adoption of sorghum varieties in ethiopia
TRANSCRIPT

ADOPTION OF IMPROVED SORGHUM VARIETIES AND FARMERS’
VARIETAL TRAIT PREFERENCE IN KOBO DISTRICT, NORTH
WOLO ZONE, ETHIOPIA
M.Sc. Thesis
ERMIAS TESFAYE TEFERI
October 2013
HARAMAYA UNIVERSITY

ADOPTION OF IMPROVED SORGHUM VARIETIES AND FARMERS’
VARIETAL TRAIT PREFERENCE IN KOBO DISTRICT, NORTH
WOLO ZONE, ETHIOPIA
Thesis Submitted to the College of Agriculture and Environmental Sciences
Department of Agricultural Economics, School of Graduate Studies
HARAMAYA UNIVERSITY
In Partial Fulfilment of the Requirements for the Degree of
MASTER OF SCIENCE IN AGRICULTURE
(AGRICULTURAL ECONOMICS)
By
ERMIAS TESFAYE TEFERI
October 2013
HARAMAYA UNIVERSITY

ii
SCHOOL OF GRADUATE STUDIES
HARAMAYA UNIVERSITY
As research advisors, we here by certify that we have read and evaluated the thesis prepared
by ERMIAS TESFAYE TEFERI under our guidance, which is titled “Adoption of Improved
Sorghum Varieties and Farmers’ Varietal Trait Preference in Kobo District, North Wolo
Zone, Ethiopia”. We recommend that the thesis be submitted as it fulfills the requirements.
Adam Bekele (Ph.D) _________________ _______________
Major Advisor Signature Date
Alastair Orr (Ph.D) _________________ _______________
Co-advisor Signature Date
As members of the Board of Examiners of the M.Sc. thesis open defence examination of
ERMIAS TESFAYE TEFERI, we certify that we have read, evaluated the thesis and
examined the candidate. We recommend that the thesis be accepted as it fulfils the
requirements for the degree of Master of Science in Agriculture (Agricultural Economics).
Final approval and acceptance of the thesis is contingent upon the submission of the final
copy to the Council of Graduate Studies (CGS) through the Departmental Graduate
Committee (DGC) of Agricultural Economics and Agribusiness Management.
----------------------------------- --------------------------------- -------------------------
Chairperson Signature Date
---------------------------------- -------------------------------------- --------------------
Internal Examiner Signature Date
---------------------------------- ------------------------------------- ------------------
External Examiner Signature Date

iii
DEDICATION
Dedicated to my mother Mulu Yiheyis Tiruneh

iv
STATEMENT OF AUTHOR
First, I declare that this thesis is my own work and that all sources of materials used for
writing it have been duly acknowledged. This thesis has been submitted to Haramaya
University in partial fulfilment of the requirements for the Degree of Master of Science and is
deposited at the library of the University to be made available to borrowers under the rules
and regulations of the library. I declare that I have not submitted this thesis to any other
institution anywhere for the award of any academic degree, diploma, or certificate.
Brief quotations from this thesis are allowable without requiring special permission provided
that an accurate acknowledgement of source is made. Requests for permission for extended
quotations from or reproduction of this manuscript in whole or in part may be granted by the
head of the Department of Agricultural Economics and Agribusiness Management or by the
Dean of the School of Graduate Studies where in his or her judgment, the proposed use of the
material is for a scholarly interest. In all other instances, however, permission must be
obtained from the author.
Name: Ermias Tesfaye Teferi
Signature...................
Place: Haramaya University
Date of Submission: ------------------------------

v
BIOGRAPHICAL SKETCH
The author, ERMIAS TESFAYE TEFERI, was born in Jabi Tehnan district in West Gojjam
Zone on 29 November, 1983. He attended his primary school in Lay Birr town and his
secondary education at Damot Secondary school in Fenoteselam town from 1990- 2002.
After he successfully passed the Ethiopian School Leaving Certificate Examination
(E.S.L.C.E.), he joined Mekelle University in 2003 and graduated with the Degree of
Bachelor of Science in Natural Resource Economics and Management in July, 2006. He was
employed by Amhara Food Security and Disaster Prevention Office in Addis Zemen, South
Gondar Zone, and has worked as a Food Security Program Coordinator from April 2007 to
June, 2009. Later on, he was employed by the Amhara Region Agricultural Research Institute
as a socio-economic researcher. He has been working there until he joined Haramaya
University in October 2012 to pursue a study program leading to the Degree of Master of
Science in Agricultural Economics.

vi
ACKNOWLEDGEMENTS
I feel a great pleasure to place on record my deep sense of appreciation and heartfelt thanks to
my major advisor Dr. Adam Bekele for his keen interest, constant supervision, valuable
guidance, kindness, encouragement, and constructive criticisms from the initial stage of thesis
research proposal development to the completion of the write-up of the thesis. I am also
greatly indebted to my co-advisor, Dr. Alastair Orr, for his valuable comments, suggestions,
and support during the course of the thesis research work.
I would like to pay my sincere gratitude to HOPE Project, Harnessing Opportunities for
Productivity Enhancement, which is funded by the Melinda and Bilgates foundation and
executed by ICRISAT (International Crop Research Institute in Semi-Arid Tropics), for
giving me the financial support required to do the M.Sc. research work. I am especially very
thankful to Dr. Tilaye T/wold, Director of Agricultural Economics and Extension Research
Directorate at Amhara Region Agricultural Research Institute for his kind technical support
throughout my study period. My thanks are extended also to Solomon Tiruneh for his
wholehearted support during the thesis research work. In addition, I would like to thank the
excellent assistance of Bogale Nigir, Solomon Mitiku, Abraha Alemu, and Mulugeta Tilahun
in data collection. I am also very much indebted to Kidist Abera for her continuous support
and encouragement during the research write-up.
I would like to express my special thanks to my colleagues, Yonas Worku, and Abiro Tigabe.
I wish to express my deepest gratitude to my mom Mulu Yiheyis who nursed me with great
zeal. Above all, I praise and glorify God, for his immeasurable help and blessing, and for
giving me the stamina required to successfully complete this piece of work.

vii
LIST OF ABBREVIATIONS
CSA Central Statistical Agency
CVM Contingent Valuation Method
FAO Food and Agricultural Organization
FTC Farmers Training Centre
GDP Gross Domestic Product
HOPE Harnessing Opportunities for Productivity Enhancement
ICRISAT International Crop Research Institute for Semi-Arid Tropics
IIA Independence of Irrelevant Alternatives
IID Independently and Identically Distributed
INTSORMIL International Sorghum and Millets
m.a.s.l meter above sea level
MNL Multinomial Logit model
MoFED Ministry of Finance and Economic Development
NGOs Non-governmental Organizations
PVS Participatory Variety Selection
RP Revealed Preference
SARC Sirinka Agricultural Research Centre
SCM Stated Choice Model
SP Stated Preference
TLU Tropical Livestock Unit

viii
TABLE OF CONTENTS
STATEMENT OF AUTHOR IV
BIOGRAPHICAL SKETCH V
ACKNOWLEDGEMENTS VI
LIST OF ABBREVIATIONS VII
TABLE OF CONTENTS VIII
LIST OF TABLES XI
LIST OF FIGURES XIII
LIST OF TABLES IN THE APPENDIX XIV
ABSTRACT XV
1. INTRODUCTION 1
1.1. Background 1
1.2. Statement of the Problem 3
1.3. Research Questions 5
1.4. Objectives of the Study 5
1.5. Significance of the Study 5
1.6. Scope and Limitations of the Study 6
2. LITERATURE REVIEW 7
2.1. Sorghum production and research 7
2.2. Basic Concepts and Theoretical Foundation of Technology Adoption Analysis 9
2.3. Models for Analyzing Adoption of Technologies 10
2.4. Review of Empirical Adoption Studies 12
2.5. Evaluation Methods of Non-Marketed Goods 17
2.6. Farmers’ Varietal Trait Preferences 18
2.7. Economic Models Used for Farmers’ Varietal Trait Preferences 19
2.7.1. Econometric models to analyze discrete choices 20
2.7.2. Specification of the utility function 20
2.7.3. The application of MNL model in choice analyses and its basic assumptions 21

ix
TABLE OF CONTENT(CONTINUEDE)
3. RESEARCH METHODOLOGY 22
3.1. Description of the Study Area 22
3.1.1. Location and physical features 22
3.1.2. Population and area coverage 23
3.1.3. Agricultural production 24
3.2. Sources and Methods of Data Collection 25
3.2.1. Sources of data 25
3.2.2. Sampling 25
3.2.3. Method of data collection 26
3.3. Data Analysis 27
3.3.1. Descriptive analysis 27
3.3.2. The Tobit model 27
3.3.3. The Multinomial logit model 34
3.3.4. Test of multicolinearity 41
4. RESULTS AND DISCUSSIONS 42
4.1. Socioeconomics Characteristics of Sample Households 42
4.1.1. Household characteristics 42
4.1.2. Resource ownership 48
4.1.3. Institutional and market factors 52
4.1.4. Farmers’ perception on improved sorghum variety attributes 55
4.1.5. Income sources of sample households 59
4.2. Choice of Sorghum Attributes/ Traits/ 60
4.2.1. Choice of improved varieties and their attribute 62
4.2.2. Perception of farmers on sorghum production constraints 63
4.2.3. Risk and choice of sorghum attributes 65
4.3. An Overview of Sorghum Production in the Study Area 66
4.3.1. Crops grown in the study area 66
4.3.2. Changes of sorghum area coverage over the last five years 67
4.3.3. Improved sorghum technologies dissemination 68

x
TABLE OF CONTENT(CONTINUEDE)
4.3.4. Trends of HOPE induced technology dissemination 69
4.3.5. Acceptance of HOPE induced sorghum technologies 70
4.3.6. Distribution of the HOPE promoted sorghum varieties 71
4.4. Econometric Model Results 72
4.4.1. Determinants of adoption and intensity of use of improved sorghum varieties 73
4.4.2. Effects of changes in explanatory variables 77
4.4.3. Determinants of farmers’ preference to sorghum attributes 79
5. SUMMARY CONCLUSION AND RECOMMENDATION 86
5.1. Summary 86
5.2. Conclusions and Recommendations 88
6. REFERENCES 92
7. APPENDICES 102

xi
LIST OF TABLES
List of Table Pages
1. List of sorghum technologies introduced by HOPE project 8
2. Size of sample households in the sample kebeles 26
3. Explanatory variables used in the Tobit model and their expected signs 33
4. Description of explanatory variables of MNL model 40
5. Family structure of sample households by improved sorghum varieties adoption 43
6. Education status of household heads by improved sorghum varieties adoption 45
7. Education level of household heads by improved sorghum varieties adoption 45
8. Sex of the household head by improved sorghum varieties adoption 45
9. Socioeconomic characteristics of female and male headed households 46
10. Resource endowments by sex of household heads 47
11. Amount of livestock value and species by improved sorghum varieties adoption 48
12. Land arrangement of households by improved sorghum varieties adoption 50
13. Types of sorghum farm land by improved sorghum varieties adoption status 52
14. Households’ Extension contact and distance to FTCs by adoption status 53
15. Sorghum extension and research experience of households by adoption status 54
16. Farmers’ participation in leadership by adoption categories 54
17. Walking distance from the nearest main market to households’ residence 55
18. Households’ access to credit by improved sorghum varieties adoption status 55
19. Farmers’ valuation of sorghum traits by improved sorghum varieties adoption 57
20. Subjective speculation on potential drought and pest occurrence in 10 years 58
21. Farmers’ subjective judgment of their food security status in relative to others 59
22. Income sources of sample households by improved sorghum varieties adoption 60
23. Most preferred sorghum traits/attributes by sample households 62
24. Improved sorghum varieties adoption by sorghum trait preference of households 62
25. Households’ perception of sorghum constraint by choice of sorghum traits 64
26. Mean comparison of risk proxy among 3 sorghum attributes choosers 65
27. Crops replacing sorghum between adoption categories 67

xii
LIST OF TABLES (CONTINUED)
28. Information dissemination of sorghum technologies across kebeles 69
29. Sample households’ participation in new sorghum scale out by Adoption 69
30. Dissemination of promoted sorghum varieties across sample kebeles 72
31. Maximum Likelihood Estimates of the Tobit Model 76
32. Marginal effects of statistically significant explanatory variables 78
33. Estimated coefficients of Multinomial logit model 84
34. Marginal effects of the multinomial logit model 85

xiii
LIST OF FIGURES
Figure Page
1. Stated preference methods (Admowiz, 1998) 18
2. A characteristic model (Edilegnaw, 2004) 19
3. Map of the study area 23
4. Rank of important competing crops in the study area with sorghum 67
5. Cumulative distribution of improved sorghum varieties information 70

xiv
LIST OF TABLES IN THE APPENDIX
Appendix Table Page
1. Multi-collinearity test result for the continuous variables in Tobit model 102
2. Contingency Coefficients for the qualitative variables in Tobit model 102
3. Variables inflation factor result of MNL model 103
4. Acceptance of newly promoted sorghum varieties by sample household 104
5. Dissemination of HOPE varieties across treatment and control kebeles 105
6. Adoption of HOPE induced sorghum technologies by kebeles 105
7. Conversion factors used to calculate Tropical Livestock Units (TLU) 106
8. Interview questionnaire 107

xv
ADOPTION OF IMPROVED SORGHUM VARIETIES AND FARMERS’ VARIETAL
TRAIT PREFERENCE IN KOBO DISTRICT, NORTH WOLO ZONE, ETHIOPIA
ABSTRACT
Agricultural productivity should be improved if food security status of the majority of rural
farmers who depend on farming is to be enhanced. Wider diffusion of improved crop varieties
such as sorghum would therefore play vital role in reversing the present situation of chronic
food insecurity in many parts of Ethiopia. Various research and development endeavors, such
as HOPE project, have been working in sorghum technology development and dissemination
of improved sorghum varieties in the study area. The main objective of this study was
therefore, to identify factors that determine adoption and intensity of use of improved
sorghum varieties and farmers’ choice of most preferred sorghum varietal traits. The study
used a primary data collected from 150 randomly selected sorghum grower farmers from five
randomly selected “Kebelles” (or villages) in Kobo District. Moreover, regular statistical
reports from different sources like the Ministry of Agriculture and CSA were reviewed.
Description, Tobit and multinomial logit (MNL) were used to analyze the data. Results of
descriptive analysis showed that adopters of improved sorghum varieties as compared with
non-adopters were characterized by better agricultural extension experience and educational
status, higher livestock assets ownership, less total cultivable farm but higher irrigable farm
size, and most of them are located nearer to FTCs. In the Tobit model, 9 variables were found
to significantly determine adoption and intensity of improved sorghum varieties either
positively or negatively. They are active labor ratio (-) tropical livestock unit (+), farm size (-
), farmers’ perception of yielding capacity and taste preference for improved sorghum
varieties (+), irrigated farm size (+), striga infested farm size (+), proportion of sorghum
farm from the total cultivated farm (-) and distance from farmers’ training centre to home (-).
Thus, there is a need to target smallholder farmers with low labour force in sorghum
technology outreach programs. Targeting should also take Striga threat, accessibility of
technology information and irrigation facilities in to consideration to fasten the acceptance
and dissemination of improved sorghum varieties. High yielder sorghum varieties with good
“Injera” and “Tella” making qualities should be given special priority in sorghum variety

xvi
scaling out programs. The MNL model also suggested that adoption status of improved
sorghum varieties, level of vulnerability to potential income shocks, age of the household
head, experience of the household head in using extension service, perception on soil fertility
status, labor constraint, frequency of important sorghum pests occurrence, and location of the
household residence were important variables that significantly explained choice of sorghum
attributes in general. Thus, it will not be wise and acceptable to perform sorghum variety
improvement from only single attribute perspective such as yield capacity and unanimously
disseminate across all farmers. Sorghum variety development should entail a wider set of
technology users’ characteristics, priorities and production constraints.
Key words: varieties, attributes,

1
1. INTRODUCTION
1.1. Background
Agriculture has been the mainstay of the Ethiopian economy for several centuries. It is still
the dominant sector being contributing 42% of the total GDP (CSA, 2010). According to
(MoFED, 2006), the sector employed more than 83% of the population, and was the source of
over 90 % of export revenues. It also provides raw materials for more than 70% of the
country’s industries. With in the sector, 60% of the agricultural GDP comes from crop
production, whereas, 30% and 7% of it is generated from livestock and forestry sectors
respectively (World Bank, 2007). Therefore, it is palpable that countries like Ethiopia, which
are comparatively endowed with unskilled labor and arable land, would find it relatively
easier to follow an agricultural development path. According to (World Bank 2008), escaping
poverty traps in many developing countries such as Ethiopia depends on the growth and
development of the agricultural sector.
Following these facts, successive Ethiopian governments have focused on promoting
technology-led initiatives to enhance productivity, particularly in smallholder agriculture
(Gebresilassie, 2006; FDRE, 2010). Crop production is a subsector on which the country has
unfailingly depended on to bring about a livelihood transformation of the poor. Currently, the
government is undertaking a strategy of improving agricultural productivity primarily through
agricultural intensification, involving an increased use of inputs, including seeds of improved
crop varieties (McGuire, 2005; Byerlee et al., 2007).
Sorghum is also the most widely cultivated and consumed cereals in Ethiopia. According to
(CSA, 2008), it ranks third after maize and tef in total production, after maize in yield per
hectare and after tef and maize in area harvested. The crop is also the most important crop in
Amhara region, being the second crop in terms of area coverage next to tef. In Kobo district,
sorghum has a vital role of achieving food security. The crop is one of the leading traditional
food crops in the area. It is also a multipurpose crop, being utilized in different forms where
the grain is used for making “Injera” (large round pancake made from fermented dough) and

2
“Tella” (local beverage drinks). It is also consumed in boiled and roasted forms. Sorghum is
also essential source of feed for livestock where the stalk is used to feed animals in dry
season. Moreover, its stalk is used as firewood and fencing material.
So far, the research system of the country has developed and released several yield increasing
and drought resistant improved Sorghum varieties. According to Ethiopian Agricultural
Research Organization (2004), a total of 23 improved sorghum varieties have been released to
the users nationally. More than half of those sorghum varieties were released from Sirinka
Agricultural Research Centre (2011). Various development stakeholders have also been
undertaking several interventions of sorghum variety promotion and diffusion activities. The
agriculture office alone, starting from year 2007, has performed massive technology scaling-
out activities including improved sorghum varieties. On the other hand, since 2009, the HOPE
project has been promoting and disseminating improved sorghum technologies focusing on
integrated activities that would address the versatile challenges in sorghum production system
of the area. Even if these improved technologies were available at the research disposal and
huge investments done on several extension programs to promote improved seeds, the use of
improved seeds is still very low. Only 3–5 percent of Ethiopia’s cultivated agricultural area is
covered with improved seeds leaving a great proportion of the farm households to depend on
traditional varieties (World Bank, 2005).
Furthermore, Wolo in general and Kobo district in particular is one of the sorghum genetic
pools of the country. Farmers in the area have various varietal choice criteria for different
sorghum varieties. They are well aware of varietal selection decision within a diverse set of
alternatives and dynamic and risky environmental situations. Since recently, however, the
unpredictable nature of climatic condition makes sorghum varietal choice difficult posing a
great challenge in rural household food security status. Farmers therefore, began to show a
growing preference towards improved sorghum varieties which are compatible to their socio-
economic settings, environmental conditions and utilization purposes. Therefore, in
agricultural research priority setting, understanding farmers’ variety attribute preferences will
serve as an input for developing varietal technologies with more chance to be adopted and be
successful (Edilegnaw, 2004). A careful assessment of farmers’ varietal choice decision and

3
factors affecting adoption of improved sorghum technologies thus is essential to gear the
oncoming technology improvement and diffusion endeavors towards achieving sorghum
productivity enhancement in the study area.
1.2. Statement of the Problem
In contrary to the fact that the agricultural sector has received substantial attention in the
country’s development strategies since 1970s, when the Third Five-year Development Plan
(1968-1973) was launched, Ethiopia is still a food deficit country (Mulugeta, 2002).
Unprecedented population pressure has contributed to the decreasing plot size. Consequently,
farmers produce crops and rear animals in small and fragmented land holdings. Nearly 55 per
cent of all smallholder farmers operate on one hectare or less (MoFED, 2010). The sector has
also long suffered from recurrent drought and output fluctuations. On average, some 5 million
people are chronically food insecure even in years of good weather (FAO, 2011).
A combination of many factors including weakly functioning agricultural markets, low
purchasing power of the consumers, overall low level of technical knowledge of the
producers, and a high illiteracy rate of the rural communities have hindered the much
expected technical change and farm productivity ( Birhanu, 2006). The inability of producing
enough food has in turn its own backward impact on the ill performance of the agricultural
sector through weak productivity of agricultural labor. It is therefore, a vicious circle of
poverty trap that holds the overall effort of development in to the status quo.
Wello, similar to many parts of Ethiopia, is mainly characterized by rugged topography,
unreliable rainfall condition, meager resource endowment, and very diverse, complex and risk
prone farming systems (Sirinka Agricultural Research Centre, 1998). Agriculture in the area
is mainly rain fed. The nature of the rainfall is also erratic, low in amount and uneven in
distribution. As a result, crop production has become highly unpredictable and unsatisfactory
throwing major proportion of the rural population in to a chronic food insecurity situation.

4
Clearly, agricultural performance in the area should be improved if the food security of the
majority of rural farmers is to be enhanced. Improvement and diffusion of sorghum varieties
have an invaluable role in reversing the present situation of chronic food insecurity in the
study area. To this end, sorghum technologies have been generated and promoted in the past
30 years in the study area. Promotion and diffusion activities have continued still recently.
HOPE project being executed by SARC in collaboration with ICRISAT is one of the major
efforts extended to the farmer aimed to improve sorghum productivity in the study area. The
project mainly promoted improved sorghum varieties (both drought and Striga resistant
Varieties), economical fertilizer dose (micro-dosing) and improved water conserving tied
ridge tillage system. However, the adoption of improved sorghum technologies is low until
recently. Factors responsible for the low adoption of sorghum technologies generated are not
well investigated and documented so far. Specially, there have been limited efforts in
investigating the effect of farmers’ perception on characteristics of new varieties on their
acceptance and wider dissemination. Farmers may assess new technology such as improved
varieties in terms of a range of attributes such as grain quality, straw yield, input requirements
and grain yield (Traxler and Byrlee; 1993, Kelly et al 1995).
Furthermore, technology improvement and dissemination activities from the research side
usually lack incorporation of farmers’ diverse concerns and settings. As a result, farmers in
the study area had little participation in sorghum variety improvement activities. Technology
adoption decision however is dependent on the farmers’ perception on the performance of
new technology relative to that of the technology currently practiced. Thus, variety
improvement activities in an environment where little is known about factors that determine
the most preferred trait of crops could not be effective in terms of improving the welfare of
the research target population. Accordingly, breeding should target to satisfy demands of
different farm household types classified by their resource endowments, preferences and
constraints. The research priority setting should, therefore, also ask ‘breeding for whom?’ not
just only ‘breeding for which environment?’, as it is mostly the case (Sinafiksh, 2008).
Different farmers may have their own quality measurement criteria to decide in growing a
particular variety.

5
1.3. Research Questions
a. What are the factors influencing adoption and intensity of use of sorghum varieties in
the study area?
b. What factors determine the choice of most preferred sorghum traits?
1.4. Objectives of the Study
The overall objective of this study is to determine factors affecting adoption and intensity of
use of improved sorghum varieties in the study area and to draw policy recommendations that
will pave the way to future intervention.
The specific objectives of this study are:
To assess the recent diffusion of improved sorghum technologies.
To identify determinants of improved sorghum varieties adoption and intensity of use.
To identify factors affecting farmers’ choice of most preferred sorghum variety
attributes.
1.5. Significance of the Study
Sorghum is the major staple crop in the study area. It has a multi-purpose utilization type by
the local people. In the research area various sorghum technologies have been released and
tested by the farmers. However, the flow of research outputs has been uni-directional for long
time. The participation of farmers in technology development through provision of their
preference and incorporation of local idea was very limited otherwise non-existent. Now it is
known that adoption and intensity of use of improved sorghum varieties is conditioned on
socioeconomic, institutional and farmers’ perception. Therefore, the study enabled us to
identify important factors which hinder success in the adoption and intensity of use of
improved sorghum varieties. This result is very crucial in assessing the performance of the
prevailing technology diffusion endeavors in the area.
6
The study has also enabled us to critically identify relevant and most preferred traits of
sorghum crop by different socio-economic group of farmers. The result would have valuable
insight in understanding the socioeconomic settings and concerns of technology users’
domain. The result would also enable us to better target farmers who demand different
sorghum variety types. Moreover, the study generated important lessons from the HOPE
project intervention in the study area. The lessons learnt could be documented and applied for
similar projects in the future and to the HOPE project for the rest of the project life.
1.6. Scope and Limitations of the Study
This study was conducted in Kobo district of the Northern Wollo administrative zone. The
district was selected from many sorghum growing districts of the zone for it is the major
sorghum producing area and starting point for the HOPE project. Therefore, the study had
limited coverage from the zone in particular and from sorghum growing areas of Wolo in
general. Moreover, the study utilized cross sectional data of only one cropping season. This
wouldn’t enable the study to capture various dynamisms of the subject under interest.

7
2. LITERATURE REVIEW
This chapter is classified in to seven sections. The sections included are presented in such a
way that could give an insight on issues such as prevailing sorghum production and research
status, basic concepts of technology adoption, empirical results of previous agricultural
technology adoption studies, and concepts related to farmers’ varietal traits’ demand and
determinants.
2.1. Sorghum Production and Research
Sorghum (Sorghum bicolor L. Moench) is the fourth most important cereal crop globally
following wheat, rice and maize. It is a staple food for more than 500 million people in the
semi-arid tropics of Africa and Asia and more than 80% of the world area of production is
confined to these two continents (Masresha et al., 2011). It is primarily a crop of resource-
poor small-scale farmers and is grown predominantly in low-rainfall, arid to semi-arid
environments. The crop is typically produced under adverse conditions such as low input use
and marginal lands. In sub-Saharan Africa, over 100 million people depend on sorghum as
staple (Serna-Saldivar and Rooney, 1995; Smith and Frederiksen, 2000). It is well adapted to
a wide range of precipitation and temperature levels and is produced from sea level to above
2000 m.a.s.l. Due to its drought tolerance, this crop is grown in eastern Africa where
agricultural and environmental conditions are unfavorable for the production of other crops.
All lines of evidence point to the north-east quadrant of Africa, mainly Ethiopia, as the centre
of domestication of sorghum (Tanto and Demissie, 2000; McGuire, 2005). Therefore, the
greatest genetic diversity for both cultivated and wild forms of sorghum are found in Ethiopia
and the surrounding eastern African countries. It is the second most important staple cereal
crop after maize in the region, making a huge contribution to the domestic food supply chain
with a total acreage of 8,199,741 ha. Sorghum is also one of the leading traditional food crops
in Ethiopia comprising 15-20% of the total cereal production in the country (Wortmann et al.,
2006). Sorghum grows in a wide range of agro ecologies most importantly in the moisture
stressed parts where other crops can least survive and food insecurity is rampant (Asfaw,

8
2007). According to (CSA, 2008), sorghum ranks third after maize and tef in total production,
after maize in yield per hectare and after tef and maize in area harvested.
Livelihood depends on sorghum production to a very high extent in the mid and low-lying
areas of Wolo. The area is also considered as the source of sorghum genetic diversity (Brhane,
1979, Solomon et al, 1999). It has tremendous importance for farmers and no part of this plant
is ignored. The grain is used for making “Injera”, bread, porridge, “Kollo” (roasted grain),
“Nifro” (boiled grains) and “Tella” (local beverage). The stalk is used for cattle feed, fuel
wood and simple construction purposes.
In the low and midlands of the three administrative zones (out of four in Wolo), about thirty
local sorghum landraces were identified (Girm et al, 2000). Besides, introduction and release
of exotic sorghum varieties started in Ethiopia long time ago. Most of the released sorghum
varieties were from ICRISAT and INTSORMIL (Asfaw, 2007). HOPE project, being
executed by SARC in collaboration with ICRISAT is one of the major recent efforts extended
to farmers in the study area to improve sorghum productivity. The project mainly focused on
integrated activities that address the multifaceted challenges in sorghum production system of
the area, (SARC, 2011). It delivered improved sorghum varieties, economical fertilizer dose
(micro-dosing) and introduction of improved water conserving tillage system on credit basis
(in kind). To deliver those technologies, the project trained farmers, participated them in on-
farm research trials and participatory varietal selection events and organized several field
visits on-station and on-farm.
Table 1. List of sorghum technologies introduced by HOPE project
Variety name Original name
Year of introduction
Source Specific character
Miskir 2009 ICRISAT drought resistant Girana-1 2009 ICRISAT drought resistant Hormat ICSV1112BF 2009 ICRISAT Striga resistant
Fertilizer (micro-dose) 2009 Economic level of fertilizer
Tie ridging for sorghum 2009 Water conserving method
Source: unpublished report by Sirinka Agricultural Research Center, 2011

9
2.2. Basic Concepts and Theoretical Foundation of Technology Adoption Analysis
Adoption and diffusion of technology are two interrelated concepts describing the decision to
use or not to use and the spread of a given technology among economic units over a period of
time. They are distinct but interrelated concepts. Adoption commonly refers to the decision to
use a new technology or practice by economic units on a regular basis. It is not a one step
process as it takes time for it to complete. First time adopters may continue or cease to use the
new technology. The duration of adoption of a technology vary among economic units,
regions and attributes of technology itself. Diffusion often refers to spatial and temporal
spread of the new technology among different economic units. Therefore, adequate
understanding of the process of technology adoption and diffusion is necessary for designing
effective agricultural research and extension programs (Feder and Zilberman., 1985).
Among many other definitions, the one given by Rogers (1983) is widely used in several
adoption and diffusion studies. He defined diffusion (aggregate adoption) as the process by
which a technology is communicated through certain channels over time among the members
of social system. This definition recognizes the following four elements: (1) the technology
that represents the new idea, practice, or object being diffused, (2) communication channels
which represent the way information about the new technology flows from change agents
(extension, technology suppliers) to final users or adopters (e.g. Farmers), (3) the time period
over which a social system adopts a technology and (4) the social system. Rogers (1983) then
defined adoption as use or non-use of a new technology by a farmer at a given period of time.
This definition can be extended to all economic units in the social system.
Feder and Zilberman (1985) distinguished individual adoption (farm level) from aggregate
adoption. Individual adoption was defined as the degree of use of a new technology in a long-
run equilibrium when the farmer has full information about the new technology and its
potential impact. Aggregate adoption (diffusion) was defined as the process of spread of
technology within a region. This definition implies that aggregate adoption is measured by the
aggregate level of use of a given technology within a given geographical area. Similarly,
10
Thirtle and Ruttan (1987) defined aggregate adoption as the spread of a new technique within
a population. The distinction between adoption and diffusion is also important for theoretical
and empirical analyses of the levels of the two economic phenomena.
The adoption decision also involves the choice of how much resource (i.e. land) to be
allocated to the new and old technologies if the technology is not divisible (e.g. improved
seed, fertilizer and herbicides), the decision process involves area allocations as well as level
of use or rate of application (Feder and Zilberman., 1985). Thus the process of adoption
decision includes the simultaneous choice of whether to adopt a technology or not and the
intensity of its use. Besides, before adoption choices are made a farmer makes a set of several
interdependent decisions (Hassan, 1996).
A distinction has to be made between technologies that are divisible and that are not divisible
with regard to the measurement of intensity of adoption. The intensity of adoption of divisible
technologies can be measured at the individual level in a given period of time by share of
farm area under the new technology or quantity of input used per hectare in relation to the
research recommendations (Feder and Zilberman., 1985). This measure can also be applied to
the aggregate level of adoption in a region. On the other hand, the extent of adoption of non-
divisible agricultural technologies such as tractors and combine harvesters at the farm level at
a given period of time is dichotomous (use or no use), and the aggregate measure becomes
continuous. In the latter case, aggregate adoption of a lumpy technology can be measured by
calculating the percentage of farmers using the new technology within a given area.
2.3. Models for Analyzing Adoption of Technologies
Generally it is assumed that farmers’ decision in a given period of time and space are derived
from maximization of expected utility or expected profit subject to resource constraints.
Therefore, adoption decision depends on farmers’ discrete choice of a new technology from a
mix including the traditional technology and a set of components of a new technology (Feder
and Zilberman, 1985). To answer the question of what determines whether a particular

11
technology is adopted or not and intensity of adoption, most of the adoption of agricultural
innovation studies used static rather than dynamic models.
Static adoption models
The static model refers to farmers’ decision to adopt an improved technology at a specific
place and specific period of time. This model attempts to answer the question of what
determines whether a particular technology is adopted or not and what determines the pattern
of adoption at a particular point in time. The results of these models are often contradictory
regarding the importance and influences of certain variables (Ghadim and Pannel, 1999). One
limitation of the static model is that it does not account for time in adoption process nor for
the farmers’ activity to learn to improve their technical efficiency in growing and marketing
the crop (Hailu, 2008). These weaknesses are addressed in using a dynamic adoption models.
The majority of adoption studies are continued to be a static binary setting of logit or probit
models such as (Polsen and Spencer, 1991; Jonsen, 1992,; Aklilu and Graaf, 2007 and
Bayissa, 2010). In these models the adoption decision is merely dichotomous / whether or not
to adopt/ where a functional relationship between the probability of the adoption and a set of
explanatory variables is estimated econometrically using logistic distribution for the logit
procedure and normal distribution for the probit procedure.
The logit/probit methods investigate the effects of regressors on the choice to use or no to use
but it does not measure the degree or intensity of adoption (Feder and Zilberman, 1985).
Therefore, the alternative static econometric procedure such as the Tobit (Tobin, 1958) is used
to analyze quantitative adoption decisions when information on the intensity of adoption is
available. However, in working with continuously measured dependent variables such as
quantity of area, some of the data points will have a zero value (for non-users). In this case, a
dependent variable is censored where information is missing for some range of the sample.
Information on the dependent variable is available only if the dependent variable is
observable, the dependent variable is described as truncated (Kennedy, 1992). The Tobit
model provides coefficients that can be further disaggregated to determine the effect of a

12
change in the ith variable or changes in the probability of adopting the new technology and
expected intensity of use of the technology. However, a study by Dong and Saha (1998)
indicated that a Tobit model imposes restrictions that the variables and coefficients
determining whether and how much to adopt decisions are identical,
Other alternatives to analyze farmers’ adoption decisions include the use of double hurdle
models, which take in to account zero observations (Cragg, 1971, Heckman, 1976). The
choice of a model is important because it influences the empirical results obtained (Jones and
Yen, 1994). The Tobit model assumes that decision regarding adoption and intensity of use
are related. However, studies by Cragg (1971) on the demand for durable goods and Coady
(1995) on fertilizer use indicated that such decisions might not be intimately related. The
Heckman (1976) model is also another most restrictive type of the double hurdle model
available because it assumes that none of the zeros for the non-adopters are generated by the
adoption decisions (i.e. first hurdle dominance) so that standard Tobit censoring is irrelevant
(Jones, 1989).
On the other hand, dynamic diffusion models allow the determinants of adoption to change
over time period enabling to measure the rate of adoption more accurately than the static
adoption models, (Hailu, 2008).
2.4. Review of Empirical Adoption Studies
Different studies of technology adoption across different location revealed that a combination
of socioeconomic, demographic, institutional and perception to technology attribute variables
determine the adoption and intensity of use of the technologies. Therefore, this sub section
will focus on reviewing relevant literatures around Ethiopia and outside Ethiopia that would
give brief account of results and explanations behind the findings.
Sex differential between household heads is a very important explanatory variable in studying
determinants of adoption. The prevailing social set up of rural households placed a varying
responsibility among male and female members. In most parts of rural Ethiopia women are

13
disfavored groups of the society who couldn’t easily access technology information. Thus,
numerous adoption studies had come up with results showing being a female headed
negatively influencing technology adoption decisions. For instance, Techane (2002), in his
study on determinants of fertilizer adoption in Ethiopia found that male headed households
are more likely to adopt fertilizer than female headed households. Similar study by Fitsum
(2003) confirmed a negative and significant relation between fertilizer use intensity and
female-headed households. The existence of wealth difference among female headed and
male headed households was the possible reason forwarded for the difference in adoption of
fertilizer by the two groups.
Education status of the household head is the most common and important variable that is
found to explain farmers’ agricultural technology adoption behavior. Various studies
confirmed that it has a significant positive influence on adoption of technologies. For
instance, Mahadi et al (2012) studied factors affecting adoption of improved sorghum
varieties in Somali Region of Ethiopia. They have found out that more educated farmers are
more likely to adopt improved sorghum varieties in the study area. This finding is in line with
other results such as Alene (2000) in the study of determinants of adoption and intensity of
use of improved Maize varieties in the Central Highlands of Ethiopia. Teferi (2003) also used
Tobit model to analyze determinants of fertilizer use in Gozamin District, Amhara Region,
Ethiopia and has founded that education affected the adoption of fertilizer use positively.
Similar studies by Bayissa (2010) suggested that education positively explained adoption and
intensity of use of sesame technologies. However, a study by (Asnake et al., 2005) in
Ethiopia showed that education had no significant effect on the adoption of improved
chickpea varieties.
Age of the household head is another variable in explaining farmers’ technology adoption
behavior which plays an important role through influencing farmers’ information access and
shaping their ability to change the available information into action. Older farmers may have
experience and resource that would allow them more possibilities for trying a new
technology. On the other hand, younger farmers are more likely to adopt new technology
because they have had more schooling than the older generation. Different agricultural

14
technology adoption studies revealed conflicting results on the influence of age in adoption.
Some of the findings confirmed that age negatively influencing adoption behavior of farmers.
A study by Mahdi (2005), and Yitayal (2004) confirmed that when a farmer’s age increases the
probability of using improved technology decreases. Similar findings were also obtained by
Assefa and Gezahegn (2004), Million and Belay (2004) and Shiferaw and Tesfaye (2006). On
the other hand, other agricultural technology adoption studies by other researchers indicated
that age positively affected adoption. For instance, a study by Lapar and Pandey (1999) has
revealed that age had a positive influence on the adoption of hedge growing technologies. The
result was explained as better experience of older farmers gave them a chance to better
perceive risks and constraints of new technologies.
Availability and amount of family labor plays a vital role in determining adoption and
intensity of use of agricultural technologies. The existence of active work force in rural
households usually encourages them to show interest in trying some agricultural technologies.
Off course, the influence of labor availability on adoption depends on the characteristics of
the technology to be adopted. When the new technologies in relative to the older ones are
more attractive and labor intensive, farmers with more labor would tend to adopt those
technologies. Nevertheless, if a technology is labor saving like tractors, harvesters, pesticides
and the like, its impact will be negative. Plenty of adoption studies found out a positive
impact of family labor on technology adoption such as Alene et al (2000), Techane (2002),
Bayissa (2010) and Solomon et al. (2011). On the other hand, adoption studies done by some
other researchers such as Akinola (1987), Igodan et al. (1988), in Nigeria found negative
relationship between family size and technology adoption.
Livestock ownership is another essential factor that determines adoption of improved
technologies in the context of developing countries agriculture including Ethiopia. Livestock
are usually considered as a risk buffering assets that boost farmers’ confidence to try new
agricultural practices. Accordingly, most adoption literatures confirmed the positive influence
of livestock holding on technology adoption and intensity of use. Among some are findings
by Endrias (2003). The study reported that value of livestock has positive and significant
influence on adoption decision and intensity of use of improved sweet potato varieties in

15
Boloso district, Sothern Ethiopia. Similar adoption studies such as Bayissa, (2010), Tesfaye et
al. (2001), Yishak (2011), and Mesfin (2007) confirmed that livestock ownership positively
and significantly explained improved technology adoption decissions.
The impact of Farm size on adoption and intensity of use agricultural technologies on the
other hand, is not consistently similar in various adoption studies. Some of the studies showed
a positive influence of the variable on adoption decision. For instance, Alene et al (2000)
studied determinants of adoption and intensity of use of improved Maize varieties in the
Central Highlands of Ethiopia. This study employed a Tobit model to examine factors that
influence the adoption and intensity of utilization of improved maize varieties and found a
significant positive effect. Similar results by other researchers such as Mulugeta (2000),
Million and Belay (2004) and Taha (2007), Mahadi et a.l (2012), Solomon et al (2011)
reported positive relationship of farm size with adoption. In contrary to these findings, studies
by Endrias (2003) and Abrhaley (2006) revealed that farm size negatively and significantly
affected adoption of improved technologies. The explanations provided were the better rate of
technology intensification tendency of small holder farmers as compared to larger ones.
Farmers’ Perception to technology characteristics were very important explanatory variables
that are usually omitted in most of agricultural technology adoption studies. Few studies has
been able to reveal the importance of such variables in explaining adoption of technologies
such as a study of farmers’ perception and adoption of Modern Sorghum and Rice varieties in
Burkinafaso and New Guinea by Adesina and Baidu-Forson (1995). The study result showed
that better perception of farmers on improved sorghum characteristics such as quality of
making sorghum pasete (TO), performance on poor soil condition, performance on yield and
relative tolerance to striga weed significantly and positively affected adoption and intensity of
use of improved sorghum varieties. In the same study however, perception of drought
tolerance negatively and significantly affected adoption and intensity of use. This unexpected
result of the Tobit model was explained as possibility of negative correlation between the
variable and other varietal characteristics not included in the model. Similar study by Timu et
al. (2012) confirmed that improved sorghum varieties in Kenya had desirable production and
marketing attributes while the local varieties were perceived to have the best consumption

16
attributes. Evidence further indicates that the major sorghum variety attributes driving rapid
adoption are taste, drought tolerance, yield, ease of cooking and the variety’s ability to fetch a
price premium. Early maturity, a major focus of research however has no effect on adoption.
Similar studies conducted in many parts of Ethiopia have also showed the importance of those
perception variables in explaining improved crop varieties adoption and intensity of use.
Some of them include Endrias (2003), Mesfin (2005), Solomon et al (2011), Bayissa (2010)
and Wubneh (2003).
Extension service access is a very crucial institutional factor that differentiates adoption status
among farmers. In the existing situation much of agricultural technology delivery is
undertaken by the extension system. Therefore, farmers’ failure or success of accessing the
service is expressed in their technology adoption and intensity of use. Several studies used
different variable to measure farmers’ access to extension services. For instance, Dereje
(2006) used distance to FTC as a proxy variable to measure farmers’ access to extension
service. The finding was a negative and significant effect of the variable on technology
adoption. Similar study by Mahdi (2005) has also found a negative influence of distance from
farmers’ residence to DAs office on technology adoption. Another important measure of
extension is farmers’ experience in extension service. Dereje (2006) and Mahdi (2005) have
also found out a positive effect of farmers’ extension experience on their technology adoption
behavior. Moreover, Degnet and Belay (2001) have found frequency of contact with
extension agents significantly and positively explaining adoption decision.
Access to market is also another important explanatory variable that plays a vital role in
stimulating adoption of new productive agricultural technologies. The variable is usually
responsible if the new technologies are market driven. Majority of the reviewed literatures
showed that better market access plays a positive role in adoption of technologies. For
instance, Alemitu (2012), Minyahil (2008), Bayissa (2010), Romina et al.( 2010) found out
farmers’ distance to input and output markets negatively and significantly affected adoption
of agricultural technologies. The results suggested that those of farmers relatively nearer to
markets are more probable to adopt new technologies.
.

17
Finally, farm income is reported in many adoption studies to have a positive impact on
adoption of agricultural technologies. The studies done by Alene (2000), Degnet and Belay
(2001), Minyahil (2008) and Yishak (2011) confirmed that farm income positively affecting
adoption of agricultural technologies. The explanation behind the findings is the better
purchasing power of those farmers with higher farm income enables them to access the
technologies.
2.5. Evaluation Methods of Non-Marketed Goods
Current methods of environmental valuation can be categorized as Revealed Preference
methods (RP) and Stated Preference methods (SP). The revealed preference method, infers
the value of a non-market good by studying actual (revealed) behavior on a closely related
market. The two most well-known revealed preference methods are the hedonic pricing
method and the travel cost method (Braden and Kolstad, 1991). In general, the revealed
preference approach has the advantage of being based on actual choices made by individuals.
However, there are also a number of drawbacks; most notably that the valuation is
conditioned on current and previous levels of the non-market good and the impossibility of
measuring non-use values, i.e. the value of the non- market good not related to usage such as
existence value, altruistic value and bequest value.
Research in the area of valuation of non-market goods has therefore seen an increased interest
in another branch, the stated preference method, during the last 20 years (Alpizar et al., 2001).
However, RP data may suffer from a variety of problems that limit their usefulness in model
development and compensation determination (Adamowicz et al. 1998). Stated preference
method assesses the value of non-market goods by using individuals’ stated behavior in a
hypothetical setting. The method includes a number of different approaches such as conjoint
analysis, contingent valuation method (CVM) and choice experiment. The most commonly
used SP method in environmental valuation is contingent valuation (Carson et al. 1996). The
term Stated Choice Methods (SCM), refers to a flexible approach to collecting preference data
(generally, choices and rankings, whether full or partial) from subjects in hypothetical
situations (Alpizar et al., 2001).

18
Stated Preference Methods
Figure 1. Stated preference methods (Admowiz, 1998)
In a choice experiment, individuals are given a hypothetical setting and asked to choose their
preferred alternative among several alternatives in a choice set, and they are usually asked to
perform a sequence of such choices. Each alternative is described by a number of attributes or
characteristics. A monetary value is included as one of the attributes, along with other
attributes of importance, when describing the profile of the alternative presented. Thus, when
individuals make their choice, they implicitly make trade-offs between the levels of the
attributes in the different alternatives presented in a choice set.
2.6. Farmers’ Varietal Trait Preferences
Undertaking variety development venture requires understanding farmers’ variety choice and
variety attribute preferences. Variety attribute preferences and the varieties that embed these
attributes are, in turn, shaped by farmers’ economic (resource constraints, markets and risk)
and non-economic (religion, culture and norms) concerns (Edilegnaw, 2004). The following
Rating Ranking
Stated Choice

19
figure summarizes the interaction of farmers’ concerns, their contextual characteristics,
environmental characteristics, and crop diversity.
Figure 2. A characteristic model (Edilegnaw, 2004)
2.7. Economic Models Used for Farmers’ Varietal Trait Preferences
The basis for most microeconomic models of consumer behavior is the maximization of a
utility function subject to a budget constraint. Due to the complexity of farmers’ variety use
decisions, the micro-economic model should be utility-based since a profit maximization
framework is unable to explain farmers’ variety attribute preferences and their land allocation
Referendum contingent valuation
Other Choice Methods
Attribute based Sated Choice
Working Environment: natural, economic and

20
decisions (Edilegnaw, 2004). Accordingly, Lancaster has developed the characteristic theory
of consumer behavior in which individuals derive utility from the characteristics of the goods
rather than directly from the goods themselves. For illustration of the basic model behind
choice experiment, consider a farm household’s choice of a crop variety, and assume that
utility depends on choices made from a set C, which includes all the possible options of
different crop varieties. This list of all options that are available to the farm household is
referred to as the choice set.
Recently, characteristic models have attracted renewed interest not only in micro- economic
theory of diversity (for instance, Nehring and Puppe, 2002) but also in applications
concerning farmer preferences for crop varieties and land allocation decisions (for instance,
Smale et al., 2001).
2.7.1. Econometric models to analyze discrete choices
Stated behavior surveys sometimes reveal preference structures may seem inconsistent with
the deterministic model. It is assumed that these inconsistencies stem from observational
deficiencies arising from unobservable components such as characteristics of the individual or
non-included attributes of the alternatives in the experiment, measurement error and/or
heterogeneity of preferences (Hanemann and Kanninen, 1999). In order to allow for these
effects, the Random Utility approach (McFadden, 1974) is used to link the deterministic
model with a statistical model of human behavior.
2.7.2. Specification of the utility function
In a discrete choice experiment, a decision-maker n chooses a single alternative from a choice
set Cn made up of a finite number of mutually exclusive alternatives, where the choice set is
exhaustive, and the ordering of alternatives has no effect on the choice process undertaken by
the decision-maker. Each alternative j = 1, . . . , J in the choice set is characterized by a utility
U , which is specific to decision-maker n, due to variations in attributes of the individuals, as
well as in the attributes of the alternative, as faced by deferent decision-makers. The use of the
21
concept of utility, along with the need for a decision-rule, leads to the single most important
assumption in the field of discrete choice modeling, namely that of utility maximizing
behavior by respondents. The most common assumption is that the error term enters the utility
function as an additive term. This assumption, although restrictive, greatly simplifies the
computation of the results and the estimation of welfare measures (Hanemann, 1999). Under
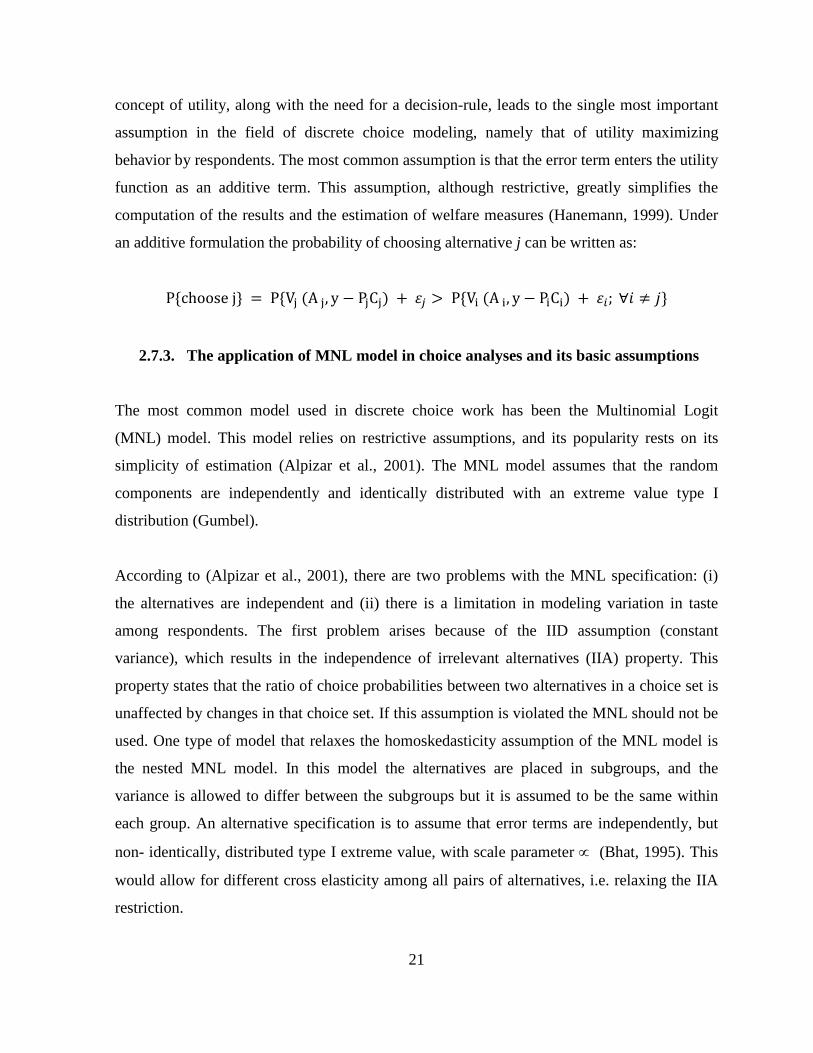
an additive formulation the probability of choosing alternative j can be written as:
P{choose j} = P{Vj (A j, y − PjCj) + 𝜀𝜀𝑗𝑗 > P{Vi (A i, y − PiCi) + 𝜀𝜀𝑖𝑖; ∀𝑖𝑖 ≠ 𝑗𝑗}
2.7.3. The application of MNL model in choice analyses and its basic assumptions
The most common model used in discrete choice work has been the Multinomial Logit
(MNL) model. This model relies on restrictive assumptions, and its popularity rests on its
simplicity of estimation (Alpizar et al., 2001). The MNL model assumes that the random
components are independently and identically distributed with an extreme value type I
distribution (Gumbel).
According to (Alpizar et al., 2001), there are two problems with the MNL specification: (i)
the alternatives are independent and (ii) there is a limitation in modeling variation in taste
among respondents. The first problem arises because of the IID assumption (constant
variance), which results in the independence of irrelevant alternatives (IIA) property. This
property states that the ratio of choice probabilities between two alternatives in a choice set is
unaffected by changes in that choice set. If this assumption is violated the MNL should not be
used. One type of model that relaxes the homoskedasticity assumption of the MNL model is
the nested MNL model. In this model the alternatives are placed in subgroups, and the
variance is allowed to differ between the subgroups but it is assumed to be the same within
each group. An alternative specification is to assume that error terms are independently, but
non- identically, distributed type I extreme value, with scale parameter ∝ (Bhat, 1995). This
would allow for different cross elasticity among all pairs of alternatives, i.e. relaxing the IIA
restriction.

22
The second problem arises when there is taste variation among respondents due to observed
and/or unobserved heterogeneity. Observed heterogeneity can be incorporated into the
systematic part of the model by allowing for interaction between socio-economic
characteristics and attributes of the alternatives or constant terms. However, the MNL model
can also be generalized to a so-called mixed MNL model in order to further account for
unobserved heterogeneity.
3. RESEARCH METHODOLOGY
This chapter starts with a brief description of the study area, Kobo district followed by
sources and methods of data collected for the study. Besides, descriptions of data analysis
methods that are used to address research objectives are briefly discussed step by step.
3.1. Description of the Study Area
3.1.1. Location and physical features
The study was conducted at Kobo district, Northeastern escarpment of Amhara. The district is
one of the eight rural districts in North Wolo Zone and lies about 54 Km North of Woldia
town. The district town, Kobo is located on the Addis Ababa-Adigrat highway, 189
kilometers south of Mekele. The geographical coordinate of the area is 39038’ E longitude and
12009N latitude. The district borders with Tigray region in the North, Gubalafto and Habru
district in the South, Afar region in the East, and Gidan district in the west. The landscape of
this woreda is characterized by a broad fertile plain which is separated from the lowlands of
the Afar Region by the Zobil Mountains, which are over 2000 meters high. In general, the
altitude of Kobo ranges from 1100 meters on the plains to slightly more than 3000 meters
above sea level along the border with Gidan.

23
The principal feature of rainfall in the area is seasonal, poor distribution and variability from
year to year. Rainfall distribution over the area is Bimodal, characterized by a short rainy
season (Belg) and the long rainy season (Meher) that occurs in February-April and July-
October respectively with a short dry spell (May- June). According to meteorological data
from Sirinka Agricultural Research, Kobo sub-center, the mean annual rainfall ranges
between 500-800 mm while the mean maximum and mean minimum temperature varies from
33.07- 26.67 0C and 19.48-12.31 0C, respectively. There are three types of soils in the district
based on color, texture, water holding capacity and productivity /fertility status. The soils are
black, red and sandy soil with the area coverage of 40, 37, and 23 percents of the total area of
the district, respectively. Black soil is found in both midland and lowlands, and the red and
sandy soils are found in the wider areas of the lowlands Girma et al. (2000).
Figure 3. Map of the study area
3.1.2. Population and area coverage

24
In Kobo district, there are 34 rural and 6 urban kebele administrations. The urban kebele
administrations are located in Kobbo, Robit and Gobiye towns. According to (CSA, 2012),
the total human population in Kobo district is estimated to be 248,711 , an increase of 11.2%
over the 2007 census, of whom 124,998 are males and 123,713 are females. According to the
(CSA, 2007) census, a total of 52,108 households were counted in this woreda, resulting in an
average of 4.08 persons to a household. The majority of the inhabitants practiced Ethiopian
Orthodox Christianity, with 82.88% reporting that as their religion, while 16.5% of the
population said they were Muslim.
With an area of 2,001.57 square kilometers, Kobo has a population density of 124.3, which is
less than the Zone average of 137.1 persons per square kilometer. Agriculture and Rural
development office of the district reported that the topography of the area to be categorized as
65 percent plain, 15 percent rugged and the remaining 20 percent is mountainous.
3.1.3. Agricultural production
The agricultural practice of the Kobo is mainly characterized by mixed farming system of
which the crop sub-system dominates over livestock rearing. According to (Girma et al.,
2000), 66.5 percent of the population in Kobo is engaged in mixed farming whereas 27
percent and 2 percent of the population depend only on crop and livestock production,
respectively. This is summed to about 95.5 percent of the people revealing that a larger
proportion rely on the production of either crops or livestock or both.
The crop production sub system is both rain fed and irrigated. The rain fed crop production is
dominated by cereals such as Sorghum and Tef where as the irrigation crop farming is
dominated by vegetables and cereals again. Other crops which grow in the district include
barley, wheat, field pea and lentils. Chickpea is also grown when rainfall is late and not
adequate to support the growth of main crops. Since 2005 onwards, with the use of ground
water for irrigation, farmers are producing twice a year. In addition to the above cereals,
cultivation of the more commercial crops such as tomato, onion and pepper are undertaken
during the dry season i.e. from March/April to June/July using irrigation water. On the other

25
hand, goats and cattle dominate the livestock production sub-system. The sub-system is also
characterized as sedentary and semi-pastoralist.
3.2. Sources and Methods of Data Collection
3.2.1. Sources of data
The study used both primary and secondary data. Primary data was collected from key
informants and individual interviews with respondents who were randomly selected from the
kebeles. Secondary data was gathered from several sources located around the study area to
back the primary data. The institutions for secondary data sources include Sirinka Agricultural
Research Center and Kobo woreda agricultural office. Moreover, regular statistical reports
from sources like the Ministry of Agriculture and CSA were reviewed.
3.2.2. Sampling
A multi-stage sampling method was used to select sample respondents of the study. Kobo
woreda is purposively selected because of its higher sorghum production from Amhara
region. Consequently, the district has long stayed as a major sorghum research intervention
and technology promotion site. From the woreda, a total of 20 kebeles were first selected on
the basis of sorghum production availability. Kebeles with no or little sorghum production are
not considered for sample selection. From the 20 sorghum growing kebeles, 6 of them are
sites for HOPE project intervention. Thus a total of 5 kebeles of which 2 from HOPE
intervention sites and 3 from non-HOPE kebeles were randomly selected based on proportion
to size bases. The sample for the study was therefore drawn from both target and non-target
kebeles of the project. Accordingly, 68 sorghum growing households from HOPE target
kebeles and 82 households from non-target kebeles were randomly selected for the interview.
Thus, a total of 150 were selected based on proportionate to size probability sampling
technique, Table 2.

26
The sample size is determined by following a formula developed by Yemane, 1967. The
formula is:
𝑛𝑛 = 𝑁𝑁
1 + 𝑁𝑁(𝑒𝑒)2− − − − − − − − − − − − − − − − − − − − − −(1)
Where n is the sample size for the study, N is the population of interest which is 50000, e is
the precision level which is 0.08 in this study. The formula is valid for 95% confidence level
and p=0.5 (the level of variability assumed to exist in the population which is the maximum
level in this case).
The sample size from each kebeles was determined based on their proportion to total share of
households residing in each kebeles.
Table 2. Size of sample households in the sample kebeles
HOPE intervention Kebeles Total No of households % No of Sampled HHs
Treatment village Aradom 1800 18% 27
Treatment village Abuare 2730 27.3% 41
Control village Gedemeyu 1670 16.7% 25
Control village Mendefera 1930 19.3% 29
Control village Qeyu Gara 1870 18.7% 28
Total 10000 100 150
Source: Own survey data, 2013
3.2.3. Method of data collection
Both structured and semi structured questionnaires were prepared, pretested and adjusted
accordingly. Enumerators having better qualification and experience in data collection were
trained on how to administer the data collection work. The data was collected, with due
supervision of the student researcher.

27
3.3. Data Analysis
The study used both descriptive statistics and econometric model results for data analyses.
The analysis was made using STATA version 11 software package.
3.3.1. Descriptive analysis
Descriptive statistics includes ratios, percentages, mean, standard deviation, minimum,
maximum, range, chi-square for nominal variables, and t-test comparison for continuous
variables. The methods were employed to assess the socio-economic factors associated with
the adoption intensity and varietal preferences. The descriptive method of analysis was also
used to assess status of adoption and diffusion of HOPE induced technologies and farmers’
awareness of HOPE induced technologies in the study area.
3.3.2. The Tobit model
The econometric model, Tobit, was used to trace the important determinants of adoption and
intensity of use of improved sorghum varieties among the sample households. Factors
affecting adoption and the intensity of use of improved sorghum varieties were estimated by
examining their influence on proportion of sorghum area planted with improved Sorghum
varieties. The proportion of area planted with improved sorghum seed has a censored
distribution since it is zero for those not adopting (hereafter called non-adopters). This
suggests that ordinary least squares regression is not appropriate and that Tobit estimation
should be used (Tobin, 1958). The rationale to use the Tobit model than other adoption
models such as logit or probit is to overcome the deficiency of those models to determine
level of adoption. Looking into the empirical studies in the literature, many researchers have
employed the Tobit model to identify factors influencing adoption and intensity of technology
use. For example, according to Adesina and Zinnah (1993), the advantage of the Tobit model
is that, it does not only measure the probability of adoption of technology but also takes care
of the intensity of use.

28
The general formulation of the model is given in terms of latent index function shown bellow.
Following (McDonald and Moffit, 1980): Let AIi = adoption Intensity of an improved
sorghum variety of ith farmer, AI* = the latent variable and the solution to utility maximization
problem of intensity of adoption subject to a set of constraints per household and conditional
on being above a certain limit,
Xi= Vector of factors affecting adoption and intensity of adoption,
Bi= Vector of unknown parameters, and
Ui= is the error term which is normally distributed with mean 0 and variance 𝜎𝜎2
AI* = Bo + BiXi + Ui
AI = AI* if Bo + BiXi + Ui > 0
= 0 if Bo + BiXi + Ui ≤ 0 ------------------------------------------------ (2)
Equation (1) represents a censored distribution of intensity of adoption since the value of AI
for all non-adopters equals zero.
The model parameters are estimated by maximizing the Tobit likelihood function of the
following form (Maddala, 1997 and Amemiya, 1985).
--------------------- (3)
Where f and F are respectively, the density function and cumulative distribution function of
AIi*.
Following Tobin (1958), the expected intensity of adoption of improved sorghum varieties
Across all Observations E(AI) is:
E (AI) = XßF(z) + σf(z)............................................................. (4)

29
Similarly, the expected value of intensity of use of improved sorghum varieties by adopters
was estimated by:
E(AIi|AIi* > 0) = Xß + σf(z)/F(Z)……………………………….......(5)
where X is a vector of explanatory variables, F (z) is the cumulative normal distribution of z, f
(z) is the value of the derivative of the normal curve at a given point (i.e., unit normal
density), z is the Z-score for the area under normal curve, β is a vector of Tobit maximum
likelihood estimates, and 𝜎𝜎 is the standard error of the error term.
The Tobit coefficients do not directly give the marginal effects of the associated independent
variables on the dependent variable. But their signs show the direction of change in
probability of adoption and the marginal intensity of adoption as the respective explanatory
variable changes (Amemiya, 1985; Maddala, 1985; Goodwin, 1992). Therefore, the
McDonald and Moffit (1980) model was introduced for interpretation of results. The model
shows that the marginal effect of an explanatory variable on the expected value of the
dependent variable is:
)6()()(−−−−−−−−−−−−−−−−=
∂∂
ii
i zFXAIE β
Also, the change in the probability of adopting a technology as independent variable 𝑋𝑋𝑖𝑖
changes is:
)7()()(−−−−−−−−−−−−−−−−−−−−−=
∂∂
σβi
i
zfX
zF
And, the change in intensity of adoption with respect to a change in an explanatory variable
among adopters is:

30
)8()()(
)()(1
)0( 2*
−−−−−−−−−−−−−−−−
−−=
∂
>∂
zFzf
zFzfz
X
AIAIE
i
iβ
Definition of variables and hypotheses
The dependent variable used in the Tobit model was the share of total sorghum area that is
cultivated with improved varieties. The independent variables are socioeconomic,
demographic, institutional characterstics and technology perception of the farm households.
The relationship of the independent variables to the dependent variable is hypothesized in
Table 3.
Sex of the household head: sex is an important explanatory variable that explains adoption
and intensity of use of new technologies. Various societies differ in values, roles and
responsibilities that they share within the social members. Within the existing socioeconomic
setting in the study area in particular and the national level in general, there exist different
social, economical and political role among female and male headed household. Therefore, it
was hypothesized that being a female headed household would have an indirect or direct
negative influence in adoption and intensity of use of improved sorghum varieties.
Education status of the household head: Education is a process of changing human
behavior through understanding environmental, social and technical knowledge to achieve
better livelihood. The variable in this study is a dummy variable defined as literate and
illiterate based on the ability to read and write. It is hypothesized that education status of
household heads positively influence their improved sorghum adoption and use intensity.
Farming experience of the household head: It is the number of consecutive years since the
farmer has started farming on his farmland. It explains adoption and intensity of use of
improved technologies as it determines farmers’ skill of information accessing and utilization
behavior. Thus, farmers with better farming experience are expected to adopt improved
sorghum varieties with better degree.

31
Active labor ratio in the household: It is the ratio of active members of the family to the
total family size. The measure enables us to know the level of labor availability in the
household. Active members of the family are those who are in the working age group and are
currently engaged in households’ agricultural activities. It is hypothesized that this variable
positively affects adoption and intensity of use of improved sorghum varieties.
Livestock ownership: Livestock are permanent and semi-permanent assets for farmers in the
study area. Their purpose is multi-dimensional ranging from being as factor of production to a
symbol of prestige. The study hypothesized that livestock amount would have a positive
relationship with technology adoption and intensity as those livestock owner farmers could
have enough cash to purchase required amount of improved input for production. A tropical
livestock unit is used to measure the ownership of livestock by sample households. The unit is
composite measure of livestock amount composed from each type of livestock species to ease
the analysis of the subject for readers.
Access to ox: The availability of oxen in the farming household is another important variable
that is expected to explain adoption of improved sorghum varieties. It was hypothesized as
availability of oxen in the household positively affects adoption and intensity of use of
improved sorghum varieties.
Cultivated farm size: It is the amount of land operated in the survey year measured in
hectare. From literature, the effect of farm size on technology adoption is mixed. Some of the
literatures argue that farm size affect technology adoption positively for that those large
farmers have the required resource to adopt available technologies. Some others however
argue that small farms are efficient as they intensively utilize technology and labor. This study
follows the later argument and hypothesized a negative relation between cultivated farm size
and improved sorghum varieties adoption and intensity.
Participation in off-farm: It is a dummy variable which take 1 for participation in off-farm
activities and 0 for non-participation. Participation in such activities avail cash for purchase of
32
inputs such as improved seeds. Therefore, it is with this premises that is hypothesized in this
study as participation in off-farm activities would positively affect adoption and intensity of
use of improved sorghum varieties.
Farmers’ perception for sorghum attributes: farmers’ perception for attributes of improved
technologies are vital variables in explaining adoption decision. In the study area, farmers are
well aware of various sorghum attributes which are meant to be translated in to various
market, consumption and environmental utilities. As being major staple crop in the study area,
sorghum plays a vital role in fulfilling household consumption and cash requirements.
Accordingly, farmers’ perception for yield capacity, taste quality, and feed importance of
improved sorghum varieties were asked. The variables are dummy taking 1 for perceiving
superiority of improved varieties over the locals and 0 otherwise. Better perception of those
attributes for improved varieties is hypothesized affect adoption and intensity positively.
Irrigated land: it is the amount of irrigated land measured in hectare during the survey year.
The farming system in the survey area is increasingly changing from only rain fed to a
mixture of both rain fed and irrigation. Consequently, farmers’ choice of crop and variety
types is becoming important farm decision. This, study hypothesized that an increase in
irrigated farm has a positive relation with improved sorghum adoption. This is due to an
expectation that the early maturing improved sorghum varieties would be more suitable to fit
to the crop rotation system that farmers might exercise in their irrigated farms.
Participation in on-farm trials: Farmers’ participation in research activities was also
hypothesized to positively explain sorghum adoption and intensity as it determines their
knowledge and information level about the existence and performance of available new
varieties. On-farm trial and field visit are usually major strategies used as a means of variety
promotion and dissemination by extension system and agricultural research centers.
Therefore, for the interest of this study, farmers who either participate in on-farm trials or
field visit are considered as research participants.

33
Credit use: The accessibility of credit from appropriate sources helps farmers to increase
their adoption of agricultural technologies. Hence, credit is hypothesized to influence
adoption and extent of use of improved sorghum varieties positively. This variable is dummy
which takes 1 if the farmer obtained credit and, 0 otherwise.
Experience in extension service: Public Extension service is a crucial component of
government’s agricultural supports in Ethiopia. It is through this service that major share of
inputs required by the farmers reach to the production process. The quality and accessibility
of this service therefore will have an eminent role in improving agricultural technology
dissemination there by boosting productivity. It is from this bases that is hypothesized in this
study as experience in agricultural extension service would have a positive relation with the
adoption and intensity of use of improved sorghum varieties.
Proportion of sorghum area: It is the share of sorghum area in the survey year from the total
cultivated farm land. The more the share of the sorghum area, the more attention the farmers
give to the crop and the more likely they adopt new varieties in higher extent.
Distance from farmers’ training center: The closer the farmer to the farmers’ training
centre, the more likely he/she will receive valuable information and/or input to adopt
improved technology. Therefore, the sign of this variable is expected to be negative.
Table 3. Explanatory variables used in the Tobit model and their expected signs
Independent variable Exp sign Variable description
Sex of the household head + Dummy, favorable response = 1
Education status of the household head + Dummy, favorable response = 1
Farming experience of the household head + Farming experience in years
Family labor supply + Proportion of active Labor from
Livestock ownership + In Tropical Livestock Unit
Access to ox + Dummy, favorable response = 1
Total cultivated farm size - Size of farm measured in hectare

34
Participation in off-farm of household head + Dummy, favorable response = 1
Farmers' perception for yield of improved
sorg
+ Dummy, favorable response = 1
Farmers’ perception for taste of improved
sorg
+ Dummy, favorable response = 1
Farmers’ perception feed importance + Dummy, favorable response = 1
Irrigated land size + Irrigated Farm size in hectare
Participation in on-farm trials + Dummy, favorable response = 1
Credit use + Dummy, favorable response = 1
Experience in extension service + Number of years
Proportion of sorghum area + Ratio of area covered by sorghum
Distance to farmers’ training center - Walking distance in kilometers
Source: own data, 2013.
3.3.3. The Multinomial logit model
To start with the economic model, farmers’ preference for crop attributes is modeled
following Lancaster’s attribute theory of consumer choice (Lancaster, 1966) as cited in
(Edilegnaw, 2005). According to the characteristic model, developed by Lancaster (1966),
consumers derive utility not from goods themselves but from the attributes they provide. This
implies that farmers are maximizing their household utility by consuming their preferred
variety attributes not by directly consuming the varieties embedding those preferred attributes.
This would mean that farm household characteristics and variety characteristics translate to
varietal choice and land allocation decisions. Thus, the probability of existence of a variety on
farmers’ fields is a function of the extent to which it embeds the most important attributes
playing a key role to the household. Therefore, the question boils down to the fitness of the
variety characteristics with household concerns (Edilegnaw, 2005).
Thus, consumers (farmers in this case) are assumed to be rational in the sense that they make
choices that maximizes the perceived utility from sorghum attributes subject to constraints.
Suppose ϖ1 is the vector of socioeconomic, demographic and environmental characteristics of

35
farmers reflecting their endowments, concerns and preferences and Zij is a vector of attributes
of sorghum varieties in the choice set. Then utility from sorghum attributes is given by:
𝑈𝑈𝑠𝑠𝑠𝑠𝑠𝑠𝑠𝑠ℎ𝑢𝑢𝑢𝑢 𝑝𝑝𝑠𝑠𝑠𝑠𝑝𝑝𝑢𝑢𝑝𝑝𝑝𝑝𝑖𝑖𝑠𝑠𝑝𝑝 = 𝑓𝑓( 𝑍𝑍1𝑓𝑓𝑓𝑓 ⋯𝑧𝑧𝑝𝑝𝑓𝑓𝑓𝑓,𝑍𝑍1𝑖𝑖𝑓𝑓 ⋯𝑧𝑧𝑝𝑝𝑖𝑖𝑓𝑓/ 𝜛𝜛1) ----------(9)
Where Zfv are the attributes of farmers’ varieties and Ziv are the attributes of improved
varieties. From the available choice set, the ith farmer will select the combination of variety
attributes that will maximize the derived utility.
Let the probability that the ith farmer chooses the jth variety attribute be pij and denote the
choice of the ith farmer by Yij= (yi1, yi2….yij) where Yij = 1 if the jth attribute is selected and all
other elements of Yi’ are zero. If each farmer is observed only a single time, the likelihood
function of the sample of values Yi1., Yij is:
𝐿𝐿 = �𝑝𝑝𝑖𝑖1𝑌𝑌𝑖𝑖1𝑢𝑢
𝑗𝑗=1
𝑝𝑝𝑖𝑖2𝑌𝑌𝑖𝑖2 ⋯𝑝𝑝𝑖𝑖𝑗𝑗𝑦𝑦𝑖𝑖𝑗𝑗 ; 𝑖𝑖 = 1,2 …𝑛𝑛 𝑎𝑎𝑛𝑛𝑎𝑎 𝑗𝑗 = 1,2. .𝑚𝑚 −−− (10)
Where n is the number of farmers and m is the number of varieties’ attributes. Using the
maximum likelihood procedure and assuming that each farmer is maximizing utility (𝑈𝑈𝑖𝑖𝑗𝑗= 𝜇𝜇𝑖𝑖𝑗𝑗 + 𝜀𝜀𝑖𝑖𝑗𝑗) −−−−−−−−−−−−−−−−−−−−−−(11)
The probability that farmer i chooses variety attribute 1 among m attributes is given by:
𝑝𝑝𝑖𝑖1 = 𝑝𝑝𝑝𝑝⌈𝑈𝑈𝑖𝑖1 > 𝑈𝑈𝑖𝑖2,𝑈𝑈𝑖𝑖1 > 𝑈𝑈𝑖𝑖3, … 𝑎𝑎𝑛𝑛𝑎𝑎 𝑈𝑈𝑖𝑖1 > 𝑈𝑈𝑖𝑖𝑢𝑢⌉ −−−−−−−−−−−−(12)
𝑃𝑃𝑝𝑝[𝜀𝜀𝑖𝑖1 − 𝜀𝜀𝑖𝑖2 > 𝜇𝜇𝑖𝑖2 − 𝜇𝜇𝑖𝑖1, 𝜀𝜀𝑖𝑖1 − 𝜀𝜀𝑖𝑖3 > 𝜇𝜇𝑖𝑖3 − 𝜇𝜇𝑖𝑖1 𝑎𝑎𝑛𝑛𝑎𝑎 𝜀𝜀𝑖𝑖1 − 𝜀𝜀𝑖𝑖𝑢𝑢 > 𝜇𝜇𝑖𝑖𝑢𝑢 − 𝜇𝜇𝑖𝑖1 ] −− (13)
Maintaining our notation that and taking the exp (𝜇𝜇𝑖𝑖𝑝𝑝) instead of 𝜇𝜇𝑖𝑖𝑝𝑝to
insure non-negative probability leads to:
𝑃𝑃𝑖𝑖𝑗𝑗 =𝑒𝑒𝑒𝑒𝑝𝑝{𝜇𝜇𝑖𝑖𝑝𝑝}
𝑒𝑒𝑒𝑒𝑝𝑝{𝜇𝜇𝑖𝑖1} + 𝑒𝑒𝑒𝑒𝑝𝑝{𝜇𝜇𝑖𝑖2}⋯+ 𝑒𝑒𝑒𝑒𝑝𝑝�𝜇𝜇𝑖𝑖𝑗𝑗�− − − − − −−−−−−−− (14)

36
Assuming that the errors across the variety traits (𝜀𝜀ij) are independent and identically
distributed and writing 𝑈𝑈𝑖𝑖𝑝𝑝 = 𝜇𝜇𝑖𝑖𝑝𝑝 + 𝜀𝜀𝑖𝑖𝑝𝑝 and constraining one of the coefficients (β1) to zero
leads us to the specification of the multinomial logit model. Therefore, a multinomial logit
model was used to identify the important factors affecting farmers’ sorghum variety attributes
preference. The model is the extension of the binary logit models; the interpretations are
similar to that of binary logit models (Gujarati, 2004). In the binary case, the comparison is
between category 1 and category 2 (or the first versus the last category). In multinomial case
however, the comparison is between category j and J (or any category versus the last).
After estimating the parameters one can predict the probability that an individual with a
specified set of characteristics will choose any particular attribute (Maddla, 1985). The MNL
model is presented bellow:-
𝑃𝑃{𝑌𝑌𝑖𝑖 = 𝑡𝑡} = 𝑒𝑒𝑒𝑒𝑝𝑝{𝑒𝑒′𝑖𝑖𝑖𝑖𝛽𝛽}1+𝑒𝑒𝑒𝑒𝑝𝑝{𝑒𝑒′𝑖𝑖2𝛽𝛽2}+⋯+𝑒𝑒𝑒𝑒𝑝𝑝�𝑒𝑒′𝑖𝑖𝑖𝑖𝛽𝛽𝑖𝑖�
= 𝑒𝑒𝑒𝑒𝑝𝑝�𝑒𝑒′𝑖𝑖𝑖𝑖𝛽𝛽�1+∑ 𝑒𝑒𝑒𝑒𝑝𝑝�𝑒𝑒′𝑖𝑖𝑖𝑖𝛽𝛽𝑖𝑖�𝑀𝑀−1
𝑘𝑘=1 , 𝑗𝑗 = 1,2⋯ , 𝑧𝑧.−−−− (15)
The predicted probabilities are better interpreted using the marginal effects of the multinomial
model (Greene, 2004).
𝜹𝜹𝑖𝑖𝑗𝑗 = 𝜕𝜕𝜕𝜕𝑖𝑖𝑗𝑗𝜕𝜕𝑿𝑿𝑖𝑖
= 𝑃𝑃𝑖𝑖𝑗𝑗�𝜷𝜷𝑗𝑗 − ∑ 𝑃𝑃𝑖𝑖𝑖𝑖 𝛽𝛽𝑖𝑖𝐽𝐽𝑖𝑖=0 � = 𝑃𝑃𝑖𝑖𝑗𝑗�𝜷𝜷𝑗𝑗 − 𝜷𝜷�� − − − − − −−−−−−−−−(16)
Where, 𝜹𝜹𝑖𝑖𝑗𝑗 denotes the marginal effect (the coefficient), of the explanatory variable on the
probability that alternative j is chosen.
The marginal effect varies as a function of a bunch of things, including
- The probability itself,
- The value of the coefficient estimate,
- The sums of the other coefficients for that covariate.
This implies that the marginal effect may or may not have the same sign as the coefficient
estimate itself.

37
The multinomial logit model is characterized by its importance in considering individual
characteristics: such as education, experience, market access and sex as explaining the
probability of choosing a specified alternative. It is often an attractive analysis because; it
does not assume normality, linearity, or homoscedasticity. It does only have assumptions,
such as the assumption of independence of irrelevant alternative. This assumption states that
the choice of or membership in one category is not related to the choice or membership of
another category (i.e., for the dependent variable). Another way of describing the IIA property
(e.g. Vovsha, 1997) is that, in a model exhibiting IIA over alternatives, all alternatives are
equally independent from each other. McFadden (1974) describes the IIA property by noting
that in the case of an additional alternative, the proportional decrease in the selection
probabilities of the existing alternatives is equal to the selection probability of the new
alternative (with an analogous situation when an alternative is removed).The assumption of
independence was tested with the Hausman-McFadden (1984) test and confirmed no violation
of the IIA assumption.
Definition of variables and hypothesis
The most preferred sorghum varietal traits by farmers are used as dependent variables of
MNL model specified as:
Y1= Yield capacity attribute of sorghum
Y2= Environmental adaptability attribute of sorghum (adaptability to several environmental
hazards)
Y3= Food taste quality attribute of sorghum
The choice of dependent outcomes was decided from literature reviews and key informant
discussions held before formal survey. (Edilegnaw, 2005) and (Sinafkish, 2008) have used
similar dependent variables in their study. The choice of these attributes are conditioned on
various socioeconomic, institutional and perception variables. The description of such
explanatory variables for the model is summarized in Table 4.
Socioeconomic Characteristics of households: various socioeconomic variables are
hypothesized to influence farmers’ varietal trait preference. Sex of the household head is a
dummy variable which takes 1 for female and 0 for male headed households. It is

38
hypothesized that female headed households to opt for food taste quality attribute than other
attributes. This was due to the expectation that women have better acquaintance with cooking
than men. More Educated household heads on the other hand are expected to be more
interested towards income maximizing and/or consumption maximizing (yield capacity) and
utility maximizing (food quality is more tended to be interested to comfort for food) attributes
than environmental adaptability attribute of sorghum crop. However, the effect of age of the
household head on attribute choice is not well understood to put a hypothesis.
Family Size of the household is hypothesized to influence the choice of yield capacity and
environmental adaptability positively. As the size of the family increases, households need
more produce in a sustainable manner. Market access on the other hand is more intended to
create incentive to increase surplus production. Therefore, households which are more nearer
to markets are expected to be more interested in yield maximizing attributes than others.
The effect of land holding and livestock ownership are hypothesized to influence choice of
yield maximizing and utility maximizing attributes than survival stabilizing attribute
(environmental adaptability) of sorghum. As sorghum is considered mainly as a food security
crop, an increase in proportion of sorghum area is expected to influence a choice of food
quality attribute than others. Households’ perception on their food security status is expected
to be translated in to demanding yield maximizing sorghum attributes than others.
Farmers’ knowledge about crop attributes is partly influenced by the information they acquire
from external sources such as extension. Therefore, it is important to investigate the effect of
extension access (distance from FTCs) and extension experience on farmers’ varietal trait
choice. However, the direction of the influence of such variables on sorghum attributes is not
priory understood. Similarly, the effect of off-farm participation and farmers’ village location
on varietal trait preference is not well understood to put hypotheses.
Improved sorghum adoption: Farmers’ choice of improved sorghum varieties is conditioned
up on their subjective judgment on the fitness of those varieties to their interest. The interest
of farmers over growing different new sorghum varieties is also an outcome of various factors

39
that they take in to account. It is hypothesized as adopters to be more interested on yield
maximizing attributes than others.
Perception to major sorghum production constraints: Demand for sorghum attributes is
the outcome of various interacting factor that characterizes the decision makers, farmers.
Besides to the effect of several socioeconomic factors, existence and level of production
constraints also play a vital role in determining choice of crop attributes such as sorghum. To
this end, preferences to sorghum traits by farmers were hypothesized to be influenced by a set
of major sorghum production constraints namely perception of farmers on farm land
availability and fertility, and shortage of labor. To account for, the perception of farmers on
the listed constraints, they were asked to judge whether they perceive that these constraints
are their major constraints that hinder production of sorghum on their farm. The questions
were yes or no types which enabled as to have an indicator on the constraints’ importance in
sorghum production.
Risk proxy: The Risk proxy is a variable which is expected to explain the farmers’ sorghum
attribute choices. The variable is modeled using Roy’s safety first approach ( Roy, 1952) as
cited in (Edilegnaw, 2005). Farmers’ safety-first strategy makes the farmer a lexicographic
optimizer, i.e., an economic agent who aims at meeting the target minimum survival level as a
first priority and maximizes the expected returns as a second priority. In farming, If there is an
expectation of higher net return with higher yield risk and/or lower expected net return with
lower yield variability, the farmers’ decision depend on the extent to which the household is
able to fulfill its basic needs (Basicreq) from its internal endowment (wealth plus expected
‘risk free’ farm and non-farm income denoted as FN).
Min Prob. (FNIncome < Basicreq) ⇒ prob.(FNIncome – Basicreq < 0 ) ---------------(17)
Accordingly, the farmer is considered to take risk if FNincome > Basicreq or will be reluctant to
take risk if FNincome < Basicreq. The decision of the farmer considering ‘survival first motive’
depends on the extent to which the household is able to fulfill basic household needs or
subsistent level of income (Basicreq) from its internal endowment (FNincome) (Edilegnaw, 2005).
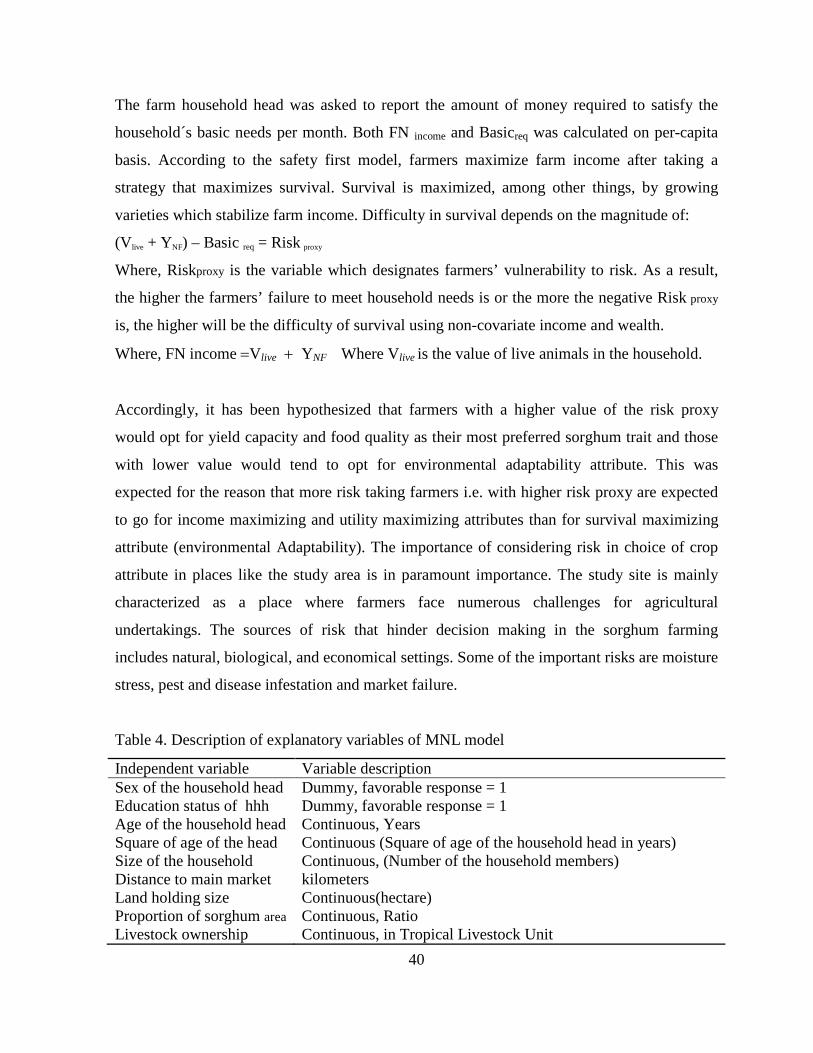
40
The farm household head was asked to report the amount of money required to satisfy the
household´s basic needs per month. Both FN income and Basicreq was calculated on per-capita
basis. According to the safety first model, farmers maximize farm income after taking a
strategy that maximizes survival. Survival is maximized, among other things, by growing
varieties which stabilize farm income. Difficulty in survival depends on the magnitude of:
(Vlive + YNF) – Basic req = Risk proxy
Where, Riskproxy is the variable which designates farmers’ vulnerability to risk. As a result,
the higher the farmers’ failure to meet household needs is or the more the negative Risk proxy
is, the higher will be the difficulty of survival using non-covariate income and wealth.
Where, FN income =Vlive + YNF Where Vlive is the value of live animals in the household.
Accordingly, it has been hypothesized that farmers with a higher value of the risk proxy
would opt for yield capacity and food quality as their most preferred sorghum trait and those
with lower value would tend to opt for environmental adaptability attribute. This was
expected for the reason that more risk taking farmers i.e. with higher risk proxy are expected
to go for income maximizing and utility maximizing attributes than for survival maximizing
attribute (environmental Adaptability). The importance of considering risk in choice of crop
attribute in places like the study area is in paramount importance. The study site is mainly
characterized as a place where farmers face numerous challenges for agricultural
undertakings. The sources of risk that hinder decision making in the sorghum farming
includes natural, biological, and economical settings. Some of the important risks are moisture
stress, pest and disease infestation and market failure.
Table 4. Description of explanatory variables of MNL model
Independent variable Variable description Sex of the household head Dummy, favorable response = 1 Education status of hhh Dummy, favorable response = 1 Age of the household head Continuous, Years Square of age of the head Continuous (Square of age of the household head in years) Size of the household Continuous, (Number of the household members) Distance to main market kilometers Land holding size Continuous(hectare) Proportion of sorghum area Continuous, Ratio Livestock ownership Continuous, in Tropical Livestock Unit

41
Participation in off-farm Dummy, favorable response = 1, 0 otherwise Sorghum adoption Dummy, 1 if the HH adopted improved sorghum varieties, 0
otherwise Food security perception Dummy, Farmers perception of their food security status Loss of soil fertility Dummy, Perception on soil infertility as major production
problem (1 if the respondent percept the constraint as major sorghum production challenge, 0 otherwise)
Shortage of labor Dummy, Perception on labor shortage as major production problem (1 if the respondent percept the constraint as major sorghum production challenge, 0 otherwise)
Frequency of pest Forecasted frequencies of potential pest occurrence in 10 years Risk proxy Value of risk free assets minus basic expenditures Distance from FTC Distance in kilometers from FTC to residenc Experience in extension Number of consecutive years since using extension services ARADOM Village dumy for aradom (1=Aradom, 0=baseline village?) ABUARE Vlllage dummy forAbuare (1=Abuare,0=baseline village?) GEDEMEYU Village dumy for Gedem (1=Gedem, 0=baseline village?) QEYUGARA Village dummy for Qeyu (1= Qeyu, 0=baseline village?) MENDEFERA Village dummy for Mendefera (1= Mendefera, 0=baseline villa Source: own survey data, 2013
3.3.4. Test of multicolinearity
Multi-colinearity is a situation where we encounter an association among the explanatory
variables. It refers to a situation where it becomes difficult to separate effects of independent
variables on the dependent variable because of strong relationships among independent
variables (Maddalla, 1977). Before running the Tobit and MNL model, an assessment for an
existence of multi-colinearity was tested. For the Tobit model, a separate test for continuous
and categorical variables included in the model was undertaken using VIF and Contingency
Coefficient procedures respectively.
Variance inflation factor / VIF/ and contingency coefficient
VIF method is used to detect multicolinearity problem among continuous dependent
variables. According to Maddala (1992), it can be computed using the formula,
VIF (xi) = 211
iR−

42
Where 2iR is the squared multiple correlation coefficient between Xi and the other
explanatory variables. As a rule of thumb a VIF value of more than 10 is said to be
highly collinear (Gujarati, 1995).
Similarly, the existence of association among discrete explanatory variables is tested using
contingence coefficient method using a formula shown bellow. A value of 0.75 or more
indicates a stronger relationship (Healy, 1984 as cited in Destaw, 2003).
Where: C.C = Contingency coefficient, n = sample size, and χ2=Chi square value.
4. RESULTS AND DISCUSSIONS
This chapter mainly presents the findings of the study with an appropriate level of discussion.
It is divided in to four sub-headings that could give a brief account of the subjects that were
being investigated by the study. The first sub-heading presents socioeconomic characteristics
of sample households. The second sub-heading is about description on choice of sorghum
attributes by sample households. An overview of current sorghum production practice is also
discussed in the third subheading by disaggregating the findings in to adopters and non-
adopters categories. The fourth subheading is left for econometric model result which deals
with determinants of adoption and intensity of use of improved sorghum varieties and choice
of preferred sorghum attributes by the sample households.
4.1. Socioeconomics Characteristics of Sample Households
4.1.1. Household characteristics

43
Family structure: A comparison of some indicators of family structures in table 5 showed no
statistically significant difference among adopters and non-adopter farmers. Household size of
sampled farmers ranged between 1 and 10 persons per household. The average family size of
sample households was found to be 5.11 persons. Although not statistically different, adopter
and non-adopter farmers had on average 5.13 and 5.1 persons per household respectively.
A household usually consists of dependent members, active members or both in varying
proportion. On average sample households had 3.51 dependent members. An independent
sample t-test comparison showed no evidence on the statistical difference in the adopter and
non-adopter categories in terms of number of dependent members. Number of active
household members ranged from 0 to 3 persons. Although not statistically different, adopter
and non adopter households had 1.55 and 1.64 active members respectively. Active ratio is a
variable which measures proportion of active family members from the total family size. On
average sample households had 0.34 active ratios per household. Adopters on average had
0.32 and non-adopters 0.35 active proportions from their total family size. An independent
sample t-test showed no statistical difference among adopters and non-adopters in terms of
proportion of active family members.
Age of the sample respondents in the study ranged from 24 to 70 years old. The average age
of the respondents in the sample was 42.95 years old. Adopters were 43.36 years old while
non-adopters 42.72 on average. The result in table 5 also showed no statistically significant
mean difference between adopter and non-adopter farmers in terms of age. The average
farming experience of households was found to be 20 years. An independent sample t-test
showed no statistically significant farming experience difference among adopter and non-
adopter farmers.
Table 5. Family structure of sample households by improved sorghum varieties adoption
Family structure Category Min Max Mean Std. Deviation
t-value
Family size
Adopter 2 10 5.13 1.83 -0.092 (NS) Non-adopter 1 9 5.1 1.84 Total 1 10 5.11 1.83

44
Dependent members Adopter 1 9 3.58 1.71 -0.40 (NS) Non-adopter 0 8 3.46 1.8 Total 0 9 3.51 1.76
Active labour force Adopter 0 3 1.55 0.8 0.73(NS) Non-adopter 0 3 1.64 0.71 Total 0 3 1.61 0.74
Active ratio Adopter 0 0.75 0.32 0.16 1.18 (NS) Non-adopter 0 1 0.35 0.2 Total 0 1 0.34 0.18
Age of the HHH (years)
Adopter 26 70 43.36 12.24 Non-adopter 24 70 42.72 12.29 Total 24 70 42.95 12.24 -0.303 (NS)
Farming experience of HHH (years)
Adopter 3 45 20.74 12 Non-adopter 1 45 19.67 11.61 Total 1 45 20.05 11.72 -0.531 (NS)
Source: own Survey data, 2013 Std. Deviation= standard deviation, t-value= T-value NS=
Non-significant
Education: Table 6 summarizes education status of sample households. Out of 150 sample
households, 70 household heads (46.6 %) were illiterates, where as 80 (53.4 %) could at least
read or write. A chi-square test comparison with a 5 % level of probability showed a
significant difference in ability to read and write between adopters and non- adopters. Among
the 53 adopters 35 (66 %) could at least read and write while only 46.4 % of the 97 non-
adopter farmers did so.
The difference in adopters and no-adopters was not only in their ability to read and write.
Further disaggregation of education information into levels also showed a significant
association between educational level and improved sorghum adoption. Table 6 describes that
a chi-square comparison of adopters and non-adopters and shows a systematic association
with a χ2 = 7.497 at less than 10% probability level. From adopter group 9 (17%) of them
attended up to a junior level of education while only 7 (7.2 %) of non-adopters were able to
do so. It was also found that 11 (20.8 %) of adopter farmers attended school beyond junior
grade where as only12 (12.4 %) of the non-adopter counterparts could do so.

45
Table 6. Education status of household heads by improved sorghum varieties adoption
Education level of the HHH
Adopters Non adopters Total χ 2 -value
No % No % No % 5.3149**
Illiterate 18 34 52 53.6 70 46.6 Literate 35 66 45 46.4 80 53.4 Total 53 100 97 100 150 100 Source: own Survey data, 2013 **represents level of significance at 5%
Table 7. Education level of household heads by improved sorghum varieties adoption
Education level of the HHH Non adopters Adopters Total χ 2 -value No % No % No %
Can’t read and write 52 53.6 18 34 70 46.7 7.497* Can only read and write 26 26.8 15 28.3 41 27.3 Grade 1-6 7 7.2 9 17 16 10.7 Greater than 6 grade 12 12.4 11 20.8 23 15.3 Total 97 100 53 100 150 100 Source: own Survey data, 2013 *represents level of significance at 10%
Gender: Table 8 describes that out of the total sample, 121 (80.7 %), respondents were male
headed and the rest 29 (19.3 %) were female headed households. A chi-square comparison
between categories of adopters and non-adopters in terms of their sex however showed no
evidence to conclude any systematic association between male headed and female headed
households in terms of their improved sorghum technology adoption status. Though not
statistically different, 7 (13.2 %) and 46 (86.8 %) of the adopters were found to be female
headed and male headed households respectively. On the other hand, 7 (24.1%) of female
headed and 46 (38 %) of male headed households were found to be adopters of improved
sorghum varieties.
Table 8. Sex of the household head by improved sorghum varieties adoption
Sex of the HHH Non adopters Adopters Total χ 2 -value No % No % No %
Male 75 77.3 46 86.8 121 80.7 1.972 (NS) Female 22 22.7 7 13.2 29 19.3 Total 97 100 53 100 150 100 Source: own Survey data, 2013 NS=Non-significant
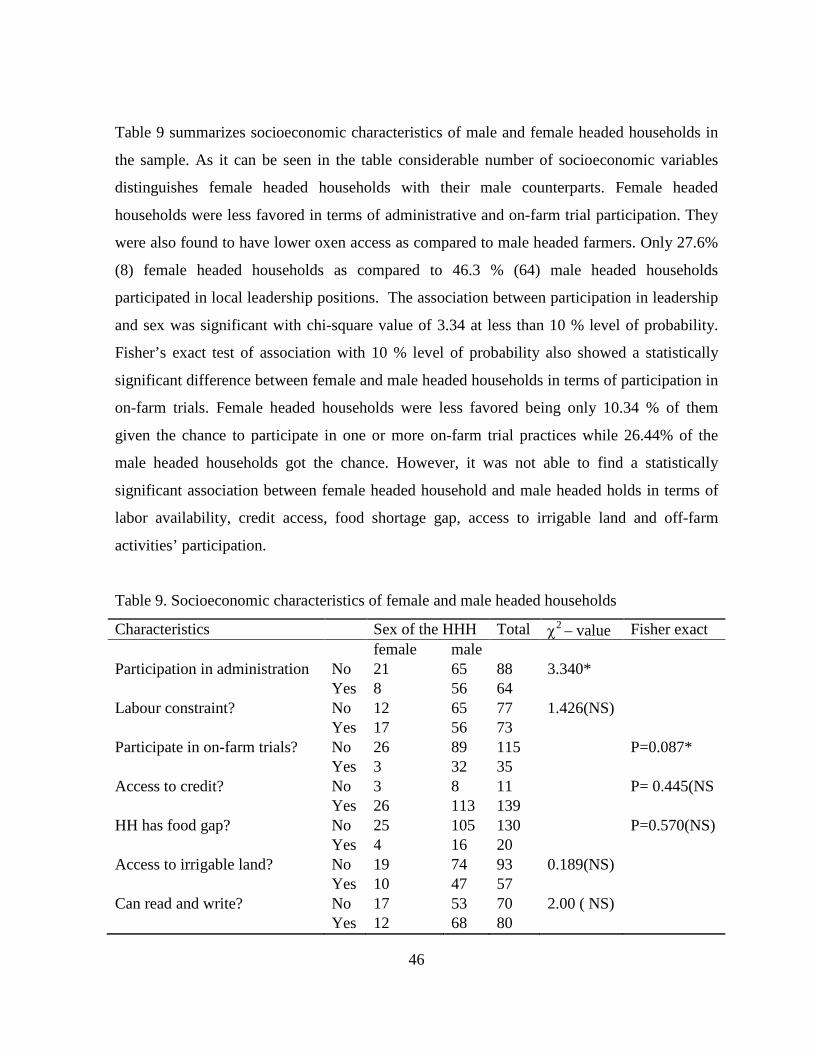
46
Table 9 summarizes socioeconomic characteristics of male and female headed households in
the sample. As it can be seen in the table considerable number of socioeconomic variables
distinguishes female headed households with their male counterparts. Female headed
households were less favored in terms of administrative and on-farm trial participation. They
were also found to have lower oxen access as compared to male headed farmers. Only 27.6%
(8) female headed households as compared to 46.3 % (64) male headed households
participated in local leadership positions. The association between participation in leadership
and sex was significant with chi-square value of 3.34 at less than 10 % level of probability.
Fisher’s exact test of association with 10 % level of probability also showed a statistically
significant difference between female and male headed households in terms of participation in
on-farm trials. Female headed households were less favored being only 10.34 % of them
given the chance to participate in one or more on-farm trial practices while 26.44% of the
male headed households got the chance. However, it was not able to find a statistically
significant association between female headed household and male headed holds in terms of
labor availability, credit access, food shortage gap, access to irrigable land and off-farm
activities’ participation.
Table 9. Socioeconomic characteristics of female and male headed households
Characteristics Sex of the HHH Total χ2 – value Fisher exact female male Participation in administration No 21 65 88 3.340* Yes 8 56 64 Labour constraint? No 12 65 77 1.426(NS) Yes 17 56 73 Participate in on-farm trials? No 26 89 115 P=0.087* Yes 3 32 35 Access to credit? No 3 8 11 P= 0.445(NS Yes 26 113 139 HH has food gap? No 25 105 130 P=0.570(NS) Yes 4 16 20 Access to irrigable land? No 19 74 93 0.189(NS) Yes 10 47 57 Can read and write? No 17 53 70 2.00 ( NS) Yes 12 68 80

47
Oxen access? No 4 4 8 5.1** Yes 25 117 142 Participation in off-farm? No 25 104 129 P=0.61(NS) Yes 4 17 21 Total 29 121 150 Source: Own survey data, 2013, NS= Non-significant, * *represents level of significance at 5%, * represents level of significance at 10%
Resource ownership and gender: Table 10 summarizes resource ownership between male
and female headed households. Many of the comparisons were found to show that female
headed households have more or less similar resource ownership with the male headed
households. However, a chi-square comparison at 5 % probability level showed existence of
significantly different number of oxen ownership among female and male headed households.
Male headed households kept an average of 1.79 numbers of oxen while female headed
household kept 1.41 numbers of oxen on average. The mean number of oxen that sample
households own was 1.72. On the other hand, an independent sample t-test comparison of the
two groups in terms of tropical livestock unit ownership, number of active family labor,
family size and total cultivated land showed no significant difference.
Table 10. Resource endowments by sex of household heads
Resources Sex of the HHH Mean Std. Deviation t-value
TLU male 4.82 3.57 1.141(NS) female 4.03 2.37 total 4.67 3.38 Number of oxen male 1.79 0.78 2.369**
female 1.41 0.73 total 1.72 0.79 No of active family labour male 1.58 0.73 -0.950 (NS)
female 1.72 0.8
total 1.61 0.74
Family size male 5.15 1.89 0.480 (NS)
female 4.97 1.83

48
total 5.11 1.83
Cultivated farm by the HHH male 1.64 0.74 0.024 (NS)
female 1.64 0.85
total 1.64 0.76
Source: Survey data, 2013, NS= Non-significant, * *represents level of significance at 5%,
4.1.2. Resource ownership
Livestock: Table 11 summarizes ownership of various livestock species for adopter and non-
adopter farmers. The mean numbers of livestock in the sample were 1.72 oxen, 1.21 cows,
o.99 heifers or bulls, 0.82 calves, 0.82 sheep, 1.25 goat, 3.31 chicken, 0.35 donkey and 0.35
camels.
An independent sample t-test analysis at 10 % probability level on tropical livestock
ownership revealed a significant variation between adopters and non-adopters. Adopters were
found to own more livestock than their non adopter counterparts. They had a mean of 5.07
TLU whereas non-adopters only owned 4.33 TLU. The table also summarizes the level of
livestock ownership in terms of monetary unit. This measure of livestock ownership would
enable us proximate quality and market value of animals kept by adopters and non adopters.
According to an independent sample t-test analysis with 5% probability level, adopter farmers
were found to own higher livestock. It is estimated that sample households own a mean of
27143.4 ETB as an asset from their livestock holding. Adopters had an estimated livestock
value of 30809.7 ETB while non-adopters had 25140.2 ETB, table 11. It also shows that
adopters generally had higher number of oxen than non-adopters. Sample households owned a
mean of 1.72 numbers of oxen. Adopters and non adopters held a mean of 1.94 and 1.6
number of oxen respectively. An independent sample t-test comparison at less than 1 %
probability level showed a significant difference among adopter and non-adopter farmers in
term of the number of oxen ownership.
Table 11. Amount of livestock value and species by improved sorghum varieties adoption
Type Non-adopters Adopters Total
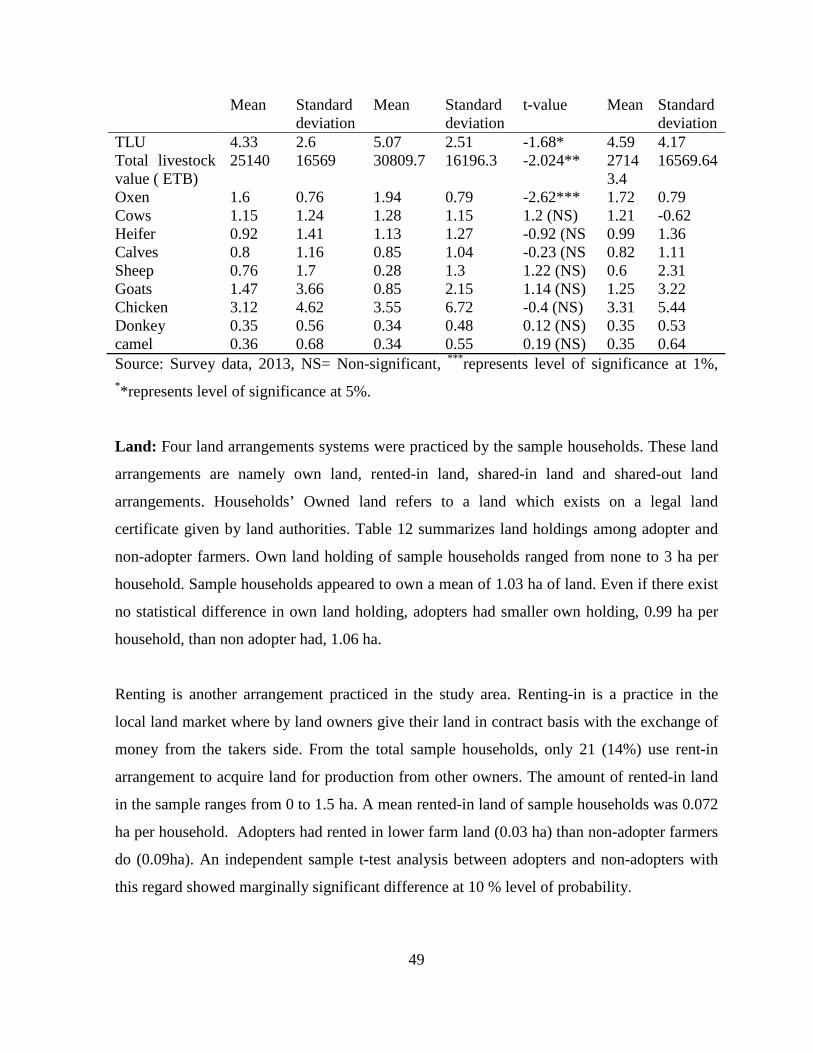
49
Mean Standard deviation
Mean Standard deviation
t-value Mean Standard deviation
TLU 4.33 2.6 5.07 2.51 -1.68* 4.59 4.17 Total livestock value ( ETB)
25140 16569 30809.7 16196.3 -2.024** 27143.4
16569.64
Oxen 1.6 0.76 1.94 0.79 -2.62*** 1.72 0.79 Cows 1.15 1.24 1.28 1.15 1.2 (NS) 1.21 -0.62 Heifer 0.92 1.41 1.13 1.27 -0.92 (NS 0.99 1.36 Calves 0.8 1.16 0.85 1.04 -0.23 (NS 0.82 1.11 Sheep 0.76 1.7 0.28 1.3 1.22 (NS) 0.6 2.31 Goats 1.47 3.66 0.85 2.15 1.14 (NS) 1.25 3.22 Chicken 3.12 4.62 3.55 6.72 -0.4 (NS) 3.31 5.44 Donkey 0.35 0.56 0.34 0.48 0.12 (NS) 0.35 0.53 camel 0.36 0.68 0.34 0.55 0.19 (NS) 0.35 0.64 Source: Survey data, 2013, NS= Non-significant, ***represents level of significance at 1%, **represents level of significance at 5%.
Land: Four land arrangements systems were practiced by the sample households. These land
arrangements are namely own land, rented-in land, shared-in land and shared-out land
arrangements. Households’ Owned land refers to a land which exists on a legal land
certificate given by land authorities. Table 12 summarizes land holdings among adopter and
non-adopter farmers. Own land holding of sample households ranged from none to 3 ha per
household. Sample households appeared to own a mean of 1.03 ha of land. Even if there exist
no statistical difference in own land holding, adopters had smaller own holding, 0.99 ha per
household, than non adopter had, 1.06 ha.
Renting is another arrangement practiced in the study area. Renting-in is a practice in the
local land market where by land owners give their land in contract basis with the exchange of
money from the takers side. From the total sample households, only 21 (14%) use rent-in
arrangement to acquire land for production from other owners. The amount of rented-in land
in the sample ranges from 0 to 1.5 ha. A mean rented-in land of sample households was 0.072
ha per household. Adopters had rented in lower farm land (0.03 ha) than non-adopter farmers
do (0.09ha). An independent sample t-test analysis between adopters and non-adopters with
this regard showed marginally significant difference at 10 % level of probability.

50
Renting-out is an opposite of renting-in land arrangement whereby land owners give their
land to other farmers to get cash in exchange. In the sample households, no farmer from both
adopter and non-adopter sides reported to exercise this practice. Shared-in or out
arrangements on the other hand were practices of acquiring land for production of crop by
which land owners share a proportion of crop produce in exchange of their land from land
operators who take the land for a fixed period of time, usually for one cropping season.
Farmers who share-in land are those who bring factors of production such as oxen, seed and
labour in to the production process and operate the farming exercise. The common
appropriation of produce in the study area is sharing the product equally between the two
parties. Accordingly, sample farmers share-in an average of 0.54 ha in the survey year.
Adopters and non adopter shared in a mean of 0.49 ha and 0.57 ha farm land respectively. On
the other hand a mean of 0.05 ha of land was found to be shared out by sample households to
other farmers. In this arrangement adopters shared-out a mean of 0.04 ha of land while non-
adopters do the same about 0.06 ha of their land. Even if adopter farmers are appeared to
share in and out lesser farm land as compared to their non-adopter counter parts, an
independent sample t-test comparison showed no statistically significant difference between
the two groups.
Cultivated farmland is calculated as a sum of owned, rented-in and shared-in farm land less
shared out farm. It is an effective farm land amount used by sample households to undertake
crop production. Sample households were found to hold a mean of 1.64 ha of cultivated land
in the survey year. Adopters and non-adopters held a mean of 1.5 and 1.72 ha respectively.
An independent sample t-test analysis showed that non-adopters are superior to adopters in
terms of their cultivated land holding at 10% probability level. This finding is in line with
other study results done by (Endrias, 2003).
Table 12. Land arrangement of households by improved sorghum varieties adoption
Land arrangement types Category Min Max Mean Std. Deviation
t-value
Farm land owned by the HH (ha)
Non-adopter 0 3 1.06 0.54 0.77 (NS) Adopter 0.25 2.38 0.99 0.54 Total 0 3 1.03 0.54

51
Farm land rented in by the HH (ha)
Non-adopter 0 1.5 0.09 0.26 1.64 Adopter 0 0.5 0.03 0.1 Total 0 1.5 0.072 0.22
Farm land shared in by the HH (ha)
Non-adopter 0 2.5 0.57 0.58 0.81 (NS) Adopter 0 1.75 0.49 0.5 Total 0 2.5 0.54 0.55
Farm land shared out by the HH (ha)
Non-adopter 0 1.75 0.055 0.26 0.26 (NS) Adopter 0 0.75 0.04 0.16 Total 0 1.75 0.05 0.22
Farm land cultivated by the HH (ha)
Non-adopter 0.47 3.34 1.72 0.74 1.69* Adopter 0.25 3.25 1.5 0.78 Total 0.25 3.34 1.64 0.76
Source: Survey data, 2013, NS= Non-significant, *represents level of significance at 10%.
Table 13 summarizes some farm land related variables which characterizes sample
households of the study area. Adopter farmers appeared to own more irrigable land (0.2 ha)
than non-adopters do (0.1 ha). The mean difference was statistically significant at less than
5% level of probability. This might reflect the fact that the practice of farmers in study area on
management of irrigated lands. In the main irrigation season around the survey area, it is
customary to look an irrigation land covered by cash crops such as onion. The cash crops
reach for harvest in late may and then. This time is a period in which the sowing time of late
maturating local sorghum varieties ends. Therefore, farmers in the area prefer planting of
early maturing sorghum varieties which can potentially compensate the time lag.
Table 13 also shows that a mean of 0.44 ha was infested by striga in survey households.
However, the mean amount of land infested by Striga was not significantly deferent with
adopters having a mean of 0.45 ha and non-adopters having 0.44 ha of infested land. On the
other hand, a mean of 0.76 ha land was allocated by sample households for sorghum
plantation. Land allocated for the crop by sample households ranged from 0.125 to 2 hectares.
Adopters were tend to allocate meager amount of land on average (0.65 ha) as compared to
the non-adopter farmers (0.82 ha). The difference in allocation of land for sorghum between
adopter and non-adopter farmers was also significant at less than 5 % probability level.
Moreover, the proportion of land covered by improved sorghum varieties from the total
sorghum varieties was appeared to be a significant difference among adopter and non-adopter

52
farmers. A mean of 0.13 and 0.34 ha of land was found to be allocated for improved sorghum
varieties by sample households and adopters respectively.
Table 13. Types of sorghum farm land by improved sorghum varieties adoption status
Farm size Category Min Max Mean Std. Dev t-value Irrigated farm size (ha)
Non-adopter 0 0.75 0.1 0.19 -2.37** Adopter 0 1 0.2 0.31 Total 0 1 0.14 0.24
Farm size infested by striga (ha)
Non-adopter 0 3.75 0.44 0.54 -0.094 (NS) Adopter 0 2.5 0.45 0.61 Total 0 3.75 0.44 0.56
Farm size allocated to sorghum
Non-adopter 0.13 2 0.82 0.45 2.35** Adopter 0.13 1.88 0.65 0.41 Total 0.125 2 0.76 0.44
Proportion of sorghum land from the total cultivated farm land
Non-adopter 0.095 1 0.49 0.19 1.53 (NS) Adopter 0.083 1 0.44 0.27 Total 0.083 1 0.48 0.23
Farm area allocated to improved sorghum variety
Non-adopter 0 0 0 0 -13.43 *** Adopter 0.06 1.44 0.37 0.27 Total 0 1.44 0.13 0.24
Source: Survey data, 2013, NS= Non-significant, ***represents level of significance at 1%, **represents level of significance at 5%.
4.1.3. Institutional and market factors
Extension: Table 14 and 15 summarize access and utilization of extension services by sample
households. From the total sample household heads, 36 (24 %) reported that they haven’t ever
get an extension service of whom 9 (17 % from their group) are adopters and 27(27.7% from
the group) are non-adopters. A chi-square comparison between adopters and non adopters
groups in this regard showed no significant association. Sample households also reported that
they met with the DAs an average of 8.27 times a year. An independent sample t-test
comparison revealed no significant mean difference in terms of number of contact between
adoption groups. However, with regard to the experience of utilizing agricultural extension
service, sample households had a mean of 5.17 years experience in using the service. In this
respect, adopters exhibited more experience in extension service, a mean of 6.15 years, than
their non-adopter counterparts did, 4.64 years. This difference was statistically significant
when tested with an independent sample t-test at less than 5% probability level.

53
Access to extension services: Sample households were located on average 3.03 kilometers
away from FTCs. Adopters were on average located nearer, 1.50 kilometers, than non-
adopters who were located 3.87 kilometers away from the FTCs. Accordingly, distance to
FTCs was found to be negatively related with adoption. The more distant farmers are from
FTCs, the less likely they adopt improved sorghum varieties. The difference in the distance to
FTCs between the groups was highly significant with less than 1% probability level.
Table 14. Households’ Extension contact and distance to FTCs by adoption status
Type Non-adopters Adopters t-value Total Mean Standard
deviation Mean Standard
deviatio Mean Standard
deviation Number of extension contact per year
9.85 10.93 9.91 8.27 -0.03(NS) 9.87 10.22
Extension Experience
4.64 3.74 6.15 4.29 -2.24** 5.17 3.4
Distance to FTC 3.87 4.63 1.50 1.66 3.60*** 3.03 4.01 Source: Survey data, 2013, NS= Non-significant, ***represents level of significance at 1%,
**represents level of significance at 5%.
Table 15 summarizes extension service access specific to sorghum production and
participation in on-farm research trials. From the 114 sample households who reported to
have used extension services at least once, 89 farmers (78.1%) reported that they got
extension service specific to sorghum production. Out of these farmers 43 (81%) were
adopters and 46 (47.7 %) were non-adopters. This clearly shows that the major proportion of
adopters get extension service on sorghum production than non-adopters. A chi-square
comparison of the two groups in this regard showed a systematic association at less than 1 %
probability level.
Moreover, 35 (23.3%) of the sample households participated in research activities of whom
21 (39.6%) were adopters where as 14 (14.4 %) were non-adopters. A chi-square comparison
also showed the existence of systematic association between sorghum variety adoption and
research participation at less than 1 % probability level and a chi-square value of 12.17.

54
Table 15. Sorghum extension and research experience of households by adoption status
Category Non adopters Adopters Total χ 2 -value No % No % No % Do you get any agricultural extension services?
2.21 (NS)
No 27 27.8 9 17 36 24 Yes 70 72.25 44 83 114 76 Total 97 100 53 100 150 100 Did you get any extension specific to sorghum
16.14***
No 51 52.6 10 19 61 40.7 Yes 46 47.4 43 81 89 59.3 Total 97 100 53 100 150 100 Have you ever participated in any research activities?
No 83 85.6 32 60.4 115 76.7 12.17*** Yes 14 14.4 21 39.6 35 23.3 Total 97 100 53 100 150 100 Source: Survey data, 2013, NS= Non-significant, ***represents level of significance at 1%.
Participation in local leadership: Table 16 summarizes a chi-square comparison of adopter
and non-adopter farmers with regard to their participation experience in local administration.
This administration positions include kebelle cabinet positions and other leadership positions
such as cooperatives, saving and credit groups’ leadership. Accordingly, 61 (40.7%) of the
sample households reported to be involved at least in one of the local authorities listed. It was
also found that 27 (50.9%) adopters to be involved in the listed positions while only 34
(35.1%) of the non-adopter were able to do so. A chi-square comparison among the groups
showed a significant association of leadership participation and adoption of improved
sorghum varieties at less than 10 % level of probability with a chi-square value of 3.587.
Table 16. Farmers’ participation in leadership by adoption categories
Category Non adopters
Adopters Total χ 2 -value
Participation in administrative leadership No % No % No % No 63 64.9 26 49.1 89 59.3 3.587* Yes 34 35.1 27 50.9 61 40.7 Total 97 100 53 100 150 100 Source: Survey data, 2013, *represents level of significance at 10%.

55
Market access: Sample households were located at a mean distance of 10.96 kilometers away
from the nearest main market. Adopters were far a mean of 11.34 kilometers away from their
main market while non-adopters were 10.75 kilometers far. A mean difference of market
distance between adopters and non-adopters was not found to be significant when tested with
an independent sample t-test, table 17.
Table 17. Walking distance from the nearest main market to households’ residence
Type Non-adopters Adopters t-value Total Mean Standard
deviation Mean Standard
deviation Mean Standard
deviation Distance to main market in kilometer
10.75 4.65 11.34 3.37 -0.835(NS)
10.96 4.24
Source: Survey data, 2013, NS= Non-significant.
Access to credit: Difference in access to credit is a major reason that usually influences
adoption of new technologies. With this regard, 23(15.3%) of sample households were found
to have access to formal credit. Adopters and non-adopter farmers were found to access
formal credit with varying proportion being 11.3% and 17.5 % from their groups respectively.
A chi-square analysis however did not show a systematic association adoption and access to
formal credit facilities.
Table 18. Households’ access to credit by improved sorghum varieties adoption status
Category Non adopters Adopters Total χ 2 -value Credit access No % No % No % No 80 82.5 47 88.7 127 84.7 1.02 (NS) yes 17 17.5 6 11.3 23 15.3 Total 97 100 53 100 150 100 Source: Survey data, 2013, NS= Non-significant.
4.1.4. Farmers’ perception on improved sorghum variety attributes
It was hypothesized that farmers perception on characteristics of improved sorghum varieties
influence their adoption and intensity of use. This hypothesis was tested based on different
56
sorghum varietal trait preferences of sample households. These traits include biotic, abiotic
and consumption characteristics of the commodity. Farmers’ Perception on yielding capacity,
color attractiveness, food making quality, feed importance and pest resistance capacity of
improved sorghum varieties were assessed and summarized in table 19. Out of the total
sample respondents, 78 (52%) of them perceived that improved sorghum varieties in general
give superior grain yield than local varieties. Considerable proportion of adopters, 69.8 %,
perceived that improved sorghum varieties are superior in their yielding capacity as compared
to local sorghum varieties. However, it was only 36.1 % of the non-adopters that perceived
improved varieties give higher yield than local varieties. This difference in perception
between adopters and non-adopters was highly significant when analyzed with chi-square
comparison at less than 1% probability level and chi-square value of 15.62 was obtained.
Farmers’ perception on color of improved sorghum varieties is also another comparison
criteria that farmers use in the study area to value the importance of the variety at hand. The
preferred color types of sorghum that farmers usually prefer are white and yellow colors.
These color valuation is very important for marketing as “Injera” and “Tela” making quality
are highly determined by color of sorghum grain. Accordingly, from the sample households,
74 (49.3 %) reported that they perceived improved sorghum varieties color superior to the
local ones. It was also found that, 71.1 % of adopters to perceive improved sorghum varieties
to have superior color preference than local varieties. On the other hand, only 37.1 % of non-
adopters perceived improved varieties superiority in terms of color preference. A chi-square
analysis also showed significant association at less than 10 % probability level and chi-square
value of 16.4. Since sorghum contributes the major consumption share in the study area, an
evaluation of improved sorghum varieties in terms of food making quality makes a lot of
sense for determination of adoption level. It is from this argument that it is hypothesized in
this study as perception for food suitability influences improved sorghum adoption and
intensity of use. Accordingly, 18.7 % of the sample household perceived that improved
sorghum varieties are superior in their suitability for food making. More number of adopters
(43.4 %) appeared to perceive that improved sorghum varieties have superior food making
quality in contrast to the fact that only 5.2 % of non-adopters perceived the same. This
comparison was also found to be highly significant when analyzed with chi-square
comparison at less than 1 % and with the test value of 33.

57
Table 19 also shows that 56.6 % of sample households perceived improved varieties are
superior in their feed importance as compared to the local varieties. In this regard, no
significant variation of perception was observed between adopters and non-adopter farmers.
Finally, a general perception of farmers on adaptability of improved sorghum varieties to
pests was assessed. The study revealed that 41.3 % of the sample respondents perceived
improved sorghum varieties are generally superior in terms of their pest resistance capacity
than local varieties. It was also found that more proportion of adopters, 54.7 %, perceived
improved sorghum varieties as more resistant to pests than locals. However, it is only 34 % of
non-adopter farmers that perceived the same. This comparison was found to possess a strong
association with improved sorghum adoption with less than 5% probability level and chi-
square value of 6.05.
Table 19. Farmers’ valuation of sorghum traits by improved sorghum varieties adoption
Preferences of farmers to improved sorghum varieties over the local sorghum varieties
Non adopters
Adopters Total χ 2 -value
Yielding capacity? No % No % No % Inferior 62 63.9 16 30.2 78 52 15.62*** Superior 35 36.1 37 69.8 72 48 Total 97 100 53 100 150 100 Color? 16.4*** Inferior 61 62.9 15 28.3 76 50.7 Superior 36 37.1 38 71.7 74 49.3 Total 97 100 53 100 150 100 Food quality? 33*** Inferior 92 94.8 30 56.6 122 81.3 Superior 5 5.2 23 43.4 28 18.7 Total 97 100 53 100 150 100 Feed importance? 1.87 (NS) Inferior 45 46.4 19 35.8 65 43.4 Superior 51 52.6 34 64.2 85 56.6 Total 97 100 53 100 150 100

58
Pest adaptability? No % No % No % 6.05** Inferior 64 66 24 45.3 88 58.7 Superior 33 34 29 54.7 62 41.3 Total 97 100 53 100 150 100 Source: Survey data, 2013, NS= Non-significant, ***represents level of significance at 1%, **
represents level of significance at 5%.
Perception on drought and pest occurrence: Farmers’ subjective forecasts for an
occurrence of natural hazard for crop failure are an important consideration which should be
taken in to account to hypothesize their reaction in technology adoption. For this reason
expectation of farmers for an occurrence of drought and pest for sorghum were asked. These
variables were measured as frequencies of drought and pest incidence for the future based on
their experience from the past. For the purpose of catching memorable events farmers were
asked only to forecast the frequencies of the hazards to happen in the coming ten years.
Accordingly, a mean frequency of 2.28 and 3.21 years in ten years time were estimated by
sample households for an occurrence of potential drought and pests respectively. Nonetheless,
an independent sample t-test showed no significant difference among adopters and non-
adopter farmers on their occurrence forecasting. In spite of the hypothesis made with respect
to the effect of these variables to adoption of sorghum varieties, the study result showed that
farmers’ subjective judgment forecast for potential drought and pest infestation had no
significant difference among adoption categories at hand.
Table 20. Subjective speculation on potential drought and pest occurrence in 10 years
Type
Non-adopters Adopters t-value Total Mean Standard
deviation Mean Standard
deviation Mean
Standard deviation
Expected frequency of drought incidence ten years
2.39 1.28 2.10 1.30 1.33 (NS)
2.28 1.29
Expected frequency of pest incidence in ten years
2.95 2.70 3.68 3.35 -1.45 (NS)
3.21 2.96
Source: Survey data, 2013, NS= Non-significant.
Food security status perception: This study used perception of household heads’ on their
food security status in relative to other farmers around their locality as a measure of food
security status. The majority (86.7 %) of sample households perceived that they are food

59
secured as compared to the local dwellers while only the rest 13.3 % of them perceived that
they have low food security status in relative terms, table 20. A chi-square comparison
between adopters and non-adopters in terms of their perception on food security status
showed no statistical association. A chi-square value of 0.001 appeared to explain this fact.
Table 21. Farmers’ subjective judgment of their food security status in relative to others
Category Non adopters Adopters Total χ 2 -value Do you consider yourself as food secure in relative to others?
No % No % No %
No 84 86.6 46 86.8 130 86.7 0.001(NS) Yes 13 13.4 7 13.2 20 13.3 Total 97 100 53 100 150 100 Source: Survey data, 2013, NS= Non-significant.
4.1.5. Income sources of sample households
The use of improved technologies is directly or indirectly related with the level of income of
the users. The direct relation is most of the time due the better purchasing power of the higher
income induces an improved access to technologies available. Rich farmers are usually
observed as the first movers to try new technologies. This important status of wealthy farmers
entails the better risk taking behavior of such farmers in technology uptake. In contrary, poor
farmers are usually characterized by their slow movement towards trying new technologies.
This is mainly due to fear to fail to harvest lower yield than basic required amount for their
subsistence. It is based on these premises that is hypothesized in this study as there will be a
significant difference in income level among adopters and non-adopters. Table 22
summarizes income sources and income level of sample households in adoption status groups.
In the study area, mixed farming is the dominant farming system. Consequently income from
livestock and crop are the dominant income sources. Crop income is the major income source
generating an average of 6268 ETB per annum for sample households. Even if adopters
seemed to generate higher average crop income (6790 ETB) than no-adopters (5982.7 ETB),
the difference was not statistically significant when tested with an independent sample t-test.

60
Off-farm and non-farm income on the other hand was calculated by summing all income
generated by sample households from income generating activities which are practiced by
famers during the off-season and non-agricultural income generating activities as well. This
category included income generated from hand craft activities, petty trade and remittances
from relatives or family members. The income generated from this category was found to be
the second source in terms of amount generated by sample households generating an average
annual income of 2284.8 ETB for sample households. However, the income difference
between adoption groups was not statistically significant.
Income from livestock is calculated by summing amount of money generated from the sale of
livestock and their products in the survey year. A mean of 1871.8 ETB per annum was
generated by sample households from livestock. An independent sample t-test comparison
between adopters and non-adopters however, showed no statistically significant difference
with this regard. Finally a mean total income of 11251 ETB was generated by sample
households. Adopters and non-adopter farmers generated an average total income of 10140
ETB and 11859 ETB respectively per annum. This difference in average total income among
the two groups however was not statistically significant.
Table 22. Income sources of sample households by improved sorghum varieties adoption
Income sources Non-adopters Adopters t-value
Total Mean St. dev Mean St. dev Mean St. dev
Income from crop
5982.7 6613.9 6790 7456.37 -0.683( NS) 6268 6909
Income from livestock
1890 4133.1 1839 3546 0.074 (NS) 1871.8 3923.68
income from off-farm/ non-farm a
2708 5975.25 1511 2993.71 1.367 ( NS) 2284.8 5144.1
Total income 11859 1559.5 10140 8067 0.759( NS) 11251 13243.2 Source: Survey data, 2013, NS= Non-significant, St.dev represents standard deviation
4.2. Choice of Sorghum Attributes/ Traits/

61
Farmers in kobo district grow a multiple of sorghum varieties in their farm. This practice is
mainly attributed to the fact that a single sorghum variety cannot satisfy a multitude of
farmers’ interest in growing sorghum. While, some farmers give high value for a high
yielding capacity trait of sorghum, some others opt for good taste quality and some others also
might opt for better disease and pest resistance capacity. A choice of these traits is also
governed by an interaction of various socioeconomic and consumption characteristics of
decision makers, farmers. To decide on a choice set of most preferred sorghum attributes for
the study, a key informant survey was conducted before embarking on the formal survey.
Accordingly, 30 %, 20%, 25%, 15% and 10 % of key informant participants voted for yield
capacity, environmental adaptability, food making quality, marketability and fodder
palatability respectively as relevant sorghum attributes on the existing farmers context. Then
farmers are confronted with a choice of the aforementioned variety attributes to opt for their
best out of the list.
Table 23 summarizes the preferred sorghum attributes by sample households. Out of the five
attributes selected by key informants, only yield capacity, environmental adaptability, and
food quality attributes were selected by sample households as their most preferred sorghum
attribute choices. The rest two, marketability and fodder quality did not appear in the list of
most preferred sorghum attribute to any one of the respondents included for the study. These
attributes appeared as second or third preferred attributes for sample households. Among the
three preferred sorghum attributes yield capacity was the one chosen by majority of sample
respondents (48%) followed by food quality (27.2%) and environmental adaptability (24.7%).
These choices are expected to explain distinct features and settings of local farmers in
utilization of sorghum crop. A choice over high yielding capacity attribute for instance
reflects farmers’ view of maintaining yield or income maximizing importance as main criteria
for selecting sorghum varieties Edilegnaw (2005). On the other hand, environmental
adaptability choice is more linked with farmers behavior of opting for yield stabilizing
attribute than other criteria in order to use a given sorghum variety. However, a choice of food
quality attribute in higher degree is viewed to explain the fact that the importance of the crop
for the farmer is more on consumption purpose than other uses such as marketing.

62
Moreover, these choices shouldn’t be seen as the only choices that farmers use as criteria to
grow sorghum varieties. It does not also mean farmers look only a single criteria at a time to
evaluate a given sorghum variety. This was only an attempt to find out factors that influence
farmers’ choice of most preferred sorghum traits.
Table 23. Most preferred sorghum traits/attributes by sample households
Most preferred sorghum attributes frequency percent Yield capacity 72 48 Environmental adaptability 37 24.7 Taste quality 41 27.3 Total 150 100 Source: Survey data, 2013.
4.2.1. Choice of improved varieties and their attribute
Table 24 explains the interaction of farmers’ variety attribute choice and the varieties
themselves. After farmers were confronted with a choice of best preferred sorghum traits and
asked for the improved varieties they had grown, it was found that there exist a strong
correlation between the two attribute choices and some of the improved sorghum varieties
such as, Miskir, Hormat and Yeju. Considerable proportion of Miskir variety growers, 53%,
reported that they opt for environmental adaptability as a most preferred trait from sorghum.
The association was appeared to be significant at less than 5% probability level and 8.28 chi-
square value. This might imply that most farmers choose Miskir variety mainly for its
environmental adaptability. For Hormat sorghum variety however, a fisher exact comparison
was undertaken and found to be significant at 1% level of probability. From the same table, it
is shown that most of the farmers who plant Hormat variety (70 %) opt for food quality of
sorghum as their most preferred attribute. This association might tell us that this variety is
considered as best fit for home consumption. An external observation of the researcher has
also confirmed similar fact with the result.
Table 24. Improved sorghum varieties adoption by sorghum trait preference of households

63
Most preferred sorghum attributes by the HHH
Didn’t plant Miskir Planted Miskir Total χ 2 -value No % No % No %
yield capacity 69 51.1 3 20 72 48 8.28** environmental adaptability 29 21.5 8 53.3 37 24.7 Taste quality 37 27.4 4 26.7 41 27.3 Total 135 100 15 100 150 100 Didn’t plant Girana Planted Girana yield capacity 63 48.8 9 42.8 72 48 0.30 ( NS) environmental adaptability 31 24 6 28.6 37 24.7 Taste quality 35 27.2 6 28.6 41 27.3 Total 129 100 21 100 150 100 Didn’t plant
Hormat Planted Horma
yield capacity 69 49.3 3 30 72 48 Fish ex=0.006
environmental adaptability 37 26.4 0 0 37 24.7 Taste quality 34 24.3 7 70 41 27.3 Total 140 100 10 100 150 100 Didn’t plant Yeju Planted Yeju yield capacity 70 50 2 20 72 48 Fex=0.11 environmental adaptability 32 22.9 5 50 37 24.7 Taste quality 38 27.1 3 30 41 27.3 Total 140 100 10 100 150 100 Source: Survey data, 2013, NS= Non-significant, ** represents level of significance at 5%.
4.2.2. Perception of farmers on sorghum production constraints
Table 25 summarizes the association between perceived sorghum production constraints and
choice of sorghum attributes. Even if these constraints were hypothesized to influence the
choice of sorghum attributes, it only appeared to be true for only two of them. Perception of
farmers on shortage of land and labor as a main constraint for sorghum production were not
found to be systematically associated with choice of sorghum attributes. On the other hand,
perception of sample household heads on loss of soil fertility and poor extension service were
found to show a systematic association with various choices made by the intended decision
makers. From the sample households, 64 (42.7 %) of them appeared to perceive that loss of
soil fertility is the major sorghum production constrain, of whom 53 % chose yielding
capacity attribute as their most preferred attribute. The rest 30% and 20 % of those who
perceived loss of soil fertility as major constraint opt for environmental adaptability and food

64
quality as their most preferred sorghum traits respectively. A chi-square test also showed a
significant association between perception of soil loss and choice of preferred sorghum
attribute at 5 % probability level.
Another significant association appeared to come to picture was farmers’ perception on
performance of existing extension service and choice of preferred sorghum trait. Farmers who
perceived that the existing extension service as poor and major constraint for sorghum
production were tend to rarely (14.2%) choose food quality of sorghum as their most
preferred sorghum attribute. In contrary to this, farmers who perceived the extension system
as better tend to opt for the food quality attribute in a better way (32 %). This might be due to
low nutrition consciousness/ awareness/ of those farmers who didn’t show willingness to
participate in the extension service. The information they get from extension might help
farmers to have better consciousness towards food value of the crop they grow. The
association was significant with probability level of 5 %.
Table 25. Households’ perception of sorghum constraint by choice of sorghum traits
perceived constraints for sorghum production
yielding capacity
environmental adaptability
food quality
Total χ 2 -value
No No No No
Is shortage of land major constraint?
0.816 (NS)
No 11 7 9 27 % 40.7 26 33.3 100 Yes 61 30 32 123 % 49.6 24.4 26 100 Total 72 37 41 150

65
% 48 24.7 27.3 100 Is soil infertility a constraint? 5.956**
No 38 18 30 86 % 44.2 21 34.8 100 Yes 34 19 11 64 % 53 30 27 150 Total 48 24.7 27.3 100 % 48 24.7 27.3 100 Is labor shortage constraint? 1.833 (NS) No 33 20 24 77 % 42.9 26 31.1 100 Yes 39 17 17 73 % 53.4 23.3 23.3 100 Total 72 37 41 150 % 48 24.7 27.3 100 Is poor extension the major constraint?
6.00**
No 46 27 35 108 % 42.6 25 32.4 100 Yes 26 10 6 42 % 62 23.8 14.2 100 Total 72 37 41 150 % 48 24.7 27.3 100 Source: Survey data, 2013, NS= Non-significant, ** represents level of significance at 5%.
4.2.3. Risk and choice of sorghum attributes
Table 26 presents summary of mean comparison of the risk proxy variable for each choice
categories. The mean value of the risk proxy for the sample households was be 4501 ETB.
The highest mean value of the proxy (5544 ETB) is obtained in the food quality attribute
choice followed by yield capacity choice ( 4142.8 ETB ) and environmental adaptability
choice ( 4045 ETB). The f-test for mean comparison showed the existence of significant mean
variation among at least two comparisons at probability level of 5 % and f-value of 3.71.
Table 26. Mean comparison of risk proxy among 3 sorghum attributes choosers
Choice Category Mean SD F value P value
Yield capacity 4142.8 3048
environmental adaptability 4045 2640.2

66
Food quality 5544 2774.5 Total 4501 2931 3.71** 0.027 Source: Survey data, 2013, ** represents level of significance at 5%.
4.3. An Overview of Sorghum Production in the Study Area
4.3.1. Crops grown in the study area
Sorghum and Tef are the two major stable crops grown in the study area. 100 % of the sample
households were found to grow the two crops in a varying proportion. Therefore, the bar
graph presented bellow only shows the frequency percentage of crops share other than the two
staples among adopters and non adopter farmers. Crops such as maize, onion, chick pea,
pepper and barely are the types of crops that are being grown in the study area. According to
the graph shown bellow, chickpea appeared to be the dominant crop in both adopters and non
adopter farmers in terms of number of farmers cultivating the crop. The same graph shows
68.7 % of the sample households managed to grow this crop. Both adopters and non-adopter
farmers appeared to participate in chickpea production in a closer proportion 67.9% and 69%
respectively. On the other hand, onion and maize appeared to be the second and third
dominant crops being grown by 16.7% and 8% of the sample households. However, barley
and pepper were found to be the least grown crops in the study area based on the number of
growers of the crops covering 6 and 0.7 % of the sample households respectively.
0
50
100
150
maize onion chick pea peper barely
7 15 67
1 7
5 10 36
0 2
12 25
103
1 9
Number from Non-adopters Number from Adopters Number from Total

67
Figure 4. Rank of important competing crops in the study area with sorghum
Source: own survey data, 2013
4.3.2. Changes of sorghum area coverage over the last five years
Even if sorghum has stayed to be a dominant food crop grown by the majority of farmers in
the study area, the story seems changing over the last five years. Table 27 summarizes the
dynamics of sorghum area share over the past five years based on respondents’ experience.
The majority of the sample households, 68.7% reported that the share of their sorghum area
coverage has remained constant. However, a considerable number of sample households (24.7
%) also reported that the share of sorghum area cultivated over the last five years has declined
due to several reasons. It was only 6.6 % of the sample households that told their sorghum
area share was increasing during the specified time period. However, the sorghum area share
dynamics was not systematically associated with improved sorghum adoption when analyzed
with chi-square comparison.
For those farmers who claimed that their share of sorghum area has declined over the past five
years, a follow up question was asked to know the crops replacing sorghum. Three important
crops were identified as competent crops which are replacing sorghum in the study area. The
crops are Tef, onion and maize in order of importance. Tef is the primary crop replacing
sorghum. In terms of the proportion of farmers (64.9 %) shifted to Tef instead of sorghum
followed by onion (24.3 %) and maize (10.8 %). A fisher’s exact test however showed no
significant association among adoption and types of replacing crops.
Table 27. Crops replacing sorghum between adoption categories
Category Non- adopters
Adopters Total χ 2 -value
change of sorghum farm over the last 5 years
No % No % No % 2.739(NS)
Constant 71 73.2 32 60.4 103 68.7 increasing 6 6.2 4 7.5 10 6.6 Decreasing 20 20.6 17 32.1 37 24.7 Total 97 100 53 100 150 100

68
If decreasing which crop replaced sorghum?
Maize 1 5 3 17.6 4 10.8 fishers' exact =0.212 Tef 12 60 12 70.56 24 64.9 onion 7 35 2 11.8 9 24.3 Total 20 100 17 100 37 100 Source: Survey data, 2013, NS= Non-significant.
4.3.3. Improved sorghum technologies dissemination
Various sorghum technology outreach programs have been undertaken in kobo district, where
the study had been done. One among those initiations is the bilateral sorghum technology
scale-out program led by Sirinka Agricultural Research Centre and the International Crop
Research Institute for Arid and Semi-arid Tropics / ICRISAT/. The name of the project being
undertaken by the joint enrolment is “Harnessing Opportunities for Productivity
Enhancement”, HOPE in short. The project was intended to scale-out integrated sorghum
technologies in the study area since 2009. The intervention aimed at delivering improved
sorghum varieties with appropriate agronomic practices recommended so far.
Consequently, newly released sorghum varieties from Sirinka Agricultural Research Center
and Melkassa Agricultural Research centre with improved moisture conservation techniques
and micro-dosing application of fertilizer were promoted in some villages of the district. The
new improved sorghum varieties induced by this joint action were namely Miskir, Girana and
Hormat. The villages targeted by the intervention were six in number. Table 28 summarizes
information on dissemination of HOPE induced sorghum technologies in to HOPE treatment
and control villages. The figures suggested that most of the farmers in HOPE treatment
village (88.4 %) accessed the information about the promoted technologies in contrary to the
fact that only about 30% of the control village farmers were able to do so. Further analysis of
the information in to adoption in table 29 also showed that 56.7 % of the sample households
to have known at least one of the HOPE induced sorghum technologies while the rest 43.3 %
of them were found to have no idea about any of those technologies. Apparently, knowledge
about the technologies was associated with improved sorghum technology adoption at less
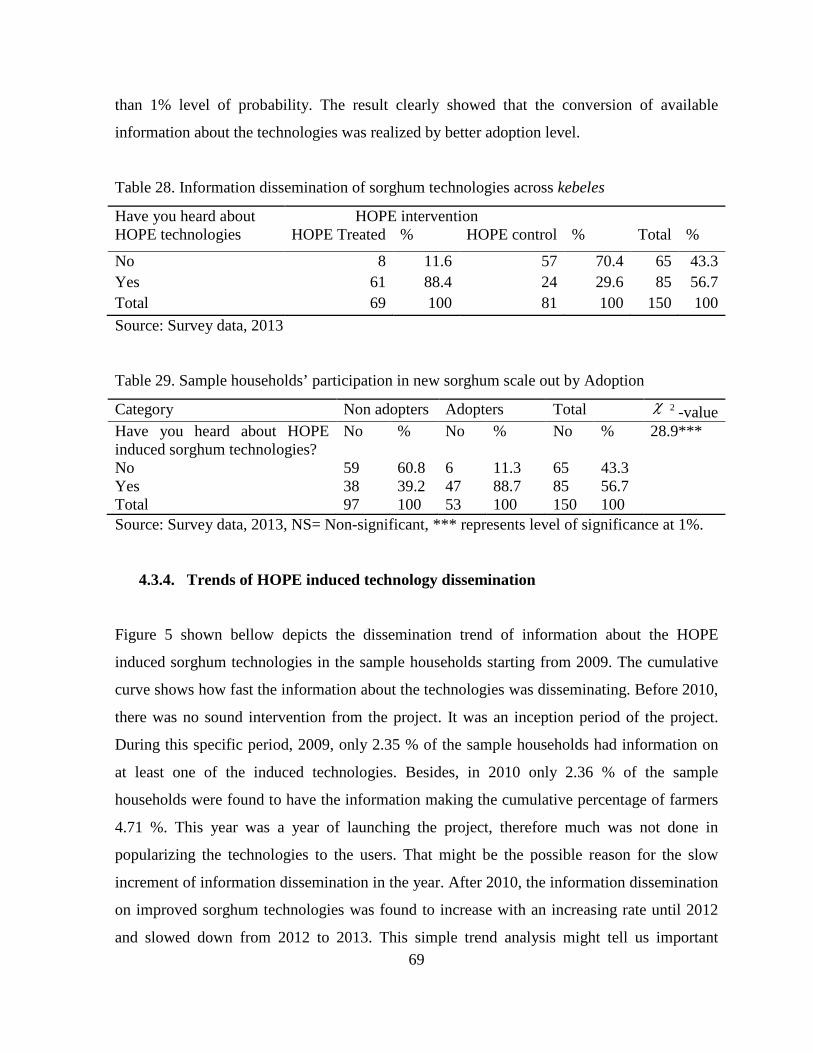
69
than 1% level of probability. The result clearly showed that the conversion of available
information about the technologies was realized by better adoption level.
Table 28. Information dissemination of sorghum technologies across kebeles
Have you heard about HOPE technologies
HOPE intervention HOPE Treated % HOPE control % Total %
No 8 11.6 57 70.4 65 43.3 Yes 61 88.4 24 29.6 85 56.7 Total 69 100 81 100 150 100 Source: Survey data, 2013
Table 29. Sample households’ participation in new sorghum scale out by Adoption
Category Non adopters Adopters Total χ 2 -value Have you heard about HOPE induced sorghum technologies?
No % No % No % 28.9***
No 59 60.8 6 11.3 65 43.3 Yes 38 39.2 47 88.7 85 56.7 Total 97 100 53 100 150 100 Source: Survey data, 2013, NS= Non-significant, *** represents level of significance at 1%.
4.3.4. Trends of HOPE induced technology dissemination
Figure 5 shown bellow depicts the dissemination trend of information about the HOPE
induced sorghum technologies in the sample households starting from 2009. The cumulative
curve shows how fast the information about the technologies was disseminating. Before 2010,
there was no sound intervention from the project. It was an inception period of the project.
During this specific period, 2009, only 2.35 % of the sample households had information on
at least one of the induced technologies. Besides, in 2010 only 2.36 % of the sample
households were found to have the information making the cumulative percentage of farmers
4.71 %. This year was a year of launching the project, therefore much was not done in
popularizing the technologies to the users. That might be the possible reason for the slow
increment of information dissemination in the year. After 2010, the information dissemination
on improved sorghum technologies was found to increase with an increasing rate until 2012
and slowed down from 2012 to 2013. This simple trend analysis might tell us important

70
information that could be translated in to action for the better achievement of the project for
the years to come. The slow down curve at the last one year might be attributed to decreased
performance of the project.
Figure 5. Cumulative distribution of improved sorghum varieties information
Source: Survey data, 2013
4.3.5. Acceptance of HOPE induced sorghum technologies
So far, the discussion focused on the dissemination of promoted sorghum technologies
information across sample households. Table 4 in the appendix however, further describes
farmers’ decision to accept and try among the promoted technologies or all together.
Accordingly, 37 (43.5%) of those farmers who had the information about promoted sorghum
varieties reported that they have adopted at least one of the varieties on their field. Of those
who did not tried the varieties at all, the majority (41.7%) reported unavailability of seed
followed by poor taste quality (20.8 %) as the main reasons for not trying. Appendix table 6
also showed that the adoption of HOPE induced varieties in Non-HOPE kebeles is small
accounting for only 2.5 % from the group.
On the other hand, 95.3 % of sample households reported that they did not apply any dose of
inorganic fertilizer for their sorghum. Most of them (60.8%) claim lower moisture availability
in the soil as the main reason for not applying fertilizer in to the farm. Appendix table 6
2009, 2.35 2010, 4.71 2011, 27.06
2012, 80 2013, 100
020406080
100120
1999 2000 2001 2002 2003 2004 2005
Cum
mul
ativ
e pe
rcen
tage
Year in which farmers know about the varieties
Cummulative distribution of sorghum varieties information
Cummulative

71
however showed that Micro-dose fertilizer application was better adopted by HOPE treated
villages covering 8.7 % in the group as compared to 1.2 % in the control group.
With regard to moisture conservation technology, Tie-ridge farming, only 10.7 % of sample
households were found to use the technique. The heavy load of the implement during wet
time was the main reason, reported by 38 % of the households, for the rejection of the
technology to be used for soil water conservation. Table 6 in the appendix also showed that
16% of the control kebeles farmers adopted the technique as opposed to the fact only 4% of the
farmers in the treatment kebeles did so.
In addition, row planting practice was found to be a rare experience being used only by 6.7 %
of the sample households. Moreover, only 8 % of the sample households were found to use
chemical pesticides for sorghum production.
4.3.6. Distribution of the HOPE promoted sorghum varieties
The HOPE project has started promoting the technologies from six villages in the study area
of which Aradom and Abuare are included as sample kebeles in this study. Therefore, a
further look at the distribution of HOPE induced sorghum technologies was important to see
the dissemination of those varieties from project villages to other non-project areas.
Accordingly, table 30 summarizes the percentage of households in each village that has
planted the varieties induced by the project namely Miskir, Girana and Hormat at least once.
All these newly promoted sorghum varieties seems getting good acceptance over the project
period, being grown by 38%, 37% and 35% of the sample households respectively. The
popularity of each variety however differs from one kebele to another. Abauare kebele is the
leading kebele where all the three varieties are grown by larger proportion of respondents.
The kebele appeared as the best adopter of those varieties in general. In the other side, Qeyu
Gara kebele was the least in number of farmers that have tried those varieties.
Another interesting feature that could be observed in the result is the dissemination of
improved sorghum varieties from HOPE project villages to Non-HOPE villages, especially to

72
Mendefera and Gedemeyu. A considerable number of farmers appeared to grow the newly
promoted sorghum varieties in Mendefera and Gedemeyu. In Mndefera alone 31% of the
respondents were found to grow Hormat variety while 14 % and 10% of the respondents grew
Miskir and Girana varieties respectively. In Gedemeyu, however 16% of the samples were
found to grow Girana and Hormat Varieties each. All these figures show that there was a
spillover of sorghum varieties across several kebeles in the district within the three year
period of the project. The disaggregation of similar data in HOPE treatment and control
groups as shown in appendix table 5 suggested that about half of the treatment kebeles’
respondents planted at least one of the varieties. On the other hand, Hormat variety is the one
which got better acceptance in control kebeles being produced by 16% of the treatment group
farmers.
Table 30. Dissemination of promoted sorghum varieties across sample kebeles
Knowledge of varieties
Villages of respondents
Aradom Abuare Gedeme Qeyu gar Mendefer Total
No % NO % % % % % No information about varieties
6 22 0 0 17 68 25 89 17 29 65 43
Planted Miskir 17 63 36 88 0 0 0 0 4 14 57 38 Planted Girana 13 48 35 85 4 16 0 0 3 10 55 37 Planted Hormat 14 52 23 56 4 16 3 11 9 31 53 35 Total 27 41 25 28 100 29 150 Source: Survey data, 2013
4.4. Econometric Model Results
In the previous section a description of sample households’ important characteristics and their
relation with adoption of improved sorghum varieties and choice of sorghum attributes was
thoroughly presented. However, a simple look at the relation and association of those
variables by itself is not enough to reach on conclusion. In this section therefore, results and
discussions from an econometric model analyses will be presented. Accordingly, an
econometric (Tobit) model was used to determine the influence of various socio-economic,

73
institutional, and farmers’ preference variables on adoption and intensity of use of improved
sorghum varieties. In addition a multinomial logit model was used to identify variables that
influence farmers’ choice of sorghum varietal traits. Before running the models, multi-
collinearity test was undertaken. The VIF values displayed in the appendix table 1 shows that
all the continuous explanatory variables have no serious multi-collinearity problem.
Similarly, the values of the contingency coefficients were also low as shown in (appendix
table 2). Based on the above tests both the hypothesized continuous and dummy variables
were kept in the respective models.
4.4.1. Determinants of adoption and intensity of use of improved sorghum varieties
This section presents maximum likelihood estimates of Tobit model to identify determinants
of adoption and intensity of use of improved sorghum varieties. The dependent variable for
the Tobit model is the proportion of farm size covered by improved sorghum varieties from
the total sorghum area. A total of 17 explanatory variables, of which 8 categorical and 9
continuous, were included in the model. The selection of those explanatory variables for the
model was done through literature review of previous similar works.
Maximum likelihood estimates of Tobit model are summarized in table 31. The model was
significant at less than 1% level implying the appropriateness of the model to estimate the
relationship between the dependent variable with at least one independent variable. From the
model, a total of 9 variables were found to significantly determine adoption and intensity of
improved sorghum varieties. The significant variables were active labor ratio, tropical
livestock unit, cultivated farm size, farmers’ perception of yielding capacity and taste
preference for improved sorghum varieties, irrigated farm size, Striga infested farm size,
proportion of sorghum farm from the total cultivated farm and distance from FTCs to home.
Active labor ratio: The model result revealed that active labor ratio was significant at less
than 10% probability level. The relation of the variable with adoption of improved sorghum
varieties was found to be negative. The result is in contrary to the prior expectation. Plenty of
adoption studies also found out a positive impact of family labor on technology adoption such
74
as Techane (2002), Bayissa (2011) and Solomon et al (2011). The possible explanation for the
result obtained in this study could be that improved sorghum technologies use less number of
labor force compared to local cultivars. The local sorghum cultivars are long duration (usually
take 9 months to mature) varieties that require more active family members for monitoring
and bird scaring. However, improved sorghum varieties as being early maturing types (take 2
to 3 months to mature) require less number of labor for monitoring and bird scaring.
Total Tropical livestock unit ownership: As expected, the extent of livestock ownership
significantly and positively affected adoption and intensity of use of improved sorghum
varieties at less than 5% probability level. The result could possibly be explained as, better
risk bearing behaviour of those wealthy farmers with better livestock would enable them to
try those newly adapted sorghum varieties. The same results were reported by Tesfaye et al.
(2001) and Haji (2003).
Farm size: The size of a farm cultivated by the household affected adoption and intensity of
use of improved sorghum varieties negatively and significantly at less than 1% level of
probability. This result was found as per the prior expectation of the study. The result would
tell us status of improved sorghum utilization among different sizes of farm operations. It
implies that small farmers use improved sorghum technologies more than large farm
households. The result enhances the validity of an argument which states that small farms are
efficient as they intensify farm technologies. This result is also in agreement with previous
empirical findings such as Abrhaley (2006) and Endrias (2003).
Perception on yield capacity of improved sorghum varieties: The variable was positively
and significantly explaining adoption and intensity of use of improved sorghum varieties at
less than 1% probability level. This implies that farmers are more responsive in adopting new
sorghum varieties if they perceive that those new varieties as compared to the existing
varieties give higher grain yield. This is mainly due to a strong interest of farmers to achieve
food security not only in the production year but also in the upcoming seasons as there might
be crop failure due to environmental adversity. This finding was also in line with the previous
similar research results by Endrias (2003), and Adesina and Baidu-Forson (1995).

75
Perception on food Taste quality of improved sorghum: farmers’ perception in food taste
quality of improved sorghum varieties was highly important explanatory variable which was
found to greatly explaining adoption and intensity of adoption of improved sorghum varieties.
Sorghum is used to make “Injera” either being mixed with other cereals or alone. It is also the
main ingredient in preparation of local beverage such as “Tela”. Therefore, the perception of
farmers in the crop’s food making quality is taken as a general perception of farmers on
improved sorghum varieties’. The perception therefore is seen as an outcome of farmers’
judgement on suitability and taste of the improved varieties food making quality as compared
to local varieties. The variable positively and significantly explained improved sorghum
adoption and intensity of use at less than 1% level of probability. The results found with
regard to farmers’ perception of improved sorghum varieties’ taste quality are in conformity
with findings of similar studies by Adesina and Baidu-Furson ( 1995) and McGuire (2000).
Irrigated farm size: The Tobit model result shown in table revealed that amount of
household’s irrigated farm size positively and significantly explained adoption and intensity
of use of improved sorghum varieties at about 10 % level of probability. The possible reason
for this could be the compatibility of improved sorghum varieties for crop rotation. Since
most improved sorghum varieties are early maturing types as compared with the local
varieties, they might be harvested in short period to leave the farm for succeeding cash crops
such as Onion. This was a frequently observed practice in the study area.
Striga infested farm size: As expected, the maximum likelihood estimate of the Tobit model
revealed a positive and significant relation between striga infested land and sorghum adoption
at less than 5% level of probability. It confirmed that as farmers’ striga challenge increases
they tend to use improved sorghum varieties with more level. This might be due to farmers’
understanding on better performance of improved varieties in Striga prone areas.
Proportion of sorghum farm: It is a measure of farmers’ focus on producing sorghum. The
model result showed a negative and significant relationship between sorghum land proportion
and adoption intensity of improved sorghum varieties at less than 10% level of probability.

76
This result implies that as farmers focus more on sorghum production, s/he gives more
attention for local varieties than to improved sorghum varieties. A possible explanation might
be an increased risk taking behavior of farmers’ with an increase proportion of sorghum area.
A crop failure in choosing those local varieties will therefore be compensated by an increased
proportion of sorghum area for the same.
Distance from farmers’ training center: farmers’ access to information and knowledge highly
determine the way they accept technologies. Farmers’ access to information is analysed using
a proxy variable of their access to farmers’ training centres. The variable was found to
negatively and significantly influence adoption and intensity of use of improved sorghum
varieties at less than 10% probability level. The result was found as per to the prior
expectation. The result revealed that as farmers are located far from the farmers’ training
centre they are less likely to adopt improved sorghum varieties. This might be due limited
access to new information concerning technologies and lower probability of those farmers to
be involved in on-farm research trials and visits to the same. The result is in agreement with
findings by Alemitu (2012), Minyahil (2008) and Bayissa (2011).
Table 31. Maximum Likelihood Estimates of the Tobit Model
Variables Estimated Coefficient
Standard Error
t-ratio P-value
Constant 0.0272 0.3555 0.08 0.939 Sex of household head -0.0311 0.1591 -0.2 0.845 Education level of HHH 0.1466 0.1289 1.14 0.257 Farming experience of HHH 0.0023 0.0056 0.41 0.686 Active labor ratio -0.6187* 0.373 -1.66 0.099 Tropical Livestock Unit 0.0563** 0.0266 2.12 0.036 Farm size (ha) -0.3766*** 0.1076 -3.5 0.001 Participation in off-farm 0.0119 0.1824 0.07 0.948 Perception on yield capacity of improved sorghum 0.4073*** 0.134 3.04 0.003

77
Perception on taste quality of improved sorghum 0.5271*** 0.1469 3.59 0.000 Perception on feed importance of improved sorgh -0.142 0.1392 -1.02 0.309 Irrigated farm size( ha) 0.5938* 0.3016 1.97 0.051 Striga infested land( ha) 0.3092** 0.1275 2.43 0.017 Participation in on-farm trial and field visit 0.0302 0.1487 0.2 0.839 Access to credit 0.0779 0.2284 0.34 0.734 Extension Experience of the household head 0.0156 0.0141 1.11 0.27 Proportion of sorghum area from total crop land -0.5595* 0.3234 -1.73 0.086 Distance from FTC to home -0.0569* 0.0335 -1.7 0.092 Sigma 0.5438 0.0599 Log likelihood function = -81.212 Pseudo R2 = 0.3095
Source: Model output, * and *** significant at 1%, and 10% levels respectively.
4.4.2. Effects of changes in explanatory variables
A change in explanatory variables from a Tobit model could be decomposed in to changes
due to probability of adoption and changes due to intensity of use as suggested by McDonald
and Moffit (1980). Accordingly, the marginal effect of significant explanatory variables in
explaining adoption and intensity of use of improved sorghum varieties is summarized in table 32.
Out of the nine significant explanatory variables, four of them were found to have a negative
effect while the rest five have positive effect on the dependent variable. The ratio of active
labour force, cultivated farm size, proportion of sorghum area and distance to farmers’
training centre are variables which negatively affected adoption and intensity of use of
improved sorghum varieties. On the other hand, livestock ownership, farmers’ perception of
yield capacity and taste quality of improved sorghum varieties, irrigation and Striga infested
farm size positively affected adoption and intensity of use of improved sorghum varieties.
A marginal effect summary in table 32 showed that a unit change in labour ratio of a
household will result in 60.18 % reduction in adoption and intensity of use of improved
sorghum technologies of which much percentage (42.3%) is due to reduction in intensity of
use of adopters. An increase in area of cultivated farm size by a hectare would also reduce
adoption and intensity of use of improved sorghum varieties by 36.64%. On the other hand,

78
an increase in distance from farmers’ residence to FTC by a kilometre would result in 5.54%
reduction in adoption and intensity of use of improved sorghum varieties. Moreover, the same
table result suggested that an increase in proportion of sorghum farm by a unit would result in
54.43% reduction on adoption and intensity of use of improved sorghum varieties of which
38.24% of the reduction is associated with intensity of use of the technology.
Of those significant explanatory variables which affected the dependent variable positively,
the effect of irrigated farm size followed by the two perception variables are larger than the
rest two variables in terms of the extent of marginal effects. An increase in irrigated farm size
by a hectare was associated with an increase of adoption and intensity of adoption by 57.76%
of which 40.58% is due to an increase in intensity of use of the varieties. On the other hand, a
better perception of farmers’ on food quality and yielding capacity of improved sorghum
varieties would result in an increase of adoption and intensity of use by 51.27% and 39.61%
respectively. Striga infested farm size and livestock ownership are other two variables whose
increases in value by a unit would result in an increase in adoption and intensity of use of
improved sorghum varieties by 30.08% and 5.48% respectively.
Table 32. Marginal effects of statistically significant explanatory variables
Variable Change in
probability of
adoption *
Change in
intensity
of use*
Total
change
Active labor ratio -0.1790 -0.4228 -0.6018
Tropical Livestock Unit 0.0163 0.0385 0.0548
Farm size (ha) -0.1090 -0.2574 -0.3664
perception on yield capacity of improved sorghum 0.1178 0.2783 0.3961

79
perception on taste quality of improved sorghum 0.1525 0.3602 0.5127
irrigated farm size( ha) 0.1718 0.4058 0.5776
Striga infested land( ha) 0.0895 0.2113 0.3008
proportion of sorghum area from total crop land -0.1619 -0.3824 -0.5443
Distance from FTC to home -0.0165 -0.0389 -0.0554
Source Own survey result, 2013
4.4.3. Determinants of farmers’ preference to sorghum attributes
This section presents an empirical finding from the sample survey to address factors that
determine the preference choice of sorghum attribute of sample households. Sorghum crop as
a commodity is considered by farmers as composite of its attributes. Therefore, consumers
and growers of the crop, farmers, demand and prefer variety of the sorghum crop based on the
level of satisfaction they derive from specific attributes. A multinomial logit model was fitted
to find out important determinants for choice of sorghum attributes.
A total of 22 explanatory variables were included in the multinomial logit model for analysis.
From the total explanatory variables, 11 were dummies and the rest 11 were continuous
variables. Table 32 and 33 summarizes the estimated coefficients of the model and the
marginal effects of explanatory variables respectively. Before running the multinomial logit
regression, the model was checked for the existence of multi-colinearity. The analysis of VIF
was done using STATA version 11 software package. The VIF and Contingence coefficient
analyses result summarized in appendix table 3 showed no serious multi-collinearity problem
among any one of the explanatory variables. Furthermore, multinomial logit model requires
the fulfillment of independence of irrelevant alternatives (IIA) for the estimates to be
consistent. The IIA assumption states that adding or deleting alternative outcome categories
should not affect the odds among the remaining outcomes. The idea of that assumption is that
the odds for a decision are not depending on other categories. Test of the IIA assumption was
performed using Hausman’s test procedure using STATA 11 software package. The result of
the test provided an evidence to accept the null hypothesis which states that Odds (Outcome-J
versus Outcome-K) are independent of other alternatives.

80
Table 33 summarized the MNL model estimated coefficients. The likelihood ratio chi-square
value of 82.83 with a p-value of 0.0003 tells us the model as a whole fitted significantly at
less than 1% level of probability. Besides, pseudo R2 was found to be 0.2632. The yield
capacity choice, which is the most frequently occurring, outcome, was set as a reference
outcome group. Therefore, the results shown in the table are discussed in comparison with
this outcome variable. The reference group was purposively selected so as the result would
enable as to make comparison among the other two important but usually bypassed criteria for
crop selection procedure in the conventional crop variety improvement trends. Usually
breeders put special attention on yielding capacity of crop varieties with little emphasis given
to other traits especially to food quality.
The sorghum attributes are the most preferred characteristics of the crop from which the
farmers drive maximum utility. This does not mean that farmers preferred only a single
attribute of the crop. Accordingly, a set of socioeconomic, institutional and farmers’
preference based explanatory variables which are hypothesized to influence farmers’ attribute
preference were entered in to the multinomial logistic model for analysis. Coefficients of the
MNL model explain the direction of change of the dependent variable as explanatory
variables change. To provide the effects of independent variables on the dependent variable,
estimates of marginal effects ,which measure the expected change in probability of a
particular choice being made with respect to a unit change in an independent variable ,are
reported in table 34.
Table 33 revealed that household’s adoption status of improved sorghum varieties,
household’s vulnerability level to potential income shocks (risk proxy), age of the household
head, experience of the household head in using the extension service, perception on soil
fertility status, labor constraint, frequency of important sorghum pests occurrence, and
location of the household residence were important variables that significantly explained
choice of most preferred sorghum attributes.

81
More specifically, the model result showed that age and extension experience of the
household head negatively influenced the choice of environmental adaptability attribute of
sorghum over its yield capacity attribute. The results were significant at less than 10% and 5%
probability levels respectively. This would mean that, against the base variable, as age and
extension experience of the of the household head increases, it is more likely that farmers
preferred yield capacity of sorghum than its environmental adaptability attribute.
The possible explanation of the result could be that aged people might have developed some
better coping mechanisms, (such as experience, remittance or wealth etc), that would make
them more resilient if the sorghum production fails due to environmental hazards. Therefore,
it seems that elders are more risk takers by opting for yield maximizing or in other words
income or consumption maximizing attribute of sorghum crop than environmentally adaptable
one. However, the effect of age didn’t seem linear as the age of the head continuously
increases the previous preposition didn’t turn out to be true. For the extension experience
however, the possible explanation might be a better knowledge or awareness on sorghum crop
production obtained from extension involvement would have made those farmers to focus on
cash earning strategy (cash oriented) than stabilizing yield for survival. In other way, those
experienced farmers in extension service might have developed a skill of accumulating yield
that would be consumed even after a crop failure has occurred.
On the other hand, improved sorghum variety adoption and perception on frequency of future
potential pest occurrence positively influenced farmers’ preference for environmental
adaptability attribute over high yielding capacity attribute of sorghum at less than 5%
probability level both. This result could be interpreted as; being an adopter of improved
sorghum varieties is more associated with demanding environmental adaptability attribute of
the crop than its high yielding capacity. On the other hand, more apparently, those farmers
who speculate more frequent pest occurrence in the future are more interested in
environmentally adaptable sorghum varieties than that of high yielder ones.
Nonetheless, livestock ownership, perception on soil infertility and labor shortage as major
sorghum production constraints, and farmers’ location in Abuare village were variables that
82
negatively influenced the choice of food taste attribute of sorghum as compared to its high
yielding capacity attribute. The variables significantly influenced the specified choice at less
than 10%, 5%, 5% and 1% respectively. The result for livestock ownership could be due to
the indirect effect of livestock amount on decision to allocate resources such as land. Those
households with high livestock number would give emphasis to fodder production in addition
to grain. In consequence, the important feed sources, Tef, for its straw, would be considered
as first priority crop choice. Thus, those households with more livestock number might
allocate more land to Tef. This would mean little farm would be available for sorghum
production. This in turn would force them to give more attention to high yielding attribute that
could avail enough sorghum grain to consumption than the food taste attribute of the crop.
Those households who perceived loss of soil fertility and shortage of labor as the major
sorghum production constraints are found to demand for high yielding capacity of sorghum
than for its environmental adaptability attribute. The case in labor, might suggest that
households who value their labor at most may find production of sorghum attractive if they
get more productive sorghum varieties that might compensate the cost lost due to hiring of
labor or its opportunity cost of sorghum production. Besides, households who perceived that
there farmland is infertile to grow sorghum would respond more for high yielding sorghum
varieties as otherwise it would be effective for them if they diverted that infertile land to other
more paying crops. These findings are in line with the findings of Edilegnaw (2005).
Moreover, farmers in Abuare village as compared to Aradom would more probably prefer
yield capacity attribute of sorghum than its food quality attribute. This would mean that
farmers in the village are more interested in the yield capacity of the crop than the taste
quality when compared with the base village (Aradom). The village is the nearest and more
linked to market as compared to all other sample villages including aradom. This might make
the farmers in the village more responsive to market signals through producing more sorghum
than the case in Aradom village farmers do. Therefore, their better integration to market might
make them demand more yield than consumption quality at home. On the other hand, farmers
in Gedemeyu Kebele as compared to Aradom are more probably interested in food quality of
sorghum than its productivity trait.

83
Contrary to the prior expectation, current adopters of improved sorghum varieties were found
to demand more of the food taste quality of sorghum as compared to the yielding capacity of
the crop. Looking at adoption determinants result at this juncture might help to explain this
result. In the previous section, it had been discussed that both perception on yield capacity and
taste quality of improved sorghum influenced adoption positively. However, the degree that
food taste quality perception influenced adoption was higher than that of yield capacity.
Therefore, it is evident that adopter farmers would prefer more of the taste quality of the crop
Unlike the prior expectation again, more resilient farmers who could absorb probable shocks
in basic expenditure were found to prefer food taste quality attribute of sorghum than its
productivity attribute. This could however be explained based on the nature and social
acceptance of sorghum crop in the study area. Wealthier farmers (those with higher risk free
assets as compared to their basic expenditures) might obtain higher utility from the best food
making sorghum varieties than the best yielders in comparison base. The result wa significant
at less than 5% probability level. Finally, farmers who perceived more frequent pest
occurrence in the future were found to prefer productivity attribute of sorghum than its food
making quality. This might be explained as the same way as it is in the environmental
adaptable attribute preference. Those who expect more yield decreasing risks in the future
might need to acquire more yields that will make them safe during crop failure in the future.
Farmers’ improved sorghum adoption status and their perception on occurrence of future pest
incidences have been important cross-cutting variables affecting both environmental
adaptability and food quality.

84
Table 33. Estimated coefficients of Multinomial logit model
Source: own survey data, 2013.
Note: Yield capacity is set as the reference alternative, Aradom village is left as a reference .
Dependent variable = the choice of attribute of sorghum crop, number of observation= 150
LR chi2 (44) = 83.07, Prob > chi2= 0.0003
Log likelihood= -116.28146 Pseudo R2 = 0.2632
Explanatory variables Environmental adaptability Food quality
Coefs. St. errors
Z-value
s
Coefs. St. errors
Z-value
Sex of household head -0.85539 0.75302 -1.14 0.73901 0.61256 1.21 Education status of HHH 0.07768 0.23674 0.33 -0.30180 0.27248 -1.11
Age of the household head -0.16171* 0.09725 -1.66 0.12642 0.18020 0.70
Square of age of the head 0.00123 0.00093 1.32 -0.00154 0.00193 -0.80
Size of the household -0.24604 0.21994 -1.12 0.11456 0.22817 0.50
Distance to main market 0.09992 0.10721 0.93 0.03431 0.11767 0.29 Land holding size -0.33944 0.42018 -0.81 -.14924 0.41650 -0.36 Proportion of sorghum area -1.34417 1.5167 -0.89 -2.43587 1.5385 -1.58
Livestock ownership 0.13969 0.20034 0.70 -0.32127* 0.19031 -1.69 Off-farm participation 0.61391 0.69839 0.88 0.38576 0.76332 0.51 Improved sorghum adoption
1.2383** 0.63210 1.96 1.88690*** 0.68356 2.76
Food security perception -1.27841 0.87684 -1.46 -1.04980 0.91631 -1.15 Loss of soil fertility 0.56003 0.53909 1.04 -1.37811** 0.56437 -2.44 Shortage of labor 0.14329 0.55716 0.26 -1.34047** 0.58149 -2.31 Frequency of pest occurrence
0.20437** 0.09731 2.10 -0.17841* 0.10389 -1.72
Risk proxy per capita -0.00008 0.00016 -0.52 0.00045** 0.00019 2.38 Distance from FTC 0.091298 0.16146 0.57 -0.05127 0.16456 -0.31 Extension Experience -
.19769*** 0.07556 -2.62 0.07714 0.06888 1.12
ABUARE Village -0.9112 0.97459 -0.93 -1.9942* 1.1045 -1.81 GEDEMEYU Village 0.06365 0.94398 0.07 1.71989* 0.9131 1.88 QEYUGARA Village -1.17195 1.33400 -0.88 0.82118 1.50175 0.55
MENDEFERA Village -0.03143 0.94895 -0.03 1.41644 0.94722 1.5

85
Table 34. Marginal effects of the multinomial logit model
Source: own survey data, 2013 (*) dy/dx is for discrete change of dummy variable from 0 to 1
Explanatory Variables
Environmental adaptability
Food quality
Sex of household head -0.14483* 0.17968
Education status of household head 0.02615 -0.05461
Age of the household head -0.03208* 0.02863
Square of age of the head 0.00027 -0.00032
Size of the household -0.04535 0.03037
Distance to main market 0.01482 0.00136
Land holding size -0.04888 -0.01017
Proportion of sorghum area -0.11136 -0.35294
Livestock ownership 0.03716 -0.06067*
Off-farm participation 0.08980 0.03445
Improved sorghum adoption 0.09750 0.27898**
Food security perception -0.13532 -0.11349
Loss of soil fertility 0.15223 -0.24251***
Shortage of labor .08204 -0.23069**
Frequency of pest occurrence .02548* 0.02113
Risk proxy per capita -.00003 0.00008***
Distance from FTC .01722 -0.01276
Extension Experience -.03577*** 0.02188**
ABUARE Village -0.07292 -0.23786** GEDEMEYU Village -0.08827 0.36079* QEYUGARA Village -0.17784 0.20893
MENDEFERA Village -0.08040 0.29223

86
5. SUMMARY CONCLUSION AND RECOMMENDATION
5.1. Summary
Crop production is a subsector which the government of Ethiopia highly relied on to bring
about a livelihood security of the people. As part of this goal, there has been an increasing
effort to improve crop productivity primarily through agricultural intensification, involving an
increased use of inputs, including seeds of improved crop varieties. Recently, a massive
dissemination of improved seeds and fertilizer has been undertaken in the government
technology scaling out programs.
Sorghum is one of the crops which are expected to play a vital role in achieving food security
in most parts of the country especially in wello. The crop is one of the most widely cultivated
and consumed cereals in the area. Moreover, the research system of the country has gone long
way in technology development and dissemination of several yield increasing and drought
resistant improved sorghum varieties. HOPE project is one of the initiatives that have been
following an approach of integrating improved sorghum varieties with other yield increasing
agronomic practices since 2010. The adoption and intensity of use of such improved varieties
being extended by the project has not been studied.
On the other hand, there have been limited efforts in investigating the farmers’ varietal trait
preference and characteristics of varieties required by farmers that would enhance the
acceptance of the technologies in the farming community. With this regard, Wello in general
and Kobo district in particular is known for being sorghum genetic pools of the country.
Farmers in the area have various choice criteria for different sorghum varieties. They are well
aware of varietal selection decision within a diverse set of alternatives and dynamic and risky
environmental situation. Despite this fact the conventional crop breeding system seldom used
the local sorghum selection criteria to evaluate and release new sorghum varieties.
This study therefore, is intended to identify factors that determine adoption and intensity of
use of improved sorghum varieties. Also, factors that derive farmers’ choice of most preferred

87
sorghum varietal traits and the diffusion trend of the recent HOPE induced sorghum
technologies were assessed.
The study used a primary data collected from 150 randomly selected sorghum grower farmers
from five randomly selected “Kebelles” in Kobo Destrict of North Wello zone. Moreover,
regular statistical reports from sources like the Ministry of Agriculture and CSA were
reviewed.
The study used both descriptive statistics and econometric model results for data analyses.
The analysis was made using STATA version 11 software package. Results of descriptive
analysis generally showed that adopter of improved sorghum varieties differ from their non-
adopter counterparts in various demographic, socio-economic and institutional related
perspectives. Moreover, Farmers’ Perception on yielding capacity, color attractiveness, food
making quality, and pest resistance capacity of improved sorghum varieties were compared
and showed variation between the two adoption groups.
A Tobit model was also used to identify factors that determine adoption and intensity of use
of improved sorghum varieties. A total of 17 explanatory variables were included in the
model and a total of 9 variables were found to significantly determine adoption and intensity
of improved sorghum varieties. These are active labor ratio, tropical livestock unit, cultivated
farm size, farmers’ perception of yielding capacity and taste preference for improved sorghum
varieties, irrigated farm size, Striga infested farm size, proportion of sorghum farm from the
total cultivated farm and distance from farmers’ training centre to home.
Similarly, a Multinomial logit model was fitted to identify factors that determine farmers’
sorghum attribute choices. Sample households of the study generally chose three sorghum
attributes, namely, Yield capacity, environmental adaptability and food taste quality as most
preferred attributes. These choices are used as a dependent variable in the multinomial logit
model. The yield capacity choice was set as a reference outcome group. A total of 22
explanatory variables were included in the multinomial logit model for analysis. From the
total explanatory variables, 11 were dummies and the rest 11 were continuous variables. The

88
result of the model revealed variables that significantly explained choice of sorghum
attributes are adoption status of improved sorghum varieties, vulnerability level to potential
income shocks, age of the household head, experience in using the extension service,
perception on soil fertility status, labor constraint, frequency of important sorghum pests
occurrences, and location of the household residence.
5.2. Conclusions and Recommendations
The study on the trend of recent dissemination of HOPE project induced sorghum
technologies revealed a promising result of the project achievement. About 56.7 % of the
sample households had the chance to know at least one of the hope induced sorghum
technologies. Knowledge about the technologies was found to be associated with improved
sorghum technology adoption at less than 1% level of probability. The result clearly showed
that the information about the technologies was realized by better adoption level. Information
dissemination activity was slow at the beginning of the project period, increased with an
increasing rate after the second period of the project and slowed down currently. The
slowdown in the last one year might be attributed to a decreased performance of the project.
This information might help to reinitiate efforts to enhance the performance of the project for
years to come. Another interesting feature is the better dissemination of improved sorghum
varieties from HOPE project villages to Non-HOPE villages, especially to Mendefera and
Gedemeyu.
Results of descriptive analysis showed that adopters of improved sorghum varieties as
compared with non-adopters were characterized by better educational status, higher livestock
assets ownership, less total cultivable farm but higher irrigable farm size, and most of them
are located nearer to FTCs. With regard to the experience of utilizing agricultural extension
service, adopters possessed more experience than non-adopters. Moreover, higher proportion
of adopters (69.8%) as opposed to only little proportion of non-adopters (36.1%) perceived
that improved sorghum varieties are superior in their yielding capacity as compared to local
sorghum landraces. Similarly, higher proportion of adopters perceived improved sorghum
varieties to be superior in terms of color attractiveness, food taste quality and pest resistance

89
attributes than the local land races. These differences in perception between adopters and non-
adopters were also highly significant. Nonetheless, perception of both adopters and no-
adopters on drought resistance of improved sorghum varieties showed no significant
variation.
A Tobit model result has suggested that the level of active labor ratio negatively and
significantly affecting adoption and intensity of improved sorghum varieties. This implies that
improved sorghum varieties save labor force compared to local cultivars. The study therefore
indicates that cultivation of local land race is attractive for those households who have large
family members. Thus, new varieties would have wider acceptance if technology promoters
focus more on households with lower work forces and if additional means of engaging the
released labor is designed.
The extent of livestock ownership significantly and positively affected adoption and intensity
of use of improved sorghum varieties. This implies that livestock serve as an asset and
security that provide better risk taking ground to try those newly released sorghum varieties.
Therefore, especial emphasis should be given to those first mover farmers with more number
of livestock to promote and scale out new sorghum varieties.
Farm size was found to negatively and significantly affect adoption and intensity of use of
improved sorghum varieties. This implies diseconomies of scale due may be the lack of
sufficient access to improved seeds and managerial problems that impede putting more land
under intensive agriculture. On the other hand it is probable that farmers with large land
would diversify more into other crops and may mask the actual scenario about sorghum
variety utilization. Thus it is more likely to increase adoption level of improved sorghum
varieties in the long run by making better access to improved seeds (affordable prices of
inputs and improved supply system) and in the short run through targeting smallholder
farmers in technology outreach programs.
The Tobit model result has also shown that the amount of household’s irrigated farm size
positively and significantly influenced adoption and intensity of use of improved sorghum

90
varieties. The result implies that early maturing improved varieties are more compatible with
the upcoming irrigation farming system in the study area. Moreover, irrigation could facilitate
intensive agriculture. Therefore it is recommended to design more sorghum production and
scaling out programs in irrigation schemes in the study area.
The size of striga infested land positively and significantly determined adoption and intensity
use of improved sorghum varieties. The result implies that farmers’ with striga threat respond
to the problem by adopting new Striga resistant improved sorghum varieties. Thus it will be
important to identify Striga hot spot villages and farms in order to enhance adoption and
intensity of use of those varieties.
Furthermore, higher proportion of sorghum area and longer distance from FTCs to farmers’
residence affect adoption and intensity of use of improved sorghum varieties negatively. The
result on the proportion of sorghum area implies that as farmers give more focus to sorghum
production than to other crops they tend to grow more of the local varieties than improved
ones. However, the later result could reinforce the reason suggested for increased use of land
where the situation of diseconomies of scale could operate. Also it could be that farmers
located far away could face deprived access to technological information and to involvement
in on-station trials are less likely to adopt those new sorghum varieties and could continue
with the existing local varieties.
Thus, on the one hand it is necessary to make information and knowledge about new
technologies accessible to farmers to enhance the acceptance and adoption of new varieties
thereby increase farm level productivity. This might be done through involving farmers who
are far from FTCs through on-farm trials and field-visits. On the other hand, improving the
capacity of those farmers to get access to the currently unaffordable and inaccessible
improved inputs through better access to asset building mechanisms, such as livestock, access
to favourable credit and promotion of local seed producers may be essential.
Perception of farmers about better yield and taste qualities of improved sorghum varieties
strongly determined adoption and intensity of those varieties. This implies that farmers are
91
more responsive in adopting new sorghum varieties if they perceive that those new varieties
as compared to the existing varieties give higher grain yield and taste quality. Thus it would
be very important to focus on the two traits for developing new sorghum varieties for the
varieties to have better adoption intensity.
Likewise, the result of multinomial logit model indicated that, compared to the base outcome,
age and experience of the household head in agricultural extension negatively and
significantly influenced farmers’ choice of environmental adaptability attribute of sorghum.
The result entails that age and extension exposure are important variables in shaping farmers’
preference towards yield maximizing attributes. Therefore, any development intervention in
the study area should focus on dissemination of yield improving varieties under the context of
harsh environment. On the other hand, improved sorghum variety adoption and perception on
frequency of future potential pest occurrence positively influenced farmers’ preference for
environmental adaptability attribute over high yielding capacity attribute of sorghum. This
calls for the analysis of detailed environmental adaptability valuation new sorghum varieties
from variety improvement side so as to enhance their adoption.
Furthermore, livestock ownership, soil infertility and labor shortage constraints in sorghum
production and farmers’ location in Abuare village were variables that negatively influenced
the choice of food taste attribute of sorghum as compared to its high yielding capacity
attribute. On the other hand, improved sorghum adoption status, better risk taking capacity
and location in Gedemeyu are associated with demanding food quality attribute of sorghum
than its productivity characteristics.
In conclusion, it is an interaction of diverse demographic, socioeconomic, and perception
based variables that determined farmers’ choice of sorghum traits. Thus, it will not be wise
and acceptable to perform sorghum variety improvement from only single attribute
perspective such as yield capacity and unanimously recommend across all farmers. The
research should address the scenario of different farmer groups that could be formed based on
their socio-economic differences to evaluate the merits and attributes of the varieties before
going to release and popularization of new ones.

92
6. REFERENCES
Abrhaley Gebrelibanos, 2006. Farmers’ perception and adoption of integrated striga management technology in Tahtay Adiabo Woreda, Tigray, Ethiopia. An M.Sc. Thesis presented to the School of Graduate Studies of Haramaya University.104p.
Adamowicz, W.L., P. Boxall, M. Williams and J. Louviere, 1998. Introduction to attribute-Based Stated Choice Methods. American Journal of Agricultural Economics. 80(1):64-75.
Adesina, A.A. and J. Baidu-Forson, 1995. Farmers’ perceptions and adoption of new agricultural technology: evidence from analysis in Burkina Faso and Guinea, West Africa. Agricultural Economics. 13: 1-9.
Adesina, A.A.; Zinnah, M.M, 1993. Technology characteristics, farmers' perceptions and adoption decisions: A Tobit model application in Sierra Leon. Agricultural Economics. 9: 297-311.
Akinola, A. A, 1987. An application of probit analysis to the adoption of tractor hiring service scheme in Nigeria. Oxford Agrarian Studies. 16: 70-81.
Alemitu Mulugeta, 2012, Factors affecting adoption of improved haricot bean varieties and associated agronomic practices in dale woreda, SNNPRS. An M.Sc. Thesis presented to the School of Graduate Studies of Haramaya University.109p.
Alene, A.D., D. Poonyth and R.M. Hassan, 2000. Determinants of adoption and intensity of use of improved maize varieties in the central highlands of Ethiopia: a Tobit analysis. Agrekon. 39(4): 633-643.
Alpizar, F. Carlsson and F. P. Martinsson, 2001. Using choice experiments for non-market valuation. Economic Issues. 8(1): 83–109.
Amemiya, T., 1985. Advanced Econometrics. T.J. Press, Pad stow Ltd: Great Britian.
Amsalu Aklilu and de J. Graaff, 2007. Determinants of adoption and continued use of stone terraces for soil and water conservation in an Ethiopian highland watershed. Ecological Economics. 61(2): 294-302.
Anne G. Timu, Richard M. Mulwa, Julius Okello and Mercy Kamau, 2012. The role of varietal attributes on adoption of improved seed varieties: The case of sorghum in Kenya.

93
Selected paper prepared for presentation at the Agricultural & Applied Economics Association’s 2012 AAEA Annual Meeting, Seattle, Washington, August 12-14. (http://ageconsearch.umn.edu) Accessed on July 7, 2013.
Asfaw Adugna, 2007. The role of introduced sorghum and millets in Ethiopian agriculture: ICRISAT Open Access Journal. 3(1):1-12. (http://ejournal.icrisat.org) on July 12, 2013.
Assefa Admassie and Gezahegn Ayele. 2004. Adoptions of improved technologies in Ethiopia. Ethiopian Development Research Institute, Research Report No. 3.
Bayissa Gedefa, 2010. Adoption of improved sesame varieties in Meisso district, West Hararghe Zone, Ethiopia. An M.sc Thesis submitted to Haramaya University.108p.
Berhanu Adinew, 2006. Effective aid for small farmers in Sub-saharan Africa: Ethiopia case study, submitted to Canadian Food Security Policy Group. Southern Civil Society Perspectives. (http://www.ccic.ca) Accessed on 7/21/13.
Berhnu Gebremedihine, 1981. Salient features of the sorghum breeding strategies used in Ethiopia. Ethiopian Journal of Agricultural Sciences. 3(2). 97-104.
Bhatt, C., 1995. A heteroskedastic extreme value model of intercity travel mode choice. Transportation Research.29(2): 471-483.
________,1997. Covariance heterogeneity in nested logit models: Econometric structure and application to intercity travel. Transportation Research. 31 (2): 11-21.
Braden, J. and C. Kolstad, 1991. Measuring the demand for an environmental improvement. North-Holland, Amsterdam. 370pp.
Byerlee, D., D. Spielman, Dawit Alemu and M. Gautam, 2007. Policies to promote cereal intensification in Ethiopia: A review of evidence and experience. IFPRI Discussion Paper 00707, IFPRI, Washington, DC. (http://www.ifpri.org/pubs/dp/ifpridp00707) Accessed on August 10, 2013.
Carson, R.T., Flores, N.E., Martin, K.M. and Wright, J.L., 1996. Contingent valuation and revealed preference methodologies: comparing the estimates for quasi-public goods. Land Economics. 72(1): 80-99.
Coady, D.P, 1995. An empirical analysis of fertilizer use in Pakistan. Econometrica 62(246): 213-234.

94
Cragg, J, 1971. Some statistical models for limited dependent variable with application to the demand of durable goods. Econometrica, 39: 829-844.
CSA (Central Statistical Authority), 2007. Summary and statistical report of the population and housing census. National Results. Volume I, Part I, Addis Ababa, Ethiopia.
___________, 2008. (Central Statistical Authority). Agricultural sample survey, 2008/2009 (2001 E.C) report on area and production for major crops (private peasant holdings, main season), statistical bulletin 446, Addis Ababa, Ethiopia.
____________, 2010. (Central Statistical Authority). Summary and statistical report of the population and housing census Addis Ababa, Ethiopia.
____________, 2012. (Central Statistical Authority). Summary and statistical report of the population and housing census Addis Ababa, Ethiopia.
Dereje Hamza, 2006. Assessment of farmers’ evaluation criteria and adoption of improved bread wheat varieties. An M.Sc. Thesis presented to the School of Graduate Studies of Haramaya University.133p.
Destaw Berhanu Nega, 2003.Non-farm employment and farm production of smallholder farmers’ study, in Edja district of Ethiopia. An M.Sc. Thesis, presented to Agricultural Economics, Alemaya University, Ethiopia.
Dong, D. and A. Saha, 1998. He came, he saw, (and) he waited: An empirical analysis inertia in technology adoption. Applied Economics. 30: 893-905.
EARO (Ethiopian Agricultural Research Organization), 2004. Directory of released crop varieties and their recommended cultural practices. Adiss Ababa, Ethiopia.
Edelegnaw Wale, 2004. The economics of on-farm conservation of crop diversity in Ethiopia: Incentives attribute preferences and opportunity costs of maintaining local varieties of crops. Ph.D dissertation, Faculty of Agriculture, University of Bonn, Bonn.
Edelegnaw Wale, J. Mburu, K. Holm-Müller and M. Zeller, 2005. Economic analysis of farmers' preferences for coffee variety attributes: lessons for on-farm conservation and technology adoption in Ethiopia. Quarterly Journal of International Agriculture. 44(2): 121-139.

95
Endrias Geta, 2003. Adoption of Improved Potato Varieties in Boloso Sore District, Southern Ethiopia. An M.Sc. Thesis presented to the School of Graduate Studies of Haramaya University, Haramayam Ethiopia. 92p.
FAO (Food and Agricultural Organization), 2011. Annual report. Addis Ababa, Ethiopia.
________, 2006. Special report. FAO/WFP crop and food supply assessment mission to Ethiopia. 24 February, 2006. [On line accessed on 09 April, 2012 at http://www.fao.org/ docrep/008/j7071e/ j7071e00.htm#48 accessed in July 2012.
FAOSTAT, 2005. FAO statistical data base for Agriculture. (http://faostat.fao.org/faostat/) Accessed on August 10, 2013.
FDRE (Federal Democratic Republic of Ethiopia), 2010. Growth and transformation plan 2010/11- 2014/15. Volume I: Main Text, Ministry of Finance and Economic Development. November 2010. Addis Ababa, Ethiopia.
Feder, G.R.E. and D. Zilberman, 1985. Adoption of agricultural innovations in developing countries: a survey. Economic Development and Cultural Change. 33 (2): 255-298.
Fitsum Hagos. 2003. Poverty, Institution, Peasant Behavior and Conservation Investment in Northern Ethiopia. Department of Economics and Social Sciences. Agricultural University of Norway. PhD Dissertation.
Ghadim, A.K.A and D.J. Pannel, 1999. A conceptual framework of adoption of agricultural innovations. Journal of Agricultural Economics, 21: 145-154
Girma Tesfahun, Fiseha Worede, Samuel Menbere and Adane Girma, 2000. Farming systems of Kobbo Woreda, Initial Findings of Informal Survey. 66P.
Goodwin, B. K, 1992. Analysis of factors associated with consumers' use of grocery coupons. Journal of Agricultural and Resource Economics. 17: 110-120.
Green, H.W., 2004. Econometric Analysis: Fourth Edition. New York University Macmillan Publishing Company.
Gujarati, D.N., 2004. Basic Econometrics: forth edition. New York, USA: MacGraw-Hill.

96
Gujarati, D. N, 1995. Basic econometrics. Second Edition. New York, USA: MacGraw Hill Inc.
Hailu Beyene, 2008. Adoption of improved tef and wheat production technologies in crop-livestock mixed systems in Northern and Western Shoa Zoans of Ethiopia. A Phd. Dissertation at university of Pretoria.
Haji Biru, 2003. Adoption of crossbred dairy cows in Aris Zone, The case of Tiyo and Lemu Bilbilo Woreda. M.Sc Thesis presented to School of Graduate Studies of Haramaya University.
Hanemann, M, 1999. Welfare analysis with discrete choice models. In Herriges, J. and C. Kling (eds.) Valuing Recreation and the Environment, Edward Elgar, Cheltenham, Uk.
Hanemann, M. and B. Kanninen, 1999. The statistical analysis of discrete-response CV data. In Bateman, I. and K. Willies (eds.) Valuing Environmental Preferences pp. 302-441, Oxford University Press.
Hassan, R.M, 1996. Planting strategies of maize farmers in Kenya: A simultaneous equations analysis in the presence of discrete dependent variables, Journal Agricultural Economics. 15: 137–149.
Hausman, J., and D. McFadden, 1984. Specification tests for the multinomial logit model. Econometrica. 52(5): 1219-1240.
Healy, F.J, 1984. Statistics: A Tool for Social Research. California, USA: Wadsworth Publishing Company.
Heckman, J. J, 1976. The common structure of statistical models of truncation, sample selection and limited dependent variables and a simple estimator for such models. Annuals of Economic Social Measurement. 5(4): 475–492.
Igodan, C. O., P. E. Ohaji and J. A. Ekpere, 1988. Factors associated with the adoption of recommended practice for maize production in the Kainji Lake Basin of Nigeria. Agricultural Administration and Extension. 29: 149-156.
Jones, A.M, 1989. A double-hurdle model of cigarette consumption. J. Appl. Econometrics. 4: 23-29.
Jones, A.M. and S.T. Yen, 1994. A box-cox double hurdle model. IFS working paper W94/96 and DERS Discussion Paper No. 94/95.

97
Janson, H.G.P, 1992. Inter-regional variation in the speed of modern cereal caltivars inIndia. Jornal of Agricultural Economics. 63: 495-502.
Kelley, J, 1995. ‘Public perceptions of genetic engineering: Australia 1994’, final report to the Department of Industry, Science and Technology, Canberra: International Social Science Survey, Australia. (http://www.international-survey.org) Accessed on May 25, 2013.
Kennedey, P, 1992. A guide to Econometrics, 3rd ed. Cambridge, Mass, USA: The MIT press.
Lancaster, K.J, 1966. A new approach to consumer theory. Journal of Political Economy. 74: 132-57.
Lancasar E, and J..J Louviere, 2006. Deleting irrational responses from discrete choice experiments: a case of investigating or imposing preferences. Health Economics. 15(8): 797-811.
Leeuwise, C, 1983. Communication for rural innovation: rethinking agricultural extension. Third Edition. Oxford, UK: Blackwell Sc. Ltd. 381p.
Legesse Dady, Asnake Fikre, C.L.L Gowda, Demissie Mitiku, Mcs Bantiln, PM Gaur and Senait Regassa, 2005. Adoption of improved chickpea varieties in Ethiopia. International Crops Research Institute for the Semi-Arid Tropics. (http://oar.icrisat.org ) Accessed on August 10, 2013.
Maddala, G. S, 1977. Econometrics. Singapore, McGrow-Hill Book Co.
Maddala, G.S.,1992. Introduction to econometrics. 2nd edition. New York, USA: Macmillan. 631p.
____________,1985. Limited dependent and qualitative variables in econometrics. Econometric Society Monograph No. 3. pp. 151-160. Cambridge, UK. Cambridge University Press.
Mahdi Egge, 2005. Farmers’ evaluation, adoption and sustainable use of improved sorghum varieties in Jijiga woreda, Ethiopia. MSc Thesis. An M.Sc. Thesis presented to the School of Graduate Studies of Haramaya University, Ethiopia.
98
Mahdi Egge, P. Tongdeelert, S. Rangsipaht and S. Tudsri, 2012. Factors affecting the adoption of improved sorghum varieties in awbare district of somali regional state, Ethiopia. Kasetsart J. (Soc. Sci). 33: 152 -160.
Masresha Fetene., Okori P., Gudu S., Mneney E., Kassahun Tesfaye, 2011. Delivering new sorghum and finger millet innovations for food security and improving livelihoods in eastern africa. Nairobi, Kenya, ILRI. (www.ilri.org ) Accessed on May 03, 2013.
McDonald, J. F. and R. A. Moffit, 1980. The use of tobit analysis. Review of Economics and Statistics. 62(3): 18-320.
McFadden, D, 1974. Conditional logit analysis of qualitative choice behavior. In P. Zarembka, (ed.) Frontiers in Econometrics pp.105-142. New York, USA: Academic Press.
McGuire, 2000. Ethiopian farmers’ management of sorghum genetic resources. Botany. 55: 106-128.
_____________, 2005. Getting genes: Rethinking seed system analysis and reform for sorghum in Ethiopia. PhD Dissertation, Wageningen, University,Wageningen.
Mesfin Astatike, 2005. Analysis of factors influencing adoption of triticale (x-triticosecale wittmack) and its impact: the case of Farta district. An M.Sc Thesis Submitted to School of Graduate Studies of Haramaya University. 112p.
Mesfin Duguma,2007. Farmers’ perception on soil erosion and decision on land management in Assosa woreda, Ethiopia. An M.Sc Thesis Submitted to School of Graduate Studies of Haramaya University. 114p.
Million Tadesse, and Belay Kassa, 2004. Determinants of fertilizer use in Gununo area, Ethiopia. In agricultural technology evaluation, adoption and marketing. Proceedings of the Workshop Held to Discuss the Socio-economic Results of 1998-2002 from August 6-8, 2002. Ethiopian Agricultural Research Organization, Addis Ababa.
MoFED (Ministry of Finance and Economic Development), 2006. Ethiopia: Building on Progress. A Plan for Accelerated and Sustained Development to End Poverty (PASDEP) (2005/06-2009/10) Volume I: Main Text. Addis Ababa, Ethiopia.
Mulugeta Tefera, 2002. Determinants of household food security in Estern Oromia, Etthopia: The case of Boke District of Western Harerghe Zone. An M.sc Thesis submitted to Haramaya University, Haramaya, Ethiopia.
99
Nehring, K. and C. Puppe, 2002. A theory of diversity. Econometrica. 70(3): 1155-1198.
Polson, R.A. and D.S.C. Spencer, 1991. The technology adoption process in subsistence agriculture: The case of cassava in South Western Nigeria. Agric. Syst. 36: 65-77.
Ransom, J.K, Pandyal, K. Adhikari, K, 2003. Adoption of improved varieties in the hills of Nepal. Agricultural Economics. 29: 299-305.
Rogers, E.M, 1983. Diffusion of innovations. New York, USA: The Free Press.
Romina C., L. Lipper, and U. Narloch, 2010. Modern variety adoption and risk management in drought prone areas: insights from the sorghum farmers of eastern Ethiopia. International Association of Agricultural Economists. 20:1–14
Roy, A.D, 1952. Safety first and the holding of assets. Econometrica. 20: 431-449.
Samuel, A. D. and J. A. Awuni, 2009. Farmers’ perceptions and adoption of improved farming techniques in low land rice production in Northern Ghana. Journal of Agricultural and Biological Science. 2(4): 084-093.
Samuel Gebreselassie, 2006. Intensification of smallholder agriculture in Ethiopia: options
and scenarios. Paper presented for the Future Agricultures Consortium Meeting at the Institute
of development Studies, 20-22 March 2006. DFID (Accessed on 06.12.2010 at www.future-
agricultures.org)
Serna-Saldivar, S. and L. Rooney, 1995. Structure and chemistry of sorghum and millets. In Dendy Dave (ed.) Sorghum and millets, chemistry and technology pp. 69–124. St Paul, MN: American Association of Cereal Chemists.
Shiferaw Feleke and Tesfaye Zegeye, 2006. Adoption of improved maize varieties in Southern Ethiopia: Factors and strategy options. Food Policy. 31: 442-457.
Sinafikish Asrat, 2008. Economic Analysis of farmers’ preference for crop variety traits using a choice experiment approach: lessons for on-farm conservation and technology adoption in Ethiopia, an M.sc thesis submitted to Addis Ababa University, Addis Ababa, Ethiopia.

100
(SARC) Sirinka Agricultural Research Center, 2011. Annual report, Unpublished. Sirinka,
Ethiopia.
Smale, M., M. Bellon, and J.A.A. Gömez, 2001. Maize diversity, variety attributes and farmers’ choices in Southeastern Guanajuato, Mexico. Economic Development and Cultural Change. 50(1): 201-225.
Smith. C.W. and R.A. Frederiksen, 2000. Sorghum: origin, history, technology, and production. New York, USA: NY: John Wiley and Sons. 824p.
Solomon Asfaw, Bekele Shiferaw, Franklin Simtowe and Mekbib Gebretsadik Haile, 2011. Agricultural technology adoption, seed access constraints and commercialization in Ethiopia. Journal of Development and Agricultural Economics. 3(9): 436-447.
Solomon Benor and Lemlem Sisay, 1999. Diversity of sorghum germplasms in the Northeastern Ethiopia and their implication for conservation and breeding. 9 Ethiopia, 22-23 June 1999, proceedings of the Crop science society of Ethiopia, Addis Ababa.
Storck, H., Bezabih Emana, Berhanu Adnew, A.A. Borowiecki and Shimelis Welde Hawariat, 1991. Farming systems and farm management practices of small-holders in the Hararghe Highlands. Farming system and resource economics in the Tropics. V.11: Wissenschafts Varlag Vauk Kiel KG, Germany.
Taha Mume, 2007. Determinants of intensity of adoption of improved Onion production package in Dugda Bora District, East Shoa, Ethiopia. An M.Sc Thesis Submitted to School of Graduate Studies of Haramaya University.
Techane Adugna, 2002. Determinants of fertilizer adoption in Ethiopia. The Case of Major Cereal producing Areas. An M.Sc. Thesis Presented to School of Graduate Studies of Alemaya University. 92 p.
Teferi Wondale, 2003. Trends in and determinants of fertilizer use in Gozamin District, Amhara Region. An M.Sc. Thesis Presented to School of Graduate Studies of Alemaya University.
Tesfaye Zegeye and Alemu Haileye, 2001. Adoption of improved maize technologies and inorganic fertilizer in Northwestern Ethiopia. Ethiopian Agricultural Research Organization (EARO). Research report No.40, Addis Ababa, Ethiopia. 51p.

101
Tessema Tanto and Abebe Demissie, 2000. A comparative study of genetic diversity of four major crops managed of Ethiopia. Institute of Biodiversity Conservation and Research, Addis Ababa. (www.kew.org/ucm/groups/public/documents/.../ppcont_013810.pdf.) Accessed on July 05, 2013.
Tobin, J. 1958, Estimation of relationship for limited dependent variables. Econometrica 26: 26-36.
Traxler, G. and Derek Byerlee, 1993. A Joint-product analysis of adoption of modern cereal varieties in Developing Countries. American Journal of Agricultural Economics. 75: 981-989.
Vovsha, P, 1997. Application of a cross-nested logit model to mode choice in Tel Aviv, Israel, Metropolitan Area. Transportation Research Record. 1607: 6–15.
World Bank, 2007. Development indicators, available at http://web.worldbank.org. Accessed on July 18, 2012.
_________,2005. Well-being and poverty in Ethiopia: the role of agriculture and agency. World Bank Report No. 29468-ET, Poverty Reduction and Economic Management, Country Department for Ethiopia, Africa Region, World Bank, Washington, DC.
Wortmann, C.S., Martha Mamo,Girma Abebe, Kaizzi, K., Mburu, C., Letayo, E & XerindaS, 2006. An atlas of sorghum production in eastern Africa. (http://intsormil.org) Accessed on June 15, 2012.
Wubeneh Nega, 2003. Farm-level adoption of new sorghum technologies in Tigray Region, Ethiopia. M.Sc thesis research presented to Purdue University, USA.
Yamane, T, 1967. Statistics, an introductory analysis, 2nd Ed., New York, USA: Harper and Row.
Yishak Gecho and N. K. Punjabi, 2011. Determinants of adoption of improved maize technology in damot gale, wolaita, Ethiopia. Raj. J. Extn. Edu. : 19: 1-9.
Yitayal Anley, 2004. Determinants of use of soil conservation measures by smallholder farmers in Jimma Zone. The case of Dedo district. Ethiopia. An M.Sc Thesis Submitted to School of Graduate Studies of Alemaya University.

102
Zegeye Bante, 2007. Risk aversion behavior of farm households and the role of credit usage in Kobo district, Northern Wollo Zone of Ethiopia, An M.Sc Thesis Submitted to School of Graduate Studies of Haramaya University, Haramaya, Ethiopia.
7. APPENDICES
Appendix table 1. Multi-collinearity test result for the continuous variables in Tobit model
Variable Co-linearity Statistic Tolerance VIF
Farming experience 4.42 0.226 Active ratio of family member 4.16 0.240 Tropical Livestock Unit 5.16 0.194 Farm size 7.46 0.133 Irrigable farm size 1.45 0.687 Years of extension experience 2.58 0.388 Striga infested land 2.31 0.433 Distance from the household to FTC 2.29 0.437 Proportion of sorghum farm from total cultivated land 4.68 0.214 Source: Survey data, 2013
Appendix table 2. Contingency Coefficients for the qualitative variables in Tobit model
Source: survey output, 2013.
A. Sex E. Perception of taste advantage B. Education F. Perception of drought advantage C. Off/non-farm employment G. Experiences of the HHH on farm trial D. Perception of yield advantage H. Access to formal credit
A B C D E F G H A 1 0.117 0.03 0.065 0.061 0.019 0.149 0.056 B 1 0.182 0.043 0.171 0.098 0.255 0.109 C 1 0.035 0.004 0.073 0.085 0.040 D 1 0.311 0.265 0.219 0.116 E 1 0.073 0.324 0.004 F 1 0.192 0.091 G 1 0.026 H 1

103
Appendx table 3. Variables inflation factor result of MNL model
Variable Co-linearity Statistic
Tolerance VIF
Sex of household head 0.84352 1.19
Education status of HHH 0.74539 1.34
Age of the household head 0.72154 1.39
Size of the household 0.38345 2.61
Distance to main market 0.25732 3.89
Land holding size 0.55040 1.82
Proportion of sorghum area 0.74062 1.35
Livestock ownership 0.23998 4.17
Off-farm participation 0.84574 1.18
Improved sorghum adoption 0.66031 1.51
Food security perception 0.71975 1.39
Loss of soil fertility 0.85818 1.17
Shortage of labor 0.78171 1.28
Frequency of pest occurrence 0.73400 1.36
Risk proxy per capita 0.25674 3.89
Distance from FTC 0.49198 2.03
Extension Experience 0.78581 1.27
ABUARE Village 0.28541 3.50
GEDEMEYU Village 0.49840 2.01
QEYUGARA Village 0.20616 4.85
MENDEFERA Village 0.43066 2.32
Mean VIF 2.17
Source: Own survey data, 2013

104
Appendix table 4. Acceptance of newly promoted sorghum varieties by sample household
If you have known any one of the varieties promoted by SARC/ HOPE, did you try at least one of them?
No %
No, I haven’t tried any 48 56.5 Yes, I have tried at least one 37 43.5 total 85 100 If you have not tried what was the main reason? seed not available 20 41.7 seed too expensive 2 4.2 poor fodder quality and or quantity 10 20.8 poor food taste 5 10.4 never proved its environmental adaptability 6 12.5 not demanded by market 5 10.4 Total 48 100 do you apply fertilizer /micro dose/ to sorghum No 143 95.3 yes 7 4.7 total 150 100 if you don’t what is the main reason too expensive 31 21.7 cash shortage 25 17.5 moisture stress 87 60.8 total 143 100 Do you use any tie ridging for moisture conservation? No 134 89.3 yes 16 10.7 total 150 100 if you don’t what is the main reason No. % not available 18 13.4 expensiveness 7 5.3 heavy dry wet time to be pulled by oxen 51 38 don’t know the implement 37 27.6 farm land not comfortable 21 15.7

105
Total 134 100 What planting method/s did you use? row planting 8 5.4 broadcast planting 140 93.3 mixed of both 2 1.3 Total 150 100 Source: Survey data, 2013
Appendix table 4 (continued)
If you have known any one of the varieties promoted by SARC/ HOPE, did you try at least one of them?
No %
did you use any pest control chemicals No 138 92 Yes 12 8 Total 150 100 how many time do you go for weeding your sorghum One 32 21.3 Two 109 72.7 Three 9 6 Total 150 100 Source: Survey data, 2013
Appendix table 5. Dissemination of HOPE varieties across treatment and control kebeles
which varieties have you heard about Treatment Villages % Control Villages % No information about any 6 8.7 59 72.8 Miskir 9 13 0 0 Girana 4 5.8 1 1.2 Hormat 4 5.8 13 16 Miskir and Girana 11 16 1 1.2 Miskir and Hormat 1 1.4 3 3.7 Girana and Hormat 1 1.4 5 6.2 Miskir, Girana and Hormat 32 46.4 0 0 Total 69 100 81 100 Source: Survey data, 2013
Appendix table 6. Adoption of HOPE induced sorghum technologies by kebeles
Sorghum Varieties Treatment Kebeles
% Control Kebeles
% Total
%
Not-adopted 34 49.3 79 97.5 113 75.3 Adopted 35 50.7 2 2.5 37 24.7 Total 69 100 81 100 150 100

106
Micro-dosing application
Not-adopted 63 91.3 80 98.8 143 95.3 Adopted 6 8.7 1 1.2 7 4.7 Total 69 100 81 100 150 100 Tied-ridge adoption Not-adopted 66 95.7 68 84 134 89.3 Adopted 3 4.3 13 16 16 10.7 Total 69 100 81 100 150 100 Source: Survey data, 2013
Appendix table 7. Conversion factors used to calculate Tropical Livestock Units (TLU)
Animals
TLU-equivalent
Calf 0.20 Heifer & Bull 0.75
Cows & Oxen 1.00
Camel 1.25
Horse 1.10
Donkey 0.70
Ship & Goat 0.13 Chicken/poultry
0.013
Source: Strock et al., (1991)

107
Appendix 8 Interview questionnaire
Interview questionnaire for MSc thesis
0.0 Survey quality control
Date of interview:Date:……………………Month…………………….Year:.........................
Interviewed by:.........................................................
Starting time: …………………… Ending time: …………………………
Date checked: Day: …………………...Month:……………………………Year:.....................
Date entered: Day: ...............................Month:… ………………Year: .............
Village location: HOPE Treatment area………… Control area……………………..
Household ID:
1.0 Respondent and site identification Please confirm that the person you interview is the head of the household or that s/he is able to answer
questions concerning the agricultural production and other household issues. If the respondent is not
able to do so, please stop the interview and arrange another date to interview the head of the household.
Please explain the respondent that the questions are only for study purpose.
1. Respondent’s name………………………………………….…….………………………………
2. Respondent’s sex 0 male 1 female
3. Age of the respondent ________years
4. District….................................. Kebele/PA……………………………………….
Got………………………………………
5. Distance to agricultural field officer (DA) in km………… and/or hours ………………( 1 hr= 7km)
6. Number of years the respondent is living in the village…………………………………… years

108
7. Experience in own farming activities …………………………………… years
8. Experience in cultivating Sorghum…………………… years
9. Distance to the nearest main market in km/hr…..…………………
10. Name of the nearest main market…..………………………………………………………………
11. Does your village have access to electricity? 0 No 1 Yes

109
2.0 Household information 2.1 Household composition (Please fill the table for all household members who were in the last 12
month living in your household, fill also for non-permanent members)
Name of HH member (start with respondent)
Gender (0=male;1=f
emale)
Position HH
Code A
Marital status Code
B
Age (years
Educ. level
Code C
Social responsibility
Code D
Farm labour participation
Codes E
1. 2. 3. 4.
2.2. Involvement of the household in off-farm activities: 0. No ______ 1. Yes______
2.3. If yes, who participates in off-farm activity?
Name of the household member Number of days spent off-farm in a year
2.4 What is the type of off-farm activity in which the household is involved in?
1. Paid daily labour _______
2. Petty trade ________
3. Handcraft ________
4. Other, specify _______________
2.5. From the following, to which one you assign yourself relation in relation to other
households in the area? 0) food self-sufficient farmer 1) food self-insufficient farmer.
Codes A 1. Household head 2. Spouse 3. Son/daughter 4. Parent 5. Son/daughter in-law 6. Grand child 7. Other relative 8. Hired worker 9. Other, specify……
Codes B 1 Married living with spouse 2. Married but spouse away 3. Divorced/separated 4. Widow/widower 5. Never married 6. Other, specify………..
Code C 0. None (illiterate) 1. Basic ( can write and read) 2. Primary (1-4) 3. Junior (5-8) 4. Secondary (9-10)
5. High school (11-12) 6. Higher education 7. Other specify
Code D 0 None 1. kebele cabinet 2. social group leadership 3. religious leadership 4. Cooperatives 5. Saving and credit group 6. others specify-
Codes E 0. None 1. Full time 2. Part-time 3. Weekends and holidays 4. Other, please specify

110
2.5 Please fill the following table about land holdings during 2004/05 planting season in timad
**Specification………………………………………………………………………
2.6 Do you think that shortage of land is the major production constraint for you in
sorghum prod? 0) No 1)Yes
2.7 Do you think that Poor quality of land is the most important problem currently faced by
the? household in sorghum prod 0) No 1)Yes
2.8 Do you think that shortage of labour is the major production constrain for sorghum
production? 0) No 1)Yes
2.9 If yes, for what specific activities do you encounter labour shortage?
1= Cultivation of land 2= Weeding 5=Planting
3= Crop harvest 4 = Threshing 6= Others (Specify)
2.10 If yes, how did you overcome this labour shortage? 1. Hiring labor 2. Labour pooling
mechanism (Wenfel) 3. Others, specify____________
2.11 Do you think that Poor extension, input supply, and farm implements are the most
important production constraint 0) No 1)Yes
2.12 Do you think that natural factors( pests, disease, weather, and drought) as a production
constraint 0) No 1)Yes
2.13 The number of times the household faces drought problems during the last ten years--?
2.14 The number of years the HH expects potential pest/ disease problems during the future
10 years?
Land ownership
Total Cultivated land
(Area)
Fallow land
(Area)
Rented out (Area)
Shared out
(Area)
Other, specify**
(Area) Area Timad
Own Rented in Shared in
Total
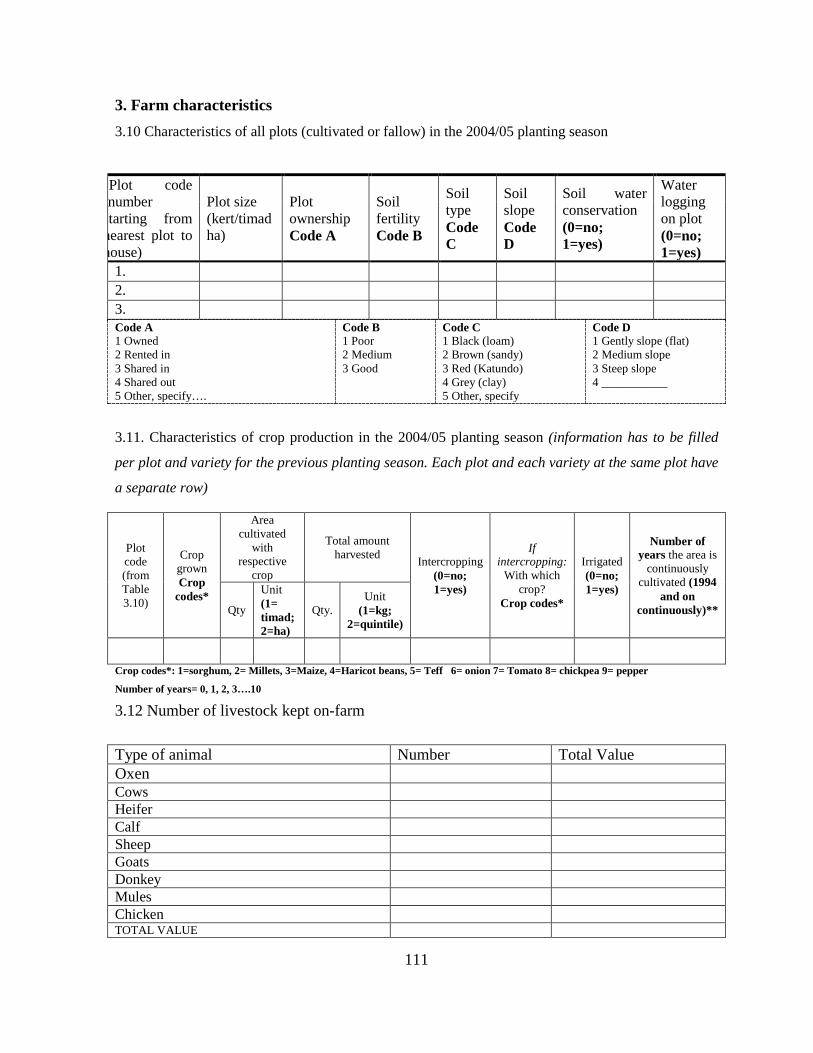
111
3. Farm characteristics 3.10 Characteristics of all plots (cultivated or fallow) in the 2004/05 planting season
3.11. Characteristics of crop production in the 2004/05 planting season (information has to be filled
per plot and variety for the previous planting season. Each plot and each variety at the same plot have
a separate row)
Crop codes*: 1=sorghum, 2= Millets, 3=Maize, 4=Haricot beans, 5= Teff 6= onion 7= Tomato 8= chickpea 9= pepper
Number of years= 0, 1, 2, 3….10
3.12 Number of livestock kept on-farm
Type of animal Number Total Value Oxen Cows Heifer Calf Sheep Goats Donkey Mules Chicken TOTAL VALUE
Plot code number
starting from nearest plot to house)
Plot size (kert/timad ha)
Plot ownership Code A
Soil fertility Code B
Soil type Code C
Soil slope Code D
Soil water conservation (0=no; 1=yes)
Water logging on plot (0=no; 1=yes)
1. 2. 3. Code A 1 Owned 2 Rented in 3 Shared in 4 Shared out 5 Other, specify….
Code B 1 Poor 2 Medium 3 Good
Code C 1 Black (loam) 2 Brown (sandy) 3 Red (Katundo) 4 Grey (clay) 5 Other, specify
Code D 1 Gently slope (flat) 2 Medium slope 3 Steep slope 4 ___________
Plot code (from Table 3.10)
Crop grown Crop
codes*
Area cultivated
with respective
crop
Total amount harvested Intercropping
(0=no; 1=yes)
If intercropping:
With which crop?
Crop codes*
Irrigated (0=no; 1=yes)
Number of years the area is
continuously cultivated (1994
and on continuously)** Qty
Unit (1= timad; 2=ha)
Qty. Unit
(1=kg; 2=quintile)

112
3.13. What is the source of animal feed?
1. Own farm_______ 2. Purchase _________
3. Communal grazing area _______ 4. Specify if others.............................
3.14 Do you have access to irrigation? 0) no 1) Yes
3.15 if yes to 3.14 amount of irrigated land last cropping season in _______timad.
3.16 Do you have plowing oxen? 0) no 1) Yes
3.17. If no, how do you plow your farmland?
1. Using rented oxen, 2.Through labor exchange
3. By- asking cooperation 4. Other specify…………..
4.0 Use of Improved Sorghum Varieties 4.1 Crop history 4.1.1 from the cultivated land holding:
1. Crop land__________in timad 2. Sorghum__________in timad
3. striga infested land ______ in timad
4.1.2 Have you ever used improved sorghum variety? 0) No 1) Yes
4.1.3 If you ever used improved sorghum verities, when did you start using? ________ year.
4.1.4 If no to 4.1.2, reason for not using improved variety?
1. ______________2. _________3. _________
4.1.5 Did you use improved sorghum variety during 2004/05 E.C cropping season?
0) No ) Yes
4.1.6. If yes, improved varieties ____in timad in 2004/05 If no, Local varieties _____in timad
4.1.7 If yes, what was the size of area under improved and local varieties last season?
Varieties Area planted in timad Improved Miskir Girana-1 Hormat Gobiye Teshale Local

113
4.2 Do you think that the improved sorghum variety is better than local variety in terms of the following characteristics/ traits?
1. Yield 0) No 1) Yes 2. Color 0) No 1) Yes 3. Taste 0) No 1) Yes 4. Drought resistance 0) No 1) Yes 5. Maturity period 0) No 1) Yes 6. Establishment ability 0) No 1) Yes 7. Storability 0) No 1) Yes 8. Resistance to diseases/pests/weeds 0) No 1) Yes 4.3 What is the most preferred sorghum trait for your household? 1. Yield capacity 2. Environmental adaptability 3. Food taste quality 4. Marketability 5.Fodder quality and quantity 4.4 Give priority order of the traits you consider 1. _________________________ 2. __________________________ 3. _________________________ 4. __________________________ 4.5 Does the use of improved varieties require additional labor than the usual operation? 0) No 1) Yes
4.6. From where did you get improved sorghum seeds? 1. BOA _________ 2. Research centre ______ 3. Own _________ 4. Market ________ 5. Neighbors______ 6. NGO _______7. Others, specify _______ 4.7. Do you think that there is risk associated to the use of improved sorghum varieties? 0) No 1) Yes 4.7. If yes, what are the risks associated to the use of new sorghum varieties? 1. __________________________2.__________________3. ____________________ 4.8 Which other crops besides sorghum do you grow? Please list the two most important. 1)…………………………… 2)…………………………………… 4.9 Please first rank the importance for growing crops and second the importance of each of the three crops in regard to the given reasons.
Reason Rank reasons for growing crops Code A
Sorghum Code B
Other crop (fill crop)……… …… Code B
Other crop (fill crop)…………… Code B
1. Needed for food/home consumption
Horizontal X
Vertical
2. Needed for fodder/ animal consumption
Horizontal X
Vertical
3. Cash income Horizontal X Vertical
4. Others (specify)…
Horizontal X Vertical
Code A
1 Most important
2 Second most important
3 Least important
Code B
1 Most important for this reason
2 Second important for this reason
3 Least important for this reason

114
4.10 What was the change in the area under sorghum on your farm in the last five years?
0 constant 1 increasing 2 decreasing
4.10.1 Please give the two most important reasons for your answer in 4.14 (if area is constant skip to
4.15) 1) ______________________________ 2) ___________________________
4.10.2 If area is increasing: What are the crops replaced by this crop?
(1) -------------------- (2) --------------------- (3) --------------------------
4.10.3 If area is decreasing what are the crops replacing this crop?
(1) -------------------- (2) --------------------- (3) --------------------------
4.12 Once in how many years do you grow sorghum on the same land (crop rotation)?
0 Every year 1 Every second year 2 Every third year 3 Other, specify…………
5. SARC-HOPE Induced Technologies related to sorghum Production
5.1. Use of improved sorghum varieties
5.1.1 Have you heard about new early maturing sorghum varieties ( Miskir , Hormat and Girana) ? 0) No 1) Yes
5.1.2 If yes, list the name of the varieties you have heard of__________________________________
5.1.3 If yes, when did you first heard about the varieties?______ 5.1.4 Did you plant the variety last year? 0) No 1) Yes 5.1.5 If no, why? 1= Seed not available 4= Never heard of improved variety
2= Too expensive 5= Others (Specify)____________ 3= Not convinced
of benefits
5.1.6 If the answer for Q.5.1.4 is yes, land allocated for the varieties last seasons (2004/2005
E.C)
Variety Variety Code
Total land under sorghum
Area of local variety
Area under new variety/ies
Yield from new var. (qt/ha)
Yield from local (qt/ha)
Variety Code: 1) Meskir 2) Girana-1 3) Hormat
5.1.7 Have you ever used striga resistant sorghum varieties? 0) No 1) Yes
5.1.8 If yes From where do you usually get improved seed of striga resistant variety?

115
1= MOA 2=Own 3= Market 4= Neighbours 5= Research centres 6=OthersSpecify
5.2 Fertilizers Adoption 5.2.1 Do you use fertilizer for improved sorghum varieties? 0) No 1) Yes 5.2.2 If yes, when did you start the use of commercial fertilizer? (E.C.) _______ 5.2.3 If no, why?
1= Not available 3= Cash shortage 5=Not available on time
2= Too expensive 4= I am not sure of benefit 6 =Others (Specify) _________
5.2.4 If used commercial fertilizers with sorghum for the last cropping season, fill the details
Fertilizer type
Rate of fertilizer use
Area fertilized (ha)
Time Type/split/side Total
5.3 Tied-ridge Adoption
5.3.1. Have you ever used moisture conservation techniques for sorghum varieties? 0) No 1) Yes
5.3.2. If yes which type? 1= Traditional 2= improved 3. both
5.3.3. If traditional, list them.------------------------------------------------------------------------
5.3.4. Have you used tied-ridger? 0) No 1) Yes
5.3.5. If no why? Specify____________
5.3.6. If yes, when did you first use it?______
5.3.7. Did you use it during the last cropping season? 0) No 1) Yes
5.3.8. If no why? 1. Unavailable 2. Expensive 3.Others/specify
5.3.9. If yes, what area of land did you plant using tied ridger?
cropping
Year
Area under sorghum
production( In ha)
Area planted with tied ridger Remark
5.4.9 When do you plant sorghum? _______________________(month)
5.4.10 what planting method do you use last cropping season? 1. Row planting 2. Broadcast

116
5.4.11. Do you use regular spacing for planting sorghum last cropping season? 0) No 1) Yes
5.4.12. If yes what is the spacing? ____________between Row ________CM Between plants
5.4.13. Frequency of weeding sorghum last cropping season _________
5.4.14. Did you use pest control measures last season? 0) No 1) Yes
5.4.15. Pest control measures last cropping season
1. ____________________________ 2. ____________________________
3. ____________________________
6. EXTENSION SERVICE
6.1 Have you ever consulted Extension Agent (EA)? 0) No 1) Yes
6.1.1 If yes number of extension contact per year ____________
6.1.2 Did you participate in on-farm research/demonstration/field day? 0) No 1) Yes
6.1.3 Who organizes the field day? 1) Extension Agent 2) Sirnka Agricultural rese.cent 3)
NGOs 4) others specify______
6.1.4 How many years of Experience do you have in agricultural extension? ……Years
6.2 If no to question number 6.1, why?
1. No EA nearby 4. I am not happy with the EA
2. Possessed the required information 5. No need for service
3. EA office is far from my residence 6. Others
6.3 If yes, did you get advice about improved sorghum production? 0) No 1) Yes
7. Marketing and Credit
7.1 What are the major constraints in purchasing seed, please rank the first two important (do
not read out the reasons assign the farmers’ answers to the given categories) (a) Lack of information about recommended variety --------- (b). Non-availability of seed of required variety --------- (c). High seed price --------- (d). Need to travel long distances --------- (e) Credit facility not available --------- (f) Low seed quality -------------------------- (g) Others (specify) -------------------------
7.2 Do you sell sorghum this last cropping season? 0) No 1) Yes
7.3 If yes where is your output marketed?

117
1. at farm gate _______2. Local market______ 3. District market _____ 4. Other, specify
7.5. If yes, to whom do you sell your sorghum in the 2004 E.C.?
1. Traders ( Retailers, Whole sellers)
2. Consumers 3. Others(specify)___________
7.6. If no, why not? 1. No surplus 2. Market far /transportation cost large 3. Others specify
7.7. How do you transport your output to market?
1. carrying by own _____ 2. Using donkeys ______ 3. Using trucks ____
4. Other, specify __________
7.8. Which are months of higher prices of sorghum?
______________________________________________________________
7.9. Which were months of lower prices of sorghum?
_____________________________________________________
7.10. What type of storage method do you use for sorghum?_________________
7.11. For how long do you store sorghum? __________________________
7.12 Do you have Access to credit 0) No 1) Yes
7.12 If yes, did you receive credit during 2004/05 cropping season?
1. Yes _______ 2. No ________
7.13. If yes, which category? 1. Cash ________ 2. Kind _______
7.14. What was the purpose of credit?
________________________________________________________
7.15 If yes to q. 7.12 what are the preconditions for getting credit?
1. ___________________________
2. ___________________________
3. ___________________________

118
8. Income and Expenditure
8.1. Cash income from crop sales during 2004/05
Crop Unit Quantity sold Price per unit Total Sorghum Tef Maize Onion Tomato Peper Chickpea Millet Potato Sesame Total
8.2. List of permanent asset and their value 2004/05
Item Amount Total Value Income from sold asset Oxen Cows Heifer Calf Sheep Goats Donkey Chicken Trees Others (specify) Total Value
8.3. Off-farm income in the last year
Activity Income Daily labour Petty trade Handicraft Remittance Gift Others, specify Total

119
8.4. Expenditure
Cordially thank the respondent!
Item Amount of money per year
Food Clothing School fee Tax Social obligations Health care Other, specify Total