adsa2014/ameigs 29-09-14 electron temperature from high-n balmer series at jet: a question of...
TRANSCRIPT

ADSA2014/Ameigs 29-09-14
Electron temperature from high-n Balmer series at JET: A question of “n”
A. Meigs, M. O’Mullane, and E. Delabie(discussions of future modelling EDGE2D/Eirene with Paula Belo and Mathias Groth)
From Stark widths one can get estimate of
electron density (ADAS2013, PSI2012, …)
Presumably, given this knowledge of ne, then
the line intensities or line ratio’s should give an
estimate of Te (and possibly nn/ni)

ADSA2014/Ameigs 29-09-14
Questions
Questions:
•What are the best set(s) of n-levels to measure?
•Is the “high-resolution” spectra (left) capable of
giving Te estimate? (or even shifted to cover
9-2 to 14-2)
•Can we do better for Te by using a survey spectra?
•Are other effects (MAR) possibly important? How can
we tell?

ADAS2014/Ameigs 29-09-14
KT3D Overview: Lines of sight
ho
Passive Divertor Spectroscopy• Mirror-link largest wavelength range of any
JET diagnostic (200-1200nm)• D influx and recycling profiles• Recombination monitoring• ne and Te in recombining divertor• Impurity influx and profiles (Be, C, W, O, N, Ar…)

ADSA2014/Ameigs 29-09-14
Single Shell Model of Balmer Line Intensities
Intensity of a Balmer transition u-2:
Only 3-body recombination and electron impact excitation are considered (for now)
Where:u = upper n-level for the transitionne = electron densityni = ion densitynn = neutral densityPu
R (ne,Te) = the recombination Photon Emission Coefficient from ADASfor a transition u-2Pu
E (ne,Te) = the excitation Photon Emission Coefficient from ADASDL = the integration path length (assuming single shell model)
Wrapper to ADF15 using file '/home/cxs/adas/adf15/pec12#h/pec12#h_balmer#h0.dat' so that recombination only and excitation only components could be retrieved.
Too many unknown’sNeeds full modelling codes to get at all parametersCan we reduce this set using line ratios

ADSA2014/Ameigs 29-09-14
Can we do better with line ratio’s (and which ones)?
Where the second formula we have created a new variable a = nn/ni
Assuming the single shell model is ok, then the line ratio removes:DL, linear ne (only ne now in PEC’s)

ADSA2014/Ameigs 29-09-14
Balmer Line Ratios:
Further factoring makes apparent a “correction” term to the pure recombination ratio:
So the relative size of this correction term depends on both the relative ratio
of excitation to recombination for the u-state and the r-state.
For a given a, a u-state dominated by recombination and a r-state driven more
by excitation would provide the largest correction factor.

ADSA2014/Ameigs 29-09-14
ADAS Balmer Line Ratios: 12/6
5.7x

ADSA2014/Ameigs 29-09-14
ADAS Balmer Line Ratios: 9/6
2.9x

ADSA2014/Ameigs 29-09-14
Examples of Balmer Line Ratios: 12/9
1.6x

ADSA2014/Ameigs 29-09-14
Balmer Line Ratios: Measured in “Survey Spectra”
6-27-28-2
9-2
JET pulse:80821Ohmic Vertical outerstrike pointGas ramp todensity limitdisruption.
13-2

ADSA2014/Ameigs 29-09-14
80821 Electron density from line shape
ADSA2014/Ameigs 29-09-14
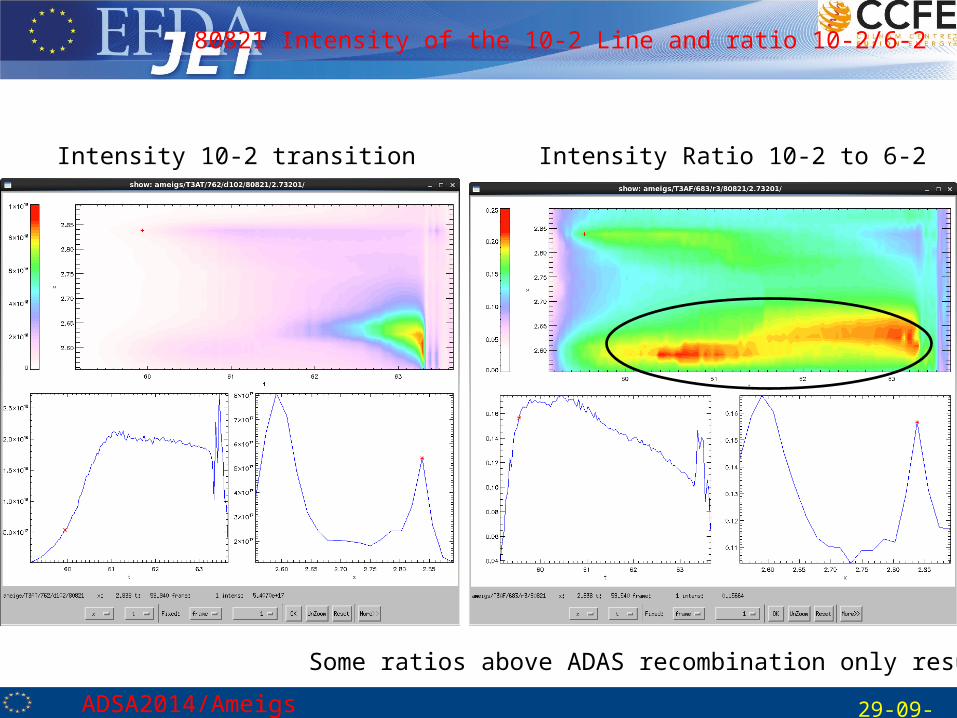
80821 Intensity of the 10-2 Line and ratio 10-2/6-2
Intensity 10-2 transition Intensity Ratio 10-2 to 6-2
Some ratios above ADAS recombination only results

ADSA2014/Ameigs 29-09-14
80821 Intensity of the 8-2 Line and ratio 8-2/6-2
Intensity 8-2 transitionIntensity Ratio 8-2 to 6-2
More ratio’s above ADAS prediction
Possible reasons for too large ratios:1)For highest n’s (14-2, 13-2, maybe 12-2) near the continuum merging/limit: incomplete baseline subtraction2)For both high-n and lower-n: other population mechanisms MAR?
ADSA2014/Ameigs 29-09-14
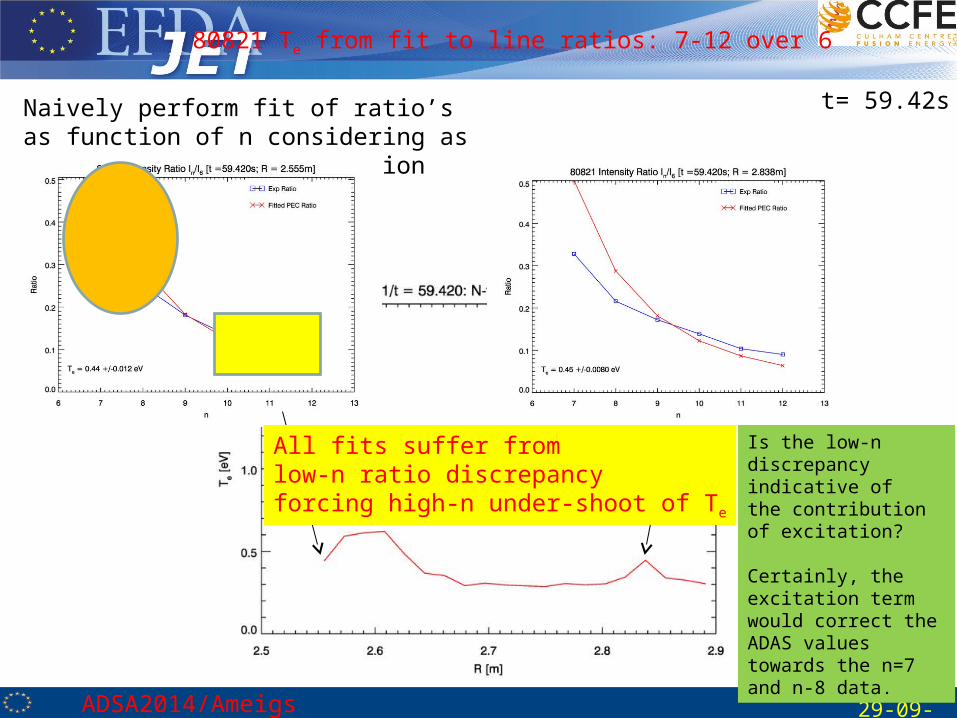
80821 Te from fit to line ratios: 7-12 over 6
Naively perform fit of ratio’s as function of n considering as reference the 6-2 transition
All fits suffer fromlow-n ratio discrepancyforcing high-n under-shoot of Te
t= 59.42s
Is the low-ndiscrepancy indicative of the contribution of excitation?
Certainly, the excitation term would correct the ADAS values towards the n=7 and n-8 data.

ADSA2014/Ameigs 29-09-14
80821 Te from fit to line ratios: 7-12 over 6
t= 60.22s

ADSA2014/Ameigs 29-09-14
80821 Te from fit to line ratios: restrict Nupper 9-12
t= 60.22s
Still a small problem with n=9

ADSA2014/Ameigs 29-09-14
ADAS Balmer Ratio: 7/6

ADSA2014/Ameigs 29-09-14
80821 Look at individual ratios
Infer Te thru interpolation: given a ratio, interpolate ADAS ratio to obtain Te (still using ne from line shape)Ensure no extrapolation beyond the Te grid passed to ADAS (Tmax = 10.0eV)
if result > max Te of grid, then Te = -1.0Not (yet) ensuring that the ratio is in “useful range” or even above ADAS limit
(extrapolation limit will get probably all of the above limit values)
**After doing this I think the limit should have been ~3.0eV (but need to lookat the individual ratio curves to find max)

ADSA2014/Ameigs 29-09-14
80821 Look at individual ratios
10/6 Electron density
Zoomed away from x-point
Te 10/6

ADSA2014/Ameigs 29-09-14
80821 Look at 9-12 fit vs individual ratios
Comparison of Te from individual ratios 10/6,11/6, 9/6, 12/6 and the fitted 9-12
N-fit error bars are 2-s

ADSA2014/Ameigs 29-09-14
High resolution setting: 81469 L-mode Density Limit
1.46x

Ratio 11/10
ADSA2014/Ameigs 29-09-14
High res. setting: 81469 L-mode DL, Horizontal target
11-2 Intensityne
12-2 Intensity
Ratio 12/10
Restricted (for now) to 11-2 and 12-2 as 13-2 and 14-2 may not be “reliable” (later, this is questioned)

ADSA2014/Ameigs 29-09-14
High resolution setting: 81469 L-mode Density Limit
Te from 11/10
Te from 12/10
Gibberish…..
Why?Dn too small so dynamic range of ratio too restricted?Does horizontal target delocalize the measurement too much?Are MAR effects more important in this higher density plasma compared to the Ohmic case?

Te max= 4eVfor inferred results
ADSA2014/Ameigs 29-09-14
81469 n-fit 11/10 and 12/10 only vs infered 11/10,12/10
Large errors indicate one or other ratio at or near limits

ADSA2014/Ameigs 29-09-14
High resolution setting: 81469 L-mode Density Limit
Ratio 12/10
The sky blue areas are above the ADAS limit

ADSA2014/Ameigs 29-09-14
81469: extend to 13-2 and 14-2 over 10-2…
For fun, I thought to include 13-2 and 14-2 ratios…..Note: •13-2 may experience more of the continuum merging baseline which is not accounted for in current fits.•14-2 will have more of this baseline, plus it is under the Be III triplet! (how much to trust the intensity)
Peak near strike point!

ADSA2014/Ameigs 29-09-14
81469 profiles versus time
Nice correlation with ne versus time (but is it “just” a correlation)Are the fits believable yet? NO, I think not.

ADSA2014/Ameigs 29-09-14
Conclusions? And further work
Conclusions:•Survey spectra may allow some determination of electron temperature and possiblyidentify when excitation comes in; plus maybe nn/ni estimation
Further work:1.Check if 80821, a clean Ohmic plasma, has problems with 11/10 and 12/10 ratio’s in the survey spectra2.Look at the 9-14 spectra (started but mixed results and way too many slides as it is)3.Most measurements since ~Feb use the 9-14 spectral setting and where repeats arepossible the 6-14 survey spectra is taken Some H-mode plasmas fitted for ne but none looked at for line ratio’s4.EDGE2D/Eirene (plasma modelling codes) have implemented simulation of the KT3diagnostics lines of sight and have imported ADAS results to calculate the LOS-integrals for the high-n Balmer series (need to make sure the ADAS dataset is correct one) Look at LOS-integrals and ratios from modelling codes comparedto experimental results.5.Nail down some constraints on the n-fit so that acceptable ranges are not exceededand so that periods where the data ratio’s exceed the ADAS ratio’s are identified more easily6.Look into the state of the art on MAR and see how to include it in the CR modellingof the Balmer populations.7.For survey try to fit getting nn/ni from the 7/6 and 8/6

ADSA2014/Ameigs 29-09-14
Look at L-mode Vertical target: new range 9-14
85106 outer vertical target L-mode density limit

ADSA2014/Ameigs 29-09-14
Recombination only“Intensity” vs n for several Te
Assuming recombinationonly
Setting ni= ne

ADSA2014/Ameigs 29-09-14
9-14 for two densities

ADSA2014/Ameigs 29-09-14
Wrapper to ADF15 for high-n Balmer lines
FUNCTION agm_readadf15_balmer, nupper, $ dens = dens, $ ;; input, if not present then ADAS grid returned te = te, $ ;; input, if not present then ADAS grid returned exciteonly = exciteonly, $ recombonly = recombonly, $ all = all, $ ;; if want 2D grid on Te and Ne values-- this is a
;;keyword to read_adf15. If not set then 1D results ;;numbering the smaller of Te and dens arrays verbose = verbose
filename = '/home/cxs/adas/adf15/pec12#h/pec12#h_balmer#h0.dat'