advanced charting - windows · pdf file–usually near a moving average –set stops...
TRANSCRIPT

Advanced
Charting

Neither Better Trades or any of its personnel are registered broker-dealers or investment advisers. I will mention that I consider certain securities or positions to be good candidates for the types of strategies we are discussing or illustrating. Because I consider the securities or positions appropriate to the discussion or for illustration purposes does not mean that I am telling you to trade the strategies or securities. Keep in mind that we are not providing you with recommendations or personalized advice about your trading activities. The information we are providing is not tailored to any particular individual. Any mention of a particular security is not a recommendation to buy, sell, or hold that or any other security or a suggestion that it is suitable for any specific person. Keep in mind that all trading involves a risk of loss, and this will always be the situation, regardless of whether we are discussing strategies that are intended to limit risk. Also Better Trades’ personnel are not subject to trading restrictions. I and others at Better Trades could have a position in a security or initiate a position in a security at any time.

Technicals & Time Frame
Technical analysis is transferable & scalable.
This means that the patterns we teach you may be applied to all markets and all time frames.
What you see today on a daily chart may be applied to a 15-minute, a 10-minute, a 5-minute, a 3-minute and a 1-minute chart, but the timing will be faster.
What you see today on an intraday chart may be applied to a daily, but the timing will be slower.

Entries & Exits
• Obviously better entries and exits can help your profitability
• But, trades that go on for days are more forgiving than those that go on for minutes
• Thus, the shorter the trading time frame the more critical good entries and exits become

Seasonality
• Generally the markets are more bullish early in the year.
• There is almost always a period of bearishness and/or choppiness as things slow down in the spring or summer.
• If the bearishness is enough it may attract buyers and create another uptrend in the fall or toward the end of the year.

Summer Is Here!
• And we don’t just see this with the weather but also in the charts.
• Have you noticed, the markets have slowed down and things are getting choppier?
• This is when you can’t rely on a trend to make up for sloppy entries and or exits.
• Better timing is more critical than ever!

Early Entries & Exits
• Failed trend
• Candles
– Size of candles
– Engulfing candles
• Bollinger Bands
– Bollinger top
– Bollinger bottom
– Candles outside the bands

An Uptrend Is When:
The stock makes higher highs and higher lows. The failure of a stock to do so signals weakness.
How do we use this information?
Look for an exit!
Evaluate trading in the opposite direction.

Lower High
BIIB sold off $10 from
bearish engulfing candle.

A Downtrend Is When:
The stock makes lower lows and lower highs. The failure of a stock to do so signals strength.
How do we use this information?
Look for an exit!
Evaluate trading in the opposite direction.

Higher Low
SDS retraced $3.

Candles
• In addition to continuation and reversal candle patterns, watch the size of the candle body
• The bigger the candle the stronger the momentum
• The smaller the candle the weaker the momentum (that may lead to tradable reversals or retracements)

Slowing
Tighten stops as candles begin
getting smaller.
Use either previous close or previous
candle body (engulfing).

Tighten stops as candles begin
getting smaller.
Use either previous close or previous
candle body (engulfing).
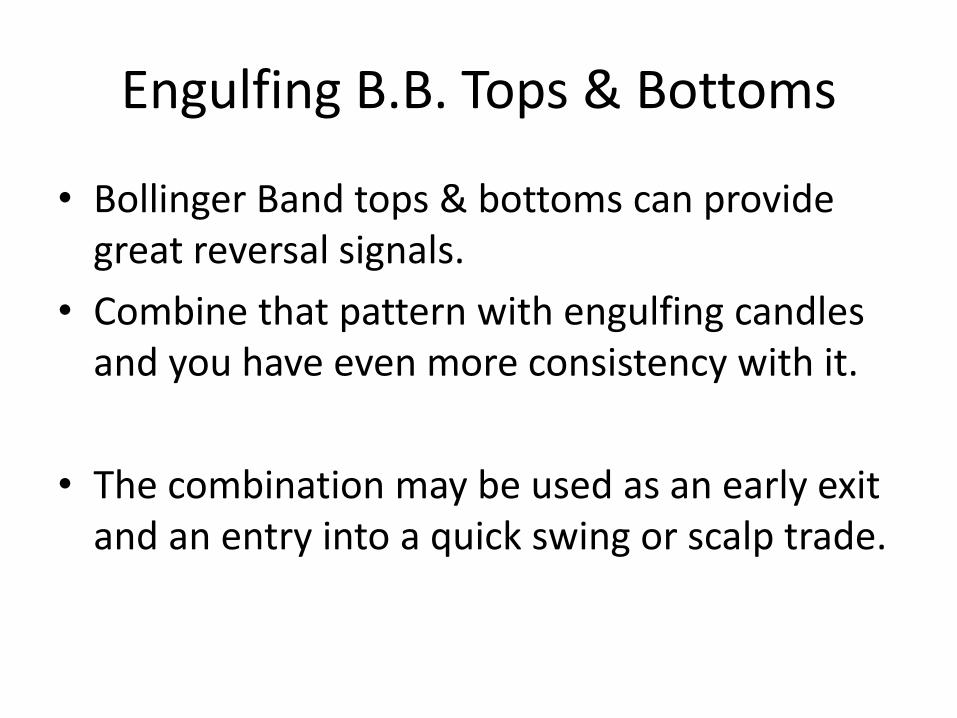
Engulfing B.B. Tops & Bottoms
• Bollinger Band tops & bottoms can provide great reversal signals.
• Combine that pattern with engulfing candles and you have even more consistency with it.
• The combination may be used as an early exit and an entry into a quick swing or scalp trade.

Bullish & Bearish Reversals
BB Bottom
Engulfing Candle
BB Bottom
Engulfing Candle Doesn’t engulf, but trades below
last bullish candle.

Bollinger Band Bottom
Stock trades above last
bearish candle.
Bullish trades may be considered
if stock is far enough away from m.a.
for potential profit.

Bollinger Band Bottom
Stock trades above last
bearish candle.

BB Top & Engulfing
Re-entry on bounce off 10 ema
Resistance on daily chart
Put entry, if stocks breaks below
m.a. and trends lower may use m.a.
as stop.

Resistance on daily chart
@ 10 ema

Different Time Frames
• How do you combine different time frames?
• Do you ever get mixed signals?
• How do you handle it?

Focus most on the time frame that reflects your current strategy
•Day Trades
– Most emphasis on intraday charts (5 min)
– Use daily charts for major support / resistance
•Swing Trades (1-5 days) – Most emphasis on Magic & 5 min charts
•Trending Trades ( 5 days or more) – Most emphasis on daily charts
– Use intraday charts to help with exits if daily chart & indicators show weakness (ADX, BB’s, MACD, RSI)

Trading Outside Bands
• Bollinger Bands encompass most of the trading action
• A stock trading outside the bands sets up a rare early exit opportunity

Long wick at top
Price Moves Back Inside Bands

Smaller Candles
Bearish Engulfing
Price Moves Back Inside Bands

Price moves back inside bands
but doesn’t trade below
previous candle close

Add a 5 ema and use a break
of average as exit.

Failed: Bollinger Band Squeeze Play
You may know about the Bollinger Band Squeeze Play, but do you know how to profit from a
failed one?

Failed BB Breakout
No bullish entry if using 5 min. rule.
Enter bearish trade on break below
BB or on second down candle.

How do you know if this is
a retracement or a reversal?
Failed BB breakout

What If You Miss A Trade?
If you missed the last entry on a trending stock: •Move in with a stop pennies below the entry
– Higher risk of stock retracing quickly – But will help with an entry on stocks that aren’t
pulling back
•Or, be patient and wait for the next retracement pattern
– Usually near a moving average – Set stops near average

Exiting Losers
1. Place market order to exit when justified by the chart
2. Bracket the exit with an OCO order:
1. Set market stop below current price
2. Set limit price on other side to exit at higher price

Exiting Winners
• Set stops below moving average that is holding as support or resistance
– This may be done on an intraday and daily chart, depending on time frame
• Use trailing stops
– This may be helpful on an intraday basis if you are not around to watch the stock
• Raise stops if stock gaps in your favor

Always Use Gaps to Take Profits
Exit calls on break below
first five min candle.

PART 2

This is not “Basic”
• We are going to look beyond basic chart patterns.
• Look at what some of the institutions use.
• Will take you to new level of awareness.

The Chart
• A picture of the market psychology.
• Tells us what the market is “thinking.”
• Pure supply and demand in picture form.

The Chart
• Charts should be evaluated in multiple time frames.
• Pure price activity is foremost.
• Advanced Indicators can potentially enhance probabilities.

The Intraday Pivot

Intraday Pivots
• Can be used to identify potential intraday support and resistance.
• Should be used in conjunction with chart patterns.
• Must take intraday trends into consideration.
• Must take multiple time frames into consideration.

Pivot Point Formula
• The basic pivot point formula is:
• Pivot Point = (High + Low + Close) / 3
• High, low and close are the previous day

Support Formulae
• Support Level Formulae are:
• S1 = (2*PP) - H
• S2 = PP - (H - L)
• S3 = L - 2*(H - PP)

Resistance Formulae
• Resistance Level Formulae are:
• R1 = (2*PP) - L
• R2 = PP + (H - L)
• R3 = H + 2*(PP -L)


Intro to Elliot Wave

History
• Developed by Ralph Nelson Elliot during the Great Depression
• He used his process to call the market low on Wednesday March 13, 1935
• Tied human behavior to Fibonacci ratios

Waves
• Impulse wave
– In direction of the larger wave
– Five wave pattern
• Corrective wave
– Counter trend move
– Three wave pattern

Impulse Wave
1 2
3 4
5

Corrective Wave
a b
c

Rules
• Rule 1
– Wave 2 cannot retrace more than 100% of Wave 1
• Rule 2
– Wave three cannot be the shortest impulse wave
• Rule 3
– Wave 4 cannot overlap Wave 4

Rules
1 2
3 4
5
Wave 2 cannot retrace below wave 1
Wave 3 cannot be the shortest
Wave 4 cannot overlap wave 1


Intro to the Ichimoku Cloud

Ichimoku Cloud • Often used by Forex and Futures Traders
• Can be used in multiple time frames
• Consists of:
– Tenkansen line (faster line)
– Kijunsen line (slower line)
– Chikou span line (we will remove this one for now)
– Support/resistance zone or “cloud”


Ichimoku Cloud Long Signals
• Watch for bullish cross of fast and slow line.
• If the cross is below the cloud it is considered a weak signal.
• If the cross of the lines is “in the cloud” it is considered of medium strength.
• A cross above the cloud it is considered stronger.
• Watch for price action to break above the cloud.


Ichimoku Cloud Long Signals
• The price activity must break above the cloud to confirm the entry.
• The stock remains technically bullish above the cloud.


Ichimoku Cloud Long Exit Signals
• An early exit occurs when the price activity closes below fast line.
• A secondary exit occurs on the cross of the fast and slow lines.
• The final exit occurs if the price activity closes in or below the cloud.


Ichimoku Cloud Short Signals
• Watch for bearish cross of fast and slow line.
• If the cross is above the cloud it is considered a weak signal.
• If the cross of the lines is “in the cloud” it is considered of medium strength.
• A cross below the cloud is considered stronger.
• Watch for price action to break below the cloud to confirm.


MARKAY’S NEXT CLASS
Trade the Close with the Pros Thursday, June 13th
1 p.m. – 3:30 p.m. Eastern
$249
Tonight only: $199 Online Enrollment
Class will be recorded with unlimited viewings for 30 days!

BILL’S NEXT CLASS
Small Account, Big Results Monday, July 1st
8-10 p.m. Eastern
$149
Tonight only: $99 Online Enrollment
Class will be recorded with unlimited viewings for 30 days!

Neither Better Trades or any of its personnel are registered broker-dealers or investment advisers. I will mention that I consider certain securities or positions to be good candidates for the types of strategies we are discussing or illustrating. Because I consider the securities or positions appropriate to the discussion or for illustration purposes does not mean that I am telling you to trade the strategies or securities. Keep in mind that we are not providing you with recommendations or personalized advice about your trading activities. The information we are providing is not tailored to any particular individual. Any mention of a particular security is not a recommendation to buy, sell, or hold that or any other security or a suggestion that it is suitable for any specific person. Keep in mind that all trading involves a risk of loss, and this will always be the situation, regardless of whether we are discussing strategies that are intended to limit risk. Also Better Trades’ personnel are not subject to trading restrictions. I and others at Better Trades could have a position in a security or initiate a position in a security at any time.