advanced quantitative electron-probe...
TRANSCRIPT
–1
UO EPMA Workshop 2010
Advanced Quantitative
Electron-Probe Microanalysis
Paul CarpenterEarth and Planetary Sciences CB 11691 Brookings DriveWashington UniversitySt Louis, MO 63130
UO EPMA Workshop 2010
Washington University, Saint Louis
Earth and Planetary Sciences JEOL JXA-8200
UO EPMA Workshop 2010
The Big Picture for EPMA
Calibration, Measurement, Quantitation, Report
Instrumental issues for EPMA:Column-spectrometer alignmentDetector linearity and stability (flow, sealed)WDS deadtime calibrationSpectrometer resolution, reproducibilityNew developments: SDD EDS mapping and quantitative analysis
EPMA Standards:Proper selection of standards (sample vs. standard)Internal consistency of stds in your lab vs. international environment
Problem Systems:Peak overlaps, high-order WDS interferencesAnalytical problems, high absorption correctionCorrection algorithms and mass absorption coefficient data sets
Solutions:Interlaboratory collaboration, educationMultiple KV and multiple spectrometer analysis of core std setPayoff – proof of internal std comps and empirical macs
Procedures for Quantitative EPMA, WDS Emphasis
Part I – Instrument Calibration and Measurement
Electron microprobe calibration issues
WDS and EDS spectrometer alignment, column alignment, (stage too)
WDS deadtime characterization
WDS pulse processing, gain/bias, PHA, P-10
EPMA Standards characterization and accuracy of analysis
Internal consistency of standard compositions and measurements
WDS wavelength scans and background measurement locations
Full peak width, scans on stds and samples
Note: Valley between Kα-Kβ, Lα-Lβ, Mα-Mβ is not true background!
Identification of peak and background interferences
Analytical conditions, beam sensitive materials
New instrument, 25 year old std block with oxidized surface, why ???
Avoid blunders
Reliance on software defaults, automated procedures and unattended ops
Setup without WDS scans, ignorance of pulse processing
Precision vs. accuracy issues UO EPMA Workshop 2010
–2
UO EPMA Workshop 2010
Calibration Issues for Electron-Probe Microanalysis
Microprobe performance specifications are:
Driven by capabilities and address problem solving for customers
Capabilities are funded by purchases, user/vendor development
Realistic specifications for WDS vs. EDS systems
Instrument calibration during installation and testing
Spectrometer alignment – to electron column and mutual agreement
Detector linearity with count rate and deadtime issues
Precision = reproducibility (mechanical, electronic)
Accuracy = correct K-ratio measured
Instrument calibration – short vs. long term
Consistent performance with time
Accuracy in international interlaboratory environment
Geological EPMA
CMAS silicate standards used for acceptance testing (CIT, WU)
Software Tools for the Microprobe Analyst
Interaction with experienced scientists and technicians, and thinking.
Calczaf – correction algorithms, mac sets, parameters
Generated a-factors for compact correction algorithm, testing
DTSA II, Casino, GMRfilm, (Penelope) – scattering volume, spatial
sampling, simulation of x-ray spectra
Startwin (PFE) – bias/gain scans, pha characterization, spectrometer
alignment, spectrometer reproducibility, beam stability, etc.
Probe for EPMA – all quantitative EPMA
Sample setups and subsets of master element list, customized
Formula calculation, specified elements, etc.
Multiple standards comparison, standards evaluation
Beam sensitive materials analysis via TDI
Multiple spectrometer measurement of (trace) elements
QC with record-keeping of all peaking, PHA scans
ProbeImage – x-ray and quantitative compositional mapping
UO EPMA Workshop 2010
Wavelength Scans and Interferences
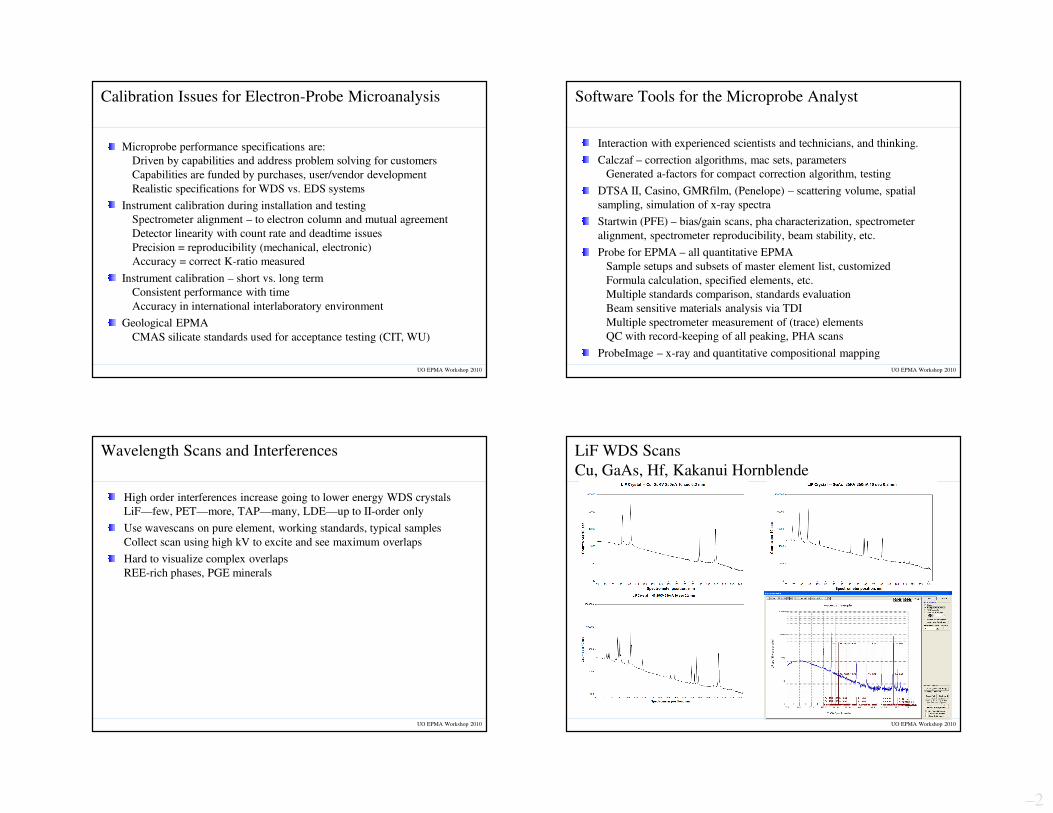
High order interferences increase going to lower energy WDS crystals
LiF—few, PET—more, TAP—many, LDE—up to II-order only
Use wavescans on pure element, working standards, typical samples
Collect scan using high kV to excite and see maximum overlaps
Hard to visualize complex overlaps
REE-rich phases, PGE minerals
UO EPMA Workshop 2010
LiF WDS Scans
Cu, GaAs, Hf, Kakanui Hornblende
UO EPMA Workshop 2010

–3
PET WDS Scans
Cr, Rh, PbS, Kakanui Hornblende
UO EPMA Workshop 2010
TAP WDS Scans
Cr, Fe, PbS, Kakanui Hornblende
UO EPMA Workshop 2010
UO EPMA Workshop 2010
WDS Scan TAP: Al, Cr, Ni, and NiCrAl Sample
Note Cr Kβ IV-order interference on Al Kα, Full Al peak width
10
100
1000
10000
100000
82
83
84
85
86
87
88
89
90
91
92
93
94
95
96
97
98
99
100
101
102
Spectrometer position, mm TAP
Co
un
ts p
er s
ec
Al std
NiCrAl
Cr std
Ni std
Al Kα 1,2
Al Kβ
Satellites
Al Kα
Satellites
Al Kβ 1
Cr Kα 1,2
IV-order
Cr Kβ 3
IV-order
UO EPMA Workshop 2010
Corning 95IRV, 95IRW, and 95IRX
LIF 170 - 210 mm
0
250
500
750
1000
1250
1500
1750
2000
2250
2500
170 175 180 185 190 195 200 205 210
Spectrometer Position, mm
Co
un
ts
95IRV
95IRW
95IRX
WDS Scan: LiF Crystal
95IRV Green, 95IRW Blue, 95IRX Red

–4
UO EPMA Workshop 2010
Corning 95IRV, 95IRW, and 95IRX
PET 70 - 90 mm
0
200
400
600
800
1000
1200
1400
1600
1800
2000
70 71 72 73 74 75 76 77 78 79 80 81 82 83 84 85 86 87 88 89 90
Spec pos mm
Co
un
ts p
er
se
c
95IRV
95IRW
95IRX
Cr K
α1,2
V K
α1,2
Ce L
α
La L
α
Ba L
α
Ti K
β
Ti K
α1,2
Cs Lβ1
Cs Lβ4Cs Lβ3
Ba L
β1
Ba L
β4
La L
β1
Ba L
β2
Ce L
β1
Ba L
γ
V K
β
Ce L
β4
Ce L
β3
La L
β4
La L
β3
Ba L
β4
Cs Lβ2
Cs Lγ
Cs Lγ2
WDS Scan: PET Crystal
95IRV Green, 95IRW Blue, 95 IRX Red
UO EPMA Workshop 2010
Corning 95IRV, 95IRW, and 95IRX
P-10 Flow counter -- PET 116-134 mm
0
100
200
300
400
500
600
116 117 118 119 120 121 122 123 124 125 126 127 128 129 130 131 132 133 134
Spec pos mm
Co
un
ts p
er
se
c
95IRV
95IRW
95IRX
K Kα1,2
Th Mα
Th Mβ
U Mα
U Mβ
Th MγAr K
abs edge
WDS Scan: PET Crystal
Th Mβ on U Mα, K Kα Peaks & Ovlp U Mβ
WDS Background Selection: Cd (red) Te (blue)
UO EPMA Workshop 2010 UO EPMA Workshop 2010
Pulse-Height Analysis
Wavelength-dispersive spectrometer

–5
UO EPMA Workshop 2010
WDS PHA Measurement
Low energy pulses must be discriminated from baseline noise. Need proper setting of noise threshold, baseline, and window settings of WDS pulse height analyzer.
The pulse processing circuitry of WDS does not need to deal with pulse shaping like that of EDS, and is inherently faster.
Pulse energy shift with varying count rate results in instability. At high count rates pulses are poorly discriminated from baseline noise. Use similar count rates on standard and sample.
Avoid tight PHA window, use integral mode unless a PHA interference is observed.
The P-10 detector gas flow rate must be stable or else gas amplification factor varies, and so does count rate.
Temperature variation will affect gas amplification factor as well as thermal expansion of analyzer crystal.
Low energy peaks need to be integrated due to peak centroid and peak shape/area factors. Use area-peak factor or perform integration.
UO EPMA Workshop 2010
Bias Scan Si Kα 15kv 25 nA
Detector Bias for 4 volt SCA Peak: 1632
0
500
1000
1500
2000
2500
3000
1500 1525 1550 1575 1600 1625 1650 1675 1700 1725 1750 1775 1800
Bias, Volts
Co
un
ts p
er 1
sec Si Ka, TAP1, 64x
Detector Bias Scan Si Kα
Vary Bias at PHA Narrow Window
Detector bias scan using 3.9 volt baseline and 0.2 volt window on PHA.
Intended to minimize energy gain shift of PHA.
MSFC Spec 1, P-10 flow counter, TAP, 64x gain, Si Kα on SiO2 metal @ 10k cps.
UO EPMA Workshop 2010
SCA Scan Si Kα 15kv 25 nA
Bias 1632 Volts, SCA Peak at 4 Volts
0
500
1000
1500
2000
2500
0 1 2 3 4 5 6 7 8 9 10
Volts
Co
un
ts p
er 1
sec TAP1, 64x, 1632 Bias
Detector PHA Scan Si Kα
For Si Kα there is good separation between baseline and Si pulses.
Nominal baseline is 0.5 V with 9.5 V window (integral mode)
MSFC Spec 1, P-10 flow counter, TAP, 64x gain, Si Kα on SiO2 @ 10k cps.
PHA Scans
JEOL P-10 flow detector, PET crystal
UO EPMA Workshop 2010
Ar escape peak observed for x-rays with E > 3.203 keV = Ec Ar K-edge
PHA scans for K-lines of K, Ca,
Sc, Ti, V, and Cr, using 64x gain
and detector bias necessary to
produce a 4 volt PHA x-ray pulse.
Expanded scale illustrating Ar Kα escape peak position as a function of x-ray energy. As the x-ray
energy increases, the Ar escape peak increases in voltage. The position of the escape peak must be
treated consistently when setting the baseline of the PHA: either always include the escape peak or
always exclude it, for both sample and standard measurement.

–6
PHA Scans
JEOL sealed Xe detector, LiF crystal
UO EPMA Workshop 2010
PHA Scans at 64x Gain and Calibrated Bias on LiF:
K-lines of Ti, Cr, Fe, Cu and L-line of Au
0
10
20
30
40
50
60
70
80
90
100
110
120
0.0 0.5 1.0 1.5 2.0 2.5 3.0 3.5 4.0
X-ray pulse energy, Volts
X-r
ay
In
ten
sity
Ti Ka LIF3
Cr Ka LIF3
Fe Ka LIF3
Cu Ka LIF3
Au La LIF3
PHA Scans at 64x Gain and Calibrated Bias on LiF:
K-lines of Ti, Cr, Fe, Ni, Cu and L-line of Au
0
100
200
300
400
500
600
700
800
900
1000
1100
1200
1300
0 1 2 3 4 5 6 7 8 9 10
X-ray pulse energy, Volts
X-r
ay
In
ten
sity
Ti Ka LIF3
Cr Ka LIF3
Fe Ka LIF3
Ni Ka LIF3
Cu Ka LIF3
Au La LIF3
PHA scans for K-lines of Ti, Cr, Fe,
Ni, and Cu, and L-line of Au, using
64x gain and detector bias necessary
to produce a 4 volt PHA x-ray pulse.
Expanded scale illustrating Xe Lα escape peak position as a function of x-ray energy. As the x-ray
energy increases, the Xe escape peak increases in voltage. For Ti the escape peak is buried in the
baseline noise, and for more energetic x-rays the positions are: Cr ~0.9V, Fe ~1.4V, Cu ~1.9V, and
Au ~2.2V. The position of the escape peak must be treated consistently when setting the baseline of
the PHA: either always include the escape peak or always exclude it, for both sample and standard
measurement.
Xe escape peak observed for x-rays with E > 5.452 keV = Ec Xe L-edge
UO EPMA Workshop 2010
Calibration of PHA
Using Bias vs. ln(E) plots
For JEOL microprobe want SCA pulse at 4 volts, Cameca at 2 volts
Spectrometer at peak position
Bias scan with 3.8v base, 0.2v window gives bias for 4 volt SCA
Plot of bias vs ln of x-ray energy is linear
Calibration performed for minimum element set which spans energy
range of spectrometer for all analyzing crystals
Detector should give same bias for Ti Kα on PET vs. LIF, others
Calibration confirms systematic behavior of x-ray counter
As P-10 tank empties and Ar/CH4 changes, requires recalibration
Use y = mx + b fit to bias data to provide quick calibration
Similar plot for escape peak as function of x-ray energy
UO EPMA Workshop 2010
PHA Bias Plot for LIF/PET Data
Si, Ti, Ni Bias data at 8, 16, 32, 64, and 128x GainWU 8200 Detector Bias Spectrometer 3
Settings for 4 Volt Pulse
y = -87.037x + 1955.1
y = -94.949x + 1889
y = -98.905x + 1808
y = -108.8x + 1748.9
15001525155015751600162516501675170017251750177518001825185018751900
0.5
0
0.7
5
1.0
0
1.2
5
1.5
0
1.7
5
2.0
0
2.2
5
2.5
0
Ln Energy
Bia
s, V
olt
s
LIF 8x
LIF 16x
LIF 32x
LIF 64x
LIF 128x
PET 32x
PET 64x
PET 128xSi, PET
Ti, PET and LIF
Ni, LIF
y = mx + b
y = bias, x=ln(E)
UO EPMA Workshop 2010
Gain Shift Due to Count Rate
Gain shift due to count rate, detector bias arbitrarily set to 1700 volts.
Observed shift is ~ 0.008 volts per 1 K cps (1.95 volt shift over 245 K cps range).
At ~125k cps baseline noise discrimination deteriorates.
Older PCS electronics exhibit complete shift into baseline noise.
MSFC Spec 1, P-10 flow counter, TAP, 32x gain, Si Kα on Si metal.
5K cps
3.75 V
60K cps
3 V
125K cps
2.6 V
250K cps
1.8 V
–7
UO EPMA Workshop 2010
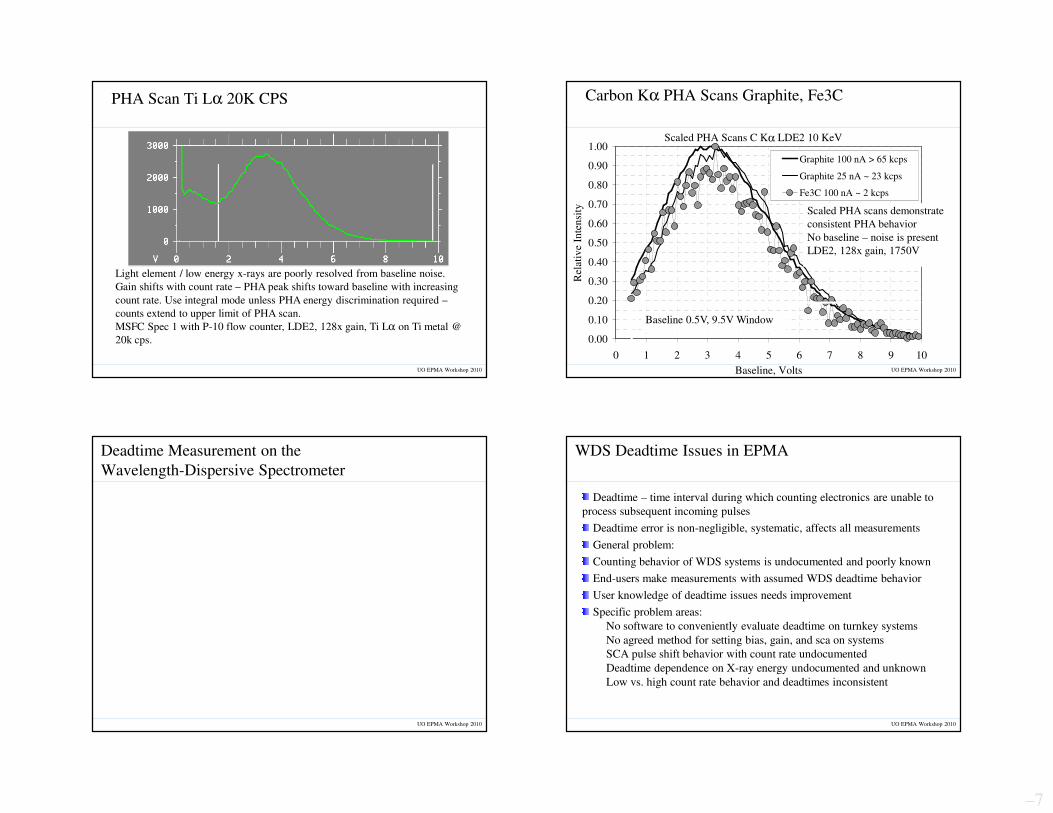
PHA Scan Ti Lα 20K CPS
Light element / low energy x-rays are poorly resolved from baseline noise.
Gain shifts with count rate – PHA peak shifts toward baseline with increasing
count rate. Use integral mode unless PHA energy discrimination required –
counts extend to upper limit of PHA scan.
MSFC Spec 1 with P-10 flow counter, LDE2, 128x gain, Ti Lα on Ti metal @
20k cps.
UO EPMA Workshop 2010
Carbon Kα PHA Scans Graphite, Fe3C
Scaled PHA Scans C Kα LDE2 10 KeV
0.00
0.10
0.20
0.30
0.40
0.50
0.60
0.70
0.80
0.90
1.00
0 1 2 3 4 5 6 7 8 9 10
Baseline, Volts
Rel
ativ
e In
ten
sity
Graphite 100 nA > 65 kcps
Graphite 25 nA ~ 23 kcps
Fe3C 100 nA ~ 2 kcps
Scaled PHA scans demonstrate
consistent PHA behavior
No baseline – noise is present
LDE2, 128x gain, 1750V
Baseline 0.5V, 9.5V Window
UO EPMA Workshop 2010
Deadtime Measurement on the
Wavelength-Dispersive Spectrometer
UO EPMA Workshop 2010
WDS Deadtime Issues in EPMA
Deadtime – time interval during which counting electronics are unable to
process subsequent incoming pulses
Deadtime error is non-negligible, systematic, affects all measurements
General problem:
Counting behavior of WDS systems is undocumented and poorly known
End-users make measurements with assumed WDS deadtime behavior
User knowledge of deadtime issues needs improvement
Specific problem areas:
No software to conveniently evaluate deadtime on turnkey systems
No agreed method for setting bias, gain, and sca on systems
SCA pulse shift behavior with count rate undocumented
Deadtime dependence on X-ray energy undocumented and unknown
Low vs. high count rate behavior and deadtimes inconsistent

–8
UO EPMA Workshop 2010
Deadtime Behavior:
Extending vs. Nonextending
Nonextending vs Extending Deadtime
0.01
0.10
1.00
0.01 0.10 1.00 10.00
Normalized Input Count Rate
No
rmali
zed O
utp
ut
Cou
nt
Rat
e
Nonextending
Extending
Nonextending: N = Nm (1 – N τ), Nmax = 1/τExtending: N = Nm e –Nm τ , Nmax = 1/eτ
Nm τ
N τ
UO EPMA Workshop 2010
Deadtime Losses
Input – Output Curves for µsec Deadtime Constants
WDS Deadtime Losses
0
50000
100000
150000
200000
0 50000 100000 150000 200000
Input Counts per second
Ou
tput
Co
unts
per
sec
.
1.00E-06
2.00E-06
4.00E-06
5.00E-06
6.00E-06
UO EPMA Workshop 2010
Percentage Deadtime Losses
Percent Level Corrections Apply to All Measurements
Deadtime Correction, Percentage
0
1
2
3
4
5
6
7
8
9
10
0 10000 20000 30000 40000 50000
Input Counts per second
Dea
dti
me
Corr
ecti
on
, %
6.00E-06
5.00E-06
4.00E-06
2.00E-06
1.00E-06
~1.25 µsec
At 1 µsec, 1% correction at 10Kcps, 5% at 50Kcps
At 2 µsec, 2% correction at 10Kcps, 10% at 50Kcps
UO EPMA Workshop 2010
Deadtime Relations
Calculation of Deadtime Constant
• N = true count rate, Nm = measured count rate with
deadtime losses (Nm < N), and τ is the deadtime constant,
which ranges from 1 to several µsec for WDS counting
systems. It is necessary to know Nm and N to calculate τ.We assume the proportionality of N to the probe current i
is constant. This may not be true at low count rates.
• Nm / i = measured count rate in counts per second per nA,
and c is the constant N / i
Form: y = mx +b
(Nm / i) is y, x is Nm, y-intercept b is constant c (= N / i).
• Equivalent to τ = (1 – y / b) / x
Measure x-ray intensity at increasing probe current
Use count rate Nm and Nm / i to evaluate the deadtime
constant τ over a range of intensity values
=) N - (1
N N
m
m
τ
)= τ N - c(1 i
N m
m
Ν
] / ) / Ν( −[1 =
m
m ci τ

–9
UO EPMA Workshop 2010
Deadtime Evaluation Plot
Nm vs. Nm / i to determine LS Fit to τ
UO EPMA Workshop 2010
Verification of Probe Current vs. Absorbed Current Linearity
and/or Detection of Sample Charging
Identification of Sample Charging:
Ratio of Absorbed Current to Probe Current
0.00
0.10
0.20
0.30
0.40
0.50
0.60
0.70
0.80
0.90
1.00
0 100 200 300 400 500 600 700 800 900
Cup Current, nA
Abso
rbed /
Cu
p C
urr
ent
Conductive Si Wafer
Conductive Si Wafer Run 2
Charging Si Wafer
UO EPMA Workshop 2010
Deadtime Calculation from Excel Spreadsheet
nA Abs Cur Abs/Probe Time Cps (x) Cps/nA (y) Fit All Fit Last DT us All DT Last
2.00 1.63 0.82 100 4607.9 2302.57 2299.81 0.61
5.00 4.05 0.81 80 11436.9 2287.20 2286.17 0.83
10.01 8.10 0.81 80 22665.3 2264.44 2263.73 0.85
20.05 16.25 0.81 60 44469.0 2217.95 2220.18 0.89
25.00 20.29 0.81 60 54977.1 2199.08 2199.18 2197.08 0.87 0.83
29.98 24.34 0.81 30 65298.1 2177.91 2178.56 2177.00 0.87 0.84
35.02 28.54 0.81 30 75474.9 2155.07 2158.23 2157.20 0.88 0.86
40.05 32.53 0.81 30 85510.0 2134.97 2138.18 2137.67 0.88 0.86
49.99 40.74 0.81 30 105026.6 2101.04 2099.19 2099.70 0.86 0.84
69.98 57.25 0.82 30 141942.7 2028.45 2025.44 2027.88 0.86 0.84
Regression Output: Mean deadtime 0.86 0.84
All Y intercept 2309.01 Slope -0.0020 Sigma 0.02 0.01
High CR Y intercept 2304.04 Slope -0.0019 Regression DT 0.87 0.84
Excel Sheet: X is Nm and Y is Nm/i. Deadtime evaluated from each intensity (DT) and
from least squares fit to data (Fit) using Excel linest function. All data and high intensity
only data are compared with average values (Mean deadtime) and standard deviation.
Ratio of absorbed/probe current checks conductivity. If linear all data agree.
UO EPMA Workshop 2010
Deadtime Si Kα TAP Spec 2 Caltech 733
1.00
1.10
1.20
1.30
1.40
1.50
1.60
1.70
1.80
1.90
2.00
2.10
0 25000 50000 75000 100000 125000 150000 175000
Counts per second
Dea
dti
me, µ
sec
4/25/91 Original Noran
Deadtime Variation with Count Rate
Caltech 733 Spec 2 with P-10 flow counter
Deadtime at low count rates include dark
current and are not representative of dynamic
range of spectrometer

–10
UO EPMA Workshop 2010
Deadtime Variation With Time and P-10 Gas Chemistry
Comparison of Original and New Tracor PCS Electronics
UO EPMA Workshop 2010
Establishing Calibration of an Electron Microprobe
Wavelength spectrometer aligned vertically (baseplate) to coincide with
optical microscope focal point in z-space
Diffracting crystal aligned to be on Roland circle
All WDS should focus on same z-axis and coincident xy area ~ 50 um in
diameter
Characteristics of correct alignment
All WDS & EDS have identical X-ray takeoff angle
Maximum X-ray intensity at z focus position, but also require:
Measure identical k-ratio within counting statistics
Simultaneous k-ratio measurement is ultimate test of alignment
Initial CMAS standard set used on Caltech MAC and JEOL JXA-733
Expanded CMASTF standard set used for Wash U JXA-8200
UO EPMA Workshop 2010
Electron Microprobe Column
Spectrometer Alignment: Baseplate and Crystal
Baseplate: Place Rowland circle at Z focus
Crystal: Align all crystals on Rowland circle
Spectrometer design keeps detector on RC
Note: Different K-ratio = misalignment
Multiple spectrometer comparison required
to demonstrate all WDS and EDS are
mutually aligned
WDS Spectrometer Alignment--Baseplate and Crystal
(JEOL, vertical spectrometers)
UO EPMA Workshop 2010
Baseplate – done first
Place Rowland circle at Z focus
Use PET Cr Kα, other low peak
Crystal – done for each crystal
Align all crystals on Rowland circle
Use PET Si Kα, others
Here baseplate is set using Cr
Crystal Spec 5 PET set, 3&4 need
further adjustment
Crystal alignment PET Si Kα
Baseplate alignment PET Cr Kα

–11
UO EPMA Workshop 2010
CMASTF Silicate Standards
Geological materials are multicomponent
End-member stoichiometric silicate and oxide mineral standards
Primary standards:
MgO, Al2O3, SiO2, CaSiO3 (CaO 48.27, SiO2 51.73), TiO2, and Fe2O3
Analyzed suite of stoichiometric standards, natural and synthetic materials:
Second set of primary standards on different mounts
Spinel MgAl2O4, Enstatite MgSiO3, Forsterite Mg2SiO4
Kyanite Al2SiO5
Fayalite Fe2SiO4
Well characterized natural mineral standards and glasses:
Olivines (Mg,Fe)2SiO4
Diopside CaMgSi2O6, Anorthite CaAl2Si2O8, Sphene CaTiSiO5
Ilmenite FeTiO3
Synthetic glasses in CMAS and CMASF system:
Weill CMAS glasses, NBS K411, K412
UO EPMA Workshop 2010
CMASTF Standard Inventory: Natural & SyntheticComposition in Wt% Oxide
Standard MgO Al2O3 SiO2 CaO TiO2
FeO* or
Fe2O3Alaska Anorthite 36.03 44.00 19.09 0.62
Boyd Olivine 51.63 40.85 7.17
Ilmen Mtns Ilmenite 0.31 45.70 46.54
K411 Glass 14.67 0.10 54.30 15.47 14.42
K412 Glass 19.33 9.27 45.35 15.25 9.96
Kyanite P236 62.91 37.09
Natural Bridge Diopside 18.31 0.06 55.40 25.78 0.01 0.26
ORNL, RDS Fayalite 29.49 70.51
San Carlos Olivine 49.42 40.81 9.55
Shankland Forsterite 57.30 42.70
Springwater Olivine 43.58 38.95 16.62
Taylor Kyanite 0.00 62.70 37.00 0.16
Taylor Olivine 50.78 41.15 7.62
Taylor Sphene 1.36 30.83 28.82 37.80 0.66
Taylor Spinel 28.34 71.66
Weill A 11.05 16.07 49.72 23.15
Weill B 13.99 16.05 48.99 20.97
Weill D 17.97 20.96 45.07 16.00
Weill E* 6.00 8.99 79.97 5.04
Weill Enstatite Glass 40.15 0.00 59.85
Weill F 10.07 30.93 52.06 6.94
Weill G 32.69 3.31 61.12 2.89
Weill H 5.22 41.90 30.91 21.97
Weill I 19.03 2.01 52.95 26.01
Weill J 1.01 19.02 42.98 36.99
UO EPMA Workshop 2010
0
20
40
60
80
100
120
140
0.80 0.85 0.90 0.95 1.00 1.05 1.10 1.15
Armstrong PRZ Heinrich 1986
Pouchou Experimental Binary K-ratio Data Set (n=756)
Φ(ρz) Algorithm – No silicates or multi-element materials
Average Kcorr / Kexp = 1.0079 +/- 0.0382 (1 σ)
Armstrong Φ(ρz)
Heinrich 1986 macs
UO EPMA Workshop 2010
1.00
1.20
1.40
1.60
1.80
2.00
2.20
0.0 0.2 0.4 0.6 0.8 1.0
30 KV
25 KV
20 KV
15 KV
10 KV
Ag Lα NIST SRM 481 AgAu Alloy (ψ=40)
C Ag, weight fraction
C /
K
C vs. C / K plot for Ag Lα data
y = mx + b
α factor is b intercept
slope is 1-α

–12
UO EPMA Workshop 2010
Accuracy Study for EPMA
Comparison of Measured to Calculated K-ratio
Kmeasured dependent on:
Accelerating Potential
Probe current
Detector (gas, sealed)
Pulse processing
PHA calibration
Deadtime
Spectrometer alignment
Sample homogeneity
P-B determination, stripping, counting statistics
Other sampling/drift factors
Kcalculated dependent on:
Correct composition of standard
Correction algorithms
Data sets, mass absorption coefficients
Other algorithmic factors
calculated
measured
calculated
standard
sample
measured
K
K :Evaluate
ZAF / C K
ZAF*KC
B)(P
B)(PK
=
=
−
−=
UO EPMA Workshop 2010
Historical CMAS Data
Caltech MAC Probe, Circa 1980’s
Shaw Data Set: Caltech MAC Probe (38.5 deg, 15 kV)
Armstrong φ(ρz), FFAST macs
0.90
0.95
1.00
1.05
1.10
0 10 20 30 40 50 60 70 80 90
Weight % Oxide
Mea
sure
d W
t% /
Acc
epte
d W
t%
Mg
Al
Si
Ca
UO EPMA Workshop 2010
Caltech JEOL 733 1990’s
Spectrometer 124 TAP for Mg Al Si (Ca PET)
Shaw Data Set: Caltech Jeol 733 -- TAP:1Mg 2Al 4Si
Armstrong φ(ρz), FFAST macs, 15 kV
0.90
0.95
1.00
1.05
1.10
0 5 10 15 20 25 30 35 40
Weight % Element
Mea
sure
d W
t% /
Acc
epte
d W
t%
Mg
Al
Si
Ca
UO EPMA Workshop 2010
Caltech JEOL 733 1990’s
Spectrometer 1 TAP for Mg Al Si (Ca PET)
Shaw Data Set: Caltech Jeol 733 -- TAP1 MgAlSi PET3 Ca
Armstrong φ(ρz), FFAST macs, 15 kV
0.90
0.95
1.00
1.05
1.10
0 5 10 15 20 25 30 35 40
Weight % Oxide
Mea
sure
d W
t% /
Acc
epte
d W
t%
Mg
Al
Si
Ca

–13
UO EPMA Workshop 2010
WU JXA-8200 CMASTF Data Set
All WDS Data Superimposed
0.80
0.90
1.00
1.10
1.20
0 10 20 30 40 50 60 70 80 90 100
Mg1 TAP
Mg2 TAP
Al1 TAP
AL2 TAP
Si1 PET
Si1 TAP
Si2 TAP
Si3 PET
Si4 PET
Si5 PETH
Ca1 PET
Ca3 PET
Ca4 PET
Ca5 PETH
Ca3 LIF
Ca4 LIF
Ca5 LIFH
Ti1 PET
Ti3 PET
Ti4 PET
Ti5 PETH
Ti3 LIF
Ti4 LIF
Ti5 LIFH
Fe3 LIF
Fe4 LIF
Fe5 LIFH
Oxide Weight Percent
Km
eas
/ K
calc
UO EPMA Workshop 2010
Average Kmeas / Kcalc for CMASTF Standards
Washington University JEOL 8200
WDS Spec 1 Spec 2 Spec 3 Spec 4 Spec 5
Mg TAP 0.9997 0.9971
Al TAP 0.9950 0.9946
Si TAP 0.9981 0.9955
Si PET 0.9855 0.9865 0.9837 0.9880
Ca PET 1.0013 1.0064 1.0035 1.0101
Ca LIF 0.9908 0.9948 0.9989
Ti PET 1.0000 1.0059 1.0044 1.0115
Ti LIF 0.9919 0.9949 1.0084
Fe LIF 0.9962 1.0051 1.0131
UO EPMA Workshop 2010
Accuracy, 1σ % Error in Kmeas / Kcalc CMASTF
Standards Washington University JEOL 8200
WDS Spec 1 Spec 2 Spec 3 Spec 4 Spec 5
Mg TAP 0.65 1.30
Al TAP 1.06 1.22
Si TAP 0.74 0.64
Si PET 0.71 0.71 0.75 0.70
Ca PET 0.79 0.73 0.70 0.74
Ca LIF 0.74 0.92 0.69
Ti PET 2.27 1.44 0.98 1.54
Ti LIF 0.61 1.15 1.14
Fe LIF 1.75 1.27 1.26
UO EPMA Workshop 2010
WU JXA-8200 CMASTF Data Set
All WDS Data Superimposed Expanded Scale
0.95
0.96
0.97
0.98
0.99
1.00
1.01
1.02
1.03
1.04
1.05
0 10 20 30 40 50 60 70 80 90 100
Mg1 TAP
Mg2 TAP
Al1 TAP
AL2 TAP
Si1 PET
Si1 TAP
Si2 TAP
Si3 PET
Si4 PET
Si5 PETH
Ca1 PET
Ca3 PET
Ca4 PET
Ca5 PETH
Ca3 LIF
Ca4 LIF
Ca5 LIFH
Ti1 PET
Ti3 PET
Ti4 PET
Ti5 PETH
Ti3 LIF
Ti4 LIF
Ti5 LIFH
Fe3 LIF
Fe4 LIF
Fe5 LIFH
Oxide Weight Percent
Km
eas
/ K
calc

–14
UO EPMA Workshop 2010
Washington University JEOL JXA-8200
SDD Quantitative Analysis Data
SDD great for mapping, what about quantitative analysis?
SDD EDS data acquired at 120s, 60s, and 3s acquisitions at T3
Standards used: MgO, Al2O3, SiO2, CaSiO3 (CaO 48.27, SiO2 51.73), TiO2,
and Fe2O3
Linear least-squares peak deconvolution (JEOL software)
Extracted raw K-ratios processed using Armstrong Φ(ρz) and FFAST macs
for comparison with WDS data
UO EPMA Workshop 2010
CMASTF Standard Analyses
WU8200 SDD LLSQ 120 sec. Acquisition T3
Measured K Relative to Calculated K
W U8200 SDD 120 sec Acquisition
0.80
0.90
1.00
1.10
1.20
0 10 20 30 40 50 60 70 80 90 100
Weight Percent Oxide
Km
/ K
c
Mg Km/Kc
Al Km/Kc
Si Km/Kc
Ca Km/Kc
Ti Km/Kc
Fe Km/Kc
UO EPMA Workshop 2010
CMASTF Standard Analyses
WU8200 SDD LLSQ 60 sec. Acquisition T3
Measured K Relative to Calculated K
WU8200 SDD 60 sec Acquisition
0.80
0.90
1.00
1.10
1.20
0 10 20 30 40 50 60 70 80 90 100
Weight Percent Oxide
Km
/ K
c
Mg Km/Kc
Al Km/Kc
Si Km/Kc
Ca Km/Kc
Ti Km/Kc
Fe Km/Kc
UO EPMA Workshop 2010
CMASTF Standard Analyses
WU8200 SDD LLSQ 3 sec. Acquisition T3
Measured K Relative to Calculated K
WU8200 SDD 3 sec Acquisition
0.80
0.90
1.00
1.10
1.20
0 10 20 30 40 50 60 70 80 90 100
Weight Percent Oxide
Km
/ K
c
Mg Km/Kc
Al Km/Kc
Si Km/Kc
Ca Km/Kc
Ti Km/Kc
Fe Km/Kc
–15
UO EPMA Workshop 2010
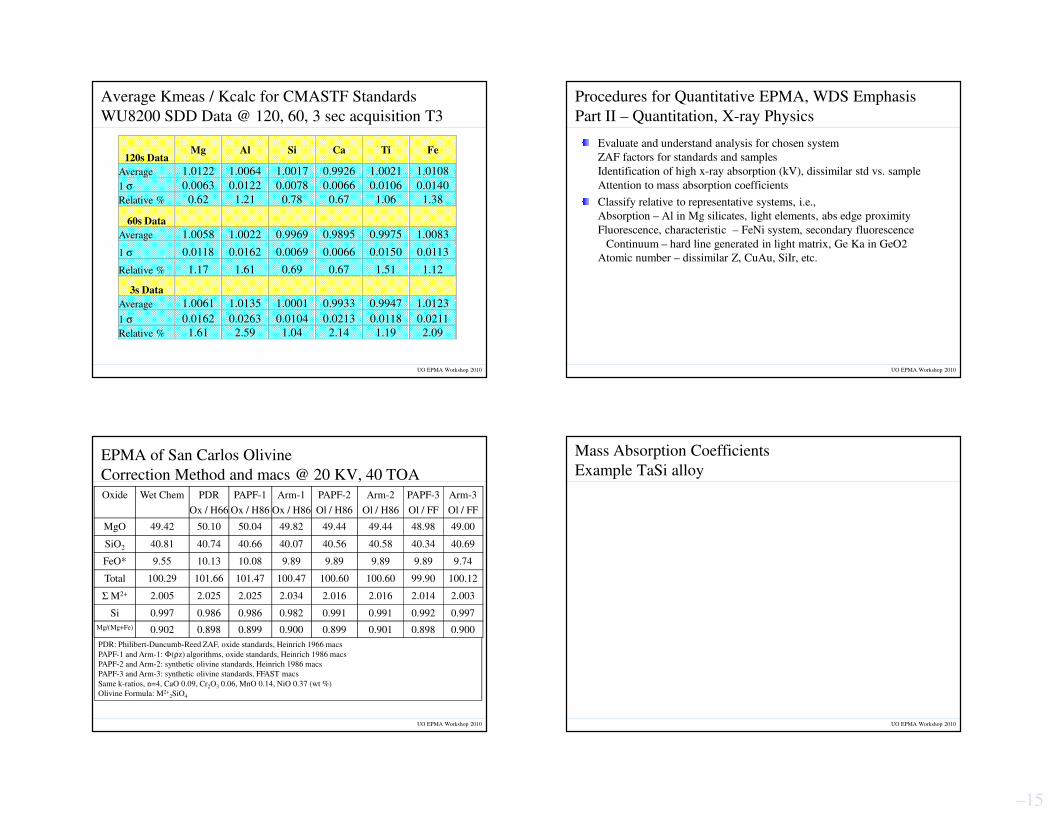
Average Kmeas / Kcalc for CMASTF Standards
WU8200 SDD Data @ 120, 60, 3 sec acquisition T3
120s DataMg Al Si Ca Ti Fe
Average 1.0122 1.0064 1.0017 0.9926 1.0021 1.0108
1 σ 0.0063 0.0122 0.0078 0.0066 0.0106 0.0140
Relative % 0.62 1.21 0.78 0.67 1.06 1.38
60s Data
Average 1.0058 1.0022 0.9969 0.9895 0.9975 1.0083
1 σ 0.0118 0.0162 0.0069 0.0066 0.0150 0.0113
Relative % 1.17 1.61 0.69 0.67 1.51 1.12
3s Data
Average 1.0061 1.0135 1.0001 0.9933 0.9947 1.0123
1 σ 0.0162 0.0263 0.0104 0.0213 0.0118 0.0211
Relative % 1.61 2.59 1.04 2.14 1.19 2.09
Procedures for Quantitative EPMA, WDS Emphasis
Part II – Quantitation, X-ray Physics
Evaluate and understand analysis for chosen system
ZAF factors for standards and samples
Identification of high x-ray absorption (kV), dissimilar std vs. sample
Attention to mass absorption coefficients
Classify relative to representative systems, i.e.,
Absorption – Al in Mg silicates, light elements, abs edge proximity
Fluorescence, characteristic – FeNi system, secondary fluorescence
Continuum – hard line generated in light matrix, Ge Ka in GeO2
Atomic number – dissimilar Z, CuAu, SiIr, etc.
UO EPMA Workshop 2010
UO EPMA Workshop 2010
PDR: Philibert-Duncumb-Reed ZAF, oxide standards, Heinrich 1966 macs
PAPF-1 and Arm-1: Φ(ρz) algorithms, oxide standards, Heinrich 1986 macs
PAPF-2 and Arm-2: synthetic olivine standards, Heinrich 1986 macs
PAPF-3 and Arm-3: synthetic olivine standards, FFAST macs
Same k-ratios, n=4, CaO 0.09, Cr2O3 0.06, MnO 0.14, NiO 0.37 (wt %)
Olivine Formula: M2+2SiO4
EPMA of San Carlos Olivine
Correction Method and macs @ 20 KV, 40 TOA
Oxide Wet Chem PDR
Ox / H66
PAPF-1
Ox / H86
Arm-1
Ox / H86
PAPF-2
Ol / H86
Arm-2
Ol / H86
PAPF-3
Ol / FF
Arm-3
Ol / FF
MgO 49.42 50.10 50.04 49.82 49.44 49.44 48.98 49.00
SiO2 40.81 40.74 40.66 40.07 40.56 40.58 40.34 40.69
FeO* 9.55 10.13 10.08 9.89 9.89 9.89 9.89 9.74
Total 100.29 101.66 101.47 100.47 100.60 100.60 99.90 100.12
Σ M2+ 2.005 2.025 2.025 2.034 2.016 2.016 2.014 2.003
Si 0.997 0.986 0.986 0.982 0.991 0.991 0.992 0.997
Mg/(Mg+Fe) 0.902 0.898 0.899 0.900 0.899 0.901 0.898 0.900
Mass Absorption Coefficients
Example TaSi alloy
UO EPMA Workshop 2010

–16
UO EPMA Workshop 2010
Mass Absorption Coefficients for Si Kα
By Absorber Z, All MAC Data Sets ComparedMAC for Si Ka by Z Absorber Elements
0
1000
2000
3000
4000
5000
6000
7000
0 10 20 30 40 50 60 70 80 90 100
Atomic Number Z
MA
C
Citzmu
Linemu
McMaster
Mac30
MacJTA
FFAST
UO EPMA Workshop 2010
Silicon Kα MAC at L-edge of Absorber
MAC for Si Ka by Z Absorber Elements
0
1000
2000
3000
4000
5000
6000
7000
25 26 27 28 29 30 31 32 33 34 35 36 37 38 39 40 41 42 43 44 45
Atomic Number Z
MA
C
Citzmu
Linemu
McMaster
Mac30
MacJTA
FFAST
Mn Fe Co Ni Cu Zn Ga Ge As Se Br Kr Rb Sr Y Zr Nb Mo Tc Ru Rh
UO EPMA Workshop 2010
Silicon Kα MAC at M-edge of Absorber
Si Ka close to the Ta M5 absorption edgeMAC for Si Ka by Z Absorber Elements
0
1000
2000
3000
4000
5000
6000
7000
55 56 57 58 59 60 61 62 63 64 65 66 67 68 69 70 71 72 73 74 75 76 77 78 79 80
Atomic Number Z
MA
C
Citzmu
Linemu
McMaster
Mac30
MacJTA
FFAST
Cs Ba La Ce Pr Nd PmSm Eu Gd Tb Dy Ho Er Tm Yb Lu Hf Ta W Re Os Ir Pt Au Hg
Si Kα line energy 1.73984 keV, M5 edges: Hf 1.662, Ta 1.735, W 1.810 keV
UO EPMA Workshop 2010
Comparison of Si Kα MACS
Relative percent σMAC for Si Ka by Z Absorber Elements
0
5
10
15
20
25
30
35
40
45
50
0 10 20 30 40 50 60 70 80 90 100
Atomic Number Z
Per
cen
t S
tan
dard
Dev
iati
on
, R
ela
tive

–17
UO EPMA Workshop 2010
Elevated and Uncertain MAC Values for K, L, M Lines:
Proximity to Absorption Edge of Matrix ElementK-Lines and absorber for K, L, M edge
Li Be B
Be,S,Y
C
B,Ar,Tc
N
C,Ca,Ag
O
N,V,Sn
F
O,Mn,I
Ne
F,Co,La
Na
Ne,Zn,Nd
Mg
Na,Ge,Gd
Al
Mg,Se,Er
Si
Al,Kr,Hf
P
Si,Sr,Re
S
P,Zr,Au
Cl
S,Mo,Pb
Ar
Cl,Ru,Rn
K
Ar,Pd,Ac
Ca
K,Cd,U
Sc
Ca,Sn
Ti
Sc,Sb
V
Sc,Xe
Cr
Ti,Ba
Mn
V,Ce
Fe
Cr,Nd
Co
Mn,Sm
Ni
Fe,Gd
Cu
Co,Dy
Zn
Ni,Er
Ga
Cu,Lu
Ge
Zn,Ta
As
Ga,Re
Se
Ge,Ir
Br
As,Au
Kr
As,Hg
Rb
Se,Pb
Sr
Br,Po
Y
Kr,Rn
Zr
Rb,Ra
Nb
Sr,Th
Mo
Y,U
Tc
Fr
Ru
~Ac
L-Lines and absorber for K, L, M edge
Ti
N,Sc,In
V
N,Ti,Sn
Cr
O,V,Sb
Mn
O,Cr,I
Fe
F,Mn,Xe
Co
F,Fe,Ca
Ni
F,Co,La
Cu
Ne,Ni,Ce
Zn
Ne,Cu,Nd
Ga
Na,Zn,Pm
Ge
Na,Ga,Eu
As
Na,Ge,Tb
Se
Mg,As,Dy
Br
Mg,Se,Er
Kr
Al,Br,Yb
Rb
Al,Kr,Lu
Sr
Si,Rb,Ta
Y
P,Rb,W
Zr
Si,Sr,Os
Nb
P,Y,Ir
Mo
P,Zr,Au
Tc
P,Nb,Tl
Ru
S,Mo,Pb
Rh
S,Tc,Po
Pd
Cl,Ru,At
Ag
Cl,Ru,Rn
Cd
Cl,Rh,Ra
In
Ar,Pd,Ac
Sn
Ar,Ag,Pa
Sb
Ar,Cd,U
Te
K,In,Np
I
K,Sn,Np
Xe
Ca,Sn
Cs
Ca,Sb,
Ba
Ca,Te
Hf
Co,Dy
Ta
Co,Ho
W
Ni,Er
Re
Ni,Tm
Os
Ni,Tm
Ir
Cu,Yb
Pt
Cu,Lu
Au
Zn,Hf
Hg
Zn,Ta
Tl
Zn,W
Pb
Ga,Re
Bi
Ga,Re
Po
Ge,Os
At
Ge,Ir
Rn
Ge,Pt
Fr
As,Au
Ra
As,Hg
La
Sc,I
Ce
Sc,Xe
Pr
Ti,Cs
Nd
Ti,Cs
Pm
Ti,Ba
Sm
V,La
Eu
V,Ce
Gd
Cr,Pr
Tb
Cr,Nd
Dy
Cr,Pm
Ho
Mn,Sm
Er
Mn,Sm
Tm
Fe,Eu
Yb
Fe,Gd
Lu
Fe,Tb
Ac
As,Hg
Th
Se,Tl
Pa
Se,Pb
U
Br,Bi
Np
Br,Po
Pu
Br,At
M-Lines and absorber for K, L, M edge
Hf
Al,Br,Lu
Ta
Al,Kr,Lu
W
Al,Kr,Hf
Re
Si,Rb,Ta
Os
Si,Rb,W
Ir
Si,Sr,Re
Pt
Si,Sr,Os
Au
Si,Y,Ir
Hg
P,Y,Pt
Tl
P,Zr,Pt
Pb
P,Zr,Au
Bi
P,Nb,Hg
Po
S,Nb,Tl
At
S,Mo,Pb
Rn
S,Mo,Pb
Fr
S,Tc,Po
Ra
Cl,Tc,At
La
F,Co,Ba
Ce
Ne,Ni,La
Pr
Ne,Ni,Ce
Nd
Ne,Cu,Pr
Pm
Ne,Ni,Nd
Sm
Na,Zn,Pm
Eu
Na,Ga,Sm
Gd
Na,Ga,Eu
Tb
Na,Ge,Gd
Dy
Na,Ge,Tb
Ho
Mg,As,Dy
Er
Mg,As,Ho
Tm
Mg,Se,Er
Yb
Mg,Se,Tm
Lu
Al,Br,Yb
Ac
Cl,Ru,Rn
Th
Cl,Ru,Rn
Pa
Cl,Rh,Fr
U
Cl,Rh,Ra
UO EPMA Workshop 2010
Error Analysis Ta Lα in TaSi2
All algorithms and MAC sets (PAPF-FFAST = 1.0)
Error Histogram Ta Lα in TaSi2
Relative to PAP-FFAST Nominal K-ratios
0
2
4
6
8
10
12
14
0.9
50
0.9
55
0.9
60
0.9
65
0.9
70
0.9
75
0.9
80
0.9
85
0.9
90
0.9
95
1.0
00
1.0
05
1.0
10
1.0
15
1.0
20
1.0
25
Kcorr / Kexp
Fre
qu
ency Philibert-Duncumb-Reed
ZAF
Φ(ρz) Models
PA
PF
-FFA
ST
= 1
.0
UO EPMA Workshop 2010
Error Histogram Si Kα in TaSi2
Relative to PAP--FFAST Nominal K-ratio
0
1
2
3
4
5
6
7
8
0.7
90
0.8
60
0.9
30
1.0
00
1.0
70
1.1
40
1.2
10
1.2
80
1.3
50
1.4
20
1.4
90
1.5
60
1.6
30
1.7
00
1.7
70
1.8
40
Kexp / Kcorr
Fre
qu
ency
Error Analysis Si Kα in TaSi2
All algorithms and MAC sets (PAPF-FFAST=1.0)
Phil
iber
t-D
uncu
mb
-Ree
d
ZA
F
Φ(ρz) Models
McM
aste
r
Lin
emu
Mac
30
citz
mu
Φ(ρz) Models
Phil
iber
t-D
uncu
mb
-Ree
d
ZA
F
PA
PF
-FFA
ST
= 1
.0
Dramatic demonstration of choice of MAC data set:
Variation of Φ(ρz) models and 4 mac data sets
UO EPMA Workshop 2010
Calculated Compositions of TaSi2
Relative to PAP—FFAST Nominal K-ratios
PAPF
with MACWt% Si Wt% Ta Total
CM 14.74 73.74 88.48
M30 15.64 74.02 89.66
(FFAST) 23.69 76.31 100
LM 24.87 76.52 101.39
MM 25.96 76.85 102.81
–18
UO EPMA Workshop 2010
EPMA Standards
M&M 2008 EPMA Standards
The Good, the Bad and the Ugly
The Good, the Bad and the Ugly
(Italian: Il buono, il brutto, il cattivo)
1966 Italian spaghetti western directed by Sergio Leone
Clint Eastwood as Blondie, the Good (confident bounty hunter)
Lee Van Cleef as Angel Eyes, the Bad (ruthless sociopathic killer)
Eli Wallach as Tuco, the Ugly (oafish bandit and liar)
Third film in the Dollars trilogy
A Fistful of Dollars (1964), For a Few Dollars More (1965)
Plot: three gunslingers compete to find a fortune in buried
Confederate gold amid the violent chaos of gunfights, hangings,
Civil War battles, and prison camps
There are (similar?) challenges of using microanalysis standards that are
Good, Bad, and just plain Ugly
M&M 2008 EPMA Standards
EPMA Standards: Desirable Attributes
EPMA standards should be well characterized
Bulk and microchemical analysis of distribution material
XRF, ICP-MS, INAA, Classical wet chemistry, etc.
Supplemental to EPMA analysis
Traceable
Homogeneous on micron scale
Minimal variation intra-grain and grain-to-grain
Quantitative representation of homogeneity
Stable under electron beam bombardment and non-reactive with air
Similar in composition to samples being analyzed
Amenable to mounting and polishing
Relatively large grains for use (several hundred microns minimum)
Widely available and in sufficient quantity to international community
Inexpensive for purchase
M&M 2008 EPMA Standards
EPMA Standards: Emphasis on Mineral and Glass
Multielement Standards
Pure element metal standards
Minimal uncertainty in composition, typically assumed pure
Useful for wide range of samples, EDS calibration
Caution: Segregations at grain boundaries, oxidation
End-member oxides, compounds, and minerals
Assumed composition
Al2SiO5, Mg2SiO4, etc., need WDS scans for minor elements
Caution: Mg(OH)2 on MgO, SiO2 beam damage, etc.
Stoichiometry is powerful constraint on composition
Intermediate Composition Minerals, Glasses
Kakanui Hornblende, K-411 glass, Corning 95-series trace glasses
Minerals have stoichiometric constraint, glasses do not
Minerals may have homogeneity issues, glasses may not

–19
M&M 2008 EPMA Standards
EPMA Standards: Il buono, the Good
Eugene Jarosewich – Smithsonian microbeam standards:
Natural and synthetic minerals and glasses
Classical wet chemistry for primary analytical data (published values)
EPMA used for intra-grain and grain-to-grain variation
Sigma ratio: (actual sd / counting sd) data for quantitative homogeneity
Sigma of all grains, measure of homogeneity
Sigma of worst grain, indication of other material in separate?
Significant amount of available material
Widely distributed and routinely used
Free for the asking
NIST Standard Reference Materials
Synthetic glasses (K-411, K-412, 61X-series, others)
CuAu and AgAu alloys
Certified values from extensive chemical and homogeneity analysis
M&M 2008 EPMA Standards
EPMA Standards: Il brutto, the Bad
Multielement standards we use fit into this category, in my opinion
Widely distributed Taylor standards uncertain pedigree
Presumably EPMA analyses
Zircon contains inclusions, undocumented homogeneity
Many mineral standards characterized by EPMA only
Few analytical details (standards, kV, instrument, correction algorithm)
Chemistry only reported, no k-ratios
Informally distributed material is assumed to be that of analysis
Madagascar orthoclase (Fe, Ba differ)
Material contains other elements and/or inclusions
Boatner REE phosphates, must use portion with lowest Pb from flux
The upside:
Most of these standards could be analyzed to better their characterization
M&M 2008 EPMA Standards
EPMA Standards: Il cattivo, the Ugly
Worst offenders are oxidized metals in commercial mounts
If used as sole standard serious analytical errors may result
Only check is total on an unknown
Homemade mounts that have a single decrepit grain
Poorly polished and not even perpendicular to the beam
Used exclusively as the primary standard
Mounts that have never been repolished and recoated since purchase
A real need exists for refurbishing services
…that cost less than a new standard mount
Again, a situation that is avoidable but is the responsibility of the analyst
M&M 2008 EPMA Standards
Taylor Commercial Mount

–20
M&M 2008 EPMA Standards
EPMA Standards: Effect of Oxide Layer Formation
Oxidized Surface = Layered Structure
0.00
0.10
0.20
0.30
0.40
0.50
0.60
0.70
0.80
0.90
1.00
0 1000 2000 3000 4000 5000
Film Thickness, Angstroms
k-r
ati
o R
elat
ive
to P
ure
Ele
men
t
Mg in Mg(OH)2
Mg in MgO sub
Al in Al2O3
Al in Al sub
Fe in Fe2O3
Fe in Fe sub
Cd in CdO
Cd in Cd sub
U in UO2
U in U sub
Substrate reduction, oxide layer increase: k-ratio ~0.001-.003 per nm
High Z oxides: Layer effect greater per unit thickness vs. low Z oxides
Crossover point: UO2/U ~ 200nm, Fe2O3/Fe ~320nm Al2O3/Al ~520nm
At thickness > crossover, oxide layer dominates k-ratio measurement
Film thickness up
to 0.5 µm (500nm)
GMR Film results for 15kV.
For 100nm oxide, reduction of
10-35% substrate intensity
UO2/U
crossover
Fe2O3/Fe
crossover
UO EPMA Workshop 2010
Advances in EPMA:
Geological Materials -- Standards
EPMA standards requirements: Homogeneous on micron scale, grain to grain, well characterized on both scales, and available in large enough quantity to be used by microanalysis communities.
Most materials fail one or more of these requirements.
Natural and synthetic minerals, oxides, and glasses.Minerals impose stoichiometry but may be inhomogeneousGlasses lack stoichiometric control but can be homogeneous
Glasses: targeted compositions that can be made in bulk and utilized by the microanalysis community.(Corning 95-series trace element glasses)
Internal consistency of EPMA standards used by the community is poorly known. Few comparison reports, generally anecdotal.
Solution: calculate expected x-ray intensity for element of interest in suite of standards, compare measured intensities relative to end-member standard (oxide), i.e., k = ZAF / C. This highlights errors in composition as well as systematic errors in algorithm.
UO EPMA Workshop 2010
Basalt Glass Indian Ocean USNM 113716:
EPMA vs. Wet Chemistry Data
Of
Of the 3-5 mounts of UNSM 113716, this is the first observation of mineral
inclusions or crystallites in the glass. This is otherwise a homogeneous standard,
consistent with EPMA of other glasses, but based on wet chemistry comparison.
How representative is this of the wet chemical analysis?
DevitrificationPlag
Glass
UO EPMA Workshop 2010
Olivine Standards: Mg-rich (Mg,Fe)2SiO4
Standard Nat./Syn. Minor/Trace Els.
Shankland forsterite Fo100 Synthetic Fe?
Boyd olivine Fo93 Natural Mn, Co, Ni, Zn?
LLNL “Fo85” (Fo93) Synthetic <none>
San Carlos olivine Fo90 Natural Na?, Mg, Al, Ca, Ti?, Cr, Mn, Co, Ni
Fujisawa sintered Fo90 Synthetic Al, Ca, Mn, Zn
LLNL “Fo80” (Fo85) Synthetic Al, Ca, Cr, Mn, Co?, Ni?
Springwater olivine Fo82 Natural Ca, Cr, Mn
LLNL “Fo67” (Fo70) Synthetic <none>
Shankland from ORNL
LLNL olivines from George Rossman, Boyd and Fujisawa from Caltech
San Carlos and Springwater olivine from Smithsonian

–21
UO EPMA Workshop 2010
Olivine Standards: Mn, Fe, Ni
Standard Nat./Syn. Minor/Trace Els.
Mn-olivine GRR-392 Synthetic Fe
Mn-olivine RDS P-1087 Synthetic Mg, Ca, Fe
Fayalite GRR-391 Synthetic Mn
Fayalite RDS P-1086 Synthetic Mg, Cr, Mn
Rockport Fayalite Natural Mg, Ca, Cr, Mn, Zn
Fayalite ORNL Synthetic Al?, Ca?, Cr
Ni-olivine P-877 Synthetic Cr?, Fe, Co
GRR and RDS from George Rossman, P numbers Caltech probe standards
Rockport Fayalite from Smithsonian
UO EPMA Workshop 2010
Rockport Fayalite
RF is widely used as primary Fe standard
But Mg and Zn present, not in wet chemistry analysis
[Low level oxides suspected to be variable not reported in wc analysis]
Is ferric iron present? – apparently not:
Wet Chemistry: Fe2O3 1.32, FeO 66.36 %, Tot: 99.18
Dyar XANES: RF iron is completely reduced.
Grunerite in separate: Fe72+Si8O22(OH)2
Magnetite at locality, in separate (Fe23+Fe2+O4) ??
Analysts should use EPMA analysis when using RF as primary standard.
M&M 2008 EPMA Standards
Rockport Fayalite
Complete analysis needed for quantitative correctionELEMENT K-VALUE ELEMWT% OXIDWT% ATOMIC% FORMULA KILOVOL
Si ka .10211 13.659 29.221 14.299 1.001 15.0
Fe ka .47949 52.508 67.551 27.644 1.935 15.0
Ti ka .00024 .024 .040 .015 .001 15.0
Mn ka .01487 1.657 2.140 .887 .062 15.0
O 31.104 .000 57.156 4.000
TOTAL: 98.952 98.952 100.000 6.998
ELEMENT K-VALUE ELEMWT% OXIDWT% ATOMIC% FORMULA KILOVOL
Si ka .10195 13.659 29.221 14.214 .995 15.0
Fe ka .47983 52.508 67.551 27.480 1.924 15.0
Ti ka .00024 .024 .040 .015 .001 15.0
Mn ka .01488 1.657 2.140 .882 .062 15.0
Mg ka .00014 .028 .046 .033 .002 15.0
Ca ka .00032 .032 .045 .023 .002 15.0
Cr ka .00045 .040 .059 .023 .002 15.0
Ni ka .00005 .006 .007 .003 .000 15.0
Zn ka .00394 .462 .575 .207 .014 15.0
O 31.269 .000 57.120 4.000
TOTAL: 99.684 99.684 100.000 7.003
Wet chem
missing elements
Wet chem plus
EPMA data
UO EPMA Workshop 2010
Fayalite Standards
Oxide Rockport Wet
Chemistry
Rockport
EPMA
RDS P-1086
EPMA
GRR391
EPMA**
MgO Not reported 0.046 0.385 0
SiO2 29.22 29.99 30.04 (29.49)
CaO 0.045 0 0.004
Cr2O3 0.059 0 0.010
MnO 2.14 2.13 0.092 0.212
FeO* 67.55 67.62 69.61 (70.34)
NiO 0.007 0.012 0.011
ZnO Not reported 0.575 0.006 0.007
Total 99.18 100.48 100.16 (100.04)
Σ M2+ 1.999 1.982 1.979 1.999
Si 1.001 1.009 1.010 1.000
Rockport WC: FeO 66.36, Fe2O3 1.32, FeO* 67.55. TiO2 0.04, H2O 0.1
EPMA: PAPF, olivine stds, Heinrich 1986 macs, 20KV, n=4 **GRR391 std Si, Fe

–22
UO EPMA Workshop 2010
Systematic Errors in Olivine M2+2SiO4
PAPF, Heinrich 1986 macs @ 20 KV, 40 TOA
Olivine
Group
Standard
Type
Analysis
Total
σ, wt% Si cations
1 ideal
σ Σ M2+
2 ideal
σ
Olivines Oxide 101.14 0.42 0.989 0.004 2.023 0.007
Syn. Olivine 100.22 0.37 0.994 0.003 2.012 0.006
Fayalites Oxide 100.93 0.20 0.990 0.001 2.022 0.001
Syn. Olivine 100.34 0.23 1.010 0.001 1.981 0.003
Mn,Ni
Olivines
Oxide 99.32 0.33 0.991 0.003 2.018 0.006
Syn. Olivine 100.07 0.30 1.002 0.003 1.995 0.005
Averages of total and cation stoichiometry for all olivines from test data set.
For olivines, Mg/(Mg+Fe) = 0.860 ± 0.080 (ox) vs. 0.861 ± 0.079 (oliv).
Identical k-ratios corrected using PAP full Φ(ρz) and Heinrich 1986 macs,
relative to oxide vs. synthetic olivine standards.
Olivine Formula: M2+2SiO4
UO EPMA Workshop 2010
Systematic Error Using Oxide Standards
Olivines: Oxide Standards / Syn. Olivine Standards
PAPF Heinrich 1986 macs 20 KV
0.975
0.980
0.985
0.990
0.995
1.000
1.005
1.010
1.015
1.020
1.025
0 10 20 30 40 50 60 70 80
Wt% Oxide in Olivine (MgO, SiO2, FeO)
Oxid
e S
tds
/ O
livin
e S
tds
Olivine SiO2
Olivine MgO
Olivine FeO
Fe FayaliteFe Olivine
Si Olivine
Si Fayalite, Mn,Ni Olivine
Mg Olivine
Mg Fayalite
UO EPMA Workshop 2010
Status Report: EPMA of Olivine
EPMA using synthetic olivine standards better than oxide standards:Superior analysis total, Si cation ~1.0, and ΣM2+ ~ 2.0
Improvement in EPMA accuracy for olivine usingArmstrong Φ(ρz) coupled with FFAST mac data set.
Using oxide standards we observe:Overcorrection of Mg and Fe in olivine across Fo-Fa binaryUndercorrection of Si in low-Mg olivine (Fayalite, Mn-ol, and Ni-ol)Marginal underestimation of Mg/(Mg+Fe).
These relationships extend to all MgFe silicates relative to composition.
Alpha-factor analysis of systematic errors in Fo-Fa system:EPMA and wet chemistry of natural olivines are not internally consistent.Worst: Boyd Forsterite Mg and Fe not consistent (Caltech standard)Best: Springwater Mg,Fe, and Mg in San Carlos (Fe in SC less so)
UO EPMA Workshop 2010
Conclusions
Quantitative EPMA emphasizes
Measurement issues and instrumental calibration
Use of good microanalysis standards
Attention to details of correction algorithms and data sets
Experimental approach which confirms all is well:
Use of Kmeas/Kcalc plot used for data analysis, WDS and EDS
CMASTF standards provide instrument calibration data set
Identification of inconsistent compositions
Accuracy of analysis in CMASTF system better than 2%, precision limited
SDD quantitative analysis data highly competitive with WDS
Always think:
Calibration, measurement, quantitation, evaluation, report and discuss