advancing financial development in latin america and the ... · pdf filedevelopment in latin...
TRANSCRIPT

WP/16/81
Advancing Financial Development in Latin America and the Caribbean
By Dyna Heng, Anna Ivanova, Rodrigo Mariscal, Uma Ramakrishnan, Joyce Cheng Wong
IMF Working Papers describe research in progress by the author(s) and are published to elicit comments and to encourage debate. The views expressed in IMF Working Papers are those of the author(s) and do not necessarily represent the views of the IMF, its Executive Board, or IMF management.

© 2016 International Monetary Fund WP/16/81
Western Hemisphere Department
Advancing Financial Development in Latin America and the Caribbean
Prepared by Dyna Heng, Anna Ivanova, Rodrigo Mariscal, Uma Ramakrishnan, and Joyce Cheng Wong
Authorized for distribution by Krishna Srinivasan
April 2016
Abstract
This paper examines the state of financial development in the Latin America and Caribbean (LAC) region as well as potential growth and stability implications from further development. The analysis suggests that access to financial institutions has expanded notably in the past decade, and the region compares favorably with other emerging market regions on this dimension. The region, however, continues to lag behind peers on broader financial development, especially with respect to markets, though there is substantial heterogeneity across countries. Financial systems in many LAC countries are also underdeveloped relative to their macroeconomic fundamentals. Further financial development could convey net benefits to the region, provided there is adequate regulatory oversight to prevent excesses.
JEL Classification Numbers: G10, G18, G20, O16, O40
Keywords: Finanical, Deepening, Latin America, Caribbean, Financial Development Index
Author’s E-Mail Address: [email protected], [email protected], [email protected], [email protected], [email protected]
IMF Working Papers describe research in progress by the author(s) and are published to elicit comments and to encourage debate. The views expressed in IMF Working Papers are those of the author(s) and do not necessarily represent the views of the IMF, its Executive Board, or IMF management.

3
TABLE OF CONTENTS
ABSTRACT _______________________________________________________________2
I. INTRODUCTION ________________________________________________________4
II. MEASURING FINANCIAL DEVELOPMENT_______________________________4
III. FINANCIAL DEVELOPMENT: WHERE DOES LAC STAND? _______________7
IV. FINANCIAL DEVELOPMENT AND MACROECONOMIC FUNDAMENTALS 10A. The Nexus Between Finance, Stability, and Growth: What is in Store for LAC? _______12
V. CONCLUSIONS AND POLICY IMPLICATIONS ___________________________17 A. Where Does Costa Rica Stand? _____________________________________________22 B. Conclusions and Policy Recommendations ____________________________________23
REFERENCES ___________________________________________________________30
FIGURES Figure 1: Non Bank Assets ____________________________________________________5 Figure 2: How to Measure Financial Development _______________________________6 Figure 3: Composite Financial Development Index vs. Traditional Measures, 2013 _______7 Figure 4: Inter-Regional Variation in Financial Development _________________________9 Figure 5: Financial Development Progress and Remaining Gaps _____________________11 Figure 6: Financial Institutions and Markets Development, and Economic Growth _______15 Figure 7: Financial Development, Growth, and Stability ____________________________16
TABLES Table 1. Estimated Equations _________________________________________________14
APPENDICES Appendix 1: Data Description and Processing ___________________________________18 Appendix 2: An Example of Framework Application to Costa Rica ___________________22

4
I. INTRODUCTION
Growth has slowed in Latin America and the Caribbean (LAC), and the region’s medium-term growth prospects have been marked down. Even during the most recent commodity super-cycle, LAC’s growth performance improved significantly relative to the previous decade but still underperformed relative to other emerging market (EM) regions. Going forward, in a less positive external environment with lower commodity prices and lower global growth, LAC countries would need to look for new growth engines. In this context, deepening financial systems through better market access, liquidity, and diversity of instruments can help unleash new growth sources, better reap the benefits from globalization, and transition to higher income levels.
Since early 1990s, many LAC countries have undertaken significant efforts to expand scope and depth of their financial systems to promote diversification and growth, cope with shocks, and enhance macroeconomic stability. This paper examines the current state of financial development in Latin America, as well as implications for potential growth and stability from further development. In particular, we construct a measure of financial development for a large sample of advanced, emerging, and developing countries, estimate financial development gaps in relation to country’s current fundamentals, and evaluate the relationship of financial development with growth and stability. The literature has investigated the link between growth and financial development, usually narrowly defined, using private credit to GDP, liquid liabilities of the financial system to GDP, stock market capitalization to GDP, market turnover ratio (Levine 1997, Levine 2005). Some studies found that there may be too much finance after a certain point (Arcand, Berkes, and Panizza, 2015, Sahay and others, 2015a). A separate line of research explored benchmarking of financial development with respect to country’s fundamentals, including income level (Feyen, Kibuuka, and Sourrouille 2014). However, the two strands of research have not been put together in a unified framework. The studies focused on financial development in LAC are relatively scarce (De la Torre, Ize, and Schmukler 2012), and the issue of “too much” finance in LAC has not been systematically examined. This paper attempts to fill in these gaps. Its contribution, compared to the existing literature, is fivefold: (i) it provides a consistent empirical framework to estimate financial development gaps at the current level of fundamentals as well as long-term relationship between growth and stability on the one hand and financial development on the other, (ii) it refines the index of financial development constructed in IMF (Sahay and others 2015a), (iii) it improves the specification of the growth/stability regressions, (iv) it employs a more comprehensive stability measure than that used in the literature, and (v) explores the state of financial development in LAC.
II. MEASURING FINANCIAL DEVELOPMENT
Financial development has proven difficult to measure in a comprehensive way. Typical proxies in the literature have included the ratio of private credit to GDP (Cavallo and

5
Scartascini, 2012, Hansen and Sulla, 2013, Arcand, Berkes, and Panizza, 2015) and, to a lesser extent, stock market capitalization (e.g. Yartey, 2008). These traditional indicators, however, are too narrow to capture the broad spectrum of financial sector activities. Indeed, non-bank financial institutions (pension funds, insurance companies, mutual funds etc.) have grown significantly over the past decade, providing opportunities for greater consumption smoothing, investment funding, and risk diversification across households and firms (Figure 1). Similarly, financial markets have grown and become more diversified, with access to market finance available to a wider set of economic agents.
To better capture different facets of these trends, a new comprehensive and broad-based index of financial development was developed by the IMF (Sahay and others 2015a). The index contains two major components: financial institutions and financial markets. Each component is broken down into access, depth, and efficiency sub-components. These sub-components, in turn, are constructed based on a number of underlying variables that track development in each area. We employ the same framework to capture financial sector development in LAC, with a few modifications (Figure 2 and Appendix 1). Even though data availability limits the choice of countries and variables for index construction, the database includes 122 countries for 1995–2013. Appendix 1 describes data processing and transformations.
All the individual variables listed in Figure 2 were normalized into an index ranging between zero and 1 using the following formula:
,
min( )
max( ) min( )it it
x itit it
x xI
x x
where ,x itI is the normalized variable x of country i on year t, min( )itx is the lowest value of
variable itx over all it; and max( )itx is the highest value of itx . For those variables for which
a decrease over time would reflect financial development, such as Interest Rate Spread, Bank Asset Concentration, Overhead Costs, Net Interest Margin, and Non-Interest Income, we use the reverse formula:
,
min( )1
max( ) min( )it it
x itit it
x xI
x x
Figure 1: Non Bank Assets (Regional averages in percent of GDP)
Sources: World Bank, FinStats and World Development Indicators; and IMF staff calculations. Note: Sum of insurance company assets and mutual fund assets in percent of GDP. Simple average across countries. EM Asia = emerging Asia; LAC = Latin America and the Caribbean; Non-Asia/LAC EM = emerging market economies excluding Asia and LAC; LIC = low income countries.
0
5
10
15
20
25
1995 1997 1999 2001 2003 2005 2007 2009 2011 2013
EM AsiaLACNon-Asia/LAC EMLIC
6
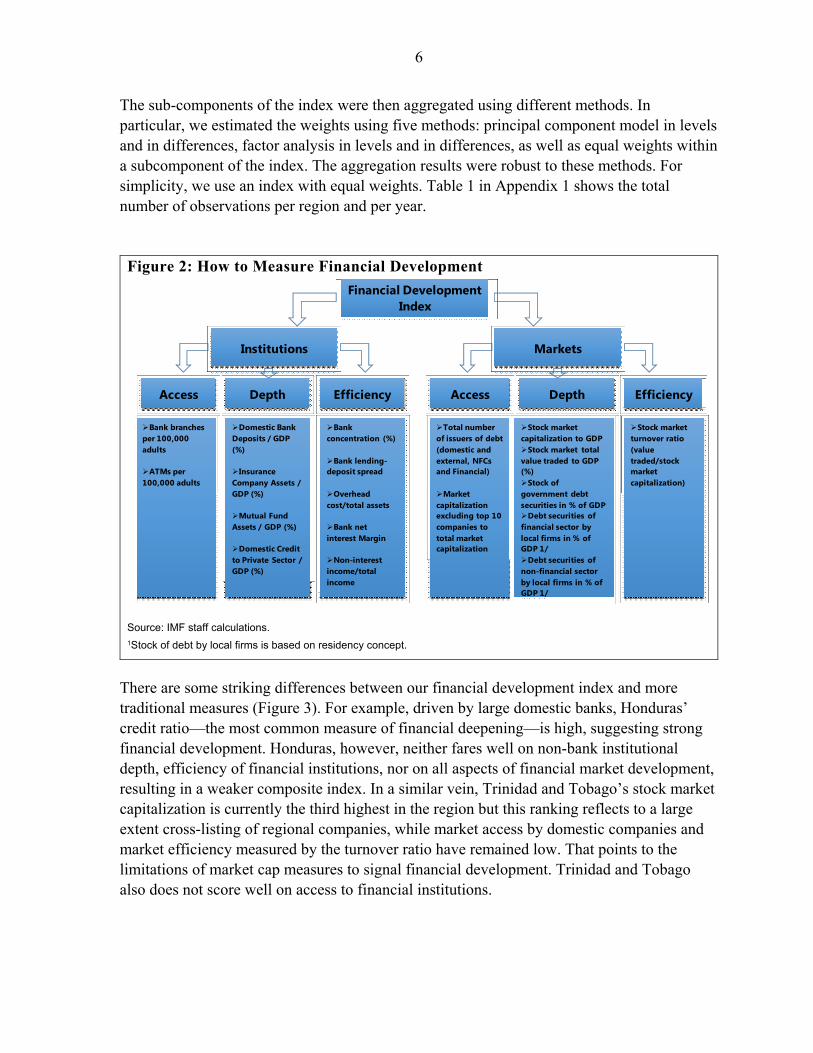
The sub-components of the index were then aggregated using different methods. In particular, we estimated the weights using five methods: principal component model in levels and in differences, factor analysis in levels and in differences, as well as equal weights within a subcomponent of the index. The aggregation results were robust to these methods. For simplicity, we use an index with equal weights. Table 1 in Appendix 1 shows the total number of observations per region and per year.
Figure 2: How to Measure Financial Development
Source: IMF staff calculations. 1Stock of debt by local firms is based on residency concept.
There are some striking differences between our financial development index and more traditional measures (Figure 3). For example, driven by large domestic banks, Honduras’ credit ratio—the most common measure of financial deepening—is high, suggesting strong financial development. Honduras, however, neither fares well on non-bank institutional depth, efficiency of financial institutions, nor on all aspects of financial market development, resulting in a weaker composite index. In a similar vein, Trinidad and Tobago’s stock market capitalization is currently the third highest in the region but this ranking reflects to a large extent cross-listing of regional companies, while market access by domestic companies and market efficiency measured by the turnover ratio have remained low. That points to the limitations of market cap measures to signal financial development. Trinidad and Tobago also does not score well on access to financial institutions.
Financial Development Index
Institutions Markets
Access EfficiencyDepth Access EfficiencyDepth
Bank branches per 100,000 adults
ATMs per 100,000 adults
Domestic Bank Deposits / GDP (%)
Insurance Company Assets / GDP (%)
Mutual Fund Assets / GDP (%)
Domestic Credit to Private Sector / GDP (%)
Bank concentration (%)
Bank lending-deposit spread
Overhead cost/total assets
Bank net interest Margin
Non-interest income/total income
Total number of issuers of debt (domestic and external, NFCs and Financial)
Market capitalization excluding top 10 companies to total market capitalization
Stock market capitalization to GDPStock market total value traded to GDP (%)Stock of government debt securities in % of GDPDebt securities of financial sector by local firms in % of GDP 1/Debt securities of non-financial sector by local firms in % of GDP 1/
Stock market turnover ratio (value traded/stock market capitalization)

7
Figure 3: Composite Financial Development Index vs. Traditional Measures, 2013
Composite Financial Development Index vs. Credit to GDP
Source: World Bank, FinStats and World Development Indicators; and IMF staff calculations.
Composite Financial Development Index vs. Stock Market Capitalization to GDP
III. FINANCIAL DEVELOPMENT: WHERE DOES LAC STAND?
Overall, countries in LAC compare unfavorably with other emerging markets (EMs) with respect to financial development. In fact, only low-income countries (LICs) lag behind LAC (Figure 4). However, results vary by component: LAC scores higher on financial institutions than on financial markets, a feature shared
with LICs. Even so, the LAC region’s scores on depth and efficiency of financial institutions lag other EM regions, as do its metrics for all the sub-components of financial market development. This pattern has also broadly held over time.
LAC excels relative to other EMs is access to financial institutions, reflecting the
emphasis that countries have placed on improving financial inclusion through improved bank and ATM networks1. However, LAC still lags other EM regions on the level of usage of financial services by households (Box 1).
There is substantial variation in financial development across LAC (Figure 5). Chile and Brazil rank the highest in the development of financial markets and financial institutions, respectively. Peru, Colombia, and Mexico are next on the list; the latter has made major strides recovering from its 1994 crisis.
1 For a detailed analysis of financial inclusion in LAC see Dabla-Norris and others 2015. The link between financial inclusion and financial stability and growth is explored in Sahay and others, 2015b.
0
20
40
60
80
100
120
0.0
0.2
0.4
0.6
0.8
1.0
BRA
CHL
PER
COL
MEX
BHS
PAN
BRB
ECU
ARG SL
VCR
IVE
NU
RY TTO
GTM BO
LH
ND
JAM
PRY
DO
MN
IC
Composite IndexCredit to GDP (percent, right scale)
0.0
0.2
0.4
0.6
0.8
1.0
1.2
1.4
BRA
CHL
PER
COL
MEX
BHS
PAN
BRB
ECU
ARG SL
VCR
IVE
NU
RY TTO
GTM BO
LH
ND
JAM
PRY
DO
MN
IC
Composite Index
Stock Market Capitalization to GDP

8
Chile’s financial reforms began in the mid-1970s, with measures to facilitate bond and equity market development. The creation of a fully-funded pension system generated a large domestic institutional investor base, which provided stable demand for private bonds of increasingly longer maturities. Reforms in the 2000s gave institutional investors further flexibility to increase the portion of their portfolios invested in domestic equities. Currently, the domestic bond market represents almost 40 percent of GDP, while the market value of listed companies in the equity market (about 90 percent of GDP) far exceeds that of its neighbors.
Brazil, in contrast, saw rapid development in both financial institutions and markets over the past decade. The government implemented a market-friendly debt management strategy, which helped develop the domestic capital market, including lengthening maturities of government bonds, building benchmarks at different points along the yield curve, and reviving the market for covered bonds. These reforms also contributed to the development of Brazil’s financial institutions—insurance company assets to GDP more than doubled in the past decade, while mutual fund assets grew from 30 percent of GDP to 50 percent of GDP, making Brazil sixth in the world, excluding financial centers. The markets for private bonds, equities, and derivatives also grew remarkably.
After its 1994 crisis, Mexico focused on increasing trust in the banking system by
strengthening regulations, reforming deposit insurance, and improving collateral execution and information sharing among credit bureaus.2 At the same time, there were also reforms to promote financial education and competition in the banking sector. All these reforms contributed to an acceleration in credit growth, which is a welcome development given the still low credit to GDP ratio.
2See Selected Issues Paper “Financial Deepening in Mexico,” by A. Klemm and A. Herman, IMF Country Report No. 15/314.

9
Figure 4: Inter-Regional Variation in Financial Development
Financial Development by Region, 2004 and 2013 Components of the Financial Development Index
by Region, 2013
Distribution Across Institutions and Markets, 20131
Source: IMF staff calculations. 1 2D histogram based on countries’ frequency. The rectangular bins show the number of countries for each combination of FI and FM. Note: ADV = advanced economies; EM Asia = emerging Asia; Non-Asia/LAC EM = emerging market economies excluding Asia and LAC; LAC = Latin America and the Caribbean; LIC = low income countries. FI= financial institutions; FM = financial markets.
Other LAC countries (such as Ecuador, Colombia, and Peru) also experienced notable progress in financial development over the past decade. In particular, Colombia, and Peru
0.0
0.2
0.4
0.6
0.8
1.0
2004 2013 2004 2013 2004 2013
Total Institutions Markets
ADVEM AsiaNon-Asia/LAC EMLACLIC
0.0
0.2
0.4
0.6
0.8
1.0
Access(FI)
Depth(FI)
Efficiency(FI)
Access(FM)
Depth(FM)
Efficiency(FM)
ADVEM AsiaNon-Asia/LAC EMLACLIC

10
took large steps in developing financial institutions as the number of commercial bank branches more than quadrupled. In Ecuador the number of bank branches also grew dramatically, driven by the expansion of two large banks and the conversion of several cooperatives into commercial banks. On the market side, with the exception of the Bahamas and El Salvador, Lac countries have not made a notable progress.
IV. FINANCIAL DEVELOPMENT AND MACROECONOMIC FUNDAMENTALS
For most LAC countries, the current stage of financial development does not appear to be fully aligned with their respective macroeconomic fundamentals. Financial development gaps—computed as the deviation of our index from a prediction based on economic fundamentals, such as income per capita, government size, macroeconomic stability, and others—can help identify potential distortions or other sources of financial under/over-development for individual countries. This analysis, however, is only suggestive, a normative assessment of the link between financial development and growth and stability is provided in the next section. The exact specification of regressions linking financial development (FD), institutions (FI) and markets (FM) development indices to fundamentals is below. Following the literature on
benchmarking financial development (Beck and others 2008) fundamentals ( FIitX ) included
initial income per capita, government consumption to GDP, inflation, trade openness, educational attainment proxied by the average number of years of secondary schooling for people 25+, population growth, capital account openness, the size of the shadow economy
(given its importance for the LAC region) and the rule of law. Instruments ( itZ ) for financial
development such as the rule of law and legal origin dummies were also used. Predicted norms were computed using the following equation:3
δ δ1 2' 'FI FI FIit it it t itFI h e= + + +X Z ,
where itFI stands for one of the financial indices (FD, FI or FM). Gaps shown on Figure 5
are the difference between the actual values of the index and the calculated norms.
3The regressions explain a large portion of the variation in financial development, with R-squares of 0.74 and 0.61 for institutions and market regressions, respectively. Nonetheless, the lack of a solid theory on the factors driving financial development implies that the correct model specification is subject to uncertainty. Hence, the gaps should be interpreted with due caution.

11
Figure 5: Financial Development Progress and Remaining Gaps
LAC: Financial Development Index (Composite index)
Latin America and the Caribbean: Changes in Financial Development Index, 2004–13 (Change of composite index between dates)
LAC: Financial Development Gaps w.r.t. Country's Own Fundamentals, 20131
Source: IMF staff calculations. 1 Gap decomposition is calculated using the aggregated reggression specification on the individual components.
Note: FI = financial institutions; FM = financial markets. For country name abbreviations, see Appendix.
Consistent with the previous studies (De La Torre and others 2012, 2014), we find that shortfalls on institutional efficiency and depth as well as market access and efficiency are common in LAC. The gaps can reflect a variety of factors. For instance, financial systems that experienced crises in the more recent past may still be in recovery mode. In the case of the Dominican Republic, which experienced a financial crisis in 2003, for example, the lower levels of development than those implied by fundamentals partly reflect the erosion of trust in financial institutions and depressed demand for credit as a consequence of the crisis. In Uruguay (banking crisis in 2002), on the other hand, the negative gap mostly reflects low access to financial institutions and markets. Negative gaps can also result from weak frameworks for obtaining or seizing collateral (for instance, Peru’s negative efficiency gap). In other cases, such as Jamaica’s negative efficiency gap, the lack of efficiency reflects both high levels of bank concentration and a historical investment dependence on low risk government debt which has hindered banks’ capacity for risk assessments when lending to the private sector, thus driving up spreads. Negative market efficiency gaps in LAC are
0.0
0.1
0.2
0.3
0.4
0.5
0.6
BRA
CHL
PER
COL
MEX
BHS
PAN
BRB
ECU
ARG SL
VCR
IVE
NU
RYTT
OG
TM BOL
HN
DJA
MPR
YD
OM
NIC
2004 2013
-0.2
-0.1
0.0
0.1
0.2
0.3
0.4
PER
ECU
PRY
BRA
COL
MEX CR
IU
RY BOL
BRB
DO
MCH
LVE
NH
ND
SLV
BHS
GTM NIC
TTO
PAN
JAM
ARG
InstitutionsMarketsTotal
-0.10
-0.05
0.00
0.05
0.10
PAN
HN
DPE
RBO
LBR
AG
TM ECU
SLV
COL
MEX NIC
VEN
PRY
CHL
CRI
JAM
DO
MU
RY
Access (FI) Depth (FI)Efficiency (FI) Access (FM)Depth (FM) Efficiency (FM)Total

12
linked to offshoring by larger companies, according to De La Torre (2012), though the underlying drivers still need to be identified. Positive gaps in financial development should also be examined for indications of potential excess or inefficiency. For example, Bolivia’s use of regulated interest rates and credit quotas for certain sectors can pose risks to banks’ profitability and generate inefficient allocation of credit. Similarly, rapid credit growth in Honduras beyond what can be justified by macroeconomic fundamentals has largely fueled consumption due to scant investment opportunities. In yet other countries, notably in Central America, positive gaps in the development of financial markets capture the fact that stock markets feature a small number of listed firms but hardly see any trading activity, lack adequate legal and contractual infrastructure, and are not viewed as an affordable financing source by the majority of domestic companies. However, positive gaps do not necessarily indicate stability problems— they simply position countries with respect to an average of countries with similar fundamentals. Countries in LAC should explore the causes behind financial development gaps. Given that macroeconomic fundamentals are often difficult to change in the short-term, policies to alleviate gaps in financial development should be tailored to address country-specific distortions, if identified (see Conclusions and Appendix 2 for an example of application of the framework developed in this paper to the case of Costa Rica).
A. The Nexus Between Finance, Stability, and Growth: What is in Store for LAC?
Financial development has been shown to be positively related to economic growth4. Efficient financial systems help channel capital to productive uses, provide insurance against shocks, reduce information asymmetries, and can potentially alleviate poverty and inequality (Beck, Demirguc-Kunt, and Levine, 2004). Sound financial systems can also foster innovation and entrepreneurship through risk diversification (King and Levine, 1993). However, recent studies document the existence of a certain threshold of financial development beyond which additional deepening generates decreasing returns to growth and stability (Arcand and others, 2012; Arcand, Berkes, and Panizza, 2015, Sahay and others, 2015a). One possible explanation is that large financial systems divert resources from productive activities to speculative and risky financial investments (Minsky, 1975)5. Also, excessive leverage and risk-taking can lead to increased economic and financial volatility with potentially negative consequences for long-term growth, especially if regulation and supervision are inadequate (IMF, 2003; Reinhart and Rogoff, 2011; Sahay and others, 2015a; and Sahay and others, 2015b).
4Goldsmith (1969), McKinnon (1973), Shaw (1973), Beck and Levine (2004) and Levine (2005). 5Diminishing returns to growth from financial development were also documented in Cecchetti and Kharroubi (2012, 2015), Reshef (2013), Aizenman and others (2015), Cournède and others, (2015), and IMF (2015).
13
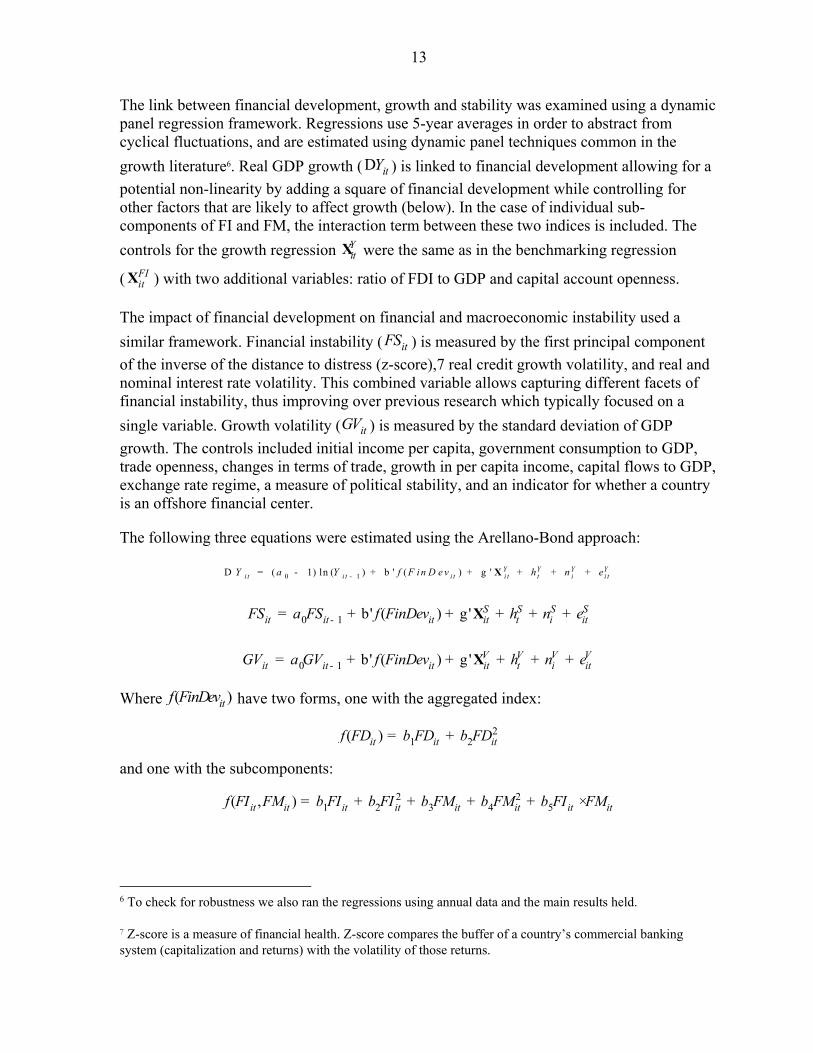
The link between financial development, growth and stability was examined using a dynamic panel regression framework. Regressions use 5-year averages in order to abstract from cyclical fluctuations, and are estimated using dynamic panel techniques common in the
growth literature6. Real GDP growth ( itYD ) is linked to financial development allowing for a
potential non-linearity by adding a square of financial development while controlling for other factors that are likely to affect growth (below). In the case of individual sub-components of FI and FM, the interaction term between these two indices is included. The
controls for the growth regression YitX were the same as in the benchmarking regression
( FIitX ) with two additional variables: ratio of FDI to GDP and capital account openness.
The impact of financial development on financial and macroeconomic instability used a
similar framework. Financial instability ( itFS ) is measured by the first principal component
of the inverse of the distance to distress (z-score),7 real credit growth volatility, and real and nominal interest rate volatility. This combined variable allows capturing different facets of financial instability, thus improving over previous research which typically focused on a
single variable. Growth volatility ( itGV ) is measured by the standard deviation of GDP
growth. The controls included initial income per capita, government consumption to GDP, trade openness, changes in terms of trade, growth in per capita income, capital flows to GDP, exchange rate regime, a measure of political stability, and an indicator for whether a country is an offshore financial center.
The following three equations were estimated using the Arellano-Bond approach:
0 11) ln ( )( ' ( ) ' Y Y Y Yi t i t i t i t t i i tY Y f F i n D e va h n e-D = + b g + + +- + X
0 1 ' ( ) ' Sit
S S Sit iti t i itt f FinDevFS FSa h n e-= + b + g + + +X
0 1 ' ( ) ' V V V Vit it it it t i itGV GV f FinDeva h n e-= + b + g + + +X
Where ( )itf FinDev have two forms, one with the aggregated index:
21 2( )it it itf FD FD FDb b= +
and one with the subcomponents:
2 21 2 3 4 5( , )it it it it it it it itf FI FM FI FI FM FM FI FMb b b b b= + + + + ×
6 To check for robustness we also ran the regressions using annual data and the main results held.
7 Z-score is a measure of financial health. Z-score compares the buffer of a country’s commercial banking system (capitalization and returns) with the volatility of those returns.

14
Table 1. Estimated Equations
Dependent Variable
FinancialInstability
GrowthVolatility
Growth
FD -6.457* (3.814)
-21.42*** (7.270)
11.47* (6.279)
FD2 6.263 (5.735)
23.74** (10.82)
-12.38* (6.556)
∆ FD 5.283** (2.160)
8.423** (4.008)
5.698* (3.075)
FI -13.75** (5.419)
-27.89*** (9.533)
30.83*** (8.788)
FI2 18.64** (8.123)
36.38** (14.45)
-48.36*** (11.58)
FM -0.772 (3.119)
-6.779 (5.345)
-0.586 (3.987)
FM2 3.360 (4.886)
18.02** (8.324)
-12.35** (5.314)
FM*FI -5.140 (9.730)
-5.354 (15.81)
27.27** (13.16)
∆ FI 4.753** (2.114)
14.08*** (3.708)
7.088** (2.958)
∆ FM 3.190* (1.672)
-2.335 (2.846)
0.508 (2.222)
Obs. 143 143 158 158 301 301
Source: IMF staff calculations. Note: Standard errors in parentheses*** p<0.01, ** p<0.05, * p<0.1
Following previous studies on this topic, we also find non-linear relationships between financial development and growth (Table 1 and Figure 6), and between financial development and instability in LAC.8 Financial development initially lowers the risk of macroeconomic instability, perhaps by creating greater opportunities for risk management, insurance, and diversification. However, there appears to be a turning point after which the marginal contribution to greater stability turns negative (Appendix).9 Similar non-linearity also holds for financial development and growth, which is particularly pronounced in the
8We use a measure of financial instability calculated as the first principal component of the inverse of the z-score (the distance to distress), real credit growth volatility, and real and nominal interest rate volatility. For growth volatility the standard deviation of GDP growth is used.
9We tried testing the relevance of regulatory quality, as proxied by a dummy variable based on a z score (see Appendix), as a conditioning variable for the link between financial development and growth. However, adequately measuring regulatory quality presents a serious challenge due to (i) the lack of an appropriate measure across countries and over time, and, more important, (ii) because most regulatory changes occur in response to financial crises which also affect growth, causing endogeneity problems for the regression.

15
relationship between institutional depth and growth. This maybe because a large financial system is more likely to give room for excessively risky behavior (Bruno and Shin, H. Song, 2014; Rajan 2005), which could generate excessive credit creation. This may, in turn, portend large credit losses and macroeconomic instability, thus hindering strong and durable growth (Cecchetti and Kharroubi 2015). However, the linear relationship between growth and financial services efficiency suggests continued welfare gains from a more efficient financial sector though there could be stability costs as reduced bank profitability could provide incentives to diversify into riskier business areas. The latter, however, is not necessarily the case – e.g. efficiency gains in the financial systems dominated by inefficient public banks could be obtained by creating a level playing field for private banks without increase in risk-taking. Comparing financial institutions and markets, while the relationship for financial institution development is quite robust across growth and stability regressions, effects from financial market development on any of the endogenous variables are weaker at lower levels of financial market development but become important at the higher development levels for growth and growth volatility. Financial market development is also complementary to institutional development in terms of raising growth.
Figure 6: Financial Institutions and Markets Development, and Economic Growth
Contribution to Growth by Institutions and Markets1
LAC: Composite Indices and Growth
Contribution, 20132
Source: IMF staff calculations. 1Surface shows the predicted effect in growth for each level of the indices, holding fixed other sets of controls. 2The lines show the levels of contribution to growth projected from a three-dimensional surface to a two-dimensional plane; the dots show the financial institutions and markets combination for selected LAC countries
Regression evidence also suggests that too much market development at the early stages of institutional development may have negative effects on stability. This is likely because the increased volatility from market development dominates when financial institutions are not strong enough to help insure against shocks. In particular, rapid market development driven by liberalization and deregulation without sound institutional and legal setting can make a country more vulnerable to market manipulation, volatile capital flows, and financial crises (Laeven 2014, De La Torre and Schmukler 2006). For similar levels of development,

16
however, institutions and markets complement each other positively for both growth and stability. Hence, a gradual approach, aimed at first securing gains in institutional development before taking steps towards market development, may be warranted. In sum, there is scope for further financial development in LAC over the longer horizon. Most of the countries in the region have not yet reached the turning point where marginal growth dividends from additional financial development become negative. Brazil and Chile are nearest this “optimum” level of financial development, whereas the Dominican Republic, Paraguay, and Honduras are on the opposite side of the spectrum (Figure 7). Note that these relationships stem from a partial analysis that assumes that all other growth determinants (such as income level, inflation, government size, etc.) are held constant while financial development is consistent with the level of macroeconomic fundamentals.
Figure 7: Financial Development, Growth, and Stability
Predicted Contribution to Growth1 Predicted Contribution to Growth Volatility2
Source: IMF staff calculations. Note: For country name abbreviations, see page [xx]. 1Curve shows the predicted effect in growth for each level of the index, holding fixed other sets of controls. 2Curve shows the predicted effect in growth volatility for each level of the index, holding fixed other sets of controls. Growth volatility refers to the standard deviation of GDP growth rate over 5-year samples.
Thus, in the longer term, reaping maximum benefits from financial development for growth and stability would also require improving a country’s macroeconomic fundamentals, which in turn would support the further development of financial systems. This is an interactive process whereby financial systems are shaped by fundamentals, and fundamentals evolve partly as a function of more developed financial systems. Estimates should, however, be interpreted with caution since it is difficult to disentangle causality in econometric terms, even though instrumental variables were used to address potential endogeneity issues.10
10We use system GMM estimation (Arellano and Bover, 1995; Blundell and Bond, 1998) to address the dynamic dependence of our variables of interest and potential endogeneity of control variables. We also employ additional instrumental variables used in the literature, namely, rule of law (Kaufmann, Kraay and Mastruzzi 2010) and a set of dummies for the country’s legal origin (La Porta, Lopez-de-Silanes and Shleifer 2008).
DOMPRYHND
CRISLVPAN
MEXCOLPERCHL BRAAvg. G7
-2.0
-1.0
0.0
1.0
2.0
3.0
0.0 0.1 0.2 0.3 0.4 0.5 0.6 0.7 0.8 0.9 1.0
Cont
ribut
ion
to G
row
th
Financial Development Index
Predicted functionActual Index (2013)
DOMPRY
HNDCRI SLV
PANMEXCOLPERCHLBRAAvg. G7
-6.0
-4.0
-2.0
0.0
2.0
4.0
0.0 0.1 0.2 0.3 0.4 0.5 0.6 0.7 0.8 0.9 1.0
Cont
ribut
ion
to G
row
th
Vola
tility
Financial Development Index
Predicted functionActual Index (2013)
17
V. CONCLUSIONS AND POLICY IMPLICATIONS
Financial systems in LAC have developed and deepened in recent years but continue to lag other emerging market groupings, especially with respect to financial market development. More importantly, some countries have financial development gaps compared with the levels implied by their macroeconomic fundamentals. In particular, gaps on institutional efficiency and depth as well as market access and efficiency are common. Given that the fundamentals are sticky in the short term, countries should explore policies tailored to their own circumstances and that aim to remove the distortions and, in turn, help close the financial development gaps, if any. While there is no one-size-fits-all solution, the literature points to several important building blocks for a well-functioning financial system such as (i) strong property rights; (ii) efficient legal system; (iii) low incidence of corruption; (iv) sufficient financial information; (iv) good corporate governance; and (v) sound prudential regulation and supervision of the banking system (Mishkin 2007, Laeven 2014). These building blocks could be useful in designing policies geared toward closing financial development gaps in LAC. For example, LAC countries that are recovering from financial crises could benefit from improving the credibility of financial systems, strengthening capital and liquidity buffers, ensuring credible deposit insurance, and addressing balance-sheet mismatches. Many of these reforms were undertaken in Mexico after the 1994 crisis and have proven invaluable—although a negative financial development gap still remains in Mexico. Countries that have negative gaps in the depth and efficiency of financial institutions (such as the Dominican Republic, Jamaica and Peru) could explore strengthening institutional and legal frameworks related to property rights and collateral, as well as improving the efficiency of courts and credit reporting systems (Emerging Market Committee, 2012).
Similarly, LAC countries that have underdeveloped bond markets (such as Costa Rica and Uruguay) could benefit from following market-friendly debt management and issuance strategies to help foster secondary markets for government securities, such as the use of standardized simple instruments with conventional maturities, as well as strengthening legal and regulatory frameworks.
Finally, countries where stock markets are underdeveloped or inefficient, which includes the majority of LAC countries, could benefit from strong macroeconomic environment, institutional and legal frameworks, which promote investor rights, information disclosure, as well as policies that increase market size (e.g., pension reforms, carefully sequenced financial liberalization, corporate governance and tax reforms; see Laeven 2014). However, in smaller LAC economies developing domestic equity markets may not be justified due to the small market size. Hence, a careful investigation of specific country circumstances with the view of identifying constraints, including those outside of the financial sector such as poor corporate governance, as well as tradeoffs is needed.In countries where financial development levels

18
are higher than those implied by macroeconomic fundamentals (i.e., positive development gaps), efforts could be reinforced to enhance supervisory vigilance aimed at improving credit quality and avoiding problems of poor underwriting quality as well as strengthening macroprudential policy frameworks.
In the longer term, as fundamentals continue to evolve, LAC countries could benefit from further financial development by stimulating economic growth without jeopardizing macroeconomic and financial stability. The process, however, is likely to be gradual and iterative with income growth supporting financial development and vice versa.
When financial development proceeds too fast, it can lead to economic and financial instability, especially where regulation and supervision do not keep pace. Hence, developing regulation and supervision that are consistent with the existing level of financial development and embed enough flexibility to address future challenges in financial deepening is an important safeguard.
The sequencing of reforms could also be important. Indeed, care should be taken in not promoting excessive market development when financial institutions are underdeveloped, since this would jeopardize macroeconomic and financial stability.
Lastly, since financial integration will move in tandem as regional financial systems develop, care should be taken to reap the benefits from integration while safeguarding against risks. Furthering financial integration could help generate regional economies of scale (especially for smaller countries) enabling markets to achieve minimum viable sizes and facilitate regional risk diversification. On the other hand, closer interconnections would also require coordination across supervisory and regulatory agents in order to ensure appropriately organized responses (Enoch and others, 2016).

19
APPENDIX 1: DATA DESCRIPTION AND PROCESSING
In this section we explain how we construct the Index of Financial Development (FD) and its components. Also, we explain where we get the data and how we process the information to produce the final Index. Table 2 shows Index’s components and subcomponents.
Sources and data gathering Our data sources are referred in Table A1. We found annual data starting in the 1960s but for nearly all of the countries the data were only available from mid 1990s. Therefore, we decide to set our period of analysis from 1995 to 2013 (the last date available in most cases). Yet, the database was inadequate for building an index. For example, data gaps and outliers did not reflect accurately the general trends in the data. Most countries in Middle East, Sub-Sahara Africa and Latin America had large data gaps. As for some variables, like ATMs per thousands of adults, we could only find data available from 2004.
Table A1: Variables and Sources
1/ Stock of debt securities. Sub nationality refers to the stock of debt issued by all the firms located inside the country. We take on count all the issuance of national firms and foreign subsidiaries but leaving out the national subsidiaries located abroad.
Building a consistent dataset
To build a consistent dataset across regions and countries, and to obtain the longest possible sample period, we supplement and extrapolate the data where feasible. The data conversions also help with achieving a balanced panel. We supplement the data with national sources: from central banks and national statistic agencies. Alternative, the Federal Reserve Bank of St. Louis and the World Federation of Exchanges were used. Nonetheless, most of the data came from the IMF’s Financial Sector Assessment Program reports (FSAPs). For those countries that we could not find any data to fill the gaps, we use a linear interpolation procedure: that is the same as to fill the gaps with a linear projection between two available data points.
Indices Subcomponents Variables SourcesAutomated teller machines (ATMs) (per 100,000 adults) World Bank, WDINumber of Branches Per 100,000 Adults, Commercial Banks World Bank, FinStats; IMF, Financial Access SurveyDomestic credit to private sector / GDP (%) World Bank, WDIMutual Fund Assets / GDP (%) World Bank, FinStats and NBFI databaseInsurance Company Assets / GDP (%) World Bank, FinStats and NBFI databaseDomestic Bank Deposits / GDP (%) World Bank, FinStats and WDI; IMF, IFSInterest rate spread (lending rate minus deposit rate, %) World Bank, WDIBank net interest margin (%) World Bank, Global Financial Development (GFD)Non-Interest Income / Total income (%) World Bank, FinStats; BankscopeOverhead Costs / Total Assets (%) World Bank, FinStats; Bankscope3 Bank Asset Concentration (%) World Bank, FinStats; BankscopeTotal number of issuers of debt (domestic and external, NFCs and Financial) Dealogic, supplement from SPRMarket capitalization excluding top 10 companies to total market capitalization (%) World Bank, GFD; World Federation of ExchangesMarket capitalization of listed companies (% of GDP) World Bank, WDIStocks traded, total value (% of GDP) World Bank, WDIOutstanding International Public Debt Securities / GDP (%) BIS, Debt securities statisticsDebt securities of financial sector by sub nationality in % of GDP 1/ DealogicDebt securities of non-financial sector by sub nationality in % of GDP 1/ Dealogic
Efficiency Stock market turnover ratio (value traded/stock market capitalization) World Bank, WDI
Depth
Fina
ncia
l Mar
kets
Fina
ncia
l Ins
titu
tion
s
Depth
Access
Access
Efficiency

20
We identify outliers using two methods that take on count the trending nature of most of the series. Taking one country and one variable at the time, we estimate the trend component in the series and calculate the gap between the actual and the trend11. We define an outlier as a point in time that is 3 standard deviations above or below our calculated gap. In some rare cases, however, where 2 or 3 outliers stand close to each other, this method did not single them out of the estimated trend; instead, these values pull the estimated trend closer to them. Hence, we run a second procedure: we calculate the growth rate of the variables, and taking one variable per country at the time, we define an outlier as a point where the growth rate exceeds 3 standard deviations of the sample period. Finally, we drop all the outliers and replace them with the linear interpolation method —just as we did at the beginning. A clean database with no gaps and with unbalanced samples was still not adequate to carry out principle components analysis for aggregation. Thus, we extrapolate the data backwards using a method called exponential smoothing12. We apply this method to every variable per country back to 1995. We also tried other methods instead, but this last seemed to be the most conservative of all. To extrapolate forward, in each case, we simply use the last observation available in the sample to replace the missing values forward. There were not many cases that needed forward extrapolation; typically only one year forward. Table A2 shows the number of available observations per region per year. The index constructed this way was aggregated as described using principle component and factor analysis as well as equal weights. The factor weights are theoretically most appropriate as the goal of the exercise is to identify the common factor underlying the movements in the variables (see also Amidžić, Massara, and Mialou (2014) and Cámara and Tuesta (2014) on the discussion of theoretical advantages of common factor analysis for weights construction). However, since the results turned out to be very similar (Table A2) for simplicity we present the results for the index with equal weights. The main differences between the index employed in this paper and that constructed in Sahay and others 2015a can be summarized as follows:
11 The estimation of the trend component and the cycle uses a Hodrick-Prescott (HP) filter with a lambda equal to 6.25. 12 See for example Holt (2004) and the references therein.
Table A2: Regions and Coverage
Region Countries Per year
Total obs.
East Asia Pacific 13 247
Europe and Central Asia 43 817
Latin America 22 418
Middle East and North Africa 12 228
North America 2 38
South Asia 6 114
Sub-Sahara Africa 24 456
Total 122 2,318

21
Our index is supplemented with additional data from IMF Financial Sector
Assessment Programs and country reports. We extend the data back to 1995 while Sahay and others 2015a extend the missing series back to 1980.
We use exponential extrapolation method in contrast to the average growth rates of all the non-missing observations of the variable employed in Sahay and others 2015a.
We employ a different procedure for eliminating outliers, namely, we eliminate observations that exceed three standard deviations above or below the trend while Sahay and others 2015a eliminate observations below the 5th and above the 95th percentiles. To fill in the resulting gaps from dropped outliers we use simple linear interpolation technique while Sahay and others 2015a employ a winsorization technique, which replaces the outliers with the values for the 5th and the 95th percentiles, respectively.
We use equal weights while Sahay and others 2015a employ principle component analysis for index construction.

22
APPENDIX 2: AN EXAMPLE OF FRAMEWORK APPLICATION TO COSTA RICA This Appendix examines how the framework presented in the paper can be applied in the case of particular country such as Costa Rica.
Where Does Costa Rica Stand? Costa Rica’s financial system deepened notably in the past decade but continues to lag behind those of other emerging markets. The improvements came from growth in financial institutions, in particular, better institutional access and improved efficiency. In contrast, market development stagnated. Despite the recent progress, Costa Rica continues to lag behind other emerging markets on many dimensions. In particular, it lags other EM groups on all of the subcomponents of financial market development. It is also behind other EMs on some aspects of institutional development, though performance varies by component. In fact, Costa Rica compares favorably on institutional access, outperforming all other EM country groupings. Good access reflects a relatively wide network of ATMs and bank branches per 100,000 adults. However, the country lags behind other EMs on institutional efficiency, though it slightly exceeds the LAC average on this component. Low efficiency reflects high interest rate spreads, high overhead costs, and high net interest margins. Finally, Costa Rica is behind all other country groupings on institutional depth due to the low level of credit and deposits to GDP as well as small mutual fund and insurance industries.
Figure A2-1. Costa Rica: Financial Sector Development
Source: IMF Staff calculations.
Costa Rica’s financial development is also below the levels predicted by country’s fundamentals. A simple cross-country comparison above does not account for differences in the underlying macroeconomic conditions. Financial development gaps—the deviation of the financial development index from a prediction based on economic fundamentals, such as income per capita, government size, and macroeconomic stability—can help identify potential under or overdevelopment of Costa Rica, compared to countries with similar fundamentals. These gaps suggest that Costa Rica’s financial development is below the
0.00
0.02
0.04
0.06
0.08
0.10
0.0
0.1
0.2
0.3
0.4
1995
1996
1997
1998
1999
2000
2001
2002
2003
2004
2005
2006
2007
2008
2009
2010
2011
2012
2013
Total indexFinancial institutionsFinancial markets (rhs)
Costa Rica: Financial Development Index(Index, highest level = 1)
-0.1
0.1
0.3
0.5
0.7
0.9
1.1
1.3
1.5
Tota
l
Tota
l
Acce
ss
Dep
th
Effic
ienc
y
Tota
l
Acce
ss
Dep
th
Effic
ienc
y
Overall Institutions Markets
Costa Rica and Emerging Markets: Financial Development, 2011
EM Asia
LAC
Non-Asia/LAC EM
CRI

23
levels predicted by its macroeconomic fundamentals on all but two subcomponents. The exceptions are two narrow measures of institutional efficiency, namely, 3-bank asset concentration and non-interest income. Other measures, however, including lending-deposit spread, bank interest margin, and overhead cost, point to inefficiencies in the banking sector. To the extent that the negative gaps reflect distortions or market frictions, they need to be addressed. For example, high interest rate spreads are likely a reflection of the substantial presence of public banks, which lack strong incentives to improve efficiency. The relatively low credit-to-GDP ratio at least to some extent reflects a weak legal collateral framework, which was in place before 2015, and was probably one of the causes of the high collateral-to-loan ratio.
Costa Rica has not yet reached the levels of institutional and market development that yield maximum benefits to growth and stability. Costa Rica is still far away from reaping the maximum benefits to growth and stability, in particular, in terms of financial market development. In the longer term, reaping maximum benefits from financial development for growth and stability would require improving Costa Rica’s macroeconomic fundamentals.
Conclusions and Policy Recommendations
Costa Rica’s financial system deepened notably in the past decade, but continues to lag behind those of other emerging markets as well as the level of development implied by its macroeconomic fundamentals.
Given that the fundamentals are sticky in the short term, Costa Rica should aim at removing distortions that prevent the country from reaching its full financial development potential given the current state of macroeconomic fundamentals.
To facilitate deepening on the side of financial institutions, Costa Rica should follow through on the modernization of its collateral framework while balancing it with proper regulation and supervision. In 2015, the country adopted a new secured transactions law that establishes a functional secured transactions system and a modern, centralized, notice-based collateral registry. The law also broadened the range of assets that can be used as collateral, including intangibles such as intellectual property rights, allowed a general description of assets granted as collateral and permitted out-of-court enforcement of collateral. Nevertheless,
Figure A2-2: Costa Rica’s Financial Development Gaps
Source: IMF Staff estimates.
-60 -50 -40 -30 -20 -10 0 10 20
Domestic Bank Deposits / GDP (%)Market capitalization (% of GDP)
Domestic credit to private sector (% of GDP)Market capitalization excluding top 10
Stocks traded, turnover ratio (%)Securities of financial sector in % of GDP
Stocks traded, total value (% of GDP)Total number of issuers of debt
Insurance Company Assets / GDP (%)Securities of non-financial sector in % of GDP
Mutual Fund Assets / GDP (%)Interest rate spread
Commercial Banks, per 100,000 AdultsATMs, per 100,000 adults
Overhead Costs / Total Assets (%)Public Debt Securities / GDP (%)
Bank net interest margin (%)Non-Interest Income / Total income (%)
3 Bank Asset Concentration (%)
Gaps with respect to fundamentals

24
careful monitoring is warranted at this stage to hinder abuse as the new system is being tested.
To improve efficiency of financial intermediation it should ensure a level playing field for private banks compared to public banks. An important first step would be to remove the explicit guarantee currently given by the state to all colon-denominated deposits in state banks.
Costa Rica could benefit from following market-friendly debt management and issuance strategies to help foster secondary markets for government securities, such as the use of standardized simple instruments with conventional maturities, as well as strengthening legal and regulatory frameworks.
To promote the development of the stock market Costa Rica would certainly gain from a more robust macroeconomic environment, as well as stronger institutional and legal frameworks, which promote investor rights, information disclosure, as well as policies that increase market size, in particular, those supporting the development of an institutional investor base In recent years, an important step has been taken by allowing private participation into the insurance sector where it used to be a state monopoly but more could be done to encourage further entry. Strengthening protection of minority investors – an area where Costa Rica does not score well in Doing Business indictors - could also help. Finally, reviewing tax treatment of securities issuance and investment to make the tax system more attractive to issuers may be warranted as long as it does not jeopardize fiscal sustainability objectives.
In the longer term, as fundamentals continue to evolve, including toward a higher income per capita, further financial development would be advantageous for Costa Rica in terms of growth and stability, provided there is adequate regulatory oversight to prevent excesses.

25
Figure A2-3: Financial Development Indices and Sub-indices by Country
Source: IMF Staff calculations.
0.00
0.10
0.20
0.30
0.40
NIC
PRY
ECU
HN
DG
TMCRI
DO
MBO
LVE
NTT
OU
RYSLV
BHS
JAM
PAN
BRB
ARG
COL
MEXPER
BRA
CHL
FD Markets
2004 2013
0.00
0.10
0.20
0.30
0.40
0.50
JAM
NIC
DO
MPR
YAR
GBO
LU
RYH
ND
TTO
SLV
VEN
MEX
GTMCR
IBR
BPA
NCH
LBH
SPE
RCO
LEC
UBR
A
FD Institutions
2004 2013
0.00
0.10
0.20
0.30
0.40
ECU
TTO
URYNIC
BRB
BHS
BOL
PRY
SLV
HN
DJA
MPA
ND
OM
VEN
GTMCR
ICO
LAR
GM
EXPER
BRA
CHL
FD Markets, Access
2004 2013
0.00
0.20
0.40
0.60
0.80
NIC
JAM
PRY
SLV
BOL
DO
MTT
OU
RYVE
NAR
GM
EXBRB
HN
DCH
LCR
IPA
NG
TMBHS
COL
BRA
ECU
PER
FD Institutions, Access
2004 2013
0.00
0.05
0.10
0.15
0.20
0.25
NIC
PRY
ECU
HN
DG
TMCRI
DO
MAR
GBO
LVE
NTT
OM
EXPER
BRA
COL
URYSLV
CHL
BHS
JAM
PAN
BRB
FD Markets, Depth
2004 2013
0.00
0.05
0.10
0.15
0.20
ARG
DO
MEC
UN
ICVE
NM
EXG
TMPER
URYPR
YCR
ICO
LSL
VBO
LJA
MH
ND
TTO
BRA
PAN
BHS
CHL
BRB
FD Institutions, Depth
2004 2013
0.00
0.02
0.04
0.06
NIC
BHS
HN
DD
OM
VEN
BRB
BOL
SLV
TTO
URY
PAN
CRI
ECU
JAM
ARG
PRY
PER
GTMCO
LCH
LM
EXBR
A
FD Markets, Efficiency
2004 2013
0.00
0.20
0.40
0.60
0.80
JAM
DO
MN
ICPE
RAR
GPR
YH
ND
GTMEC
UBR
BTT
OU
RYBO
LCR
ICO
LBR
AVE
NM
EXSLV
BHS
CHL
PAN
FD Institutions, Efficiency
2004 2013

Table A2-1 Index Components
Variable1 ARG BHS BOL BRA BRB CHL COL CRI DOM ECU GTM HND JAM MEX NIC PAN PER PRY SLV TTO URY VEN
Automated teller machines (ATMs) (per 100,000 adults) 51.4 74.4 27.9 118.6 36.5 67.3 35.8 54.7 30.7 43.6 28.7 23.6 26.7 47.3 11.9 53.5 35.6 19.8 30.7 35.6 42.7 41.4
Number of Branches Per 100,000 Adults, Commercial Banks 13.5 34.6 11.7 47.7 19.2 17.2 72.2 22.3 11.7 80.1 38.0 24.0 6.1 15.3 7.6 24.7 88.4 10.3 9.8 12.6 12.7 16.8
Domestic credit to private sector / GDP (percent) 15.8 77.4 47.0 70.7 80.6 105.9 50.2 50.4 24.0 26.7 32.6 55.2 29.6 30.6 28.8 70.7 31.4 45.8 42.7 31.1 26.8 25.3
Mutual Fund Assets / GDP (percent) 2.3 - 4.5 49.7 22.3 13.8 0.1 3.9 - 0.2 - - - 10.1 - 2.9 3.0 - 2.9 27.0 0.0 -
Insurance Company Assets / GDP (percent) 3.1 17.4 3.1 10.4 26.9 20.2 6.0 6.6 1.5 1.6 1.7 3.1 19.5 5.8 0.6 5.3 5.2 1.7 2.6 26.7 5.5 3.2
Domestic Bank Deposits / GDP (percent) 23.3 72.1 49.7 57.9 113.8 49.8 24.4 22.5 22.7 30.3 40.4 47.5 41.3 28.4 31.6 78.7 35.4 29.2 41.3 55.0 41.7 41.1
Interest rate spread (lending rate minus deposit rate, percent) 2.3 3.1 9.3 14.1 6.2 4.1 6.8 11.3 7.6 5.6 8.1 8.4 14.1 2.9 14.0 4.5 14.1 14.1 4.6 6.0 7.8 1.4
Bank net interest margin (percent) 7.1 3.5 5.1 5.0 4.6 3.6 6.1 5.7 10.1 6.8 7.6 8.8 10.1 3.0 5.8 3.2 6.2 8.2 5.9 5.1 4.9 7.8
Non-Interest Income / Total income (percent) 50.9 20.7 36.1 27.7 33.0 32.1 31.7 20.7 28.4 30.1 20.7 25.8 27.9 53.2 34.5 22.3 33.9 24.1 20.7 26.2 30.9 25.3
Overhead Costs / Total Assets (percent) 6.5 2.2 5.0 2.8 0.8 2.3 3.9 4.0 6.5 5.2 4.0 6.0 6.5 2.5 4.1 1.6 3.5 4.2 3.6 3.8 4.3 4.4
3 Bank Asset Concentration (percent) 36.0 86.0 51.1 54.4 94.6 43.0 52.8 62.0 70.8 55.9 67.0 42.9 89.1 55.2 83.7 60.3 74.2 51.4 56.5 78.7 67.3 45.3
Total number of issuers of debt (domestic and external, NFCs and Financial) 25.0 - - 141.0 - 36.0 20.0 3.0 2.0 - 3.0 1.0 2.0 65.0 - 2.0 17.0 - - - - 2.0
Market capitalization excluding top 10 companies to total market capitalization (percent) 29.9 - - 46.9 - 55.0 20.9 - - - - - - 34.1 - - 38.4 - - - - -
Market capitalization of listed companies (percent of GDP) 5.7 35.6 16.4 54.7 106.4 117.7 70.8 4.4 0.7 6.7 0.9 8.8 43.2 44.3 - 33.0 50.3 3.9 45.1 64.7 0.4 6.6
Stocks traded, total value (percent of GDP) 0.2 0.2 0.1 37.1 0.4 17.6 7.0 0.1 - 0.2 0.1 - 1.4 10.0 - 0.3 2.6 0.2 0.2 0.5 0.0 0.0
Outstanding International Public Debt Securities / GDP (percent) 7.4 10.7 6.5 2.6 12.8 1.6 5.7 5.0 5.9 1.6 3.2 - 20.4 4.3 - 23.1 7.1 - 20.0 3.9 20.7 8.0
Debt securities of financial sector by local firms in percent of GDP1 0.4 14.8 0.0 5.0 20.7 5.2 4.5 0.4 0.0 0.4 1.5 15.4 - 3.3 - 8.0 6.0 1.4 2.9 0.6 - 4.4
Debt securities of non-financial sector by local firms in percent of GDP1 3.7 65.2 2.1 13.1 36.2 22.9 9.2 4.7 5.9 1.2 2.5 5.2 31.3 19.8 2.2 30.9 11.0 1.4 3.0 13.2 4.2 15.6
Stock market turnover ratio (value traded/stock market capitalization) 3.8 - 0.5 67.9 0.4 16.0 11.2 1.9 - 2.3 6.4 - 3.0 25.3 - 1.0 5.7 5.5 0.6 0.8 0.8 0.2
Automated teller machines (ATMs) (per 100,000 adults) 21.8 63.6 13.3 105.2 34.9 33.2 27.0 26.2 18.8 3.1 21.1 4.7 18.3 27.7 3.4 33.7 10.7 12.5 20.7 31.2 27.8 21.9
Number of Branches Per 100,000 Adults, Commercial Banks 13.4 39.7 4.5 40.9 19.3 12.5 13.4 16.1 9.8 12.8 18.8 16.3 7.3 10.6 5.0 22.6 4.3 4.1 11.7 12.6 12.8 15.4
Domestic credit to private sector / GDP (percent) 8.8 61.2 42.7 29.0 66.0 75.6 27.3 32.0 25.2 19.2 26.2 38.4 20.0 15.0 19.6 85.1 18.2 14.7 41.8 36.0 24.2 11.0
Mutual Fund Assets / GDP (percent) 1.5 - 2.9 31.6 16.2 11.0 0.2 5.7 - 0.9 - - - 4.5 - 2.9 2.4 - 2.9 20.1 0.1 -
Insurance Company Assets / GDP (percent) 3.0 10.8 4.8 5.7 16.5 20.3 3.5 1.2 1.8 0.5 1.4 2.9 14.7 3.5 0.4 5.4 3.0 1.0 1.9 31.4 3.6 2.1
Domestic Bank Deposits / GDP (percent) 23.1 57.1 38.0 47.3 96.6 45.8 14.9 21.0 17.7 20.1 35.2 41.3 42.5 21.0 38.3 73.9 20.8 17.2 40.1 33.3 43.2 17.2
Interest rate spread (lending rate minus deposit rate, percent) 4.2 2.2 7.1 19.2 5.8 3.2 7.3 13.9 11.5 5.8 9.6 8.8 10.2 4.7 8.8 6.6 19.2 19.2 4.6 6.5 17.5 5.9
Bank net interest margin (percent) 2.4 1.1 4.4 7.5 4.7 4.4 4.4 7.2 9.8 6.0 6.6 6.6 7.7 7.7 8.1 3.4 6.2 7.7 5.5 4.9 5.6 9.8
Non-Interest Income / Total income (percent) 65.2 49.9 50.6 30.3 46.6 28.9 59.7 30.6 53.1 65.2 19.9 30.4 22.7 32.2 24.3 37.1 33.8 65.2 19.9 41.9 64.8 33.3
Overhead Costs / Total Assets (percent) 3.9 1.0 6.8 6.1 4.3 2.9 7.0 6.0 8.9 7.4 4.6 5.5 5.6 5.2 5.2 2.6 5.5 8.9 2.9 4.6 8.9 7.0
3 Bank Asset Concentration (percent) 45.7 70.2 48.9 47.1 100.0 53.5 34.6 55.2 66.1 48.6 45.4 53.4 79.6 62.3 72.1 37.4 76.7 43.6 68.8 79.8 54.9 39.4
Total number of issuers of debt (domestic and external, NFCs and Financial) 53.0 - - 51.0 1.0 26.0 - 1.0 - - 1.0 1.0 - 45.0 - - - - - - - 2.0
Market capitalization excluding top 10 companies to total market capitalization (percent) 20.7 - - 51.0 - 55.5 45.7 - - - - - - 38.0 - - 45.4 - - - - -
Market capitalization of listed companies (percent of GDP) 25.3 33.7 22.7 49.8 149.0 116.3 21.5 7.6 0.7 7.1 0.9 8.8 103.9 22.3 - 24.0 30.1 3.1 16.7 132.3 0.6 5.4
Stocks traded, total value (percent of GDP) 4.2 0.5 0.1 14.1 6.6 11.5 1.2 0.2 - 0.3 0.1 - 4.7 5.6 - 0.4 1.7 0.0 0.2 4.1 0.0 0.4
Outstanding International Public Debt Securities / GDP (percent) 47.3 2.8 - 9.1 8.8 3.8 10.8 9.4 6.9 17.1 4.6 - 22.6 5.9 - 40.5 9.1 - 14.7 5.3 31.7 17.0
Debt securities of financial sector by local firms in percent of GDP2 2.3 - - 3.1 5.7 0.4 0.5 0.1 - 0.9 - 5.3 - 1.5 - 5.1 0.4 - 2.8 2.3 2.3 4.2
Debt securities of non-financial sector by local firms in percent of GDP2 8.4 59.4 3.3 7.1 18.6 35.1 5.9 2.2 3.2 2.9 2.8 1.4 2.0 10.0 0.9 24.1 4.3 0.9 5.3 14.8 2.2 8.2
Stock market turnover ratio (value traded/stock market capitalization) 17.9 - 0.3 33.1 5.3 11.4 7.4 2.3 - 4.2 6.4 - 4.2 29.1 - 1.6 6.2 1.4 1.4 3.8 0.8 9.1Source: IMF staff calculations.Note: ARG = Argentina, BHS = Bahamas, BOL = Bolivia, BRA = Brazil, BRB = Barbados, CHL = Chile, COL = Colombia, CRI = Costa Rica, DOM = Dominican Republic, ECU = Ecuador, GTM = Guatemala, HND = Honduras, JAM = Jamaica, MEX = Mexico, NIC = Nicaragua, PAN = Panama, PER = Peru, PRY = Paraguay, SLV = El Salvador, TTO = Trinidad and Tobago, URY = Uruguay, VEN = Venezuela.1For index construction missing values were replaced with imputed values using procedures described in Appendix 1. 2Stock of debt by local firms based on residency concept.
2013
2004
26

Table A2-2: Weight Comparison
Factor Equal
F_factor_lev FD Total 1.00 1.00 0.00
F_factor_index3 FD Institutions 0.54 0.50 0.04
F_factor_index3_IA FD Institutions, Access 0.33 0.33 0.00
F_factor_index3_ID FD Institutions, Depth 0.34 0.33 0.01
F_factor_index3_IE FD Institutions, Efficiency 0.32 0.33 -0.01
F_factor_index4 FD Markets 0.46 0.50 -0.04
F_factor_index4_MA FD Markets, Access 0.35 0.33 0.01
F_factor_index4_MD FD Markets, Depth 0.33 0.33 -0.01
F_factor_index4_ME FD Markets, Efficiency 0.33 0.33 -0.01
FIA1_norm Automated teller machines (ATMs) (per 100,000 adults) 0.50 0.50 0.00
FIA2_norm Number of Branches Per 100,000 Adults, Commercial Banks 0.50 0.50 0.00
FID1_norm Domestic credit to private sector (% of GDP) 0.27 0.25 0.02
FID2_norm Mutual Fund Assets / GDP (%) 0.23 0.25 -0.02
FID3_norm Insurance Company Assets / GDP (%) 0.23 0.25 -0.02
FID4_norm Domestic Bank Deposits / GDP (%) 0.27 0.25 0.02
FIE1_norm Interest rate spread (lending rate minus deposit rate, %) 0.21 0.20 0.01
FIE2_norm 3 Bank Asset Concentration (%) 0.18 0.20 -0.02
FIE3_norm Overhead Costs / Total Assets (%) 0.24 0.20 0.04
FIE4_norm Bank net interest margin (%) 0.20 0.20 0.00
FIE5_norm Non-Interest Income / Total income (%) 0.18 0.20 -0.02
FMA1_norm Total number of issuers of debt (domestic and external, NFCs and Financial) 0.50 0.50 0.00
FMA2_norm Market capitalization excluding top 10 companies to total market capitalization 0.50 0.50 0.00
FMD1_norm Market capitalization of listed companies (% of GDP) 0.21 0.20 0.01
FMD2_norm Stocks traded, total value (% of GDP) 0.19 0.20 -0.01
FMD3_norm Outstanding International Public Debt Securities / GDP (%) 0.17 0.20 -0.03
FMD4_norm Debt securities of financial sector by sub nationality in % of GDP 0.21 0.20 0.01
FMD5_norm Debt securities of non-financial sector by sub nationality in % of GDP 0.21 0.20 0.01
FME1_norm Stocks traded, turnover ratio (%) 1.00 1.00 0.00
Variable DescriptionWeights
Difference
27

Table A2-3: Regression Variables, Source and Transformation
Regression Variable Transformation Source
Initial GDP per capita logs, average 1995-2000 World Bank, WDI: GDP per capita, PPP (constant 2011 international $)
Government consumption logs, 5-year averages, 1995-2013 World Bank, WDI: General government final consumption expenditure (% of GDP)
Population growth 5-year averages, 1995-2013 World Bank, WDI: Population, total
Inflation rate log(1 + inflation/100), 5-year averages, 1995-2014 World Bank, WDI: Inflation, consumer prices (annual %)
Trade to GDP logs, 5-year averages, 1995-2013 World Bank, WDI: Trade (% of GDP)
Average years of schooling 5-year averages, 1995-2013 World Bank, Education Statistics, Barro and Lee, Average years of secondary schooling, 25+, total
Size of the shadow economy, ranking 5-year averages, 1995-2013 Schneider, F., A. Buehn and C.E. Montenegro. 2010. World Bank, Policy Research Working Paper, No. 5356.
Financial Openness Index 5-year averages, 1995-2013 Chinn-Ito index: Chinn, Menzie D. and Hiro Ito (2006).
Rule of Law Index 5-year averages, 1995-2013 The Worldwide Governance Indicators (WGI), Rule of Law, Estimate.
Legal origins Dummy variable for each legal origin 1/ La Porta, R., F. Lopez-de-Silanes and A. Shleifer (2008).
Initial GDP per capita logs, average 1995-2000 World Bank, WDI: GDP per capita, PPP (constant 2011 international $)
GDP per capita growth rate 5-year averages, 1995-2013 World Bank, WDI: GDP per capita (constant LCU)
Government consumption logs, 5-year averages, 1995-2013 World Bank, WDI: General government final consumption expenditure (% of GDP)
Dummy for offshore countries 5-year averages, 1995-2013 IMF, offshore list.
Exchange Regime (Coarse Class.) 5-year averages, 1995-2013Official IMF classification of the exchange rate arrangement, published annually in the Annual Report on Exchange
Arrangements and Exchange Restrictions (AREAER).
Private capital inflows (% of GDP) 5-year averages, 1995-2013 IMF, Balance of Payments statistics.
Political Stability 5-year averages, 1995-2013 The Worldwide Governance Indicators (WGI), Political Stability and Absence of Violence/Terrorism, Estimate.
Initial GDP per capita logs, average 1995-2000 World Bank, WDI: GDP per capita, PPP (constant 2011 international $)
GDP per capita growth rate 5-year averages, 1995-2013 World Bank, WDI: GDP per capita (constant LCU)
Growth of terms of trade 5-year averages, 1995-2013 World Bank, WDI: Net barter terms of trade index (2000 = 100)
Government consumption logs, 5-year averages, 1995-2013 World Bank, WDI: General government final consumption expenditure (% of GDP)
Trade to GDP logs, 5-year averages, 1995-2013 World Bank, WDI: Trade (% of GDP)
Dummy for offshore countries 5-year averages, 1995-2013 IMF, offshore list.
Exchange Regime (Coarse Class.) 5-year averages, 1995-2013Official IMF classification of the exchange rate arrangement, published annually in the Annual Report on Exchange
Arrangements and Exchange Restrictions (AREAER).
Private capital inflows (% of GDP) 5-year averages, 1995-2013 IMF, Balance of Payments statistics.
Political Stability 5-year averages, 1995-2013 The Worldwide Governance Indicators (WGI), Political Stability and Absence of Violence/Terrorism, Estimate.
Initial GDP per capita logs, average 1995-2000 World Bank, WDI: GDP per capita, PPP (constant 2011 international $)
Government consumption logs, 5-year averages, 1995-2013 World Bank, WDI: General government final consumption expenditure (% of GDP)
Population growth 5-year averages, 1995-2013 World Bank, WDI: Population, total
Inflation rate log(1 + inflation/100), 5-year averages, 1995-2014 World Bank, WDI: Inflation, consumer prices (annual %)
Trade to GDP logs, 5-year averages, 1995-2013 World Bank, WDI: Trade (% of GDP)
Average years of schooling 5-year averages, 1995-2013 World Bank, Education Statistics, Barro and Lee, Average years of secondary schooling, 25+, total
FDI, net inflows (% of GDP) 5-year averages, 1995-2013 World Bank, WDI: Foreign direct investment, net inflows (% of GDP)
Size of the shadow economy, ranking 5-year averages, 1995-2013 Schneider, F., A. Buehn and C.E. Montenegro. 2010. World Bank, Policy Research Working Paper, No. 5356.
Financial Openness Index 5-year averages, 1995-2013 Chinn-Ito index: Chinn, Menzie D. and Hiro Ito (2006).
1/ Original variable take 4 values: English origin = 1, French origin = 2, german origin= 4, Scandinavian origin = 5.
Gaps regression
Growth volatility regression
Growth regression
Financial Instability
regression
28

29
LIST OF COUNTRY ACRONYMS
Argentina ARG
Bahamas BHS
Bolivia BOL
Brazil BRA
Barbados BRB
Chile CHL
Colombia COL
Costa Rica CRI
Dominican Republic DOM
Ecuador ECU
Guatemala GTM
Guyana GUY
Honduras HND
Haiti HTI
Jamaica JAM
Panama PAN
Peru PER
Paraguay PRY
El Salvador SLV
Trinidad and Tobago TTO
Uruguay URY
Venezuela VEN

30
REFERENCES
Aizenman, J., Y. Jinjarak and D. Park. 2015. “Financial Development and Output Growth in Developing Asia and Latin America: A Comparative Sectoral Analysis.” NBER Working Paper, No. 20917.
Amidžić, G., A. Massara, and A. Mialou. 2014. “Assessing Countries’ Financial Inclusion Standing—A New Composite Index,” IMF Working Paper WP/14/36.
Arcand, JL., E. Berkes and U. Panizza. 2012. “Too Much Finance?” IMF Working Paper, No. 161.
Arellano, M. and O. Bover. 1995. “Another Look at the Instrumental Variable Estimation of Error-components Models.” Journal of Econometrics, Vol. 68, pp. 29-51.
Beck, T., A. Demirguc-Kunt and R. Levine. 2004. “Finance, Inequality and Poverty: Cross Country Evidence.” NBER Working Paper, No. 10979.
Bernanke, B. and M. Gertler. 1999. “Monetary Policy and Asset Price Volatility.” Economic Review, Issue Q-IV, pp 17-51.
Blundell, R. and S. Bond. 1998. “Initial Conditions and Moment Restrictions in Dynamic Panel Data Models.” Journal of Econometrics, Vol. 87, pp. 115-143.
Bruno V. and Shin H. Song. 2014. “Globalization of Corporate Risk Taking”, Journal of International Business Studies, Vol. 45, Issue 7, pp. 800-820.
Cámara, N. and D. Tuesta, 2014, “Measuring Financial Inclusion: A Multidimensional Index.” BBVA Working Paper No. 14/26.
Becerra O., E. Cavallo, and C. Scartascini, 2010. “The Politics of Financial Development: The Role of Interest Groupd and Government Capabilities,” IDB Working Paper No. 207.
Cecchetti, S. G. and E. Kharroubi. 2012. “Reassessing the Impact of Finance on Growth.” BIS Working Papers, No. 381.
Cecchetti, S. G. and E. Kharroubi. 2015. “Why Does Financial Sector Growth Crowd Out Real Economic Growth?” Centre for Economic Policy Research. Discussion Paper No. 10642.
Cournède, B., O. Denk and P. Hoeller. 2015. “Finance and Inclusive Growth.” OECD Economic Policy Papers, No. 14.
Dabla-Norris, E., Y. Deng, A. Ivanova, I. Karpowicz, F. Unsal, E. VanLeemput, and J. Wong. 2015. “Financial Inclusion: Zooming in on Latin America,” IMF Working Paper No. WP/15/206.
De la Torre, A., and S. Schmukler. 2006. Emerging Capital Markets and Globalization: The Latin American Experience. Washington, DC: World Bank.
De la Torre, A., A. Ize and S. L. Schmukler. 2012. Financial Development in Latin America and the Caribbean: The Road Ahead. Washington, D.C.: World Bank.
De la Torre, A., E. Feyen and A. Ize. 2014. “Benchmarking LAC’s Financial Development: The Banking and Equity Gaps.” in Didier, T. and S. L. Schmukler (eds.) Emerging Issues in Financial Development. Lessons from Latin America. Washington, D.C.: World Bank, pp. 129-173.
Enoch, C., C. Caceres, L. Eyraud, A. Myrvoda, A. Osueke, D. Singh, B. Sutton, I. Teodoru, J. Alvares, W. Bossu, B. Jansen, L. Lorenzo, M. Pinon, M. Norat, C. Minoiu, and P. Ganum 2016. “Financial Integration in Latin America,” IMF Country Paper, FO/DIS/16/39.

31
Feyen, E., K. Kibuuka, and D. Sourrouille. 2014. “FinStats 2015: A Ready-to-Use Tool to Benchmark Financial Sectors Across Countries and Time.” World Bank, mimeo.
Goldsmith, R.W. 1969. Financial structure and development. New Haven: Yale University Press.
Hansen and Sulla, 2013. “Credit Growth in Latin America – Financial Development or Credit Boom?” IMF Working Paper, No. 106.
Holt, C. C. 2004. “Forecasting Seasonals and Trends by Exponentially Weighted Moving Averages.” International Journal of Forecasting, Vol. 20, No. 1, pp. 5–10.
IMF. 2003. “Financial Asset Price Volatility: A source for Instability”, Chapter 3, GFSR. pp.62-88.
Kaufmann, D., A. Kraay and M. Mastruzzi. 2010. “The Worldwide Governance Indicators: A Summary of Methodology, Data and Analytical Issues.” World Bank Policy Research Working Paper, No. 5430.
King, R. G. and R. Levine. 1993. “Finance, Entrepreneurship and Growth.” Journal of Monetary Economics, Vol. 32, No. 3, pp. 513-542.
Klemm, A. and A. Herman. 2015. Financial Deepening in Mexico. Selected Issues Paper; IMF Country Report No. 15/314, pp. 70-81.
La Porta, R., F. Lopez-de-Silanes and A. Shleifer. 2008. “The Economic Consequences of Legal Origins.” Journal of Economic Literature, Vol. 46, No. 2, pp. 258-332.
Laeven, L. 2014. “The Development of Local Capital Markets: Rationale and Challenges.” IMF Working Paper, No. 234.
Levine, R. “Financial Development and Economic Growth: Views and Agenda,” Journal of Economic Literature, Vol. XXXV (June 1997), pp. 688-726.
Levine, R. “Finance and Growth: Theory and Evidence,” Handbook of Economic Growth, Volume 1, Part A, 2005, Pages 865–934.
McKinnon, R. 1973. Money and Capital in Economic Development. Washington, D.C.: The Brookings Institution.
Minsky, H. 1975. John Maynard Keynes. New York: Columbia University Press.
Mishkin, F. S. 2007. “Globalization and Financial Development.” Speech to the New Perspectives on Financial Globalization Conference, Washington D.C., April 26.
Emerging Market Committee. 2012. “Development and Regulation of Institutional Investors in Emerging Markets.” International Organization of Securities Commission, No. FR04/12.
Philippon, T. and A. Reshef. 2013. “An International Look at the Growth of Modern Finance.” Journal of Economic Perspectives, Vol. 27, No. 2, pp. 73-96.
Rajan G. Raghuram. 2005 “Has financial development made the world riskier?” NBER Working paper 11728.
Reinhart, C. M., and S. R. Kenneth. 2011. This Time Is Different: Eight Centuries of Financial Folly. Princeton, New Jersey: Princeton University Press.
Ross, L. 2005. “Law, Endowments and Property Rights.” Journal of Economic Perspectives, Vol. 19, No. 3, pp 61-88.
Sahay, R., M. Cihak, P. N'Diaye, A. Barajas, D. Ayala Pena, R. Bi; Y. Gao, A. Kyobe, L. Nguyen, C. Saborowski, K. Svirydzenka, and R. Yousefi. 2015a. “Rethinking Financial Deepening: Stability and Growth in Emerging Markets.” IMF Staff Discussion Notes, No. 15/8.

32
Sahay, R., M. Cihak, P. N'Diaye, A. Barajas, S. Mitra, A. Kyobe, N. Mooi, and R. Yousefi. 2015b. “Financial Inclusion: Can It Meet Multiple Macroeconomic Goals?” IMF Staff Discussion Notes, No. 15/17.
Shaw, E. S. 1973. Financial Deepening in Economic Development. New York: Oxford University Press.
Svirydzenka, K. 2016. “Introducing a New Broad-based Index of Financial Development.” IMF Working Paper, No. WP/16/5.
Yartey, C. A. 2008. “The Determinants of Stock Market Development in Emerging Economies: Is South Africa Different?” IMF Working Paper No. WP/08/32.