advisor assessment report - · pdf filereference systems technology incorporated...
TRANSCRIPT
Reference Systems Technology Incorporated Virtustream® Advisor | Assessment Report v2014.03
Advisor Assessment Report
Client: Reference Systems Technology Incorporated Project: Reference Project
Model: 2014 Reference Model - Unix/Linux
Report: Virtustream Branding Sample Report
Version: 1.0
Date: Thursday, January 23, 2014
Prepared By: Derek Bambach
Prepared For: internal review
Classification: Discussion Document
CC:

Reference Systems Technology Incorporated Virtustream® Advisor | Assessment Report
Virtustream, Inc.
www.virtustream.com
North America
Bethesda, Maryland (Headquarters)
4800 Montgomery Lane, Suite 1100, Bethesda, MD 20814
Tel: +1.240.252.1007 Fax: +1.301.718.7880
San Francisco, California
455 Market Street, Suite 1250, San Francisco, CA 94105
Tel: +1.415.856.2501 Fax: +1.415.856.2504
Atlanta, Georgia
6 Concourse Parkway, Suite 1930, Atlanta, GA
Tel: +1.678.533.2440 Fax: +1.678.395.6998
European Offices
London, UK
3rd Floor, 78-79 Leadenhall Street, London, EC3A 3DH
Tel: +44 (0) 870 345 3525 Fax: +44 (0) 870 738 6345
Kaunas, Lithuania
Coming Soon
Copyright © 2014 by Virtustream, Inc. All rights reserved worldwide.

Reference Systems Technology Incorporated Virtustream® Advisor | Assessment Report
Document Control:
The following document details the effect that Cloud and Virtualization would have on the future Information
Technology strategy of Reference Systems Technology Incorporated.
It is based on the information provided to Virtustream in a series of meetings and also any performance analysis
that is available at the time of writing.
Information contained in this document is accurate to the best of Virtustream knowledge at the time of publication
and is required to be treated as confidential. It should not be reproduced or made available in any form to persons
outside the group directly responsible for evaluating its contents
Any performance data provided is based on relevant information made available to us at the present time, and
must (except where stated otherwise) be regarded as an estimate only, since the actual performance and
functionality of any computer system will depend upon a variety of factors, not all of which are related to the
products and services that may ultimately be supplied.
For information purposes, please find below the document control details:
Client: Reference Systems Technology Incorporated
Project Name: Reference Project
Model Name: 2014 Reference Model - Unix/Linux
Report Name: Virtustream Branding Sample Report
Doc Version: 1.0
Report Date: Thursday, January 23, 2014
Prepared By: Derek Bambach
Prepared For: internal review
Classification: Discussion Document
CC:

[Reference Systems Technology Incorporated] Virtustream® Advisor Assessment Report | 1
Contents
1. Advisor Study Objectives .................................................................................................... 3
Overview of Reference Systems Inc...................................................................................................................3
Project Background.............................................................................................................................................3
Reference Systems Inc. Objectives for the Cloud ..............................................................................................3
Cloud Options for Consideration .........................................................................................................................3
Concerns about the Cloud ..................................................................................................................................3
Success Criteria for Reference Systems Inc. .....................................................................................................3
2. Executive Summary ............................................................................................................ 4
Overview .............................................................................................................................................................4
Summary of Resource Utilization .......................................................................................................................4
Main Areas of Service Improvement...................................................................................................................4
Conclusions and Recommendations ..................................................................................................................5
3. General IT Profile ................................................................................................................ 6
IT at Reference Systems Inc. (Environment Summary) .....................................................................................6
Current Data Center Information ........................................................................................................................6
Server Estate Information ...................................................................................................................................6
Device Estate Information ...................................................................................................................................6
Network and Access Overview ...........................................................................................................................6
4. Business Continuity, Disaster Recovery, Backup and Restore ........................................... 7
Overview .............................................................................................................................................................7
Advisor Interview Results ...................................................................................................................................7
Virtualization and Cloud Services for Back-up and Restore ...............................................................................7
Virtualization as an Enabling Technology for Business Continuity .....................................................................7
Disaster Recovery Objectives .............................................................................................................................8
Business Continuity Requirements .....................................................................................................................8
Higher Systems Availability ................................................................................................................................9
Business Continuity Conclusions and Recommendations .............................................................................. 10
5. Security and Compliance Requirements ........................................................................... 11
Overview .......................................................................................................................................................... 11
Security Audit Requirements ........................................................................................................................... 11
Security and Compliance Recommendations .................................................................................................. 11
6. Performance Statistic Summaries ..................................................................................... 12
Overview .......................................................................................................................................................... 12
Measured Candidates ...................................................................................................................................... 12
CPU Peak Hour Demand Load (56 candidates) .............................................................................................. 14
CPU Consumption (56 candidates) ................................................................................................................. 15
Memory Consumption (56 candidates) ............................................................................................................ 19
Disk Activity: Input/Output Operations (56 candidates) ................................................................................... 23
Disk Activity: Volume (56 candidates) ............................................................................................................. 26
Network Data Volume (55 candidates) ............................................................................................................ 29
[Reference Systems Technology Incorporated] Virtustream® Advisor Assessment Report | 2
Storage Capacities (56 candidates) ................................................................................................................. 33
7. Aggregate Resource Utilization over Time ........................................................................ 37
Aggregate CPU Utilization ............................................................................................................................... 37
Aggregate Memory Utilization .......................................................................................................................... 37
Aggregate Disk IOPS (Read) ........................................................................................................................... 38
Aggregate Disk IOPS (Write) ........................................................................................................................... 38
Aggregate Disk Volume (Read) ....................................................................................................................... 39
Aggregate Disk Volume (Write) ....................................................................................................................... 39
Aggregate Disk IOPS (Total) ........................................................................................................................... 40
Aggregate Disk Volume (Total) ........................................................................................................................ 40
Aggregate Storage Utilization .......................................................................................................................... 41
Aggregate Network Utilization ......................................................................................................................... 41
8. Week by Week Performance Analysis for Virtualization ................................................... 42
Overview .......................................................................................................................................................... 42
Measured Performance Data – Period 1 ......................................................................................................... 44
Measured Performance Data – Period 2 ......................................................................................................... 45
Measured Performance Data – Period 3 ......................................................................................................... 46
Measured Performance Data – Period 4 ......................................................................................................... 47
9. Resource Utilization Analysis ............................................................................................ 48
Overview .......................................................................................................................................................... 48
µVM Consumption (56 candidates) ................................................................................................................. 49
10. Potential Impact of Virtualization ....................................................................................... 50
Proposed Virtualization Host Resources ......................................................................................................... 50
Combined Most Intensive Resource Utilization modelling............................................................................... 50
11. Potential Impact of Cloud Infrastructure ............................................................................ 53
Proposed Cloud µVM Resources .................................................................................................................... 53
Current Overall Resource Utilization ............................................................................................................... 53
12. Environmental Impact ....................................................................................................... 54
Overview .......................................................................................................................................................... 54
Existing Infrastructure Power Consumption .................................................................................................... 54
Impact of Virtualization Solution ...................................................................................................................... 55
Impact of Cloud Solution .................................................................................................................................. 57
13. Report Signoff ................................................................................................................... 58
14. Target List ......................................................................................................................... 59
15. About Virtustream, Inc. ..................................................................................................... 64
16. Appendix - Virtualization Explained................................................................................... 65
17. Appendix - Cloud Explained .............................................................................................. 70

[Reference Systems Technology Incorporated] Virtustream® Advisor Assessment Report | 3
1. Advisor Study Objectives
Overview of Reference Systems Inc.
[Questionnaire Section 01 - Question 03] Reference Systems Inc. provides real time system process monitoring
for industrial, utility, and military markets worldwide. The company provides tools to monitor and report on real-
time conditions and changes to manufacturing, utility, and infrastructure support systems to insure system
integrity and to create an automated alert and response system. Reference Systems Inc. offers its monitoring
tools directly and through third party distributors, and also offers additional out-sourced monitoring services to
users of its monitoring tools.
Project Background
[Questionnaire Section 01 - Question 03] Reference Systems Inc. provides real time system process monitoring
for industrial, utility, and military markets worldwide. The company provides tools to monitor and report on real-
time conditions and changes to manufacturing, utility, and infrastructure support systems to insure system
integrity and to create an automated alert and response system. Reference Systems Inc. offers its monitoring
tools directly and through third party distributors, and also offers additional out-sourced monitoring services to
users of its monitoring tools.
Reference Systems Inc. Objectives for the Cloud
[Questionnaire Section 34 - Question 03] Summary of the Client Objectives for the Cloud.
Cloud Options for Consideration
[Questionnaire Section 34 - Question 04] Summary of the Cloud Options under Consideration for this
assessment.
Concerns about the Cloud
[Questionnaire Section 34 - Question 05] Summary of the Client's concerns about the Cloud.
Success Criteria for Reference Systems Inc.
[Questionnaire Section 34 - Question 06] Consumption model, right class of server, agility, replication, DR,
backup, Increase Availability, Risk Mitigation, cost effectiveness.

[Reference Systems Technology Incorporated] Virtustream® Advisor Assessment Report | 4
2. Executive Summary
Overview
[Questionnaire Section 34 - Question 02] Executive Overview summary based on Client interviews.
This report discusses the opportunity that cloud services and virtualization technologies present to Reference
Systems Inc. and the approaches required to implement and complete a successful transformation from its
current status.
Summary of Resource Utilization
Memory, CPU, IOPS
[Questionnaire Section 34 - Question 07] Summary of current Resource Utilization.
The below chart summarizes the usage results of Reference Systems Inc.’s infrastructure in aggregate. Detailed
analysis of the systems and the implications for virtualization and cloud services is provided in Chapters 6-9.
Resource Total during Peak Period % Utilized µVMs
CPU (Mhz) 366,538 18.0% 1,833
Memory (MB) 1,920,612 83.5% 2,687
Disk I/OPS 1,826,416 N/A 1,274
Network (B/s) 1,767,340 N/A 4,307
Main Areas of Service Improvement
Potential Efficiencies from Virtualization and Cloud Services
Industry averages place CPU utilization lower than 15% per server – Reference Systems Inc. is averaging
18.0% at peak. Virtualization consolidates all this inefficiency onto fewer platforms to drive up utilization without
compromising performance / reliability.
Total Cost of Ownership
Systems Availability
Business Continuity
[Reference Systems Technology Incorporated] Virtustream® Advisor Assessment Report | 5
Conclusions and Recommendations
[Questionnaire Section 34 - Question 20] Conclusions and Recommendations based on Client interviews and
conversations.
The Advisor Report lays the initial groundwork on the current configuration of Reference Systems Inc.’s IT
infrastructure, and provides a 4-week profile of the system usage.
Virtustream recommends that Reference Systems Inc. use this Advisor Report as the baseline for developing a
Cloud Strategy and Implementation Project.
[Reference Systems Technology Incorporated] Virtustream® Advisor Assessment Report | 6
3. General IT Profile
IT at Reference Systems Inc. (Environment Summary)
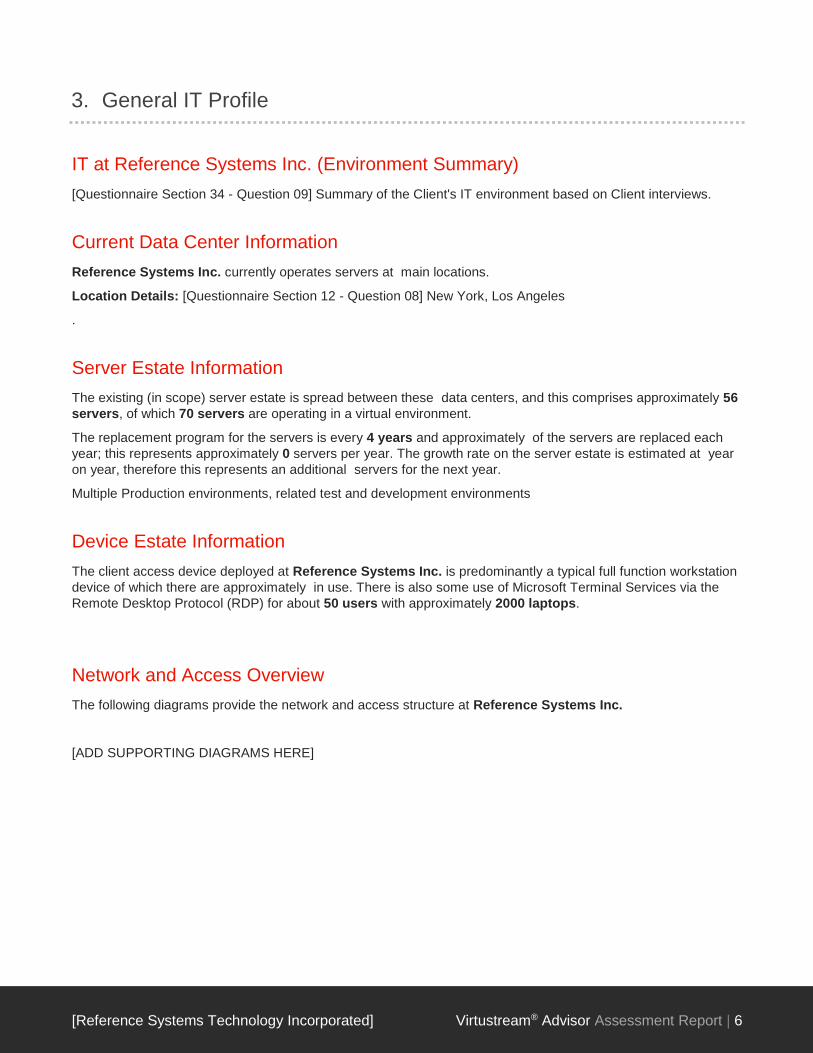
[Questionnaire Section 34 - Question 09] Summary of the Client's IT environment based on Client interviews.
Current Data Center Information
Reference Systems Inc. currently operates servers at main locations.
Location Details: [Questionnaire Section 12 - Question 08] New York, Los Angeles
.
Server Estate Information
The existing (in scope) server estate is spread between these data centers, and this comprises approximately 56
servers, of which 70 servers are operating in a virtual environment.
The replacement program for the servers is every 4 years and approximately of the servers are replaced each
year; this represents approximately 0 servers per year. The growth rate on the server estate is estimated at year
on year, therefore this represents an additional servers for the next year.
Multiple Production environments, related test and development environments
Device Estate Information
The client access device deployed at Reference Systems Inc. is predominantly a typical full function workstation
device of which there are approximately in use. There is also some use of Microsoft Terminal Services via the
Remote Desktop Protocol (RDP) for about 50 users with approximately 2000 laptops.
Network and Access Overview
The following diagrams provide the network and access structure at Reference Systems Inc.
[ADD SUPPORTING DIAGRAMS HERE]

[Reference Systems Technology Incorporated] Virtustream® Advisor Assessment Report | 7
4. Business Continuity, Disaster Recovery, Backup and Restore
Overview
Much of the content of this report focuses on new technologies and different methods to achieve objectives via
virtualization. However, one area that is still as valid as ever is the requirement for a Business Continuity Strategy
that includes a robust and reliable backup and recovery solution.
Virtustream has extensive experience in the specification, implementation and support of Enterprise backup
solutions, and virtualization has until recently presented a significant challenge with regard to backup and
recovery strategies.
Advisor Interview Results
[Questionnaire Section 34 - Question 13] Overview based on the Advisor Interview results.
For further detail on the results of this area, please see the “Business Continuity, Back-up, and Restore” section
of the Advisor Questionnaire Summary.
Virtualization and Cloud Services for Back-up and Restore
Virtualization as an Enabling Technology for Business Continuity
Reference Systems Inc. has a separate strategic review being conducted on how to improve the current disaster
recovery capabilities, and virtualization has been recognized as a potential enabling technology that could assist
in the delivery of such a strategy.
The assumption that virtualization could potentially have benefits in assisting such a strategy is well founded as
virtualization is the cornerstone technology to enabling organizations to simplify and automate the tasks required
to provide reliable and rapid disaster recovery. If all the requisite components in the technology stack illustrated
below are implemented, then this recovery can begin to move towards business continuity as in a solution that
does not need recovery as it has avoided the outage in the first place.
This report uses the following terminology to explain the evolution of disaster recovery capabilities.
Tier Terminology Explanation
1 Business Continuity The ability to cope with most types of outage and continue to provide key services with
no or very limited disruption and little or no restoration services
2 Disaster Recovery
In the event of an interruption to services a plan is activated to recover the systems
within the agreed timelines. Services are interrupted until recovery services have been
performed.
3 High Availability The ability to provide higher availability for systems within the confines of no major
outages.
Within each of the tiers, it is necessary to implement techniques, designs, technologies and processes to ensure
that the objective can be met.

[Reference Systems Technology Incorporated] Virtustream® Advisor Assessment Report | 8
Disaster Recovery Objectives
Business Continuity Requirements
Reference Systems Inc. will need to consider the following components to enable a transition to a continuity
solution. The table below indicates the required stack of components to deliver true business continuity
Component Status Requirement
Multi-Site Data Center [Add status here]
To be able to function in the event of an outage it is
a necessity that operations can operate from more
than one location.
Resilient
Communications [Add status here]
The solution is only as strong as its weakest link
and therefore the communications backbone needs
to be multi-homed and routed.
Remote access [Add status here] The ability to utilize applications remotely is critical
as the data is only useful if it can be accessed.
Replicated Data [Add status here]
The requirement to replicate data between sites so
that the need to restore from backups is minimized
or removed totally. Business continuity is all about
the ability to remove lead times.
Service availability /
resource provisioning [Add status here]
This forms the mainstay of this report to be able to
measure and quantify the resource required to
operate the services in a virtualized presentation.
Without virtualization duplicate hardware for all
services that are deemed required in a disaster
scenario would be required.
Operational planning [Add status here]
The requisite planning and testing of a Business
Continuity Solution, the creation of the procedures
to be adhered to and the test of their success. A
sound business continuity plan is an essential part
of the process.

[Reference Systems Technology Incorporated] Virtustream® Advisor Assessment Report | 9
Component Status Requirement
Semi-Automation [Add status here]
To enable the most rapid restoration of services in
the event of an outage it is a requirement that
automation or semi-automation of processes be
implemented to remove the lag introduced and the
risk of human error to repeat the tested in a true
outage situation. It is also the key to testing the
business continuity plan.
The functionality provided by the semi-automation
solution is covered in detail in the operational
management section of this report.
In summary by combining the functionality of
VMware Site Recovery Manager and its other
automation tools it will be possible for Reference
Systems Inc. to implement the semi-automation
frameworks required to simplify and more
consistently enable site failover and fail-back.
Higher Systems Availability
Like any organization, Reference Systems Inc. has expressed a desire to have enhanced systems availability
from its services. This is broken down into the following key areas:
Ability for systems to cope with outages
Improved disaster recovery capabilities through intelligent storage management
Improved agility to enable planned systems maintenance
Standardization
Improved management
Service Outages
To minimize the ability of system outages to affect services, Reference Systems Inc. should consider a design
that addresses two critical areas: storage and resource pools.
The resource pools are handled by the High Availability function of VMware vSphere server where the loss of a
host system running the underlying VMware ESX Hypervisor would instigate the servers that were being serviced
by the downed host being restarted on an alternative host. The host that will operate these servers is decided by
the Distributed Resource Scheduler (DRS) function of VI3 which finds the best placed host to service the
requests.
By building in enough resource to cope with host outages, this can facilitate both an unplanned failure and
planned maintenance in working hours.
Systems Maintenance
Systems Maintenance is essentially to maintain the wellbeing of the IT infrastructure, unfortunately this can lead
to ‘planned downtime’ to avoid ‘unplanned downtime’, the opportunity to complete this required task is getting less
and less as organizations tolerance to any interruption of service reduces.
In line with the Services Outages section, it is necessary to build in capability to perform maintenance to both the
storage and resource pools and therefore both solutions need to have this functionality.

[Reference Systems Technology Incorporated] Virtustream® Advisor Assessment Report | 10
Standardization
A key to maintaining high availability is to maintain approved standards as this minimizes the effect of variations.
Virtualization allows standard server templates to be created on a platform of uniform hardware and therefore one
of the most disruptive areas of server support that of non-standard builds or hardware is avoided, thus improving
availability.
Business Continuity Conclusions and Recommendations
[Questionnaire Section 34 - Question 01] Summary of conclusions & recommendations regarding Business
Continuity.

[Reference Systems Technology Incorporated] Virtustream® Advisor Assessment Report | 11
5. Security and Compliance Requirements
Overview
[Questionnaire Section 34 - Question 15] Summary of the security and compliance overview based on Client
interviews.
Security Audit Requirements
[Questionnaire Section 34 - Question 16] Summary of the Client's Security Audit Requirements based on Client
interviews.
Security and Compliance Recommendations
[Questionnaire Section 34 - Question 17] Summary of our Security and Compliance Recommendation for the
Client.

[Reference Systems Technology Incorporated] Virtustream® Advisor Assessment Report | 12
6. Performance Statistic Summaries
Overview
Cloud computing and Virtualization are essentially all about resource management. These approaches are, in
some ways, a return of the methodologies of mid-range and mainframe computing models. Therefore to
understand the areas that could benefit the most from virtualization, it is important to monitor and asses the
current utilization models.
The principle benefit of virtualization is in its ability to utilize underlying physical resources in a more intelligent
way by sharing resources based on service level policies. It is this ability to be flexible to the varying demands
placed upon the consolidated resources that enables organizations to drive efficiencies within the organization.
By removing significant dependencies on the underlying physical resources, it is possible to design highly
available, performance enhanced and efficient shared platforms.
Once operating in such a manner, further enhancements can be made to improve the management and
optimization of IT infrastructure through service-level automation frameworks enabling organizations to manage
more with less and more effectively.
Measured Candidates
Performance Characteristics Overall Summaries
Each area of critical importance to virtualization/consolidation is summarized complete with utilization graphs.
This includes the following areas:
CPU and Memory Trends and efficiencies
Disk IOPS Trends
Disk IOPS data volume trends
Networking Trends
Storage Capacity Requirements
Utilization Detail
As part of the process, we have run the Virtustream Advisor to collect inventory and performance information over
a four week period. The statistics have been collated to help formulate a server consolidation solution targeted at
a cloud architecture.
We use the peak load values when considering consolidation, not the weekly average. As statistics are received,
they are evaluated to determine what hour of the day the peak load is placed on each individual server. The peak
load is determined by evaluating load for a minimum of four weeks. The hour with the consistently high load will
be deemed the peak load hour, and its average value becomes the peak load for the server. These peak loads
are then correlated across the broader collection of servers to determine the optimal mix of workloads with a
virtual or cloud infrastructure.
Proposed Consolidation of Resources
Using the statistics gathered in the planning exercise, Virtustream is able to estimate actual resources required in
the target cloud environment(s) to ensure that Reference Systems Inc. has the necessary compute resources
required to meet its demands.

[Reference Systems Technology Incorporated] Virtustream® Advisor Assessment Report | 13
Performance Characteristics Week by Week Summaries
Each area of critical importance to virtualization/consolidation is summarized to create the week’s virtualization
candidate profile, and this is modelled against the proposed host resources that form the virtualization platform. It
shows the demand that the measured systems would place upon the consolidated design.
A Guide to the Measured Statistics
Resource Explanation
CPU Util. MHz A calculation of the peak average MHz load placed upon the existing server estate based on %
utilization against the total amount of CPU installed
RAM Used MB A calculation of the utilized memory (RAM) in MB against the allocated resource
Disk Size GB The total amount of Hard Disk space allocated to the server
Disk Used GB The total amount of allocated disk space actually used by the server
Disk IOPS The total storage Input/output operations
Disk Reads/Writes B/s The total of the IOPs with regard to read and write operations
Network Traffic B/s A measure of how busy the server network card is, taken from the average data throughput in
bytes per second
Data Collection Periods
Period One: 41281 Number of Candidates: 56
Period Two: 41288 Number of Candidates: 56
Period Three: 41295 Number of Candidates: 56
Period Four: 41302 Number of Candidates: 56
Applied Resource Model Adjustments*
Target Expansion: 100.00% [if 100%, no adjustment applied]
CPU Performance: 100.00% [if 100%, no adjustment applied]
*Adjustment values of 100% = NO ADJUSTMENT APPLIED

[Reference Systems Technology Incorporated] Virtustream® Advisor Assessment Report | 14
CPU Peak Hour Demand Load (56 candidates)
Commentary
Ideally, organizations target an
even spread of demand
throughout the 24 hour period.
If there are concentrated
periods of load being
experienced this can typically
be causes by some of the
following activities:
1) Backup schedules
2) Anti-Virus Scans
3) Update periods
4) Logon and Logoff cycles
Virtustream models on the
load placed at peak average
demand.
The graph illustrates that there
is a peak demand for CPU at
a concentrated period
between 3:00 AM - 4:00 AM
when the highest number of
servers (5) experience their
most demanding hour. This
represents 8.9% of the entire
server estate and as a
concentrated workload.
[Questionnaire Section 35 -
Question 02] Additional
Commentary - CPU Peak
Hour Demand Load.
0
1
2
3
4
5
12
AM
1 A
M
2 A
M
3 A
M
4 A
M
5 A
M
6 A
M
7 A
M
8 A
M
9 A
M
10
AM
11
AM
12
PM
1 P
M
2 P
M
3 P
M
4 P
M
5 P
M
6 P
M
7 P
M
8 P
M
9 P
M
10
PM
11
PM
2014 Reference Model - Unix/Linux: Servers at Peak CPU per Hour
Servers Per Hour at MAX

[Reference Systems Technology Incorporated] Virtustream® Advisor Assessment Report | 15
CPU Consumption (56 candidates)
CPU Utilization (MHz)
CPU (Percent)
Commentary
The CPU Consumption graphs
show how the demands
placed on the systems have
varied from week to week -
from a low consumption peak
of 301,543 MHz observed in
week #N/A to the highest
peak in week 3 at 366,538
MHz. This equates to an
increase of 64,995 MHz
across all of the servers, or an
average increase of 64,995
MHz per machine for CPU
consumption from the lowest
to the highest observed peak.
[Questionnaire Section 35 -
Question 01] Additional
Commentary - CPU
Consumption.
0
50,000
100,000
150,000
200,000
250,000
300,000
350,000
400,000
1/7/2013 1/14/2013 1/21/2013 1/28/2013
350,861321,046
366,538
301,543
2014 Reference Model - Unix/Linux: CPU (MHz)
CPU @ MIN CPU @ AVG CPU @ 95th% CPU @ MAX
0%
5%
10%
15%
20%
1/7/2013 1/14/2013 1/21/2013 1/28/2013
17%16%
18%
15%
2014 Reference Model - Unix/Linux: CPU (% of Asset)
CPU % @ MIN CPU % @ AVG CPU % @ 95th% CPU % @ MAX

[Reference Systems Technology Incorporated] Virtustream® Advisor Assessment Report | 16
CPU Utilization – Average vs. Maximum (MHz)
CPU Utilization – Average vs. Maximum (Percent)
0
100,000
200,000
300,000
400,000
1/7/20131/14/2013
1/21/20131/28/2013
210,984198,122 209,365
204,784
350,861321,046 366,538
301,543
2014 Reference Model - Unix/Linux: CPU [AVG + MAX] (MHz)
CPU @ AVG CPU @ MAX
0%
5%
10%
15%
20%
1/7/20131/14/2013
1/21/20131/28/2013
10.4%9.7% 10.3%
10.1%
17.2%15.8% 18.0%
14.8%
2014 Reference Model - Unix/Linux: CPU [AVG + MAX] (%)
CPU % @ AVG CPU % @ MAX
[Reference Systems Technology Incorporated] Virtustream® Advisor Assessment Report | 17
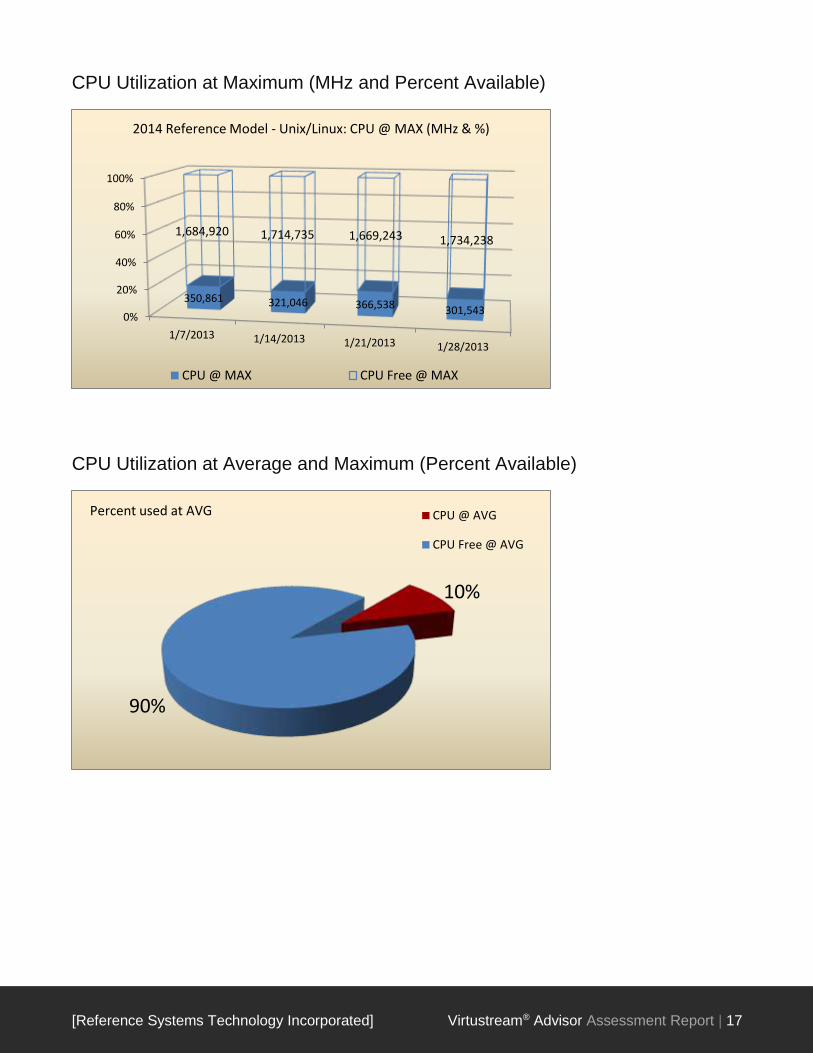
CPU Utilization at Maximum (MHz and Percent Available)
CPU Utilization at Average and Maximum (Percent Available)
0%
20%
40%
60%
80%
100%
1/7/2013 1/14/2013 1/21/2013 1/28/2013
350,861 321,046 366,538 301,543
1,684,920 1,714,735 1,669,243 1,734,238
2014 Reference Model - Unix/Linux: CPU @ MAX (MHz & %)
CPU @ MAX CPU Free @ MAX
10%
90%
Percent used at AVG CPU @ AVG
CPU Free @ AVG

[Reference Systems Technology Incorporated] Virtustream® Advisor Assessment Report | 18
16%
84%
Percent used at MAX CPU @ MAX
CPU Free @ MAX

[Reference Systems Technology Incorporated] Virtustream® Advisor Assessment Report | 19
Memory Consumption (56 candidates)
Memory Utilization (MB)
Memory Utilization (Percent)
Commentary
The Memory consumption
graphs show how the
demands placed on the
system vary from week to
week. The highest period of
memory utilization observed in
week 3 with 2,645,193 MB of
memory consumed at peak;
the lowest result was collected
in week 2 with a total of
2,630,420 MB utilized, yielding
a net difference of MB or 264
MB per server on average.
[Questionnaire Section 35 -
Question 03] Additional
Commentary - Memory
Consumption.
0
500,000
1,000,000
1,500,000
2,000,000
2,500,000
3,000,000
1/7/2013 1/14/2013 1/21/2013 1/28/2013
2,643,511 2,630,420 2,645,193 2,641,670
2014 Reference Model - Unix/Linux: Memory (MB)
Memory @ MIN Memory @ AVG Memory @ 95th% Memory @ MAX
0%
10%
20%
30%
40%
50%
60%
70%
80%
90%
1/7/2013 1/14/2013 1/21/2013 1/28/2013
83% 83% 83% 83%
2014 Reference Model - Unix/Linux: Memory (% of Asset)
Memory % @ MIN Memory % @ AVG Memory % @ 95th% Memory % @ MAX

[Reference Systems Technology Incorporated] Virtustream® Advisor Assessment Report | 20
Memory Utilization – Average vs. Maximum (MB)
Memory Utilization – Average vs. Maximum (Percent)
0
500,000
1,000,000
1,500,000
2,000,000
2,500,000
3,000,000
1/7/20131/14/2013
1/21/20131/28/2013
2,535,4922,517,897 2,559,793
2,487,056
2,643,5112,630,420 2,645,193
2,641,670
2014 Reference Model - Unix/Linux: Memory [AVG + MAX] (MB)
Memory @ AVG Memory @ MAX
0%
20%
40%
60%
80%
100%
1/7/20131/14/2013
1/21/20131/28/2013
80.0%79.4% 80.8%
78.5%
83.4%83.0% 83.5%
83.3%
2014 Reference Model - Unix/Linux: Memory [AVG + MAX] (%)
Memory % @ AVG Memory % @ MAX

[Reference Systems Technology Incorporated] Virtustream® Advisor Assessment Report | 21
Memory Utilization at Maximum (MB and Percent Available)
Memory Utilization at Average and Maximum (Percent Available)
0%
20%
40%
60%
80%
100%
1/7/2013 1/14/2013 1/21/2013 1/28/2013
2,643,511 2,630,420 2,645,193 2,641,670
526,021 539,112 524,339 527,862
2014 Reference Model - Unix/Linux: Memory @ MAX (MB & %)
Memory @ MAX Memory Free @ MAX
80%
20%
Percent used at AVG Memory @ AVG
Memory Free @ AVG

[Reference Systems Technology Incorporated] Virtustream® Advisor Assessment Report | 22
83%
17%
Percent used at MAX Memory @ MAX
Memory Free @ MAX

[Reference Systems Technology Incorporated] Virtustream® Advisor Assessment Report | 23
Disk Activity: Input/Output Operations (56 candidates)
Disk IOPS (Read, Write, & Total) at Average
Disk IOPS (Read, Write, & Total) at Maximum
Commentary
The transition to centralized
computing via virtualization
places a significant
dependency on centralized
storage.
Much of the functionality
available from virtualization
comes from its close links with
the storage layer.
The storage solution will need
to meet the demands of the
IOPs of the business.
The Disk Operation
consumption graphs show
how the demands placed on
the system vary from week to
week. The high point of
demand comes in week 4
when 50,944 IOPs were
performed. This diminishes to
its low point in week 2 when it
is reduced to 44,378 IOPs.
This represents a 6,566 IOPs
variance from the low peak to
the high peak.
[Questionnaire Section 35 -
Question 04] Additional
Commentary - Storage IOPS.
0
10,000
20,000
30,000
40,000
50,000
1/7/2013 1/14/2013 1/21/2013 1/28/2013
47,23142,541
47,196 46,927
2014 Reference Model - Unix/Linux: Disk IOPS Rd/Wr/Total @ AVG
IOPS Read @ AVG IOPS Write @ AVG IOPSTotal @ AVG
0
10,000
20,000
30,000
40,000
50,000
60,000
1/7/2013 1/14/2013 1/21/2013 1/28/2013
50,944
44,37849,359 49,706
2014 Reference Model - Unix/Linux: Disk IOPS Rd/Wr/Total @ MAX
IOPS Read @ MAX IOPS Write @ MAX IOPS Total @ MAX

[Reference Systems Technology Incorporated] Virtustream® Advisor Assessment Report | 24
Disk IOPS (Read)
Disk IOPS (Write)
0
2,000
4,000
6,000
8,000
10,000
12,000
1/7/2013 1/14/2013 1/21/2013 1/28/2013
10,337
7,588 7,3718,681
2014 Reference Model - Unix/Linux: Disk IOPS Read
IOPS Read @ MIN IOPS Read @ AVG IOPS Read @ 95th% IOPS Read @ MAX
0
5,000
10,000
15,000
20,000
25,000
30,000
35,000
40,000
45,000
1/7/2013 1/14/2013 1/21/2013 1/28/2013
43,391
37,22341,995 42,047
2014 Reference Model - Unix/Linux: Disk IOPS Write
IOPS Write @ MIN IOPS Write @ AVG IOPS Write @ 95th% IOPS Write @ MAX

[Reference Systems Technology Incorporated] Virtustream® Advisor Assessment Report | 25
Disk IOPS (Total) – Average and Maximum
Disk IOPS (Total) at Maximum
0
10,000
20,000
30,000
40,000
50,000
60,000
1/7/20131/14/2013
1/21/20131/28/2013
47,231
42,541 47,19646,927
50,944
44,378 49,35949,706
2014 Reference Model - Unix/Linux: Disk IOPS Total [AVG + MAX]
IOPSTotal @ AVG IOPS Total @ MAX
0
10,000
20,000
30,000
40,000
50,000
60,000
1/7/2013 1/14/2013 1/21/2013 1/28/2013
50,944
44,37849,359 49,706
2014 Reference Model - Unix/Linux: Disk IOPS Total
IOPS Total @ MIN IOPSTotal @ AVG IOPS Total @ 95th% IOPS Total @ MAX

[Reference Systems Technology Incorporated] Virtustream® Advisor Assessment Report | 26
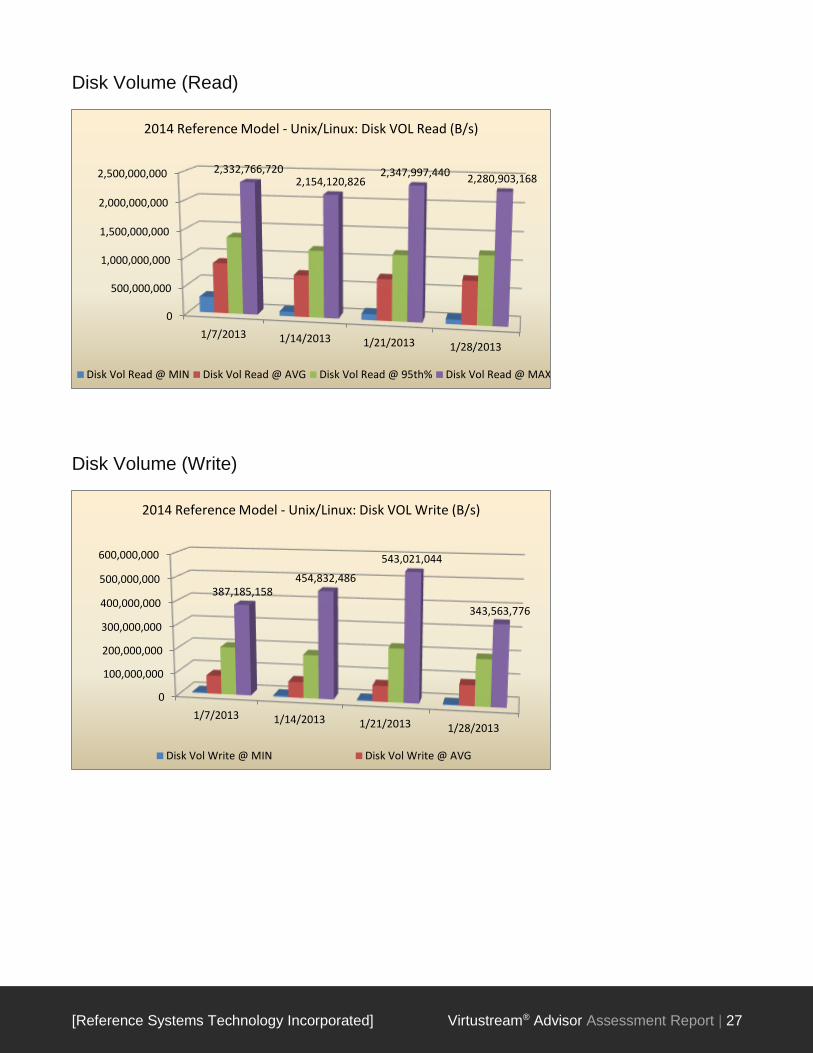
Disk Activity: Volume (56 candidates)
Disk Volume (Read, Write, & Total) at Average
Disk Volume (Read, Write, & Total) at Maximum
Commentary
These graphs indicate the
volume of data being read
from or written out to the
underlying storage. The
centralized storage will need
to be able to cope not only
with the amount of
transactions, but also the
volume of data.
The blend of the read and
write transactions will have an
effect on the actual storage
design. Disk writes impose a
much greater load on the
storage subsystem and often
is a limiting factor in
commodity clouds.
The Read and Write
consumption graphs show
how the demands placed on
the system vary from week to
week.
The peak for Reads of
2,347,997,440 bytes per
second is hit in week and the
peak for Writes is hit in week
at 543,021,044 bytes per
second.
[Questionnaire Section 35 -
Question 05] Additional
Commentary - Storage Data
Volume.
0
200,000,000
400,000,000
600,000,000
800,000,000
1,000,000,000
1/7/2013 1/14/2013 1/21/2013 1/28/2013
977,093,788
806,404,136 820,041,458 845,574,907
2014 Reference Model - Unix/Linux: Disk VOL Rd/Wr/Total @ AVG (B/s)
Disk Vol Read @ AVG Disk Vol Write @ AVG Disk Vol Total @ AVG
0
500,000,000
1,000,000,000
1,500,000,000
2,000,000,000
2,500,000,000
1/7/2013 1/14/2013 1/21/2013 1/28/2013
2,428,042,7142,218,410,114
2,390,252,256 2,358,500,352
2014 Reference Model - Unix/Linux: Disk VOL Rd/Wr/Total @ MAX (B/s)
Disk Vol Read @ MAX Disk Vol Write @ MAX Disk Vol Total @ MAX
[Reference Systems Technology Incorporated] Virtustream® Advisor Assessment Report | 27
Disk Volume (Read)
Disk Volume (Write)
0
500,000,000
1,000,000,000
1,500,000,000
2,000,000,000
2,500,000,000
1/7/2013 1/14/2013 1/21/2013 1/28/2013
2,332,766,7202,154,120,826
2,347,997,4402,280,903,168
2014 Reference Model - Unix/Linux: Disk VOL Read (B/s)
Disk Vol Read @ MIN Disk Vol Read @ AVG Disk Vol Read @ 95th% Disk Vol Read @ MAX
0
100,000,000
200,000,000
300,000,000
400,000,000
500,000,000
600,000,000
1/7/2013 1/14/2013 1/21/2013 1/28/2013
387,185,158454,832,486
543,021,044
343,563,776
2014 Reference Model - Unix/Linux: Disk VOL Write (B/s)
Disk Vol Write @ MIN Disk Vol Write @ AVG

[Reference Systems Technology Incorporated] Virtustream® Advisor Assessment Report | 28
Disk Volume (Total) – Average and Maximum
Disk Volume (Total) at Maximum
0
500,000,000
1,000,000,000
1,500,000,000
2,000,000,000
2,500,000,000
1/7/20131/14/2013
1/21/20131/28/2013
977,093,788
806,404,136820,041,458
845,574,907
2,428,042,7142,218,410,114 2,390,252,256
2,358,500,352
2014 Reference Model - Unix/Linux: Disk VOL Total [AVG + MAX]
Disk Vol Total @ AVG Disk Vol Total @ MAX
0
500,000,000
1,000,000,000
1,500,000,000
2,000,000,000
2,500,000,000
1/7/2013 1/14/2013 1/21/2013 1/28/2013
2,428,042,7142,218,410,114
2,390,252,256 2,358,500,352
2014 Reference Model - Unix/Linux: Disk VOL Total
Disk Vol Total @ MIN Disk Vol Total @ AVG

[Reference Systems Technology Incorporated] Virtustream® Advisor Assessment Report | 29
Network Data Volume (55 candidates)
Network Utilization (B/s)
Network Utilization (Percent)
Networking Commentary
Most physical machines have
a connection to the network
via Gigabit network interface
cards (NICs). When these
machines are virtualized, they
will share network interfaces
via virtual networking.
Therefore it is critical that the
networking layer is not
overloaded leading to
contention for resources that
could affect the perceived
performance and availability of
the virtual machines.
Within the physical hosts used
by virtualized infrastructures
and the cloud, multiple
physical networking interfaces
(NICs) will be bonded or
teamed to provide higher
bandwidth trunks and
redundancy to the core
network infrastructure and this
will then be allocated in a load
balanced manner to virtual
machines using algorithms
defined within virtual network
switches.
The Reference Systems Inc.
network was being utilized at
its highest rate during week
when 1,076,702,038 bytes
per second was measured.
This peak was reduced to
588,710,958 bytes per
second during week .
[Questionnaire Section 35 -
Question 06] Additional
Commentary - Network Data
Volume.
0
200,000,000
400,000,000
600,000,000
800,000,000
1,000,000,000
1,200,000,000
1/7/2013 1/14/2013 1/21/2013 1/28/2013
588,710,958
762,186,990
1,076,702,038
593,966,041
2014 Reference Model - Unix/Linux: Network (B/s)
NET used @ MIN NET used @ AVG NET used @ 95th% NET used @ MAX
0%
1%
2%
3%
4%
5%
6%
1/7/2013 1/14/2013 1/21/2013 1/28/2013
3%
4%
5%
3%
2014 Reference Model - Unix/Linux: Network (%)
NET % used @ MIN NET % used @ AVG NET % used @ 95th% NET % used @ MAX
[Reference Systems Technology Incorporated] Virtustream® Advisor Assessment Report | 30
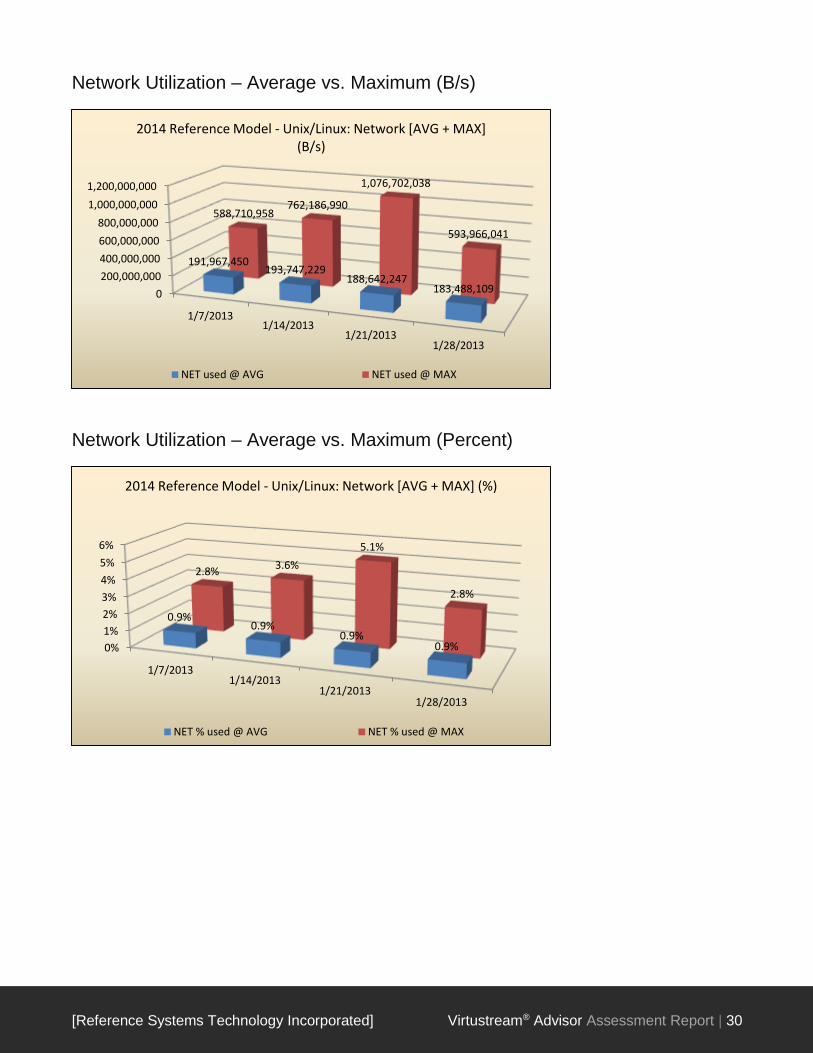
Network Utilization – Average vs. Maximum (B/s)
Network Utilization – Average vs. Maximum (Percent)
0
200,000,000
400,000,000
600,000,000
800,000,000
1,000,000,000
1,200,000,000
1/7/20131/14/2013
1/21/20131/28/2013
191,967,450193,747,229
188,642,247183,488,109
588,710,958762,186,990
1,076,702,038
593,966,041
2014 Reference Model - Unix/Linux: Network [AVG + MAX] (B/s)
NET used @ AVG NET used @ MAX
0%
1%
2%
3%
4%
5%
6%
1/7/20131/14/2013
1/21/20131/28/2013
0.9%0.9%
0.9%0.9%
2.8%3.6%
5.1%
2.8%
2014 Reference Model - Unix/Linux: Network [AVG + MAX] (%)
NET % used @ AVG NET % used @ MAX
[Reference Systems Technology Incorporated] Virtustream® Advisor Assessment Report | 31
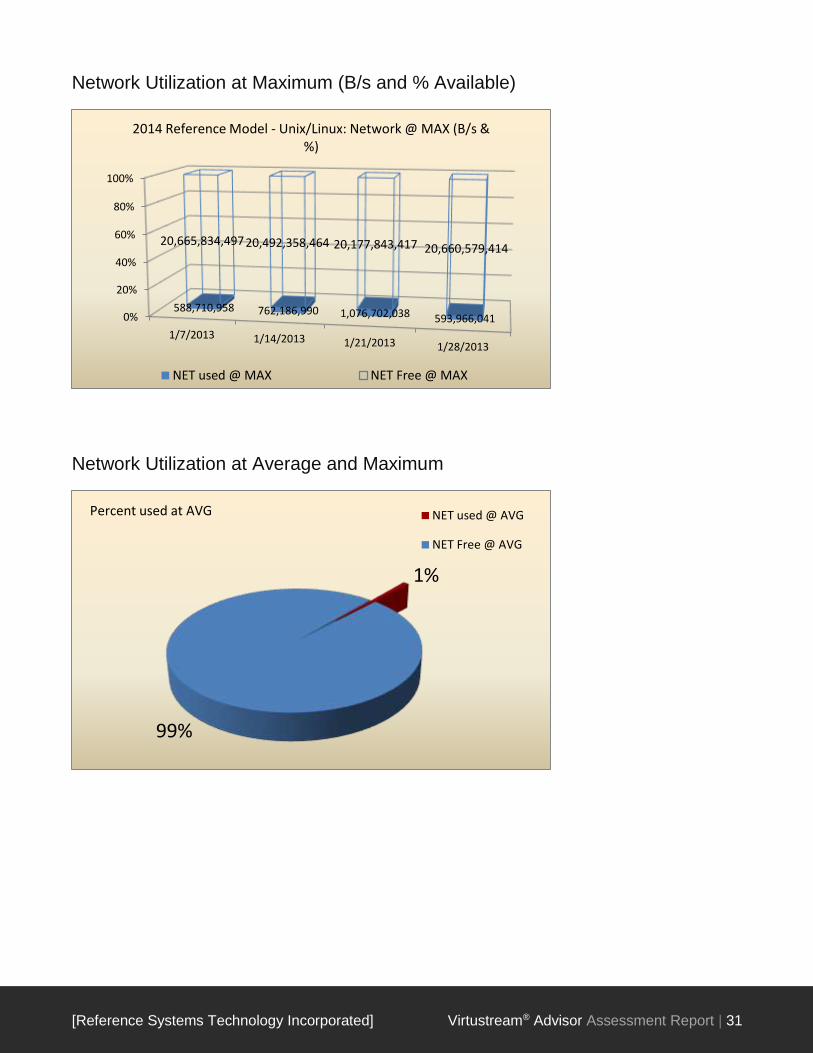
Network Utilization at Maximum (B/s and % Available)
Network Utilization at Average and Maximum
0%
20%
40%
60%
80%
100%
1/7/2013 1/14/2013 1/21/2013 1/28/2013
588,710,958 762,186,990 1,076,702,038 593,966,041
20,665,834,497 20,492,358,464 20,177,843,417 20,660,579,414
2014 Reference Model - Unix/Linux: Network @ MAX (B/s & %)
NET used @ MAX NET Free @ MAX
1%
99%
Percent used at AVG NET used @ AVG
NET Free @ AVG
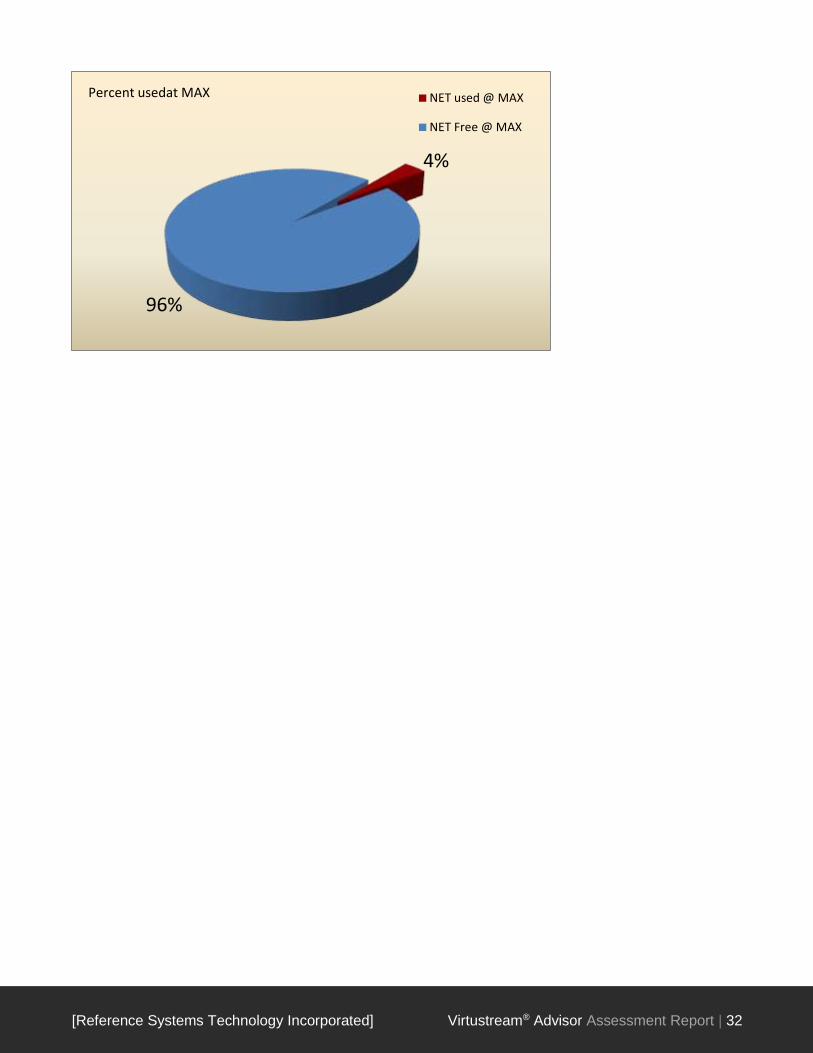
[Reference Systems Technology Incorporated] Virtustream® Advisor Assessment Report | 32
4%
96%
Percent usedat MAX NET used @ MAX
NET Free @ MAX
[Reference Systems Technology Incorporated] Virtustream® Advisor Assessment Report | 33
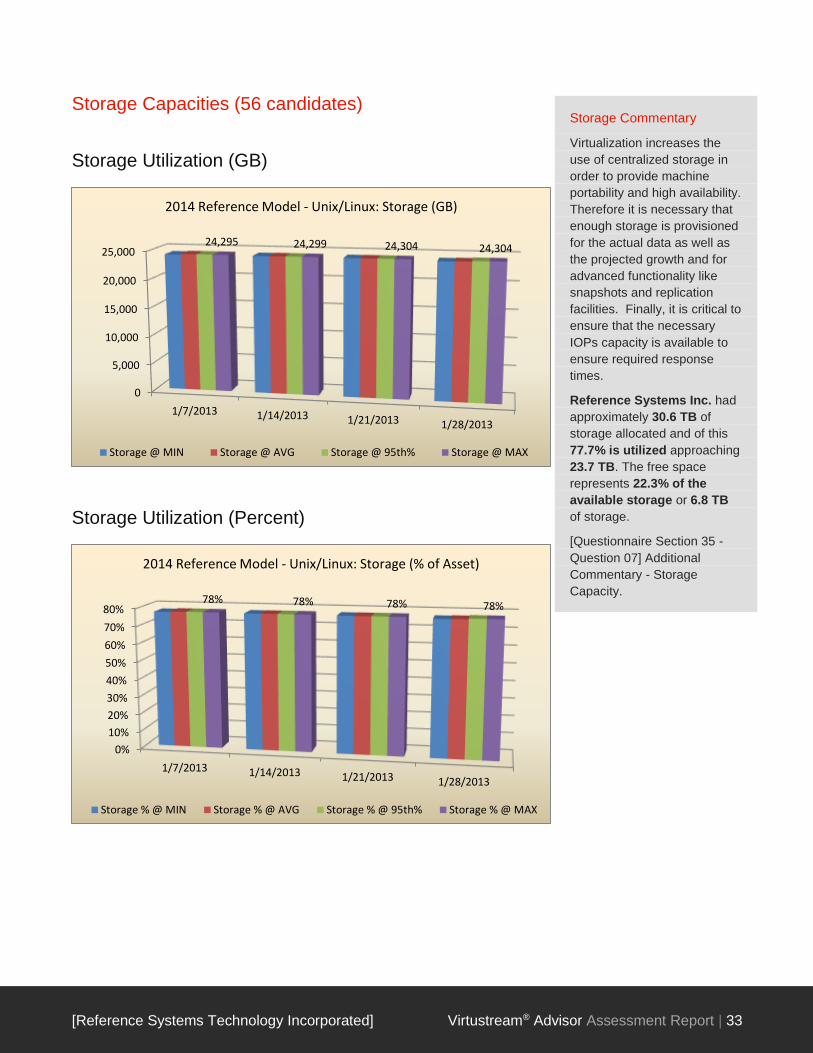
Storage Capacities (56 candidates)
Storage Utilization (GB)
Storage Utilization (Percent)
Storage Commentary
Virtualization increases the
use of centralized storage in
order to provide machine
portability and high availability.
Therefore it is necessary that
enough storage is provisioned
for the actual data as well as
the projected growth and for
advanced functionality like
snapshots and replication
facilities. Finally, it is critical to
ensure that the necessary
IOPs capacity is available to
ensure required response
times.
Reference Systems Inc. had
approximately 30.6 TB of
storage allocated and of this
77.7% is utilized approaching
23.7 TB. The free space
represents 22.3% of the
available storage or 6.8 TB
of storage.
[Questionnaire Section 35 -
Question 07] Additional
Commentary - Storage
Capacity.
0
5,000
10,000
15,000
20,000
25,000
1/7/2013 1/14/2013 1/21/2013 1/28/2013
24,295 24,299 24,304 24,304
2014 Reference Model - Unix/Linux: Storage (GB)
Storage @ MIN Storage @ AVG Storage @ 95th% Storage @ MAX
0%
10%
20%
30%
40%
50%
60%
70%
80%
1/7/2013 1/14/2013 1/21/2013 1/28/2013
78% 78% 78% 78%
2014 Reference Model - Unix/Linux: Storage (% of Asset)
Storage % @ MIN Storage % @ AVG Storage % @ 95th% Storage % @ MAX
[Reference Systems Technology Incorporated] Virtustream® Advisor Assessment Report | 34
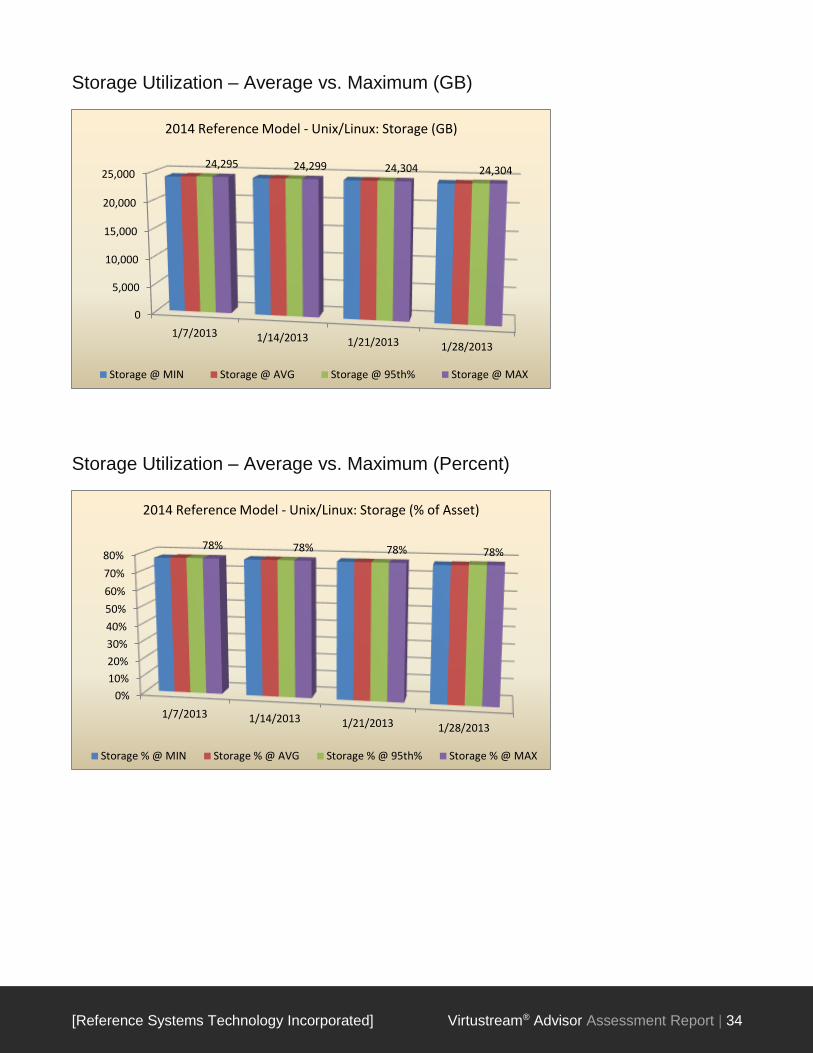
Storage Utilization – Average vs. Maximum (GB)
Storage Utilization – Average vs. Maximum (Percent)
0
5,000
10,000
15,000
20,000
25,000
1/7/2013 1/14/2013 1/21/2013 1/28/2013
24,295 24,299 24,304 24,304
2014 Reference Model - Unix/Linux: Storage (GB)
Storage @ MIN Storage @ AVG Storage @ 95th% Storage @ MAX
0%
10%
20%
30%
40%
50%
60%
70%
80%
1/7/2013 1/14/2013 1/21/2013 1/28/2013
78% 78% 78% 78%
2014 Reference Model - Unix/Linux: Storage (% of Asset)
Storage % @ MIN Storage % @ AVG Storage % @ 95th% Storage % @ MAX
[Reference Systems Technology Incorporated] Virtustream® Advisor Assessment Report | 35
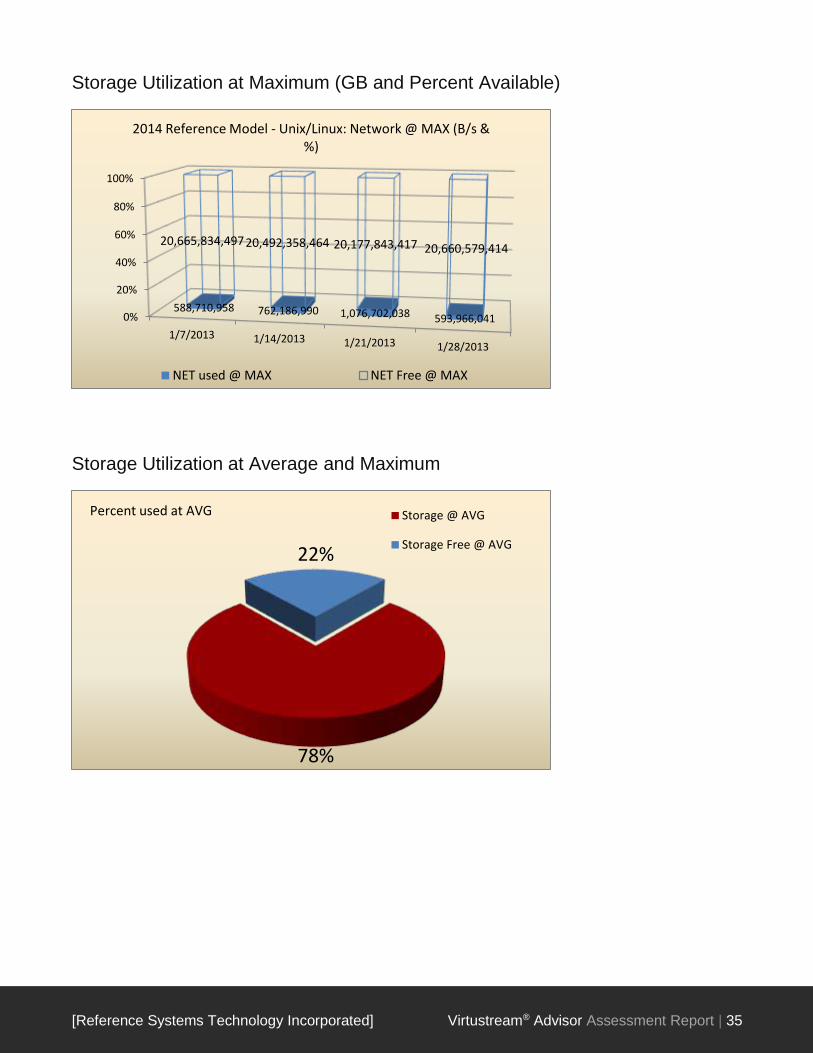
Storage Utilization at Maximum (GB and Percent Available)
Storage Utilization at Average and Maximum
0%
20%
40%
60%
80%
100%
1/7/2013 1/14/2013 1/21/2013 1/28/2013
588,710,958 762,186,990 1,076,702,038 593,966,041
20,665,834,497 20,492,358,464 20,177,843,417 20,660,579,414
2014 Reference Model - Unix/Linux: Network @ MAX (B/s & %)
NET used @ MAX NET Free @ MAX
78%
22%
Percent used at AVG Storage @ AVG
Storage Free @ AVG

[Reference Systems Technology Incorporated] Virtustream® Advisor Assessment Report | 36
78%
22%
Percent used at MAX Storage @ MAX
Storage Free @ MAX

[Reference Systems Technology Incorporated] Virtustream® Advisor Assessment Report | 37
7. Aggregate Resource Utilization over Time
Aggregate CPU Utilization
Aggregate Memory Utilization
0
50,000
100,000
150,000
200,000
250,000
300,000
350,000
400,000
2014 Reference Model - Unix/Linux: Aggregate CPU (MHz)
0
500,000
1,000,000
1,500,000
2,000,000
2,500,000
3,000,000
2014 Reference Model - Unix/Linux: Aggregate Memory (MB)
[Reference Systems Technology Incorporated] Virtustream® Advisor Assessment Report | 38
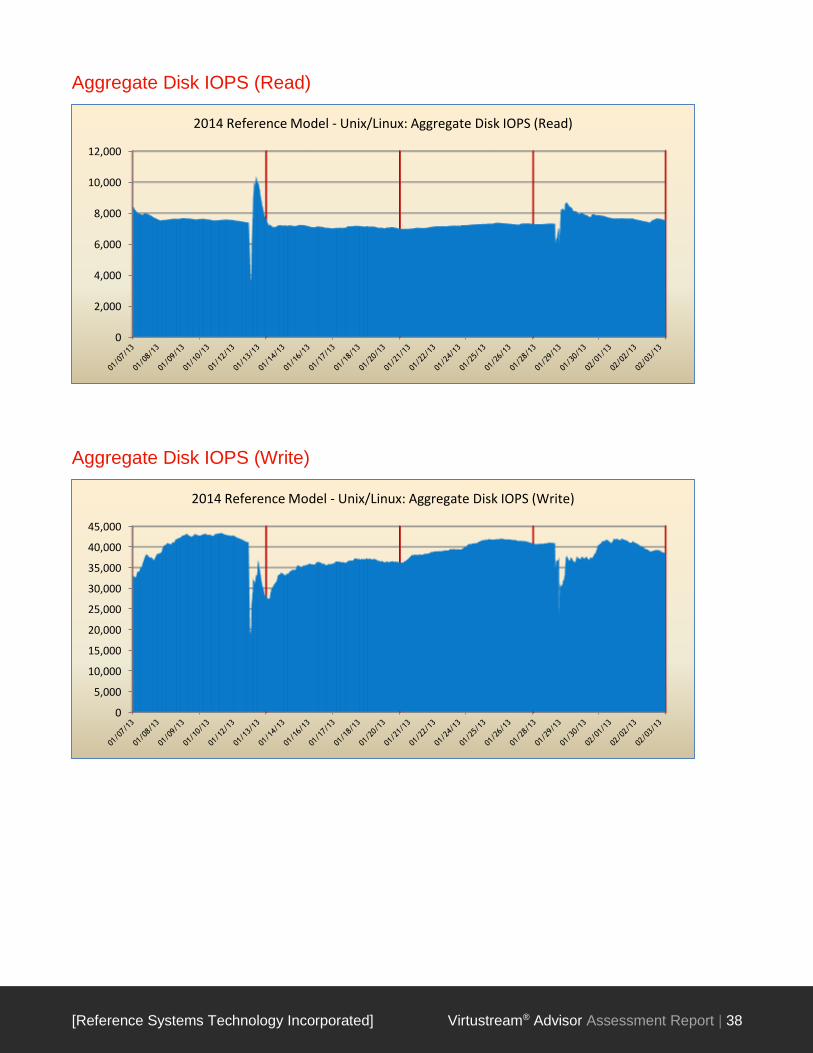
Aggregate Disk IOPS (Read)
Aggregate Disk IOPS (Write)
0
2,000
4,000
6,000
8,000
10,000
12,000
2014 Reference Model - Unix/Linux: Aggregate Disk IOPS (Read)
0
5,000
10,000
15,000
20,000
25,000
30,000
35,000
40,000
45,000
2014 Reference Model - Unix/Linux: Aggregate Disk IOPS (Write)

[Reference Systems Technology Incorporated] Virtustream® Advisor Assessment Report | 39
Aggregate Disk Volume (Read)
Aggregate Disk Volume (Write)
0
500,000,000
1,000,000,000
1,500,000,000
2,000,000,000
2,500,000,000
2014 Reference Model - Unix/Linux: Aggregate Disk Volume (Read) B/s
0
100,000,000
200,000,000
300,000,000
400,000,000
500,000,000
600,000,000
2014 Reference Model - Unix/Linux: Aggregate Disk Volume (Write) B/s

[Reference Systems Technology Incorporated] Virtustream® Advisor Assessment Report | 40
Aggregate Disk IOPS (Total)
Aggregate Disk Volume (Total)
0
10,000
20,000
30,000
40,000
50,000
60,000
2014 Reference Model - Unix/Linux: Aggregate Disk IOPS (Total)
0
500,000,000
1,000,000,000
1,500,000,000
2,000,000,000
2,500,000,000
2014 Reference Model - Unix/Linux: Aggregate Disk Volume (Total) B/s
[Reference Systems Technology Incorporated] Virtustream® Advisor Assessment Report | 41
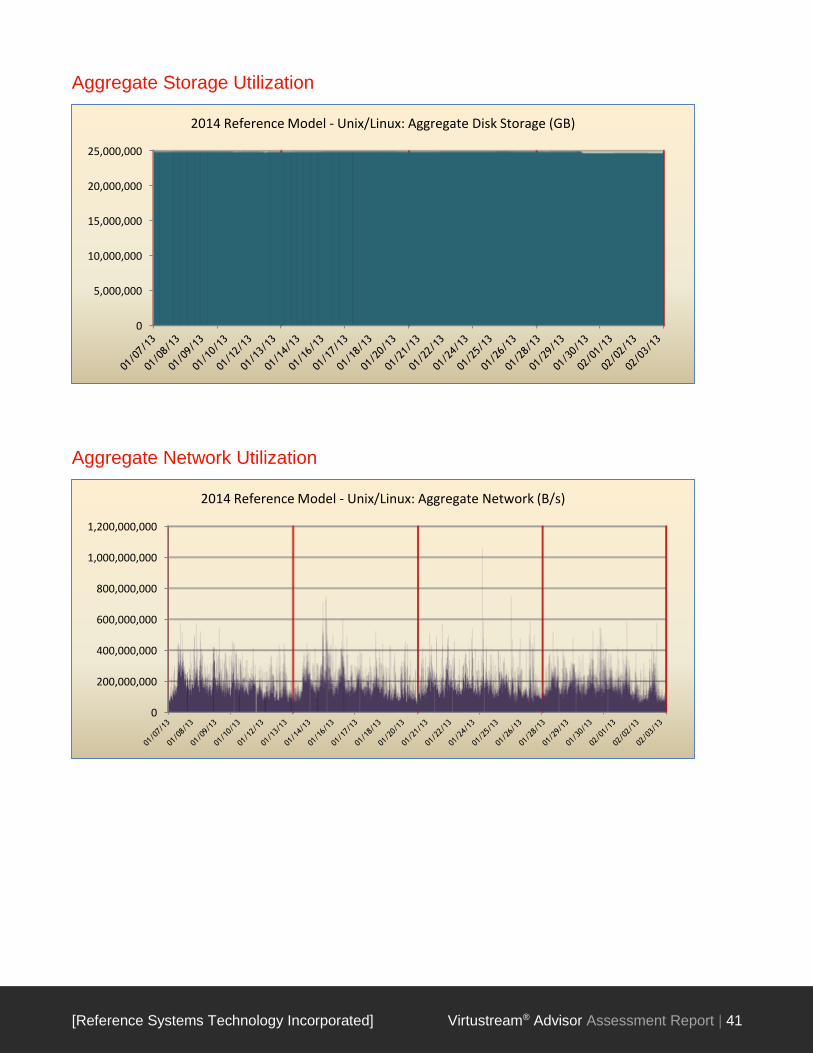
Aggregate Storage Utilization
Aggregate Network Utilization
0
5,000,000
10,000,000
15,000,000
20,000,000
25,000,000
2014 Reference Model - Unix/Linux: Aggregate Disk Storage (GB)
0
200,000,000
400,000,000
600,000,000
800,000,000
1,000,000,000
1,200,000,000
2014 Reference Model - Unix/Linux: Aggregate Network (B/s)

[Reference Systems Technology Incorporated] Virtustream® Advisor Assessment Report | 42
8. Week by Week Performance Analysis for Virtualization
Overview
The previous section concentrated on the combined loads of the differing workload areas. This section illustrates
how this usage profile would affect the ‘typical’ virtual machine profile and what the effect on a suggested host
platform would be.
Each area of critical importance to virtualization/consolidation is summarized to create the week’s virtualization
candidate profile, and this is modelled against the proposed host resources that form the virtualization platform. It
shows the demand that the measured systems would place upon the consolidated design.
The information is presented in a week by week basis to illustrate the performance trends.
Resource Totals Per Server
CPU Allocated MHz Total CPU MHz available in all the
candidates. Total divided by the number of candidates
CPU Util. MHz
The total literal MHz consumption of the
entire estate based on each individual
server’s consumption.
The average of total literal MHz consumption of
the entire estate based on each individual
servers consumption
Average Processor
Speed N/A
The average speed of the processor installed in
the servers
Peak Av CPU MHz
consumption
The total MHz consumption of the servers
based on literal calculation.
Take the calculated MHz figure and then divide
by the number of servers
VMware Peak Av CPU
Utilization based on
average %
The average MHz consumed based on the
total MHz in the estate divided by the
average %. This is not as accurate as the
CPU utilized MHz (measured figure)
The average MHz consumed based on the total
MHz in the estate divided by the average %
divided by the number of candidate servers.
This is not as accurate as the CPU utilized MHz
(measured figure)
Memory Allocated MB The total allocated Mb of RAM in the estate The total allocated Mb of RAM in the estate
divided by the number of servers
Memory Used The total memory used in the Estate The total memory used in the Estate divided by
the number of servers
Memory Free The total amount of free memory not being
utilized in the estate
The total amount of free memory not being
utilized in the estate divided by the number of
servers
Memory utilization % The percentage that the memory is utilized in
the estate
The percentage that the memory is utilized in
the estate
Disk I/0 The number of disk Input/output operations
per second in the entire estate.
The number of disk Input/output operations per
second in the entire estate divided by the
number of servers
Network (bytes/sec) The total bytes per second transferred on the
network interface cards of the entire estate.
The total bytes per second transferred on the
network interface cards of the entire estate
divided by the number of servers.

[Reference Systems Technology Incorporated] Virtustream® Advisor Assessment Report | 43
Data Collection Periods
Period One: 41281 Number of Candidates: 56
Period Two: 41288 Number of Candidates: 56
Period Three: 41295 Number of Candidates: 56
Period Four: 41302 Number of Candidates: 56

[Reference Systems Technology Incorporated] Virtustream® Advisor Assessment Report | 44
Measured Performance Data – Period 1
Resource (at MAX Utilization) Totals Per Server
Number of Targets 56 Divided by # of Targets
CPU: Allocated (MHz) 2,035,781 36,353
CPU: Utilization (MHz) ** 350,861 6,265
CPU: Utilization (Percent) 17.2% 17.2%
CPU: Free at MAX (MHz) 1,684,920 30,088
Memory: Allocated (MB) 3,169,532 56,599
Memory: Utilization (MB) ** 2,643,511 47,206
Memory: Utilization (Percent) 83.4% 83.4%
Memory: Free (MB) 526,021 9,393
Disk I/0PS (Read) 10,337 185
Disk I/0PS (Write) 43,391 775
Disk I/0PS (Total) ** 50,944 910
Disk Volume (Read) 2,332,766,720 41,656,549
Disk Volume (Write) 387,185,158 6,914,021
Disk Volume (Total) 2,428,042,714 43,357,906
Network: Allocated (Mbits) 170,036 3,036
Network: Utilization (B/s) ** 588,710,958 10,512,696
Network: Utilization (Percent) 2.8% 2.8%
Network: Free 20,665,834,497 369,032,759
Storage: Allocated 31,290 559
Storage: Utilization (MB) 24,295 434
Storage: Utilization (Percent) 77.6% 77.6%
Storage: Free 6,996 125
**Resource Unit Component
[Reference Systems Technology Incorporated] Virtustream® Advisor Assessment Report | 45
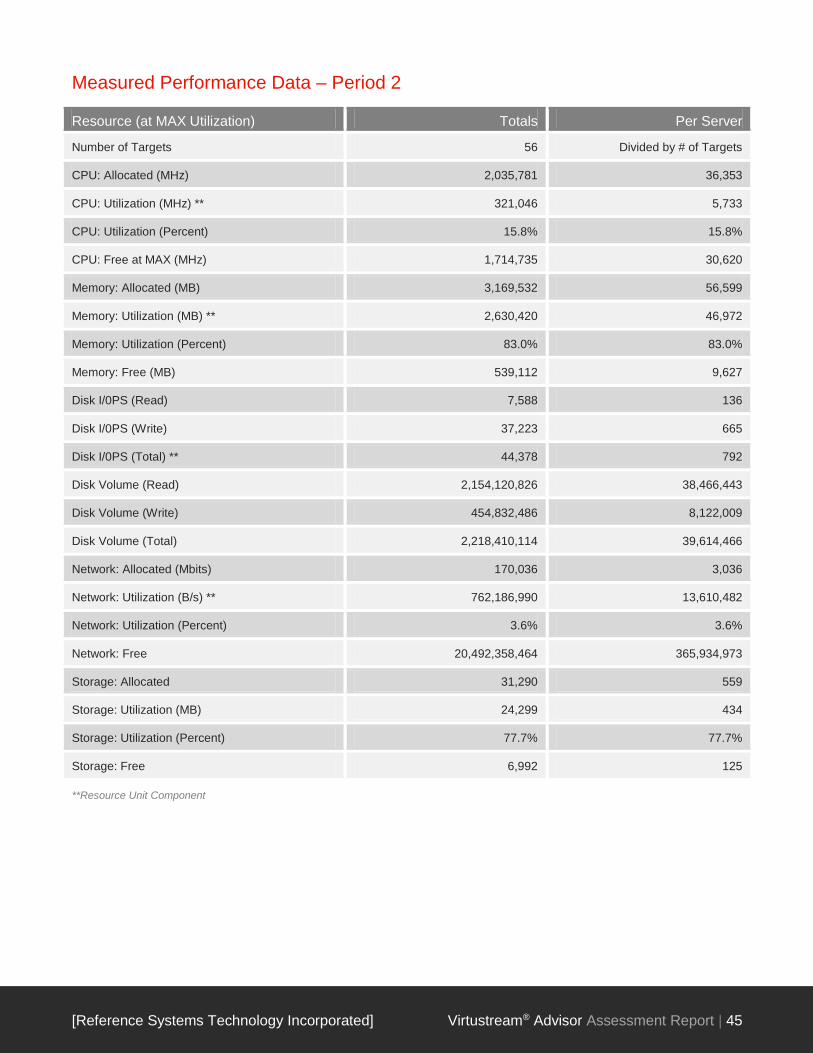
Measured Performance Data – Period 2
Resource (at MAX Utilization) Totals Per Server
Number of Targets 56 Divided by # of Targets
CPU: Allocated (MHz) 2,035,781 36,353
CPU: Utilization (MHz) ** 321,046 5,733
CPU: Utilization (Percent) 15.8% 15.8%
CPU: Free at MAX (MHz) 1,714,735 30,620
Memory: Allocated (MB) 3,169,532 56,599
Memory: Utilization (MB) ** 2,630,420 46,972
Memory: Utilization (Percent) 83.0% 83.0%
Memory: Free (MB) 539,112 9,627
Disk I/0PS (Read) 7,588 136
Disk I/0PS (Write) 37,223 665
Disk I/0PS (Total) ** 44,378 792
Disk Volume (Read) 2,154,120,826 38,466,443
Disk Volume (Write) 454,832,486 8,122,009
Disk Volume (Total) 2,218,410,114 39,614,466
Network: Allocated (Mbits) 170,036 3,036
Network: Utilization (B/s) ** 762,186,990 13,610,482
Network: Utilization (Percent) 3.6% 3.6%
Network: Free 20,492,358,464 365,934,973
Storage: Allocated 31,290 559
Storage: Utilization (MB) 24,299 434
Storage: Utilization (Percent) 77.7% 77.7%
Storage: Free 6,992 125
**Resource Unit Component

[Reference Systems Technology Incorporated] Virtustream® Advisor Assessment Report | 46
Measured Performance Data – Period 3
Resource (at MAX Utilization) Totals Per Server
Number of Targets 56 Divided by # of Targets
CPU: Allocated (MHz) 2,035,781 36,353
CPU: Utilization (MHz) ** 366,538 6,545
CPU: Utilization (Percent) 18.0% 18.0%
CPU: Free at MAX (MHz) 1,669,243 29,808
Memory: Allocated (MB) 3,169,532 56,599
Memory: Utilization (MB) ** 2,645,193 47,236
Memory: Utilization (Percent) 83.5% 83.5%
Memory: Free (MB) 524,339 9,363
Disk I/0PS (Read) 7,371 132
Disk I/0PS (Write) 41,995 750
Disk I/0PS (Total) ** 49,359 881
Disk Volume (Read) 2,347,997,440 41,928,526
Disk Volume (Write) 543,021,044 9,696,804
Disk Volume (Total) 2,390,252,256 42,683,076
Network: Allocated (Mbits) 170,036 3,036
Network: Utilization (B/s) ** 1,076,702,038 19,226,822
Network: Utilization (Percent) 5.1% 5.1%
Network: Free 20,177,843,417 360,318,632
Storage: Allocated 31,290 559
Storage: Utilization (MB) 24,304 434
Storage: Utilization (Percent) 77.7% 77.7%
Storage: Free 6,986 125
**Resource Unit Component

[Reference Systems Technology Incorporated] Virtustream® Advisor Assessment Report | 47
Measured Performance Data – Period 4
Resource (at MAX Utilization) Totals Per Server
Number of Targets 56 Divided by # of Targets
CPU: Allocated (MHz) 2,035,781 36,353
CPU: Utilization (MHz) ** 301,543 5,385
CPU: Utilization (Percent) 14.8% 14.8%
CPU: Free at MAX (MHz) 1,734,238 30,969
Memory: Allocated (MB) 3,169,532 56,599
Memory: Utilization (MB) ** 2,641,670 47,173
Memory: Utilization (Percent) 83.3% 83.3%
Memory: Free (MB) 527,862 9,426
Disk I/0PS (Read) 8,681 155
Disk I/0PS (Write) 42,047 751
Disk I/0PS (Total) ** 49,706 888
Disk Volume (Read) 2,280,903,168 40,730,414
Disk Volume (Write) 343,563,776 6,135,067
Disk Volume (Total) 2,358,500,352 42,116,078
Network: Allocated (Mbits) 170,036 3,036
Network: Utilization (B/s) ** 593,966,041 10,606,536
Network: Utilization (Percent) 2.8% 2.8%
Network: Free 20,660,579,414 368,938,918
Storage: Allocated 31,290 559
Storage: Utilization (MB) 24,304 434
Storage: Utilization (Percent) 77.7% 77.7%
Storage: Free 6,986 125
**Resource Unit Component
[Reference Systems Technology Incorporated] Virtustream® Advisor Assessment Report | 48
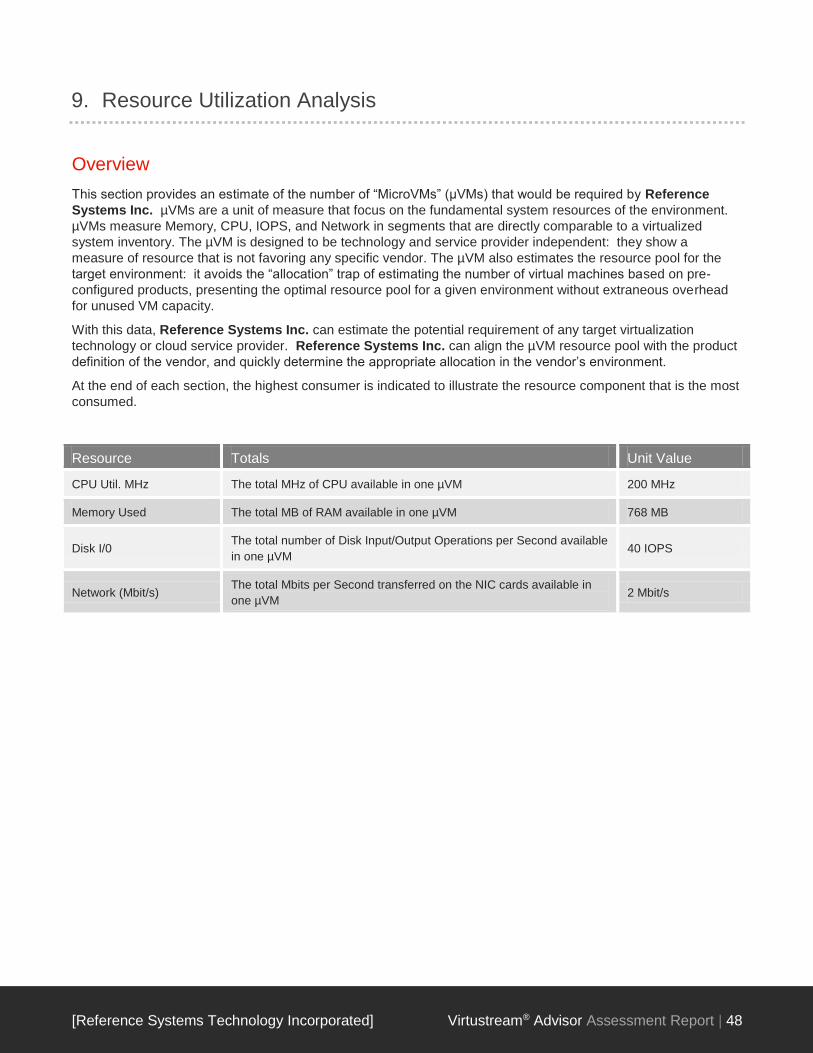
9. Resource Utilization Analysis
Overview
This section provides an estimate of the number of “MicroVMs” (µVMs) that would be required by Reference
Systems Inc. µVMs are a unit of measure that focus on the fundamental system resources of the environment.
µVMs measure Memory, CPU, IOPS, and Network in segments that are directly comparable to a virtualized
system inventory. The µVM is designed to be technology and service provider independent: they show a
measure of resource that is not favoring any specific vendor. The µVM also estimates the resource pool for the
target environment: it avoids the “allocation” trap of estimating the number of virtual machines based on pre-
configured products, presenting the optimal resource pool for a given environment without extraneous overhead
for unused VM capacity.
With this data, Reference Systems Inc. can estimate the potential requirement of any target virtualization
technology or cloud service provider. Reference Systems Inc. can align the µVM resource pool with the product
definition of the vendor, and quickly determine the appropriate allocation in the vendor’s environment.
At the end of each section, the highest consumer is indicated to illustrate the resource component that is the most
consumed.
Resource Totals Unit Value
CPU Util. MHz The total MHz of CPU available in one µVM 200 MHz
Memory Used The total MB of RAM available in one µVM 768 MB
Disk I/0 The total number of Disk Input/Output Operations per Second available
in one µVM 40 IOPS
Network (Mbit/s) The total Mbits per Second transferred on the NIC cards available in
one µVM 2 Mbit/s

[Reference Systems Technology Incorporated] Virtustream® Advisor Assessment Report | 49
µVM Consumption (56 candidates)
The charts below illustrate how the resource consumption varies in relation to the µVM resource allocation.
Resource Unit (µVM) Component
Max Consumption µVM Unit Value**** µVM Unit Total During Period
CPU (Mhz) 366,538 200 MHz/µVM 1,833
Memory (MB) 2,645,193 768 MB/µVM 2,687
Disk I/OPS 50,944 40 IOPS/µVM 1,274
Network (B/s) 1,076,702,038 2 Mbps/µVM 4,307
µVM Commentary
Over the measured period, the servers would require 4,307 µVMs to meet the highest consuming component
(Network). [Questionnaire Section 35 - Question 08] Additional Commentary - µVM Consumption.
0 1,000 2,000 3,000 4,0005,000
Network
Disk I/O
Memory
CPU
2,376
1,243
2,683
1,508
4,307
1,234
2,687
1,833
3,049
1,110
2,672
1,606
2,355
1,274
2,685
1,755
2014 Reference Model - Unix/Linux: µVM Requirement
1/7/2013 1/14/2013 1/21/2013 1/28/2013

[Reference Systems Technology Incorporated] Virtustream® Advisor Assessment Report | 50
10. Potential Impact of Virtualization
Proposed Virtualization Host Resources
The previous section analyzed the resources currently used within the existing server estate. That information is
utilized within this section to map this onto a consolidation design utilizing virtualization.
The following table indicates the total available resource in each of the proposed VMware vSphere ESX hosts to
run operate the virtual machines.
The platform has been modelled with the following parameters:
Most intensive processing week to provide CPU requirements
Most intensive memory week to provide RAM requirements
Additional host resource to cope with a failure to one host or for online maintenance
Active/Active operation capability
Provision to cater for 25% of estate utilizing Fault Tolerant facilities with the assumption of 2x resource
consumption per server utilizing this facility
Site A – Virtualization Resources Main Data Center – 33 Host(s) in Normal Operations
Resource Host Total Capacity Site Capacity
Host CPU Resource (1 CPU, 6 Core w/2600 MHz speed) (MHz) 11,232 370,656
Memory (GB) factored to 80% 205 6,758
Network (Gbps) 4 132
Storage (Gbps) 4 132
Site B – Virtualization Resources Secondary Data Center – 33 Host(s) in Normal Operations
Resource Host Total Capacity Site Total Capacity
Host CPU (1 CPU, 6 Core w/2600 MHz speed) (MHz) 11,232 370,656
Memory (GB) factored to 80% 205 6,758
Network (Gbps) 4 132
Storage (Gbps) 4 132
Combined Most Intensive Resource Utilization modelling
Utilizing the performance data captured in the previous section, we take the combined load of each of the most
intensive weeks to create the combined peak average load candidate. This is then modelled onto the proposed
host resources to illustrate the likely utilization.

[Reference Systems Technology Incorporated] Virtustream® Advisor Assessment Report | 51
Modelled Candidate with Combined Maximum Source Demands – Typical Profile x 56 Candidates
Resource Peak Modeled Candidate Maximum Utilization
Processor Utilization (MHz) 6,545 366,538
Memory Utilization (MB) 47,236 2,645,193
Storage Allocation (GB) 0.55 30.56
Storage Utilization (GB) 0.42 23.73
Disk IOPS Read 185 10,337
Disk IOPS Write 775 43,391
Disk IOPS Total 910 50,944
Disk Volume Read (B/s) 9,696,804 543,021,044
Disk Volume Write (B/s) 9,696,804 543,021,044
Disk Volume Total (B/s) 43,357,906 2,428,042,714
Network Bandwidth (B/s) 19,576,401 1,096,278,438
Storage Bandwidth (Disk Vol Rd + Wr) 19,393,609 1,086,042,088
Typical Profile of the Production Consolidation Platform Utilization (All Hosts Active/Active)
Resource Maximum Utilization
Site Total Capacity
% Utilized #NAME? #NAME? #NAME?
#NAME? 358 370,656 0% #NAME? #NAME? #NAME?
Memory (MB) 2,583 6,758 38% #NAME? #NAME? #NAME?
Network (4 Gbps) 1,070,584 132 811049% #NAME? #NAME? #NAME?
Storage (4 Gbps) 1,060,588 132 803476% #NAME? #NAME? #NAME?
The table above shows the utilization of 33 host(s) at each site in an active / active configuration with standard operations and all hosts operating.
Typical Profile of Production Consolidation Platform Utilization (All Hosts Active/Active Loss of One Host)
Resource Maximum Utilization
Site Total Capacity
% Utilized #NAME? #NAME? #NAME?
#NAME? 358 #NAME? #NAME? #NAME? #NAME? #NAME?
Memory (GB RAM) 2,583 #NAME? #NAME? #NAME? #NAME? #NAME?
Network (4 Gbps) 1,070,584 #NAME? #NAME? #NAME? #NAME? #NAME?
[Reference Systems Technology Incorporated] Virtustream® Advisor Assessment Report | 52
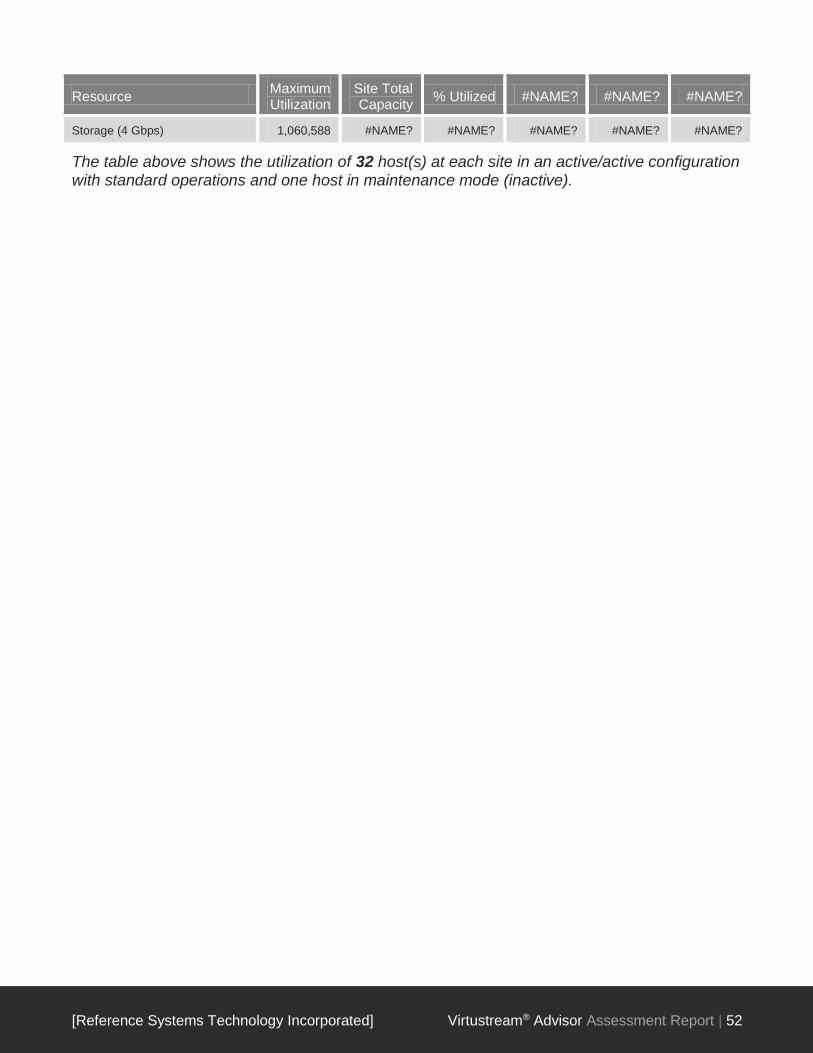
Resource Maximum Utilization
Site Total Capacity
% Utilized #NAME? #NAME? #NAME?
Storage (4 Gbps) 1,060,588 #NAME? #NAME? #NAME? #NAME? #NAME?
The table above shows the utilization of 32 host(s) at each site in an active/active configuration with standard operations and one host in maintenance mode (inactive).

[Reference Systems Technology Incorporated] Virtustream® Advisor Assessment Report | 53
11. Potential Impact of Cloud Infrastructure
Proposed Cloud µVM Resources
This section maps the resource configuration profiled in the previous section into the target cloud environment(s).
The proposal has been modelled with the following parameters:
Most intensive processing week to provide CPU requirements
Most intensive memory week to provide RAM requirements
Most intensive IOPs requirements
Most intensive Networking
Current Overall Resource Utilization
Resource Total during Peak Period % Utilized µVMs
CPU (Mhz) 366,538 18.0% 1,833
Memory (MB) 1,920,612 83.5% 2,687
Disk I/OPS 1,826,416 N/A 1,274
Network (B/s) 1,767,340 N/A 4,307
[Reference Systems Technology Incorporated] Virtustream® Advisor Assessment Report | 54
12. Environmental Impact
Overview
Virtualization has achieved widespread adoption in many organizations due to its ability to essentially do more
with less and faster. Therefore virtualization is in essence a more efficient inherent strategy to pursue.
One convenient side effect of pursuing virtualization is that it will undoubtedly require less utility than was in place
previously. Until recently, hardware was notoriously inefficient as the priority was to maintain service levels, not
necessarily to do so efficiently. Virtualization has highlighted the ability to eradicate huge areas of cost and
inefficiency.
Gaining much more notoriety today is the follow-on effect that if computing can be completed using less resource,
then in turn with being more cost effective, it will also place less demand on the environment. Recent initiatives
such as ‘The Green Grid’ are extolling the virtue of designing the efficient data center and core to this is
consolidation and virtualization.
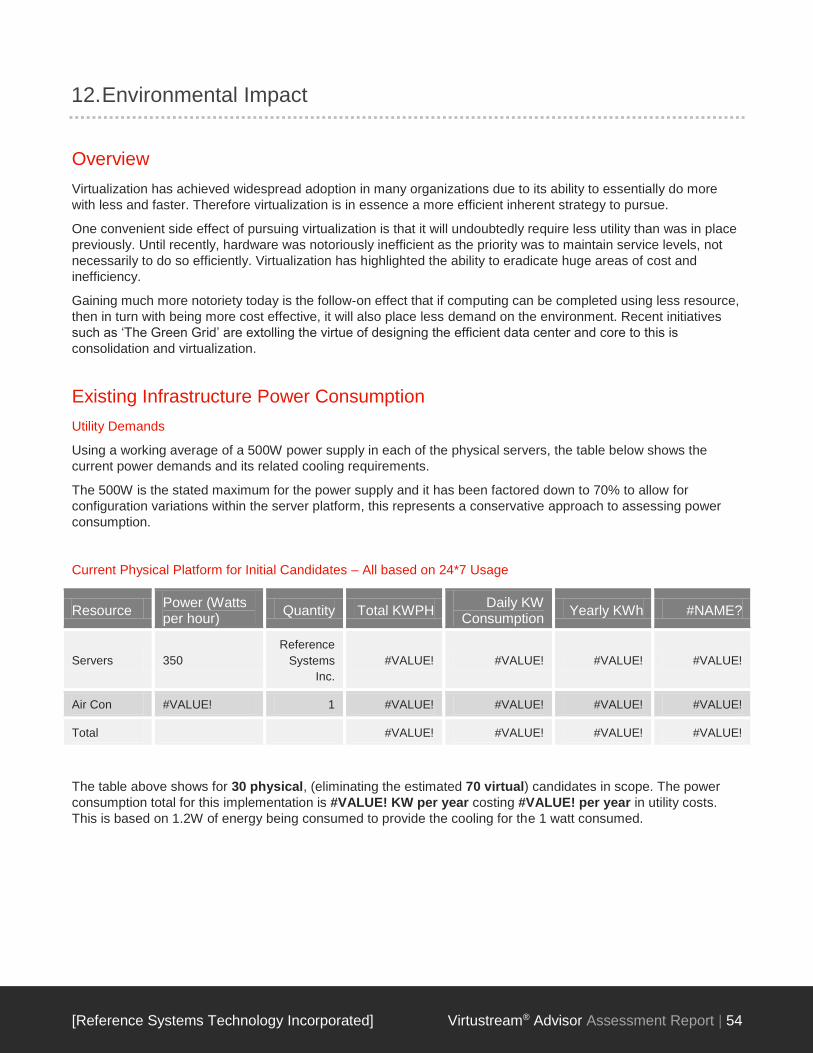
Existing Infrastructure Power Consumption
Utility Demands
Using a working average of a 500W power supply in each of the physical servers, the table below shows the
current power demands and its related cooling requirements.
The 500W is the stated maximum for the power supply and it has been factored down to 70% to allow for
configuration variations within the server platform, this represents a conservative approach to assessing power
consumption.
Current Physical Platform for Initial Candidates – All based on 24*7 Usage
Resource Power (Watts per hour)
Quantity Total KWPH Daily KW
Consumption Yearly KWh #NAME?
Servers 350
Reference
Systems
Inc.
#VALUE! #VALUE! #VALUE! #VALUE!
Air Con #VALUE! 1 #VALUE! #VALUE! #VALUE! #VALUE!
Total #VALUE! #VALUE! #VALUE! #VALUE!
The table above shows for 30 physical, (eliminating the estimated 70 virtual) candidates in scope. The power
consumption total for this implementation is #VALUE! KW per year costing #VALUE! per year in utility costs.
This is based on 1.2W of energy being consumed to provide the cooling for the 1 watt consumed.

[Reference Systems Technology Incorporated] Virtustream® Advisor Assessment Report | 55
Impact of Virtualization Solution
Power Consumption
Power Consumption of the proposed Virtualization Live Platform – All based on 24*7 usage).
Resource Power (Watts
per hour) Quantity Total KWPH
Daily KW Consumption
Yearly KWh #NAME?
Servers 350 33 12 277 101,178 $12,141.36
Storage 4,410 2 9 212 77,263 $9,271.58
Air Con 11,550 1 12 277 101,178 $12,141.36
Total 32 766 279,619 $33,554.30
The above figures take into account the existing virtualized infrastructure; the number of hosts is reflective of what
would be required to virtualize the 56 servers. These virtualization hosts are based on servers operating 835W
power supplies to 100% resulting in the 835W power consumption per hour per server.
In addition, centralized storage would be required, and a representative power consumption of a dual site
implementation of a storage solution capable of meeting the requirements has been specified.
To run the surveyed servers the 33 host(s) would utilize 101,178KW per year resulting in a likely cost of
$12,141.36. This is then increased by the need for centralized storage which would require 77,263KW per year
and cost $9,271.58. The cooling based on 1.2 Watts consumed to provide cooling for 1 watt would add an
additional 101,178KW per year. This brings the total cost to $33,554.30 per year for electricity costs and cooling.
Compared to the existing physical model this would save #VALUE! KW per year and #VALUE!.
Carbon Comparisons
The key to the reduction in carbon footprint emissions in relation to data centers is within the following areas:
Improved efficiency of the power supplies to reduce the inefficiency when demand is low
Reduction in the number of servers by utilizing the resources efficiently
Reduction in the associated cooling requirements due to less emitted BTUs by less servers
The carbon footprint impact of the candidates for consolidation is detailed in the comparison table below.
Resource Total KWPY Carbon Calculation Carbon Footprint (Tons per Year)
Footprint Physical #VALUE! #VALUE! #VALUE!
Footprint Virtual 279,619 #DIV/0! #DIV/0!
Reduction #VALUE! #VALUE! #VALUE!
% Reduction #VALUE! #VALUE! #VALUE!

[Reference Systems Technology Incorporated] Virtustream® Advisor Assessment Report | 56
Calculation Key
Typical gas fired power stations produce 440g of CO2 per KWPH, oil fired stations produce 650g of CO2 per
KWPH coal fired stations 950g per KWPH. The above calculation uses 440g carbon dioxide per KWPH of
electricity for the middle ground.
The carbon footprint for Reference Systems Inc. would be reduced by #VALUE! per year when operating on a
fully virtual platform.
This does not take account for the additional reductions that would be possible by dynamic reduction in available
host resources as demand decreases without any loss of service that would be possible once on a virtualized
platform. This is a feature that is now fully supported, and host servers can be powered on and off to meet varying
demand. The figure being currently estimated is an additional 20% reduction in consumption related to the
virtualization host systems.

[Reference Systems Technology Incorporated] Virtustream® Advisor Assessment Report | 57
Impact of Cloud Solution
Power Consumption
Power Consumption of the proposed Cloud Platform – All based on 24*7 usage).
Resource Power (Watts
per hour) Quantity Total KWPH
Daily KW Consumption
Yearly KWh #NAME?
Servers 350 0 0 0 0 $0.00
Storage 4,410 2 9 212 77,263 $9,271.58
Air Con 0 1 0 0 0 $0.00
Total 9 212 77,263 $9,271.58
The above figures take into account the existing virtualized infrastructure; the number of hosts is reflective of what
would be required to virtualize the 56 servers on the cloud platform. These virtualization hosts are based on
servers operating 835W power supplies to 100% resulting in the 835W power consumption per hour per server.
In addition, centralized storage would be required and a representative power consumption of a dual site
implementation of a storage solution capable of meeting the requirements has been specified.
Carbon Footprint Comparisons
The key to the reduction in carbon footprint emissions in relation to data centers is within the following areas:
Improved efficiency of the power supplies to reduce the inefficiency when demand is low
Reduction in the number of servers by utilizing the resources efficiently
Reduction in the associated cooling requirements due to less emitted BTUs by less servers
The carbon footprint impact of the candidates for consolidation is detailed below.
Resource Total KWPY Carbon Calculation Carbon Footprint (Tons per Year)
Footprint Physical #VALUE! #VALUE! #VALUE!
Footprint Cloud 77,263 #DIV/0! #DIV/0!
Reduction #VALUE! #VALUE! #VALUE!
% Reduction #VALUE! #VALUE! #VALUE!
Calculation Key
Typical gas fired power stations produce 440g of CO2 per KWPH, oil fired stations produce 650g of CO2 per
KWPH coal fired stations 950g per KWPH. The above calculation uses #DIV/0!g carbon dioxide per KWPH of
electricity for the middle ground.
The carbon footprint for Reference Systems Inc. would be reduced by #VALUE! per year when operating on a
cloud services platform.

[Reference Systems Technology Incorporated] Virtustream® Advisor Assessment Report | 58
13. Report Signoff
Report Signoff
Project: Reference Project
I agree with and accept the contents of the report version 1.0, dated Thursday, January 23, 2014.
Reference Systems Inc. Representative
Job Title:
Signed:
Date:
For and on behalf of Reference Systems Inc.:
Print Name:
Virtustream Project Lead
Print name:
Signed:
Date:

[Reference Systems Technology Incorporated] Virtustream® Advisor Assessment Report | 59
14. Target List
Target Name Operating System OS Version CPU Speed
(MHz) Total CPU
(MHz) Disk Capacity
(MB) Memory
(MB) Network (MBits)
Target 004 CentOS release 5.8 (Final) 2.6.18-308.8.1.el5 2,394 19,152 144,971 3,948 1,000
Target 005 CentOS release 5.8 (Final) 2.6.18-308.8.1.el5 2,394 38,304 143,085 7,982 2,000
Target 006 CentOS release 5.7 (Final) 2.6.18-274.12.1.el5 2,394 9,576 38,704 2,010 1,000
Target 007 CentOS release 5.8 (Final) 2.6.18-308.4.1.el5 2,400 38,402 93,731 7,972 6,000
Target 008 CentOS release 5.8 (Final) 2.6.18-308.4.1.el5 2,400 38,402 1,404,026 7,972 6,000
Target 009 CentOS release 4.5 (Final) 2.6.9-55.0.2.ELsmp 1,867 7,467 72,671 1,010 1,000
Target 010 CentOS release 4.5 (Final) 2.6.9-55.0.2.ELsmp 1,867 7,467 72,671 1,010 5,000
Target 011 CentOS release 4.5 (Final) 2.6.9-55.0.9.ELsmp 1,596 6,384 156,377 4,051 1,000
Target 026 CentOS release 5.7 (Final) 2.6.18-274.17.1.el5 2,494 79,803 261,794 16,049 2,000
Target 027 CentOS release 5.8 (Final) 2.6.18-308.8.2.el5 2,500 5,000 63,528 12,010 1,000
Target 028 CentOS release 6.3 (Final) 2.6.32-
220.23.1.el6.x86_64 2,500 2,500 49,652 490 1,000
Target 029 CentOS release 5.8 (Final) 2.6.18-308.8.2.el5 2,500 5,000 63,528 12,010 1,000
Target 030 CentOS release 5.6 (Final) 2.6.18-238.5.1.el5 2,833 90,670 126,084 16,052 2,000
Target 031 CentOS release 5.6 (Final) 2.6.18-238.9.1.el5 2,328 74,481 267,585 12,009 2,000
Target 032 CentOS release 5.6 (Final) 2.6.18-238.5.1.el5 2,328 74,482 265,571 7,981 2,000
Target 033 CentOS release 5.6 (Final) 2.6.18-238.9.1.el5 2,494 79,802 263,678 12,009 2,000
Target 034 CentOS release 6.2 (Final) 2.6.32-
220.17.1.el6.x86_64 2,833 5,667 97,815 2,006 10,000
Target 035 CentOS release 5.5 (Final) 2.6.18-194.11.3.el5PAE 2,993 11,970 112,212 7,986 10,000
Target 036 CentOS release 5.5 (Final) 2.6.18-194.32.1.el5 2,826 2,826 120,830 3,949 10,000
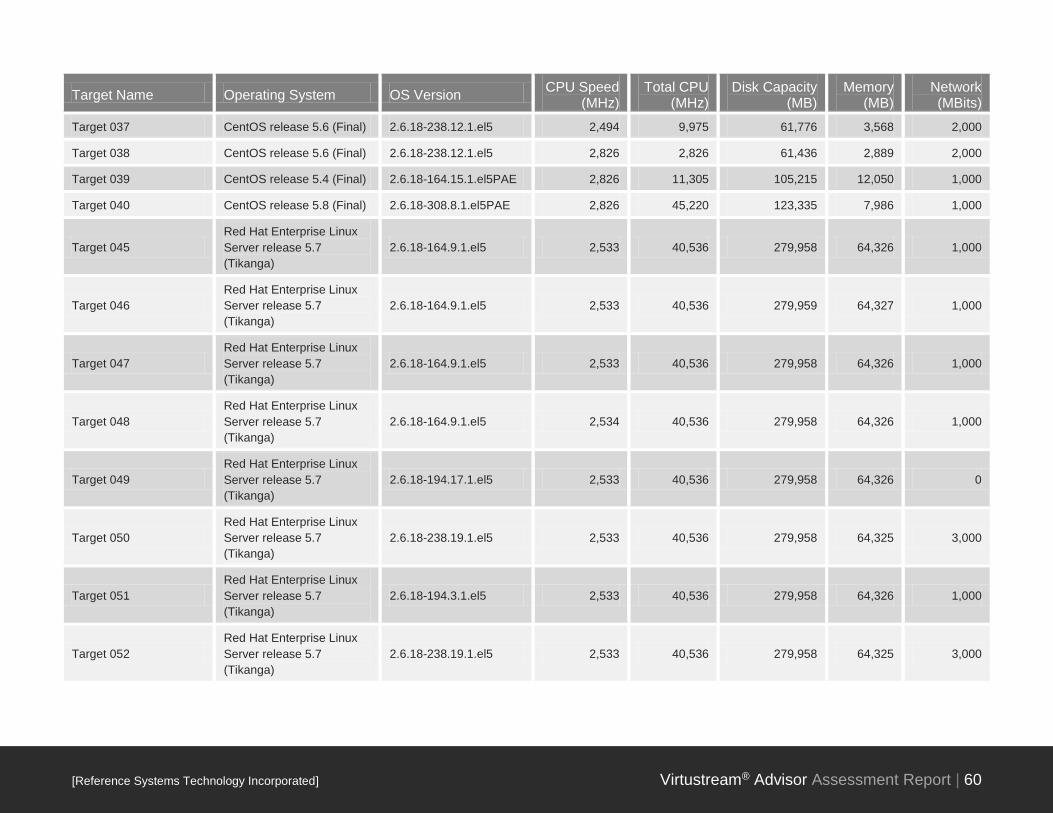
[Reference Systems Technology Incorporated] Virtustream® Advisor Assessment Report | 60
Target Name Operating System OS Version CPU Speed
(MHz) Total CPU
(MHz) Disk Capacity
(MB) Memory
(MB) Network (MBits)
Target 037 CentOS release 5.6 (Final) 2.6.18-238.12.1.el5 2,494 9,975 61,776 3,568 2,000
Target 038 CentOS release 5.6 (Final) 2.6.18-238.12.1.el5 2,826 2,826 61,436 2,889 2,000
Target 039 CentOS release 5.4 (Final) 2.6.18-164.15.1.el5PAE 2,826 11,305 105,215 12,050 1,000
Target 040 CentOS release 5.8 (Final) 2.6.18-308.8.1.el5PAE 2,826 45,220 123,335 7,986 1,000
Target 045
Red Hat Enterprise Linux
Server release 5.7
(Tikanga)
2.6.18-164.9.1.el5 2,533 40,536 279,958 64,326 1,000
Target 046
Red Hat Enterprise Linux
Server release 5.7
(Tikanga)
2.6.18-164.9.1.el5 2,533 40,536 279,959 64,327 1,000
Target 047
Red Hat Enterprise Linux
Server release 5.7
(Tikanga)
2.6.18-164.9.1.el5 2,533 40,536 279,958 64,326 1,000
Target 048
Red Hat Enterprise Linux
Server release 5.7
(Tikanga)
2.6.18-164.9.1.el5 2,534 40,536 279,958 64,326 1,000
Target 049
Red Hat Enterprise Linux
Server release 5.7
(Tikanga)
2.6.18-194.17.1.el5 2,533 40,536 279,958 64,326 0
Target 050
Red Hat Enterprise Linux
Server release 5.7
(Tikanga)
2.6.18-238.19.1.el5 2,533 40,536 279,958 64,325 3,000
Target 051
Red Hat Enterprise Linux
Server release 5.7
(Tikanga)
2.6.18-194.3.1.el5 2,533 40,536 279,958 64,326 1,000
Target 052
Red Hat Enterprise Linux
Server release 5.7
(Tikanga)
2.6.18-238.19.1.el5 2,533 40,536 279,958 64,325 3,000
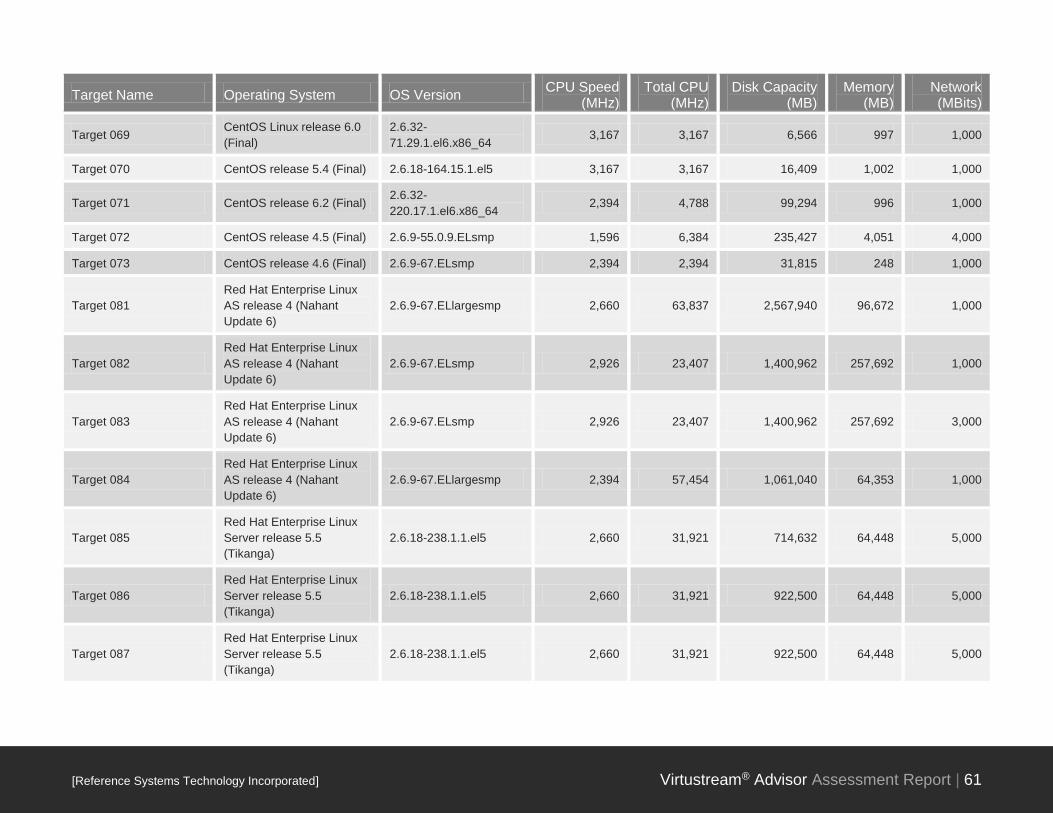
[Reference Systems Technology Incorporated] Virtustream® Advisor Assessment Report | 61
Target Name Operating System OS Version CPU Speed
(MHz) Total CPU
(MHz) Disk Capacity
(MB) Memory
(MB) Network (MBits)
Target 069 CentOS Linux release 6.0
(Final)
2.6.32-
71.29.1.el6.x86_64 3,167 3,167 6,566 997 1,000
Target 070 CentOS release 5.4 (Final) 2.6.18-164.15.1.el5 3,167 3,167 16,409 1,002 1,000
Target 071 CentOS release 6.2 (Final) 2.6.32-
220.17.1.el6.x86_64 2,394 4,788 99,294 996 1,000
Target 072 CentOS release 4.5 (Final) 2.6.9-55.0.9.ELsmp 1,596 6,384 235,427 4,051 4,000
Target 073 CentOS release 4.6 (Final) 2.6.9-67.ELsmp 2,394 2,394 31,815 248 1,000
Target 081
Red Hat Enterprise Linux
AS release 4 (Nahant
Update 6)
2.6.9-67.ELlargesmp 2,660 63,837 2,567,940 96,672 1,000
Target 082
Red Hat Enterprise Linux
AS release 4 (Nahant
Update 6)
2.6.9-67.ELsmp 2,926 23,407 1,400,962 257,692 1,000
Target 083
Red Hat Enterprise Linux
AS release 4 (Nahant
Update 6)
2.6.9-67.ELsmp 2,926 23,407 1,400,962 257,692 3,000
Target 084
Red Hat Enterprise Linux
AS release 4 (Nahant
Update 6)
2.6.9-67.ELlargesmp 2,394 57,454 1,061,040 64,353 1,000
Target 085
Red Hat Enterprise Linux
Server release 5.5
(Tikanga)
2.6.18-238.1.1.el5 2,660 31,921 714,632 64,448 5,000
Target 086
Red Hat Enterprise Linux
Server release 5.5
(Tikanga)
2.6.18-238.1.1.el5 2,660 31,921 922,500 64,448 5,000
Target 087
Red Hat Enterprise Linux
Server release 5.5
(Tikanga)
2.6.18-238.1.1.el5 2,660 31,921 922,500 64,448 5,000

[Reference Systems Technology Incorporated] Virtustream® Advisor Assessment Report | 62
Target Name Operating System OS Version CPU Speed
(MHz) Total CPU
(MHz) Disk Capacity
(MB) Memory
(MB) Network (MBits)
Target 088
Red Hat Enterprise Linux
Server release 5.5
(Tikanga)
2.6.18-238.1.1.el5 2,660 31,921 922,500 64,448 2,000
Target 089
Red Hat Enterprise Linux
Server release 5.5
(Tikanga)
2.6.18-238.5.1.el5 2,793 67,034 139,392 32,179 2,000
Target 090
Red Hat Enterprise Linux
Server release 6.1
(Santiago)
2.6.32-
131.0.15.el6.x86_64 1,200 38,400 712,732 129,141 2,000
Target 091
Red Hat Enterprise Linux
Server release 6.1
(Santiago)
2.6.32-
131.0.15.el6.x86_64 1,200 38,400 712,732 129,141 2,000
Target 092
Red Hat Enterprise Linux
Server release 6.1
(Santiago)
2.6.32-
131.0.15.el6.x86_64 1,200 38,400 763,918 129,141 2,000
Target 093
Red Hat Enterprise Linux
Server release 6.1
(Santiago)
2.6.32-
100.34.1.el6uek.x86_64 2,128 136,174 3,267,460 258,455 6,000
Target 094
Red Hat Enterprise Linux
Server release 6.1
(Santiago)
2.6.32-
100.34.1.el6uek.x86_64 2,128 136,213 3,267,460 258,455 14,000
Target 095
Red Hat Enterprise Linux
Server release 6.1
(Santiago)
2.6.32-
100.34.1.el6uek.x86_64 2,128 136,182 3,267,460 258,455 5,000
Target 096
Red Hat Enterprise Linux
Server release 5.5
(Tikanga)
2.6.18-238.9.1.el5 1,596 19,152 972,932 96,669 5,000
Target 097
Red Hat Enterprise Linux
Server release 5.5
(Tikanga)
2.6.18-238.9.1.el5 1,596 19,152 972,932 96,669 5,000

[Reference Systems Technology Incorporated] Virtustream® Advisor Assessment Report | 63
Target Name Operating System OS Version CPU Speed
(MHz) Total CPU
(MHz) Disk Capacity
(MB) Memory
(MB) Network (MBits)
Target 098
Red Hat Enterprise Linux
Server release 5.5
(Tikanga)
2.6.18-238.9.1.el5 1,596 19,152 972,932 96,669 5,000
Target 099
Red Hat Enterprise Linux
Server release 5.3
(Tikanga)
2.6.18-164.10.1.el5xen 2,527 40,432 139,392 31,729 3,000
Target 100
Red Hat Enterprise Linux
Server release 5.3
(Tikanga)
2.6.18-164.10.1.el5xen 2,527 40,432 139,392 31,728 2,000

[Reference Systems Technology Incorporated] Virtustream® Advisor Assessment Report | 64
15. About Virtustream, Inc.
Virtustream, Inc. is a global infrastructure services firm committed to providing our clients pioneering and impartial
thought leadership in defining Information Technology strategies.
Our solutions enable clients to actualize the enterprise cloud by providing strategy, integration and managed
services leveraging virtualization technologies, and our proprietary, secure platform, xStream. Virtustream
delivers efficient infrastructure solutions backed by guaranteed service levels and industry leading resource-
based pricing models built upon the company’s pillars of service excellence including Professional Services,
Cloud Services and Managed Service solutions.
Virtustream has been providing specialist independent IT consultancy in all areas of virtualization from the data
center to the desktop for the last 10 years. We have won numerous industry awards in recognition of the detail
and quality of our work including being awarded VMware’s EMEA Consultancy Partner of the Year and the ICT -
Green IT initiative of the year award. Our customers range from the smaller business to the larger enterprises,
charities and government organizations including Domino Foods, Johns Hopkins, National Education Association,
The World Bank, Federal Reserve IT, National Institutes of Health, Allied Irish Bank, EMC and VMware.
The XStream Platform
The xStream platform is unique to Virtustream and has been built and developed in-house using internal IP
accumulated over 9 years of client engagements and including bespoke automation scripts to create a highly
scalable, efficient secure and resilient infrastructure to support our clients.
Virtustream has developed the platform to be vendor agnostic to leverage best of breed hardware and software
and is made available as a dedicated or shared platform, either managed or unmanaged, in our data centers or
on a client’s premises.
This provides our clients with the flexibility of options, so that we can host critical applications on any platform with
guaranteed committed level of resources defined by units. These computing units are calculated through CPU,
RAM, IOPs, Network, and requirements for High Availability and Disaster Recovery.
The whole environment is also tuned to optimize ERP applications such as SAP, Oracle and Microsoft and is
easily accessed via a personalized Silverlight portal.
Solution Overview
The xStream platform features an N+2 cluster design for high availability within the data center. Similarly, the
platform features resilience across two data centers.
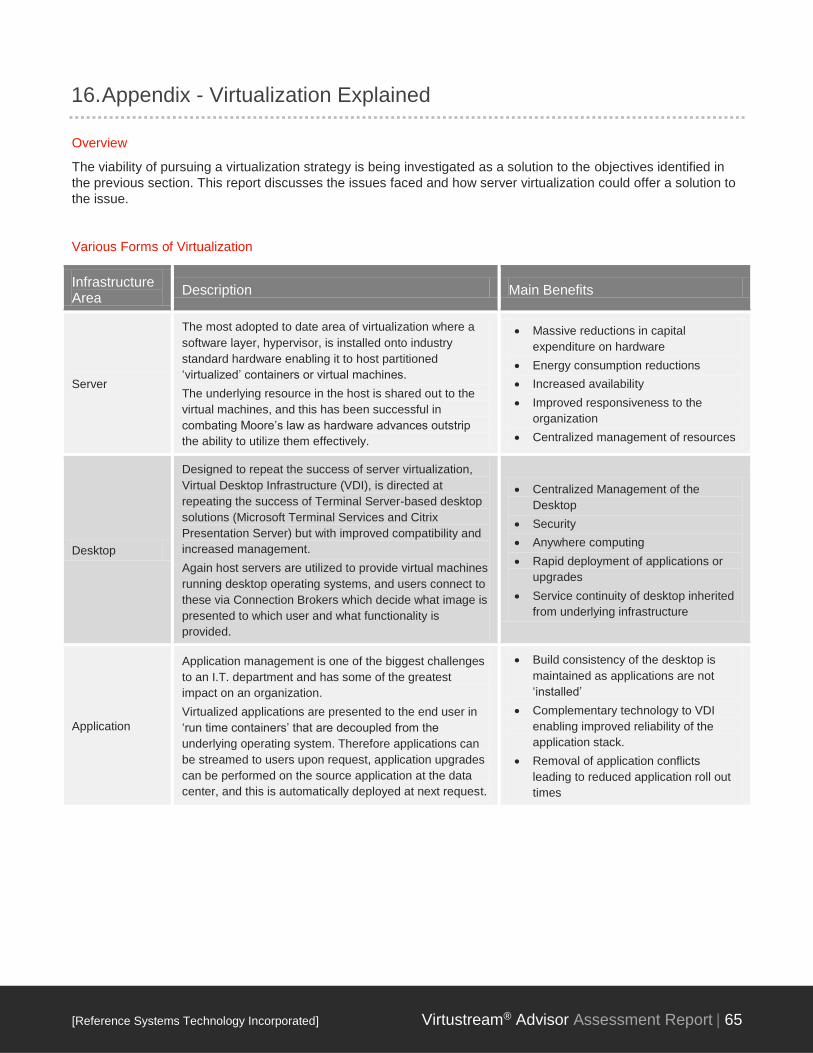
[Reference Systems Technology Incorporated] Virtustream® Advisor Assessment Report | 65
16. Appendix - Virtualization Explained
Overview
The viability of pursuing a virtualization strategy is being investigated as a solution to the objectives identified in
the previous section. This report discusses the issues faced and how server virtualization could offer a solution to
the issue.
Various Forms of Virtualization
Infrastructure Area
Description Main Benefits
Server
The most adopted to date area of virtualization where a
software layer, hypervisor, is installed onto industry
standard hardware enabling it to host partitioned
‘virtualized’ containers or virtual machines.
The underlying resource in the host is shared out to the
virtual machines, and this has been successful in
combating Moore’s law as hardware advances outstrip
the ability to utilize them effectively.
Massive reductions in capital
expenditure on hardware
Energy consumption reductions
Increased availability
Improved responsiveness to the
organization
Centralized management of resources
Desktop
Designed to repeat the success of server virtualization,
Virtual Desktop Infrastructure (VDI), is directed at
repeating the success of Terminal Server-based desktop
solutions (Microsoft Terminal Services and Citrix
Presentation Server) but with improved compatibility and
increased management.
Again host servers are utilized to provide virtual machines
running desktop operating systems, and users connect to
these via Connection Brokers which decide what image is
presented to which user and what functionality is
provided.
Centralized Management of the
Desktop
Security
Anywhere computing
Rapid deployment of applications or
upgrades
Service continuity of desktop inherited
from underlying infrastructure
Application
Application management is one of the biggest challenges
to an I.T. department and has some of the greatest
impact on an organization.
Virtualized applications are presented to the end user in
‘run time containers’ that are decoupled from the
underlying operating system. Therefore applications can
be streamed to users upon request, application upgrades
can be performed on the source application at the data
center, and this is automatically deployed at next request.
Build consistency of the desktop is
maintained as applications are not
‘installed’
Complementary technology to VDI
enabling improved reliability of the
application stack.
Removal of application conflicts
leading to reduced application roll out
times

[Reference Systems Technology Incorporated] Virtustream® Advisor Assessment Report | 66
Infrastructure Area
Description Main Benefits
Storage
The foundation on which all virtualization depends is the
storage layer, and Storage Virtualization enables the data
residing within the physical storage devices to be
accessed via a virtualization layer which enables an
independence from the underlying hardware.
Data is able to be replicated to multiple locations, and
applications access the data via the virtualized instance,
meaning data can traverse physical boundaries.
It also enables greater efficiency in the consumption of
storage as virtual volumes can be ‘thin provisioned’,
meaning they are built for future requirements but only
consume what is required for now.
Data availability as dependency on the
underlying physical resource is
reduced massively.
Performance can be increased as
physical disks can all participate in the
I/O demands
Just in time provisioning through thinly
provisioned data volumes
Reduced power consumption by
reduced footprint that is only increased
as real data is required
Network
Covering both the traditional network-based layer used for
traffic between devices and the core infrastructure
communication layers, such as storage area networks.
Network virtualization again takes the concept of
consolidation and abstraction so that fewer physical
interface cards are required and instead software layers
control the traffic flow and overlay Quality of Service
(QOS) to enable network interfaces to be shared.
Technology area is fast becoming known as
Convergence.
Simplified connection networks
Guaranteed service levels
Share available resources between
different networks
Improved manageability
What is Virtualization?
Virtualization is not a new technology as it has been utilized within mainframe and mid-range machines since its
invention by IBM over 30 years ago. It is relatively new in the area of x86 server-based technologies. It has been
established in production use however for over 5 years. In the last two years, adoption rates have soared with
most organizations attempting to exploit its benefit.
Virtualization places a thin layer of software onto hardware to allow the physical resource to be dynamically
segmented and presented to multiple server instances that run within the virtualization software. It effectively
creates sub-systems dedicated to services much in the same way as mid-range and mainframe solutions and
enables physical resources to be shared to multiple servers.
This design aspect has been adopted by other areas of I.T. infrastructure and is now incorporated into the storage
layer, application layer and workstation layer.
Why is it being adopted by so many
Inefficiency within the x86 physical models has been the primary driver. The reason that the issue exists in the
first place is the typical deployment model for x86-based servers dictates that one service is deployed onto one
server chassis, resulting in improved reliability (due mainly to the fact x86 operating systems have not traditionally
multi-tasked effectively) but increased inefficiency.
Hardware advances have exacerbated the issue as this has widened the gap between the resource available and
the ability to utilize it; this has led to typical averages of less than 10% utilization with regard to processor
utilization.
This has now been expanded where the benefits witnessed in the server sector are now being examined in the
application, storage and desktop models.

[Reference Systems Technology Incorporated] Virtustream® Advisor Assessment Report | 67
Is it just another of the latest trends from IT that will be out of fashion in a year?
IT often suffers from appearing to follow the latest developments only to repeat the process within a year when
the latest new technology surfaces, leading to wastage in expenditure and a lack of cohesive strategy. When
virtualization on x86 first appeared approximately six years ago it created significant interest but also attracted
much skepticism.
The landscape for virtualization today however presents a picture of huge adoption rates and acceptance as an
established mainstream deployment solution. The main driving force behind this growth has been the delivery on
the benefits promised by early adopters leading to exceptionally high levels of satisfaction by those organizations
who have made the migration.
The success of the technology has been based not on the technical benefits it offers IT services divisions but on
the fundamental changes it has made to the operational effectiveness of those who have adopted it.
Hardware manufacturers have changed their solutions to take advantage of the benefits of virtualization and as
this trend progresses many industry observers comment that it will reach a point where virtualization is built into
the hardware platform itself and will be a power-on option.
Headline Benefits of Server Virtualization
Issue Virtualization Solution Benefit
Data Center
Space
Allow more services to operate on a physical platform by sharing
underutilized resources to multiple servers
Less hardware working more
efficiently. Less data center space
required.
Data Center
Costs
By using the physical resources more efficiently, the asset is
worked to higher levels (typically taking utilization from sub 10%
towards 80%); and therefore, less hardware is required which
reduces the associated costs.
Power, cooling, space and
maintenance costs can be
significantly reduced.
Operational
efficiencies
Servers that were previously hardware-based are presented as
software; and therefore, deployment of servers can be achieved
far more rapidly and reliably. Typical commissioning of a server
can take 2 days currently (operating system and patching only),
and this can be reduced to minutes by deploying standardized
templates of virtual servers that are hardware independent.
Server deployment can be
completed in significantly less time
and with higher degrees of
standardization.
Service Levels
Aligning business service levels to hardware-based solutions can
be complex and costly. Areas such as business continuity and
high availability can result in duplication of resources.
Virtualization has such solutions built into the underlying
architecture; and therefore, solutions can be standardized and
costs reduced.
Costly high availability solutions can
be reduced in expenditure and
complexity and made available to
entire data centers.
Environmental
Benefits
High power and cooling consumption of underutilized servers
results in higher carbon emissions. Virtualization can significantly
reduce these.
Massive savings in carbon
emissions
Planning for
future
requirements
With the established inefficiencies of the physical model, this
places a higher emphasis on accurate predictive planning. While
Virtualization does not advocate less diligence in the planning
process, it does enable greater flexibility by being able to share
resources and prioritize allocation based on service level
decisions.
Far more flexible and dynamic
solution more in line with the nature
of organizations on demand model

[Reference Systems Technology Incorporated] Virtustream® Advisor Assessment Report | 68
Issue Virtualization Solution Benefit
Dynamic
Provisioning
Virtualization through all its forms allows the dynamic
management of physical resources to meet the demand; this
allows organizations to build for now but expand effortlessly for
the future.
Matching I.T. strategy to
organizational agility.
What Should or Should Not Be Virtualized
Virtualization Solution Reason
Virtualized
Any server where the measured performance can be combined
with other servers to not cause a combined issue on the
consolidation platform or where licensing proves to be prohibitive
to do so.
Servers should always be
measured for their suitability if
transferring from existing physical
platform as this can show
underlying existing issues in the
physical configuration that would
mask where the issue resides if
problems are encountered.
Physical
It is recommended to maintain at least one instance of the
following type of servers:
Active Directory Server
DNS server
Backup server
Virtual Center Server
Older versions of Citrix servers can present performance issues if
running on Windows 2000
Prohibitive licensing models based on host resources not virtual
server
By maintaining these outside the
consolidation platform there will
always be one instance that can be
brought up in isolation or first during
a sequence of power up to enable
critical facilities for other services
such as authentication or DNS.
Virtual Center is a recommendation
of Virtustream as it does not see
the wisdom in having the
management platform for
virtualization to be held within the
services it is managing.
Vendor Criteria
It is important that when choosing a platform vendor that the features and cost are evaluated in relation the stated
goals. By evaluating the vendors against each other, it is possible to make the correct decision of which platform
will provide the long term technology to deliver the TCO and ROI figures.
When comparing the vendors, it is important to look at the near future to what will be available as this can
influence any tactical decisions in the short term to move to an intermediate version of the vendor to allow
migration to the preferred platform. This design is based on the current or release imminent from the vendors in
the next 2-3 months as this is the realistic start of an implementation timeline.
The vendors for comparison in this assessment were Microsoft Hyper-V R2 and VMware vSphere. This section
looks at the overall feature comparison and additional products that are required to deliver the overall strategic
design and then outlines an indicative costing for comparison.
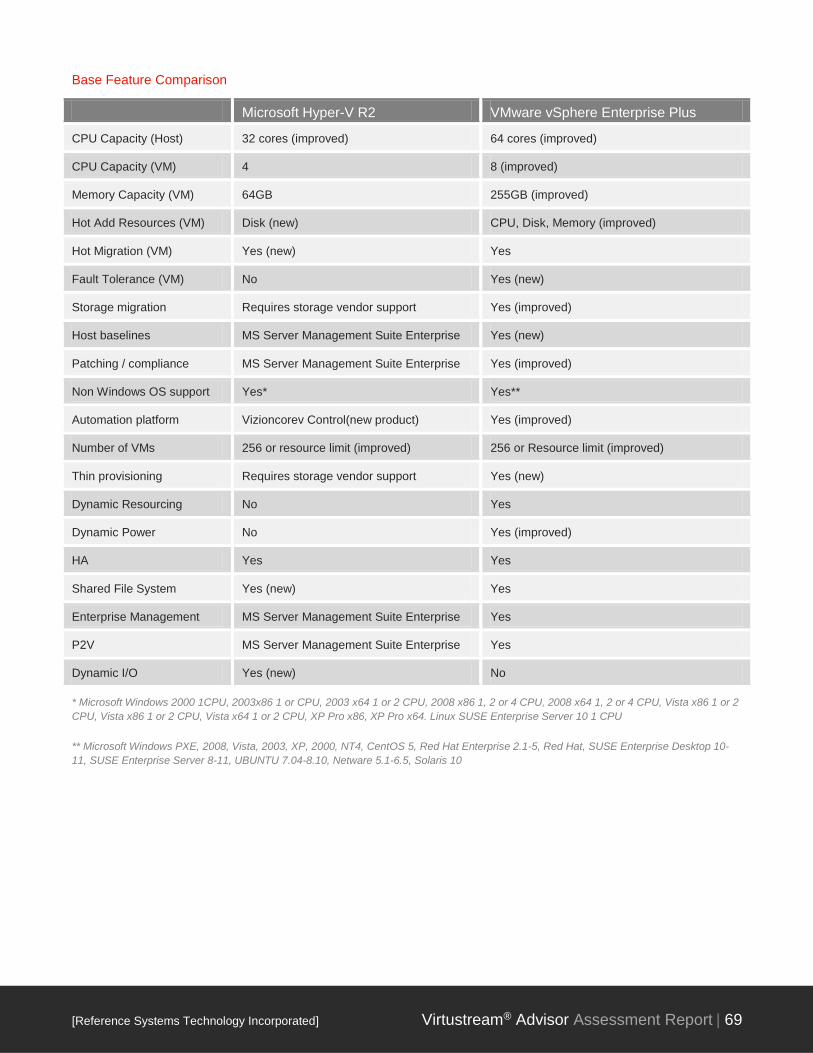
[Reference Systems Technology Incorporated] Virtustream® Advisor Assessment Report | 69
Base Feature Comparison
Microsoft Hyper-V R2 VMware vSphere Enterprise Plus
CPU Capacity (Host) 32 cores (improved) 64 cores (improved)
CPU Capacity (VM) 4 8 (improved)
Memory Capacity (VM) 64GB 255GB (improved)
Hot Add Resources (VM) Disk (new) CPU, Disk, Memory (improved)
Hot Migration (VM) Yes (new) Yes
Fault Tolerance (VM) No Yes (new)
Storage migration Requires storage vendor support Yes (improved)
Host baselines MS Server Management Suite Enterprise Yes (new)
Patching / compliance MS Server Management Suite Enterprise Yes (improved)
Non Windows OS support Yes* Yes**
Automation platform Vizioncorev Control(new product) Yes (improved)
Number of VMs 256 or resource limit (improved) 256 or Resource limit (improved)
Thin provisioning Requires storage vendor support Yes (new)
Dynamic Resourcing No Yes
Dynamic Power No Yes (improved)
HA Yes Yes
Shared File System Yes (new) Yes
Enterprise Management MS Server Management Suite Enterprise Yes
P2V MS Server Management Suite Enterprise Yes
Dynamic I/O Yes (new) No
* Microsoft Windows 2000 1CPU, 2003x86 1 or CPU, 2003 x64 1 or 2 CPU, 2008 x86 1, 2 or 4 CPU, 2008 x64 1, 2 or 4 CPU, Vista x86 1 or 2
CPU, Vista x86 1 or 2 CPU, Vista x64 1 or 2 CPU, XP Pro x86, XP Pro x64. Linux SUSE Enterprise Server 10 1 CPU
** Microsoft Windows PXE, 2008, Vista, 2003, XP, 2000, NT4, CentOS 5, Red Hat Enterprise 2.1-5, Red Hat, SUSE Enterprise Desktop 10-
11, SUSE Enterprise Server 8-11, UBUNTU 7.04-8.10, Netware 5.1-6.5, Solaris 10
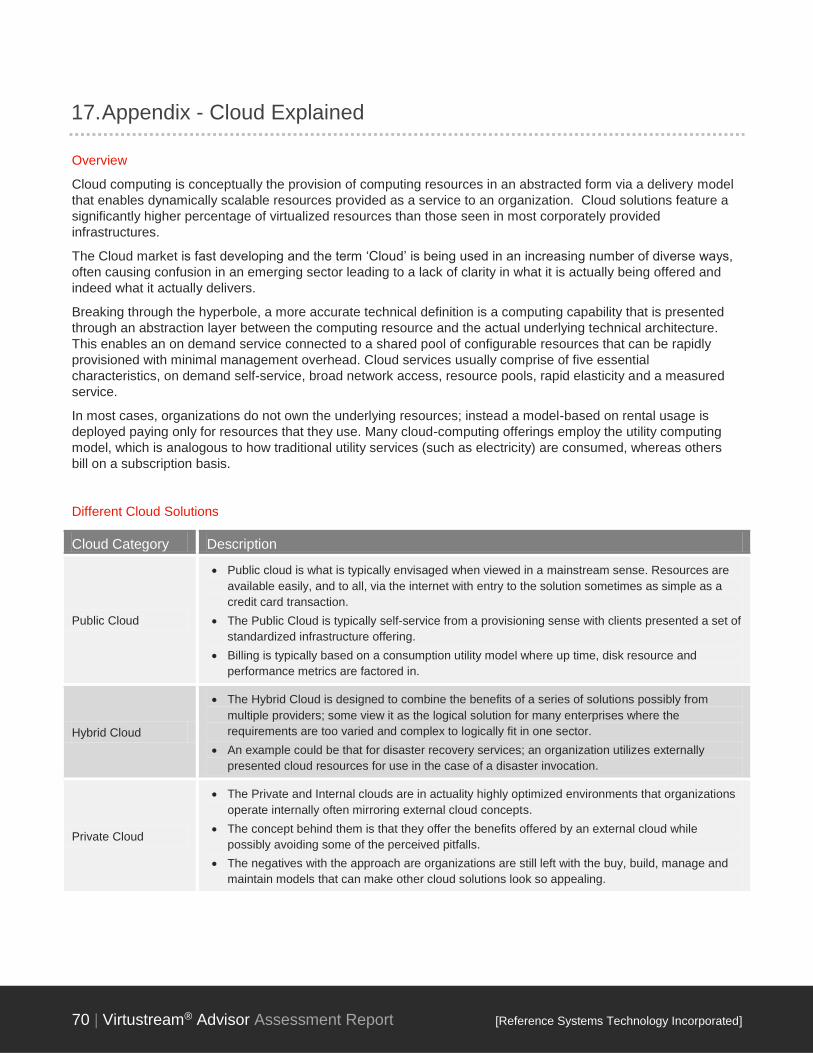
70 | Virtustream® Advisor Assessment Report [Reference Systems Technology Incorporated]
17. Appendix - Cloud Explained
Overview
Cloud computing is conceptually the provision of computing resources in an abstracted form via a delivery model
that enables dynamically scalable resources provided as a service to an organization. Cloud solutions feature a
significantly higher percentage of virtualized resources than those seen in most corporately provided
infrastructures.
The Cloud market is fast developing and the term ‘Cloud’ is being used in an increasing number of diverse ways,
often causing confusion in an emerging sector leading to a lack of clarity in what it is actually being offered and
indeed what it actually delivers.
Breaking through the hyperbole, a more accurate technical definition is a computing capability that is presented
through an abstraction layer between the computing resource and the actual underlying technical architecture.
This enables an on demand service connected to a shared pool of configurable resources that can be rapidly
provisioned with minimal management overhead. Cloud services usually comprise of five essential
characteristics, on demand self-service, broad network access, resource pools, rapid elasticity and a measured
service.
In most cases, organizations do not own the underlying resources; instead a model-based on rental usage is
deployed paying only for resources that they use. Many cloud-computing offerings employ the utility computing
model, which is analogous to how traditional utility services (such as electricity) are consumed, whereas others
bill on a subscription basis.
Different Cloud Solutions
Cloud Category Description
Public Cloud
Public cloud is what is typically envisaged when viewed in a mainstream sense. Resources are
available easily, and to all, via the internet with entry to the solution sometimes as simple as a
credit card transaction.
The Public Cloud is typically self-service from a provisioning sense with clients presented a set of
standardized infrastructure offering.
Billing is typically based on a consumption utility model where up time, disk resource and
performance metrics are factored in.
Hybrid Cloud
The Hybrid Cloud is designed to combine the benefits of a series of solutions possibly from
multiple providers; some view it as the logical solution for many enterprises where the
requirements are too varied and complex to logically fit in one sector.
An example could be that for disaster recovery services; an organization utilizes externally
presented cloud resources for use in the case of a disaster invocation.
Private Cloud
The Private and Internal clouds are in actuality highly optimized environments that organizations
operate internally often mirroring external cloud concepts.
The concept behind them is that they offer the benefits offered by an external cloud while
possibly avoiding some of the perceived pitfalls.
The negatives with the approach are organizations are still left with the buy, build, manage and
maintain models that can make other cloud solutions look so appealing.

Reference Project
71 | Virtustream® Advisor Assessment Report [Reference Systems Technology Incorporated]
Cloud Services – Service Provider Options
In the above illustration it is easy to see the evolutionary scale of control as an organization moves through the
service level offering from cloud services.
In the traditional dedicated IT model on the first column we see the service level extending to the Network
element of the technology stack, where most organizations rely on a service provider of some variety to provide
their network links to locations.
Progressing to the next column, that of the traditional Hosting Provider, we find it shifting in the areas of storage
and server where the responsibility is shared. Above the server layer the client is still responsible for the virtual
machines and everything that operates on them.
Moving into Infrastructure as a Service (IaaS) the client has handed over responsibility solely to the provider in the
areas of Network, Storage and Server and has joint responsibility for the virtual machine layer, everything else is
controlled by the client.
Platform as a Service (PaaS) extends this responsibility further still with the service provider sharing responsibility
for the application layer and the actual Virtual Machines becoming part of a wider services agreement.
In the final iteration, Software as a Service (SaaS) the client has delegated responsibility for the entire stack with
them maintaining only shared control over the critical data layer.

Headquarters
4800 Montgomery Lane
Suite 1100, Bethesda
MD 20814
Tel: +1.(240).252.1007
Fax: +1.301.718.7880
Email: [email protected]
www.virtustream.com