adwest media usage survey
DESCRIPTION
Adwest media usage survey. Communities 10K to 50K. 2013 How geography impacts lifestyle, shopping habits and media usage. HOW GEOGRAPHY IMPACTS LIFESTYLE AND MEDIA USAGE ON THE PRAIRIES. Communities 10K to 50K. STUDY OBJECTIVES: - PowerPoint PPT PresentationTRANSCRIPT

ADWEST MEDIA USAGE SURVEY
2013 HOW GEOGRAPHY IMPACTS LIFESTYLE, SHOPPING HABITS AND MEDIA USAGE
Communities 10K to 50K

HOW GEOGRAPHY IMPACTS LIFESTYLE AND MEDIA USAGE ON THE PRAIRIES
STUDY OBJECTIVES:
1. To determine what impact ‘community’ has on the types of news and information that people are interested in and the sources they use to seek out that information.
2. To identify influences and factors that could play a role in how people in different types of communities access information.
3. Use the information to quantify the differences between populations living in rural areas and smaller communities against those living in larger cities and metropolitan areas.
4. How does media accessibility influence the sources people use to get information.
Communities 10K to 50K

THE STUDY• Commissioned by AdWest Marketing Inc and conducted by Totum
Research Inc.
• Survey: 8-Page Mailed Questionnaire. Sample was selected by SM Research split into 1,000 random addresses within each of the 5 geographic groups for a total of 5,000 addresses in Alberta, Saskatchewan, Manitoba and Northwest Territories/Nunavut
• Communities: Under 5,000 Population and Rural• Communities: 5,000 to 10,000 Population• Communities: 10,000 to 50,000 Population• Communities: 50,000 to 100,000 Population• Communities: Over 100,000 Population
• Surveys addressed to the resident of the household 18 years of age or older and the next to celebrate a birthday in the household.
• Timing: Mid November 2013 – Mid January 2014
Communities 10K to 50K

SAMPLE SIZES AND RESPONSE RATES
The maximum margin of error for 1,015 responses is ±3.1% at the 95% confidence level. For 200 responses it is ±6.9% at the 95% confidence level.
Communities 10K to 50K

COMMUNITY ENGAGEMENT
Communities 10K to 50K

5%11%
20%
49%
14%
Length of Time Lived in Your Community
Less than 1 year 1 to 5 years 6 to 10 years 11 to 20 years More than 20 years All your life
49% of respondents in small cities indi-cated they’ve lived in the area more
than 20 Years.
Communities 10K to 50K
Totum Research November/December 2013: How Media Habits Vary by Community Size and Type, N=1,015

41%
59%
1%
Do You Know the Names of Neighbours Who Live Close by You
Yes, know them all
Yes, know only some
No, don't know any
Do not have neighbours close by
58% of respondents in communities of 10-50K indicated they know the names of all of their neighbours. 41% know only some
of their names. This suggests a strong connection with community but slightly
less than the connection neighbours have in smaller communities
Communities 10K to 50K
Totum Research November/December 2013: How Media Habits Vary by Community Size and Type, N=1,015
ENGAGEMENT WITH NEWS AND SOURCES OF NEWS
Communities 10K to 50K

More time per day About the same amount of time Less time per day0%
10%
20%
30%
40%
50%
60%
70%
80%
90%
100%
17%
73%
10%
Time Personally Spent With News Compared to 2 Years Ago
90% of respondents in the small cities group said they
spend at least the same amount of time with the
news as they did 2 years ago. 17% said they are actually
spending MORE time with the news
Communities 10K to 50K
Totum Research November/December 2013: How Media Habits Vary by Community Size and Type, N=1,015

Inte
rnat
iona
l New
s
Most o
f the
tim
e
Only
whe
n so
met
hing
is h
appe
ning
Seld
om o
r Nev
er
Not st
ated
Natio
nal N
ews
Most o
f the
tim
e
Only
whe
n so
met
hing
is h
appe
ning
Seld
om o
r Nev
er
Not st
ated
Loca
l New
s
Most o
f the
tim
e
Only
whe
n so
met
hing
is h
appe
ning
Seld
om o
r Nev
er
Not st
ated
0
0.1
0.2
0.3
0.4
0.5
0.6
0.7
0.8
0.9
1
0.522
0.298
0.1010.079
0.68
0.243
0.0480.029
0.794
0.120.0480.038
How Closely Do You Follow Specific Types of News
In cities of 10-50K population respondents were more engaged with Local news than
any other news types
Communities 10K to 50K
Totum Research November/December 2013: How Media Habits Vary by Community Size and Type, N=1,015

0%
10%
20%
30%
40%
50%
60%
70%
80%
90%
100%
78%
65% 66%61%
25%18%
11% 10% 13%
2%
22%
8%
41%
Frequency of Media Use at Least Once Per Week As far as regular weekly media use is con-
cerned, traditional media was still dominant amongst respondents in communities 10-50K population. The Print Version of the Local
Newspaper was #1 and used at Least Once per Week by 78% of respondents.
Traditional Media
Communities 10K to 50K
Totum Research November/December 2013: How Media Habits Vary by Community Size and Type, N=1,015

Blog about your local
community
Your city or town's website
Local printed
community newspaper
Local community newspaper
website
Local store website
Local radio station
Social media e.g. Facebook, Twitter, Myspace
etc.
Local TV station
Other None of the above
0%
10%
20%
30%
40%
50%
60%
70%
80%
90%
100%
0% 2%
47%
4% 0%
27%
3%
20%
3% 3%
Favourite Source of Local News
The Local Printed Community Newspaper was by far the
Favourite Source for Local News amongst respondents in the
sample of small cities of 10-50K, the preferred source by nearly
half.
Communities 10K to 50K
Totum Research November/December 2013: How Media Habits Vary by Community Size and Type, N=1,015

0%
10%
20%
30%
40%
50%
60%
70%
80%
90%
100%
27%
38%
56%
8%
38%
13%
31%
14%
42%
27%
47%
Sources Used for Information on Local Topics of Interest
City/Town Website
Printed Lo-cal Com-munity Newspaper
Daily Newspaper or its Web-siteRadio
TV
Store Website
Social Media
Other
Never Seek This Info
The Local Printed Community Newspaper was listed as the top source for information on local topics of interest including: Local Businesses, Community Events, Arts and
Culture, Housing and Real Estate and Lo-cal Crime.
Communities 10K to 50K
Totum Research November/December 2013: How Media Habits Vary by Community Size and Type, N=1,015

Fede
ral P
oliti
cs, C
ampa
igns
and
Pro
g...
Prov
incial
Pol
itics
, Cam
paig
ns a
nd P
r...
Loca
l Pol
itics
, Cam
paig
ns a
nd P
rog.
..
Health
Info
rmat
ion
and
Serv
ices
Taxe
s an
d Ta
x Issu
es
Build
ing,
Dev
elop
men
t and
Zon
ing
Social
Ser
vice
s, H
ousing
, Foo
d, C
hild
...
Publ
ic N
otices
Oth
er Fed
eral
Gov
ernm
ent A
ctiv
ities
Oth
er P
rovi
ncia
l Gov
ernm
ent A
ctiv
ities
Oth
er Loc
al G
over
nmen
t Act
iviti
es0%
10%
20%
30%
40%
50%
60%
70%
80%
90%
100%
Sources Used for Information on Government Programs and Services
Gov't Website Printed Local Community Newspaper Daily Newspaper or its Website Radio TV Gov't Office/Rep Social Media
Other Never Seek Info
The Local Printed Community Newspaper was the leading source for information on a number of Gov-
ernment Programs and Services including: Local Poli-tics, Health Information, Public Notices and Other
Local Government Activities in the small cities sample
Communities 10K to 50K
Totum Research November/December 2013: How Media Habits Vary by Community Size and Type, N=1,015
0%
10%
20%
30%
40%
50%
60%
70%
80%
90%
100%
50% 47%
34% 34%
62%
13%
66% 44%
6% 5%
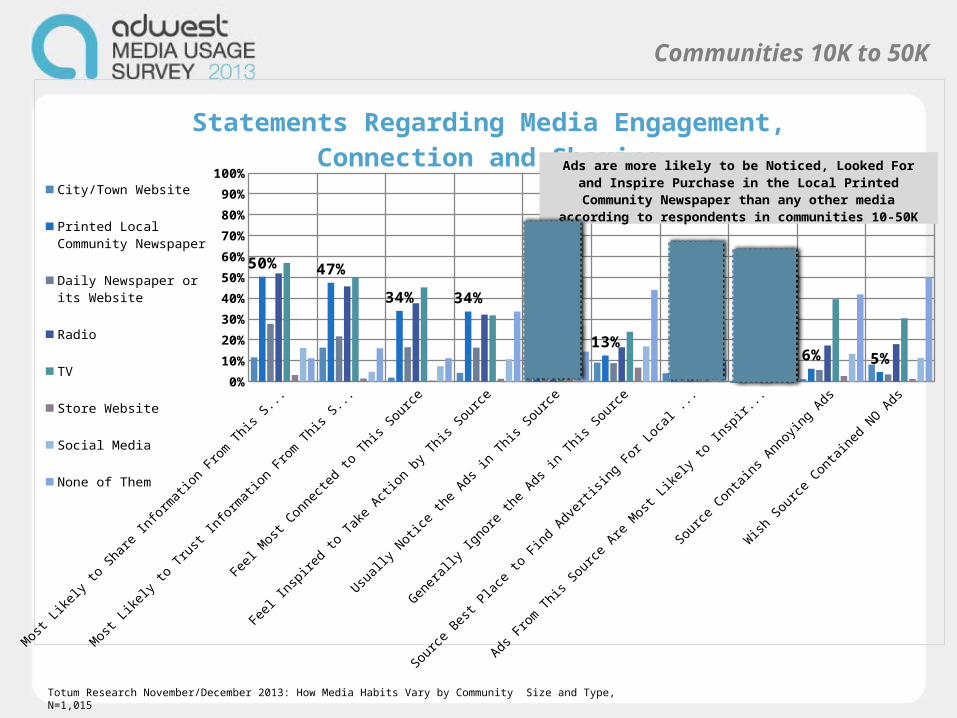
Statements Regarding Media Engagement, Connection and Sharing
City/Town Website
Printed Local Com-munity Newspaper
Daily Newspaper or its Website
Radio
TV
Store Website
Social Media
None of Them
Ads are more likely to be Noticed, Looked For and Inspire Purchase in the Local Printed Community Newspaper than any other media
according to respondents in communities 10-50K
Communities 10K to 50K
Totum Research November/December 2013: How Media Habits Vary by Community Size and Type, N=1,015

ONLINE ACCESSIBILITY, ENGAGEMENT AND USE
Communities 10K to 50K

Dial-u
p te
leph
one
line
DSL-e
nabl
ed p
hone
line
Cable
TV m
odem
Cellu
lar o
r mob
ile con
nect
ion
Fibre
opt
ic co
nnec
tion
e.g.
FIO
S, T
-1 e
tc.
Sate
llite
Don't
know
whi
ch con
nect
ion
we ha
ve
Don't
have
inte
rnet
con
nect
ion
Not st
ated
0%
10%
20%
30%
40%
50%
60%
70%
80%
90%
100%
9%
28%
39%31%
9%16% 9%
10%3%
Internet Connectivity: Internet Connections You Have at Home
The sample in cities of 10-50K indicated a wide variance in types
of connections used at home. Still, nearly 1 in 5 reported either an outdated connection type or no
connection at all.
Communities 10K to 50K
Totum Research November/December 2013: How Media Habits Vary by Community Size and Type, N=1,015
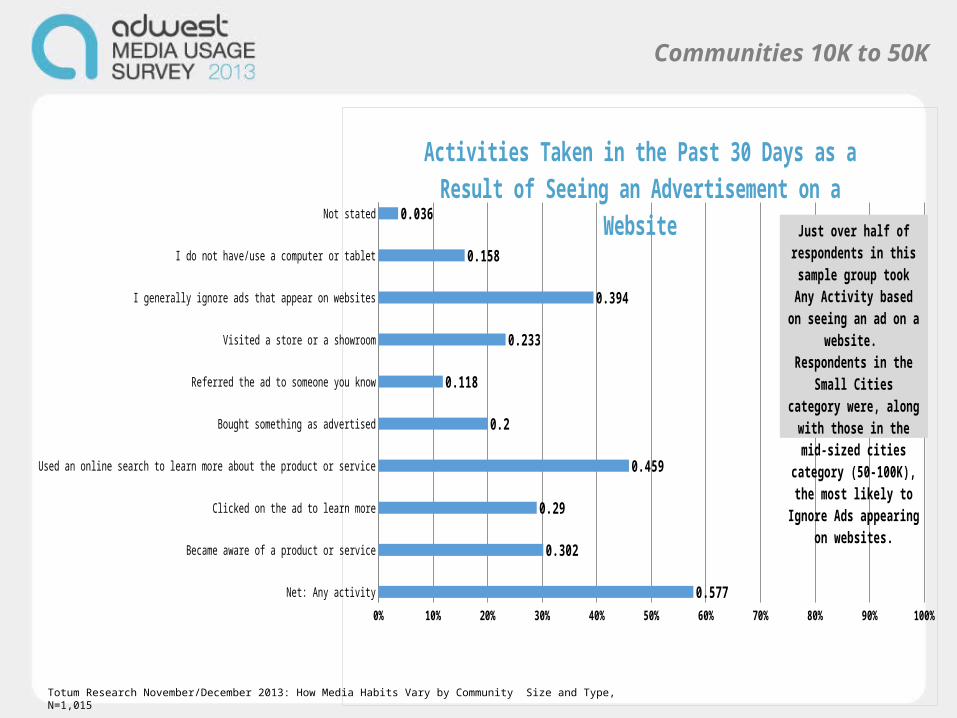
Net: Any activity
Became aware of a product or service
Clicked on the ad to learn more
Used an online search to learn more about the product or service
Bought something as advertised
Referred the ad to someone you know
Visited a store or a showroom
I generally ignore ads that appear on websites
I do not have/use a computer or tablet
Not stated
0% 10% 20% 30% 40% 50% 60% 70% 80% 90% 100%
0.577
0.302
0.29
0.459
0.2
0.118
0.233
0.394
0.158
0.036
Activities Taken in the Past 30 Days as a Re-sult of Seeing an Advertisement on a Website
Just over half of respondents in this sample group took Any Activity based on seeing an ad on a website. Respondents in
the Small Cities category were, along with those in the mid-sized cities category (50-100K), the most likely to Ig-nore Ads appearing on web-
sites.
Communities 10K to 50K
Totum Research November/December 2013: How Media Habits Vary by Community Size and Type, N=1,015

29%
53%
16%2%
Mobile/Tablet Use: Have 'Apps' That Help You Get Information About the Local Community
Yes
No
Do not have a cell phone or tablet computer
Not stated
Interestingly, at 29% respondents from Small Cities were more likely to be using
Apps to get information about their community than any other sample
group measured. 53% of respondents still indicated they don’t use apps and 16% do not own a cell phone or tablet
Communities 10K to 50K
Totum Research November/December 2013: How Media Habits Vary by Community Size and Type, N=1,015

31%
68%
1%
Cellular Phone Use: Use of Device
Use cell phone only to make or receive phone calls
Also use it for other things
Not stated
Of cell phone owners in communities 10-50K, just under a third of respondents
use their device to make or receive phone calls only
Communities 10K to 50K
Totum Research November/December 2013: How Media Habits Vary by Community Size and Type, N=1,015

0%
10%
20%
30%
40%
50%
60%
70%
80%
90%
100%
45%
27%20%
19% 16%
31%
68%
27%
11%
27%
Mobile/Tablet Owners: Purposes for Which You Ever Use Your Device
As was the case across all community sizes the #1 other use for a mobile device was to check
local weather reports
Less than half said they used the device
to get information about the community
Communities 10K to 50K
Totum Research November/December 2013: How Media Habits Vary by Community Size and Type, N=1,015

COMMUNITY NEWSPAPER ENGAGEMENT
Communities 10K to 50K

Yes,
rece
ive
it fre
e
Yes,
subs
crib
e to
it
Tota
l Rec
eive
rs
No, d
on't
get p
rinte
d lo
cal c
omm
unity
new
spap
er
Not st
ated
0%
10%
20%
30%
40%
50%
60%
70%
80%
90%
100%
56.2
29.1
85.3
16.1
2.1
Community Newspaper Penetration
At 85%, the 10-50K sample reported the highest community newspaper receivership of the 5 community sizes measured in the
study
Communities 10K to 50K
Totum Research November/December 2013: How Media Habits Vary by Community Size and Type, N=1,015

More time About the same amount of time Less time0%
10%
20%
30%
40%
50%
60%
70%
80%
90%
100%
12%
75%
13%
Time Personally Spent With Your Local Printed Community Newspaper Compared to 2 Years
Ago87% of respondents said they spend the same or
more time with their local printed newspaper than
they did 2 years ago
Communities 10K to 50K
Totum Research November/December 2013: How Media Habits Vary by Community Size and Type, N=1,015

29%
33%
18%
8%
5%
6%
Level of Agreement: My Local Newspaper is a Source of Pride for the Community
Agree strongly
Agree somewhat
Neutral
Disagree somewhat
Disagree strongly
Do not receive a local printed community newspaper
Nearly two-thirds of respondents agree either strongly or somewhat that the Local News-
paper is a Source of Pride for the community
Communities 10K to 50K
Totum Research November/December 2013: How Media Habits Vary by Community Size and Type, N=1,015

40%
33%
9%
7%
4%
7%
Level of Agreement: I Get Most of the Informa-tion About Activities in my Community From the
Local Newspaper
Agree strongly
Agree somewhat
Neutral
Disagree somewhat
Disagree strongly
Do not receive a local printed community newspaper
Almost three-quarters of respondents agree either strongly or somewhat that they Get Most of the
Information About Activities in Their Community from the Local Newspaper
Communities 10K to 50K

63%16%
11%
2%
3% 6%
Level of Agreement: I Would Much Rather my Local Newspaper Remain in Printed Form as Opposed to On-
line Only
Agree strongly
Agree somewhat
Neutral
Disagree somewhat
Disagree strongly
Do not receive a local printed community newspaper
Close to 90% of respondents in the Small Cities category indicated that they would prefer that the
Local Newspaper remain in printed form
Communities 10K to 50K
Totum Research November/December 2013: How Media Habits Vary by Community Size and Type, N=1,015

26%
30%
21%
8%
8%7%
Level of Agreement: If I Miss an Issue of the Local Newspaper I Feel I am Missing Informa-
tion That is Important to Me
Agree strongly
Agree somewhat
Neutral
Disagree somewhat
Disagree strongly
Do not receive a local printed community newspaper
Well over 50% of respondents feel like they are missing out on important news if they miss an
issue of the Local Newspaper
Communities 10K to 50K
Totum Research November/December 2013: How Media Habits Vary by Community Size and Type, N=1,015
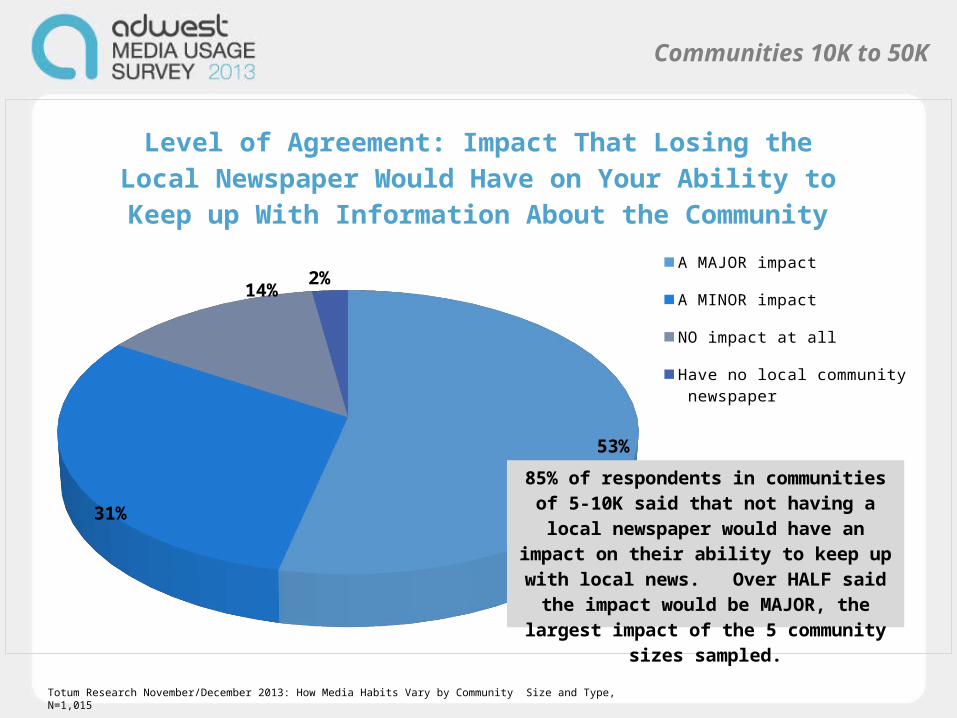
53%
31%
14%2%
Level of Agreement: Impact That Losing the Lo-cal Newspaper Would Have on Your Ability to
Keep up With Information About the Community
A MAJOR impact
A MINOR impact
NO impact at all
Have no local community newspaper
85% of respondents in communities of 5-10K said that not having a local newspaper would
have an impact on their ability to keep up with local news. Over HALF said the impact would be MAJOR, the largest impact of the 5
community sizes sampled.
Communities 10K to 50K
Totum Research November/December 2013: How Media Habits Vary by Community Size and Type, N=1,015