aerodynamic analysis of the liebeck l2573 high-lift airfoil
TRANSCRIPT
Analysis of the Liebeck L2573 High-Lift Airfoil, with a Focus on the Impact of Separation of Flow on the Lift Characteristics
Todd G. RamseyArizona State University, Tempe, Arizona, 85287, 12/5/13 MAE 360 Honors Section
The objective of this assignment was to determine the coefficients of lift and drag, as well as the coefficients of moment about the aerodynamic center, for the L2573 airfoil for the purpose of comparing to the original results as published by Liebeck and Blackwelder on the same airfoil. The study began with a brief literature review, including the original data from Liebeck and Blackwelder. The L2573 airfoil was then loaded into TACAA1, and flow results generated at a design Reynolds number of 250000 and an arbitrarily-chosen mach number of 0.1, from angles of attack of -2 to 14 degrees. The flow results were then transferred into Fieldview2, where pressure and friction-coefficient data was generated and the boundary layer visualized. The coefficient data was then imported into MATLAB3, and values for the coefficients of lift, drag and moment about the aerodynamic center were evaluated. Comparing these calculated values to those presented by Liebeck and Blackwell revealed relationships between the design angle of attack, the zero-coefficient of moment about the aerodynamic center, and the separation bubble-formation. The separation of flow occurred roughly at 14 degrees, though stall was not yet reached according to the lift curve generated by TACAA1. The pressure, lift, and drag-coefficients matched very closely to the theoretical values calculated by Liebeck and Blackwell. The L2573 did meet the design lift-coefficient of 0.68 near the design angle of attack, at 5 degrees.
Nomenclature
α = angle of attackCd = coefficient of dragCf = coefficient of frictionCl = coefficient of liftCmAC = coefficient of moment about the aerodynamic centerCmle = coefficient of moment about the leading edgeμ = viscosity coefficientP = ambient pressureρ = density (air)q = dynamic pressureRe = Reynolds numberv∞ = freestream velocityω = vorticity
I. Introduction
he purpose of this experiment is to establish a better understanding of high-lift airfoils, separation of flow and the shear/viscous contributions to the lift and drag of an airfoil. According to the theory explored by Liebeck and Blackwelder, “the boundary layer transition occurs upstream of the separation point precluding the formation of a
laminar separation bubble, and the flow remains attached. Studies have also shown that increases in the size of the separation region correlate with increases in drag for a particular angle of attack” (Liebeck/Blackwell 1-2) 4. Liebeck and
T1
Arizona State University
Blackwell's work was centered on designing an airfoil, the L2573 airfoil, that attempted to reduce the size of the separation bubble for a design angle of attack (Near 5.16 degrees, with a lift coefficient of about 0.68) and low Reynolds number in order to reduce the drag. Applying the no-slip condition, the air at the surface of the airfoil will have no velocity relative to the airfoil. This stationary layer of air slows down the fluid moving in the region, and produces shear stress that acts on the airfoil. When there is an adverse pressure gradient, that acts against the velocity of the fluid, there is a loss of momentum in the boundary layer, which may result in the separation of the boundary layer from the airfoil surface. The Stratford criterion predicts this point of separation, and enables the design of an airfoil that slows the fluid down in a way that barely avoids separation. Liebeck used this criterion to solve for an “optimum” coefficient of pressure distribution for an airfoil generating a given amount of lift. That is, designing an airfoil with an upper-surface pressure-coefficient with a nearly-flat “Cp-min”, or a minimum pressure along much of the upper surface.
II. Results and Discussion
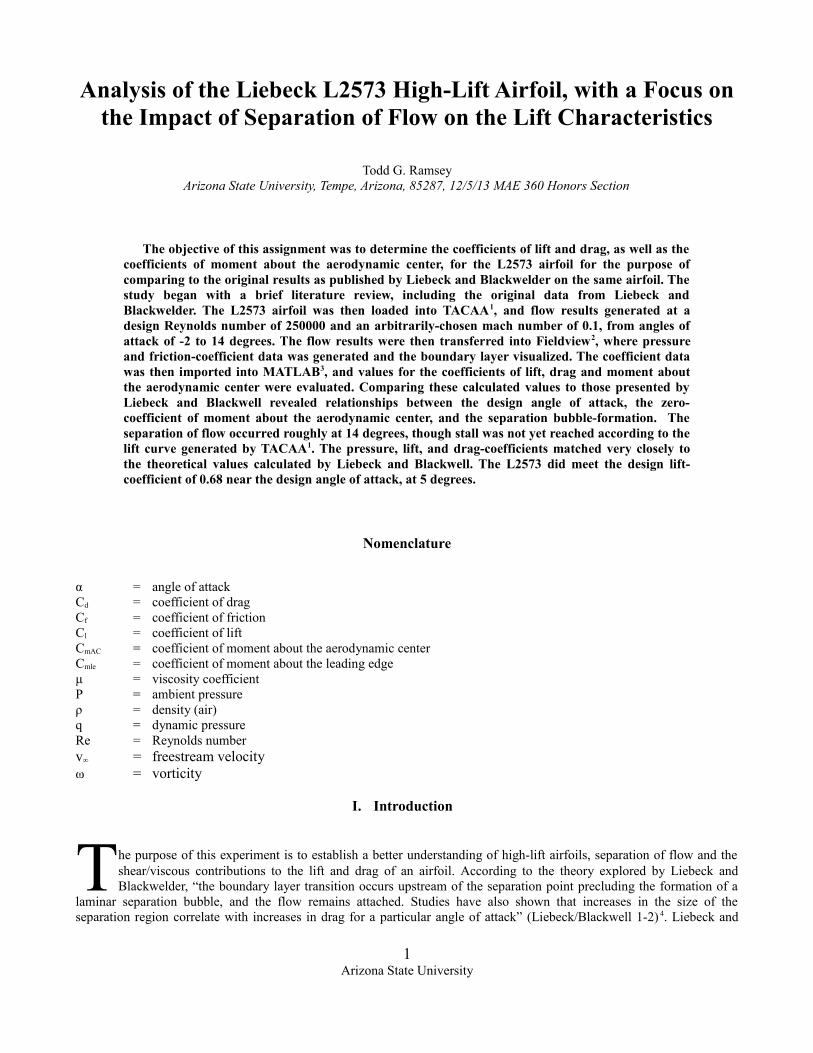
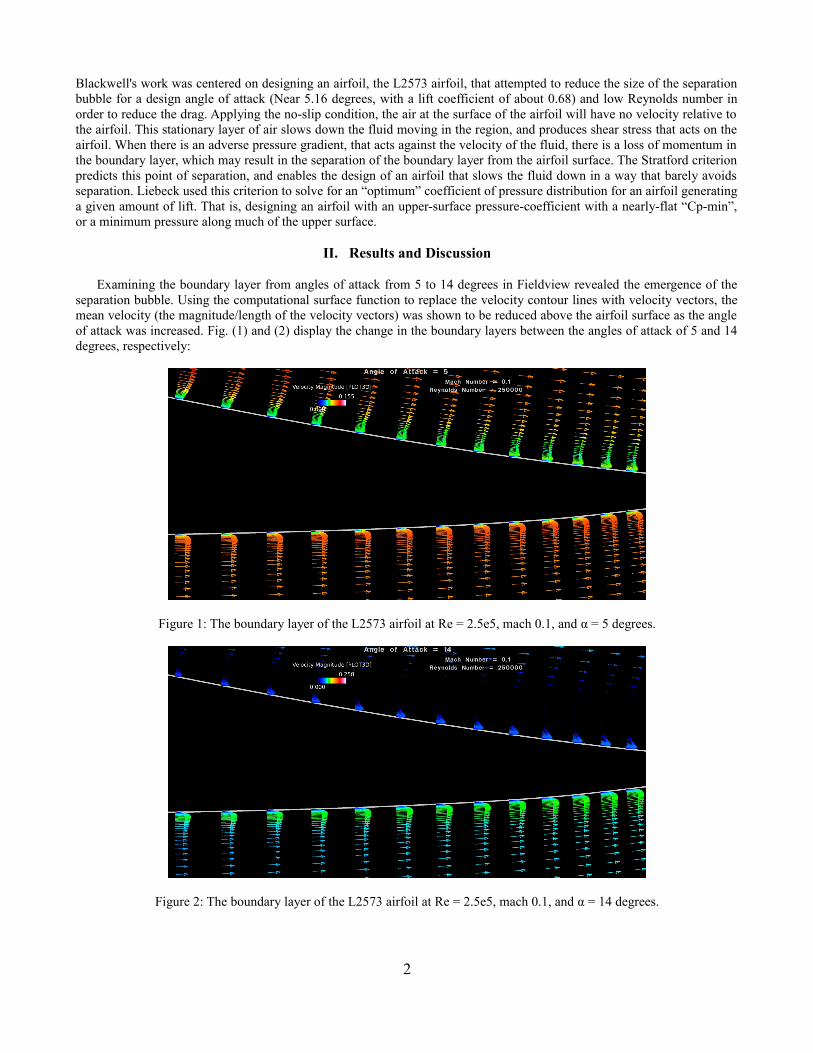
Examining the boundary layer from angles of attack from 5 to 14 degrees in Fieldview revealed the emergence of the separation bubble. Using the computational surface function to replace the velocity contour lines with velocity vectors, the mean velocity (the magnitude/length of the velocity vectors) was shown to be reduced above the airfoil surface as the angle of attack was increased. Fig. (1) and (2) display the change in the boundary layers between the angles of attack of 5 and 14 degrees, respectively:
Figure 1: The boundary layer of the L2573 airfoil at Re = 2.5e5, mach 0.1, and α = 5 degrees.
Figure 2: The boundary layer of the L2573 airfoil at Re = 2.5e5, mach 0.1, and α = 14 degrees.
2
In addition to the growth of the boundary layer to the point of separation, the viscosity/no-slip condition can be seen at both angles of attack near the airfoils surface, where the length of the velocity vectors are reduced considerably to the point of nonexistence. It should be noted that the vectors were set to the same scale in Fieldview2 for both of the above figures. This being said, the momentum loss visualized in fig. (2) is noticeable, with the velocity vectors near the upper surface diminishing rapidly as they move away from the surface, approaching the separation bubble where the velocity reaches zero. This momentum loss is a result of the adverse pressure gradient, and is what causes the separation of the boundary layer from the surface. This separation is occurring beyond the design angle of attack of this particular airfoil, whereas separation is avoided at the design angle of attack, near 5 degrees.
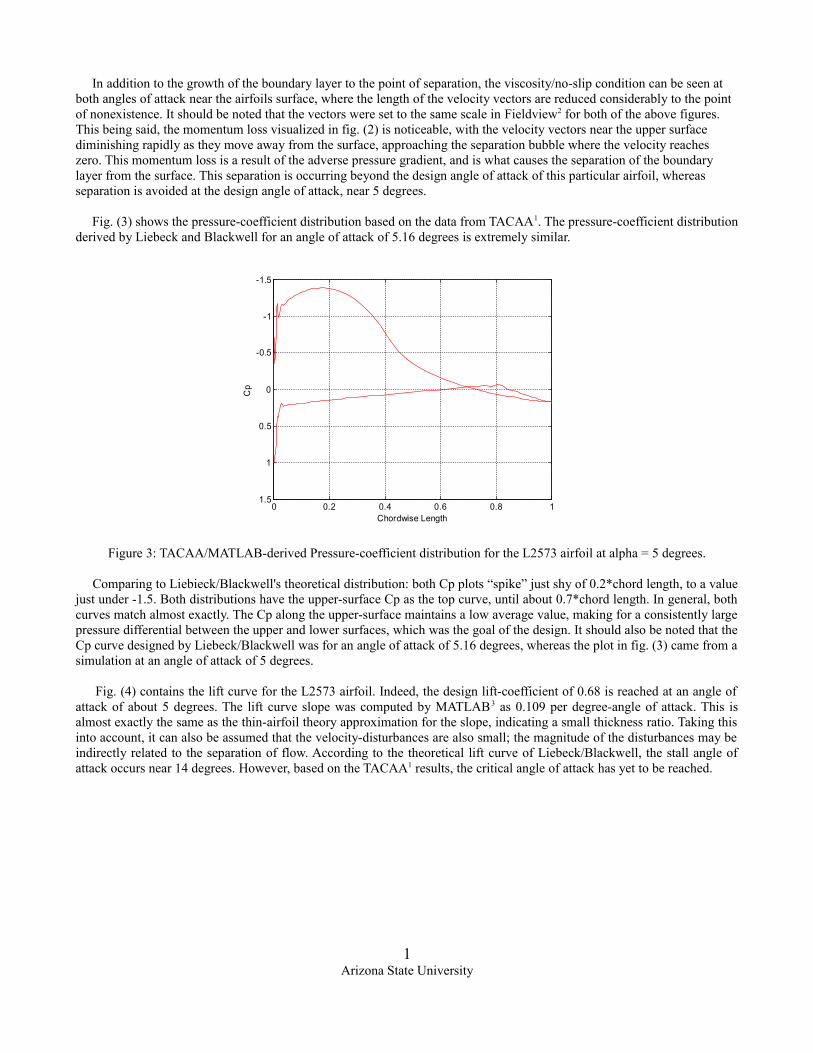
Fig. (3) shows the pressure-coefficient distribution based on the data from TACAA1. The pressure-coefficient distribution derived by Liebeck and Blackwell for an angle of attack of 5.16 degrees is extremely similar.
Figure 3: TACAA/MATLAB-derived Pressure-coefficient distribution for the L2573 airfoil at alpha = 5 degrees.
Comparing to Liebieck/Blackwell's theoretical distribution: both Cp plots “spike” just shy of 0.2*chord length, to a value just under -1.5. Both distributions have the upper-surface Cp as the top curve, until about 0.7*chord length. In general, both curves match almost exactly. The Cp along the upper-surface maintains a low average value, making for a consistently large pressure differential between the upper and lower surfaces, which was the goal of the design. It should also be noted that the Cp curve designed by Liebeck/Blackwell was for an angle of attack of 5.16 degrees, whereas the plot in fig. (3) came from a simulation at an angle of attack of 5 degrees.
Fig. (4) contains the lift curve for the L2573 airfoil. Indeed, the design lift-coefficient of 0.68 is reached at an angle of attack of about 5 degrees. The lift curve slope was computed by MATLAB3 as 0.109 per degree-angle of attack. This is almost exactly the same as the thin-airfoil theory approximation for the slope, indicating a small thickness ratio. Taking this into account, it can also be assumed that the velocity-disturbances are also small; the magnitude of the disturbances may be indirectly related to the separation of flow. According to the theoretical lift curve of Liebeck/Blackwell, the stall angle of attack occurs near 14 degrees. However, based on the TACAA1 results, the critical angle of attack has yet to be reached.
1Arizona State University
0 0.2 0.4 0.6 0.8 1
-1.5
-1
-0.5
0
0.5
1
1.5
Chordwise Length
Cp
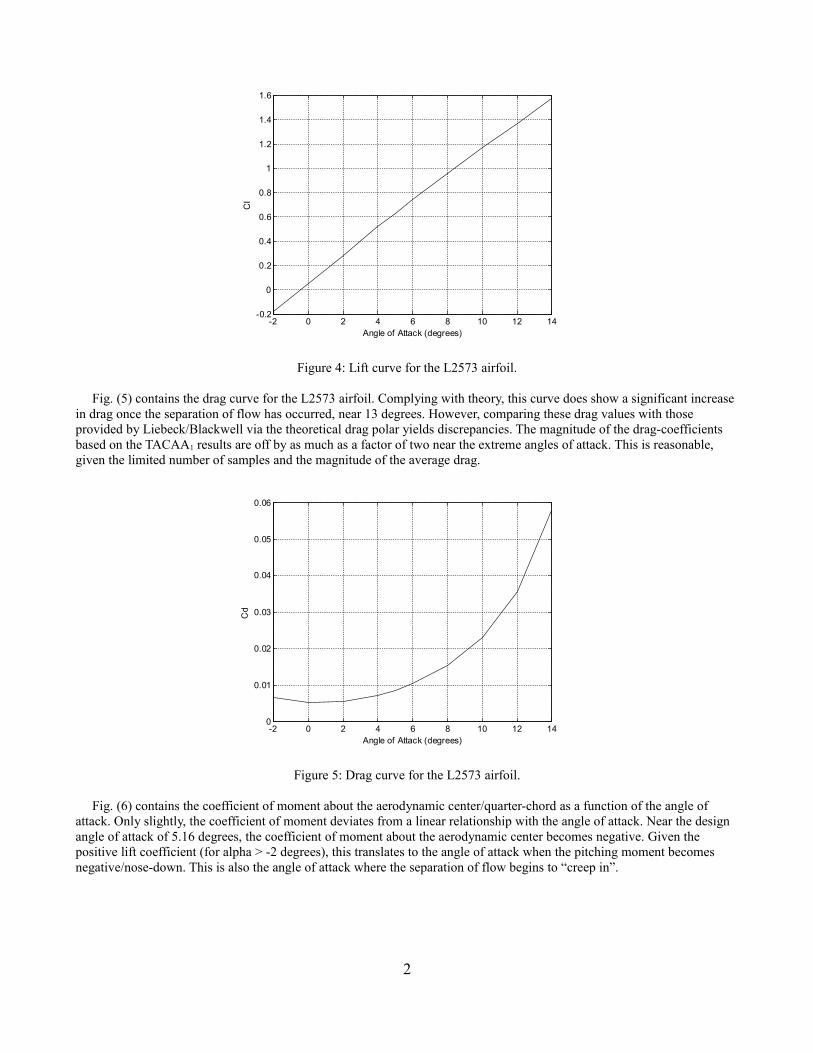
Figure 4: Lift curve for the L2573 airfoil.
Fig. (5) contains the drag curve for the L2573 airfoil. Complying with theory, this curve does show a significant increase in drag once the separation of flow has occurred, near 13 degrees. However, comparing these drag values with those provided by Liebeck/Blackwell via the theoretical drag polar yields discrepancies. The magnitude of the drag-coefficients based on the TACAA1 results are off by as much as a factor of two near the extreme angles of attack. This is reasonable, given the limited number of samples and the magnitude of the average drag.
Figure 5: Drag curve for the L2573 airfoil.
Fig. (6) contains the coefficient of moment about the aerodynamic center/quarter-chord as a function of the angle of attack. Only slightly, the coefficient of moment deviates from a linear relationship with the angle of attack. Near the design angle of attack of 5.16 degrees, the coefficient of moment about the aerodynamic center becomes negative. Given the positive lift coefficient (for alpha > -2 degrees), this translates to the angle of attack when the pitching moment becomes negative/nose-down. This is also the angle of attack where the separation of flow begins to “creep in”.
2
-2 0 2 4 6 8 10 12 14-0.2
0
0.2
0.4
0.6
0.8
1
1.2
1.4
1.6
Angle of Attack (degrees)
Cl
-2 0 2 4 6 8 10 12 140
0.01
0.02
0.03
0.04
0.05
0.06
Angle of Attack (degrees)
Cd
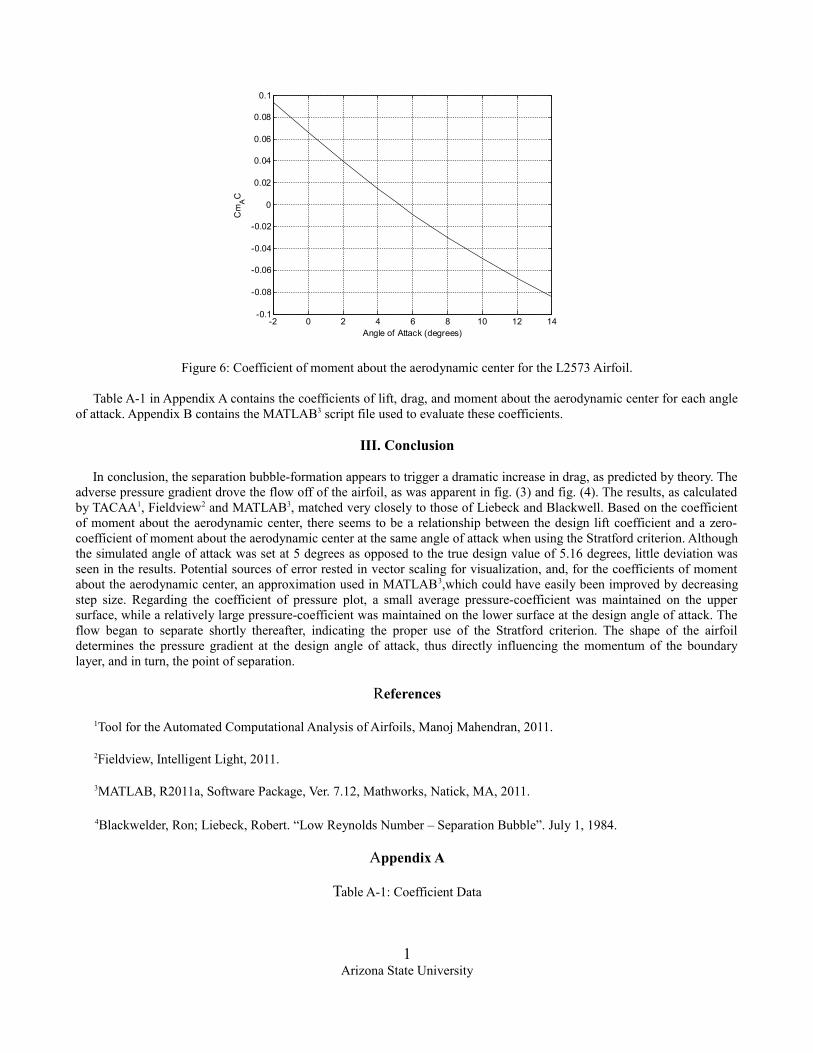
Figure 6: Coefficient of moment about the aerodynamic center for the L2573 Airfoil.
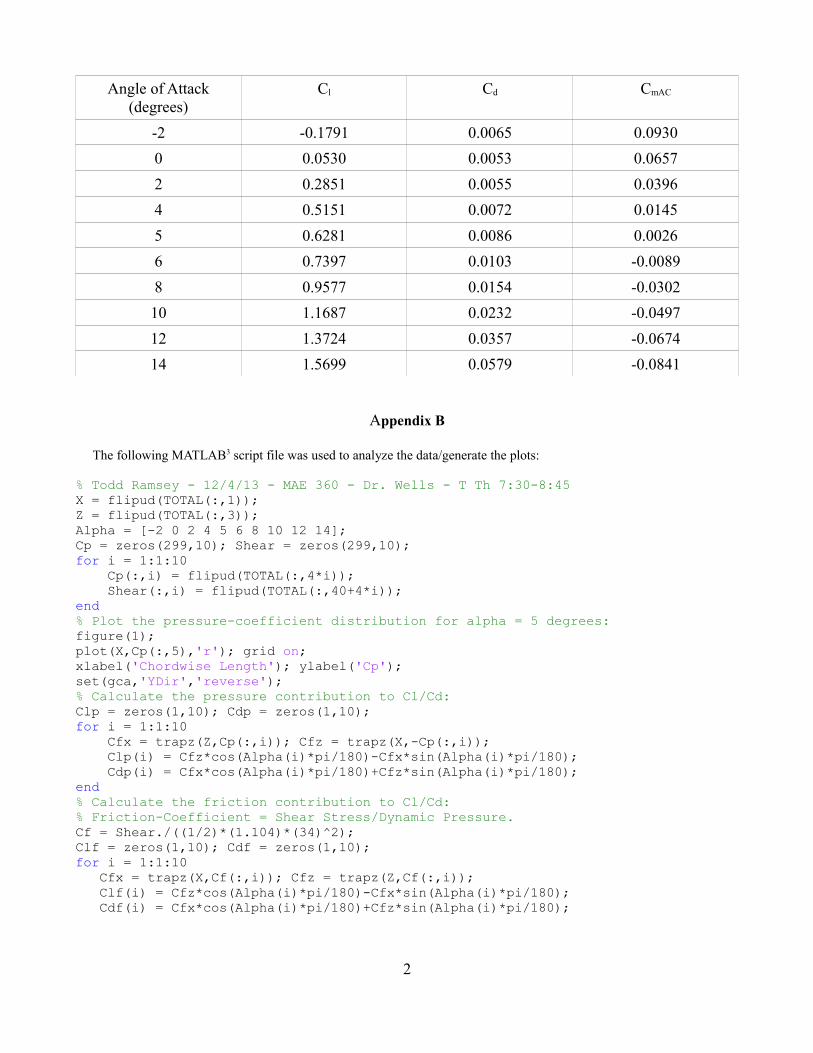
Table A-1 in Appendix A contains the coefficients of lift, drag, and moment about the aerodynamic center for each angle of attack. Appendix B contains the MATLAB3 script file used to evaluate these coefficients.
III. Conclusion
In conclusion, the separation bubble-formation appears to trigger a dramatic increase in drag, as predicted by theory. The adverse pressure gradient drove the flow off of the airfoil, as was apparent in fig. (3) and fig. (4). The results, as calculated by TACAA1, Fieldview2 and MATLAB3, matched very closely to those of Liebeck and Blackwell. Based on the coefficient of moment about the aerodynamic center, there seems to be a relationship between the design lift coefficient and a zero-coefficient of moment about the aerodynamic center at the same angle of attack when using the Stratford criterion. Although the simulated angle of attack was set at 5 degrees as opposed to the true design value of 5.16 degrees, little deviation was seen in the results. Potential sources of error rested in vector scaling for visualization, and, for the coefficients of moment about the aerodynamic center, an approximation used in MATLAB3,which could have easily been improved by decreasing step size. Regarding the coefficient of pressure plot, a small average pressure-coefficient was maintained on the upper surface, while a relatively large pressure-coefficient was maintained on the lower surface at the design angle of attack. The flow began to separate shortly thereafter, indicating the proper use of the Stratford criterion. The shape of the airfoil determines the pressure gradient at the design angle of attack, thus directly influencing the momentum of the boundary layer, and in turn, the point of separation.
References
1Tool for the Automated Computational Analysis of Airfoils, Manoj Mahendran, 2011.
2Fieldview, Intelligent Light, 2011.
3MATLAB, R2011a, Software Package, Ver. 7.12, Mathworks, Natick, MA, 2011.
4Blackwelder, Ron; Liebeck, Robert. “Low Reynolds Number – Separation Bubble”. July 1, 1984.
Appendix A
Table A-1: Coefficient Data
1Arizona State University
-2 0 2 4 6 8 10 12 14-0.1
-0.08
-0.06
-0.04
-0.02
0
0.02
0.04
0.06
0.08
0.1
Angle of Attack (degrees)
Cm
AC
Angle of Attack (degrees)
Cl Cd CmAC
-2 -0.1791 0.0065 0.0930
0 0.0530 0.0053 0.0657
2 0.2851 0.0055 0.0396
4 0.5151 0.0072 0.0145
5 0.6281 0.0086 0.0026
6 0.7397 0.0103 -0.0089
8 0.9577 0.0154 -0.0302
10 1.1687 0.0232 -0.0497
12 1.3724 0.0357 -0.0674
14 1.5699 0.0579 -0.0841
Appendix B
The following MATLAB3 script file was used to analyze the data/generate the plots:
% Todd Ramsey - 12/4/13 - MAE 360 - Dr. Wells - T Th 7:30-8:45X = flipud(TOTAL(:,1));Z = flipud(TOTAL(:,3));Alpha = [-2 0 2 4 5 6 8 10 12 14];Cp = zeros(299,10); Shear = zeros(299,10);for i = 1:1:10 Cp(:,i) = flipud(TOTAL(:,4*i)); Shear(:,i) = flipud(TOTAL(:,40+4*i));end% Plot the pressure-coefficient distribution for alpha = 5 degrees:figure(1);plot(X,Cp(:,5),'r'); grid on;xlabel('Chordwise Length'); ylabel('Cp');set(gca,'YDir','reverse');% Calculate the pressure contribution to Cl/Cd:Clp = zeros(1,10); Cdp = zeros(1,10);for i = 1:1:10 Cfx = trapz(Z,Cp(:,i)); Cfz = trapz(X,-Cp(:,i)); Clp(i) = Cfz*cos(Alpha(i)*pi/180)-Cfx*sin(Alpha(i)*pi/180); Cdp(i) = Cfx*cos(Alpha(i)*pi/180)+Cfz*sin(Alpha(i)*pi/180);end% Calculate the friction contribution to Cl/Cd:% Friction-Coefficient = Shear Stress/Dynamic Pressure.Cf = Shear./((1/2)*(1.104)*(34)^2);Clf = zeros(1,10); Cdf = zeros(1,10);for i = 1:1:10 Cfx = trapz(X,Cf(:,i)); Cfz = trapz(Z,Cf(:,i)); Clf(i) = Cfz*cos(Alpha(i)*pi/180)-Cfx*sin(Alpha(i)*pi/180); Cdf(i) = Cfx*cos(Alpha(i)*pi/180)+Cfz*sin(Alpha(i)*pi/180);
2
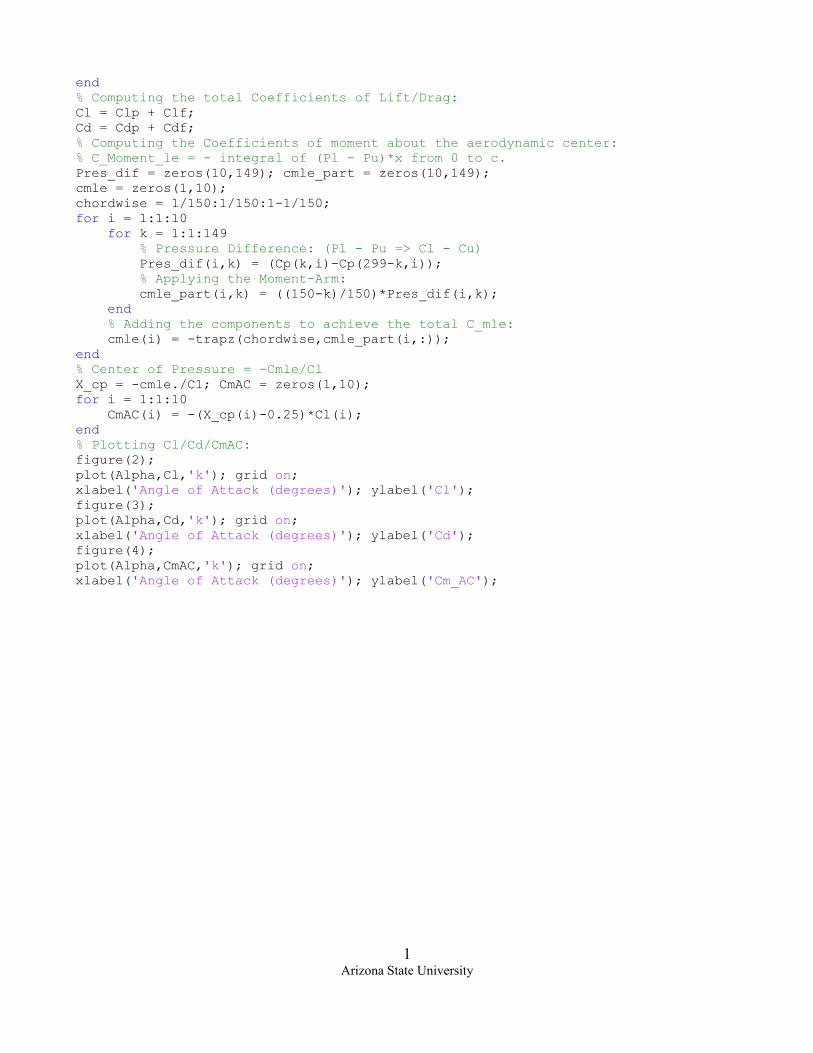
end% Computing the total Coefficients of Lift/Drag:Cl = Clp + Clf;Cd = Cdp + Cdf;% Computing the Coefficients of moment about the aerodynamic center:% C_Moment_le = - integral of (Pl - Pu)*x from 0 to c.Pres_dif = zeros(10,149); cmle_part = zeros(10,149);cmle = zeros(1,10);chordwise = 1/150:1/150:1-1/150;for i = 1:1:10 for k = 1:1:149 % Pressure Difference: (Pl - Pu => Cl - Cu) Pres_dif(i,k) = (Cp(k,i)-Cp(299-k,i)); % Applying the Moment-Arm: cmle_part(i,k) = ((150-k)/150)*Pres_dif(i,k); end % Adding the components to achieve the total C_mle: cmle(i) = -trapz(chordwise,cmle_part(i,:));end% Center of Pressure = -Cmle/ClX_cp = -cmle./Cl; CmAC = zeros(1,10);for i = 1:1:10 CmAC(i) = -(X_cp(i)-0.25)*Cl(i);end% Plotting Cl/Cd/CmAC:figure(2);plot(Alpha,Cl,'k'); grid on;xlabel('Angle of Attack (degrees)'); ylabel('Cl');figure(3);plot(Alpha,Cd,'k'); grid on;xlabel('Angle of Attack (degrees)'); ylabel('Cd');figure(4);plot(Alpha,CmAC,'k'); grid on;xlabel('Angle of Attack (degrees)'); ylabel('Cm_AC');
1Arizona State University