aerodynamic study of a two-elements...
TRANSCRIPT
5th High Performance Yacht Design Conference Auckland, 10-12 March, 2015
AERODYNAMIC STUDY OF A TWO-ELEMENTS WINGSAIL FOR HIGH PERFORMANCE MULTIHULL YACHTS
Vincent Chapin1, [email protected] Nicolas Gourdain2, Nicolas Verdin3, Alessandro Fiumara4, Julien Senter5
Abstract. this paper is devoted to the numerical study of a 1:20th model-scale wingsail typical of America’s Cup yachts like AC72, AC62, AC45 or any C class catamaran to gain insight in its complex aerodynamic behavior and to prepare a wind-tunnel campain. This rigging has still not been much studied and needs more knowledge. This study is based on CFD simulations of the flow around the wingsail by resolving Navier-Stokes equations. Two modeling issues are investigated: the Unsteady Reynolds Average Navier-Stokes (URANS) and the Large Eddy Simulation (LES). These numerical approaches are used to characterize the wingsail aerodynamic behavior and variations with some key design and trim parameters (camber, slot width, angle of attack, flap thickness). Unsteady modeling are used to characterize the stall behavior and improve our understanding of the flow physics that may occur in such configurations. The analysis of the results shows transition phenomena due to a laminar separation bubble and strong interaction of boundary layers of main and flap in the slot region. LES results give flow physics understanding and qualitative elements of validation of the URANS simulations. Both URANS and LES results emphasized the central role of the slot geometry and its associated leakage flow in the onset of stall. Some key parameters of the wingsail are identified. The stall behavior for low and high camber (through flap deflection) is characterized showing differences in both configurations. These differences are related to the leakage flow in the slot where a non-linear coupling between flap deflection, slot width and flap thickness takes place. These results illustrate the complex aerodynamic of multi-element wingsail and that a better knowledge of its behavior is necessary to open roads for better design and enhanced performances for future multihull yachts and foilers.
1 Associate Professor, Department of Aerodynamics, Energetics and Propulsion, ISAE, University of Toulouse 2 Professor, Department of Aerodynamics, Energetics and Propulsion, ISAE, University of Toulouse 3 Student, Department of Aerodynamics, Energetics and Propulsion, ISAE, University of Toulouse 4 PhD student, Assystem and ISAE/DAEP 5 Engineer, Assystem
NOMENCLATURE Angle of attack of the main (element 1) c total chord of the wingsail c1 chord of the main (element 1) c2 chord of the flap (element 2) Cd Drag coefficient Cl Lift coefficient Cp Pressure coefficient Cf Skin friction coefficient Flap deflection angle, boundary layer thickness e1 thickness of the main (element 1) e2 thickness of the flap (element 2) gB near boundary layer growth rate gD default growth rate g non-dimensional slot width (g/c1) γ Turbulence intermittency h Mast height LLSB Length of the laminar separation bubble Reθ Momentum thickness Reynolds number Sv Reference area XLSB Location of the laminar separation bubble xr Flap rotation axis position
1. INTRODUCTION
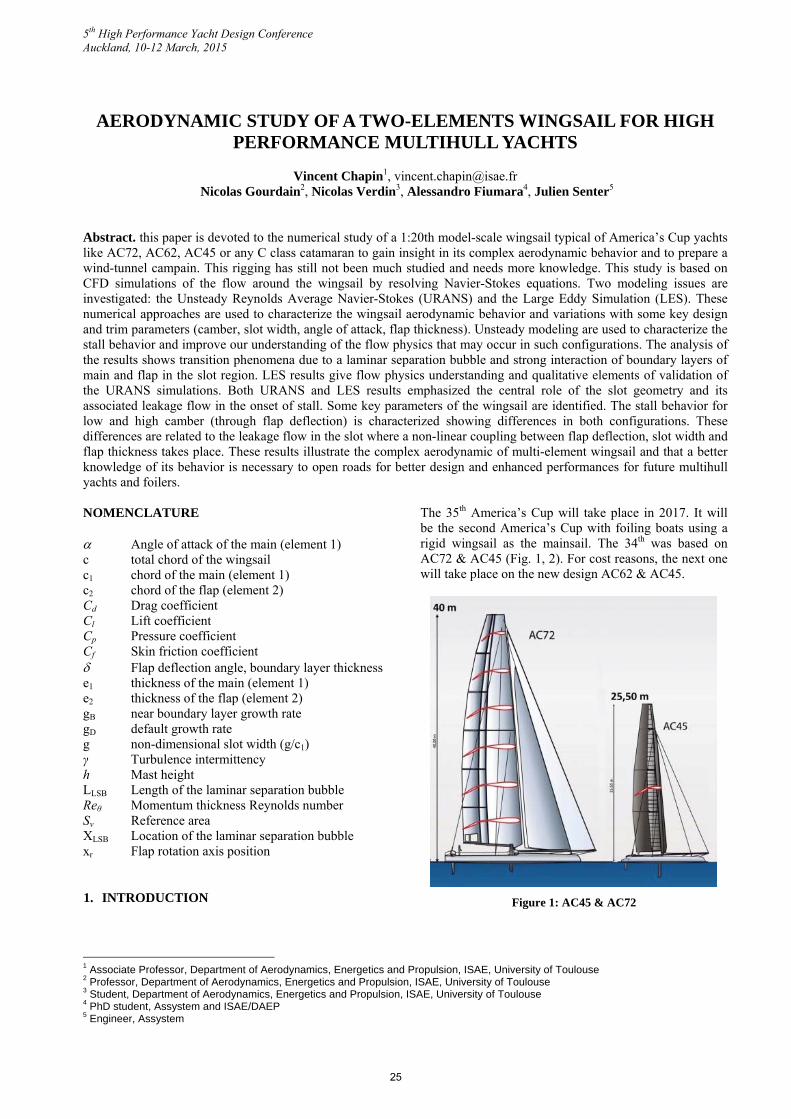
The 35th America’s Cup will take place in 2017. It will be the second America’s Cup with foiling boats using a rigid wingsail as the mainsail. The 34th was based on AC72 & AC45 (Fig. 1, 2). For cost reasons, the next one will take place on the new design AC62 & AC45.
Figure 1: AC45 & AC72
25
The AC62 has the following characteristics: LWL: 19m Mast height: 32m Wingsail: 175m2 Hull weight: 4300kg The rigid wingsail is composed of two or three symmetric wings with a slot between them to control the sail camber on starboard and port tack (Fig. 1, 2). Their aerodynamic performances are largely unkwown. The stability requirements of foiling boats is a far more complex problem than for conventional archimedean boats. The aerodynamic center is not fixed in space. Also the aerodynamic design and the knowledge of wingsails is an interesting and challenging project which will be the aim of this paper. Historically wingsails on yachts are not really new. The open design C Class (a 25ft catamaran with 300 ft2 sail surface) use it since 1993 with Yellow Pages. Some years later, as explained by Steve Clark : “Cogito was the first wing where they could induce twist in the front element, which Steve explains they wanted but didn't know how to do it, until they were shown the way by an inventive International Canoe sailor”. Since last America’s cup in 2014 with AC72, wingsail visibility has increased a lot and gives new developments in many classes of boats like: C class, A class catamaran. Some advantages of rigid wingsail over soft sail are power, lift-to-drag ratio and control. Some inconvenient are weight and ability to reduce sail surface in strong wind. Indeed, this rigging has achieved outstanding performances during the last edition of the America’s Cup but the manoeuvrability of the ship is still a great issue because of the boat speed, stability properties on foilers and rigid sail sudden stall at high angle of attack. Capsizes of the Swedish and an American ships have unfortunately shown it. Aerodynamic properties of multi-element wings for aircraft have been largely studied and documented in the literature. For a review, consider reading the excellent papers from Smith (1975) and van Dam (2002). At the opposite research on wingsail for yachts is not abundant. Blakeley & al. (2012) have done one of the first wind-tunnel tests of a two-dimensional wingsail section with pressure measurements for lift and pressure drag estimation. Recently a new interest on wingsail emerges for concept design of wind driven vessel in the era of low carbon society (Nakashima & al. 2011, Jo & al. 2013). In order to have a better understanding of the aerodynamic properties of such rigid sails and for better control, several numerical studies are presented in this paper with three objectives:
To prepare a wind-tunnel test campain on a 1:20th model-scale wingsail
To better understand the aerodynamics of multi-elements rigid wingsails
To describe the stall behavior of a wingsail with key parameters (angle of attack, camber, slot width, flap thickness)
Figure 2: AC72 foiling
The paper is divided in two parts. The first one describes the geometry of the wingsail, the meshes generated and the numerical methods used (URANS and LES). The second part present results obtained on a quasi-3D configuration at mid-span of the wingsail. The aim is to validate the URANS approach with LES results. Then key parameters are identified on many two-dimensional configurations and a study of the stall phenomenon is done on selected three-dimensional configurations.
2. METHODS
2.1 Wingsail geometry
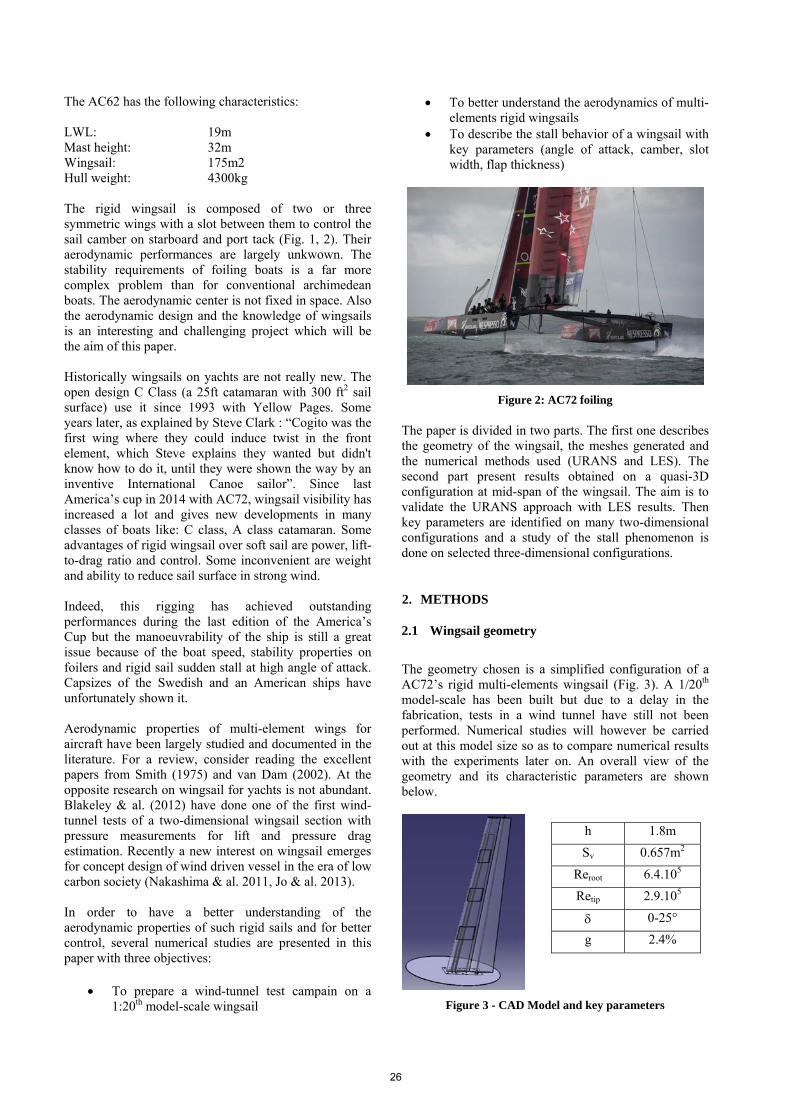
The geometry chosen is a simplified configuration of a AC72’s rigid multi-elements wingsail (Fig. 3). A 1/20th model-scale has been built but due to a delay in the fabrication, tests in a wind tunnel have still not been performed. Numerical studies will however be carried out at this model size so as to compare numerical results with the experiments later on. An overall view of the geometry and its characteristic parameters are shown below.
Figure 3 - CAD Model and key parameters
h 1.8m
Sv 0.657m2
Reroot 6.4.105
Retip 2.9.105
0-25°
g 2.4%
26

An objective of this work is to gain insight on the effect of the geometry and aerodynamic parameters (e1/c, e2/c, , , xr, g/c1, c2/c1) and define a reference wingsail configuration for future numerical and experimental studies. A parameterization of the wingsail is chosen and described on Fig. 4. To simplify the general problem, it has been decided to focus on the camber f/c which is directly related to the flap deflection angle , on the slot width g/c1 and on the flap thickness e2/c.
Figure 4: wingsail geometry and parameterization
Based on preliminary simulations and previous studies (Blakeley 2012), the initial wingsail configuration has a chord ratio c2/c1=1, a main element thickness of 25%, a flap thickness of 12%, a flap rotation axis xr/c1=90% and a slot width g/c1=2.4%. Its name will be r1t2512x90g2.4. Adding to this name the angle of attack of the main element () and of the flap deflection angle (), the complete configuration name of a wingsail will be r1t2512x90g2.4a3d25 for =3° and =25°.
2.2 Computational approach for URANS
Numerical method: The unsteady RANS equations are solved thanks to the StarCCM+ 8.04 CD-Adapco finite-volume solver. This method consider incompressible fluid (inlet Mach number being of about 0.06). Second-order scheme was used for spatial discretization and an implicit first order scheme for temporal stepping. The turbulence model chosen is based on the turbulent eddy-viscosity hypothesis. In URANS simulations, due to the low Reynolds number of the scaled model for a turbulent external aerodynamic flow and the absence of trip mechanisms, transition from laminar to turbulent is taken into account using the Transitional SST model (Malan 2009). This turbulent model is based on the well-known SST k-ω model but solves two additional equations to model the transition: one for the intermittency γ, and the other one for the transition momentum thickness Reynolds number Re. The turbulence intensity at inlet is Tu = 1%. Two kind of URANS simulations have been done on the scaled wingsail:
URANS 2D around the mid-span section of the wingsail with a mean chord Reynolds number Re=4.8 105
URANS 3D around the untwisted wingsail Mesh in open conditions: The computational domain is large enough (20x20x4m) to consider the side effect as negligible (Fig. 5). The mean chord of the scaled wingsail is 0.36m and the span 1.8m. As may be seen in Fig. 6, a trimmer meshing approach was chosen to enable a sufficient refinement near the two wing elements with small cells around them (in comparison, the polyhedral approach needs more cells for the same resolution). Prism layers were added around the elements to ensure the wall y+ to be bounded in [0.1:1] (the mean y+ on all the wingsail cells is 0.5). A particular attention has been done to refine mesh in the slot being a region of interaction between the main element wake, the slot jet and the flap boundary layer. To simplify the modeling issues, the wingsail is untwisted and the atmospheric boundary layer is not taken into account as in the wind-tunnel campaign that will be done later at ISAE S4 wind-tunnel. The boundary conditions used are classical with a velocity inlet on three sides (inlet, leeward, windward) and a static pressure on the outlet. The bottom and top sides are modeled by symmetry condition.
Figure 5: Computational domain with wingsail
Figure 6: Trimmer mesh at z/h = 94.5%
2.3 Computational approach for LES
Numerical method: The Large-Eddy Simulation relies on the resolution of the spatially-filtered compressible Navier-Stokes equations, ensuring the conservation of mass, momentum and total energy of a perfect gas. The
27

code uses a finite volume formulation on unstructured hexahedral meshes. The studied flow is at low-Mach number (no shock), so a purely non-dissipative centered numerical scheme is applied for convective fluxes. The polynomials used to reconstruct the fluxes at each cell face allow to achieve a fourth-order accuracy on uniform Cartesian meshes and second-order elsewhere. The time-marching algorithm is a three-stage, third-order explicit Runge-Kutta algorithm. The time step is set to 2.04 10-7s (one throughflow is described in 90,000 time steps). Subgrid scale stresses are modeled following Vreman (2004), and a fixed turbulent Prandtl number of 0.9 is used to model the subgrid scale heat flux. Mesh in wind tunnel conditions: The wingsail is simulated in a wind-tunnel environement as it will be during the experimental measurement campaign, as shown in Fig. 7. LES has been done at the mid section of the wingsail with a span extension of z/c=10%. This hypothesis seems reasonable knowing that a typical aspect ratio of an AC72 rigid wingsail is AR=6 without taking into account any mirror effect from the sea surface or the trampoline. One of the most critical features for such LES of wall-bounded flows is the presence of transitional boundary layers. A wall-resolved LES remains very expensive even at such moderate Reynolds number (the number of grid points in the viscous sub-layer scales as Re1.8). An intermediate approach is used in this work, which relies on the modelling of the near-wall turbulent structures (Kawai et al., 2012). The grid is designed to match such wall-model LES (WM-LES) requirements. The dimension of the first cell in the direction normal to the wall is set to 200m, which corresponds to y+=20. Then 300 points, respectively 100 points, are used in the streamwise direction, respectively the span-wise direction (x+/y+=6, z+/y+=2) to describe the wingsail. The total number of points for the grid is about 23 millions.
Figure 7: Instantaneous flow field of axial velocity (LES
results). The effect of the wind tunnel facility is visible: the open sections areas reduce the main passage section where
the wingsail is located. Computational cost: Simulations have been done on a Linux-based cluster. 400 cores have been used for LES,
32 cores for 3D URANS and up to 8 cores for 2D URANS simulations. Typical computing times are less than 1 hour for 2D URANS, about 10 hours for 3D URANS and about 50,000 hours for WM-LES (to simulate about 10 throughflow times).
3. RESULTS
Results will be presented in three sections. The first one is devoted to the comparison of LES and URANS simulations for validation purposes and flow physics analysis. The second one is a URANS study of the two-dimensional flow around the mid-span section of wingsail configurations to identify key parameters of the aerodynamics of the two-elements wingsail. The last section resumes the three-dimensional URANS study of the aerodynamic properties and stall behavior of a wingsail with low and high camber through flap deflection.
3.1 LES study in wind-tunnel
The flow that develops around the wingsail is complex, especially in the gap region where the leakage flow influences the flow at the trailing edge of the main element and at the leading edge of the flap. As shown in Fig. 8, the boundary layer of the flap interacts with the wake generated by the main element.
Figure 8: Instantaneous flow field shaded with entropy (LES). Configuration r1t2512a0d25 =0°, =25°, g/c1=2.4%
Due to this complexity, the interest for LES is to help in the validation of URANS predictions and to provide details about the flow physics. The time-averaged pressure coefficients Cp obtained with URANS-SSTtr at mid-span and WM-LES are first compared in Fig. 9. Both simulations agree well on Cp for the flap. However, some discrepancies are observed on the main element, especially on the suction side close to the peak of minimum pressure: Cp,LES=-4.95 and Cp,RANS=-3.5. As already mentioned, transitional boundary layers are observed at such intermediate Reynolds numbers. There are evidences in Fig. 9 of such transition phenomena (small bumps visible both on URANS and LES results). The results show that the transition mechanism is triggered by a laminar separation bubble, on the main element and on the flap. The main features of this laminar separation bubble are shown in Table 1, in terms
28
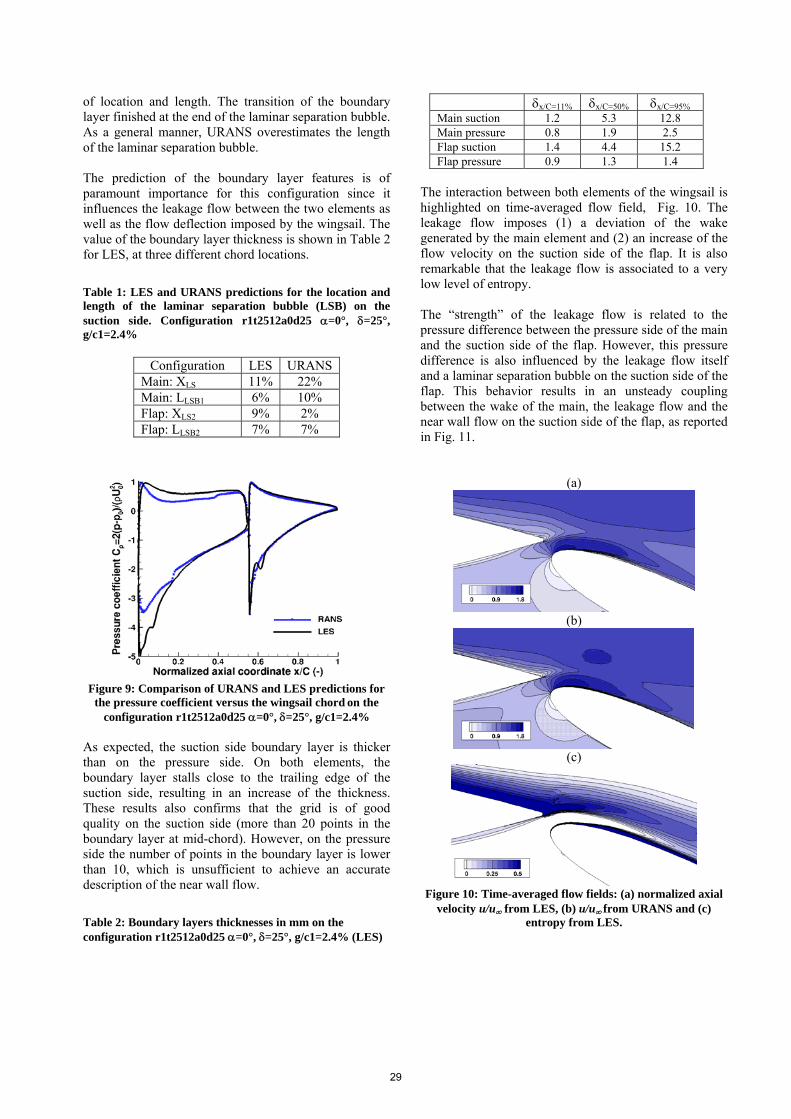
of location and length. The transition of the boundary layer finished at the end of the laminar separation bubble. As a general manner, URANS overestimates the length of the laminar separation bubble. The prediction of the boundary layer features is of paramount importance for this configuration since it influences the leakage flow between the two elements as well as the flow deflection imposed by the wingsail. The value of the boundary layer thickness is shown in Table 2 for LES, at three different chord locations.
Table 1: LES and URANS predictions for the location and length of the laminar separation bubble (LSB) on the suction side. Configuration r1t2512a0d25 =0°, =25°, g/c1=2.4%
Configuration LES URANSMain: XLS 11% 22% Main: LLSB1 6% 10% Flap: XLS2 9% 2% Flap: LLSB2 7% 7%
Figure 9: Comparison of URANS and LES predictions for
the pressure coefficient versus the wingsail chord on the configuration r1t2512a0d25 =0°, =25°, g/c1=2.4%
As expected, the suction side boundary layer is thicker than on the pressure side. On both elements, the boundary layer stalls close to the trailing edge of the suction side, resulting in an increase of the thickness. These results also confirms that the grid is of good quality on the suction side (more than 20 points in the boundary layer at mid-chord). However, on the pressure side the number of points in the boundary layer is lower than 10, which is unsufficient to achieve an accurate description of the near wall flow.
Table 2: Boundary layers thicknesses in mm on the configuration r1t2512a0d25 =0°, =25°, g/c1=2.4% (LES)
x/C=11% x/C=50% x/C=95% Main suction 1.2 5.3 12.8 Main pressure 0.8 1.9 2.5 Flap suction 1.4 4.4 15.2 Flap pressure 0.9 1.3 1.4
The interaction between both elements of the wingsail is highlighted on time-averaged flow field, Fig. 10. The leakage flow imposes (1) a deviation of the wake generated by the main element and (2) an increase of the flow velocity on the suction side of the flap. It is also remarkable that the leakage flow is associated to a very low level of entropy. The “strength” of the leakage flow is related to the pressure difference between the pressure side of the main and the suction side of the flap. However, this pressure difference is also influenced by the leakage flow itself and a laminar separation bubble on the suction side of the flap. This behavior results in an unsteady coupling between the wake of the main, the leakage flow and the near wall flow on the suction side of the flap, as reported in Fig. 11.
(a)
(b)
(c)
Figure 10: Time-averaged flow fields: (a) normalized axial
velocity u/u from LES, (b) u/u from URANS and (c) entropy from LES.
29
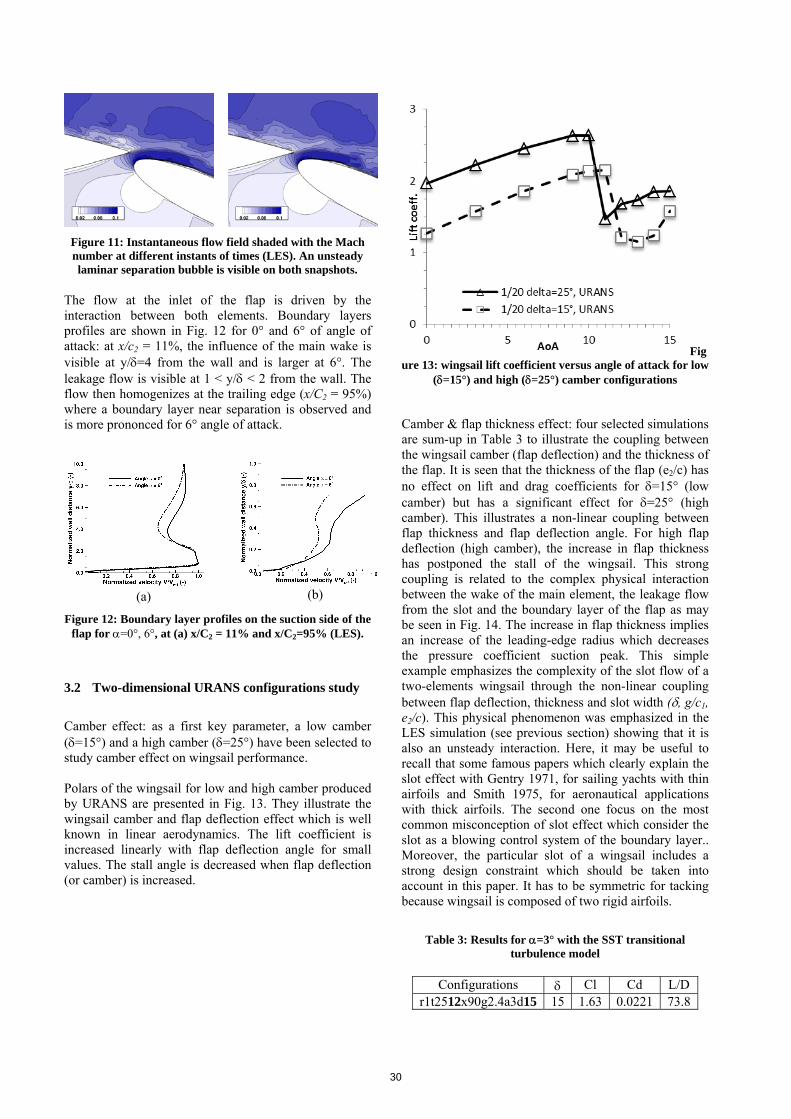
Figure 11: Instantaneous flow field shaded with the Mach number at different instants of times (LES). An unsteady laminar separation bubble is visible on both snapshots.
The flow at the inlet of the flap is driven by the interaction between both elements. Boundary layers profiles are shown in Fig. 12 for 0° and 6° of angle of attack: at x/c2 = 11%, the influence of the main wake is visible at y/=4 from the wall and is larger at 6°. The leakage flow is visible at 1 < y/ < 2 from the wall. The flow then homogenizes at the trailing edge (x/C2 = 95%) where a boundary layer near separation is observed and is more prononced for 6° angle of attack.
(a)
(b)
Figure 12: Boundary layer profiles on the suction side of the flap for =0°, 6°, at (a) x/C2 = 11% and x/C2=95% (LES).
3.2 Two-dimensional URANS configurations study
Camber effect: as a first key parameter, a low camber (=15°) and a high camber (=25°) have been selected to study camber effect on wingsail performance. Polars of the wingsail for low and high camber produced by URANS are presented in Fig. 13. They illustrate the wingsail camber and flap deflection effect which is well known in linear aerodynamics. The lift coefficient is increased linearly with flap deflection angle for small values. The stall angle is decreased when flap deflection (or camber) is increased.
Figure 13: wingsail lift coefficient versus angle of attack for low
(=15°) and high (=25°) camber configurations
Camber & flap thickness effect: four selected simulations are sum-up in Table 3 to illustrate the coupling between the wingsail camber (flap deflection) and the thickness of the flap. It is seen that the thickness of the flap (e2/c) has no effect on lift and drag coefficients for =15° (low camber) but has a significant effect for =25° (high camber). This illustrates a non-linear coupling between flap thickness and flap deflection angle. For high flap deflection (high camber), the increase in flap thickness has postponed the stall of the wingsail. This strong coupling is related to the complex physical interaction between the wake of the main element, the leakage flow from the slot and the boundary layer of the flap as may be seen in Fig. 14. The increase in flap thickness implies an increase of the leading-edge radius which decreases the pressure coefficient suction peak. This simple example emphasizes the complexity of the slot flow of a two-elements wingsail through the non-linear coupling between flap deflection, thickness and slot width (, g/c1, e2/c). This physical phenomenon was emphasized in the LES simulation (see previous section) showing that it is also an unsteady interaction. Here, it may be useful to recall that some famous papers which clearly explain the slot effect with Gentry 1971, for sailing yachts with thin airfoils and Smith 1975, for aeronautical applications with thick airfoils. The second one focus on the most common misconception of slot effect which consider the slot as a blowing control system of the boundary layer.. Moreover, the particular slot of a wingsail includes a strong design constraint which should be taken into account in this paper. It has to be symmetric for tacking because wingsail is composed of two rigid airfoils.
Table 3: Results for =3° with the SST transitional turbulence model
Configurations Cl Cd L/D r1t2512x90g2.4a3d15 15 1.63 0.0221 73.8
30
r1t2512x90g2.4a3d25 25 2.16 0.0439 49.1 r1t2510x90g2.4a3d15 15 1.64 0.0221 74.2 r1t2510x90g2.4a3d25 25 1.47 0.1058 13.9
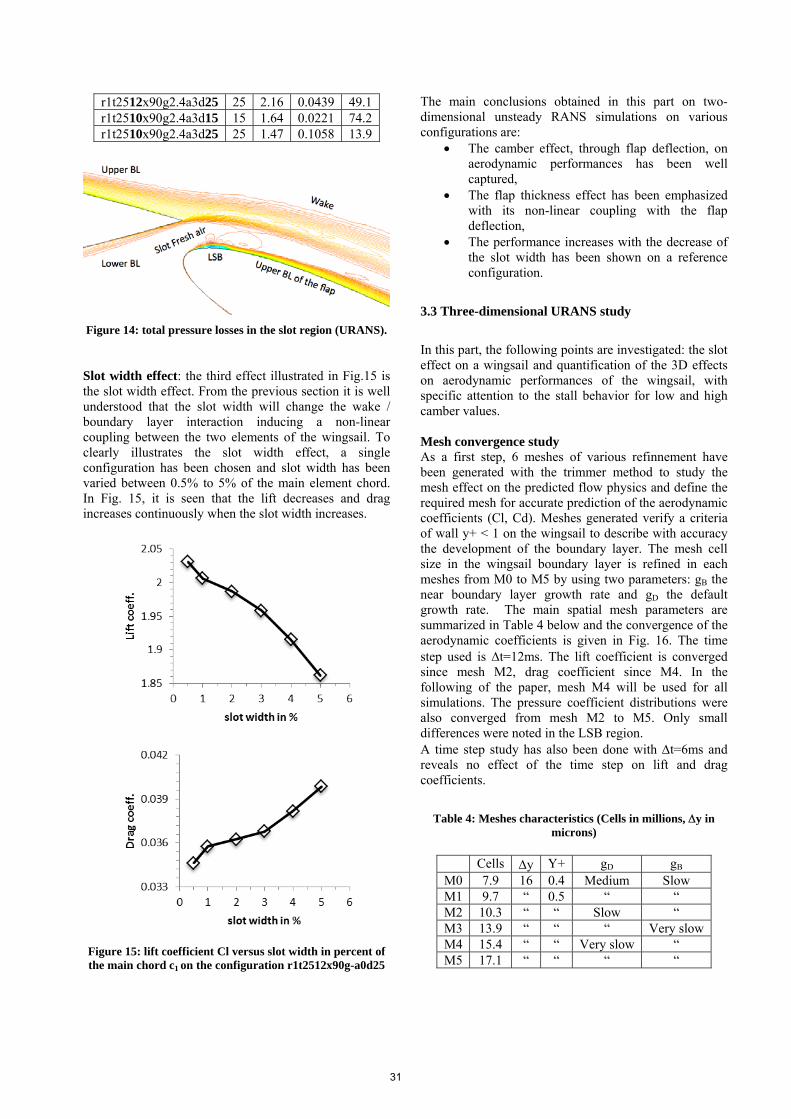
Figure 14: total pressure losses in the slot region (URANS).
Slot width effect: the third effect illustrated in Fig.15 is the slot width effect. From the previous section it is well understood that the slot width will change the wake / boundary layer interaction inducing a non-linear coupling between the two elements of the wingsail. To clearly illustrates the slot width effect, a single configuration has been chosen and slot width has been varied between 0.5% to 5% of the main element chord. In Fig. 15, it is seen that the lift decreases and drag increases continuously when the slot width increases.
Figure 15: lift coefficient Cl versus slot width in percent of the main chord c1 on the configuration r1t2512x90g-a0d25
The main conclusions obtained in this part on two-dimensional unsteady RANS simulations on various configurations are:
The camber effect, through flap deflection, on aerodynamic performances has been well captured,
The flap thickness effect has been emphasized with its non-linear coupling with the flap deflection,
The performance increases with the decrease of the slot width has been shown on a reference configuration.
3.3 Three-dimensional URANS study
In this part, the following points are investigated: the slot effect on a wingsail and quantification of the 3D effects on aerodynamic performances of the wingsail, with specific attention to the stall behavior for low and high camber values. Mesh convergence study As a first step, 6 meshes of various refinnement have been generated with the trimmer method to study the mesh effect on the predicted flow physics and define the required mesh for accurate prediction of the aerodynamic coefficients (Cl, Cd). Meshes generated verify a criteria of wall y+ < 1 on the wingsail to describe with accuracy the development of the boundary layer. The mesh cell size in the wingsail boundary layer is refined in each meshes from M0 to M5 by using two parameters: gB the near boundary layer growth rate and gD the default growth rate. The main spatial mesh parameters are summarized in Table 4 below and the convergence of the aerodynamic coefficients is given in Fig. 16. The time step used is t=12ms. The lift coefficient is converged since mesh M2, drag coefficient since M4. In the following of the paper, mesh M4 will be used for all simulations. The pressure coefficient distributions were also converged from mesh M2 to M5. Only small differences were noted in the LSB region. A time step study has also been done with t=6ms and reveals no effect of the time step on lift and drag coefficients.
Table 4: Meshes characteristics (Cells in millions, y in microns)
Cells y Y+ gD gB M0 7.9 16 0.4 Medium Slow M1 9.7 “ 0.5 “ “ M2 10.3 “ “ Slow “ M3 13.9 “ “ “ Very slow M4 15.4 “ “ Very slow “ M5 17.1 “ “ “ “
31
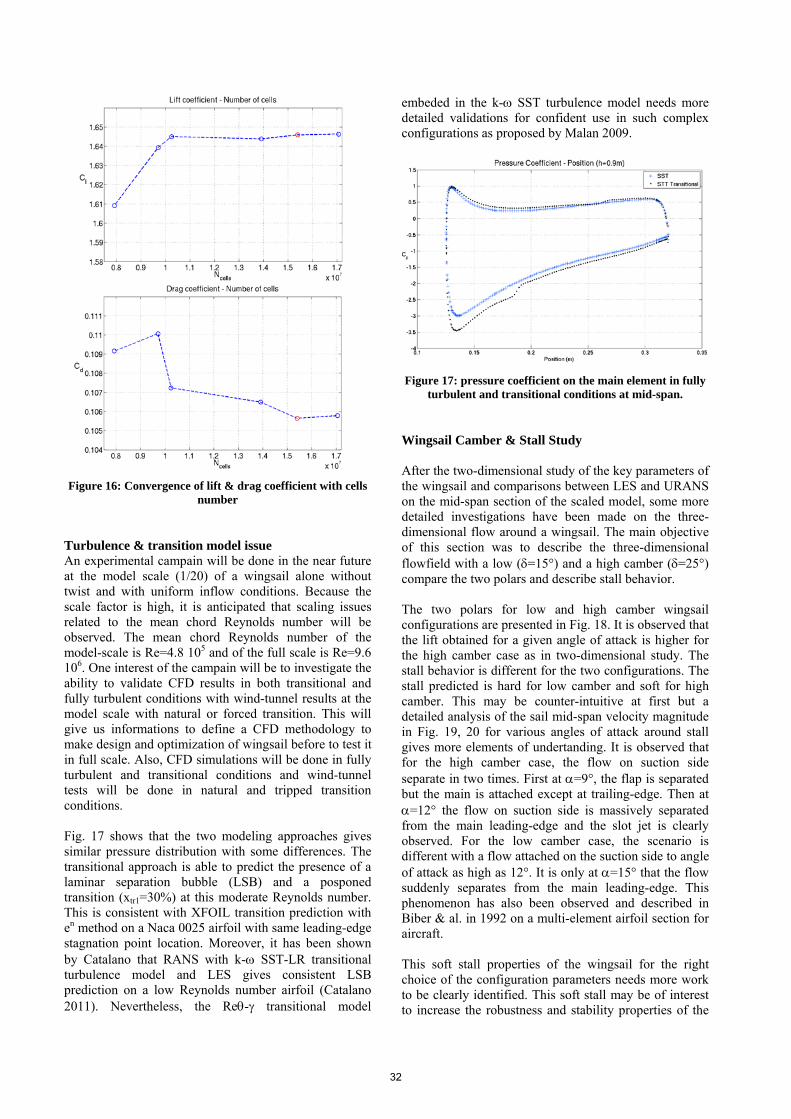
Figure 16: Convergence of lift & drag coefficient with cells number
Turbulence & transition model issue An experimental campain will be done in the near future at the model scale (1/20) of a wingsail alone without twist and with uniform inflow conditions. Because the scale factor is high, it is anticipated that scaling issues related to the mean chord Reynolds number will be observed. The mean chord Reynolds number of the model-scale is Re=4.8 105 and of the full scale is Re=9.6 106. One interest of the campain will be to investigate the ability to validate CFD results in both transitional and fully turbulent conditions with wind-tunnel results at the model scale with natural or forced transition. This will give us informations to define a CFD methodology to make design and optimization of wingsail before to test it in full scale. Also, CFD simulations will be done in fully turbulent and transitional conditions and wind-tunnel tests will be done in natural and tripped transition conditions. Fig. 17 shows that the two modeling approaches gives similar pressure distribution with some differences. The transitional approach is able to predict the presence of a laminar separation bubble (LSB) and a posponed transition (xtr1=30%) at this moderate Reynolds number. This is consistent with XFOIL transition prediction with en method on a Naca 0025 airfoil with same leading-edge stagnation point location. Moreover, it has been shown by Catalano that RANS with k- SST-LR transitional turbulence model and LES gives consistent LSB prediction on a low Reynolds number airfoil (Catalano 2011). Nevertheless, the Re- transitional model
embeded in the k- SST turbulence model needs more detailed validations for confident use in such complex configurations as proposed by Malan 2009.
Figure 17: pressure coefficient on the main element in fully turbulent and transitional conditions at mid-span.
Wingsail Camber & Stall Study After the two-dimensional study of the key parameters of the wingsail and comparisons between LES and URANS on the mid-span section of the scaled model, some more detailed investigations have been made on the three-dimensional flow around a wingsail. The main objective of this section was to describe the three-dimensional flowfield with a low (=15°) and a high camber (=25°) compare the two polars and describe stall behavior. The two polars for low and high camber wingsail configurations are presented in Fig. 18. It is observed that the lift obtained for a given angle of attack is higher for the high camber case as in two-dimensional study. The stall behavior is different for the two configurations. The stall predicted is hard for low camber and soft for high camber. This may be counter-intuitive at first but a detailed analysis of the sail mid-span velocity magnitude in Fig. 19, 20 for various angles of attack around stall gives more elements of undertanding. It is observed that for the high camber case, the flow on suction side separate in two times. First at =9°, the flap is separated but the main is attached except at trailing-edge. Then at =12° the flow on suction side is massively separated from the main leading-edge and the slot jet is clearly observed. For the low camber case, the scenario is different with a flow attached on the suction side to angle of attack as high as 12°. It is only at =15° that the flow suddenly separates from the main leading-edge. This phenomenon has also been observed and described in Biber & al. in 1992 on a multi-element airfoil section for aircraft. This soft stall properties of the wingsail for the right choice of the configuration parameters needs more work to be clearly identified. This soft stall may be of interest to increase the robustness and stability properties of the
32

wingsail and of the entire boat to apparent wind angle (AWA) variations as is common on sea in turbulent wind conditions.
Figure 18: Lift coefficient versus Angle of Attack of the wingsail in low and high camber configuration
Figure 19: velocity magnitude contours at mid-span for =25°, =3°, 9°, 12°
Figure 20: velocity magnitude contours at mid-span for =15°, =12°, 15°
Fig. 21, the Cp profiles show the evolution of the stall phenomenon over the two configurations analysed. At α=0°, the elevated suction on the flap for the high cambered configuration, acts as a favourable gradient pressure for the main element flow. When the first stall occurs, the flap one, the flap suction suddenly reduces. This modification does not perturb particularly the pressure distribution over the main element since the pressure on the leading edge of the flap is still lower than that one on the trailing edge of the element. The pressure distribution on the main element appears to be similar to the lower cambered one even if in this last case the flow is attached on the flap. At 12° the flow over the main element of the high cambered configuration can no more support the adverse gradients coming from the flap provoking the second stall (the main element stall) over this configuration. The low cambered still remains attached. At 15° the brutal stall occurs on the lower cambered configuration with a loss of lift over both the wing elements. Fig. 22 & 23, the flow on the global wing has strong 3D effects, particularly on the high cambered configuration. In this case the flow begins to detach from the flap at 0° on the tip ward of the wing; on the contrary the low cambered configuration does not present differences of the flow in the wing span. The detachment of the flow over the flap, for the high cambered configuration, continues toward the root of the wing provoking also the detachment on the main element. At 9° two regions on the wing span can be distinguished: the upper one where the flap is completely stalled and the flow is partially detached on the main element, and the lower one where the flow persists to remain attached on both the wing elements. The flow in a mid span section has strong 3d effects; these effects persist even when the wing is completely stalled. The lower cambered configuration has a more uniform and bidimensional structure.
33
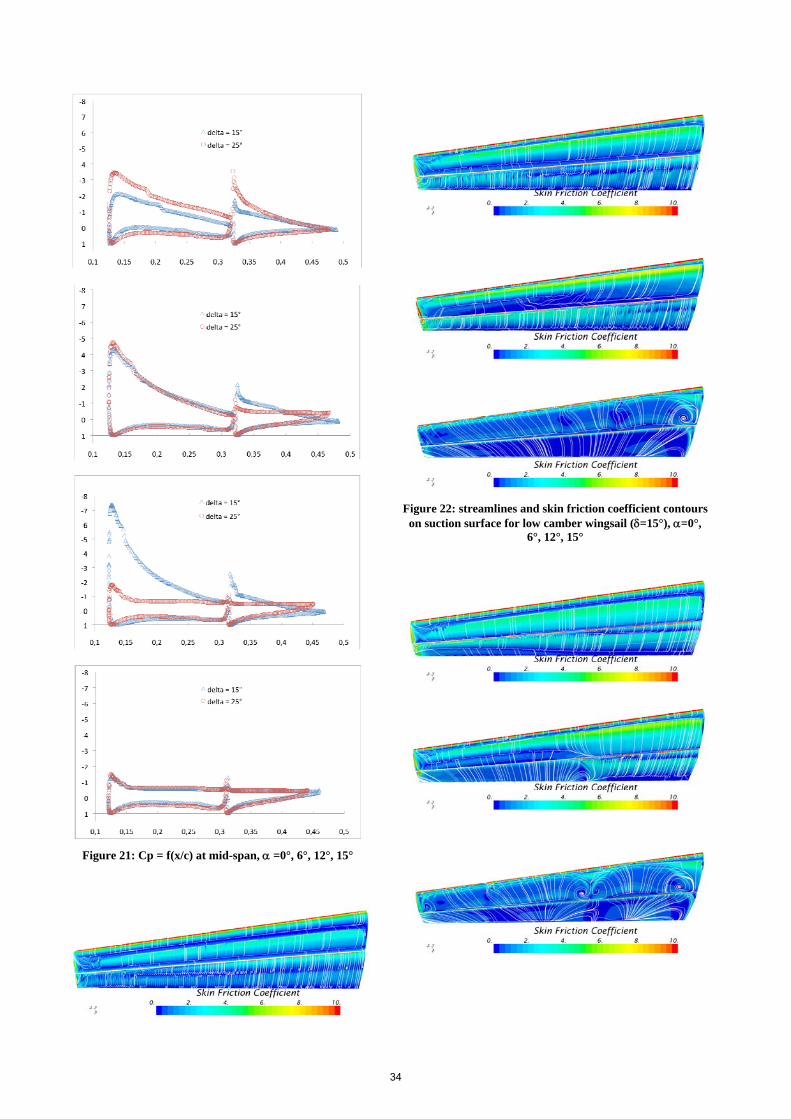
Figure 21: Cp = f(x/c) at mid-span, =0°, 6°, 12°, 15°
Figure 22: streamlines and skin friction coefficient contours on suction surface for low camber wingsail (=15°), =0°,
6°, 12°, 15°
34

Figure 23: streamlines and skin friction coefficient contours on suction surface for high camber wingsail (=25°). =0°,
6°, 12°, 15°
4. CONCLUSIONS
Preparing wind tunnel tests of a 1/20 model-scale rigid wingsail, simulations in two-dimensional and three-dimensional typical configurations have been done through URANS and LES modeling with the same scale and Reynolds number (Re=4.8 105). LES were used to gain insight into the flow phenomena associated to the slot flow and to validate the URANS approach for one wingsail configuration (=25° and =0°). The results show that both methods predict the same flow phenomena: transition of boundary layers on the suction side and a separation close to the trailing edge of the flap. However some discrepancies remain on the location of transition and the length of the laminar separation bubble responsible for transition. LES also validate the role of the leakage flow between the two elements: this leakage flow increase the robustness of the boundary layer on the flap. A coupling mechanism also exist: when the boundary layer starts to separate on the flap suction side, the pressure difference between the pressure and suction sides is reduced, reducing the flow momentum of the leakage flow, which leads to an increase of the boundary layer separation. URANS 2D study has shown the central role of the slot geometry which depend on many parameters. Main parameters have been identified. A non-linear coupling influencing the stall has been emphasized between the flap deflection angle and flap thickness. URANS 3D study has focused on three-dimensional separation and stall behavior. The stall of the wingsail has been characterized for two camber configurations (=15°, =25°). It has been shown that for high camber, the separation is soft and take place in two times. At the opposite, for low camber, the separation was hard with a sudden massive separation from the leading-edge of the main element. These simulations have emphasized the necessity of doing more detailed comparisons of URANS and LES simulations with wind-tunnel tests. The transition model included in the k-w SST turbulence model used has been shown to be useful to predict laminar separation bubble
on the main and flap elements but needs more comparisons to be fully validated in complex situations. The next step of this work will be:
1. the experimental campaign in S4 a large wind-tunnel of ISAE with forces measurements, PIV measurements and flow visualisations to characterize the complex aerodynamics of two-elements wingsail.
2. to further develop and use our multiphysics simulation and optimization framework (Chapin & al. 2006, 2011) for sailing yacht analysis, design and optimization at model and full scale.
Acknowledgements This research was supported in part by ASSYSTEM France, which kindly provided PhD funding. Thanks also to Dr. J. Bodart from ISAE for his help. The computing resources used in this work were provided both by ISAE and the computing center of the University of Toulouse under project p1425. These supports are greatly acknowledged.
References
1. Gentry, A. (1971), The Aerodynamic of Sail Interaction, Proceeding of the 3th AIAA Symposium on the Aero/Hydronautics of Sailing.
2. Smith, A. M. O. (1975), High-Lift Aerodynamics, J. of Aircraft, 12(6), 501-530.
3. Van Dam, C. P. (2002), The Aerodynamic Design of Multi-element High-Lift Systems for Transport Airplanes, Progress in Aerospace Science, 38, 101-144.
4. Blakeley, A. W., Flay, R. G. J. & Richards, P. J. (2012), “Design and Optimization of Multi-Element Wing Sails for Multihull Yachts”, 18th Australasian Fluid Mechanics Conference, Launceston, 3-7 December 2012.
5. Nakashima, T., Yamashita, Y., Nihei, Y. & Li Q. (2012), “A Basic Study for Propulsive Performance Prediction of a Cascade of Wingsails Considering Their Aerodynamic Interaction”, Proceeding of the 21th International Offshore and Polar Engineering Conference, Hawaï, June 2011.
6. Jo, Y., Lee, H. & Choi S. (2013), “Aerodynamic Design Optimization of Wing-Sails”, 31th AIAA Applied Aerodynamics Conference, San Diego, June 2013.
7. Catalano, P., Tognaccini, R., (2011), “RANS analysis of the low-Reynolds number flow around
35
the SD7003 airfoil”, Aerospace Science and Technology, n°15, 615-626.
8. Malan, P., Suluksna, K. & Juntasaro, E. (2009), “Calibrating the -Re Transition Model for Commercial CFD”, 47th AIAA Aerospace Science Meeting, Jan 2009.
9. Kawai, S. and Larsson, J. (2012). Wall-modeling in large eddy simulation: length scales, grid resolution and accuracy, Phys. Fluids 24, 15105
10. Vreman, A. W. (2004). An eddy-viscosity subgrid-scale model for turbulent shear flow: Algebraic theory and applications. Phys. Fluids 16 (10), 3670–3681.
11. Biber, K., Zumwalt, G.W., (1992), Experimental Studies of a two-elements airfoil with large separation, AIAA paper 92-0267, Reno 1992.
12. Chapin, V.G., Neyhousser, R., Dulliand, G., Chassaing, P., “Analysis, Design and Optimization of Navier-Stokes Flows around Interacting Sails”, MDY06 International Symposium on Yacht Design and Production, Madrid, Spain, March 2006.
13. Chapin, V.G., de Carlan, N., Heppel, P., (2011) “Performance Optimization of Interacting Sails through Fluid-Structure Coupling”, IJSCT Vol. 153, Part B2, 103.
36