aerodynamics modelling for training on the edge of the ... · cd drag coefficient ... rences. in...
TRANSCRIPT

ABSTRACTAircraft upset and Loss of Control (LOC) is a leading cause of accidents in commercial and general
aviation aircraft operations. A number of measures have been taken in the commercial segment
to improve training and awareness of this problem and several organisations offer in-flight train-
ing to enhance awareness. In relative terms, in both commercial and general aviation sectors, the
use of Full Flight Simulators (FFS) and Flight Training Devices (FTD) for this purpose is
minimal. A key reason for this is the limited capability and coverage of flight models used in these
devices. This paper provides examples of the limitations in civilian simulators in contrast to mil-
itary efforts that have been using full envelope modelling for decades to enhance pilot training.
The paper also presents techniques used in full-envelope modelling, their validity, and a regula-
tory vehicle that is in-line with current international guidelines for application to civilian trainer
development.
NOMENCLATUREb reference span
c mean aerodynamic chord
p angular rate about body X-axis (roll)
q angular rate about body Y-axis (pitch)
r angular rate about body Z-axis (yaw)
Cl rolling moment coefficient (body axes)
Clp rolling moment damping derivative (body axes)
THE AERONAUTICAL JOURNAL JANUARY 2012 VOLUME 116 NO 1175 67
Aerodynamics modelling fortraining on the edge of the flight envelopeD. R. Gingras J. N. [email protected] [email protected]
Bihrle Applied Research HamptonVirginia, USA
Paper No. 3499. Manuscript received 2 October 2009, revised version received 28 March 2011, accepted 6 June 2011.

Cm pitching moment coefficient (body axes)
Cn yawing moment coefficient (body axes)
Cnβ ∂Cn/∂β – directional static stability (body axes)
CA axial force coefficient (body axes)
CD drag coefficient (stability axes)
CL lift coefficient (body axes)
CN normal force coefficient (body axes)
Dh symmetric horizontal tail deflection
Ddh differential horizontal tail deflection
V,Vo true velocity
α angle of attack
αstall stall angle-of-attack
β angle of sideslip
βSHSSmax maximum angle-of-attack achieved during steady heading side slip tests
Ω omega wind-axis roll rate (rotation about velocity vector)
Ωctrlmax vector (p,q,r) representing maximum anglular rates achieved with control system
Inputs
1.0 INTRODUCTIONA number of efforts in recent years have sought to identify and mitigate leading causes of air-traffic
accidents and losses, with systems, hardware and training being the typical identified tools used to
reduce the occurrence of the incident. For example, aviation safety organisations have long identi-
fied Controlled Flight In to Terrain (CFIT) as a leading cause of aviation related losses. As a result,
a number of efforts to develop test and integrate ground proximity and synthetic visions systems have
effectively demonstrated their viability as cost effective options in the effort to reduce CFIT occur-
rences. In this light, Boeing’s Statistical Summary of Commercial Jet Airplane Accidents – WorldwideOperations 1959 – 2006(1) recognised in flight Loss of Control (LOC) as the most severe accident
causal factor in commercial aviation – with the most crash related fatalities – over the past 10 years.
In addition, statistics tracking both fatal and nonfatal incidents in general aviation, compiled by the
National Transportation Safety Bureau (NTSB)(2), show similar results. With the advent of the Very
Light Jet (VLJ) and their increasing operations, this trend will likely continue. In fact, manufactur-
ers of VLJ’s see upset training as a requirement and are offering programs to pilots(3).
The focus of a number of current programs offering training to combat upset and loss of control
accidents is in-flight training using aerobatic and or military aircraft. Such programs offer course
work and practical exposure to unusual attitudes, stalls, and spins. Although these programs provide
valuable experience to pilots in a general sense, this type of training lacks exposure to aircraft-
specific characteristics that may provide a critical basis that is needed when attempting to
negotiate difficult upset conditions.
There are also efforts to make use of ground-based simulators for such training: specialised devices
such as centrifuges as well as FAA and JAR qualified simulators. The commercial aircraft industry,
in a collaborative effort, published a training aid for upset recovery(4) that offers training recom-
mendations for use in conventional ground-based simulators. The basic premise of this training aid
is that a training syllabus may be performed without ‘extensive simulator modification.’ It also advises
that instructors must be trained to avoid nonstandardised or ineffective training, and that excursions
outside the validated flight regime can lead to such ineffective or negative training.
68 THE AERONAUTICAL JOURNAL JANUARY 2012

The training aid document acknowledges that a simulation may be ‘extended to represent regions
outside the typical operating envelope by using reliable predictive methods.’ It further points to
the fact that flight data are rarely available for these regions. Readily accepted analytical and empir-
ical approaches have provided reasonable predictions of the aerodynamic response beyond the
typical flight envelop for decades. Most of the research and work in this area has been conducted
as part of military aircraft development efforts for engineering use and migrated for use in oper-
ational training simulations. The objective of this paper is to present the state of the art in the
modelling of unusual flight conditions and how these proven techniques are well suited for use
to expand the usable flight envelope of civil ground-based simulators.
2.0 UPSET CONDITIONS AND THE FLIGHT ENVELOPEUpset conditions are typically described as an unintentional pitch attitude of greater than 25° nose
up, a pitch angle of 10° nose down, bank angle of greater than 45°, or ‘inappropriate’ airspeeds
within the above parameters. Such conditions may be caused by environmental conditions,
system anomalies, and or pilot inputs. Although the attitude of the vehicle does not necessarily
mean that the aircraft has ventured beyond the typical flight envelope covered in a flight simula-
tor, the maneuvering or anomaly that causes the upset or the recovery from the condition may result
in an excursion outside the typical flight envelope. Figure 1 presents the typical coverage of a com-
mercial aerodynamics database in the angle-of-attack – angle-of-sideslip space.
Also presented in the figure are regions of typical interpolated analytical/empirical data cov-
erage, extrapolated data coverage, and where data are held constant(5). For reference, a
representative FAA/JAA approved validation region, labeled ‘ACCEPTANCE’, is superimposed,
showing that the normal flight envelope, to stall, is well covered during the validation and
acceptance process.
Further overlaying regions of data that have been gathered and/or reconstructed from accident inves-
tigations from the 1990s clearly shows the lack of coverage of modelling these extreme events.
GINGRAS AND RALSTON AERODYNAMICS MODELLING FOR TRAINING ON THE EDGE OF THE... 69
Figure 1. Typical commercial trainer aerodynamics model coverage.
Figure 2. Typical pitch control coverage.

When one looks deeper into the coverage of aerodynamics models typically used for commer-
cial flight simulators, an assessment of control power envelope coverage reveals that coverage is
quite limited. An example of this can be seen in pitch-control data presented in Ref. 5 and repro-
duced here in Fig. 2.
Representation of the dynamics, or aerodynamic ‘damping effects’ in typical simulations used
for training, is typically by conventional derivatives that vary with Mach number and angle of
attack, but have minimal variation beyond stall, as can be seen in representative roll damping in
Fig. 3 again from Ref. 5.
The dynamic range of a transport aircraft in-flight incident can be quite extreme. Non-dimen-
sional angular rates during these events are typically on the order of magnitude of a military
fighter(6). Therefore, limitations in the dynamic coverage of the aerodynamics model may lead to
unrepresentative aircraft response to adverse conditions or post-stall recovery. For example,
extrapolated damping as seen in Fig. 3 in the stall region would provide an unrealistic dynamic
response, where the flight vehicle may have an unstable trend in dynamics stability making recov-
ery from an upset condition much more difficult.
It is because of these limitations that recommended procedures for upset training in ground-based
simulators is quite restrictive. An ideal situation provides a simulation that contains realistic data
beyond the typical flight envelope and thus allows ‘Fly In- Fly-Out’ (FIFO) upset and recovery
training. Methods for achieving this goal have been used in the development of flight models for
the military for several decades and have seen continuous improvement.
3.0 STALL/POST-STALL MODEL DEVELOPMENTIn efforts to increase the understanding of military aircraft loss, improve airframe and flight control
design, and finally to improve training, the military launched several parallel efforts to improve
stall and post-stall modelling. Assessment of existing EA-6B, F-18, and F-16 engineering and
training simulations(7,8,9) in use in the early 1980s revealed several issues impacting the use of sim-
ulations to model the stall/post-stall regime. The most important, a legacy of limited computer
capacity, cost, or the application of linearised flight extracted data (or all of the above) had left
an implementation of the flight model in the traditional derivative expansion form. This archi-
tecture was incapable of providing the representation of the stall aerodynamic behavior, behavior
that even these early simulations attempted to accommodate. As a result, a common practice with
these models was the integration of model ‘effects’ or adjustments, non-physical accommodations
made to the flight model in an attempt to inject more complex behavior on a relatively simple
model form. As was clearly demonstrated in these early model assessments, these sorts of flight
model manipulations, even if justified with improved model response, typically do not capture
70 THE AERONAUTICAL JOURNAL JANUARY 2012
Figure 3. Example of roll damping. Figure 4. Yawing moment coefficient vs sideslip.

true physical aerodynamic characteristics, and once outside of the adjustment validated envelope,
model fidelity is generally compromised further. The need to identify and physically model aero-
dynamic functional dependencies in this flight regime was clearly seen.
As a result, efforts were made to develop a new modelling approach, utilising new testing, data
reduction and data mechanisation methods to characterise the true aerodynamic behaviors. The
following discussion describes some of the major attributes of this modelling approach.
3.1 Static aerodynamics characterisation
While the introduction of wind-tunnel-test data in simulations has been accomplished since the
earliest applications, the practice of simplifying the data set to its basic derivative form has left
important aerodynamic functionality unrepresented in simulation datasets. Exhaustive wind-
tunnel testing in the stall and post-stall regime has shown the aerodynamic characteristics to be
much more complex and interrelated as stall is approached and exceeded. These functional
dependencies are crucial to proper modelling of the aircraft’s behavior in this regime.
Figure 4 illustrates the importance of capturing the effect of sideslip angles beyond the typical
angle-of-attack and sideslip ranges. While the yawing moment exhibits a slope that could be effec-
tively represented as a derivative below 12° of sideslip, the directional, Cnβ, stability is
dramatically reduced at higher sideslips. These trends require expanded sideslip functionality and
a non-linear multi-dimensional table characterisation. Normal flight typically does not require such
large angular excursions; however, sideslip angles of 20° and above can be experienced during
the stall and post-stall motions. Further, due to asymmetric stall behavior that is frequently
observed on modern military and civil aircraft, the symmetric effect of sideslip may not always
be assumed in the stall region.
The appropriate modelling of control-surface effectiveness is also of primary importance in
exposing pilots to the efficacy of the controls during upset conditions. This is nevertheless a com-
ponent that is frequently highly simplified. Figure 5 presents examples of the control interactions
GINGRAS AND RALSTON AERODYNAMICS MODELLING FOR TRAINING ON THE EDGE OF THE... 71
Figure 5. Non-linear control interaction effect functionality with angle of sideslip.
Figure 6. Non-linear control interaction effects.
that are typically excluded and illustrates the profound effect that sideslip, particularly at large
angles, has on yawing moment. Analysis of yaw versus sideslip provides information on the level
of directional static stability of the aircraft. In this case, with differential horizontal tail deflection,
the directional stability is greatly affected. The effectiveness of deflecting the rudder is similarly
affected by sideslip, particularly in the stall region.
Figure 6 illustrates the effect of symmetric control deflection on the incremental yaw effec-
tiveness of the same differential horizontal tail deflection. As seen in the plot, the effectiveness
of the controller varies from proverse to adverse (even well below stall) depending on the sym-
metric control deflection that is imposed. These data were collected as part of a simulation
envelope expansion effort. The fact that the original simulation used a linear mechanisation for
the yaw due to differential horizontal tail led to a number of modifications and factors being applied
in attempts to improve the simulation response, particularly in the stall regime. While this con-
troller is obviously from a military application, it is worth noting that similar interactions have been
observed on conventional civil configurations with the elevator/stabiliser deflection interaction
on rudder effectiveness.
The key result of the assessment of the static characteristics was the need to acquire functional
complexity beyond what has traditionally been incorporated in these simulations. This functional
expansion should be based on tangible configuration dependent interactions between the aircraft
states and the airframe and control surfaces. Identifying these functionalities is typically well
beyond the scope of even the most comprehensive flight test, given the complex, non-linear
responses seen in the stall/post-stall region. In this regard, the successful application of post-stall
flight modelling in military and civil applications has utilised a series of low speed, low-cost wind-
tunnel test applications(10,11) to exercise the large test matrices that are required to quantify these
effects.
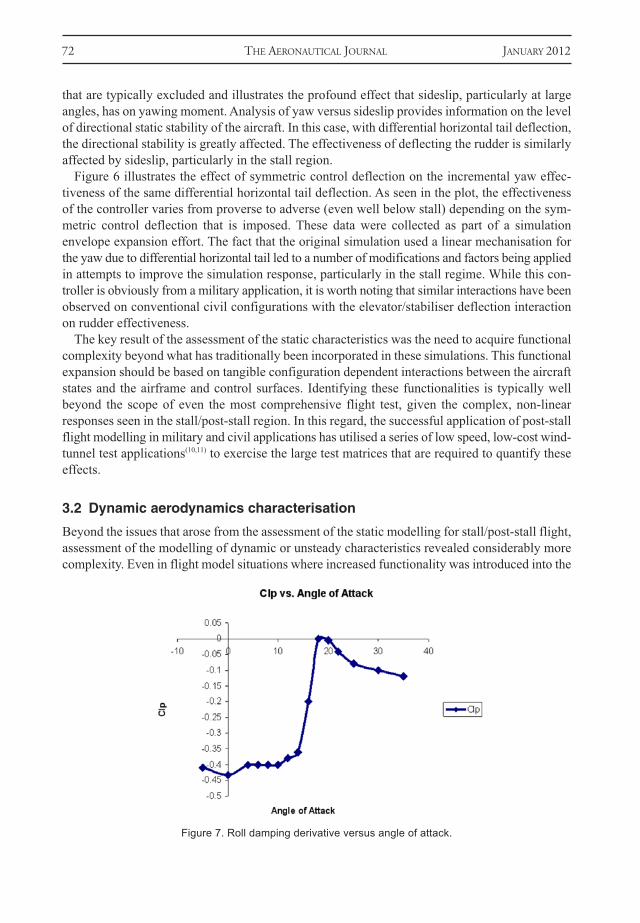
3.2 Dynamic aerodynamics characterisation
Beyond the issues that arose from the assessment of the static modelling for stall/post-stall flight,
assessment of the modelling of dynamic or unsteady characteristics revealed considerably more
complexity. Even in flight model situations where increased functionality was introduced into the
72 THE AERONAUTICAL JOURNAL JANUARY 2012
Figure 7. Roll damping derivative versus angle of attack.

basic static components, the body-axis dynamic aerodynamic effects, also known as ‘damping
effects’ or ‘damping derivatives,’ remained in derivative form, modeled as non-linear functions
of angle of attack, but linear functions of angular rate as presented in Fig. 7.
Concurrent with this renewed assessment of the body-axis dynamics characterisation, consid-
erable progress had been made in the acquisition and data implementation of velocity vector
dynamic characteristics(12). This test method, initially developed to help analyse and model a con-
figuration’s spin characteristics, uses a steady rotation rate about the velocity vector at a set
angle-of-attack and sideslip Fig. 8.
By rotating at specific rates, the test method allows the definition of the vehicle’s linear and non-
linear damping characteristics about the velocity vector as a function of rate. Such data revealed,
at low angles of attack, the dynamics can be expressed as a linear function of the non-dimensional
rate Ωb/2V, Fig. 9, but as the aircraft enters the stall condition, the data exhibits a significant non-
linear variation with rate, the effect varying from propelling to damped depending on the
condition. In the stall region, a velocity-vector roll can also be decomposed as a combination of
body-axis roll and yaw rates, so the inference would be that these individual terms would likely
exhibit nonlinear variation with their respective rates as well.
This conclusion was initially difficult to identify since the methods for identifying damping, from
wind-tunnel and flight test, used assumptions and acquisition techniques that forced the deriva-
tive form. In order to acquire non-linear body-axis damping data, test methods were devised that
allowed the measurement of the damping term at a particular rate as the model oscillated through
the reference attitude in the wind tunnel. This method, referred to as the specific point method(13)
allowed the acquisition of dynamic data at unique non-dimensional rates at specific reference
angles of attack and sideslip, and is expressed in the same fashion as the velocity vector damping
GINGRAS AND RALSTON AERODYNAMICS MODELLING FOR TRAINING ON THE EDGE OF THE... 73
Figure 8. Velocity-vector rotation testing.

data mentioned above. Assessment of these data immediately illustrated the same sort of charac-
teristics seen in the velocity vector data, with generally linear variation with rate below stall, but
as stall is approached and exceeded, the damping characteristics can also vary in a non-linear
fashion with non-dimensional angular rate. For example, Fig. 10 shows the variation of roll incre-
ment as a function of rate for selected angles of attack. The significance of attempting to model
this region’s damping with a linearised term is displayed in Fig. 11, where the extrapolation of the
linear term can lead to grossly incorrect roll-damping increments.
A secondary issue arose as these data were analysed. The superposition of the new body-axis
rate terms to produce an equivalent velocity vector roll damping did exhibit identical damping as
the rotary balance velocity vector rate damping data below stall. However, in the stall regime, the
superposition of body-axis rate terms did not represent velocity vector damping acquired from
rotary balance test technique.
The net result from this analysis was the conclusion that to build the most physically repre-
sentative dynamic modelling of a particular airframe in the stall/ post-stall region, the combination
of the two types of dynamic data were needed, and these had to be specifically combined based
on real time evaluation of the simulated rate excursions. This research led to a number of postu-
lated dynamic data mechanisation schemes(14,15) and the most appropriate have been successfully
demonstrated and applied in a number of current military and civil applications.
Further investigation into the significance of the dynamic characteristics illuminated other issues
as well. Unlike the previous methods of dynamic data acquisition and reduction techniques, the
specific point approach allows the identification of functional effects such as the effect of sideslip,
control deflection and the sign of the rate, interactions that had not previously been identified. The
evaluation of these effects in the dynamic test data revealed that these states can have significant
impact on the dynamic responses in the stall and beyond. Figure 12 shows an example of a vari-
ation of incremental pitching moment as a function of non-dimensional pitch rate at stall
angle-of-attack for a business jet. The pitch increments are shown for the clean aircraft, the air-
craft with landing flaps deployed, and finally, the flaps and full aft stick elevator configuration.
At the angle-of-attack shown, the basic aircraft exhibits a stable pitch-damping characteristic. The
deployment of the flaps significantly reduces the positive rate stability to effectively neutral sta-
bility (with negative rate damping remaining unchanged). The addition of full aft stick to this
combination results in a configuration that is quite unstable for low positive pitch rates. These sig-
nificant effects had not previously been identified or modeled.
This figure also illustrates the impact these identified effects have on the modelling of the stall
behavior. Evaluation of many military and civil stall simulations has identified a number of
74 THE AERONAUTICAL JOURNAL JANUARY 2012
Figure 9. Rolling moment effects from rotation about the velocity vector.
Figure 10. Effect of body-axis roll rate on rolling moment coefficient.

complicated model ‘effects’ incorporated to provide a level of what is frequently referred to as
‘stall hysteresis’ or dynamic stall. This behavior is characterised by unsteady aerodynamics that
cause dissimilar aircraft response as the aircraft pitches up through stall versus the response that
occurs as the aircraft pitches down through the same angle-of-attack Fig. 13. This behavior has
important training consequences and because the conventional model build-up does not provide
any attitude or rate unique characterisation, simulations have used mechanical effects such as
‘latching’ increments based on angle-of-attack history, or other similar devices to attempt to intro-
duce these effects. Referring to the test data presented in Fig. 13(16), one can easily see how this
stall hysteresis characteristic is accommodated by actual aerodynamic variation of the pitch
damping as a function of positive and negative rate.
4.0 EXAMPLES OF MILITARY APPLICATIONSTo illustrate the validity of the methods described two example of military applications of high-
angle-of-attack modelling have been selected, a variant of the F-16 and the F/A-18CD. Both aircraft
are highly maneuverable and provide excellent example of the capability of modern flight models.
GINGRAS AND RALSTON AERODYNAMICS MODELLING FOR TRAINING ON THE EDGE OF THE... 75
Figure 11. Consequence of linearisation. Figure 12. Example of control effects on pitch damping.
Figure 13. Example of dynamic effects near stall or ‘hysteresis’(16)
.

4.1 F-16 MATV (Multi-Axis Thrust Vectoring)
Application of the modelling techniques described above in the military has demonstrated the
success of these new approaches. One of the early applications of these methods was the devel-
opment of a new high-angle-of-attack flight model of the F-16 MATV (Fig. 14) configuration
undertaken for the Air Force Research Laboratory(17,18). This effort was the result of the existing
F-16 simulation’s inability to accurately model the stall and post-stall characteristics. This was
particularly manifest in the poor roll co-ordination control in the immediate stall region. As a
result, the aircraft was outfitted with a ‘dial-a-gain’ board that allowed the pilot to actively adjust
the FCS in flight to attempt to improve post-stall controllability. Post-flight comparisons between
flight data and existing F-16 simulation predictions were made. Figure 15 provides an example
of such comparisons for a velocity-vector roll attempt at approximately 35° angle-of-attack. The
comparison exhibits the simulations deficiency, and explains how an FCS developed using this
simulation would likely be inadequate for controlling such a maneuver.
A new flight model was independently developed, incorporating the non-linear modelling and
mechanisation techniques described above, including revised body-axis dynamic data utilised in
conjunction with rotary balance based velocity axis dynamic data. Using the same flight condi-
tions and inputs, the resulting predicted flight response is compared with the flight data (Figure
(16)). The significant improvement in the correlation between flight and simulation was demon-
strated for this maneuver as well as many other high-angle-of-attack conditions.
4.2 F/A-18C/D
Efforts to improve the Navy’s high-angle-of-attack modelling of the F-18C/D (Fig. 17) configura-
tion began in the 1980s as a result of observed deficiencies in the existing simulation’s ability to model
this aircraft’s high-angle-of-attack characteristics, both in and out of control. The desire to enable
76 THE AERONAUTICAL JOURNAL JANUARY 2012
Figure 14. F-16 MATV.

flight test evaluation of and training exposure to these behaviors further drove these efforts. As a
result, an extensive redesign of the original model to include an entirely new low-speed, high-angle-
of-attack static and dynamic dataset was undertaken(8,20). This model formed the basis for the
development and distribution of an F-18 Common Aerodynamics Database to F-18 users.
Beyond the application of the simulation to support F-18 flight test and training, the availabil-
ity of the simulation provided significant support in addressing an important flight deficiency. The
F-18 is one of the few aircraft that exhibits an out of control mode that is referred to as the ‘Falling
Leaf’. This name refers to the dramatic large amplitude oscillations that are characteristic of this
flight condition. Besides being very disorientating to the pilot, this motion can be unrecoverable
depending on flight conditions, the flight control mode, and pilot inputs. As a result, numerous
aircraft losses were attributed to its occurrence. The F-18 could enter falling-leaf condition
during aggressive maneuvering at low angles of attack, as the time history shown in Fig. 18
exhibits; it shows a low angle-of-attack, large-sideslip excursion entry, as well as the subsequent
complex and highly oscillatory motions.
The original F-18 simulation was incapable of providing a representation of the entry and the
subsequent motions, consequently, evaluation of the entry aerodynamics and FCS update testing
in ground-based simulators was compromised. The revised model, with the expanded static and
dynamic characteristics, was able to very accurately represent the entry and subsequent motions,
as shown in Fig. 18. The availability of this modelling capability enabled not only a detailed under-
standing of the aerodynamics behind the departure and subsequent motion, but also provided a
platform for FCS update evaluation prior to flight testing(21-22).
GINGRAS AND RALSTON AERODYNAMICS MODELLING FOR TRAINING ON THE EDGE OF THE... 77
Figure 15. Comparison of unimproved F-16 MATV simulation with flight data.
Figure 16. Comparison of improved F-16 MATV simulation with flight data.

78 THE AERONAUTICAL JOURNAL JANUARY 2012
Figure 17. F/A-18C/D (D-model shown).
Figure 18. Example of F/A-18C/D simulation comparison with flight data.

GINGRAS AND RALSTON AERODYNAMICS MODELLING FOR TRAINING ON THE EDGE OF THE... 79
Figure 19. Photos of NASA DH-6 Twin Otter sub-scale wind-tunnel model and full-scale Icing research vehicle.

80 THE AERONAUTICAL JOURNAL JANUARY 2012
Figure 20. Example of comparison of aerodynamics coefficient prediction during stall comparison with flight extracted data.
Figure 21. Photos of NASA 5·5% and 3·5% scale wind-tunnel models in the Langley 14- by 22- foot and 20-foot vertical wind tunnels.

5.0 APPLICATION TO CIVIL SIMULATIONSAs indicated in the previous sections much work has been performed to develop wind-tunnel
testing, data collection, and data reduction methods to best predict aircraft aerodynamic response
in extreme conditions. In addition to the vast amount of work that has been performed in the area
for military applications, the approach described above has also been applied to a number of civil
configurations. In fact, techniques have been used since the 1970s to investigate spin behavior
of general aviation aircraft(23). Because of confidentiality agreements no specific work may be
discussed in this paper, but within the past decade, a number of civil aircraft manufacturers have
employed advanced data collection and reduction techniques along with simulation to predict
behavior of new configurations in the stall and post-stall regimes to facilitate and reduce flight
test time during certification.
Work has also been performed using civilian configurations in the non-commercial world.
NASA has sponsored efforts for simulation development for research and training purposes. Two
examples are provided below.
5.1 De Havilland DH-6 twin otter
In the early 2000s, in support of NASA’s in-flight icing program in conjunction with NASA’s
Aviation Safety Program a training simulation was developed by Bihrle Applied Research Inc.
to model the effects of in-flight icing on the flight dynamics of the DH-6 aircraft Fig. 19(24-25).
The primary objective of the work was to establish a process that could be used to modify and
enhance existing flight aerodynamics models with data to appropriately model the effects of in-
flight icing in normal and extreme flight conditions. The baseline and icing effects model was
developed from wind-tunnel data collected at the Wichita State 7ft by 10ft low-speed tunnel in
Kansas, and at Bihrle Applied Research Inc. Large Amplitude Multi Purpose (LAMP) facility
in Germany. The test data covered a large angle-of-attack and side slip range including inverted
angles of attack, with and without deflected flaps and control surfaces. As part of the compre-
hensive data collection effort, body-axis forced oscillation and rotary balance data were collected
and implemented into the model. The tests were then repeated with prescribed ice-shaped fix-
tures adhered to the wing, vertical, and horizontal tails.
Data from wind-tunnel tests were reduced and incorporated into an aerodynamics model that
was validated against flight test data (Fig. 20) and implemented into a unique Icing Contamination
Effects Flight Training Device (ICEFTD). The main purpose of this device is to demonstrate and
train pilots on the effects of in-flight icing(26). The ICEFTD has been a key element in a number
of hands-on short courses conducted by the University of Tennessee Space Institute (UTSI)(27).
5.2 Large twin engine transport
As part of NASA’s Aviation Safety and Security Program, a collaborative effort performed by
NASA and The Boeing Company leveraged state-of-the-art practices in the modelling of flight
dynamics to better model the stall and post-stall flight regime of a large twin-engine commer-
cial transport(5). During the effort comprehensive wind-tunnel tests using 3·5% and 5·5% scale
models, Fig. 21, were conducted employing the extended static, body-axis forced oscillation and
rotary-balance test techniques described above. The data from these tests were reduced by
NASA, using techniques presented in Ref. 15, and used by Boeing to create an ‘enhanced’ flight
model of the subject aircraft.
GINGRAS AND RALSTON AERODYNAMICS MODELLING FOR TRAINING ON THE EDGE OF THE... 81

The resulting simulation was used in a piloted simulation study in which the response of the
enhanced model was compared to a baseline model with typical envelope coverage used for
crew training. The study focused on maneuvers with flaps up in the stall and post-stall flight
regimes. The conclusion of the study showed that the enhanced model was able to achieve
‘higher angles of attack,’ and that lateral-directional characteristics were ‘more dynamic’ than
the baseline crew training model(28). The enhanced model ‘provides a better prediction of
lateral/directional dynamics in post-stall flight where complex interactions of stability, control
effectiveness, rate damping, and kinematic coupling occur.’ Qualitative assessments from
Boeing and NASA pilots indicated that the enhanced model was an ‘improvement’ over the
baseline(28).
6.0 GROUND-BASED SIMULATOR ENVELOPE EXPANSION
Both FAR Part 60 Change 1(29) and JAR-STD 1A(30) contain the requirements for qualifying a
simulator for pilot training. In the stated requirements, specifically for the aerodynamic and
flight models, a number of requirements indicated proper functionality and behavior of the
flight model. For example, Part 60 requires that overall aerodynamics modelling must have
appropriate functionality for corresponding levels of qualification, such as ‘Nonlinearities due
to sideslip,’ ‘Mach effects at high altitude,’ etc. The requirements also contain a detailed list
of objective tests, commonly included in a document named the Qualification Test Guide
(QTG), which must be performed where results must fall within specific tolerances of acknowl-
edged truth data – data typically provided by the manufacturer. Revisiting Fig. 1, the region
of the simulator flight envelope that undergoes rigorous validation and acceptance, the QTG
region, during FAA or JAR qualification efforts is quite small relative to the ‘entire’ flight enve-
lope. One can raise the argument that the QTG envelope does not completely cover the entire
normal flight envelope and that it is readily accepted that interpolated data collected from
approved methods that has NOT been validated is used every day for pilot training. It is gen-
erally accepted that these responses must be of the correct trend and magnitude, and thus
deemed appropriate by piloted subjective tests.
Since the use of data that generates ‘correct trend and magnitude’ response without objec-
tive testing is an accepted practice within the ‘normal’ flight envelope, it is reasonable to
suggest that such data collected outside the ‘normal’ flight envelope would be appropriate as
well.
As presented in the previous sections, the state-of-the-art in the modelling of flight dynam-
ics has evolved much like other technologies used in the deployment of flight simulators such
as image generators and motion systems. The methods are well suited for providing data, that
at the very least, can be used to generate aerodynamics models that will yield responses that
are of the correct trend and magnitude for use in training of scenarios in which the flight vehicle
experiences flight motions that are beyond the normal flight envelope and beyond stall.
6.1 The process for envelope enhancement
The addition of data in the post-stall regime to aerodynamics data packages can be a contro-
versial subject. On the one hand it is desirable to field comprehensive models for training pilots
to improve safety by allowing them to train for events that are not practical to execute in the
82 THE AERONAUTICAL JOURNAL JANUARY 2012

aircraft. On the other hand, the addition of data at extreme conditions to the database by air-
craft manufactures may not be possible. Current requirements do not require modelling past
stall or at extreme flight conditions. Perhaps it is time to recommend a change in thinking.
In order to extend capabilities beyond the currently accepted usage of ground-based simu-
lators, a qualified ‘endorsement’ strategy is proposed that is in-line with task-driven trainer
requirements being proposed in the latest version of ICAO 9625(31). Such endorsements would
serve as a mechanism for allowing simulator manufacturers to exceed capabilities that the air-
craft manufactures are not willing or capable of providing. In addition, it provides a potential
revenue stream for aircraft manufacturers and other vendors with data package options that
support the endorsements. Each endorsement would have a set of requirements, much like
requirements for qualification. For the topic at hand, an ‘upset training and extreme flight
endorsement,’ would carry requirements that ensures the FAA or JAR qualification level, B,C,D
etc. are satisfied, and that augmentation to the qualified aerodynamics model are performed
using readily accepted methods, such as those presented in this paper. An official endorsement
program would provide standardisation and motivation for enhancing and improving the
flight envelope coverage for flight simulators.
The process of enhancing existing aerodynamics models by an aircraft or simulator manu-
facturer would require a number of steps that are outlined below.
1. Define the Enhancement Envelope
(a) Several guidelines can be used for determining the true extent of the required aero-
dynamics model enhancement.
(i) Angle-of-Attack: -2αstall to 5αstall
(1) Reference 32 presents a quantitative approach to the determination of loss
of control. In this work an adverse aerodynamics envelope is defined by
a normalised angle-of-attack and sideslip. The normalised angle-of-attack
is equal to 1 at stall and zero at 0°. When overlaying accident data on this
adverse aerodynamics envelope, several accidents exceed normalised
angles of attack of 4·5.
(ii) Angle of sideslip: -2βSHSSmax to βSHSSmax
(1) The extents for angle of sideslip are a function of maximum sideslip
achieved in any condition during a steady heading sideslip maneuver from
flight test.
(iii) Control power and flaps
(1) Primary controls and flap coverage that may be available to the pilot in
extreme conditions should be covered in the enhanced model for the
angle-of-attack and sideslip coverage specified above.
(2) Control surface effects must capture nonlinearities and inter action effects.
(iv) Pitch, roll, and yaw rate: -2Ωctrlmax to 2Ωctrlmax
(1) The maximum nondimensional angular rate, Ωctrlmax, is the maximum rate
that can be generated by the flight controls in any of the three aircraft
axes, pitch, roll, and yaw. These rates are typically nondimensionalised
using a characteristic length in the corresponding axis, span for example
in the lateral axis, and divided by twice the true airspeed, thus pb/2v.
GINGRAS AND RALSTON AERODYNAMICS MODELLING FOR TRAINING ON THE EDGE OF THE... 83

(2) Modelling of dynamic effects must account for nonlinearities throughout
the flight envelope.
2. Assessment of the existing envelope coverage
(a) The assessment of the existing envelope coverage focuses on the determination of what
are believable data and what are not and the relation of this coverage to the envelope
specified in step 1.
(i) This may be a difficult task, but obvious answers may be revealed by simple inspec-
tion of data like those seen in Fig. 2. It is obvious that elevator effectiveness does
not physically remain constant after stall. Other data’s functionality and validity
may not be as obvious.
3. Data Acquisition
(a) Develop a plan for data not covered by the baseline data. Several options exist as data
sources.
(i) Wind-tunnel testing (low-speed, dynamic)
(1) As presented in a number of examples in this paper the data that are col-
lected from low-speed wind-tunnel testing are well-suited for populating
extreme envelope aerodynamics models. Much work has been performed
in the development of using dynamic data from such facilities in modern
aerodynamics models.
(ii) Computational aerodynamics and computational fluid dynamics
(1) Currently options exist that can be used to model aerodynamics beyond
stall, and at extreme flight conditions. Several solutions provide good cor-
relation with wind-tunnel data.
(b) Data collection, reduction and implementation
(i) Data would be collected from the chosen source and need to be organised into a
database that would be merged with the baseline aerodynamics model. In this step
expert judgment must be made as to any corrections that must be made to the data
that will enhance the baseline data in order to seamlessly blend data coverage.
4. Testing and Verification
(a) As with all modifications to a simulation used for training, the QTG must be run to ensure
the baseline fidelity was not corrupted by the enhancement. Further testing must be con-
ducted to verify proper implementation and blend of the enhanced data envelope.
(b) Subjective test flights by subject experts
7.0 CONCLUSIONMuch work has been performed in the modelling and simulation of flight dynamics in ‘extreme’
conditions. Through this work, a process has been established that yields models with very good
predictive capability and subsequent correlation with flight test data. Although most of the work
in this area has focused on highly maneuverable military aircraft, the concepts for data collec-
tion and reduction are well suited for use in the civil arena, as was proven during two efforts
sponsored by NASA in the past decade.
84 THE AERONAUTICAL JOURNAL JANUARY 2012

The current typical coverage of aerodynamics models used in training simulators is inadequate
to provide realistic ‘fly-in fly-out’ upset and extreme condition training. With the application
of techniques and processes presented here along with the concept of FAA and or JAR endorse-
ments, the industry is provided with a path toward increased use of ground-based simulators
for upset training by the expansion of the typical simulator flight envelopes.
REFERENCES1. Statistical Summary of Commercial Jet Airplane Accidents, World Wide Operations, 1956-2006, The
Boeing Company, Commercial Airplanes, Statistical Summary, July 2007.2. Annual Review of Accident Data, USA General Aviation, 2003, National Transportation Saftey Board,
PB2007-105-105388, NTSB/ARG-07/01.3. Eclipse 500: implications of integration for VLJs. Aviation international news/industry make progress
on VLJ training standards, Avionic Magazine, 1 May 2005, July 2007.4. Airplane Upset Recovery Training Aid Revision 1, Upset Recovery Industry Team, August 2004.5. FOSTER, J.V. et al Dynamics Modelling and Simulation of Large Transport Airplanes in Upset Condi-
tions, AIAA-2005-5933.6. MURCH, A.M and FOSTER J.V. Recent NASA Research on Aerodynamic Modelling of Post-Stall and
Spin Dynamics of Large Transport Airplanes, AIAA-2007-463-253, 45th AIAA Aerospace SciencesMeeting and Exhibit, Reno NV, USA, 8-11 January 2007.
7. RALSTON, J.N. A Low-Speed Aerodynamic Model of the EA-6B Airplane Through 90° Angle-of-Attack.Bihrle Applied Research 85-3, January 1985.
8. RALSTON, J.N. Analysis of F-18A/B Low-Speed, High Angle-of-Attack Aerodynamic Data Base,Including: I. Selected Erect Characteristics, II. Two-Place Canopy Effect, III. Store Loading Effect,Bihrle Applied Research 88-7, September 1988.
9. RALSTON, J.N. Analysis of High Angle of Attack Data and Simulation Results for the F-16 MCID Con-figuration, Including the Effects of Selected Stores, Bihrle 89-12, September 1989.
10. DICKES, E, RALSTON, J.N. and LAWSON, K. Application of Large-Angle Data for Flight Simulation,AIAA 2000-4584, AIAA Modelling and Simulation Conference and Exhibit, 14-17 August 2000,Denver, CO, USA.
11. RALSTON, J.N. and KAY, J. The Utilization of High Fidelity Simulation in the Support of High-Angle-of-Attack Flight Testing, NASA High Angle-of-Attack Technology Conference, 17-19 September,1996, NASA Langley Research Center, Hampton, VA, USA.
12. RALSTON, J.N. and BARNHART, B.P. Application of Rotary Balance Data in the Analysis of High Angle-of-Attack Characteristics, NASA High Angle-of-Attack Technology Conference, 30 October – 1November 1990, NASA Langley Research Center, Hampton, VA, USA.
13. HULTBERG, R. Acquisition Technique and Analysis Format for Forced Oscillation Dynamic Data, NASAHigh Angle-of-Attack Technology Conference, 17-19 September 1996, NASA Langley ResearchCenter, Hampton, VA, USA.
14. HULTBERG, R. and PLAYER, J.L. An Improved Wind Tunnel Test Technique for Dynamic Data. BAR 00-01.15. KAY, J. Acquiring and Modelling Unsteady Aerodynamic Characteristics, AIAA 2000-3907, AIAA
Atmospheric Flight Mechanics Conference, 14-17 August 2000, Denver, CO, USA.16. BRANDON, J.M. and FOSTER, J. Recent dynamic measurements and considerations for aerodynamic
modelling of fighter airplane configurations, AIAA-1998-4447.17. O’ROURKE, M., RALSTON, J.N., BELL, J.W. and LASH, S. PC-Based Simulation of the F-16/MATV,
AIAA 97-3728, AIAA Modelling and Simulation Technologies Conference, 11-13 August 1997, NewOrleans, LA, UK.
18. KAY, J., RALSTON, J.N. and LASH, S. Development of Non-Linear, Low-Speed Aerodynamic Model forthe F-16/VISTA, AIAA 97-3576, AIAA Modelling and Simulation Technologies Conference, 11-13August 1997, New Orleans, LA, USA.
19. RALSTON, J.N. and O’CONNOR, C. F-18A/B Low-Speed Aerodynamic Math Model for Simulation ofAircraft Motions Between -90° and +90° Angles of Attack, Including: I. Rotational Terms, II. InvertedStatic & Oscillatory Terms, III. Incremental Store Loading Effects, IV. Two-Place F-18B Canopy Effect,Bihrle Applied Research 88-5, May 1988.
GINGRAS AND RALSTON AERODYNAMICS MODELLING FOR TRAINING ON THE EDGE OF THE... 85

20. O’CONNOR, C, RALSTON, J. and FITZGERALD, T. Evaluation of the NAWC/AD F/A-18C/D Simulation
Including Database Coverage and Dynamic Data Implementation Techniques, AIAA 96-3365, AIAA
Atmospheric Flight Mechanics Conference, 29-31 July, 1996, San Diego, CA, USA.
21. JARAMILLO, P. Flight Test Analysis and Simulation of the F-18D Falling Leaf Motion, AIAA 96-3371,
AIAA Atmospheric Flight Mechanics Conference, 29-31 July, 1996, San Diego, CA, USA.
22. JARAMILLO, P. An Analysis of Falling Leaf Suppression Strategies for the F/A-18D, AIAA 96-3370,
AIAA Atmospheric Flight Mechanics Conference, 29-31 July, 1996, San Diego, CA, USA.
23. BIHRLE, W. and BARNHART, B.P. Spin prediction techniques, J Aircraft, 20, (2), February 1983.
24. BARNHART, B.P., DICKES, E.G., GINGRAS, D.R. and RATVASKY, T.P. Simulation Model Development for
Icing Effects Flight Training, SAE Paper 2002-01-1527.
25. GINGRAS, D.R., DICKES, D.G., RATVASKY, T.P. and BARNHART, B.P. Modelling of In-Flight Icing Effects
for Flight Training, AIAA paper 2002-4605, AIAA Aerospace Sciences Meeting and Exhibit, January
2002.
26. RATVASKY, T.P., RANAUDO, R.J., BARNHART, B.P., DICKES, E.G. and GINGRAS, D.R. Development and
Utility of a Piloted Flight Simulator for Icing Effects Training, NASA TM-2003-212116. April 2003.
27. BARNHART, B.P. and RATVASKY, T.P. Effective Training for Flight in Icing Conditions, NASA TM 2007-
214693, March 2007.
28. CUNNINGHAM, K. et al Simulation Study of a Commercial Transport Airplane During Stall and Post-Stall
Flight, SAE Technical Paper Series, 2004-01-3100.
29. Federal Aviation Administration, 14 CFR Part 60 Flight Simulation Training Device Initial and Con-
tinuing Qualification and Use; Final Rule, 9 May 2008.
30. JAR-STD-1A Aeroplane Flight Simulators, Amendment 3, Joint Aviation Authorities Committee, 01
July 2003.
31. Manual of Criteria for the Qualification of Flight Simulation Training Devices. Volume I Aeroplanes,
ICAO 9625 Edition 3, December 2009.
32. WILBORN, J. and FOSTER, J. Defining Commercial Transport Loss-of-Control: A Quantitative Approach,
AIAA 2004-4811, August 2004.
86 THE AERONAUTICAL JOURNAL JANUARY 2012