aerospace technology institute: scoping study · executive summary the aerospace technology...
TRANSCRIPT

BIS RESEARCH PAPER NUMBER 271
The Aerospace Technology Institute: Scoping study to establish baselines, monitoring systems and evaluation methodologies
FEBRUARY 2016


Contents Executive Summary ....................................................................................................................... i
The evaluation challenge and approach ....................................................................................... i
Next steps and recommendations .............................................................................................. iv
1. Introduction ........................................................................................................................... 1
2. Evaluation subject and context ............................................................................................ 2
2.1. ATI programme features: a summary of the intervention logic ........................................ 2
2.2. Summary ...................................................................................................................... 10
3. Key Performance Indicators for the ATI programme ........................................................ 12
4. Setting the Baseline ............................................................................................................ 19
4.1. The baseline at project level ......................................................................................... 19
4.2. The baseline at sector level .......................................................................................... 21
4.3. Projecting a future baseline for the sector ..................................................................... 25
5. Evaluation approach and framework ................................................................................. 32
5.1. Types of evaluation and implications ............................................................................ 32
5.2. The key evaluation challenges ...................................................................................... 33
5.3. The problem of the counterfactual: Alternative approaches ........................................... 36
5.4. The overall impact evaluation approach ........................................................................ 39
5.5. The ‘top-down’ evaluation approach ............................................................................. 43
5.6. The ‘bottom-up’ evaluation approach ............................................................................ 45
5.7. Triangulation of evidence to assess impact ................................................................... 53
5.8. Addressing key issues and challenges.......................................................................... 54
5.9. Assessing spillovers ...................................................................................................... 56
5.10. Economic evaluation ..................................................................................................... 57

6. Next steps and recommendations ..................................................................................... 59
Annex A. ATI programme intervention logic ............................................................................. 61
A.1. ATI context, rationale and objectives ............................................................................ 62
A.2. ATI inputs and activities ................................................................................................ 64
A.3. ATI expected results ..................................................................................................... 66
A.4. ATI results chain summary ............................................................................................ 68
A.5. ATI theory of change ..................................................................................................... 69
Annex B. The project baseline ................................................................................................ 75
B.1. Project partners by types of organisations .................................................................... 76
B.2. Main individual beneficiary organisations ...................................................................... 78
B.3. Research themes .......................................................................................................... 82
B.4. Areas for further consideration ...................................................................................... 83
B.5. Aerospace R&T schemes included in the project baseline analysis .............................. 83
Annex C. The sector baseline ................................................................................................. 86
C.1. A detailed analysis of the sector baseline ..................................................................... 86
C.2. Trends in UK market share ........................................................................................... 96
C.3. Conclusion and other factors for consideration ........................................................... 101
C.4. Recommendations on data issues .............................................................................. 101
C.5. Gross Value Added (GVA) .......................................................................................... 103
C.6. Turnover/gross output ................................................................................................. 104
C.7. Export/Import .............................................................................................................. 105
C.8. Export/Import price deflators ....................................................................................... 108
C.9. UK market share ......................................................................................................... 108
Annex D. Data sources .......................................................................................................... 112
D.1. UK .............................................................................................................................. 112

D.2. Market share - various countries ................................................................................. 115
Annex E. Bibliography for the sector baseline .................................................................... 120
Annex F. The model to project future sector performance .................................................... 121
F.1. A future baseline to assess the sector’s potential and establish a ‘pseudo-counterfactual’ 121
F.2. The purpose of the modelling framework .................................................................... 121
F.3. The modelling framework ............................................................................................ 122
F.4. Using the model and interpreting the results ............................................................... 128
F.5. Implications for monitoring and evaluation .................................................................. 134
F.6. Recommendations for further research to improve the modelling framework .............. 135
Annex G. Key evaluation methods and tools .......................................................................... 136
G.1. Beneficiary Survey ...................................................................................................... 136
G.2. Case Studies .............................................................................................................. 141
Annex H. Monitoring framework .............................................................................................. 145
H.1. Approach and parameters ........................................................................................... 145
H.2. Programme monitoring framework – mapping and gapping ........................................ 147
H.3. Summary .................................................................................................................... 154

Executive Summary The Aerospace Technology Institute (ATI) was created as part of the coalition government’s industrial strategy, which targets aerospace as one of the priority sectors. It was incorporated in September 2013, and its management team began its work in September 2014. The ATI is a virtual centre of academics and industry experts, supported by a small team of staff, to drive the UK’s intellectual leadership in aerodynamics, propulsion, aerostructures and advanced systems.
In December 2014, the Department for Business Innovation and Skills (BIS) commissioned SQW and Cambridge Econometrics (CE) to carry out a scoping study to establish baselines, monitoring systems and evaluation methodologies for the portfolio of aerospace research and technology (R&T) and infrastructure projects for which the ATI is to provide strategic oversight (hereinafter referred to as the ATI programme). The ATI programme will provide £1.05bn of funding for aerospace R&T projects over the seven year period to 2020. Industry has pledged to match the government funding, bringing total investment to approximately £2.1bn.
The evaluation challenge and approach
The nature and design of the ATI programme, coupled with the characteristics of the sector, pose a number of challenges to evaluation. The ATI project portfolio is highly diverse; projects vary significantly (in terms of size, themes, etc.) and are delivered by a range of beneficiaries (ranging from very large companies to SMEs to academic institutions). The varying, though frequently long, timeframes to impact and the many confounding factors make attribution of observed effects to the ATI-funded R&T difficult. The nature of the aerospace sector (with relatively few large companies, most or all of which are expected to receive some ATI funding) means that a control group of similar non-beneficiaries does not exist. As a result, the companies that do not take part are likely to be fundamentally ‘different’ from those that do. An empirical impact evaluation design involving a formal control group is therefore not feasible.
In light of this, the impact evaluation will need to adopt a combination of approaches and methods. It will need to triangulate both quantitative and qualitative data from different sources to arrive at the best possible estimate of the outcomes achieved and assess the ATI programme’s contribution to bringing these about. The scoping study has therefore recommended that a mixed methods theory-based approach to evaluating the impact of the ATI programme is undertaken. This approach should combine two conceptually separate but complementary perspectives:
i
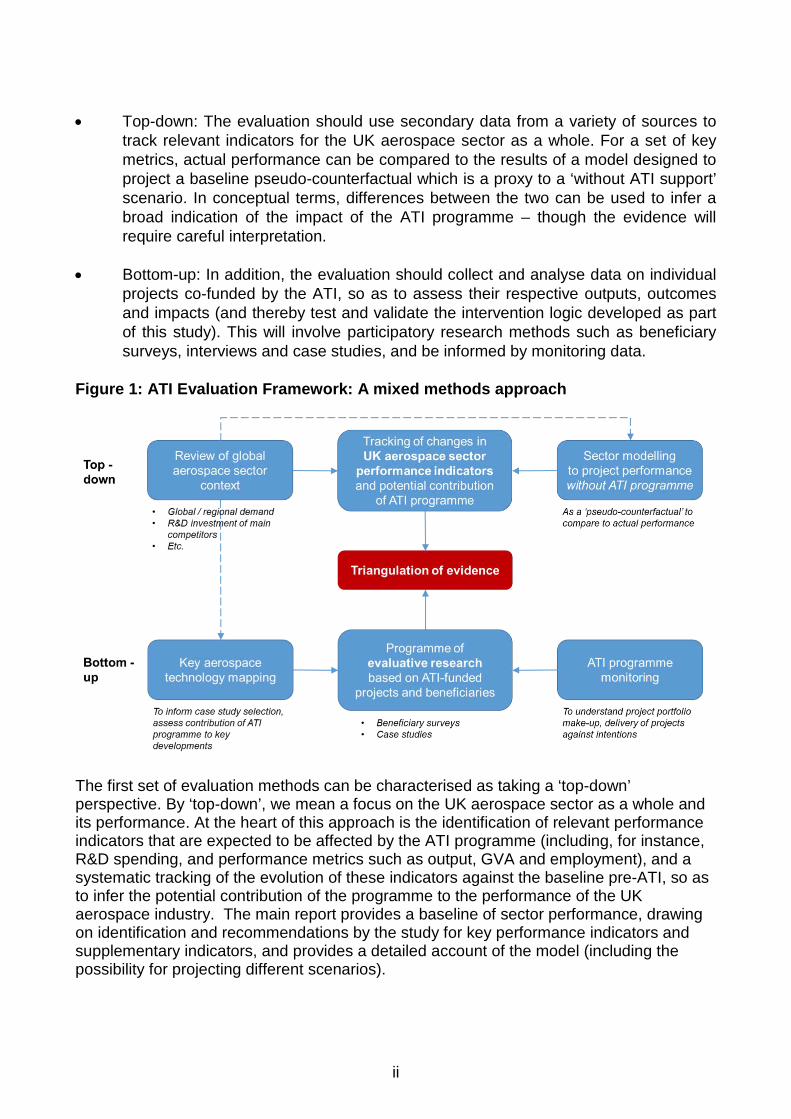
• Top-down: The evaluation should use secondary data from a variety of sources to track relevant indicators for the UK aerospace sector as a whole. For a set of key metrics, actual performance can be compared to the results of a model designed to project a baseline pseudo-counterfactual which is a proxy to a ‘without ATI support’ scenario. In conceptual terms, differences between the two can be used to infer a broad indication of the impact of the ATI programme – though the evidence will require careful interpretation.
• Bottom-up: In addition, the evaluation should collect and analyse data on individual projects co-funded by the ATI, so as to assess their respective outputs, outcomes and impacts (and thereby test and validate the intervention logic developed as part of this study). This will involve participatory research methods such as beneficiary surveys, interviews and case studies, and be informed by monitoring data.
Figure 1: ATI Evaluation Framework: A mixed methods approach
The first set of evaluation methods can be characterised as taking a ‘top-down’ perspective. By ‘top-down’, we mean a focus on the UK aerospace sector as a whole and its performance. At the heart of this approach is the identification of relevant performance indicators that are expected to be affected by the ATI programme (including, for instance, R&D spending, and performance metrics such as output, GVA and employment), and a systematic tracking of the evolution of these indicators against the baseline pre-ATI, so as to infer the potential contribution of the programme to the performance of the UK aerospace industry. The main report provides a baseline of sector performance, drawing on identification and recommendations by the study for key performance indicators and supplementary indicators, and provides a detailed account of the model (including the possibility for projecting different scenarios).
ii

Table 1: Methods that form part of ‘top-down’ evaluation Method Purpose
Tracking sector performance data
Review how key UK aerospace sector performance metrics that the ATI programme is expected to affect are evolving
Review of global aerospace sector context
Track external factors that may contribute to explaining the (relative) performance of the UK aerospace industry, including factors that affect demand and, where possible, relevant policies in competitor countries
Projecting sector performance without ATI support
Generate a modelled scenario (or set of scenarios) to compare with actual performance (as a ‘pseudo-counterfactual’ to help infer impact)
Source: SQW
The ‘bottom-up’ part of the proposed evaluation methodology is meant to provide an alternative and complementary perspective to the sector-level data and estimates, by focusing on the specific activities (i.e. projects) that are co-funded by the ATI programme and their beneficiaries. The emphasis should be on data collection methods with beneficiaries themselves, and their partners, that ask them to report on the results of their respective projects. This will enable the evaluation to test and validate the programme theory (i.e. the causal impact chains depicted in the intervention logic), and thereby confirm the extent to which the ATI programme has contributed to longer-term outcomes and impacts. In doing so, the evaluation approach will need to take into account the heterogeneity of funded activities. This requires the collection of qualitative data on key issues such as technological developments and the role of the ATI programme in bringing these about, to complement and help interpret the quantitative data on aspects such as R&D spend, commercial benefits, jobs etc., some of which should be addressed through programme monitoring. The main report provides recommendations to modify and add to existing monitoring to inform the evaluation, again drawing on a set of key performance indicators and supplementary indicators that have been identified.
Table 2: Methods that form part of ‘bottom-up’ evaluation Method Purpose
Case studies In-depth review of a sample of projects to generate rich qualitative and quantitative data on implementation and results, including hard-to-assess aspects such as effects on the supply chain, spillover effects, etc.
Beneficiary surveys Collect self-reported data from beneficiaries (including lead and non-lead partners) on project results achieved to date, and expectations for further impacts in the future
Programme monitoring
Systematically collect data to allow for analysis and segmentation of the ATI project portfolio, and to provide up-to-date information on a limited number of results that lend themselves to monitoring
Technology mapping Provide context for the evaluative research by identifying key technological developments, enabling the evaluation to assess the contribution of ATI-funded projects to progress in these areas in a targeted way
Source: SQW
iii

By combining both the ‘top-down’ and the ‘bottom-up’ perspectives, the evaluation should be able to arrive at estimates of the order of magnitude of the impact, as well as the ATI programme’s necessity and sufficiency (e.g. was it a necessary but individually insufficient factor in producing the observed outcomes?). In line with much of the current thinking around the merits of theory-based approaches to establishing causality, the evaluation would attempt to verify the causal chain, and thereby assemble an evidence-based contribution story. Contribution analysis could serve as an overarching framework for the evaluation as a whole, with the ‘bottom-up’ work attempting to establish the extent to which the projects funded through the ATI programme have contributed to the changes in sector performance observed via the ‘top-down’ analysis, while also considering the role of other (external) factors such as global demand, R&D support schemes in competitor countries, etc.
Next steps and recommendations
In order to strike a balance between the intervention logic analysis (which highlights the long timescales to outcomes and impacts) and the likely requirements of government for evidence on outcomes and impacts to inform policy-making (which operates on shorter timescales), the study recommends the following timetable for evaluation:
• 2016/17: First interim impact evaluation, focusing on outputs, short and (where possible) medium term outcomes, and incorporating elements of process evaluation (addressing both internal elements, such as how projects were selected, appraised and monitored, and external aspects, such as how beneficiaries went about implementing projects, difficulties encountered, etc.)
• 2019/20: Second interim impact evaluation, focusing on short, medium and (where possible) longer term outcomes, and again incorporating elements of process evaluation
• 2022/23: Final impact evaluation
The present study has addressed relevant issues and developed concrete proposals to the extent that the available information and resources have allowed. There are, however, a number of additional aspects that fell outside the scope of the project and/or the ‘area of influence’ of the consultants, but should be addressed / taken forward over the course of the coming months so as to ensure that future evaluations can be launched and implemented effectively and efficiently. These include:
• Comprehensive and relevant monitoring data is one of the key prerequisites for future robust impact and economic evaluation. BIS, ATI and Innovate UK should discuss urgently the ATI programme monitoring system and agree how the recommendations made by this study to ensure high-quality monitoring data is available can be taken forward. Ideally, this system should also be applied retrospectively (i.e. to projects launched to date).
iv

• The work on developing the model to project future sector performance without ATI support has provided the ‘proof of concept’ in terms of a realistic model design and structure and its use as part of evaluation. However, specific aspects could be refined further to provide even more realistic results.
• Despite exploring different options and deriving an approximate estimate, the present study was not able to definitively resolve the issue of the relative shares between the civil aerospace and defence sectors in most official data sources. Given the importance for deriving accurate performance measures of the civil aerospace sector (which the ATI programme aims to support), this warrants further research / analytical work.
• The study sets out clearly the recommendations for the core methods to be used in the evaluation of the ATI programme. The precise scale and frequency of data collection (in particular for surveys and case studies) will need to be determined, partly dependent on the resources available. In addition, BIS, in conjunction with partners, may wish to come to a view on how far additional methods are adopted, such as country comparisons, surveys of non-lead partners and surveys of unsuccessful applications. These approaches would not change the fundamental methodology that has been recommended; rather they may offer different perspectives that could be used to add to the evidence that will inform the assessment of the contribution of the ATI to the outcomes achieved.
v

1. Introduction In December 2014, the Department for Business Innovation and Skills (BIS) commissioned SQW and Cambridge Econometrics (CE) to carry out a scoping study to establish baselines, monitoring systems and evaluation methodologies for the Aerospace Technology Institute (ATI). The focus of the evaluation is to be the over £1bn of grant funding for aerospace R&T and infrastructure projects for which the ATI is to provide strategic oversight (hereinafter referred to as the ATI programme), rather than the ATI as an institution. This report presents the results of this work.
The proposed approach and framework for conducting an impact and economic evaluation of the ATI programme takes into account the nature and design of the programme and the structure of the UK aerospace sector, and the various challenges and opportunities arising from this. In essence, we believe that the most appropriate approach to arrive at the most robust evaluation results is a mixed-methods approach that combines a review and analysis of key sector performance data (‘top-down’ approach) with methods to engage beneficiaries and collect and analyse data on the outcomes generated by individual ATI-funded projects (‘bottom-up’ approach).
The report is structured as follows:
• Chapter 2 introduces the key features of the ATI programme, its design, activities, beneficiaries and expected results, based on an analysis of its intervention logic, and thereby prepares the ground for the discussion of the key aspects of monitoring and evaluation that follow.
• Chapter 3 introduces the indicators (including Key Performance Indicators, KPIs) that will need to be taken into account in monitoring and evaluating the ATI programme.
• Chapter 4 describes key aspects of the baseline, including scenarios for projecting the future performance of the UK aerospace sector without ATI support.
• Chapter 5 presents the proposed evaluation approach and framework, including an overview of recommended evaluation methods and tools, as well as the role of monitoring systems in supporting evaluation.
• Chapter 6 outlines recommendations for BIS and other stakeholders to operationalise the proposed evaluation approach.
A series of supporting Annexes provide further detail. The main body of the report provides a succinct overview of the results of the study, with the Annexed material containing further detail on the intervention logic, baseline, justification and discussion on data sources, and information that will help to operationalise monitoring and evaluation.
1

2. Evaluation subject and context The Aerospace Technology Institute (ATI) was created as part of the coalition government’s industrial strategy, which targets aerospace as one of the priority sectors.1 It was incorporated in September 2013, and its management team began its work in September 2014. The ATI is a virtual centre of academics and industry experts, supported by a small team of staff, to drive the UK’s intellectual leadership in aerodynamics, propulsion, aerostructures and advanced systems. One of the ATI’s key responsibilities is to provide strategic oversight on a portfolio of collaborative research and technology (R&T)2 and infrastructure projects that are co-funded by government, and help decide (in collaboration with BIS and Innovate UK) how these funds are spent.
The focus of this study was to scope out options for an impact and economic evaluation of the project portfolio that the ATI is responsible for and which the government has pledged to support with £150 million per annum of grant funding for seven years. Hereinafter, the R&T and infrastructure grant support scheme is referred to as the “ATI programme”. Its key features are briefly summarised in the remainder of this chapter, in order to provide the context for the remainder of the study in terms of key opportunities and challenges for monitoring and evaluation.
2.1. ATI programme features: a summary of the intervention logic
The ATI programme, the principal focus of this study, is a complex mix of R&T and capital infrastructure projects. This is reflected in the intervention logic that has been developed and refined as part of this study. A summary is presented overleaf in Figure 2 1. It provides a depiction of the logical relationships between the activities, outputs and outcomes of the ATI programme. It presents the desired effects of the programme, a summary of the causal relationships between them, and the main underlying assumptions driving them (termed ‘internal drivers’ and ‘external factors’). Each aspect of the intervention logic is discussed briefly in the sections which follow. A more detailed account is presented in Annex A.
The intervention logic provided the basis for developing a coherent monitoring and evaluation framework in two key ways. First, it has informed identification of indicators for monitoring and assessing the performance of the programme (see Chapter 3). Second, it has been used to outline the main features of the ATI programme and in doing so frame the key evaluation challenges and questions (see Chapter 5).
1 HM Government and Aerospace Growth Partnership: Lifting Off: Implementing the Strategic Vision for UK Aerospace, 2013
2 We note that a distinction is sometimes made between research & development (R&D) and research and technology (R&T), with R&D typically referring to more fundamental research at the lower technology readiness levels (TLR 1-3), while R&T refers to research on technologies that are closer to commercialisation. Since the ATI-funded projects will focus on TLRs 4-6, we have chosen to use the term R&T throughout this report, expect where other considerations mean this would be inappropriate.
2

Figure 2-1: ATI Intervention Logic Summary
Source: SQW analysis based on documentation review and stakeholder consultation
3

2.1.1. ATI programme activities and policy delivery The ATI programme will provide £1.05bn of funding for aerospace R&T projects over the seven year period to 2020. Industry has pledged to match the government funding, bringing total investment to approximately £2.1bn. The portfolio of ATI funded projects varies substantially. To illustrate this heterogeneity, at the programme level – and for the purposes of the evaluation – projects are classified in three main ways. These are outlined below and presented in Figure 2-2.
• Different time horizons (sometimes expressed in terms of the ‘SEP’ Model – i.e. Secure, Exploit and Position3) – broadly described by market alignment in terms of addressing opportunities in the shorter, medium or longer term
• Four Priority Value Areas: whole aircraft, structures, propulsion and systems
• Five Enabling Technologies and Capabilities: aerodynamics, manufacturing, materials, technology infrastructure, and process and tools.
Figure 2-2: The ATI Market aligned technology strategy – overview
Source: Building Momentum for UK Aerospace: ATI 2015
3 Note the aerospace industrial strategy set out a ‘PEP (Protect, Exploit and Position)’ model as a strategy for identifying and prioritising the actions needed to support the delivery of the Aerospace Industrial Strategy and capture the opportunities for short, medium and long term growth. This model was renamed to ‘SEP’ (Secure, Exploit and Position) in the final ATI Technology Strategy, in response to feedback from stakeholders.
4

The market alignment classification is important in terms of evaluation, particularly due to its implications vis-à-vis timeframes to impact. In line with the ‘SEP’ model introduced in the aerospace industrial strategy, ATI-funded projects can be divided into three categories for the purposes of evaluation:
• Secure (0-5 years): Collaborative research and technology developments in which the UK could potentially lose part of the value chain. This is particularly in relation to the next wave of airframe refits, which are experiencing significant global competition for parts. Such projects are expected to deliver (economic) returns relatively soon after the initial investment.
• Exploit (Up to 2025): Collaborative research and technology developments looking to exploit the next wave of refits which will provide “early wins” in the incremental stage of product development. Such projects are expected to take longer to deliver returns.
• Position (Beyond 2025): Collaborative research and technology projects aiming to make the UK well placed in terms of technological capability to compete for parts on “next generation aircraft”. It is likely that this will involve the major aerospace companies launching long term demonstrator projects that will involve the supply chain and the research base to develop “blue sky” technologies. Such projects are not expected to deliver economic returns until well into the next decade.
The three categories above reflect the ‘juncture’ of the aerospace sector. While the next generation of aircraft are likely to be over twenty years away from entering service, there are current airframes that require more immediate technological upgrades, particularly in the narrow body market.
Of the five Enabling Technologies and Capabilities, it is worth noting that the investment in technology infrastructure is relatively stand alone. Up to 20% of ATI funding is to be allocated to capital infrastructure projects to build or upgrade testing facilities or equipment required for the development of new aerospace technologies. Once completed, this infrastructure may then be used by subsequent R&T projects (whether ATI-funded or not). The outcomes generated by these projects, therefore, are expected to be slightly different and are discussed briefly in the sub-sections below.
The policy delivery mechanism is also important in the context of evaluation. The ATI is delivered through two main project design and selection processes. It is expected that the majority of grant funding will be awarded to projects via a ‘stage-gate’ process, in which the ATI plays an active role in helping to develop, filter and eventually select projects. In addition, at least one open competition for project funding is planned per year; this is expected to account for approximately £25 million of grant funding per annum.
2.1.2. ATI programme beneficiaries As part of establishing the baseline for the programme (see Annex B), a review has been carried out as part of this study of a series of 51 projects launched during the first two years of the ATI’s existence (2013-2014), with a total grant amount of £236.1 million. Although these projects only represent a ‘snapshot’ (based on what data was available from the Innovate UK public website at the time the analysis was undertaken), they
5

provide an early indication of the types of projects and beneficiaries that are likely to receive ATI support over the seven year period (although there may of course be changes as the ATI plays an increasingly active role in designing and selecting projects). The basic characteristics of these early ATI projects are shown in Table 2-1.
Table 2-1: Basic Characteristics of ‘early’ ATI projects
Metric ‘Early’ ATI projects
Number of projects 51
Avg. government grant (£ million) 4.63
Avg. duration (in months) 31
Avg. number of partners 4.4
Source: SQW based on data extracted by BIS from Innovate UK website
The size of grants for projects ranged from a little over £500,000 for the smallest projects, to over £15 million for the largest one. On average, each project received a little over £4.5 million of government funding. The duration of projects ranged from eight to 47 months, with an average of a little less than three years. Although a few projects involved funding for only one beneficiary, the vast majority were collaborative, involving up to a maximum of 13 partners.
The R&T projects funded by the ATI involved companies ranging from multinationals such as Rolls Royce, to SMEs and the research base. In interpreting the participation patterns, it is important to keep in mind the structure of the UK’s aerospace sector, which broadly reflects the characteristics of the global aerospace industry. Among the approx. 3,000 companies from across all regions of the UK that are considered to form part of the sector, there are only a very small number of ‘Primes’ (or Original Equipment Manufacturers – OEMs) that engage in the design and assembly of complete sections of aircraft (e.g. engine and propulsion systems in the case of Rolls-Royce). Underneath these in the supply chain – sit a much larger number of companies – including many SMEs – that specialise in the assembly and/or manufacture of sub-sections or individual components thereof, and are usually thought of as pertaining to different ‘Tiers’.4
Our analysis of the available data showed that, of the 51 ‘early’ ATI projects, approximately 65% involved at least one SME, 88% of projects involved at least one large company and 73% involved at least one partner from the research base. In around 80% of cases, the lead partner was a large company, while SMEs played the lead role in around 20% of projects (research institutions typically do not lead projects). A breakdown of the average funding and % of total grant provided for each partner is provided in Table 2-2.
4 For more detail on the structure of the UK aerospace sector see for example KPMG: The Future of Civil Aerospace, 2013
6

Table 2-2: ‘Early’ ATI projects: Involvement of partners by type
Type of partner5 Avg. no. of partners per project
Avg. funding for organisations of this type per project
% of total grant funding
% of projects containing at least one listed partner type
Large companies 1.7 £3,143,000 68% 88%
SMEs 0.8 £353,000 8% 65%
Medium companies 0.3 £183,000 4% 27%
Small companies 0.5 £165,000 4% 31%
Micro companies 0.1 £5,000 0% 6%
Research base 1.8 £1,134,000 25% 73%
Total 4.4 £4,630,000 100% n/a
Source: SQW based on data extracted by BIS from the Innovate UK website
NB: Amounts rounded to the nearest thousand/ percentage point. Figures may not add up to 100% due to rounding.
Assuming that these numbers will remain similar over the duration of the ATI programme, we can make some estimates as to the likely make-up and evolution of the project portfolio over the seven years of the initial government commitment. Thus, the ATI would be able to support approximately 33 projects per year, each with a grant of £4.5 million. Based on an average duration of three years and the programme’s start in 2013/14, the evolution of the portfolio, in terms of ongoing and finalised projects, would be roughly as shown in Figure 2-3. This is of course a simplified vision, but it provides a useful approximation of the universe of projects that can be evaluated at different points in time, and so helps to inform evaluation planning.
In total we would expect the ATI programme to fund approximately 200 to 250 discrete projects over the seven years of its existence (and since projects are selected in a staggered way, we would expect some projects to finish after the seven-year period). Based on an average of 4.4 partners per project, and ignoring duplication at this stage (see the next paragraph), we expect there to be a total universe of individual project beneficiaries of around 1,000 (including approx. 400 large firms, 200 SMEs, and 400 research institutions).
The actual number of unique beneficiaries will be much lower, since many beneficiaries (in particular large companies and research institutions) are involved in multiple projects.6
Based on the trends apparent in the 51 ‘early ATI’ projects (see Table 2-3), we would assume that the number of unique beneficiaries is likely to be around 200 to 250. This is
5 The classification adopted by Innovate UK is used here. They presumably relate to standard ONS definitions. 6 Note that in some cases, different units / departments within a larger company are involved in different projects. Such sub-entities are not considered ‘unique’ for the purpose of these analyses / estimates.
7

Figure 2-3: Indicative evolution of the ATI project portfolio over time
Source: SQW estimates based on average values for 51 ‘early ATI’ projects
only an approximate estimate (based on the assumption that most relevant large aerospace companies and research institutions will have already been involved in the first wave of ATI projects), but it clearly highlights the important issue of the involvement of the same beneficiaries in multiple projects.
Table 2-3: Estimated total and unique beneficiaries of the ATI programme
‘Early ATI’ projects Est. totals for entire ATI programme
Beneficiary category
Total beneficiaries
Unique beneficiaries
Total beneficiaries
Unique beneficiaries
Large companies 88 37 400 40-50
SMEs 42 38 200 120-150
Research base 93 30 400 40-50
Total 223 105 1,000 200-250
Source: SQW
In summary, both the types of projects funded by the ATI and the range of beneficiaries involved are far from homogenous: they will typically involve different (in some cases very long) timescales to deliver impact; they will concern different (sub) parts of the aircraft; some will involve capital infrastructure investment; some will involve the supply chain, SMEs and the research base more than others; and some beneficiaries (in particular larger companies) will be involved in more than one ATI funded R&T project at any one
8
time. Comparing the estimates above with the number of companies in the sector as a whole7 also suggests that very few (if any) large or medium-sized aerospace companies in the UK will not benefit at all from the ATI programme.
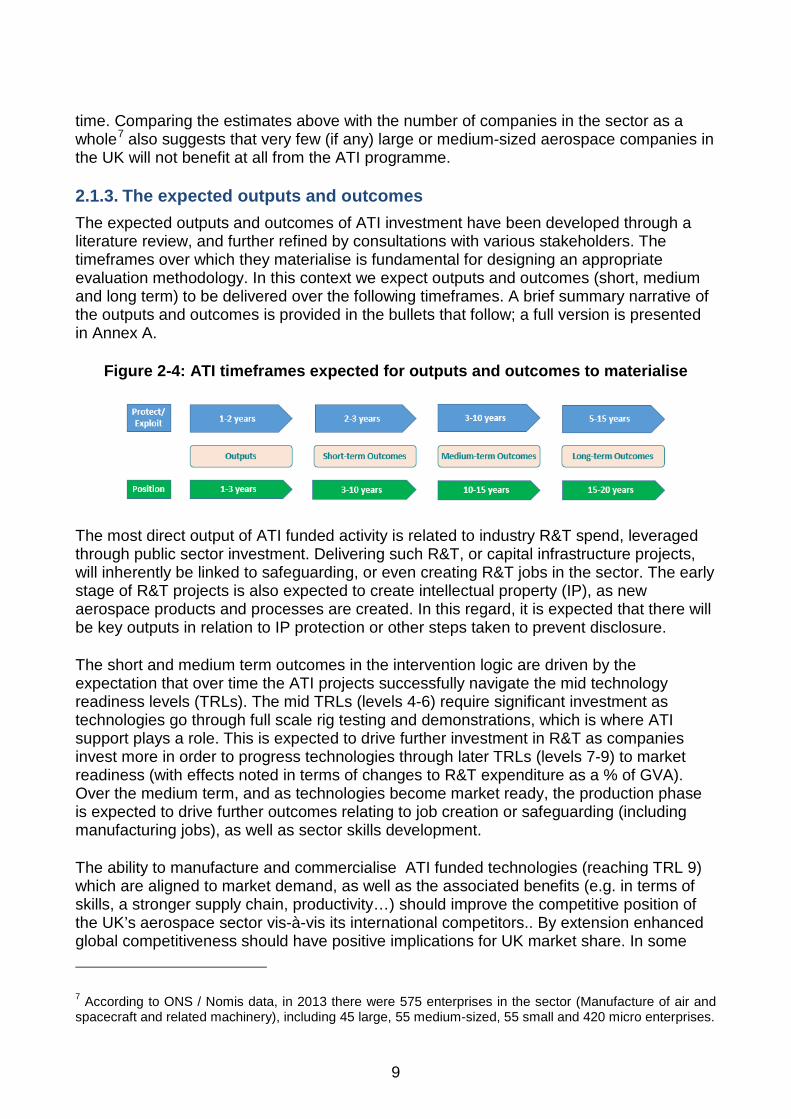
2.1.3. The expected outputs and outcomes The expected outputs and outcomes of ATI investment have been developed through a literature review, and further refined by consultations with various stakeholders. The timeframes over which they materialise is fundamental for designing an appropriate evaluation methodology. In this context we expect outputs and outcomes (short, medium and long term) to be delivered over the following timeframes. A brief summary narrative of the outputs and outcomes is provided in the bullets that follow; a full version is presented in Annex A.
Figure 2-4: ATI timeframes expected for outputs and outcomes to materialise
The most direct output of ATI funded activity is related to industry R&T spend, leveraged through public sector investment. Delivering such R&T, or capital infrastructure projects, will inherently be linked to safeguarding, or even creating R&T jobs in the sector. The early stage of R&T projects is also expected to create intellectual property (IP), as new aerospace products and processes are created. In this regard, it is expected that there will be key outputs in relation to IP protection or other steps taken to prevent disclosure.
The short and medium term outcomes in the intervention logic are driven by the expectation that over time the ATI projects successfully navigate the mid technology readiness levels (TRLs). The mid TRLs (levels 4-6) require significant investment as technologies go through full scale rig testing and demonstrations, which is where ATI support plays a role. This is expected to drive further investment in R&T as companies invest more in order to progress technologies through later TRLs (levels 7-9) to market readiness (with effects noted in terms of changes to R&T expenditure as a % of GVA). Over the medium term, and as technologies become market ready, the production phase is expected to drive further outcomes relating to job creation or safeguarding (including manufacturing jobs), as well as sector skills development.
The ability to manufacture and commercialise ATI funded technologies (reaching TRL 9) which are aligned to market demand, as well as the associated benefits (e.g. in terms of skills, a stronger supply chain, productivity…) should improve the competitive position of the UK’s aerospace sector vis-à-vis its international competitors.. By extension enhanced global competitiveness should have positive implications for UK market share. In some
7 According to ONS / Nomis data, in 2013 there were 575 enterprises in the sector (Manufacture of air and spacecraft and related machinery), including 45 large, 55 medium-sized, 55 small and 420 micro enterprises.
9

instances, we might expect the technology development phase to lead to spillovers, whether this be within the sector (e.g. through the supply chain or through replication) or to other sectors (if technologies can be applied in other settings). Once operational, technologies are expected to deliver efficiency, environmental and service improvements for aircraft. This might include noise reduction8, reduced fuel burn or enhanced customer experience.
2.1.4. The ‘internal drivers’ and external factors During the development of the ATI intervention logic, a number of internal and external factors have been identified which could have a material effect on some of the outcomes identified in the intervention logic. As such, they play a fundamental role in the underlying theory of change and therefore have implications for the evaluation.
The ATI is expected to change the landscape for government-funded R&T in aerospace (and thereby drive impact) in three inter-related ways. These are: a) more funding, b) more certainty, and c) ‘better’ projects. At the most basic level, the government’s announcement to provide £150m per year represents a significant increase in the amount of support relative to recent years. Its seven year commitment also provided long-term certainty for the industry required for such long-term investments (although two years into the programme, the level of certainty is already falling until further spending decisions are taken). The ATI’s role in strategically prioritising ATI projects that are market aligned to the priorities outlined in its Strategy is also important, as it is expected to generate added value by directing funding towards more relevant and higher quality projects. This last driver (‘better’ projects) is only expected to have an effect in practice from 2015 onwards, when the ATI is fully operational
There are also a good number of external factors which might drive changes identified in the intervention logic. In evaluation terms these represent ‘background noise’ which must be accounted for, whether quantitatively or qualitatively, to attribute change to ATI investment. They include: the range of other R&T projects that companies are investing in already; the UK programme not being significantly ‘out-bid’ elsewhere; that the sector skills base is able to keep pace with demand; that the quality of EPSRC funded projects remains similar so early stage R&T projects remain of similar quality over time; that the consolidation of the UK supply chain continues; that exchange rates remain broadly stable; and that global demand for air travel and current sector competition remains on its current trajectory.
2.2. Summary
As the brief overview of the programme presented in this Chapter shows, the ATI programme is an example of an intervention that is both complicated (i.e. multiple agencies and causal strands) and complex (i.e. with emergent, potentially non-linear and/or disproportionate outcomes).9 Over the seven years of its existence, the ATI programme is expected to fund approximately 200 to 250 discrete projects, and thereby
8 Although some fuel efficiency technologies may lead to increases in noise. 9 Cp. Rogers P: Using Programme Theory to Evaluate Complicated and Complex Aspects of Interventions. Evaluation, Vol. 14(1): 29 – 48, 2008
10

support around the same number of unique beneficiaries, many of whom (especially the large companies) will take part in multiple projects. The ultimate desired impact – increased competitiveness and market share for the UK aerospace sector (as well as spillovers to other sectors and wider economic, social and environmental benefits) – will take 15 or more years to fully materialise, although there are a number of intermediate outcomes that should be observable sooner. The creation of the ATI and the associated budget commitment should drive impact by providing more government funding than in recent years, greater planning certainty over a longer period of time, and a more strategic approach to how the available funds are invested. On the other hand, a number of external factors and imponderables (including possible changes in global demand) have the potential to significantly affect the UK sector’s performance and related outcomes.
Key challenges for the evaluation include the frequently long timeframes to impact and the many confounding factors that make attribution of observed effects to the ATI-funded R&T difficult. Furthermore, the nature of the aerospace sector (with relatively few large companies, most or all of which are expected to receive some ATI funding) means a control group of similar non-beneficiaries does not exist. The problem is further exacerbated by the project selection process (which in most cases is a staged process involving a Strategic Review Committee, with only a small proportion of the funding allocated via genuinely open competitions, and therefore a limited pool of unsuccessful project applications). Both of these factors mean that the companies that do not take part are likely to be fundamentally ‘different’ from those that do. The nature and design of the programme, coupled with the characteristics of the sector, therefore pose a number of challenges to evaluation, in particular to “empirical impact evaluation” (as defined by the Magenta Book as evaluation that provides a quantitative measure of the impact of an intervention by isolating the effect of a policy from other factors affecting the outcome through use of statistical and/or econometric analysis). These challenges and proposed solutions are further discussed in Chapter 5.
11

3. Key Performance Indicators for the ATI programme
One of the basic building blocks of any monitoring and evaluation system is a set of relevant indicators to track and measure performance. This chapter presents such indicators for the ATI programme. These correspond with the activities and desired results contained in the ATI programme’s intervention logic developed as part of the study (see Annex A). From this, we derived a relatively long list of indicators, which were subsequently reviewed, prioritised and structured with a view to their relevance and importance (i.e. how critical are they to assessing performance) as well as practical considerations (especially in terms of data availability and quality).
The result of this process was the identification of three separate sets of indicators, each with a different purpose:
• Key Performance Indicators (KPIs) (Table 3-1): A limited number of metrics related to those results that are most relevant and significant in assessing the overall performance of the ATI programme. These are the indicators that should be included in a KPI ‘scorecard’, to be tracked on a regular (e.g. annual) basis. The criteria we applied for selecting indicators as KPIs were as follows:
o It should be clear and unambiguous if an increase (or decrease) in the indicator represents improved performance relevant to the ATI programme (even if attribution is not guaranteed).
o For the sake of the scorecard’s presentation, the selection is restricted to quantifiable indicators. Non-quantifiable indicators would need to be included as part of wider narrative and interpretation in evaluation work.
o There needs to be a clear source, which can be monitoring, evaluation or secondary sources, and the source must be reliable.
• Supplementary performance indicators (Table 3-2): It is important to note that whilst some results-related indicators may not be recommended as KPIs for an overall ‘scorecard’ on the performance of the ATI programme, they can nonetheless be important for understanding particular aspects of the ATI programme’s performance, context and functioning. These indicators are presented in a separate list; they are of lower priority than the KPIs, but should still be duly considered in monitoring and/or evaluation, and indeed provide critical data to inform the interpretation of evaluation findings.
• Portfolio indicators (Table 3-3): These provide important information about the types of projects funded and the composition of the portfolio that the ATI is responsible for, e.g. in terms of the number and size of projects, the partners that are involved, the themes and expected timeframes to impacts. They do not relate to the ATI programme’s performance as such, but provide input for the ongoing
12

management of the portfolio, as well as information to inform and facilitate eventual evaluation activities (such as the sample selection for case studies).
In the tables below, we present the three sets of indicators, and provide further commentary on each of them. It is worth highlighting the following key issues:
• The tables distinguish between two levels of analysis: individual ATI-funded R&T projects on the one hand (representing a ‘bottom-up’ approach to evaluation that attempts to understand how projects lead to results, primarily at the lower levels of the logic chain), and the UK aerospace sector (corresponding to a ‘top-down’ evaluation approach, focusing on how the ATI programme, the projects it funds and their results affect the sector as a whole). There is some overlap between the two levels, as a few indicators will have to be considered from both a project and sector perspective.
• The lists also provide an indication of the relevant data sources for each indicator – usually this will be monitoring and/or evaluative research for the project-level indicators, and secondary sources for the sector-level indicators. More details on specific sources are provided in Annex H (for monitoring), chapter 5 and Annex G (for evaluative research), and chapter 4 and Annexes C and D (for sector-level data).
• Many sector-level KPIs are expected to form part of the baseline as well as the model to forecast future performance (see chapter 4). We have gone to considerable length to explore different possible data sources and their limitations. What is proposed and presented in chapter 4 is based on data from what we consider to be the most appropriate sources, with the justifications for these more fully laid out in Annex C.
13

Table 3-1: Key Performance Indicators for the ATI programme
Type # Indicator Level of analysis
Likely sources Commentary
Short-term outcomes
K1 Projects progressing through TRLs 4-6
Project Monitoring / Evaluative research
Key indicator of project progress. Starting point and target levels to be defined at project outset, and progress to be verified as part of regular monitoring (at least annually and at project completion). May need to assess as part of evaluation for projects launched before updated monitoring framework is implemented.
K2 Inward investment in aerospace R&T10
Sector Secondary sources Meant to explore to what extent international corporations see the UK as a (more) attractive location for their R&T; data sources to be clarified11
K3 Aerospace R&T jobs Project Monitoring / Evaluative research
Key to assessing employment effects at the first level (R&T itself). Data on direct jobs created / safeguarded by projects to be collected as part of monitoring, and assessed as part of evaluation.
K4 R&T expenditure (in absolute and relative terms, e.g. % of turnover / GVA)
Sector Secondary sources Indicator of research-intensity of UK activity; where available, will have to use R&D (rather than R&T) data
Medium-term outcomes
K5 Projects / technologies reaching TRLs 7-9
Project Evaluative research Key indicator of project success in terms of reaching commercialisation stages, but will usually only happen following project completion. Should be incorporated into evaluation
10 Although in the context of the ATI’s activity it may be preferable to refer to R&T, secondary sources will almost invariably contain data for R&D only. We may therefore need to consider changing most or all references to R&T in this table to R&D. 11 A possible source for this is a Eurostat database for ‘business enterprise R&D expenditure by economic activity and source of funds, which identifies ‘abroad’ as one of the sources (data may come from a UK dataset and therefore be available somewhere on ONS), although data look to be available only for 2009-12. This would provide information on very recent performance/trend, but not on the longer historical trend.
14

Type # Indicator Level of analysis
Likely sources Commentary
K6 New orders (and associated turnover)
Project / Sector Evaluative research / Secondary sources
Orders that can be linked to the R&T will be an important indicator of project success and to be estimated through evaluation; but comprehensive sector data may not be available through secondary sources - propose to use (revenue from) deliveries instead (i.e. turnover/output).
K7 Exports Sector Secondary sources Important indicator of sector performance, since the vast majority of output is exported. Key component of the baseline and forward-looking projections
K8 Gross Value Added Project / Sector Evaluative research / Secondary sources
Key measure of sector performance; relevant as both a ‘medium-term’ and ‘long-term’ outcome reflecting the varying timescales to impact for ATI projects. Performance to be tracked for the sector as a whole, as well as GVA effects evaluated for project beneficiaries – deriving this from turnover outcomes (K6) and/or jobs (K3).
Long-term outcomes
K9 High-value jobs in the UK Aerospace sector
Sector Secondary sources Rather than focus on R&T (K3) vs manufacturing (S8), this KPI looks at employment overall and by value in terms of occupations and/or wages. Should be assessed for the sector as a whole.
K10 UK share of global aerospace manufacturing and of OEMs
Sector Secondary sources For an estimate of UK share of global market, see chapter 4 of this report (though note there are significant challenges in arriving at this, as described in Annex C)
Source: SQW
15

Table 3-2: Supplementary performance indicators for the ATI programme
Type # Indicator Level of analysis
Likely sources Commentary
Outputs S1 EU / international R&T funding obtained
Project Monitoring / Secondary sources
Relevant to assessing the ATI’s wider role. To be checked as part of monitoring for each project, plus data on evolution of total UK funding from EU / other relevant international programmes to be tracked.
S2 Intellectual property developed (including patents)
Project Evaluative research Patents are not a perfect indicator of IP; systematic monitoring would add little value. Instead, evaluations to check IP / knowledge development more generally.
S3 R&T infrastructure created Project Monitoring To verify the actual outputs of capital infrastructure projects
Short-term outcomes
S4 Subsequent industry aerospace R&T expenditure
Project Evaluative research This relates to the extent to which ATI co-funded projects demonstrably lead to follow-up R&T investment by the private sector – and important in bridging to interpreting changes in sector R&T investment
S5 Skills of aerospace labour force
Project Monitoring / Evaluative research
Important for evaluative research to consider skills implications of projects (data to be collected via monitoring and evaluation), but likely to be impossible to detect effects at sector level
S6 Use of new / upgraded R&T infrastructure
Project Evaluative research Relates to use of ATI-funded infrastructure (see indicators P2 and S3); evaluation should not only assess ‘take-up/use’, but also explore ‘value/utility’
Medium-term outcomes
S7 Import intensity of exports Sector Secondary sources Useful to measure, as a decline in import intensity would indicate a stronger UK supply chain
S8 Aerospace manufacturing jobs Project Evaluative research Important to understand if and how research activity leads to safeguarding / increasing manufacturing activity in the UK (and potentially related activities such as servicing, operations, etc.). Data on such indirect jobs created / safeguarded at project level to be collected as part of evaluation.
16

Type # Indicator Level of analysis
Likely sources Commentary
S9 GVA in the supply chain Project / Sector
Evaluative research / Secondary sources
Potentially useful as a supplement to indicator K8, but use of secondary sources would require clear mapping of supply chain and the use of business databases. Evaluative research could be used as an alternative, especially if as part of a case study based approach
S10 Stronger supply chains in the UK
Project Evaluative research Aims at a qualitative assessment of supply chain development; particularly useful given challenges in quantitative measures under previous indicator
S11 Further collaboration between aerospace businesses, supply chain, and research base
Project Evaluative research Useful for evaluative research to follow-up on sustainability of relationships forged via ATI projects
Long-term outcomes
S12 Reduction in cost and time taken to commercialise innovations
Project Evaluative research Relevant indicator of the commercial success of research, but would have to rely on case study research / self-reporting
S13 Increased UK competitiveness Project / Sector
Evaluative research / Secondary sources
Performance metrics such as capital expenditure, labour productivity, profitability, etc. could be measured and used as indicators of competitiveness
S14 Proportion of “flying technologies” developed in the UK
Project Evaluative research Potential to add value alongside KPI relating to market share (K10), but probably not measurable comprehensively across the board, so will have to rely on case study or other evaluative research
S15 Safer, more efficient and environmentally friendly aircraft
Sector Evaluative research / Secondary sources
Concrete improvements in terms of fuel efficiency, emissions etc. resulting from technology developed with ATI support should be investigated and recorded by future evaluation, but need to be conscious of the many other intervening factors
S16 Spillovers, especially into other sectors
Project Evaluative research This is a key objective, but assessment is likely to be based on case study evidence and not quantifiable
Context S17 Sector structure, e.g. business demography, regional profiles
Sector Secondary sources It is not an objective of the ATI programme to affect the sector’s structure, although it would be useful to explore for context and possible unintended effects
Source: SQW
17

Table 3-3: Portfolio indicators for the ATI programme
Type # Indicator Level of analysis
Likely sources Commentary
Activities P1 Number of collaborative research projects (and corresponding grant funding)
Project Monitoring Indicator to track how ATI programme funds are spent. In principle, 80% of the funding is earmarked for collaborative R&T
P2 Number of capital infrastructure projects (and corresponding grant funding)
Project Monitoring As above. In principle, up to 20% of the funds are to be spent on infrastructure projects
P3 Private R&T spend on ATI co-funded projects
Project Monitoring Projects should be match-funded by industry, need to understand if this is the case in practice. Planned spend can easily be assessed at the project outset; actual private spend may evolve over the course of projects, but this is hard to track.
P4 Projects and grant funding broken down by themes
Project Monitoring Could be broken down according to the “priority aircraft value streams” and “enabling technologies and capabilities” defined by the ATI
P5 Projects and grant funding broken down by expected timescales to impact
Project Monitoring Could be broken down according to the SEP model (Secure, Exploit, Position) set out in the aerospace industrial strategy
P6 Number of demonstrator projects launched
Project Monitoring Relates to a particular type of R&T project
P7 SMEs / companies in the supply chain involved in projects
Project Monitoring ATI expected to lead to greater involvement of SMEs (in terms of numbers participating and amounts / proportion of the total grant amounts); data is already being collected as part of project monitoring
P8 Research base (universities, Catapults, RTOs) involved in projects
Project Monitoring ATI expected to lead to greater involvement and collaboration with the research base; data is already being collected as part of project monitoring
P9 TRLs at project start and target TRLs at completion
Project Monitoring Would be useful to systematically capture the starting and desired end point in terms of TRLs for all R&T projects (with a view to monitoring progress – see indicators K1 and K5)
Source: SQW
18

4. Setting the Baseline In order to measure and interpret the effects of the ATI programme, it is important to understand the situation at the outset, i.e. before the launch of the programme. For this purpose, we have reviewed data from a number of sources to develop a baseline at both project level (what were the key characteristics of aerospace R&T projects funded before the ATI programme?) and at sector level (how did the UK aerospace sector perform before the launch of the ATI programme?). Headline results for both levels are presented in this chapter, while more detailed accounts, including a discussion of the data sources that were used and possible alternatives, are provided in Annexes B, C and D.
Due to the challenges around identifying / constructing a suitable counterfactual (i.e. a control group to compare with ATI programme beneficiaries to detect differences between the two that could be attributed to the programme; for details see Chapter 5), the study also set out to develop a quantitative model to forecast how the sector’s performance would be likely to evolve without ATI support. The results derived from the model could be used as a forward-looking baseline (or ‘pseudo-counterfactual’) to compare with the actual sector performance, thereby providing an indication of the potential impact of the ATI programme. A brief summary overview of the model and key results that it generated are also provided in this chapter (with further details contained in Annex F).
4.1. The baseline at project level
One of the issues a future evaluation of the ATI programme will have to consider is if and how ATI-funded projects differ from the aerospace R&T projects that were funded by government before the ATI was created. To test a potential baseline of pre-ATI projects, we have analysed data on a number of relevant BIS-funded (and TSB / Innovate UK-managed) R&T schemes and projects launched between 2005 and 2013. Data on projects within these schemes were sourced from Innovate UK’s public website.12 The schemes included in the analysis are listed in Annex B. In total, the analysis included 94 pre-ATI projects from 14 different schemes. It is important to emphasise that this analysis was for illustrative purposes only, and to inform our evaluation framework. It represents a sample rather than the totality of aerospace R&D funding pre-ATI; while the sample size was sufficient to identify key features of ‘typical’ projects and beneficiaries, the sums (in terms of total grant funding across projects) are not accurate, and should not be taken as a true reflection of the level of government support for the sector.
The mean average government funding was just under £3.2 million per project. The average duration of these projects was 36 months. On average, projects involved between four and five partners. An important question for future evaluation is the extent to which ATI projects are more “inclusive” than similar projects in the past, i.e. successfully involve the supply chain (in particular SMEs) and/or the research base. As shown in Table 4-1 below, slightly over one-third of the projects launched in the years prior to the creation of the ATI involved an SME, and these received 3% of the grant funding, while 65% went to
12 https://www.gov.uk/government/publications/innovate-uk-funded-projects NB: the Aerospace projects are coded within the ‘Transport’ or ‘Large’ categories).
19

large firms (in particular Rolls-Royce and Airbus). The remaining 32% was for the research base, which included academic institutions, research and technology organisations (RTOs) and Catapult centres.13
Table 4-1: Pre-ATI projects: Involvement of partners by type
Type of partner Avg. no. of partners per project
Avg. funding for organisations of this type per project
% of total grant funding
% of projects containing at least one listed partner type
Large companies 2.0 £2,072,000 65% 97%
SMEs 0.5 £97,000 3% 38%
Medium companies 0.2 £48,000 1% 15%
Small companies 0.3 £40,000 1% 20%
Micro companies 0.0 £9,000 0% 3%
Research base 1.9 £1,013,000 32% 82%
Total 4.4 £3,182,000 100% n/a
Source: SQW based on data extracted by BIS from the Innovate UK website
NB: Amounts rounded to the nearest thousand/ percentage point. Figures may not add up to 100% due to rounding.
We have also sought to explore the main themes addressed by the projects, by categorising them according to the ATI’s ‘priority aircraft value streams’ (whole aircraft, structures, propulsion, and systems) and ‘enabling technologies and capabilities’ (aerodynamics, manufacturing, materials, technology infrastructure, and process & tools).14 The results of this process suggest that the majority of pre-ATI projects focused on the value streams of propulsion and systems. However, when considering the proportion of total funding dedicated to each category, it appears that ‘systems’ projects, although numerous, were typically relatively small in size (Table 4-2)
13 The classification of beneficiaries is according to the Innovate UK’s categorisation, with one significant exception: the Aircraft Research Association (ARA) and the Manufacturing Technology Centre (MTC) were re-classified from medium enterprises to being part of the research base. For more on this please see Annex B. 14 The classification by themes was undertaken by an aerospace expert based on the public descriptions. For more details on the approach please see Annex B.
20
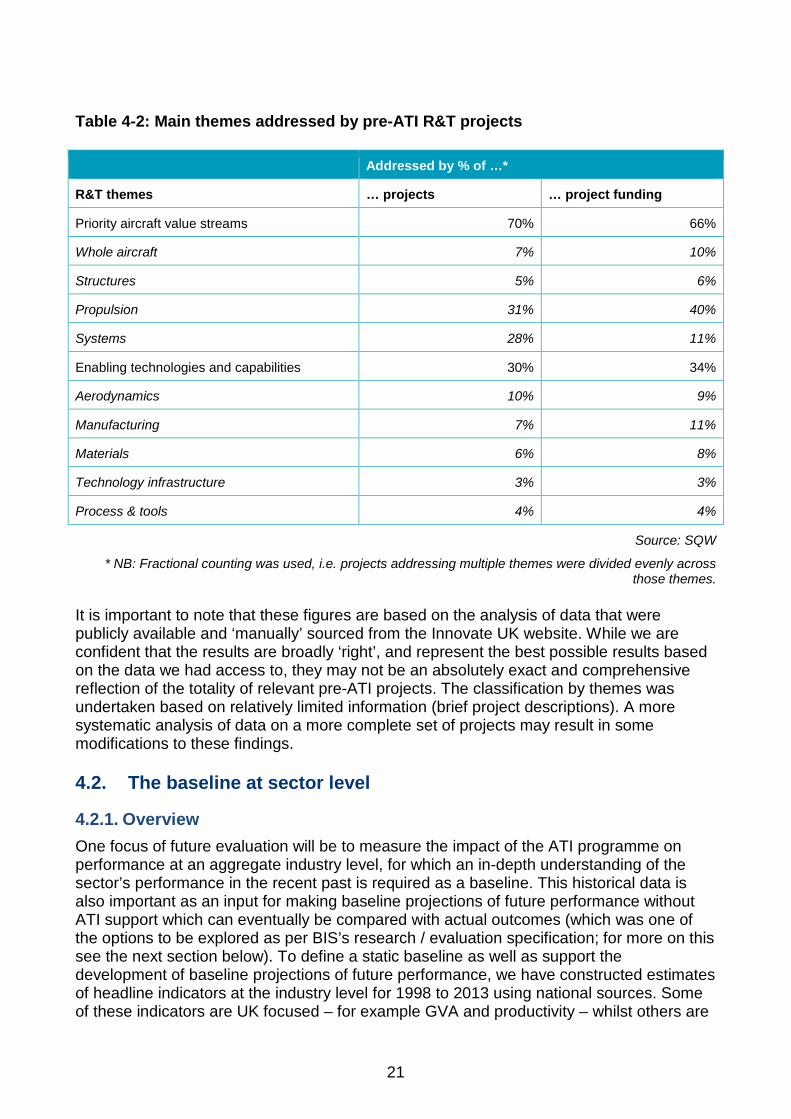
Table 4-2: Main themes addressed by pre-ATI R&T projects
Addressed by % of …*
R&T themes … projects … project funding
Priority aircraft value streams 70% 66%
Whole aircraft 7% 10%
Structures 5% 6%
Propulsion 31% 40%
Systems 28% 11%
Enabling technologies and capabilities 30% 34%
Aerodynamics 10% 9%
Manufacturing 7% 11%
Materials 6% 8%
Technology infrastructure 3% 3%
Process & tools 4% 4%
Source: SQW
* NB: Fractional counting was used, i.e. projects addressing multiple themes were divided evenly across those themes.
It is important to note that these figures are based on the analysis of data that were publicly available and ‘manually’ sourced from the Innovate UK website. While we are confident that the results are broadly ‘right’, and represent the best possible results based on the data we had access to, they may not be an absolutely exact and comprehensive reflection of the totality of relevant pre-ATI projects. The classification by themes was undertaken based on relatively limited information (brief project descriptions). A more systematic analysis of data on a more complete set of projects may result in some modifications to these findings.
4.2. The baseline at sector level
4.2.1. Overview One focus of future evaluation will be to measure the impact of the ATI programme on performance at an aggregate industry level, for which an in-depth understanding of the sector’s performance in the recent past is required as a baseline. This historical data is also important as an input for making baseline projections of future performance without ATI support which can eventually be compared with actual outcomes (which was one of the options to be explored as per BIS’s research / evaluation specification; for more on this see the next section below). To define a static baseline as well as support the development of baseline projections of future performance, we have constructed estimates of headline indicators at the industry level for 1998 to 2013 using national sources. Some of these indicators are UK focused – for example GVA and productivity – whilst others are
21

international in scope (such as market share); the global nature of the industry necessitates analysis of UK aerospace performance relative to other key competitors.
One difficulty associated with finding the true performance of the aerospace industry is that different national sources present contrasting narratives on the health of the industry, especially with regard to its performance during and since the global recession. These difficulties are further compounded by missing and/or unrealistic observations at the most detailed level for some headline indicators. Together, these issues obfuscate the size and performance of UK aerospace to some extent. A fuller discussion of the challenges, and our suggested solutions, can be found in Annex C.
A second challenge stems primarily from the global nature of the aerospace industry. The provision of sources for other key aerospace players can often be partial at the detail required. The challenge, therefore, was reconciling the data provided by different statistical agencies and compiling a comparable series to calculate UK’s aerospace performance relative to the rest of the world. A fuller discussion of the issues, sources used and assumptions made can be found in Annex D.
The focus of ATI’s programmes is civil aerospace. Measuring civil aerospace at the industry level is extremely difficult, as most national statistical sources do not disaggregate their data into civil and defence activities. Furthermore, in existing literature15 (see Annex E), it is evident that a company focused approach often tends to group aerospace and defence together. One suggestion was to use PRODCOM (production communautaire) data for the UK, which divide the SIC codes into products manufactured for civil and defence purposes. This indicated that the civil share of aerospace output was in the region of 60-70%, although it must be noted that this includes the sales of spacecraft and satellites, which cannot be isolated in the available data. Alternatively, based on a survey of its members, ADS has estimated civil share of production to be 49% (p.19, 2012, ADS).
Consequently, the headline findings discussed below reflect the performance of both civil and defence aerospace. Separating out civil and defence aerospace therefore represents a gap in the current evidence base, and further research on this issue may be beneficial.
All calculations made to derive estimates for the headline indicators are intended to be easily rationalised, replicable, transparent and consistent over time, to support continued monitoring in the future as the ATI programme develops. This is particularly important in the case of market share; we expect that as international statistical departments increase their scope and data provision, our calculation can be built on to provide a more accurate estimate of UK aerospace market share, especially given how some of the likely major players in the future are also those which currently lack comprehensive data.
4.2.2. Headline findings on current UK performance In 2013, the aerospace industry directly employed 110,000 individuals. Industry turnover was £28.7bn in 2013, of which around 40% (£11.5bn) was value added (see Table 4-3). This was higher than for the rest of the manufacturing sector, for which approximately 30%
15 For example, see PWC (2014), Deloitte (2013), KPMG (2014).
22

of total turnover16 was value added in 2013. Labour productivity in 2013 was calculated to be over £98,000 per worker, which was higher than the general manufacturing (excluding aerospace) average of approximately £59,00017 per worker.
Real GVA, turnover and labour productivity growth have been strongest as the UK has emerged from the economic downturn that started in 2008; GVA growth in aerospace was approximately five times higher than average GDP growth nationally over the same period. This can be compared with much lower average growth values around the start of the millennium and in the mid-2000s. Although employment has not experienced the same growth observed for GVA and turnover, the steady decline in employment around 9/11 did not continue into the late-2000s; fluctuations notwithstanding, employment since 2008 averaged above 110,000, compared to an average of approximately 100,000 for the rest of the 2000s after 2002. It is perhaps unsurprising, then, that UK aerospace is regarded as a “national economic asset” (p.2, HM Government, 2013).
At an industry level, headline indicators of investment into UK aerospace suggest that businesses have continued to spend money on research. Despite aggregate R&D spending growth slowing down nationally over the years, R&D spending in civil aerospace has been growing to become an increasingly larger share of total R&D spending. The large growth in GVA has failed to stimulate increased investment into the industry, which has been steady at £500m-£750m pa for the whole period under consideration. As a result, investment intensity has declined slightly, from around 10% in 2000 to close to 5% in 2013.
This increase in economic activity has in large part been propelled by increasing demand from outside of the UK. In 2013, exports accounted for almost 85% of UK aerospace output, compared with 65-70% for most of 2000s. Apart from 2009, aerospace products have consistently yielded a real trade surplus (in 2013, the aerospace trade surplus was valued at over £4bn), and real exports have been growing at an average rate of almost 8% pa since 2009, compared to around 1.5% between 2002 and 2008. Exports to countries outside of the EU have grown, constituting almost 73% of total UK exports in 2013 (compared to an average of around 60% over 1998-2007).
16 According to Annual Business Survey figures. 17 Using both Annual Business Survey figures and Workforce Jobs average
23

Table 4-3: Headline indicators, 1998-2013
Variable Units Levels Growth rates* (% pa)
2000 2013 09-13 98-13
GVA (constant)** £m 8,064 10,840 7.5 2.2
Turnover (constant)** £m 20,430 27,022 3.4 1.1
Employment 000’s 120 110 -1.7 -0.5
Real labour Productivity** £/worker 67,100 98,472 9.3 2.7
Total R&D (civil and defence, current)
£m 1,091 1,656 3.1 3.2
Investment (current) £m 445 712 3.1 3.2
Exports (constant)** £m 13,824 21,035 7.9 3.9
Imports (constant)** £m 9,975 18,708 3.2 3.9
Source: CE calculations and national statistics.
*Growth rates calculated as compound annual growth rates.
** The base year is 2010 for constant price indicators
Estimating market share is particularly challenging. Our calculations (based on estimates of real GVA using official statistics from various national statistics offices) indicated that, in 2012, the UK’s share of global aerospace production was an estimated 9%.18 Market share hovered at just above 10% until the eve of the financial crisis, after which it fell to around 7.5%. Since 2010, it has rebounded, although to levels lower than those observed in the late 1990s. This is unsurprising, as new players have emerged and captured larger shares of the increasing demand for aerospace products. UK global market share has been partly sustained by two potential factors: expansion into new markets, and strong growth in demand in established markets offsetting the decline of UK import share in these markets.
This increased competition can be marked by the general increase in global output. In 2013, worldwide aerospace production was almost one and a half times the level in 2000, buoyed by the growth of aerospace production in countries such as Canada, Japan, Singapore, Korea and Russia. Whilst this signals a potential change in the future composition of key players, their importance, at present, should not be exaggerated; in 2012, the US and Europe (including the UK) still dominated the industry, with around 57% and 31% of the market share respectively.
18 Other estimates of market share are available; a fuller discussion of this headline indicator is available in Annex C
24

4.3. Projecting a future baseline for the sector
4.3.1. A future baseline to assess the sector’s potential and establish a ‘pseudo-counterfactual’
This scoping study has developed a modelling framework and tool to produce a baseline (and alternative) projection of the sector’s future performance based on trends in R&D support that existed before the ATI programme was launched. The current model has made the best use of the available secondary data and evidence to incorporate within the framework key drivers so as to provide a sufficiently logical and insightful projection. The model is a systematic framework to generate alternative scenarios incorporating different expert views, assumptions or projections (e.g. of global demand) and mapping these onto alternative economic outcomes for the sector (e.g. GVA and employment). As part of this study, draft versions of the model and the results of various ‘test runs’ were shared and discussed with BIS and the steering group. Based on the feedback received, the modelling framework, key variables, assumptions and data sources were amended in a number of ways.
As well as providing a forward-looking assessment of the sector’s potential for growth (and its potential importance to the UK economy), this projection provides one option (but not the only one), as part of evaluation scoping, to establish a counterfactual (or at least pseudo-counterfactual) for the future performance of the UK sector without ATI support (see chapter 5 for more details).
A fuller description and discussion of the model, along with worked examples, is given in Annex F. It is important to note that the data and projections from the model are for the aerospace sector as a whole; they do not distinguish civil from defence19.
4.3.2. Benefits and limitations of the modelling approach There are a number of advantages to developing such a quantified model. One of the difficulties of establishing a future counterfactual is that we cannot perfectly predict future developments in the external drivers of the sector’s performance. The model provides a framework to vary the assumptions for the future profiles of key drivers to assess the likely impact on the projection of sector performance. Later on, the projections framework can be updated with the known values for the exogenous assumptions to produce an updated set of projections. In addition, the model can be used for sensitivity analysis to investigate uncertainties, for example by varying the coefficients relating the drivers to performance. The results of the model should not be interpreted as precise predictions of the sector’s performance in 10-20 years’ time, nor should they be used to look at performance from one year to the next; rather, they provide an indication of the sector’s direction of travel over the period given a defined set of assumptions and based on a transparent and logical framework.
The purpose of the model is not to estimate returns to investment20, nor to generate an ex ante ‘policy on’ projection of the impact of the ATI programme on the sector’s
19 As agreed with the Steering Group; Measuring civil aerospace at the industry level is extremely difficult, as most national statistical sources do not disaggregate their data into civil and defence activities.
25

performance. What the model does provide is a forward-looking ‘without support’ or ‘with pre-ATI trends in support’ projection (i.e. pseudo-counterfactual) of expected performance (under a number of alternative scenarios) against which the ‘with support’ actual outcome can be compared. How this can contribute to an overall evaluation strategy for the ATI programme is explored further in Chapter 5.
4.3.3. The modelling framework The model has been designed to project forward, for a chosen set of assumptions, a set of headline performance indicators (such as global market share, GVA and employment) over the long-term. Its main purpose is to produce such projections that can eventually be compared with actual performance data as part of future impact evaluations of the ATI programme (although differences between the two cannot be automatically attributed to the ATI programme – for further discussion of this see Chapter 5).21
The drivers of the sector’s performance are many and varied, some of which are easier to quantify than others. In addition, there are feedback loops from the sector performance to some of the drivers of performance, such as between profitability and investment.
The drivers that are relatively easily quantified or estimated (in principle at least) include, for example: global economic conditions and the consequent demand and orders for aerospace goods and services; the scale of investment in R&D and its consequent impacts on the relative competitiveness of the UK aerospace sector; the scale of government support to R&D; and the performance of the UK’s key competitors (which in turn would depend upon funding and R&D in those countries). Other drivers, such as socioeconomic or behavioural change, the quality of aerospace companies’ management team and/or companies’ strategies, the skill level of the workforce are much harder to quantify because they are not readily observed, not easily measured or may only become apparent with the passing of time. An important driver that is not included is the scale of UK R&D and government support relative to the UK’s competitors. We have not included this due to a current lack of data/evidence on the scale of R&D and government support in other countries. We understand that BIS has commissioned work to gather evidence about R&D and government support to aerospace in other countries. This would provide useful contextual evidence in which to interpret the results of this model22.
Having considered various options we have chosen not to include an extensive list of drivers, performance indicators and feedback loops in the modelling framework: it has not been feasible to obtain the required data, and the framework would potentially have become intractable and difficult to maintain and interpret. In using the model to generate baseline projections, therefore, the overarching assumption is that there is no fundamental change in the levels/growth rates of these omitted drivers (and the influence they exert on
20 Any attempt to use the model to estimate returns to investment needs to bear in mind that the impacts calculated show the effects of total R&D (private is not distinguished from public) on the UK aerospace sector, including spillovers generated within the sector. 21 In addition, because of the way it is set up, the model can also be used in certain other potentially relevant ways, e.g. to provide an estimate of what level of R&D (which is one of the key drivers of performance in the model) would be necessary to maintain the UK’s share of the global aerospace market (without commenting on where any additional R&D comes from). 22 The model could be adjusted to incorporate this data as and when it becomes available.
26

the sector), and that the trends in these drivers over the forecast period are in line with the trends over the historical period.
The challenge, then, is to identify the key elements to include within the scope of the modelling framework so that it provides sufficiently logical and insightful projections. The resulting modelling framework takes account of insights and feedback about priorities from BIS and ATI. Aerospace is characterised as a global sector and the key drivers of change are agreed as:
• Global GDP growth, which is broken down by eight world areas to take account of the relative importance of different markets for UK aerospace.
• Investment and R&D expenditures, which drive technological progress in UK aerospace, and so enhance the productivity and competitiveness of the UK sector.
Figure 4-1 presents the key elements that are included in the modelling framework. The red circles represent elements that are exogenous (inputs) to the modelling framework, and the blue ovals are elements determined within the model. The dark blue arrows show the links between drivers and performance indicators, and represent where ‘coefficients’ quantify those links. The logic of the model can be summarised as follows:
• The key drivers of UK aerospace (gross) output are assumed to be: trade-weighted global GDP; and enhancements to UK competitiveness through technological progress.
• The UK’s global market share (of GVA) is derived from: UK aerospace value added, which is driven by UK (gross) output; and global aerospace value added, which is driven by global GDP23.
• The key drivers of employment are: output; and technological progress.
• The framework also includes relationships between: output and exports; and imports and exports.
23 With 70-80%+ of UK aerospace output going to exports, the UK sector is clearly servicing the global market, and so global GDP, as a driver of global demand, is an important driver.
27
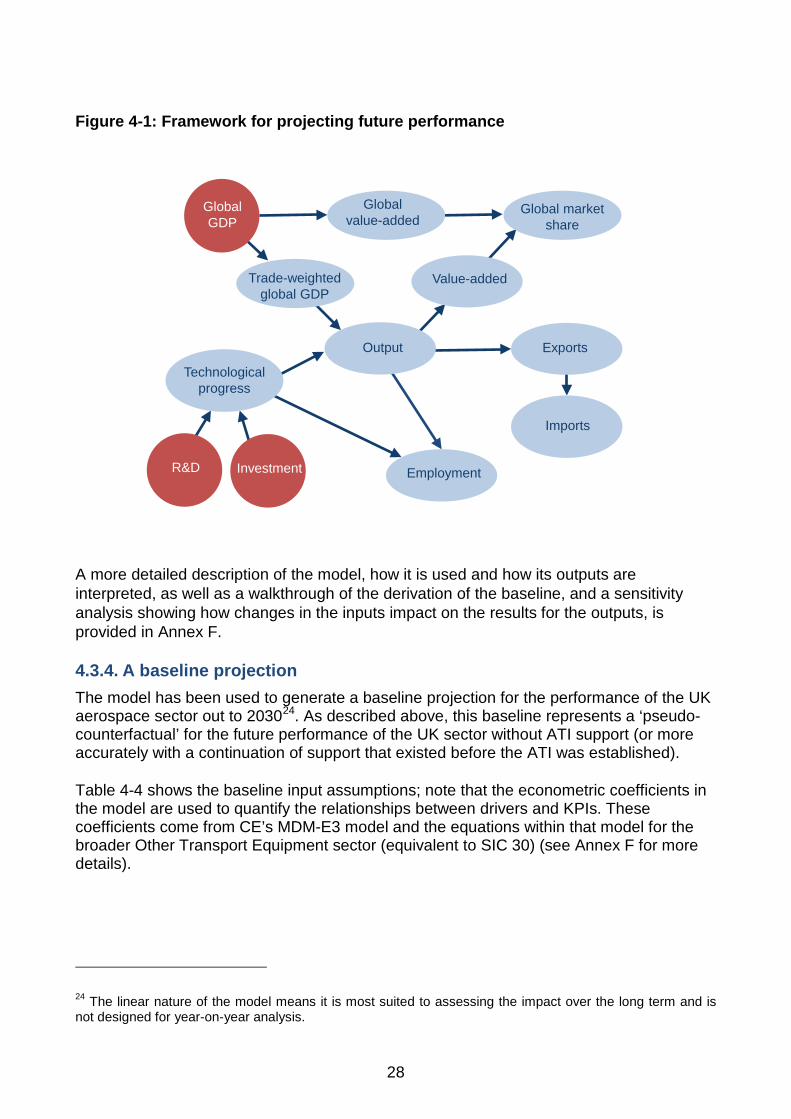
Figure 4-1: Framework for projecting future performance
ExportsOutput
Value-added
Employment
Imports
Technological progress
InvestmentR&D
Globalvalue-added
R&D
Global GDP
Global market share
Trade-weighted global GDP
A more detailed description of the model, how it is used and how its outputs are interpreted, as well as a walkthrough of the derivation of the baseline, and a sensitivity analysis showing how changes in the inputs impact on the results for the outputs, is provided in Annex F.
4.3.4. A baseline projection The model has been used to generate a baseline projection for the performance of the UK aerospace sector out to 203024. As described above, this baseline represents a ‘pseudo-counterfactual’ for the future performance of the UK sector without ATI support (or more accurately with a continuation of support that existed before the ATI was established).
Table 4-4 shows the baseline input assumptions; note that the econometric coefficients in the model are used to quantify the relationships between drivers and KPIs. These coefficients come from CE’s MDM-E3 model and the equations within that model for the broader Other Transport Equipment sector (equivalent to SIC 30) (see Annex F for more details).
24 The linear nature of the model means it is most suited to assessing the impact over the long term and is not designed for year-on-year analysis.
28

Table 4-4: Inputs to the baseline projection
Input Baseline assumption
Exogenous inputs – projections (average annual % change over the period 2013-2030)
Future investment and R&D growth
R&D expenditure -0.7
Investment expenditure -0.8
Future world GDP growth
EU27 1.9
USA 2.6
Canada 2.5
Japan 1.3
Brazil 3.5
India 6.2
China 7.2
Rest of the World 3.3
World total 3.5
Econometric coefficients (elasticities)
Export equation coefficients
Trade-weighted global GDP 0.84
Technology index 0.61
Employment equation coefficients
Gross output 0.20
Technology index -0.12
Global aerospace GVA coefficient 0.64
Source: Cambridge Econometrics
The coefficients used capture the long-term impact and so the model looks at long-term (underlying trend) effects not short-term dynamics. As such, the results are better analysed over the long term rather than looking at year-on-year changes. If users wish to look at short-term dynamic effects, the existing model could be developed further, or an alternative model could be developed.
The baseline assumes that the future growth of UK R&D and investment expenditure will continue at the same pace that was observed in the decade prior to the announcement of ATI (2002-2012). This represents an assumption that the pattern of private expenditure
29

and government support for aerospace will continue at a scale similar to that in recent years prior to the announcement of ATI – that is a modest decline in both R&D and investment expenditures. The assumptions for future global growth are taken from CE’s most recent economic forecast25. These assumptions show future growth of world GDP of around 3¾% each year, with growth assumed to be slower in developed economies than emerging economies. The results for the baseline projection are summarised in Table 4-5.
It is a weighted index of global GDP that is used to drive output - the weights (fixed over time) represent the importance of each world area to UK exports of aerospace. Note that the trade-weighted measure of global GDP is forecast to grow more slowly than average global GDP, because the UK’s current main export markets are assumed to grow less rapidly than others.
UK aerospace output and value added are projected to continue to grow, though considerably lower than in recent years, at around 2% pa over 2013-2030, and employment is also projected to grow, by around 0.5% pa. UK global market share is projected to shrink slightly, from just over 9% in 2013 to just under 9% by 2030. Note that exports and imports are projected to grow at the same pace as output – this is the outcome of the simple rules that are used in the existing model.
Table 4-5: Headline results for the baseline projection
2008-2013 2013-2030
Global indicators (average annual % change)
Global GDP 1.8 3.5
Trade-weighted global GDP 1.2 2.9
Global aerospace GVA 6.9 2.3
UK aerospace KPIs
Technology index -1.7 -0.6
Output 4.4 2.1
Value added 5.5 2.1
Employment 1.1 0.5
Exports 7.2 2.1
Imports 4.7 2.1
2008 2013 2030
Global market share (of GVA) 9.8% 9.1% 8.9%
Source: Cambridge Econometrics
25 With reference C151IND, published in February 2015.
30

4.3.5. Alternative projections and sensitivity analyses The model can be used for sensitivity analysis to investigate uncertainties and generate alternative scenarios, as illustrated by the examples in Table 4-6 (which are presented in more detail in Annex F). These scenarios are presented for illustrative purposes only, to show how sensitive the model is to changes in the input assumptions. They are not intended to characterise plausible scenarios (which itself depends on the user’s viewpoint); however, the model user can vary the input assumptions to produce a scenario that he/she considers to be plausible.
Table 4-6: Examples of alternative projections and sensitivity analyses
Question Assumptions Findings
What growth of R&D and investment would be required to curb the projected fall in UK global market share?
Assume global GDP growth as in the baseline; adjust R&D and investment expenditure to achieve no fall in market share.
The model suggests that the growth of R&D and investment expenditure would need to be increased by 0.25 percentage points in each year (to -0.45% and -0.55% pa, respectively) to prevent a decline in global market share by 2030.
What impact might the composition of world growth have on UK aerospace?
Two alternative scenarios are compared by varying only the assumptions for global GDP growth: scenario 1 – assumptions and inputs the same as the baseline; scenario 2 – same global GDP growth as Scenario 1, but slower in UK key markets (USA and Europe) and faster elsewhere.
As would be expected, UK aerospace suffers a worse performance in Scenario 2 in which GDP growth is slower in the UK’s key markets (USA and Europe) and faster elsewhere: output growth and employment growth are curbed, and market share declines more rapidly.
How sensitive are the model results to the econometric coefficients?
As an example, adjustments are made to the coefficient on the technology index in the equation used to determine output. The coefficient in the baseline (and Scenario 1) is 0.61, indicating that a 1% increase in the technology index increases output by 0.61%. In Scenario 2 we increase the coefficient to 1 – this higher coefficient would indicate that UK competitiveness is boosted to a greater extent by the technology index than in the baseline.
UK aerospace performs worse in Scenario 2 in which output is more responsive to increases in the technology index: this is because (in both Scenarios) the technology index is assumed to fall modestly, and so the higher coefficient translates into a larger negative impact on output. The overall impact of the change in the coefficient is fairly modest.
Source: Cambridge Econometrics
31
5. Evaluation approach and framework
This chapter builds on the materials and analysis presented previously, and presents the results of the evaluation scoping work as such. This includes:
• A summary of the key evaluation challenges, in particular the lack of a suitable ‘control group’ to compare with the ‘treatment group’, and following on from this, a discussion of a variety of alternative approaches to identifying a possible counterfactual.
• A description of the proposed approach to the impact evaluation, which is a mixed methods theory-based approach combining a ‘top-down’ perspective (focusing on sector performance) and a ‘bottom-up’ perspective (focusing on individual projects co-funded by the ATI and the participating firms). We also discuss the scope and timing of evaluations.
• An overview of the recommended evaluation methods and tools. As part of this, we also highlight the role of programme monitoring data, and describe key elements of the proposed monitoring system.
• A discussion of how evidence from both the ‘top-down’ and the ‘bottom-up’ evaluation approaches should be triangulated to arrive at estimates of impact, and a summary of how the proposed approach addresses the various challenges identified previously.
• A proposed approach to the economic evaluation, which is based on a form of cost-effectiveness analysis.
5.1. Types of evaluation and implications
A primary objective of this scoping study was to develop an evaluation framework for the ATI programme which allows for impact and value for money to be rigorously assessed. In principle, this involves two key strands of evaluation:
• Impact evaluation develops a full and robust assessment of change brought about by the ATI programme. Typically this is achieved by isolating the impact of the programme in bringing about that change and understanding what would have happened in its absence – commonly termed the counterfactual. Control and treatment groups or scenarios are required to generate robust empirical analyses. Other approaches to estimating impact can also be adopted to derive robust assessments, e.g. of the contribution of an intervention to changes in outcomes.
• Economic evaluation identifies the costs and benefits of the ATI programme so that a value for money assessment can be made. There are various means in which value for money can be expressed, including unit costs of achievements and benefit
32
cost ratios. The latter involves deriving a monetary value for the costs and benefits of a programme.
In recent years, there has been an increasing emphasis from government on empirical impact evaluation, with a review and refresh of government’s guidance on policy evaluation, the Magenta Book, a report by the National Audit Office on evaluation26, and the establishment of the What Works Centre network. Empirical impact evaluation, as defined by the Magenta Book, provides a quantitative measure of the impact of an intervention by isolating the effect of a policy from other factors affecting the outcome through use of statistical and/or econometric analysis. To address the question of attribution, this normally involves establishing a counterfactual through using some form of control or comparison group. Whilst such methods are viewed as the ‘gold-standard’ methodology by some in the research community, in many cases they are unfeasible or inappropriate to adopt due to policy design or other factors, e.g. the complex relationship between drivers and outcomes, the difficulties in identifying a comparison or control group and the timescales to impact. This point is recognised, accepted and discussed at length in the Magenta Book.
As noted in the previous chapters, the ATI programme is an example of an intervention that is both complicated and complex. The ATI programme incorporates a number of design features that, taken together, mean there is no straightforward approach to measuring its impact, or to establishing the attribution of observed effects to the programme by referring to a formal counterfactual. As we go on to discuss later in this chapter, this, together with the nature of the wider industry environment, led us to conclude that empirical impact evaluation is fundamentally not possible. Our initial development of the intervention logic and review of relevant literature have informed our judgement on this matter. It means that in the ATI context, empirical impact evaluation is not the ‘gold standard’ and thus a different evaluation methodology must be employed. The main reasons for this are outlined below.
5.2. The key evaluation challenges
Drawing on the intervention logic and the key features of the ATI programme outlined in Chapter 2, a list of the key evaluation challenges is presented in the box below. The sub-sections that follow discuss what they mean in terms of implementing practical evaluation methodologies. It is important to note that the focus of the requirement to develop an evaluation methodology was to determine ways of assessing the impact of the ATI programme, that is the portfolio of R&T and infrastructure projects, rather than the ATI (the institution) itself. There is, nevertheless, some blurring with the ATI ‘drivers’ (see Chapter 2), reflecting the way in which the ATI may steer the development of certain R&T projects.”
26 NAO (2013) Evaluation in Government, London
33

Summary of Key Evaluation Challenges
• Evolution of ATI and its ‘drivers’• Long development times and returns to innovation• Varying types of projects and timescales to impact• Isolating ATI projects and attribution• Absence of a suitable counterfactual or ‘control group’• Reliance on self-reported outcomes
5.2.1. Evolution of ATI and its ‘drivers’ The ATI programme does not start from a clean slate. Government has provided some R&D support to the sector for quite some time (e.g. CARAD). As a result there is no distinct timeframe between ‘policy on’ and ‘policy off’ scenarios. Legacy funding (i.e. pre-ATI) projects are included within its portfolio, and this will continue to be the case until approximately 2017/18. An additional complication is that the ATI is not expected to play a significant role in actively steering the portfolio until sometime in 2015/16; its influence in terms of strategically prioritising, designing and joining up projects and partners is therefore unlikely to be felt for the ATI projects launched to date (i.e. up to 2015). An impact evaluation before the 2020s that focuses on completed projects is therefore unlikely to incorporate the effect garnered through the ATI’s involvement in project design and selection.
5.2.2. Long development timeframes The timescales to expected outcomes have been presented in chapter 2. They have important implications for evaluation. The financial returns to innovation in the form of turnover or profit and economic returns in terms of GVA typically occur a long time after initial investment, due to the timescales required for projects to successfully navigate the TRLs and achieve commercialisation. The aerospace industry is ‘extreme’ in this sense, with some returns not expected for over 20 years in the case of technology development for the ‘next generation’ aircraft. Isolating the changes in key performance metrics that resulted from investment made many years previously is therefore extremely challenging from an evaluation perspective.
5.2.3. Varying project types & timescales The ATI project portfolio is highly diverse. Not only do projects vary on a case by case basis, but they are also delivered by a range of beneficiaries. As such there is no ‘typical’ ATI project. In addition, depending on the nature of the project, timescales to impact – although often relatively long – vary substantially. While ‘secure’ projects might deliver economic returns in the next 10 years, ‘position’ projects are not expected to deliver until after 2025. As a result, the number of projects in each project category, even over the seven year life-time of the ATI, is likely to be relatively small. Again, this makes isolating any changes in outcome indicators to ATI funding difficult and far from uniform across the programme.
34

5.2.4. Isolating ATI projects and attribution Our analysis of the early ATI projects showed that many beneficiaries (i.e. firms) will be involved in multiple ATI projects at any one time. In evaluation terms this presents significant difficulties in attributing changes in outcomes to individual ATI projects. In some instances, multiple R&T projects (including a combination of ATI-funded and non-ATI-funded projects) may be required to reach commercialisation; breaking this down into its component parts will be challenging.
There is also an issue with attributing longer term outcomes relating to aircraft operating efficiencies. Many new technologies are likely to be required in the development of a new turbo fan, for example; as a whole it may lead to a reduction in fuel burn, but isolating that impact to one ATI-funded technology will be difficult unless one can determine the costs and benefits of individual R&T projects at each stage of a wider R&D programme of activity (e.g. option value), which is notoriously difficult to estimate.27 There are also a good number of external factors which might generate changes in the outcomes identified in the intervention logic. They represent a significant amount of ‘background noise’ and accounting for them is important.
Some longer term outcomes, particularly those in relation to spillover effects, are difficult to trace. For example, whilst knowledge spillovers that involve direct participants in ATI projects may be possible to detect, others will involve non-participants as a result of imitation or further collaborations with the research base. For spillovers across sectors, these issues are exacerbated. Navigating this process will be difficult. On the other hand, the rationale for government support for Aerospace R&D rests significantly on the assumption that there would be considerable spillover effects as a result of the ATI programme.
5.2.5. Absence of a suitable control group of firms Given the nature and design of the programme and the structure of industry more broadly, identifying a suitable control or comparison group is not possible. If we could identify a group of companies that are identical (or at least suitably similar) to the beneficiaries in every way except that they have not received ATI funding, then the differences between the two groups would be attributable to the programme with a high degree of certainty. However, as noted previously, such a group does not exist, mainly because of the size and structure of the industry (which means that all or nearly all of the key players are expected to benefit from the ATI programme to a greater or lesser extent), but also the heterogeneity of the treatment group and of the treatment itself (which means inter alia that many firms will participate in more than one ATI-funded project at a time). More detail on the crucial issues of the counterfactual is provided below.
27 This point is well illustrated by a recent report commissioned by BIS (Frontier Economics: Rates of return to investment in science and innovation, July 2014). The case studies on the aerospace sector find that it is very hard to decompose the precise contribution of an individual investment to an individual return in a meaningful way, as “initial programmes of research to develop new technologies are then built on by subsequent investments, including public investments, all of which contribute to the final returns”.
35

5.2.6. Reliance on self-reported outcomes This challenge essentially follows from the previous one. Given that a comparison group of non-beneficiary firms will not be possible due to some of the issues outlined above, data collection at project level will have to rely on self-reported outcomes by both businesses and the research base. This presents two key challenges. First, in many cases beneficiaries may not wish to disclose information on the development of new technologies, or reveal much in the way of detail in terms of outputs / outcomes. Second, relying on self-reported outcomes can lead to response bias. For example, beneficiaries may have a tendency to overstate the role of the intervention on the outcomes, in particular if they have an interest in demonstrating the value of the support they have received. Whilst optimism bias can be incorporated into the analysis, there is limited evidence on how much optimism bias to apply in such situations. Fundamentally, using self-reported data relies on asking beneficiaries to isolate the effects of individual R&T projects, which as we have seen is complicated by the inter-relationships between R&T projects and other factors.
5.3. The problem of the counterfactual: Alternative approaches
Throughout this report, we have referred on several occasions to the problem of the lack of a suitable counterfactual to compare with the ‘treatment group’ (i.e. the firms benefiting from the ATI programme). Given that an (observed or constructed) counterfactual is one of the main ways – and many would argue the preferred way – of assessing the extent to which observed effects can be attributed to an intervention, it is worth dwelling on this issue a little longer, and systematically exploring both conventional and possible alternative approaches to identifying a possible counterfactual for the ATI programme. In doing so, we consider: (1) non-beneficiary UK aerospace firms in general; (2) unsuccessful applicants for ATI funding; (3) companies in other (comparable) sectors; (4) international comparators; and (5) estimates of the performance of the sector as a whole in the absence of ATI funding.
5.3.1. Option 1: Non-beneficiary UK aerospace companies In theory, the most promising option for constructing a counterfactual is to focus on non-beneficiaries from within the sector, and comparing the performance of this ‘control group’ with that of the ‘treatment group’ using techniques such as matching or difference-in-difference to statistically test the extent to which the observed differences were caused by the programme. However, as we have discussed before, this approach is not feasible for two main reasons:
• Heterogeneity and treatment intensity: as outlined in the previous section, the level of heterogeneity – of the ‘treatment’ itself (i.e. the projects in terms of their size, thematic focus, routes and timescales to impact) and of the treatment group (i.e. the beneficiaries and their level of exposure to the ‘treatment’) – is too large. This means that the average treatment effect across the entire universe of beneficiaries is of little value. A meaningful statistical analysis would have to be based on sub-groups, which would in turn be too small for statistical analysis.
• Size and structure of the industry: the UK aerospace industry is relatively small (dominated by a small number of large firms / Primes and Tier 1s, and a long tail of lower tier firms), and it is anticipated that the vast majority of the key players will
36

benefit from the ATI programme to a greater or lesser extent. The (few) companies that do not benefit are likely to be fundamentally different from those that do (e.g. in terms of their size and propensity to conduct R&T), and therefore unsuitable as a control or comparison group.
5.3.2. Option 2: Unsuccessful applicants for ATI funding This option is a variation of the first one, but rather than targeting non-funded companies at large, it would focus only on those aerospace companies or projects that have applied for but were not awarded ATI funding. To ensure comparability (to the extent possible), the comparison group could be made up of only those that narrowly failed (i.e. had credible project proposals). However, for reasons outlined previously, this approach would be unlikely to provide a robust counterfactual, mainly because:
• The size and structure of the sector mean that most key players (i.e. large and medium-sized firms) would benefit from some level of support. In other words, even if a certain application is unsuccessful, the applicant is likely to also be part of other projects that do receive ATI funding or apply in future rounds
• The programme design means that only a small proportion of the project funding will be allocated through genuinely open competitions, with the majority awarded through the ATI’s ‘stage-gate’ process, which is more iterative and involves an element of consultation, filtering and possibly re-design of project proposals. As a result, even if a sufficiently large and representative group of genuinely unsuccessful applicants could be identified (which in itself is unlikely due to the previous point), this group is likely to differ in its levels of exposure to and interaction with the ATI to successful applicants.
Therefore, no counterfactual in the strict sense can be constructed from unsuccessful applicants (firms). This is not to say, however, that there is no value in investigating the experiences of projects for which applications fail to obtain funding, or of firms that consider but decide not to apply. This could serve two purposes (and has been incorporated in the evaluation approach described later in this chapter):
• Assessing project additionality: It will be interesting to try to understand the extent to which projects that are rejected by the ATI still go ahead (possibly with a reduced scope) with funding from private and/or other public sources. Note that what happens to projects that do not get funded is fundamentally different from attempting to assess the performance of unsuccessful applicant firms.
• Assessing engagement of firms in the supply chain: Although the vast majority of large (and probably also medium-sized) aerospace companies will apply for and obtain funding for at least some of their projects, the same is not necessarily true of small firms in the supply chain, which may only ever apply for one project, or express their interest by registering with Innovate UK but then decide not to apply. Such companies are far too dissimilar from the universe of ATI beneficiaries to be used as a control group, but collecting feedback from them could be useful to assess engagement of and barriers to SME participation.
37

5.3.3. Option 3: Companies in other sectors In theory, the evaluation could look to identify UK companies in other industries in the advanced manufacturing sector (such as automotive, or machinery, electrical & transport equipment) that are similar to and could therefore be matched with ATI beneficiaries. However, it seems clear that this would not result in a robust counterfactual in view of (1) the specific context and drivers of the aerospace sector, and (2) the fact that other sectors benefit from other support measures (including access to Catapult Centres), and in some cases (e.g. automotive) from targeted support under their own industrial strategy.
5.3.4. Option 4: International comparators Given that no suitable counterfactual can be found within the UK aerospace sector (because most key players will be ATI beneficiaries) or other sectors (because companies are not directly comparable), it is worth considering whether appropriate comparators might be found internationally. Analysing individual companies based in other countries is not feasible for both conceptual (different economic, fiscal, legal, political etc. environments) and practical reasons (access to relevant data). Nonetheless, as part of an evaluation of the ATI, one could review the approaches taken by some of the UK’s main competitors (e.g. France, Germany, Canada) to support and stimulate R&T activity, and the performance of their respective aerospace sectors, so as to draw some broad conclusions as to the relative advantages and disadvantages of the ATI approach. While this could generate potentially interesting qualitative insights, it needs to be clear that it would not provide a counterfactual as such, as it would be based on a very small number of observations that are at best indirectly comparable.
5.3.5. Option 5: Forecasting sector performance without ATI funding This option would involve developing a model to forecast how the performance of the UK aerospace sector would have been likely to evolve in the absence of the ATI programme, based on historical trends, assumptions as to key drivers of performance, and coefficients to relate drivers to performance. This is the purpose of the model described in Chapter 4 and Annex F. Although this does not provide a ‘pure’ counterfactual either, the proposed evaluation approach suggests using the results as one of several ways of assessing impact and inferring causality (as part of the ‘top-down’ perspective on the ATI programme).
As is noted in Chapter 4 and Annex F, a precise model forecasting the performance of the UK aerospace sector without the ATI programme in order to provide a formal counterfactual against which to compare actual outturns (with the difference representing the scale of impact) is not feasible. This is partly due to the long history of government support to the sector, which means that past trends still provide a “with intervention” scenario, and partly due to the wide range of factors that will affect sector performance that cannot be modelled (i.e. noise in the system). Therefore, the model can only provide a ‘pseudo-counterfactual’ (i.e. based on previously existing trends of government support), and the model generates forecasts based on the assumptions that have been modelled in a way that retains tractability. These assumptions can be updated in future runs of the model to provide an indication of sector performance on a ‘business as usual’ basis, against which outturns can be considered (whilst recognising the inherent limitations). We suggest that this evidence is used alongside other strands of evaluation evidence to judge the overall impact of the programme. Therefore, although the modelled forecasts do not
38

provide a ‘pure’ counterfactual either, they can provide one of several ways (but not the only way) of assessing aggregate impact.
5.3.6. Summary For the reasons outlined above, an empirical impact evaluation (i.e. a quasi-experimental research design involving a formal comparison group to generate net impact estimates) is not possible. This means that the extent to which effects on the (economic) performance of beneficiaries that are observed can be attributed to the ATI programme cannot be established statistically by comparing with a control or comparison group. In light of this, other approaches to inferring causality have been explored, and the challenges outlined previously remain critical to developing the method. The next section sets out the proposed approach and methodology.
5.4. The overall impact evaluation approach
In light of the nature and design of the ATI programme and the various challenges resulting from this, the impact evaluation will need to adopt a combination of approaches and methods. It will need to triangulate both quantitative and qualitative data from different sources to arrive at the best possible estimate of the outcomes achieved and assess the ATI programme’s contribution to bringing these about.
We therefore propose a mixed methods theory-based approach to evaluating the impact of the ATI programme. Broadly speaking, this approach will combine two conceptually separate but complementary perspectives:
• Top-down: The evaluation will use secondary data from a variety of sources to track relevant indicators for the UK aerospace sector as a whole including, for instance, R&D spending, and performance metrics such as output, GVA and employment. For a set of key metrics, actual performance can be compared to the results of a model designed to project a baseline pseudo-counterfactual which is a proxy to a ‘without ATI support’ scenario. In conceptual terms, differences between the two can be used to infer a broad indication of the impact of the ATI programme on the sector as a whole – though the evidence will require careful interpretation.
• Bottom-up: In addition, the evaluation should collect and analyse data on individual projects co-funded by the ATI (and the participating firms), so as to assess their respective outputs, outcomes and impacts (and thereby test and validate the intervention logic outlined in chapter 2 and Annex A of this report). This will involve research methods such as beneficiary surveys, interviews and case studies, and be informed by monitoring data.
This combination of methods and sources will provide a wealth of relevant data on project outputs and outcomes, as well as on the performance of the aerospace sector. The indicators at sector level will be addressed through ‘top-down’ evaluation by drawing on data from secondary sources, while data to populate the indicators at project level will be collected through monitoring and evaluative research as part of the ‘bottom-up’ approach (see the Tables in Chapter 3).
39

The approach to establishing causality will use contribution analysis to combine the modelled ‘pseudo-counterfactual’, which will give an indication of the ‘direction of travel’, with a theory-based approach to systematically investigate the extent to which the observed changes were brought about by the ATI programme. In other words, the bottom-up evaluation will need to test the intervention logic (or ‘programme theory’), and assess the extent to which the envisaged outcomes have occurred as a result of the ATI programme versus other factors that might influence the results. Based on this, the study should verify the causal chain and thereby arrive at valid conclusions as to the programme’s contribution (or lack thereof) to the observed changes.
The above will require a combination of quantitative and qualitative data to generate meaningful and robust results. While quantitative data should ideally be collected on the entire universe of projects and beneficiaries (via monitoring, surveys and secondary sources), the collection of qualitative data (via interviews and case studies) allows more in-depth review but is more resource-intensive (for both evaluators and beneficiaries) and will need to be focused where it is likely to add the most value. A key principle underlying our proposed approach is to conduct case studies on those projects that are most likely to have contributed (or contribute in future) to key technological developments and advances. Past research suggests that the benefits of business and innovation support programmes tend to be unequally distributed across beneficiaries, with a disproportionate concentration among a few highly successful ones. This is especially the case with R&D support, which is inherently risky, and typically sees some projects fail to achieve commercially viable results, while others lead to breakthroughs with potentially large economic benefits. In light of this, rather than work with representative samples, we propose to purposefully select mainly (but not exclusively) those projects for closer inspection that appear most likely to demonstrate and provide evidence of the ATI programme’s economic benefits.
The diagram below provides a schematic overview of the proposed evaluation approach. Further details on its constituent parts are discussed in the ensuing pages.
Figure 5-1: ATI Evaluation Framework: A mixed methods approach
40

5.4.1. The role of monitoring The evaluation framework will have to be underpinned by an appropriate and robust programme monitoring framework, to ensure that relevant data is collected regularly and systematically. Programme monitoring is to serve two main purposes: (1) to ensure that basic parameters regarding the ATI project portfolio are understood (see the Portfolio indicators in Table 3-3), which can provide an indication of whether the portfolio is in line with ATI priorities, as well as inform choices to be made in the context of evaluation (e.g. regarding case study selection); and (2) to provide data on a limited number of outputs and direct (short-term) outcomes that have been delivered by projects individually and collectively (and that lend themselves to monitoring).
More detail on the role of monitoring data to feed into, inform and guide the evaluative research is provided as part of the discussion of the ‘bottom-up’ evaluation below. For an outline of the proposed monitoring framework, including the specific indicators to be included, please see Annex H.
5.4.2. Evaluation scope and timing It is worth reiterating that the impact evaluation will focus on the ATI programme (i.e. the portfolio of ATI-funded projects), and not on the ATI as an institution (although its role in determining the make-up of the portfolio will of course have to be considered, e.g. as part of the case studies, as well as in parallel process evaluation – see below). The scope for the impact evaluation should include all projects launched since the ATI was incorporated in 2013. All of these projects will potentially be affected by at least one of the three drivers for change from the ATI we have identified (see Chapter 2 and Annex A), although the extent will vary depending on when each project was launched (for example, the driver “better projects” is unlikely to be felt strongly for projects launched before the second half of 2015, when the ATI began to play an active role in proposal development and review). On the other hand, legacy projects launched before 2013/14 would not have been affected by any of these drivers (even though some have been formally included in the ATI portfolio), and should therefore not be within the scope of the evaluation.
An indicative timeline for evaluation of the ATI programme is outlined below. It seeks to strike a balance between the intervention logic analysis (which highlights the long timescales to outcomes and impacts) and the likely requirements of government for evidence on outcomes and impacts to inform policy-making (which operates on shorter timescales).
41

Table 5-1: Proposed evaluation timetable for the ATI programme
Year Type of evaluation
Purpose Notes
2016-17 First interim To provide an early indication of the success of the first wave of ATI projects in delivering outputs and short term outcomes, and allow for potential improvements during the final years of the 7-year programme.
Focus will have to be on early results, based primarily on bottom-up evaluation, as sector-wide effects unlikely to be felt until later.
2019-20 Second interim
To provide evidence towards the end of the 7-year period, including an indication of the success of ATI projects in delivering short and medium term outcomes, particularly for ‘secure’ and ‘exploit’ projects which are expected to reach commercialisation earlier than ‘position’ projects.
First opportunity to seriously assess sector performance, although the impact of ‘position’ projects is unlikely to be felt at this stage.
2022-23 Final A more comprehensive assessment of the outcomes generated by ATI projects, including longer-term outcomes where possible, drawing evidence from the entire range of projects funded by the ATI programme.
Assessing medium/long-term outcomes of “position” projects would require another evaluation in the second half of the 2020s.
Source: SQW
While Table 5-1 proposes separate, distinct evaluations at three year intervals, it is recommended that data from secondary sources on the KPIs, as well as programme monitoring data, are compiled and reviewed on an annual basis. It could also be useful to conduct evaluative research in the years in between when formal evaluation reports are due. In particular, case study visits could be conducted between the first and second interim and between the second interim and final evaluation reports, so as to track projects and provide insights into progress made, results produced, and lessons learned on an ongoing basis. Similarly, brief survey updates could also be completed. We would note, however, that such an extensive programme of research might add significantly to evaluation costs.
The focus of this scoping study (and of the Table above) is on impact and economic evaluation. Nonetheless, in view of the limitations that will inevitably affect the first and, to a slightly lesser extent, second interim evaluations (based on the expected time to impact for different types of projects – see in particular Figure 2-4 and Table 3-1), we recommend that process evaluation is incorporated into the interim evaluations to complement the information generated by impact evaluation. Process evaluation should focus on the implementation of the ATI programme, including the ATI’s strategic role in influencing the project portfolio and maximising results. Specifically, it should assess the effectiveness of the process by which projects are developed and prioritised, including the role of the new BIS and ATI Strategic Review Committee, as well as how beneficiary firms are implementing the co-funded projects and using the emerging results. In the early years, when data on impacts will still be scarce, such information will provide useful clues as to the extent to which the creation of the ATI has added strategic value and led to more and/or ‘better’ (and hence potentially more impactful) R&T, as well as help identify areas where there remains room for improvement. Such process evaluation would require interviews with beneficiaries, stakeholders, ATI staff and other relevant groups (including
42

applicants who are unsuccessful, or register but then decide not to proceed with their application), and so could be readily incorporated into the interim evaluations set out in Table 5-1.
5.5. The ‘top-down’ evaluation approach
The first set of evaluation methods can be characterised as taking a ‘top-down’ perspective. By ‘top-down’, we mean a focus on the UK aerospace sector as a whole and its performance. At the heart of this approach is the identification of relevant performance indicators that are expected to be affected by the ATI programme, and a systematic tracking of the evolution of these indicators against the baseline pre-ATI, so as to infer the potential contribution of the programme to the performance of the UK aerospace industry.
Table 5-2: Methods that form part of ‘top-down’ evaluation
Method Purpose Related indicators
Tracking sector performance data
Review how key UK aerospace sector performance metrics that the ATI programme is expected to affect are evolving
All sector-level outcomes (see Table 3-1 and Table 3-2)
Review of global aerospace sector context
Track external factors that may contribute to explaining the (relative) performance of the UK aerospace industry, including factors that affect demand and, where possible, relevant policies in competitor countries
N/A
Projecting sector performance without ATI support
Generate a modelled scenario (or set of scenarios) to compare with actual performance (as a ‘pseudo-counterfactual’ to help infer impact)
Sub-set of key sector-level outcomes: K6-K10
Source: SQW
A series of relevant indicators have been defined as part of this study (based on the intended outputs, outcomes and impacts of the ATI programme identified in the intervention logic), and sub-divided into key performance indicators (KPIs) and supplementary performance indicators. The KPIs include R&D expenditure, turnover, exports, GVA, employment and the UK’s share of the global (civil) aerospace market. A comprehensive review of data sources and definition of baselines has been undertaken as part of this scoping study. Where significant challenges were encountered (e.g. in terms of concerns about the quality and/or consistency of available data), appropriate solutions have been developed. The approach taken should be repeated in future, and data compiled annually so as to populate a ‘scorecard’ that allows for a tracking of progress against KPIs on a regular basis (the exact process and responsibilities for collecting, analysing and presenting the data will need to be clarified).28 For the supplementary
28 We note that, in the research specification, the collection of data related to outcomes and impacts is discussed as part of the monitoring system. However, in our understanding the term “monitoring” is best
43

performance indicators (which are less ‘core’ to assessing performance but can be important for understanding particular aspects of the ATI programme’s context and functioning), we suggest data be compiled and analysed specifically as and when an (interim or final) evaluation is undertaken (rather than annually).
A key challenge to keep in mind in this context is the lack of data for the civil aerospace sector specifically. As discussed in chapter 4, most national statistical sources on which the ‘top-down’ evaluation approach is expected to draw do not disaggregate their data into civil and defence activities. It is vitally important that this issue is investigated and addressed further (most likely by deriving estimates regarding the civil/defence split based on the few sources that do make this distinction, and by systematically testing the robustness of these estimates) in order to render the results of the evaluation as meaningful as possible.
5.5.1. Assessing the counterfactual and external factors Obviously, it will not be possible to simply attribute any changes in the indicators to the ATI programme. To help contextualise and interpret the data, it will be necessary to review key trends in the global aerospace industry. The intervention logic highlights the numerous external factors that are likely to affect the performance of the UK aerospace industry, among them the evolution of global demand (which is expected to continue to grow significantly, but could be vulnerable to external shocks) as well as its regional composition (e.g. a possible shift of demand towards Asia). The extent to which the UK’s main competitor nations maintain or increase their support for R&T is also important to consider, as it affects the UK’s relative position when it comes to attracting investment. In order to enable the evaluation to take these factors into account, they should be explicitly investigated. This is likely to involve a review of both quantitative and qualitative data and information, ideally with involvement of sector experts. The output of this work should be a summary paper (at the time of each evaluation) of a limited number of key global developments, and an assessment of how they are likely to have affected the UK aerospace sector.
As an optional element, the review of relevant global developments could also incorporate a limited number of case studies (e.g. two to three) on key competitor nations’ approaches, processes and institutions for supporting R&D / R&T for the aerospace sector. As noted previously, although such an analysis would not generate a formal counterfactual, it could provide useful information on how the ATI programme compares with international equivalents and their respective strengths and weaknesses, including an indication of how different approaches – alongside other external factors – may affect the behaviour of aerospace companies (e.g. in terms of where they choose to invest in R&T) and ultimately, their performance. In practical terms, these case studies would have to rely on a combination of desk-based research and consultations with relevant experts and stakeholders in other countries.
reserved for those metrics that are directly related to the programme in question, i.e. activities, outputs, and a limited set of outcomes that are objectively verifiable and directly linked to the ATI-funded projects, as described as part of the ‘bottom-up’ approach below. We therefore refer to the compilation and analysis of sector performance data as “tracking” rather than monitoring.
44

In order to address the issue of attribution in a more formal, quantified way, we have developed a model to project the future performance of the UK aerospace sector based on current and recent trends, i.e. a proxy for without ATI support. This is based on a limited number of key external and internal variables and coefficients. Although this projection cannot be considered to be a pure counterfactual (insofar as the future performance of the sector will be affected by other government funding mechanisms that preceded the ATI, such as CARAD, BIS/TSB and RDA support), it does provide an indication of expected future performance assuming that government support for aerospace R&D would have continued at the scale and nature similar to that over recent years. The model also provides a framework to vary the assumptions for the (past and likely future) profiles of key drivers such as those discussed in the previous paragraphs, to arrive at a realistic projection of sector performance. As such, it is important to emphasise that the purpose of the model is not to generate an ex ante ‘policy on’ projection of the impact of the ATI programme on the sector’s performance. What the model will provide is a forward-looking ‘without support’ projection (i.e. pseudo-counterfactual) of expected performance (or a small number of scenarios to estimate the likely range of outcomes) against which the ‘with support’ actual outcomes can be compared (based on the data and indicators mentioned above), and hence some assessment of impact (or at least broad scale of impact) inferred (for more details on the models and its potential uses please see the final section of Chapter 4 and Annex F).
5.5.2. Summary In summary, the various strands of the ‘top-down’ approach will provide: (1) up-to-date evidence on a series of indicators of the UK aerospace sector’s performance that the ATI programme is intended to affect, based on the best available data sources; (2) a quantitative / qualitative review of key external factors that may have had a bearing on performance; and (3) a quantified ‘pseudo-counterfactual’ based on a model to estimate how the sector’s performance would have evolved without ATI support, taking into account key external factors. The combination of these results will allow for an approximation of the nature and broad scale of impact of the ATI programme, albeit only in the medium to long term (as significant economic benefits from the funded projects are unlikely to be felt in the first few years).
5.6. The ‘bottom-up’ evaluation approach
The ‘bottom-up’ part of the proposed evaluation methodology is meant to provide an alternative and complementary perspective to the sector-level data and estimates, by focusing on the specific activities (i.e. projects) that are co-funded by the ATI programme and their beneficiaries. The emphasis will be on data collection methods with beneficiaries themselves that ask them to report on the results of their respective projects. This will enable the evaluation to test and validate the programme theory (i.e. the causal impact chains depicted in the intervention logic), and thereby confirm the extent to which the ATI programme has contributed to longer-term outcomes and impacts. In doing so, the evaluation approach will need to take into account the heterogeneity of funded activities. This requires the collection of qualitative data on key issues such as technological developments and the role of the ATI programme in bringing these about, to complement and help interpret the quantitative data on aspects such as R&D spend, commercial benefits, jobs etc.
45

We therefore propose two main evaluation methods. The first of these is a beneficiary survey, the second a series of case studies. Key aspects of each are briefly discussed below, and more details are provided in Annex G. The implementation of these methods (including case study sample selection and segmentation of survey responses) will be underpinned by monitoring data, as well as a technology mapping exercise.
Table 5-3: Methods that form part of ‘bottom-up’ evaluation
Method Purpose Related indicators
Beneficiary surveys Collect self-reported data from beneficiaries (including lead and non-lead partners) on project results achieved to date, and expectations for further impacts in the future
Most project-level outputs and outcomes (see Table 3-1, Table 3-2 and Annex G)
Case studies In-depth review of a sample of projects to generate rich qualitative and quantitative data on implementation and results, including hard-to-assess aspects such as effects on the supply chain, spillover effects, etc.
Most project-level outputs and outcomes (see Table 3-1, Table 3-2 and Annex G)
Programme monitoring Systematically collect data to allow for analysis and segmentation of the ATI project portfolio, and to provide up-to-date information on a limited number of results that lend themselves to monitoring
Activities (see Table 3-1) Table Certain outputs and short-term outcomes (see Annex H)
Technology mapping Provide context for the evaluative research by identifying key technological developments, enabling the evaluation to assess the contribution of ATI-funded projects to progress in these areas in a targeted way
N/A
Source: SQW
5.6.1. Survey of ATI programme beneficiaries Beneficiary surveys are one of the most frequently used tools to evaluate programme performance. Obvious limitations of self-reported data notwithstanding, they provide a relatively straightforward way of testing relevant outputs, outcomes and impacts. In the case of the ATI programme, the various challenges around using beneficiary company data and attributing any changes therein to ATI-funded projects mean surveys (in combination with other methods) are the best possible way of investigating results for a broad cross-section of projects.
The survey should target at least all lead partners of completed (and potentially also ongoing) collaborative R&T projects co-funded by the ATI. The main purpose is to test the extent to which projects have generated the various desired outputs, outcomes and (to the extent possible) impacts, as specified in the intervention logic and the indicator lists derived from it. Thus, the survey questionnaire will need to include questions on issues such as the knowledge / IP created, relationships built and further collaboration, exploitation of R&T results (in the UK or elsewhere), jobs created/ safeguarded, (expected) commercialisation of results, etc. (for more detail please refer to Annex G).
46
In this context, it is important to reiterate the differences between projects (in particular as regards timescales to commercial impacts), which should be considered in survey design and/or analysis (either by using tailored questionnaires for different sets of projects, or by segmenting the responses according to key project characteristics). To enable this to happen, data on portfolio indicators would need to be systematically collected and recorded at the project application / approval / contracting stage (for more detail on what we mean by portfolio indicators see under monitoring below).
As noted in chapter 3 above, we expect the ATI programme to support in the range of 200-250 individual projects over its duration (although some of these will not be completed until after the 7-year programming period). The first significant wave of ATI projects will complete around 2016 (although some smaller-scale projects will come to an end before then). This provides an indication of the universe of beneficiaries who could potentially be surveyed. In total, at the end of the programme we expect the programme to have provided funding to around 200-250 lead partners (the vast majority of which will be large companies), and around 750-800 other partners (including significant numbers of SMEs and research institutions). However, there will inevitably be significant duplication, as many if not most beneficiaries will participate in more than one project. Thus, the total number of large companies benefiting is unlikely to exceed 40-50. In some instances, different departments / sub-entities within large companies will be responsible for different projects (and could therefore be asked to provide survey responses on their respective project or projects). Still, there will be some duplication, and since it would be unrealistic to expect the same individuals to fill in separate survey responses for more than two or three projects, it may not be possible to obtain a response for each and every project. An alternative could be to use a ‘portfolio’ approach to surveying (i.e. ask each beneficiary firm to complete a single response covering their entire project portfolio, or parts thereof). There are advantages as well as drawbacks to this, and the trade-offs would need to be considered carefully.
A number of aspects related to the survey would need to be explored further. These include:
• Timing and responsibility: The default option would be for a survey to be run by the contractor as part of an external evaluation. The drawback of this is that it only collects feedback at a discrete point in time, when different projects are at a different stage of their life cycle (and different amounts of time have elapsed since completed projects came to an end). To avoid this, the survey could be conducted annually, and administered either centrally (e.g. by Innovate UK) or by an external contractor commissioned to cover the whole evaluation period. The survey could be sent to all beneficiaries upon completion of their respective projects, and potentially again (with a modified questionnaire) two to three years after completion, when there is likely to be greater clarity around the actual use of the results and the associated impacts. We note that Innovate UK is in the process of trialling such a survey. Until it is clear if, when and how this will be rolled out, we need to assume that a survey would have to be carried out as part of an evaluation. In any case, we would caution against a broad brush approach to be rolled out across all programmes and sectors, given the importance of context. A tailored survey is likely to generate more robust and meaningful results.
47

• Survey method: Linked to the above is the question of the most appropriate method for implementing the survey – online, telephone, or even during a face-to-face interview. While online surveys are less costly and easier to implement for the likes of Innovate UK, telephone or face-to-face surveys tend to result in higher response rates and higher quality responses, as the interviewer can clarify and explain the meaning of questions in cases of doubt. Balancing the costs and quality, we suggest that the survey is undertaken by telephone, though there could be flexibility on this (including an option to combine methods) depending on the chosen approach to timing and responsibility, and the available budget.
• Surveying partners other than the lead partner: Ideally, feedback should be collected not only from the lead partner, but also from other beneficiaries, especially as the role of and impact on companies in the lower tiers of the supply chain is of particular interest. If possible, the survey should also be rolled out to non-lead partners (based on a modified questionnaire, as non-lead partners will be less able to comment on certain aspects). We understand that contact details of relevant representatives of non-lead partners are available and could be used for a survey, and have assumed that this will continue to be the case. Even so, it is important to note that the issue of duplication (i.e. companies participating in more than one project) also applies, and is likely to mean that it will not be possible to obtain responses from (or indeed, to target) non-lead partners on all projects.
• Surveying unsuccessful applicants: As noted previously, the nature of the intervention and the size and composition of the sector mean that a formal control or comparison group and use of statistical methods to estimate the impact would be inappropriate. However, it may be worth exploring what happened to projects that were not funded, so as to help assess project additionality. Whether this is practical depends to some extent on the prevailing process for project development and selection (i.e. projects developed on an individual basis or encouraged through open competitions). Our understanding is that only a relatively small share of the funding is allocated based on genuinely open competitions, with the majority of projects selected by the ATI via a staged approach involving the newly established Strategic Review Committee. Although some funding applications will have to be discarded as part of both processes, these may not provide a useful basis for assessing additionality – i.e. they may be smaller (in the case of open competitions) and/or different in nature (e.g. less fully developed, in the case of projects discarded during the first stages of the selection process) to the projects to which the bulk of ATI funding is awarded. In spite of this, consulting unsuccessful applicants (and/or those who register with Innovate UK but subsequently decide not to submit an application) could add significant value from a process evaluation perspective (see the section on evaluation timing above) in order to explore if and how the ATI contributes to channelling funding towards the ‘best’ projects.
The responses to the beneficiary survey will need to be analysed along two main lines of enquiry. In the first instance, appropriate statistical techniques should be used to develop aggregate values (or ranges) of key (economic) outcomes, such as effects on turnover, employment, etc., and based on this, a calculation of GVA. Secondly – and arguably more importantly, at least during the first interim evaluation – the survey data
48

should be used to assess the full range of outputs and outcomes (e.g. knowledge development, progress through TRLs, plans for investment in follow-up R&T, effects on staff skills and job creation, collaboration with other entities, etc.), in order to link these back to the intervention logic and systematically test to what extent this ‘holds true’ in practice. If the survey shows that short/medium-term outcomes occur largely as envisaged, this suggests that longer-term outcomes (which will typically not have materialised yet) are also likely to occur (though relevant external factors need to be taken into account). In order to test these relationships and timeframes in the most robust way possible, the survey results should be segmented by project type (especially projects pertaining to different stages in the ‘SEP’ model) for at least parts of the analysis, though we note that such segmentation is likely to result in small sub-samples.
5.6.2. Case studies The survey will provide self-reported data on the outcomes of most projects (depending on the response rate and the extent of duplication of beneficiaries). In order to explore and assess key elements and aspects in more detail, a series of in-depth case studies should be carried out. A case study focuses on a particular unit (in this case a project). It often uses a combination of quantitative and qualitative data. Case studies can be particularly useful for understanding how different elements fit together and how different elements (implementation, context and other factors) have produced the observed impacts. They are therefore particularly well suited for use as part of a theory-based evaluation approach. In the case of the ATI programme, case studies will have to play a key role in investigating key intended outcomes that are difficult to measure quantitatively across the entire project portfolio, such as impacts on the supply chain, or the question of if and how the results and IP resulting from the funded projects is exploited and (eventually) commercialised. They may also provide a basis for examining spillover effects.
Each case study would seek to generate data on project outcomes, both direct and indirect, and both those achieved to date and those yet to come (including the likelihood and order of magnitude of longer-term outcomes). They should also investigate to what extent these outcomes are attributable to the project, and what other (external) factors have played a role. In addition, they should aim to assess the implementation of projects and key success factors and barriers, including if and how the ATI’s role in strategy setting, project development, review and coordination has added value. The main methods for assembling the evidence for this are:
• Review of relevant project documentation, including the application and original business case, progress and close-out reports, and key outputs / deliverables (subject to receiving permissions to access this documentation)
• Interviews with beneficiaries, including the lead partner and, where relevant, other partners, in particular SMEs (in order to explore the effects in the supply chain) and research organisations that were involved
• Where appropriate, interviews with other stakeholders, such as ATI, BIS or Innovate UK staff, or (potential or actual) users of the results if appropriate.
49

The number and sampling for the case studies will depend to some extent on the timing of the evaluation and the available resources. In order to ensure an adequate breadth, a minimum of 10-15 case studies should be conducted. Ideally, these will be on projects that were finalised within the two to three years prior to the research (balancing time for outcomes to emerge with ‘corporate memory’ necessary to obtain meaningful feedback), but an early (interim) evaluation might also have to include ongoing projects that are nearing completion. The projects should be selected so as to provide a range that reflects the heterogeneity of the ATI programme, i.e. include both R&T and infrastructure projects, projects of different sizes (in terms of grant funding, duration and number of partners), on different themes, and – crucially – different expected timescales to impact (in line with the SEP model). As described earlier in this chapter, we suggest that case studies should be purposefully selected from those where impacts may be more likely to have occurred. The selection should, therefore, be informed by a technology mapping exercise (see below), so as to focus attention on those fields and projects where significant economic impacts are most likely.
Ideally, successive evaluations should select a set of new projects to review (based on the considerations outlined above), but also re-visit some of the earlier case studies so as to explore longer-term outcomes. Including such a longitudinal element would allow particularly interesting / significant projects to be tracked over time, and thereby help assess to what extent the projections made previously regarding likely impacts over the longer term (in particular regarding the exploitation and commercialisation of the R&T result) materialise in practice. This should also help revise assumptions and identify key contributing factors, and thereby refine the method for anticipating impacts with each successive evaluation.
Each case study would be written up in a concise self-standing report, which should follow a standard structure, and include both narrative and tables to present key quantitative data. For this report, the data collected for the case study should be analysed from two different but complementary main angles. First, the case studies provide an opportunity to test / challenge / verify the estimates beneficiaries provide for project outcomes more rigorously than the survey; case study reports should explain how the main reported quantified outcomes were arrived at, and provide estimates / ranges where relevant. Second, case studies should attempt to analyse the broader context of projects and their results, by taking a contribution analysis approach. This means using a combination of qualitative and quantitative data and information to critically construct a ‘contribution story’ that demonstrates the (current and/or likely future) contribution of the ATI-funded project in question to key outcomes (including longer-term ones that have yet to materialise fully). In doing so, this will also need to establish the relative importance of other (internal or external) factors, such as previous, parallel or subsequent R&T, whether ATI-funded or not, UK-based or not. This analysis would need to be informed by an understanding of relevant sector-wide technology trends (see the section on technology mapping below).
As noted above, the participatory evaluation methods (survey and case studies) should be underpinned by monitoring data on ATI project activities and outputs, as well as an understanding of the broader technological context and trends within which the research is conducted. The tools and processes to ensure this data and information is available are described in the following paragraphs.
50

5.6.3. ATI programme monitoring A monitoring system needs to be in place to ensure the collection of relevant data, both to inform the ongoing management of the ATI programme, and to feed into future evaluation. At present, project monitoring is undertaken by Innovate UK in accordance with the framework it applies to all programmes for which it has responsibility. This framework focuses on delivery against the project plan. Although no fundamental changes to this process are envisaged, as part of the present study we have explored options for adding to or tailoring certain elements for application specifically to the ATI programme. Details of this are presented in Annex H. In summary, the recommended changes / additions relate to:
• systematic collection of data on a range of portfolio indicators (e.g. on R&T themes, expected timescales to impact, involvement of SMEs and the research base) at the application / approval / contracting stage
• as part of regular (quarterly / annual) project monitoring, collect data on a limited number of key outputs, namely progress through technology readiness levels (TRLs), direct jobs created / safeguarded
• at project close-out, collection of data on a range of further outputs, including private and other public funding invested / obtained, knowledge / IP developed, and staff upskilled.29
The monitoring data would obviously need to inform the design and feed into the results of evaluations to be conducted in future. The data on the portfolio indicators should be used to guide the evaluation approach and analysis, in particular as regards the selection of case studies (which should be reflective – even if not necessarily strictly representative – of the portfolio as a whole). The data could also be used to segment and analyse beneficiary survey results. For example, it might be instructive to analyse the economic outcomes separately for projects at different stages of the SEP model, as ‘Secure’ projects could be expected to generate economic returns relatively quickly, whereas ‘Position’ projects will not.
5.6.4. Technology mapping Future evaluations should involve a systematic review / mapping of the technological development in the core areas of aerospace R&T. This should lead to the identification of a limited number of the most recent and emerging technologies that are likely to be key to the competitiveness of the UK industry in future, so that the evaluation could ‘track back’ to see how far ATI projects had contributed to their development (including, potentially, through spillover effects). These technologies could be summarised in ‘technology fiches’, which should include a summary description of the global technological challenge and the
29 It is worth noting that Innovate UK is currently exploring the feasibility of launching a survey to collect data on outcomes and impacts as part of the project close-out process. If this were to become a reality, further discussions would have to be held to clarify if and how the standard survey could / would need to be tailored to the ATI programme, and determine if and how this could complement or potentially replace the beneficiary surveys foreseen as part of the ‘bottom-up’ evaluation approach (see paragraph 0, first bullet point).
51

commercial opportunities specifically for the UK, and an overview of the likely trajectory of progress / key technological advances expected in the short, medium and longer term.
These fiches would provide important context for the evaluative research, primarily by:
• enabling the strategic selection of (clusters of) projects as case studies that address key technological developments, and therefore have the potential to generate significant economic returns, and/or illustrate how the ATI programme contributes to tackling longer-term challenges
• allowing case studies to take a contribution analysis approach, whereby the evaluation assesses ATI-funded projects not in isolation, but in terms of their contribution (relative to relevant external factors) to larger technology trajectories; this would require wider consultation work with companies and industry representatives to consider wider influences on technology trajectories as part of a ‘tracking back’ approach
• facilitating the exploration of synergy effects between ATI-funded research as well as infrastructure projects, by showing how they collectively work towards key technological advances
• helping to identify potential gaps and shortcomings that should be addressed in future.
In practical terms, the technology mapping requires significant input from industry experts, who are experienced in aerospace R&T and able to assess and put into perspective both past and likely future technological developments. This should ideally be a panel of academic experts covering a range of relevant disciplines and specialisms, potentially recruited not only from UK but also international institutions. In order to achieve buy-in and build consensus, the identification and development of a limited number of key themes / trends may also require consultations with a range of stakeholders.
It will be important to ensure independence from the ‘horizon scanning’ work undertaken by the ATI itself to define and update its technology strategy. ATI’s work is forward looking to identify where it should focus future R&T investments given the UK’s relative competences. By contrast, the technology mapping proposed for the evaluation is backward facing, aiming to identify concrete and specific recent or emerging technological developments where a contribution of ATI-funded projects to such developments can be tested. It is worth emphasising that the exercise is intended to provide context for the evaluation, direct it towards the activities that appear most impactful, and provide a framework for meaningful contribution analysis, rather than pre-empt its results.
5.6.5. Summary In summary, the ‘bottom-up’ evaluation approach will use monitoring and beneficiary survey data to assess the outputs and outcomes of as much of the portfolio of ATI-funded projects as possible (and segmented by types of projects). In addition, a series of case studies informed and framed by an understanding of the current and expected future state of development of key technologies, will provide rich data to assess outcomes in greater details, as well as explore implementation, success factors and barriers, and the role of
52

external factors. By taking a theory-based approach to the analysis of this data (i.e. using it to test the extent to which the intended results and assumptions in the intervention logic can be observed and hold true in practice), the ‘bottom-up’ evaluation will provide evidence to assess the plausible contribution of the ATI programme to the economic impacts that should be observable from the ‘top-down’ approach.
5.7. Triangulation of evidence to assess impact
Both the ‘top-down’ and the ‘bottom-up’ evaluation approaches and methods have their merits, and help shed light on different but complementary aspects of the ATI programme’s effects on the sector:
• ‘Top-down’ analysis tracks the actual performance of the UK aerospace sector in terms of a number of headline economic indicators, without distinguishing between individual companies that have benefitted from the ATI programme to a greater or lesser extent. By comparing this against a modelled projection, we can gain a sense of how the performance differs from the trajectory the industry was on prior to the launch of the ATI programme. This ‘pseudo-counterfactual’ can also be adjusted based on the actual evolution of key external drivers, including global demand. In this way, it will be possible to infer, in the first instance, the extent of the ATI programme’s impact on total R&D spending across the sector, and following on from this, whether the increase (or decline) in R&D spending has had the expected positive effect on sector performance.
• ‘Bottom-up’ analysis provides a detailed understanding of the portfolio of projects supported by the ATI programme, and compiles self-reported data on the outcomes of these projects, as well as a more in-depth analysis of a sample of projects that are expected to be particularly impactful based on the technological developments they address. For reasons discussed previously, it is not possible to measure quantitatively the economic impact on beneficiaries through comparison with a suitable control group. However, the evaluation will provide evidence on project additionality (i.e. would the projects have gone ahead without ATI funding?), and estimates of the outcomes that can be attributed to ATI projects.
By combining both the ‘top-down’ and the ‘bottom-up’ perspectives, the evaluation should be able to arrive at estimates of the order of magnitude of the impact, as well as the ATI programme’s necessity and sufficiency (e.g. was it a necessary but individually insufficient factor in producing the observed outcomes?). In line with much of the current thinking around the merits of theory-based approaches to establishing causality, the evaluation would attempt to verify the causal chain, and thereby assemble an evidence-based contribution story. Each ‘bottom-up’ case study should also seek estimates of quantifiable outcomes (although these will of course be reliant on a degree of judgment by consulted firms and the evaluators, and in some cases the range of confounding factors will make this difficult if not impossible). These could in turn be used to sense-check the estimates of the overall direction and broad magnitude of impact based on comparing actual sector performance with the modelled pseudo-counterfactual.
Contribution analysis could serve as an overarching framework for the evaluation as a whole, with the ‘bottom-up’ work attempting to establish the extent to which the projects
53

funded through the ATI programme have contributed to the changes in sector performance observed via the ‘top-down’ analysis, while also considering the role of other (external) factors such as global demand, R&D support schemes in competitor countries, etc.. Contribution analysis is an appropriate approach for this, as it allows assembling the various pieces of evidence in a ‘contribution story’ by constructing alternative/competing theories of change that emphasise different factors, testing these theories using/generating a range of quantitative and qualitative evidence, and then putting them together into a narrative to tease out the actual contribution of the programme.
In all this, it is important to distinguish between different timeframes for evaluation. In the short term (approx. the first five years of the programme), the actual impact of the ATI programme on the performance of the sector is likely to be limited, as few of the project results will have come close to generating economic returns. Therefore, the usefulness of the ‘top down’ approach in the short term is equally limited. A potential interim evaluation undertaken before 2020 would therefore need to rely mainly on evidence gathered via ‘bottom-up’ approaches, including (early) project outcomes, and contributions to equipping UK companies for likely future technological breakthroughs. In the longer term, the ‘top-down’ perspective becomes more meaningful, as one would expect the innovation capacity and products developed with ATI support to begin to have a significant effect on sector performance. It is at this stage that the triangulation of evidence from both approaches should prove most valuable.
5.8. Addressing key issues and challenges
At the beginning of this Chapter, we listed a number of key challenges for evaluation. Below is a brief summary of how the proposed approach outlined above would seek to address these challenges:
• Evolution of ATI and its ‘drivers’: Although a number of legacy projects were allocated to the ATI programme in the first few years of its existence, reflecting funding commitments made before the launch of the ATI, these should be considered as outside of the scope of the evaluation (for the sake of clarity and consistency), which should instead focus only on projects launched from 2013/14, and thus affected (at least potentially) by the ATI and the seven-year commitment in some way. As to the gradually increasing role of the ATI in shaping the project portfolio, this should ideally be explored via the case studies, and as part of a process evaluation to supplement the impact evaluation that is the focus of this scoping study.
• Long development timeframes: The evaluation needs to explicitly acknowledge that the full impacts of many of the funded projects will not be felt until the second half of the 2020s or even the 2030s. Sufficient attention therefore needs to be paid to intermediate outcomes that can be observed over the short / medium term, and provide an indication of the potential of projects to ultimately generate economic impacts.
• Varying project types & timescales: The systematic programme monitoring based on a set of portfolio indicators should provide reliable and detailed data on project types to inform and guide evaluation design, and ensure it reflects the diversity.
54

Perhaps most importantly, the systematic categorisation of projects according to the SEP model should allow for realistic expectations as to when economic impacts can be observed, and to focus the evaluation research accordingly (e.g. by segmenting the survey data on outcomes, and/or by including a selection of ‘secure’ projects among the case studies).
• Isolating ATI projects and attribution: As noted, isolating the exact impact of ATI-funded projects will not always be possible due to the range of confounding factors (including previous or follow-on R&T projects). The ‘bottom-up’ evaluation (in particular the case studies) will use contribution analysis to systematically assess the extent to which projects contributed to outcomes, while acknowledging the role of external factors.
• Absence of a ‘control group’: The evaluation will use two complementary approaches to assessing causality in the absence of a control group. A modelled ‘pseudo-counterfactual’ (i.e. quantified projection of the sector’s performance without ATI support) can be compared with actual performance, and taking into account key external factors, will provide an indication of the direction and order of magnitude of impacts (albeit only in the medium to longer term). The theory-based ‘bottom-up’ evaluation uses an alternative approach to assessing causality that does not require a formal counterfactual, namely, the verification of the programme ‘theory’ by testing and assessing the envisaged intermediate results and underlying assumptions.
• Reliance on self-reported outcomes: Respondent biases cannot be eliminated completely, nor can their likely effect be easily quantified. The risks will need to be systematically analysed and minimised by appropriate data collection and analysis strategies (such as sensitivity testing), including careful sampling, clear guidance for the case study research, and appropriate survey questionnaire design. In this context, we have also considered the potential for data linking (i.e. accessing key economic data for beneficiaries from existing administrative datasets, e.g. via their Companies House registration number). However, we believe that data linking would add limited value, as e.g. turnover or employment growth in supported companies as such is very difficult to attribute to the intervention (in the absence of a control group), especially in the case of large companies where the effect of ATI support will likely be small relative to reported metrics in administrative datasets. Nonetheless, BIS may wish to explore further the feasibility of using data linking as an option to complement or ‘sense-check’ the self-reported data from surveys and case studies.
Another significant practical challenge relates to the split between the civil and defence sectors. As noted previously, most official data sources do not distinguish between the two, which obviously calls into question the relevance and usefulness of the data for the purpose of evaluating the ATI programme (which only focuses on civil aerospace). Estimates of the proportion of the sector's production attributable to civil vary between 50-70%, but the evidence currently available is limited (see Chapter 4 and Annex C). This issue will need to be addressed further to ensure the validity of the ‘top-down’ evaluation approach.
55

5.9. Assessing spillovers
Another issue that is of particular interest, but inherently challenging to assess, are spillover effects. Past evaluations of aerospace R&D programmes have often struggled to find strong evidence of spillovers, particularly into other sectors.30 However, the potential for significant spillovers is a key part of the rationale for government intervention in aerospace R&T, and the evaluation will therefore have to assess the evidence on these effects. In principle, spillover effects from research projects can occur in a variety of ways, including:31
• knowledge spillovers occur because knowledge created by one firm is typically not contained within that firm, and thereby creates value for other firms and other firms' customers
• market spillovers occur because the workings of the market or markets for an innovative product or process create benefits for consumers and non-innovating firms
• network spillovers occur because the profitability of a set of interrelated and interdependent technologies may depend on achieving a critical mass of success, and so each firm pursuing one or more of these related technologies creates economic benefits for other firms and their customers.
In the context of the ATI programme, key “market spillovers” have been discussed already, such as efficiency, environmental and service improvements following from new technologies developed. Of the other two types, knowledge transfer seems by far the more likely source of significant spillover effects, mainly because the concentration and oligopolistic nature of the aerospace market (in particular whole aircraft and engines manufacturers) make network spillovers unlikely (at least in the relatively short term). Knowledge spillovers (i.e. instances where a firm other than the original innovator uses the new knowledge to copy or imitate the commercial products or processes of the innovator, or may use the knowledge as an input to a research process leading to other new technologies) can be intentional (i.e. with the consent of the innovator, possibly in exchange for a fee) or unintentional (e.g. when a researcher leaves and takes a job at another firm). The latter category is likely to be more frequent, but also more difficult to detect.32
30 According to the evaluation of CARAD, “interviews showed that in practice there was a considerable gap between technology being considered applicable to other sector and subsequent transfer taking place.” (BERR: Evaluation of the Civil Aeronautics Research and Technology Demonstration (CARAD) Programme, May 2008). The evaluation of the German aerospace R&D programme LuFo concluded that the number of results that were being used outside of the beneficiary firms, or even in other sectors, was still limited, as beneficiaries typically have a keen interest in their exclusive exploitation (Institut für Innovation und Technik: Das Luftfahrtforschungsprogramm des Bundesministeriums für Wirtschaft und Technologie – Zentrale Ergebnisse der Evaluation 2012). 31 This categorisation is based on Jaffe, Adam B.: Economic Analysis of Research Spillovers – Implications for the Advanced Technology Program. December 1996 32 For a discussion of knowledge spillovers in the aerospace sector, see the case studies conducted as part of Frontier Economics: Rates of return to investment in science and innovation. A report prepared for BIS,
56

The evaluation will therefore have to rely primarily on the case studies in order to detect spillover effects to the greatest extent possible. The technology mapping preceding and informing the case study work should help to identify potential for spillovers that could then be verified and traced back to ATI-funded projects where relevant. Consultations with research partners, including the Centres from the High Value Manufacturing Catapult, may also lead to the identification of spillovers, as these are most likely to be involved in knowledge diffusion through their involvement in numerous R&D activities across different (high value manufacturing) sectors.
5.10. Economic evaluation
Economic evaluation involves comparing the benefits of the policy with its costs, so as to assess whether the former justify the latter. There are two main approaches for this:
• Cost-effectiveness analysis (CEA), which values the costs of implementing and delivering the policy, and relates this amount to the total quantity of outcome generated, to produce a “cost per unit of outcome” estimate (e.g. cost per additional job created/safeguarded).
• Cost-benefit analysis (CBA), which goes further than CEA by placing monetary values on the changes in relevant outcomes (e.g. the value of jobs). This means that CBA can examine the overall justification for a policy (“Do the benefits outweigh the costs?”), as well as compare policies which are associated with quite different types of outcome.
As discussed at length above, it is extremely challenging to quantify the full range of impacts of the ATI programme, or to determine the exact extent to which observable changes in sector performance can be attributed to ATI-funded projects, partly because of the often very long timescales for final impacts to materialise. By applying ‘bottom-up’ approaches, the evaluation will assess a range of intermediate effects, but some of these will be difficult to value in monetary terms. Furthermore, since case studies will be selected purposefully to focus on those projects where effects are likely to be most significant and/or detectable, one cannot simply ‘gross up’ the identified outcomes and impacts to the level of the programme (although one could of course present the aggregate outcomes from the case studies as the lower end of a range and/or apply some modest level of grossing up given the evidence available on the rest of the portfolio of projects).
In view of this, the evaluation should quantify and monetise the effects as far as possible, but this may result in ranges of effects, some of which are unlikely to be monetised. Formal CBA is therefore unlikely to provide a fair representation of the value for money of the programme. A form of CEA will be most appropriate, which may involve some indicative estimates of return on investment, if the estimates for key metrics such as turnover or employment can be monetised in terms of value added. Alternatively, and in particular at interim stage, it may be most useful to look at estimates of the costs of
July 2014. For a more general discussion (without specific reference to the aerospace sector), also see London Economics: The impact of investment in intangible assets on productivity spillovers. BIS Research Paper number 74, May 2012
57

developing/progressing technologies, based on a series of illustrative examples, ideally drawn from different stages of the ‘SEP’ model.
Where possible, the assessment and monetisation of benefits as part of economic evaluation should refer back to and be consistent with the ex-ante value for money assessments BIS carries out for all project applications that request £10 million of grant funding or more. As part of the assessment, BIS estimates the likely net benefits, i.e. gross benefits (from jobs created or safeguarded, spillovers, skills and training, and wider socio-economic benefits) adjusted for deadweight, displacement, substitution, risk. Case studies on projects that have undergone such an assessment should check these estimates, and analyse (a) for ongoing projects, whether the assumptions underlying the ex-ante assessment are still valid, i.e. the project is still expected to deliver value for money as previously appraised, or (b) for finalised projects, compare the ex-ante estimates with actual results (keeping in mind that some impacts will often only materialise several years after project completion). Depending on the number of large (over £10 million) projects within the ATI portfolio, and the resources available for evaluation, it may also be worth considering whether a systematic review of all ex ante value for money assessments against actual delivery would be feasible as part of the interim and final evaluations.
On the issue of calculating costs, the monitoring system should collect data on both government funding, and firms’ own investment (which in principle should at least match the public investment). The costs should also include an allowance for Innovate UK’s management of the programme, and the part of the ATI’s operating costs that covers the oversight of the R&T grant programme.
58

6. Next steps and recommendations The content of this report provides our proposals for a comprehensive framework for impact and economic evaluation that takes into account and responds to the various challenges posed by the nature and design of the ATI programme and the size and structure of the UK aerospace sector. It thus constitutes the basis on which the first interim evaluation (foreseen for 2016/17 according to the recommended timetable in Table 5-1) and subsequent evaluations can be commissioned.
The present study has addressed relevant issues and developed concrete proposals to the extent that the available information and resources have allowed. There are, however, a number of additional aspects that fell outside the scope of the project and/or the ‘area of influence’ of the consultants, but should be addressed / taken forward over the course of the coming months so as to ensure that future evaluations can be launched and implemented effectively and efficiently. These include:
• BIS, ATI and Innovate UK should discuss the ATI programme monitoring system and agree if/how the recommendations (see Annex H) can be taken forward. Comprehensive and relevant monitoring data is one of the key prerequisites for future robust impact and economic evaluation. This includes the collection of additional portfolio data at the proposal / contracting stage (which is crucial for ‘real-time’ project portfolio monitoring as well as appropriately targeting the evaluation effort in future), establishing quarterly / annual monitoring (to collect data on a few highly relevant outcome indicators, including jobs and skills), and a discussion of the feasibility and desirability of changes to the project close-out process.
• In view of the recommendation to collect data on jobs and skills as part of regular monitoring, it would be useful to systematically ask applicants to specify ex ante estimates so as to be able to assess the actual data in light of these (this is currently only required for projects above £10 million, for which BIS conducts ex ante value for money assessments).
• The ATI and/or Innovate UK should also discuss and agree as soon as possible an approach to retrospectively classifying projects launched to date (and in the time that passes before the monitoring system is adapted) along the lines of the portfolio indicators (see Table 3-3) in order to ensure this information is available for all projects in time for the first interim evaluation. This should be fairly straightforward once the categories for the classification (e.g. themes and expected timeframes to impact) are clearly defined and agreed.
• The work on developing the model to project future sector performance without ATI support has provided the ‘proof of concept’ in terms of a realistic model design and structure and its use as part of evaluation. Specific aspects could be refined further, as described in Annex F.
59

• Despite exploring different options and deriving an approximate estimate, the present study was not able to definitively resolve the issue of the relative shares between the civil aerospace and defence sectors in most official data sources. Given the importance for deriving accurate performance measures of the sector that the ATI programme aims to support (civil aerospace only), this warrants further research / analytical work.
Table 5-2 and Table 5-3 and the related text in chapter 5 set out clearly the recommendations for the core methods to be used in the evaluation of the ATI programme. The precise scale and frequency of data collection (in particular for surveys and case studies) will need to be determined, partly dependent on the resources available. In addition, BIS, in conjunction with partners, may wish to come to a view on how far additional methods are adopted, such as country comparisons, surveys of non-lead partners and surveys of unsuccessful applications. Again, this will be partly dependent on the resources available.
60

Annex A. ATI programme intervention logic
An intervention logic (also known as a logic model, logical framework or theory of change) is a graphical depiction of the logical relationships between the resources, activities, outputs and outcomes of a programme. It is a tool frequently used by funders, managers, and evaluators to understand and present the desired effects of a programme at different levels, the causal relationships between them, and the underlying risks and assumptions (“the programme theory”), and thereby helps design, focus and conduct a (theory-based) evaluation of its effectiveness.
In its simplest form, intervention logic is a linear causal model of boxes and arrows. However, the ATI programme is an example of an intervention that is both complicated (i.e. multiple agencies and causal strands) and complex (i.e. with emergent, potentially non-linear and/or disproportionate outcomes).33 This represents a serious challenge for designing a meaningful yet not overly intractable logic model, as well as for the eventual evaluation. To address this challenge, we have designed a model that consists of three key elements. These three elements (the ATI programme’s core logic, the internal (ATI) drivers and external factors) are shown in the schematic overview below.
Figure A-1: Elements of the ATI programme intervention logic
Source: SQW
33 Cp. Rogers P: Using Programme Theory to Evaluate Complicated and Complex Aspects of Interventions. Evaluation, Vol. 14(1): 29 – 48, 2008
61

The core of the intervention logic is shown in red in the centre of the diagram. It contains a relatively traditional, linear logic chain, including how the context and rationale translate into objectives, and how the inputs and activities (i.e. government funded collaborative R&T projects) are expected to bring about a series of relevant outputs, outcomes and impacts.
In addition, for any future evaluation of the ATI programme, it will be important to understand if and how the creation of the ATI may have affected these R&T projects and their ability to generate the desired results. In other words, how are ATI R&T projects “different” from their predecessors, and how is the R&T landscape affected? These aspects are covered under ATI drivers (blue box at the top of the diagram above).
Finally, it is important to explicitly acknowledge that a range of factors that are external to the ATI may have a significant influence on the achievement of ATI programme objectives (i.e. materialisation of the intended benefits). Therefore, the intervention logic includes a number of assumptions, or external factors that need to be considered when assessing the results (blue box at the bottom of the diagram).
In the following pages, we begin by focusing on the logic chain from the context all the way through to the long-term outcomes and impacts of the ATI programme. We then turn our attention to the drivers and assumptions at the top and bottom of the diagram, and investigate how they are likely to feed into a ‘theory of change’.
A.1. ATI context, rationale and objectives
The context for the ATI programme is determined by the economic and policy landscape laid out in the coalition government’s industrial strategy, and more specifically in the strategy for the aerospace sector.34 In summary, key aspects include: the aerospace sector’s success (with estimated growth of 7% per annum since 2008) and its major importance among the UK’s advanced manufacturing sectors (in 2013 it generated around £28bn worth of revenue); the strong global growth prospects (with global air traffic expected to double over 2015-30); the fact that the UK’s competitive position is in decline (and its capabilities are becoming increasingly fragmented and fragile) as a result of decades of under-investment; the need to invest in research and development due to the rapid pace of technological advances that is expected, in particular with a view to the introduction of the next generation of aircraft beginning sometime in the 2020s; and finally, the belief (although not yet backed by significant amounts of evidence) that there are strong interdependencies between R&T and subsequent production, servicing and maintenance, and that investment in the former also helps to anchor high-value manufacturing jobs in the UK.
The market failures that justify government investment in aerospace R&T can be summed up as follows:
• High market and technical risk: Aerospace research is characterised by typically long development timeframes, gaps to commercial readiness and low “private”
34 HM Government and AGP: “Lifting off – Implementing the Strategic Vision for UK Aerospace”, 2013
62

returns. The timescales for a return on investment and the associated risks are often too great for companies to bear on their own.
• Information and coordination failures: The risks alluded to above are even harder to bear lower down the supply chain. The barriers to truly collaborative R&T are further exacerbated by sub-optimal inter-firm collaboration and a tendency for ‘top-down’ communication through the supply chain, making it difficult for SMEs to engage in R&T.
• Externalities not internalised: Aerospace R&T has significant potential for technology spillovers into other advanced manufacturing sectors, such as automotive.
• Not a level playing field: Although not a market failure in the strict economic sense, it is nonetheless a fact that the UK’s international competitors are investing heavily to support their respective industries, and that the UK’s aerospace sector would be at a significant disadvantage without government aid.
In light of the above, the global objectives the ATI is intended to contribute to can be defined as follows (drawing on the aerospace strategy “Lifting Off”):
• Sustain or grow the future market share of the UK’s aerospace sector
• Sustain or create UK employment in high value-added work
To achieve this, the ATI itself35 has defined its specific objectives as follows:
• Provide technology leadership: create, promote and embed an aerospace technology vision and strategy, and thereby help preserve, develop and enhance critical technological capabilities and infrastructure.
• Maximise funding impact: maximise funding opportunities and back R&T projects consistent with its strategy, so as to develop and embed UK technological know-how and capabilities.
• Convene strategic partnerships: bring together government, industry, centres of excellence and academia to identify areas of mutual benefit and facilitate programmes of work amongst stakeholders.
• Elevate the UK’s international profile: promote the UK’s aerospace capability internationally, to develop strong and impactful relations with sector leaders and institutions abroad.
35 Building Momentum for UK Aerospace. Aerospace Technology Institute 2015, published February 2015
63

A.2. ATI inputs and activities
The inputs specifically related to the ATI projects, and relevant for the evaluation framework are the £1.1bn of public funding, further matched by industry over the 7 year period to 2020.
The activity to be evaluated is the ATI programme, i.e. the portfolio of R&T projects it funds. The wider strategic leadership role of the ATI is not the focus of the evaluation as such. Nonetheless, the ATI plays a key role in prioritising and managing the project portfolio, and this aspect of its role can be expected to have an effect on the projects and the results they generate. This does of course need to be taken into account by the evaluation, and is discussed further below (under ‘ATI drivers’). In other words, the evaluation should assess how the ATI’s role affects project outputs, outcomes and impacts, but not the leadership role itself.
The portfolio of R&T projects varies substantially. To cut through this heterogeneity, at the programme level – and for the purposes of the evaluation - projects are classified in three main ways. These are outlined below and presented graphically in Figure A-2 which follows.
• Different time horizons (sometimes expressed in terms of the ‘SEP’ Model – i.e. Secure, Exploit and Position36) – broadly described by market alignment in terms of addressing opportunities in the shorter, medium or longer term
• Four Priority Value Areas: whole aircraft, structures, propulsion and systems
• Five Enabling Technologies and Capabilities: aerodynamics, manufacturing, materials, technology infrastructure, and process and tools.
36 Note the aerospace industrial strategy set out a ‘PEP (Protect, Exploit and Position)’ model as a strategy for identifying and prioritising the actions needed to support the delivery of the Aerospace Industrial Strategy and capture the opportunities for short, medium and long term growth. This model was renamed to ‘SEP’ (Secure, Exploit and Position) in the final ATI Technology Strategy, in response to feedback from stakeholders.
64

Figure A-2: The ATI Market aligned technology strategy – overview
Source: Building Momentum for UK Aerospace: Technology Institute 2015
In line with the ‘SEP’ model introduced in the aerospace industrial strategy, projects that form part of the ATI programme can be divided into three categories:
• Secure (0-5 years): Collaborative research and technology developments in which the UK could potentially lose part of the value chain. This is particularly in relation to the next wave of airframe refits, which are experiencing fierce global competition for parts. Such projects are expected to deliver (economic) returns relatively soon after the initial investment.
• Exploit (Up to 2025): Collaborative research and technology developments looking to exploit the next wave of refits which will provide “early wins” in the incremental stage of product development. Such projects are expected to take longer to deliver significant returns.
• Position (Beyond 2025): Collaborative research and technology projects aiming to make the UK well placed in terms of technological capability to compete for parts on “next generation aircraft”. It is likely that this will involve larger companies such as Rolls Royce, Airbus or GKN launching long term demonstrator projects, involving the supply chain and the research base to develop “blue sky” technologies. Such projects are not expected to deliver economic returns until well into the next decade.
The three classifications above reflect the ‘juncture’ of the aerospace sector. While the “next generation aircraft” is likely to be over twenty years away from entering service, there are current airframes that need to be upgraded particularly in the narrow body market. As a result, both industry and the ATI expect technology developments to be required for both nearer term upgrades, and longer term “step change” technologies for the next generation of aircraft.
65

Of the five Enabling Technologies and Capabilities (developed as part of the ATI annual strategy 2015), investment in technology infrastructure is relatively stand alone and is worth highlighting here. Up to 20% of ATI funding is to be allocated to capital infrastructure projects to build or upgrade testing facilities or equipment required for the development of new aerospace technologies. Once completed, this infrastructure may then be used by subsequent R&T projects (whether ATI-funded or not). The outcomes generated by these projects are slightly different and discussed briefly in the sub-sections below.
The timeframes over which the four ATI classified projects will deliver on outputs, outcomes and impacts vary considerably given the current industry “juncture”. Secure and exploit projects will work on far tighter timescales than position projects, as they are focused on incremental changes in technology development. Position projects however will generate project outputs and outcomes over a far longer time period. This is reflected in the intervention logic (see Figure A-3 below).
A.3. ATI expected results
A broad range of results are expected from ATI projects, reflecting the diversity of projects outlined above, as well as the complexity of aerospace R&T systems. The (immediate) outputs, (short and medium term) outcomes and (longer term) impacts that are discussed below underpin the KPI performance indicators developed as part of the KPI report, and the evaluation methodology outlined as part of this report.
A.3.1 ATI outputs
• R&T spend related outputs
• R&T Knowledge creation related outputs
The most direct output of ATI funded activity is related to industry R&T spend to match the government funding. By providing a substantial proportion of investment cost, the ATI will leverage matched private sector R&T spending. This may include the funding of large “demonstrator projects” launched by the likes of Rolls Royce, or the creation of capital infrastructure such as full scale testing rigs and wind tunnels. Inherent in this process is the safeguarding and creation of the R&T jobs in the aerospace sector that are directly linked to the ATI-funded projects.
There are also various outputs related to the processes and results of knowledge creation. ATI funded collaborative R&T projects will not happen in isolation, and many will involve the broader supply chain, many of which are SMEs. Collaboration is also expected between businesses and the research base resulting in the potential for new partnerships. Collaborative R&T is expected to lead to the development of new products, processes and technologies, which may require some form of Intellectual Property protection such as patents or steps taken by businesses to prevent disclosure (such as restricted access or non-disclosure agreements). Patents as a measure on its own, are likely to have limitations.
66

A.3.2. ATI short & medium term outcomes
• Technology related outcomes
• Investment related outcomes
• Commercial outcomes
• Skills related outcomes
The short and medium term outcomes in the intervention logic are driven by the expectation that over time the ATI projects successfully navigate the mid technology readiness levels (TRLs). Through the development of new technologies, the collaborative R&T projects will build a more “inclusive” and broader reaching industry skills base by exposing more of the labour force to cutting edge science and research. Over the medium term, further collaborations between established partners may be expected.
For a new technology to reach market readiness, further investment in R&T is expected especially around TRL five. This is where technologies go through the full scale rig-testing stages of development and require significant investment. Further investment required at this stage is expected to drive changes in R&T expenditure as a % of GVA or business capex measures. In addition to increased domestic investment, foreign direct investment in aerospace R&T is expected in the UK as ATI support – in relative terms - makes the UK a more attractive place to locate R&T activity.
Over the medium term, one would also expect outcomes related to business GVA growth and supply chain developments. Following commercialisation and the securing of technology on new or existing airframes (or parts), rising orders - driven by market demand - are expected to deliver GVA growth. To satiate end user demand the technologies will move into the production phase, and in doing so safeguard or potentially create production and manufacturing (and possibly even servicing and maintenance) jobs in the UK supply chain.
A.3.3. ATI long term outcomes & impacts
• Technology development & production related outcomes
• Market share and reputation related outcomes
• Technology spill over related outcomes
Following commercialisation of ATI funded technologies (reaching TRL 9), rising orders from air-framers, strengthening of the UK supply chain and increased value added per employee are all expected to drive improvements in UK sector competitiveness. Cost or time savings brought about from technologies that progress through the TRLs will also enhance the UK’s position in this regard.
67
By extension, improvements in the UK aerospace industry’s competitiveness brought about by the ATI R&T programme will have positive implications for market share. Improvements in the number of original equipment manufacturers (OEMs) in the UK could also be expected. Similarly, capturing the proportion of “flying technologies”37 originally developed – if not produced – in the UK could give a reasonable proxy for the UK’s increased global market share.
Once new technologies reach the market and are successfully incorporated into airframe operating systems, their life time will typically span a number of decades. As a general industry rule of thumb, new technologies need to offer a 10-15% improvement in operating efficiency, either for existing or next generation aircraft. This typically means a 10-15% reduction in fuel burn, or carbon emissions generally through weight saving e.g. the development of carbon composite wings. Crucial long term outcomes associated with ATI technologies are therefore improvement in commercial aircraft operating costs, and reduction in CO2, NOx and/or noise emissions.
There is evidence to support the spill-over impacts of aerospace R&D. Technology advancements in the aerospace sector can contribute to technological breakthroughs and/or productivity improvements in other industries, especially transport, communications, navigation and broadcasting. Technologies developed with ATI funding may spill over into other sectors through a number of channels. These include through knowledge sharing or directly applying technologies to other products; dissemination of research by research partners and particularly how it might be transferable to other products; interactions in the supply chain; or labour movements between industries.
A.4. ATI results chain summary
The narrative outlined in the previous section is presented in visual form in Figure A-3. The indicative timeframes and the ATI project classification outlined in the activity section above are also reintroduced to develop a comprehensive latter stage to the ATI intervention logic.
37 Technologies which are incorporated into operational aircraft.
68

Figure A-3: Latter stages of the ATI intervention logic and timeframes
Source: SQW
A.5. ATI theory of change
As noted at the beginning of this chapter, the linear logic chain shown above is an important part of the intervention logic of the ATI programme, but it focuses only on the R&T projects, and does not capture fully the complexity of the intervention. Most importantly, it does not explicitly address the important question of if and how the programme adds value to and enhances the impact of the projects, e.g. through the role of programme leadership in particular played by the ATI. There are also a number of factors that the ATI has no control over that may influence the programme’s effectiveness. The ensuing paragraphs highlight the most important of these internal and external drivers and assumptions, and thereby provide the basis for a theory of change which can inform the eventual evaluation.
A.5.1. Internal (ATI) drivers and assumptions As noted above, when considering the intervention logic for the ATI programme, it is important to consider not only how collaborative R&T projects generate results, but also how the creation of the ATI can enhance and add value to these projects. Based on our review of relevant documentation and the consultations with various stakeholders, we understand that the new ATI programme is expected to change the landscape for government-funded aerospace R&T (and thereby drive impact) in three main inter-related ways. These are: (1) more funding, (2) more certainty, and (3) ‘better’ projects. While stakeholders hold differing views about the relative importance of each of these, it is clear that a future evaluation will need to consider all three in order to substantiate to what extent it has made a difference in practice.
More funding: At the most basic level, the government’s commitment of £150 million per year represents a significant increase over the amounts available specifically for the
69

aerospace sector in the recent past (see Figure A-5 below), and should therefore allow for a larger number and/or greater scale of collaborative R&T projects to be carried out.
More certainty: The ad-hoc nature and resulting lack of longer-term certainty about the amounts available for aerospace R&T were frequently cited as putting the UK at a competitive disadvantage in the past. The fact that ATI programme funding is committed over seven years (i.e. beyond the life of a single government spending review round or even a single Parliamentary term) is meant to remedy this, signalling a longer-term commitment to the sector and providing businesses with the planning certainty they require to base more of their R&T activity in the UK.
‘Better’ projects: The creation of the ATI is not only about more / larger-scale R&T operations. It is also meant to ensure the available (public and private) funds are spent as effectively and efficiently, so as to best embed advantages gained through R&T funding into the UK and maximise economic return. The ways in which the ATI is intended to contribute to this can be conceptualised as follows:
• Project content and mix: The ATI is intended to facilitate a strategic approach to directing funding towards those projects that are likely to add the most value. Based on a market-aligned technology strategy (aspects of which were first outlined in a document published by the ATI in February 2015), it will develop an annual portfolio plan, so as to ensure that the content of individual projects, as well as the overall mix of projects, are in line with strategic priorities.
• Project design and delivery: The ATI is also expected to play a role in influencing how projects are designed and delivered, inter alia by fostering the involvement of the ‘right’ partners (including SMEs, the supply chain, and research centres and universities, where appropriate); coordinating capital investment in – and use of – the ‘right’ R&T infrastructure; joining the dots between different projects and partners; and connecting ATI-funded R&T with other (national or international) sources of support.
These drivers can be expected to enhance ATI-funded R&T projects and their results in a number of ways, most importantly:
• More funding: Quite simply, the increased amounts made available by the government should be at least matched by private R&T spend (output), which may also stimulate subsequent industry investment in R&T (short term outcome).
• More certainty: Similarly, the hope is that the planning certainty resulting from the 7-year commitment made by government will influence industry decisions on where to conduct their R&T, and thereby also result in higher private (inward) investment in R&T (short term outcome).
• ‘Better’ projects: This driver can be expected to affect projects in a number of ways, in particular by helping ensure projects that are funded are successful in getting through TRLs (short / medium term outcome) and ultimately result in commercial products that the market wants (long term outcome). In the process, the ATI’s role in project design and delivery should also lead to greater engagement of the supply
70

chain and research base (outputs), which may feed through to a range of beneficial outcomes in the medium / longer term.
Further to these ‘drivers’, there are certain ‘internal’ assumptions that are central to the logic of the ATI programme, in particular the expectation that R&T conducted here tends to lead to subsequent manufacturing, service and maintenance activity in the UK. An indication of where in the logic chain these internal drivers and assumptions are most likely to have an effect is provided in Figure A-4 below.
Figure A-4: Internal drivers and assumptions in the theory of change
Source: SQW
The three sets of drivers are expected to begin to take effect at different points in time. More certainty was achieved from the moment the government’s commitment was formalised. More funding is provided gradually as the amounts of government grant funding increases from its previous levels to £150 million per year. The third driver, ‘better’ projects, can be expected to materialise once the ATI begins to play an active role in managing the project portfolio. This is currently expected to happen sometime in the financial year 2015-16.
The diagram below illustrates this, as well as underlying funding patterns, by using historical aerospace R&T funding data, and projecting ATI (as well as some legacy) funding that has already been committed into the future. The diagram was developed by making certain assumptions and extrapolations,38 and should therefore only be seen as an illustration, rather than a completely accurate depiction, of funding patterns. Another
38 Future funding for ATI and certain legacy projects was projected by assuming an equal distribution across the project duration. The amounts for ATI6, 7 and 8 are based on proposed rather than actual funding figures.
71

point to note is that EPSRC funding39 is not included, since it focuses on academic research at the lower technology readiness levels (typically 1-3), and is therefore not directly relevant in this context. We note, however, that EPSRC funding, and the quality of research outputs produced, may have a bearing on the nature of projects that are brought forward for ATI funding, and is therefore included among the external factors listed in the next sub-section.
Figure A-5: Trends in government support for aerospace R&T and the ATI drivers
Source: SQW based on data provided by BIS
A.5.2. External factors and assumptions While the internal drivers and assumptions should – in theory - act as a catalyst to the ATI outcomes, there are “bigger picture” phenomena which might equally drive changes in the outcomes identified in the intervention logic. These will need to be considered as part of the evaluation, and especially when considering the counterfactual of the ATI programme. The most significant assumptions are discussed in turn below:
• UK programme not significantly “out-bid” elsewhere: This is of particular relevance to the increased foreign direct investment indicator. It assumes that other governments around the world do not significantly increase the support for aerospace R&T in response to the ATI model. This will change the “playing field” in
39 According to the EPSRC itself, the current portfolio of direct relevance to the aerospace sector currently consists of 107 research grants totalling around £158 million, and 23 PhD training grants totalling £93 million.
72

terms of the relative attractiveness of the UK to locate R&T activity. More broadly this might affect longer term competition outcomes identified in the intervention logic.
• Sector skill base is able to keep pace with demand: This is in relation to increased domestic and foreign direct investment in aerospace R&T. The UK aerospace industry is currently renowned for its labour force. It represents a genuine competitive advantage. The intervention logic assumes that this is not diminished and able to meet demand, for example through retaining and attracting labour with the right skills over the medium-to-long-term.
• Quality of EPSRC funded projects remains similar: This relates to the progress through the early stage TRLs short term outcome. One of ATI’s key role is to align projects with early TRL research, much of which is funded by the EPSRC. The quality of recent early stage research and research currently being undertaken and in the immediate pipeline, largely influenced by EPSRC, is therefore assumed to be of similar, or sufficient quality to ensure progress through early TRL’s under the ATI banner.
• Consolidation of the UK supply chain: This is particularly in relation to the stronger supply chain medium term outcome. The current “direction of travel” for the industry is for a consolidation of the supply chain led particularly by the larger businesses such as Rolls Royce and airbus as they onshore more of their research and development activity. Inherent in this process should be a strengthening of partnerships forged between UK businesses in the supply chain. The ATI should add weight to this process, but the wider “direction of travel” must be accounted for.
• Exchange rates broadly “stable”: This is in relation to the higher exports medium term outcome. While the impact of changes to the exchange rate are normally internalised by aerospace exporters, in the form of lower profit margins, substantial unforeseen movements in the exchange rate could potentially affect this outcome. It is therefore assumed that movements in exchange rate are within “industry bounds”.
• Continued global demand for air travel: This affects the longer term commercial ATI outcomes which drive sector GVA growth. Any changes to the current trajectory of global demand caused by unforeseen events such as 9/11 or substantial increases in oil prices are assumed to be nil in the intervention logic.
• Global airframe competition remains on its current trajectory: This assumption relates particularly to the UK’s market share related outcomes. While competition is growing in the global airframe race – and in some cases fiercely with the likes of China – it is assumed that no “step change” in competition occurs which would significantly change the UK’s current aerospace market share.
• Productivity gains do not offset job creation: This is in relation to job creation outcomes. It assumes that technological advances brought about by ATI projects do not significantly reduce the need for manufacturing, production and engineering
73

jobs. It specifically applies to any ATI capital investment in the manufacturing or production process which offsets the need for skilled labour.
The exogenous assumptions discussed above largely affect the latter stages of the intervention logic. Figure A-6 presents a summarised intervention logic model and where the various assumptions “fall” in terms of outcomes. This is not clear cut, and it is likely that certain assumptions affect multiple stages of the intervention logic, but an indicative positioning is provided for illustration.
Figure A-6: External assumptions in the theory of change
Source: SQW
74

Annex B. The project baseline One of the issues a future evaluation of the ATI programme will have to consider is if and how ATI-funded projects differ from the aerospace R&T projects that were funded by government before the ATI was created. To develop this baseline of pre-ATI projects, we have analysed data on a number of relevant BIS-funded (and TSB / Innovate UK-managed) R&T schemes and projects launched between 2005 and 2013.
We have also reviewed data on a number of projects launched during the first year of the ATI’s existence (2014). These data do not form part of the baseline as such; it is presented for two reasons: to explore whether any trends are detectable already; and to inform how the ATI portfolio could be categorised to inform evaluation. In this context, it should be noted (as discussed in our progress report) that the influence of the ATI on the make-up of the project portfolio has been very limited to date, with substantive influence only likely to occur from later in 2015 and 2016 onwards. We would therefore not expect to find any significant differences between the two data sets that could be attributed to the ATI’s influence as such.
• Data on projects within these schemes were sourced from Innovate UK’s public website.40 The schemes included in the analysis are listed at the end of this Annex. In total, the analysis includes:
• 94 pre-ATI projects from 14 different schemes, amounting to a total government grant of £299.1 million
• 51 ‘early’ ATI projects from nine different schemes, amounting to a total government grant of £236.1 million.
In considering the results presented in the remainder of this Annex, it is important to remember the purpose of the analysis, which was to understand the nature, size, scope, duration etc. of projects, in order to develop a baseline (of pre-ATI projects) and use the ‘early’ ATI projects to make broad estimates as to the likely make-up of the project portfolio to inform the approach to future evaluations (e.g. with regard to sample sizes for surveys and case studies). The analysis was not carried out on a comprehensive set of projects, but on a sample (based on what data was available from the public website). The sample size was sufficient to arrive at meaningful results regarding ‘typical’ projects and beneficiaries, but the totals (in terms of grant funding across all projects) are not accurate (i.e. do not reflect and should not be taken as an indication of the entire project ATI portfolio). In this context, it is also worth keeping in mind that a number of pre-ATI (‘legacy’) projects that were still ongoing when the ATI was launched – and therefore feature in our analysis as pre-ATI projects – have subsequently been funded from the ATI budget (i.e. the £150 million per year committed by government).
40 https://www.gov.uk/government/publications/innovate-uk-funded-projects NB: the Aerospace projects are coded within the ‘Transport’ or ‘Large’ categories).
75

Basic characteristics of the projects included in the sample for analysis are shown in Table B-1 below. They show that the average pre-ATI project was awarded a grant of just over £3 million, lasted for three years, and involved between four and five partners. Based on these data, the first generation of ATI projects seem to be about 50% larger in terms of grant sizes. The duration of early ATI projects is slightly shorter though only by just over four months. The average number of partners is the same between pre-ATI and early ATI projects.
Table B-1: Basic characteristics of pre and early ATI projects
Pre-ATI projects ‘Early’ ATI projects
Number of projects 94 51
Avg. government grant (£) 3,181,772 4,629,598
Avg. duration (in months) 35.9 31.4
Avg. number of partners 4.4 4.4 Source: SQW based on data extracted by BIS from the Innovate UK website
B.1. Project partners by types of organisations
An important question for future evaluation is the extent to which ATI projects are more “inclusive” than similar projects in the past, i.e. successfully involve the supply chain (in particular SMEs) and/or the research base. As shown in Table B-2, slightly over one third of the projects launched in the years prior to the creation of the ATI involved an SME, and these received 3% of the grant funding, while 65% went to large firms (according to the Innovate UK’s categorisation). The remaining 32% was for the research base, which includes academic institutions, research and technology organisations (RTOs) and Catapult centres.41
41 Please note that the Aircraft Research Association (ARA) and the Manufacturing Technology Centre (MTC) are classified as medium enterprises in the Innovate UK data, while other Catapult centres (the National Composite Centre at the University of Bristol, and the University of Sheffield Advanced Manufacturing Research Centre with Boeing) are classified as academic institutions. Following consultations with BIS and ATI, we decided that, for the sake of consistency, the ARA and the MTC should be re-classified and included among the research base with the other academic institutions.
76

Table B-2: Pre-ATI projects: Involvement of partners by type
Type of partner Avg. no. of partners per project
Avg. funding for organisations of this type per project
% of total grant funding
% of projects containing at least one listed partner type
Large companies 2.0 £2,071,986 65.1% 97%
SMEs 0.5 £97,209 3.1% 38%
Medium companies 0.2 £48,005 1.5% 15%
Small companies 0.3 £39,960 1.3% 20%
Micro companies 0.0 £9,243 0.3% 3%
Research base 1.9 £1,012,577 31.8% 82%
Total 4.4 £3,181,772 100.0% n/a Source: SQW based on data extracted by BIS from the Innovate UK website
The make-up of the partnerships for the first generation of ATI projects is broadly similar, though the number of SMEs involved has increased slightly (from 0.5 to 0.8 per project), and at least one SME is involved in almost two thirds of ‘early’ ATI projects (compared to 38% of pre-ATI projects). The SME share of the funding has also increased in both absolute and relative terms (see Table B-3). On the other hand, although the funding for the research base has increased very slightly in absolute terms, this represents a small decrease in relative terms (from 32% to 25%) due to the larger average size of ‘early’ ATI compared with pre-ATI projects.
Table B-3: ‘Early’ ATI projects: Involvement of partners by type
Type of partner Avg. no. of partners per project
Avg. funding for organisations of this type per project
% of total grant funding
% of projects containing at least one listed partner type
Large companies 1.7 £3,142,760 67.9% 88%
SMEs 0.8 £352,944 7.6% 65%
Medium companies 0.3 £182,638 3.9% 27%
Small companies 0.5 £165,058 3.6% 31%
Micro companies 0.1 £5,247 0.1% 6%
Research base 1.8 £1,133,894 24.5% 73%
Total 4.4 £4,629,598 100.0% n/a Source: SQW based on data extracted by BIS from the Innovate UK website
77

B.2. Main individual beneficiary organisations
The tables below show the top ten organisations in each category according to the amount of funding received from pre-ATI projects (note again that the classification of SMEs and large companies is based on Innovate UK’s categorisation).42 The data show the prevalence of Rolls-Royce and, to a lesser extent, Airbus among the large companies receiving grant funding. On the other hand, there is a fairly widespread and equitable involvement of academic institutions, although it is worthy of note that two organisations (the MTC and the ARA) account for over a third of pre-ATI project funding for the research base.43
Table B-4: Pre-ATI projects – top ten large companies in terms of funding
Organisation Total funding (£) % of all funding No. of projects
Rolls-Royce £93,595,461 31.3% 54
Airbus £41,855,279 14.0% 33
AgustaWestland Limited £14,871,281 5.0% 7
GKN £12,960,608 4.3% 9
BAE Systems £7,553,842 2.5% 13
GE Aviation Systems Limited £4,489,948 1.5% 10
Short Brothers PLC £2,795,102 0.9% 5
QinetiQ £2,369,960 0.8% 6
EADS UK Limited £1,948,432 0.7% 2
Dunlop Aircraft Tyres Limited £1,467,193 0.5% 1 Source: SQW based on data extracted by BIS from the Innovate UK website
42 NB: The same organisations are sometimes listed under slightly different names in the datasets. We have harmonised this, and also summed funding received by sub-divisions within large companies (e.g. Rolls-Royce) under the ‘mother’ company. 43 The MTC and the ARA are slightly peculiar cases, in that they were classified as medium-sized companies in the Innovate UK data (see footnote 13 above). While the MTC ‘behaves’ like a university in that it consistently receives100% grant funding, this varies in the case of the ARA, which on different projects was funded at rates ranging from 50% to 100%.
78
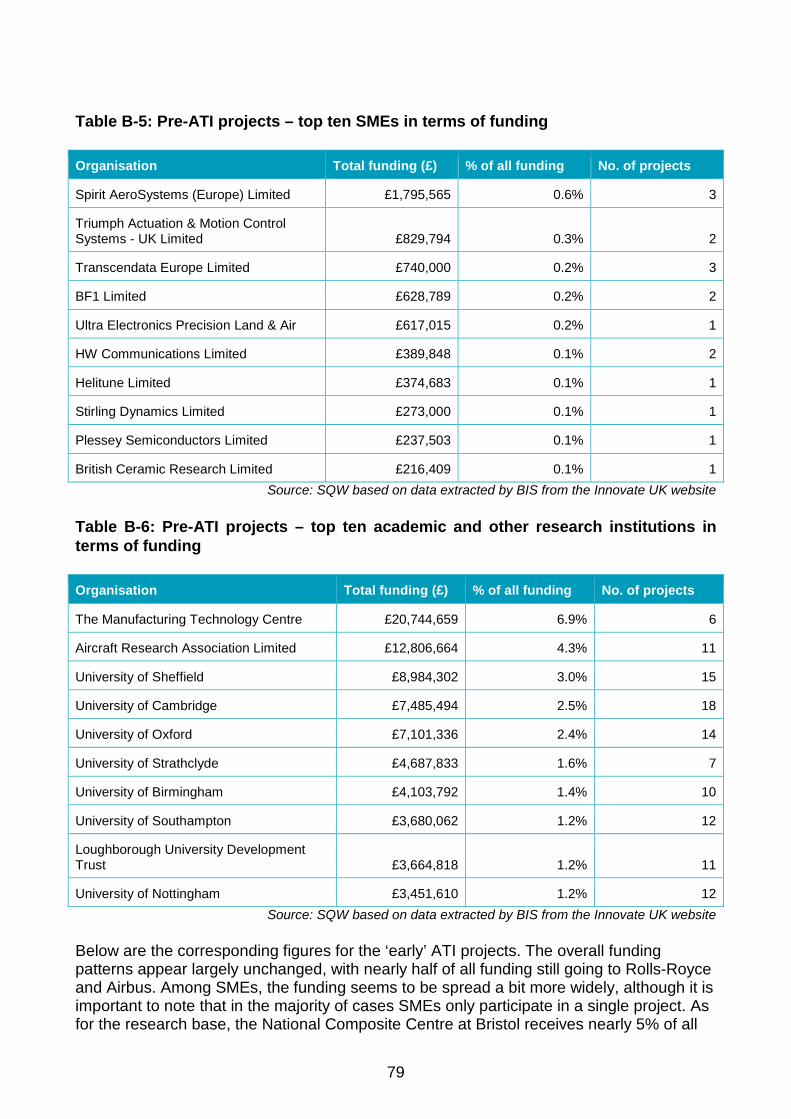
Table B-5: Pre-ATI projects – top ten SMEs in terms of funding
Organisation Total funding (£) % of all funding No. of projects
Spirit AeroSystems (Europe) Limited £1,795,565 0.6% 3
Triumph Actuation & Motion Control Systems - UK Limited £829,794 0.3% 2
Transcendata Europe Limited £740,000 0.2% 3
BF1 Limited £628,789 0.2% 2
Ultra Electronics Precision Land & Air £617,015 0.2% 1
HW Communications Limited £389,848 0.1% 2
Helitune Limited £374,683 0.1% 1
Stirling Dynamics Limited £273,000 0.1% 1
Plessey Semiconductors Limited £237,503 0.1% 1
British Ceramic Research Limited £216,409 0.1% 1 Source: SQW based on data extracted by BIS from the Innovate UK website
Table B-6: Pre-ATI projects – top ten academic and other research institutions in terms of funding
Organisation Total funding (£) % of all funding No. of projects
The Manufacturing Technology Centre £20,744,659 6.9% 6
Aircraft Research Association Limited £12,806,664 4.3% 11
University of Sheffield £8,984,302 3.0% 15
University of Cambridge £7,485,494 2.5% 18
University of Oxford £7,101,336 2.4% 14
University of Strathclyde £4,687,833 1.6% 7
University of Birmingham £4,103,792 1.4% 10
University of Southampton £3,680,062 1.2% 12
Loughborough University Development Trust £3,664,818 1.2% 11
University of Nottingham £3,451,610 1.2% 12 Source: SQW based on data extracted by BIS from the Innovate UK website
Below are the corresponding figures for the ‘early’ ATI projects. The overall funding patterns appear largely unchanged, with nearly half of all funding still going to Rolls-Royce and Airbus. Among SMEs, the funding seems to be spread a bit more widely, although it is important to note that in the majority of cases SMEs only participate in a single project. As for the research base, the National Composite Centre at Bristol receives nearly 5% of all
79

‘early’ ATI grant funding (compared to only 1% under the pre-ATI projects), whereas the relative share of nearly all other institutions has declined.
Table B-7: ‘Early’ ATI projects – top ten large companies in terms of funding
Organisation Total funding (£) % of all funding No. of projects
Rolls-Royce £87,842,708 37.2% 22
Airbus £21,648,905 9.2% 13
GKN £9,959,153 4.2% 2
GE Aviation Systems Limited £8,474,582 3.6% 6
Short Brothers PLC £6,697,660 2.8% 2
Thales UK Limited £3,213,162 1.4% 2
BAE Systems (Operations) Limited £2,407,361 1.0% 4
Messier-Dowty Limited £2,200,688 0.9% 2
Safran Power £2,154,735 0.9% 2
AgustaWestland Limited £2,125,186 0.9% 1 Source: SQW based on data extracted by BIS from the Innovate UK website
Table B-8: ‘Early’ ATI projects – top ten SMEs in terms of funding
Organisation Total funding (£) % of all funding No. of projects
Spirit AeroSystems (Europe) Limited £5,581,575 2.4% 5
Hybrid Air Vehicles £1,473,583 0.6% 1
Crompton Technology Group Limited £1,204,557 0.5% 1
Oxsensis Limited £982,621 0.4% 1
Ilika Technologies Limited £864,601 0.4% 1
Helitune Limited £757,803 0.3% 1
CFMS Limited £639,000 0.3% 1
Triumph Actuation & Motion Control Systems - UK Limited £616,905 0.3% 1
Magnomatics Limited £486,571 0.2% 1
FGP Precision Engineering Limited £482,767 0.2% 1 Source: SQW based on data extracted by BIS from the Innovate UK website
80

Table B-9: ‘Early’ ATI projects – top ten academic and other research institutions in terms of funding
Organisation Total funding (£) % of all funding No. of projects
University of Bristol: The National Composite Centre £10,976,697 4.6% 12
The Manufacturing Technology Centre £7,488,940 3.2% 9
University of Sheffield £5,958,745 2.5% 9
Aircraft Research Association Limited £4,238,062 1.8% 9
Newcastle University £2,297,079 1.0% 2
Advanced Manufacturing Research Centre £2,193,255 0.9% 2
University of Southampton £2,164,528 0.9% 5
Swansea University £2,135,044 0.9% 5
University of Cambridge £2,026,352 0.9% 4
University of Oxford £1,614,425 0.7% 2 Source: SQW based on data extracted by BIS from the Innovate UK website
Table B-10: Main themes addressed by R&T projects – by number of projects
Addressed by % of…*
R&T themes …Pre-ATI projects …‘Early’ ATI projects
Priority aircraft value streams 70% 64%
Whole aircraft 7% 10%
Structures 5% 13%
Propulsion 31% 18%
Systems 28% 22%
Enabling technologies and capabilities 30% 36%
Aerodynamics 10% 7%
Manufacturing 7% 15%
Materials 6% 7%
Technology infrastructure 3% 4%
Process & tools 4% 3%
Source: SQW
* NB: Fractional counting was used, i.e. projects addressing multiple themes were divided evenly across those themes.
81

B.3. Research themes
We have sought to explore the main themes addressed by the projects, by categorising them according to the ATI’s “priority aircraft value streams” (whole aircraft, structures, propulsion, and systems) and “enabling technologies and capabilities” (aerodynamics, manufacturing, materials, technology infrastructure, and process & tools).44 For projects that addressed more than one of these categories, fractional counting was used. The results of this process suggest that the majority of pre-ATI projects focused on propulsion and systems, while the ‘early’ ATI projects exhibit a slightly more equal distribution across the priority value streams and enabling technologies and capabilities (see Table B-10 above).
Table B-11 shows the funding (as opposed to the number of projects) dedicated to each theme, using the same approach (i.e. an equal split of the budget across themes for projects that addressed more than one). As can be seen, this results in a significantly
Table B-11: Main themes addressed by R&T projects – by funding
Addressed by % of funding for …*
R&T themes …Pre-ATI projects …‘Early’ ATI projects
Priority aircraft value streams 66% 60%
Whole aircraft 10% 9%
Structures 6% 12%
Propulsion 40% 26%
Systems 11% 13%
Enabling technologies and capabilities 34% 40%
Aerodynamics 9% 9%
Manufacturing 11% 22%
Materials 8% 6%
Technology infrastructure 3% 2%
Process & tools 4% 1%
Source: SQW
* NB: Fractional counting was used, i.e. funding for projects addressing multiple themes was divided evenly across those themes.
44 These categories inform the ATI’s Technology Strategy, and are outlined inter alia in the ATI’s 2015 document “Building Momentum for UK Aerospace”. The classification of pre-ATI and ‘early’ ATI projects into these categories was undertaken by aerospace expert Dr Andrew Mair, based on the public descriptions. 131 of the 145 projects (pre and early ATI) could be classified in this way. For the purpose of our analysis, we have interpreted the category “whole aircraft” to include “big systems” projects, such as whole wing, whole engine, or engine/wing integration type projects. This is because the alternative, “structures”, seemed less appropriate. However, we are unsure whether this approach coincides with current ATI coding, which may use “structures” for such (usually Airbus-led) projects.
82

higher percentage for propulsion, at the expense of systems, which suggests the former are addressed by significantly larger projects than the latter (for both pre-ATI and ‘early’ ATI projects). Manufacturing also accounts for a higher share.
B.4. Areas for further consideration
The data presented above provide an analysis of the profile of pre-ATI and early ATI projects against which the future portfolio of ATI projects can be compared. In order to further enhance the robustness and usefulness of this baseline analysis, the following issues should be considered:
The data presented above relates to 94 pre-ATI and 51 ‘early’ ATI projects for which data could be retrieved from the Innovate UK website in March 2015 (see below). This provides a reasonably comprehensive and representative picture, but it should be noted that the actual picture of the ATI programme will evolve from this ‘early’ set of funded projects.
Some questions have been raised as to whether some of the companies listed as SMEs are in fact small or medium-sized enterprises. We have assumed that Innovate UK’s categorisation has followed the standard EU-wide definitions and are therefore accurate.
The categorisation according to the ATI’s value streams, technologies and capabilities seems useful, as these categories should remain valid in future. However, it is worth noting that “our” classification above was made by a single expert, based on only publicly available (and hence incomplete) information. We recommend that the ATI itself carries out a retrospective analysis of past projects, according to these categories (and, if deemed useful, further sub-categories). In addition, ATI and Innovate UK should ensure that all future projects are systematically categorised along the same lines.
Finally, it should also be considered if/how distinctions can be made between: (i) projects that aim to lead to economic returns over different timescales, taking into account the SEP (Secure, Exploit, Position) model set out in the aerospace industrial strategy45; and (ii) R&T projects and capital infrastructure projects.
B.5. Aerospace R&T schemes included in the project baseline analysis
The following tables list all the schemes (both pre-ATI and ‘early’ ATI) and corresponding projects that were included in the baseline analysis. It should be noted:
• There may have been other projects within certain schemes (as well as other schemes, such as HVM (pre-ATI) or ATI6), but data on these could not be retrieved from the Innovate UK website, and they are therefore not included in the analysis.
It has been brought to our attention that a number of other, potentially large projects funded in the late 2000s are also missing from the dataset, e.g. Environmentally Friendly Engine (led by Rolls-Royce) and Next Generation Composite Wing (led by Airbus). We assume that this is because the projects were concluded more than five
45 HM Government and AGP (2013): Lifting Off: Implementing the Strategic Vision for UK Aerospace, p. 23
83

years before the ATI was created in 2014, and or funded by others (e.g. the RDAs), and that the dataset is reasonably complete as regards BIS / TSB / Innovate UK projects.
Table B-12: Pre-ATI projects included in the baseline analysis
Scheme Total govt. grant (£m)
Number of projects
Competition date
Earliest start date
Latest end date
ENVIRONMENT04 £7.7 6 2005 Jan-05 Oct-09
CFMS £8.7 1 2007 Feb-07 Oct-10
SAMULET1 £39.8 6 2009 Jan-09 Apr-13
PROTOCOL £39.5 12 2009 Jan-09 Mar-16
SILOET1 £44.8 7 2010 May-09 Nov-13
RTVP £5.9 1 2010 Apr-10 Mar-14
NGVL £9.9 3 2010 Oct-10 Mar-15
HITEA1 £5.9 11 2012 Sep-12 Dec-15
SAMULET2 £25.0 8 2012 Apr-12 Dec-15
SILOET2 £40.0 10 2012 Dec-13 May-17
AeroCentre1 £29.0 6 2013 Jan-12 Dec-14
AeroCentre2 £15.0 7 2013 Dec-12 Mar-16
HITEA2 £12.8 15 2013 Dec-13 May-17
CATAPULT £15.0 1 2013 Jan-14 Jan-15
TOTAL £299.1 94 Source: SQW based on data extracted by BIS from the Innovate UK websit
84

Table B-13: ‘Early’ ATI projects included in the baseline analysis
Scheme Total govt. grant (£m)
Number of projects
Competition date
Earliest start date
Latest end date
ATI0 £2.1 1 2014 Aug-13 Sep-14
ATI1 £14.9 4 2014 Jul-13 Dec-16
ATI2 £53.8 8 2014 Oct-13 Mar-17
ATI3 £41.9 8 2014 Jan-14 Dec-17
ATI4 £39.9 7 2014 Oct-13 Mar-19
ATI5 £54.8 10 2014 Jan-14 Aug-17
ATI CRD1 £18.8 11 2014 Apr-14 Dec-17
ATI7 £6.9 1 2014 Dec-14 May-18
ATI8 £3.0 1 2014 Jul-14 Mar-17
TOTAL £236.1 51 Source: SQW based on data extracted by BIS from the Innovate UK website
85

Annex C. The sector baseline C.1. A detailed analysis of the sector baseline
This annex provides the detailed analysis that was undertaken to derive the headline indicators for the sector baseline presented in chapter 4 of this report. The first section of this annex presents a full descriptive overview of the trends in the headline indicators (on the current performance of UK aerospace). Separate data have been provided to BIS covering a national perspective (presenting the indicators at the national level e.g. for turnover, exports, GVA and employment) and a global perspective (presenting the indicators for UK market share and global output). In the second section we discuss the issues encountered in constructing the historical dataset and present our proposed solution from the options identified for resolving these.
All indicators were constructed using the following definition of aerospace:
• SIC(2007) 30.3 Manufacture of air and spacecraft and related machinery
• SIC(2007) 33.16 Repair and maintenance of aircraft and spacecraft.
Where data are not available for this classification or in this level of detail, we derived estimates consistent with this definition. Any references to the “aerospace industry” reflect statistics covering these two SIC codes, unless explicitly stated otherwise. One clear caveat is that the data include both civil and defence segments of the market, and this section should be read and interpreted in that context.
In looking at industry performance through a set of headline indicators, there were numerous challenges; the specifics of these issues, as well as the suggested solutions. These are highlighted in the next section.
We first present outcome indicators for UK aerospace, such as turnover, GVA and employment. We then proceed to look at some drivers of these outcomes. One aspect is global demand, which drives UK exports and affects import values. Another aspect is productivity, which is partly driven by R&D spending and investment. Finally, we look at what the implications are for the UK’s role in the global aerospace market, and offer concluding remarks and further avenues of research.
C.1.1. Aerospace industry performance The aerospace industry is global in nature. Over the past 10-20 years the industry has flourished, in part driven by strong growth in air travel demand over the same period (p.59, Airbus, 2014). This makes national aerospace performance susceptible to international factors and global shocks, such as the SARS epidemic in 2003 and the Financial Crisis in 2009.
86

C.1.2. Trends in the performance of UK aerospace C.1.2.1. Headline indicators The various headline indicators of UK aerospace are presented and discussed below.
Table C-1: GVA and turnover in UK aerospace
Variable Units Levels Growth rates* (% pa)
2000 2008 2013 98-01 02-08 09-13 98-13
GVA (constant)** £m 8,064 8,299 10,840 3.0 -0.1 7.5 2.2 Turnover (constant)** £m 20,430 21,736 27,022 -2.7 3.0 3.4 1.1
Source: CE calculations and national statistics.
* In this and subsequent tables, growth rates are calculated as compound annual growth rates (CAGR)
** The base year is 2010 for constant price indicators
***In this and subsequent tables, four compound annual growth rates have been presented; the first covers the years before September 11th 2001, the second reflects the performance of the aerospace
sector prior to the global recession, the third examines the performance of the aerospace sector during the period of recovery from the global recession, and the fourth covers the whole period under
examination
The preferred measure of aerospace industry activity is gross value added (GVA), because it directly measures the contribution of the aerospace industry to the economy. Turnover, in contrast, can be used as a proxy of the worth of aerospace outputs produced and sold. From 2000 to 2013, the aerospace industry’s contribution as measured by real GVA increased by over £2bn, and real aerospace output increased by over £6.5bn. The overall growth rate of GVA was faster than that of turnover over the whole period under consideration. Turnover experienced negative growth between 1998 and 2002 but grew positively at a higher rate than GVA between 2002 and 2008. It is evident that on both measures, the aerospace industry has grown most significantly after the global economic recession.
87

Figure C-1: Trends in UK aerospace GVA and turnover, 1998-2013
0
2000
4000
6000
8000
10000
12000
0
5000
10000
15000
20000
25000
30000
1998 2000 2002 2004 2006 2008 2010 2012
GVA
leve
ls (£
m)
Turn
over
leve
ls (£
m)
Year
Turnover (constant price 2010) GVA (constant price 2010)
Source: CE calculations and Annual Business Survey
The overall narrative of sustained growth in turnover and GVA conceals some fluctuations over the last 15 years. The decline observed in the levels in 2000 could in part be due to company restructuring: in 2000, when Aeronautic Defence and Space Company N.V. (EADS) formed, BAE Systems remained independent. The reduced involvement of a major British company in European aerospace could explain the decline in activity.
Turnover fell by 13% between 2001 and 2002. However, there was positive growth of turnover in all years up to 2013. GVA fell sharply in 2003, reflecting the continued negative impact of the events in 2001, as well as the outbreak of the SARS epidemic in 2003. Apart from a pick-up in 2007, GVA was largely flat between 2003 and 2009.
The effects of the global recession on GVA were more severe than on turnover; GVA fell by 13% between 2008 and 2010 whilst turnover increased. GVA comprises wages and profits that tend to be more responsive to short-term shocks. Nevertheless, following a 10% fall in 2010, GVA rebounded sharply in 2011, with growth of 17%, and continued to grow in 2012 and 2013.
Table C-2: Employment in UK aerospace
Variable Units Levels Growth rates* (% pa)
2000 2008 2013 98-01 02-08 09-13 98-13
Employment 000’s 120 104 110 0.4 -0.9 -1.7 -0.5 Source: CE calculations and workforce jobs data, Business Register and Employment Survey
88
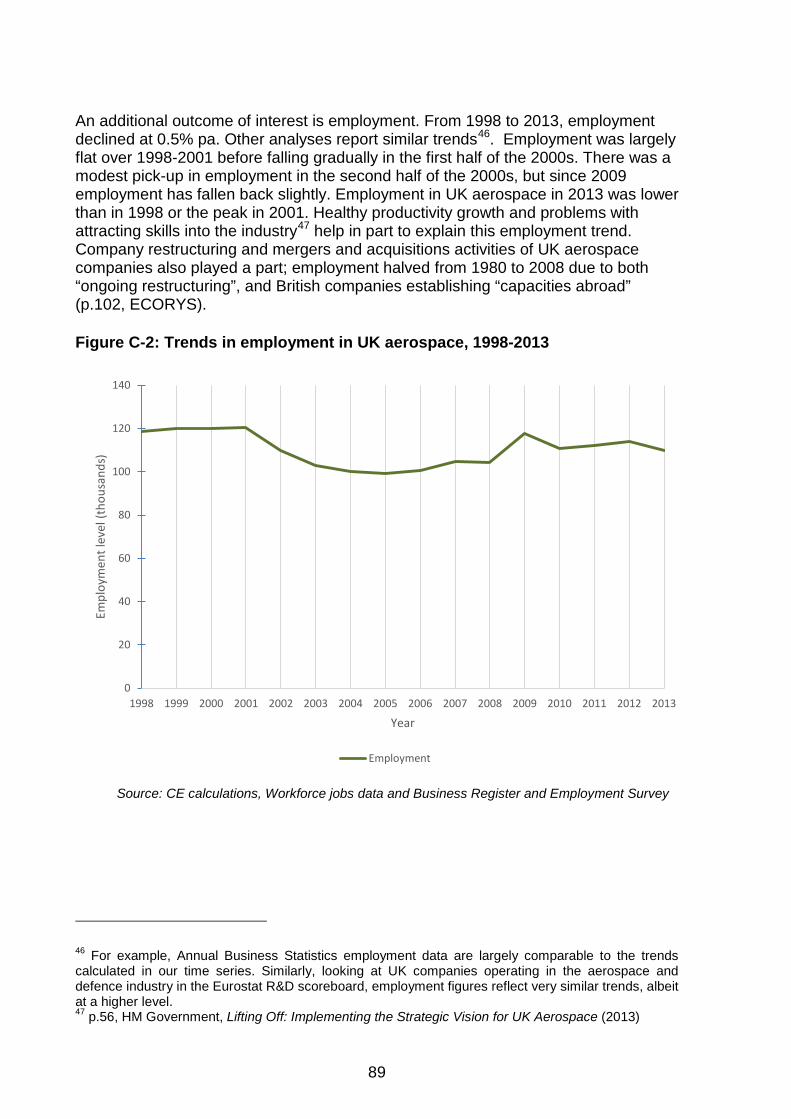
An additional outcome of interest is employment. From 1998 to 2013, employment declined at 0.5% pa. Other analyses report similar trends46. Employment was largely flat over 1998-2001 before falling gradually in the first half of the 2000s. There was a modest pick-up in employment in the second half of the 2000s, but since 2009 employment has fallen back slightly. Employment in UK aerospace in 2013 was lower than in 1998 or the peak in 2001. Healthy productivity growth and problems with attracting skills into the industry47 help in part to explain this employment trend. Company restructuring and mergers and acquisitions activities of UK aerospace companies also played a part; employment halved from 1980 to 2008 due to both “ongoing restructuring”, and British companies establishing “capacities abroad” (p.102, ECORYS).
Figure C-2: Trends in employment in UK aerospace, 1998-2013
0
20
40
60
80
100
120
140
1998 1999 2000 2001 2002 2003 2004 2005 2006 2007 2008 2009 2010 2011 2012 2013
Empl
oym
ent l
evel
(tho
usan
ds)
Year
Employment
Source: CE calculations, Workforce jobs data and Business Register and Employment Survey
46 For example, Annual Business Statistics employment data are largely comparable to the trends calculated in our time series. Similarly, looking at UK companies operating in the aerospace and defence industry in the Eurostat R&D scoreboard, employment figures reflect very similar trends, albeit at a higher level. 47 p.56, HM Government, Lifting Off: Implementing the Strategic Vision for UK Aerospace (2013)
89

C.1.2.2. Global drivers Global factors are important in determining UK output because they drive export production. Trade is therefore an important indicator of UK production. Different global factors could have varying effects on UK aerospace performance. Of these, one important consideration is the geographic source of increased demand. In light of this, we briefly outline how changes in other countries’ demand for foreign goods affect the volume of UK exports.
Real exports and imports increased at similar rates over 1998-2013, at around 4% pa, though there have been fluctuations in growth rates during the period (see Table C-3). Levels of both exports and imports picked up in the late-1990s/early-2000s, with exports enjoying a larger increase, before stalling after the 9/11 attacks in 2001. From 2002-08, UK exports were largely flat, growing by just 1½% pa. Over the same period, imports fell continuously over 2002-05, before a period of sustained growth over 2005-09. Exports have been growing strongly since the recession, albeit at a lower rate than that observed during the 1998-2001 period. The growth in imports has been robust in most years since the recession. Overall, the export share of turnover was fairly static between 2000 and 2008, but then increased significantly to 2013 (from 68% in 2008 to 85% in 2013), indicating that an increasing proportion of UK aerospace products are produced for foreign markets.
Table C-3: Exports and imports in UK aerospace
Variable Units Levels Growth rates* (% pa)
2000 2008 2013 98-01 02-08 09-13 98-13
Exports (constant)* £m 13,824 14,868 21,035 9.4 1.5 7.9 3.9 Imports (constant)* £m 9,975 14,847 18,708 4.2 2.1 3.2 3.9 Export share of turnover (current price) % 67.8 67.6 84.5
Average Import share of UK into selected countries**
% 11.3% 8.5% 7.9%
Source: CE calculations, HMRC overseas trade statistics and OECD STAN database
*Price series for exports and imports are calculated differently; see the second section of Annex C for details
**We look at levels of imports into selected countries, and look at how much of that originates from the UK. The sample of countries will be outlined below
Trade overall has been volatile, and UK aerospace has experienced a trade surplus for all years apart from three during the recessionary period (2008 to 2010). However, import growth has outpaced export growth in most years since 2009.
90

Figure C-3: Trends in exports and imports of UK aerospace, 1998-2013
0
5000
10000
15000
20000
25000
1998 2000 2002 2004 2006 2008 2010 2012
Valu
e le
vels
(£m
)
Year
Exports (constant prices 2010) Imports (constant prices 2010)
Source: CE calculations and HMRC overseas trade statistics
Extra-EU trade forms a growing part of the UK’s exports. Between 1998 and 2007, the average share of extra-EU exports was around 60%; from 2009 to 2014, the average grew to almost 74%.
Intermediate goods dominate the types of products that are exported from the UK. In 2013, final goods48 comprised approximately 11% of total exports. That most of UK output is exported, and that most exports are intermediate goods, is unsurprising and highlights that few final products are produced in the UK.
These figures are representative of defining features of the modern aerospace market. One feature is the growth of emerging markets, which incentivises UK producers to look for new customer bases. Airbus forecasts that new aircraft demand from the Asia/Pacific regions will form 39% of the new deliveries between 2014 and 2033 (p.7, Airbus, 2014). It is also indicative of the integration of UK manufacturers in the global supply chain. The increase in extra-EU trade indicates that UK producers are supplying intermediate goods to an increasingly diverse group of countries and companies.
48 Defined as whole helicopters, aeroplanes, other powered aircrafts, spacecraft, and balloons and dirigibles.
91

Figure C-4: UK exports by destination
Extra EU
Intra EU
0
5000
10000
15000
20000
25000
30000
1998 2000 2002 2004 2006 2008 2010 2012 2014
Expo
rt le
vels
(£m
illio
n)
Year
Source: CE calculations and HMRC Overseas Trade Statistics
For a given increase in a destination country’s demand for foreign goods, the corresponding increase in demand for UK goods can differ according to the specific country in question. Factors such as supply chains and type of aerospace products could contribute to this heterogeneity. For example, BAE systems lists Saudi Arabia as one of its four principal markets (p.14, BAE systems), which helps to explain the UK’s high share of Saudi Arabian imports (see Table C-4); specialisation in defence aerospace products could be driving this trend.
Geographical proximity does not closely correlate with level of demand for UK products. Belgium and Austria purchase a comparatively smaller proportion of aerospace products from the UK (relative to total imports to those countries) than countries such as Canada, United States and South Africa.
A low percentage implies that a higher proportion of the destination countries’ imports originate from the rest of the world. This gives no implications on the absolute levels of UK exports into these countries. For example, although the UK accounted for 21% of Saudi Arabian aerospace imports in 2013 this translates into US$560m worth of exports. In contrast, the UK accounted for just 5½% of French aerospace imports in 2013, but this equates to US$2.1bn worth of exports, nearly four times larger than exports to Saudi Arabia.
92

Table C-4: Aerospace exports from UK as a % of total aerospace imports to selected countries
Year Average Destination country 2000 2005 2010 2013 (00-13) Australia 24.1% 3.2% 4.8% 17.7% 10.0% Austria 1.0% 1.9% 3.4% 0.7% 1.6% Belgium 7.0% 6.3% 4.2% 2.3% 6.6% Canada 18.8% 12.6% 15.8% 10.6% 14.5% France 8.1% 9.0% 5.6% 5.6% 8.6% Germany 10.5% 11.2% 14.5% 12.6% 12.9% Japan 3.5% 2.0% 2.8% 4.9% 3.0% United States 14.7% 11.7% 11.7% 8.8% 11.9% Brazil 3.1% 2.0% 1.7% 1.8% 2.0% China (People’s Republic of) 4.4% 2.7% 1.7% 2.6% 2.4% India 15.0% 4.4% 3.9% 3.8% 6.4% South Africa 4.0% 12.9% 11.6% 5.2% 11.3% Saudi Arabia 33.9% 36.6% 24.5% 20.6% 33.3% Singapore 5.3% 9.3% 9.5% 20.2% 8.2% United Arab Emirates 7.6% 32.6% 7.4% - 13.1%
Source: CE calculations and STAN Bilateral Trade in Goods by Industry and End-use, OECD
C1.2.3. Labour productivity drivers The level of output, however, is not only driven by global demand. Labour productivity is also an important factor. In addition to productivity, we also consider some drivers that could affect productivity in the long run: investment and R&D spending. Spending in these areas could make processes more efficient, which could subsequently increase labour productivity.
Overall, between 2000 and 2013, productivity has increased by £31,000 per worker (see Table C-5). This points to the potential for positive growth prospects of the industry.
93

Table C-5: Labour productivity in UK aerospace
Variable Units Levels Growth rates* (% pa)
2000 2008 2013 98-01 02-08 09-13 98-13
Real labour Productivity*
£/worker 67,100 79,661 98,472 2.6 0.8 9.3 2.7
Investment** (current)
£m 445 464 712 -6.3 -5.5 5.4 0.9
R&D (current) £m 1,091 1,732 1,656 8.1 4.2 3.1 3.2 Proportion of civil R&D
% 42 48 75
Nominal R&D intensity
% of current price GVA 15.7 21.6 14.4
Investment intensity
% of current price GVA 6.4 5.8 6.2
*Investment is measured as capital expenditure.
Source: CE calculations, Business Enterprise and Research Development Survey and Annual Business Survey
Increased productivity after 2010 is encouraging. The greatest shock to productivity came during the financial crisis and the ensuing global recession, with productivity dipping in 2010 to its lowest value over the period under study (see Figure C-5).
Figure C-5: Trends in labour productivity in UK aerospace, 1998-2013
0
20000
40000
60000
80000
100000
120000
1998 2000 2002 2004 2006 2008 2010 2012
Leve
l (£
per w
orke
r)
Year
Productivity (constant price 2010)
Source: CE calculations
94

Conversely, annual changes in R&D spending levels were and remain extremely volatile (see Figure C-6). The heavy upfront investments (p.21, ECORYS) that characterise the industry explains the volatility observed in the annual percentage changes in capital investment. Disaggregating aerospace R&D into civil and defence, it is evident that the much of the volatility is due to fluctuations in defence spending (see Figure C-7).
Figure C-6: Trends in investment and R&D in UK aerospace
0
500
1000
1500
2000
2500
1998 1999 2000 2001 2002 2003 2004 2005 2006 2007 2008 2009 2010 2011 2012 2013
Spen
ding
leve
ls (£
m)
Year
Investment (current price) R&D (current price) spending
Source: Business Employment Research and Development survey
Figure C-7: Research and development by focus
Civil R&D (constant price 2010)
Defence R&D (constant price 2010)
0
500
1000
1500
2000
2500
1998 1999 2000 2001 2002 2003 2004 2005 2006 2007 2008 2009 2010 2011 2012 2013
R&D
expe
nditu
re le
vels
(£m
illio
n)
Year
Source: CE calculations and Business Employment Research and Development survey
95

For the whole period under study, investment intensity fluctuates often, but do so within 5% and 10% levels (see Figure C-8). Similarly, R&D intensity over the whole period is relatively consistent at levels between 15% and 20%, apart from a noticeable upwards spike between 2002 and 2009. The spike is driven by an increase in defence R&D spending.
Figure C-8: Intensity of drivers, 1998-2013
0.00%
5.00%
10.00%
15.00%
20.00%
25.00%
30.00%
35.00%
1998 1999 2000 2001 2002 2003 2004 2005 2006 2007 2008 2009 2010 2011 2012 2013
Leve
l of i
nten
sity
(% o
f cur
rent
pric
e GV
A)
Year
Nominal R&D intensity Nominal investment intensity
Source: CE calculations, Business Enterprise Research and Development Survey and Annual Business Survey
C.2. Trends in UK market share
Indicators at the national level do not reveal the UK’s performance compared to other countries. In light of emerging competitors and clients, it is necessary to analyse the baseline performance from an international perspective.
C.2.1. UK market share To our knowledge, previous to this study, no consistent time series has been derived for the UK share of the world market in aerospace production in nominal or real terms. This is likely to be because of the lack of a universally applied methodology and lack of comprehensive data available. Our methodology is highlighted in the following section (and the details of the calculations have been provided separately to BIS). Other estimates of market share are available49.
Our most up-to-date estimate of UK global market share is 9% in 2012 (see Table C-6 and Figure C-9) and this has declined slightly since 2000. The US has the largest
49 One often cited figure of UK market share is 17%, although it is unclear where this figure comes from.
96

share of the aerospace industry, followed by the EU (excluding the UK). The dominance of companies such as Boeing, Airbus, and US defence companies such as Lockheed Martin, United Technologies and Northrop Grumman (PWC, 2014) loosely mirrors the relative performance of the top players.
Table C-6: UK GVA share of global market
Units: USD million Real Global GVA 2000 2008 2012 CAGR (2000-2012) UK 12200 15256 13763 1.0% EU (minus UK) 17185 33313 32922 5.6% US 75111 89880 85701 1.1% Canada 3869 7064 6473 4.4% Brazil 2685 2471 2205 -1.6% Japan 2866 5052 5699 5.9% India 19 93 142 18.4% Korea 752 1133 1291 4.6% Singapore 466 1882 2456 14.8% Total GVA 115154 156142 150653 2.3% UK real GVA market share 10.6% 9.8% 9.1% -1.2%
Source: CE calculations and national statistics.
Figure C-9: GVA share of key global aerospace players, 2012
UK 9.1%
EU (minus UK) 21.9%
US 56.9%
Canada 4.3% Brazil
1.5% Japan 3.8%
India 0.1%
Korea 0.9%
Singapore 1.6%
UK EU (minus UK) US Canada Brazil Japan India Korea Singapore
Source: CE calculations.
However, the growth rate of the US aerospace industry is slower in comparison to other countries, such as Japan, Korea, Singapore and India. Although it is unrealistic
97

to expect that their growth will be sustained in the long run, it indicates that the composition of the global aerospace market is likely to change in the future. Countries such as China are entering the civil aerospace market in collaboration with international companies, but it is aimed partly to spur domestic manufacturing (Flight plan, 2011). India and Russia are emerging as major players; they have recently announced that they will invest US$1bn and US$6bn respectively into their national programmes to spur country aerospace performance (p.11, KPMG, 2013). Increased competition in the market exerts pressure on the traditional players. UK market share decreased slightly between 2000 and 2012, despite productivity and GVA growth (see Figure C-10), though market share was broadly static between 2000 and 2007, and actually increased slightly between 2010 and 2012. Therefore, the fall in market share occurred primarily in the period of the global recession.
Figure C-10: Trends in UK real market share, 2000-2012
0.0%
2.0%
4.0%
6.0%
8.0%
10.0%
12.0%
14.0%
1999 2000 2001 2002 2003 2004 2005 2006 2007 2008 2009 2010 2011 2012
UK sh
are
of re
al g
loba
l GVA
(%)
Year
UK real GVA market share
Source: CE calculations
Under the assumption that aerospace products are made to order, a measure of global output should be equivalent to global demand for aerospace products. A snapshot of our findings is presented in the table below. More details of the assumptions, calculations and sources are found in the ensuing sub-section (Recommendations on data issues).
Exports can be used as an alternative (to GVA and gross output) indicator of global aerospace demand and activity, with a higher level of detail available for more countries. It is possible, for example, to explore the performance of some of the other
98

key players beyond a qualitative level50. Data show strong growth of real exports of countries such as Russia, China and Australia (see Table C-7).
Table C-7: Global output based on output of key countries
Units: USD millions Real Global Output 2000 2008 2012 UK 30,911 39,958 39,670 EU (minus UK) 66,664 114,354 108,080 US 165,434 201,961 222,785 Canada 8,887 18,119 16,988 Brazil 7,393 8,419 6,589 Japan 9,254 13,381 16,467 India 47 282 435 Korea 1,557 2,400 3,148 Singapore 1,077 4,826 7,154 Russia 2,310 1,072 5,024 China 753 2,386 2,928 Australia 385 1,071 1,291 South Africa 380 730 389 Real global output 295,053 408,959 430,949
Source: CE calculations and national statistics
It is clear that the relative performance of countries outside of North America and Europe have changed over time. For example, Singapore’s aerospace sector has flourished and overtaken Korea in terms of gross output, as it has become one of the principal hubs in Asia for MRO aerospace activities (2015, Future ready Singapore).
Although 2012 is the latest estimate of global gross output, it is debatable whether it is reflective of the performance of the countries if they were operating close to “full capacity”. The decline in demand for aerospace products driven by the global recession had different effects on different countries, and performance in 2012 might reflect that. Nevertheless, the patterns between 2000 and 2008 are broadly consistent with trends observed between 2000 and 2012, except that output in Brazil and Canada fell recently. Emerging from the economic downturn, it is possible that Brazilian and Canadian production will grow, rather than continue to shrink.
However, the relative performance of these emerging key players should not be over-exaggerated. Despite the growth rates of these smaller players, the output of the largest players – Europe and US – continue to dominate global aerospace production, as is evident in Figure C-11.
50 More detail of the approximation can be found in Annex D; export data is used as a proxy for country output.
99

Figure C-11: Real gross output of selected producers
UK
UK
UK
[SERIES NAME]*, [VALUE]
[SERIES NAME]*, [VALUE]
[SERIES NAME]*, [VALUE]
[SERIES NAME]*, [VALUE]
[SERIES NAME]*, [VALUE]
[SERIES NAME]*, [VALUE]
Canada
Canada
Canada
Brazil
Brazil
Brazil
Japan
Japan
Japan
India
India
India
Korea
Korea
Korea
Singapore
Singapore
Singapore
Russia
Russia
Russia
China
China
China
Australia
Australia
Australia
South Africa
South Africa
South Africa
0 5000 10000 15000 20000 25000 30000 35000 40000 45000 50000
2000
2008
2012
Level (US$ millions)
Year
Source: CE calculations based on national statistics and OECD trade data.
*Due to issues of scaling, the bars for these observations extend beyond the axis. The exact number is displayed in the bar instead
100

C.3. Conclusion and other factors for consideration
The baseline headline indicators and contributory factors indicate that UK aerospace was hit by global shocks, such as the events of 9/11 and the global recession beginning in 2008. Despite this, the data show that subsequent growth has been robust.
The international perspective provides cause for optimism and concern. UK market share has declined between 1998 and 2013. However, this was driven largely by a fall over 2007 to 2010. Prior to 2007, UK market share was largely unchanged at around 11% and since 2010, UK market share has picked up. The trends before and after the recessionary period suggest the UK aerospace sector has more or less kept up with global demand and held its own.
C.4. Recommendations on data issues
In this section we present some of the major issues with the data on analysing the performance at an industry sector level, different potential options for calculating the headline indicators, and the solutions we chose to remedy the issues and challenges.
C.4.1. Employment There is no straightforward time series for employment figures for the aerospace industry (defined by SIC07 30.3 and 33.16). From 1998 to 2007 there is a time series for employment from the Annual Business Inquiry (ABI). Obtaining data for 2008 to 2013 is more problematic because the data relating to aerospace is incomplete or inconsistent with previous years’ observations. The Business Register and Employment Survey (BRES) survey has figures at the four digit level from 2008 to 2013. However, the numbers given in BRES are lower than the figures reported in the ABI for the years 1998-2007. This may be due in part to the geographic coverage (BRES is GB; ABI is UK) and that BRES is a point in time measure, whereas ABI provides an average for each year. Because it is a point in time measure, it is not recommended to use BRES as a time series. Other employment surveys, for example Workforce Jobs (WFJ), only disaggregate to two-digit level. Some sort of estimate must be derived for 2008 to 2013 that is consistent with the previous time series.
C.4.1.1. Options Out of all possible options CE (in collaboration with BIS) especially focussed on the following approaches:
1. For 1998-2007, use ABI time series. For 2008-13, derive a ratio of 30.30 and 33.16 to their respective two-digit classes (i.e. SIC codes 30 and 33) from LFS data, and apply those ratios to the WFJ data (which give observations at the two-digit level) to give estimates of aerospace employment.
2. Do the same as above, but use BRES to give year-specific ratios of 30.3 to 30 and 33.16 to 33 between 2008 and 2013.
3. Use ABI figures for 1998-2007, and use BRES figures for 2008-2013
101

4. Do the same as option 2, except for the years 1998-2007, take an average of all the available ratios for BRES, and apply that ratio to the WFJ SIC code 30 and 33 to derive estimates for 30.3 and 33.16 for the years 1997-2008
5. Take observations from R&D scoreboard for UK aerospace and defence companies, compiled by Eurostat
C.4.1.2. Preferred approach Option 4. Having experimented with most of the available options (as well as combinations for different periods in time based loosely on the methods mentioned above) it is evident that the different methodologies give broadly similar results. From analysis of disclosive data, BIS experts have informed us that the ABS data after 2008 is volatile. It would be best to choose a method that anchors the numbers to one dataset to ensure consistency. Given that we want a comparable series, and given the problems associated with ABS figures post-2008, we suggest not to use ABI results 1998-2007. This is particularly important, seeing that a priority for us is to derive a suitable estimate of employment in recent years. Estimating aerospace employment from WFJ data, using BRES ratios ensures that the estimates are comparable across the whole time series. Option 5 is only useful in giving us a broad trend and company breakdown; it is not a reliable measurement of direct employment due to UK aerospace companies having employees in other parts of the world.
Figure C-12: Options for "employment" indicator
0.0
20.0
40.0
60.0
80.0
100.0
120.0
140.0
160.0
180.0
200.0
1996 1998 2000 2002 2004 2006 2008 2010 2012
Uni
t (00
0's)
Year
WFJ (LFSratio) R&D Scoreboard ABS estimates
WFJ (BRES ONLY) ABI and BRES
Source: CE calculations using national statistical sources
102

C.5. Gross Value Added (GVA)
As one of the main headline indicators, it is particularly important that we get an accurate measure of this indicator. There are two principal sources of data: the National Accounts (NA) values and the Annual Business Survey (ABS) values. Conventionally, ABS GVA is used if the researcher is viewing the industry from a business perspective, whilst the NA approach facilitates cross-industry comparison and coherence of values across a national economy as a whole.
C.5.1. Options 1. Use ABS values
2. Use NA values
3. Use an augmented time series that combines the two by taking averages of the reported values
C.5.2. Preferred approach Use option 1, ABS, (which presents values in current prices). When comparing the ABS and NA values, there are some differences in the levels and trends, particularly from around 2007 onwards, Although there might be more conversion issues related to the ABS measure (in that there was a classification change in the time series for which we will have to adjust), our interest lies primarily in the aerospace industry and not the aerospace industry in comparison to other industries. Furthermore, GVA as a measure is very important in our calculation approximating UK market share of the world; we want to make sure that our choice corresponds to the available data in other countries on aerospace value added. Given that for many of the national statistical sources, the most up-to-date indicators on aerospace come from survey data, we decide that ABS is the preferred source for GVA than NA.
103

Figure C-13: Options for "GVA" indicator
0
2,000
4,000
6,000
8,000
10,000
12,000
14,000
1997 1999 2001 2003 2005 2007 2009 2011 2013
Valu
e (£
m)
Year
Aerospace_ABI (1997-2007: 35.3) NA CP
NA KP Average (NA CP, ABS)
ABS (coverted SIC codes)
Source: CE calculations using national statistical sources
C.6. Turnover/gross output
There are numerous measures for turnover of which not all are plausible; it is problematic that different measures do not align with each other, even in terms of trends. The additional issue is that turnover is a measure that is utilised to calculate other indicators, such as gross operating rate. Hence, our choice of indicator should be determined both by the plausibility of the data series but also the compatibility of options open to us by adopting that particular method. It is also problematic in that the various sources are independent of each other and whilst they are acknowledged to be broadly comparable, they are not based on the same sources. Furthermore, choosing an unsuitable time-series could lead to implausible ratios.
C.6.1. Options 1. Approximate turnover with final or total demand from the National Accounts
(either from SuTs or the Input-Output Analytical Tables
2. Use Turnover and Orders in the Production and Service Industries (TOPSI) survey
3. Use the ABS survey
104

4. Use Gross Output from SuTs
C.6.2. Preferred approach We opt to use the ABS survey data (option 3). To a certain extent, our choice over which dataset to use is not as important given the similarity of values reported in the different options. The only possible exception is the trajectory of gross output in the NA in recent year, which does not match with the trends displayed in the other options. Our choice is determined by the consistency of the choice with other baseline indicators at the industry level. Given our choice to use ABS survey data for GVA, we opt to use ABS for turnover figures to maintain consistency of approach in deriving the different indicators measuring the performance of the industry. That reported values of sample size for the TOPSI survey is smaller than for the ABS strengthens our conviction to use ABS over TOPSI.
Figure C-14: Options for "turnover" indicator
0
5,000
10,000
15,000
20,000
25,000
30,000
35,000
40,000
45,000
1995 1997 1999 2001 2003 2005 2007 2009 2011 2013
Valu
e (£
m)
Year
ABI (1997-2007: 35.3) TOPSI R&D ScoreboardNA (Gross output) PRODCOM ABI (Converted SIC codes)Final demand (33.16 zero)
Source: CE calculations using national statistical sources
C.7. Export/Import
Within observations for the UK there are numerous different measurements of export and import data, all of which are differentiated by their scope, definitions and classifications. The most appropriate choice is imperative given that these measures are used for various different purposes: to derive the export share of sales; to derive UK export share of world export share; and to look at UK trade balances. Further, given the global nature of the aerospace industry it is notable that the data series for exports should at least partially reflect that (by having a high export to turnover ratio, for example). The various measures of aerospace exports include: a measure of
105

trade by industry activity (Classification of Product by Activity (08)) published by the ONS, export and import data as part of the National Accounts, or Overseas Trade Statistics (OTS) (using Standard International Trade classification (SITC)) that records exports by commodity. Some of the above measures omit MRO exports in their observations.
C.7.1. Options 1. Use the SuTs database on exports and imports
2. Use the OTS and choose group of commodities as defined by correspondence tables that maps SITC groups to CPA (08) groups.
3. Use the MQ10 dataset
4. Use export data from TOPSI dataset
C.7.2. Preferred approach Option 2. To ensure cross comparability, we would ideally like to use a measure of exports that can be compared with other indicators such as turnover, gross output, and GVA. The results of option 1, 2 and 3 are largely interchangeable, largely because the NA and MQ10 values for exports are derived principally from OTS apart from a few modifications. Given that our model requires a time-series of exports data it would be unlikely that we will be using the Input-Output Analytical Tables as they only gives point estimates for specific years. One advantage of using option 1 is that it considers the export of services as well as products, something other measures lack. We are not as convinced by option 2, given that the commodities covered by this method are not the same as the commodities covered under the NACE or SIC classifications; comparing exports/imports from this definition with other indicators that are based on SIC definitions would mean that we would be comparing values that cover different commodities and activities. Further work would be needed on the constant/current price issue of the MQ10 database. TOPSI estimates give unusually low figures of exports, which are implausible given the knowledge of the industry within the UK. There is scope to estimate the export values of 33.16 based on the ratio of 33.16 exports given from the TOPSI survey.
106

Figure C-15: Options for "export" indicator
-
5,000
10,000
15,000
20,000
25,000
30,000
1997 1998 1999 2000 2001 2002 2003 2004 2005 2006 2007 2008 2009 2010 2011 2012 2013 2014
Valu
e (£
m)
Year
SuT tables (33.16 zero) Previous BIS definitions (33.16 zero)
OTS CPA(08)to HS(2007) conversion MQ10 30.3 Exports (industry)
Inflated MQ10 using TOPSI (30.3+33.16) TOPSI (30.3+33.16)
Source: CE calculations using national statistical sources
Figure C-16: Options for "imports" indicator
0
5000
10000
15000
20000
25000
1998 2000 2002 2004 2006 2008 2010 2012 2014
Valu
e (£
m)
Year
Own analysis
MQ10
BIS definition HMRC
SuT
Source: CE calculations using national statistical sources
107

C.8. Export/Import price deflators
Although the easiest option would be to use the same deflators as for other outcome indicators such as turnover and GVA, it is a less accurate measure, mainly because imports and exports could have different prices due to tariff structures and transportation costs. There are numerous options, of which some are implausible; for example, implied import price deflators recorded in MQ10 for 1998 is 7150.3, if 2010 is the base year.
C.8.1 Options 1. Use MQ10 from 2006 onwards (where price deflators look reasonable)
2. Use the time-series taken from internal Cambridge Econometrics models for other transport equipment– MDM-E3
3. Use Eurostat export price indices and MM22 import price indices
4. As option 1 but extend back using percentage changes in price index from MDM-E3 time series.
C.8.2. Preferred approach Option 4. Using Other Transport Equipment price indices are not unreasonable approximations given how, according to the MQ10 datasets, aerospace production dominates the proportion of other transport equipment exports/imports. Whilst Option 1 is the easiest option, it would be helpful to have real values for exports and imports that extend backwards beyond 2006/2007. Option 2 would be implausible for future monitoring purposes, as the MDM-E3 time series is not publicly available. Option 3, meanwhile give (albeit slightly less) wild price fluctuations that seem implausible. By process of elimination, we opt for option 4.
C.9. UK market share
We have constructed an estimate of a time series of UK market share. Conceptually, the approach is straightforward: we draw on national statistics data of the key countries and regions to examine the performance of their aerospace industry and then aggregate the reported values to derive an approximation of world output in the aerospace industry. We focus on key indicators such as gross value added data for the baseline approximation and derive a time series from 2000 to 2012 using this approach. The key players that we have identified (that ought to encompass the majority of global aerospace production) are EU, USA, Canada, Brazil, Russia, China, Japan, India, Australia, South Africa, South Korea and Singapore.
The values presented are likely to overestimate the “true” UK market share of total aerospace in 2014. This is because our approximation of world production focusses only on the key players and leaves out smaller levels of production in other countries. Including the smaller national aerospace industries would invariably increase the size of total output, and thus decrease UK market share.
108

Figure C-17: Options for "price indices" data
1.0
10.0
100.0
1000.0
10000.0
1998 1999 2000 2001 2002 2003 2004 2005 2006 2007 2008 2009 2010 2011 2012 2013
Pric
e in
dice
s* (B
ase
year
: 20
10=1
00)
Year
MQ10 import deflator
Import implied deflator
MQ10 export deflator
Export implied deflator
Source: CE calculations using national statistical sources
*A logarithmic scale was used
We sought to refine the estimate of UK global market share by looking for country specific price deflators for their aerospace products in cases where it is available.
There are numerous practical obstacles in adopting the proposed approach.
Different industrial classifications: there are different industrial classifications used by different countries, and it is not entirely clear how each classification system relates to UK classifications of the aerospace industry. If the classes do not correspond at least partially, then the values are meaningless as they could relate to different activities. We use official correspondence tables where possible to map onto the UK (SIC) industries, although technically most of the time conversion tables map country-specific industry classifications to NACE Rev.251 instead of ISIC52 classification systems. For example, American and Canadian national statistics use NAICS (North American Industry Classification System), which can be mapped onto NACE Rev. 2
51 Statistical Classification of Economic Activities in the European Community, Rev. 2 (2008) 52 International Standard Industrial Classification of All Economic Activities
109

classifications according to official guidance notes of international organisations (EU, UN). In cases where this is unavailable, we either rely on country-provided conversion guidance, or choose categories most closely associated to activities or products outlined in SIC codes 3030 and 3316. In cases where there is an overlap over multiple codes, we choose the set of codes that we believe most closely relates to the SIC codes. Given that there is some subjectivity in what the best choice of codes are, we have detailed our preferences within each countries’ classification system in the table below.
Detail of data: in some of the key countries, the level of detail in the statistics is insufficient to cover our industry of interest. In particular, national statistics published by China and Russia are not disaggregated enough for us to look at the performance of their aerospace industries. Given the lack of information from national agencies, we approximate gross output from these countries by looking at the OECD trade database and looking at their export values; the rationale behind this is that that the export value is a better approximation of the gross output compared to the data provided on a national level. The use of export data means that we do not account for domestic demand for domestic production for those countries. Another issue regarding the level of detail is that a lot of countries do not explicitly account for maintenance, repair and overhaul (MRO) of aircraft. In cases where the data is not available and no approximation can be made, it will be explicitly stated.
Choice of sources within national data: as with national statistics compiled by the ONS, there are at times numerous different values given for the same indicators. Most notably, for some countries, national accounts data and business survey data can give very different values for the same indicators within broadly similar classifications. Overall, this issue is less important because the problem is more often due to a lack of data rather than too much data. Nonetheless, where possible we cross correlate different sources (for example, OECD estimates for previous years) and derive values that are as consistent as possible over multiple sources. There are in some cases attempts to reconcile the two sources by using the ratio of business surveys to estimate what the value for the same indicator in the national accounts would have been if it was available. However, this was possible only for a limited number of countries.
How up-to-date the available data is: Evidently, in trying to come up with a baseline estimate of current UK market share it would be best to look at the national statistics of the key countries for 2014/2015. However, the most-up-to-date and comprehensive datasets only cover up to 2010 for some countries, with provisional or less-detailed data for later years. This presents a challenge in balancing the availability of data with the relevance of our eventual approximation. Surveying the data available to us, we opt to look at the statistics for the year 2012. There are a few countries which do not cover sufficiently our indicators of interest for 2012. In these instances we make estimations where possible on what the value could be, either based on business survey results or national accounts.
Another caveat to our calculations is that we have not (thus far) accounted for the prices in which the Value Added measures are presented; we have at the moment not adjusted the different compiled values such that all countries’ value added are,
110

for example, converted to basic prices. Due to linguistic and time scale issues, achieving this might be a challenge.
Our estimate of UK market share is subject to numerous assumptions, estimates and calculations. Ideally, the most straightforward and reliable approach would be to make use of OECD STAN53 database, which lists GVA values for countries separated by year and industry. However, the dataset available does not cover enough countries of interest, and the data not up-to-date for it to be a plausible approximation of current UK global market share. Furthermore, given the stated methodology, there is scope to improve this estimate of market share given better data availability at the national level for all the key players of the aerospace industry.
Given the flexibility of this approach, there is scope to adapt and improve on this estimate.
53 More details are available in Annex D
111

Annex D. Data sources The tables below present the sources used to compile the data for the sector baseline analysis in Annex C. Additional metadata information is given in the Excel spreadsheets published alongside this report.
D.1. UK
D.1.1. Employment Source Dataset Hyperlink Date
downloaded Short description
BIS/ ONS ONS Workforce jobs, with adjustments made by BIS
N/A N/A All employment data is based on national statistics on employee and self-employed numbers, but adjusted so that they are consistent with published totals at National and section level (and include GST and Armed forces data).
ONS/NOMIS Business register and employment survey
https://www.nomisweb.co.uk/articles/850.aspx
19/03/2015 The data provided here contains data on employee and employment figures for GB in aerospace, from 2009 onwards.
D.1.2. Gross value added (GVA) Source Dataset Hyperlink Date
downloaded Short description
ONS Annual Business Survey – 2013 Provisional results
http://www.ons.gov.uk/ons/rel/abs/annual-business-survey/2013-provisional-results/index.html
11/02/2015 This survey carried out by the ONS between 2008 and 2013 records observations for some of the key performance indicators.
ONS Annual Business Inquiry, 1995-2007 National Results
http://www.ons.gov.uk/ons/publications/re-reference-tables.html?edition=tcm%3A77-235505
11/02/2015 This is the equivalent to the Annual Business Survey, although it is for past historical data, from 1995 to 2007.
112

D.1.3. Gross output Source Dataset Hyperlink Date
downloaded Short description
ONS Annual Business Survey – 2013 Provisional results
http://www.ons.gov.uk/ons/rel/abs/annual-business-survey/2013-provisional-results/index.html
11/02/2015 See short descriptions for GVA indicator.
ONS Annual Business Inquiry, 1995-2007 National Results
http://www.ons.gov.uk/ons/publications/re-reference-tables.html?edition=tcm%3A77-235505
11/02/2015 See short descriptions for GVA indicator.
D.1.4. R&D Source Dataset Hyperlink Date
downloaded Short description
ONS BERD Business Enterprise Research and Development
http://www.ons.gov.uk/ons/rel/rdit1/bus-ent-res-and-dev/2013/tsd-berd-2013.html
11/02/2015 As agreed with BIS, defined as “Aerospace R&D”, which covers more than what is defined in 30.3.
D.1.5. Exports (and imports) Source Dataset Hyperlink Date
downloaded Short description
HMRC Overseas trade statistics- data by commodity code
https://www.uktradeinfo.com/Statistics/BuildYourOwnTables/Pages/Home.aspx
20/03/2015 Detailed commodity codes chosen to match industry activity 30.3, in accordance with Eurostat correspondence tables.
113

D.1.6. Price deflators Source Dataset Hyperlink Date
downloaded Short description
ONS Aerospace and Electronics Cost Indices: Data for January 2015
http://www.ons.gov.uk/ons/rel/ppi2/producer-price-index/march-2015/tsd-aerospace-and-electronics-cost-indices--january-2015.html
28/04/2015 Producer price index (used to deflate nominal turnover and GVA values).
ONS UK Trade in Goods Analysed in Terms of Industry, Q2 2014
http://www.ons.gov.uk/ons/publications/re-reference-tables.html?edition=tcm%3A77-352683
28/04/2015 Implied export/import price indices from their constant and current price values of exports/imports
Cambridge Econometrics
MDM-E3 Unavailable 07/05/2015 Supplementary export and import price index data for 1998-2006/07
D.1.7. Capital expenditure Source Dataset Hyperlink Date
downloaded Short description
ONS Annual Business Survey – 2013 Provisional results
http://www.ons.gov.uk/ons/rel/abs/annual-business-survey/2013-provisional-results/index.html
11/02/2015 See short descriptions for GVA indicator.
ONS Annual Business Inquiry, 1995-2007 National Results
http://www.ons.gov.uk/ons/publications/re-reference-tables.html?edition=tcm%3A77-235505
11/02/2015 See short descriptions for GVA indicator.
114

D.2. Market share - various countries
Source Dataset Hyperlink Date downloaded
Classification and industry codes used
Short description
Eurostat (EU)
Eurostat structural business statistics; Producer prices in industry – short term business statistics
http://ec.europa.eu/eurostat/web/structural-business-statistics/overview; http://ec.europa.eu/eurostat/web/short-term-business-statistics/overview
16/04/2015-21/04/2015
NACE Rev2 (C303, C3316)54
The problem here is how to capture “EU” aerospace activity; the availability of data is incomplete for variables “EU27” or “EU28”. Our preferred approach is to sum the available values on aerospace of the separate EU countries. The implicit assumption therefore, is that all countries who do not report their aerospace activity have negligible contributions. Price indices for Other transport equipment indices are used to derive real values because of lacking aerospace price indices.
Bureau of Economic Analysis Bureau of Labour Statistics United States
Industry Economic Accounts; Producer Price Index Industry Data Annual Survey of Manufactures
http://www.bea.gov/industry/gdpbyind_data.htm http://www.bls.gov/ppi/ http://www.census.gov/econ/census/index.html
11/03/2015-17/04/2015
NAICS (33641, 48819)55
Through cross checking OECD data, census data and national accounts data, it is evident that census GVA values are considerably larger than the values provided by the other sources. We have derived ratio estimates from national account measures to ensure consistency over multiple sources
54 In historical data where previous revisions of the same classification systems were used, the industry groups with definitions matching the codes highlighted were chosen as approximations
55 See footnote 54
115

Source Dataset Hyperlink Date downloaded
Classification and industry codes used
Short description
Census Bureau (US)
MRO revenue: Transportation and Warehousing: Industry Series
Statistics Canada (Canada)
Input-Output tables; GDP at basic prices by Industry (monthly)
http://www.statcan.gc.ca/start-debut-eng.html (tables 379-0031 381-0016 381-0022 329-0077)
12/03/2015-20/04/2015 NAICS
(3364)56
Only a short time series is available for most recent years. Estimates based on ratios were used to project existing time series backwards
Instituto Brasileiro de Geografia e Estatística (Brazil), OECD
Annual Survey of Industry – Enterprise; Producer prices (MEI)
http://www.sidra.ibge.gov.br/bda/pesquisas/pia/default.asp?o=23&i=P (IBGE - Pesquisa Industrial Anual – Empresa); http://stats.oecd.org/OECDStat_Metadata/ShowMetadata.ashx?Dataset=MEI_PRICES_PPI&ShowOnWeb=true&Lang=en
11/03/2015-21/04/2015; 28/04/2015
CNAE 2.0 (30.4 and 33.16)57
Before 2007, we have not found any measure of GVA from the census data. We estimate the values based on ratio estimates from a related variable – “Value of industrial transformation”. MRO figures are only available from most recent survey data; MRO estimates for past years are derived from ratios of MRO to total production. Producer price indices for other transport equipment on IBGE are only available for 2009 to 2013; we use OECD wholesale prices for Brazil’s industrial activities instead.
Ministry of Economy, Trade and Industry
Census of Manufactures, Input-Output Price Index of the Manufacturing
http://www.meti.go.jp/english/statistics/tyo/kougyo/index.html http://www.meti.go.jp/english/statistics/tyo/entyoio/index.html
12/03/2015-21/04/2015
Basic Sector Classification (362201, 362210), 4
Due to classification changes, we had to estimates GVA based on current classification. We used one year where values were given for both current and
56 See footnote 54 57 See footnote 54
116

Source Dataset Hyperlink Date downloaded
Classification and industry codes used
Short description
(Japan), Bank of Japan
Industry by Sector http://www.stat-search.boj.or.jp/index_en.html https://www.boj.or.jp/en/statistics/pi/iopi_2005/index.htm/
digit industrial sub classification (3140)58
past classification to derive overlap of definitions, and applied that ratio to previous values to derive estimates based on current definitions Price indices are for category “Other transport equipment”, built from multiple price indices following different classifications.
Ministry of Statistics and Programme Implementation (India), Office of the Economic Adviser (India)
Annual survey of industries, Index files for wholesale price index
http://mospi.nic.in/mospi_new/upload/asi/ASI_main.htm?status=1&menu_id=88; http://www.eaindustry.nic.in/home.asp
17/03/2015-17/04/2015
NIC’08 (303)59
Only net value added is available; depreciation is added onto net value added to obtain an approximation of gross value added. We opted to use Wholesale Price index for category “Transport equipment and parts” due to lack of available data for “Other transport equipment” category before 2005.
Statistics South Africa (South Africa)
Supply and Use Tables (SuTs); Report: Manufacturing industry: Production, 2011; Manufacturing industry - financial detail
http://www.statssa.gov.za/?page_id=1854&PPN=Report-30-02-04; http://www.statssa.gov.za/?page_id=1854&PPN=Report-30-02-03; http://www.statssa.gov.za/?page_id=1854&PPN=Report-04-04-02
17/03/2015-20/04/2015
SIC (3850), (I32)
Only point estimates are available for 2005, 2008, 2009,2010, 2011, 2012; for all other years, GVA is unobtainable Export data for all years used as an approximation of output
58 See footnote 54 59 See footnote 54
117
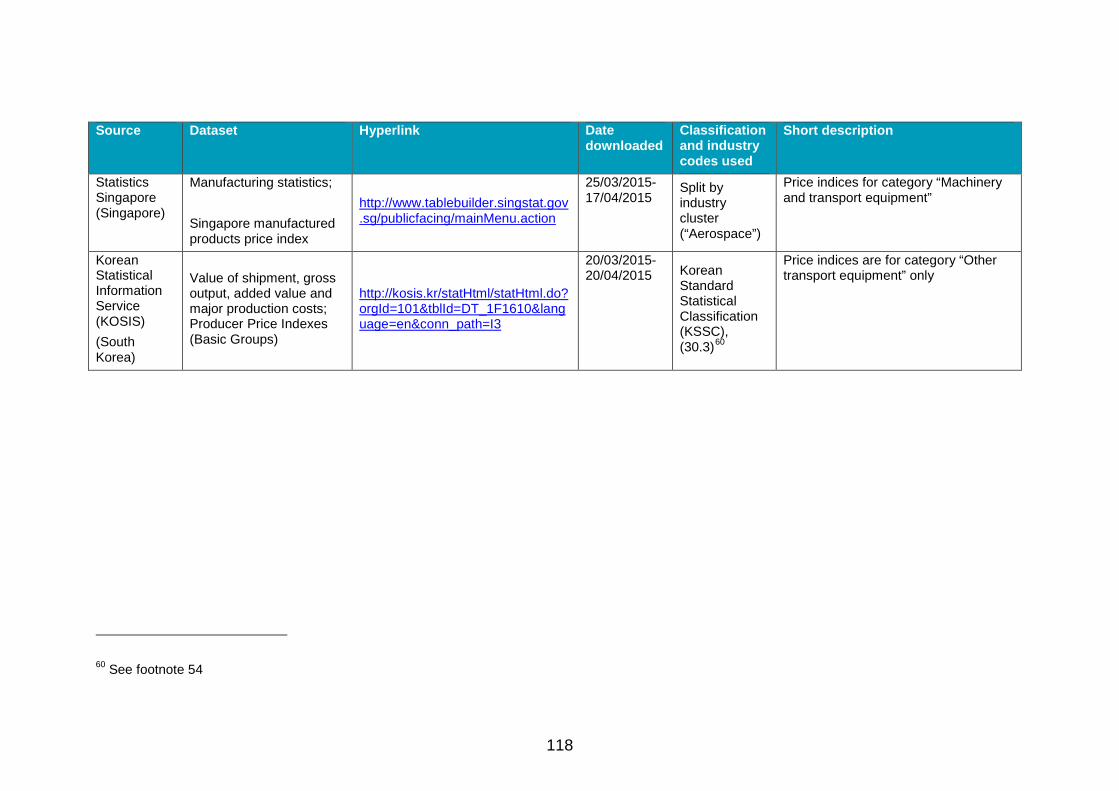
Source Dataset Hyperlink Date downloaded
Classification and industry codes used
Short description
Statistics Singapore (Singapore)
Manufacturing statistics; Singapore manufactured products price index
http://www.tablebuilder.singstat.gov.sg/publicfacing/mainMenu.action
25/03/2015-17/04/2015
Split by industry cluster (“Aerospace”)
Price indices for category “Machinery and transport equipment”
Korean Statistical Information Service (KOSIS) (South Korea)
Value of shipment, gross output, added value and major production costs; Producer Price Indexes (Basic Groups)
http://kosis.kr/statHtml/statHtml.do?orgId=101&tblId=DT_1F1610&language=en&conn_path=I3
20/03/2015-20/04/2015 Korean
Standard Statistical Classification (KSSC), (30.3)60
Price indices are for category “Other transport equipment” only
60 See footnote 54
118

D.2.1 Global demand (Additional sources supplementing the national statistical sources outlined in the “Market share” variable
Source Dataset Hyperlink Date downloaded
Short description
OECD (Australia); Australian Bureau of Statistics
STAN Bilateral Trade in Goods by Industry and End-use (BTDIxE); ISIC Rev.4; 6427.0 - Producer Price Indexes, Australia, Dec 2014
http://stats.oecd.org/OECDStat_Metadata/ShowMetadata.ashx?Dataset=BTDIXE_I4&ShowOnWeb=true&Lang=en; http://www.abs.gov.au/Ausstats/[email protected]/mf/6427.0
23/02/2015, 16/04/2015 We used exports for 30.3
Producer price index relates to category “2394 Aircraft manufacturing and repair services”
OECD (Russia)
STAN Bilateral Trade in Goods by Industry and End-use (BTDIxE), ISIC Rev.4; Producer prices (MEI) - Economic activities - Domestic producer prices - Manufacturing
http://stats.oecd.org/OECDStat_Metadata/ShowMetadata.ashx?Dataset=BTDIXE_I4&ShowOnWeb=true&Lang=en; http://stats.oecd.org/OECDStat_Metadata/ShowMetadata.ashx?Dataset=MEI_PRICES_PPI&ShowOnWeb=true&Lang=en
23/02/2015 We used exports for 30.3. The price indices provided by national statistics agency does not go into enough detail and the continuous time series is not long enough. We opt to use OECD provided values of price indices for wider industrial category.
OECD (China)
STAN Bilateral Trade in Goods by Industry and End-use (BTDIxE), ISIC Rev.4; Producer prices (MEI) - Economic activities - Total producer prices - Industrial Activities
http://stats.oecd.org/OECDStat_Metadata/ShowMetadata.ashx?Dataset=BTDIXE_I4&ShowOnWeb=true&Lang=en; http://stats.oecd.org/OECDStat_Metadata/ShowMetadata.ashx?Dataset=MEI_PRICES_PPI&ShowOnWeb=true&Lang=en
23/02/2015 We used exports for 30.3. Price indices available on national website for the whole time series under consideration is patchy. As the scope of the data is as not better that provided by OECD, we suggest using OECD values instead
OECD (South Africa); Statistics South Africa
STAN Bilateral Trade in Goods by Industry and End-use (BTDIxE), ISIC Rev.4; Producer Price Index (PPI)
http://stats.oecd.org/OECDStat_Metadata/ShowMetadata.ashx?Dataset=BTDIXE_I4&ShowOnWeb=true&Lang=en; http://www.statssa.gov.za/?page_id=1854&PPN=P0142.1
23/02/2015; 16/04/2015
Export data for 30.3 Using “Producer Price Index for domestic output of South African industry groups” for category “Other Transport Equipment” from (discontinued) time series up to 2012
119

Annex E. Bibliography for the sector baseline Airbus (2014), Flying on demand 2014-2033, Global Market Forecast, available at http://www.airbus.com/company/market/forecast/
BAE systems (2014), Annual Report 2013, London, available at http://bae-systems-investor-relations-v2.production.investis.com/~/media/Files/B/BAE-Systems-Investor-Relations-V2/Annual%20Reports/BAE-annual-report-2013.pdf
Deloitte (2013), 2013 Global aerospace and defense industry outlook, available at: http://www2.deloitte.com/be/en/pages/manufacturing/articles/2013-global-aerospace-and-defense-industry-outlook.html
ECORYS et al. (2009), FWC Sector Competitiveness Studies – Competitiveness of the EU Aerospace Industry with Focus on the Aeronautics Industries, available at http://ec.europa.eu/enterprise/sectors/aerospace/files/aerospace_studies/aerospace_study_en.pdf
Future ready Singapore (2015), Aerospace Engineering Singapore, available at https://www.edb.gov.sg/content/edb/en/industries/industries/aerospace-engineering.html
International trade administration (2011), Flight Plan: 2011, Analysis of the U.S. Aerospace Industry: China, available at http://trade.gov/mas/manufacturing/oaai/tg_oaai_003656.asp
HM Government (2013), Lifting Off: Implementing the Strategic Vision for UK Aerospace, available at https://www.gov.uk/government/publications/lifting-off-implementing-the-strategic-vision-for-uk-aerospace
KPMG (2013), The Future of Civil Aerospace: Study on the Outlook for the UK Civil Aerospace Manufacturing Sector, available at https://www.kpmg.com/uk/en/industry/aerospaceanddefence/pages/default.aspx
KPMG (2014), Global Aerospace and Defence Outlook 2014, available at: http://www.kpmg.com/uk/en/issuesandinsights/articlespublications/pages/global-aerospace-defence-outlook2014.aspx
PWC (2014), Top 100 aerospace companies 2014, available at http://www.pwc.co.uk/aerospace-defence/top-100-aerospace-companies-2014.jhtml
120

Annex F. The model to project future sector performance F.1. A future baseline to assess the sector’s potential and establish a
‘pseudo-counterfactual’
A subset of the headline performance indicators for the UK aerospace sector61 (see Chapter 4 and Annex C) has been used to develop a baseline projection of the sector’s future performance. As well as providing a forward-looking assessment of the sector’s potential (and potential importance to the UK economy), this projection provides one option, as part of evaluation scoping, to establish a counterfactual (or at least pseudo-counterfactual – see more below) for the future performance of the UK sector without ATI support.
F.2. The purpose of the modelling framework
This scoping study has developed a modelling framework that can be used to project a subset of the sector’s headline indicators. This is inherently challenging, because the sector’s performance is potentially influenced by a large number of external drivers that are difficult to incorporate together in a model, and the future profiles of which are difficult to foresee. The model systematically includes and links together: the selected headline indicators (such as GVA); key external drivers (such as global GDP); and estimates of the relative impacts of each of the external drivers on the UK sector’s performance (coefficients that represent the relationships that link the drivers and indicators). The scope and complexity of the model has been determined by a number of things, such as: the extent to which data are available to measure the headline indicators and external drivers, and to estimate the relationships between them; the availability of evidence to inform assumptions (for example, the relationships between external drivers and indicators, and the future profiles of the external drivers); and the tractability, and ease of use and interpretation, of the model.
There are a number of advantages to developing such a quantified model. One of the difficulties of establishing a future counterfactual is that we cannot perfectly predict future developments in the external drivers of the sector’s performance. However, the model provides a framework to vary the assumptions for the future profiles of key drivers to assess the likely impact on the projection of sector performance. In addition, the model provides a framework in which to undertake sensitivity analysis to investigate uncertainties, for example, by varying the coefficients relating the drivers to performance. The results of the model should not be interpreted as precise predictions of the sector’s performance in 10-20 years’ time; rather they provide an indication of the scale and
61 The data and projections from the model are for the aerospace sector as a whole; they do not distinguish civil from defence.
121

direction of travel, given the user’s chosen assumptions62 and based on a transparent and logical framework.
The purpose of the model is not to generate an ex ante ‘policy on’ projection of the impact of the ATI on the sector’s performance. What the model can provide is a forward-looking ‘without support’ projection (i.e. counterfactual) of expected performance (or a small number of scenarios to estimate the likely range of outcomes) against which the ‘with support’ actual outcome can be compared, and hence some assessment of ATI impact inferred.
It is important to note that the projection cannot be considered to be a pure counterfactual insofar as the future performance of the sector will be affected by other government funding mechanisms that preceded the ATI, such as CARAD, BIS/TSB support and schemes of the Regional Development Agencies (RDAs). The projection(s) is therefore better interpreted as a pseudo counterfactual; i.e. it can provide an indication of expected future performance assuming that government support for aerospace R&D would have continued at the scale and nature in the recent years prior to the announcement of ATI.
F.3. The modelling framework
In this section we present the modelling framework. The focus of the model is to project a set of headline performance indicators so as to provide estimates of the medium-term and longer-term outcomes identified in the modelling framework (such as global market share, GVA and employment).
The drivers of the sector’s performance are many and varied. In addition, there are feedback loops from the sector performance to some of the drivers of performance, such as between profitability and investment.
Drivers include, for example: global economic conditions and the consequent demand and orders for aerospace goods and services; the scale of investment in R&D and its consequent impacts on the relative competitiveness of the UK aerospace sector; the scale of government support to R&D; and the performance of the UK’s key competitors (which in turn would depend upon funding and R&D in those countries), which are more easily quantified or estimated. Other drivers, such as socioeconomic or behavioural change, the quality of aerospace companies’ management team and/or companies’ strategies, the skill level of the workforce are much harder to quantify because they are not readily observed, not easily measured or may only become apparent with the passing of time. It is recommended not to include an extensive list of drivers, performance indicators and feedback loops in the modelling framework: it has not been feasible to obtain the required data, and the framework would potentially become intractable and difficult to maintain and interpret.
An important driver that is not included is the scale of UK R&D and government support relative to the UK’s competitors. We have not included this due to a current lack of
62 As an example, see Table 4-5 and Table F-5 for the specific assumptions used for the baseline projections.
122

data/evidence on the scale of R&D and government support in other countries. We understand that BIS has commissioned work to gather evidence about R&D and government support to aerospace in other countries. This would provide useful contextual evidence in which to interpret the results of this model.
The challenge is to identify the key elements to include within the scope of the modelling framework so that it provides sufficiently logical and insightful projections. The modelling framework takes account of BIS and ATI’s insights and feedback about priorities; aerospace is characterised as a global sector and the key drivers of change are:
• Global GDP growth, which is broken down by eight world areas to take account of the relative importance of different markets for UK aerospace.
• Investment and R&D expenditures which drive technological progress in UK aerospace, and so enhances the productivity and competitiveness of the UK sector.
Figure F-1 presents the key elements that are included in the modelling framework. The red circles represent elements that are exogenous (inputs) to the modelling framework, and the blue ovals are elements determined within the model. The dark blue arrows show the links between drivers and performance indicators, and represent where ‘coefficients’ are used to quantify those links.
The logic of the model is summarised as follows:
• The key drivers of UK aerospace (gross) output are assumed to be: trade-weighted global GDP; and enhancements to UK competitiveness through technological progress.
• The UK’s global market share (of GVA) is derived from: UK aerospace value added, which is driven by UK (gross) output; and global aerospace value added, which is driven by global GDP.
• The key drivers of employment are: output; and technological progress.
• The framework also includes relationships between: output and exports; and imports and exports.
123

Figure F-1: Framework for projecting future performance
ExportsOutput
Value-added
Employment
Imports
Technological progress
InvestmentR&D
Globalvalue-added
R&D
Global GDP
Global market share
Trade-weighted global GDP
The following data and evidence are used to quantify the framework:
• Time series (historical and current) data to measure each of the indicators and drivers (the red circles and the blue ovals) – the derivation of these data is described in Annex C.
• Coefficients to quantify the relationships between drivers and KPIs (the dark blue arrows) – as described in Table F-1.
• Quantified projections of the drivers that are exogenous (i.e. not determined within the modelling framework – the red circles) – as described in Table F-1.
Table F-1 summarises the derivation of the variables within the modelling framework. All of the variables measured in monetary units have been inflation adjusted, to show real measures (reference year 2010)63; the model does not include price effects.
63 Real measures have been adjusted (using chain volume measure, cvm, method) from a nominal value to remove the effects of general price level changes over time. Future measures have been adjusted for inflation, but they have not been discounted in any other way.
124

Table F-1: Derivation of variables in the modelling framework
Variable Units Type Derivation Description
Global GDP Index 2010=1, cvm
Exogenous input
Input by user The model user enters assumptions for future growth of global GDP by eight world areas (Europe, USA, Canada, Japan, Brazil, India, China, Rest of the World), which are combined using appropriate weights to give an estimate of global GDP growth.
R&D £m, cvm Exogenous input
Input by user The user enters assumptions for future growth of R&D expenditure by UK aerospace (for the whole sector, public and private, defence and civil).
Investment £m, cvm Exogenous input
Input by user The user enters assumptions for future growth of capital expenditure by UK aerospace (for the whole sector, public and private, defence and civil).
Technological progress
£m, cvm Intermediate driver
Function of: investment; R&D
An index measuring cumulative gross investment adjusted to take account of R&D expenditure64.
Trade-weighted global GDP
Index 2010=1, cvm
Intermediate driver
Function of: global GDP; trade weights
A weighted index of global GDP. The weights (fixed over time) represent the importance of each world area to UK exports of aerospace.
Global value added
£m, cvm Output Function of: global GDP
Global value added (output) of aerospace is driven by global GDP. A simple regression (1999-2013) was used to estimate a coefficient to relate global GDP to global aerospace GVA. The user can adjust this coefficient.
64 Technological progress is often represented as exogenous in macroeconomic models (e.g. via a time trend) or as a residual in a neoclassical production function. Both methods have their drawbacks. This approach treats technological progress as endogenous by including a quality-adjusted measure of investment. See Lee, K, M H Pesaran and R G Pierse (1990), 'Aggregation Bias in Labour Demand Equations for the UK Economy', Chapter 6 in Barker, T and M H Pesaran (eds) Disaggregation in Econometric Modelling, Routledge.
125

Variable Units Type Derivation Description
(Gross) output £m, cvm Output Function of: trade-weighted global GDP; technological progress
Exports account for around 80% of aerospace gross output (production). The model therefore assumes that output is determined by the same drivers (and with the same responsiveness) as exports; these drivers are: trade-weighted global GDP; and technological progress. The model uses econometrically estimated coefficients from the export equations of CE’s MDM-E3 model. The user can adjust these coefficients.
Employment thousands Output Function of: (gross) output; technological progress
The model uses econometrically estimated coefficients from the employment equations of CE’s MDM-E3 model. These coefficients derive employment from: output; and technological progress (which boosts productivity). The user can adjust these coefficients.
Value added £m, cvm Output Function of: (gross) output
The existing model assumes a fixed ratio65 of aerospace value added to (gross) output.
Exports £m, cvm Output Function of: (gross) output
The existing model assumes a fixed ratio of aerospace exports to (gross) output.
Imports £m, cvm Output Function of: exports
The existing model assumes a fixed ratio of aerospace imports to exports.
Global market share
percent Output Function of: global value added; UK value added
UK global market share of aerospace (GVA) is calculated from UK value added divided by global value added.
Source: Cambridge Econometrics
The model, as developed during this scoping study, has made the best use of the available data and evidence. Ideally statistical methods would have been used to estimate the relationships (coefficients) between the drivers and performance indicators, but the data available for the aerospace sector has not been sufficient for this purpose.
For the derivation of output and employment, we have therefore made use of coefficients that have been estimated econometrically for CE’s existing sectoral model of the UK economy (MDM-E3) (see Box F-1 for more detail). Although these coefficients are for a
65 The ratio is fixed at its value in the most recent year of historical data.
126

broader sector than aerospace66 they offer the advantages of: being estimated over a relatively long time series of data; and being empirical estimates from fully specified econometric relationships (the impact of each individual driver is isolated, and drivers that are outside the scope of the aerospace model are included in MDM-E3’s equations). In this respect we judge them as preferable to assumptions informed solely by judgement, or simple correlations of data over a shorter period of time. They offer, at least, empirical estimates that can be sense-checked against judgement or simple correlations.
The coefficients identify the long-term impact and so while the model might show the impact of a particular change in that period, in practice the effect may be experience with a lag, and the full effect may take several years to be felt. The projections are therefore better analysed over the long term rather than looking at year-on-year changes. If users wish to look at short-term dynamic effects, the existing model could be developed further, or an alternative model could be developed. Where we have not been able to draw on coefficients from CE’s existing sectoral models, simpler approaches have been applied. A simple regression was estimated to relate global value added (output) of aerospace with global GDP. Simple rules are applied to derive value added (from gross output), exports (from gross output) and imports (from exports). There is scope to improve these parts of the model (see below for recommendations for further research to improve the modelling framework).
Box F-1: About MDM-E3 and the derivation of coefficients
MDM-E3 is maintained and developed by Cambridge Econometrics (CE) as a framework for generating forecasts and alternative scenarios, analysing changes in economic structure and assessing energy-environment-economy (E3) issues and other policies. MDM-E3 provides a one-model approach in which the detailed industry and regional analysis is consistent with the macroeconomic analysis: in MDM-E3, the key indicators are modelled separately for each industry sector, and for each region, yielding the results for the UK as a whole.
To analyse structure, the model disaggregates industries, commodities, and household and government expenditures, as well as foreign trade and investment, and incorporate an input-output framework to identify the inter-relationships between industry sectors. The models combine the features of an annual short and medium-term sectoral model estimated by formal econometric methods with the detail and structure of input-output models, providing analysis of the movement of the long-term outcomes for key E3 indicators in response to economic developments and policy changes. The models are essentially dynamic simulation models estimated by econometric methods.
The parameters of the behavioural relationships in MDM-E3 are estimated econometrically over time, within limits suggested by theory, rather than imposed from theory. The economy is represented as being in a continual state of dynamic adjustment, and the speed of adjustment to changes (in, for example, world conditions or UK policies) is based on empirical evidence. The equations are specified in the Engle-Granger co-integrating form and therefore allow for the impact of lagged and error
66 CE’s MDM-E3 model distinguishes the other transport equipment sector (SIC(2007) 30).
127

correction terms, allowing adjustment to the long-term trend. There is therefore no assumption that the economy is in equilibrium in any given year, or that there is any automatic tendency for the economy to return to full employment of resources.
Source: Description of MDM-E3, Cambridge Econometrics
F.4. Using the model and interpreting the results
This section first gives an overview of the Excel modelling tool. It then presents a baseline projection for the future performance of UK aerospace, as a worked example, and then shows how the modelling tool can be used to explore alternative projections and their sensitivity to the assumptions used.
F.4.1. Overview of the model
The model is implemented in Excel in several sheets as summarised in Table F-2. Some sheets, in which intermediate calculations are made, are hidden from the user.
Table F-2: Overview of the model
Sheet name Content
Home The ‘landing page’, with links and descriptions of the main sheets in the model.
User inputs The ‘driving seat’. Here the user can enter inputs (in yellow cells) to generate two alternative scenarios. The user can vary: assumptions for the exogenous inputs; and the econometric coefficients.
Scen1_Results Tables of results for Scenario 1.
Scen2_Results Tables of results for Scenario 2.
Chart_Scens Charts comparing the results of Scenarios 1 and 2.
Charts_data Charts of the historical data used in the model.
Hist Table of the historical data used in the model. Source: Cambridge Econometrics
The model includes historical data from 1999-2013 and projects ‘trend’ changes for the period 2013-2030. For the exogenous inputs, the user enters assumptions about the average annual change over the period 2013-2030 and from this the model derives the ‘trend’ changes over 2013-2030 for KPIs of UK aerospace: output, value added, global market share, employment, exports and imports.
The exogenous inputs are average annual % change over the period 2013-2030 for: investment expenditure; R&D expenditure; and global GDP by eight world areas (Europe, USA, Canada, Japan, Brazil, India, China, Rest of the World).
The user can also adjust the econometric coefficients used in the model to assess the sensitivity of the sector’s future performance to these coefficients: export equation coefficients (to derive output); employment equation coefficients (to derive employment); and global aerospace GVA coefficient (to derive global aerospace GVA).
128

F.4.2. A baseline projection The model has been used to generate a baseline projection for the performance of the UK aerospace sector. As described above, this baseline represents a ‘pseudo-counterfactual’ for the future performance of the UK sector without ATI support. The baseline assumptions are shown in Table F-3.
Table F-3: Inputs to the baseline projection
Input Baseline assumption
Exogenous inputs – projections (average annual % change over the period 2013-2030)
Future investment and R&D growth
R&D expenditure -0.7
Investment expenditure -0.8
Future world GDP growth
Europe 1.9
USA 2.6
Canada 2.5
Japan 1.3
Brazil 3.5
India 6.2
China 7.2
Rest of the World 3.3
World total 3.5
Econometric coefficients (elasticities)
Export equation coefficients
Trade-weighted global GDP 0.84
Technology index 0.61
Employment equation coefficients
Gross output 0.20
Technology index -0.12
Global aerospace GVA coefficient 0.64 Source: Cambridge Econometrics
129

The baseline assumes that the future growth of R&D and investment expenditure will continue at the same pace that was observed in the decade prior to the announcement of ATI (2002-2012). This represents an assumption that the pattern of private expenditure and government support for aerospace will continue at a scale similar to that in recent years prior to the announcement of ATI – that is a modest decline in both R&D and investment expenditures.
The assumptions for future global growth are taken from CE’s most recent economic forecast. These assumptions shows future growth of world GDP of around 3¾% each year, with growth assumed to be slower in developed economies than emerging economies.
The econometric coefficients are expressed as long-term elasticities – having taken account of short-term dynamic responses, the elasticities show (on average over the long-term) how much variable Y responds in a given year to a change in variable X in that year. The elasticities are interpreted as follows.
In the employment equation: for a 1% increase in aerospace gross output, all other things being equal, employment will increase by 0.2%; and a 1% increase in the technology index causes employment to fall by 0.12% (productivity gains).
In the export equation (used to determine output): a 1% increase in trade-weighted global GDP increases output by 0.84%; and a 1% increase in the technology index increases output by 0.61%.
In the global GVA equation: a 1% increase in global GDP increases global aerospace GVA by 0.64%.
The results for the baseline projection are summarised in Table F-4.
It is a weighted index of global GDP that is used to drive output - the weights (fixed over time) represent the importance of each world area to UK exports of aerospace. Note that the trade-weighted measure of global GDP is forecast to grow more slowly than average global GDP, because the UK’s markets are assumed to grow less rapidly than others.
UK aerospace output and value added are projected to continue to grow, at around 2% pa over 2013-2030, and employment is also projected to grow, by around 0.5% pa. UK market share is projected to shrink slightly from just over 9% in 2013 to just under 9% by 2030. Note that export and imports are projected to grow at the same pace as output – this is the outcome of the simple rules that are used in the existing model.
The logic of the model is that, all other things being equal, the performance of UK aerospace (as measured, for example, by output and market share) would be improved by increased spending on R&D and investment. The model can be used, for example, to assess what growth of R&D and investment would be required to curb the projected fall in
130

Table F-4: Headline results for the baseline projection
2008-2013 2013-2030
Global indicators (average annual % change)
Global GDP 1.8 3.5
Trade-weighted global GDP 1.2 2.9
Global aerospace GVA 6.9 2.3
UK aerospace KPIs
Technology index -1.7 -0.6
Output 4.4 2.1
Value added 5.5 2.1
Employment 1.1 0.5
Exports 7.2 2.1
Imports 4.7 2.1
2008 2013 2030
Global market share (of GVA) 9.8% 9.1% 8.9% Source: Cambridge Econometrics
global market share?67 Leaving the assumptions of global GDP growth as in the baseline, the model suggests that the growth of R&D and investment expenditure would need to be increased by 0.25 percentage points in each year (to -0.45% and -0.55% pa, respectively) to prevent a decline in global market share by 2030.
F.4.3 Sensitivity analysis The assessment above of what growth of R&D and investment would be required to curb the projected fall in global market share illustrates how the model can be used for sensitivity analysis to investigate uncertainties and generate alternative scenarios. Here we provide further examples.
1. What impact might the composition of world growth have on UK aerospace?
Two alternative scenarios are generated. Compared with the baseline, only the assumptions for global GDP growth are varied:
• Scenario 1 – assumptions and inputs the same as the baseline.
67 Note, this does not imply the model can be used to project the impact of intervention. It is simply telling us the growth/level of R&D required to maintain UK global market share, without making any statement on how that is achieved (i.e. with or without intervention).
131

• Scenario 2 – same global GDP growth as Scenario 1, but slower in UK key markets (USA and Europe) and faster elsewhere.
Table F-5: Assumptions for alternative compositions of global GDP growth
Input Scenario 1 assumption Scenario 2 assumption
Exogenous inputs - projections (average annual % change over the period 2013-2030)
Future world GDP growth
Europe 1.9 0.0
USA 2.6 0.0
Canada 2.5 2.5
Japan 1.3 1.3
Brazil 3.5 4.5
India 6.2 7.3
China 7.2 9.0
Rest of the World 3.3 3.5
World total 3.5 3.5 Source: Cambridge Econometrics
Table F-6: Headline results for the projections with alternative compositions of global GDP growth
Scenario 1 Scenario 2
2008-2013 2013-2030
Global indicators (average annual % change)
Global GDP 1.8 3.5 3.5
Trade-weighted global GDP 1.2 2.9 2.5
Global aerospace GVA 6.9 2.3 2.2
UK aerospace KPIs
Output 4.4 2.1 1.7
Value added 5.5 2.1 1.7
Employment 1.1 0.5 0.4
2013 2030
Global market share (of GVA) 9.1% 8.9% 8.4% Source: Cambridge Econometrics
132

Figure F-2: Projections of market share with alternative compositions of global GDP growth
0%
2%
4%
6%
8%
10%
12%
2005 2009 2013 2017 2021 2025 2029S1 UK share of global GVA (%) S2 UK share of global GVA (%)
Source: Cambridge Econometrics
The results for these two scenarios are summarised in Table F-6 and Figure F-2. As would be expected, UK aerospace suffers a worse performance in Scenario 2 in which GDP growth is slower in the UK’s key markets (USA and Europe) and faster elsewhere: output growth and employment growth are curbed, and global market share declines more rapidly.
2. How sensitive are the model results to the econometric coefficients?
As an example, we use the coefficient on the technology index in the equation used to determine output. The coefficient in the baseline (and Scenario 1) is 0.61, indicating that a 1% increase in the technology index increases output by 0.61%. In Scenario 2 we increase the coefficient to 1 – this higher coefficient would indicate that UK competitiveness is boosted to a greater extent by the technology index than in the baseline.
The results for these two scenarios are summarised in Table F-7. UK aerospace sees a weaker performance in Scenario 2 in which output is more responsive to increases in the technology index: this is because (in both Scenarios) the technology index is assumed to fall modestly, and so the higher coefficient translates into a larger negative impact on output. The overall impact of the change in the coefficient is fairly modest.
133

Table F-7: Headline results for the projections with alternative coefficients for technology index impact on output
Scenario 1 Scenario 2
2008-2013 2013-2030
Global indicators (average annual % change)
Global GDP 1.8 3.5 3.5
Trade-weighted global GDP 1.2 2.9 2.9
Global aerospace GVA 6.9 2.3 2.34
UK aerospace KPIs
Output 4.4 2.1 1.9
Value added 5.5 2.1 1.9
Employment 1.1 0.5 0.4
2013 2030
Global market share (of GVA) 9.1% 8.8% 8.5% Source: Cambridge Econometrics
F.5. Implications for monitoring and evaluation
This scoping study has developed a modelling framework to produce a baseline projection of the sector’s future performance. The model has made the best use of the available data and evidence to incorporate key elements that can provide a sufficiently logical and insightful projection. The model is a systematic framework to generate alternative scenarios incorporating different expert views, assumptions or projections (e.g. of global demand) and mapping these onto alternative economic outcomes for the sector (e.g. GVA and employment). The model is not a tool for estimating returns to investment68; as a tool to inform evaluation, the model can be used as follows.
As presented above, a forward-looking ‘without support’ projection of expected performance has been prepared against which the ‘with support’ actual outcome can eventually be compared, and hence some assessment of ATI impact inferred (including through triangulation with other evidence).
As additional years of outcome data become available, the model can be re-calibrated to the new data and an ‘updated’ baseline projection prepared from the new starting point.
We have also illustrated other types of assessment for which the model can be used (for example, what growth of R&D and investment would be required to curb the projected fall
68 Any attempt to use the model to estimate returns to investment should recognise that the impacts calculated show the effects of total R&D (private is not distinguished from public) on the UK aerospace sector, including spillovers generated within the sector.
134

in global market share, or what impact might the composition of world growth have on UK aerospace).
If the model was to be used in its current form as part of a future evaluation of the ATI, its results will need to be carefully interpreted in the context of changes in external factors. This particularly includes understanding support for R&D in other countries. We understand that BIS has commissioned work to gather evidence about R&D and government support to aerospace in other countries. This would provide useful contextual evidence in which to interpret the results of this model.
This model is for the sector as a whole – it takes a top-down/macro approach to generate indicative sector-level scenarios. A different (bottom-up) approach would be required to look at issues such as specific product supply chains and comparative advantage. Other approaches and analyses could complement the sector-level model - to derive bottom-up insights to challenge, check and interpret the sector-level insights.
Due to insufficient data for the required variables, the data and projections from the model are for the aerospace sector as a whole; they do not distinguish civil from defence. There is limited evidence (see Chapter 4: The baseline at sector level) to assess the proportion of the sector's production attributable to civil: estimates vary between 50-70%. There is insufficient evidence to assess the responsiveness of civil aerospace to changes in the key drivers; indeed the coefficients used in the model are for an even broader sector (other transport equipment) than (civil plus defence) aerospace. The results of the model indicate the overall aerospace sector's future performance given a defined set of assumptions and based on a transparent and logical framework; this is not an unreasonable framework for the evaluation of ATI because there is insufficient evidence to differentiate the relative responsiveness of civil versus defence and because developments in the civil sector are likely to spill over into the defence sector.
F.6. Recommendations for further research to improve the modelling framework
The development of the model to date reflects the constraints of the available data, and the scale of resource allocated to this task in this scoping study. Recommendations for further research to improve the modelling framework can be summarised as follows:
As additional years of data are released, sufficient time series (and additional indicators) may become available to: assess trends to check and challenge the coefficients used in the model; or potentially to estimate econometric equations using the specific UK-aerospace dataset.
In the current model, simple but logical relationships are used to derive projections of value added, exports and imports. The model assumes that in the future, the ratios of output to value added, exports to output, and imports to exports, will remain fixed at their value in the most recent year of data. As a longer time series of data for aerospace becomes available, it may be feasible to develop more sophisticated methods to either project these ratios, or characterise and quantify the relationships between output, value added, exports and imports.
135

Annex G. Key evaluation methods and tools The mixed methods, theory-based approach proposed for the evaluation of the ATI will be carried out from two perspectives: top-down and bottom-up. The remit of the bottom up perspective is to generate project level evidence on the outputs and outcomes generated by the ATI programme, and thereby validate (or disprove parts of) the intervention logic and theory of change in chapter 2 of this report. The intention is to combine the evidence collected as part of this process with the top-down approach, which is to compare actual sector performance data with a modelled pseudo counterfactual to establish causality. This annex presents further detail on the key methods for the bottom-up perspective, namely the beneficiary survey and case studies, including approaches and key question topics.
G.1. Beneficiary Survey
Beneficiary surveys are frequently used as a form of primary evidence gathering for policy and programme evaluations. For the ATI programme, the survey will be principally focused on the treatment group (i.e. beneficiaries), as a formal control group of non-beneficiaries that would enable an empirical impact evaluation approach has been ruled out (though a short survey of unsuccessful project applicants may be an additional option). The beneficiary survey is crucial for collecting data on project level outputs and outcomes, and thereby inferring the contribution of the programme to wider impacts. The additional details on the method outlined here cover:
• Data collection – how the evidence will be collected, by whom and over what time period
• Scope and sampling – who will be interviewed as part of the beneficiary survey and how will they be selected
• Survey content – what evidence will be generated through the beneficiary survey.
G.1.1 Data collection The default position in a policy context such as this is for an external contractor to design, administer and deliver beneficiary surveys of this type. Given the time periods involved with the programme and the timeframe to impact, multiple evaluations of the ATI programme will have to be carried out: we propose interim evaluations in 2016/17 and 2019/20, and a final evaluation in 2022/23. Each of these should include a beneficiary survey, and it would be useful for the second and third evaluations to go back to (some or all) beneficiaries that were already surveyed in the first wave, so as to collect data on outcomes that will take longer to materialise.
There are various options for data collection. These range from face to face interviews to online surveys. In this instance, and given the complexity of the intervention, the ATI beneficiary survey lends itself best to telephone interviews. While it could be carried out
136

via an online survey, it is unlikely to garner sufficient response rates from an already small total unique beneficiary population (see section below), nor provide the responses of sufficient quality (relatively complicated surveys such as this run the risk of respondents providing answers in too much haste). It is particularly difficult to assess contribution of a policy to a change in project outputs and outcomes through an online survey for example, and a direct conversation can ensure understanding of questions, thereby reducing the risk of biases. A telephone survey may also provide an opportunity to involve more than one representative from a given firm in the conversation, especially from lead beneficiaries who will typically be able to provide both a financial and technical perspective.
G.1.2. Scope & sampling The ATI programme is expected to support in the range of 200 to 250 discrete projects over its duration. This is cumulative however, and some projects will not be completed until after the seven year programme period. That said, the first significant wave of ATI projects will complete around 2016. Based on initial programme monitoring data, it is estimated that the total universe of unique beneficiaries (which could be surveyed) is likely to be in the region of 200 to 250 by the end of the seven year programme. This includes both lead and non-lead partners.
Given the relatively small number of unique beneficiaries, even towards the end of the programme period, there is scope to survey the entire population. This will therefore cover the heterogeneity of ATI projects, and hence generate evidence on the three ATI project classifications: Secure, Exploit and Position; in addition to capital infrastructure projects and the various priority value streams. It should also cover both lead beneficiaries and non-lead partners, so as to ensure that data are also collected from SMEs and the research base involved. The survey should cover both finalised and ‘live’ projects, especially for the first interim evaluation in 2016/17 where the number of finalised projects is still likely to be low.
G.1.3. Survey content The purpose of the beneficiary survey is to generate evidence on the core elements of the intervention logic and theory of change presented in chapter 2. The table which follows outlines the core topics which should be covered; how they relate to the key performance indicators, and the supplementary indicators (outlined in chapter 3); and a brief overview of content. This should be used as a starting point for developing the eventual survey questionnaires.
137

Table G-1: Main topic to be covered in ATI beneficiary Survey
Topic Issues to be covered Associated KPI Indicators Purpose
Introduction • Basic facts about the project • Project aims • Implementation
NA This will establish a number of basic facts about the project and the respondent. It will gather information on the respondent company/individual and their role in the project, project aims, reasons for using ATI funding, alternative finance considered/applied for, activities funded, project status (ongoing or finalised), where it sits in terms of the SEP model and priority value streams, implementation, roles of other partners (NB: if available, some of this information could be sourced from monitoring data instead)
Technology related outputs
• Basic R&T spend • Progression through early
TRLs. • Intellectual property developed
(incl. patents) • EU / International R&T funding
obtained
K1, S1, S2, S12 This topic will seek evidence on the direct outputs of the project in terms of research results, in particular the stage of technology development. It will specifically seek to test how the ATI has leveraged in industry spend including any further subsequent investment required or funding obtained from other sources; and how it has aided progress through to the mid TRLs (and how this compares to the original target TRL). As part of this, it will look at the R&T grant’s role in negating any barriers to development, and the effect of collaborative working in smoothing the technological development process. In addition, it will gather early stage information on intellectual property in development / developed (if any).
Infrastructure related outputs / outcomes
• Delivery and use of new / upgraded R&T infrastructure
S3, S6 As more of a standalone piece (relevant only for the capital infrastructure project grants), the R&T infrastructure topic will generate insight primarily on its use for driving technological development. It is an essential part of the mix which will drive technologies through TRLs, so understanding its role in this context, and how it interacts with other ‘development factors’, will be important. It will also gather information on who the beneficiaries of the new infrastructure are, including scale of users, reasons for use and types of benefits derived (including decision making in terms of R&T / manufacturing location).
Skills and knowledge creation outcomes
• Skill level of aerospace workforce
S5 The extent to which ATI projects bring about changes in workforce skills is another core area of the intervention logic. This section will seek evidence on whether exposure to new technologies and research brought about by the ATI has led to any skills development in the workforce and management.
138

Topic Issues to be covered Associated KPI Indicators Purpose
Economic outcomes
• R&T and manufacturing job creation / safeguarding.
• New orders and associated turnover, GVA impacts
K3, K6, K8, S8 The economic outcomes will materialise over different time periods. First – and for the interim evaluations in particular – the survey will gather information on jobs directly associated with R&T activity for each project / beneficiary. For businesses whose technologies have reached market readiness, orders, either with larger companies in the supply chain or direct with air-framers will be captured through the survey. This will involve questions that seek to quantify turnover effects. The survey will also seek evidence on subsequent employment effects of reaching market readiness, including for manufacturing. GVA can be estimated based on the employment and/or turnover effects.
Collaboration & supply chain related outcomes
• Knock-on effects in the supply chain incl. on GVA, turnover and employment.
• Collaborations between businesses and businesses and the research base.
S9, S10, S11 The ATI grants are for collaborative R&T. A key part of the theory of change for the ATI is that collaboration, as well as the ATI’s strategic role itself, will lead to ‘better’ projects. This part of the survey will test this concept, and make a qualitative assessment on whether such collaboration genuinely does help in the technology development process. Understanding whether it is equally beneficial for lead businesses as well as SMEs and the research base will also be important. Over the longer term, questions will also be pitched at the nature of the collaborations and whether they lead to structural changes in the supply chain; whether relationships are maintained over the long term; and whether they have led to additional partnership working.
Technological performance and sector competitiveness outcomes
• Aircraft performance enhancements
• UK aerospace sector competitiveness
S13, S14, S15 This section will only be relevant once direct orders have been secured from airframes. It will cover aspects related to aircraft performance brought about by ATI technologies. In many cases, technologies will be a small part of the technology mix which brings about improvements and this will need to be explored, insomuch as it can be inferred. In addition a qualitative perspective will be gleaned from respondents on the overall significance of the technology. This may be looked at in terms of overall global comparative advantage (i.e. uniqueness); in terms of applicability to all airframes (i.e. reach); and for Position projects primarily in terms of how it changes the ‘playing field’. All will have a bearing on the competitiveness of the UK aerospace sector. The survey will only be able to capture evidence on these issues at a high level, which could be probed in more detail through the in-depth case studies.
139

Topic Issues to be covered Associated KPI Indicators Purpose
Spillover outcomes
• Spillovers both within the sector, and cross sectors.
S16 Spillover outcomes will be relevant primarily for projects which have reached commercialisation. First the survey will test perceptions of whether any spillovers have occurred, whether internal (within the aerospace sector) or external (cross-sectors). It will then look to gather information on which organisations have benefited (e.g. researchers, suppliers, competitors, others), and the headline nature of spillover effects. Again, the survey will only be able to capture evidence on these issues at a high level, which could be probed in more detail through the in-depth case studies.
Additionality, displacement and leakage
• A qualitative assessment of to what extent the activities, outputs, outcomes above would have occurred without ATI support.
N/A To understand the ‘net’ effects of ATI funding, the survey will cover additionality, displacement and leakage. They are all fundamentally important for inferring the attribution of changes in the outcomes dealt with above to the ATI programme; put differently, what would have happened in the absence of the project funding from the ATI. Project additionality will be assessed through considering the extent to which projects would have gone ahead without ATI funding (this could also be tackled with a survey on unsuccessful project applications); and outcome additionality will be tested through questions on the extent to which outcomes reported would have been achieved otherwise (or to a different scale, speed and/or quality). Displacement should use BIS-standard questions on markets and competitors. Leakage could be tested to consider the extent to which projects have resulted in job creation or other outcomes outside of the UK.
Source: SQW
140

The topics in the table above provide a comprehensive set of topics for the beneficiary survey. However, there will need to be appropriate routing and variations in question wording and responses to reflect the heterogeneity across the programme and the different types of beneficiary. This will need to take account of:
• lead versus non-led partners
• large multi-nationals, SMEs (usually as non-lead partners), and research institutes
• heterogeneity of projects based on the SEP model and priority value streams.
G.2. Case Studies
Case studies form the second main strand of the evaluative research under the bottom-up approach. They are well suited to theory-based evaluation given they allow for more rigorous assessment of project outcomes and how they were achieved. Their purpose is to test the extent to which the outcomes that can be observed coincide with those outlined in the intervention logic, as well as making a comprehensive, qualitative assessment of attribution, and thereby adding to the ‘thinner and wider’ evidence generated by the beneficiary survey. At the same time, the case studies should also contribute to the process evaluation of the ATI programme by assessing the implementation of projects. In summary, they will pursue four conceptually distinct but inter-related main objectives:
• Undertake a detailed assessment of the outputs and outcomes produced by the project to date
• Provide reasoned estimates (based on the best available evidence) of the likely longer-term outcomes and impacts of the project, including key risks and uncertainties
• Analyse the extent to which these (actual as well as expected future) results are attributable to the project as such, and identify and assess the contribution of other (external) factors
• Assess the implementation of the project, including key success factors and challenges, and the strategic added value of the ATI (via the three ‘internal drivers’ identified in the intervention logic).
G.2.1. Sampling The number of case studies to be carried out depends on a number of considerations, including the available budget for evaluation; in order to ensure sufficient breadth, at least 10-15 case studies should be envisaged as part of each interim / final evaluation. Given their purpose, the sample selection for the case studies is paramount. It is proposed that case studies are purposefully selected mainly (but not exclusively) for those projects that appear most likely to demonstrate and provide evidence of the ATI programme’s economic benefits. They are also time critical, reflecting the varying timescales to impact for the different SEP project classifications. As a result, case studies should also be selected based on their stage of technological development. The technology mapping exercise (outlined in chapter 5) should serve to prioritise projects where significant economic
141

impacts may have occurred and the relative contribution of the ATI programme can be tested. Ideally, these will be projects that were finalised within the two to three years prior to the evaluation research (balancing time for outcomes to emerge with ‘corporate memory’ necessary to obtain meaningful feedback), and cut across the SEP model and priority value stream project classifications. In addition projects might be chosen based on the achievement of specific outcomes of interest, such as spillover impacts, or anchoring manufacturing jobs in the UK. Ultimately, project selection should cover a range of different types of projects, with an emphasis on those where there may (potentially) be significant economic impacts for which attribution can be tested. The proposed sampling criteria are summarised in the table below.
Table G-2: Sampling criteria for case studies
Headline criterion Rationale Aspects to consider
Representativeness Ensure sample reflects the variety and heterogeneity of ATI-funded projects
Project size (budget, number of partners) Project theme (by value streams / enabling technologies and capabilities Expected timescale to impact (SEP model) R&T / infrastructure projects (data on all these should be collected as part of portfolio monitoring)
Likely impact Prioritise projects that demonstrate the potential economic impact of the ATI programme
Projects that address the most recent and emerging technologies that are likely to be key to the competitiveness of the UK industry in future (identified as part of technology mapping)
Particular areas of interest
Include specific key outcomes that are difficult to test via other methods
Projects that are likely to lead to spillover effects (e.g. via Catapult Centre involvement) Engagement of the supply chain
Source: SQW
Some of the case studies should also be longitudinal, given the time frames involved for outputs and outcomes to materialise. The first and second interim evaluations (2016/17, 2019/20) and the final evaluation (2022/23) will allow for repeat consultations and thus track a project over time. This can be planned as part of case study selection at the outset, but is likely to need revisiting for each wave of evaluation. The focus of each consultation will thus be on the part of the intervention logic (in terms of outputs, short term outcomes, medium term outcomes) most relevant to the project at that point in time. In some instances, the ATI may fund a follow-up project to take forward the results of an earlier project, providing opportunities for case studies to cover both the early results of the ‘new’ project and the longer-term outcomes of its predecessor (which may in turn have been the subject of a case study for an earlier evaluation).
142

G.2.2. Data collection The content of case studies should vary, reflecting the heterogeneity of ATI projects and businesses involved, and include both desk-based research and a series of interviews with direct and indirect beneficiaries:
• Common to all will be an assessment of the project monitoring data and project information collected by Innovate UK including the business case, progress reports and project-close reports, as well as, where available, the results of ex-ante value-for-money appraisals conducted by BIS or the ATI.
• Consultations (in-depth interviews) should be held with both lead and non-lead partners, and wherever possible multiple representatives from each to cover both financial and technical perspectives. Where relevant, consultees should include project partners that are SMEs (in particular to assess effects on the supply chain) and research institutions (in particular to assess possible spillover effects). Depending on perceptions of spillover effects, further consultations may be necessary with other companies, researchers and industry representatives to validate potential spillovers.
Through the consultation process, detailed qualitative and quantitative information will be gathered based on broadly the same topics related to (actual and likely future) outcomes outlined in Table G-1 above. In addition, the consultations should address project implementation, as well as the question of attribution of / contribution to outcomes and impacts (relative to other potential contributing factors). Focus will be placed on specific elements of the intervention logic, based on the selection rationale. In some cases, it may also be worth discussing with beneficiaries whether they also submitted any applications for ATI funding that were unsuccessful, and if so, what happened to those projects. This could provide further evidence as to the additionality of ATI funding, and thereby add further nuance to the contribution narrative.
G.2.3. Analysis and reporting The case studies will examine in detail the contribution of the ATI grants to observable changes in project outcomes (on an ex-post basis, as well as on an ex-ante basis for impacts that are yet to materialise), as well as assess the implementation process. They will seek to understand all the various factors which might have driven such changes, including the external factors identified in the intervention logic (which may either increase or lessen the impact of ATI-funded projects), as well as internal drivers (in particular the ATI’s role in prioritising and developing ‘strategic’ projects).
The case studies should seek to consider the different perspectives of different consultees, and seek to identify and make explicit the underlying reasons for differences in opinion, in particular where there may be differing views on the attribution of outcomes to the ATI project. This will be important in addressing potential biases that may otherwise affect the robustness of the contribution story.
The systematic consideration of these factors should put case studies in a position to carry out a robust ‘contribution analysis’ that demonstrates if and how the project in question has led to technological breakthroughs, and the extent to which these have led (or are likely to
143

lead to) commercial / economic results. Doing so will help to understand the role the ATI programme played in bringing about outcomes and impact, and thereby allow the evaluator to make stronger inferences about causality and attribution. The results of each case study should be written up into a concise self-standing report which can be referred back to in case the same project is reviewed again as part of a subsequent evaluation. The structure should reflect the four main case study objectives identified at the outset of this section.
144

Annex H. Monitoring framework As part of the present scoping study, we were tasked with making practical recommendations to ensure that the monitoring system in place for the ATI informs on-going management of the portfolio and provides the data required for evaluation, in particular at the level of activities, outputs and short-term outcomes. For this purpose, we assessed if and how ATI programme monitoring could or should generate data on the different indicators identified as part of the study. Chapter 3 of this report distinguishes three separate categories of indicators:
Key Performance Indicators (KPIs): A limited number of metrics related to those results that we consider to be most relevant and significant in assessing the overall performance of the ATI programme. These are the indicators that should be included in a KPI ‘scorecard’, to be tracked on a regular (e.g. annual) basis.
Supplementary performance indicators: Other metrics that can be important for understanding particular aspects of the ATI programme’s context and functioning. These indicators are of lower priority than the KPIs, but should still be duly considered in future monitoring and/or evaluation, and indeed provide critical contextual data to inform the interpretation of evaluation findings.
Portfolio indicators: These provide important information about the types of projects being funded and the composition of the portfolio that the ATI is responsible for. They do not relate to the ATI programme’s performance as such, but provide input for the ongoing management of the portfolio, as well as information to inform and facilitate eventual evaluation activities (such as the sample selection for case studies).
These indicators provided the starting point for our thinking around the monitoring system, which was further informed by a discussion with Innovate UK on their current monitoring processes and practices on 7 April, and a conference call with representatives of the ATI, Innovate UK and BIS on 2 June to discuss a first draft of the framework presented below. The remainder of this Annex sets out our proposed approach to the monitoring of the ATI programme to inform the evaluation.
H.1. Approach and parameters
Five points are made regarding the approach and parameters of the proposed monitoring framework:
• First, the focus is on providing recommendations for programme monitoring systems, to provide the subsequent evaluation with data on the activity, outputs and outcomes for the ATI project portfolio as a whole (aggregated from project level data), as well as other core information that would be required to inform evaluation. The focus is not on providing recommendations for modifications to the core on-going project monitoring undertaken by Innovate UK.
• Second, the consideration of programme monitoring activity and resulting recommendations should be consistent with the approach as set out in the Project
145

Monitoring Framework document.69 In this context, the ATI is ‘different’ to other Innovate UK interventions, potentially requiring an enhanced approach to monitoring, and meaning that there is scope to develop specific systems/processes to reflect this.
• Third, notwithstanding the need to provide an enhanced approach to programme monitoring, the systems and processes for this need to be proportionate and reasonable, both for Innovate UK in collecting and managing the information, and for applicant/supported firms in providing data and information.
• Fourth, the proposed additions/revisions to the monitoring framework for the ATI should be made in the context of the possible change in the project close-out processes at Innovate UK across all of its programmes/schemes, potentially including an impact survey. If this is rolled out in the (near) future, it would be helpful for Innovate UK to consider the scope to include the proposed suggestions for data to be collected at project close-out stage (see below) in the close-out survey for ATI projects specifically (thereby limiting any duplication of effort for Innovate UK and beneficiary firms). More generally, if such a survey were to be rolled out across all Innovate UK projects, consideration should be given to the extent that it could also provide meaningful data on other outcome indicators, e.g. on employment, spillover effects, etc., and thereby potentially also reduce the need for a separate beneficiary survey to be carried out as part of an external evaluation.
• Fifth, the consideration of programme monitoring systems is based on the intervention logic for the ATI programme (see Annex A) and the indicators derived from it (see Chapter 3), focused on the activity, outputs, short- and medium-term outcomes that we initially considered could be captured through monitoring activity. All those indicators for which we had identified monitoring as a possible data source at some stage of the study are covered in this note (but note that the indicator tables in Chapter 3 have been updated to only mention monitoring as a source where the review presented below suggests this is practical). It is also assumed that inputs (i.e. data on planned and actual expenditure) are collated centrally by Innovate UK.
We note that we have not considered any implications of the proposed monitoring systems for information management/data security: it is assumed that the existing protections and procedures in place will cover the additional data proposed. This will need to be confirmed by Innovate UK.
69 Innovate UK Project Monitoring Framework. Issue 6.1, March 2015
146

H.2. Programme monitoring framework – mapping and gapping
To inform the proposed recommendations on the monitoring systems for the ATI, SQW has reviewed relevant documents on existing monitoring and performance management. This has identified the existing systems (i.e. mapping), and data that are required to inform evaluation and support effective ATI portfolio and performance management but are not currently collected (i.e. gapping). This exercise has included the indicators identified previously in the study.
Revisions/additions to the programme monitoring systems have been considered at five stages in the ATI project journey:
• Application (where data would be collected on both successful and unsuccessful applicants)
• Approval/contracting
• Regular project monitoring (quarterly or annual monitoring)
• Project close-out
• Post-project contact period (the five-year period following project close in which firms are contractually obliged to provide information to Innovate UK).
The table below sets out our proposals for revisions/additions for monitoring covering metrics for activities, outputs and relevant outcomes, and clarifies in relation to each indicator whether revisions / additions to the current monitoring system are recommended, and if so, at what stage. Note that the ‘Collected by existing monitoring?’ column sets out whether the data identified is currently collected by Innovate UK in terms of what projects are planning to do (i.e. as set out in the application) and/or what is actually delivered.
147

Table H-1: Proposed developments to the monitoring system for the ATI programme
Indicator type #70 Indicator
Collected by existing monitoring? Proposed additions to
monitoring system Stage of revisions / additions
Comments Planned Actual
Activity P1 & P2 Headline project category
No N/A
Categorisation of project activity by: • Collaborative research • Capital infrastructure • Both • Other
(i) Application (ii) Approval / contracting
• Self-defined category at application stage, to be checked and confirmed at approval/contracting stage
Activity P3 Private R&T spend on ATI co-funded projects Yes No
Data on actual (achieved) private spend to be collected from project lead as part of the completion report
Project close • Based on discussions with Innovate UK, it may be too difficult / burdensome to track how actual private spend evolves over the course of projects. Need to consider proportionality
70 The numbers of the indicators refer to the key performance (K), supplementary performance (S) and portfolio (P) indicators as listed in the tables in Chapter 3 of this report.
148

Indicator type #70 Indicator
Collected by existing monitoring? Proposed additions to
monitoring system Stage of revisions / additions
Comments Planned Actual
Activity P4 R&T themes
No N/A
Categorisation of project activity by ATI Priority value stream (Whole aircraft, Structures, Systems, Propulsion) and/or Enabling technologies and capabilities (Aerodynamics, Manufacturing, Materials, Technology infrastructure, Process and tools)
(i) Application (ii) Approval / contracting
• Self-defined category at application stage, to be checked and confirmed at approval/contracting stage
Activity P5 Timescales to impact category
No N/A
Categorisation of project activity by: • Secure (short term) • Exploit (medium term) • Position (long term)
(i) Application (ii) Approval / contracting
• Self-defined category at application stage, to be checked and confirmed at approval/contracting stage
Activity P6 Demonstrator projects launched
No No (i) Question on whether project is a demonstrator to be included in application form (Yes/No) (ii) Delivery against intention for demonstrator collected from project lead as part of the completion report
(i) Application (ii) Project close
• Option for performance against intention to be collected in close out meeting rather than completion report, if it is felt this is necessary (could there be projects that aimed but “failed” at being demonstrators?)
Activity P7 SMEs / companies in the supply chain involved in projects
Yes (Yes) None – data available from existing systems on both numbers of SMEs involved and funding allocated to them
- • May be a case to check SME involvement at project close to validate existing data
149

Indicator type #70 Indicator
Collected by existing monitoring? Proposed additions to
monitoring system Stage of revisions / additions
Comments Planned Actual
Activity P8 Research base (universities, Catapults) involved in projects
Yes (Yes) None – data available from existing systems on both numbers of research institutes involved and funding allocated to them
- • May be a case to check research base involvement at project close to validate existing data
Activity P9 TRLs at project start and target TRLs at completion
No No
Question on expected TRL development to be included in application form Consistency with applicable definitions to be verified during contracting stage
(i) Application (ii) Approval / contracting
• Concerns among some stakeholders over the lack of a formally agreed definition
• However, focus on progress through TRLs (rather than absolute levels) means minor differences in interpretation should not affect usefulness of results
Output S1 EU / international R&T funding obtained
No No
Data on leveraged EU / international funding to be collected from project lead as part of the completion report
Project close • Option for data to be collected in close out meeting rather than completion report
Output S2 Intellectual property developed (including patents)
No No None – to be covered through evaluation research
- • Majority of projects not expected to lead to patents or other quantifiable measures of IP
• Technological progress better assessed via TRLs
150

Indicator type #70 Indicator
Collected by existing monitoring? Proposed additions to
monitoring system Stage of revisions / additions
Comments Planned Actual
Output S3 R&T infrastructure created
No No Data on completion of planned infrastructure projects (see P2 above) collected at project close
Project close • To check delivery against intention to create infrastructure, unless this is clear from other sources
Short-term outcomes
K1 Projects progressing through TRLs 4-6
No No (i) Pro forma on baseline TRL stage and target TRL by project close included in project approval process for completion by project lead (see P9 above) (ii) Data on achievement against TRL, and any change on stage to be collected as part of on-going monitoring (at least) on an annual basis
(i) Project approval (ii) Regular monitoring (annually)
• TRL definitions may need to be clarified by ATI and agreed with Innovate UK/BIS prior to roll-out
• Innovate UK to consider scope to apply TRL to existing projects retrospectively, to provide consistent baseline across supported projects
• Option to include TRL pro forma at application rather than approval stage
151
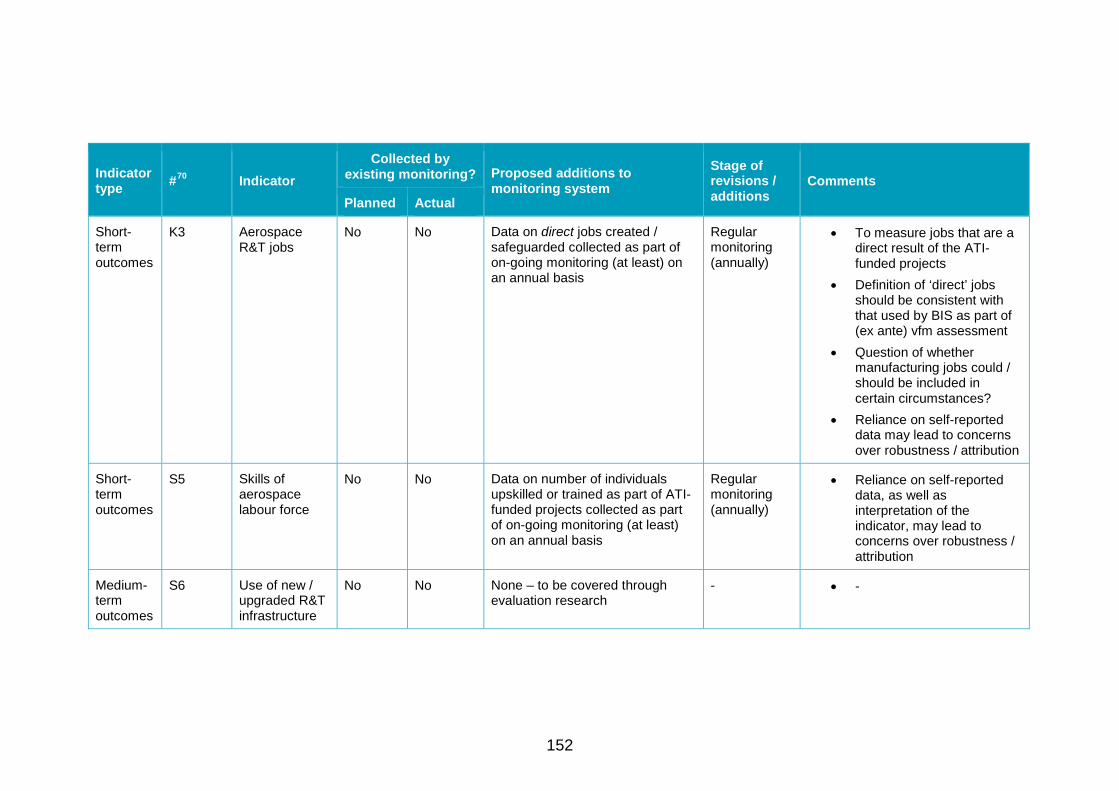
Indicator type #70 Indicator
Collected by existing monitoring? Proposed additions to
monitoring system Stage of revisions / additions
Comments Planned Actual
Short-term outcomes
K3 Aerospace R&T jobs
No No Data on direct jobs created / safeguarded collected as part of on-going monitoring (at least) on an annual basis
Regular monitoring (annually)
• To measure jobs that are a direct result of the ATI-funded projects
• Definition of ‘direct’ jobs should be consistent with that used by BIS as part of (ex ante) vfm assessment
• Question of whether manufacturing jobs could / should be included in certain circumstances?
• Reliance on self-reported data may lead to concerns over robustness / attribution
Short-term outcomes
S5 Skills of aerospace labour force
No No Data on number of individuals upskilled or trained as part of ATI-funded projects collected as part of on-going monitoring (at least) on an annual basis
Regular monitoring (annually)
• Reliance on self-reported data, as well as interpretation of the indicator, may lead to concerns over robustness / attribution
Medium-term outcomes
S6 Use of new / upgraded R&T infrastructure
No No None – to be covered through evaluation research
- • -
152

Indicator type #70 Indicator
Collected by existing monitoring? Proposed additions to
monitoring system Stage of revisions / additions
Comments Planned Actual
Medium-term outcomes
K5 Technologies reaching TRLs 7-9
No No None – to be covered through evaluation research
- • We understand that ATI projects will normally fund R&T only up to TRL 6. Higher levels would only be reached post project completion.
• Data could be collected via a beneficiary survey approx. 2-3 years after project completion. However, unclear if this would be feasible / proportionate as part of monitoring (as opposed to evaluative research).
Source: SQW
153

H.3. Summary
A summary of the proposed revisions/additions to strategic monitoring by the stage of the project journey is set out below.
Table H-2: Summary of proposed additions/revisions by stage of project journey
Stage Proposed additions/modifications to the existing process
Application • Question on Headline project category included • Question on Priority value stream and/or Enabling technologies and
capabilities included • Question on Timescale to Impact category included • Question on whether project is a demonstrator included • Question on start and target TRL included
Approval/contracting • Validation of the applicants’ responses to all of the above; changes to project categorisation where necessary
Regular monitoring (quarterly or annually)
• Data on achievement against TRL, and any change on TRL stage achieved
• Data on direct aerospace (R&T) jobs created / safeguarded • Data on number of individuals upskilled / trained
Project close • Final data for all indicators addressed by regular monitoring (see row above)
• Data on achieved private spend collected (if deemed possible / appropriate)
• Data on leveraged EU / international funding collected • Delivery against intention for demonstrator confirmed • Delivery against plans to create infrastructure for demonstrator
confirmed
Post-project contact • None (but see commentary below) Source: SQW
As can be seen from the above, the proposed additions are relatively light touch. The majority would be relevant at the application / approval / contracting stage only, and be designed to ensure the systematic collection of data against the Portfolio indicators, so as to provide important information about the types of projects being funded and the composition of the portfolio that the ATI is responsible for, e.g. in terms of the number and size of projects, the partners that are involved, the themes and expected timeframes to impacts. These indicators do not relate to the ATI programme’s performance as such, but provide input for the ongoing management of the portfolio, as well as information to inform and facilitate eventual evaluation activities (such as the sample selection for case studies).
154

By contrast, our scoping suggests the potential for monitoring to provide data on outcomes is limited. This is because the desired outcomes of ATI projects are mostly of a kind that does not lend itself to monitoring, but will require either tracking of data from secondary sources, and/or evaluative research. The exceptions relate to progress through TRLs, direct jobs created / safeguarded, and individuals upskilled; these indicators are sufficiently ‘objective’ to be worth monitoring (although the potential bias from monitoring officers having to rely on self-reported data from beneficiaries should be noted).
In this context, an interesting development is Innovate UK’s plans to potentially introduce a project close-out survey, which would require beneficiaries to report on outcomes and impacts against a set of standardised questions. If this were to become common practice, it would provide opportunities to collect data on a number of relevant outcomes. Some of the “easier” ones are listed above. But there could also be scope for using such a survey to collect data for which we had so far not considered monitoring as a possible source. At the same time, it is important, again, to note the limitations of self-reported data of this kind, especially if the categories are defined in a general way so as to be applicable to the widest possible range of projects and sectors. It would need to be explored further to what extent this could indeed be an appropriate complement / substitute for tailored evaluative approaches.
Should a project close-out survey become the norm, it would also be worth considering whether a second survey at some point during the five-year post-project contact period should be conducted. This would provide an opportunity to verify the earlier responses and collect data on outcomes that typically take longer to emerge (including, for example, progression through TRLs 7-9). However, we understand that at present Innovate UK does not systematically engage projects after their completion; introducing such an approach specifically for the ATI programme may have significant implications in terms of work flows and resources. We therefore suggest that the discussions should firstly focus on the feasibility and potential added value of a project close-out survey (see above); should this be progressed, the next step could be a post-completion survey.
155

© Crown copyright 2016 This publication is licensed under the terms of the Open Government Licence v3.0 except where otherwise stated. To view this licence, visit nationalarchives.gov.uk/doc/open-government-licence/version/3 or write to the Information Policy Team, The National Archives, Kew, London TW9 4DU, or email: [email protected]. Where we have identified any third party copyright information you will need to obtain permission from the copyright holders concerned. This publication available from www.gov.uk/bis Contacts us if you have any enquiries about this publication, including requests for alternative formats, at: Department for Business, Innovation and Skills 1 Victoria Street London SW1H 0ET Tel: 020 7215 5000
Email: [email protected]
BIS/16/123