aes latin america review aes corporation...
TRANSCRIPT
AES CORPORATIONAES Latin America Review
Andres GluskiPresident, Latin America
June 28, 2006

1www.aes.com
Safe Harbor Disclosure
Certain statements in the following presentation regarding AES’s business operations may constitute “forward looking statements.” Such forward-looking statements include, but are not limited to, those related to future earnings, growth and financial and operating performance. Forward-looking statements are not intended to be a guarantee of future results, but instead constitute AES’s current expectations based on reasonable assumptions. Forecasted financial information is based on certain material assumptions. These assumptions include, but are not limited to continued normal or better levels of operating performance and electricity demand at our distribution companies and operational performance at our contract generation businesses consistent with historical levels, as well as achievements of planned productivity improvements and incremental growth from investments at investment levels and rates of return consistent with prior experience. For additional assumptions see the Appendix to this presentation. Actual results could differ materially from those projected in our forward-looking statements due to risks, uncertainties and other factors. Important factors that could affect actual results are discussed in AES’s filings with the Securities and Exchange Commission including but not limited to the risks discussed under Item 1A “Risk Factors” in the Company’s 2005 Annual Report on Form 10-K as well as our other SEC filings. AES undertakes no obligation to update or revise any forward-looking statements, whether as a result of new information, future events or otherwise.
2www.aes.com
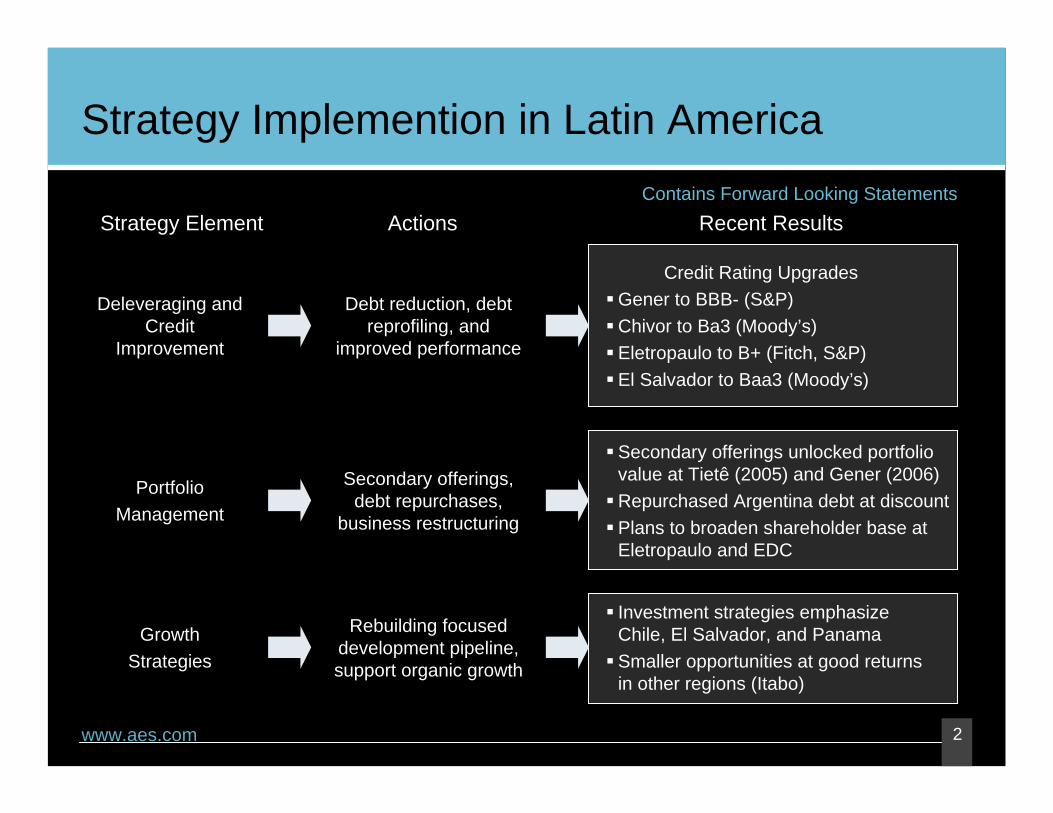
Strategy Implemention in Latin AmericaContains Forward Looking Statements
Strategy Element Actions Recent Results
Debt reduction, debt reprofiling, and
improved performance
Credit Rating UpgradesGener to BBB- (S&P)Chivor to Ba3 (Moody’s)Eletropaulo to B+ (Fitch, S&P)El Salvador to Baa3 (Moody’s)
Deleveraging and Credit
Improvement
Secondary offerings, debt repurchases,
business restructuring
Secondary offerings unlocked portfolio value at Tietê (2005) and Gener (2006)Repurchased Argentina debt at discountPlans to broaden shareholder base at Eletropaulo and EDC
PortfolioManagement
Rebuilding focused development pipeline, support organic growth
Investment strategies emphasize Chile, El Salvador, and PanamaSmaller opportunities at good returns in other regions (Itabo)
GrowthStrategies
3www.aes.com
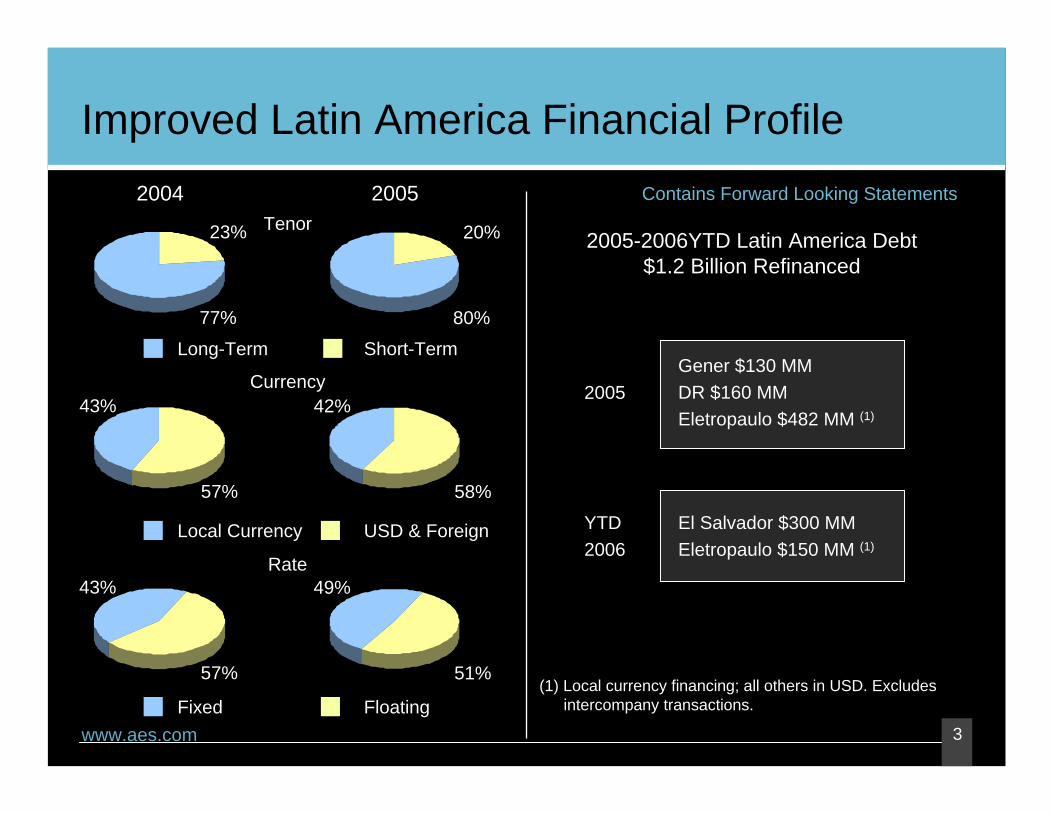
Improved Latin America Financial Profile
Tenor
Currency
Rate
Long-Term Short-Term
2004 2005
Gener $130 MMDR $160 MMEletropaulo $482 MM (1)
El Salvador $300 MMEletropaulo $150 MM (1)
2005
YTD2006
2005-2006YTD Latin America Debt $1.2 Billion Refinanced
Contains Forward Looking Statements
Local Currency USD & Foreign
Fixed Floating(1) Local currency financing; all others in USD. Excludes
intercompany transactions.
77%
23%
80%
20%
57%
43%
51%
49%
57%
43%
58%
42%
4www.aes.com
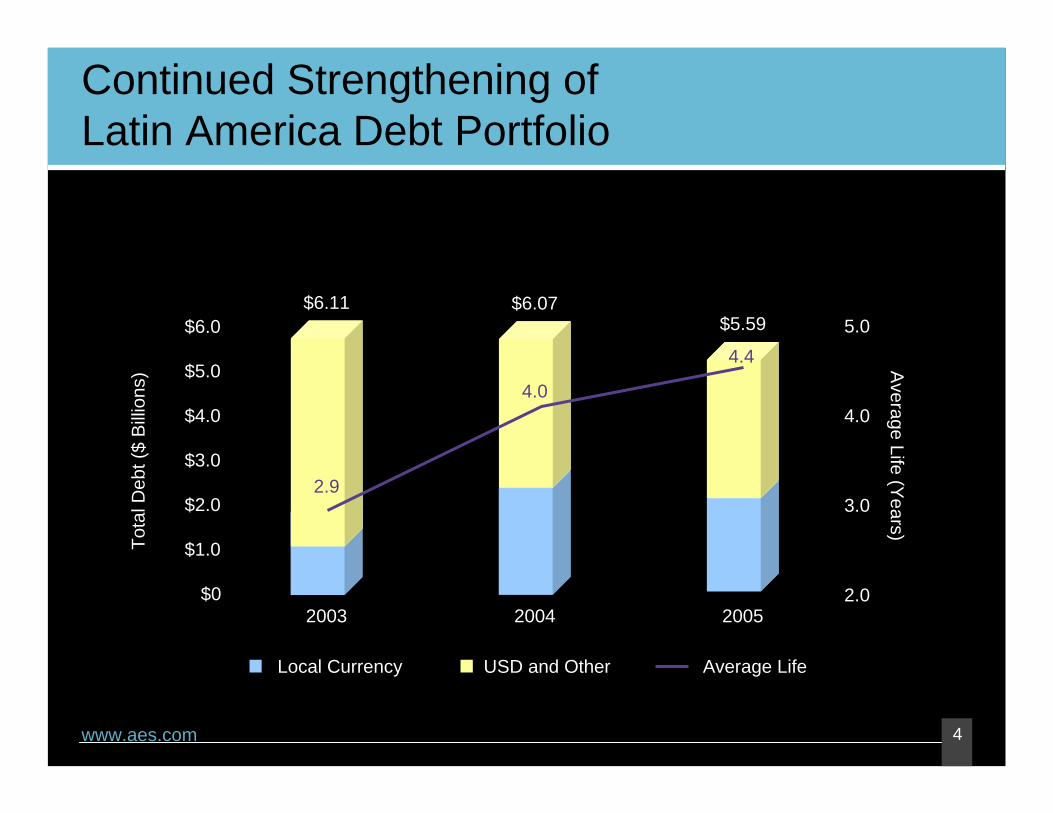
Continued Strengthening ofLatin America Debt Portfolio
Tota
l Deb
t ($
Billi
ons)
$0
$1.0
$2.0
$3.0
$4.0
$5.0
$6.0
2003 2004 2005
Local Currency USD and Other
$6.11 $6.07$5.59
2.0
3.0
5.0
Average Life (Y
ears)
Average Life
4.0
2.9
4.0
4.4
AES CORPORATIONAES El Salvador and AES Dominicana Review
Andres GluskiPresident, Latin America
June 28, 2006
Manuel Perez DubucPresident, AES Dominicana
6www.aes.com
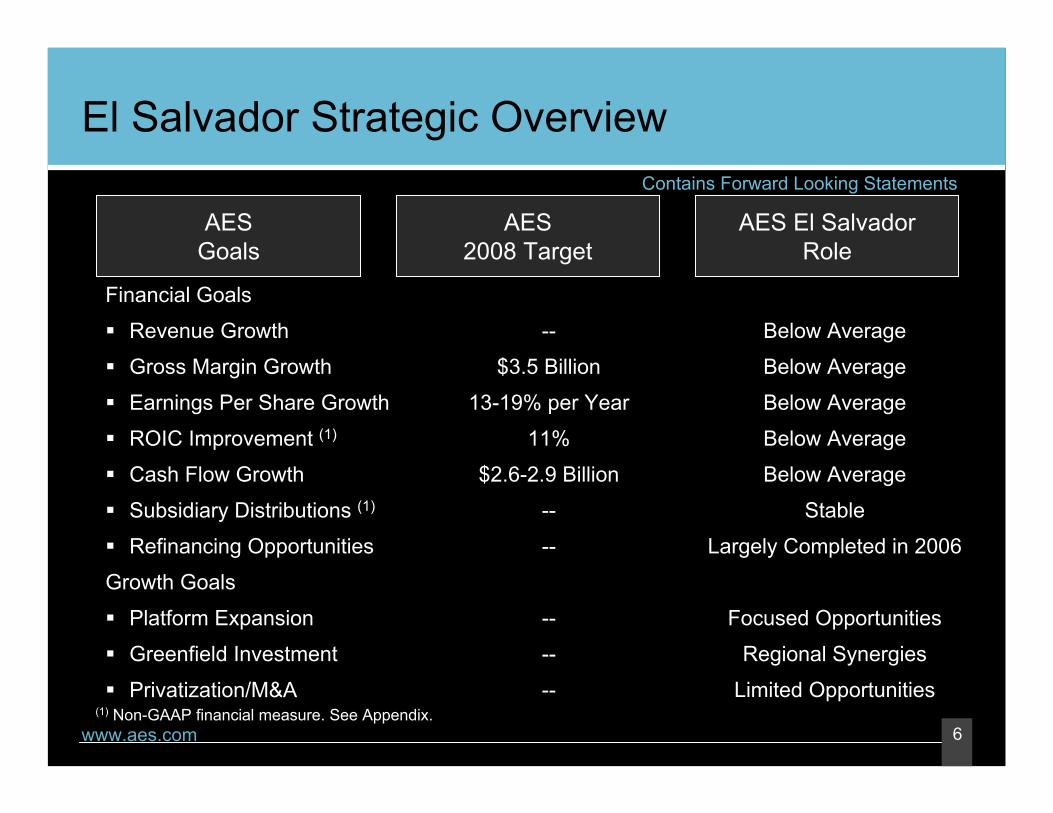
Financial Goals
Revenue Growth
Gross Margin Growth
Earnings Per Share Growth
ROIC Improvement (1)
Cash Flow Growth
Subsidiary Distributions (1)
Refinancing Opportunities
Growth Goals
Platform Expansion
Greenfield Investment
Privatization/M&A
AESGoals
AES2008 Target
AES El SalvadorRole
El Salvador Strategic Overview
--
$3.5 Billion
13-19% per Year
11%
$2.6-2.9 Billion
--
--
--
--
--
Below Average
Below Average
Below Average
Below Average
Below Average
Stable
Largely Completed in 2006
Focused Opportunities
Regional Synergies
Limited Opportunities(1) Non-GAAP financial measure. See Appendix.
Contains Forward Looking Statements

7www.aes.com
El Salvador Highlights
6,756,800Population (2005 est.)San SalvadorLargest CitySan Salvador Capital
Family remittances, manufacturing, agriculture Economic Drivers
4.3%Inflation Rate (2005 est.)US $1,220Per Capita GDP (2005)U.S. DollarCurrency
El Salvador at a Glance

8www.aes.com
EL Salvador Electricity Demand GrowthContains Forward Looking Statements
Sources: Unidad de Transacciones (Market Administrator), BCR (National Central Bank).
Demand GDP Growth
0
1,000
2,000
3,000
4,000
5,000
6,000
1993 1995 1997 1999 2001 2003 2005 2007E
Dem
and
(GW
h)
0%1%2%3%4%5%6%7%8%
GD
P G
row
th (%
)
9www.aes.com
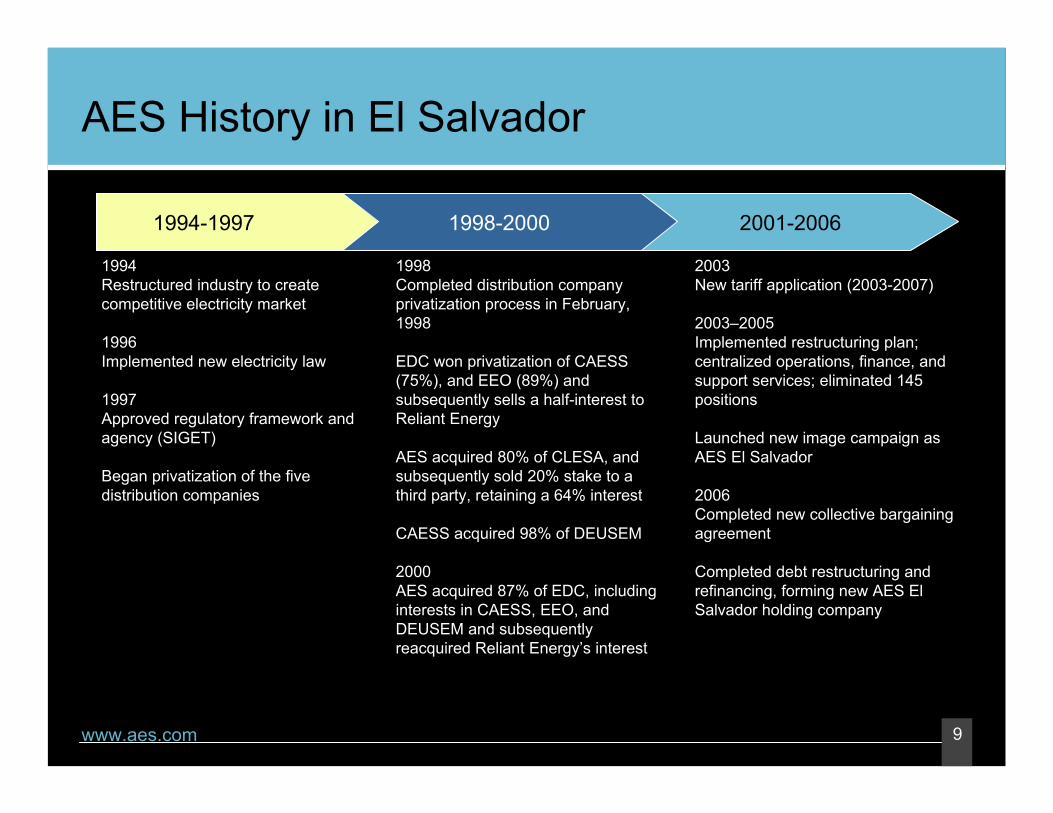
AES History in El Salvador
1994Restructured industry to createcompetitive electricity market
1996Implemented new electricity law
1997Approved regulatory framework and agency (SIGET)
Began privatization of the fivedistribution companies
1998Completed distribution company privatization process in February, 1998
EDC won privatization of CAESS (75%), and EEO (89%) and subsequently sells a half-interest to Reliant Energy
AES acquired 80% of CLESA, and subsequently sold 20% stake to a third party, retaining a 64% interest
CAESS acquired 98% of DEUSEM
2000AES acquired 87% of EDC, including interests in CAESS, EEO, and DEUSEM and subsequentlyreacquired Reliant Energy’s interest
2003New tariff application (2003-2007)
2003–2005Implemented restructuring plan; centralized operations, finance, and support services; eliminated 145 positions
Launched new image campaign as AES El Salvador
2006Completed new collective bargaining agreement
Completed debt restructuring and refinancing, forming new AES El Salvador holding company
1994-1997 1998-2000 2001-2006
10www.aes.com
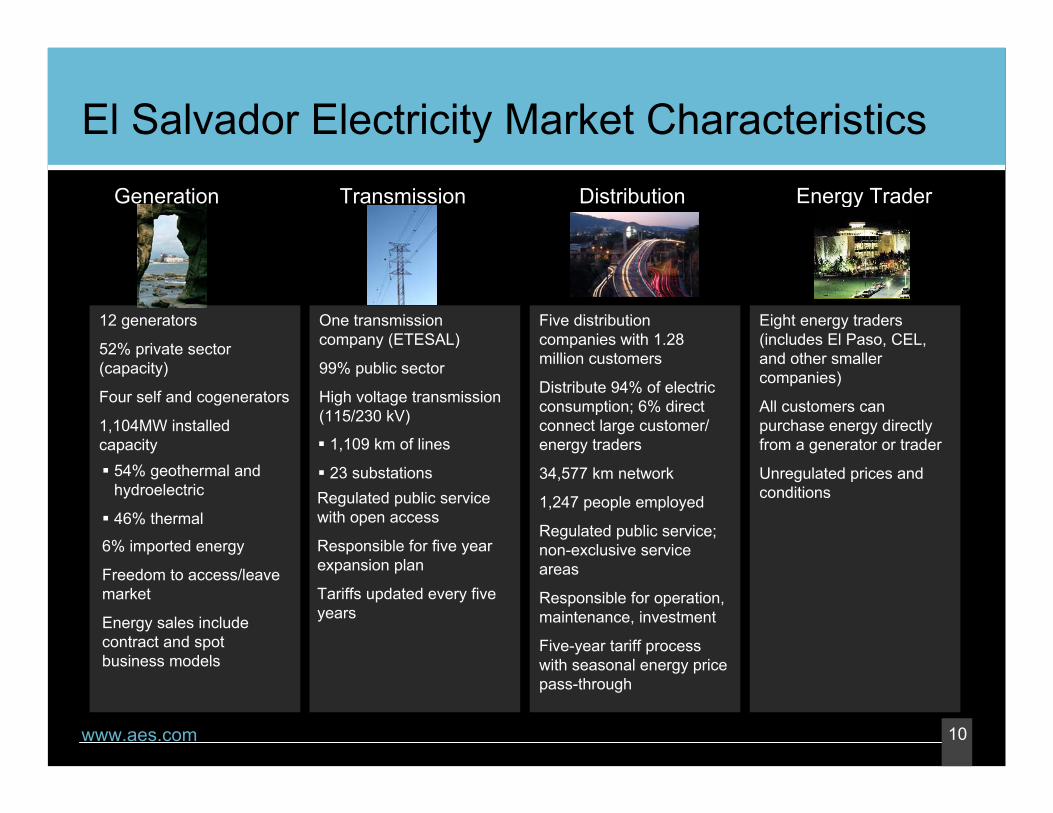
12 generators
52% private sector (capacity)
Four self and cogenerators
1,104MW installedcapacity
Generation
One transmissioncompany (ETESAL)
99% public sector
High voltage transmission(115/230 kV)
Transmission
Five distribution companies with 1.28 million customers
Distribute 94% of electricconsumption; 6% directconnect large customer/ energy traders
34,577 km network
1,247 people employed
Regulated public service; non-exclusive service areas
Responsible for operation, maintenance, investment
Five-year tariff processwith seasonal energy pricepass-through
Distribution
Eight energy traders(includes El Paso, CEL, and other smallercompanies)
All customers can purchase energy directlyfrom a generator or trader
Unregulated prices and conditions
Energy Trader
El Salvador Electricity Market Characteristics
54% geothermal and hydroelectric
46% thermal
6% imported energy
Freedom to access/leavemarket
Energy sales includecontract and spot business models
1,109 km of lines
23 substationsRegulated public service with open access
Responsible for five yearexpansion plan
Tariffs updated every fiveyears

11www.aes.com
Strong Utility Position in El Salvador
CLESA4,633 km2 service territory272,000 customers64% AES-owned
CAESS4,284 km2 service territory487,000 customers75% AES-owned
EEO6,212 km2 service territory200,000 customers89% AES-owned
DEUSEM1,129 km2 service territory53,000 customers74% AES-owned
AES El SalvadorRegulated distribution systems16,200 km2 total service territory1.01 million customers947 employees80% market share
Note: Data as of December 31, 2005
CLESACAESS
DEUSEM
EEO
San Salvador
12www.aes.com
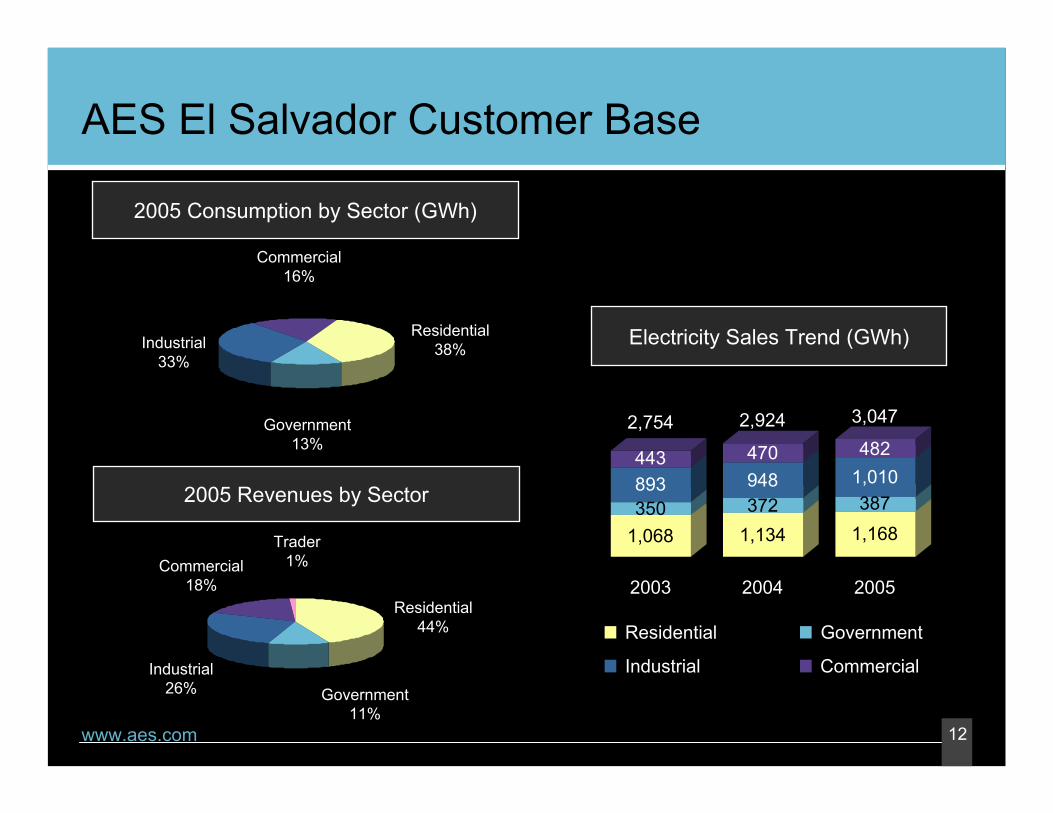
AES El Salvador Customer Base
Residential44%
Trader1%
Industrial26% Government
11%
2005 Consumption by Sector (GWh)
2005 Revenues by Sector
Residential38%
Government13%
Commercial16%
Commercial18%
Industrial33%
Electricity Sales Trend (GWh)
2,754 2,924 3,047
1,068350893443
1,134372948470
1,168387
1,010482
2003 2004 2005
Residential Government
Industrial Commercial

13www.aes.com
El Salvador Electricity Market Operation Model
System Regulator Market
(MRS))
ContractMarket
Wholesale
Electric
Market
DISTRIBUTIONInitial geographic zones (no concession)
Unrestricted network accessDistribution charges regulated
TRANSMISSIONMonopoly service -unrestricted access
Charges regulated by SIGET
GENERATIONCompetitive
Negotiated prices (contracts)Competitive short-term market
END USERSRegulated and non-regulated
Some with subsidies
SIGETSIGET((regulatorregulator))
14www.aes.com
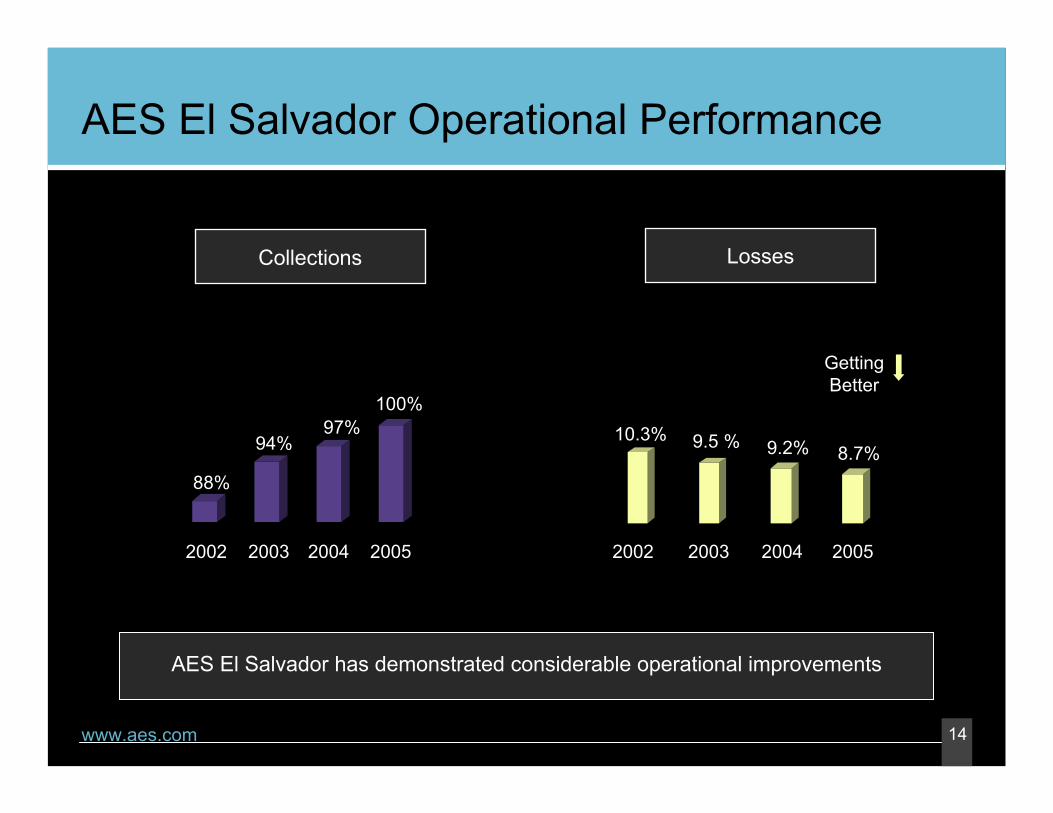
AES El Salvador Operational Performance
AES El Salvador has demonstrated considerable operational improvements
2004 2004200320032002 20022005 2005
Collections Losses
88%
94%97%
100%10.3% 9.5 % 9.2% 8.7%
GettingBetter
15www.aes.com
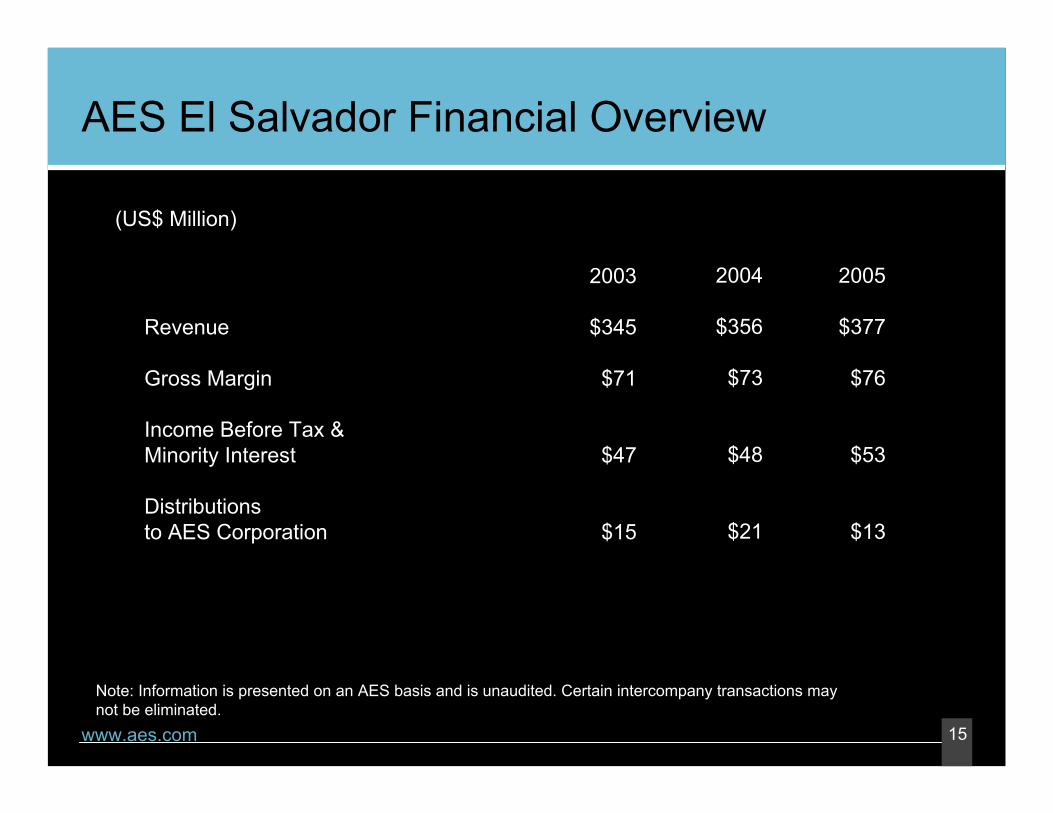
AES El Salvador Financial Overview
Revenue
Gross Margin
Income Before Tax &Minority Interest
Distributions to AES Corporation
2003
$345
$71
$47
$15
2004
$356
$73
$48
$21
(US$ Million)
2005
$377
$76
$53
$13
Note: Information is presented on an AES basis and is unaudited. Certain intercompany transactions may not be eliminated.
16www.aes.com
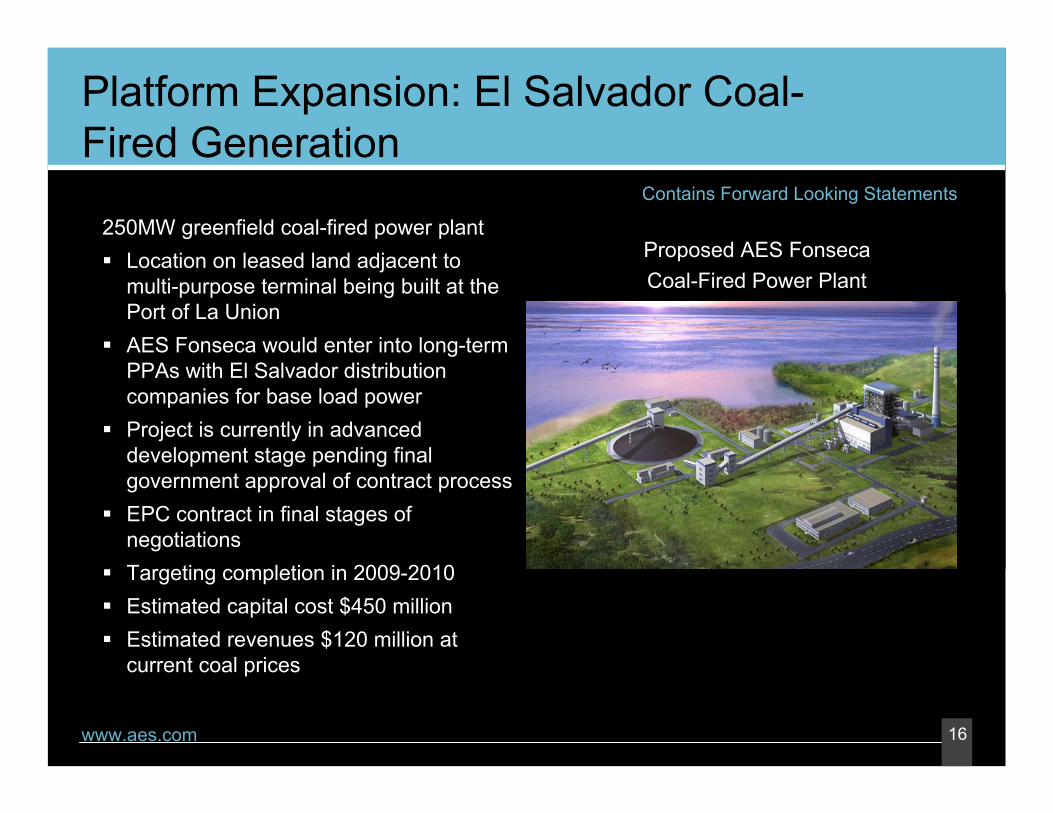
Platform Expansion: El Salvador Coal-Fired Generation
250MW greenfield coal-fired power plantLocation on leased land adjacent to multi-purpose terminal being built at the Port of La UnionAES Fonseca would enter into long-term PPAs with El Salvador distribution companies for base load powerProject is currently in advanced development stage pending final government approval of contract process EPC contract in final stages of negotiationsTargeting completion in 2009-2010Estimated capital cost $450 millionEstimated revenues $120 million at current coal prices
Contains Forward Looking Statements
Proposed AES FonsecaCoal-Fired Power Plant

17www.aes.com
Regional Opportunity: SIEPAC(1)
Framework
Created in 1999 to establish a regional competitive market withfree interconnectionaccess
Provides regional transaction clearing mechanism
Promotes the economicdevelopment of the regionin a free market withoutbarriers
CRIE is the regulatory agency for the regional transmission network
Vertical integrationpermited
Generation
Comercialization of energyat a regional level
Regional privateinvestment participationand expansion of energysector
Allows for AES coal and hydro plants to export to other regional markets
Transmission
The Central Americangovernments via ERP will own the network
Concession for the construction and administration of the network to be done by ERP
Begins operation in 2008
Represents US$330MMinvestment (1,830 km)
Primary line 230 KV
Rights to privateinvestment in the transmission network
Market Administrator
EOR will be the administrator of the regional network
Prices will be establishedon an hourly basis
Will provide the marketwith short, medium, and long term contracts
Integrated regional transmission costs (more equitable)
(1) Sistema de Interconexión Eléctrica de los Paises de Centroamérica

18www.aes.com
Financial Goals
Revenue Growth
Gross Margin Growth
Earnings Per Share Growth
ROIC Improvement (1)
Cash Flow Growth
Subsidiary Distributions (1)
Refinancing Opportunities
Growth Goals
Platform Expansion
Greenfield Investment
Privatization/M&A
AESGoals
AES2008 Target
AES DominicanaRole
AES Dominicana Strategic Overview
--
$3.5 Billion
13-19% per Year
11%
$2.6-2.9 Billion
--
--
--
--
--
Above Average
Above Average
Above Average
Below Average
Above Average
Not Significant Near-Term
Largely Completed in 2005
Focused Opportunities
Not Significant
Not Significant(1) Non-GAAP financial measure. See Appendix.
Contains Forward Looking Statements

19www.aes.com
Dominican Republic Highlights
9,300,000 Population (2005 est.)Santo DomingoLargest CitySanto Domingo Capital
Tourism, free trade zones, family remittances Economic Drivers
7.4%Inflation Rate (2005 est.)US $3,250Per Capita GDP (2005 est.)
1 (RD$) = 32.76 (US $) Exchange Rate (06/26/2006)Dominican Pesos (RD$)Currency
Dominican Republic at a Glance
20www.aes.com
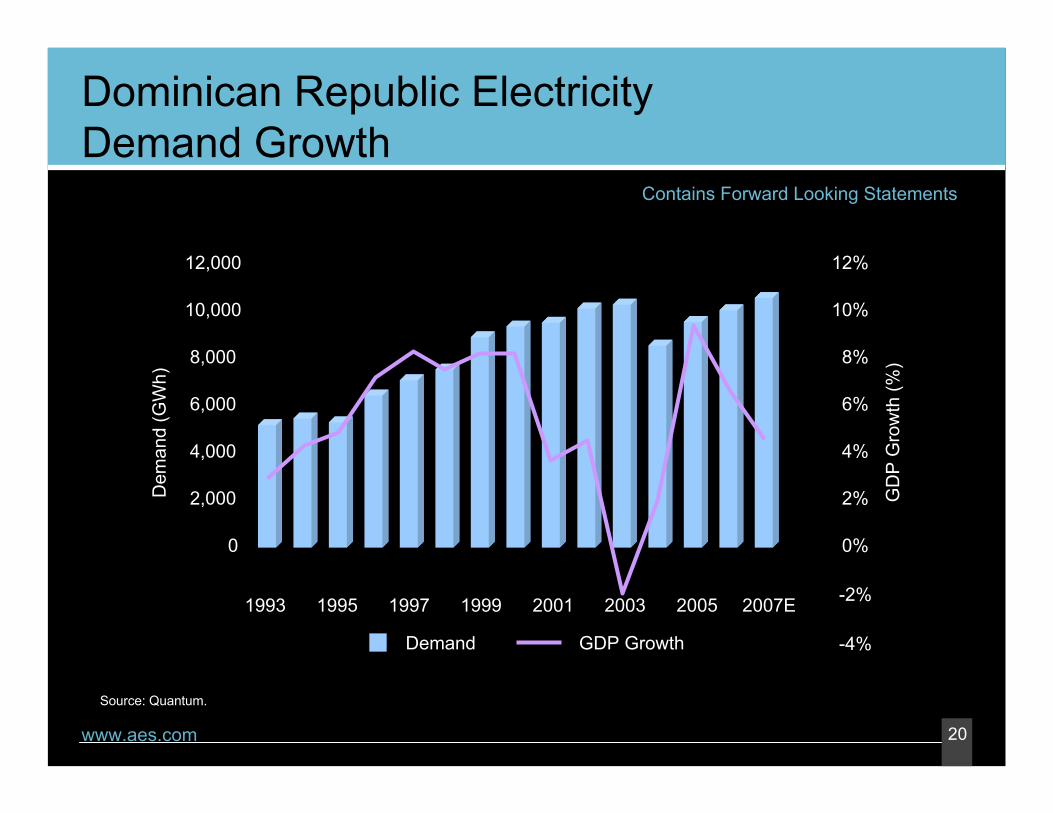
Dominican Republic Electricity Demand Growth
Contains Forward Looking Statements
Source: Quantum.
Demand GDP Growth
0
2,000
4,000
6,000
8,000
10,000
12,000
1993 1995 1997 1999 2001 2005 2007E
Dem
and
(GW
h)
0%
2%
-2%
-4%
4%
6%
8%
10%
12%
GD
P G
row
th (%
)
2003
21www.aes.com
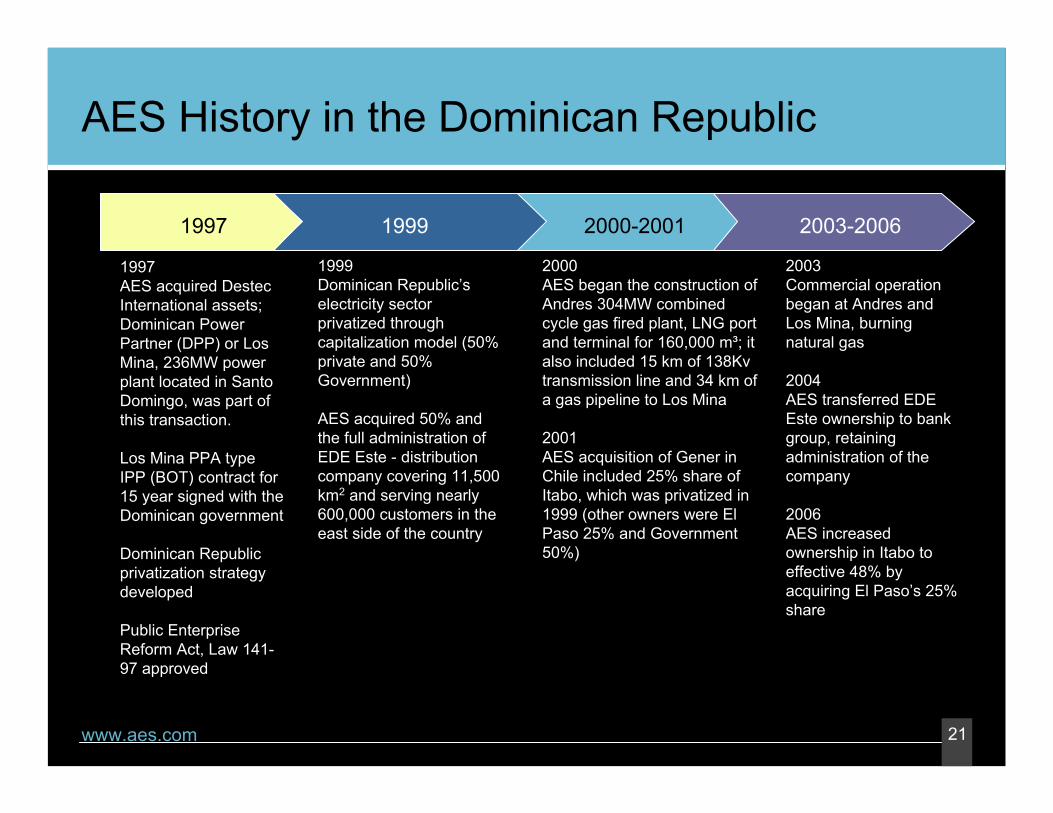
AES History in the Dominican Republic
1999Dominican Republic’s electricity sector privatized through capitalization model (50% private and 50% Government)
AES acquired 50% and the full administration of EDE Este - distribution company covering 11,500 km2 and serving nearly 600,000 customers in the east side of the country
2003Commercial operation began at Andres and Los Mina, burning natural gas
2004AES transferred EDE Este ownership to bank group, retaining administration of the company
2006AES increased ownership in Itabo to effective 48% by acquiring El Paso’s 25% share
2000AES began the construction of Andres 304MW combined cycle gas fired plant, LNG port and terminal for 160,000 m³; it also included 15 km of 138Kv transmission line and 34 km of a gas pipeline to Los Mina
2001AES acquisition of Gener in Chile included 25% share of Itabo, which was privatized in 1999 (other owners were El Paso 25% and Government 50%)
1997 1999 2000-2001 2003-2006
1997AES acquired DestecInternational assets;Dominican Power Partner (DPP) or Los Mina, 236MW power plant located in Santo Domingo, was part of this transaction.
Los Mina PPA type IPP (BOT) contract for 15 year signed with the Dominican government
Dominican Republic privatization strategy developed
Public Enterprise Reform Act, Law 141-97 approved
22www.aes.com
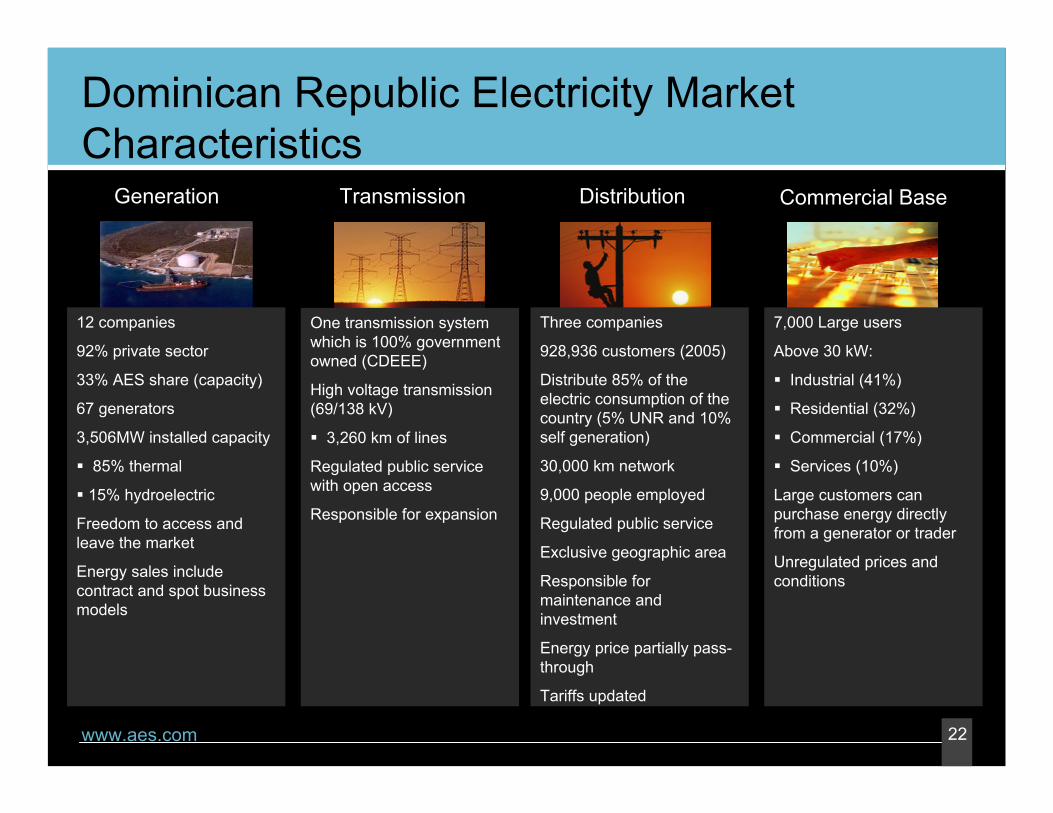
12 companies
92% private sector
33% AES share (capacity)
67 generators
3,506MW installed capacity
85% thermal
15% hydroelectric
Freedom to access and leave the market
Energy sales includecontract and spot businessmodels
Generation
One transmission system which is 100% governmentowned (CDEEE)
High voltage transmission(69/138 kV)
3,260 km of lines
Regulated public service with open access
Responsible for expansion
Transmission Distribution
7,000 Large users
Above 30 kW:
Industrial (41%)
Residential (32%)
Commercial (17%)
Services (10%)
Large customers can purchase energy directlyfrom a generator or trader
Unregulated prices and conditions
Commercial Base
Dominican Republic Electricity Market Characteristics
Three companies
928,936 customers (2005)
Distribute 85% of the electric consumption of the country (5% UNR and 10% self generation)
30,000 km network
9,000 people employed
Regulated public service
Exclusive geographic area
Responsible for maintenance and investment
Energy price partially pass-through
Tariffs updated

23www.aes.com
Dominican Republic Generation Market Profile
www.aes.com
Effective Capacity (2,995MW)
Monte Rio Power3%
Metaldom1%
EGE-Haina20%
Itabo14%
EGE-Hidro15%
Compaňia de Electricidad de
Puerto Plata (CEPP) 2%
IPP’s16%
AES Andres & Los Mina19%
G PLV6%
Seaboard4%
AES Total 33%

24www.aes.com
AES Has Important Low-Cost Position in Dominican Republic Generation System
0
100
200
300
0 150 350 550 750 950 1,150 1,350 1,550 1,750 1,950 2,150 2,350 2,550
Dominican Republic Electricity Market Stack
US
$ / M
Wh
ItaboAndres Oil-Fired Los Mina
Source: AES Dominicana estimates. Oil-fired capacity owned by Monte Rio Power, Seaboard, Palamara-La Gega, Metaldom, CEPP. Diesel-fired capacity owned by Smith Enron, CESPM, EGE Haina and Itabo.
Diesel-Fired
MinimumLoad
MaximumLoad
Hydro
MW

25www.aes.com
Dominican Republic Generation Position
www.aes.com
Coal/OilNatural Gas
AES DPP (Los Mina)236MW gas-fired100% AES
Itabo432MW coal/oil48% AES (25% direct, 23% through Gener)
Andres319MW gas-fired100% AES
Santo Domingo
LNG Terminal

26www.aes.com
Dominican Republic Power Market
Economic Dispatch Center
Distribution Companies
Substation1
Unregulated
SpotTransactions
Transmission andDistribution Customers
DistributionTransmission
Substation2
Substation3
Gencogas Gencodiesel
Gencohydro
Toll Payment
Open access transmission
Concessions granted for distribution and tariffs based on model company structure
Gencocoal
Regulated
Dispatch based on lowest variable cost of production (marginal cost)
Spot price = marginal cost of the system
Includes energy and capacity payments
Contracts node price + value added cost
Contracts awarded in open bid processes
Minimum demand requirement > 0.2 MW
Unregulated freely negotiated price
27www.aes.com
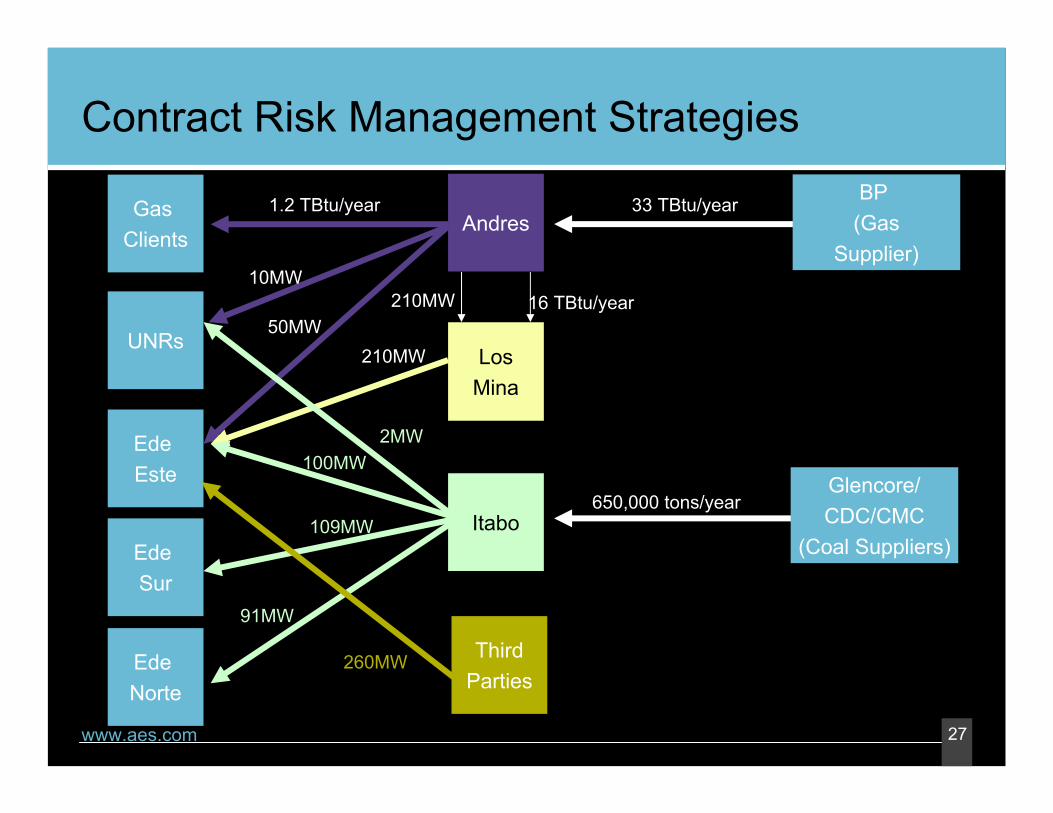
Contract Risk Management StrategiesBP
(GasSupplier)
Glencore/CDC/CMC
(Coal Suppliers)
Gas Clients
UNRs
Ede Este
Ede Sur
Ede Norte
Andres
LosMina
Itabo
16 TBtu/year210MW
33 TBtu/year
50MW
10MW
1.2 TBtu/year
210 MW
ThirdParties
260MW
2MW100MW
109MW
91MW
650,000 tons/year
210MW

28www.aes.com
AES Fuel Sourcing Strategy
Note: Fuel Flexibility represents company-wide maximums or minimums.
Sourced From
Transportation Method
Distance
Key Suppliers
Fuel Flexibility
Colombia
Ocean going ships
586 nautical miles
Glencore/CDC/CMC
<1.0% Sulfur (dry)11,600 BTU/lb heating
value
Coal
Trinidad & Tobago
LNG
679 nautical miles
BP
Methane > 84 % molecular
Natural Gas

29www.aes.com
AES Dominicana Generation KPI Focus
2.1%
9.0%
1.0%
0%2%4%6%8%
10%
2003 2004 2005
99%96%
89%
80%
85%
90%
95%
100%
2003 2004 2005
Equivalent Forced Outage Rate
Equivalent Availability Factor
Getting Better

30www.aes.com
AES Dominicana Financial Overview
Revenue
Gross Margin
Income Before Tax &Minority Interest
Distributions to AES Corporation
2003
$141
$23
$15
$0
2004
$168
$29
($38)
$0
(US$ Million)
2005
$231
$53
$10
$0
Note: Information is presented on an AES basis and is unaudited. Certain intercompany transactions may not be eliminated. Results exclude equity in earnings from Itabo, another generation company in the Dominican Republic, in which Gener has a 25% equity interest. In 2006, AES purchased an additional 25% interest in Itabo.

31www.aes.com
AES Dominicana Expansion Opportunities
Natural GasMarket
Development
Retail distribution of compressed natural gas Conversion of existing diesel units (Cogentrix)Convert AES Andres into an energy hub for the region
Generation Diversify customer base (large users and self generators)
Power Transmission
Connect existing self generators to the national gridInterconnect Haiti to the national gridImprove quality and service
Non-Power But Related
Port and storage servicesWater sales
Areas Description of Selected ProjectsContains Forward Looking Statements

32www.aes.com
Platform Expansion: AES Dominicana LNGContains Forward Looking Statements
34km Current Gas Pipeline40km Gas Pipeline 1st phase250km Gas Pipeline 2nd phase
Compressed gas marketRetail compressed gas market – sales potential of 2.5 TBtu/year
Third party gas conversionSan Pedro de Macorisconversion opportunity –sales potential of up to 15 TBtu/year for 300MW diesel-fired power plantBenefit from cleaner combustion, less expensive fuel and lower maintenance costsRequires investment in gas pipeline and the conversion of the units into natural gas
LNG terminalService location
Santo Domingo
Puerto Plata
Santiago
La Vega
Haina
Bonao
AESAndres
San Pedro