affirmative action bans and college graduation rates action bans and college graduation rates * ......
TRANSCRIPT
Affirmative Action Bans and College Graduation Rates*
Peter Hinrichs†
First Draft: August 11, 2009 This Draft: July 14, 2011
Abstract: I estimate the effects of statewide affirmative action bans on college graduation rates. Previous research has found that affirmative action bans displace underrepresented minorities from selective institutions but do not affect overall college attendance rates. This reshuffling of students to schools may raise graduation rates for underrepresented minorities if it alleviates “minority mismatch.” On the other hand, it may lower graduation rates if it leads to disillusionment or deterioration in quality of peers or support services. I find that graduation rates for Hispanics and possibly blacks at selective institutions do rise when affirmative action is banned, but this may be due to the changing composition of students at these universities. Moreover, the effects are small compared to the number displaced from selective universities due to affirmative action bans. Thus, on net, affirmative action bans lead to fewer underrepresented minorities becoming graduates of selective colleges. Keywords: affirmative action, college admissions, minority mismatch JEL classification: I28, J15
* I thank Elizabeth Ananat, Joshua Angrist, Kate Antonovics, Peter Arcidiacono, David Autor, Duncan Chaplin, Kalena Cortes, Nora Gordon, John Ham, Judith Hellerstein, Harry Holzer, Adriana Kugler, George LaNoue, Arik Levinson, Mark Long, Dave Marcotte, Peter Schnabl; seminar participants at The Brookings Institution and UMBC; lunch seminar participants at Georgetown; and conference participants at the 2011 Association for Education Finance and Policy and Western Economic Association International conferences for useful conversations and suggestions. † Georgetown Public Policy Institute, Georgetown University, 100 Old North Building, 37th and O Streets NW, Washington DC 20057. E-mail: [email protected]
I. Introduction
College graduation rates for blacks, Hispanics, and Native Americans lag behind
those of whites and Asians. In the year 2000, 26.1% of whites and 43.9% of Asians in
the United States above 25 years of age were college graduates, but only 16.5% of blacks
and 10.6% of Hispanics were.1 Even among those who entered a four-year degree
program in the United States between 1996 and 2003, the six-year graduation rates were
59.9% for whites and 66.3% for Asians but only 40.6% for blacks and 48.2% for
Hispanics.2 There are many possible reasons for these disparities, including differences
in family background, differences in ability, discrimination, or credit constraints. There
are also many policies that potentially have the ability to reduce these disparities,
including providing more need-based financial aid, improving preschools or the K-12
education system, and affirmative action in college admissions.
This paper focuses on affirmative action. An empirical study of the effects of
affirmative action on college graduation rates is important for at least four reasons. First,
affirmative action in college admissions directly relates to several topics of interest to
economists. It has important consequences for human capital acquisition, and affirmative
action is also a potential remedy for labor market discrimination. Second, as shown in
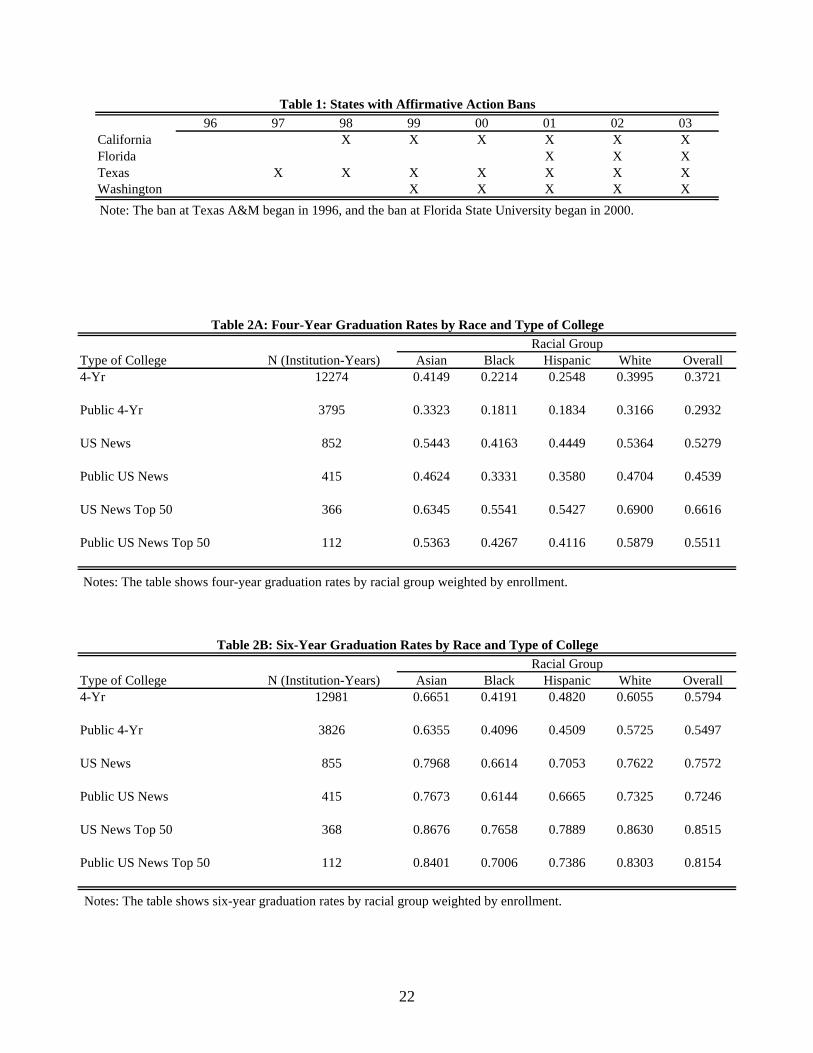
Table 1, several states have recently prohibited the use of race in determining admission
to public universities statewide.3 Other states may consider doing so in the near future.
1 Source: Table 224 of the 2010 Statistical Abstract of the United States. 2 Source: author’s calculation using IPEDS data discussed in Section III. 3 The California and Washington bans are the result of ballot initiatives, the Florida ban is the result of an executive order from the governor, and the Texas ban was the result of a circuit court ruling in the case of Hopwood v. Texas. The statewide ban in Texas has since been discontinued. Bans in Arizona, Michigan, and Nebraska went into effect after the time period studied in this paper. The typical ballot initiative reads, “The state shall not discriminate against, or grant preferential treatment to, any individual or group on the basis of race, sex, color, ethnicity, or national origin in the operation of public employment, public education, or public contracting.”
2
Thus, not only is there variation across states and over time that may be useful in
identifying the effects of affirmative action bans, but the issue is also very timely. Third,
states have an interest in supplying college graduates to serve in professions such as
teaching and medicine. Additionally, minorities in these professions may be more
inclined to serve in poor communities (Holzer and Neumark 2000, 2006). Thus, the
effect of affirmative action bans on college graduation is one factor that decision makers
should take into account when deciding on affirmative action policy. Moreover, the
effect of affirmative action bans on college graduation is of interest above and beyond
their effect on college enrollment. Fourth, the effect of affirmative action bans on college
graduation rates is theoretically ambiguous. Affirmative action may be a way to reduce
the graduation rate gap, but some have argued that affirmative action may actually be
partly to blame for low graduation rates among underrepresented minorities.
There are several reasons why banning affirmative action might actually raise
graduation rates for underrepresented minorities. First, an affirmative action ban may
alleviate “minority mismatch.” By giving underrepresented minorities a preference in the
college admissions process, affirmative action results in underrepresented minorities
being admitted to and attending universities at which their entering credentials are lower
than those of their white and Asian counterparts. Students who were admitted to a
university because of affirmative action may thus find the pace of their courses to be too
fast or the level of courses to be too high, which could result in less learning and a lower
performance than if they had attended a university where their entering credentials more
closely match those of their classmates. Taking courses that are too difficult may also
lead to disillusionment and disengagement with the learning process, which could further
3
worsen outcomes. If this theory is true, then eliminating affirmative action may reduce
these negative effects. Previous research has shown that affirmative action bans reduce
black, Hispanic, and Native American representation at selective colleges and increase
white representation (Hinrichs forthcoming). As long as more capable students within
each race generally attend more selective colleges, then the average entering credentials
of underrepresented minorities at selective universities should rise and the average
entering credentials of whites at selective universities should fall when affirmative action
is discontinued.4 Therefore, if there is mismatch under affirmative action, banning
affirmative action could alleviate it and result in improved performance for
underrepresented minorities.5 Second, behavioral responses from students or universities
could result in higher underrepresented minority graduation rates without affirmative
action than with affirmative action. Universities may adopt better support services for or
better recruiting of underrepresented minority students.6 Underrepresented minorities
may raise their level of pre-college skill investment due to the higher standards for
college admission, they may enroll in private universities rather than public universities,
or they may exert more effort while in college because they are freed from stigma or
because college graduation now sends a stronger signal.
On the other hand, there may be higher graduation rates for underrepresented
minorities with affirmative action than without it because affirmative action draws
4 A caveat is that, if recruited athletes are immune to the affirmative action ban, then this might counteract the otherwise rising credentials of underrepresented minorities after a ban on affirmative action at a university. 5 This argument assumes that colleges do not respond to affirmative action bans by increasing enrollment. If colleges increase enrollment by admitting students farther down in the pool of applicants, then the average entering credentials of underrepresented minorities may not rise when affirmative action is banned. In results not shown here, I find no relationship between affirmative action bans and the size of the freshman entering class. 6 For example, both UT Austin and Texas A&M adopted targeted scholarship programs in response to an affirmative action ban.
4
underrepresented minorities into universities that have better resources and support
services and where the culture creates the norm and expectation that students will
graduate. Further, underrepresented minorities may benefit from peers at selective
universities. Moreover, low performance prior to college may be due to lack of resources
and opportunities at K-12 schools or to family or community characteristics, and it may
be possible to overcome these factors in college. Affirmative action may also raise the
level of pre-college skill investment if it helps put admission to selective colleges within
reach. It is even conceivable that graduation rates even among underrepresented
minorities who remain at selective universities after affirmative action is banned fall
because those underrepresented minorities who remain at such universities may perceive
a hostile or unsupportive atmosphere, which may result in disengagement from the
educational process and less effort exerted.
This paper exploits cross-state and over-time variation in affirmative action bans
to study how graduation rates by race change when affirmative action is banned. Using
data from the Integrated Postsecondary Enrollment Data System (IPEDS), I find that
overall graduation rates do not change very much when affirmative action is banned. I do
find that graduation rates for underrepresented minorities at selective universities rise,
although I acknowledge that this may be due to the changing composition of students
who enroll at such universities. Moreover, the effects are small compared to the number
displaced from selective universities due to affirmative action bans. Additionally, I find
that the negative effect on enrollment outweighs the positive effect on graduation from
these universities, so that affirmative action bans lead to fewer underrepresented
minorities becoming graduates of selective institutions.
5
Section II discusses previous related research, Section III introduces the data used
and the models estimated in this paper, Section IV gives the empirical results, and
Section V concludes.
II. Previous Related Research
There are at least three lines of research that are closely related to the study of
affirmative action and college graduation rates.7 The first is the literature on the effects
of affirmative action bans. Most of this research has focused on the effects on SAT-
taking rates (Dickson 2006), SAT-sending (Card and Krueger 2005; Long 2004a), or
enrollment (Arcidiacono 2005; Bucks 2005; Hinrichs forthcoming; Howell 2010; Kain,
O’Brien, and Jargowsky 2005; Long 2004b). Most of the research finds negative effects
of affirmative action bans on these outcomes, although much less is known about the
effects on longer-term outcomes such as graduation rates or earnings. Arcidiacono
(2005) studies affirmative action in the context of a structural model and finds little effect
of affirmative action on earnings. Cortes (2010) and Furstenberg (2010) have recently
studied the college graduation rate effects of Texas’ Top 10% law, which grants
automatic admission to public universities for students in the top 10% of their high school
class, although the two papers come to different conclusions.8 The current paper furthers
this line of research by studying the graduation rate effects of actual affirmative action
bans across different states. 7 In addition to these three lines of research, also see Arcidiacono and Vigdor (2010) or Hinrichs (2011) on the effects of college diversity on earnings and Hickman (2010) on the effects of affirmative action on effort. 8 Furstenberg (2010) uses the introduction of the 10% law to generate an instrument for college quality. He finds a negative effect of college quality on grades and graduation rates. Cortes (2010) finds that the difference in graduation and retention rates for minorities in the top decile and those in the next two deciles of their high school class widens when Texas replaced affirmative action with the 10% law, a finding that should arguably be attributed to the widening of college quality between these two groups.
6
A second line of related research is the body of research that directly addresses
the mismatch hypothesis. Loury and Garman (1993, 1995) and Light and Strayer (2000)
find some support for the mismatch hypothesis when examining the relationship between
individual ability and the probability of graduating from institutions of various selectivity
levels. Sander (2004) finds that there is mismatch in law schools in the United States,
although others using the same data come to the opposite conclusion (Ayres and Brooks
2005; Barnes 2007; Chambers et al. 2005; Ho 2005a; Ho 2005b; Rothstein and Yoon
2008; Rothstein and Yoon 2009). Arcidiacono et al. (2009) use data on Duke
undergraduates and find that the university possesses private information that is useful for
predicting first-year grade point averages, which they argue is a necessary condition for
mismatch.9 The present paper informs the debate over mismatch by using panel data on
institutions and exploiting large, plausibly exogenous shifts in the type of institutions
attended by members of various racial groups.10
The third line of relevant research is the general body of research on college
quality. This body of research is important to the topic at hand because one of the
immediate effects of affirmative action bans is the reshuffling of underrepresented
minorities from more selective colleges to less selective ones (Hinrichs forthcoming).
There are numerous research papers that draw on observational data from surveys such as
the National Education Longitudinal Study and the National Longitudinal Survey of
Youth that document a positive relationship between college quality inputs, such as peer
9 Also see Dillon and Smith (2009), who study the determinants of mismatch between students and colleges. 10 A caveat is that, as mentioned in the introduction, a change in the graduation rate could come about through channels other than the alleviation of mismatch.
7
quality or spending per student, and desired outputs like wages or graduation rates.11
Behrman, Rosenzweig, and Taubman (1996) obtain similar findings when comparing
outcomes within sets of twins. Hoekstra (2009) uses a regression discontinuity design to
show that attending a flagship public institution is associated with higher earnings.
Indirect evidence suggesting that college quality matters comes from Bound and Turner
(2007), who show that college completion rates are lower in larger cohorts.12 A notable
exception to the findings of the rest of the literature is Dale and Krueger (2002), which
makes comparisons within sets of students who applied to and were admitted by similar
universities and generally finds no effect of college quality except for low income
students. Most of the papers in this literature do not stratify by race or interact college
quality variables with race, but those that do generally find that the effect of school
quality inputs for underrepresented minorities is either larger or not significantly different
from the effect for whites (Alon and Tienda 2005; Behrman et al. 1996; Bowen and Bok
1998; Daniel, Black, and Smith 2001; Kane 1998; Long 2010).
III. Data and Models
I use data from the National Center for Education Statistics’ Integrated
Postsecondary Education Data System (IPEDS) to estimate the effects of affirmative
action bans on graduation rates by race. IPEDS has extremely broad coverage. It
11 Examples of this line of research include Alon and Tienda (2005); Behrman et al. (1996); Black and Smith (2004, 2006); Black, Daniel, and Smith (2005); Bound, Lovenheim, and Turner (2010); Bowen and Bok (1998); Brewer, Eide, and Ehrenberg (1999); Daniel, Black, and Smith (2001); Hoxby (1998); Kane (1998); Long (2008, 2010); Monks (2000); and Zhang (forthcoming). On the other hand, Stange (forthcoming) finds no effect of college quality at community colleges, a setting where arguably selection bias is less of a concern because students generally attend community colleges near where they live. 12 Neither resources per student nor the number of spots in more selective colleges fully adjust to larger cohort sizes. Thus, the worse outcomes in larger cohorts could be due to a larger share of students attending less selective colleges.
8
includes data from all institutions of higher education that have a Program Participation
Agreement with the Department of Education to provide student financial aid under
federal programs such as the Federal Pell Grant Program, the Ford Direct Loan Program,
and the Federal Perkins Loan Program.13 I use four-year and six-year graduation rate
data from the IPEDS for each year between 2002 and 2009, which covers students who
entered universities between 1996 and 2003. I drop observations from five states
(Alabama, Georgia, Louisiana, Michigan, and Mississippi) that are in jurisdictions where
there was important affirmative action litigation but that did not have outright bans on
affirmative action.14 Table 2 reports summary statistics.15 The table shows that
graduation rates are higher for Asians and whites than for blacks and Hispanics, that
graduation rates are higher at private universities than public universities, that graduation
rates are higher at more-selective universities than less-selective ones, and that many of
the students who do not graduate within four years do graduate within six years.
I first use the full sample of four-year colleges to estimate models of the form
iststsstist tbany εηδμα ++++= (1)
separately by racial group. Here is an outcome such as the four-year or six-year
graduation rate for entering freshmen of a particular demographic group at university i in
state s at time t, is a dummy for whether a ban is in effect in state s in year t,
isty
stban sμ is a
full set of state dummies, tδ is a full set of year dummies, tsη is a full set of state-specific
13 It also may include data on other institutions that submit data voluntarily. 14 Including these states in the control group changes the results very little. 15 The six-year graduation rates in Table 2 differ from those listed in the opening paragraph because Table 2 excludes Alabama, Georgia, Louisiana, Michigan, and Mississippi.
9
linear time trends, istε is a disturbance, and α is the parameter of interest.16 The
regressions are weighted by enrollment of individuals of the particular demographic
group, and I report standard errors that are robust to clustering at the state level.17 It is
worth noting that this paper defines the treatment based on state of college attendance
rather than state of residence but that Hinrichs (forthcoming) finds no evidence of
migration across state lines for college in response to affirmative action bans.
I also report results for estimating equation (1) on subsamples of universities.
Since mismatch may be more of a problem at selective institutions, estimating effects on
the full sample may mask mismatch effects. Thus, I also report results from estimating
equation (1) for the subsample of 115 universities in the top two tiers in the 1995 U.S.
News & World Report college ranking and for the top 50 institutions in that ranking. And
as affirmative action bans generally apply only to public universities, I also show results
for the subsample of public universities. However, in estimating the effects on these
subsamples, there is the possibility that the results are affected by the changing
composition of students at the universities. Hinrichs (forthcoming) finds that affirmative
action bans affect the distribution of colleges attended and, in particular, they lower the
representation of underrepresented minorities at selective colleges. If it is the weaker
students who are displaced, then the graduation rate for underrepresented minorities at
selective colleges may rise due to the shifting student composition when affirmative
action is banned. This composition effect should tilt the results toward finding that
affirmative action bans result in higher graduation rates at selective universities.
16 Although all regressions reported in this paper include state-specific time trends, the results without them are broadly similar. 17 Estimating the coefficients of this model by weighted least squares is algebraically equivalent to estimating by weighted least squares a model of state-level graduation rates.
10
However, even in this case, the point estimates may still be of interest as effects on
institutions. This is true for at least two reasons. First, there may be an interest in
institutions raising their own graduation rate and giving slots to students who are likely to
graduate. If the graduation rate for an underrepresented minority group rises when
affirmative action is banned, it suggests that the marginally admitted student within the
group has a lower chance of graduating than the average student. This may mean that the
institution is doing a good job in admitting the students within that group who are more
likely to graduate. Second, there may be an interest in reducing within-institution
graduation rate gaps and knowing how policies such as affirmative action bans affect
those gaps. In any case, in light of the fact that Hinrichs (forthcoming) finds that
affirmative action bans do not affect overall college attendance rates, examining the
effects of affirmative action bans on the full sample would not be subject to this caveat
about composition effects.18
I also study how affirmative action bans affect the proportion of college entrants
from various racial groups who go on to receive degrees from selective colleges. This
combines the effect of bans on enrollment in selective colleges with the effect of bans on
graduation conditional on enrollment. In order to do this, I aggregate the IPEDS data to
the state level and estimate models of the form
ststsstst tbany εηδμα ++++= (2)
separately by racial group, where the notation is similar to before except that is the
fraction of those of a particular race entering any four-year college in state s in year t who
attended and went on to graduate within six years from the type of college considered in
sty
18 Card and Krueger (2005) even find little effect on application behavior in response to a ban, although Long (2004) finds somewhat differently.
11
the regression. I weight these regressions by the number of students of the particular race
entering any four-year college in the state in year t, and I again cluster the standard errors
at the state level. As an example of how the left-hand side variable is constructed for the
regression pertaining to blacks at the top two tiers universities in the U.S. News rankings,
yst in this case would measure the fraction of blacks entering any four-year college who
entered a college in the top two tiers of the U.S. News rankings and received a degree
from it within six years.19 Note that Hinrichs (forthcoming) finds no effect of affirmative
action bans on overall college attendance, so the fact that the sample is limited to college
entrants should not cause large concern. The effect on graduation from a selective
college amongst college entrants should convey similar information to the effect in the
overall population on graduating from a selective college, although one would need to
rescale the former effect by the share of the population attending college to arrive at the
latter. Also note that estimating equation (2) for graduation from any type of college is
algebraically equivalent to estimating equation (1) for the sample of all four-year
colleges. But when estimating models for institutions in the top 50 in the U.S. News
rankings, for instance, estimating equation (1) is different from estimating equation (2).
Estimates of equation (1) show how graduation rates within such institutions change
when affirmative action is banned, whereas estimates of equation (2) show how the
fraction of college entrants who become graduates of such institutions change when
affirmative action is banned.
19 To be even more specific, in 1996 there were 4324 blacks who entered a four-year college in California. Of these students, 832 of them meet both of these criteria: (1) they entered a college in the top two tiers in the U.S. News rankings and (2) they received a degree from it within six years. An important caveat here is that students who transfer and receive a degree from a different institution are not counted amongst the 832.
12
IV. Results
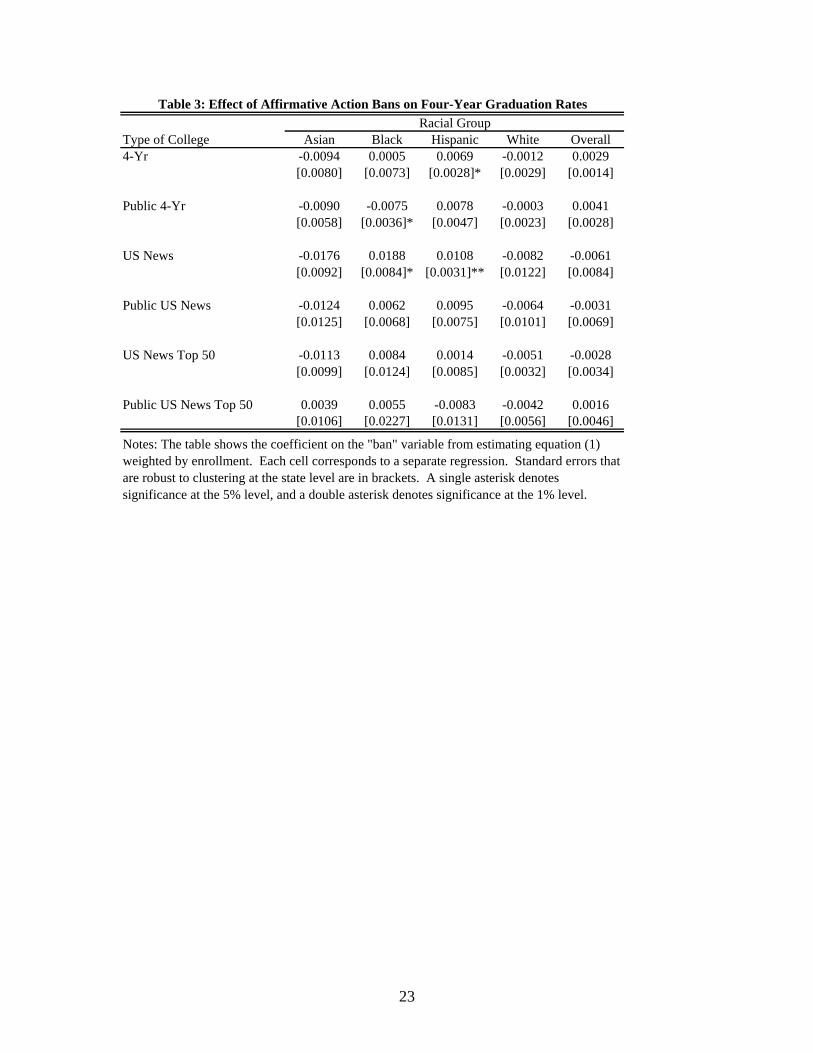
The first row of Table 3 suggests there is not a strong relationship between
affirmative action bans and overall four-year college graduation rates. The only
significant coefficient is for Hispanics, although even there the magnitude is not very
large. The coefficient of .0069 suggests that banning affirmative action is associated with
a .69 percentage point rise in the four-year graduation rate for Hispanics. The lower rows
of Table 3 suggest that there is no relationship between affirmative action bans and
graduation rates within selective public universities. This result is somewhat surprising,
since mismatch may be a larger issue at selective universities and since graduation rates
might rise at those universities due to the changing composition of the student body when
affirmative action is banned.
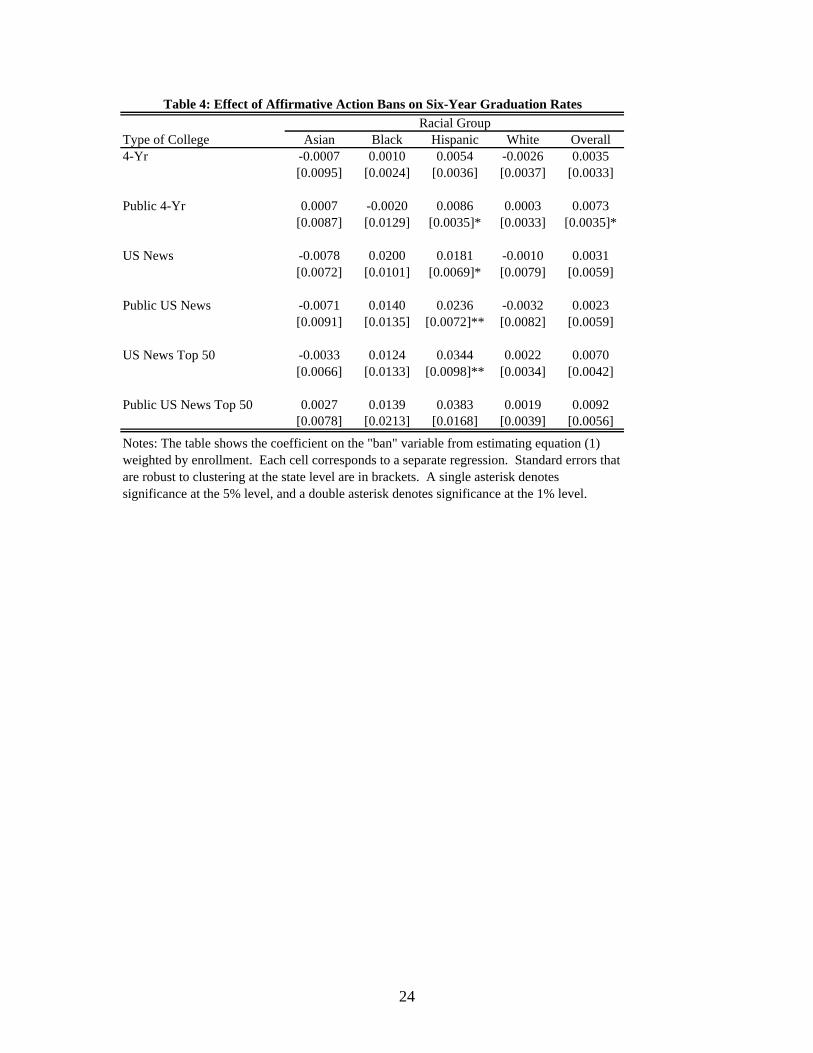
However, especially in light of Table 2, which reveals that many students who
graduate do not graduate within four years, graduating in four years vs. not graduating in
four years may not be the margin along which affirmative action bans have an effect.
Thus, Table 4 reports the results from regressions of six-year graduation rates on
affirmative action bans. Here the results suggest that there may be a reasonably large
effect of affirmative action bans, particularly on the graduation rates of Hispanics. For
instance, affirmative action bans are associated with a statistically significant 2.36
percentage point increase in the graduation rate of Hispanics attending public universities
in the top two tiers of the U.S. News rankings. This effect is quite large compared to the
base of 66.65% shown in Table 2B. The estimated effect on Hispanic graduation rates at
public universities in the top 50 of the U.S. News rankings is 3.83 percentage points,
although this narrowly fails to be significant at the 5% level. None of the coefficients for
13
blacks in Table 4 is significant, although the signs generally point to a positive effect of
affirmative action bans on college graduation rates and the magnitudes are larger at more
selective colleges. And yet, the effects on graduation rates are small relative to the
effects on enrollment found in Hinrichs (forthcoming), which finds displacement effects
of affirmative action bans on blacks and Hispanics at selective universities on the order of
15-30% relative to the base. Thus, the results suggest that mismatch may exist but that it
is probably not very large in magnitude. There is a large displacement of
underrepresented minorities within selective universities caused by affirmative action
bans but not a very large graduation effect. Moreover, as discussed earlier, this
graduation effect may be due to the shifting composition of students at selective
universities.
Two additional points about Tables 3 and 4 are worth mentioning. First, the
coefficients for whites in Tables 3 and 4 are generally smaller in magnitude than those for
underrepresented minorities, and none of the coefficients for whites is significant.20 This
seems to be a good specification check, as whites in relative terms should not be affected
by bans as much as underrepresented minorities are. If affirmative action bans result in a
certain number of whites replacing that same number of minority students at selective
colleges, the effects relative to group size should be smaller for whites since they are a
larger group.21 Second, as shown in the final column of Table 4, there may be a small
20 But as with blacks and Hispanics, the effect on whites is theoretically ambiguous. Banning affirmative action could lead to higher graduation rates for whites because whites are attending higher-quality schools with a ban than without one, or it could lead to lower graduation rates for whites because more whites are mismatched with a ban than without one. 21 Of course affirmative action bans may affect Asians as well, although Hinrichs (forthcoming) generally did not find an effect on Asian representation.
14
positive effect on overall graduation rates when affirmative action is banned, although
most of the coefficients are statistically insignificant.
To be sure, the benefits of banning affirmative action (higher within-institution
graduation rates) found in Table 4 are not measured in the same units as the costs (lower
underrepresented minority enrollment) found in Hinrichs (forthcoming). I next combine
the two effects to study whether there are more or fewer underrepresented minorities who
become graduates of selective colleges when affirmative action is banned. Table 5 shows
summary statistics. The overall effect on the share of underrepresented minorities who
become graduates of selective colleges depends on the change in the within-institution
graduation rates and also the shifting of students across institutions when affirmative
action is banned. The results shown in Table 6 suggest that blacks and possibly
Hispanics are less likely to receive a degree from a selective college when affirmative
action is banned.22 For example, the share of blacks entering four-year colleges who
become graduates of universities in the top two tiers of the U.S. News rankings falls by
.93 percentage points, and the share that become graduates of universities in the top 50
falls by 1.54 percentage points. These results are both statistically and practically
significant, and they suggest that affirmative action bans result in fewer blacks becoming
graduates of elite institutions. Although not shown here, the effect of affirmative action
bans on the share of college graduates (as opposed to the share of college entrants) who
become graduates of selective institutions is even larger in magnitude. In any case, the
results are clear: since fewer underrepresented minorities are admitted to selective
22 Note that there is no row for “All Four-Year Institutions” in Table 6. As alluded to earlier, the estimates would be identical to those in the top row of Table 4.
15
colleges when affirmative action is banned, fewer underrepresented minorities become
graduates of selective colleges.
V. Conclusion
Two caveats are worth bearing in mind. First, this paper examines only
graduation rates. If earnings depend on college selectivity, attending a selective college
may be a risk worth taking even if it results in a lower probability of graduating from any
college. On the other hand, mismatch may be reflected in grades or choice of major and
not in graduation rates, especially to the extent that colleges graduate even low-
performing students.23 This latter possibility is supported by the results of Arcidiacono,
Aucejo, and Spenner (2011), which finds that blacks at Duke University are more likely
to switch out of quantitative majors over the course of their college careers than whites
are. Second, even if there is mismatch, banning affirmative action may not eliminate it.
If universities do not admit the students within each race who are the most likely to
graduate, then some mismatched students may remain in selective universities and some
non-mismatched students might be moved out of selective universities when affirmative
action is banned. This is a likely consequence of the “percentage plans” in place in
California, Florida, and Texas, where students above a certain high school class rank are
automatically admitted to a college.24 Additionally, if students substitute toward private
23 It would be especially problematic if the standards for graduation change in response to affirmative action bans. 24 Here the admissions office is not necessarily admitting the students with only the highest entering credentials within each race statewide, as a student who falls toward the top of his class at a low-income high school may not be toward the top of the distribution of entering credentials statewide. Chan and Eyster (2003) present a model of admissions offices responding to an affirmative action ban by adopting a noisy admissions rule that admits students in the part of the distribution where underrepresented minorities tend to fall rather admitting those with the best test scores within each race. Fryer, Loury, and Yuret (2008) present a model of “color-blind affirmative action,” where colleges take into account in admissions
16
universities that can still use affirmative action, then students may still be mismatched.
But affirmative action bans should at least reduce mismatch even if they do not eliminate
it.
Despite these caveats, it is worth noting that the results of this paper still show the
effect of affirmative action bans on graduation rates. The results do suggest that
graduation rates of Hispanics and possibly blacks rise when affirmative action is banned
at selective colleges, although this effect is small and may be due to the changing
composition of students at these colleges. But the results for the effects of affirmative
action bans on the stock of graduates from selective colleges are clearer: since fewer
underrepresented minorities are admitted to selective colleges, fewer become graduates
of selective colleges.
variables that proxy for race. In the models in both papers, the “best” students within each race are not necessarily admitted to the “best” college.
17
References Alon, Sigal and Marta Tienda (2005), “Assessing the ‘Mismatch’ Hypothesis: Differences in College Graduation Rates by Institutional Selectivity,” Sociology of Education 78:4, 294-315. Arcidiacono, Peter (2005), “Affirmative Action in Higher Education: How Do Admission and Financial Aid Rules Affect Future Earnings,” Econometrica 73:5, 1477-1524. Arcidiacono, Peter, Esteban M. Aucejo, Hanming Fang, and Kenneth I. Spenner (2009), “Does Affirmative Action Lead to Mismatch? A New Test and Evidence,” National Bureau of Economic Research Working Paper 14885. Arcidiacono, Peter, Esteban M. Aucejo, and Ken Spenner (2011), “What Happens After Enrollment? An Analysis of the Time Path of Racial Differences in GPA and Major Choice,” mimeo. Arcidiacono, Peter and Jacob L. Vigdor (2010), “Does the River Spill Out? Estimating the Economic Returns to Attending a Racially Diverse College,” Economic Inquiry 48:3, 537-557. Ayres, Ian and Richard Brooks (2005), “Does Affirmative Action Reduce the Number of Black Lawyers?” Stanford Law Review 57:6, 1807-1854. Barnes, Katherine Y. (2007), “Is Affirmative Action Responsible for the Achievement Gap Between Black and White Law Students?” Northwestern University Law Review 101:4, 1759-1808. Behrman, Jere R., Jill Constantine, Lori Kletzer, Michael McPherson, and Morton Owen Schapiro (1996), “The Impact of College Quality on Wages: Are There Differences Among Demographic Groups?” mimeo. Behrman, Jere R., Mark R. Rosenzweig, and Paul Taubman (1996), “College Choice and Wages: Estimates Using Data on Female Twins,” The Review of Economics and Statistics 78:4, 672-684. Black, Dan, Kermit Daniel, and Jeffrey Smith (2005), “College Quality and Wages in the United States,” German Economic Review 6:3, 415-443. Black, Dan A. and Jeffrey A. Smith (2004), “How Robust is the Evidence on the Effects of College Quality? Evidence from Matching,” Journal of Econometrics 121:1-2, 99-124. Black, Dan A. and Jeffrey A. Smith (2006), “Estimating the Returns to College Quality with Multiple Proxies for Quality,” Journal of Labor Economics 24:3, 701-728.
18
Bound, John, Michael Lovenheim, and Sarah E. Turner (2010), “Why Have College Completion Rates Declined?” An Analysis of Changing Student Preparation and Collegiate Resources,” American Economic Journal: Applied Economics 2:3, 129-157. Bound, John and Sarah Turner (2007), “Cohort Crowding: How Resources Affect Collegiate Attainment,” Journal of Public Economics 91:5-6, 877-899. Bowen, William G. and Derek Bok (1998), The Shape of the River. Brewer, Dominic J., Eric R. Eide, and Ronald G. Ehrenberg (1999), “Does it Pay to Attend an Elite Private College? Cross-Cohort Evidence on the Effects of College Type on Earnings” The Journal of Human Resources 34:1, 104-123. Bucks, Brian (2005), “Affirmative Access Versus Affirmative Action: How Have Texas’ Race-Blind Policies Affected College Outcomes?” mimeo. Card, David and Alan B. Krueger (2005), “Would the Elimination of Affirmative Action Affect Highly Qualified Minority Applicants? Evidence from California and Texas,” Industrial and Labor Relations Review 58:3, 416-434. Chambers, David L., Timothy T. Clydesdale, William C. Kidder, and Richard O. Lempert (2005), “The Real Impact of Eliminating Affirmative Action in American Law Schools: An Empirical Critique of Richard Sander’s Study,” Stanford Law Review 57:6, 1855-1898. Chan, Jimmy and Erik Eyster (2003), “Does Banning Affirmative Action Lower College Student Quality?” The American Economic Review 93:3, 858-872. Cortes, Kalena E. (2010), “Do Bans on Affirmative Action Hurt Minority Students? Evidence from the Texas Top 10% Plan,” Economics of Education Review 29:6, 1110-1124. Dale, Stacy Berg and Alan B. Krueger (2002), “Estimating the Payoff to Attending a More Selective College: An Application of Selection on Observables and Unobservables,” The Quarterly Journal of Economics 117:4, 1491-1527. Daniel, Kermit, Dan Black, and Jeffrey Smith (2001), “Racial Differences in the Effects of College Quality and Student Body Diversity on Wages,” in Diversity Challenged: Evidence on the Impact of Affirmative Action, Gary Orfield and Michal Kurlaender, eds., 221-231. Dickson, Lisa M. (2006), “Does Ending Affirmative Action in College Admissions Lower the Percent of Minority Students Applying to College?” Economics of Education Review 25:1, 109-119.
19
Dillon, Eleanor and Jeffrey Smith (2009), “The Determinants of Mismatch between Students and Colleges,” mimeo. Fryer, Roland G., Jr., Glenn C. Loury, Tolga Yuret (2008), “An Economic Analysis of Color-Blind Affirmative Action,” The Journal of Law, Economics, & Organization 24:2, 319-355. Furstenberg, Eric (2010), “Academic Outcomes and Texas’s Top Ten Percent Law,” The ANNALS of the American Academy of Political and Social Sciences 627:1, 167-183. Hickman, Brent R. (2010), “Effort, Race Gaps and Affirmative Action: A Structural Policy Analysis of US College Admissions,” mimeo. Hinrichs, Peter (2011), “The Effects of Attending a Diverse College,” Economics of Education Review 30:2, 332-341. Hinrichs, Peter (forthcoming), “The Effects of Affirmative Action Bans on College Enrollment, Educational Attainment, and the Demographic Composition of Universities,” The Review of Economics and Statistics. Ho, Daniel E. (2005a), “Why Affirmative Action Does Not Cause Black Students To Fail the Bar,” Yale Law Journal 114:8, 1997-2004. Ho, Daniel E. (2005b), “Affirmative Action’s Affirmative Actions: A Reply to Sander,” Yale Law Journal 114:8, 2011-2016. Holzer, Harry and David Neumark (2000), “Assessing Affirmative Action,” Journal of Economic Literature 38:3, 483-568. Holzer, Harry J. and David Neumark (2006), “Affirmative Action: What Do We Know?” Journal of Policy Analysis and Management 25:2, 463-490. Hoekstra, Mark (2009), “The Effect of Attending the Flagship State University on Earnings: A Discontinuity-Based Approach,” The Review of Economics and Statistics 91:4, 717-724. Howell, Jessica S. (2010), “Assessing the Impact of Eliminating Affirmative Action in Higher Education,” Journal of Labor Economics 28:1, 113-166. Hoxby, Caroline M. (1998), “The Return to Attending a More Selective College: 1960 to the Present,” mimeo. Kain, John F., Daniel M. O’Brien, and Paul A. Jargowsky (2005), “Hopwood and the Top 10 Percent Law: How They Have Affected the College Enrollment Decisions of Texas High School Graduates,” mimeo.
20
Kane, Thomas J. (1998), “Racial and Ethnic Preferences in College Admissions,” in The Black-White Test Score Gap, Christopher Jencks and Meredith Phillips, eds., 431-456. Light, Audrey and Wayne Strayer (2000), “Determinants of College Completion: School Quality or Student Ability?” The Journal of Human Resources 35:2, 299-332. Long, Mark C. (2004a), “College Applications and the Effect of Affirmative Action,” Journal of Econometrics 121:1-2, 319-342. Long, Mark C. (2004b), “Race and College Admissions: An Alternative to Affirmative Action?” The Review of Economics and Statistics 86:4, 1020-1033. Long, Mark C. (2008), “College Quality and Early Adult Outcomes,” Economics of Education Review 27:5, 588-602. Long, Mark C. (2010), “Changes in the Returns to Education and College Quality,” Economics of Education Review 29:3, 338-347. Loury, Linda Datcher and David Garman (1993), “Affirmative Action in Higher Education,” American Economic Review AEA Papers and Proceedings 83:2, 99-103. Loury, Linda Datcher and David Garman (1995), “College Selectivity and Earnings,” Journal of Labor Economics 13:2, 289-308. Monks, James (2000), “The Returns to Individual and College Characteristics. Evidence from the National Longitudinal Survey of Youth,” Economics of Education Review 19:3, 279-289. Rothstein, Jesse and Albert Yoon (2008), “Affirmative Action in Law School Admissions: What Do Racial Preferences Do?” The University of Chicago Law Review 75:2, 649-714. Rothstein, Jesse and Albert Yoon (2009), “Mismatch in Law School,” mimeo. Sander, Richard H. (2004), “A Systemic Analysis of Affirmative Action in American Law Schools,” Stanford Law Review 57:2, 367-483. Stange, Kevin (forthcoming), “Ability Sorting and the Importance of College Quality to Student Achievement: Evidence from Community Colleges,” Education Finance and Policy. Zhang, Lei (forthcoming), “A Value-Added Estimate of Higher Education Quality of U.S. States,” Education Economics.
21
96 97 98 99 00 01 02 03California X X X X X XFlorida X X XTexas X X X X X X XWashington X X X X X
Table 1: States with Affirmative Action Bans
Note: The ban at Texas A&M began in 1996, and the ban at Florida State University began in 2000.
Type of College N (Institution-Years) Asian Black Hispanic White Overall4-Yr 12274 0.4149 0.2214 0.2548 0.3995 0.3721
Public 4-Yr 3795 0.3323 0.1811 0.1834 0.3166 0.2932
US News 852 0.5443 0.4163 0.4449 0.5364 0.5279
Public US News 415 0.4624 0.3331 0.3580 0.4704 0.4539
US News Top 50 366 0.6345 0.5541 0.5427 0.6900 0.6616
Public US News Top 50 112 0.5363 0.4267 0.4116 0.5879 0.5511
Table 2A: Four-Year Graduation Rates by Race and Type of CollegeRacial Group
Notes: The table shows four-year graduation rates by racial group weighted by enrollment.
Type of College N (Institution-Years) Asian Black Hispanic White Overall4-Yr 12981 0.6651 0.4191 0.4820 0.6055 0.5794
Public 4-Yr 3826 0.6355 0.4096 0.4509 0.5725 0.5497
US News 855 0.7968 0.6614 0.7053 0.7622 0.7572
Public US News 415 0.7673 0.6144 0.6665 0.7325 0.7246
US News Top 50 368 0.8676 0.7658 0.7889 0.8630 0.8515
Public US News Top 50 112 0.8401 0.7006 0.7386 0.8303 0.8154
Table 2B: Six-Year Graduation Rates by Race and Type of CollegeRacial Group
Notes: The table shows six-year graduation rates by racial group weighted by enrollment.
22
Type of College Asian Black Hispanic White Overall4-Yr -0.0094 0.0005 0.0069 -0.0012 0.0029
[0.0080] [0.0073] [0.0028]* [0.0029] [0.0014]
Public 4-Yr -0.0090 -0.0075 0.0078 -0.0003 0.0041[0.0058] [0.0036]* [0.0047] [0.0023] [0.0028]
US News -0.0176 0.0188 0.0108 -0.0082 -0.0061[0.0092] [0.0084]* [0.0031]** [0.0122] [0.0084]
Public US News -0.0124 0.0062 0.0095 -0.0064 -0.0031[0.0125] [0.0068] [0.0075] [0.0101] [0.0069]
US News Top 50 -0.0113 0.0084 0.0014 -0.0051 -0.0028[0.0099] [0.0124] [0.0085] [0.0032] [0.0034]
Public US News Top 50 0.0039 0.0055 -0.0083 -0.0042 0.0016[0.0106] [0.0227] [0.0131] [0.0056] [0.0046]
Table 3: Effect of Affirmative Action Bans on Four-Year Graduation RatesRacial Group
Notes: The table shows the coefficient on the "ban" variable from estimating equation (1) weighted by enrollment. Each cell corresponds to a separate regression. Standard errors that are robust to clustering at the state level are in brackets. A single asterisk denotes significance at the 5% level, and a double asterisk denotes significance at the 1% level.
23
Type of College Asian Black Hispanic White Overall4-Yr -0.0007 0.0010 0.0054 -0.0026 0.0035
[0.0095] [0.0024] [0.0036] [0.0037] [0.0033]
Public 4-Yr 0.0007 -0.0020 0.0086 0.0003 0.0073[0.0087] [0.0129] [0.0035]* [0.0033] [0.0035]*
US News -0.0078 0.0200 0.0181 -0.0010 0.0031[0.0072] [0.0101] [0.0069]* [0.0079] [0.0059]
Public US News -0.0071 0.0140 0.0236 -0.0032 0.0023[0.0091] [0.0135] [0.0072]** [0.0082] [0.0059]
US News Top 50 -0.0033 0.0124 0.0344 0.0022 0.0070[0.0066] [0.0133] [0.0098]** [0.0034] [0.0042]
Public US News Top 50 0.0027 0.0139 0.0383 0.0019 0.0092[0.0078] [0.0213] [0.0168] [0.0039] [0.0056]
Table 4: Effect of Affirmative Action Bans on Six-Year Graduation RatesRacial Group
Notes: The table shows the coefficient on the "ban" variable from estimating equation (1) weighted by enrollment. Each cell corresponds to a separate regression. Standard errors that are robust to clustering at the state level are in brackets. A single asterisk denotes significance at the 5% level, and a double asterisk denotes significance at the 1% level.
24
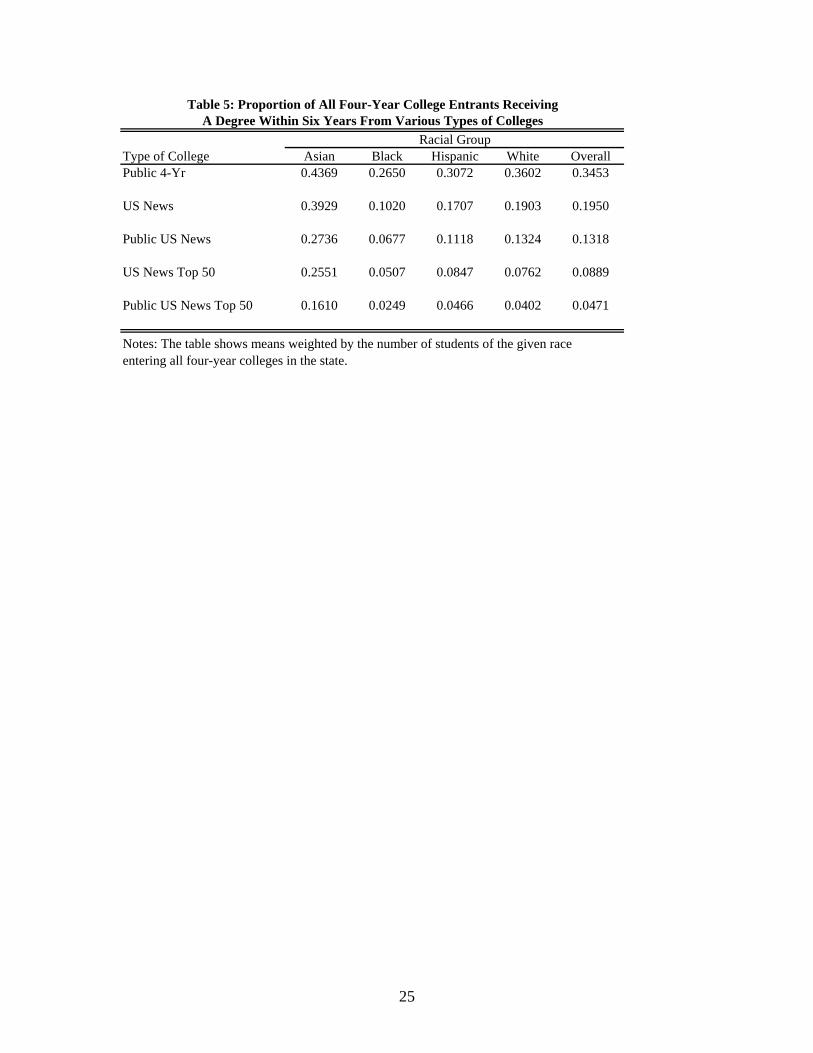
Type of College Asian Black Hispanic White OverallPublic 4-Yr 0.4369 0.2650 0.3072 0.3602 0.3453
US News 0.3929 0.1020 0.1707 0.1903 0.1950
Public US News 0.2736 0.0677 0.1118 0.1324 0.1318
US News Top 50 0.2551 0.0507 0.0847 0.0762 0.0889
Public US News Top 50 0.1610 0.0249 0.0466 0.0402 0.0471
Table 5: Proportion of All Four-Year College Entrants ReceivingA Degree Within Six Years From Various Types of Colleges
Racial Group
Notes: The table shows means weighted by the number of students of the given race entering all four-year colleges in the state.
25
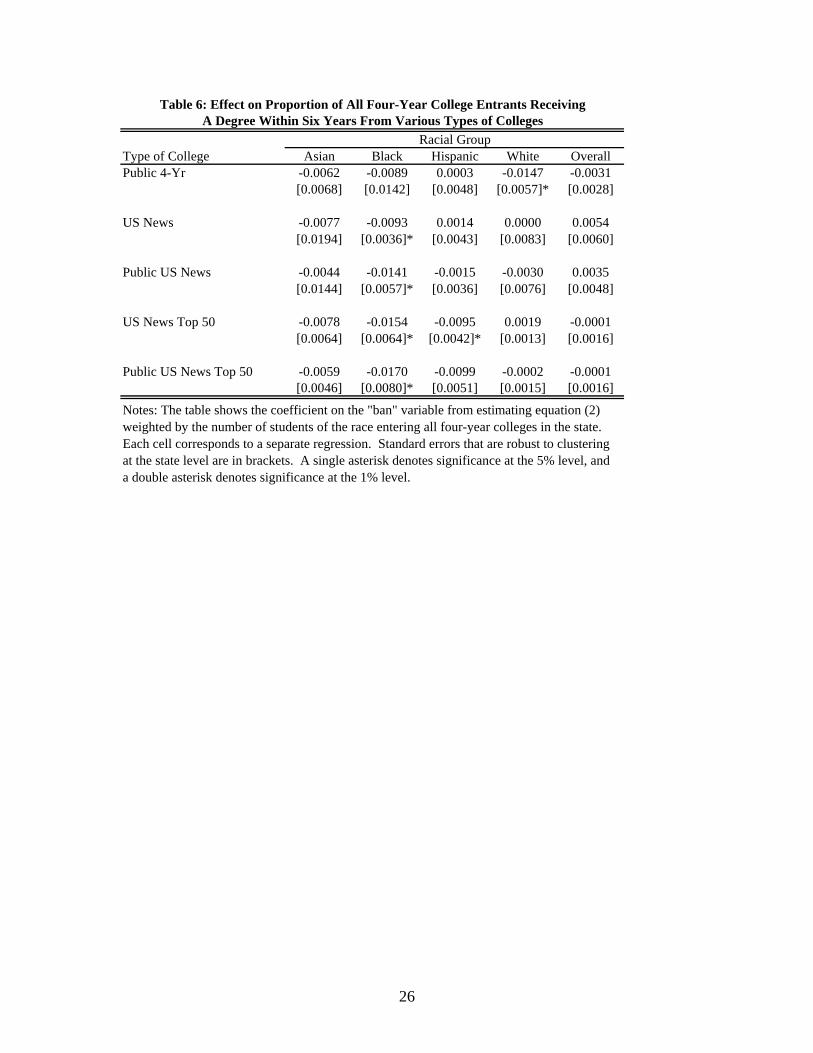
Type of College Asian Black Hispanic White OverallPublic 4-Yr -0.0062 -0.0089 0.0003 -0.0147 -0.0031
[0.0068] [0.0142] [0.0048] [0.0057]* [0.0028]
US News -0.0077 -0.0093 0.0014 0.0000 0.0054[0.0194] [0.0036]* [0.0043] [0.0083] [0.0060]
Public US News -0.0044 -0.0141 -0.0015 -0.0030 0.0035[0.0144] [0.0057]* [0.0036] [0.0076] [0.0048]
US News Top 50 -0.0078 -0.0154 -0.0095 0.0019 -0.0001[0.0064] [0.0064]* [0.0042]* [0.0013] [0.0016]
Public US News Top 50 -0.0059 -0.0170 -0.0099 -0.0002 -0.0001[0.0046] [0.0080]* [0.0051] [0.0015] [0.0016]
Racial GroupA Degree Within Six Years From Various Types of Colleges
Table 6: Effect on Proportion of All Four-Year College Entrants Receiving
Notes: The table shows the coefficient on the "ban" variable from estimating equation (2) weighted by the number of students of the race entering all four-year colleges in the state. Each cell corresponds to a separate regression. Standard errors that are robust to clustering at the state level are in brackets. A single asterisk denotes significance at the 5% level, and a double asterisk denotes significance at the 1% level.
26