africa: the impact of mobile phones - vodacom€¦ · africa: the impact of mobile phones moving...
TRANSCRIPT
Africa:The Impact
ofMobilePhones
The Vodafone Policy Paper Series • Number 2 • March 2005Moving the debate forward
ContentsPage
Foreword 00
– Arun Sarin, Chief Executive, Vodafone Group
Introduction 01
– Neil Gough and Charlotte Grezo, Vodafone Group
Overview 03
– Diane Coyle
The impact of telecoms on economic growth in developing countries 10
– Leonard Waverman, Meloria Meschi, Melvyn Fuss
Mobile networks and Foreign Direct Investment in developing countries 24
– Mark Williams
Introduction to the community and business surveys 41
Mobile communications in South Africa, Tanzania and Egypt:
results from community and business surveys 44
– Jonathan Samuel, Niraj Shah and Wenona Hadingham
Linking mobile phone ownership and use to social capital in rural South Africa and Tanzania 53
– James Goodman
Bibliography 66
Africa: The Impact of Mobile Phones Moving the debate forward • The Vodafone Policy Paper Series • Number 2 • March 2005
ForewordI hope you enjoy our second Vodafone Policy Paper. Our aim in these papers is to provide a platform for leading experts to write onissues in public policy that are important to us at Vodafone. These are the people that we listen to, even if we do not always agreewith them. These are their views, not ours. We think that they have important things to say that should be of interest to anybody concerned with good public policy.
Arun Sarin, Chief Executive, Vodafone Group
International Institutions DirectorNeil Gough
IntroductionAbout 18 months ago we became interested in studies on theeconomic and social impacts of mobile telecommunications.However, a thorough review of the existing literature revealedsurprisingly little systematic evidence. There were manyanecdotes, some interesting sociological research, but fewsuccessful studies looking at the economic impacts onindividuals, businesses and overall economic activity.
This project has its roots in our dissatisfaction with that situation.It seemed extraordinary that a technology that has clearly takenthe world by storm had attracted so little rigorous research.It was equally clear that there was widespread interest in thesubject. As we discussed our programme and ideas with peopleboth inside and outside the industry, the appetite for this workbecame obvious.
We wanted the work to be able to survive the scrutiny of apotentially skeptical audience. Therefore, with advice from theVodafone Advisory Panel (a group of academics, officials andNGO representatives with interests in this field) we developed aprogramme of research.
The field was wide open so we could have chosen to focusanywhere but we started with the impact of mobile in thedeveloping world. The reason was simple. We were inspired by aconversation with Alan Knott-Craig, the CEO of our affiliatecompany in South Africa, in which he talked about the impact
mobile was having in Africa. The variety of the examples hementioned were simply extraordinary.
Vodafone operates around the globe and has a particular interest indeveloping markets in Africa, not least because of the success ofour investment in Vodacom, initially operating in South Africa andnow also in Democratic Republic of Congo, Lesotho, Mozambiqueand Tanzania. Vodafone also operates in Egypt and Kenya.
At the time we began this work, the fact that Africa was to playsuch a leading part in the G8 agenda for 2005 and the work ofthe Africa Commission was unknown. We have been fortunatethat the issues we have covered resonate with these importantinternational initiatives. We hope that these studies will assist inhighlighting the part that mobile telecommunications can play inthe developing world.
We have learned a great deal. Most important is the fact that theways in which mobiles are used, valued and owned in thedeveloping world are very different from the developed countries.More attention should be paid to the characteristics of howpeople actually do use phones in the developing world in policydebates on increasing access to Information and CommunicationTechnology (ICT). It is wrong to simply extrapolate our developedworld models of needs and usage patterns to poorer nations.Understanding the context is vital. In the UK, the ratio of the
Africa: The Impact of Mobile PhonesMoving the debate forward • The Vodafone Policy Paper Series • Number 2 • March 2005
01
Neil is currently the International Institutions Director for Vodafone Group, coordinatinginternational policy and relationships with global institutions throughout Vodafone Group.
Director of Corporate ResponsibilityCharlotte Grezo
Charlotte is Director of Corporate Responsibility for Vodafone and is responsible forcoordinating the Group's approach to managing social and environmental issues.
Africa: The Impact of Mobile Phones Moving the debate forward • The Vodafone Policy Paper Series • Number 2 • March 2005
02
number of outgoing voice calls made to the number of SMSmessages sent is 0.6:1; in South Africa as a whole, the ratio is3:1 for pre-pay phones; yet in the rural communities wesurveyed, the average ratio was a remarkable 13:1. In Ndebe,a rural community in South Africa, the ratio was 17:1, but whenone considers this in the context of a community in whichaccess to education is not universal, the data are moreunderstandable. The combination of illiteracy and indigenouslanguages clearly has dramatic effects on the use of SMSmessaging; the implications of this extend to other types of datausage (e.g. the internet). Our view is that the policy debates onICT policy are not sufficiently informed by this type of evidence.
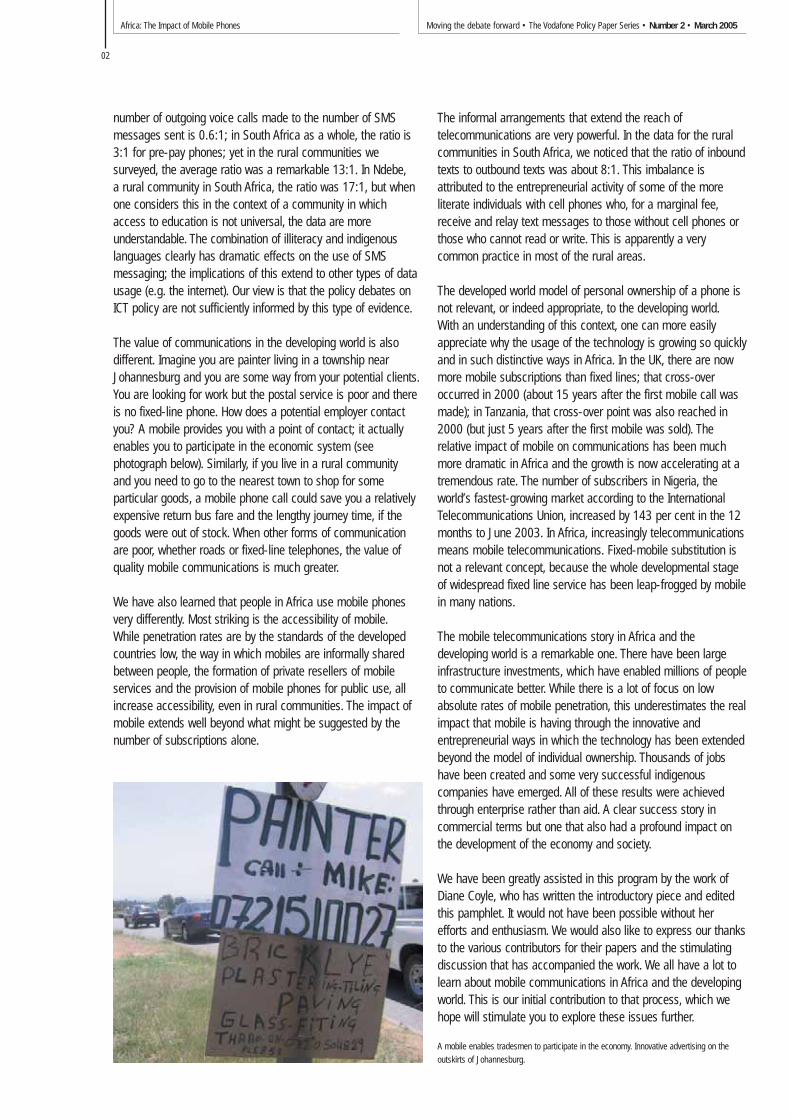
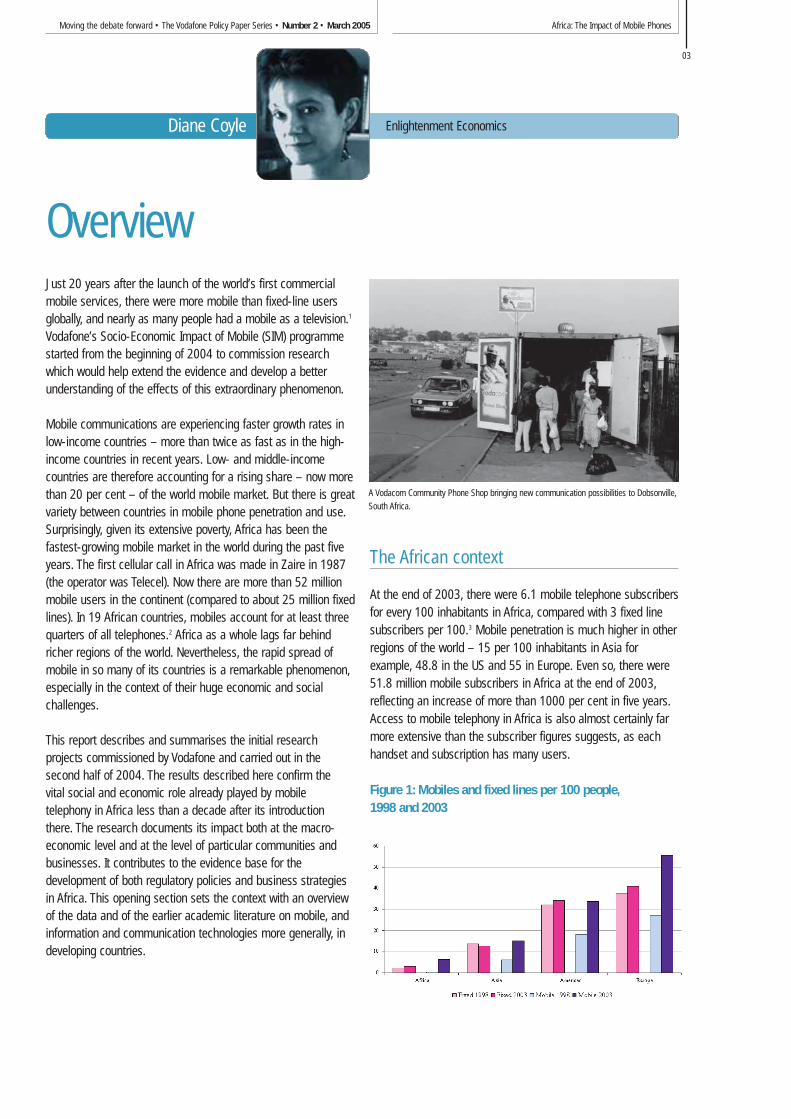
The value of communications in the developing world is alsodifferent. Imagine you are painter living in a township nearJohannesburg and you are some way from your potential clients.You are looking for work but the postal service is poor and thereis no fixed-line phone. How does a potential employer contactyou? A mobile provides you with a point of contact; it actuallyenables you to participate in the economic system (seephotograph below). Similarly, if you live in a rural community and you need to go to the nearest town to shop for someparticular goods, a mobile phone call could save you a relativelyexpensive return bus fare and the lengthy journey time, if thegoods were out of stock. When other forms of communicationare poor, whether roads or fixed-line telephones, the value ofquality mobile communications is much greater.
We have also learned that people in Africa use mobile phonesvery differently. Most striking is the accessibility of mobile.While penetration rates are by the standards of the developedcountries low, the way in which mobiles are informally sharedbetween people, the formation of private resellers of mobileservices and the provision of mobile phones for public use, allincrease accessibility, even in rural communities. The impact ofmobile extends well beyond what might be suggested by thenumber of subscriptions alone.
The informal arrangements that extend the reach oftelecommunications are very powerful. In the data for the ruralcommunities in South Africa, we noticed that the ratio of inboundtexts to outbound texts was about 8:1. This imbalance isattributed to the entrepreneurial activity of some of the moreliterate individuals with cell phones who, for a marginal fee,receive and relay text messages to those without cell phones orthose who cannot read or write. This is apparently a verycommon practice in most of the rural areas.
The developed world model of personal ownership of a phone isnot relevant, or indeed appropriate, to the developing world.With an understanding of this context, one can more easilyappreciate why the usage of the technology is growing so quicklyand in such distinctive ways in Africa. In the UK, there are nowmore mobile subscriptions than fixed lines; that cross-overoccurred in 2000 (about 15 years after the first mobile call wasmade); in Tanzania, that cross-over point was also reached in2000 (but just 5 years after the first mobile was sold). Therelative impact of mobile on communications has been muchmore dramatic in Africa and the growth is now accelerating at atremendous rate. The number of subscribers in Nigeria, theworld’s fastest-growing market according to the InternationalTelecommunications Union, increased by 143 per cent in the 12months to June 2003. In Africa, increasingly telecommunicationsmeans mobile telecommunications. Fixed-mobile substitution isnot a relevant concept, because the whole developmental stageof widespread fixed line service has been leap-frogged by mobilein many nations.
The mobile telecommunications story in Africa and thedeveloping world is a remarkable one. There have been largeinfrastructure investments, which have enabled millions of peopleto communicate better. While there is a lot of focus on lowabsolute rates of mobile penetration, this underestimates the realimpact that mobile is having through the innovative andentrepreneurial ways in which the technology has been extendedbeyond the model of individual ownership. Thousands of jobshave been created and some very successful indigenouscompanies have emerged. All of these results were achievedthrough enterprise rather than aid. A clear success story incommercial terms but one that also had a profound impact onthe development of the economy and society.
We have been greatly assisted in this program by the work ofDiane Coyle, who has written the introductory piece and editedthis pamphlet. It would not have been possible without herefforts and enthusiasm. We would also like to express our thanksto the various contributors for their papers and the stimulatingdiscussion that has accompanied the work. We all have a lot tolearn about mobile communications in Africa and the developingworld. This is our initial contribution to that process, which wehope will stimulate you to explore these issues further.
A mobile enables tradesmen to participate in the economy. Innovative advertising on the
outskirts of Johannesburg.
Africa: The Impact of Mobile PhonesMoving the debate forward • The Vodafone Policy Paper Series • Number 2 • March 2005
03
Just 20 years after the launch of the world’s first commercialmobile services, there were more mobile than fixed-line usersglobally, and nearly as many people had a mobile as a television.1
Vodafone’s Socio-Economic Impact of Mobile (SIM) programmestarted from the beginning of 2004 to commission researchwhich would help extend the evidence and develop a betterunderstanding of the effects of this extraordinary phenomenon.
Mobile communications are experiencing faster growth rates inlow-income countries – more than twice as fast as in the high-income countries in recent years. Low- and middle-incomecountries are therefore accounting for a rising share – now morethan 20 per cent – of the world mobile market. But there is greatvariety between countries in mobile phone penetration and use.Surprisingly, given its extensive poverty, Africa has been thefastest-growing mobile market in the world during the past fiveyears. The first cellular call in Africa was made in Zaire in 1987(the operator was Telecel). Now there are more than 52 millionmobile users in the continent (compared to about 25 million fixedlines). In 19 African countries, mobiles account for at least threequarters of all telephones.2 Africa as a whole lags far behindricher regions of the world. Nevertheless, the rapid spread ofmobile in so many of its countries is a remarkable phenomenon,especially in the context of their huge economic and socialchallenges.
This report describes and summarises the initial researchprojects commissioned by Vodafone and carried out in thesecond half of 2004. The results described here confirm the vital social and economic role already played by mobiletelephony in Africa less than a decade after its introductionthere. The research documents its impact both at the macro-economic level and at the level of particular communities andbusinesses. It contributes to the evidence base for thedevelopment of both regulatory policies and business strategiesin Africa. This opening section sets the context with an overviewof the data and of the earlier academic literature on mobile, andinformation and communication technologies more generally, indeveloping countries.
The African context
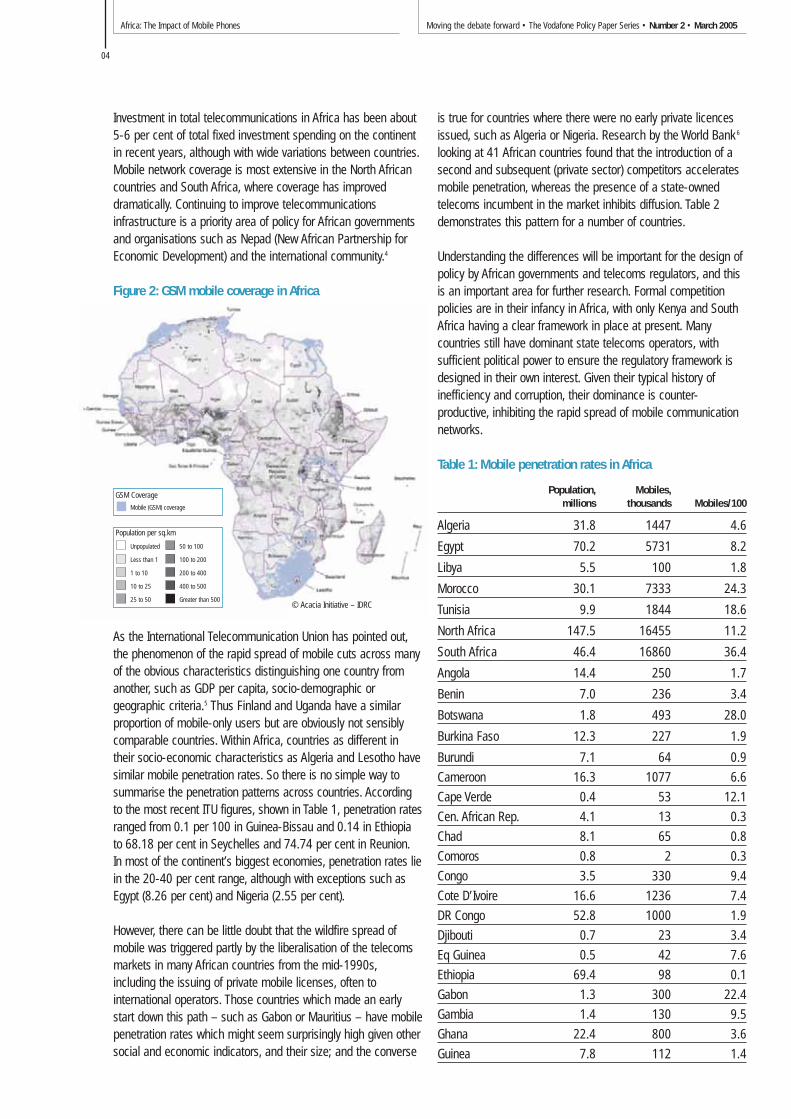
At the end of 2003, there were 6.1 mobile telephone subscribersfor every 100 inhabitants in Africa, compared with 3 fixed linesubscribers per 100.3 Mobile penetration is much higher in otherregions of the world – 15 per 100 inhabitants in Asia forexample, 48.8 in the US and 55 in Europe. Even so, there were51.8 million mobile subscribers in Africa at the end of 2003,reflecting an increase of more than 1000 per cent in five years.Access to mobile telephony in Africa is also almost certainly farmore extensive than the subscriber figures suggests, as eachhandset and subscription has many users.
Figure 1: Mobiles and fixed lines per 100 people,1998 and 2003
Enlightenment EconomicsDiane Coyle
Overview
A Vodacom Community Phone Shop bringing new communication possibilities to Dobsonville,
South Africa.
Africa: The Impact of Mobile Phones Moving the debate forward • The Vodafone Policy Paper Series • Number 2 • March 2005
04
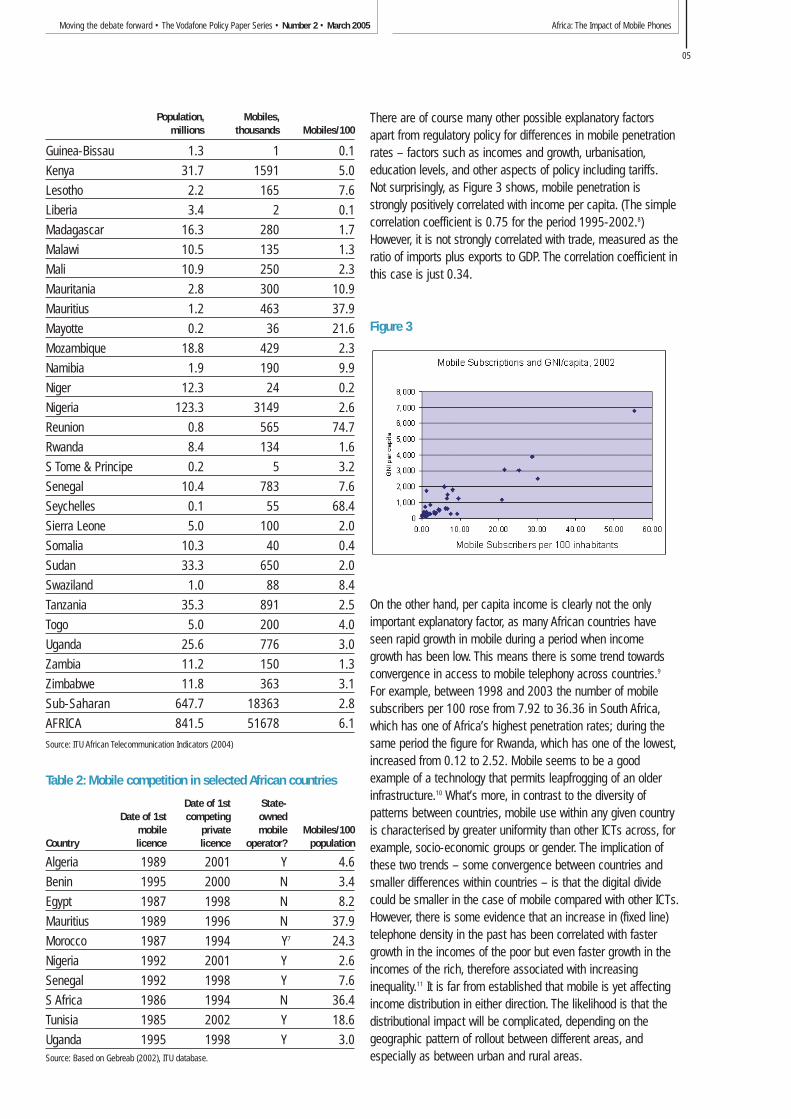
Investment in total telecommunications in Africa has been about5-6 per cent of total fixed investment spending on the continentin recent years, although with wide variations between countries.Mobile network coverage is most extensive in the North Africancountries and South Africa, where coverage has improveddramatically. Continuing to improve telecommunicationsinfrastructure is a priority area of policy for African governmentsand organisations such as Nepad (New African Partnership forEconomic Development) and the international community.4
Figure 2: GSM mobile coverage in Africa
As the International Telecommunication Union has pointed out,the phenomenon of the rapid spread of mobile cuts across manyof the obvious characteristics distinguishing one country fromanother, such as GDP per capita, socio-demographic orgeographic criteria.5 Thus Finland and Uganda have a similarproportion of mobile-only users but are obviously not sensiblycomparable countries. Within Africa, countries as different intheir socio-economic characteristics as Algeria and Lesotho havesimilar mobile penetration rates. So there is no simple way tosummarise the penetration patterns across countries. Accordingto the most recent ITU figures, shown in Table 1, penetration ratesranged from 0.1 per 100 in Guinea-Bissau and 0.14 in Ethiopiato 68.18 per cent in Seychelles and 74.74 per cent in Reunion.In most of the continent’s biggest economies, penetration rates liein the 20-40 per cent range, although with exceptions such asEgypt (8.26 per cent) and Nigeria (2.55 per cent).
However, there can be little doubt that the wildfire spread ofmobile was triggered partly by the liberalisation of the telecomsmarkets in many African countries from the mid-1990s,including the issuing of private mobile licenses, often tointernational operators. Those countries which made an earlystart down this path – such as Gabon or Mauritius – have mobilepenetration rates which might seem surprisingly high given othersocial and economic indicators, and their size; and the converse
is true for countries where there were no early private licencesissued, such as Algeria or Nigeria. Research by the World Bank 6
looking at 41 African countries found that the introduction of asecond and subsequent (private sector) competitors acceleratesmobile penetration, whereas the presence of a state-ownedtelecoms incumbent in the market inhibits diffusion. Table 2demonstrates this pattern for a number of countries.
Understanding the differences will be important for the design ofpolicy by African governments and telecoms regulators, and thisis an important area for further research. Formal competitionpolicies are in their infancy in Africa, with only Kenya and SouthAfrica having a clear framework in place at present. Manycountries still have dominant state telecoms operators, withsufficient political power to ensure the regulatory framework isdesigned in their own interest. Given their typical history ofinefficiency and corruption, their dominance is counter-productive, inhibiting the rapid spread of mobile communicationnetworks.
Table 1: Mobile penetration rates in Africa
Population, Mobiles,millions thousands Mobiles/100
Algeria 31.8 1447 4.6
Egypt 70.2 5731 8.2
Libya 5.5 100 1.8
Morocco 30.1 7333 24.3
Tunisia 9.9 1844 18.6
North Africa 147.5 16455 11.2
South Africa 46.4 16860 36.4
Angola 14.4 250 1.7
Benin 7.0 236 3.4
Botswana 1.8 493 28.0
Burkina Faso 12.3 227 1.9
Burundi 7.1 64 0.9
Cameroon 16.3 1077 6.6
Cape Verde 0.4 53 12.1
Cen. African Rep. 4.1 13 0.3
Chad 8.1 65 0.8
Comoros 0.8 2 0.3
Congo 3.5 330 9.4
Cote D’Ivoire 16.6 1236 7.4
DR Congo 52.8 1000 1.9
Djibouti 0.7 23 3.4
Eq Guinea 0.5 42 7.6
Ethiopia 69.4 98 0.1
Gabon 1.3 300 22.4
Gambia 1.4 130 9.5
Ghana 22.4 800 3.6
Guinea 7.8 112 1.4
© Acacia Initiative – IDRC
Population per sq.km
Unpopulated 50 to 100
Less than 1 100 to 200
1 to 10 200 to 400
10 to 25 400 to 500
25 to 50 Greater than 500
GSM Coverage
Mobile (GSM) coverage
Africa: The Impact of Mobile PhonesMoving the debate forward • The Vodafone Policy Paper Series • Number 2 • March 2005
05
Population, Mobiles,millions thousands Mobiles/100
Guinea-Bissau 1.3 1 0.1
Kenya 31.7 1591 5.0
Lesotho 2.2 165 7.6
Liberia 3.4 2 0.1
Madagascar 16.3 280 1.7
Malawi 10.5 135 1.3
Mali 10.9 250 2.3
Mauritania 2.8 300 10.9
Mauritius 1.2 463 37.9
Mayotte 0.2 36 21.6
Mozambique 18.8 429 2.3
Namibia 1.9 190 9.9
Niger 12.3 24 0.2
Nigeria 123.3 3149 2.6
Reunion 0.8 565 74.7
Rwanda 8.4 134 1.6
S Tome & Principe 0.2 5 3.2
Senegal 10.4 783 7.6
Seychelles 0.1 55 68.4
Sierra Leone 5.0 100 2.0
Somalia 10.3 40 0.4
Sudan 33.3 650 2.0
Swaziland 1.0 88 8.4
Tanzania 35.3 891 2.5
Togo 5.0 200 4.0
Uganda 25.6 776 3.0
Zambia 11.2 150 1.3
Zimbabwe 11.8 363 3.1
Sub-Saharan 647.7 18363 2.8
AFRICA 841.5 51678 6.1
Source: ITU African Telecommunication Indicators (2004)
Table 2: Mobile competition in selected African countries
Date of 1st State-Date of 1st competing owned
mobile private mobile Mobiles/100Country licence licence operator? population
Algeria 1989 2001 Y 4.6
Benin 1995 2000 N 3.4
Egypt 1987 1998 N 8.2
Mauritius 1989 1996 N 37.9
Morocco 1987 1994 Y7 24.3
Nigeria 1992 2001 Y 2.6
Senegal 1992 1998 Y 7.6
S Africa 1986 1994 N 36.4
Tunisia 1985 2002 Y 18.6
Uganda 1995 1998 Y 3.0Source: Based on Gebreab (2002), ITU database.
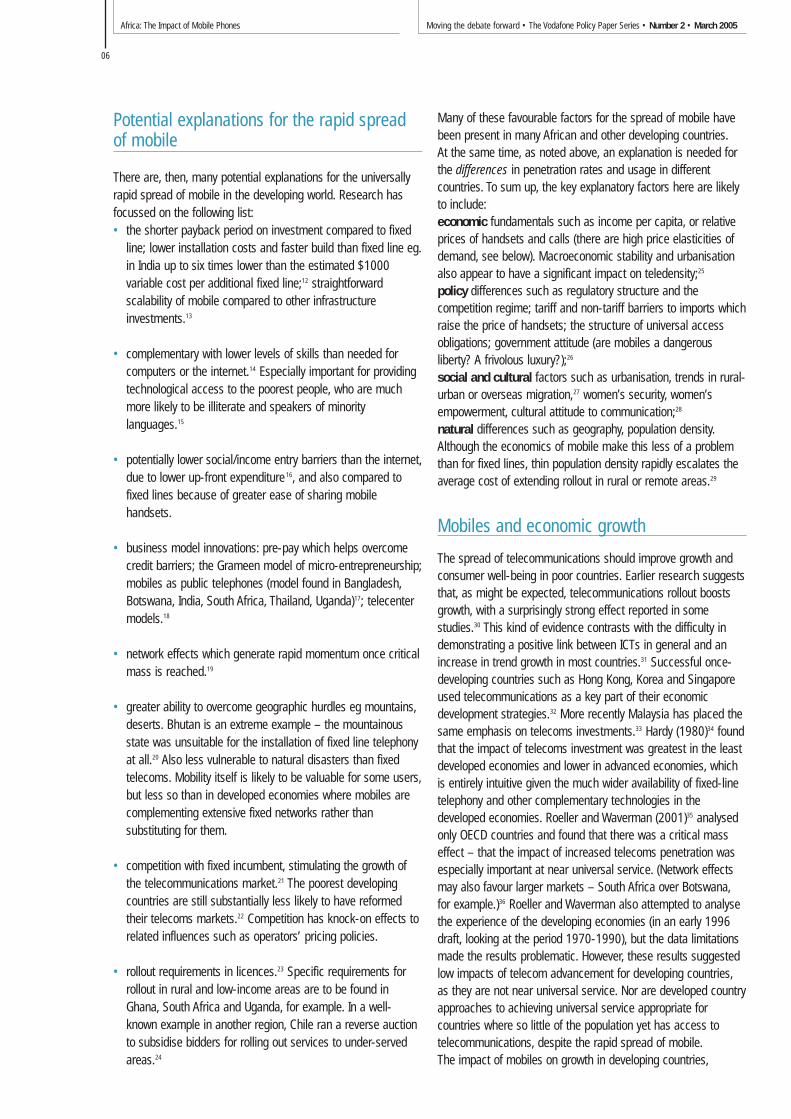
There are of course many other possible explanatory factorsapart from regulatory policy for differences in mobile penetrationrates – factors such as incomes and growth, urbanisation,education levels, and other aspects of policy including tariffs.Not surprisingly, as Figure 3 shows, mobile penetration isstrongly positively correlated with income per capita. (The simplecorrelation coefficient is 0.75 for the period 1995-2002.8)However, it is not strongly correlated with trade, measured as theratio of imports plus exports to GDP. The correlation coefficient inthis case is just 0.34.
Figure 3
On the other hand, per capita income is clearly not the onlyimportant explanatory factor, as many African countries haveseen rapid growth in mobile during a period when incomegrowth has been low. This means there is some trend towardsconvergence in access to mobile telephony across countries.9
For example, between 1998 and 2003 the number of mobilesubscribers per 100 rose from 7.92 to 36.36 in South Africa,which has one of Africa’s highest penetration rates; during thesame period the figure for Rwanda, which has one of the lowest,increased from 0.12 to 2.52. Mobile seems to be a goodexample of a technology that permits leapfrogging of an olderinfrastructure.10 What’s more, in contrast to the diversity ofpatterns between countries, mobile use within any given countryis characterised by greater uniformity than other ICTs across, forexample, socio-economic groups or gender. The implication ofthese two trends – some convergence between countries andsmaller differences within countries – is that the digital dividecould be smaller in the case of mobile compared with other ICTs.However, there is some evidence that an increase in (fixed line)telephone density in the past has been correlated with fastergrowth in the incomes of the poor but even faster growth in theincomes of the rich, therefore associated with increasinginequality.11 It is far from established that mobile is yet affectingincome distribution in either direction. The likelihood is that thedistributional impact will be complicated, depending on thegeographic pattern of rollout between different areas, andespecially as between urban and rural areas.
Africa: The Impact of Mobile Phones Moving the debate forward • The Vodafone Policy Paper Series • Number 2 • March 2005
06
Potential explanations for the rapid spreadof mobile
There are, then, many potential explanations for the universallyrapid spread of mobile in the developing world. Research hasfocussed on the following list:• the shorter payback period on investment compared to fixed
line; lower installation costs and faster build than fixed line eg.in India up to six times lower than the estimated $1000variable cost per additional fixed line;12 straightforwardscalability of mobile compared to other infrastructureinvestments.13
• complementary with lower levels of skills than needed forcomputers or the internet.14 Especially important for providingtechnological access to the poorest people, who are muchmore likely to be illiterate and speakers of minoritylanguages.15
• potentially lower social/income entry barriers than the internet,due to lower up-front expenditure 16, and also compared tofixed lines because of greater ease of sharing mobilehandsets.
• business model innovations: pre-pay which helps overcomecredit barriers; the Grameen model of micro-entrepreneurship;mobiles as public telephones (model found in Bangladesh,Botswana, India, South Africa, Thailand, Uganda)17; telecentermodels.18
• network effects which generate rapid momentum once criticalmass is reached.19
• greater ability to overcome geographic hurdles eg mountains,deserts. Bhutan is an extreme example – the mountainousstate was unsuitable for the installation of fixed line telephonyat all.20 Also less vulnerable to natural disasters than fixedtelecoms. Mobility itself is likely to be valuable for some users,but less so than in developed economies where mobiles arecomplementing extensive fixed networks rather thansubstituting for them.
• competition with fixed incumbent, stimulating the growth ofthe telecommunications market.21 The poorest developingcountries are still substantially less likely to have reformedtheir telecoms markets.22 Competition has knock-on effects torelated influences such as operators’ pricing policies.
• rollout requirements in licences.23 Specific requirements forrollout in rural and low-income areas are to be found inGhana, South Africa and Uganda, for example. In a well-known example in another region, Chile ran a reverse auctionto subsidise bidders for rolling out services to under-servedareas.24
Many of these favourable factors for the spread of mobile havebeen present in many African and other developing countries.At the same time, as noted above, an explanation is needed forthe differences in penetration rates and usage in differentcountries. To sum up, the key explanatory factors here are likelyto include:economic fundamentals such as income per capita, or relativeprices of handsets and calls (there are high price elasticities ofdemand, see below). Macroeconomic stability and urbanisationalso appear to have a significant impact on teledensity;25
policy differences such as regulatory structure and thecompetition regime; tariff and non-tariff barriers to imports whichraise the price of handsets; the structure of universal accessobligations; government attitude (are mobiles a dangerousliberty? A frivolous luxury?);26
social and cultural factors such as urbanisation, trends in rural-urban or overseas migration,27 women’s security, women’sempowerment, cultural attitude to communication;28
natural differences such as geography, population density.Although the economics of mobile make this less of a problemthan for fixed lines, thin population density rapidly escalates theaverage cost of extending rollout in rural or remote areas.29
Mobiles and economic growth
The spread of telecommunications should improve growth andconsumer well-being in poor countries. Earlier research suggeststhat, as might be expected, telecommunications rollout boostsgrowth, with a surprisingly strong effect reported in somestudies.30 This kind of evidence contrasts with the difficulty indemonstrating a positive link between ICTs in general and anincrease in trend growth in most countries.31 Successful once-developing countries such as Hong Kong, Korea and Singaporeused telecommunications as a key part of their economicdevelopment strategies.32 More recently Malaysia has placed thesame emphasis on telecoms investments.33 Hardy (1980)34 foundthat the impact of telecoms investment was greatest in the leastdeveloped economies and lower in advanced economies, whichis entirely intuitive given the much wider availability of fixed-linetelephony and other complementary technologies in thedeveloped economies. Roeller and Waverman (2001)35 analysedonly OECD countries and found that there was a critical masseffect – that the impact of increased telecoms penetration wasespecially important at near universal service. (Network effectsmay also favour larger markets – South Africa over Botswana,for example.)36 Roeller and Waverman also attempted to analysethe experience of the developing economies (in an early 1996draft, looking at the period 1970-1990), but the data limitationsmade the results problematic. However, these results suggestedlow impacts of telecom advancement for developing countries,as they are not near universal service. Nor are developed countryapproaches to achieving universal service appropriate forcountries where so little of the population yet has access totelecommunications, despite the rapid spread of mobile.The impact of mobiles on growth in developing countries,
Africa: The Impact of Mobile PhonesMoving the debate forward • The Vodafone Policy Paper Series • Number 2 • March 2005
07
however, is not covered the earlier literature.37 This is the gapfilled by the next section of this report, by Leonard Waverman,Meloria Meschi and Melvyn Fuss. They confirm that the growthimpact of mobiles is large in both developed and developingcountries, but around twice as important in the latter group,where there is also a critical mass effect. The policy implicationof their results for developing countries is clear: it will be worthinvesting large amounts in telecommunications to get close touniversal service. As wireless technologies are much lower costto roll out over large areas than fixed line systems, mobile canpotentially play a vital role in economic development.
World Bank research suggests the internal rate of returngenerated by telecoms investments in developing countries ofaround 20%. There is also some evidence that telecoms rolloutis linked with higher levels of foreign direct investment.38
This relationship is explored in the section on FDI in this reportby Mark Williams, which assesses the separate impacts of fixedline infrastructure and mobiles on FDI.
Other economic and social impacts ofmobile
The existing evidence on other impacts of mobile indicatespositive correlations between teledensity and quality of lifeindicators – allowing for GNP per capita – such as longer lifeexpectancy, lower infant mortality and lower illiteracy (althoughsuch correlations must be treated with great caution given theexistence of simultaneity and omitted variables).39 One measureof the perceived opportunities and benefits provided by mobile orby telecommunications in general is the amount consumers arewilling to spend on services. The available evidence is thattelecoms services are very highly valued. In all developingcountries, the average spent on telecommunications is 2% ofmonthly expenditure. In a sample of Indian villages, the averagewas 3% of household income. In Chile poor people spend moreof their incomes on telecommunications than on water, and eventhe average household spends more on telecoms than on waterand electricity combined.40 However, estimates of the priceelasticity of demand are typically quite high, which implies thathigh call charges could inhibit mobile penetration and usage insome developing countries. Income elasticities are also high: onestudy in India found a 1% rise in household income almostdoubled demand for telecommunications.41 Waverman et al inthis report also confirm that price and income eleasticities ofdemand are high.
There is every reason to believe that the economic and socialreturns to mobile will be highest of all in rural areas, which areconsistently less well provided with telecommunications services.Serving rural areas is also closely linked to anti-poverty efforts.Half the world’s population – 3 billion people – lives in ruralareas, and there is a substantial overlap between poverty and
rural dwelling. Telephone connectivity appears to be highlycorrelated with the extent of the non-farm sector, andconsequently average incomes, in rural areas. A study of 27 Thaivillages found that the only non-agricultural activities took placein the 18 with Public Call Offices (mostly fixed line); the other 9had no manufacturing businesses. This is consistent withfindings from other countries from Botswana to Ecuador showingan improvement in non-farm incomes in rural areas.42
To the extent that mobile communications are reaching somerural areas with little or no fixed line availability, rural people arebetter able to stay in contact with family members. Mobiles arealso improving the flow of information available to would-bemigrants from urban centres or from overseas. Survey evidencefrom Bangladesh suggests the main reason for calls made viaGrameenPhone mobiles are financial (queries about remittances,finding jobs in the city) or family-related (staying in touch withrelatives working elsewhere).43
There can be medical or educational benefits from improvedaccess to expertise, for example in access to medical advice fora remote villager. Earlier research documented such impacts oftelephony in the remote areas of developed countries, such asCanada and Australia. Likewise, previous studies on telephonylooked at the importance of social contact for people living inremote and lightly populated areas – such as the Australianoutback. Researchers suggest this is particularly important for women.44
There are now several studies documenting the improvement inprices received by farmers as a result of better access totelephony in general and mobile in particular, in developingcountries in Asia, Africa and Latin America. One particularly niceexample is the case of fishermen in India using mobile phones toget information about prices at different ports before decidingwhere to land their catch.45 This specific example was confirmedin a study of fishermen on Mafia Island, off the Tanzanian coast,where the Vodafone Foundation partners the WWF in a marineproject.46
The improved flow of information evidently reduces monopsonypower in agricultural markets – especially non-commoditymarkets such as perishable fruits, where prices were not alreadypublished in newspapers. The impact of an improved informationflow thanks to better telecommunications ought to be apparentin the dispersion of prices for the same product in different partsof the same national or regional market. If information flows arepoor, the ‘law of one price’ will not operate: the market will notwork well, and middle-men will be able to discriminate betweendifferent suppliers or customers (although competition amongstmiddlemen can limit this). There is evidence from the historicalrecord that the telegraph and telephone reduced the dispersionof agricultural prices, and raised farm incomes, in the UnitedStates in the 19th and 20th centuries. Earlier work demonstratedthe impact of the development of a long-distance fixed line
Africa: The Impact of Mobile Phones Moving the debate forward • The Vodafone Policy Paper Series • Number 2 • March 2005
08
network in the creation of a credit market for coffee growers inEthiopia.47 The same phenomenon of reduced farm pricedispersion has been documented in China recently.48
Just as in developed countries, mobiles save time and enableefficiencies in business, especially in terms of coping withunexpected events (taxis responding to customers in the cities,dealing with a blocked road or an accident when making adelivery). There is plentiful anecdotal evidence of this kind, muchof it to be found in newspaper coverage. A few studies reportsimilar findings – for example, reduced emergency responsetimes.49 In a few countries – notably China – mobiles are beingused for e-commerce: home shopping or trading in shares.50
Studies also report law enforcement benefits from the ability tocontact police quickly. In Bangladesh for example, lawenforcement agencies give GrameenPhone some credit forreduced rural crime rates. There are other examples of mobilesbeing used to improve security and thus efficiency – forexample, maize farmers in the Democratic Republic of Congohave provided phones to security guards, increasing their yieldssignificantly through reducing looting.51
The two final sections of this report contribute to this researchon social and economic impacts of mobiles using the results ofsurveys on the use of mobile carried out for Vodafone in ruralcommunities in South Africa and Tanzania, and of smallbusinesses in Egypt and South Africa. The community surveysassess the factors affecting mobile use, and the range ofpotential impacts, in relatively poor, rural African communities.As Jonathan Samuel, Niraj Shah and Wenona Hadingham report
below, the surveys suggest that mobile telephony is frequentlyaccessed by the poorest people, thanks in part to widespreadsharing. The surveys suggest that gender, age and education donot present insurmountable barriers to access – nor even theabsence of electricity. Individuals surveyed in rural communitieshighlighted savings in travel time and costs and easiercommunication with family and friends, in addition to access tobusiness information and easier job search. A majority of smallbusinesses reported increased sales and profits, time savingsand greater efficiency. For many black-owned businesses inCairo, a mobile phone was the only means of communicationavailable. The final section of this report, by James Goodman,looks specifically at the implications of the survey results forsocial capital, or the strength of social networks and contacts inthe rural communities. Mobile phone ownership in thecommunities surveyed was positively linked to life satisfactionand a willingness to help others. A clear majority of respondentssaid owning a mobile had improved their relationship with familymembers living elsewhere.
The studies included here represent the early stages ofVodafone’s SIM programme, which will continue to contribute tothe growing body of evidence. As more data and more researchbecome available, it will be important for policy makers andanybody interested in social and economic development in Africato understand the impact of the extraordinary spread of mobile.
All references in this section are to the bibliography at the end ofthe report.
Africa: The Impact of Mobile PhonesMoving the debate forward • The Vodafone Policy Paper Series • Number 2 • March 2005
09
Notes
1 UNDP HDR database.
2 ITU 2003, ITU 2004, Kirkman and Sachs, World Bank2000, World Economic Forum 2003.
(All references are to Mobile Bibliography).
3 Figures in this paragraph from ITU 2004.
4 DFID (2004); see also www.infodev.org.
5 ITU 2003.
6 Gebreab (2002)
7 The Kingdom of Morocco and Vivendi Universal agreed on November 18, 2004, to the
acquisition by Vivendi Universal of 16% of the capital of Maroc Telecom. The agreement
allows Vivendi Universal to increase its stake from 35% to 51%, thereby perpetuating its
control over the company. Payment for this transaction was made in January 2005.
8 See also Eggleston et al (2002), Forestier et al (2002), World Economic Forum (2003).
9 Grace et al (2001). See also ITU World Telecommunications Indicators 2004, Chapter 4
on the Millennium Development Goals.
10 Grace et al (2001).
11 Forestier et al (2002), Navas-Sabater (2002), Rodriguez and Wilson (2000).
12 Kenny (2002)
13 Dholakia and Kshetri (2002)
14 Mansell (2001), Qiang et al
15 Kenny (2002)
16 Forestier et al, Kenny (2002)
17 Bruns et al (1996), ITU (2002), Navas-Sabater et al (2002).
18 Latcham and Walker (2001), Proenza (2001)
19 Grajek (2003); see also Roeller and Waverman (2001).
20 Dorj (2001)
21 Azam et al – Senega (2002); Bruns et al – Thailand (1996); Forrestier et al (2002);
Gebreab – Africa (2002); ITU (1999) – Bangladesh; Laffont et al – Cote D’Ivoire (2002);
Rossotto et al (2000) – MENA; Rossotto et al (2003); UNDP; Wallsten (1999) – Africa and
Latin America,
22 Beardsley et al. (2002)
23 ITU (2003), Navas-Sabater (2002).
24 Kenny (2002), Wellenius (2001)
25 Forestier et al (2002);
26 Lopez (2000).
27 Bruns et al (1996),
28 Dholakia and Kshetri (2002).
29 Dorj (2001), Kenny (2002).
30 See Röller and Waverman for a careful study using OECD data – this refers back to the
older literature; Madden and Savage (1998) find a stronger result for Central and Eastern
Europe; Nadiri and Nandi (2003) also find a strong link for developing countries.
31 OECD 2003.
32 Saunders et al (2003).
33 Riaz (1997).
34 Hardy (1980).
35 Roeller and Waverman (2001).
36 Qiang et al
37 An exception is Jha, R and S. Majumdar (1999).
38 Mansell (2001), Navas-Sabater (2002).
39 Forestier et al (2002), Kenny, UNDP (2002).
40 Navas-Sabater (2002), Wellenius (2000); Blattman et al (2002); De Melo cited in
Forestier (2002).
41 Grajek (2003), ITU (2003); Blattman et al (2002).
42 Bruns et al (1996); Duncombe and Heeks (1999), Forestier et al (2002).
43 Bruns et a (1996); Bayes et al (1999).
44 Bayes et al (1999), Hammond (2001); Hudson (1995)
45 Bruns et al (1996); Forestier et al (2002); Hudson (1995); ITU (1999); Lopez (2000).
Dholakia and Kshetri (2002).
46 http://www.wwf.org.uk/annualreview/2003-2004/business.asp
47 Hirschman, referenced in Forestier et al (2002).
48 Hudson (1995); Eggleston et al (2002).
49 Bruns et al (1996), Schwartz (2001.)
50 Dholakia and Kshetri (2002), Laperrouza (2002).
51 Bayes et al (1999); Lopez (2000).

Introduction
There is a long tradition of economic research on the impact ofinfrastructure investments and social overhead capital oneconomic growth. Studies have successfully measured thegrowth dividend of investment in telecommunicationsinfrastructure in developed economies.2 But few have assessedthe impact of telecommunications rollout in developing countries.Given the importance of telecommunications to participation inthe modern world economy, we seek to fill the void in existingresearch. Investment in telecoms generates a growth dividendbecause the spread of telecommunications reduces costs ofinteraction, expands market boundaries, and enormouslyexpands information flows. Modern revolutions in managementsuch as ‘just-in-time’ production rely completely on efficient
ubiquitous communications networks. These networks are recentdevelopments. The work by Roeller and Waverman (2001)suggests that in the OECD, the spread of modern fixed-linetelecoms networks alone was responsible for one third of outputgrowth between 1970 and 1990.
Developing countries experience a low telecoms trap – the lackof networks and access in many villages increases costs, andreduces opportunities because information is difficult to gather.In turn, the resulting low incomes restrict the ability to pay forinfrastructure rollout.
In the OECD economies, modern fixed-line networks took a longtime to develop. Access to homes and firms requires physical linesto be built – a slow and expensive process. France, which had 8fixed line telephones per 100 population (the ‘penetration rate’) in
The Impact of Telecoms on EconomicGrowth in Developing Countries
Professor & Chair of Economics, London Business SchoolLeonard Waverman
Africa: The Impact of Mobile Phones Moving the debate forward • The Vodafone Policy Paper Series • Number 2 • March 2005
10
Associate Professor of Economics, John Cabot University,Rome and Affiliate, LECG, LondonMeloria Meschi
Professor of Economics, University of TorontoMelvyn Fuss1
Africa: The Impact of Mobile PhonesMoving the debate forward • The Vodafone Policy Paper Series • Number 2 • March 2005
11
1970, doubled this by 1976, and reached 30 main lines per 100population in 1980. Mobile phones are lower cost and far quickerto rollout than fixed lines. In 1995, Morocco had 4 fixed lines per100 inhabitants after many years of slow investment, and zeromobile phones per 100 inhabitants. In 2003, only eight yearslater, the mobile phone penetration rate in Morocco was 24, whilefixed line penetration had stagnated at its 1995 level.
We find that mobile phones in less developed economies areplaying the same crucial role that fixed telephony played in thericher economies in the 1970s and 1980s. Mobile phonessubstitute for fixed lines in poor countries, but complement fixedlines in rich countries, implying that they have a stronger growthimpact in poor countries. Many countries with under-developedfixed-line networks have achieved rapid mobile telephony growthwith much less investment than fixed-line networks would haveneeded.
We subjected the impact of telecoms rollout on economicgrowth in poorer nations to a thorough empirical scrutiny. Weemployed two different approaches – the Annual ProductionFunction (APF) approach following the work of Roeller andWaverman (2001) and the Endogenous Technical Change (ETC)approach similar to the work of Robert Barro (1991). The latterprovided us with the most robust and sensible estimates of theimpact of mobile telephony on economic growth. We used dataon 92 countries, high income and low income, from 1980 to2003, and tested whether the introduction and rollout of mobilephone networks added to growth.
We find that mobile telephony has a positive and significantimpact on economic growth, and this impact may be twice aslarge in developing countries compared to developed countries.This result concurs with intuition. Developed economies by andlarge had fully articulated fixed-line networks in 1996. Even so,the addition of mobile networks had significant value-added in thedeveloped world: the value-added of mobility and the inclusion ofdisenfranchised consumers through pay-as-you-go plansunavailable for fixed lines. In developing countries, we find that thegrowth dividend is far larger because here mobile phones provide,by and large, the main communications networks; hence theysupplant the information-gathering role of fixed-line systems.
The growth dividend of increasing mobile phone penetration indeveloping countries is therefore substantial. All else equal, thePhilippines (a penetration rate of 27 percent in 2003) mightenjoy annual average per capita income growth of as much as 1 percent higher than Indonesia (a penetration rate of 8.7percent in 2003) owing solely to the greater diffusion of mobiletelephones, were this gap in mobile penetration to be sustainedfor some time. A developing country which had an average of 10 more mobile phones per 100 population between 1996 and2003 would have enjoyed per capita GDP growth that was 0.59percent higher than an otherwise identical country.For high-income countries, mobile telephones also provide asignificant growth dividend during the same time period.
Sweden, for example, had an average mobile penetration rate of64 per 100 inhabitants during the 1996 to 2003 period, thehighest penetration of mobiles observed. In that same period,Canada had a 26 per 100 average mobile penetration rate.All else equal, we estimate that Canada would have enjoyed anaverage GDP per capita growth rate nearly 1 percent higher thanit actually was, had the mobile penetration rate in Canada beenmore-than-doubled.
Our research also provides new estimates of demand elasticitiesin developing countries – we find both the own–price and incomeelasticities of mobile phone demand to be significantly above 1.That is, demand increases much more than in proportion to eitherincreases in income or reductions in price. We also find thatmobile phones are substitutes for fixed-line phones.
Economists have long examined the importance of social overheadcapital (SOC) to economic growth. SOC is generally considered asexpenditures on education, health services, and publicinfrastructure: roads, ports, and the like. Telecommunicationinfrastructure, whether publicly or privately funded, is a crucialelement of SOC. We in the west tend to forget what everyday lifewould be like, absent modern telecommunications systems. Thesenetworks enable the ubiquitous, speedy spread of information.Alan Greenspan, the Chairman of the US Federal Reserve Board,coined the term “New Economy” to represent how the spread ofmodern information and communications technology has enabledhigh growth with low inflation. This “New Economy” is the directresult of the networked computer – the ability of higher bandwidthcommunications systems to allow computer-to-computercommunications.3 The ”New Economy” enables greatercompetition and new means of organising production.
In earlier periods, telecommunications networks helped generateeconomic growth by enabling firms and individuals to decreasetransaction costs, and firms to widen their markets; Roeller andWaverman (2001) 4 estimated the impact on GDP of investmentin telecoms infrastructure in the OECD between 1970 and 1990.They showed it significantly enhanced economy-wide output,allowing for the fact that the demand for telecoms is itselfpositively related to GDP. One must remember that in 1970telecoms penetration was quite low in a number of OECDcountries. While the US and Canada had near-universal servicein 1970, in the same year France, Portugal and Italy for example,had only 8, 6, and 12 phones per 100 inhabitants respectively.It is then not surprising that the spread of moderntelecommunications infrastructure between 1970 and 1990generated economic growth over and above the investment inthe telecoms networks itself.
Roeller and Waverman also demonstrated that the scale ofimpact of the increased penetration of telecoms networks ongrowth depended on the initial level of penetration, with thebiggest impact occurring near universal service – a phone inevery household and firm. The standard government policy of
Africa: The Impact of Mobile Phones Moving the debate forward • The Vodafone Policy Paper Series • Number 2 • March 2005
12
universal service was, then, not only a question of equity, butwas also implicit recognition of the growth-enhancing propertiesof telephony expansion.
In 1995, just under half of the membership of the InternationalTelecommunications Union (ITU), an international organisationcomprising 214 countries, had telecoms penetration rates below 8, the level attained by France in 1970. Much of the worldstill lacked a major component – the telephone – of a modern,efficient economic system in 1995.
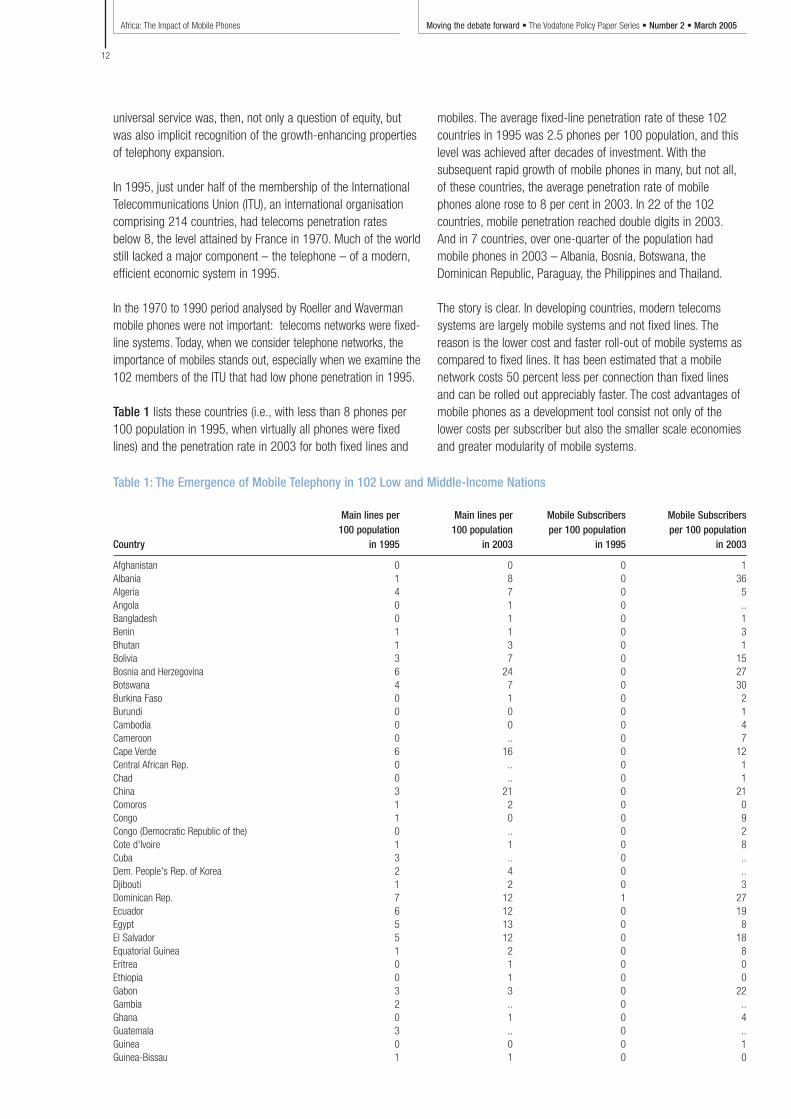
In the 1970 to 1990 period analysed by Roeller and Wavermanmobile phones were not important: telecoms networks were fixed-line systems. Today, when we consider telephone networks, theimportance of mobiles stands out, especially when we examine the102 members of the ITU that had low phone penetration in 1995.
Table 1 lists these countries (i.e., with less than 8 phones per100 population in 1995, when virtually all phones were fixedlines) and the penetration rate in 2003 for both fixed lines and
mobiles. The average fixed-line penetration rate of these 102countries in 1995 was 2.5 phones per 100 population, and thislevel was achieved after decades of investment. With thesubsequent rapid growth of mobile phones in many, but not all,of these countries, the average penetration rate of mobilephones alone rose to 8 per cent in 2003. In 22 of the 102countries, mobile penetration reached double digits in 2003.And in 7 countries, over one-quarter of the population hadmobile phones in 2003 – Albania, Bosnia, Botswana, theDominican Republic, Paraguay, the Philippines and Thailand.
The story is clear. In developing countries, modern telecomssystems are largely mobile systems and not fixed lines. Thereason is the lower cost and faster roll-out of mobile systems ascompared to fixed lines. It has been estimated that a mobilenetwork costs 50 percent less per connection than fixed linesand can be rolled out appreciably faster. The cost advantages ofmobile phones as a development tool consist not only of thelower costs per subscriber but also the smaller scale economiesand greater modularity of mobile systems.
Table 1: The Emergence of Mobile Telephony in 102 Low and Middle-Income Nations
Main lines per Main lines per Mobile Subscribers Mobile Subscribers100 population 100 population per 100 population per 100 population
Country in 1995 in 2003 in 1995 in 2003
Afghanistan 0 0 0 1Albania 1 8 0 36Algeria 4 7 0 5Angola 0 1 0 ..Bangladesh 0 1 0 1Benin 1 1 0 3Bhutan 1 3 0 1Bolivia 3 7 0 15Bosnia and Herzegovina 6 24 0 27Botswana 4 7 0 30Burkina Faso 0 1 0 2Burundi 0 0 0 1Cambodia 0 0 0 4Cameroon 0 .. 0 7Cape Verde 6 16 0 12Central African Rep. 0 .. 0 1Chad 0 .. 0 1China 3 21 0 21Comoros 1 2 0 0Congo 1 0 0 9Congo (Democratic Republic of the) 0 .. 0 2Cote d'Ivoire 1 1 0 8Cuba 3 .. 0 ..Dem. People's Rep. of Korea 2 4 0 ..Djibouti 1 2 0 3Dominican Rep. 7 12 1 27Ecuador 6 12 0 19Egypt 5 13 0 8El Salvador 5 12 0 18Equatorial Guinea 1 2 0 8Eritrea 0 1 0 0Ethiopia 0 1 0 0Gabon 3 3 0 22Gambia 2 .. 0 ..Ghana 0 1 0 4Guatemala 3 .. 0 ..Guinea 0 0 0 1Guinea-Bissau 1 1 0 0

Table 1: The Emergence of Mobile Telephony in 102 Low and Middle-Income Nations – continued
Main lines per Main lines per Mobile Subscribers Mobile Subscribers100 population 100 population per 100 population per 100 population
Country in 1995 in 2003 in 1995 in 2003
Guyana 5 .. 0 ..Haiti 1 2 0 4Honduras 3 .. 0 ..India 1 5 0 2Indonesia 2 4 0 9Iraq 3 .. 0 ..Jordan 7 11 0 24Kenya 1 1 0 5Kiribati 3 .. 0 1Kyrgyzstan 8 .. 0 ..Lao P.D.R. 0 1 0 2Lesotho 1 .. 0 ..Liberia 0 .. 0 ..Libya 6 14 0 2Madagascar 0 0 0 2Malawi 0 1 0 1Maldives 6 .. 0 ..Mali 0 .. 0 2Marshall Islands 7 8 1 1Mauritania 0 1 0 13Mayotte 4 .. 0 22Micronesia (Fed. States of) 7 10 0 5Mongolia 4 6 0 13Morocco 4 4 0 24Mozambique 0 .. 0 2Myanmar 0 1 0 0Namibia 5 7 0 12Nepal 0 2 0 0Nicaragua 2 4 0 9Niger 0 .. 0 0Nigeria 0 1 0 3Oman 8 .. 0 ..Pakistan 2 3 0 2Palestine 3 9 1 13Papua New Guinea 1 .. 0 ..Paraguay 3 5 0 30Peru 5 7 0 11Philippines 2 4 1 27Rwanda 0 .. 0 2Samoa 5 7 0 6Sao Tome and Principe 2 5 0 3Senegal 1 2 0 6Sierra Leone 0 .. 0 ..Solomon Islands 2 1 0 0Somalia 0 .. 0 ..Sri Lanka 1 5 0 7Sudan 0 3 0 2Swaziland 2 4 0 8Syria 7 .. 0 ..Tajikistan 4 4 0 1Tanzania 0 0 0 3Thailand 6 10 2 39Togo 1 1 0 4Tonga 7 .. 0 ..Tunisia 6 12 0 19Turkmenistan 7 .. 0 ..Tuvalu 5 .. 0 0Uganda 0 0 0 3Uzbekistan 7 7 0 1Vanuatu 3 3 0 4Viet Nam 1 5 0 3Yemen 1 .. 0 3Zambia 1 1 0 2Zimbabwe 1 3 0 3
Average Fixed Penetration in 1995: 2 Average Fixed Penetration in 2003: 5 Average Mobile Penetration in 1995: 0 Average Mobile Penetration in 2003: 8
Africa: The Impact of Mobile PhonesMoving the debate forward • The Vodafone Policy Paper Series • Number 2 • March 2005
13
Africa: The Impact of Mobile Phones Moving the debate forward • The Vodafone Policy Paper Series • Number 2 • March 2005
14
The importance of conveying information
Consider what communicating in France must have been like 35 years ago, in 1970, with only 8 phones per 100 people.The description of Geertz (1978) as applying to developingcountries, “information is poor, scarce, maldistributed,inefficiently communicated and intensely valued”5, must haveapplied equally to France. Residents of remote villages with nophone connections would have enormous difficulty in discoveringprices of commodities. Farmers would not have access toalternative sources of fertilisers or to alternative buyers of theirproducts. As recent studies on the use of mobile phones inSouth Africa show, the substitute for telecommunicatedinformation would have been physical transport.6 Instead of aquick phone call, never mind Internet usage, determining sellingor buying prices would require costly, time-consuming physicalcontacts and transport. Thus without telecommunications, thecosts of information retrieval and of transacting in general wouldbe high. Besides greater transaction costs, the range of supplywould be much smaller, or for transactions across largedistances, risks would be higher as prices and conditions of salewould not be known exactly. Modern telecom networks, then,are crucial forms of Social Overhead Capital. But how importantare they?
There are two basic ways in which economists determine theextent of the economic growth impact of some factor such asincreased education or telecoms infrastructure investment –aggregate production function (APF) estimation and theendogenous technical change (ETC) approach.
In the first approach – the APF – the level of economy-wideGross Domestic Product (GDP) each year is assumed to bedetermined by that year’s aggregate capital, aggregate labour,and other specific factors such as education or the spread oftelecommunications. The growth dividend of telecoms would bemeasured by its annual contribution to GDP growth. The secondapproach – the ETC – relates the average rate of growth of GDPover a substantial period (we use the 24-year period 1980 to2003) to the initial level of GDP, average investment as a shareof GDP during that period, the initial stock of labour representedin terms of its educational attainment 7, and the initial or averagetelephone penetration rate. The contribution of telecoms togrowth is here measured by its boost to the long-term growthrate. The ETC approach is not an average over time of the APFapproach, as the two models rest on different theoreticalunderpinnings.
Empirically, the two methods differ as well: the productionfunction approach uses annual data, so errors or missingobservations cause significant difficulties. The endogenoustechnical change approach uses period averages and initialperiod values instead, and it is thus less prone to data errors.Given the paucity of reliable data in developing countries, theETC approach should prove more robust and tractable.
Because demand for telecoms services rises with wealth, it iscrucial in the APF approach to disentangle two effects – theimpact of increased telecoms rollout on economic growth andthe impact of rising GDP itself on the demand for telecoms. Thisis called the two-way causality issue, or ‘endogeneity’, as thedemand for telecoms is itself dependent on the level of GDP.Hence estimating an APF alone would lead to biased and likelyexaggerated measures of the growth dividend of telecoms.
This endogeneity problem is handled in Roeller-Waverman bydeveloping a four-equation model: the first equation is the outputequation or economy-wide production function; the secondequation determines the demand for telecoms; a third equationdetermines the investment in telecoms infrastructure and a finalequation relates investment to increased rollout. In this model,the explicit causality from GDP to demand is recognised inequation two, allowing any estimated effect of telecoms ongrowth (equation one) to be net of the demand-inducing effectsof rising GDP.
The two-way causality problem cannot be dealt with explicitly inthe endogenous growth model approach but is unlikely to be acentral issue. One cannot, for example, add a demand equationdefined as the average demand over the period. Instead one hasto use data analysis, instrumental variables and statistical teststo determine whether there is any reverse causality present.8
Existing literature
The notion that telecoms infrastructure is an important part ofSOC is not new. Various researchers beginning with Hardy 9 in1980, Norton10 in 1992 and others11 have all found that there isan “externality” component in enhanced fixed telecomspenetration – that is, GDP is higher, and growth faster incountries with more advanced telecoms networks. Of course, asnoted, one has to worry about reverse causality in richercountries; there, as income rises, demand for luxuries such as auniversal telephone service rises as well. Although these studiesdo not adjust for reverse causality, several facts bear out theexistence of the telecoms externality. First, Hardy examined bothradio and telephone rollouts, since if the telephone simplyprovides information, radio broadcasts might be goodalternatives. Hardy found no significant impact of radio rollout oneconomic growth, in contrast to telephones. Secondly,telephones (unlike radios, for example) have strong networkeffects – the value of a telephone to an individual increases withthe number of other telephone subscribers.
Hence, as networks grow, their social value rises. This suggeststhat the social return – the value to society of an additionalperson connected or of an additional dollar invested in thenetwork – exceeds the private return to the network provider, ifthat provider cannot price so as to extract these externalityvalues. The Roeller-Waverman paper shows strong network
Africa: The Impact of Mobile PhonesMoving the debate forward • The Vodafone Policy Paper Series • Number 2 • March 2005
15
effects. In the OECD in from 1970 to 1990, incrementalincreases in penetration rates below universal service levelsgenerated only small growth dividends. Only at near universalservice (30 mainline phones per 100 inhabitants which is near70 or so mainline phones per 100 households) were therestrong growth externalities from telephone rollout.
Several more recent papers extend this analysis to mobilephones – among these are Torero, Choudhary and Bedi 12 (2002)and Sridhar and Sridhar13 (2004). Several points need to bemade on this research. First, for economies without many fixedlines, or where mobiles supplement low fixed-line rollout, thereshould be no inherent difference in the growth dividend of aphone, whether it is mobile or fixed. In developing countries, anadditional phone, whether fixed or mobile, increases the smallnetwork size and adds to the economy’s growth potential.Secondly, where mobile phones complement fixed lines (inadvanced economies), their externality effects will probably bedifferent from those found for fixed lines. As individual lifestyleschange and as firms utilise mobiles in productivity-enhancingways, we should see new economic growth from mobilenetworks as well. For penetration rates of fixed lines are not 100percent in developed economies. For example, in the USA in1995, the penetration rate was 60 phones per 100 people.Mobile phones move the developed economies closer touniversal service because pre-pay contracts allow exactmonitoring of use, something very difficult to manage with fixed-line phones, making them accessible to other groups of users.
Some of the recent empirical studies specifically examine theimpact of mobile phone expansion on growth in developingcountries, using the Roeller-Waverman (RW) framework.Three caveats must be mentioned here. First, in many of thesecountries, growth has been low due to a host of issues – poorgovernance, lack of capital, low skill levels, and the like. It isdifficult to show that mobile telephony increases growth rateswhere growth is low. Secondly, advances in telecoms penetrationrates in developing countries are recent, so there is little realtrend as yet. Finally, since mobiles are so new, there has beenextremely rapid growth in mobile penetration starting from zero.Thus, if one tries to explain economic growth by changes incapital, labour, education and mobile phones, one could findeither that all economic growth is due to the explosive growth inmobile phones, or conversely that mobile phones decreasegrowth since their use increases so quickly with little underlyingeconomic growth occurring. Good econometrics requires carefulconsideration of underlying facts.
Sridhar and Sridhar (2004) apply the RW Framework to data for28 developing countries over the twelve-year period 1990 to2001. The average compounded annual growth rate (CAGR) ofGDP per capita in this period was minus 2.03 per cent, while theCAGR of mainlines was 6.60 and of mobile phones 78.0percent. In their regression, they find that mobile phones explainall growth – a 1 percent increase in mobile phone penetration
increases growth by 6.75 percent. Below, we provide our ownanalyses of the RW aggregate production function approach.We do find more plausible although still exceedingly highimpacts of mobile phones on growth. But the result is not robustto alternative specifications or to changes in countries includedin the sample, and we do not rely on these estimates to drawany conclusions. We provide the APF model also to show thedemand equation estimates – these are also most interesting,and robust.
The Aggregate Production Function
In order to estimate the impact of mobile phones in developingcountries, we gathered information from the World Bank’s WorldDevelopment Indicators (WDI) database for basic variables suchas GDP, population, labour force, capital stock and so on for both low-income and lower-middle-income countries. TheInternational Telecommunication Union (ITU) produces a WorldTelecommunications Indicators database, updated annually, andwe used this for data on our major telecoms-related variables –such as revenue, investment, and subscriber numbers. We alsorelied on the World Bank’s Governance Indicators, so that wecould incorporate some measures of institutional quality, whichmost certainly has an impact on growth. We included 38developing countries for which full data are available for theperiod we used, which is 1996 to 2003.14
The framework employed was a three-equation modification ofthe Roeller-Waverman approach. Appendix A provides furtherdetails. We summarise briefly the model that we used:
1. The Output equation models the level of output (GDP) as afunction of the total physical capital stock net of telecomscapital, the total labour force, a variable that captures theextent of the “rule of law”, and the mobile telecomspenetration rate. To account for the fact that output generallyincreases over time, we included a time trend term. We alsoincluded indicator variables capturing the level of externalindebtedness of the country (there were three levels – High,Medium and Low). Roeller and Waverman used a dummyvariable for each country (a so-called “fixed effects” or “LeastSquare Dummy Variables” approach). This variable controlsfor unobservable characteristics or omissions from theequation that are peculiar to each country; our approach hereis similar in spirit, since it captures the impact of particularcharacteristics (such as the indebtedness level) on output.15
2. The Demand equation models the level of mobile telecomspenetration as a function of income (the level of GDP percapita), mobile price (revenue per mobile subscriber), and thefixed-line price (which is revenue per fixed-line subscriber).The demand equation also allows for a time trend, sincedemand for a new product such as mobiles could alsofeature a strong trend.
Africa: The Impact of Mobile Phones Moving the debate forward • The Vodafone Policy Paper Series • Number 2 • March 2005
16
3. The Investment equation simplifies the Roeller-Waverman“supply” and “investment” equations. It assumes that thegrowth rate of mobile penetration depends on the price oftelecoms (the relationship should be positive since higherprices should invite additional supply), the geographic area(the relationship should be negative), and a time trend term.
We estimated the system of equations described above using theGeneralised Method of Moments (GMM) method.16 This approachuses all the exogenous variables in the system of equations (i.e.,those that we can reasonably assume are not determined by theother variables in the system, such as the amount of labour andthe amount of total capital) as “instruments” for the endogenousvariables (output, the level of mobile and fixed penetration, andthe mobile and fixed prices).17
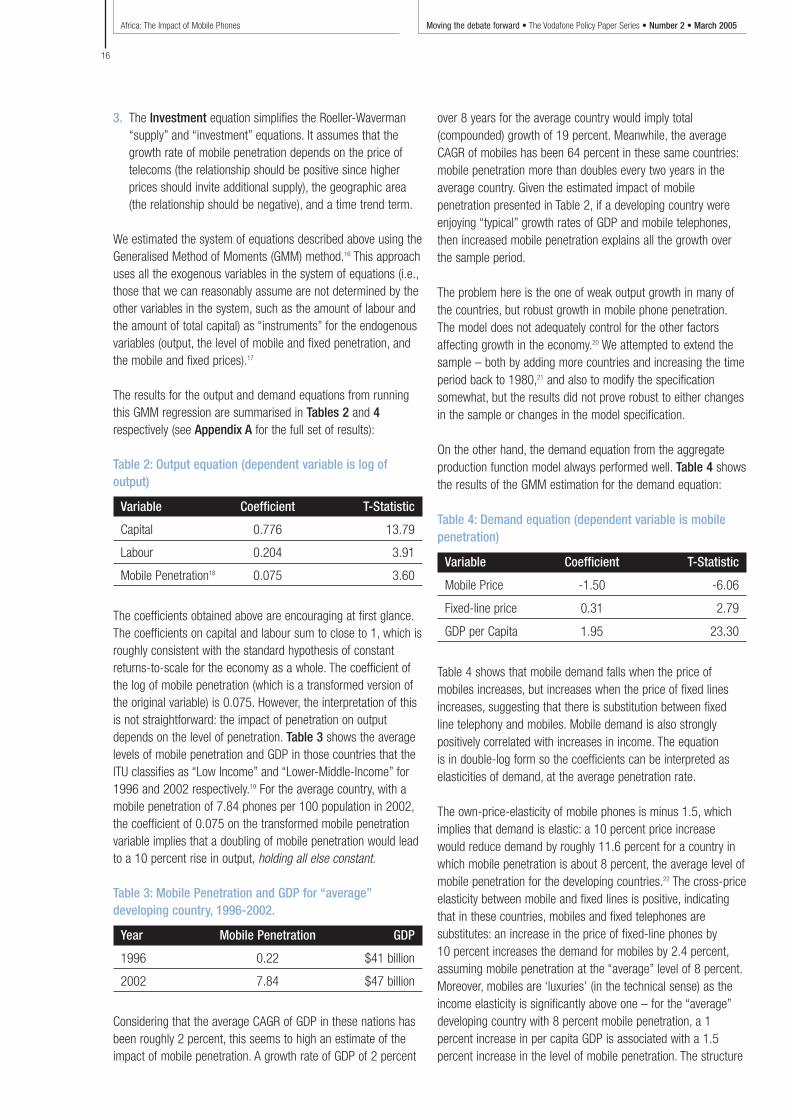
The results for the output and demand equations from runningthis GMM regression are summarised in Tables 2 and 4respectively (see Appendix A for the full set of results):
Table 2: Output equation (dependent variable is log ofoutput)
Variable Coefficient T-Statistic
Capital 0.776 13.79
Labour 0.204 3.91
Mobile Penetration18 0.075 3.60
The coefficients obtained above are encouraging at first glance.The coefficients on capital and labour sum to close to 1, which isroughly consistent with the standard hypothesis of constantreturns-to-scale for the economy as a whole. The coefficient ofthe log of mobile penetration (which is a transformed version ofthe original variable) is 0.075. However, the interpretation of thisis not straightforward: the impact of penetration on outputdepends on the level of penetration. Table 3 shows the averagelevels of mobile penetration and GDP in those countries that theITU classifies as “Low Income” and “Lower-Middle-Income” for1996 and 2002 respectively.19 For the average country, with amobile penetration of 7.84 phones per 100 population in 2002,the coefficient of 0.075 on the transformed mobile penetrationvariable implies that a doubling of mobile penetration would leadto a 10 percent rise in output, holding all else constant.
Table 3: Mobile Penetration and GDP for “average”developing country, 1996-2002.
Year Mobile Penetration GDP
1996 0.22 $41 billion
2002 7.84 $47 billion
Considering that the average CAGR of GDP in these nations hasbeen roughly 2 percent, this seems to high an estimate of theimpact of mobile penetration. A growth rate of GDP of 2 percent
over 8 years for the average country would imply total(compounded) growth of 19 percent. Meanwhile, the averageCAGR of mobiles has been 64 percent in these same countries:mobile penetration more than doubles every two years in theaverage country. Given the estimated impact of mobilepenetration presented in Table 2, if a developing country wereenjoying “typical” growth rates of GDP and mobile telephones,then increased mobile penetration explains all the growth overthe sample period.
The problem here is the one of weak output growth in many ofthe countries, but robust growth in mobile phone penetration.The model does not adequately control for the other factorsaffecting growth in the economy.20 We attempted to extend thesample – both by adding more countries and increasing the timeperiod back to 1980,21 and also to modify the specificationsomewhat, but the results did not prove robust to either changesin the sample or changes in the model specification.
On the other hand, the demand equation from the aggregateproduction function model always performed well. Table 4 showsthe results of the GMM estimation for the demand equation:
Table 4: Demand equation (dependent variable is mobilepenetration)
Variable Coefficient T-Statistic
Mobile Price -1.50 -6.06
Fixed-line price 0.31 2.79
GDP per Capita 1.95 23.30
Table 4 shows that mobile demand falls when the price ofmobiles increases, but increases when the price of fixed linesincreases, suggesting that there is substitution between fixedline telephony and mobiles. Mobile demand is also stronglypositively correlated with increases in income. The equation is in double-log form so the coefficients can be interpreted aselasticities of demand, at the average penetration rate.
The own-price-elasticity of mobile phones is minus 1.5, whichimplies that demand is elastic: a 10 percent price increasewould reduce demand by roughly 11.6 percent for a country inwhich mobile penetration is about 8 percent, the average level ofmobile penetration for the developing countries.22 The cross-priceelasticity between mobile and fixed lines is positive, indicatingthat in these countries, mobiles and fixed telephones aresubstitutes: an increase in the price of fixed-line phones by 10 percent increases the demand for mobiles by 2.4 percent,assuming mobile penetration at the “average” level of 8 percent.Moreover, mobiles are ‘luxuries’ (in the technical sense) as theincome elasticity is significantly above one – for the “average”developing country with 8 percent mobile penetration, a 1percent increase in per capita GDP is associated with a 1.5percent increase in the level of mobile penetration. The structure
Africa: The Impact of Mobile PhonesMoving the debate forward • The Vodafone Policy Paper Series • Number 2 • March 2005
17
of the demand equation is much simpler than that of the outputequation and since the equation deals with demand for oneparticular characteristic – mobile penetration – it is relativelyeasier to capture the factors that affect this demand than it is tocapture all the factors which serve to increase or reduce outputover time.
Ultimately, though, in light of the problems with the APFapproach, especially the significant difficulties of obtainingadequate data across a large group of developing countries, weturn to the endogenous growth model.
The Endogenous Growth model
We follow the work of Barro,23 who ran growth regressions for across-section of countries for the time period 1960 to 1985.The basic questions Barro was addressing were two-fold: wasthere ‘convergence’ between rates of growth between poorerand richer countries as economic theory predicts; and how diddifferences in skill levels affect growth rates? Barro took averagegrowth rates of per capita GDP for a cross-section of 98countries and regressed these growth rates against regressorswhich included initial levels of GDP per capita and human capitalstock,24 the average government consumption to GDP ratio forthe period 1970-1985, and measures of stability.25
Barro found that, conditional on the initial human capital stock,average GDP per capita growth was negatively correlated withinitial GDP per capita.26 Thus, all else equal, poorer countriesshould close the income gap with richer countries, albeit onlyover long periods of time. The initial level of human capital stockwas positively correlated with GDP per capita growth, socountries that were initially rich might actually grow faster thanpoorer countries if there were sizeable differences in their initialendowments of human capital. Only by controlling for thesedifferences could he verify that there is indeed economicconvergence between richer and poorer nations.
Our approach is similar. We took the average growth rate of percapita GDP from 1980 to 2003 as our dependent variable, andregressed this average growth rate on variables which includedthe initial level of GDP, the average ratio of investment to GDP,the stock of telecoms in 1980 (measured by the level of fixed-line penetration in 1980), the proportion of the 15-and-abovepopulation that had completed at least primary schooling in1980, and the average level of mobile penetration for the period1996 to 2003 (the period in which mobile penetration increasedrapidly). Our sample consisted of 92 countries – developing anddeveloped alike. The data came from the same sources – theWorld Development Indicators and the ITU – that we used for theAPF estimation.
We are not primarily examining the issue of ‘convergence’ inincome levels but instead in whether the increase in mobile
penetration increases growth rates, and whether it does soequally in rich and poor countries. As mobile growth starts inessentially the same recent period for all countries, rich and poor alike, this is an interesting and important question. Ourhypothesis is that increased mobile rollout should have a greatereffect in developing countries than in rich countries. The reasonis simple: while in developing countries the benefits of mobileare two-fold – the increase in the network effect of telecomsplus the advantage of mobility – in developed economies the firsteffect is much more muted.
In this model, there are no mobile phones in 1980, as there isfor other stock variables (e.g., we have proxied the stock ofhuman capital in 1980, and have included the stock of telecomcapital in 1980). We can assume that the 1980 levels of humanand telecom capital are exogenous – that is, they ought not tobe the result of income growth between 1980 and 2003.27
We cannot, however, assume that there is no reverse causalitybetween income growth in the 1980 to 2003 period and averagemobile penetration over a portion of the same period with quitethe same safety. Thus, mobile penetration is potentiallyendogenous, and we must examine whether or not this is so.
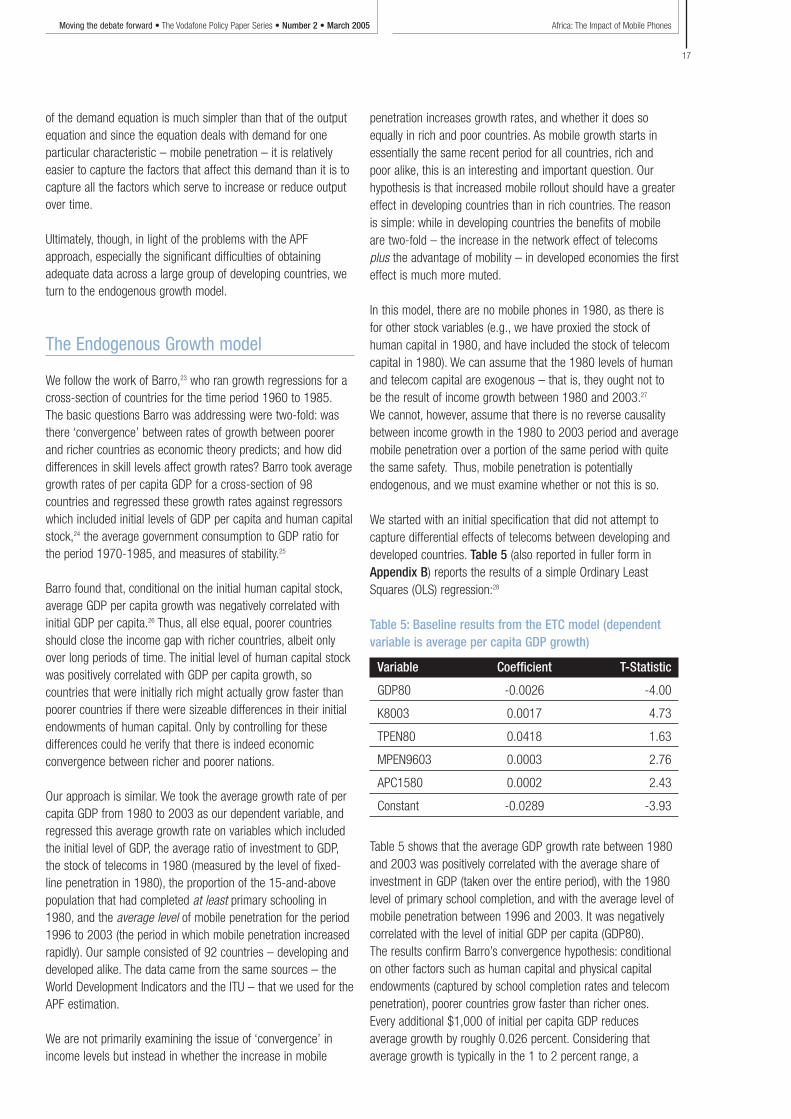
We started with an initial specification that did not attempt tocapture differential effects of telecoms between developing anddeveloped countries. Table 5 (also reported in fuller form inAppendix B) reports the results of a simple Ordinary LeastSquares (OLS) regression:28
Table 5: Baseline results from the ETC model (dependentvariable is average per capita GDP growth)
Variable Coefficient T-Statistic
GDP80 -0.0026 -4.00
K8003 0.0017 4.73
TPEN80 0.0418 1.63
MPEN9603 0.0003 2.76
APC1580 0.0002 2.43
Constant -0.0289 -3.93
Table 5 shows that the average GDP growth rate between 1980and 2003 was positively correlated with the average share ofinvestment in GDP (taken over the entire period), with the 1980level of primary school completion, and with the average level ofmobile penetration between 1996 and 2003. It was negativelycorrelated with the level of initial GDP per capita (GDP80).The results confirm Barro’s convergence hypothesis: conditionalon other factors such as human capital and physical capitalendowments (captured by school completion rates and telecompenetration), poorer countries grow faster than richer ones.Every additional $1,000 of initial per capita GDP reducesaverage growth by roughly 0.026 percent. Considering thataverage growth is typically in the 1 to 2 percent range, a
Africa: The Impact of Mobile Phones Moving the debate forward • The Vodafone Policy Paper Series • Number 2 • March 2005
18
$10,000 difference in initial per capita GDP would imply growththat would be 0.26 percent lower, which is a substantialdifference in the light of typical rates of growth.
The initial level of telecoms (i.e., fixed line) penetration was notsignificant in this model (TPEN80). However, the average level ofmobiles penetration (MPEN9603) was significant – a unitincrease in mobile penetration increased growth by 0.039percent, all else being equal. In line with Barro, the coefficient on primary school completion (APC1580) was positive and significant.
As mentioned above, we were concerned about a potentialproblem of endogeneity of the mobile penetration rate (as aregressor). We performed a Hausman test,29 which showed thatendogeneity was not likely to be an issue.30 (See Appendix B forfuller details of the IV estimates and the Hausman test).
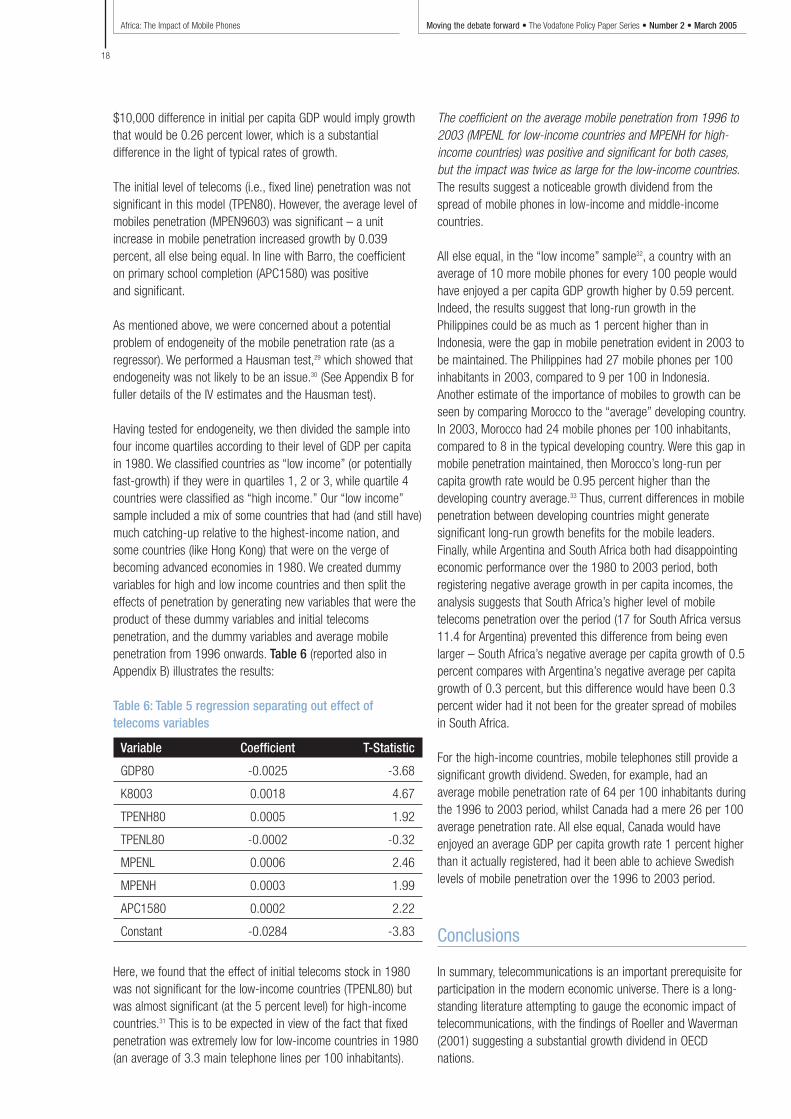
Having tested for endogeneity, we then divided the sample intofour income quartiles according to their level of GDP per capitain 1980. We classified countries as “low income” (or potentiallyfast-growth) if they were in quartiles 1, 2 or 3, while quartile 4countries were classified as “high income.” Our “low income”sample included a mix of some countries that had (and still have)much catching-up relative to the highest-income nation, andsome countries (like Hong Kong) that were on the verge ofbecoming advanced economies in 1980. We created dummyvariables for high and low income countries and then split theeffects of penetration by generating new variables that were theproduct of these dummy variables and initial telecomspenetration, and the dummy variables and average mobilepenetration from 1996 onwards. Table 6 (reported also inAppendix B) illustrates the results:
Table 6: Table 5 regression separating out effect oftelecoms variables
Variable Coefficient T-Statistic
GDP80 -0.0025 -3.68
K8003 0.0018 4.67
TPENH80 0.0005 1.92
TPENL80 -0.0002 -0.32
MPENL 0.0006 2.46
MPENH 0.0003 1.99
APC1580 0.0002 2.22
Constant -0.0284 -3.83
Here, we found that the effect of initial telecoms stock in 1980was not significant for the low-income countries (TPENL80) butwas almost significant (at the 5 percent level) for high-incomecountries.31 This is to be expected in view of the fact that fixedpenetration was extremely low for low-income countries in 1980(an average of 3.3 main telephone lines per 100 inhabitants).
The coefficient on the average mobile penetration from 1996 to2003 (MPENL for low-income countries and MPENH for high-income countries) was positive and significant for both cases,but the impact was twice as large for the low-income countries.The results suggest a noticeable growth dividend from thespread of mobile phones in low-income and middle-incomecountries.
All else equal, in the “low income” sample32, a country with anaverage of 10 more mobile phones for every 100 people wouldhave enjoyed a per capita GDP growth higher by 0.59 percent.Indeed, the results suggest that long-run growth in thePhilippines could be as much as 1 percent higher than inIndonesia, were the gap in mobile penetration evident in 2003 tobe maintained. The Philippines had 27 mobile phones per 100inhabitants in 2003, compared to 9 per 100 in Indonesia.Another estimate of the importance of mobiles to growth can beseen by comparing Morocco to the “average” developing country.In 2003, Morocco had 24 mobile phones per 100 inhabitants,compared to 8 in the typical developing country. Were this gap inmobile penetration maintained, then Morocco’s long-run percapita growth rate would be 0.95 percent higher than thedeveloping country average.33 Thus, current differences in mobilepenetration between developing countries might generatesignificant long-run growth benefits for the mobile leaders.Finally, while Argentina and South Africa both had disappointingeconomic performance over the 1980 to 2003 period, bothregistering negative average growth in per capita incomes, theanalysis suggests that South Africa’s higher level of mobiletelecoms penetration over the period (17 for South Africa versus11.4 for Argentina) prevented this difference from being evenlarger – South Africa’s negative average per capita growth of 0.5percent compares with Argentina’s negative average per capitagrowth of 0.3 percent, but this difference would have been 0.3percent wider had it not been for the greater spread of mobilesin South Africa.
For the high-income countries, mobile telephones still provide asignificant growth dividend. Sweden, for example, had anaverage mobile penetration rate of 64 per 100 inhabitants duringthe 1996 to 2003 period, whilst Canada had a mere 26 per 100average penetration rate. All else equal, Canada would haveenjoyed an average GDP per capita growth rate 1 percent higherthan it actually registered, had it been able to achieve Swedishlevels of mobile penetration over the 1996 to 2003 period.
Conclusions
In summary, telecommunications is an important prerequisite forparticipation in the modern economic universe. There is a long-standing literature attempting to gauge the economic impact oftelecommunications, with the findings of Roeller and Waverman(2001) suggesting a substantial growth dividend in OECDnations.
Africa: The Impact of Mobile PhonesMoving the debate forward • The Vodafone Policy Paper Series • Number 2 • March 2005
19
We have modelled the impact of mobile telecommunications inpoorer countries, since in these countries mobile phones arefulfilling the same role as fixed lines did previously in the OECDnations. Initially we attempted to use the Roeller-Wavermanframework, but data problems and econometric problems madeit difficult to get truly sensible estimates of the growth impact ofmobile telecommunications that were also robust to changes inthe sample and small changes in the specification of the model.We turned to a purely cross-sectional model that looked at long-term averages of growth, and our results were more robust andsensible than under the previous framework.34 They suggest thefollowing:
• Differences in the penetration and diffusion of mobiletelephony certainly appear to explain some of the differencesin growth rates between developing countries. If gaps inmobile telecoms penetration between countries persist, thenour results suggest that this gap will feed into a significantdifference in their growth rates in future.
• As Romer (1986) and Barro (1991) hypothesised for humancapital stocks, there are also increasing returns to theendowment of telecoms capital (as measured by the telecomspenetration rate).
• Given the speed with which mobile telecoms have spread indeveloping nations, it is unlikely that large gaps in penetrationwill persist for ever. However, differences in the speed ofadoption will affect the speed with which poor countriesconverge to rich countries’ level. Relative poverty still posesserious political problems, such as instability and increaseddemand for emigration. Our analysis suggests the need forregulatory policies that favour competition and encourage thespeediest possible rollout of mobile telephony.
Notes1 London Business School and LECG; John Cabot University and LECG; University of
Toronto and LECG. Funding for this research was provided by Vodafone and theLeverhulme Trust. We thank Kalyan Dasgupta for sterling assistance. We are indebted toMark Schankerman for suggesting the use of an endogenous growth approach.
2 These studies include Hardy (1980), Norton (1992), and Roeller and Waverman (2001).Full bibliographical details are given in footnotes 8, 9 and 3 respectively.
3 The “Networked Computer” is the focus of a major research programme at LondonBusiness School funded by the Leverhulme Trust.
4 Roeller, Lars-Hendrik and Waverman, Leonard. “Telecommunications Infrastructure andEconomic Development: A Simultaneous Approach.” American Economic Review, 2001,91(4), pp.909-23.
5 Geertz, Clifford. “The Bazaar Economy: Information and Search in Peasant Marketing.”American Economic Review, 1978, 68(2), pp.28-32.
6 See (for example) World Resources Institute. Digital Dividends Case Study: VodacomCommunity Phone Shops in South Africa, www.digitaldividend.org
7 In this, we follow the endogenous growth literature, which postulates increasing returns tohuman capital.
8 The data requirements of the full 4 equation APF model are much larger than for the oneequation endogenous growth model.
9 Hardy, Andrew. “The Role of the Telephone in Economic Development.”Telecommunications Policy, 1980, 4(4), pp. 278-86.
10 Norton, Seth W. “Transaction Costs, Telecommunications, and the Microeconomics ofMacroeconomic Growth.” Economic Development and Cultural Change, 1992, 41(1),pp. 175-96.
11 Among these others are Leff, Nathaniel H. “Externalities, Information Costs, and SocialBenefit-Cost Analysis for Economic Development: An Example from Telecommunications.”Economic Development and Cultural Change, 1984, 32(2), pp. 255-76. And Greenstein,Shane and Spiller, Pablo T. “Estimating the Welfare Effects of Digital Infrastructure.”National Bureau of Economic Research (Cambridge, MA) Working Paper No. 5770, 1996.
12 Torero, Maximo; Chowdhury, Shyamal and Bedi, Arjun S. “TelecommunicationsInfrastructure and Economic Growth: A Cross-Country Analysis.” Mimeo, 2002.
13 Sridhar, Kala S. and Sridhar, Varadharajan. “Telecommunications Infrastructure andEconomic Growth: Evidence from Developing Countries, National Institute of PublicFinance and Policy (New Delhi, India) Working Paper No. 14, 2004
14 Since the production function approach is so data-intensive, the sample used in thisregression consisted of 38 countries and 260 observations. Even from this sample, 95observations were eliminated in the course of the regression analysis due to missingdata. Of these 38 countries, 19 are low income countries (Bangladesh, Benin, Burkina-Faso, Central African Republic, Cote d’Ivoire, Gambia, India, Indonesia, Kenya, Lesotho,Madagascar, Mali, Mozambique, Myanmar, Nepal, Pakistan, Senegal, Tanzania andVietnam) and 19 are lower middle income countries (Armenia, Bolivia, Brazil, China,Colombia, Egypt, Fiji, Iran, Jordan, Morocco, Namibia, Peru, Philippines, South Africa, SriLanka, Swaziland, Thailand, Tunisia, and Turkey).
15 Because we had very few observations for some of the countries in the sample, a modelwith full fixed effects collapsed.
16 GMM estimation offers some advantages in terms of efficient estimation and ability tocorrect for serial correlation over other methods available for estimating a modelcomprised of a system of equations.
17 Instrumenting the endogenous variables essentially involves isolating that component ofthe given endogenous variable that is explained by the exogenous variables in the system(the “instruments”), and then using this component as a regressor.
18 Following Roeller-Waverman, we used a transformed and “unbounded” version of thepenetration variable, namely (PEN/0.35-PEN) in the regression analysis. We do so toincrease the range of the observed penetration rates.
19 It should be noted that this is a larger set of countries than we were able to include in ouractual regression analysis.
20 Appendix A shows the sign on the time-trend term is negative and statistically significant,implying that there is large-scale technological regression: unlikely and troublesome. Thisalso suggests that the mobile penetration rate variable is explaining too much growth.
21 Since there were no mobiles in 1980, we ran a model for the effects of total telecomspenetration with the demand equation adjusted so that both fixed lines and mobiledemand are estimated when mobile penetration is non-zero.
22 Since we use a transformed version of mobile penetration, the impact of an increase inGDP per capita or increase in the price level varies according to the level of mobilepenetration.
23 Barro, Robert J. “Economic Growth in a Cross Section of Countries.” The QuarterlyJournal of Economics, 1991, 106(2), pp. 407-43.
24 Measured by school enrolment rates in 1960.25 The average numbers of revolutions per year and assassinations per million population
during the sample period.26 Standard neoclassical growth theory predicts long-run convergence of income levels
between countries as richer, more capital-intensive countries run into the problem thatthe returns to capital diminish beyond a certain level of capital intensity. In the latergrowth literature, initiated by Romer (1986), there are increasing returns to particularfactors- such as human capital- that also play a significant role in determining the speedof convergence. See Romer, Paul M. “Increasing Returns and Long-Run Growth.” Journalof Political Economy, 1986, 94(5), pp.1002-37.
27 However, it is possible that these variables proxy for subsequent flows of income intohuman and telecom capital, a subtlety that Barro (1991) explored for human capital, andrejected.
28 All results are corrected for heteroscedasticity.29 Loosely speaking, the Hausman test computes the “distance” between an estimator that
is potentially inconsistent under the alternative hypothesis of endogeneity bias and onethat is always consistent. See Hausman, Jerry. “Specification Tests in Econometrics.”Econometrica, 1978, 46(2), pp. 1251-71.
30 In this context, the Hausman test compares the OLS estimates with estimates from aninstrumental variables regression (IV). We used average fixed line penetration between1960 and 1979 as an instrument for average mobiles penetration between 1996 and2003: the correlation coefficient between the two variables is 0.81.
31 This is also consistent with Roeller and Waverman (2001) who report an inability to deriveconsistent results for low-income countries.
32 Because data for more advanced countries is more widely available, and because we onlytreated the very advanced nations (top quartile) of 1980 as “high income”, our “lowincome” sample probably underweights the most underperforming developing country.Developing countries and overweights middle-income countries. Clearly, better dataavailability – particularly of historical data – would enable us to expand our sample andthereby gauge how robust our results really are.
33 It should be noted that Morocco is not part of the sample from which our results wereactually derived.
34 However, we need to examine whether our sample can be expanded, and while we havetested for the endogeneity of the mobile phones penetration variable, we still need toexamine some more subtle issues such as the potential endogeneity of some of the otherregressors. We also need to test for the possibility that some third factor (such asinstitutional quality) that we have not captured influences both growth and the level ofmobile penetration, thereby generating a spurious relationship between the two.
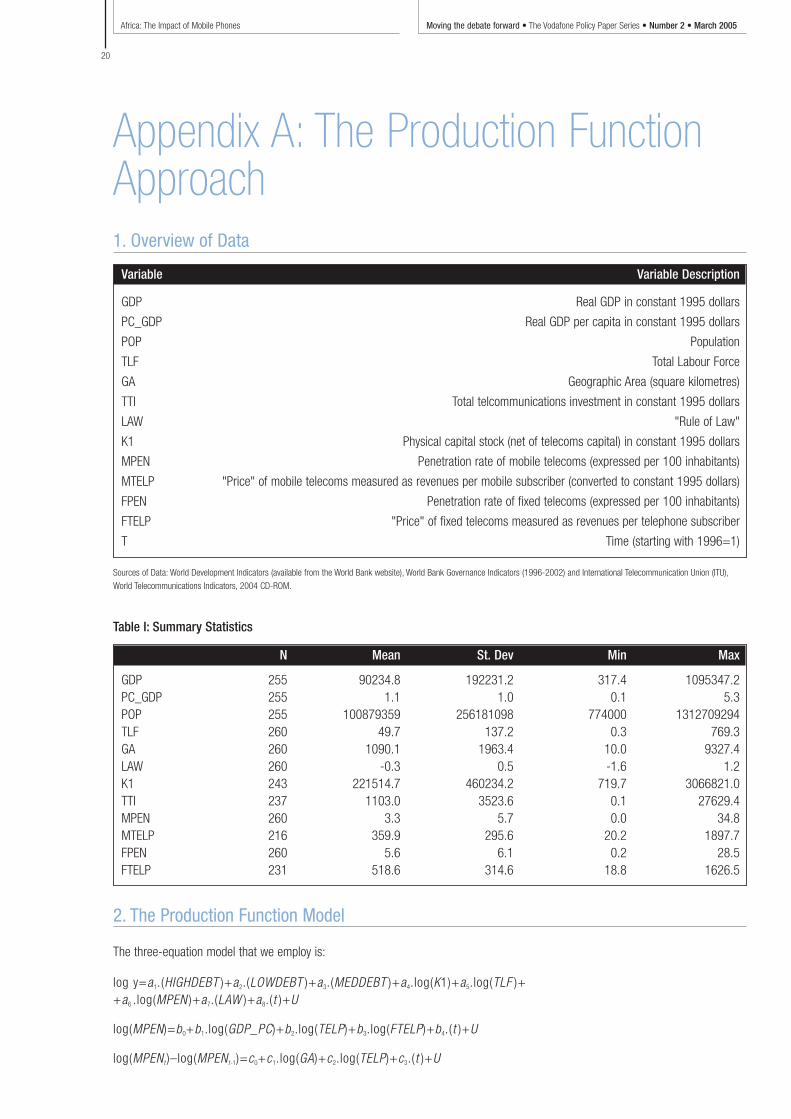
Africa: The Impact of Mobile Phones Moving the debate forward • The Vodafone Policy Paper Series • Number 2 • March 2005
20
Variable Variable Description
GDP Real GDP in constant 1995 dollars
PC_GDP Real GDP per capita in constant 1995 dollars
POP Population
TLF Total Labour Force
GA Geographic Area (square kilometres)
TTI Total telcommunications investment in constant 1995 dollars
LAW "Rule of Law"
K1 Physical capital stock (net of telecoms capital) in constant 1995 dollars
MPEN Penetration rate of mobile telecoms (expressed per 100 inhabitants)
MTELP "Price" of mobile telecoms measured as revenues per mobile subscriber (converted to constant 1995 dollars)
FPEN Penetration rate of fixed telecoms (expressed per 100 inhabitants)
FTELP "Price" of fixed telecoms measured as revenues per telephone subscriber
T Time (starting with 1996=1)
Appendix A: The Production FunctionApproach
Sources of Data: World Development Indicators (available from the World Bank website), World Bank Governance Indicators (1996-2002) and International Telecommunication Union (ITU),
World Telecommunications Indicators, 2004 CD-ROM.
1. Overview of Data
N Mean St. Dev Min Max
GDP 255 90234.8 192231.2 317.4 1095347.2PC_GDP 255 1.1 1.0 0.1 5.3POP 255 100879359 256181098 774000 1312709294TLF 260 49.7 137.2 0.3 769.3GA 260 1090.1 1963.4 10.0 9327.4LAW 260 -0.3 0.5 -1.6 1.2K1 243 221514.7 460234.2 719.7 3066821.0TTI 237 1103.0 3523.6 0.1 27629.4MPEN 260 3.3 5.7 0.0 34.8MTELP 216 359.9 295.6 20.2 1897.7FPEN 260 5.6 6.1 0.2 28.5FTELP 231 518.6 314.6 18.8 1626.5
Table I: Summary Statistics
2. The Production Function Model
The three-equation model that we employ is:
log y=a1.(HIGHDEBT )+a2.(LOWDEBT )+a3.(MEDDEBT )+a4.log(K1)+a5.log(TLF )++a6 .log(MPEN )+a7.(LAW )+a8.(t )+U
log(MPEN)=b0+b1.log(GDP_PC)+b2.log(TELP)+b3.log(FTELP)+b4.(t )+U
log(MPENt )–log(MPENt-1)=c0+c1.log(GA)+c2.log(TELP)+c3.(t )+U
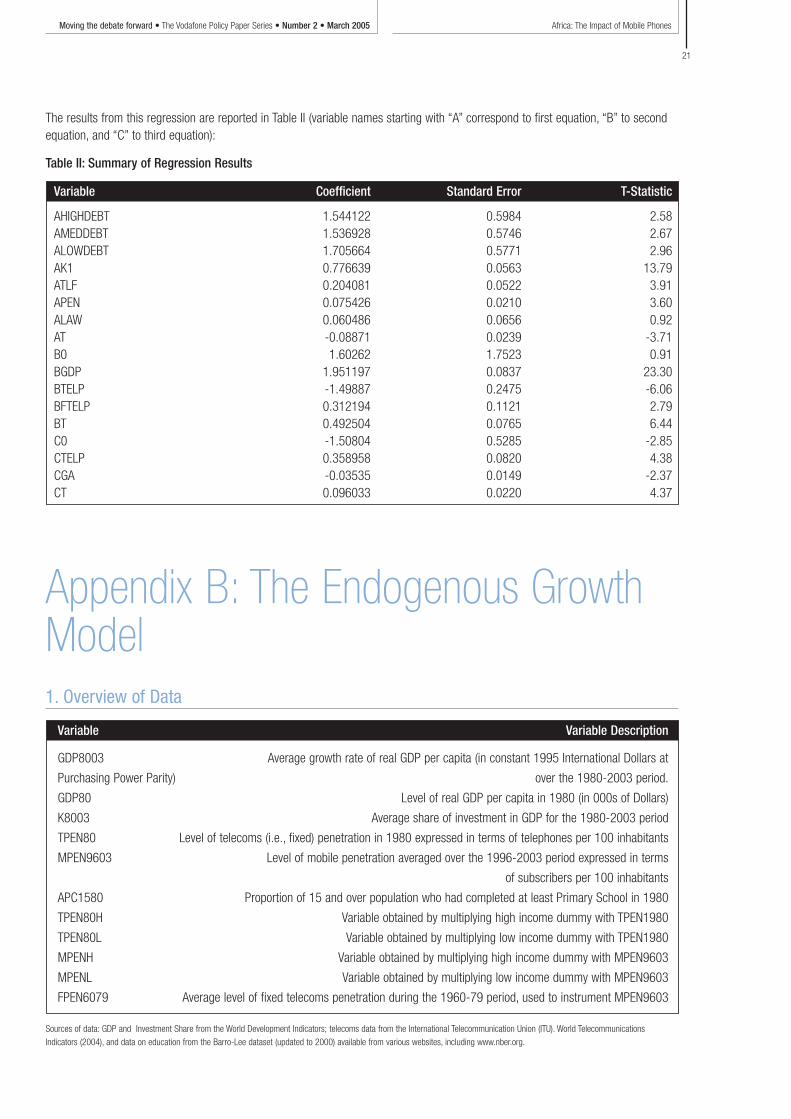
Africa: The Impact of Mobile PhonesMoving the debate forward • The Vodafone Policy Paper Series • Number 2 • March 2005
21
The results from this regression are reported in Table II (variable names starting with “A” correspond to first equation, “B” to secondequation, and “C” to third equation):
Variable Coefficient Standard Error T-Statistic
AHIGHDEBT 1.544122 0.5984 2.58AMEDDEBT 1.536928 0.5746 2.67ALOWDEBT 1.705664 0.5771 2.96AK1 0.776639 0.0563 13.79ATLF 0.204081 0.0522 3.91APEN 0.075426 0.0210 3.60ALAW 0.060486 0.0656 0.92AT -0.08871 0.0239 -3.71B0 1.60262 1.7523 0.91BGDP 1.951197 0.0837 23.30BTELP -1.49887 0.2475 -6.06BFTELP 0.312194 0.1121 2.79BT 0.492504 0.0765 6.44C0 -1.50804 0.5285 -2.85CTELP 0.358958 0.0820 4.38CGA -0.03535 0.0149 -2.37CT 0.096033 0.0220 4.37
Table II: Summary of Regression Results
Variable Variable Description
GDP8003 Average growth rate of real GDP per capita (in constant 1995 International Dollars at
Purchasing Power Parity) over the 1980-2003 period.
GDP80 Level of real GDP per capita in 1980 (in 000s of Dollars)
K8003 Average share of investment in GDP for the 1980-2003 period
TPEN80 Level of telecoms (i.e., fixed) penetration in 1980 expressed in terms of telephones per 100 inhabitants
MPEN9603 Level of mobile penetration averaged over the 1996-2003 period expressed in terms
of subscribers per 100 inhabitants
APC1580 Proportion of 15 and over population who had completed at least Primary School in 1980
TPEN80H Variable obtained by multiplying high income dummy with TPEN1980
TPEN80L Variable obtained by multiplying low income dummy with TPEN1980
MPENH Variable obtained by multiplying high income dummy with MPEN9603
MPENL Variable obtained by multiplying low income dummy with MPEN9603
FPEN6079 Average level of fixed telecoms penetration during the 1960-79 period, used to instrument MPEN9603
Appendix B: The Endogenous GrowthModel
Sources of data: GDP and Investment Share from the World Development Indicators; telecoms data from the International Telecommunication Union (ITU). World Telecommunications
Indicators (2004), and data on education from the Barro-Lee dataset (updated to 2000) available from various websites, including www.nber.org.
1. Overview of Data
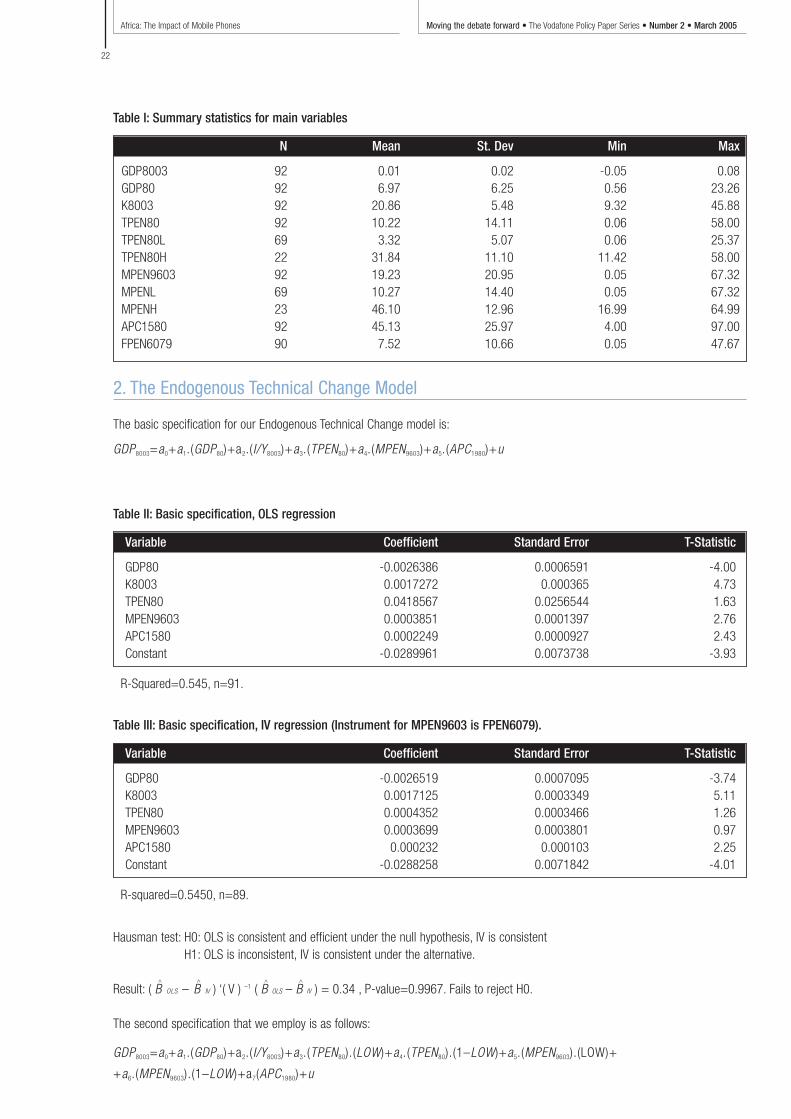
Africa: The Impact of Mobile Phones Moving the debate forward • The Vodafone Policy Paper Series • Number 2 • March 2005
22
N Mean St. Dev Min Max
GDP8003 92 0.01 0.02 -0.05 0.08GDP80 92 6.97 6.25 0.56 23.26K8003 92 20.86 5.48 9.32 45.88TPEN80 92 10.22 14.11 0.06 58.00TPEN80L 69 3.32 5.07 0.06 25.37TPEN80H 22 31.84 11.10 11.42 58.00MPEN9603 92 19.23 20.95 0.05 67.32MPENL 69 10.27 14.40 0.05 67.32MPENH 23 46.10 12.96 16.99 64.99APC1580 92 45.13 25.97 4.00 97.00FPEN6079 90 7.52 10.66 0.05 47.67
Table I: Summary statistics for main variables
2. The Endogenous Technical Change Model
The basic specification for our Endogenous Technical Change model is:
GDP8003=a0+a1.(GDP80)+a2.(I/Y8003)+a3.(TPEN80)+a4.(MPEN9603)+a5.(APC1980)+u
Hausman test: H0: OLS is consistent and efficient under the null hypothesis, IV is consistentH1: OLS is inconsistent, IV is consistent under the alternative.
Result: ( B^
OLS – B^
IV ) ‘( V ) –1 ( B^
OLS – B^
IV ) = 0.34 , P-value=0.9967. Fails to reject H0.
The second specification that we employ is as follows:
GDP8003=a0+a1.(GDP80)+a2.(I/Y8003)+a3.(TPEN80).(LOW)+a4.(TPEN80).(1–LOW)+a5.(MPEN9603).(LOW)+
+a6.(MPEN9603).(1–LOW)+a7(APC1980)+u
Variable Coefficient Standard Error T-Statistic
GDP80 -0.0026386 0.0006591 -4.00K8003 0.0017272 0.000365 4.73TPEN80 0.0418567 0.0256544 1.63MPEN9603 0.0003851 0.0001397 2.76APC1580 0.0002249 0.0000927 2.43Constant -0.0289961 0.0073738 -3.93
Table II: Basic specification, OLS regression
R-Squared=0.545, n=91.
Variable Coefficient Standard Error T-Statistic
GDP80 -0.0026519 0.0007095 -3.74K8003 0.0017125 0.0003349 5.11TPEN80 0.0004352 0.0003466 1.26MPEN9603 0.0003699 0.0003801 0.97APC1580 0.000232 0.000103 2.25Constant -0.0288258 0.0071842 -4.01
Table III: Basic specification, IV regression (Instrument for MPEN9603 is FPEN6079).
R-squared=0.5450, n=89.

Africa: The Impact of Mobile PhonesMoving the debate forward • The Vodafone Policy Paper Series • Number 2 • March 2005
23
Variable Coefficient Standard Error T-Statistic
GDP80 -0.0025463 0.000692 -3.68K8003 0.0016998 0.0003642 4.67TPENH80 0.0005329 0.0002769 1.92TPENL80 -0.0002023 0.000625 -0.32MPENL 0.0005942 0.0002414 2.46MPENH 0.0002924 0.0001466 1.99APC1580 0.0002127 0.0000959 2.22Constant -0.0284366 0.0074336 -3.83
Table IV: Regression with penetration effects split according to income group
R-squared=0.5501, n=91.
Note: Countries that were ranked in quartiles 1, 2 and 3according to GDP per capita in 1980 were “low” income,quartile 4 countries were “high” income.
Countries in the endogenous growthregression sample
Algeria, Argentina, Australia, Austria, Bahrain, Bangladesh,Barbados, Belgium, Benin, Bolivia, Botswana, Brazil, Bulgaria,Cameroon, Canada, Central African Republic, Chile, China,Colombia, Costa Rica, Cyprus, Denmark, Dominican Republic,Ecuador, Egypt, El Salvador, Fiji, Finland, France, The Gambia,Germany, Ghana, Greece, Guatemala, Honduras, Hong Kong,Hungary, Iceland, India, Indonesia, Iran, Ireland, Israel, Italy,Jamaica, Japan, Jordan, Kenya, Kuwait, Lesotho, Malawi,Malaysia, Mali, Mauritius, Mexico, Mozambique, Nepal,Netherlands, New Zealand, Nicaragua, Niger, Norway, Pakistan,Panama, Paraguay, Peru, Philippines, Portugal, Rwanda, Senegal,Sierra Leone, Singapore, South Africa, Spain, Sri Lanka, Sudan,Swaziland, Sweden, Switzerland, Syria, Thailand, Togo, Trinidadand Tobago, Tunisia, Turkey, United Kingdom, United States,Uruguay, Venezuela, Zaire/Congo (DR), Zambia, Zimbabwe.

Africa: The Impact of Mobile Phones Moving the debate forward • The Vodafone Policy Paper Series • Number 2 • March 2005
24
Introduction
Higher investment is central to achieving long-term sustainableeconomic growth and poverty reduction in developing countries.Foreign investors are often seen as an important source ofcapital finance and some types of foreign investment may alsobring spill-over benefits to the recipient country in the form oftransfer of skills, tax revenues and formal employment.Understanding the determinants of the level of foreigninvestment therefore has potentially important policyimplications.
In this study, we investigated the relationship between one typeof foreign investment – Foreign Direct Investment (FDI) – and thecharacteristics of the recipient countries. We have focused, inparticular, on the relationship between FDI flows into developingcountries and the penetration of mobile telecommunicationsnetworks in the recipient country. We found that both fixed andmobile communications networks, in addition to othercharacteristics including openness of the economy, GDP andinfrastructure, are positively linked with inward FDI; and theimpact of mobile has grown more significant in recent years.
The determinants of FDI
Capital flows from abroad fall into two categories: official financeand private finance. The private flows in turn can be divided intothree categories: loans from banks or other private sectorlenders; portfolio capital flows for the purchase of securities suchas bonds and equities; and foreign direct investment, overseascapital invested as equity in businesses in the recipient country.
FDI involves a long-term relationship between the investor andthe entity in which the investment is made and often includessome management control.1 In practice, FDI includes a range ofdifferent activities and transactions. The privatisation of state-owned firms in developing countries is often included, as areprogrammes of investment in branches or subsidiaries of
transnational corporations (TNCs). Another major type of FDIparticularly important in Africa is related to concessions forexploring and developing natural resources such as oil, gas ormineral reserves.
The volume of FDI varies significantly between countries andregions, as shown in Figure 1, with poorer regions generallyattracting the least inward investment.
Figure 1: Foreign direct investment, net inflows (% GDP, 2002)
Source: WDI (2004), Frontier Economics2
The country groupings in the figure are based on the following definitions: Least developed
countries, UN definition; Middle Income Countries, World Bank definition – GNI per capita
(2003) between $765 and $9,385;(Non-) OECD high income countries, World Bank definition
– GNI per capita (2003) greater than or equal to $9,386.
Even within these country groups there is substantial variation in the amount of FDI between countries. Figure 2 shows the FDI inflows for each of the countries included in this study.The sample includes 32 of the 48 countries in Sub-SaharanAfrica, and 39 other less developed countries.3
Frontier EconomicsMark WilliamsThanks to Reamonn Lydon and George Houpis who also
worked on this project.
Mobile networks and Foreign DirectInvestment in developing countries
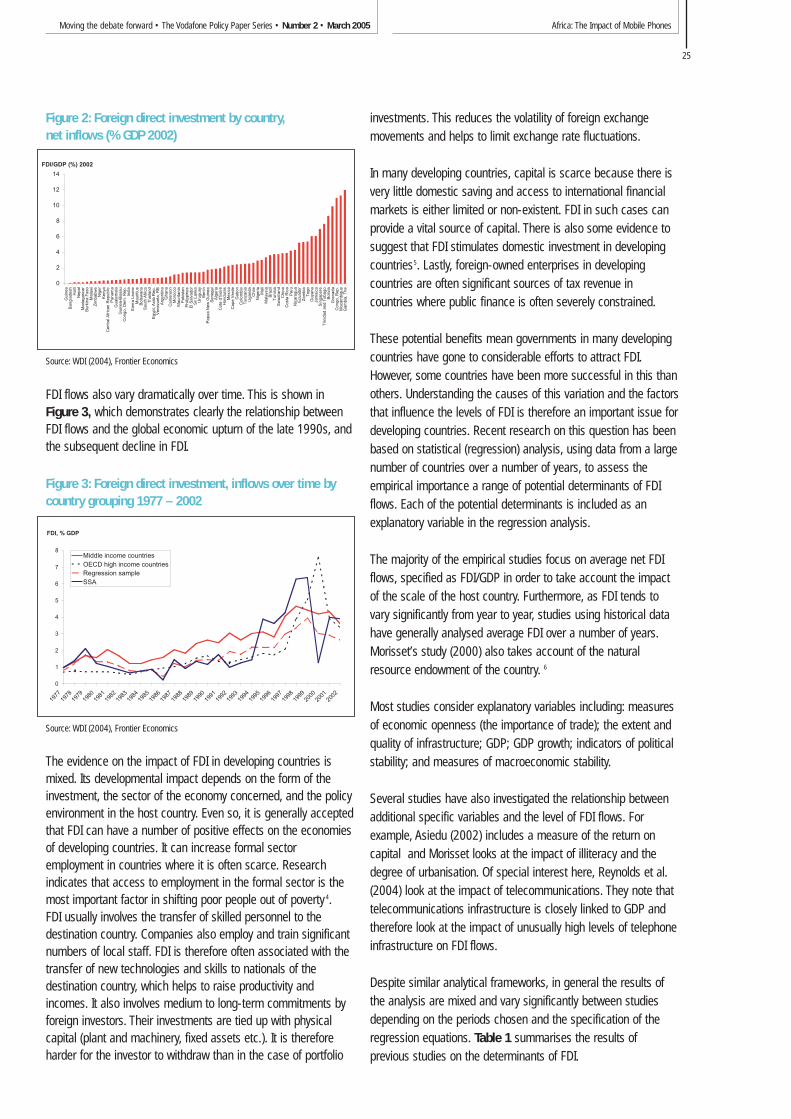
Africa: The Impact of Mobile PhonesMoving the debate forward • The Vodafone Policy Paper Series • Number 2 • March 2005
25
Figure 2: Foreign direct investment by country,net inflows (% GDP 2002)
Source: WDI (2004), Frontier Economics
FDI flows also vary dramatically over time. This is shown inFigure 3, which demonstrates clearly the relationship betweenFDI flows and the global economic upturn of the late 1990s, andthe subsequent decline in FDI.
Figure 3: Foreign direct investment, inflows over time bycountry grouping 1977 – 2002
Source: WDI (2004), Frontier Economics
The evidence on the impact of FDI in developing countries ismixed. Its developmental impact depends on the form of theinvestment, the sector of the economy concerned, and the policyenvironment in the host country. Even so, it is generally acceptedthat FDI can have a number of positive effects on the economiesof developing countries. It can increase formal sectoremployment in countries where it is often scarce. Researchindicates that access to employment in the formal sector is themost important factor in shifting poor people out of poverty 4.FDI usually involves the transfer of skilled personnel to thedestination country. Companies also employ and train significantnumbers of local staff. FDI is therefore often associated with thetransfer of new technologies and skills to nationals of thedestination country, which helps to raise productivity andincomes. It also involves medium to long-term commitments byforeign investors. Their investments are tied up with physicalcapital (plant and machinery, fixed assets etc.). It is thereforeharder for the investor to withdraw than in the case of portfolio
investments. This reduces the volatility of foreign exchangemovements and helps to limit exchange rate fluctuations.
In many developing countries, capital is scarce because there isvery little domestic saving and access to international financialmarkets is either limited or non-existent. FDI in such cases canprovide a vital source of capital. There is also some evidence tosuggest that FDI stimulates domestic investment in developingcountries5. Lastly, foreign-owned enterprises in developingcountries are often significant sources of tax revenue incountries where public finance is often severely constrained.
These potential benefits mean governments in many developingcountries have gone to considerable efforts to attract FDI.However, some countries have been more successful in this thanothers. Understanding the causes of this variation and the factorsthat influence the levels of FDI is therefore an important issue fordeveloping countries. Recent research on this question has beenbased on statistical (regression) analysis, using data from a largenumber of countries over a number of years, to assess theempirical importance a range of potential determinants of FDIflows. Each of the potential determinants is included as anexplanatory variable in the regression analysis.
The majority of the empirical studies focus on average net FDIflows, specified as FDI/GDP in order to take account the impactof the scale of the host country. Furthermore, as FDI tends tovary significantly from year to year, studies using historical datahave generally analysed average FDI over a number of years.Morisset’s study (2000) also takes account of the naturalresource endowment of the country. 6
Most studies consider explanatory variables including: measuresof economic openness (the importance of trade); the extent andquality of infrastructure; GDP; GDP growth; indicators of politicalstability; and measures of macroeconomic stability.
Several studies have also investigated the relationship betweenadditional specific variables and the level of FDI flows. Forexample, Asiedu (2002) includes a measure of the return oncapital and Morisset looks at the impact of illiteracy and thedegree of urbanisation. Of special interest here, Reynolds et al.(2004) look at the impact of telecommunications. They note thattelecommunications infrastructure is closely linked to GDP andtherefore look at the impact of unusually high levels of telephoneinfrastructure on FDI flows.
Despite similar analytical frameworks, in general the results ofthe analysis are mixed and vary significantly between studiesdepending on the periods chosen and the specification of theregression equations. Table 1 summarises the results ofprevious studies on the determinants of FDI.
0
2
4
6
8
10
12
14
Gui
nea
Ban
glad
esh
Hai
tiN
epal
Mad
agas
car
Bur
kina
Fas
oM
alaw
iZ
imba
bwe
Nig
erK
enya
Cen
tral
Afr
ican
Rep
ublic
Pan
ama
Gua
tem
ala
Gui
nea-
Bis
sau
Con
go, D
em. R
ep.
Indi
aS
ierr
a Le
one
Mau
ritiu
sB
otsw
ana
Sou
th A
fric
aT
haila
ndE
gypt
, Ara
b R
ep.
Ven
ezue
la, R
BA
rgen
tina
Gha
naC
amer
oon
Mor
occo
Mau
ritan
iaP
akis
tan
Phi
lippi
nes
El S
alva
dor
Sri
Lank
aU
rugu
ayB
enin
Pap
ua N
ew G
uine
aS
eneg
alA
lger
iaC
ote
d'Iv
oire
Hon
dura
sM
exic
oC
ape
Ver
deG
abon
Col
ombi
aT
anza
nia
Uga
nda
Chi
leN
iger
iaM
ali
Mal
aysi
aB
razi
lT
unis
iaS
waz
iland
Chi
naC
osta
Ric
aP
eru
Nic
arag
uaE
cuad
orZ
ambi
aT
ogo
Guy
ana
Jam
aica
Sin
gapo
reT
rinid
ad a
nd T
obag
oB
oliv
iaG
rena
daC
ongo
, Rep
.M
ozam
biqu
eG
ambi
a, T
he
FDI/GDP (%) 2002
0
1
2
3
4
5
6
7
8
1977
1978
1979
1980
1981
1982
1983
1984
1985
1986
1987
1988
1989
1990
1991
1992
1993
1994
1995
1996
1997
1998
1999
2000
2001
2002
FDI, % GDP
Middle income countriesOECD high income countriesRegression sampleSSA

Africa: The Impact of Mobile Phones Moving the debate forward • The Vodafone Policy Paper Series • Number 2 • March 2005
26
Table 1: Determinants of FDI
Source: Asiedu (2002)
Morrisset finds that GDP growth and trade openness have bothbeen correlated with FDI, over and above the impact of GDP andnatural resources. Political stability, illiteracy and infrastructure(as proxied by the number of telephone lines) are not significantin all specifications. Asiedu also finds that openness to trade ispositively associated with FDI and finds a positive relationshipbetween FDI and infrastructure in non-Sub Saharan Africa (SSA).She finds that FDI is generally lower in SSA than in other regionsand also finds that the effect of most of the other explanatoryvariables is lower in SSA than in non-SSA regions. Reynolds et al(2003) focus their analysis on the impact of telephone lines onFDI flows and find that having more mainlines than would beexpected, given the size of the economy, is linked to a higherlevel of FDI.
The variables which emerge as unambiguously positively relatedto FDI flows are economic openness and infrastructure (although
infrastructure is statistically insignificant in some studies). In all the cited studies, the quality and extent of infrastructure isproxied by the number of main telephone lines per 1000population. No research that we are aware of has attempted todisaggregate between the impact of the different types ofinfrastructure (e.g. transport, energy, communications). Bystudying the impact of mobile networks on FDI into developingcountries, our work is therefore a natural extension of the bodyof existing research.
Mobile networks and FDI in developingcountries
Mobile penetration in developing countries has increaseddramatically during the past 10 years, partly as a result of theliberalisation of telecommunications markets. This is shown inTable 2 and Figure 4.
Determinant of FDI/GDP Positive Negative Insignificant
Openness Edwards (1990)Gastanaga et al (1998)Hausmann and Fernadez-Arias (2000)
Infrastructure quality Wheeler and Mody (1992) Tsai (1994)Kumar (1994) Loree and Loree and Guisinger (1995)Guisinger (1995) Lipsey (1999)
Real GDP per capita Schneider and Frey (1985) Edwards (1990) Lore and Guisinger (1995)Tsai (1994) Lipsey (1999) Jaspersen, Aylward, Wei (2000) Hausmann and
and Knox (2000) Fernandez-Arias (2000)
Labour cost Wheeler and Mody (1992) Schneider and Tsai (1994)Frey (1985) Loree and Guisinger (1995)
Lipsey (1999)
Taxes and tariffs Loree and Guisinger (1995) Wheeler and Mody (1992)Gastanaga et al (1998) Lipsey (1999)Wei (2000)
Political instability Schneider and Frey (1985) Lore and Guisinger (1995)Edwards (1990) Jaspersen, Aylward,
and Knox (2000)Fernandez-Arias (2000)
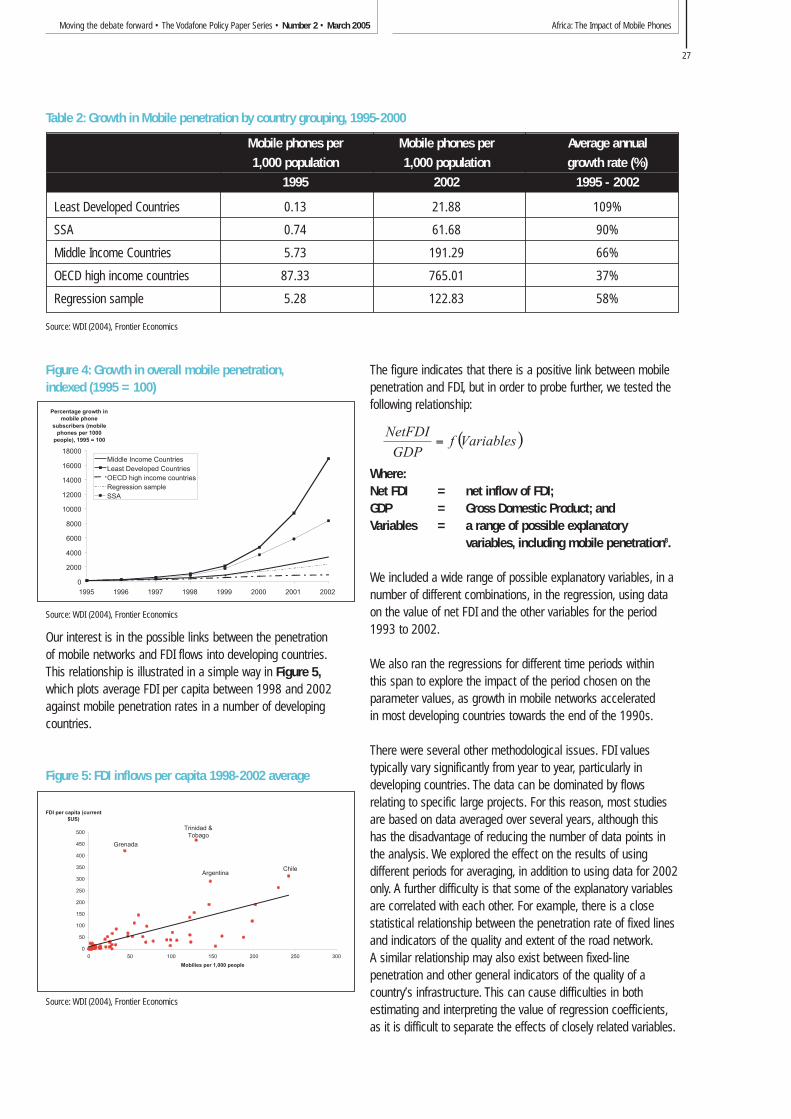
Africa: The Impact of Mobile PhonesMoving the debate forward • The Vodafone Policy Paper Series • Number 2 • March 2005
27
Figure 4: Growth in overall mobile penetration,indexed (1995 = 100)
Source: WDI (2004), Frontier Economics
Our interest is in the possible links between the penetration of mobile networks and FDI flows into developing countries.This relationship is illustrated in a simple way in Figure 5,which plots average FDI per capita between 1998 and 2002against mobile penetration rates in a number of developingcountries.
Figure 5: FDI inflows per capita 1998-2002 average
Source: WDI (2004), Frontier Economics
The figure indicates that there is a positive link between mobilepenetration and FDI, but in order to probe further, we tested thefollowing relationship:
Where:Net FDI = net inflow of FDI; GDP = Gross Domestic Product; andVariables = a range of possible explanatory
variables, including mobile penetration8.
We included a wide range of possible explanatory variables, in anumber of different combinations, in the regression, using dataon the value of net FDI and the other variables for the period1993 to 2002.
We also ran the regressions for different time periods withinthis span to explore the impact of the period chosen on theparameter values, as growth in mobile networks acceleratedin most developing countries towards the end of the 1990s.
There were several other methodological issues. FDI valuestypically vary significantly from year to year, particularly indeveloping countries. The data can be dominated by flowsrelating to specific large projects. For this reason, most studiesare based on data averaged over several years, although thishas the disadvantage of reducing the number of data points inthe analysis. We explored the effect on the results of usingdifferent periods for averaging, in addition to using data for 2002only. A further difficulty is that some of the explanatory variablesare correlated with each other. For example, there is a closestatistical relationship between the penetration rate of fixed linesand indicators of the quality and extent of the road network.A similar relationship may also exist between fixed-linepenetration and other general indicators of the quality of acountry’s infrastructure. This can cause difficulties in bothestimating and interpreting the value of regression coefficients,as it is difficult to separate the effects of closely related variables.
( )VariablesfGDP
NetFDI=
0
2000
4000
6000
8000
10000
12000
14000
16000
18000
1995 1996 1997 1998 1999 2000 2001 2002
Percentage growth in mobile phone
subscribers (mobile phones per 1000
people), 1995 = 100
Middle Income CountriesLeast Developed CountriesOECD high income countriesRegression sampleSSA
0
50
100
150
200
250
300
350
400
450
500
0 50 100 150 200 250 300
Mobilies per 1,000 people
FDI per capita (current $US)
Grenada
Trinidad & Tobago
ArgentinaChile
Table 2: Growth in Mobile penetration by country grouping, 1995-2000
Source: WDI (2004), Frontier Economics
Mobile phones per Mobile phones per Average annual1,000 population 1,000 population growth rate (%)
1995 2002 1995 - 2002
Least Developed Countries 0.13 21.88 109%
SSA 0.74 61.68 90%
Middle Income Countries 5.73 191.29 66%
OECD high income countries 87.33 765.01 37%
Regression sample 5.28 122.83 58%
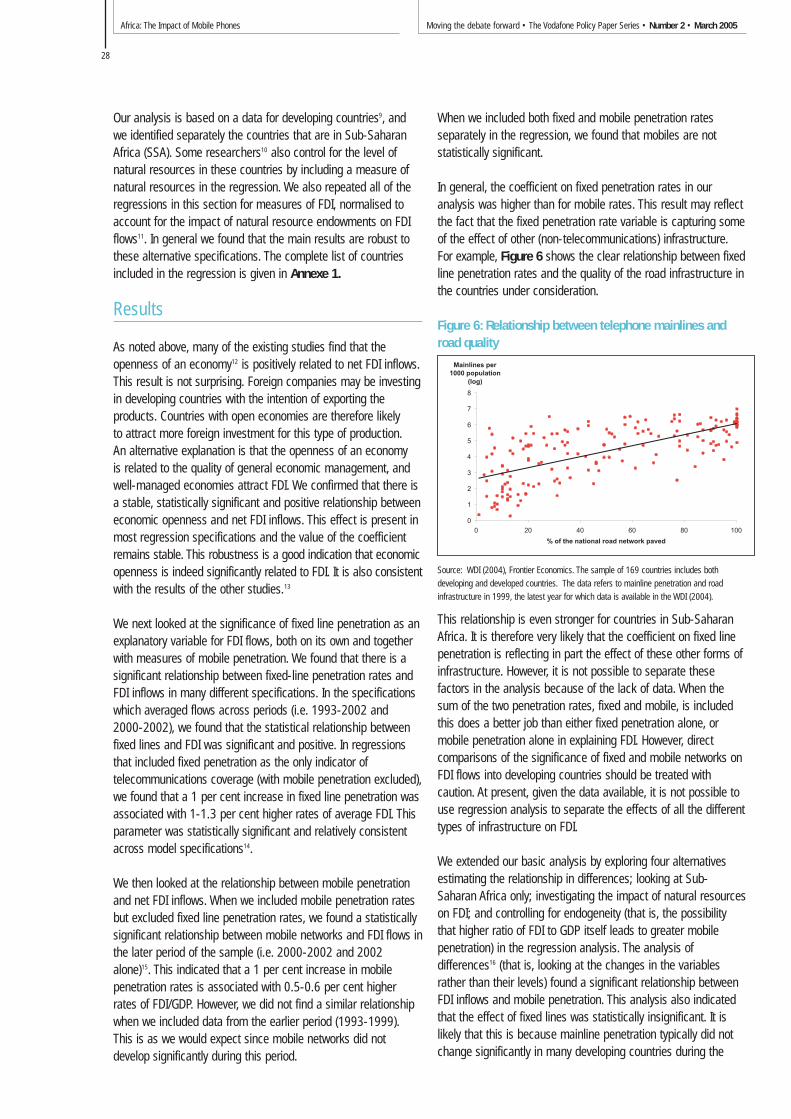
Africa: The Impact of Mobile Phones Moving the debate forward • The Vodafone Policy Paper Series • Number 2 • March 2005
28
Our analysis is based on a data for developing countries9, andwe identified separately the countries that are in Sub-SaharanAfrica (SSA). Some researchers10 also control for the level ofnatural resources in these countries by including a measure ofnatural resources in the regression. We also repeated all of theregressions in this section for measures of FDI, normalised toaccount for the impact of natural resource endowments on FDIflows11. In general we found that the main results are robust tothese alternative specifications. The complete list of countriesincluded in the regression is given in Annexe 1.
Results
As noted above, many of the existing studies find that theopenness of an economy12 is positively related to net FDI inflows.This result is not surprising. Foreign companies may be investingin developing countries with the intention of exporting theproducts. Countries with open economies are therefore likelyto attract more foreign investment for this type of production.An alternative explanation is that the openness of an economyis related to the quality of general economic management, andwell-managed economies attract FDI. We confirmed that there isa stable, statistically significant and positive relationship betweeneconomic openness and net FDI inflows. This effect is present inmost regression specifications and the value of the coefficientremains stable. This robustness is a good indication that economicopenness is indeed significantly related to FDI. It is also consistentwith the results of the other studies.13
We next looked at the significance of fixed line penetration as anexplanatory variable for FDI flows, both on its own and togetherwith measures of mobile penetration. We found that there is asignificant relationship between fixed-line penetration rates andFDI inflows in many different specifications. In the specificationswhich averaged flows across periods (i.e. 1993-2002 and 2000-2002), we found that the statistical relationship betweenfixed lines and FDI was significant and positive. In regressionsthat included fixed penetration as the only indicator oftelecommunications coverage (with mobile penetration excluded),we found that a 1 per cent increase in fixed line penetration wasassociated with 1-1.3 per cent higher rates of average FDI. Thisparameter was statistically significant and relatively consistentacross model specifications14.
We then looked at the relationship between mobile penetrationand net FDI inflows. When we included mobile penetration ratesbut excluded fixed line penetration rates, we found a statisticallysignificant relationship between mobile networks and FDI flows inthe later period of the sample (i.e. 2000-2002 and 2002alone)15. This indicated that a 1 per cent increase in mobilepenetration rates is associated with 0.5-0.6 per cent higherrates of FDI/GDP. However, we did not find a similar relationshipwhen we included data from the earlier period (1993-1999).This is as we would expect since mobile networks did notdevelop significantly during this period.
When we included both fixed and mobile penetration ratesseparately in the regression, we found that mobiles are notstatistically significant.
In general, the coefficient on fixed penetration rates in ouranalysis was higher than for mobile rates. This result may reflectthe fact that the fixed penetration rate variable is capturing someof the effect of other (non-telecommunications) infrastructure.For example, Figure 6 shows the clear relationship between fixedline penetration rates and the quality of the road infrastructure inthe countries under consideration.
Figure 6: Relationship between telephone mainlines androad quality
Source: WDI (2004), Frontier Economics. The sample of 169 countries includes both
developing and developed countries. The data refers to mainline penetration and road
infrastructure in 1999, the latest year for which data is available in the WDI (2004).
This relationship is even stronger for countries in Sub-SaharanAfrica. It is therefore very likely that the coefficient on fixed linepenetration is reflecting in part the effect of these other forms ofinfrastructure. However, it is not possible to separate thesefactors in the analysis because of the lack of data. When thesum of the two penetration rates, fixed and mobile, is includedthis does a better job than either fixed penetration alone, ormobile penetration alone in explaining FDI. However, directcomparisons of the significance of fixed and mobile networks onFDI flows into developing countries should be treated withcaution. At present, given the data available, it is not possible touse regression analysis to separate the effects of all the differenttypes of infrastructure on FDI.
We extended our basic analysis by exploring four alternativesestimating the relationship in differences; looking at Sub-Saharan Africa only; investigating the impact of natural resourceson FDI; and controlling for endogeneity (that is, the possibilitythat higher ratio of FDI to GDP itself leads to greater mobilepenetration) in the regression analysis. The analysis ofdifferences16 (that is, looking at the changes in the variablesrather than their levels) found a significant relationship betweenFDI inflows and mobile penetration. This analysis also indicatedthat the effect of fixed lines was statistically insignificant. It islikely that this is because mainline penetration typically did notchange significantly in many developing countries during the
0
1
2
3
4
5
6
7
8
0 20 40 60 80 100
% of the national road network paved
Mainlines per 1000 population
(log)
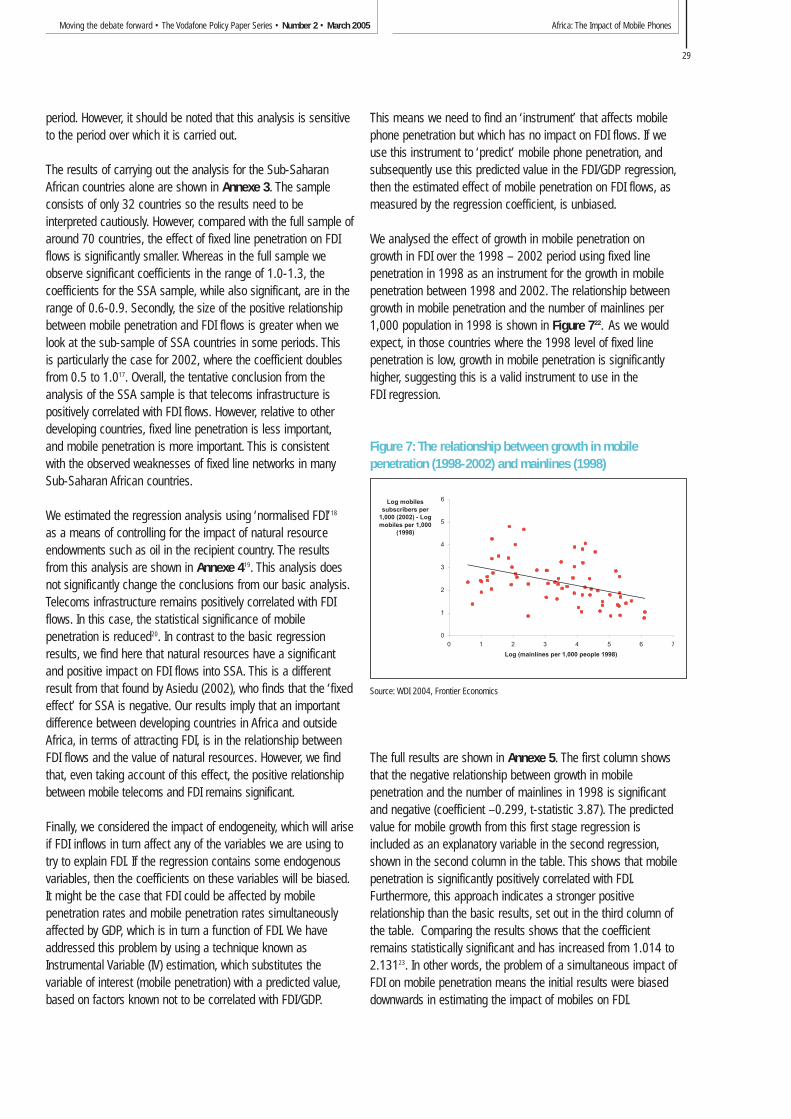
Africa: The Impact of Mobile PhonesMoving the debate forward • The Vodafone Policy Paper Series • Number 2 • March 2005
29
period. However, it should be noted that this analysis is sensitiveto the period over which it is carried out.
The results of carrying out the analysis for the Sub-SaharanAfrican countries alone are shown in Annexe 3. The sampleconsists of only 32 countries so the results need to beinterpreted cautiously. However, compared with the full sample ofaround 70 countries, the effect of fixed line penetration on FDIflows is significantly smaller. Whereas in the full sample weobserve significant coefficients in the range of 1.0-1.3, thecoefficients for the SSA sample, while also significant, are in therange of 0.6-0.9. Secondly, the size of the positive relationshipbetween mobile penetration and FDI flows is greater when welook at the sub-sample of SSA countries in some periods. Thisis particularly the case for 2002, where the coefficient doublesfrom 0.5 to 1.017. Overall, the tentative conclusion from theanalysis of the SSA sample is that telecoms infrastructure ispositively correlated with FDI flows. However, relative to otherdeveloping countries, fixed line penetration is less important,and mobile penetration is more important. This is consistentwith the observed weaknesses of fixed line networks in manySub-Saharan African countries.
We estimated the regression analysis using ‘normalised FDI’18
as a means of controlling for the impact of natural resourceendowments such as oil in the recipient country. The resultsfrom this analysis are shown in Annexe 419. This analysis does not significantly change the conclusions from our basic analysis.Telecoms infrastructure remains positively correlated with FDIflows. In this case, the statistical significance of mobilepenetration is reduced20. In contrast to the basic regressionresults, we find here that natural resources have a significantand positive impact on FDI flows into SSA. This is a differentresult from that found by Asiedu (2002), who finds that the ‘fixedeffect’ for SSA is negative. Our results imply that an importantdifference between developing countries in Africa and outsideAfrica, in terms of attracting FDI, is in the relationship betweenFDI flows and the value of natural resources. However, we findthat, even taking account of this effect, the positive relationshipbetween mobile telecoms and FDI remains significant.
Finally, we considered the impact of endogeneity, which will ariseif FDI inflows in turn affect any of the variables we are using totry to explain FDI. If the regression contains some endogenousvariables, then the coefficients on these variables will be biased.It might be the case that FDI could be affected by mobilepenetration rates and mobile penetration rates simultaneouslyaffected by GDP, which is in turn a function of FDI. We haveaddressed this problem by using a technique known asInstrumental Variable (IV) estimation, which substitutes thevariable of interest (mobile penetration) with a predicted value,based on factors known not to be correlated with FDI/GDP.
This means we need to find an ‘instrument’ that affects mobilephone penetration but which has no impact on FDI flows. If weuse this instrument to ‘predict’ mobile phone penetration, andsubsequently use this predicted value in the FDI/GDP regression,then the estimated effect of mobile penetration on FDI flows, asmeasured by the regression coefficient, is unbiased.
We analysed the effect of growth in mobile penetration ongrowth in FDI over the 1998 – 2002 period using fixed linepenetration in 1998 as an instrument for the growth in mobilepenetration between 1998 and 2002. The relationship betweengrowth in mobile penetration and the number of mainlines per1,000 population in 1998 is shown in Figure 722. As we wouldexpect, in those countries where the 1998 level of fixed linepenetration is low, growth in mobile penetration is significantlyhigher, suggesting this is a valid instrument to use in the FDI regression.
Figure 7: The relationship between growth in mobilepenetration (1998-2002) and mainlines (1998)
Source: WDI 2004, Frontier Economics
The full results are shown in Annexe 5. The first column showsthat the negative relationship between growth in mobilepenetration and the number of mainlines in 1998 is significantand negative (coefficient –0.299, t-statistic 3.87). The predictedvalue for mobile growth from this first stage regression isincluded as an explanatory variable in the second regression,shown in the second column in the table. This shows that mobilepenetration is significantly positively correlated with FDI.Furthermore, this approach indicates a stronger positiverelationship than the basic results, set out in the third column ofthe table. Comparing the results shows that the coefficientremains statistically significant and has increased from 1.014 to2.13123. In other words, the problem of a simultaneous impact ofFDI on mobile penetration means the initial results were biaseddownwards in estimating the impact of mobiles on FDI.
0
1
2
3
4
5
6
0 1 2 3 4 5 6 7
Log (mainlines per 1,000 people 1998)
Log mobiles subscribers per
1,000 (2002) - Log mobiles per 1,000
(1998)

Africa: The Impact of Mobile Phones Moving the debate forward • The Vodafone Policy Paper Series • Number 2 • March 2005
30
Conclusions
The flow of Foreign Direct Investment into developing countriesdepends on a number of variables, including the country’s GDP,the openness of the economy, and its infrastructure. In the caseof Sub-Saharan Africa, natural resources are an additionalexplanatory factor. We have extended earlier findings to showthat mobile telecommunications networks are also positivelycorrelated with FDI flows.
This relationship appears to be stable across different modelspecifications and the impact of mobile on FDI is moresignificant in recent years, as mobile penetration in developingcountries has increased dramatically. Taking account of the factthat mobile penetration may itself be boosted by higher GDPincreases the estimated impact of mobile on FDI. One naturalextension of the analysis would be to explore whether the growthof mobile networks is related to investment in particular sectorsbut sectoral FDI data are unavailable.
References
Asiedu, E. ‘On the Determinants of Foreign Direct Investment to Developing Countries: Is
Africa Different?’, World Development, Vol. 30, No.1 pp 107-119, 2002
Bosworth, B.P. and Collins, S.M. (1999), ‘Capital flows to developing economies: implications
for saving and investment’ Brookings Papers on Economic Activity: 1, Brookings Institution pp
143-169
Jenkins, C. & Thomas, L. ‘Foreign Direct Investment in Southern Africa: Determinants,
Characteristics and Implications for Economic Growth and Poverty Alleviation’, 2002
Morisset, J. ‘Foreign Direct Investment in Africa Policies Also Matter’, Transnational
Corporations Volume 9, Number 2, 2000
Reynolds, R., Kenny C., Liu J., Zhen-Wei Qiang, C. ‘Networking for foreign direct investment:
the telecommunications industry and its effect on investment’, Information Economics and
Policy Vol 16, 159-164, 2004
Notes1 The precise definitions of FDI vary between countries, usually according to the degree of
share-ownership that is involved.2 All the data used in this study comes from the World Development Indicators online
database, published annually by the World Bank.3 In constructing a sample of developing countries for the analysis that follows, we are
constrained by data availability. The full list of countries included in the analysis is shownin Annexe 1. The average income per capita for the countries included in the sample is$4,370 in 2002.
4 Jenkins and Thomas (2002)5 Bosworth and Collins (1999)6 Morisset does this by calculating a variable referred to as the Foreign Direct Investment
Climate. This is defined as FDI/(GDP*Natural Resource). This is formally equivalent toassuming that both GDP and the natural resource endowment are determinants of FDIwith an elasticity of one.
7 Since financial markets are either thin or non-existent in most developing countries, it isdifficult to directly measure the returns to capital. Asiedu uses as a proxy for ameasure of the returns to capital. The rationale for this is that GDP/capita is a proxy foreconomic output per worker. High GDP/capita is an indication that there are high levels ofcapital per worker in the country. This indicates that the returns to capital are relativelylow. In countries with a low GDP/capita, capital is relatively scarce which indicates thatthe returns to investment in capital are relatively high. is therefore a proxy for ameasure of the returns to capital.
8 Mobile penetration is measured as number of mobiles per 1000 people. A full descriptionof each of the variables used in the analysis, along with a detailed list of sources can befound in Annexe 6.
9 Our full sample of countries includes Low Income, Highly Indebted and Poor and Leastdeveloped countries as defined by the World Bank.
10 See, for example, Morisset (2000).11 We follow Morisset (2000), in normalising FDI flows by the value of natural resources in
the country in a given year. The value of natural resources is defined as the sum ofoutput in the primary (agriculture) and secondary (industry) sectors minus output in themanufacturing sector. Details of the industries included in the primary, secondary andmanufacturing sectors are given in Annexe 6. We have included the normalised measureof FDI flows as a dependent variable in some of the statistical analysis that follows.
12 Economic openness is defined as (Imports + Exports)/GDP.13 The regression results presented in Annexe 4, which include a normalised measure of FDI
as the dependent variable in order to control for the impact of natural resources, do notinclude either measures of openness or the return on investments (1/GDP) as explanatoryvariables. This is because the effects of these variables on FDI flows are already implicitlyincluded through the normalisation calculation.
14 This includes using residual values. These are residuals from a regression of fixed linepenetration on GDP/capita. This has the effect of removing the effect of collinearitybetween GDP and fixed line penetration. It can also be interpreted as being a measure ofcountries with ‘unexpectedly’ high rates of fixed-line penetration. This is the approachtaken by Reynolds et al (2004).
15 The coefficient on mobile penetration and the mobile penetration residual were significantat the 10% level for the 2000 – 02 averages. However, for 2002, only the mobilepenetration residual was significant at the 10% level.
16 This means that we investigated the relationship between the difference in FDI inflowsbetween 1998 and 2002 and the difference in the values of the explanatory variablesover the same period.
17 Not statistically significant in earlier periods in some specifications.18 Normalised for the value of natural resources in a country – see footnote 11.19 Note that because the dependent variable in this case is a measure of FDI flows
normalised by the product of GDP and the value of natural resources, the magnitude ofthe coefficients in Annexe 4 should not be directly compared with those in Annexe 2 and3. Furthermore, because natural resources, which account for a significant proportion oftrade, and GDP are implicitly included on the left-hand side of the regression, we dropthese variables from the right-hand side of the regression.
20 Mobile penetration is not statistically significant when included in the regression analysison its own or together with fixed penetration. However, the coefficients on the residualvalues of mobile penetration are significant and positive.
21 Page 108, italics in the original22 The changes shown in the figure are changes in log variables. If the changes in mobile
phone penetration over this period were small, then the log changes could be interpretedas percentage changes. However, growth in mobile phone penetration was significantduring this period, therefore the numbers on the Y-axis should not be interpreted aspercentage changes.
23 The implication of this is that the endogeneity was contributing to a negative bias in theestimate of the effect of mobile penetration on FDI.
1GDP / capita
1GDP / capita
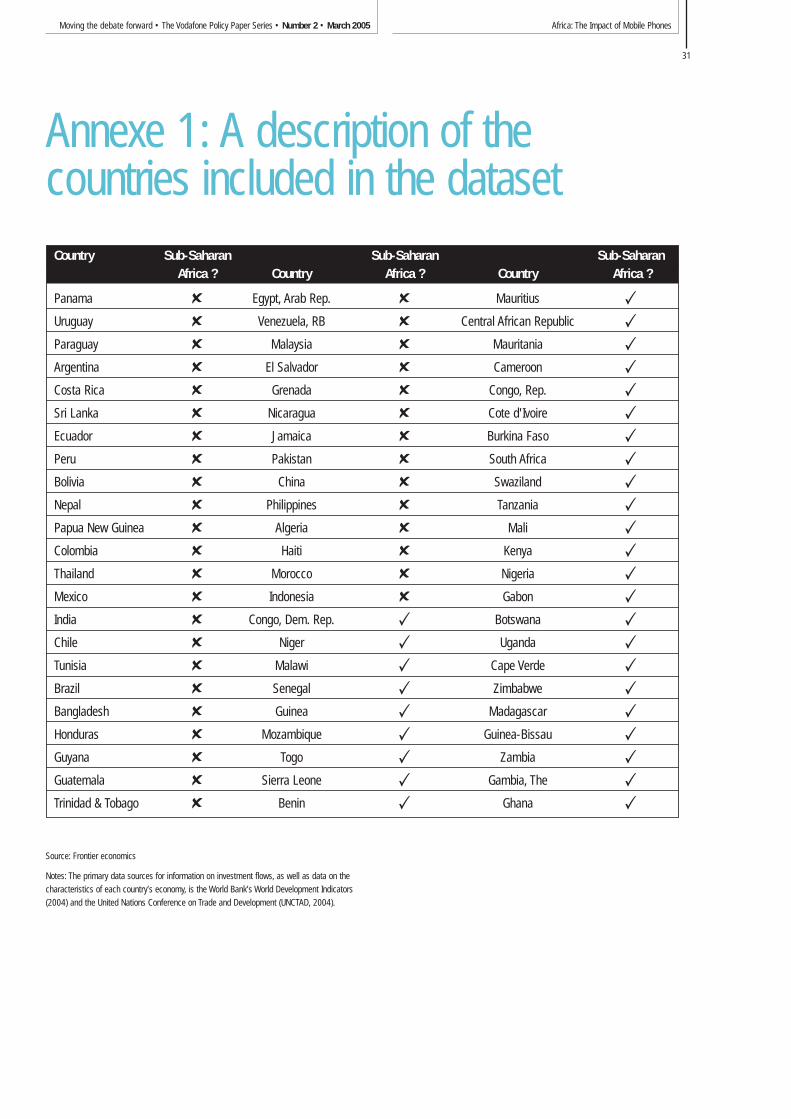
Africa: The Impact of Mobile PhonesMoving the debate forward • The Vodafone Policy Paper Series • Number 2 • March 2005
31
Source: Frontier economics
Notes: The primary data sources for information on investment flows, as well as data on the
characteristics of each country’s economy, is the World Bank’s World Development Indicators
(2004) and the United Nations Conference on Trade and Development (UNCTAD, 2004).
Country Sub-Saharan Sub-Saharan Sub-SaharanAfrica ? Country Africa ? Country Africa ?
Panama ✘ Egypt, Arab Rep. ✘ Mauritius ✓
Uruguay ✘ Venezuela, RB ✘ Central African Republic ✓
Paraguay ✘ Malaysia ✘ Mauritania ✓
Argentina ✘ El Salvador ✘ Cameroon ✓
Costa Rica ✘ Grenada ✘ Congo, Rep. ✓
Sri Lanka ✘ Nicaragua ✘ Cote d'Ivoire ✓
Ecuador ✘ Jamaica ✘ Burkina Faso ✓
Peru ✘ Pakistan ✘ South Africa ✓
Bolivia ✘ China ✘ Swaziland ✓
Nepal ✘ Philippines ✘ Tanzania ✓
Papua New Guinea ✘ Algeria ✘ Mali ✓
Colombia ✘ Haiti ✘ Kenya ✓
Thailand ✘ Morocco ✘ Nigeria ✓
Mexico ✘ Indonesia ✘ Gabon ✓
India ✘ Congo, Dem. Rep. ✓ Botswana ✓
Chile ✘ Niger ✓ Uganda ✓
Tunisia ✘ Malawi ✓ Cape Verde ✓
Brazil ✘ Senegal ✓ Zimbabwe ✓
Bangladesh ✘ Guinea ✓ Madagascar ✓
Honduras ✘ Mozambique ✓ Guinea-Bissau ✓
Guyana ✘ Togo ✓ Zambia ✓
Guatemala ✘ Sierra Leone ✓ Gambia, The ✓
Trinidad & Tobago ✘ Benin ✓ Ghana ✓
Annexe 1: A description of thecountries included in the dataset

Afric
a:Th
e Im
pact
of M
obile
Pho
nes
Mov
ing
the
deba
te fo
rwar
d•
The
Voda
fone
Pol
icy
Pape
r Ser
ies
• Nu
mbe
r 2•
Mar
ch 2
005
32
Afric
a:Th
e Im
pact
of M
obile
Pho
nes
Mov
ing
the
deba
te fo
rwar
d•
The
Voda
fone
Pol
icy
Pape
r Ser
ies
• Nu
mbe
r 2•
Mar
ch 2
005
33
Spec
ifica
tion
(1)
(2)
(3)
(4)
(5)
(6)
(7)
(8)
(9)
(10)
(11)
(12)
(13)
(14)
(15)
(16)
(17)
(18)
Open
=((i
mpo
rts0.
026
0.01
80.
020
0.02
60.
019
0.02
20.
027
0.02
00.
021
0.02
60.
019
0.02
20.
031
0.02
30.
025
0.03
10.
023
0.02
5+
expo
rts)/G
DP)
(3.7
2)**
(2.1
9)*
(2.5
2)*
(3.9
9)**
(2.3
9)*
(2.4
9)*
(3.8
0)**
(2.5
1)*
(2.9
0)**
(3.8
6)**
(2.3
7)*
(2.5
0)*
(3.9
5)**
(2.4
7)*
(2.7
4)**
(3.8
6)**
(2.5
8)*
(2.8
5)**
Log
(fixe
d +
mob
ile1.
507
1.47
71.
395
subs
crib
ers)
(3
.68)
**(2
.81)
**(2
.43)
*
Log
(fixe
d lin
es
1.29
31.
035
0.90
61.
366
1.01
90.
890
per 1
000
peop
le)
(3.3
6)**
(2.2
9)*
(1.6
1)(3
.11)
**(2
.18)
*(1
.56)
Log
(fixe
d lin
es p
er 1
000
1.23
31.
131
1.32
2Pe
ople
),re
sidu
al**
* (3
.49)
**(2
.91)
**(2
.81)
**
Log
(Mob
ile s
ubsc
riber
s)
-0.0
130.
370
0.35
60.
234
0.57
70.
512
(0.0
5)(1
.12)
(1.0
7)(0
.89)
(1.7
5)+
(1.4
9)
Log
(mob
ile s
ubsc
riber
s,0.
253
0.51
40.
570
resi
dual
)(1
.03)
(1.8
8)+
(1.8
2)+
Log
(1/G
DP p
er c
apita
) 1.
622
1.37
31.
562
1.34
00.
840
0.98
6-0
.108
-0.2
230.
042
1.42
61.
348
1.47
80.
285
0.54
80.
739
0.02
8-0
.077
0.20
3(2
.83)
**(2
.03)
*(2
.03)
*(2
.53)
*(1
.47)
(1.4
0)(0
.38)
(0.8
9)(0
.16)
(2.5
1)*
(2.1
2)*
(1.9
3)+
(0.5
6)(0
.99)
(1.2
2)(0
.09)
(0.2
8)(0
.68)
Dum
my
varia
ble
for S
SA
-0.5
120.
158
0.24
8-0
.459
0.40
10.
433
-0.7
37-0
.054
0.12
7-0
.382
0.37
40.
398
-1.4
51-0
.532
-0.3
97-1
.460
-0.5
48-0
.431
(0.8
8)(0
.25)
(0.3
5)(0
.78)
(0.5
3)(0
.52)
(1.3
2)(0
.09)
(0.2
1)(0
.61)
(0.4
9)(0
.47)
(2.2
3)*
(0.9
1)(0
.63)
(2.2
5)*
(0.9
4)(0
.71)
Cons
tant
6.
886
4.55
15.
762
6.04
83.
397
4.42
00.
322
-0.2
301.
223
6.42
65.
719
6.66
62.
665
3.15
74.
243
1.31
90.
813
2.36
8(2
.37)
*(1
.59)
(1.7
6)+
(2.1
4)*
(1.2
3)(1
.33)
(0.1
6)(0
.13)
(0.6
2)(1
.98)
+(1
.80)
+(1
.79)
+(0
.77)
(1.0
3)(1
.27)
(0.5
5)(0
.40)
(1.0
7)
Perio
dAv
erag
eAv
erag
eAv
erag
eAv
erag
eAv
erag
eAv
erag
eAv
erag
eAv
erag
eAv
erag
eAv
erag
eAv
erag
eAv
erag
eAv
erag
eAv
erag
eAv
erag
eAv
erag
eAv
erag
eAv
erag
e19
93-2
002
2000
-200
220
0219
93-2
002
2000
-200
220
0219
93-2
002
2000
-200
220
0219
93-2
002
2000
-200
220
0219
93-2
002
2000
-200
220
0219
93-2
002
2000
-200
220
02
Obse
rvat
ions
6968
6869
6868
6968
6868
6767
6867
6768
6767
R-sq
uare
d0.
420.
260.
190.
420.
240.
160.
420.
260.
220.
420.
270.
190.
330.
210.
160.
330.
220.
18
Robu
st t
stat
istic
s in
par
enth
eses
+ s
igni
fican
t at 1
0%; *
sig
nific
ant a
t 5%
; **
sign
ifica
nt a
t 1%
Anne
xe 2
:Re
gres
sion
resu
lts fo
r all
coun
tries
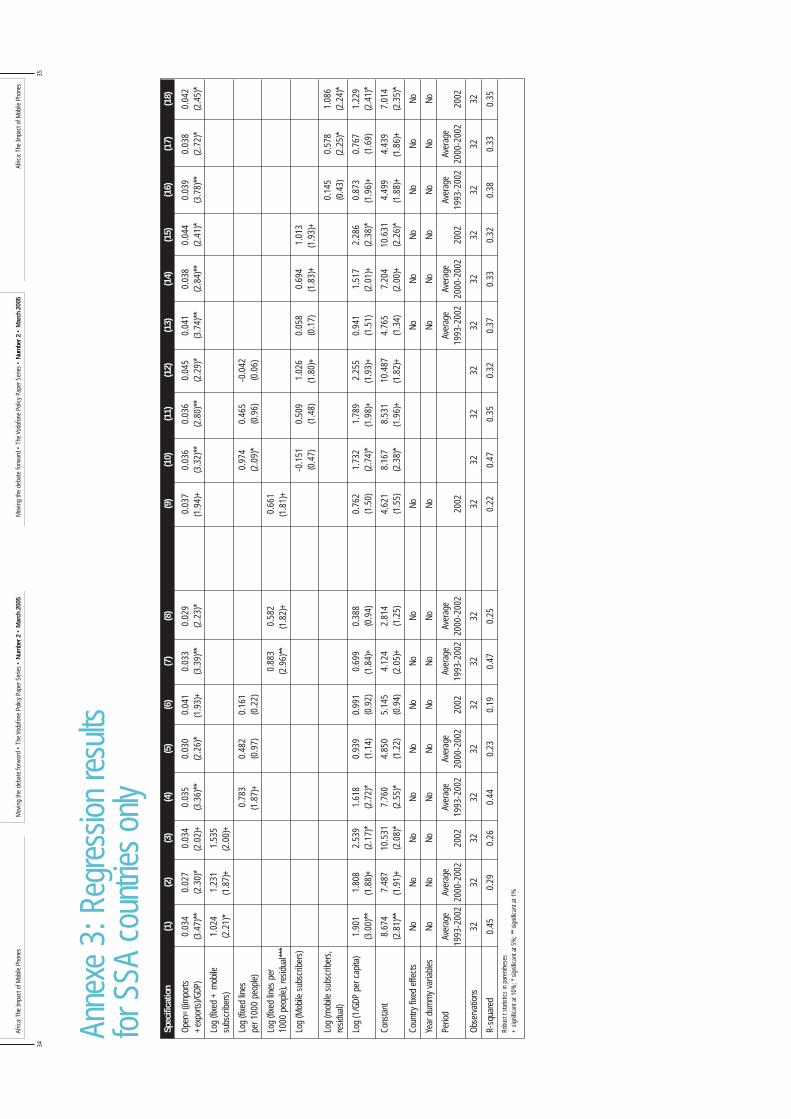
Afric
a:Th
e Im
pact
of M
obile
Pho
nes
Mov
ing
the
deba
te fo
rwar
d•
The
Voda
fone
Pol
icy
Pape
r Ser
ies
• Nu
mbe
r 2•
Mar
ch 2
005
34
Afric
a:Th
e Im
pact
of M
obile
Pho
nes
Mov
ing
the
deba
te fo
rwar
d•
The
Voda
fone
Pol
icy
Pape
r Ser
ies
• Nu
mbe
r 2•
Mar
ch 2
005
35
Spec
ifica
tion
(1)
(2)
(3)
(4)
(5)
(6)
(7)
(8)
(9)
(10)
(11)
(12)
(13)
(14)
(15)
(16)
(17)
(18)
Open
=((i
mpo
rts0.
034
0.02
70.
034
0.03
50.
030
0.04
10.
033
0.02
90.
037
0.03
60.
036
0.04
50.
041
0.03
80.
044
0.03
90.
038
0.04
2+
expo
rts)/G
DP)
(3.4
7)**
(2.3
0)*
(2.0
2)+
(3.3
6)**
(2.2
6)*
(1.9
3)+
(3.3
9)**
(2.2
3)*
(1.9
4)+
(3.3
2)**
(2.8
0)**
(2.2
9)*
(3.7
4)**
(2.8
4)**
(2.4
1)*
(3.7
8)**
(2.7
2)*
(2.4
5)*
Log
(fixe
d +
mob
ile
1.02
41.
231
1.53
5su
bscr
iber
s)(2
.21)
*(1
.87)
+(2
.00)
+
Log
(fixe
d lin
es
0.78
30.
482
0.16
10.
974
0.46
5-0
.042
per 1
000
peop
le)
(1.8
7)+
(0.9
7)(0
.22)
(2.0
9)*
(0.9
6)(0
.06)
Log
(fixe
d lin
es p
er
0.88
30.
582
0.66
110
00 p
eopl
e),r
esid
ual**
*(2
.96)
**(1
.82)
+(1
.81)
+
Log
(Mob
ile s
ubsc
riber
s)-0
.151
0.50
91.
026
0.05
80.
694
1.01
3(0
.47)
(1.4
8)(1
.80)
+(0
.17)
(1.8
3)+
(1.9
3)+
Log
(mob
ile s
ubsc
riber
s,0.
145
0.57
81.
086
resi
dual
)(0
.43)
(2.2
5)*
(2.2
4)*
Log
(1/G
DP p
er c
apita
)1.
901
1.80
82.
539
1.61
80.
939
0.99
10.
699
0.38
80.
762
1.73
21.
789
2.25
50.
941
1.51
72.
286
0.87
30.
767
1.22
9(3
.00)
**(1
.88)
+(2
.17)
*(2
.72)
*(1
.14)
(0.9
2)(1
.84)
+(0
.94)
(1.5
0)(2
.74)
*(1
.98)
+(1
.93)
+(1
.51)
(2.0
1)+
(2.3
8)*
(1.9
6)+
(1.6
9)(2
.41)
*
Cons
tant
8.67
47.
487
10.5
317.
760
4.85
05.
145
4.12
42.
814
4.62
18.
167
8.53
110
.487
4.76
57.
204
10.6
314.
499
4.43
97.
014
(2.8
1)**
(1.9
1)+
(2.0
8)*
(2.5
5)*
(1.2
2)(0
.94)
(2.0
5)+
(1.2
5)(1
.55)
(2.3
8)*
(1.9
6)+
(1.8
2)+
(1.3
4)(2
.00)
+(2
.26)
*(1
.88)
+(1
.86)
+(2
.35)
*
Coun
try fi
xed
effe
cts
NoNo
NoNo
NoNo
NoNo
NoNo
NoNo
NoNo
No
Year
dum
my
varia
bles
NoNo
NoNo
NoNo
NoNo
NoNo
NoNo
NoNo
No
Perio
dAv
erag
eAv
erag
eAv
erag
eAv
erag
eAv
erag
eAv
erag
eAv
erag
eAv
erag
eAv
erag
eAv
erag
e19
93-2
002
2000
-200
220
0219
93-2
002
2000
-200
220
0219
93-2
002
2000
-200
220
0219
93-2
002
2000
-200
220
0219
93-2
002
2000
-200
220
02
Obse
rvat
ions
3232
3232
3232
3232
3232
3232
3232
3232
3232
R-sq
uare
d0.
450.
290.
260.
440.
230.
190.
470.
250.
220.
470.
350.
320.
370.
330.
320.
380.
330.
35
Robu
st t
stat
istic
s in
par
enth
eses
+ s
igni
fican
t at 1
0%; *
sig
nific
ant a
t 5%
; **
sign
ifica
nt a
t 1%
Anne
xe 3
:Reg
ress
ion
resu
lts
for S
SA c
ount
ries
only
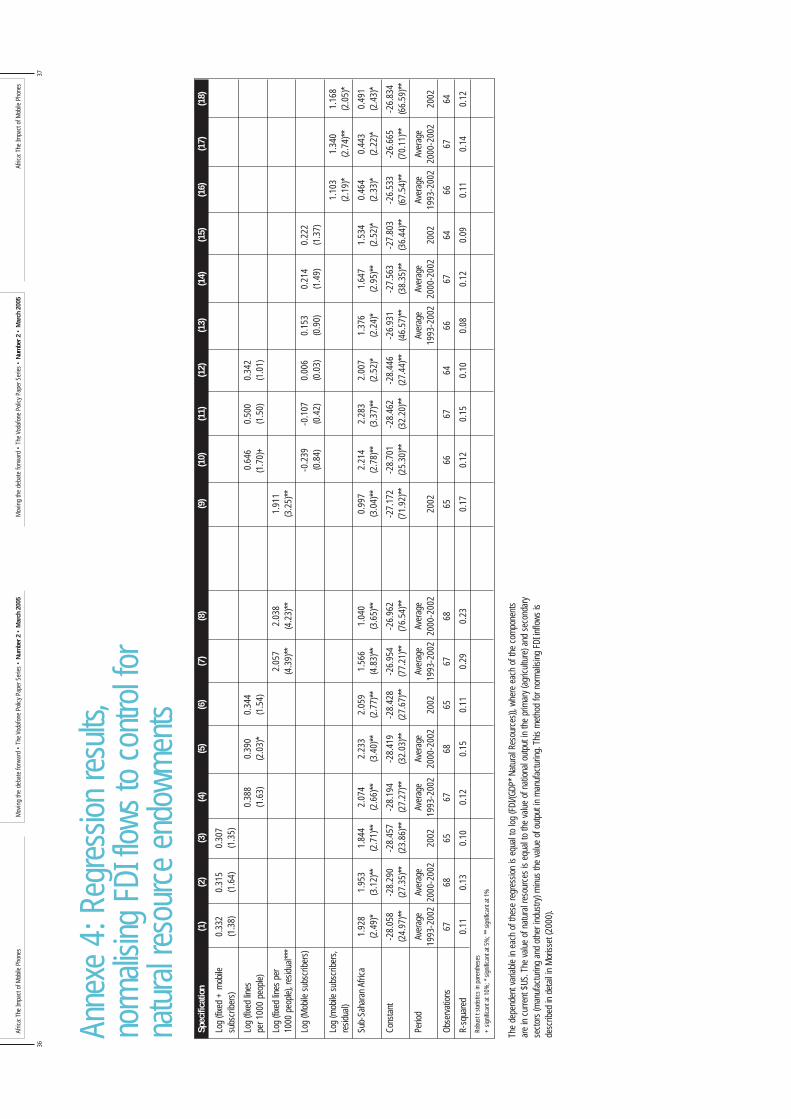
Afric
a:Th
e Im
pact
of M
obile
Pho
nes
Mov
ing
the
deba
te fo
rwar
d•
The
Voda
fone
Pol
icy
Pape
r Ser
ies
• Nu
mbe
r 2•
Mar
ch 2
005
36
Afric
a:Th
e Im
pact
of M
obile
Pho
nes
Mov
ing
the
deba
te fo
rwar
d•
The
Voda
fone
Pol
icy
Pape
r Ser
ies
• Nu
mbe
r 2•
Mar
ch 2
005
37
Spec
ifica
tion
(1)
(2)
(3)
(4)
(5)
(6)
(7)
(8)
(9)
(10)
(11)
(12)
(13)
(14)
(15)
(16)
(17)
(18)
Log
(fixe
d +
mob
ile
0.33
20.
315
0.30
7su
bscr
iber
s)(1
.38)
(1.6
4)(1
.35)
Log
(fixe
d lin
es
0.38
80.
390
0.34
40.
646
0.50
00.
342
per 1
000
peop
le)
(1.6
3)(2
.03)
*(1
.54)
(1.7
0)+
(1.5
0)(1
.01)
Log
(fixe
d lin
es p
er
2.05
72.
038
1.91
110
00 p
eopl
e),r
esid
ual**
*(4
.39)
**(4
.23)
**(3
.25)
**
Log
(Mob
ile s
ubsc
riber
s)-0
.239
-0.1
070.
006
0.15
30.
214
0.22
2(0
.84)
(0.4
2)(0
.03)
(0.9
0)(1
.49)
(1.3
7)
Log
(mob
ile s
ubsc
riber
s,1.
103
1.34
01.
168
resi
dual
)(2
.19)
*(2
.74)
**(2
.05)
*
Sub-
Saha
ran
Afric
a1.
928
1.95
31.
844
2.07
42.
233
2.05
91.
566
1.04
00.
997
2.21
42.
283
2.00
71.
376
1.64
71.
534
0.46
40.
443
0.49
1(2
.49)
*(3
.12)
**(2
.71)
**(2
.66)
**(3
.40)
**(2
.77)
**(4
.83)
**(3
.65)
**(3
.04)
**(2
.78)
**(3
.37)
**(2
.52)
*(2
.24)
*(2
.95)
**(2
.52)
*(2
.33)
*(2
.22)
*(2
.43)
*
Cons
tant
-28.
058
-28.
290
-28.
457
-28.
194
-28.
419
-28.
428
-26.
954
-26.
962
-27.
172
-28.
701
-28.
462
-28.
446
-26.
931
-27.
563
-27.
803
-26.
533
-26.
665
-26.
834
(24.
97)**
(27.
35)**
(23.
86)**
(27.
27)**
(32.
03)**
(27.
67)**
(77.
21)**
(76.
54)**
(71.
92)**
(25.
30)**
(32.
20)**
(27.
44)**
(46.
57)**
(38.
35)**
(36.
44)**
(67.
54)**
(70.
11)**
(66.
59)**
Perio
dAv
erag
eAv
erag
eAv
erag
eAv
erag
eAv
erag
eAv
erag
eAv
erag
eAv
erag
eAv
erag
eAv
erag
e19
93-2
002
2000
-200
220
0219
93-2
002
2000
-200
220
0219
93-2
002
2000
-200
220
0219
93-2
002
2000
-200
220
0219
93-2
002
2000
-200
220
02
Obse
rvat
ions
6768
6567
6865
6768
6566
6764
6667
6466
6764
R-sq
uare
d0.
110.
130.
100.
120.
150.
110.
290.
230.
170.
120.
150.
100.
080.
120.
090.
110.
140.
12
Robu
st t
stat
istic
s in
par
enth
eses
+ s
igni
fican
t at 1
0%; *
sig
nific
ant a
t 5%
; **
sign
ifica
nt a
t 1%
Anne
xe 4
:Reg
ress
ion
resu
lts,
norm
alisin
g FD
I flo
ws to
con
trol f
or
natu
ral r
esou
rce
endo
wmen
ts
The
depe
nden
t var
iabl
e in
eac
h of
thes
e re
gres
sion
is e
qual
to lo
g (F
DI/(G
DP*
Natu
ral R
esou
rces
)),w
here
eac
h of
the
com
pone
nts
are
in c
urre
nt $
US.T
he v
alue
of n
atur
al re
sour
ces
is e
qual
to th
e va
lue
of n
atio
nal o
utpu
t in
the
prim
ary
(agr
icul
ture
) and
sec
onda
ryse
ctor
s (m
anuf
actu
ring
and
othe
r ind
ustry
) min
us th
e va
lue
of o
utpu
t in
man
ufac
turin
g.Th
is m
etho
d fo
r nor
mal
isin
g FD
I inf
low
s is
desc
ribed
in d
etai
l in
Mor
isse
t (20
00).
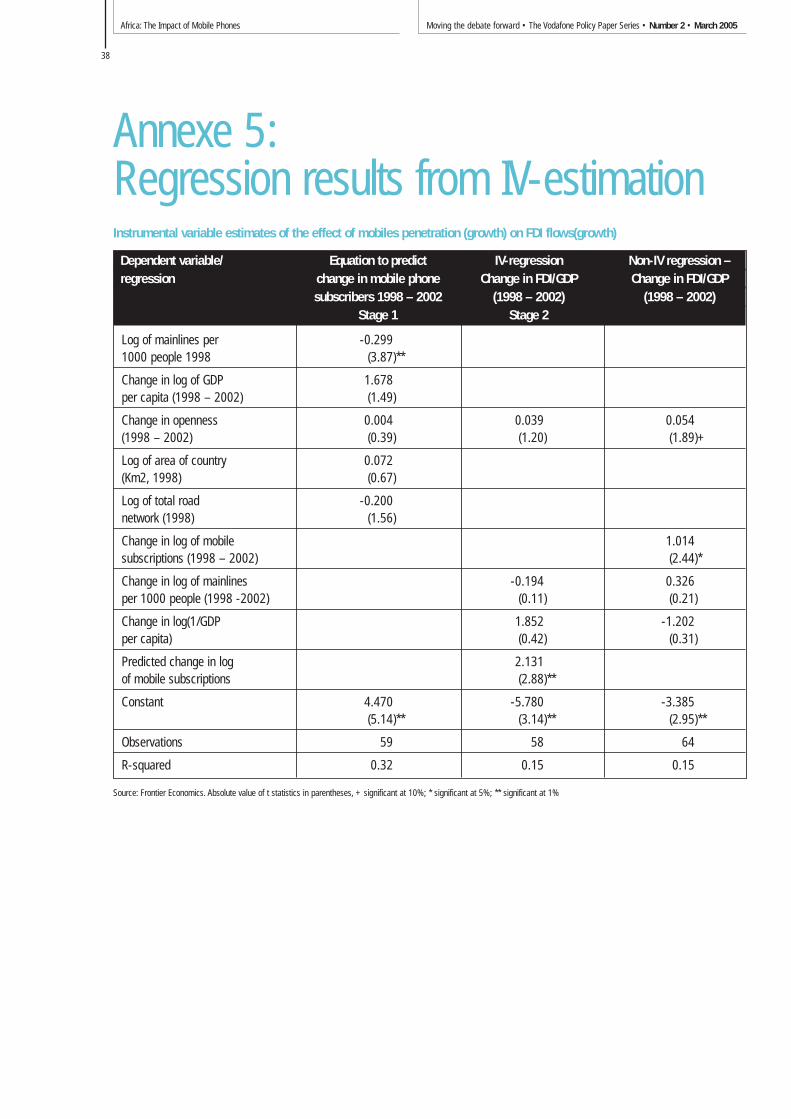
Africa: The Impact of Mobile Phones Moving the debate forward • The Vodafone Policy Paper Series • Number 2 • March 2005
38
Instrumental variable estimates of the effect of mobiles penetration (growth) on FDI flows(growth)
Source: Frontier Economics. Absolute value of t statistics in parentheses, + significant at 10%; * significant at 5%; ** significant at 1%
Dependent variable/ Equation to predict IV-regression Non-IV regression –regression change in mobile phone Change in FDI/GDP Change in FDI/GDP
subscribers 1998 – 2002 (1998 – 2002) (1998 – 2002)Stage 1 Stage 2
Log of mainlines per -0.2991000 people 1998 (3.87)**
Change in log of GDP 1.678per capita (1998 – 2002) (1.49)
Change in openness 0.004 0.039 0.054(1998 – 2002) (0.39) (1.20) (1.89)+
Log of area of country 0.072(Km2, 1998) (0.67)
Log of total road -0.200network (1998) (1.56)
Change in log of mobile 1.014subscriptions (1998 – 2002) (2.44)*
Change in log of mainlines -0.194 0.326per 1000 people (1998 -2002) (0.11) (0.21)
Change in log(1/GDP 1.852 -1.202per capita) (0.42) (0.31)
Predicted change in log 2.131of mobile subscriptions (2.88)**
Constant 4.470 -5.780 -3.385(5.14)** (3.14)** (2.95)**
Observations 59 58 64
R-squared 0.32 0.15 0.15
Annexe 5:Regression results from IV-estimation
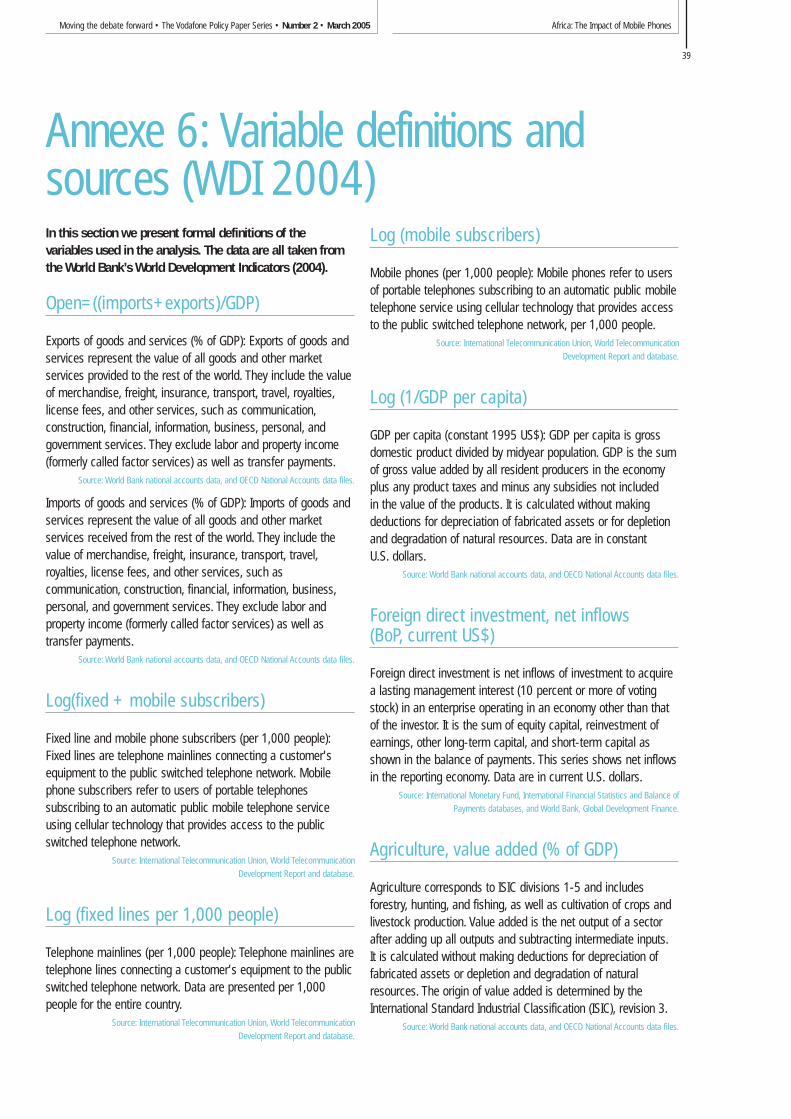
Africa: The Impact of Mobile PhonesMoving the debate forward • The Vodafone Policy Paper Series • Number 2 • March 2005
39
In this section we present formal definitions of thevariables used in the analysis. The data are all taken fromthe World Bank’s World Development Indicators (2004).
Open=((imports+exports)/GDP)
Exports of goods and services (% of GDP): Exports of goods andservices represent the value of all goods and other marketservices provided to the rest of the world. They include the valueof merchandise, freight, insurance, transport, travel, royalties,license fees, and other services, such as communication,construction, financial, information, business, personal, andgovernment services. They exclude labor and property income(formerly called factor services) as well as transfer payments.
Source: World Bank national accounts data, and OECD National Accounts data files.
Imports of goods and services (% of GDP): Imports of goods andservices represent the value of all goods and other marketservices received from the rest of the world. They include thevalue of merchandise, freight, insurance, transport, travel,royalties, license fees, and other services, such ascommunication, construction, financial, information, business,personal, and government services. They exclude labor andproperty income (formerly called factor services) as well astransfer payments.
Source: World Bank national accounts data, and OECD National Accounts data files.
Log(fixed + mobile subscribers)
Fixed line and mobile phone subscribers (per 1,000 people):Fixed lines are telephone mainlines connecting a customer'sequipment to the public switched telephone network. Mobilephone subscribers refer to users of portable telephonessubscribing to an automatic public mobile telephone serviceusing cellular technology that provides access to the publicswitched telephone network.
Source: International Telecommunication Union, World Telecommunication
Development Report and database.
Log (fixed lines per 1,000 people)
Telephone mainlines (per 1,000 people): Telephone mainlines aretelephone lines connecting a customer's equipment to the publicswitched telephone network. Data are presented per 1,000people for the entire country.
Source: International Telecommunication Union, World Telecommunication
Development Report and database.
Log (mobile subscribers)
Mobile phones (per 1,000 people): Mobile phones refer to usersof portable telephones subscribing to an automatic public mobiletelephone service using cellular technology that provides accessto the public switched telephone network, per 1,000 people.
Source: International Telecommunication Union, World Telecommunication
Development Report and database.
Log (1/GDP per capita)
GDP per capita (constant 1995 US$): GDP per capita is grossdomestic product divided by midyear population. GDP is the sumof gross value added by all resident producers in the economyplus any product taxes and minus any subsidies not includedin the value of the products. It is calculated without makingdeductions for depreciation of fabricated assets or for depletionand degradation of natural resources. Data are in constantU.S. dollars.
Source: World Bank national accounts data, and OECD National Accounts data files.
Foreign direct investment, net inflows (BoP, current US$)
Foreign direct investment is net inflows of investment to acquirea lasting management interest (10 percent or more of votingstock) in an enterprise operating in an economy other than thatof the investor. It is the sum of equity capital, reinvestment ofearnings, other long-term capital, and short-term capital asshown in the balance of payments. This series shows net inflowsin the reporting economy. Data are in current U.S. dollars.
Source: International Monetary Fund, International Financial Statistics and Balance of
Payments databases, and World Bank, Global Development Finance.
Agriculture, value added (% of GDP)
Agriculture corresponds to ISIC divisions 1-5 and includesforestry, hunting, and fishing, as well as cultivation of crops andlivestock production. Value added is the net output of a sectorafter adding up all outputs and subtracting intermediate inputs.It is calculated without making deductions for depreciation offabricated assets or depletion and degradation of naturalresources. The origin of value added is determined by theInternational Standard Industrial Classification (ISIC), revision 3.
Source: World Bank national accounts data, and OECD National Accounts data files.
Annexe 6: Variable definitions andsources (WDI 2004)
Africa: The Impact of Mobile Phones Moving the debate forward • The Vodafone Policy Paper Series • Number 2 • March 2005
40
GDP (current US$)
GDP at purchaser's prices is the sum of gross value added by allresident producers in the economy plus any product taxes andminus any subsidies not included in the value of the products.It is calculated without making deductions for depreciation offabricated assets or for depletion and degradation of naturalresources. Data are in current U.S. dollars. Dollar figures for GDPare converted from domestic currencies using single year officialexchange rates. For a few countries where the official exchangerate does not reflect the rate effectively applied to actual foreignexchange transactions, an alternative conversion factor is used.
Source: World Bank national accounts data, and OECD National Accounts data files.
Industry, value added (% of GDP)
Industry corresponds to ISIC divisions 10-45 and includesmanufacturing (ISIC divisions 15-37). It comprises value added inmining, manufacturing (also reported as a separate subgroup),construction, electricity, water, and gas. Value added is the netoutput of a sector after adding up all outputs and subtractingintermediate inputs. It is calculated without making deductionsfor depreciation of fabricated assets or depletion anddegradation of natural resources. The origin of value added isdetermined by the International Standard Industrial Classification(ISIC), revision 3.
Source: World Bank national accounts data, and OECD National Accounts data files.
Manufacturing, value added (% of GDP)
Manufacturing refers to industries belonging to ISIC divisions15-37. Value added is the net output of a sector after adding upall outputs and subtracting intermediate inputs. It is calculatedwithout making deductions for depreciation of fabricated assetsor depletion and degradation of natural resources. The origin ofvalue added is determined by the International StandardIndustrial Classification (ISIC), revision 3.
Source: World Bank national accounts data, and OECD National Accounts data files.
Services, etc., value added (% of GDP)
Services correspond to ISIC divisions 50-99 and they includevalue added in wholesale and retail trade (including hotels andrestaurants), transport, and government, financial, professional,and personal services such as education, health care, and realestate services. Also included are imputed bank service charges,import duties, and any statistical discrepancies noted by nationalcompilers as well as discrepancies arising from rescaling.Value added is the net output of a sector after adding up alloutputs and subtracting intermediate inputs. It is calculatedwithout making deductions for depreciation of fabricated assetsor depletion and degradation of natural resources. The industrialorigin of value added is determined by the International StandardIndustrial Classification (ISIC), revision 3.
Source: World Bank national accounts data, and OECD National Accounts data files.

Africa: The Impact of Mobile PhonesMoving the debate forward • The Vodafone Policy Paper Series • Number 2 • March 2005
41
The remaining two papers in this report draw on surveys of poor,rural communities in South Africa and Tanzania, and smallbusinesses, mainly in Egypt and South Africa. The first paperlooks at patterns and impacts of mobile use, and the secondspecifically at the links between mobile use and social capital inrural communities. The surveys were commissioned by Vodafonefrom Environmental Resource Management and Forum for theFuture and were conducted in mid-2004.
In South Africa 10 communities were surveyed, with 252interviews completed in total. In addition, 140 small businesseswere surveyed. In Tanzania 11 communities were surveyed, with223 completed in total. Nine small businesses in Tanzania werealso interviewed. In Egypt 150 small businesses were surveyed.In each case, the mobile services being used were ‘traditional’,namely voice or SMS text messaging, and no instances of usingmore advanced data services were observed during theresearch.
The table below presents some summary statistics on the threecountries. The maps show the locations of the communities inrelation to major urban centres. In each community a mobilephone mast had been erected in the past five years; prior to thisthe communities had little or no access to fixed-line telephones.Typical incomes in the rural communities selected will be belowthe national average. In Tanzania, employment in thecommunities is mainly agricultural, and often informal. In thecase of the South African communities a higher proportion ofinhabitants will have formal and non-agricultural employment,but unemployment rates will be higher than the national averagein most cases.
In Tanzania, the typical community surveyed was small, with onlya few hundred inhabitants. In most cases, the roads to thevillages were sealed, although roads within them were not.Most of the dwellings were self-built shacks, and local serviceswere very limited. For example, few of the communities hadformal shops, clinics, or official public transport, and in none wasrunning water or electricity to the house commonplace.
The South African communities were generally more developed,with facilities such as formal shops being common, and somehad benefited from government housing, electrification and waterand sanitation projects. However, self-built shacks were alsocommon, with much of the population living in informalsettlements or squatter camps.
Mpumalanga, South Africa, Keuny Maziya on his cell phone.
Introduction to the community andbusiness surveys
Egypt, South Africa Tanzania – basic information
Fixed MobilePer Capita Lines Lines
Percent GDP Per 1000 Per 1000 Country Population Urban (US$, PPP)* People People
Egypt 70.5 42.1 3,810 110 67
South Africa 44.8 56.5 10,070 107 304
Tanzania 36.3 34.4 580 5 22
All Developing Countries 4,936.9 41.4 4,054 96 101
High Income Countries 941.2 77.8 28,741 584 653
World 6225.0 47.8 7,804 175 184
Source: UNDP, Human Development Report 2004. All data are for 2002.
Note: PPP (purchasing power parity) GDP figures are adjusted to reflect the cost of living, so $1000 of PPP income would yield the same standard of living everywhere.
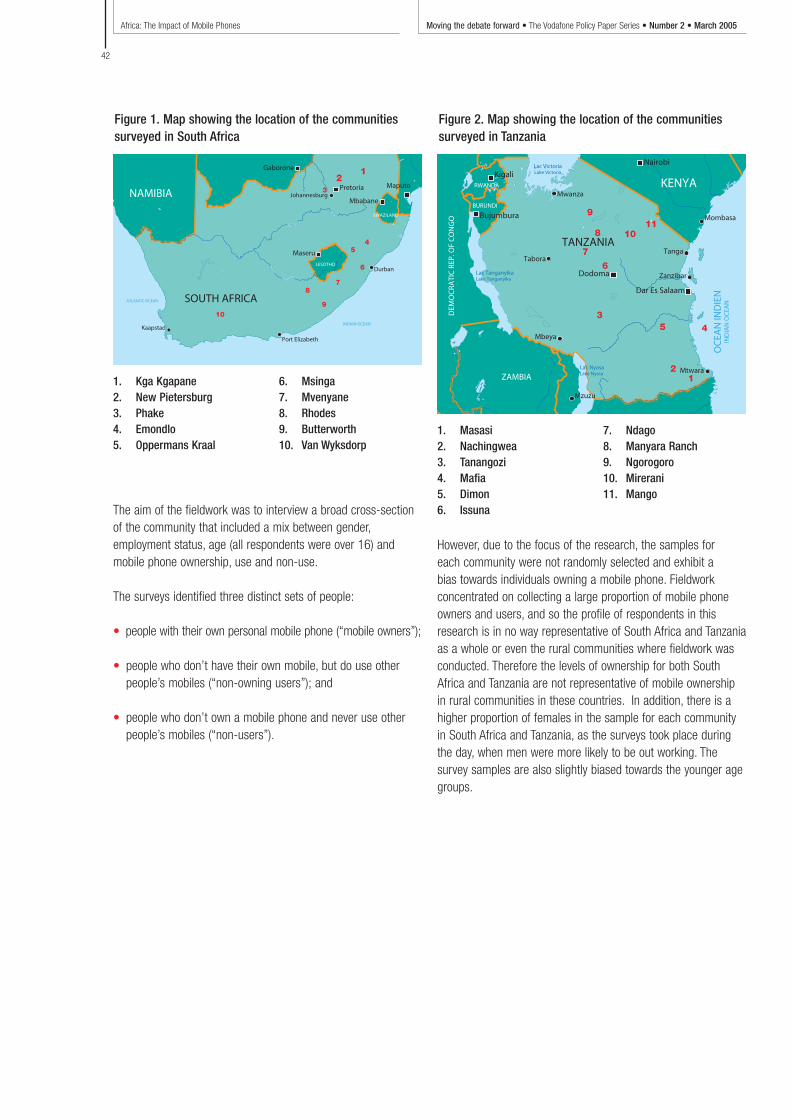
Africa: The Impact of Mobile Phones Moving the debate forward • The Vodafone Policy Paper Series • Number 2 • March 2005
42
The aim of the fieldwork was to interview a broad cross-sectionof the community that included a mix between gender,employment status, age (all respondents were over 16) andmobile phone ownership, use and non-use.
The surveys identified three distinct sets of people:
• people with their own personal mobile phone (“mobile owners”);
• people who don’t have their own mobile, but do use otherpeople’s mobiles (“non-owning users”); and
• people who don’t own a mobile phone and never use otherpeople’s mobiles (“non-users”).
Figure 1. Map showing the location of the communitiessurveyed in South Africa
1. Kga Kgapane2. New Pietersburg3. Phake4. Emondlo5. Oppermans Kraal
6. Msinga7. Mvenyane8. Rhodes9. Butterworth10. Van Wyksdorp
1. Masasi2. Nachingwea3. Tanangozi4. Mafia5. Dimon6. Issuna
7. Ndago8. Manyara Ranch9. Ngorogoro10. Mirerani 11. Mango
Figure 2. Map showing the location of the communitiessurveyed in Tanzania
However, due to the focus of the research, the samples for each community were not randomly selected and exhibit a bias towards individuals owning a mobile phone. Fieldworkconcentrated on collecting a large proportion of mobile phoneowners and users, and so the profile of respondents in thisresearch is in no way representative of South Africa and Tanzaniaas a whole or even the rural communities where fieldwork wasconducted. Therefore the levels of ownership for both SouthAfrica and Tanzania are not representative of mobile ownershipin rural communities in these countries. In addition, there is ahigher proportion of females in the sample for each communityin South Africa and Tanzania, as the surveys took place duringthe day, when men were more likely to be out working. Thesurvey samples are also slightly biased towards the younger agegroups.
12
345
6
7
8
9
1011
12
3
45
6
78
910
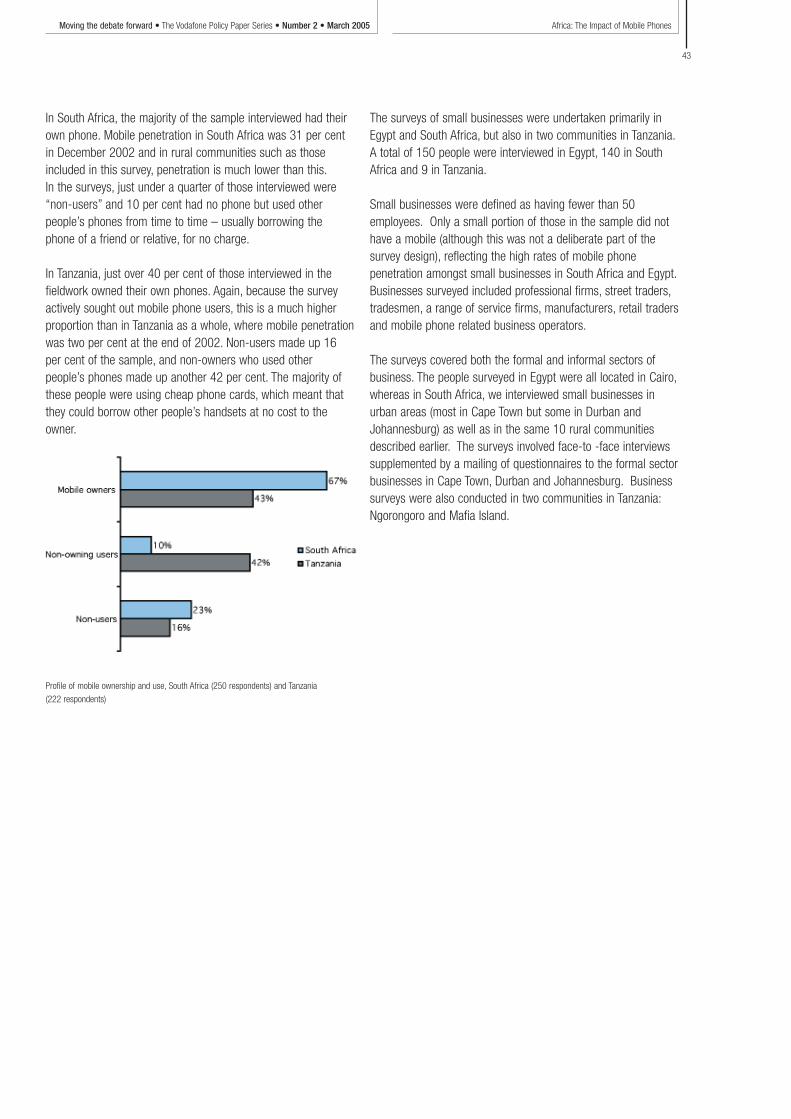
Africa: The Impact of Mobile PhonesMoving the debate forward • The Vodafone Policy Paper Series • Number 2 • March 2005
43
In South Africa, the majority of the sample interviewed had theirown phone. Mobile penetration in South Africa was 31 per centin December 2002 and in rural communities such as thoseincluded in this survey, penetration is much lower than this.In the surveys, just under a quarter of those interviewed were“non-users” and 10 per cent had no phone but used otherpeople’s phones from time to time – usually borrowing thephone of a friend or relative, for no charge.
In Tanzania, just over 40 per cent of those interviewed in thefieldwork owned their own phones. Again, because the surveyactively sought out mobile phone users, this is a much higherproportion than in Tanzania as a whole, where mobile penetrationwas two per cent at the end of 2002. Non-users made up 16per cent of the sample, and non-owners who used otherpeople’s phones made up another 42 per cent. The majority ofthese people were using cheap phone cards, which meant thatthey could borrow other people’s handsets at no cost to theowner.
Profile of mobile ownership and use, South Africa (250 respondents) and Tanzania
(222 respondents)
The surveys of small businesses were undertaken primarily inEgypt and South Africa, but also in two communities in Tanzania.A total of 150 people were interviewed in Egypt, 140 in SouthAfrica and 9 in Tanzania.
Small businesses were defined as having fewer than 50employees. Only a small portion of those in the sample did nothave a mobile (although this was not a deliberate part of thesurvey design), reflecting the high rates of mobile phonepenetration amongst small businesses in South Africa and Egypt.Businesses surveyed included professional firms, street traders,tradesmen, a range of service firms, manufacturers, retail tradersand mobile phone related business operators.
The surveys covered both the formal and informal sectors ofbusiness. The people surveyed in Egypt were all located in Cairo,whereas in South Africa, we interviewed small businesses inurban areas (most in Cape Town but some in Durban andJohannesburg) as well as in the same 10 rural communitiesdescribed earlier. The surveys involved face-to -face interviewssupplemented by a mailing of questionnaires to the formal sectorbusinesses in Cape Town, Durban and Johannesburg. Businesssurveys were also conducted in two communities in Tanzania:Ngorongoro and Mafia Island.

Africa: The Impact of Mobile Phones Moving the debate forward • The Vodafone Policy Paper Series • Number 2 • March 2005
44
Many developing country governments and development agenciesare focusing on extending telecommunications services into ruralareas, as they seek to encourage growth, alleviate poverty andovercome a perceived ‘digital divide’. Mobile technologies areplaying a major role in this effort. However, relatively little is knownabout how rural communities and small businesses use mobiletechnologies, and what impacts they are having.
Mobile communication services in Africa have expanded rapidlyin recent years. Most of this growth has been in urban areas,but there are growing rural networks in many countries.The affluent urban markets have naturally been targeted first,but in addition there has been a perception that the rural poorare not able or willing to pay for mobile telecommunicationsservices. Yet in fact, in many instances, rural demand has greatlyexceeded initial expectations.
Perhaps equally important, the introduction of mobile services
has brought about a change in the business and operating
climate of the African telecommunication sector: competing
mobile operators have helped create an environment that fosters
innovation and competition
This paper presents the results of research into socio-economic
impacts of mobile communications on households, rural
communities and small businesses in Africa. Some of the
questions the research sought to address include:
• Who uses mobile communications services?
• What are the factors that influence ownership, use and
non-use of mobile phones?
Partner, ERMJonathan Samuel
Consultant, ERMNiraj Shah
Consultant, ERMWenona Hadingham
Mobile Communications in SouthAfrica, Tanzania and Egypt: Resultsfrom Community and Business Surveys

Africa: The Impact of Mobile PhonesMoving the debate forward • The Vodafone Policy Paper Series • Number 2 • March 2005
45
• What are mobile phones used for – as a consumer good,for business or employment purposes, or both?
• What role do mobiles play in the operation of smallbusinesses in urban and rural areas?
• What social and economic impact are mobile phones havingon communities and small businesses in Africa?
Answers to these questions have important implications for bothgovernments and the mobile operators as they seek to expandtheir networks to cover rural areas. There is very little empiricalinformation on the impacts of mobile phone use in ruralcommunities or by small businesses in Africa. The results of thisstudy are based on data collected in face-to-face interviews,carried out in South Africa, Tanzania and Egypt.
Profile of mobile users and non-users inthe communities
a) Who uses mobile phones?In the surveys, 67 percent of the sample of 252 people in South Africa owned a mobile phone, while a further 8 percentused mobiles, but did not own one, and 25 percent ofrespondents did not own or use a mobile phone at all.In Tanzania, the figure for ownership was lower, at 43 percent of the 223 respondents interviewed, with users at 42 percentand nonusers at 16 percent. The higher proportion of users asopposed to owners in Tanzania suggests a greater degree of‘sharing’ of mobiles than in South Africa. This may reflect a lack of alternative communication facilities for non-owners inmost of the communities in Tanzania and the smaller numberswho can afford to purchase a phone. Those respondents whoused someone else’s phone usually bought airtime vouchers to do so.
When we looked at access to mobile phones (regardless ofwhether or not the respondent used them), 97 percent inTanzania stated that they could access a mobile phone if theywished to, whereas only 28 percent could access a landlinesomewhere in the community. This indicates a very highawareness of the potential to use mobile phones forcommunication, and very high perceived accessibility, even inthese very poor rural communities.
The survey found that the perception of ownership of mobilephones in Tanzania is different to that in South Africa. When therespondents stated that they owned a mobile phone, they oftenconsidered it as a household asset rather than a personal orindividual one. This was particularly the case for femalerespondents. However cultural norms in rural Tanzania dictatethat ownership of such items lies with male members or headsof the households. We found that a broadly similar proportion of
males and females were owners and users of mobiles. Whilstthis result is surprising, particularly in the case of Tanzania, itmay be explained by the fact that the sample is skewed towardsfemales and those with mobile phones. The figures in Table 1 doshow some differences in men’s and women’s use of mobiles,especially in Tanzania.
We can make no claims for the sample being fully representativeof the rural population in these communities. However, in thesample of owners and users of mobile phones we found a broadrepresentation of individuals by age, income groups, educationlevels and gender. We looked at the breakdown of owner, user,and non-user status by gender, age, education and income tosee where use or non-use varied with the by these parameters.
Table 1: Mobile status of the interview sample by gender
Gender Male Female
South Owners 39.1 56.8Africa Users 40.0 60.0
Non-users 51.7 46.6Census data for 47.2 52.8communities
Tanzania Owners 50.5 48.4Users 47.3 52.7Non-users 20.0 80.0
We found that nearly 57 percent of the respondents who owned a mobile phone in South Africa were female. Similarly,60 percent of respondents who were users but not owners werealso female.
Perhaps not surprisingly, almost half of the respondents whowere users in the South African communities came from the 25-45 age groups. The respondents in this age group areeconomically active and therefore may be more likely to own aphone. However, respondents in age groups of 46-55 and over55 were still well represented in the group of owners and users.
In Tanzania, the patterns of age distribution in the group ofowners and users was similar but was more concentrated in theage group of 26-45 as shown below in Table 2.
Table 2: Mobile status by age in South Africa and Tanzania
South Africa <25 26-45 46-55 >55
Owner 30.2 49.7 10.1 7.7User 40.0 36.0 20.0 4.0Non-user 29.3 37.9 6.9 17.2
Tanzania <25 26-45 46-55 >55
Owner 14.7 63.2 13.7 7.4User 25.8 52.7 10.8 10.8Non-User 28.6 60.0 5.7 2.9
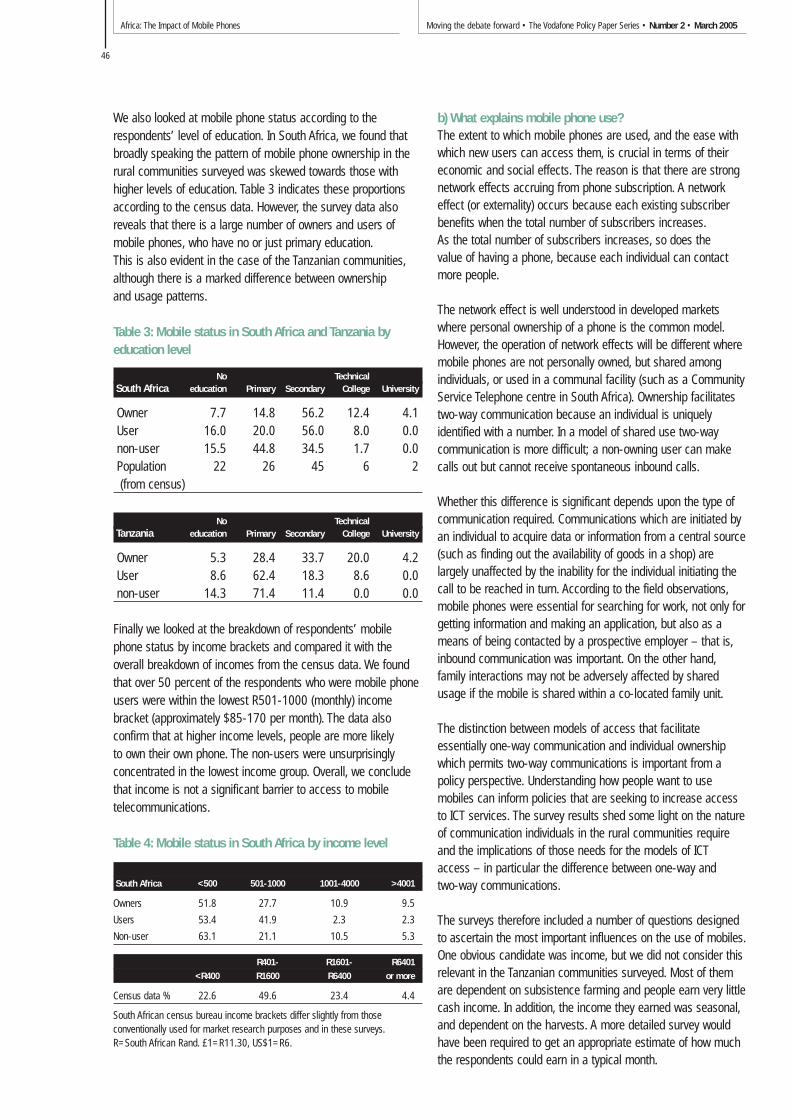
Africa: The Impact of Mobile Phones Moving the debate forward • The Vodafone Policy Paper Series • Number 2 • March 2005
46
We also looked at mobile phone status according to therespondents’ level of education. In South Africa, we found thatbroadly speaking the pattern of mobile phone ownership in therural communities surveyed was skewed towards those withhigher levels of education. Table 3 indicates these proportionsaccording to the census data. However, the survey data alsoreveals that there is a large number of owners and users ofmobile phones, who have no or just primary education.This is also evident in the case of the Tanzanian communities,although there is a marked difference between ownership and usage patterns.
Table 3: Mobile status in South Africa and Tanzania byeducation level
No TechnicalSouth Africa education Primary Secondary College University
Owner 7.7 14.8 56.2 12.4 4.1User 16.0 20.0 56.0 8.0 0.0non-user 15.5 44.8 34.5 1.7 0.0Population 22 26 45 6 2(from census)
No TechnicalTanzania education Primary Secondary College University
Owner 5.3 28.4 33.7 20.0 4.2User 8.6 62.4 18.3 8.6 0.0non-user 14.3 71.4 11.4 0.0 0.0
Finally we looked at the breakdown of respondents’ mobilephone status by income brackets and compared it with theoverall breakdown of incomes from the census data. We foundthat over 50 percent of the respondents who were mobile phoneusers were within the lowest R501-1000 (monthly) incomebracket (approximately $85-170 per month). The data alsoconfirm that at higher income levels, people are more likely to own their own phone. The non-users were unsurprisinglyconcentrated in the lowest income group. Overall, we concludethat income is not a significant barrier to access to mobiletelecommunications.
Table 4: Mobile status in South Africa by income level
South Africa <500 501-1000 1001-4000 >4001
Owners 51.8 27.7 10.9 9.5
Users 53.4 41.9 2.3 2.3
Non-user 63.1 21.1 10.5 5.3
R401- R1601- R6401
<R400 R1600 R6400 or more
Census data % 22.6 49.6 23.4 4.4
South African census bureau income brackets differ slightly from thoseconventionally used for market research purposes and in these surveys.R=South African Rand. £1=R11.30, US$1=R6.
b) What explains mobile phone use?The extent to which mobile phones are used, and the ease withwhich new users can access them, is crucial in terms of theireconomic and social effects. The reason is that there are strongnetwork effects accruing from phone subscription. A networkeffect (or externality) occurs because each existing subscriberbenefits when the total number of subscribers increases.As the total number of subscribers increases, so does the value of having a phone, because each individual can contactmore people.
The network effect is well understood in developed marketswhere personal ownership of a phone is the common model.However, the operation of network effects will be different wheremobile phones are not personally owned, but shared amongindividuals, or used in a communal facility (such as a CommunityService Telephone centre in South Africa). Ownership facilitatestwo-way communication because an individual is uniquelyidentified with a number. In a model of shared use two-waycommunication is more difficult; a non-owning user can makecalls out but cannot receive spontaneous inbound calls.
Whether this difference is significant depends upon the type ofcommunication required. Communications which are initiated byan individual to acquire data or information from a central source(such as finding out the availability of goods in a shop) arelargely unaffected by the inability for the individual initiating thecall to be reached in turn. According to the field observations,mobile phones were essential for searching for work, not only forgetting information and making an application, but also as ameans of being contacted by a prospective employer – that is,inbound communication was important. On the other hand,family interactions may not be adversely affected by sharedusage if the mobile is shared within a co-located family unit.
The distinction between models of access that facilitateessentially one-way communication and individual ownershipwhich permits two-way communications is important from apolicy perspective. Understanding how people want to usemobiles can inform policies that are seeking to increase accessto ICT services. The survey results shed some light on the natureof communication individuals in the rural communities requireand the implications of those needs for the models of ICT access – in particular the difference between one-way and two-way communications.
The surveys therefore included a number of questions designedto ascertain the most important influences on the use of mobiles.One obvious candidate was income, but we did not consider thisrelevant in the Tanzanian communities surveyed. Most of themare dependent on subsistence farming and people earn very littlecash income. In addition, the income they earned was seasonal,and dependent on the harvests. A more detailed survey wouldhave been required to get an appropriate estimate of how muchthe respondents could earn in a typical month.
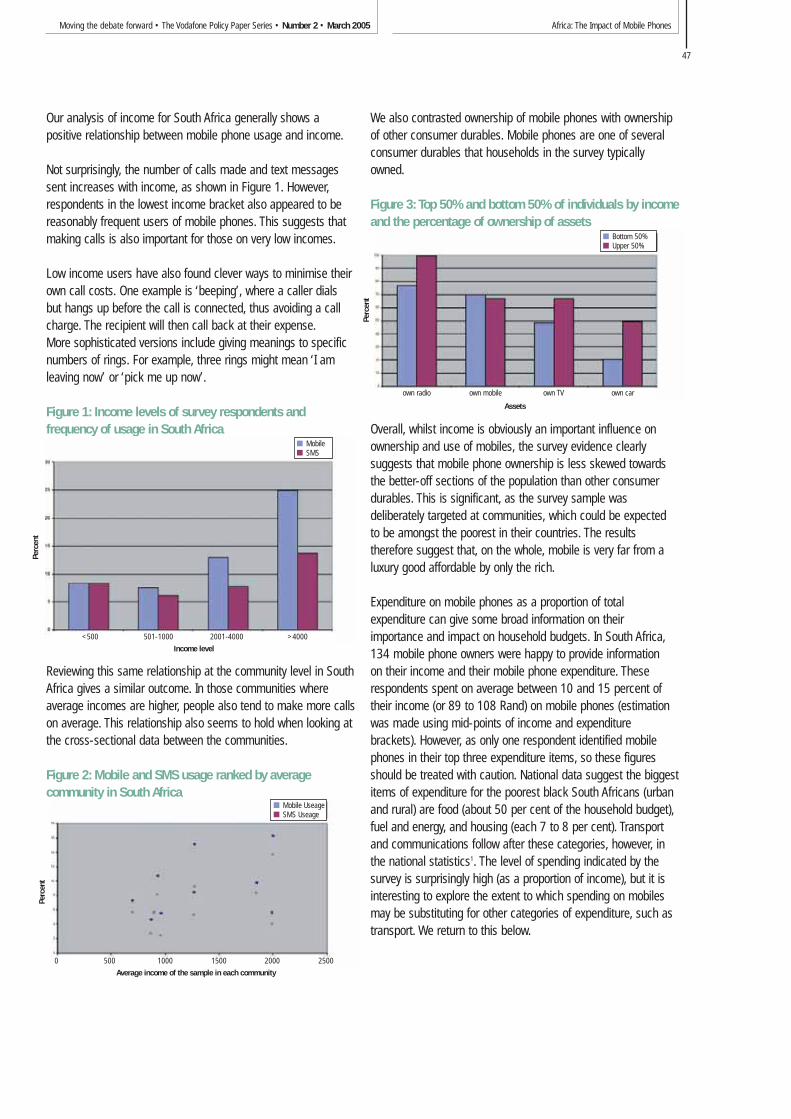
Africa: The Impact of Mobile PhonesMoving the debate forward • The Vodafone Policy Paper Series • Number 2 • March 2005
47
Our analysis of income for South Africa generally shows apositive relationship between mobile phone usage and income.
Not surprisingly, the number of calls made and text messagessent increases with income, as shown in Figure 1. However,respondents in the lowest income bracket also appeared to bereasonably frequent users of mobile phones. This suggests thatmaking calls is also important for those on very low incomes.
Low income users have also found clever ways to minimise theirown call costs. One example is ‘beeping’, where a caller dialsbut hangs up before the call is connected, thus avoiding a callcharge. The recipient will then call back at their expense.More sophisticated versions include giving meanings to specificnumbers of rings. For example, three rings might mean ‘I amleaving now’ or ‘pick me up now’.
Figure 1: Income levels of survey respondents andfrequency of usage in South Africa
Reviewing this same relationship at the community level in SouthAfrica gives a similar outcome. In those communities whereaverage incomes are higher, people also tend to make more callson average. This relationship also seems to hold when looking atthe cross-sectional data between the communities.
Figure 2: Mobile and SMS usage ranked by averagecommunity in South Africa
We also contrasted ownership of mobile phones with ownershipof other consumer durables. Mobile phones are one of severalconsumer durables that households in the survey typicallyowned.
Figure 3: Top 50% and bottom 50% of individuals by incomeand the percentage of ownership of assets
Overall, whilst income is obviously an important influence onownership and use of mobiles, the survey evidence clearlysuggests that mobile phone ownership is less skewed towardsthe better-off sections of the population than other consumerdurables. This is significant, as the survey sample wasdeliberately targeted at communities, which could be expected to be amongst the poorest in their countries. The resultstherefore suggest that, on the whole, mobile is very far from aluxury good affordable by only the rich.
Expenditure on mobile phones as a proportion of totalexpenditure can give some broad information on theirimportance and impact on household budgets. In South Africa,134 mobile phone owners were happy to provide information on their income and their mobile phone expenditure. Theserespondents spent on average between 10 and 15 percent oftheir income (or 89 to 108 Rand) on mobile phones (estimationwas made using mid-points of income and expenditurebrackets). However, as only one respondent identified mobilephones in their top three expenditure items, so these figuresshould be treated with caution. National data suggest the biggestitems of expenditure for the poorest black South Africans (urbanand rural) are food (about 50 per cent of the household budget),fuel and energy, and housing (each 7 to 8 per cent). Transportand communications follow after these categories, however, inthe national statistics1. The level of spending indicated by thesurvey is surprisingly high (as a proportion of income), but it isinteresting to explore the extent to which spending on mobilesmay be substituting for other categories of expenditure, such astransport. We return to this below.
own radio own mobile own TV own car
Assets
<500 501-1000 2001-4000 >4000
Income level
0 500 1000 1500 2000 2500
Average income of the sample in each community
Bottom 50%Upper 50%
MobileSMS
Mobile UseageSMS Useage
Perc
ent
Perc
ent
Perc
ent

Africa: The Impact of Mobile Phones Moving the debate forward • The Vodafone Policy Paper Series • Number 2 • March 2005
48
Impact South Africa (%) Tanzania (%)
Prompted responses*
Improved relationships 78.7 85.3 Call rather than travel to family and friends 77.4 91.1
Un-prompted responses
Easier communication with family and friends 72.2 84.6Useful in emergencies 25.8 27.1Assists in job search 15.5 2.7Avoids problems with public fixed-line phones** 8.8 n.a.Easier to organise meetings 8.2 9.0Faster or improved communication 7.7 53.2Access to business information/business purposes 7.2 34.0Saves money 5.7 1.6Easier to contact school/university 4.6 5.9Contact employer/clients on road 3.6 3.7Can send cheap messages using SMS 2.6 0.5Status symbol 2.1 –Improved access to telecommunications 1.5 1.1Place an order for groceries or other items 1.0 6.9Feel safe 1.0 2.7Make money from lending out phone 1.0 0.0Health concerns 0.5 0.5Expensive/costs money – 9.7
* These impacts were identified through specific questions, while the rest of the impacts identified were offered by the respondents without a specific question being asked.** In Tanzania, in the communities surveyed there was generally no public fixed line phone.
Table 5: Impacts of using a mobile phone
Another potential barrier the surveys explored was lack of accessto electricity, which can inhibit take-up of other technologies indeveloping countries. Clearly some form of energy is needed to recharge mobile batteries and so a lack of electricity couldform a barrier to mobile phone ownership. In Tanzania manycommunities had limited or no access to electric power.Figure 4 shows the relationship between mobile phoneownership and use and a community’s access to electricity in Tanzania. The horizontal axis shows the percentage ofhouseholds within a community with access to electricity,from lowest to highest. Whether a respondent was an owner of a mobile is positively related to whether he or she has accessto electricity.
Figure 4: Access to electricity and mobile phone ownership
Respondents with electricity are more likely to own a mobilephone. Those without electricity are more likely to borrowsomeone else’s.
The communities overcame the constraint of not having anelectricity connection in a variety of ways. For example, at Issuna
Mission in Tanzania, every week someone collected all sevenmobiles in the community and took them to the nearest townthat had electricity, to be charged. In a small community, it islikely to be easier to charge a small number of phones and sharethese rather than each person owning a handset. Communitieswithout electricity managed to achieve a similar level of mobilephone usage to those communities with electricity (in terms oftraffic volume), albeit with lower levels of ownership.
In South Africa, communities with and without electricity wereequally likely to own and use mobile phones. This might reflectgreater possibilities for recharging phones using motor vehicles(motor vehicles were much more prevalent in the communitiesvisited in South Africa than in Tanzania). In Kwa Phake, SouthAfrica, a community without access to electricity, a localhairdresser had a phone charging service using a car battery.
We also looked at whether or not mobile phone ownership anduse might depend on whether or not a community has access toa post office, as a proxy for access to an alternative means ofcommunication. However, no relationship of this kind was foundin either South Africa or Tanzania.
c) Impacts of mobilesRespondents to the surveys identified a large number of impactsfrom using mobile phones. Some of these were social in nature,while others concerned employment or business. The socialimpacts were very important in both South Africa and Tanzania.Greater contact and improved relationships with family andfriends was one of the most significant benefits identified by thesurveys. But reduced travel costs and help in job search werealso highlighted. A limited number of respondents also mademoney from renting out their phone.
% of households with electricity % of mobile phone owners
Perc
ent
Community
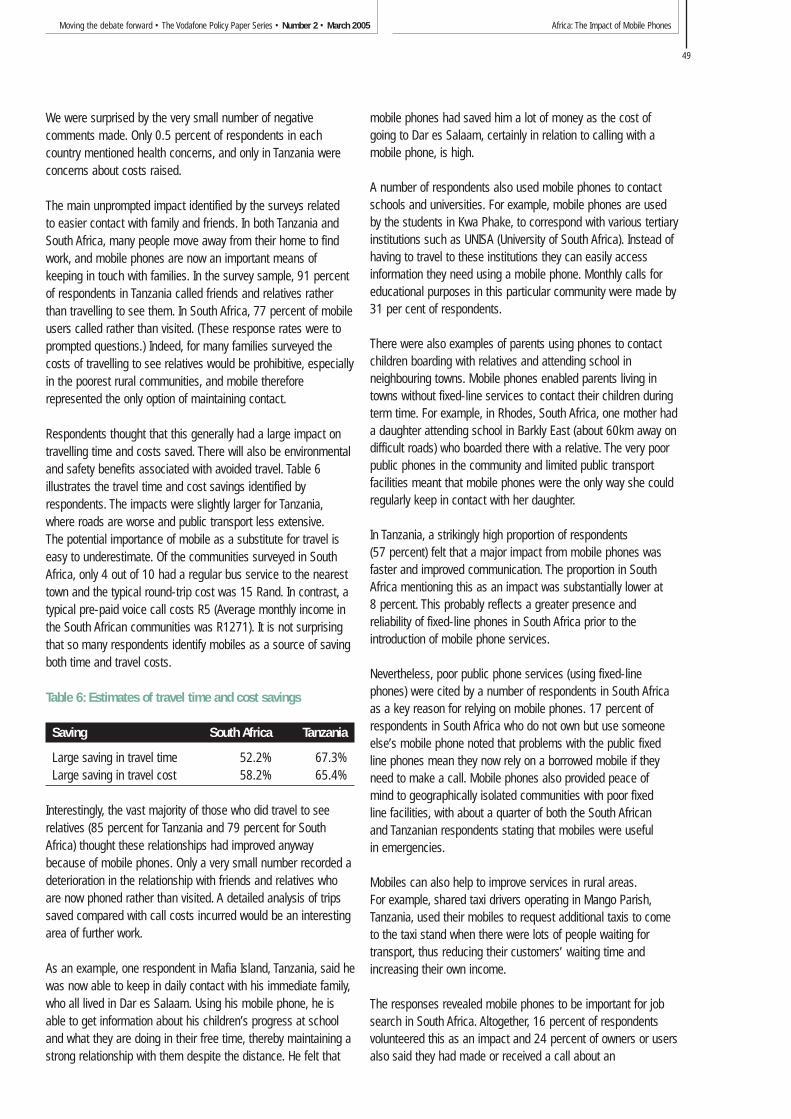
Africa: The Impact of Mobile PhonesMoving the debate forward • The Vodafone Policy Paper Series • Number 2 • March 2005
49
We were surprised by the very small number of negativecomments made. Only 0.5 percent of respondents in eachcountry mentioned health concerns, and only in Tanzania wereconcerns about costs raised.
The main unprompted impact identified by the surveys related to easier contact with family and friends. In both Tanzania andSouth Africa, many people move away from their home to findwork, and mobile phones are now an important means ofkeeping in touch with families. In the survey sample, 91 percentof respondents in Tanzania called friends and relatives ratherthan travelling to see them. In South Africa, 77 percent of mobileusers called rather than visited. (These response rates were toprompted questions.) Indeed, for many families surveyed thecosts of travelling to see relatives would be prohibitive, especiallyin the poorest rural communities, and mobile thereforerepresented the only option of maintaining contact.
Respondents thought that this generally had a large impact ontravelling time and costs saved. There will also be environmentaland safety benefits associated with avoided travel. Table 6illustrates the travel time and cost savings identified byrespondents. The impacts were slightly larger for Tanzania,where roads are worse and public transport less extensive.The potential importance of mobile as a substitute for travel iseasy to underestimate. Of the communities surveyed in SouthAfrica, only 4 out of 10 had a regular bus service to the nearesttown and the typical round-trip cost was 15 Rand. In contrast, atypical pre-paid voice call costs R5 (Average monthly income inthe South African communities was R1271). It is not surprisingthat so many respondents identify mobiles as a source of savingboth time and travel costs.
Table 6: Estimates of travel time and cost savings
Saving South Africa Tanzania
Large saving in travel time 52.2% 67.3%Large saving in travel cost 58.2% 65.4%
Interestingly, the vast majority of those who did travel to seerelatives (85 percent for Tanzania and 79 percent for SouthAfrica) thought these relationships had improved anywaybecause of mobile phones. Only a very small number recorded adeterioration in the relationship with friends and relatives whoare now phoned rather than visited. A detailed analysis of tripssaved compared with call costs incurred would be an interestingarea of further work.
As an example, one respondent in Mafia Island, Tanzania, said hewas now able to keep in daily contact with his immediate family,who all lived in Dar es Salaam. Using his mobile phone, he isable to get information about his children’s progress at schooland what they are doing in their free time, thereby maintaining astrong relationship with them despite the distance. He felt that
mobile phones had saved him a lot of money as the cost ofgoing to Dar es Salaam, certainly in relation to calling with amobile phone, is high.
A number of respondents also used mobile phones to contactschools and universities. For example, mobile phones are usedby the students in Kwa Phake, to correspond with various tertiaryinstitutions such as UNISA (University of South Africa). Instead ofhaving to travel to these institutions they can easily accessinformation they need using a mobile phone. Monthly calls foreducational purposes in this particular community were made by31 per cent of respondents.
There were also examples of parents using phones to contactchildren boarding with relatives and attending school inneighbouring towns. Mobile phones enabled parents living intowns without fixed-line services to contact their children duringterm time. For example, in Rhodes, South Africa, one mother hada daughter attending school in Barkly East (about 60km away ondifficult roads) who boarded there with a relative. The very poorpublic phones in the community and limited public transportfacilities meant that mobile phones were the only way she couldregularly keep in contact with her daughter.
In Tanzania, a strikingly high proportion of respondents (57 percent) felt that a major impact from mobile phones wasfaster and improved communication. The proportion in SouthAfrica mentioning this as an impact was substantially lower at 8 percent. This probably reflects a greater presence andreliability of fixed-line phones in South Africa prior to theintroduction of mobile phone services.
Nevertheless, poor public phone services (using fixed-linephones) were cited by a number of respondents in South Africaas a key reason for relying on mobile phones. 17 percent ofrespondents in South Africa who do not own but use someoneelse’s mobile phone noted that problems with the public fixedline phones mean they now rely on a borrowed mobile if theyneed to make a call. Mobile phones also provided peace of mind to geographically isolated communities with poor fixed line facilities, with about a quarter of both the South African and Tanzanian respondents stating that mobiles were useful in emergencies.
Mobiles can also help to improve services in rural areas.For example, shared taxi drivers operating in Mango Parish,Tanzania, used their mobiles to request additional taxis to cometo the taxi stand when there were lots of people waiting fortransport, thus reducing their customers’ waiting time andincreasing their own income.
The responses revealed mobile phones to be important for jobsearch in South Africa. Altogether, 16 percent of respondentsvolunteered this as an impact and 24 percent of owners or usersalso said they had made or received a call about an
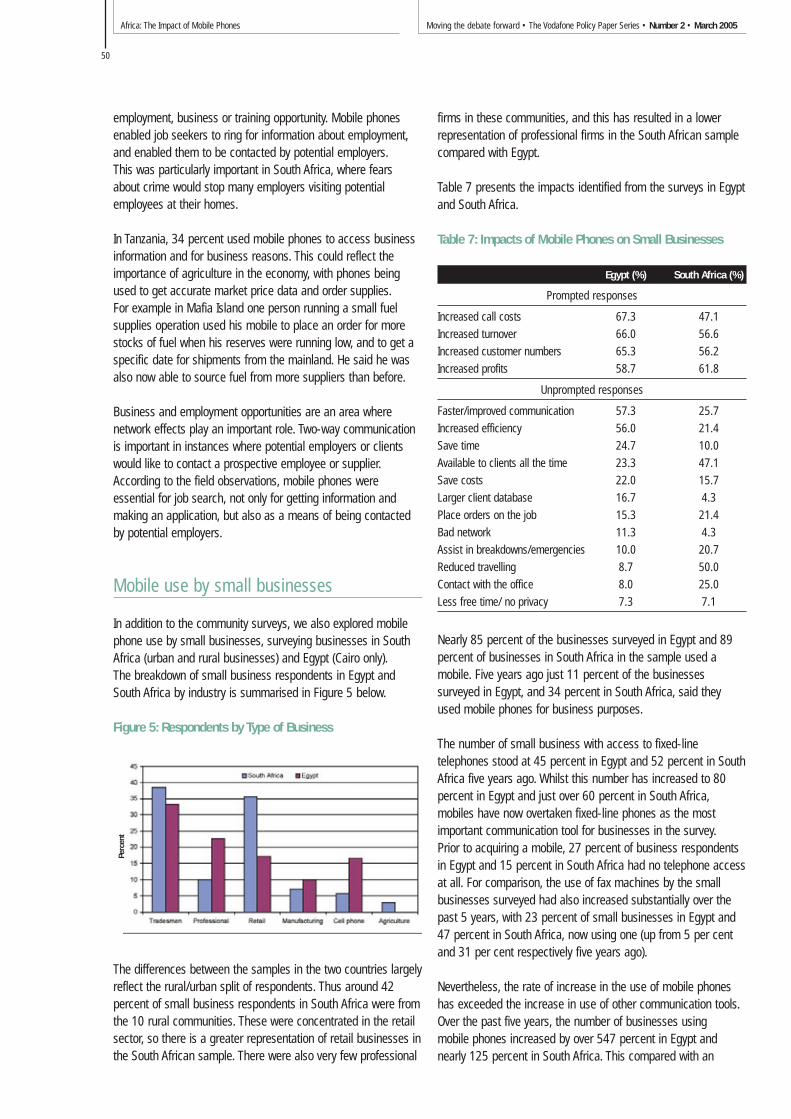
Africa: The Impact of Mobile Phones Moving the debate forward • The Vodafone Policy Paper Series • Number 2 • March 2005
50
employment, business or training opportunity. Mobile phonesenabled job seekers to ring for information about employment,and enabled them to be contacted by potential employers.This was particularly important in South Africa, where fearsabout crime would stop many employers visiting potentialemployees at their homes.
In Tanzania, 34 percent used mobile phones to access businessinformation and for business reasons. This could reflect theimportance of agriculture in the economy, with phones beingused to get accurate market price data and order supplies.For example in Mafia Island one person running a small fuelsupplies operation used his mobile to place an order for morestocks of fuel when his reserves were running low, and to get aspecific date for shipments from the mainland. He said he wasalso now able to source fuel from more suppliers than before.
Business and employment opportunities are an area wherenetwork effects play an important role. Two-way communicationis important in instances where potential employers or clientswould like to contact a prospective employee or supplier.According to the field observations, mobile phones wereessential for job search, not only for getting information andmaking an application, but also as a means of being contactedby potential employers.
Mobile use by small businesses
In addition to the community surveys, we also explored mobilephone use by small businesses, surveying businesses in SouthAfrica (urban and rural businesses) and Egypt (Cairo only).The breakdown of small business respondents in Egypt andSouth Africa by industry is summarised in Figure 5 below.
Figure 5: Respondents by Type of Business
The differences between the samples in the two countries largelyreflect the rural/urban split of respondents. Thus around 42percent of small business respondents in South Africa were fromthe 10 rural communities. These were concentrated in the retailsector, so there is a greater representation of retail businesses inthe South African sample. There were also very few professional
firms in these communities, and this has resulted in a lowerrepresentation of professional firms in the South African samplecompared with Egypt.
Table 7 presents the impacts identified from the surveys in Egyptand South Africa.
Table 7: Impacts of Mobile Phones on Small Businesses
Egypt (%) South Africa (%)
Prompted responses
Increased call costs 67.3 47.1
Increased turnover 66.0 56.6
Increased customer numbers 65.3 56.2
Increased profits 58.7 61.8
Unprompted responses
Faster/improved communication 57.3 25.7
Increased efficiency 56.0 21.4
Save time 24.7 10.0
Available to clients all the time 23.3 47.1
Save costs 22.0 15.7
Larger client database 16.7 4.3
Place orders on the job 15.3 21.4
Bad network 11.3 4.3
Assist in breakdowns/emergencies 10.0 20.7
Reduced travelling 8.7 50.0
Contact with the office 8.0 25.0
Less free time/ no privacy 7.3 7.1
Nearly 85 percent of the businesses surveyed in Egypt and 89percent of businesses in South Africa in the sample used amobile. Five years ago just 11 percent of the businessessurveyed in Egypt, and 34 percent in South Africa, said theyused mobile phones for business purposes.
The number of small business with access to fixed-linetelephones stood at 45 percent in Egypt and 52 percent in SouthAfrica five years ago. Whilst this number has increased to 80percent in Egypt and just over 60 percent in South Africa,mobiles have now overtaken fixed-line phones as the mostimportant communication tool for businesses in the survey.Prior to acquiring a mobile, 27 percent of business respondentsin Egypt and 15 percent in South Africa had no telephone accessat all. For comparison, the use of fax machines by the smallbusinesses surveyed had also increased substantially over thepast 5 years, with 23 percent of small businesses in Egypt and47 percent in South Africa, now using one (up from 5 per centand 31 per cent respectively five years ago).
Nevertheless, the rate of increase in the use of mobile phoneshas exceeded the increase in use of other communication tools.Over the past five years, the number of businesses using mobile phones increased by over 547 percent in Egypt andnearly 125 percent in South Africa. This compared with an
Perc
ent
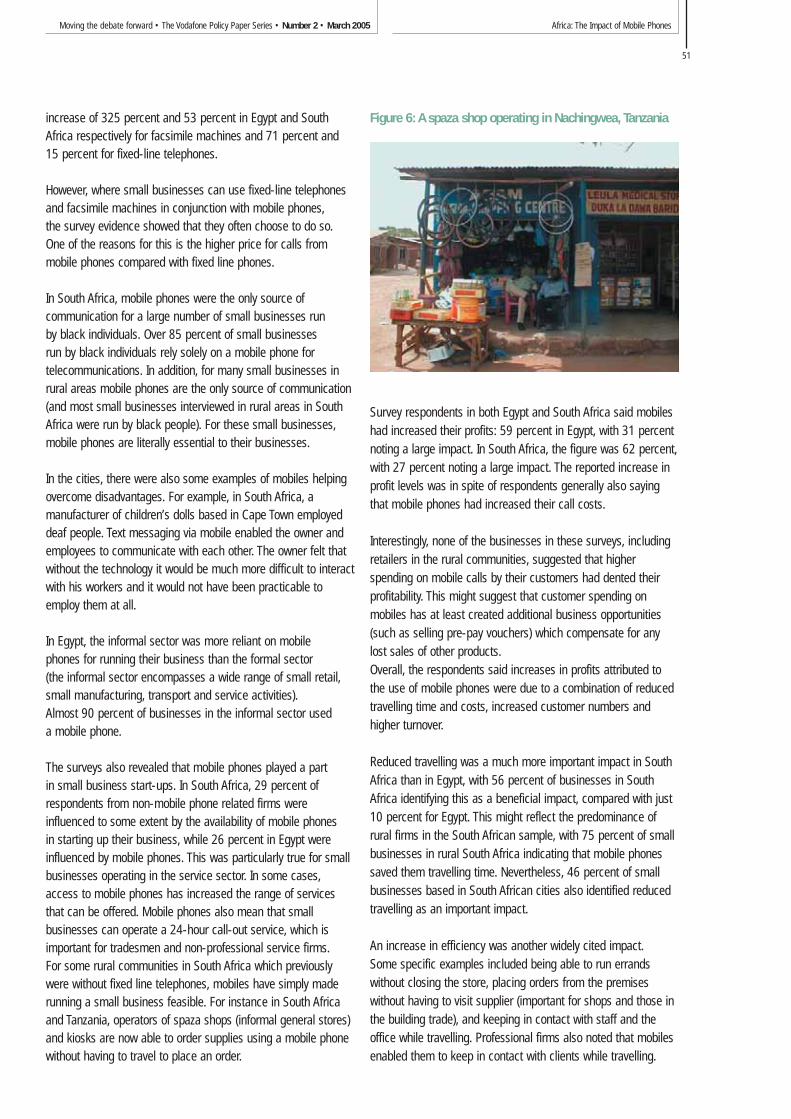
Africa: The Impact of Mobile PhonesMoving the debate forward • The Vodafone Policy Paper Series • Number 2 • March 2005
51
increase of 325 percent and 53 percent in Egypt and SouthAfrica respectively for facsimile machines and 71 percent and15 percent for fixed-line telephones.
However, where small businesses can use fixed-line telephonesand facsimile machines in conjunction with mobile phones,the survey evidence showed that they often choose to do so.One of the reasons for this is the higher price for calls frommobile phones compared with fixed line phones.
In South Africa, mobile phones were the only source ofcommunication for a large number of small businesses run by black individuals. Over 85 percent of small businesses run by black individuals rely solely on a mobile phone fortelecommunications. In addition, for many small businesses inrural areas mobile phones are the only source of communication(and most small businesses interviewed in rural areas in SouthAfrica were run by black people). For these small businesses,mobile phones are literally essential to their businesses.
In the cities, there were also some examples of mobiles helpingovercome disadvantages. For example, in South Africa, amanufacturer of children’s dolls based in Cape Town employeddeaf people. Text messaging via mobile enabled the owner andemployees to communicate with each other. The owner felt thatwithout the technology it would be much more difficult to interactwith his workers and it would not have been practicable toemploy them at all.
In Egypt, the informal sector was more reliant on mobile phones for running their business than the formal sector (the informal sector encompasses a wide range of small retail,small manufacturing, transport and service activities).Almost 90 percent of businesses in the informal sector used a mobile phone.
The surveys also revealed that mobile phones played a part in small business start-ups. In South Africa, 29 percent ofrespondents from non-mobile phone related firms wereinfluenced to some extent by the availability of mobile phones in starting up their business, while 26 percent in Egypt wereinfluenced by mobile phones. This was particularly true for smallbusinesses operating in the service sector. In some cases,access to mobile phones has increased the range of servicesthat can be offered. Mobile phones also mean that smallbusinesses can operate a 24-hour call-out service, which isimportant for tradesmen and non-professional service firms.For some rural communities in South Africa which previouslywere without fixed line telephones, mobiles have simply maderunning a small business feasible. For instance in South Africaand Tanzania, operators of spaza shops (informal general stores)and kiosks are now able to order supplies using a mobile phonewithout having to travel to place an order.
Figure 6: A spaza shop operating in Nachingwea, Tanzania
Survey respondents in both Egypt and South Africa said mobileshad increased their profits: 59 percent in Egypt, with 31 percentnoting a large impact. In South Africa, the figure was 62 percent,with 27 percent noting a large impact. The reported increase inprofit levels was in spite of respondents generally also sayingthat mobile phones had increased their call costs.
Interestingly, none of the businesses in these surveys, includingretailers in the rural communities, suggested that higherspending on mobile calls by their customers had dented theirprofitability. This might suggest that customer spending onmobiles has at least created additional business opportunities(such as selling pre-pay vouchers) which compensate for anylost sales of other products.Overall, the respondents said increases in profits attributed tothe use of mobile phones were due to a combination of reducedtravelling time and costs, increased customer numbers andhigher turnover.
Reduced travelling was a much more important impact in SouthAfrica than in Egypt, with 56 percent of businesses in SouthAfrica identifying this as a beneficial impact, compared with just10 percent for Egypt. This might reflect the predominance ofrural firms in the South African sample, with 75 percent of smallbusinesses in rural South Africa indicating that mobile phonessaved them travelling time. Nevertheless, 46 percent of smallbusinesses based in South African cities also identified reducedtravelling as an important impact.
An increase in efficiency was another widely cited impact.Some specific examples included being able to run errandswithout closing the store, placing orders from the premiseswithout having to visit supplier (important for shops and those inthe building trade), and keeping in contact with staff and theoffice while travelling. Professional firms also noted that mobilesenabled them to keep in contact with clients while travelling.
Africa: The Impact of Mobile Phones Moving the debate forward • The Vodafone Policy Paper Series • Number 2 • March 2005
52
Conclusions
The results of the surveys suggest that mobiles have broughtconsiderable benefits to communities and small businesses.People at all income levels are able to access mobile services,either through owning or sharing a phone; and gender, age and education do not seem to constitute barriers to access.While income certainly explains the level of usage, lack ofincome does not prevent mobile use. Even the absence ofelectricity does not present an insurmountable barrier, thanks tothe sharing of mobiles and recharging batteries in the nearesttown, or recharging locally by a generator or car battery.For the residents of the rural communities, mobile phones have typically had positive economic and social impacts. Mobileshave reduced travel needs, assisted job hunting and providedbetter access to business information. Greater ease of contactwith family and friends has improved relationships. Thesebenefits were reported even though the communities surveyedwere amongst the poorest in their countries.
Mobile phones have also become an essential tool for smallbusinesses. A substantial proportion of small businesses have noalternative method of communication. The proportion is highestfor black-owned businesses in South Africa and informal sectorbusinesses in Egypt, suggesting that mobiles have become animportant tool for disadvantaged groups. A large majority ofsmall businesses said mobiles have brought higher profits,turnover and increased efficiency, although they are also payinghigher call charges.
Notes
1 Income and Expenditure of Households 2000, Statistics South Africa, release P0111, 2002.
Africa: The Impact of Mobile PhonesMoving the debate forward • The Vodafone Policy Paper Series • Number 2 • March 2005
53
Introduction: what is social capital?
Human activity uses a variety of resources to achieve differentends. For example, financial capital is one of those resources,accumulated over time for drawing on when needed.Environmentalists use the concept of natural capital to mean theresources of the natural world such as clean air or trees, whichwe can invest in, use, and deplete. The idea of social capitalrefers to those social resources that likewise we invest in,accumulate, draw down and sometimes deplete. Social capitalrepresents the intangible value of the social group, on whateverscale, above and beyond the value of its individual membersalone. It can be thought of generally as the social resourcesavailable for human activity.
The term was first used in 1916, when Lyda Judson Hanifan, aWest Virgina school superintendent, published a discussion ofthe role of schools as community centres. He noted that highlevels of participation among local people in school affairs notonly led to improved support for the school, but also to generalimprovements in the school’s wider community: there was anunintended social spillover. He coined the term social capital todescribe this, and later defined it as a combination of “goodwill,fellowship, sympathy, and social intercourse among theindividuals and families who make up a social unit”.
In the past decade social capital has become one of the mostsalient concepts in the social sciences. The American sociologistRobert Putnam has done most to promote the revival of the ideaof social capital. He looked at a wide range of indicators in theUSA such as membership of voluntary associations, participationin community affairs, trust of strangers and so on, and in hiswell-known book, “Bowling Alone: The collapse and revival ofAmerican Community,” used these to argue there had been adecline in social capital in America. He identified a number ofcauses for this decline – chief among them too much televisionwatching – and proposed means by which the decline might bearrested. For Putnam, the key to a healthy society is participationin social groups, and he has advised national governments
around the world (including the UK) on how to promotecommunity participation.
The concept of social capital appeals to sociologists, economistsand political scientists alike; one of its strengths is to bring thesedisciplines together. A weakness, however, is the lack of aprecise definition. Putnam defines it as “features of social life –networks, norms and trust – that enable participants to acttogether more effectively to pursue shared objectives.” 1
Francis Fukuyama calls it “an instantiated informal norm thatpromotes cooperation between two or more individuals” 2.Michael Woolcock, a sociologist working for the World Bank,refers to “the information, trust, and norms of reciprocity inheringin one’s social networks” 3. Economists are interested in socialcapital for its contribution to productivity, and define it as thespillover from the individual to the group, a sort of socialexternality or network effect.4
Most definitions include a structural element supporting acognitive element. A parallel might be with the road network andtraffic flowing on it, as the structural element, and the laws andunwritten rules of the road as the cognitive element. Thestructural element of social capital is made up of social networksand relationships: friendship networks, families, neighbourhoodsor communities, companies, social groups, political groups, andso on. These are all forms of association, organised in order toachieve certain ends: to provide support, to distribute products ordisseminate an idea, for example. The cognitive elementcomprises a range of social attitudes, relating to a willingness totrust other people and shared values and norms. Successfulparticipation in a social network creates trust, which can then beinvested back into the social network to grow the capital,strengthening and growing the network.
These definitions make it clear that social capital might be auseful way of understanding the social role of mobile phones.Mobile phones are used to mediate contact between differentpeople, and so are likely to have an effect on the size, numberand nature of social networks that people participate in. This in
James Goodman
Linking mobile phone ownership anduse to social capital in rural SouthAfrica and Tanzania
Africa: The Impact of Mobile Phones Moving the debate forward • The Vodafone Policy Paper Series • Number 2 • March 2005
54
turn may affect levels of trust. Social capital may also provide anindicator of where take-up of mobile telephony could be higher.
What’s the use of social capital?
The literature generally agrees that high levels of social capitalcan result in desirable socio-economic outcomes. According to a2001 review by the UK Office for National Statistics, “Socialcapital has a well-established relationship with the outcomespolicy makers are concerned with e.g. economic growth, socialexclusion, better health and wellbeing.” 5 The 2002 Policy andInnovation Unit (PIU, now the Strategy Unit) report on socialcapital for the UK government identified six general benefits,supported to a varying degree by empirical research:
1. It may facilitate better economic performance, for examplethrough reducing transaction costs, enabling the mobilisationof resources and facilitating the rapid movement ofinformation.
2. It may facilitate the more efficient functioning of job markets,for example by reducing search costs.
3. It may facilitate educational attainment;4. It may contribute to lower levels of crime;5. It may lead to better health;6. It may improve the effectiveness of institutions of
government.
Research in rural Tanzania has suggested that increased levelsof community participation lead to higher household incomes.6
There appear to be strong correlations between national levels ofsocial capital, measured in terms of trust, and socio-economicdevelopment. The World Values Survey includes the question,“Generally speaking, would you say that most people can betrusted, or that you can’t be too careful in dealing with people?”.The top-scoring countries on the trust measure also tend to becountries with high GDP. In 1996, the top scoring country wasNorway, with 65 per cent of people answering that most peoplecould be trusted. Next came Sweden, Denmark, Netherlands andCanada, all with scores of over 50 per cent. Ireland scored 47per cent, Australia 40 per cent, the USA 36 per cent and the UK31 per cent. In contrast, less developed countries scored muchlower. In Turkey, trust was recorded at six per cent and in Brazilat just three per cent.7
Consequently, development organisations and governments havebecome intensely interested in social capital. The World Bank,for example, has sponsored a great deal of research on therelationship between social capital and macro-level outcomes.It has an extensive area of its website dedicated to social capital,featuring the results of this research as well as guidance on theliterature, and tools to help with the measurement of socialcapital. The Bank aims to promote the use of social capitalanalysis to aid social and economic development in developing
countries, and to counteract poverty. The World Bank and otherorganisations, such as the OECD, have been followed by anumber of national governments keen to understand howunderstanding social capital can aid successful policy-making.These include the Australian and Irish governments, forexample.8
In the UK, the PIU report identified many areas where anunderstanding of social capital could inform public policy.Suggestions included encouraging mentoring schemes to buildlinks across communities; promoting schools as communitycentres; and reforming the criminal justice system so thatconvicted criminals can maintain support networks, anddiscouraging the development of “criminal social capital”.
The report also included one proposal involving mobile phones:“Mobile telephones could have emergency help keys or codesthat would activate the nearest five phones to indicate that theholder is in danger and needs assistance. Receivers of thedistress signal would be expected to respond, at least toestablish what the problem is or call the police. The schemewould break down the “diffusion of responsibility” that inhibitsstrangers helping each other in times of personal emergencies –using technology to strengthen social norms of reciprocity andtrust within the wider community.” 9
Social capital may be an even more important concept fordeveloping countries than developed, as in many cases people inthe former have less access to formalised structures of supportsuch as the legal system or the financial system, and may relyon informal networks instead.
Social capital and mobile phones
Mobile phones are a communications technology, and as suchthey facilitate social networks, so there is likely to be a link withsocial capital. However, research on the social role of informationand communication technologies has so far has been heavilybiased towards the internet.
Optimistic assumptions that the development of virtualcommunities online would create whole new forms of socialcapital have so far been a red herring. However, there is fruitfulresearch on how internet use affects social behaviour, and howsocial tools on the internet – “social software” – can be used tobuild social capital.
The US research project, Syntopia, conducted by James Katz and Ronald Rice from Rutgers University,10 analysed the socialbehaviour of users and non-users of the internet between 1995and 2000. The research identified a clear trend: long-term use of the internet was associated with more, not less, frequentsocializing; and the same or a higher level of political and civilsociety involvement. Internet users were more likely to go out

Africa: The Impact of Mobile PhonesMoving the debate forward • The Vodafone Policy Paper Series • Number 2 • March 2005
55
and see friends, although the study found that they also spentmore time away from their local community and generally knewfewer of their neighbours.10 Syntopia’s findings are supported byresearch carried out by the Pew Institute’s Internet and AmericanLife Project, which concluded that the use of email enhancedusers’ contact with family and friends and that email usersgenerally had a richer social life.
Keith Hampton of the Massachusetts Institute of Technology(MIT) led a study specifically into the use of ICT in a communitycontext. He spent two years living in a suburb of Toronto wiredwith wide-band internet access, observing the activity of otherresidents to try and find out whether online activity cansupplement offline contact and help revive communities.The research found that: “The local computer network was usedby residents as a means to exchange introductions, organizebarbecues and parties, search for missing pets [etc]… Ratherthan isolating people in their homes, CMC [computer mediatedcommunication] encourages visiting, surveillance, neighbourrecognition and the maintenance of local social ties.” 11
There has been less attention paid to the mobile phone, whichmay be explained by the fact that widespread mobile penetrationoccurred later and also because mobile is not as prevalent in theUS – where much of the social capital literature originates – asin many other countries. However, there is a rich literature on the social impacts of the fixed-line telephone. It describes, forexample, the role of the telephone in empowering middle classwomen,12 expanding activities in the local community andbeyond, reducing loneliness and anxiety and strengthening social ties.13
One European Commission funded study has collected data onsocial capital and use of different ICTs in several Europeancountries. It suggested that access to social capital is becomingmore individualised, with people less dependent on formalgroupings and more involved in loose, spur of the momentassociation. “Mobile communication plays into this approach,since it allows a more flexible form of communication,” writesthe study’s author Richard Ling of Norwegian mobile operatorTelenor. He continues, “It allows one to fit sociation into thenooks and crannies of everyday life and possibly obviates theneed for social contact in the context of other, more formalinstitutions.” 14 A later report based on the same data showed apositive relationship between communication with friends andquality of life, but a direct link to mobile was not established:“In no country did acquiring a mobile phone, internet access orbroadband internet have any positive effect on overall quality of life”.15
It is possible that mobile telephones are having a morepronounced impact in countries where communicationsinfrastructure has hitherto been less extensive. Most of westernEurope has had a dense fixed-line network for some decades,but large numbers of telephones are a very recent phenomenon
in countries such as Tanzania. The introduction of mobiletelephony might therefore be expected to have importantconsequences. Many studies have already suggested this, forexample Sadie Plant’s investigation of the mobile phoneundertaken for handset manufacturer Motorola.16
Mobiles and social capital in South Africaand Tanzania
We aimed to use the concept of social capital as a framework forunderstanding the social impacts of mobile phones, theoreticallyconnecting the localised social impacts with wider socio-economic changes. The results shed light on the social impact ofmobile, and also suggest the concept of social capital might offerguidance for companies and governments wishing to understandthe indirect impacts of mobile products and services.
Questions pertaining to different aspects of social capital,specifically social networks, group participation and socialattitudes including generalised trust, were included in thecommunity questionnaires, used in surveys in South Africa andTanzania.
One of the objectives of the research was to assess theimportance of mobile phones relative to other communicationmeans. To this end, we asked a number of questions aboutgeneral communicaton habits, including the amount of face-to-face contact respondents thought they had with various differenttypes of people.
The responses in South Africa and Tanzania were broadly similar:there was very frequent face-to-face communication with family,close friends and others living within the community. Face-to-face contact with others outside the community was less regular,as was contact with tradesmen and figures of authority.
South Africa Tanzania
(% communicating (% communicating
Face to face “frequently” or “somewhat” or
communication “very frequently” “very often”
with… face to face) face to face) 17
Family 81% 87%
Close friends 77% 89%
Others in the community 81% 96%
Others outside of the community 25% 22%
Businessmen or tradesmen 19% 21%
Government services(inc doctors, teachers) 28% 8%
Police or security 16% 5%
Table 1 Percentage of respondents communicatingfrequently or very frequently face-to-face in South Africa(252) and Tanzania (223).
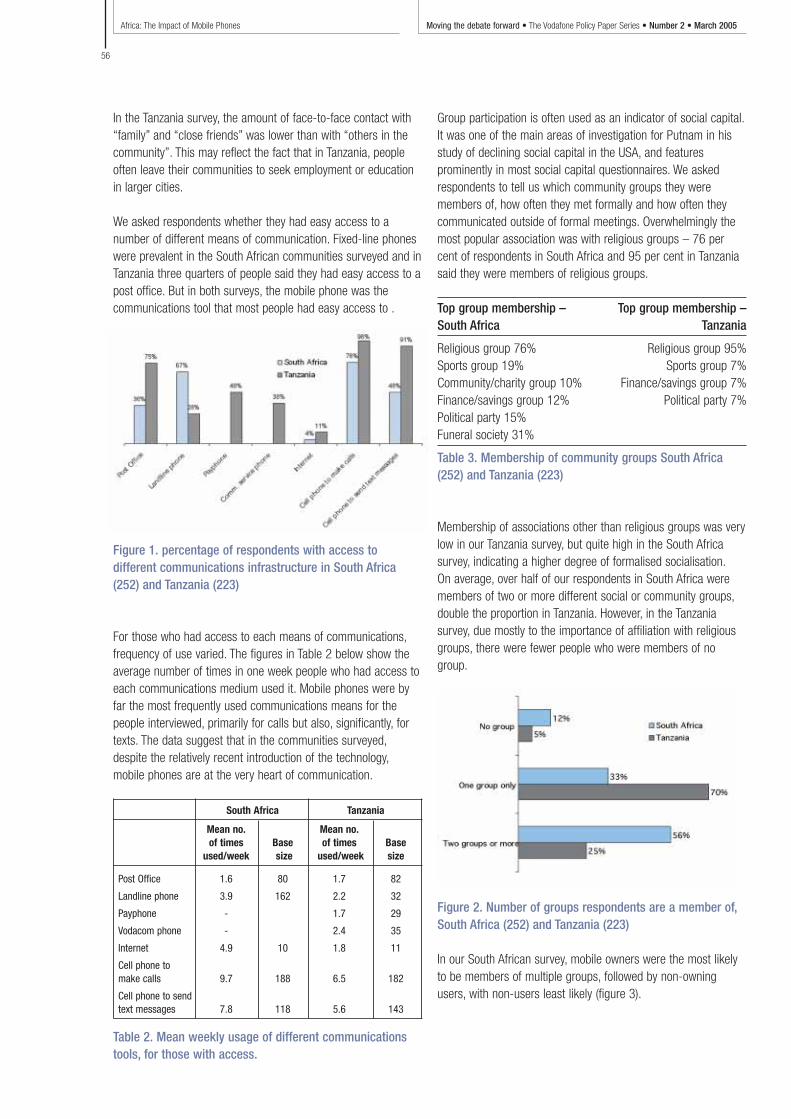
Africa: The Impact of Mobile Phones Moving the debate forward • The Vodafone Policy Paper Series • Number 2 • March 2005
56
In the Tanzania survey, the amount of face-to-face contact with“family” and “close friends” was lower than with “others in thecommunity”. This may reflect the fact that in Tanzania, peopleoften leave their communities to seek employment or educationin larger cities.
We asked respondents whether they had easy access to anumber of different means of communication. Fixed-line phoneswere prevalent in the South African communities surveyed and inTanzania three quarters of people said they had easy access to apost office. But in both surveys, the mobile phone was thecommunications tool that most people had easy access to .
Figure 1. percentage of respondents with access todifferent communications infrastructure in South Africa(252) and Tanzania (223)
For those who had access to each means of communications,frequency of use varied. The figures in Table 2 below show theaverage number of times in one week people who had access toeach communications medium used it. Mobile phones were byfar the most frequently used communications means for thepeople interviewed, primarily for calls but also, significantly, fortexts. The data suggest that in the communities surveyed,despite the relatively recent introduction of the technology,mobile phones are at the very heart of communication.
South Africa Tanzania
Mean no. Mean no.of times Base of times Base
used/week size used/week size
Post Office 1.6 80 1.7 82
Landline phone 3.9 162 2.2 32
Payphone - 1.7 29
Vodacom phone - 2.4 35
Internet 4.9 10 1.8 11
Cell phone to make calls 9.7 188 6.5 182
Cell phone to sendtext messages 7.8 118 5.6 143
Table 2. Mean weekly usage of different communicationstools, for those with access.
Group participation is often used as an indicator of social capital.It was one of the main areas of investigation for Putnam in hisstudy of declining social capital in the USA, and featuresprominently in most social capital questionnaires. We askedrespondents to tell us which community groups they weremembers of, how often they met formally and how often theycommunicated outside of formal meetings. Overwhelmingly themost popular association was with religious groups – 76 percent of respondents in South Africa and 95 per cent in Tanzaniasaid they were members of religious groups.
Top group membership – Top group membership – South Africa Tanzania
Religious group 76% Religious group 95%Sports group 19% Sports group 7%Community/charity group 10% Finance/savings group 7% Finance/savings group 12% Political party 7%Political party 15%Funeral society 31%
Table 3. Membership of community groups South Africa(252) and Tanzania (223)
Membership of associations other than religious groups was verylow in our Tanzania survey, but quite high in the South Africasurvey, indicating a higher degree of formalised socialisation.On average, over half of our respondents in South Africa weremembers of two or more different social or community groups,double the proportion in Tanzania. However, in the Tanzaniasurvey, due mostly to the importance of affiliation with religiousgroups, there were fewer people who were members of nogroup.
Figure 2. Number of groups respondents are a member of,South Africa (252) and Tanzania (223)
In our South African survey, mobile owners were the most likelyto be members of multiple groups, followed by non-owningusers, with non-users least likely (figure 3).
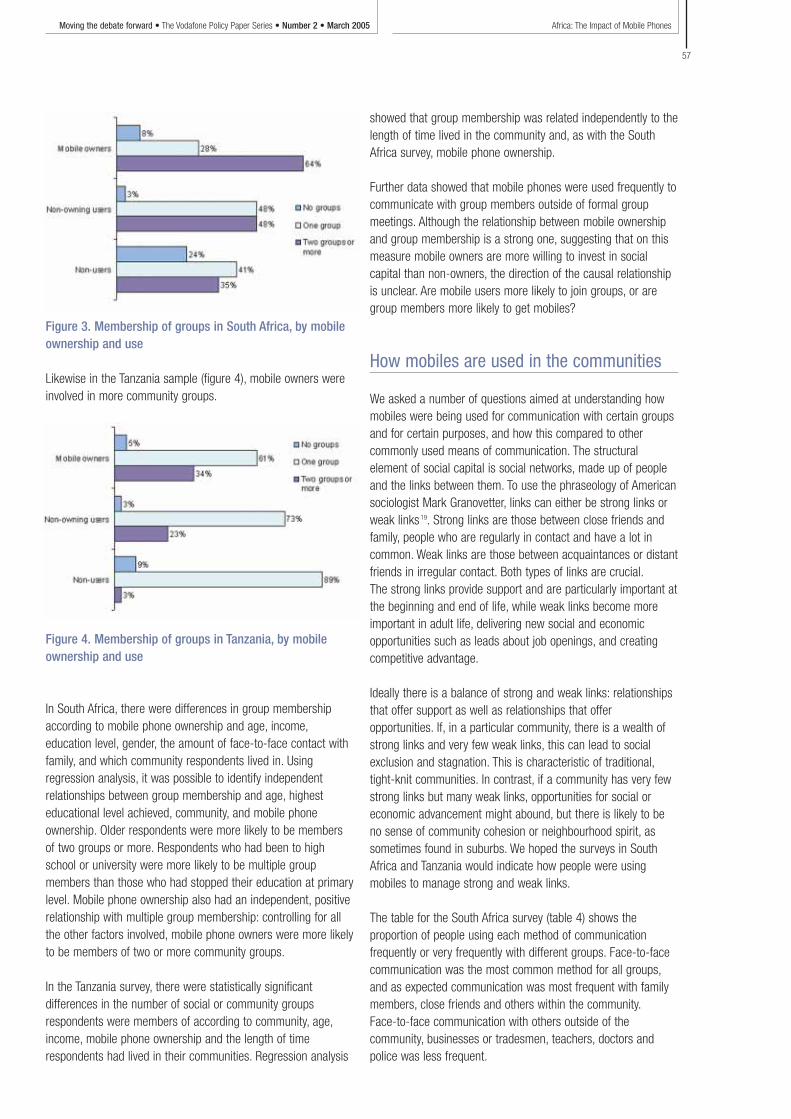
Africa: The Impact of Mobile PhonesMoving the debate forward • The Vodafone Policy Paper Series • Number 2 • March 2005
57
Figure 3. Membership of groups in South Africa, by mobileownership and use
Likewise in the Tanzania sample (figure 4), mobile owners wereinvolved in more community groups.
Figure 4. Membership of groups in Tanzania, by mobileownership and use
In South Africa, there were differences in group membershipaccording to mobile phone ownership and age, income,education level, gender, the amount of face-to-face contact withfamily, and which community respondents lived in. Usingregression analysis, it was possible to identify independentrelationships between group membership and age, highesteducational level achieved, community, and mobile phoneownership. Older respondents were more likely to be membersof two groups or more. Respondents who had been to highschool or university were more likely to be multiple groupmembers than those who had stopped their education at primarylevel. Mobile phone ownership also had an independent, positiverelationship with multiple group membership: controlling for allthe other factors involved, mobile phone owners were more likelyto be members of two or more community groups.
In the Tanzania survey, there were statistically significantdifferences in the number of social or community groupsrespondents were members of according to community, age,income, mobile phone ownership and the length of timerespondents had lived in their communities. Regression analysis
showed that group membership was related independently to thelength of time lived in the community and, as with the SouthAfrica survey, mobile phone ownership.
Further data showed that mobile phones were used frequently tocommunicate with group members outside of formal groupmeetings. Although the relationship between mobile ownershipand group membership is a strong one, suggesting that on thismeasure mobile owners are more willing to invest in socialcapital than non-owners, the direction of the causal relationshipis unclear. Are mobile users more likely to join groups, or aregroup members more likely to get mobiles?
How mobiles are used in the communities
We asked a number of questions aimed at understanding howmobiles were being used for communication with certain groupsand for certain purposes, and how this compared to othercommonly used means of communication. The structuralelement of social capital is social networks, made up of peopleand the links between them. To use the phraseology of Americansociologist Mark Granovetter, links can either be strong links orweak links 19. Strong links are those between close friends andfamily, people who are regularly in contact and have a lot incommon. Weak links are those between acquaintances or distantfriends in irregular contact. Both types of links are crucial.The strong links provide support and are particularly important atthe beginning and end of life, while weak links become moreimportant in adult life, delivering new social and economicopportunities such as leads about job openings, and creatingcompetitive advantage.
Ideally there is a balance of strong and weak links: relationshipsthat offer support as well as relationships that offeropportunities. If, in a particular community, there is a wealth ofstrong links and very few weak links, this can lead to socialexclusion and stagnation. This is characteristic of traditional,tight-knit communities. In contrast, if a community has very fewstrong links but many weak links, opportunities for social oreconomic advancement might abound, but there is likely to beno sense of community cohesion or neighbourhood spirit, assometimes found in suburbs. We hoped the surveys in SouthAfrica and Tanzania would indicate how people were usingmobiles to manage strong and weak links.
The table for the South Africa survey (table 4) shows theproportion of people using each method of communicationfrequently or very frequently with different groups. Face-to-facecommunication was the most common method for all groups,and as expected communication was most frequent with familymembers, close friends and others within the community.Face-to-face communication with others outside of thecommunity, businesses or tradesmen, teachers, doctors andpolice was less frequent.
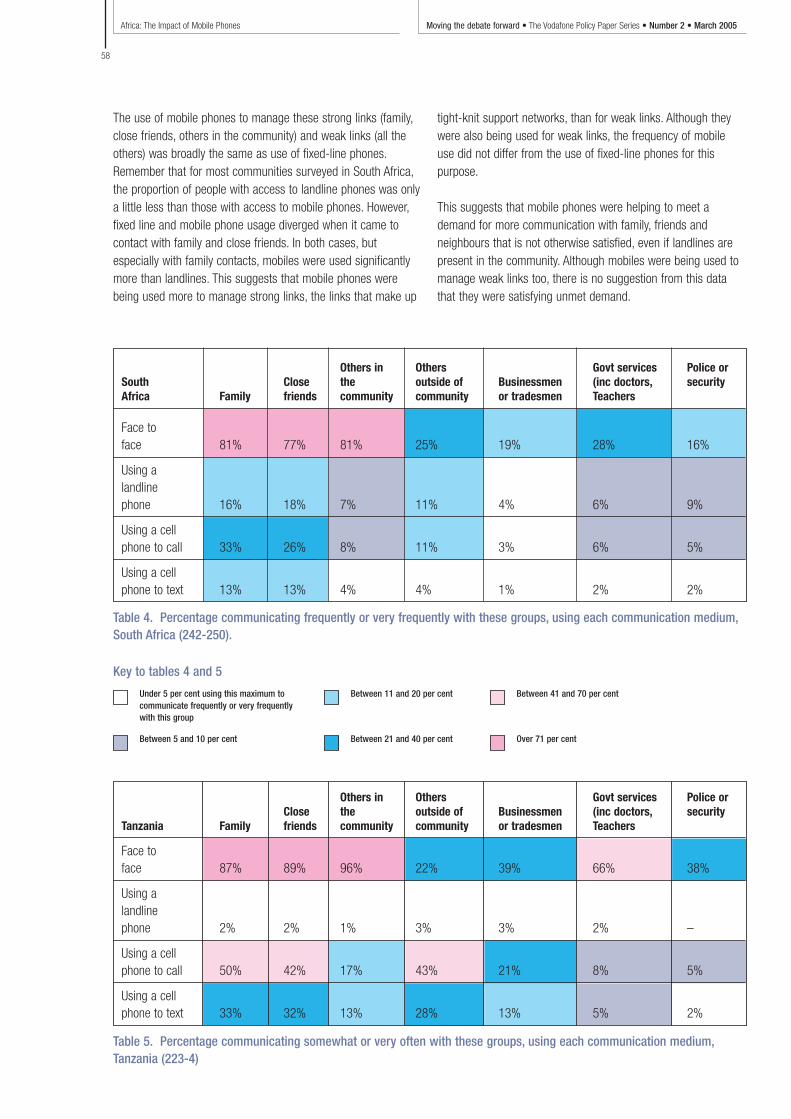
Africa: The Impact of Mobile Phones Moving the debate forward • The Vodafone Policy Paper Series • Number 2 • March 2005
58
The use of mobile phones to manage these strong links (family,close friends, others in the community) and weak links (all theothers) was broadly the same as use of fixed-line phones.Remember that for most communities surveyed in South Africa,the proportion of people with access to landline phones was onlya little less than those with access to mobile phones. However,fixed line and mobile phone usage diverged when it came tocontact with family and close friends. In both cases, butespecially with family contacts, mobiles were used significantlymore than landlines. This suggests that mobile phones werebeing used more to manage strong links, the links that make up
tight-knit support networks, than for weak links. Although theywere also being used for weak links, the frequency of mobile use did not differ from the use of fixed-line phones for thispurpose.
This suggests that mobile phones were helping to meet ademand for more communication with family, friends andneighbours that is not otherwise satisfied, even if landlines arepresent in the community. Although mobiles were being used tomanage weak links too, there is no suggestion from this datathat they were satisfying unmet demand.
Table 4. Percentage communicating frequently or very frequently with these groups, using each communication medium,South Africa (242-250).
Table 5. Percentage communicating somewhat or very often with these groups, using each communication medium,Tanzania (223-4)
Key to tables 4 and 5
Others in Others Govt services Police or South Close the outside of Businessmen (inc doctors, securityAfrica Family friends community community or tradesmen Teachers
Face toface 81% 77% 81% 25% 19% 28% 16%
Using alandlinephone 16% 18% 7% 11% 4% 6% 9%
Using a cellphone to call 33% 26% 8% 11% 3% 6% 5%
Using a cellphone to text 13% 13% 4% 4% 1% 2% 2%
Under 5 per cent using this maximum tocommunicate frequently or very frequentlywith this group
Between 11 and 20 per cent Between 41 and 70 per cent
Over 71 per centBetween 21 and 40 per centBetween 5 and 10 per cent
Others in Others Govt services Police or Close the outside of Businessmen (inc doctors, security
Tanzania Family friends community community or tradesmen Teachers
Face toface 87% 89% 96% 22% 39% 66% 38%
Using alandlinephone 2% 2% 1% 3% 3% 2% –
Using a cellphone to call 50% 42% 17% 43% 21% 8% 5%
Using a cellphone to text 33% 32% 13% 28% 13% 5% 2%
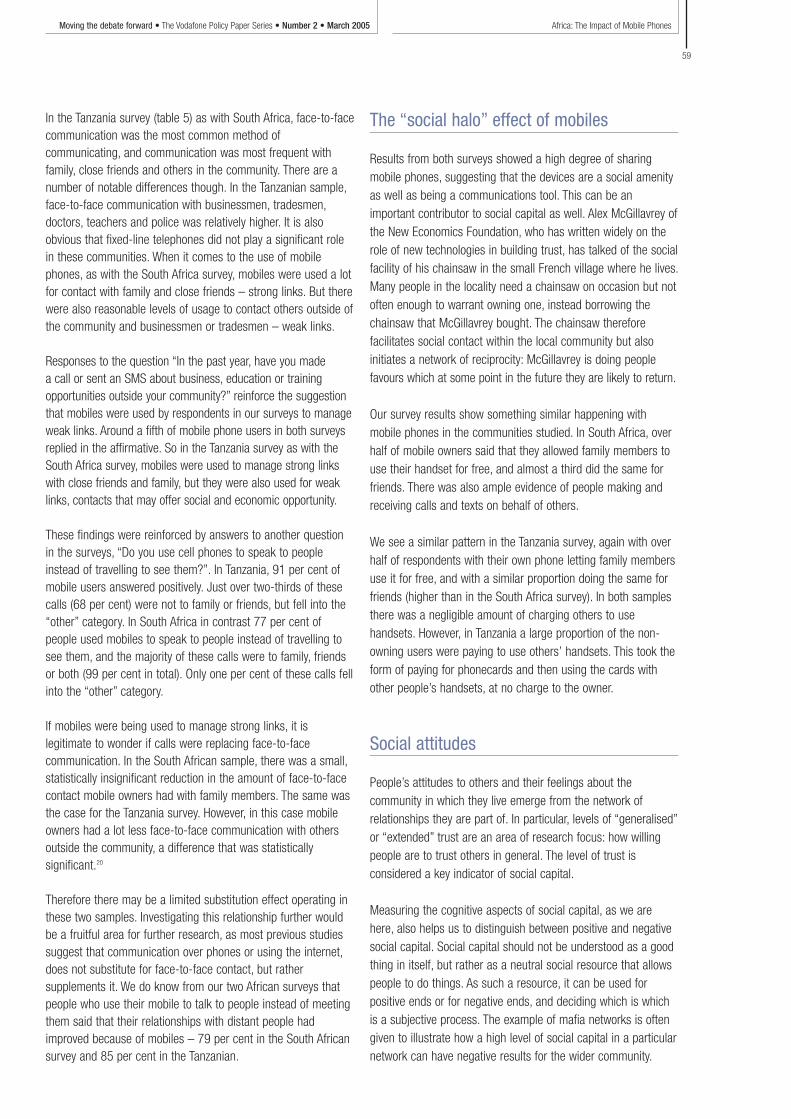
Africa: The Impact of Mobile PhonesMoving the debate forward • The Vodafone Policy Paper Series • Number 2 • March 2005
59
In the Tanzania survey (table 5) as with South Africa, face-to-facecommunication was the most common method ofcommunicating, and communication was most frequent withfamily, close friends and others in the community. There are anumber of notable differences though. In the Tanzanian sample,face-to-face communication with businessmen, tradesmen,doctors, teachers and police was relatively higher. It is alsoobvious that fixed-line telephones did not play a significant rolein these communities. When it comes to the use of mobilephones, as with the South Africa survey, mobiles were used a lotfor contact with family and close friends – strong links. But therewere also reasonable levels of usage to contact others outside ofthe community and businessmen or tradesmen – weak links.
Responses to the question “In the past year, have you made a call or sent an SMS about business, education or trainingopportunities outside your community?” reinforce the suggestionthat mobiles were used by respondents in our surveys to manageweak links. Around a fifth of mobile phone users in both surveysreplied in the affirmative. So in the Tanzania survey as with theSouth Africa survey, mobiles were used to manage strong linkswith close friends and family, but they were also used for weaklinks, contacts that may offer social and economic opportunity.
These findings were reinforced by answers to another questionin the surveys, “Do you use cell phones to speak to peopleinstead of travelling to see them?”. In Tanzania, 91 per cent ofmobile users answered positively. Just over two-thirds of thesecalls (68 per cent) were not to family or friends, but fell into the“other” category. In South Africa in contrast 77 per cent ofpeople used mobiles to speak to people instead of travelling tosee them, and the majority of these calls were to family, friendsor both (99 per cent in total). Only one per cent of these calls fellinto the “other” category.
If mobiles were being used to manage strong links, it islegitimate to wonder if calls were replacing face-to-facecommunication. In the South African sample, there was a small,statistically insignificant reduction in the amount of face-to-facecontact mobile owners had with family members. The same wasthe case for the Tanzania survey. However, in this case mobileowners had a lot less face-to-face communication with othersoutside the community, a difference that was statisticallysignificant.20
Therefore there may be a limited substitution effect operating inthese two samples. Investigating this relationship further wouldbe a fruitful area for further research, as most previous studiessuggest that communication over phones or using the internet,does not substitute for face-to-face contact, but rathersupplements it. We do know from our two African surveys thatpeople who use their mobile to talk to people instead of meetingthem said that their relationships with distant people hadimproved because of mobiles – 79 per cent in the South Africansurvey and 85 per cent in the Tanzanian.
The “social halo” effect of mobiles
Results from both surveys showed a high degree of sharingmobile phones, suggesting that the devices are a social amenityas well as being a communications tool. This can be animportant contributor to social capital as well. Alex McGillavrey ofthe New Economics Foundation, who has written widely on therole of new technologies in building trust, has talked of the socialfacility of his chainsaw in the small French village where he lives.Many people in the locality need a chainsaw on occasion but notoften enough to warrant owning one, instead borrowing thechainsaw that McGillavrey bought. The chainsaw thereforefacilitates social contact within the local community but alsoinitiates a network of reciprocity: McGillavrey is doing peoplefavours which at some point in the future they are likely to return.
Our survey results show something similar happening withmobile phones in the communities studied. In South Africa, overhalf of mobile owners said that they allowed family members touse their handset for free, and almost a third did the same forfriends. There was also ample evidence of people making andreceiving calls and texts on behalf of others.
We see a similar pattern in the Tanzania survey, again with overhalf of respondents with their own phone letting family membersuse it for free, and with a similar proportion doing the same forfriends (higher than in the South Africa survey). In both samplesthere was a negligible amount of charging others to usehandsets. However, in Tanzania a large proportion of the non-owning users were paying to use others’ handsets. This took theform of paying for phonecards and then using the cards withother people’s handsets, at no charge to the owner.
Social attitudes
People’s attitudes to others and their feelings about thecommunity in which they live emerge from the network ofrelationships they are part of. In particular, levels of “generalised”or “extended” trust are an area of research focus: how willingpeople are to trust others in general. The level of trust isconsidered a key indicator of social capital.
Measuring the cognitive aspects of social capital, as we arehere, also helps us to distinguish between positive and negativesocial capital. Social capital should not be understood as a goodthing in itself, but rather as a neutral social resource that allowspeople to do things. As such a resource, it can be used forpositive ends or for negative ends, and deciding which is whichis a subjective process. The example of mafia networks is oftengiven to illustrate how a high level of social capital in a particularnetwork can have negative results for the wider community.
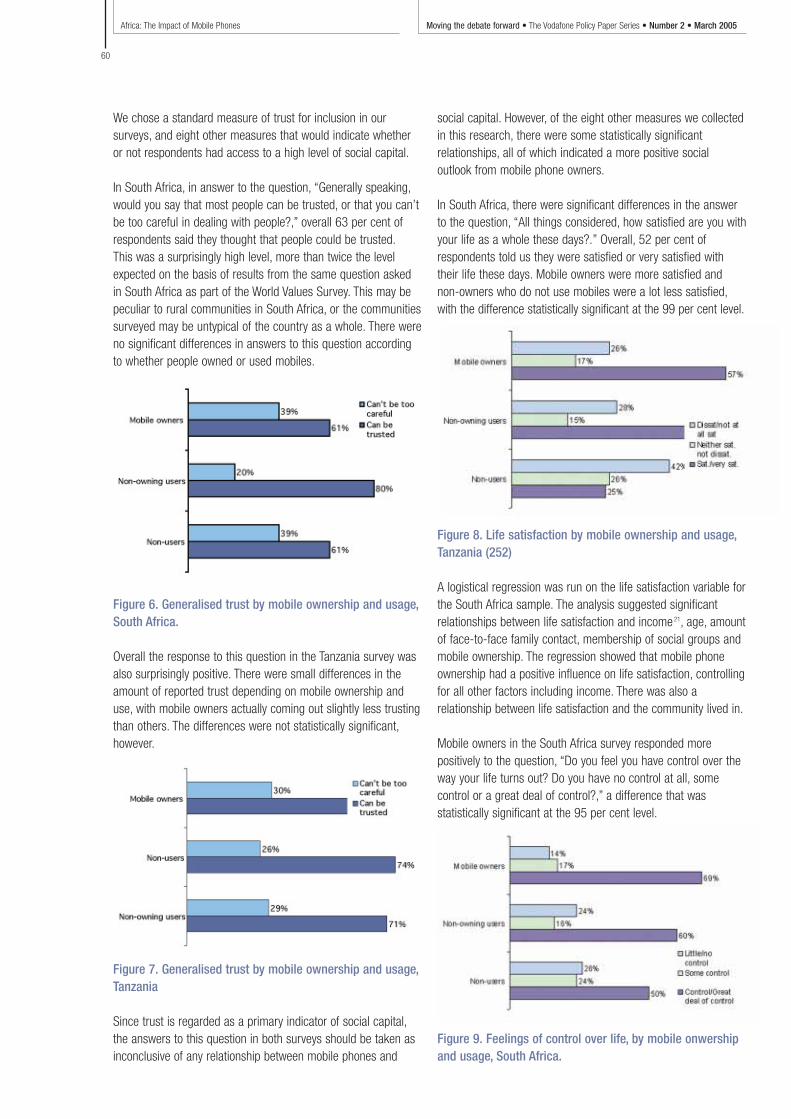
Africa: The Impact of Mobile Phones Moving the debate forward • The Vodafone Policy Paper Series • Number 2 • March 2005
60
We chose a standard measure of trust for inclusion in oursurveys, and eight other measures that would indicate whetheror not respondents had access to a high level of social capital.
In South Africa, in answer to the question, “Generally speaking,would you say that most people can be trusted, or that you can’tbe too careful in dealing with people?,” overall 63 per cent ofrespondents said they thought that people could be trusted.This was a surprisingly high level, more than twice the levelexpected on the basis of results from the same question askedin South Africa as part of the World Values Survey. This may bepeculiar to rural communities in South Africa, or the communitiessurveyed may be untypical of the country as a whole. There wereno significant differences in answers to this question accordingto whether people owned or used mobiles.
Figure 6. Generalised trust by mobile ownership and usage,South Africa.
Overall the response to this question in the Tanzania survey wasalso surprisingly positive. There were small differences in theamount of reported trust depending on mobile ownership anduse, with mobile owners actually coming out slightly less trustingthan others. The differences were not statistically significant,however.
Figure 7. Generalised trust by mobile ownership and usage,Tanzania
Since trust is regarded as a primary indicator of social capital,the answers to this question in both surveys should be taken asinconclusive of any relationship between mobile phones and
social capital. However, of the eight other measures we collectedin this research, there were some statistically significantrelationships, all of which indicated a more positive socialoutlook from mobile phone owners.
In South Africa, there were significant differences in the answerto the question, “All things considered, how satisfied are you withyour life as a whole these days?.” Overall, 52 per cent ofrespondents told us they were satisfied or very satisfied withtheir life these days. Mobile owners were more satisfied andnon-owners who do not use mobiles were a lot less satisfied,with the difference statistically significant at the 99 per cent level.
Figure 8. Life satisfaction by mobile ownership and usage,Tanzania (252)
A logistical regression was run on the life satisfaction variable forthe South Africa sample. The analysis suggested significantrelationships between life satisfaction and income 21, age, amountof face-to-face family contact, membership of social groups andmobile ownership. The regression showed that mobile phoneownership had a positive influence on life satisfaction, controllingfor all other factors including income. There was also arelationship between life satisfaction and the community lived in.
Mobile owners in the South Africa survey responded morepositively to the question, “Do you feel you have control over theway your life turns out? Do you have no control at all, somecontrol or a great deal of control?,” a difference that wasstatistically significant at the 95 per cent level.
Figure 9. Feelings of control over life, by mobile onwershipand usage, South Africa.
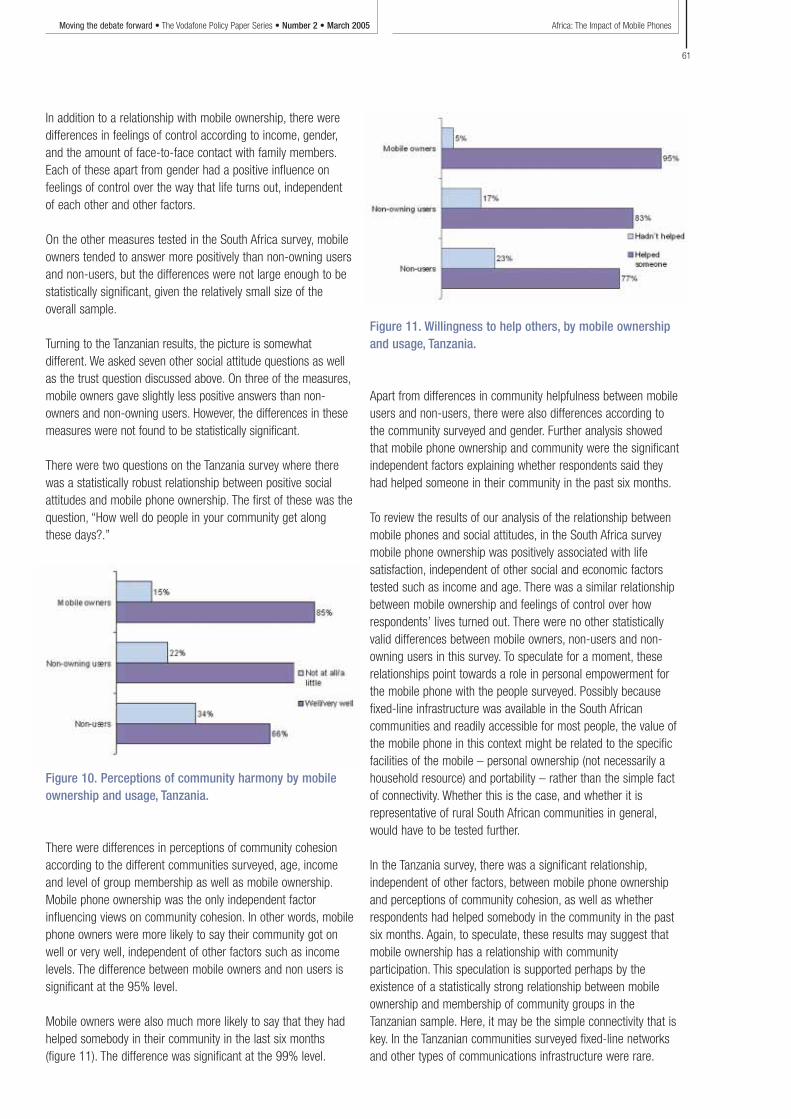
Africa: The Impact of Mobile PhonesMoving the debate forward • The Vodafone Policy Paper Series • Number 2 • March 2005
61
In addition to a relationship with mobile ownership, there weredifferences in feelings of control according to income, gender,and the amount of face-to-face contact with family members.Each of these apart from gender had a positive influence onfeelings of control over the way that life turns out, independentof each other and other factors.
On the other measures tested in the South Africa survey, mobileowners tended to answer more positively than non-owning usersand non-users, but the differences were not large enough to bestatistically significant, given the relatively small size of theoverall sample.
Turning to the Tanzanian results, the picture is somewhatdifferent. We asked seven other social attitude questions as wellas the trust question discussed above. On three of the measures,mobile owners gave slightly less positive answers than non-owners and non-owning users. However, the differences in thesemeasures were not found to be statistically significant.
There were two questions on the Tanzania survey where therewas a statistically robust relationship between positive socialattitudes and mobile phone ownership. The first of these was thequestion, “How well do people in your community get alongthese days?.”
Figure 10. Perceptions of community harmony by mobileownership and usage, Tanzania.
There were differences in perceptions of community cohesionaccording to the different communities surveyed, age, incomeand level of group membership as well as mobile ownership.Mobile phone ownership was the only independent factorinfluencing views on community cohesion. In other words, mobilephone owners were more likely to say their community got onwell or very well, independent of other factors such as incomelevels. The difference between mobile owners and non users issignificant at the 95% level.
Mobile owners were also much more likely to say that they hadhelped somebody in their community in the last six months(figure 11). The difference was significant at the 99% level.
Figure 11. Willingness to help others, by mobile ownershipand usage, Tanzania.
Apart from differences in community helpfulness between mobileusers and non-users, there were also differences according tothe community surveyed and gender. Further analysis showedthat mobile phone ownership and community were the significantindependent factors explaining whether respondents said theyhad helped someone in their community in the past six months.
To review the results of our analysis of the relationship betweenmobile phones and social attitudes, in the South Africa surveymobile phone ownership was positively associated with lifesatisfaction, independent of other social and economic factorstested such as income and age. There was a similar relationshipbetween mobile ownership and feelings of control over howrespondents’ lives turned out. There were no other statisticallyvalid differences between mobile owners, non-users and non-owning users in this survey. To speculate for a moment, theserelationships point towards a role in personal empowerment forthe mobile phone with the people surveyed. Possibly becausefixed-line infrastructure was available in the South Africancommunities and readily accessible for most people, the value ofthe mobile phone in this context might be related to the specificfacilities of the mobile – personal ownership (not necessarily ahousehold resource) and portability – rather than the simple factof connectivity. Whether this is the case, and whether it isrepresentative of rural South African communities in general,would have to be tested further.
In the Tanzania survey, there was a significant relationship,independent of other factors, between mobile phone ownershipand perceptions of community cohesion, as well as whetherrespondents had helped somebody in the community in the pastsix months. Again, to speculate, these results may suggest thatmobile ownership has a relationship with communityparticipation. This speculation is supported perhaps by theexistence of a statistically strong relationship between mobileownership and membership of community groups in theTanzanian sample. Here, it may be the simple connectivity that iskey. In the Tanzanian communities surveyed fixed-line networksand other types of communications infrastructure were rare.
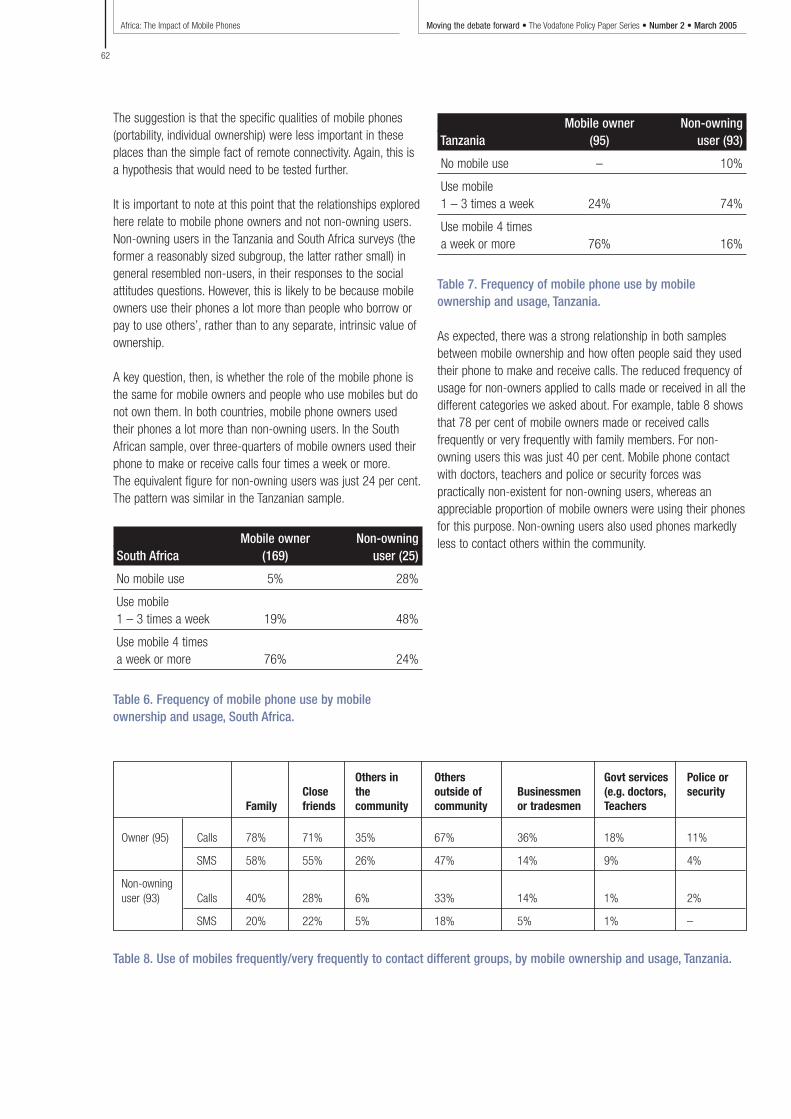
Africa: The Impact of Mobile Phones Moving the debate forward • The Vodafone Policy Paper Series • Number 2 • March 2005
62
The suggestion is that the specific qualities of mobile phones(portability, individual ownership) were less important in theseplaces than the simple fact of remote connectivity. Again, this isa hypothesis that would need to be tested further.
It is important to note at this point that the relationships exploredhere relate to mobile phone owners and not non-owning users.Non-owning users in the Tanzania and South Africa surveys (theformer a reasonably sized subgroup, the latter rather small) ingeneral resembled non-users, in their responses to the socialattitudes questions. However, this is likely to be because mobileowners use their phones a lot more than people who borrow orpay to use others’, rather than to any separate, intrinsic value ofownership.
A key question, then, is whether the role of the mobile phone isthe same for mobile owners and people who use mobiles but donot own them. In both countries, mobile phone owners used their phones a lot more than non-owning users. In the SouthAfrican sample, over three-quarters of mobile owners used theirphone to make or receive calls four times a week or more.The equivalent figure for non-owning users was just 24 per cent.The pattern was similar in the Tanzanian sample.
Mobile owner Non-owningSouth Africa (169) user (25)
No mobile use 5% 28%
Use mobile1 – 3 times a week 19% 48%
Use mobile 4 timesa week or more 76% 24%
Table 6. Frequency of mobile phone use by mobileownership and usage, South Africa.
Mobile owner Non-owningTanzania (95) user (93)
No mobile use – 10%
Use mobile1 – 3 times a week 24% 74%
Use mobile 4 timesa week or more 76% 16%
Table 7. Frequency of mobile phone use by mobileownership and usage, Tanzania.
As expected, there was a strong relationship in both samplesbetween mobile ownership and how often people said they usedtheir phone to make and receive calls. The reduced frequency ofusage for non-owners applied to calls made or received in all thedifferent categories we asked about. For example, table 8 showsthat 78 per cent of mobile owners made or received callsfrequently or very frequently with family members. For non-owning users this was just 40 per cent. Mobile phone contactwith doctors, teachers and police or security forces waspractically non-existent for non-owning users, whereas anappreciable proportion of mobile owners were using their phonesfor this purpose. Non-owning users also used phones markedlyless to contact others within the community.
Others in Others Govt services Police or Close the outside of Businessmen (e.g. doctors, security
Family friends community community or tradesmen Teachers
Owner (95) Calls 78% 71% 35% 67% 36% 18% 11%
SMS 58% 55% 26% 47% 14% 9% 4%
Non-owninguser (93) Calls 40% 28% 6% 33% 14% 1% 2%
SMS 20% 22% 5% 18% 5% 1% –
Table 8. Use of mobiles frequently/very frequently to contact different groups, by mobile ownership and usage, Tanzania.
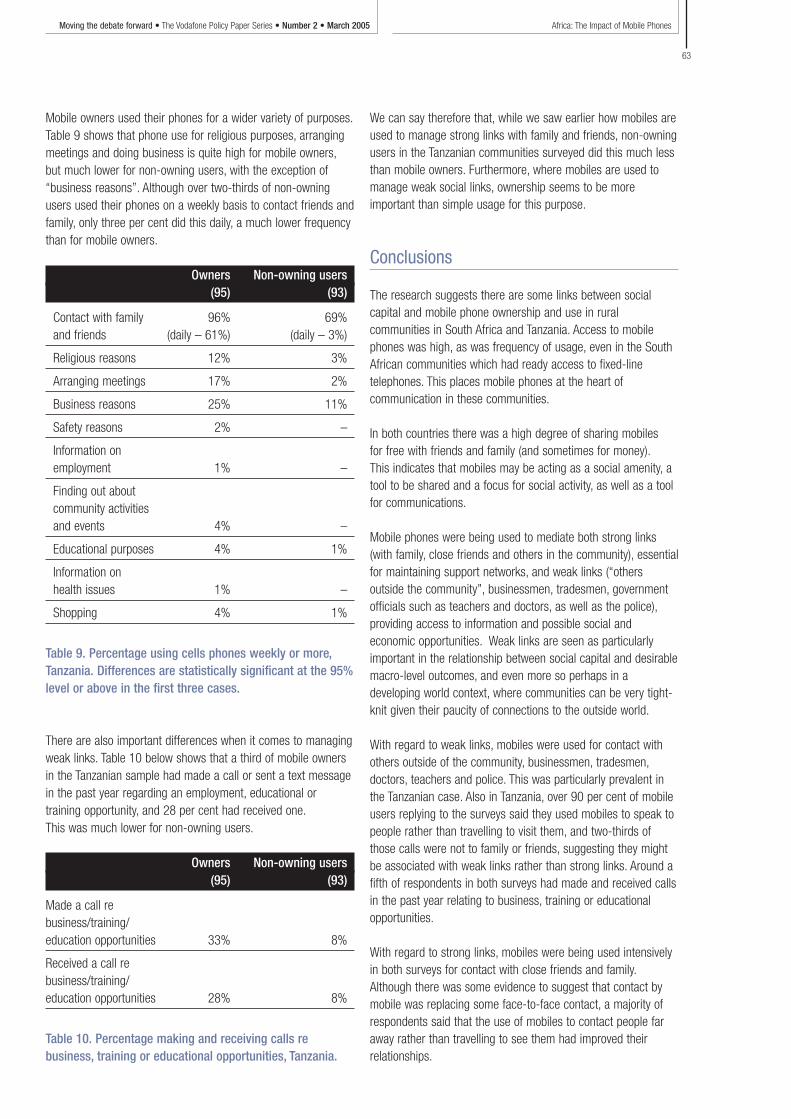
Africa: The Impact of Mobile PhonesMoving the debate forward • The Vodafone Policy Paper Series • Number 2 • March 2005
63
Mobile owners used their phones for a wider variety of purposes.Table 9 shows that phone use for religious purposes, arrangingmeetings and doing business is quite high for mobile owners,but much lower for non-owning users, with the exception of“business reasons”. Although over two-thirds of non-owningusers used their phones on a weekly basis to contact friends andfamily, only three per cent did this daily, a much lower frequencythan for mobile owners.
Owners Non-owning users(95) (93)
Contact with family 96% 69%and friends (daily – 61%) (daily – 3%)
Religious reasons 12% 3%
Arranging meetings 17% 2%
Business reasons 25% 11%
Safety reasons 2% –
Information onemployment 1% –
Finding out aboutcommunity activitiesand events 4% –
Educational purposes 4% 1%
Information onhealth issues 1% –
Shopping 4% 1%
Table 9. Percentage using cells phones weekly or more,Tanzania. Differences are statistically significant at the 95%level or above in the first three cases.
There are also important differences when it comes to managingweak links. Table 10 below shows that a third of mobile ownersin the Tanzanian sample had made a call or sent a text messagein the past year regarding an employment, educational ortraining opportunity, and 28 per cent had received one.This was much lower for non-owning users.
Owners Non-owning users(95) (93)
Made a call rebusiness/training/education opportunities 33% 8%
Received a call rebusiness/training/education opportunities 28% 8%
Table 10. Percentage making and receiving calls rebusiness, training or educational opportunities, Tanzania.
We can say therefore that, while we saw earlier how mobiles areused to manage strong links with family and friends, non-owningusers in the Tanzanian communities surveyed did this much lessthan mobile owners. Furthermore, where mobiles are used tomanage weak social links, ownership seems to be moreimportant than simple usage for this purpose.
Conclusions
The research suggests there are some links between socialcapital and mobile phone ownership and use in ruralcommunities in South Africa and Tanzania. Access to mobilephones was high, as was frequency of usage, even in the SouthAfrican communities which had ready access to fixed-linetelephones. This places mobile phones at the heart ofcommunication in these communities.
In both countries there was a high degree of sharing mobiles for free with friends and family (and sometimes for money).This indicates that mobiles may be acting as a social amenity, atool to be shared and a focus for social activity, as well as a toolfor communications.
Mobile phones were being used to mediate both strong links(with family, close friends and others in the community), essentialfor maintaining support networks, and weak links (“othersoutside the community”, businessmen, tradesmen, governmentofficials such as teachers and doctors, as well as the police),providing access to information and possible social andeconomic opportunities. Weak links are seen as particularlyimportant in the relationship between social capital and desirablemacro-level outcomes, and even more so perhaps in adeveloping world context, where communities can be very tight-knit given their paucity of connections to the outside world.
With regard to weak links, mobiles were used for contact withothers outside of the community, businessmen, tradesmen,doctors, teachers and police. This was particularly prevalent inthe Tanzanian case. Also in Tanzania, over 90 per cent of mobileusers replying to the surveys said they used mobiles to speak topeople rather than travelling to visit them, and two-thirds ofthose calls were not to family or friends, suggesting they mightbe associated with weak links rather than strong links. Around afifth of respondents in both surveys had made and received callsin the past year relating to business, training or educationalopportunities.
With regard to strong links, mobiles were being used intensivelyin both surveys for contact with close friends and family.Although there was some evidence to suggest that contact bymobile was replacing some face-to-face contact, a majority ofrespondents said that the use of mobiles to contact people faraway rather than travelling to see them had improved theirrelationships.
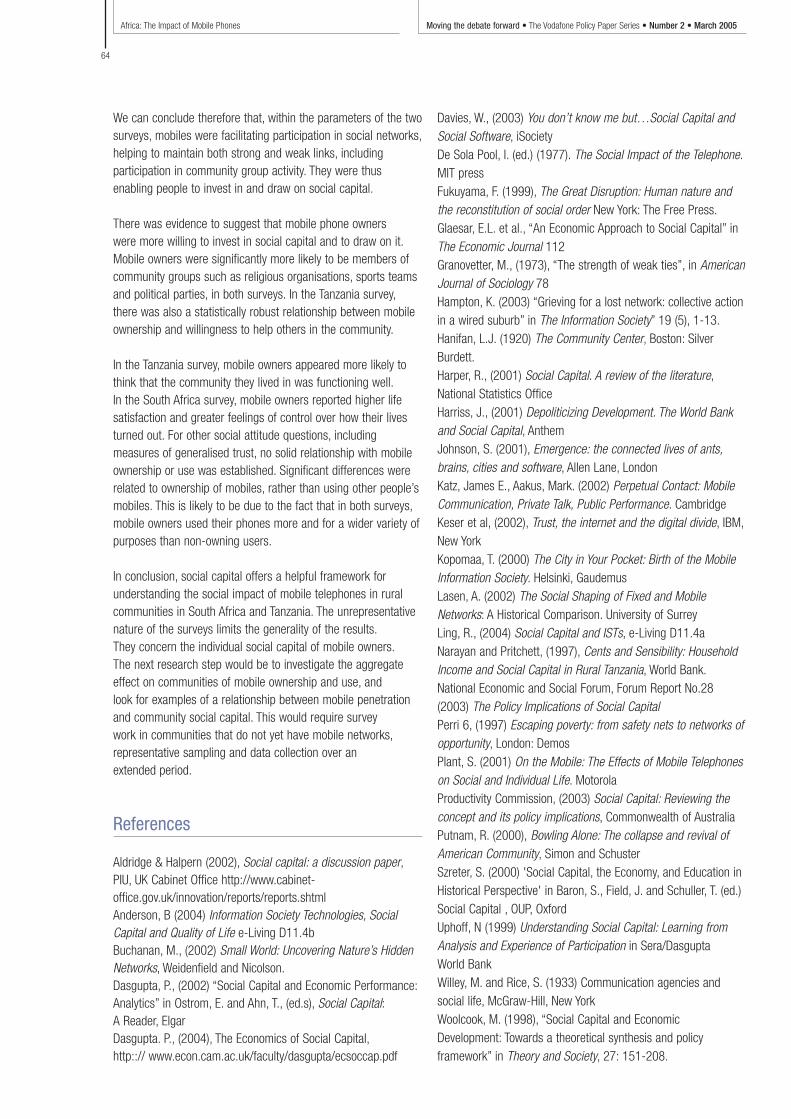
Africa: The Impact of Mobile Phones Moving the debate forward • The Vodafone Policy Paper Series • Number 2 • March 2005
64
We can conclude therefore that, within the parameters of the twosurveys, mobiles were facilitating participation in social networks,helping to maintain both strong and weak links, includingparticipation in community group activity. They were thusenabling people to invest in and draw on social capital.
There was evidence to suggest that mobile phone owners were more willing to invest in social capital and to draw on it.Mobile owners were significantly more likely to be members ofcommunity groups such as religious organisations, sports teamsand political parties, in both surveys. In the Tanzania survey,there was also a statistically robust relationship between mobileownership and willingness to help others in the community.
In the Tanzania survey, mobile owners appeared more likely tothink that the community they lived in was functioning well.In the South Africa survey, mobile owners reported higher lifesatisfaction and greater feelings of control over how their livesturned out. For other social attitude questions, includingmeasures of generalised trust, no solid relationship with mobileownership or use was established. Significant differences wererelated to ownership of mobiles, rather than using other people’smobiles. This is likely to be due to the fact that in both surveys,mobile owners used their phones more and for a wider variety ofpurposes than non-owning users.
In conclusion, social capital offers a helpful framework forunderstanding the social impact of mobile telephones in ruralcommunities in South Africa and Tanzania. The unrepresentativenature of the surveys limits the generality of the results.They concern the individual social capital of mobile owners.The next research step would be to investigate the aggregateeffect on communities of mobile ownership and use, and look for examples of a relationship between mobile penetrationand community social capital. This would require survey work in communities that do not yet have mobile networks,representative sampling and data collection over an extended period.
References
Aldridge & Halpern (2002), Social capital: a discussion paper,PIU, UK Cabinet Office http://www.cabinet-office.gov.uk/innovation/reports/reports.shtmlAnderson, B (2004) Information Society Technologies, SocialCapital and Quality of Life e-Living D11.4bBuchanan, M., (2002) Small World: Uncovering Nature’s HiddenNetworks, Weidenfield and Nicolson.Dasgupta, P., (2002) “Social Capital and Economic Performance:Analytics” in Ostrom, E. and Ahn, T., (ed.s), Social Capital:A Reader, ElgarDasgupta. P., (2004), The Economics of Social Capital,http::// www.econ.cam.ac.uk/faculty/dasgupta/ecsoccap.pdf
Davies, W., (2003) You don’t know me but…Social Capital andSocial Software, iSocietyDe Sola Pool, I. (ed.) (1977). The Social Impact of the Telephone.MIT press Fukuyama, F. (1999), The Great Disruption: Human nature andthe reconstitution of social order New York: The Free Press.Glaesar, E.L. et al., “An Economic Approach to Social Capital” inThe Economic Journal 112Granovetter, M., (1973), “The strength of weak ties”, in AmericanJournal of Sociology 78Hampton, K. (2003) “Grieving for a lost network: collective actionin a wired suburb” in The Information Society” 19 (5), 1-13.Hanifan, L.J. (1920) The Community Center, Boston: SilverBurdett.Harper, R., (2001) Social Capital. A review of the literature,National Statistics OfficeHarriss, J., (2001) Depoliticizing Development. The World Bankand Social Capital, AnthemJohnson, S. (2001), Emergence: the connected lives of ants,brains, cities and software, Allen Lane, LondonKatz, James E., Aakus, Mark. (2002) Perpetual Contact: MobileCommunication, Private Talk, Public Performance. CambridgeKeser et al, (2002), Trust, the internet and the digital divide, IBM,New YorkKopomaa, T. (2000) The City in Your Pocket: Birth of the MobileInformation Society. Helsinki, GaudemusLasen, A. (2002) The Social Shaping of Fixed and MobileNetworks: A Historical Comparison. University of SurreyLing, R., (2004) Social Capital and ISTs, e-Living D11.4a Narayan and Pritchett, (1997), Cents and Sensibility: HouseholdIncome and Social Capital in Rural Tanzania, World Bank.National Economic and Social Forum, Forum Report No.28(2003) The Policy Implications of Social CapitalPerri 6, (1997) Escaping poverty: from safety nets to networks ofopportunity, London: DemosPlant, S. (2001) On the Mobile: The Effects of Mobile Telephoneson Social and Individual Life. MotorolaProductivity Commission, (2003) Social Capital: Reviewing theconcept and its policy implications, Commonwealth of AustraliaPutnam, R. (2000), Bowling Alone: The collapse and revival ofAmerican Community, Simon and SchusterSzreter, S. (2000) 'Social Capital, the Economy, and Education inHistorical Perspective' in Baron, S., Field, J. and Schuller, T. (ed.)Social Capital , OUP, OxfordUphoff, N (1999) Understanding Social Capital: Learning fromAnalysis and Experience of Participation in Sera/Dasgupta World BankWilley, M. and Rice, S. (1933) Communication agencies andsocial life, McGraw-Hill, New YorkWoolcook, M. (1998), “Social Capital and EconomicDevelopment: Towards a theoretical synthesis and policyframework” in Theory and Society, 27: 151-208.
Africa: The Impact of Mobile PhonesMoving the debate forward • The Vodafone Policy Paper Series • Number 2 • March 2005
65
Notes
1 Putnam, 2000 p.000. Putnam also quotes here L. J. Hanigan
2 Fukuyama, 1999 p.1
3 Woolcock, 1998, p.153
4 Dasgupta 2004, p. 28
5 Harper, 2001.
6 Narayan and Pritchett, 1997
7 Keser et al., 2002
8 A paper was commissioned by the Australian government in 2003 from the Productivity
Commission to investigate the policy implications of social capital. The National Economic
and Social Forum of Ireland produced a similar report for the Irish government in the same
year. It recommended that a government department be chosen to lead on developing
social capital related policies.
9 PIU p.69
10 Katz and Rice, 2002
11 Hampton 2002, p.10
12 De Sola Pool 1977
13 Willey and Rice 1933
14 Ling, 2004, p.2
15 Anderson, 2004, p.24
16 Plant, 2001.
17 The categories offered to respondents were different for this question between South
Africa and Tanzania. Therefore, direct comparison between the two countries is not
possible.
18 Respondents in South Africa were not asked about access to payphones or community
service phones.
19 Granovetter, 1973.
20 12 per cent of mobile owners said they had regular face to face contact with “others
outside of the community” compared to 40 per cent of non-users.
21 Approximately 20 per cent of the sample in South Africa refused to state their income
level. This subgroup was cross-tabulated with all other socio-economic variables to verify
that they had no particular characteristics in common. They were then coded together with
the higher income subgroup so that the answers for this subgroup could be inlcuded in
the regression model.
Africa: The Impact of Mobile Phones Moving the debate forward • The Vodafone Policy Paper Series • Number 2 • March 2005
66
This bibliography contains the specific references cited in thereport, and in addition other references relevant to the role ofmobile telephony on economic and social development.
Accenture, Markle Foundation, and UNDP, Final Report of theDigital Opportunity Initiative, July 2001.http://www.opt-init.org/framework/DOI-Final-Report.pdfAshurst, Mark, ‘Africa: Now, a 'Quiet Revolution': Mobile PhonesLeapfrog an Obstacle to Development’ , Newsweek International,August 27, 2001 Asian Development Bank, Towards Universal Access:Socioeconomic Impact Study of Rural Telecommunications inThailand. Volume 1: Main Report, Midas Agronomics Report T.A.2381, 30 November 1996.Azam, Jean-Paul, Magueye Dia and Tchétché N’Guessan,‘Telecommunications Sector Reforms in Sénégal’, World Bank2002. http://econ.worldbank.org/files/18861_wps2894.pdfBatchelor, Woolnough and Scott, ‘The Contribution of ICTs to Pro-Poor Growth’, OECD Discussion PaperDCD/DAC/POVNET(2004)15, September 2004.http://www.gamos.org/files/oecd/MDGS_POVENT_15.pdfBayes, A, von Braun, J and Akhter, R., Village Pay Phones andPoverty Reduction: Insights from a Grameen Bank Initiative inBangladesh, ZEF, Berlin, 1999.http://www.zef.de/publications/publ_zef_dp.htm#8Beardsley, Scott, Ingo Beyer von Morgenstern, Luis Enriquez, andCarsten Kipping, Telecommunications Sector Reform: APrerequisite for Networked Readiness, Chapter 11 of Kirkmanand Sachs (2002).http://www.cid.harvard.edu/cr/pdf/gitrr2002_ch11.pdfBlattman, Christopher, Robert Jensen and Paul Roman,Assessing the Need and Potential of Community Networking forDeveloping Countries: A Case Study for India, MIT Working PaperFebruary 2002.http://edevelopment.media.mit.edu/SARI/papers/CommunityNetworking.pdfBoston Consulting Group, Options on the Future: The Role ofBusiness in Closing the Digital Divide, January 2002.Bruns, Bryan et al, Village Telephones: Socio-economic Impactand Implications for Rural Futures, paper presented at 6thInternational Conference on Thai Studies, October 1996.http://www.cm.ksc.co.th/~bruns/rurtel.htmlCamp, Jean L and Brian L Anderson, Grameen Phone:Empowering the Poor through Connectivity, The Magazine onInformation Impacts, December 1999.http://www.telecommons.com/villagephone/Camp_article12_99.htmCohen, Nevin, Grameen Telecom’s Village Phones, WorldResources Institute June 2001.http://www.digitaldividend.org/pdf/grameen.pdf
Comin, Diego and Bart Hobijn, Cross-Country TechnologyAdoption: Making the Theories Face the Facts, Federal ReserveBank of New York Staff Report no. 169, June 2003.http://www.ny.frb.org/research/staff_reports/sr169.htmlDepartment for International Development, Balancing Act: AfricanICT Infrastructure investment options, prepared by Balancing Act,2004.Department for International Development, The Impact of theNew Economy on Poor People and Developing Countries,prepared by KPMG Consulting, July 2000.http://www.globalisation.gov.uk/BackgroundWord/NewEconomyOnPoorPeopleDevelopingCountriesKPMG.docDholakia, Nikhilesh and Nir Kshetri, The Global Digital Divide andMobile Business Models: Identifying Viable Patterns of e-Development, University of Rhode Island working paper 2002.http://ritim.cba.uri.edu/working%20papers/Global-Digital-Divide-e-Development-Models-v7%5B1%5D.pdfDorj, Thinley, ‘IP Based Rural Access Pilot Project’, 2001.http://www.bhutan-notes.com/clif/bt_rural_access_pilot.htmlDuncombe, Richard and Richard Heeks, Information, ICTs andSmall Enterprise: Findings for Botswana, DevelopmentInformatics Working Paper no. 7, IDPM, University of Manchester,1999.http://idpm.man.ac.uk/publications/wp/di/di_wp07.shtmlKaren Eggleston, Robert Jensen, and Richard Zeckhauser,Information and Communication Technologies, Markets, andEconomic Development, Chapter 7 in Kirkman and Sachs (2002).http://www.cid.harvard.edu/cr/pdf/gitrr2002_ch07.pdfELDIS ICT & Development portalhttp://www.eldis.org/ict/ictcountry.htmErnberg, Johan, Universal Access for Rural Development, ITU,December 1998.http://www.itu.int/ITU-D/univ_access/telecentres/papers/NTCA_johan.docForestier, Emmanuel, Jeremy Grace and Charles Kenny, ‘CanInformation and Communication Technologies be Pro-Poor?’,Telecommunications Policy, 26 (2002), pp 623-646.Gebreab, Amare, ‘Getting Connected: competition and diffusionin African mobile telecommunications markets’, World Bank2002. http://econ.worldbank.org/files/15963_wps2863.pdfGrace, Jeremy, et al, ICTs and Broad Based Development:A Partial Review of the Evidence, World Bank Working PaperFebruary 2001.http://poverty.worldbank.org/files/10214_ict.pdfGrajek, Michal, ‘Estimating Network Effects and Compatibility inMobile Telecommunications’, Wissenschaftszentrum Berlin fürSozialforschung, December 2003.http://skylla.wz-berlin.de/pdf/2003/ii03-26.pdf
Bibliography
Africa: The Impact of Mobile PhonesMoving the debate forward • The Vodafone Policy Paper Series • Number 2 • March 2005
67
Guislain, Pierre, et al, Connecting Sub-Saharan Africa: A WorldBank Group Strategy for ICT Sector Development, World BankJanuary 2005.http://info.worldbank.org/ict/ICT_ssp.htmlHammond, Allen L., Digitally Empowered Development, ForeignAffairs, 80, 2, 96-106 (2001).http://www.digitaldividend.org/pdf/0201ar04.pdfHardy, A, 1980 “The role of the telephone in economicdevelopment” Telecommunications Policy, 4(4) pp278-286.Hudson, Heather, The Economic and Social Benefits of RuralTelecommunications, unpublished report to World Bank, 1995.http://www.usfca.edu/fac-staff/hudson/papers/Benefits%20of%20Rural%20Communication.pdfITU, African Telecommunication Indicators 2004, Geneva 2004.ITU, World Telecommunication Development Report, Geneva2003. http://www.itu.intITU, Mobile Overtakes Fixed: Implications for Policy andRegulation, Geneva 2003.http://www.itu.int/osg/spu/ni/mobileovertakes/Resources/Mobileovertakes_Paper.pdfITU, World Telecommunication Indicators Database, 2003update.http://www.itu.int/ITU_D/ict/publications/world/world.htmlITU, World Telecommunication Indicators 2000/01, March 2001.ITU, World Telecommunication Development Report: MobileCellular, Geneva 1999. http://www.itu.intITU, The Mobilization of Bangladesh, 13/10//99.http://www.itu.int/newsarchive/wtd/1999/iht10/tem-04.htmlJha, R and S. Majumdar, 1999. “A Matter of Connections: OECDCommunications Sector Productivity and the Role of CellularTechnology Diffusion, Info. Economics & Policy 11”, pp243-269.Kenny, Charles, The Costs and Benefits of ICTs for Direct PovertyAlleviation, January 2002.http://inet2002.org/CD-ROM/lu65rw2n/papers/u02-a.pdfKhalil, Mohsen, Wireless Opportunities for Developing Countriesand the Role of the World Bank Group, (presentation) June 2003.http://www.w2i.org/pages/wificonf0603/speaker_presentations/W2i_Khalil_Presentation.pdfKirkman, Geoffrey and Jeffrey Sachs, eds, Global InformationTechnology Readiness Report 2001-02, Oxford University Press2002.Kirkman, Geoffrey, Carlos Osorio and Jeffrey Sachs, TheNetworked Readiness Index: Measuring the Preparedness ofNations for the Networked World, 2002 (Chapter 2 of above).http://www.cid.harvard.edu/cr/pdf/gitrr2002_ch02.pdfLaffont, Jean-Jacques and Tchétché N’Guessan,‘Telecommunications Reform in Côte D’Ivoire’, World Bank 2002.http://econ.worldbank.org/files/18862_wps2895.pdfLaperrouza, Marc, China’s Information and CommunicationTechnology Policy-Making, Evian Group Compendium, April2002.Latchem, Colin and David Walker, Telecenters: Case Studies andKey Issues, Commonwealth of Learning, 2001.http://www.col.org/telecentres/
Also Development Gateway portal on telecenters at http://www.developmentgateway.org/node/133831/sdm/docview?docid=441647Lopez, Asbel, The South Goes Mobile, UNESCO Courier,July/August 2000.http://www.unesco.org/courier/2000_07/uk/connex.htmMadden, G and SJ Savage, CEE Telecommunications Investmentand Economic Growth, Information Economics and Policy, Vol 10,pp173-195, 1998.Mansell, Robin, Digital Opportunities and the Missing Link forDeveloping Countries, Oxford Review of Economic Policy, Vol 17,No. 2, pp282-295, 2001.http://icg.harvard.edu/~ss98em/Readings/Mansell-Digitl_misng_links.pdfMansell, Robin and W.E. Steinmueller, Mobilizing the InformationSociety: Strategies for Growth and Opportunity, Oxford UniversityPress 2000.Nadiri, M Ishaq and Banani Nandi, TelecommunicationsInfrastructure for Economic Development, NYU working paper,January 2003.http://userpage.fu-berlin.de/~jmueller/its/conf/helsinki03/abstracts/Nandi_Nadiri.pdfNavas-Sabater, Juan, Andrew Dymond and Niina Juntunen,Telecommunications and Information Services for the Poor,World Bank Discussion Paper no. 432, April 2002.http://rru.worldbank.org/Documents/1210.pdfPigato, Miria, ‘Information and communications technologies,poverty and development in Sub-Saharan Africa and South Asia’,World Bank working paper 2001.http://www.worldbank.org/afr/wps/wp20.pdfPitt, Alexander and Christine Zhen-Wei Qiang with Seth Ayers,The Contribution of ICTs to Growth, World Bank, November2003. Summary at http://www.developmentgateway.org/download/223526/Contribution_of_ICT_to_Growth_Viewpoint_December2003.pdfPralahad, C.K. and Allen Hammond, Serving the World’s Poor,Profitably. Harvard Business Review September 2002. Earlierversionhttp://www.digitaldividend.org/pdf/serving_profitably.pdfProenza, Francisco, Telecenter Sustainability: Myths andOpportunities, Journal of Development Communication,December 2001. Available at:http://www.fao.org/WAICENT/FAOINFO/AGRICULT/ags/Agsp/pdf/ProenzaTelecenter.pdfQuadir, Iqbal Z, Connecting Bangladeshi Villages. Unpublishedpaper presented at the Telecommunications for RuralDevelopment Conference, November 1998, University of Guelph,Ontario, Canada. (Updated Feb 2000).http://www.telecommons.com/villagephone/quadir.htmlReck, Jennifer and Brad Wood, What Works: Vodacom’sCommunity Services Phone Shops (World Resources Institute),August 2003.http://www.digitaldividend.org/pdf/vodacom.pdfRiaz, Ali, 'Telecommunications in Economic Growth of Malaysia'.,Journal of Contemporary Asia. Vol. 27, No. 4. December 1997.
Africa: The Impact of Mobile Phones Moving the debate forward • The Vodafone Policy Paper Series • Number 2 • March 2005
68
Richardson, Don, Towards Universal Telecom Access for Ruraland Remote Communities, TeleCommons Development Group,February 2002. http://www.telecommons.comRichardson, Don, Ricardo Ramirez and Moinul Haq, GrameenTelecom's Village Phone Programme: A Multi-Media Case Study,TeleCommons Development Group, March 2000.http://www.telecommons.com/villagephone/finalreport.pdfRodriguez, Francisco and Wilson Ernest.J., Are Poor CountriesLosing the Information Revolution?, World Bank infoDev WorkingPaper 26651, May 2000. http://www.infodev.org/library/WorkingPapers/wilsonrodriguez.docRoeller, L.H. and Waverman, L, 2001 “Telecommunicationsinfrastructure and economic development: a simultaneousapproach” American Economic Review 91 (4), pp 909-923.Rossotto, Carlo Maria, Khalid Sekkat and Aristomene Varoudakis,Opening up telecoms to competition and MENA integration in theworld economy, World Bank Discussion Paper 27024, July 2003.http://lnweb18.worldbank.org/mna/mena.nsf/Attachments/WP+33/$File/WP33.pdfRossotto, Carlo Maria, Michel Kerf and Jeffrey Rohlfs,‘Competition in Mobile Telecommunications’, Public Policy for thePrivate Sector, Note 184, World Bank August 1999.http://www1.worldbank.org/viewpoint/HTMLNotes/184/184rosso.pdfSaunders, R., Warford, J. and Wellenius, B., Telecommunicationsand Economic Development, 2nd Edition. Johns HoplinsUniversity Press (for World Bank), 1994.Sciadas, G, ed., Monitoring the Digital Divide – and Beyond,Orbicom, 2003.http://www.orbicom.uqam.ca/projects/ddi2002/index.htmlSkuse, Andrew, ‘Information and communication technologies,poverty and empowerment’, Department for InternationalDevelopment, Social Development Dissemination Note No. 3,July 2001. http://www.dfid.gov.ukSridhar, K.S. and Sridhar, V. “Telecom Infrastructure andEconomic Growth: Evidence from Developing Countries” (2003)http://www.nipfp.org.in/working%20paper/wp14.pdfStiglitz, Joseph, ‘Economic Organisation, Information andDevelopment’ in J. Behrman & T.N. Srinavasan, eds, Handbook ofEconomic Development, North Holland, 1989.Thioune, Ramata Molo, Information and communicationtechnologies for development in Africa, (3 volumes),CODESRIA/IDRC 2003.Torero, Maximo, The Access and Welfare Impacts ofTelecommunications Technology in Peru, Center for DevelopmentResearch (ZEF), Universitaet Bonn, Discussion Papers onDevelopment Policy No. 27, June 2000.http://www.grade.org.pe/download/pubs/MT-zef_dp27-00.pdfTorero, M, Chowdhury, S and Bedi, A, (2002)“Telecommunications infrastructure and economic growth: across-country analysis”, forthcoming in ICTs and IndianEconomic Development, eds A Saith and M Vijayabhaskar, SagePublications 2005.UNCTAD, E-Commerce and Development Report, 2003.http://r0.unctad.org/ecommerce/ecommerce_en/edr03_en.htm
United Nations Development Program, Human DevelopmentReport 2001: Making New Technologies Work for HumanDevelopment, Oxford University Press 2001.http://hdr.undp.org/reports/global/2001/en/Wallsten, Scott, An Empirical Analysis of Competition,Privatization, and Regulation in Telecommunications Markets inAfrica and Latin America, World Bank Working Paper 2136,June 1999.http://www.worldbank.org/html/dec/Publications/Workpapers/wps2000series/wps2136/wps2136-abstract.htmlWauschkuhn, Markus, Telecommunications and EconomicDevelopment in China, University of Bremen Institut fürWelwirtschaft und Internationales Management, Berichte ausdem Arbeitsbereich Chinaforschung 16, May 2001.http://www.iwim.uni-bremen.de/publikationen/pdf/c016.pdfWellenius, Björn, Closing the Gap in Access to RuralCommunication: Chile 1995-2002, World Bank infoDev WorkingPaper, November 2001.http://www.infodev.org/library/WorkingPapers/chile_rural/Chile%20-%20final%2017%20december%2001%20-%20revised.pdfWellenius, Björn, Extending Telecommunications Beyond TheMarket: towards a universal service in competitive markets,World Bank 2000.http://rru.worldbank.org/viewpoint/HTMLNotes/206/206welle.pdfWorld Bank, The Network Revolution and the Developing World,(report prepared by Analysys), infoDev Group, August 2000.http://www.infodev.org/library/WorkingPapers/400.docWorld Bank, World Development Report 1998/99: Knowledge forDevelopment, 1998.http://www.worldbank.org/wdr/wdr98/contents.htmWorld Economic Forum, Global Information Technology Report2002-2003 – Readiness for the Networked World, 2003.http://www.weforum.org/site/homepublic.nsf/Content/Global+Competitiveness+Programme%5CGlobal+Information+Technology+Report%5CGlobal+Information+Technology+Report+2002-2003+-+Readiness+for+the+Networked+Worldincluding chapters on ICT in Africa. http://www.weforum.org/pdf/Global_Competitiveness_Reports/Reports/GITR_2002_2003/ICT_Africa.pdf and the Arab worldhttp://www.weforum.org/pdf/Global_Competitiveness_Reports/Reports/GITR_2002_2003/Arab_World.pdf
Other Web References
http://www.infodev.org/ICT data and information for developing countries at a glance:http://www.worldbank.org/data/countrydata/ictglance.htmhttp://info.worldbank.org/ict/http://www.developmentgateway.org/node/130667/?

To keep the environmental impact of this document to a minimum, we have given careful consideration to the production process. The paper used was manufactured in the UK at mills withISO14001 accreditation. It is 75% recycled from de-inked post consumer waste. The document was printed in accordance with the ISO14001 environmental management system.All the steps we have taken demonstrate our commitment to making sustainable choices.
Designed and produced by Barrett Howe Plc
Africa: The Impact of Mobile PhonesMoving the debate forward • The Vodafone Policy Paper Series • Number 2 • March 2005
