african-american parents’ nutritional habits: implications … · african-american parents’...
TRANSCRIPT
APPROVED: George S. Morrison, Major Professor Jimmy Byrd, Minor Professor Karen Petty, Committee Member Carol D. Wickstrom, Interim Chair of the
Department of Teacher Education and Administration
Jerry R. Thomas, Dean of the College of Education
Michael Monticino, Dean of the Robert B. Toulouse School of Graduate Studies
AFRICAN-AMERICAN PARENTS’ NUTRITIONAL HABITS: IMPLICATIONS FOR
THE PREVENTION OF EARLY CHILDHOOD OBESITY
Andraya D. Anderson, B.S., M.Ed.
Dissertation Prepared for the Degree of
DOCTOR OF EDUCATION
UNIVERSITY OF NORTH TEXAS
August 2009
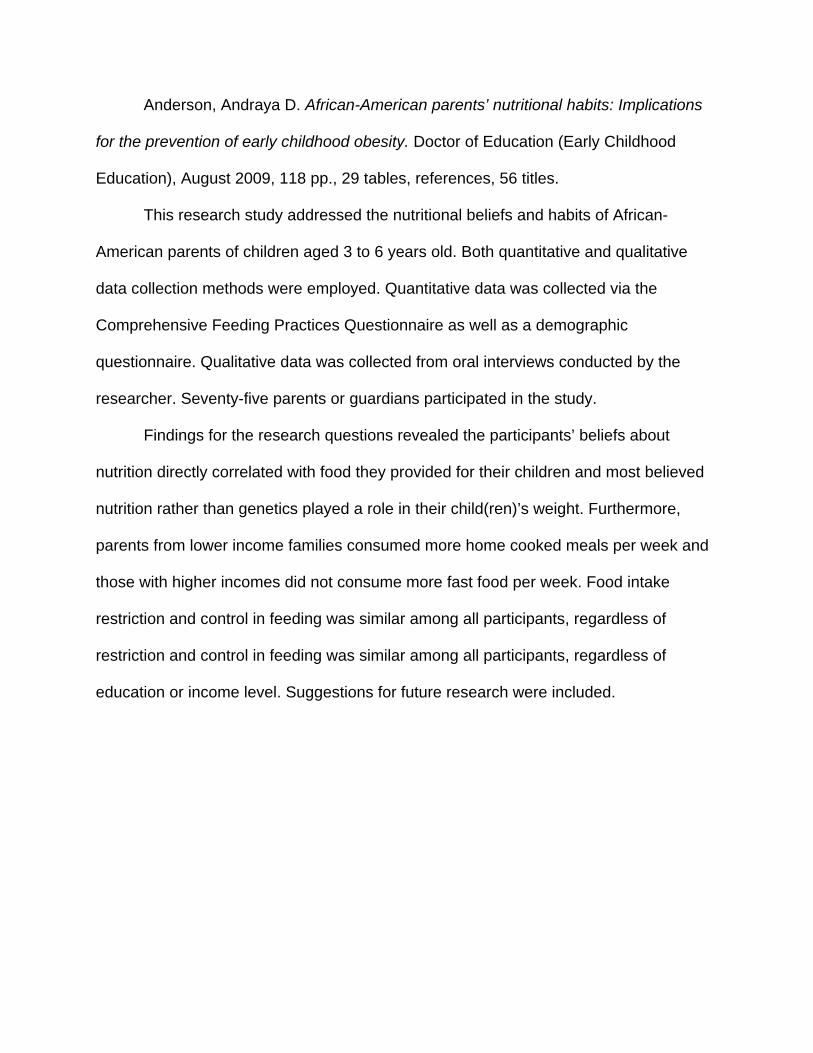
Anderson, Andraya D. African-American parents’ nutritional habits: Implications
for the prevention of early childhood obesity. Doctor of Education (Early Childhood
Education), August 2009, 118 pp., 29 tables, references, 56 titles.
This research study addressed the nutritional beliefs and habits of African-
American parents of children aged 3 to 6 years old. Both quantitative and qualitative
data collection methods were employed. Quantitative data was collected via the
Comprehensive Feeding Practices Questionnaire as well as a demographic
questionnaire. Qualitative data was collected from oral interviews conducted by the
researcher. Seventy-five parents or guardians participated in the study.
Findings for the research questions revealed the participants’ beliefs about
nutrition directly correlated with food they provided for their children and most believed
nutrition rather than genetics played a role in their child(ren)’s weight. Furthermore,
parents from lower income families consumed more home cooked meals per week and
those with higher incomes did not consume more fast food per week. Food intake
restriction and control in feeding was similar among all participants, regardless of
restriction and control in feeding was similar among all participants, regardless of
education or income level. Suggestions for future research were included.

ii
Copyright 2009
by
Andraya D. Anderson
iii
ACKNOWLEDGEMENTS
Sincere thanks are extended to everyone who assisted me in the completion of
this project, including Professor George S. Morrison, my committee chairperson and
advisor, as well as Dr. Karen Petty and Dr. Jimmy Byrd for their input and support. Dr.
Morrison’s positive attitude and wealth of knowledge has been instrumental in not only
the completion of this dissertation, but my doctoral program as a whole. I am grateful to
have had the opportunity to learn from such a reputable scholar in the field of Early
Childhood Education.
I am also thankful to Dr. Dara Musher-Eizenman and Dr. Shayla Holub for
allowing me to use the Comprehensive Feeding Practices Questionnaire for this study
and to Dr. Wyndy Wiitala for her patience and expertise in assistance with my
quantitative analysis. Immense gratitude is also offered to the Dallas Independent
School District and parents who participated in this study.
I would also like to express my most heartfelt appreciation to my wonderful
family. I would not have even considered pursing a graduate degree, much less a
doctorate, without your encouragement and on-going support and love. Thank you Dr.
Chalon Anderson, Floyd Anderson, Steven Anderson, Esq., Ervin James III, and Myles
James. I couldn’t have done it without you. I pray God continues to bless my family and
continues to allow me to be an advocate for young children.
iv
TABLE OF CONTENTS Page
ACKNOWLEDGEMENTS............................................................................................…iii LIST OF TABLES ........................................................................................................... vi Chapter 1. INTRODUCTION........................................................................................................1 Purpose of the Study ............................................................................................5 Statement of the Problem .....................................................................................6
Research Questions .............................................................................................6 Significance of the Study ......................................................................................8 Operational Definitions..........................................................................................8 2. REVIEW OF THE LITERATURE ..............................................................................10 Government Studies and Statistics.....................................................................11 Parental Behaviors..............................................................................................14 African-American Dietary Habits.........................................................................20 African-American Parent Perceptions .................................................................22 3. METHODOLOGY.....................................................................................................27 Sample................................................................................................................27 Instrumentation ...................................................................................................28 Procedures .........................................................................................................33 Interviews............................................................................................................33 Data Analysis......................................................................................................34 4. RESULTS.................................................................................................................39 Demographic Variables.......................................................................................39 Primary Quantitative Analysis .............................................................................59 Qualitative Analysis.............................................................................................70 5. SUMMARY AND DISCUSSION ...............................................................................80 Demographic Findings ........................................................................................80 Meal Types and Food Servings ..........................................................................82 Relationships Among Demographic Variables....................................................83
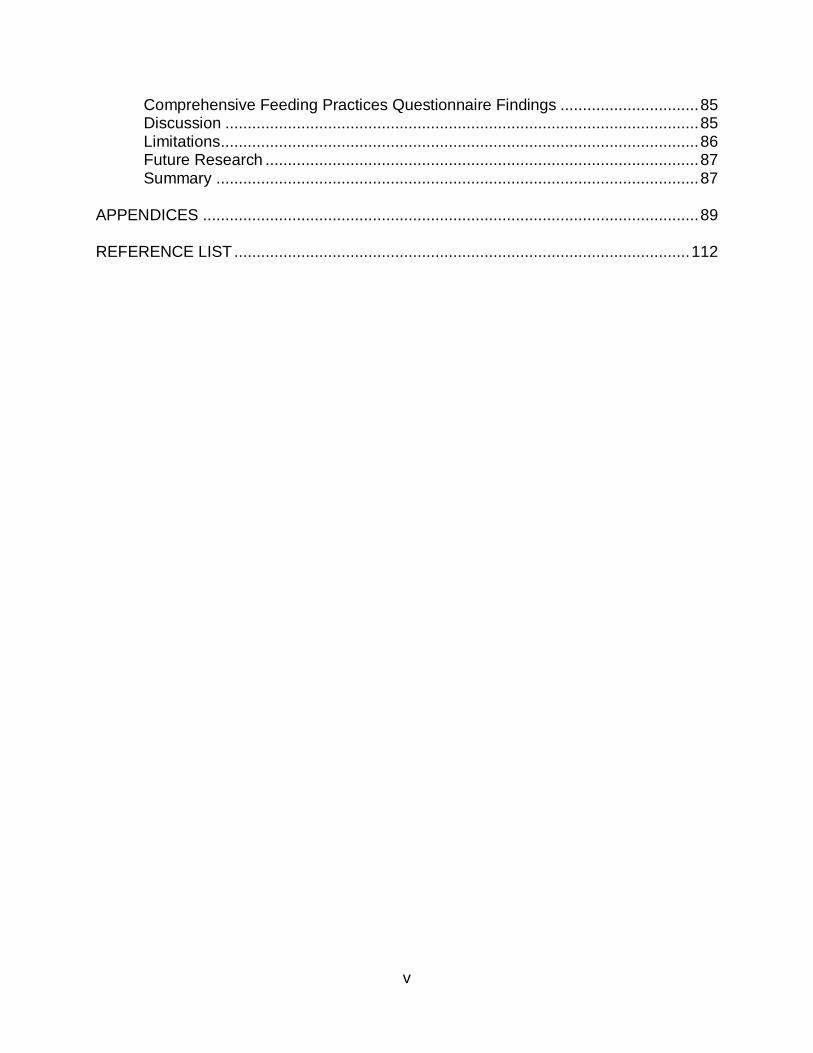
v
Comprehensive Feeding Practices Questionnaire Findings ...............................85 Discussion ..........................................................................................................85 Limitations...........................................................................................................86 Future Research .................................................................................................87 Summary ............................................................................................................87 APPENDICES ...............................................................................................................89 REFERENCE LIST ......................................................................................................112
vi
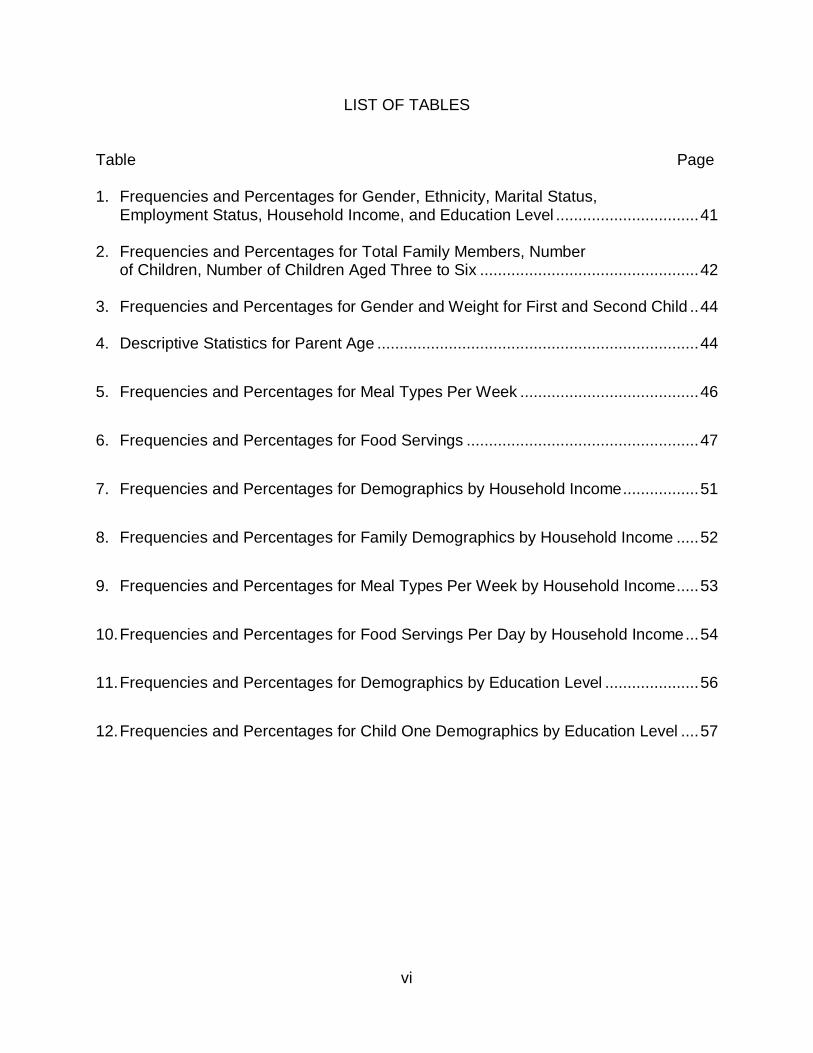
LIST OF TABLES
Table Page 1. Frequencies and Percentages for Gender, Ethnicity, Marital Status, Employment Status, Household Income, and Education Level ................................41 2. Frequencies and Percentages for Total Family Members, Number of Children, Number of Children Aged Three to Six .................................................42 3. Frequencies and Percentages for Gender and Weight for First and Second Child ..44 4. Descriptive Statistics for Parent Age ........................................................................44
5. Frequencies and Percentages for Meal Types Per Week ........................................46
6. Frequencies and Percentages for Food Servings ....................................................47
7. Frequencies and Percentages for Demographics by Household Income.................51
8. Frequencies and Percentages for Family Demographics by Household Income .....52
9. Frequencies and Percentages for Meal Types Per Week by Household Income.....53
10. Frequencies and Percentages for Food Servings Per Day by Household Income...54
11. Frequencies and Percentages for Demographics by Education Level .....................56
12. Frequencies and Percentages for Child One Demographics by Education Level ....57
vii
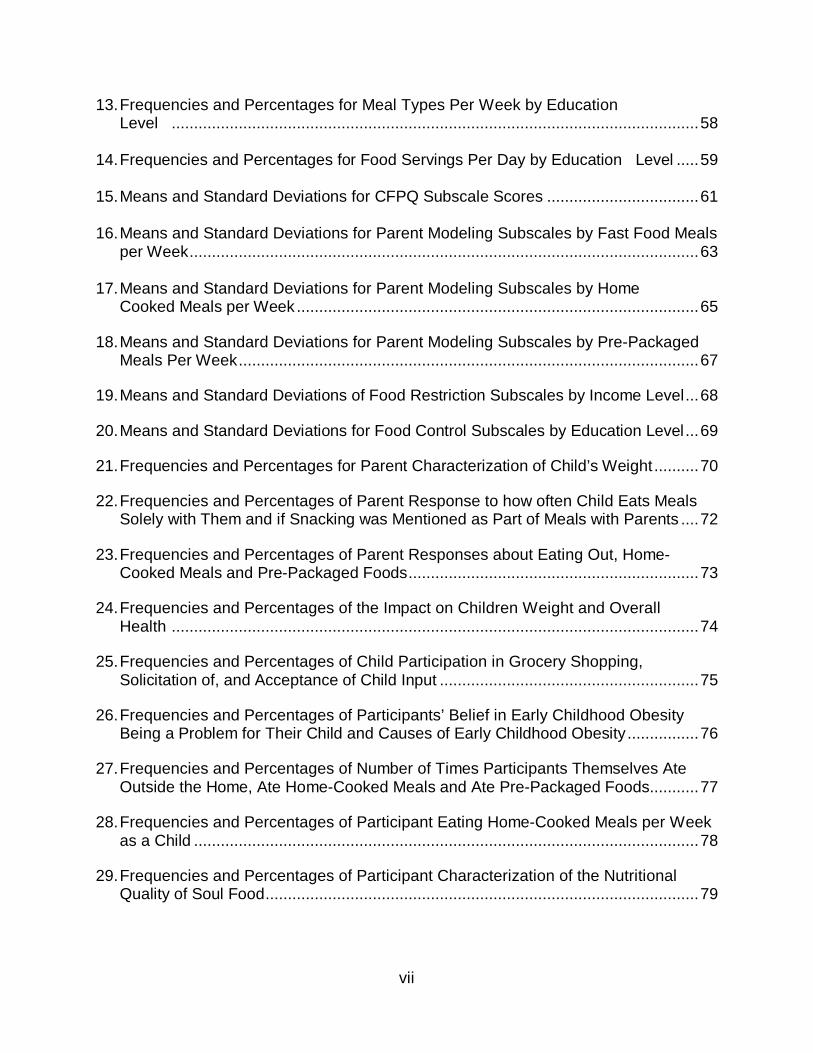
13. Frequencies and Percentages for Meal Types Per Week by Education Level ......................................................................................................................58
14. Frequencies and Percentages for Food Servings Per Day by Education Level .....59
15. Means and Standard Deviations for CFPQ Subscale Scores ..................................61
16. Means and Standard Deviations for Parent Modeling Subscales by Fast Food Meals per Week..................................................................................................................63
17. Means and Standard Deviations for Parent Modeling Subscales by Home Cooked Meals per Week..........................................................................................65
18. Means and Standard Deviations for Parent Modeling Subscales by Pre-Packaged
Meals Per Week.......................................................................................................67 19. Means and Standard Deviations of Food Restriction Subscales by Income Level...68 20. Means and Standard Deviations for Food Control Subscales by Education Level...69 21. Frequencies and Percentages for Parent Characterization of Child’s Weight ..........70 22. Frequencies and Percentages of Parent Response to how often Child Eats Meals
Solely with Them and if Snacking was Mentioned as Part of Meals with Parents ....72 23. Frequencies and Percentages of Parent Responses about Eating Out, Home-
Cooked Meals and Pre-Packaged Foods.................................................................73 24. Frequencies and Percentages of the Impact on Children Weight and Overall
Health ......................................................................................................................74 25. Frequencies and Percentages of Child Participation in Grocery Shopping,
Solicitation of, and Acceptance of Child Input ..........................................................75 26. Frequencies and Percentages of Participants’ Belief in Early Childhood Obesity
Being a Problem for Their Child and Causes of Early Childhood Obesity................76 27. Frequencies and Percentages of Number of Times Participants Themselves Ate
Outside the Home, Ate Home-Cooked Meals and Ate Pre-Packaged Foods...........77 28. Frequencies and Percentages of Participant Eating Home-Cooked Meals per Week
as a Child .................................................................................................................78
29. Frequencies and Percentages of Participant Characterization of the Nutritional Quality of Soul Food.................................................................................................79
1
CHAPTER 1
INTRODUCTION
The incidence of childhood obesity among young children in the United States
has increased exponentially in the last 10 years (Campbell, Crawford, & Hesketh, 2006;
McGarvey, Collie, Fraser, Shufflebarger, Lloyd, & Oliver, 2006). Some researchers in
public health have concluded that the problem of early childhood obesity has reached
near-epidemic proportions (Deckelbaum & Williams, 2001; Puhl & Latner, 2007). The
problem of early childhood obesity and overweight appears to be on-going without the
implementation of early detection and prevention strategies (Stegelin, 2008). The
causes most commonly identified with the increase in early childhood obesity are
inadequate physical activity, sedentary lifestyle, and poor diet (Campbell et al., 2006;
Ebbeling, Pawlak, & Ludwig, 2002). Although most health care officials and early
childhood professionals have identified the primary causes of early childhood obesity,
the debate over effective solutions is ongoing (Epstein, Paluch, Roemmich, & Beecher,
2007).
Unlike other public health issues, prior to 1990, early childhood obesity was
largely viewed as a personal problem with the greatest responsibility falling on the
parents and their children (Schwartz & Puhl, 2002). New initiatives in schools and home
have made the public aware of this increasing problem, and more is being done by way
of prevention. In recent years, elementary schools across the country have
implemented health initiatives geared toward promoting healthier lifestyle choices.
These initiatives and intervention programs include, but are not limited to, healthier meal
choices in school cafeterias, absence of soft drink vending machines in school facilities,
2
mandatory physical education classes, and instruction in health and nutrition curriculum
(Ebbeling et al., 2002). Both private and public schools across the country have
introduced intervention and obesity prevention programs in the form of interdisciplinary
curriculum, education about healthy lifestyle choices, and the importance of reduction in
fat intake (Eckstein et al., 2006). In 2008, the Texas Education Agency (TEA) required a
minimum of 135 minutes of moderate or vigorous physical activity per school week for
all students. The Dallas Independent School District (DISD) recently adopted the
Operation Tone-Up program, which is a supplement to its physical education and health
curriculum for 1,600 fourth graders at 20 of the district’s elementary schools (“Schools
Work,” 2006). Operation Tone-Up, a Phoenix-based company, established a 10-week
program that emphasizes the importance of exercise and nutrition. This program
requires participation from the students, parents, and teachers. Additionally, elementary
schools in the Richardson, Texas school district have used the Fitnessgram® test for
more than 10 years. Fitnessgram® is an annual fitness test that measures the body fat,
flexibility, and aerobic endurance of children in grades 3 through 12. According to the
Dallas Morning News and the Texas Education Agency, every school in the state of
Texas will eventually use Fitnessgram® as a requirement of a new health and fitness
law for children (Hupp, 2007).
Research indicates this generation may be the first to not outlive their parents
due to overweight and obesity-related illnesses effecting overall health and morbidity
(GAO Report, 2005). In 1998, the United States Social Security Administration began
classifying extreme obesity in both children and adults as a legitimate disease that
qualifies one for disability benefits (American Obesity Association, 2003). Health issues
3
related to obesity include, but are not limited to, Type 2 diabetes, elevated blood
pressure, sleep apnea, various forms of cancer, insulin resistance, and elevated
cholesterol levels (Deckelbaum & Williams, 2001; Faith, Scanlon, Birch, Francis, &
Sherry, 2004; Lobstein, Baur, & Uauy, 2004). The earlier in life a child is labeled
overweight the more likely that child will remain overweight into adulthood and
experience weight-related health complications (Deckelbaum & Williams, 2001). The
long-term effects of early childhood obesity have been intensely examined by
pediatricians and public healthcare officials alike (McGarvey et al., 2004). There have
also been studies that researched the psychological impact of overweight and obesity
on young children (Puhl & Latner, 2007). Caregivers reported depression, low self-
esteem, loneliness, and weight-related victimization of overweight children (2007).
The National Center for Health Statistics indicates the most recent National
Health and Nutrition Examination Survey, conducted in 2004, found that the incidence
of overweight/obesity among children 2 to 5 years old increased from 7.2% to 13.9%
between 1988 and 2004. The lifelong health issues and costs associated with obesity
can and will continue to pose a strain on individuals and public health unless changes
are made in the attitudes and lifestyles of those who are overweight.
Additional research indicates that obesity among Hispanic and African-
American children is greater than that of their Caucasian counterparts (Deckelbaum &
Williams, 2001; Kimbro, Brooks-Gunn, & McLanahan, 2007). Many experts attribute this
increase to greater levels of inactivity in young children and poor diet choices. The main
contributors of overweight in young children are video games, lack of exercise, poor
dietary choices, and prevalence of high-calorie fast foods (Golan & Crow, 2004). Health
4
issues and genetic predisposition contribute to only a small percentage of obese
children between the ages of 3 and 6 years old (Lee, Murry, Brody, & Parker, 2002;
McGarvey et al., 2004). Results from previous inquiries regarding child feeding habits
indicate that food consumption preferences, patterns, and routines are established in
early childhood (Etelson, Brand, Patrick, & Shirali, 2003). In addition, “…There is
evidence that parents may not recognize the connection between traditions associated
with food consumption and obesity in their children or perceive obesity as a health risk”
(McGarvey et al., 2006, p. 267).
I examined the nutritional perceptions and eating habits of African-American
parents of 3 to 7-year-old children. The inquiry also focused on the relationship between
African-American parents’ habits and beliefs about nutrition and the likelihood of obesity
in their children. I used the Comprehensive Feeding Practices Questionnaire and
interviews with participants to analyze parental influence, modeling, and perceptions
about nutritional food choices.
This researcher will also examine dietary practices of African-Americans and
traditional beliefs among African-American parents about acceptable weight of young
children. Current research suggests there is cultural misconception among African-
Americans and Hispanic Americans that heavy children are healthy unless health
problems are apparent (McGarvey, et al., 2006). This opinion will be explored and links
will be made regarding a child’s home environment and weight. Additionally, the
potential health complications resulting from childhood obesity and poor diet will be
explored and issues for further research will be included. Finally, the researcher will
5
make suggestions for dietary changes and parent education based upon data gathered
at the conclusion of this study.
Purpose of the Study
The researcher explored the link between parental beliefs and influences on
childhood obesity in African-American households with children ranging from the ages
of 3 to 7-years-old. The investigator examined the habits and knowledge of nutritional
information of African–American parents of differing educational and socio-economic
levels in the Dallas, Texas area. Participants completed a demographic questionnaire
and the Comprehensive Feeding Practices Questionnaire (CFPQ), which is a self-
survey used to determine the general dietary practices of adults and their children.
Twenty randomly-selected participants participated in a brief, follow-up interview
conducted by the researcher.
Statement of the Problem
Over the past decade, there have been many empirical research studies
addressing early childhood obesity (Baughcum et al., 2001; Carnell et al., 2005; Faith et
al., 2004; Musher-Eizenman & Holub, 2007). A percentage, however, have focused on
parental perceptions of healthy eating habits and lifestyle as it relates to their children.
Even fewer have addressed this issue in the African-American community (Birch et al.,
2001). Currently, more African-American children are being diagnosed with obesity than
their Caucasian counterparts (Deckelbaum & Williams, 2001). Studies have reported
that Hispanic and African-American children have higher rates of overweight and
obesity than Caucasian children (McGarvey et al., 2006). There have been limited
research studies addressing the problem of higher obesity rates in African-American
6
children and such research is indicative of the need for more substantial parent
education in the African-American community. Early childhood obesity among African-
American children will continue to increase unless changes are made in the way
parents are feeding their children and/or allowing their children to lead sedentary
lifestyles. “Between 5% and 25% of weight variance has been attributed to genetic
influences; however, the increasing prevalence of obesity during the past 20 years
appears to owe mostly to environmental factors such as home milieu and parental
influence” (2004, p. 1490).
Many parents are unknowingly contributing to their children’s weight increase
(McGarvey et al., 2004). If parents are made more aware of the problem, there is a
greater likelihood that the appropriate steps will be taken in the home to prevent or
reduce early childhood obesity. In the case of overweight and obesity, early recognition
and prevention is more desirable than treatment after diagnosis (Golan & Crow, 2004).
Fundamental change in the home environment will be necessary to combat this
problem. Additionally, research indicates that poor diet and/or obesity can produce
adverse effects in the way young children learn and interact with peers (Puhl & Latner,
2007).
Research Questions
1. To what extent, if any, is there a relationship between African-American
parental nutritional habits and beliefs and foods they provide for their
children?
Hypothesis 1. Parents’ beliefs about nutrition will positively correlate
with food they provide for their children.
7
2. To what extent, if any, do African-American parents believe their children’s
weight is based on nutrition or genetics?
Hypothesis 2a. Most parents believe that their children’s weight is
based largely on nutrition.
Hypothesis 2b. Most parents believe that genetics play a minor role in
their children’s weight.
3. To what extent, if any, do African-American parents eat home cooked meals
or fast food?
Hypothesis 3a. Home cooked meals will comprise less than 25% of
parents’ overall diet.
Hypothesis 3b. Fast food will comprise 50% of parents’ overall diet.
Hypothesis 3c. Parents with higher household incomes will eat fast
food significantly more often than those with lower household incomes.
4. To what extent do African-American parents restrict children’s food intake to
prevent obesity?
Hypothesis 4. Parents with higher household incomes will restrict their
child’s food intake more often than parents with lower household
incomes.
5. To what extent, if any, do African-American parents limit the food their
children consume?
Hypothesis 5. Parents with higher education levels will exercise greater
control in feeding their children than those with less formal education.
8
Significance of the Study
In light of the overwhelming problems related of childhood obesity, this
investigation was conducted to examine the influence parents have on their children’s
health and well-being by providing nutritious and healthy foods for their children as well
as by modeling healthy eating practices themselves. A research study conducted with
mothers in the United States as well as the United Kingdom concluded that only about
one-fifth of the participants with overweight preschool children recognized their children
as overweight (Eckstein et al., 2006). These researchers, as well as others, have
concluded that parents who do not believe their children are overweight are less likely to
take preventative measures to promote healthier lifestyle and food choices (Carnell,
Edwards, Croker, Boniface, & Wardle, 2005). Many early childhood childcare and public
health professionals agree that the first and most important step in familial intervention
is parental recognition of the problem. Existing research overwhelmingly indicates that
obesity is easier to prevent than treat. This study was intended to survey the nutritional
habits of African-American parents and provide suggestions for possible parent
education forums.
Operational Definitions
BMI (body mass index)–According to the Centers for Disease Control and
Prevention (CDC), this is:
…A number calculated from a child’s weight and height. BMI is a reliable indicator of body fatness for most children and teens. BMI does not measure body fat directly, but research has shown that BMI correlates to direct measures of body fat, such as underwater weighing and dual energy x-ray absorptiometry (DXA). BMI can be considered an alternative for direct measures of body fat. Additionally, BMI is an inexpensive and easy-to-perform method of screening for weight categories that may lead to health problems. (“About BMI”, 2008)
9
Early childhood– The National Association for the Education of Young Children
(www.naeyc.org) classifies early childhood as birth through age 8. The participants in
the study will be African-American parents of African-American children between the
ages of 3 and 6 years old.
Fast food-This type of food is often high in fat, sodium, and calories and low in
nutritional value. “Food, as hamburgers, pizza, or fried chicken, that is prepared in
quantity by a standardized method and can be dispensed quickly at inexpensive
restaurants for eating there or elsewhere”
(http://dictionary.reference.com/browse/fastfood).
Obesity–A physical state characterized by a very high amount of body fat in relation to
lean body mass, or body mass index (BMI) of 30 or higher. Health practitioners
generally attribute obesity to less energy being utilized than being taken in through food
consumption (Deckelbaum & Williams, 2001). This study will focus on early childhood
obesity, rather than young children who are overweight.
Soul food–This diet emerged in the Southern United States during the period of slavery
and was later transported to the urban North, Midwest, and West via successive waves
of black migration. Foods most traditionally associated with the slave diet include
inexpensive pork and corn products. Some examples of foods consumed were
chitterlings (pig intestines), trotters, hominy, fatback and hoecake, field greens, sweet
potatoes, black-eyed peas, wild berries, and molasses. By the 1960s, other commonly-
cited soul foods included fried catfish, fried chicken, barbecue, cornbread, biscuits and
gravy, okra, and fruit cobblers (Witt, 2008).
10
CHAPTER 2
REVIEW OF LITERATURE
The issue of early childhood obesity and obesity in general has become a
societal problem of great concern (Ebbeling et al., 2002; Puhl & Latner, 2007; Sherry et
al., 2004). Existing literature and research addressing the problem of early childhood
obesity is extensive from the early childhood community as well as medical practitioners
and pediatricians (McGarvey et al., 2006). Cross sectional, longitudinal, experimental,
and observational studies have been conducted resulting in both qualitative and
quantitative data analysis (Datar & Sturm, 2004; Kimbro et al., 2007). Genetics,
decreased physical activity, diet, and family environment have been named as
contributors to the rise in obesity (Ebbeling et al., 2002). Evidence from numerous
studies indicates that if the problem of early childhood obesity is not addressed soon,
the numbers of obese children and adults will continue to increase. Literature from the
United States Centers for Disease Control and Prevention indicates that if an individual
is overweight and/or obese before 8 years of age, achieving a healthy weight will be a
lifelong problem, and obesity in adulthood is likely to be severe (“Childhood overweight,”
2008).
This review of literature and research is separated into 4 sections. The first
section provides information derived from research studies and statistics conducted by
government or federally-funded agencies. The second section explores studies about
parental behaviors concerning their children’s eating habits. The third section will
include research studies that address the eating habits of the African-American
population in general. Finally, the fourth section will provide information about the
11
research studies that have already been conducted concerning nutritional habits and
dietary perceptions of African-American parents.
Government Studies and Statistics
Almost all current literature on the topic of obesity emphasizes that early
childhood overweight and obesity is reaching epidemic proportions in the United States
as well as in most developed countries (Deckelbaum & Williams, 2001; Golan & Crow,
2004; Kimbro et al., 2007). The number of overweight and obese pre-school aged
children is growing at an alarming rate (Small, Anderson, & Melnyk, 2007). Recent
research indicates that 21% of 2-to-5-year-old children are overweight or obese with a
body mass index (BMI) in the 85th percentile (Small et al., 2007). BMI is a measure of
body fatness calculated from a child’s weight and height and is used to determine what
is considered “healthy” (“About BMI”, 2008). The problem of early childhood obesity is
not limited to the United States nor North America; all industrialized regions of the world
are reporting increased weight in children (Deckelbaum & Williams, 2001; Ebbeling et
al., 2002). Recent European research studies indicated that more than 20% of 6-year-
olds in Germany and the Netherlands had a BMI which exceeded the 90th percentile,
and similar results were found in other industrialized countries, including the United
States (Lamerz et al., 2005). Globally, the BMI and weight of young children has
increased over the past 30 years and continues to increase with no foreseeable end in
sight (Lobstein et al., 2004).
The National Health and Nutrition Examination Survey (NHANES) is
administered periodically under the direction of the Centers for Disease Control (the
CDC), an agency run by the United States Department of Health and Human Services.
12
Statistical data from the NHANES conducted in 2003-2004 indicated an increase in
overweight of children 2 to 5 years old. These data reflected an increase from 5% in the
1971-1974 and 1976-1980 surveys to 13.9% in the 2003-2004 survey. The CDC
suggests this increase is due to a change in contributing factors. These include genetic
factors which involve family susceptibility of obesity or genetic disorders, behavioral
factors such as regular consumption of large portion sizes or sedentary lifestyle, and
environmental factors which are dietary practices within the home, school, or child care
facility.
In the last decade, the CDC has provided many resources regarding early
childhood obesity that are readily available to parents, childcare providers, and the
general public. Websites promoting healthy lifestyles and proper nutrition are interactive
and easily accessible, such as www.smallstep.gov, www.presidentschallenge.com, and
www.aap.org/obesity. In addition, ongoing campaigns from the Ad Council, which
address childhood obesity prevention, have been established in recent years promoting
the benefits of an active and healthy lifestyle. Some manufacturers of foods specifically
marketed to children have drastically changed their marketing and advertising methods
in an effort to promote healthier eating habits (Salinsky, 2006).
Many government-sponsored research studies have been conducted in the
United States regarding the causes and future health risks associated with early
childhood obesity. According to the National Health and Nutrition Examination Survey
(NHANES) conducted in 2003-2004, 17% of children between the ages of 2 and 19
years old are overweight. Data derived from the NHANES in 1999-2000 revealed that
13
20.6% of children between the ages of 2 and 5 years old are overweight or at risk of
becoming overweight (Vaughn & Waldrop, 2007).
Results from several of these studies indicate early childhood obesity contributes
to adult obesity and related health problems. Problems such as heart disease, diabetes,
hypertension, and certain types of cancer are possibly caused or exacerbated by
obesity in childhood and young adulthood (Veugelers & Fitzgerald, 2005; Young-
Hyman, Herman, Scott, & Schlundt, 2000). The costs associated with efforts to treat
and control these diseases have placed an increasingly greater economic strain on
health insurance companies, taxpaying citizens and the healthcare system of the United
States (Ebbeling et al., 2002). The long-term effects of obesity are constantly being
reviewed, and the growing trend toward obesity is often cited as being a contributor to
what U.S. policymakers regard as an evolving health care crisis (Ebbeling et al., 2002).
The President’s Council on Youth Fitness was initiated by President Dwight D.
Eisenhower in response to a published report about the physical fitness of American
children. This council was created to present recommendations to the President of the
United States concerning programs that promote physical fitness, athletics, and good
physical health for all Americans. After several modifications and name changes by
U.S. presidents, the council is currently known as the President’s Council on Physical
Fitness and Sports. “The President's Council on Physical Fitness and Sports is an
advisory committee of volunteer citizens who advise the President through the
Secretary of Health and Human Services about physical activity, fitness, and sports in
America” (About the Council, 2008).
14
Federally-funded studies focusing on the effects of physical education classes for
young children have been conducted. The Early Childhood Longitudinal Study–
Kindergarten Class (ECLS-K) was a study conducted by the National Center for
Educational Statistics that followed a cohort of ethnically and socio-economically
diverse children who entered kindergarten in the 1998-1999 school term (Datar &
Sturm, 2004). This sample was derived from approximately 1000 public and private
schools in the United States (Datar & Sturm, 2004). Data were utilized from this study to
examine the effects of increased physical education instruction between kindergarten
and first grade on BMI using the same child as a control. These children participated in
an additional hour per week of physical education instruction in first grade compared to
the time they spent in physical education class in kindergarten. The results indicated
that BMI was reduced for girls who had already been identified as overweight or at-risk
for overweight and no significant effect on boys or girls with a normal BMI. The purpose
of this inquiry was to show the benefits of increasing time for physical education classes
for young children who were attending physical education classes only once or twice a
week, if at all.
Parental Behaviors
Because of the widespread interest in addressing the problems of an overweight
and obese population, numerous research studies have been conducted to examine
parental behaviors and how they impact or contribute to early childhood obesity.
Empirical research reflects that in the absence of parental intervention and/or lifestyle
changes in the home, the rates of early childhood obesity will only increase (Schwartz &
Puhl, 2000). This fact further stresses the importance of parental influence. “Although
15
having an obese parent transfers a genetic disposition to becoming obese, shared
family experiences related to food preferences, eating patterns, and activity habits may
contribute most to the increased obesity risk for children” (McCaffrey, Rennie, Wallace,
& Livingstone, 2007, p. 89).
The Child Feeding Questionnaire (CFQ) (Birch et al., 2001) is a widely-used and
widely-recognized instrument for self-reporting parental beliefs regarding child feeding
practices and perceptions. These authors designed the CFQ to be utilized by parents of
2- to 11-year-old children (Birch et al., 2001). In 2001, the creators of the CFQ
published a research study concerning parental beliefs, attitudes, and practices, in
regards to child feeding (Birch et al., 2001). Their study was conducted in central
Pennsylvania with the assistance of 394 parents of 5- to 9-year-old girls, 148 parents of
8- to 11-year-old boys and girls, and 126 parents of 7- to 11-year-old boys (3 samples
total). All three sample groups consisted of non-Hispanic White, Hispanic, and African-
American parents who completed the CFQ. A trained professional obtained height and
weight measurements of the children. Correlations between the weight status of the
children and parents’ scores on the questionnaire factors were noted. Their results
supported the validity of the instrument as 4 of the 7 factors were directly related to the
independent measure of the children’s weight status. In the discussion of this published
study, the authors wrote that these data derived from this study were cross-sectional
and a longitudinal study would be necessary to determine the extent to which parental
control practices are causally implicated in the obesity of their children (Birch et al.,
2001). Additional researchers have indicated that parents who exercise stricter control
over their children’s diet and food intake are inadvertently promoting dieting, which is
16
discouraged by most early childhood experts (Lindsay, Sussner, Kim, & Gortmaker,
2006).
Another popular instrument is the Preschooler Feeding Questionnaire (PFQ),
which is a self-administered survey instrument that explores parental feeding beliefs
and practices as they relate to child overweight status (Baughcum et al., 2001). This
instrument was developed in 2000 and was pilot tested and validated with a sample of
351 participants in the Kentucky Special Supplemental Nutrition Program for Women,
Infants, and Children (WIC) and 283 clients of the Cincinnati Pediatric Research Group
(Baughcum et al., 2001; Seth et al., 2007). “The authors factor analyzed each
questionnaire and calculated mean factor scores and linked them with the children’s
measured and mothers’ self-reported weight and height” (Baughcum, et al., 2001, p.
391).
Seth et al. (2007) utilized the PFQ in their research to address differences among
Spanish-speaking and English-speaking parents in the Texas Special Supplemental
Nutrition Program for Women, Infants, and Children (WIC). Their inquiry was prompted
by previous research, which suggested 19% of low-income young children were
overweight, or at risk for overweight. This previous research also suggested that there
were higher rates of overweight among the Hispanic children than Caucasian children
served in the WIC program. There was no mention of other ethnic groups. The sample
in the Greenberg study comprised 235 Hispanic and non-Hispanic parents from 7 WIC
clinics in various cities in Texas. These researchers translated the instrument into
Spanish for the Spanish speakers and distributed the original form of the instrument to
the English-speaking participants. The factor analysis generated a 9-factor solution for
17
the sample. These factors were: parental worry and weight status, difficulty in child
feeding, concern about child overeating, using food to calm child, pushing child to eat
more, use of positive incentives, child’s control of feeding, mealtime routines, and use of
a bottle. The researchers compared responses from the Spanish and English versions
of the PFQ using descriptive statistics (mean factor scores and standard deviations) on
each of the 9 factors. They also analyzed these data by conducting an analysis of
variance (ANOVA) as well as a multivariate analysis of variance (MANOVA) and
concluded that Spanish-speaking parents were likely to be concerned with their
child(ren) overeating and weight than their English-speaking counterparts. No other
significant differences were noted.
The instrument used for the current research project is the Comprehensive
Feeding Practices Questionnaire (CFPQ). The CFPQ was developed by Musher-
Eizenman and Holub of Bowling Green State University and the University of Texas at
Dallas respectively on the premise that children’s eating habits, overall nutrition, taste
preferences, and ultimate weight status are largely based on parental attitudes and
influence (Musher-Eizenman & Holub, 2007).
These authors of the CFPQ believed that that the previous self-reporting
instruments did “not yet fully capture the range of behaviors regarding the construct of
child feeding” (Musher-Eizenman & Holub, 2007, p. 961). The CFPQ was validated by
three studies measuring feeding practices of mothers and fathers, a comprehensive
measure of parental feeding, and feeding practices of mothers of 2- to 8-year-old
children. Initial validation was completed through an inquiry which included 269 mothers
and 248 fathers of children between the ages of 3 and 6 years old. Ninety-two of the
18
participants were Caucasian, and the median income ranged from $55,000 to $75,000.
An initial pool of items was derived from existing child feeding surveys, including the
CFQ and the Preschooler Feeding Questionnaire (PFQ). Participants were given the
newly-constructed items, and the researchers conducted a psychometric analysis and
added new constructs to the instrument. In the second study, the participants were 33
mother-father pairs of 4-to-6-year-old children. This sample had similar racial
background and income levels as those in the first study. The participants in this inquiry
answered the same items and two open-ended questions that required them to write in
their responses. This procedure yielded new feeding practice responses, which were
coded and fit into the 11 existing subscales. For the third study, 152 mothers
participated; 93% were Caucasian, and the median reported income was $75,000 to
$95,000. Participants responded to the new items after changes had been made in the
wording. A reading level of the final survey indicated it was suitable for parents of all
educational levels. These authors also calculated bivariate correlations among the
subscales.
A 2003 research study conducted by Etelson, Brand, Patrick, and Shirali
examined “parents’ understanding of excess weight as a health risk, knowledge of
healthy eating habits, and recognition of obesity in their children” (2003, p. 1363).
These researchers distributed an anonymous questionnaire to 83 parents at a pediatric
medical facility. Their survey instrument contained a visual analog scale that required
parents to visually identify their child based on pictures of children of varying weights.
The results indicated that 23% of the participants had overweight children, but only
10.5% of these parents accurately identified their child as overweight. These authors
19
concluded that many parents have misconceptions regarding the severity of their
children’s overweight condition. Additionally, the authors discovered that many parents
had misconceptions about the definitions of obesity and believed that it was limited to or
related to compromised mobility. Many participants also believed that their 4 to 8-year-
old children would lose their “baby fat” or excess weight as they aged (2003). This
misconception is typical and frequently inhibits parents and guardians from taking
appropriate action to address the problem of pediatric obesity.
An inquiry conducted by Sherry et al. (2004) was conducted with 12 focus groups
of mothers of 2-to-5-year-old children. Nine of the focus groups were recruited from
Special Supplemental Nutrition Program for Women, Infants, and Children (WIC)
programs in Georgia. Of those 9 groups, 3 consisted of White mothers, 3 consisted of
African-American mothers, and 3 consisted of Hispanic-American mothers. The
additional 3 focus groups consisted of middle-income White mothers who were not
recipients of WIC or other government assistance near the Pennsylvania State
University campus. These participants in Georgia received small financial payments for
their participation to cover babysitting and transportation costs. The participants in
Pennsylvania were not compensated. One moderator facilitated discussion sessions
with all focus groups. The moderator utilized questions and probing inquiries adapted
from the CFQ. The focus group sessions were audio-taped, and responses from the
participants were transcribed after each session. Four co-authors independently read
and coded each transcript to identify common themes.
These results indicated that the most common difficulties reported by the African-
American mothers regarding their household mealtime environment were playing
20
outside with other children, limited food supply, dealing with children who are picky
eaters, and those who drink fluids before meals (Sherry et al., 2004). Hispanic mothers
mentioned cost as a major determinant of foods available in the home. The middle-class
groups reported the influence of older siblings and keeping children on a breakfast time
schedule that allows for ample time to get to work and school as challenges to the
household mealtime environment. Two of the twelve focus groups mentioned
withholding drinks until a sufficient amount of food had been eaten as a strategy to
persuade children to eat. These authors suggested that educating mothers about the
Dietary Guidelines of Americans, appropriate child portion sizes, and budgeting for
healthy meal planning may promote health child weight. Discouraging mothers from
bribing their children with unhealthy snacks, believing their children when they say they
are full, and requiring children to eat the family meal (as opposed to short-order cooking
for picky eaters) were mentioned as well.
A common theme in the results of these studies appears to be that more should
be done to assist parents in the initial recognition of early childhood obesity. These and
other studies have indicated that parents’ perception of overweight is sometimes
skewed.
African-American Dietary Habits
“Feeding practices and beliefs may be partial determinants of overweight status
in children; however, the food environment and cultural norms are also influential” (Seth
et al., 2007, p. 267). Historically, the price of foods such as fresh fruits, fresh
vegetables, and lean cuts of meat presented an economic hurdle that was not an option
for many African-American families, especially those of low socio-economic status or
21
those with large numbers of children (Dirks & Duran, 2001). Unhealthy foods were less
expensive and more readily available. Large families could provide for more family
members by preparing more inexpensive food like beans, rice, and meats with high fat
content. Frying foods provided another way for large families to increase the caloric
value of the foods they were able to afford.
In their 2001 study, Dirks and Duran completed an extensive comparison of early
field studies regarding the eating habits of African Americans. They discovered an
obvious difference in the diet of African Americans in the southern states of the United
States as compared to their counterparts in metropolitan areas. Their original inquiry
was conducted in rural Virginia; Washington, DC; and Philadelphia. The major findings
from this research indicated that as far back as the 1800s, African Americans in the
southern rural areas had less variety of foods in their diets, and ate more soul food
(2001). This ultimately led to increases in overweight conditions and obesity as well has
higher morbidity rates (2001). The extent to which these dietary practices are still in
place today is in question.
Ard, Skinner, Chen, Aikin, and Svetkey (2005) conducted a study addressing
cancer prevention strategies for African Americans through diet modification. Their
research indicated that traditionally, several variables have contributed to lower
consumption of vegetables and fruits by African Americans including, but not limited to
socioeconomic status, gender, age, and accessibility to fresh produce. The change from
consumption of traditional or “soul” foods has been attributed to acculturation (2005).
“Acculturation refers to adoption of values, beliefs, language, customs, and mannerisms
of the larger society–usually by members of a minority ethnic group” (2005, p. 240). This
22
suggests that younger or more affluent African Americans may be less likely to follow
historically cultural practices regarding food choices and/or may be less financially
restricted when making food purchases for themselves and their children.
African-American Parent Perceptions
Many studies have focused on the possible explanations of why obesity among
minority children is even greater than among their Caucasian counterparts. Deckelbaum
and Williams (2001) found that childhood overweight and obesity were highest in
Mexican-American children and lowest for Caucasian children, with African-American
children scoring between the other two groups. They also indicated that socioeconomic
status was an important predictor in childhood obesity (Deckelbaum & Williams, 2001;
Ebbeling et al., 2002).
A study led by Haire-Joshu et al. (2002) in the St. Louis, Missouri area found that
culture influences dietary patterns in most people, especially those of African-American
origin. This makes it difficult to promote dietary and lifestyle changes. These authors
also addressed the fact that cancers related to unhealthy diet such as colorectal, lung,
breast, and prostate cancer are more prevalent among African Americans in relation to
other ethnic groups. This may be due to lower consumption of fruits and vegetables and
higher consumption of high-calorie and high-fat foods (Haire-Joshu et al., 2003). In their
research study, the authors presented the outcomes of two programs working in
conjunction. The first program was High 5, Low Fat (H5LF) funded by the National
Cancer Institute. The second program was Parents as Teachers (PAT), a national
parent education program.
23
These researchers (Haire-Joshu et al., 2002) collected data over two years from
African-American families served by PAT in school districts in and around St. Louis,
Missouri who met certain criteria as determined by the researchers (single parenthood,
low income, minority ethnicity, et cetera). The selected participants were divided into
two groups of 325 (control group) and 406 (intervention group) and were asked to
complete baseline and post-test surveys given after an intervention. These participants
completed a modified form of the Block Food Frequency Questionnaire (FFQ) and the
Parental Modeling Questionnaire, which were developed by the authors. Results
indicated that fruit and vegetable consumption increased in 53% of the participants in
the intervention group compared to 41% in the control group. However, the intervention
group decreased its fat intake by 36.2%, whereas the control decreased its fat intake by
37.5%.
A cross-sectional research study conducted by Powers, Chamberlin, van
Schaick, and Whitaker (2006) tested the hypothesis that low-income African- American
children would have a higher BMI when their mothers reported an increased amount of
control and restriction in feeding and reported that their children displayed greater food
responsiveness. Two hundred ninety-six African- American mothers from the Special
Supplemental Nutrition Program for Women, Infants, and Children (WIC) in Cincinnati,
Ohio participated in the research. All participants had 2-to-5-year-old children and
completed a questionnaire developed by the researchers from previously-validated
instruments and self-reported their BMI scores. In addition, the researchers measured
the BMI scores of their children. These researchers found a link between parental
feeding strategies and the BMI scores of the children. “Specifically, greater maternal
24
restriction and control were both associated with greater BMI in the children of obese
mothers” (2006, p. 2031). They also discovered there was no correlation between
maternal BMI and the feeding or child eating constructs. Food restriction resulted in the
children having a greater BMI. These authors noted that, in contrast to studies
conducted with White children from middle-to-upper socioeconomic backgrounds, there
was no association between food restriction and BMI.
A study concerning how maternal education, incomes, and familial routines
impacted children’s dietary patterns was conducted by Lee, Murry, Brody, and Parker
(2002). Their research was conducted with 159 single parent households in rural
Georgia. Unlike other studies of this kind, the authors of this particular research used
Uri Bronfenbrenner’s Ecological Systems Theory as a theoretical framework for the
study. Bronfenbrenner’s Ecological Systems Theory (which is now known as the
Bioecological Systems Theory) is a five system environmental model of human
development (Santrock, 2004). The microsystem consisted of the child’s home, school,
and peer group, while the mesosystem examined the links between the home school
and peer groups of the microsystem. The exosystem concerned environments not
directly involved with the child, and the macrosystem dealt with culture, values and
attitudes of the child’s family (2002). These authors hypothesized that “maternal
education, perceived family resources, and importance of family routines would be
related to children’s dietary patterns” (2002, p. 107). The authors also hypothesized that
the children’s physical and cognitive abilities would be affected by dietary patterns.
All participants were parents of children between the ages of 6-and-9-years-old
and received monetary compensation for their participation in the study (Lee et al.,
25
2002). After receiving consent from the parents and assent from the children, trained
research assistants administered self-report questionnaires in an interview format. The
children’s teachers were interviewed as well. These researchers used 5 different
instruments for data collection. The measures were the Nutritional Component Scale,
the Woodcock Johnson Psycho-Educational Battery-Revised, the Perceived
Competence Scale for Children, the Family Routines Inventory, and the Family
Resource Scale. These results supported the authors’ hypotheses. Better eating
patterns were directly related to higher maternal education. The researchers also
concluded that cognitive and physical developments were closely tied to family nutrition
and resources, as well.
A 2006 research study conducted by Skelton, Busey, and Havens produced
results indicating that African-American children and parents from urban areas very
often do not recognize overweight nor do they recognize the health implications of
overweight. The sample included children and parent attendees at an inner-city health
fair sponsored by the Milwaukee Urban League. Both parents and children completed
surveys, and researchers measured the height and weight of the children. Analysis of
the survey responses and the measurements of the children revealed that most of the
African-American children and parents underestimated the child’s weight. More than
66% of overweight children or children who were at risk for overweight identified their
own weight as healthy or normal. “Many of the parents of these overweight and at risk
of overweight children also believed that their child’s weight was healthy, even when
they identified their child as overweight” (2006, p. 291). These authors suggest that
26
higher weights and an underestimation of weight status is prevalent in the African-
American community. Comparable research studies yielded similar results.
27
CHAPTER 3
METHODOLOGY
The purpose of this study was to determine the relationships between parental
beliefs and factors that influence childhood obesity. More specifically, the current
research focused on African-American households with children ranging in ages from 3
to 6 years old. This inquiry employed a mixed methods approach using both quantitative
and qualitative data analysis. Mixed method designs combine both quantitative and
qualitative measures to provide the most comprehensive results as they relate to the
research questions (Cresswell, 2003). Quantitative analysis was utilized for Research
Questions 1,4, and 5. Qualitative analysis was utilized for Research Question 2 and the
first hypothesis of Research Question 3. Responses from the Comprehensive Feeding
Practices Questionnaire (CFPQ) (Musher-Eizenman & Holub, 2007) and a short
demographic questionnaire provided quantitative data for analysis. Qualitative data was
collected from 20-minute participant interviews conducted by the researcher.
Sample
Participants were African-American parents of 3-, 4-, 5-, and 6-year-old children
in the Dallas, TX metropolitan area. The sample included mothers and/or fathers and
others who are custodians. A convenience sampling method was used to recruit
participants to complete the surveys and participate in the interview. African American
parents from a Dallas public school were asked to participate in the study. The school
was located in the southern sector of Dallas and was a Title I school which served
mostly families with low socioeconomic backgrounds. This school served children in
28
pre-kindergarten through fifth grade and had a predominantly African-American and
Hispanic population.
Parents of the 28 African-American pre-kindergarten students, 39 African-
American kindergarten students, and 33 African-American first grade students enrolled
in the fall of 2008 as well as volunteers and employees of the elementary school were
invited to participate. They received an introduction letter from the researcher, a consent
form, a copy of the Comprehensive Feeding Practices Questionnaire and a copy of the
demographic questionnaire. All participants were provided with the primary researcher’s
telephone number and were encouraged to schedule interviews to provide further
information regarding their questionnaire responses.
Instrumentation
Participants completed a demographic questionnaire created by the researcher
and the Comprehensive Feeding Practices Questionnaire (CFPQ). The CFPQ was
developed by Dr. Dara Musher-Eizenman of Bowling Green State University and Dr.
Shayla Holub of the University of Texas at Dallas for the purpose of better
understanding “how parents feed their children, the factors that contribute to these
practices, and the implications of these practices on children’s eating behaviors”
(Musher-Eizenman & Holub, 2007, p. 960). This questionnaire is a self-reporting survey
for assessing parental control in child feeding and consists of 49 close-ended questions,
and responses are recorded on a 5-point Likert scale. The questionnaire consists of 12
subscales for the purposes of data analysis. This instrument was validated after three
independent studies conducted by its creators.
29
The initial validation was completed with a sample of 517 parents of 3-to-6 year-
old children. Select subscales from the Child Feeding Questionnaire (CFQ) and the
Preschooler Feeding Questionnaire (PFQ) were used to develop the preliminary pool of
items. After the parents responded and returned the initial instrument, these authors
identified items that were confusing to the participants and/or had low variability to omit
from the questionnaire. The second study was conducted to add additional items to the
original questionnaire and to conduct another pilot study with another sample.
Participants in this phase were 33 mother-father pairs of 4-to-6-year-old children. This
sample completed open-ended written surveys. Those responses were coded and
developed into new survey items. The final validation introduced the new and improved
questionnaire from the initial study by adding supplementary items from the second
phase. This survey was distributed among 152 mothers of 1-to-8-year-old children. The
final validation included running a confirmatory factor analysis, examining the readability
of the instrument, and a thorough examination of the external validity of the subscales
(Musher-Eizenman & Holub, 2007).
The 49 items in the CFPQ measure parental control in child feeding on 12
subscales (see Appendix B). The subscales include: Child Control, Emotion Regulation,
Encourage Balance and Variety, Environment, Food as Reward, Involvement, Modeling,
Monitoring, Pressure, Restriction for Health, Restriction for Weight Control, and
Teaching about Nutrition.
Child Control. The Child Control subscale consists of 5 items measured on a 5-
point scale from 1 (never) to 5 (always). These items assess the frequency that parents
allow children to control their eating behaviors, as well as parent-child feeding
30
interactions. Example items include, “Do you let your child eat whatever she or he
wants?” and “If this child does not like what is being served, do you make something
else?” Internal consistency has been reported at α = .70 (Musher-Eizenman & Holub,
2007).
Emotion Regulation. The Emotion Regulation subscale contains 3 items
measured on a 5-point scale (never, always). This scale measures how parents use
food to regulate the emotions of their children. For instance, “When this child gets
fussy, is giving him/her something to eat or drink the first thing that you do?” Reliability
measures have been reported at α = .74 (Musher-Eizenman & Holub, 2007).
Encourage Balance and Variety. The Encourage Balance and Variety scale
includes 4 items that assess how well parents promote well–balanced food intake. One
of the four items is measured on a 5-point scale (never, always). The remaining 3 items
are measured on a 5-point scale from 1 (disagree) to 5 (agree). Example items include,
“I encourage my child to try new foods” and “I tell my child that healthy food tastes
good.” Internal consistency measures have been reported at a rather low level, α = .58,
and at a healthier α = .73 (Musher-Eizenman & Holub, 2007).
Environment. The Environment subscale includes 4 items that measure the
availability of healthy foods in the home. These items are measured on a 5-point scale
(disagree, agree). Example items include, “Most of the food I keep in the house is
healthy” and “I keep a lot of sweets (candy, ice cream, cake, pies, pastries) in my house
(reverse scored).” Cronbach’s alpha has been reported at .75 (Musher-Eizenman &
Holub, 2007).
31
Food as Reward. The Food as Reward scale consists of 3 items measured on a
5-point scale (never, always). This scale assesses parents’ use of food (sweets and
desserts) as rewards for good behavior or withholding of these foods as punishment.
Internal consistency measures have been reported at α = .69 (Musher-Eizenman &
Holub, 2007).
Involvement. The Involvement subscale contains 3 items that assess the level of
children’s involvement in meal planning and preparation on a 5-point scale (disagree,
agree). An example item is, “I involve my child in planning family meals.” Internal
consistency measures have been reported at α = .77 (Musher-Eizenman & Holub,
2007).
Modeling. The modeling subscale includes 4 items measured on a 5-point scale
(disagree, agree). This subscale measures parents’ healthy eating practices in their
child’s presence. An example item includes, “I model healthy eating for my child by
eating healthy foods myself.” Reliability measures have reported Cronbach’s alpha
levels at .80 (Musher-Eizenman & Holub, 2007).
Monitoring. The monitoring subscale includes 4 items measured on a 5-point
scale (never, always). This subscale assesses how often parents keep track of
unhealthy foods consumed by their children. An example item includes, “How much do
you keep track of the sweets (candy, ice cream, cake, pies, pastries) that your child
eats?” Cronbach’s alpha measures have been reported at .81 (Musher-Eizenman &
Holub, 2007).
Pressure. The Pressure subscale consists of 4 items measured on a 5-point
scale (disagree, agree). This scale measures how often parents pressure their children
32
to increase their food consumption during mealtimes. For instance, “My child should
always eat all of the food on his/her plate.” Reliability measures have been reported at
α = .79 (Musher-Eizenman & Holub, 2007).
Restriction for Health. The Restriction for Health subscale contains 4 items that
measure parents’ control over their children’s food intake to limit less healthy foods and
sweets. These items are measured on a 5-point scale (disagree, agree). Example
items include, “If I did not guide or regulate my child’s eating, s/he would eat too much
of his/her favorite foods” and “I have to be sure that my child does not eat too much of
his/her favorite foods.” Internal consistency measures have been reported at α = .81
(Musher-Eizenman & Holub, 2007).
Restriction for Weight Control. The Restriction for Weight Control contains 8
items that measure parents’ control over their children’s food intake to decrease or
maintain the child’s weight. These items are measured on a 5-point scale (disagree,
agree) and include items such as, “I have to be sure that my child does not eat too
many high-fat foods” and “I restrict the food my child eats that might make him/her fat.”
Cronbach’s alpha has been reported at .70 (Musher-Eizenman & Holub, 2007).
Teaching About Nutrition. The Teaching about Nutrition subscale consists of 3
items that measure parents’ frequency of discussion with children about the
consumption of healthy foods. These items are assessed using a 5-point scale
(disagree, agree). An example is, “I discuss with my child why it’s important to eat
healthy foods.” Internal consistency has been reported at α = .68 (Musher-Eizenman &
Holub, 2007).
33
In addition to the CFPQ, information will be collected from a demographic
questionnaire created by the researcher (See Appendix B). The questionnaire will
provide data about the participants’ gender, educational level, and frequency of
consumption of various types of foods, among other items.
Procedures
For this research, 120 questionnaires were distributed to participating parents.
Surveys with incomplete or problematic response patterns were eliminated from the
study. The principal researcher has stored the completed questionnaires for 3 years
following the completion of the inquiry in accordance with Federal Institutional Review
Board (IRB) regulations. After 3 years, all questionnaires will be shredded.
The participants in this research study provided the following demographic
information: age, gender, marital status, employment status, household income,
education level, number of people in household, number of children, and number of
children between the ages of 3 and 6. Additionally, the sample provided information
specific to the purpose of this inquiry, such as age of child(ren), weight of child(ren), and
frequency of consumption of various types of food. (See Appendix B.)
Interviews
Participants who completed the CFPQ were encouraged to schedule private
interviews with the researcher. Fewer than 20 respondents volunteered for interviews,
so the researcher solicited participants by calling them directly or by sending invitations.
The qualitative analysis consisted of information gathered from 20 interviews.
The oral interviews consisted of 10 open-ended questions (see Appendix C), and the
responses were recorded by handwritten notes at the time of the interview session.
34
Later, the principal researcher transcribed the interview notes onto a computer-
generated document. Furthermore, responses were coded using NVivo software for
analysis by the investigator. The current research followed the process of grounded
theory (Glaser & Strauss, 1967) to analyze the data derived from the interviews. In
Grounded Theory, once the data is collected, the key points of interest in the text are
marked with codes. Codes are then grouped in concepts which make them easier to
organize. The concepts are then formed into categories. Finally, the categories are used
as the basis for creating a theory that can be used to test the hypothesis 2. In the
current research, the topics of children’s weight, nutrition, and the role of genetics on
weight will be specifically examined. The responses were secured by the researcher
and will be destroyed 3 years after the completion of the study in accordance with
federal Institutional Review Board (IRB) regulations. The confidentiality of the
participants was protected. Interview responses contain no identifying information and
were assigned a number for identification purposes only. Only the researcher and/or
faculty advisor have access to participant responses.
Data Analysis
These data were analyzed using a mixed method approach (both quantitative
and qualitative analysis). Qualitative data were coded using NVivo software and used
for qualitative analysis of Research Question 2 and the first and second hypotheses of
Research Question 3. Research Question 2 was an inquiry about the opinions of
African-American parents regarding nutrition or genetics as it related to their children’s
weight. The third research question was about how regularly African-American parents
consume home cooked meals or fast food. Quantitative analysis was completed using
35
the Statistical Package for the Social Sciences (SPSS) software program for Research
Question 1 (which examined the link, if any, between African-American parents’
nutritional habits and beliefs and foods they provide for their children), Question 4
(which measured parental restriction of food intake as it relates to their children), and
Question 5 (which measured parental control in feeding their children). Quantitative
measures were also used to analyze the third hypothesis of Research Question 3 which
examined the frequency of fast food consumption among parents of various income
levels.
Descriptive statistics, including measures of central tendency for continuous
variables and frequencies for categorical variables, were calculated. In addition, the
distribution of the sample across the various levels of the categorical variables was
examined in order to determine if groups need to be combined for further analysis. That
is, in the event that a category had too few participants, it was either be combined with
another group or removed from further analyses. Preliminary analyses to determine the
relationships between the demographic variables included Pearson’s product moment
correlations for the continuous variables, chi square (χ² ) tests for the categorical
variables, as well as independent t-tests, and analysis of variance models (ANOVAs) to
test for differences between the levels of categorical variables on the continuous
variables. These preliminary analyses were conducted to determine if significant
relationships exist between the independent variables. The presence of significant
relationships between variables informed later analyses.
Research Question 1. To what extent, if any, is there a link between African- American
parental nutritional habits and beliefs and their children’s eating habits?
36
Hypothesis 1. Parents’ beliefs about nutrition will correlate directly with food they
provide for their children.
Pearson’s product moment correlations was conducted to examine the
relationship between parental nutrition beliefs and behaviors (Encourage Balance and
Variety, Environment, Modeling) and family eating habits, such as the number of times
families eat out and the number of times families eat home-cooked meals (see
Appendix B for a complete list of these variables).
Research Question 2. To what extent do African-American parents believe the weight of
their children is based on nutrition or genetics?
Hypothesis 2. Most parents will believe that their children’s weight is based
largely on nutrition. They will believe that genetics play a minor role.
Transcribed interviews were coded using NVivo. Frequency reports were run to
assess the number of times various themes emerged from the interview data.
Nonparametric chi square tests of association were calculated to test if certain themes
were statistically more frequent than other themes; specifically, was the idea that their
children’s weight is based largely on nutrition a more commonly mentioned theme than
that their children’s weight was based largely on genetics.
Research Question 3. To what extent do African-American parents eat home cooked
meals or fast food?
Hypothesis 3a. Home cooked meals will comprise a small percentage of parents’
overall diet.
Hypothesis 3b. Fast food will comprise about half of parents’ overall diet.
37
Hypothesis 3c. Parents with higher household incomes will eat fast food more
often than those from lower household incomes.
Transcribed interviews were coded using NVivo. Descriptive statistics for the
frequency of soul food and fast food consumption were reported. In addition, analysis
of variance (ANOVA) and Pearson’s product moment correlation analysis were
conducted to examine differences between income levels on meal types.
Research Question 4. To what extent do African-American parents restrict their child’s
food intake to prevent obesity?
Hypothesis 4. Parents with higher household incomes restrict their child’s food
intake more often than parents with lower household incomes.
Descriptive statistics for the subscales assessing restriction of food intake,
including Restriction for Health and Restriction for Weight Control, were reported. In
addition, analysis of variance (ANOVA) and Pearson’s product moment correlation
analysis were conducted to examine both potential differences between income levels
on restriction of food intake and the relationship between income and restriction of food
intake.
Research Question 5. To what extent do African-American parents exercise control in
feeding their children?
Hypothesis 5a. Parents with higher education levels exercise greater control in
feeding their children than those with less formal education.
Descriptive statistics for the subscales assessing control, including Child Control
and Monitoring, were reported. In addition, analysis of variance (ANOVA) were
38
conducted to examine potential differences between education levels on Child Control
and Monitoring.
39
CHAPTER 4
RESULTS
Demographic Variables
The sample for the current study included 75 participants. As shown in Table 1,
nearly all of the participants were female (94.7%). All of the participants were African-
American (100%) and therefore included in the analysis. In terms of marital status, the
majority were not married. More specifically, more than half of the participants reported
that they were single (60.0%), nearly 20% reported that they were divorced (17.3%),
and another 4.0% were separated. Married participants, on the other hand, comprised
13.3% of the sample and another 5.3% reported that they were cohabitating or living as
married.
Over half of the sample indicated that they were employed, with 45.3% reporting
full-time employment and 17.3% reporting part-time employment. Approximately 40%
of the sample was not employed (37.3%). As part of the survey, participants were asked
to indicate their pre-tax household income using categories from less than $20,000 to
$119,999. Approximately one-quarter of the participants reported incomes less than
$20,000 (25.3%), 42.7% had incomes between $20,000 and $39,000, and 29.3%
reported incomes between $40,000 and $59,000. Only 2.7% of the participants reported
household incomes between $90,000 and $99,000 and no participants selected any
other income levels.
In terms of education level, 17.3% reported that they had completed only some
high school and approximately half reported that their highest education level was a
high school diploma or GED (48%). Nearly 20% reported that they had completed some
40
college (17.3%). Smaller proportions reported having a degree, with 5.3% having
earned an associate’s degree or completed technical school, 6.7% having a 4-year
degree, and 5.3% reporting having earned a graduate degree.
Due to the distribution of the variables across categories, many of the variables
were collapsed into fewer levels for subsequent analysis. For marital status, divorced
and separated participants were combined into one category; married and cohabitating
participants were grouped together and single remained in one category. For
household income, participants with incomes less than $20,000 and between $20,000
and $39,999 were collapsed into one category. Participants with incomes between
$40,000 and $59,999 and $90,000 to $99,999 were collapsed into one category. For
education level, the categories of some high school and high school diploma or GED
were collapsed into one category. The remaining categories (some college, associate’s
degree or degree from a technical school, four year college degree, and graduate
degree) were collapsed into a second education level category. Because a majority of
the participants were female (94.7%) and only a small proportion were male (5.3%), no
further analyses were conducted using gender.
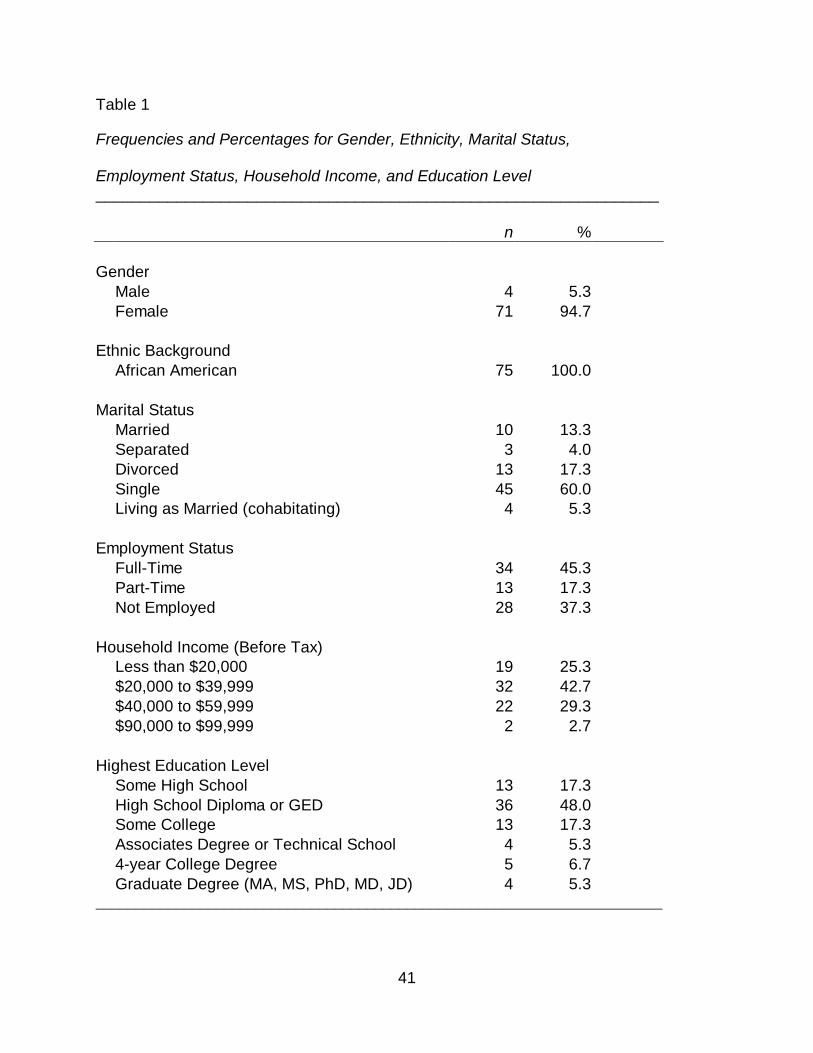
41
Table 1
Frequencies and Percentages for Gender, Ethnicity, Marital Status, Employment Status, Household Income, and Education Level _______________________________________________________________ n % Gender Male 4 5.3 Female 71 94.7 Ethnic Background African American 75 100.0 Marital Status Married 10 13.3 Separated 3 4.0 Divorced 13 17.3 Single 45 60.0 Living as Married (cohabitating) 4 5.3 Employment Status Full-Time 34 45.3 Part-Time 13 17.3 Not Employed 28 37.3 Household Income (Before Tax) Less than $20,000 19 25.3 $20,000 to $39,999 32 42.7 $40,000 to $59,999 22 29.3 $90,000 to $99,999 2 2.7 Highest Education Level Some High School 13 17.3 High School Diploma or GED 36 48.0 Some College 13 17.3 Associates Degree or Technical School 4 5.3 4-year College Degree 5 6.7 Graduate Degree (MA, MS, PhD, MD, JD) 4 5.3 _______________________________________________________________________
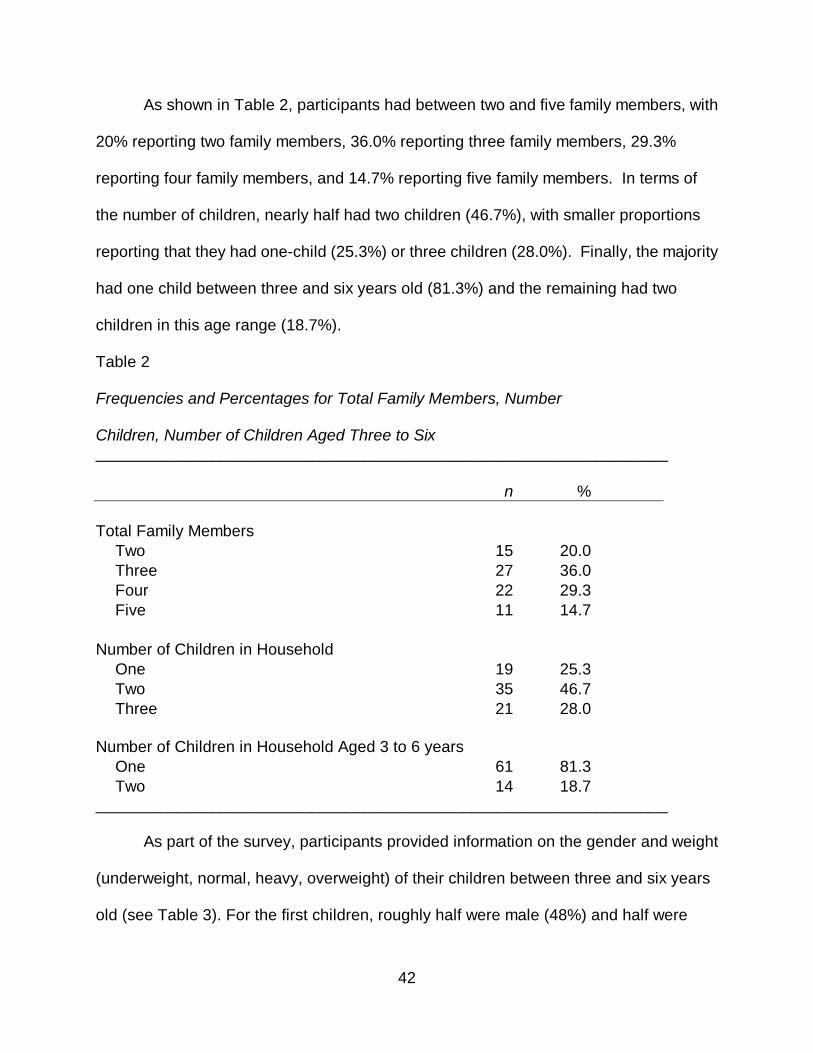
42
As shown in Table 2, participants had between two and five family members, with
20% reporting two family members, 36.0% reporting three family members, 29.3%
reporting four family members, and 14.7% reporting five family members. In terms of
the number of children, nearly half had two children (46.7%), with smaller proportions
reporting that they had one-child (25.3%) or three children (28.0%). Finally, the majority
had one child between three and six years old (81.3%) and the remaining had two
children in this age range (18.7%).
Table 2 Frequencies and Percentages for Total Family Members, Number Children, Number of Children Aged Three to Six ________________________________________________________________ n % Total Family Members Two 15 20.0 Three 27 36.0 Four 22 29.3 Five 11 14.7 Number of Children in Household One 19 25.3 Two 35 46.7 Three 21 28.0 Number of Children in Household Aged 3 to 6 years
One 61 81.3 Two 14 18.7 ________________________________________________________________
As part of the survey, participants provided information on the gender and weight
(underweight, normal, heavy, overweight) of their children between three and six years
old (see Table 3). For the first children, roughly half were male (48%) and half were
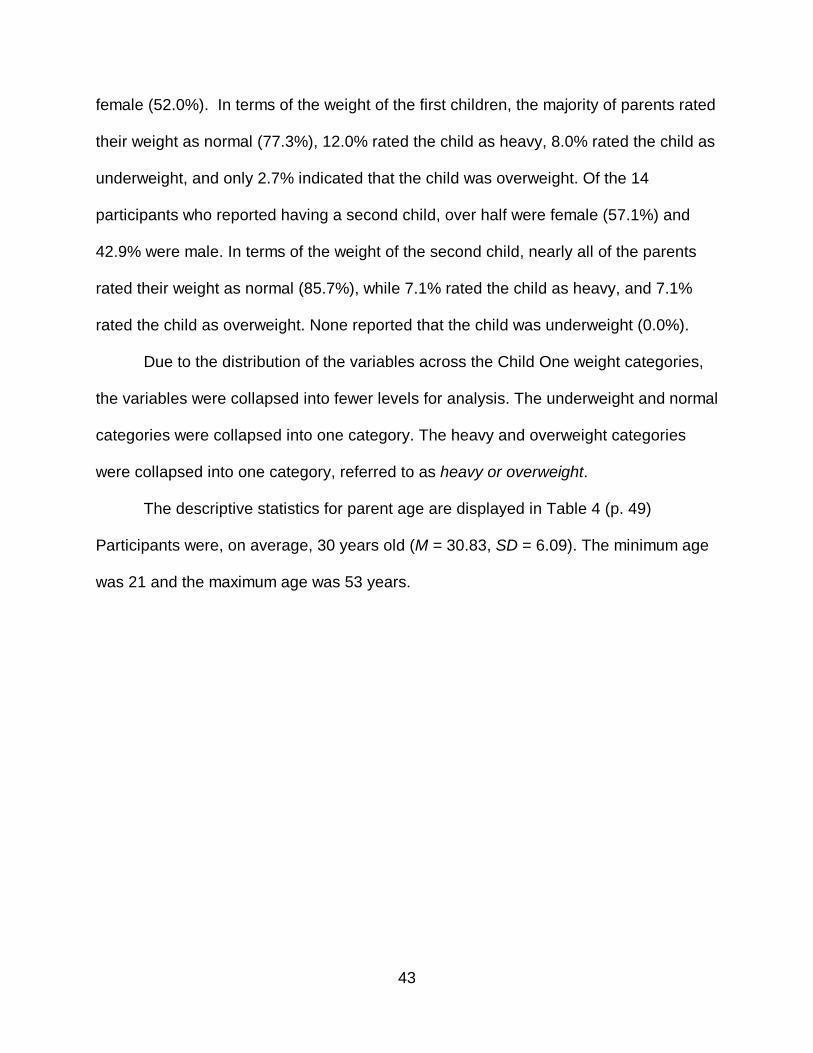
43
female (52.0%). In terms of the weight of the first children, the majority of parents rated
their weight as normal (77.3%), 12.0% rated the child as heavy, 8.0% rated the child as
underweight, and only 2.7% indicated that the child was overweight. Of the 14
participants who reported having a second child, over half were female (57.1%) and
42.9% were male. In terms of the weight of the second child, nearly all of the parents
rated their weight as normal (85.7%), while 7.1% rated the child as heavy, and 7.1%
rated the child as overweight. None reported that the child was underweight (0.0%).
Due to the distribution of the variables across the Child One weight categories,
the variables were collapsed into fewer levels for analysis. The underweight and normal
categories were collapsed into one category. The heavy and overweight categories
were collapsed into one category, referred to as heavy or overweight.
The descriptive statistics for parent age are displayed in Table 4 (p. 49)
Participants were, on average, 30 years old (M = 30.83, SD = 6.09). The minimum age
was 21 and the maximum age was 53 years.
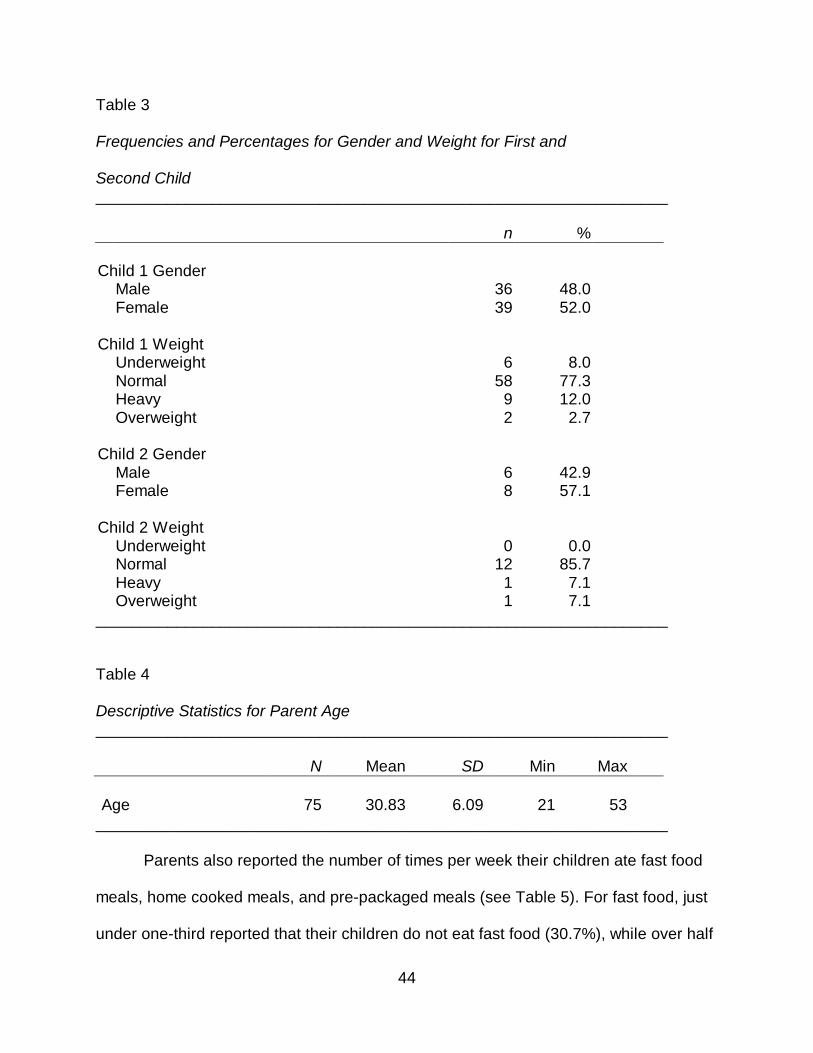
44
Table 3
Frequencies and Percentages for Gender and Weight for First and Second Child ________________________________________________________________ n % Child 1 Gender Male 36 48.0 Female 39 52.0 Child 1 Weight Underweight 6 8.0 Normal 58 77.3 Heavy 9 12.0 Overweight 2 2.7 Child 2 Gender Male 6 42.9 Female 8 57.1 Child 2 Weight Underweight 0 0.0 Normal 12 85.7 Heavy 1 7.1 Overweight 1 7.1 ________________________________________________________________ Table 4 Descriptive Statistics for Parent Age ________________________________________________________________ N Mean SD Min Max Age 75 30.83 6.09 21 53
________________________________________________________________
Parents also reported the number of times per week their children ate fast food
meals, home cooked meals, and pre-packaged meals (see Table 5). For fast food, just
under one-third reported that their children do not eat fast food (30.7%), while over half
45
reported eating fast food 1 to 2 times per week (54.7%), and 14.7% reported having fast
food 4 to 5 times per week. For home cooked meals, the majority reported eating home
cooked meals between 4 to 5 times per week (61.3%) and about one-quarter (25.3%)
reported 6 to 7 times per week. Smaller proportions indicated eating home cooked
meals 1 to 2 times per week (4.0%) and fewer than 10% reported eating home cooked
meals 8 to 9 times per week (9.3%). For pre-packaged meals, almost half reported
eating these meals between 1 and 2 times per week (48.0%) and another 40% reported
that their children do not eat pre-packaged meals (41.3%). Only 10% reported eating
pre-packaged meals between 4 and 5 times per week (10.7%).
Due to the distribution of the variables across categories, the meal type variables
were collapsed into fewer levels for subsequent analysis. For both fast food meals and
pre-packaged meals, those who reported 1to 2 times per week and 4 to 5 times per
week were combined into one category. For home cooked meals, those who reported 1
to 2 times and 4 to 5 were collapsed into one category, while those who reported 6 to 7
times and 8 to 9 times were collapsed into a second category.
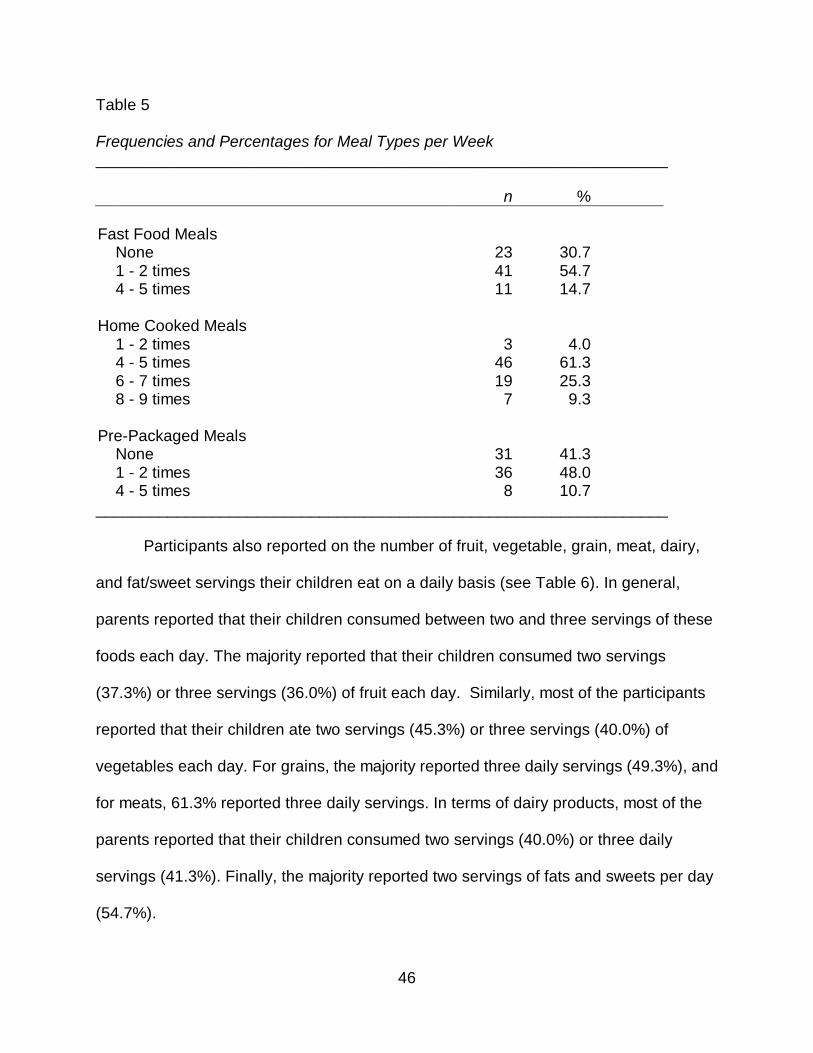
46
Table 5 Frequencies and Percentages for Meal Types per Week ________________________________________________________________ n % Fast Food Meals None 23 30.7 1 - 2 times 41 54.7 4 - 5 times 11 14.7 Home Cooked Meals 1 - 2 times 3 4.0 4 - 5 times 46 61.3 6 - 7 times 19 25.3 8 - 9 times 7 9.3 Pre-Packaged Meals None 31 41.3 1 - 2 times 36 48.0 4 - 5 times 8 10.7 ________________________________________________________________
Participants also reported on the number of fruit, vegetable, grain, meat, dairy,
and fat/sweet servings their children eat on a daily basis (see Table 6). In general,
parents reported that their children consumed between two and three servings of these
foods each day. The majority reported that their children consumed two servings
(37.3%) or three servings (36.0%) of fruit each day. Similarly, most of the participants
reported that their children ate two servings (45.3%) or three servings (40.0%) of
vegetables each day. For grains, the majority reported three daily servings (49.3%), and
for meats, 61.3% reported three daily servings. In terms of dairy products, most of the
parents reported that their children consumed two servings (40.0%) or three daily
servings (41.3%). Finally, the majority reported two servings of fats and sweets per day
(54.7%).
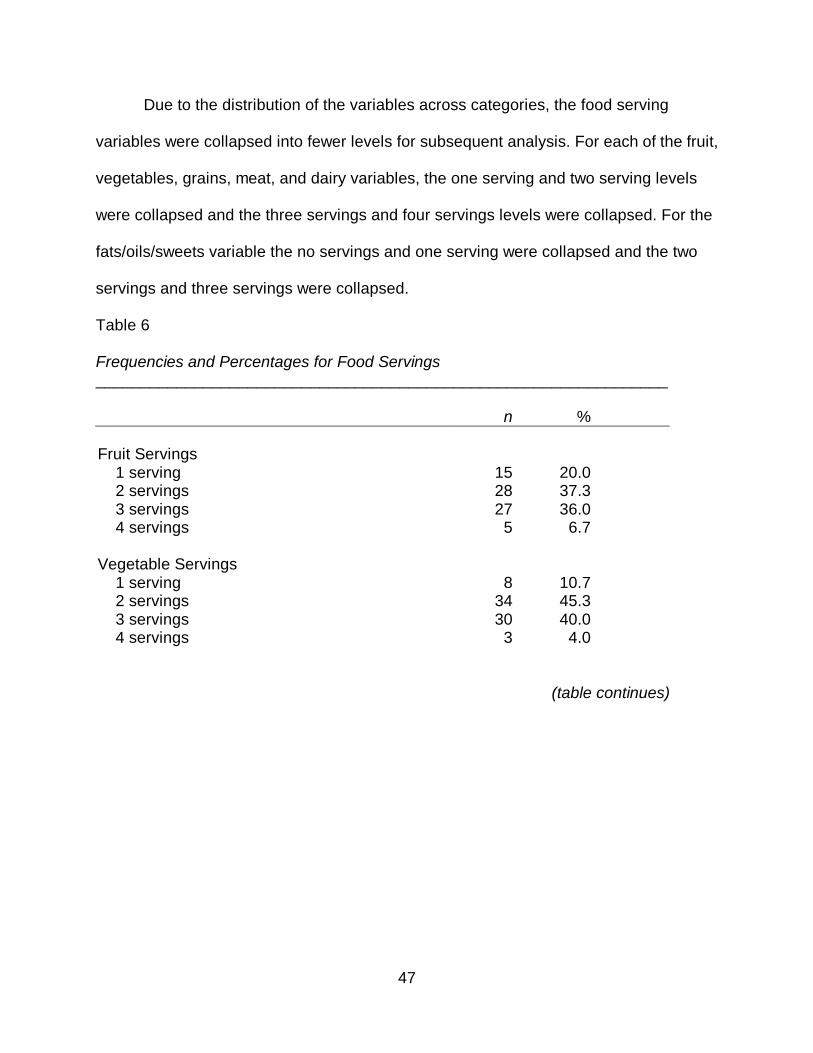
47
Due to the distribution of the variables across categories, the food serving
variables were collapsed into fewer levels for subsequent analysis. For each of the fruit,
vegetables, grains, meat, and dairy variables, the one serving and two serving levels
were collapsed and the three servings and four servings levels were collapsed. For the
fats/oils/sweets variable the no servings and one serving were collapsed and the two
servings and three servings were collapsed.
Table 6 Frequencies and Percentages for Food Servings ________________________________________________________________ n % Fruit Servings 1 serving 15 20.0 2 servings 28 37.3 3 servings 27 36.0 4 servings 5 6.7 Vegetable Servings 1 serving 8 10.7 2 servings 34 45.3 3 servings 30 40.0 4 servings 3 4.0 (table continues)
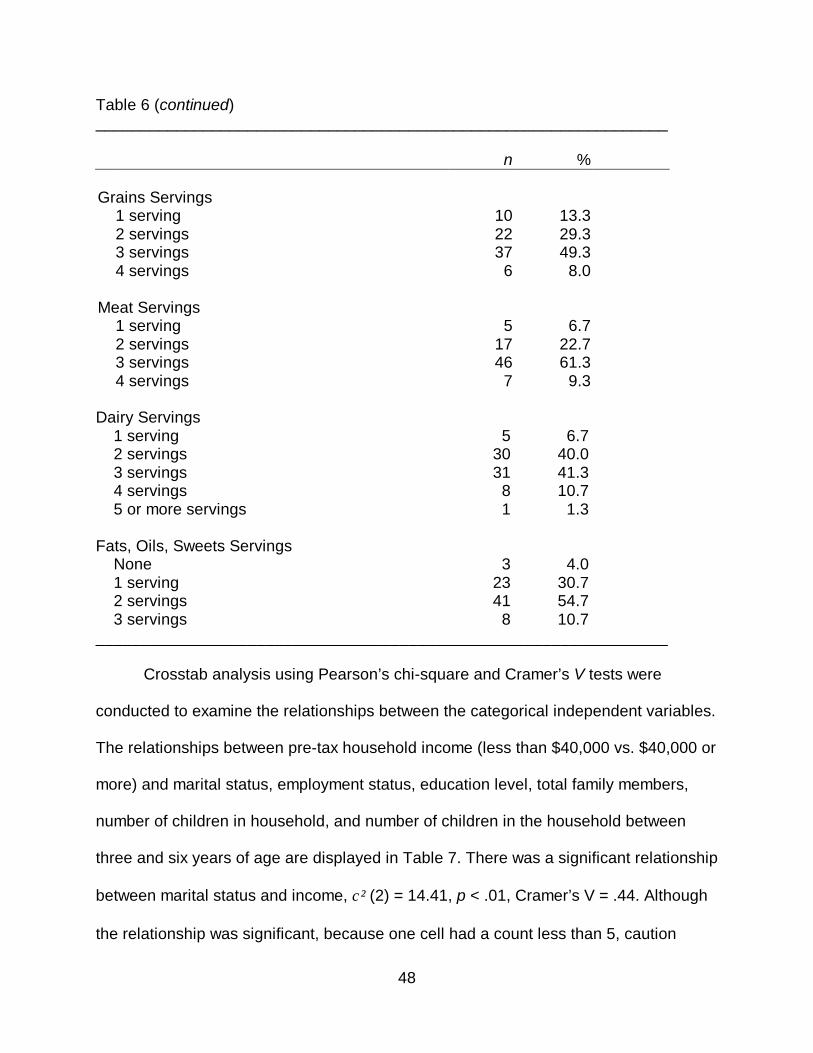
48
Table 6 (continued) ________________________________________________________________ n % Grains Servings 1 serving 10 13.3 2 servings 22 29.3 3 servings 37 49.3 4 servings 6 8.0 Meat Servings 1 serving 5 6.7 2 servings 17 22.7 3 servings 46 61.3 4 servings 7 9.3 Dairy Servings
1 serving 5 6.7 2 servings 30 40.0 3 servings 31 41.3 4 servings 8 10.7 5 or more servings 1 1.3 Fats, Oils, Sweets Servings None 3 4.0 1 serving 23 30.7 2 servings 41 54.7 3 servings 8 10.7 ________________________________________________________________
Crosstab analysis using Pearson’s chi-square and Cramer’s V tests were
conducted to examine the relationships between the categorical independent variables.
The relationships between pre-tax household income (less than $40,000 vs. $40,000 or
more) and marital status, employment status, education level, total family members,
number of children in household, and number of children in the household between
three and six years of age are displayed in Table 7. There was a significant relationship
between marital status and income, χ² (2) = 14.41, p < .01, Cramer’s V = .44. Although
the relationship was significant, because one cell had a count less than 5, caution
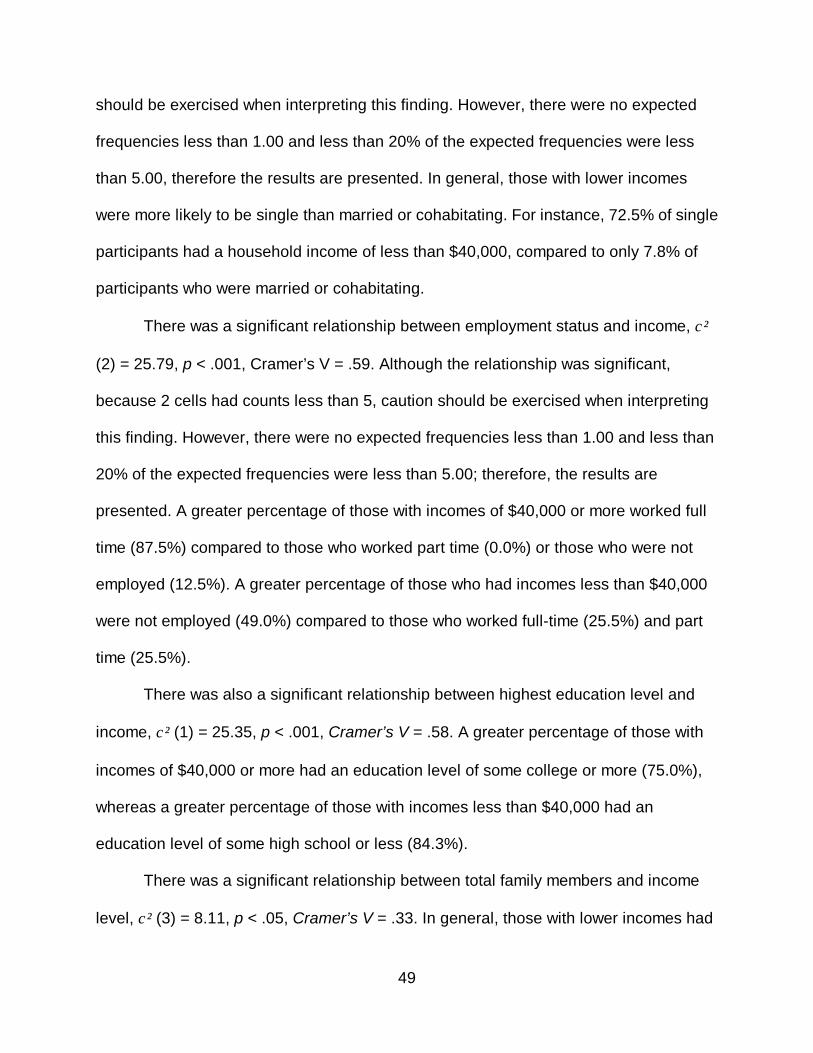
49
should be exercised when interpreting this finding. However, there were no expected
frequencies less than 1.00 and less than 20% of the expected frequencies were less
than 5.00, therefore the results are presented. In general, those with lower incomes
were more likely to be single than married or cohabitating. For instance, 72.5% of single
participants had a household income of less than $40,000, compared to only 7.8% of
participants who were married or cohabitating.
There was a significant relationship between employment status and income, χ²
(2) = 25.79, p < .001, Cramer’s V = .59. Although the relationship was significant,
because 2 cells had counts less than 5, caution should be exercised when interpreting
this finding. However, there were no expected frequencies less than 1.00 and less than
20% of the expected frequencies were less than 5.00; therefore, the results are
presented. A greater percentage of those with incomes of $40,000 or more worked full
time (87.5%) compared to those who worked part time (0.0%) or those who were not
employed (12.5%). A greater percentage of those who had incomes less than $40,000
were not employed (49.0%) compared to those who worked full-time (25.5%) and part
time (25.5%).
There was also a significant relationship between highest education level and
income, χ² (1) = 25.35, p < .001, Cramer’s V = .58. A greater percentage of those with
incomes of $40,000 or more had an education level of some college or more (75.0%),
whereas a greater percentage of those with incomes less than $40,000 had an
education level of some high school or less (84.3%).
There was a significant relationship between total family members and income
level, χ² (3) = 8.11, p < .05, Cramer’s V = .33. In general, those with lower incomes had
50
fewer family members, while those with higher incomes were more likely to have more
family members. Specifically, those with incomes less than $40,000 were more likely to
have two (25.5%), three (39.2%) or four family members (27.5%). Participants who
reported incomes of $40,000 or more, on the other hand, were more likely to have three
(29.2%), four (33.3%), or five family members (29.2%).
There was a marginally significant relationship between the number of children in
the household and income, χ² (2) = 5.59, p = .061, Cramer’s V = .27. A greater
percentage of those with incomes less than $40,000 had one child in the household
(33.3%), whereas only 8.3% of those with incomes of $40,000 or more had only one
child. The relationship between income and the number of children between three and
six years old was not significant, χ² (1) = .93, p = .334, Cramer’s V = .11.
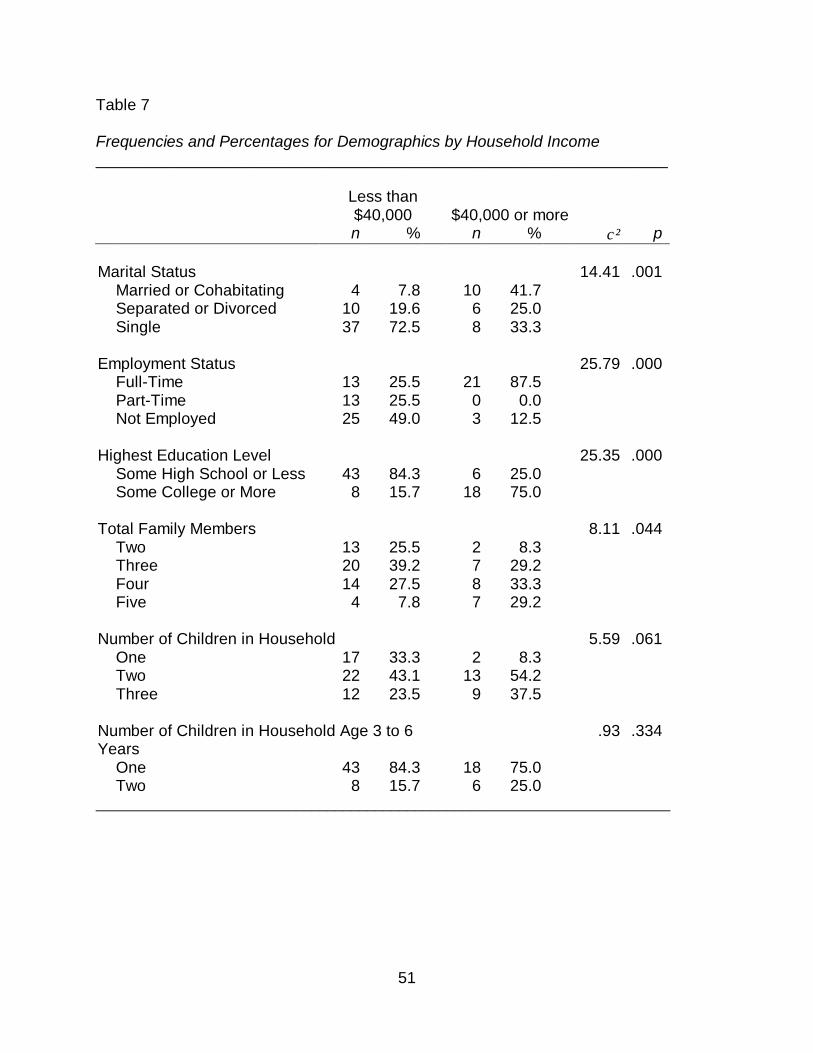
51
Table 7
Frequencies and Percentages for Demographics by Household Income ________________________________________________________________
Less than $40,000 $40,000 or more
n % n % χ² p Marital Status 14.41 .001 Married or Cohabitating 4 7.8 10 41.7 Separated or Divorced 10 19.6 6 25.0 Single 37 72.5 8 33.3 Employment Status 25.79 .000 Full-Time 13 25.5 21 87.5 Part-Time 13 25.5 0 0.0 Not Employed 25 49.0 3 12.5 Highest Education Level 25.35 .000 Some High School or Less 43 84.3 6 25.0 Some College or More 8 15.7 18 75.0 Total Family Members 8.11 .044 Two 13 25.5 2 8.3 Three 20 39.2 7 29.2 Four 14 27.5 8 33.3 Five 4 7.8 7 29.2 Number of Children in Household 5.59 .061 One 17 33.3 2 8.3 Two 22 43.1 13 54.2 Three 12 23.5 9 37.5 Number of Children in Household Age 3 to 6 Years
.93 .334
One 43 84.3 18 75.0 Two 8 15.7 6 25.0 ________________________________________________________________________
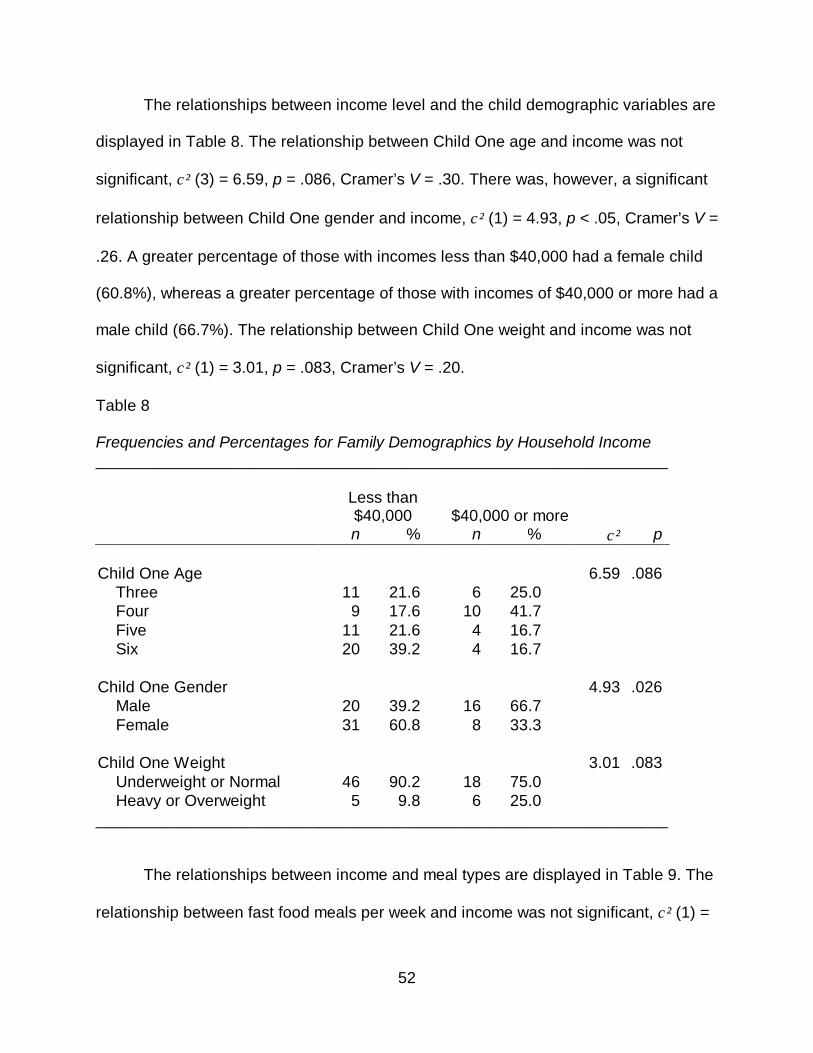
52
The relationships between income level and the child demographic variables are
displayed in Table 8. The relationship between Child One age and income was not
significant, χ² (3) = 6.59, p = .086, Cramer’s V = .30. There was, however, a significant
relationship between Child One gender and income, χ² (1) = 4.93, p < .05, Cramer’s V =
.26. A greater percentage of those with incomes less than $40,000 had a female child
(60.8%), whereas a greater percentage of those with incomes of $40,000 or more had a
male child (66.7%). The relationship between Child One weight and income was not
significant, χ² (1) = 3.01, p = .083, Cramer’s V = .20.
Table 8 Frequencies and Percentages for Family Demographics by Household Income ________________________________________________________________ Less than
$40,000 $40,000 or more
n % n % χ² p Child One Age 6.59 .086 Three 11 21.6 6 25.0 Four 9 17.6 10 41.7 Five 11 21.6 4 16.7 Six 20 39.2 4 16.7 Child One Gender 4.93 .026 Male 20 39.2 16 66.7 Female 31 60.8 8 33.3 Child One Weight 3.01 .083 Underweight or Normal 46 90.2 18 75.0 Heavy or Overweight 5 9.8 6 25.0 ________________________________________________________________
The relationships between income and meal types are displayed in Table 9. The
relationship between fast food meals per week and income was not significant, χ² (1) =
53
3.253, p = .071, Cramer’s V = .208. There was a significant relationship between home
cooked meals per week and income, χ² (1) = 5.049, p < .05, Cramer’s V = .26. A
greater proportion of those with incomes less than $40,000 reported eating home
cooked meals between 6 and 9 times per week (43.1%) compared to those who
reported incomes of $40,000 or more (16.7%). The relationship between pre-packaged
meals per week and income level was not significant, χ² (1) = .21, p = .644, Cramer’s V
= .05.
Table 9 Frequencies and Percentages for Meal Types per Week by Household Income ________________________________________________________________ Less than $40,000 $40,000 or more n % n % χ² p Fast Food Meals 3.25 .071 None 19 37.3 4 16.7 1 or more times 32 62.7 20 83.3 Home Cooked Meals 5.05 .025 1-5 times 29 56.9 20 83.3 6-9 times 22 43.1 4 16.7 Pre-Packaged Meals .21 .644 None 22 43.1 9 37.5 1 or more times 29 56.9 15 62.5 ________________________________________________________________
The relationships between income and daily food servings (fruit, vegetables,
grains, meat, dairy, and fats; see Table 10). There were no significant relationships
between food servings per day and income level (p > .05).
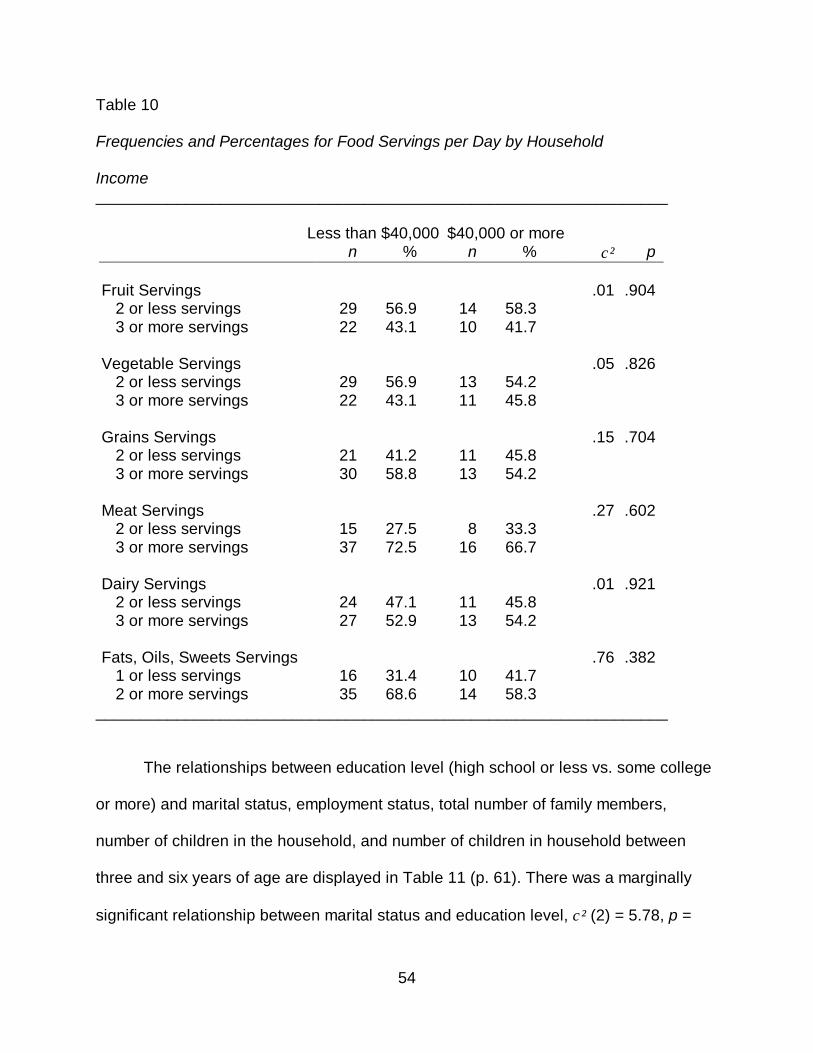
54
Table 10 Frequencies and Percentages for Food Servings per Day by Household Income ________________________________________________________________ Less than $40,000 $40,000 or more n % n % χ² p Fruit Servings .01 .904 2 or less servings 29 56.9 14 58.3 3 or more servings 22 43.1 10 41.7 Vegetable Servings .05 .826 2 or less servings 29 56.9 13 54.2 3 or more servings 22 43.1 11 45.8 Grains Servings .15 .704 2 or less servings 21 41.2 11 45.8 3 or more servings 30 58.8 13 54.2 Meat Servings .27 .602 2 or less servings 15 27.5 8 33.3 3 or more servings 37 72.5 16 66.7 Dairy Servings .01 .921 2 or less servings 24 47.1 11 45.8 3 or more servings 27 52.9 13 54.2 Fats, Oils, Sweets Servings .76 .382 1 or less servings 16 31.4 10 41.7 2 or more servings 35 68.6 14 58.3
________________________________________________________________
The relationships between education level (high school or less vs. some college
or more) and marital status, employment status, total number of family members,
number of children in the household, and number of children in household between
three and six years of age are displayed in Table 11 (p. 61). There was a marginally
significant relationship between marital status and education level, χ² (2) = 5.78, p =
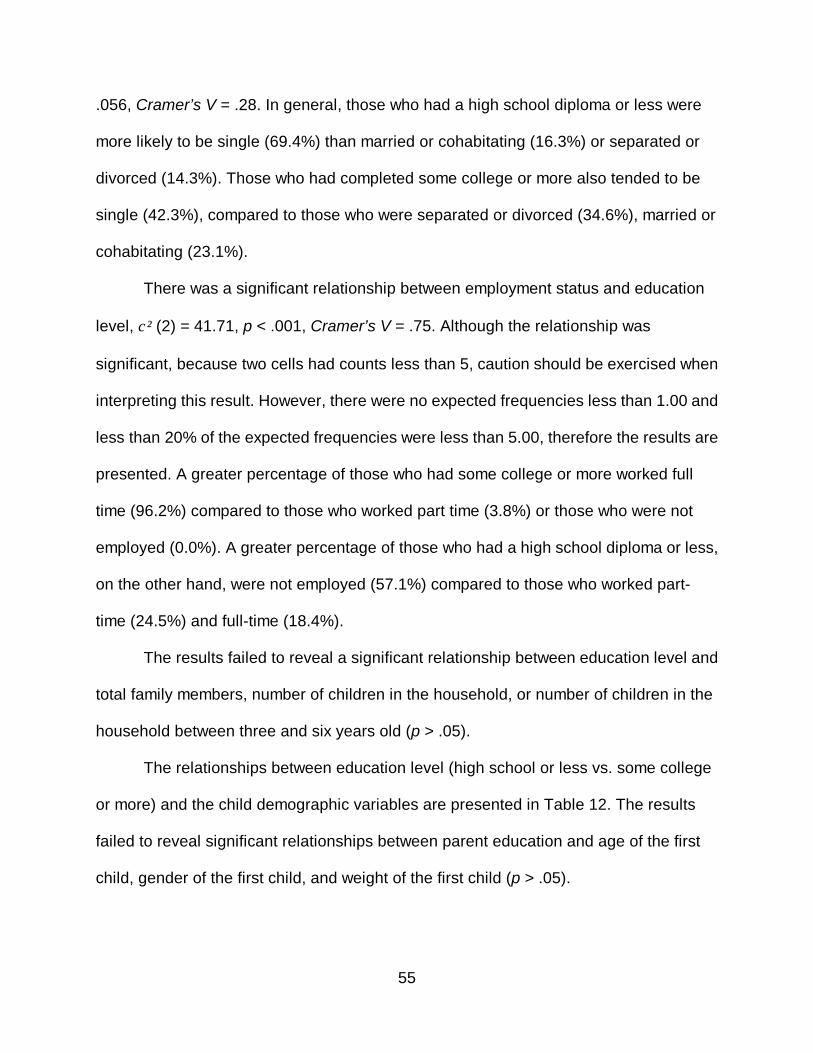
55
.056, Cramer’s V = .28. In general, those who had a high school diploma or less were
more likely to be single (69.4%) than married or cohabitating (16.3%) or separated or
divorced (14.3%). Those who had completed some college or more also tended to be
single (42.3%), compared to those who were separated or divorced (34.6%), married or
cohabitating (23.1%).
There was a significant relationship between employment status and education
level, χ² (2) = 41.71, p < .001, Cramer’s V = .75. Although the relationship was
significant, because two cells had counts less than 5, caution should be exercised when
interpreting this result. However, there were no expected frequencies less than 1.00 and
less than 20% of the expected frequencies were less than 5.00, therefore the results are
presented. A greater percentage of those who had some college or more worked full
time (96.2%) compared to those who worked part time (3.8%) or those who were not
employed (0.0%). A greater percentage of those who had a high school diploma or less,
on the other hand, were not employed (57.1%) compared to those who worked part-
time (24.5%) and full-time (18.4%).
The results failed to reveal a significant relationship between education level and
total family members, number of children in the household, or number of children in the
household between three and six years old (p > .05).
The relationships between education level (high school or less vs. some college
or more) and the child demographic variables are presented in Table 12. The results
failed to reveal significant relationships between parent education and age of the first
child, gender of the first child, and weight of the first child (p > .05).
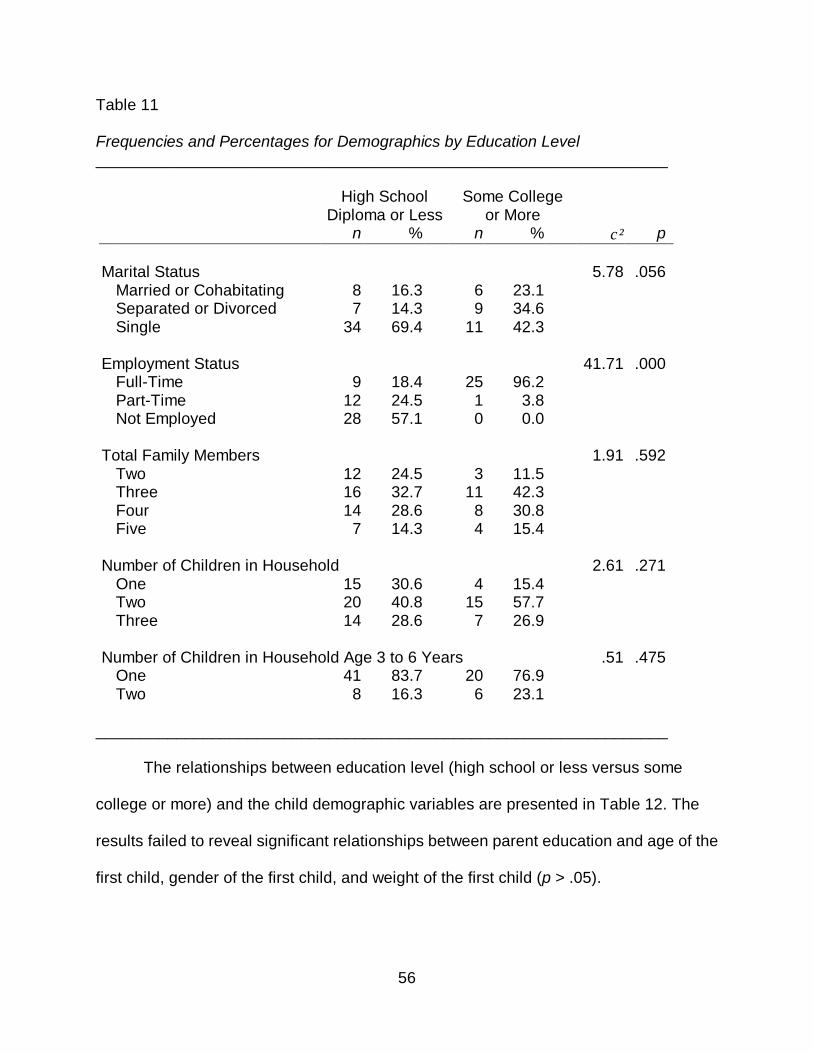
56
Table 11 Frequencies and Percentages for Demographics by Education Level ________________________________________________________________ High School
Diploma or Less Some College
or More
n % n % χ² p Marital Status 5.78 .056 Married or Cohabitating 8 16.3 6 23.1 Separated or Divorced 7 14.3 9 34.6 Single 34 69.4 11 42.3 Employment Status 41.71 .000 Full-Time 9 18.4 25 96.2 Part-Time 12 24.5 1 3.8 Not Employed 28 57.1 0 0.0 Total Family Members 1.91 .592 Two 12 24.5 3 11.5 Three 16 32.7 11 42.3 Four 14 28.6 8 30.8 Five 7 14.3 4 15.4 Number of Children in Household 2.61 .271 One 15 30.6 4 15.4 Two 20 40.8 15 57.7 Three 14 28.6 7 26.9 Number of Children in Household Age 3 to 6 Years .51 .475 One 41 83.7 20 76.9 Two 8 16.3 6 23.1
________________________________________________________________ The relationships between education level (high school or less versus some
college or more) and the child demographic variables are presented in Table 12. The
results failed to reveal significant relationships between parent education and age of the
first child, gender of the first child, and weight of the first child (p > .05).
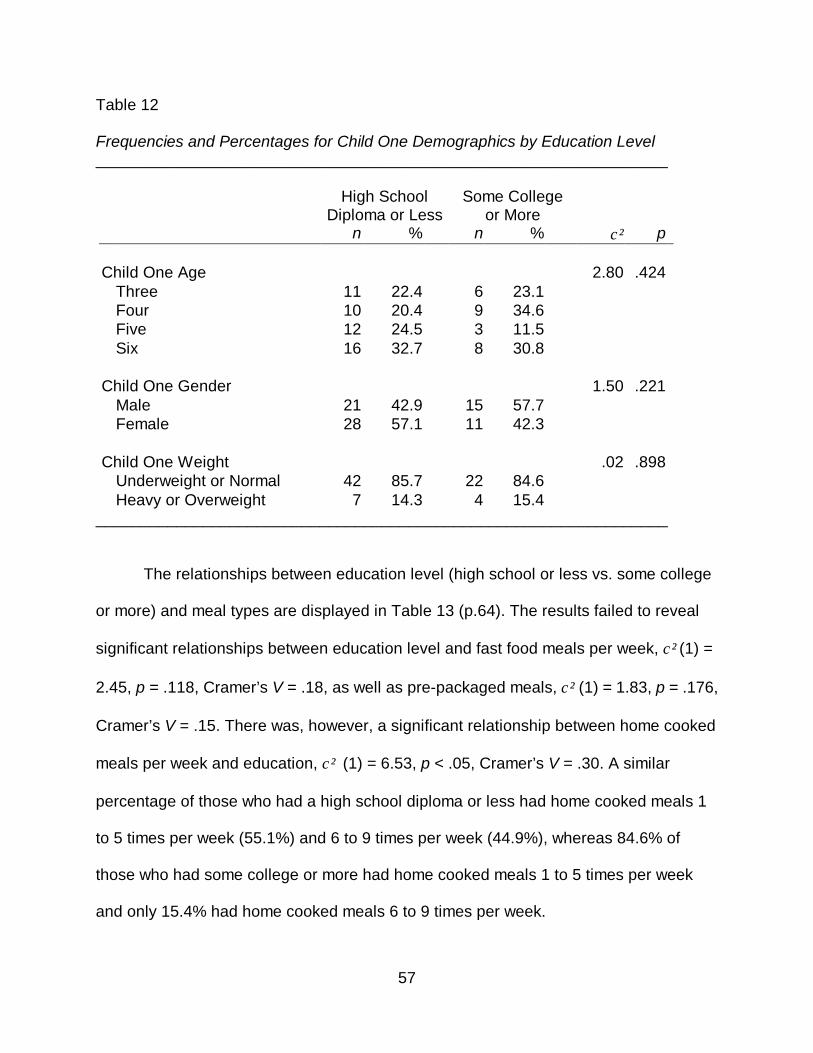
57
Table 12 Frequencies and Percentages for Child One Demographics by Education Level ________________________________________________________________ High School
Diploma or Less Some College
or More
n % n % χ² p Child One Age 2.80 .424 Three 11 22.4 6 23.1 Four 10 20.4 9 34.6 Five 12 24.5 3 11.5 Six 16 32.7 8 30.8 Child One Gender 1.50 .221 Male 21 42.9 15 57.7 Female 28 57.1 11 42.3 Child One Weight .02 .898 Underweight or Normal 42 85.7 22 84.6 Heavy or Overweight 7 14.3 4 15.4
________________________________________________________________
The relationships between education level (high school or less vs. some college
or more) and meal types are displayed in Table 13 (p.64). The results failed to reveal
significant relationships between education level and fast food meals per week, χ² (1) =
2.45, p = .118, Cramer’s V = .18, as well as pre-packaged meals, χ² (1) = 1.83, p = .176,
Cramer’s V = .15. There was, however, a significant relationship between home cooked
meals per week and education, χ² (1) = 6.53, p < .05, Cramer’s V = .30. A similar
percentage of those who had a high school diploma or less had home cooked meals 1
to 5 times per week (55.1%) and 6 to 9 times per week (44.9%), whereas 84.6% of
those who had some college or more had home cooked meals 1 to 5 times per week
and only 15.4% had home cooked meals 6 to 9 times per week.
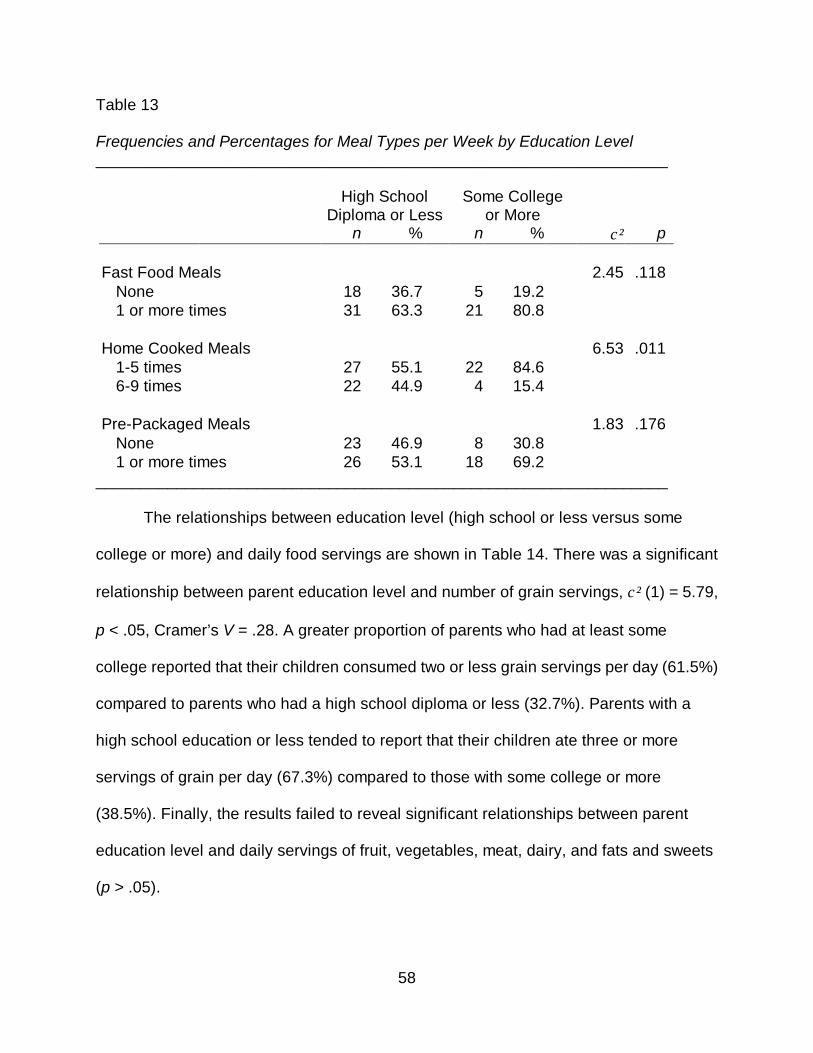
58
Table 13 Frequencies and Percentages for Meal Types per Week by Education Level ________________________________________________________________ High School
Diploma or Less Some College
or More
n % n % χ² p Fast Food Meals 2.45 .118 None 18 36.7 5 19.2 1 or more times 31 63.3 21 80.8 Home Cooked Meals 6.53 .011 1-5 times 27 55.1 22 84.6 6-9 times 22 44.9 4 15.4 Pre-Packaged Meals 1.83 .176 None 23 46.9 8 30.8 1 or more times 26 53.1 18 69.2
________________________________________________________________
The relationships between education level (high school or less versus some
college or more) and daily food servings are shown in Table 14. There was a significant
relationship between parent education level and number of grain servings, χ² (1) = 5.79,
p < .05, Cramer’s V = .28. A greater proportion of parents who had at least some
college reported that their children consumed two or less grain servings per day (61.5%)
compared to parents who had a high school diploma or less (32.7%). Parents with a
high school education or less tended to report that their children ate three or more
servings of grain per day (67.3%) compared to those with some college or more
(38.5%). Finally, the results failed to reveal significant relationships between parent
education level and daily servings of fruit, vegetables, meat, dairy, and fats and sweets
(p > .05).
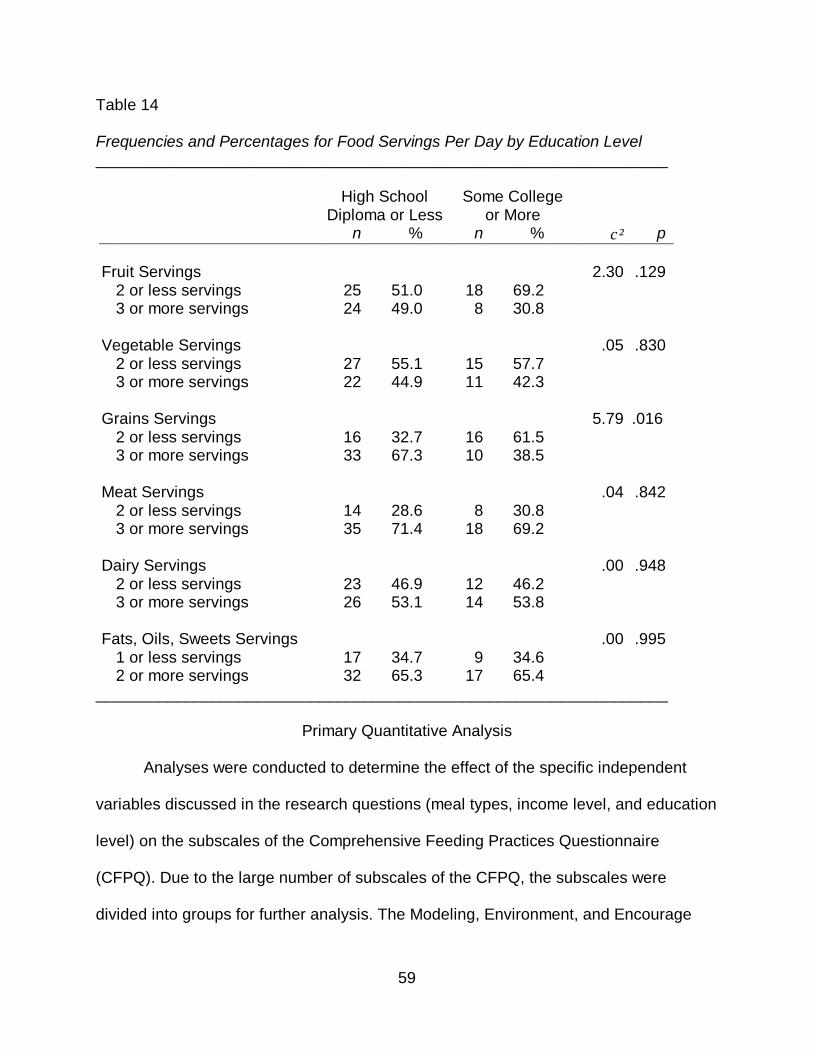
59
Table 14 Frequencies and Percentages for Food Servings Per Day by Education Level ________________________________________________________________ High School
Diploma or Less Some College
or More
n % n % χ² p Fruit Servings 2.30 .129 2 or less servings 25 51.0 18 69.2 3 or more servings 24 49.0 8 30.8 Vegetable Servings .05 .830 2 or less servings 27 55.1 15 57.7 3 or more servings 22 44.9 11 42.3 Grains Servings
5.79
.016
2 or less servings 16 32.7 16 61.5 3 or more servings 33 67.3 10 38.5 Meat Servings .04 .842 2 or less servings 14 28.6 8 30.8 3 or more servings 35 71.4 18 69.2 Dairy Servings .00 .948 2 or less servings 23 46.9 12 46.2 3 or more servings 26 53.1 14 53.8 Fats, Oils, Sweets Servings .00 .995 1 or less servings 17 34.7 9 34.6 2 or more servings 32 65.3 17 65.4
________________________________________________________________
Primary Quantitative Analysis
Analyses were conducted to determine the effect of the specific independent
variables discussed in the research questions (meal types, income level, and education
level) on the subscales of the Comprehensive Feeding Practices Questionnaire
(CFPQ). Due to the large number of subscales of the CFPQ, the subscales were
divided into groups for further analysis. The Modeling, Environment, and Encourage
60
Balance and Variety subscales were analyzed together as the Parent Modeling
subscales. The subscales measuring Restriction for Health and Restriction for Weight
Control were grouped together for analysis as the Food Restriction subscales. Finally,
the Child Control and Monitoring subscales were analyzed together as the Food Control
subscales. The remaining subscales, including Food as Reward, Emotion Regulation,
Involvement, Pressure, and Teaching About Nutrition, were not used in further analysis.
Separate Analyses of Variance (ANOVAs) were then used to examine differences on
the Parent Modeling, Food Restriction, and Food Control subscales, based on the
independent variables of interest. Tests for the assumptions associated with ANOVA,
including normality and homogeneity of variances are discussed in relation to each
analysis presented below.
Prior to presenting the results of the ANOVAs, the descriptive statistics for the
subscales are presented. The means and standard deviations for the CFPQ subscale
scores are organized by subscale grouping and shown in Table 15. In terms of the
Parent Modeling subscales, Encourage Balance and Variety (M = 4.35, SD = .58) had
the greatest mean, followed by Modeling (M = 3.83, SD = 1.09) and Environment (M =
3.60, SD = .70). In terms of the Food Restriction subscales, Restriction for Health (M =
3.87, SD = .75) had a higher mean than Restriction for Weight Control (M = 2.65, SD =
.85). In terms of the Food Control subscales, Monitoring (M = 4.11, SD = .83) had a
higher mean than Child Control (M = 2.13, SD = .64). The descriptive statistics for the
remaining subscales not used for further analysis are shown in Table 17.
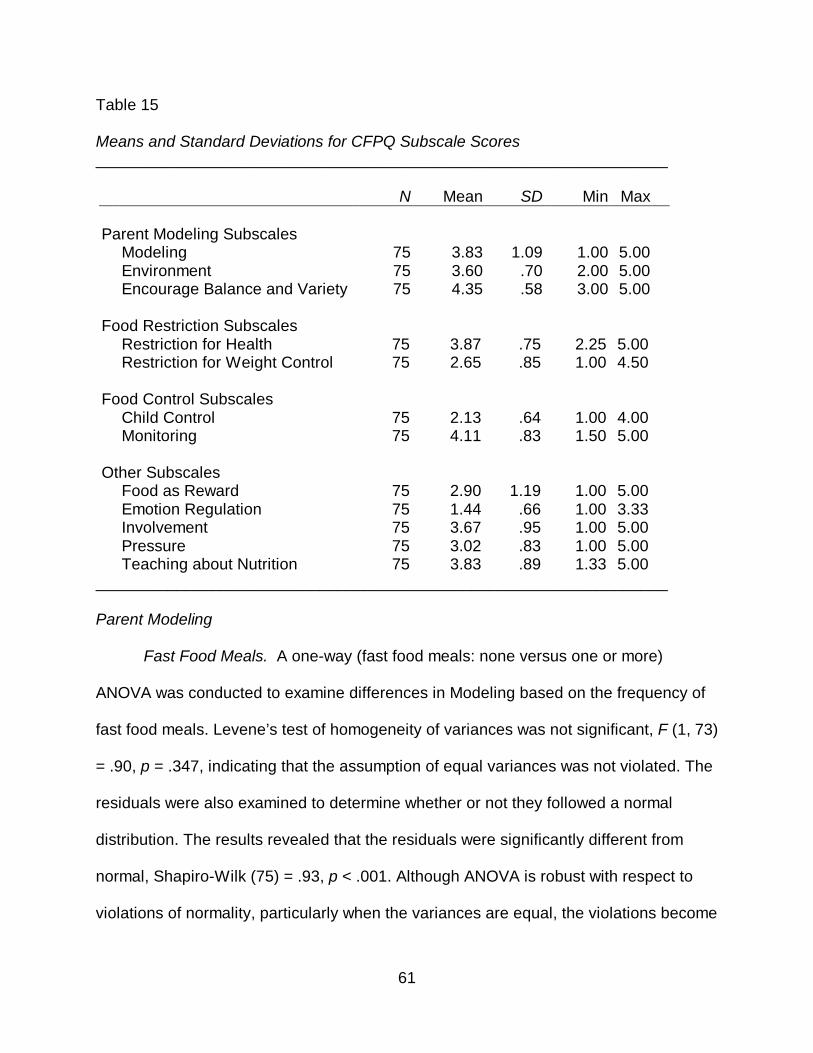
61
Table 15 Means and Standard Deviations for CFPQ Subscale Scores ________________________________________________________________ N Mean SD Min Max Parent Modeling Subscales Modeling 75 3.83 1.09 1.00 5.00 Environment 75 3.60 .70 2.00 5.00 Encourage Balance and Variety 75 4.35 .58 3.00 5.00 Food Restriction Subscales Restriction for Health 75 3.87 .75 2.25 5.00 Restriction for Weight Control 75 2.65 .85 1.00 4.50 Food Control Subscales Child Control 75 2.13 .64 1.00 4.00 Monitoring 75 4.11 .83 1.50 5.00 Other Subscales Food as Reward 75 2.90 1.19 1.00 5.00 Emotion Regulation 75 1.44 .66 1.00 3.33 Involvement 75 3.67 .95 1.00 5.00 Pressure 75 3.02 .83 1.00 5.00 Teaching about Nutrition 75 3.83 .89 1.33 5.00
________________________________________________________________ Parent Modeling
Fast Food Meals. A one-way (fast food meals: none versus one or more)
ANOVA was conducted to examine differences in Modeling based on the frequency of
fast food meals. Levene’s test of homogeneity of variances was not significant, F (1, 73)
= .90, p = .347, indicating that the assumption of equal variances was not violated. The
residuals were also examined to determine whether or not they followed a normal
distribution. The results revealed that the residuals were significantly different from
normal, Shapiro-Wilk (75) = .93, p < .001. Although ANOVA is robust with respect to
violations of normality, particularly when the variances are equal, the violations become
62
more serious when the groups have unequal sample sizes. The analysis includes n=23
records for no fast food meals and n=52 records for one or more fast food meals, thus,
Welch’s robust test of equality of means is also reported in addition to the ANOVA
results. Welch’s test is recommended when assumptions are violated, including non-
normal residuals, unequal variances, and unequal sample sizes (e.g., Wilcox, 1987).
The results of the ANOVA revealed a significant effect for fast food meals on modeling,
F (1, 73) = 8.02, p < .01, ηp2 = .10. In addition, Welch’s test was also significant, F (1,
45) = 8.52, p < .01, indicating that the difference in modeling means based on fast food
meals was robust despite assumption violations. As shown in Table 16, parents of
children who did not eat fast food had significantly higher scores on the Modeling
subscale (M = 4.34, SD = .98) than parents of children who ate fast food (M = 3.60, SD
= 1.06). This finding suggests that compared to parents who reported that their children
ate fast food, parents who reported their children did not eat fast food agreed more that
they actively demonstrated healthy eating for their children.
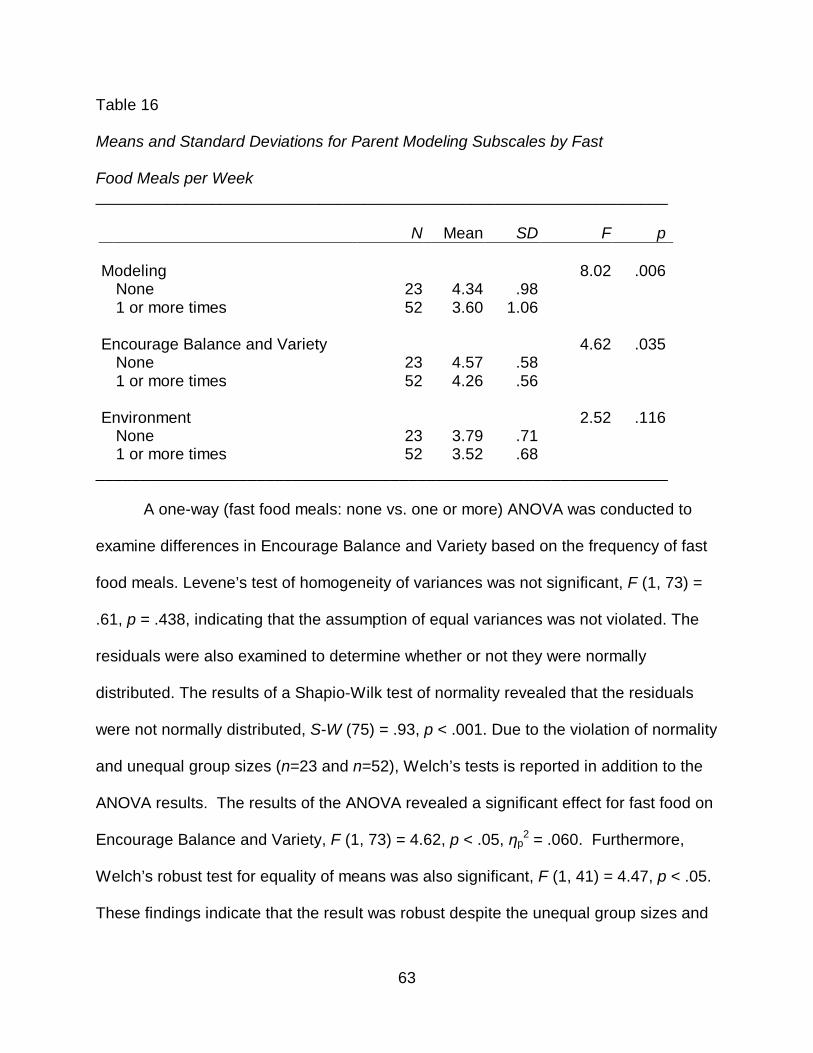
63
Table 16 Means and Standard Deviations for Parent Modeling Subscales by Fast Food Meals per Week ________________________________________________________________ N Mean SD F p Modeling 8.02 .006 None 23 4.34 .98 1 or more times 52 3.60 1.06 Encourage Balance and Variety 4.62 .035 None 23 4.57 .58 1 or more times 52 4.26 .56 Environment 2.52 .116 None 23 3.79 .71 1 or more times 52 3.52 .68
________________________________________________________________
A one-way (fast food meals: none vs. one or more) ANOVA was conducted to
examine differences in Encourage Balance and Variety based on the frequency of fast
food meals. Levene’s test of homogeneity of variances was not significant, F (1, 73) =
.61, p = .438, indicating that the assumption of equal variances was not violated. The
residuals were also examined to determine whether or not they were normally
distributed. The results of a Shapio-Wilk test of normality revealed that the residuals
were not normally distributed, S-W (75) = .93, p < .001. Due to the violation of normality
and unequal group sizes (n=23 and n=52), Welch’s tests is reported in addition to the
ANOVA results. The results of the ANOVA revealed a significant effect for fast food on
Encourage Balance and Variety, F (1, 73) = 4.62, p < .05, ηp2 = .060. Furthermore,
Welch’s robust test for equality of means was also significant, F (1, 41) = 4.47, p < .05.
These findings indicate that the result was robust despite the unequal group sizes and
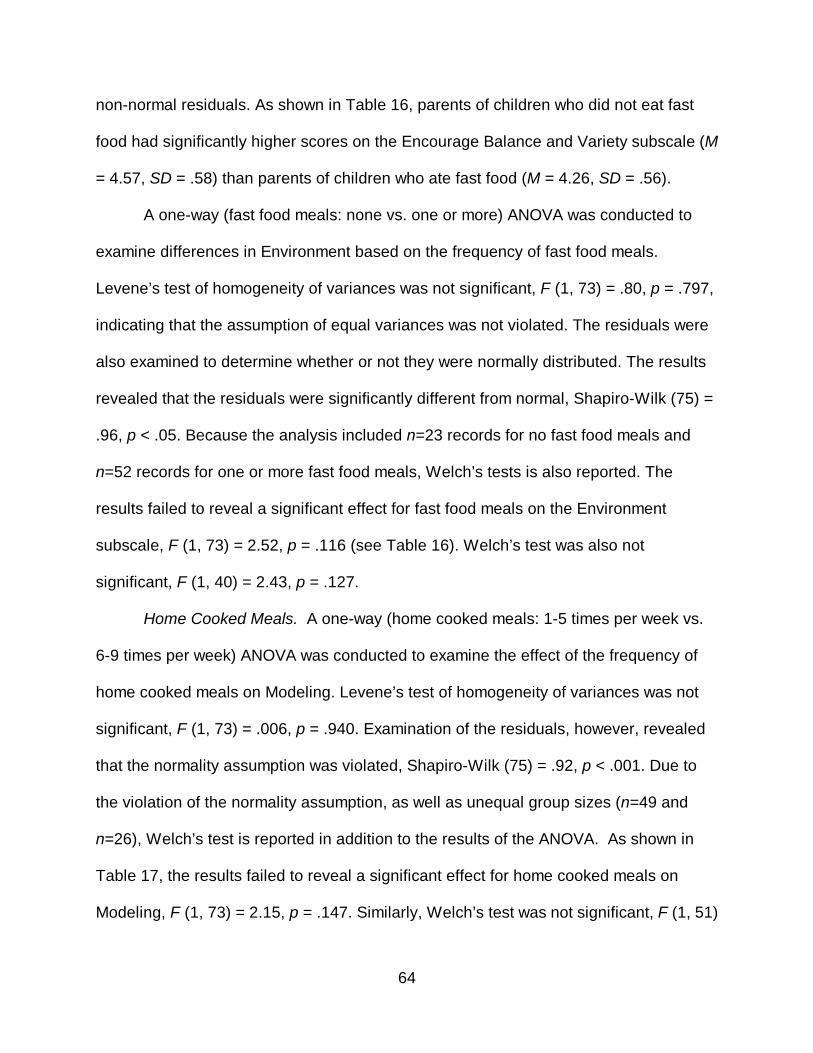
64
non-normal residuals. As shown in Table 16, parents of children who did not eat fast
food had significantly higher scores on the Encourage Balance and Variety subscale (M
= 4.57, SD = .58) than parents of children who ate fast food (M = 4.26, SD = .56).
A one-way (fast food meals: none vs. one or more) ANOVA was conducted to
examine differences in Environment based on the frequency of fast food meals.
Levene’s test of homogeneity of variances was not significant, F (1, 73) = .80, p = .797,
indicating that the assumption of equal variances was not violated. The residuals were
also examined to determine whether or not they were normally distributed. The results
revealed that the residuals were significantly different from normal, Shapiro-Wilk (75) =
.96, p < .05. Because the analysis included n=23 records for no fast food meals and
n=52 records for one or more fast food meals, Welch’s tests is also reported. The
results failed to reveal a significant effect for fast food meals on the Environment
subscale, F (1, 73) = 2.52, p = .116 (see Table 16). Welch’s test was also not
significant, F (1, 40) = 2.43, p = .127.
Home Cooked Meals. A one-way (home cooked meals: 1-5 times per week vs.
6-9 times per week) ANOVA was conducted to examine the effect of the frequency of
home cooked meals on Modeling. Levene’s test of homogeneity of variances was not
significant, F (1, 73) = .006, p = .940. Examination of the residuals, however, revealed
that the normality assumption was violated, Shapiro-Wilk (75) = .92, p < .001. Due to
the violation of the normality assumption, as well as unequal group sizes (n=49 and
n=26), Welch’s test is reported in addition to the results of the ANOVA. As shown in
Table 17, the results failed to reveal a significant effect for home cooked meals on
Modeling, F (1, 73) = 2.15, p = .147. Similarly, Welch’s test was not significant, F (1, 51)
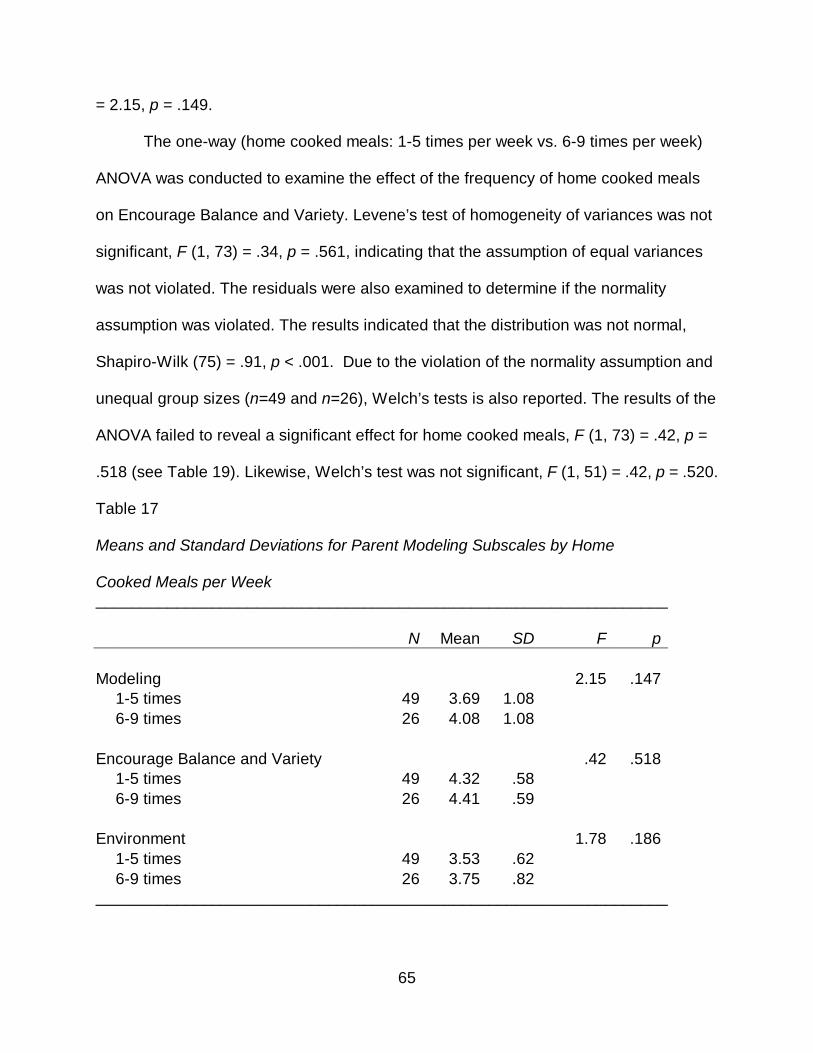
65
= 2.15, p = .149.
The one-way (home cooked meals: 1-5 times per week vs. 6-9 times per week)
ANOVA was conducted to examine the effect of the frequency of home cooked meals
on Encourage Balance and Variety. Levene’s test of homogeneity of variances was not
significant, F (1, 73) = .34, p = .561, indicating that the assumption of equal variances
was not violated. The residuals were also examined to determine if the normality
assumption was violated. The results indicated that the distribution was not normal,
Shapiro-Wilk (75) = .91, p < .001. Due to the violation of the normality assumption and
unequal group sizes (n=49 and n=26), Welch’s tests is also reported. The results of the
ANOVA failed to reveal a significant effect for home cooked meals, F (1, 73) = .42, p =
.518 (see Table 19). Likewise, Welch’s test was not significant, F (1, 51) = .42, p = .520.
Table 17 Means and Standard Deviations for Parent Modeling Subscales by Home Cooked Meals per Week ________________________________________________________________ N Mean SD F p Modeling 2.15 .147 1-5 times 49 3.69 1.08 6-9 times 26 4.08 1.08 Encourage Balance and Variety .42 .518 1-5 times 49 4.32 .58 6-9 times 26 4.41 .59 Environment 1.78 .186 1-5 times 49 3.53 .62 6-9 times 26 3.75 .82 ________________________________________________________________
66
The one-way (home cooked meals: 1-5 times per week vs. 6-9 times per week)
ANOVA was conducted to examine the effect of the frequency of home cooked meals
on Environment. Levene’s test of homogeneity of variances was not significant, F (1,
73) = 3.66, p = .060, indicating that the assumption of equal variances was not violated.
The residuals were analyzed to test the normality assumption. The results revealed that
the residuals were normally distributed, Shapiro-Wilk (75) = .97, p = .086. The results of
the ANOVA failed to reveal a significant effect for home cooked meals on Environment,
F (1, 73) = 1.78, p = .186 (see Table 17).
Pre-Packaged Meals. A one-way (pre-packaged meals: none vs. one or more)
ANOVA was conducted to examine differences in Modeling based on the frequency of
consuming pre-packaged meals. Levene’s test of homogeneity of variances was not
significant, F (1, 73) = .20, p = .656. The residuals, however, were not normally
distributed, Shapiro-Wilk (75) = .92, p < .001. Thus, Welch’s test will be reported in
addition to the results of the ANOVA. The results failed to reveal a significant effect for
pre-packaged meals on Modeling, F (1, 73) = 1.35, p = .249 (see Table 18). Similarly,
Welch’s test was not significant, F (1, 68) = 1.39, p = .243.
A one-way (pre-packaged meals: none vs. one or more) ANOVA was conducted
to examine differences in Encourage Balance and Variety based on the frequency of
consuming pre-packaged meals. Levene’s test of homogeneity of variances was not
significant, F (1, 73) = .14, p = .707, indicating that the variances were not significantly
different. However, the residual analysis revealed that the normality assumption was
violated, Shapiro-Wilk (75) = .90, p < .001. Thus, Welch’s test of robust equality of
means will also be reported. The results of the ANOVA failed to reveal a significant
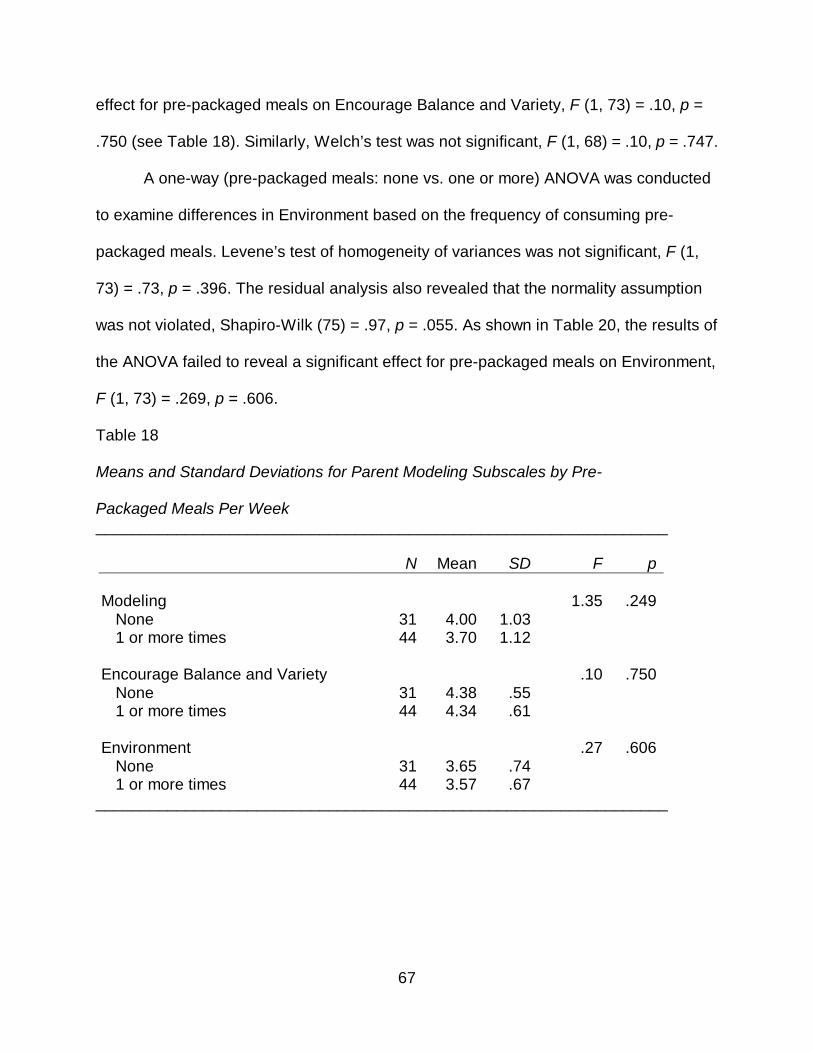
67
effect for pre-packaged meals on Encourage Balance and Variety, F (1, 73) = .10, p =
.750 (see Table 18). Similarly, Welch’s test was not significant, F (1, 68) = .10, p = .747.
A one-way (pre-packaged meals: none vs. one or more) ANOVA was conducted
to examine differences in Environment based on the frequency of consuming pre-
packaged meals. Levene’s test of homogeneity of variances was not significant, F (1,
73) = .73, p = .396. The residual analysis also revealed that the normality assumption
was not violated, Shapiro-Wilk (75) = .97, p = .055. As shown in Table 20, the results of
the ANOVA failed to reveal a significant effect for pre-packaged meals on Environment,
F (1, 73) = .269, p = .606.
Table 18 Means and Standard Deviations for Parent Modeling Subscales by Pre- Packaged Meals Per Week ________________________________________________________________ N Mean SD F p Modeling 1.35 .249 None 31 4.00 1.03 1 or more times 44 3.70 1.12 Encourage Balance and Variety .10 .750 None 31 4.38 .55 1 or more times 44 4.34 .61 Environment .27 .606 None 31 3.65 .74 1 or more times 44 3.57 .67
________________________________________________________________
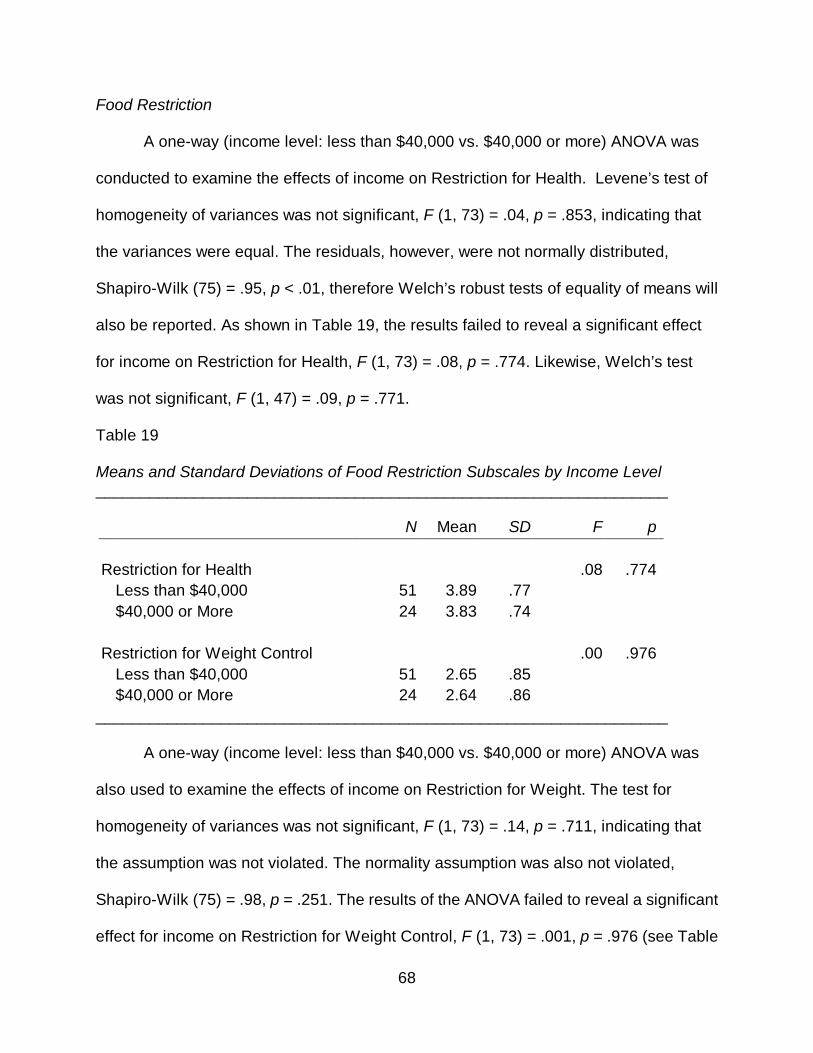
68
Food Restriction
A one-way (income level: less than $40,000 vs. $40,000 or more) ANOVA was
conducted to examine the effects of income on Restriction for Health. Levene’s test of
homogeneity of variances was not significant, F (1, 73) = .04, p = .853, indicating that
the variances were equal. The residuals, however, were not normally distributed,
Shapiro-Wilk (75) = .95, p < .01, therefore Welch’s robust tests of equality of means will
also be reported. As shown in Table 19, the results failed to reveal a significant effect
for income on Restriction for Health, F (1, 73) = .08, p = .774. Likewise, Welch’s test
was not significant, F (1, 47) = .09, p = .771.
Table 19 Means and Standard Deviations of Food Restriction Subscales by Income Level ________________________________________________________________ N Mean SD F p Restriction for Health .08 .774 Less than $40,000 51 3.89 .77 $40,000 or More 24 3.83 .74 Restriction for Weight Control .00 .976 Less than $40,000 51 2.65 .85 $40,000 or More 24 2.64 .86
________________________________________________________________
A one-way (income level: less than $40,000 vs. $40,000 or more) ANOVA was
also used to examine the effects of income on Restriction for Weight. The test for
homogeneity of variances was not significant, F (1, 73) = .14, p = .711, indicating that
the assumption was not violated. The normality assumption was also not violated,
Shapiro-Wilk (75) = .98, p = .251. The results of the ANOVA failed to reveal a significant
effect for income on Restriction for Weight Control, F (1, 73) = .001, p = .976 (see Table
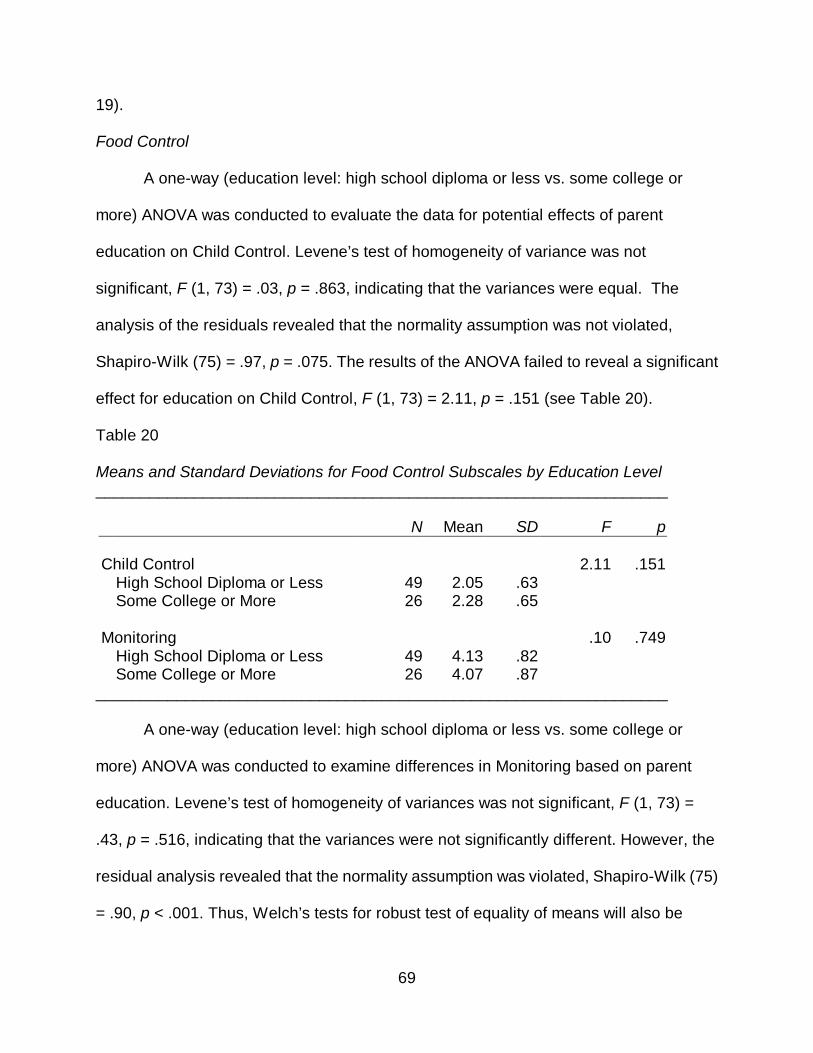
69
19).
Food Control
A one-way (education level: high school diploma or less vs. some college or
more) ANOVA was conducted to evaluate the data for potential effects of parent
education on Child Control. Levene’s test of homogeneity of variance was not
significant, F (1, 73) = .03, p = .863, indicating that the variances were equal. The
analysis of the residuals revealed that the normality assumption was not violated,
Shapiro-Wilk (75) = .97, p = .075. The results of the ANOVA failed to reveal a significant
effect for education on Child Control, F (1, 73) = 2.11, p = .151 (see Table 20).
Table 20 Means and Standard Deviations for Food Control Subscales by Education Level ________________________________________________________________ N Mean SD F p Child Control 2.11 .151 High School Diploma or Less 49 2.05 .63 Some College or More 26 2.28 .65 Monitoring .10 .749 High School Diploma or Less 49 4.13 .82 Some College or More 26 4.07 .87
________________________________________________________________ A one-way (education level: high school diploma or less vs. some college or
more) ANOVA was conducted to examine differences in Monitoring based on parent
education. Levene’s test of homogeneity of variances was not significant, F (1, 73) =
.43, p = .516, indicating that the variances were not significantly different. However, the
residual analysis revealed that the normality assumption was violated, Shapiro-Wilk (75)
= .90, p < .001. Thus, Welch’s tests for robust test of equality of means will also be
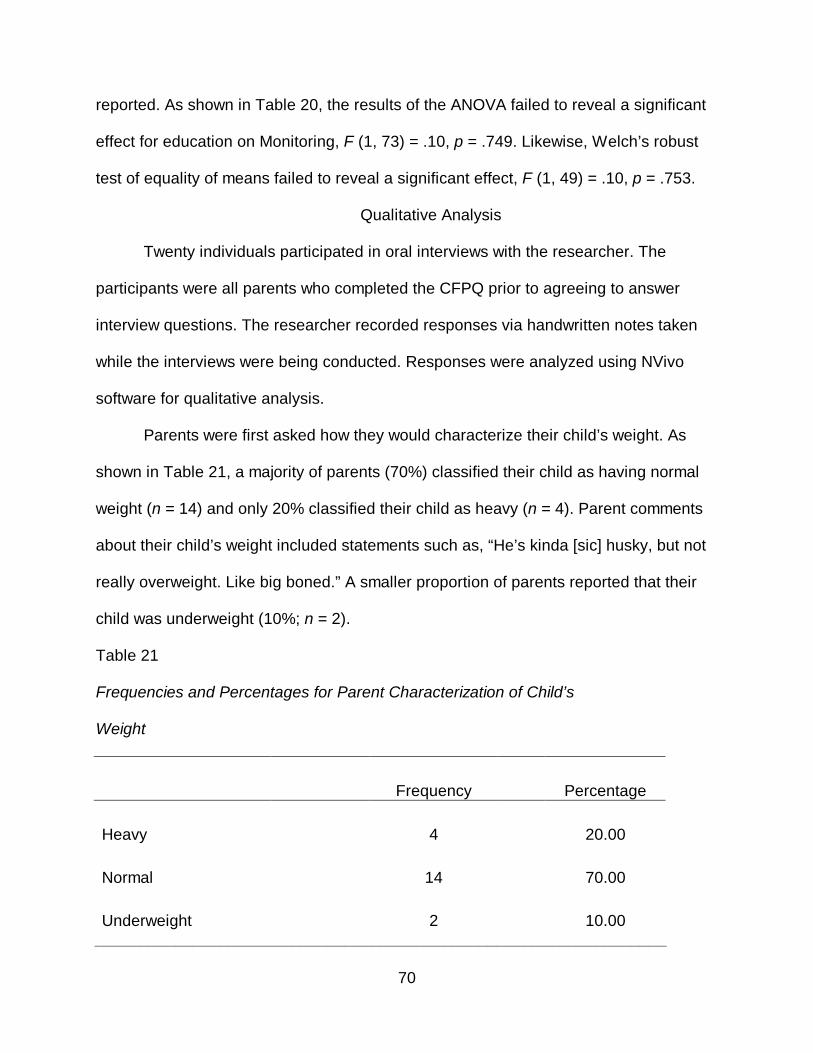
70
reported. As shown in Table 20, the results of the ANOVA failed to reveal a significant
effect for education on Monitoring, F (1, 73) = .10, p = .749. Likewise, Welch’s robust
test of equality of means failed to reveal a significant effect, F (1, 49) = .10, p = .753.
Qualitative Analysis
Twenty individuals participated in oral interviews with the researcher. The
participants were all parents who completed the CFPQ prior to agreeing to answer
interview questions. The researcher recorded responses via handwritten notes taken
while the interviews were being conducted. Responses were analyzed using NVivo
software for qualitative analysis.
Parents were first asked how they would characterize their child’s weight. As
shown in Table 21, a majority of parents (70%) classified their child as having normal
weight (n = 14) and only 20% classified their child as heavy (n = 4). Parent comments
about their child’s weight included statements such as, “He’s kinda [sic] husky, but not
really overweight. Like big boned.” A smaller proportion of parents reported that their
child was underweight (10%; n = 2).
Table 21
Frequencies and Percentages for Parent Characterization of Child’s Weight Frequency Percentage Heavy 4 20.00 Normal 14 70.00 Underweight 2 10.00
________________________________________________________________
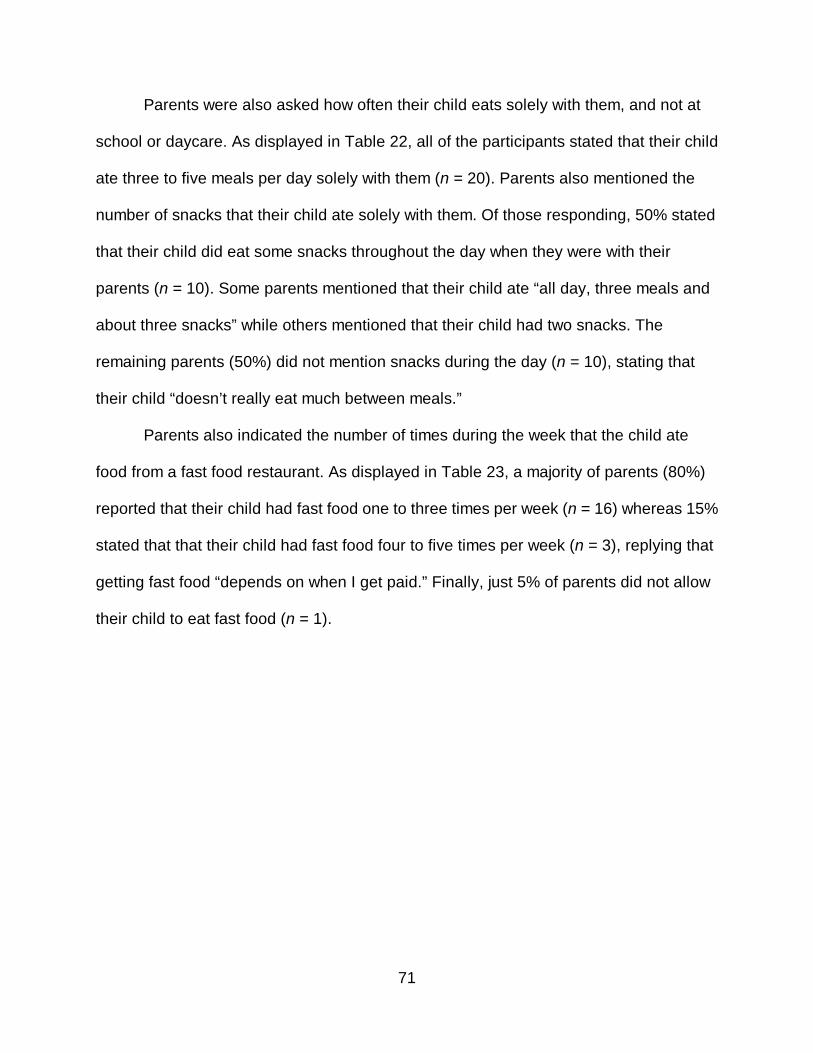
71
Parents were also asked how often their child eats solely with them, and not at
school or daycare. As displayed in Table 22, all of the participants stated that their child
ate three to five meals per day solely with them (n = 20). Parents also mentioned the
number of snacks that their child ate solely with them. Of those responding, 50% stated
that their child did eat some snacks throughout the day when they were with their
parents (n = 10). Some parents mentioned that their child ate “all day, three meals and
about three snacks” while others mentioned that their child had two snacks. The
remaining parents (50%) did not mention snacks during the day (n = 10), stating that
their child “doesn’t really eat much between meals.”
Parents also indicated the number of times during the week that the child ate
food from a fast food restaurant. As displayed in Table 23, a majority of parents (80%)
reported that their child had fast food one to three times per week (n = 16) whereas 15%
stated that that their child had fast food four to five times per week (n = 3), replying that
getting fast food “depends on when I get paid.” Finally, just 5% of parents did not allow
their child to eat fast food (n = 1).
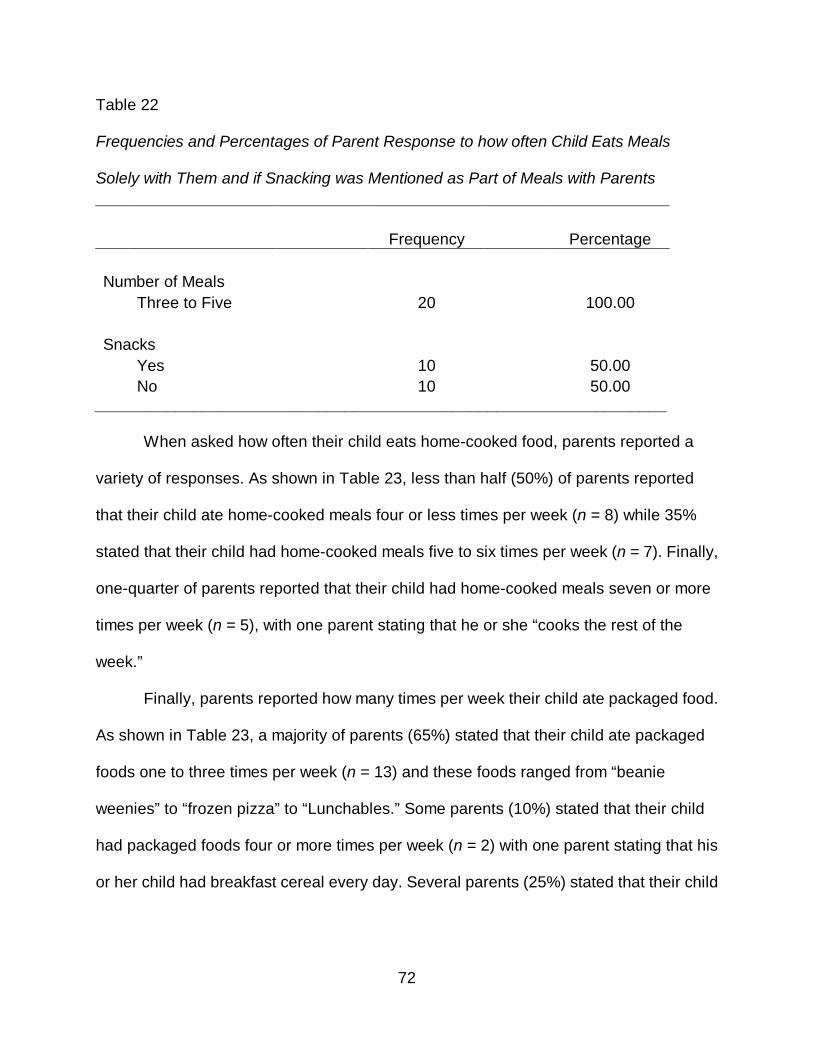
72
Table 22
Frequencies and Percentages of Parent Response to how often Child Eats Meals
Solely with Them and if Snacking was Mentioned as Part of Meals with Parents
Frequency Percentage Number of Meals Three to Five 20 100.00 Snacks Yes 10 50.00 No 10 50.00
________________________________________________________________
When asked how often their child eats home-cooked food, parents reported a
variety of responses. As shown in Table 23, less than half (50%) of parents reported
that their child ate home-cooked meals four or less times per week (n = 8) while 35%
stated that their child had home-cooked meals five to six times per week (n = 7). Finally,
one-quarter of parents reported that their child had home-cooked meals seven or more
times per week (n = 5), with one parent stating that he or she “cooks the rest of the
week.”
Finally, parents reported how many times per week their child ate packaged food.
As shown in Table 23, a majority of parents (65%) stated that their child ate packaged
foods one to three times per week (n = 13) and these foods ranged from “beanie
weenies” to “frozen pizza” to “Lunchables.” Some parents (10%) stated that their child
had packaged foods four or more times per week (n = 2) with one parent stating that his
or her child had breakfast cereal every day. Several parents (25%) stated that their child
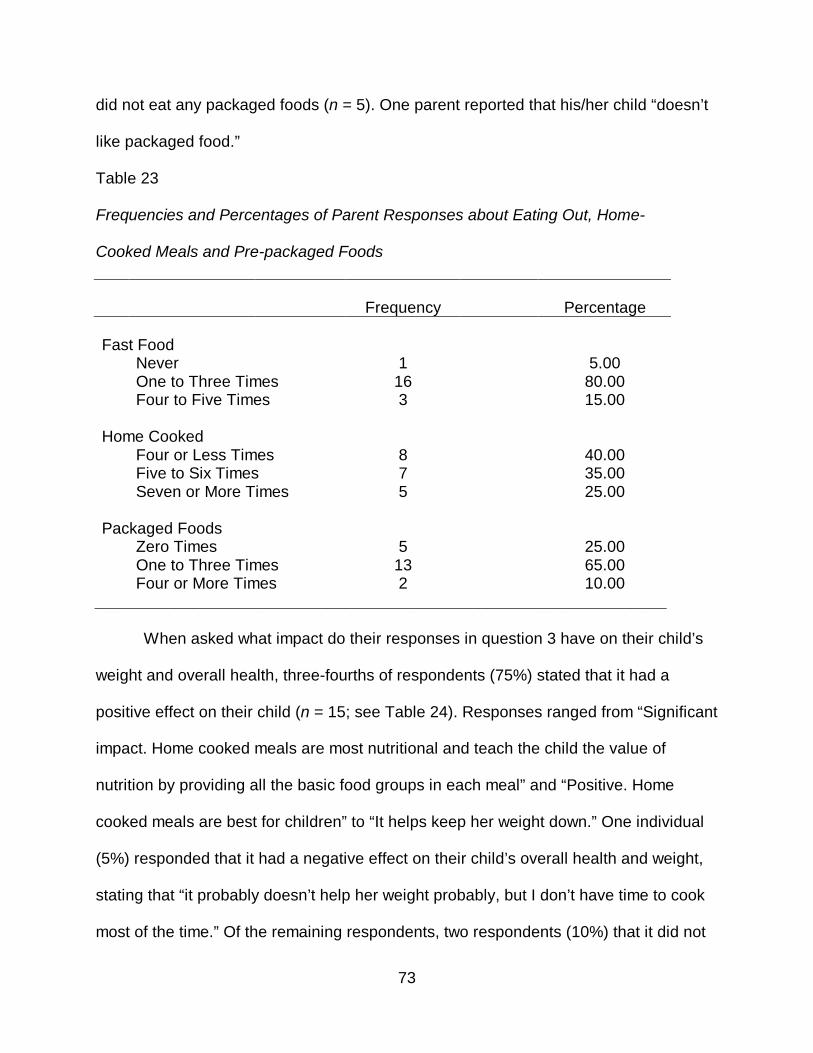
73
did not eat any packaged foods (n = 5). One parent reported that his/her child “doesn’t
like packaged food.”
Table 23
Frequencies and Percentages of Parent Responses about Eating Out, Home-
Cooked Meals and Pre-packaged Foods
Frequency Percentage Fast Food Never 1 5.00 One to Three Times 16 80.00 Four to Five Times 3 15.00 Home Cooked Four or Less Times 8 40.00 Five to Six Times 7 35.00 Seven or More Times 5 25.00 Packaged Foods Zero Times 5 25.00 One to Three Times 13 65.00 Four or More Times 2 10.00
________________________________________________________________
When asked what impact do their responses in question 3 have on their child’s
weight and overall health, three-fourths of respondents (75%) stated that it had a
positive effect on their child (n = 15; see Table 24). Responses ranged from “Significant
impact. Home cooked meals are most nutritional and teach the child the value of
nutrition by providing all the basic food groups in each meal” and “Positive. Home
cooked meals are best for children” to “It helps keep her weight down.” One individual
(5%) responded that it had a negative effect on their child’s overall health and weight,
stating that “it probably doesn’t help her weight probably, but I don’t have time to cook
most of the time.” Of the remaining respondents, two respondents (10%) that it did not

74
have any effect, and two (10%) did not know the effect on their child’s weight and
overall health.
Table 24
Frequencies and Percentages of the Impact on Children Weight and Overall
Health
Frequency Percentage No Effect 2 10.00 Negative Effect 1 5.00 Positive Effect 15 75.00 Don't know 2 10.00
________________________________________________________________
Participants also addressed the question as to whether or not their child
participated with grocery shopping. As seen in Table 25, a majority of parents (70%)
stated that their child did sometimes participate with grocery shopping (n = 14). Four
respondents (20%) stated that their child did not help with shopping and two
respondents (10%) said that their child helped with grocery shopping. Parents were also
asked if they either solicit or accept their child’s input when grocery shopping. As
displayed in Table 25, seven parents (35%) stated that they did solicit and/or accept
their child’s input when they were grocery shopping, stating that their child was allowed
to choose “which cereal and oatmeal to get” or “letting her pick out the cereal, chips,
pizza and drinks.” Another 35% of parents (n = 7) stated that they sometimes solicited
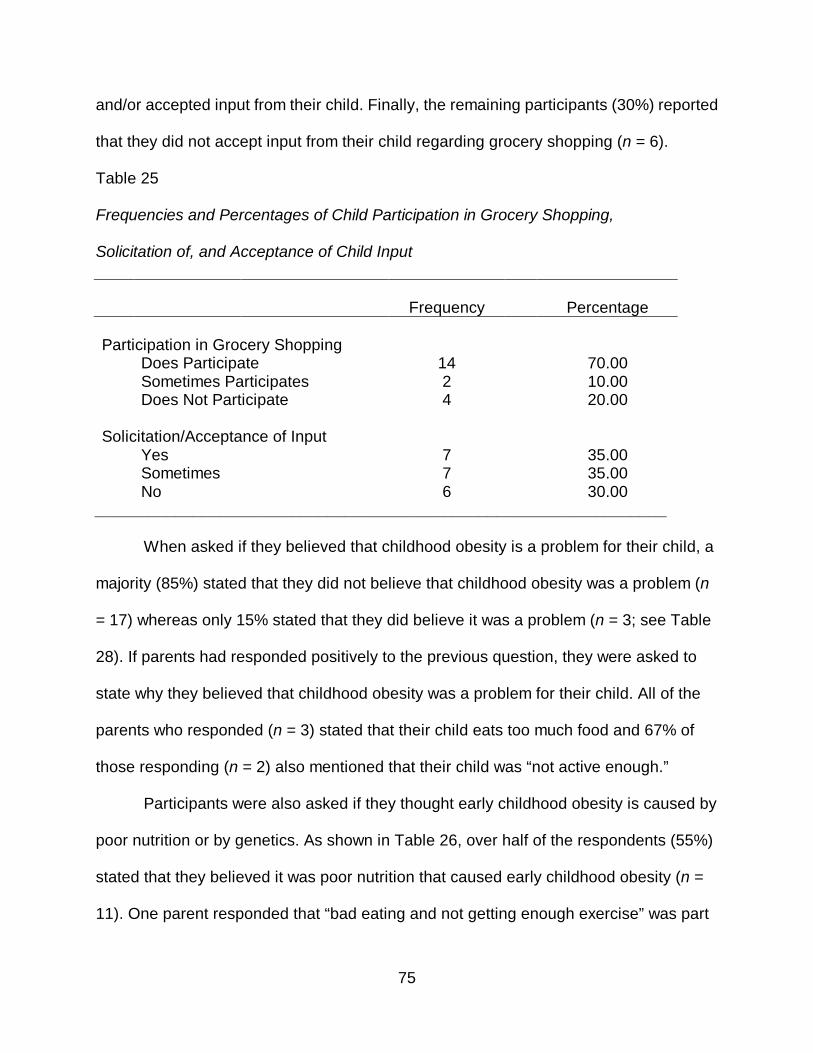
75
and/or accepted input from their child. Finally, the remaining participants (30%) reported
that they did not accept input from their child regarding grocery shopping (n = 6).
Table 25
Frequencies and Percentages of Child Participation in Grocery Shopping,
Solicitation of, and Acceptance of Child Input
Frequency Percentage Participation in Grocery Shopping Does Participate 14 70.00 Sometimes Participates 2 10.00 Does Not Participate 4 20.00 Solicitation/Acceptance of Input Yes 7 35.00 Sometimes 7 35.00 No 6 30.00
________________________________________________________________
When asked if they believed that childhood obesity is a problem for their child, a
majority (85%) stated that they did not believe that childhood obesity was a problem (n
= 17) whereas only 15% stated that they did believe it was a problem (n = 3; see Table
28). If parents had responded positively to the previous question, they were asked to
state why they believed that childhood obesity was a problem for their child. All of the
parents who responded (n = 3) stated that their child eats too much food and 67% of
those responding (n = 2) also mentioned that their child was “not active enough.”
Participants were also asked if they thought early childhood obesity is caused by
poor nutrition or by genetics. As shown in Table 26, over half of the respondents (55%)
stated that they believed it was poor nutrition that caused early childhood obesity (n =
11). One parent responded that “bad eating and not getting enough exercise” was part
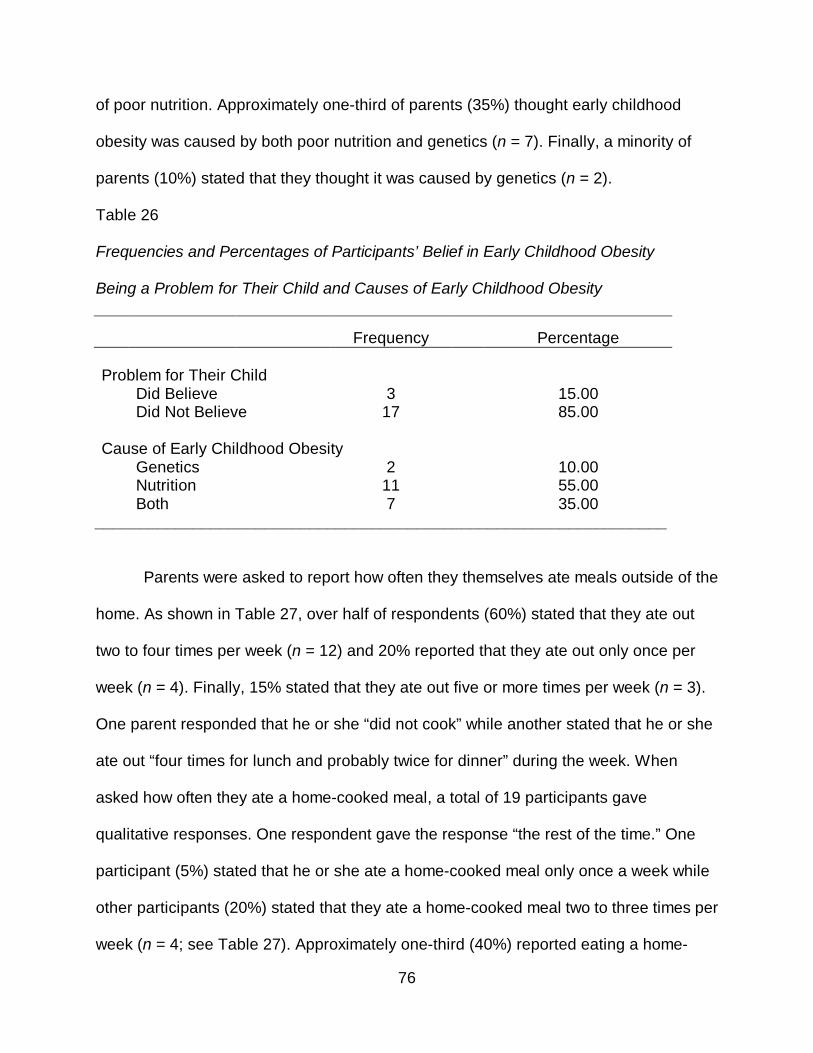
76
of poor nutrition. Approximately one-third of parents (35%) thought early childhood
obesity was caused by both poor nutrition and genetics (n = 7). Finally, a minority of
parents (10%) stated that they thought it was caused by genetics (n = 2).
Table 26
Frequencies and Percentages of Participants’ Belief in Early Childhood Obesity
Being a Problem for Their Child and Causes of Early Childhood Obesity
Frequency Percentage Problem for Their Child Did Believe 3 15.00 Did Not Believe 17 85.00 Cause of Early Childhood Obesity Genetics 2 10.00 Nutrition 11 55.00 Both 7 35.00
________________________________________________________________
Parents were asked to report how often they themselves ate meals outside of the
home. As shown in Table 27, over half of respondents (60%) stated that they ate out
two to four times per week (n = 12) and 20% reported that they ate out only once per
week (n = 4). Finally, 15% stated that they ate out five or more times per week (n = 3).
One parent responded that he or she “did not cook” while another stated that he or she
ate out “four times for lunch and probably twice for dinner” during the week. When
asked how often they ate a home-cooked meal, a total of 19 participants gave
qualitative responses. One respondent gave the response “the rest of the time.” One
participant (5%) stated that he or she ate a home-cooked meal only once a week while
other participants (20%) stated that they ate a home-cooked meal two to three times per
week (n = 4; see Table 27). Approximately one-third (40%) reported eating a home-
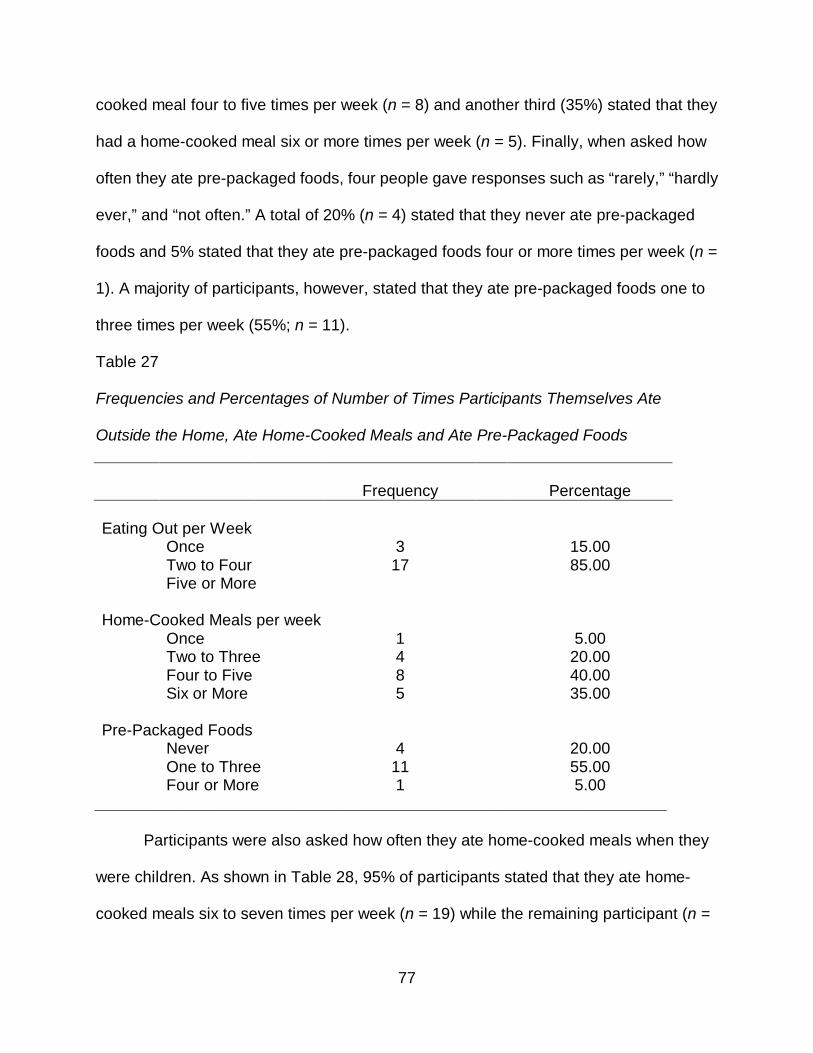
77
cooked meal four to five times per week (n = 8) and another third (35%) stated that they
had a home-cooked meal six or more times per week (n = 5). Finally, when asked how
often they ate pre-packaged foods, four people gave responses such as “rarely,” “hardly
ever,” and “not often.” A total of 20% (n = 4) stated that they never ate pre-packaged
foods and 5% stated that they ate pre-packaged foods four or more times per week (n =
1). A majority of participants, however, stated that they ate pre-packaged foods one to
three times per week (55%; n = 11).
Table 27
Frequencies and Percentages of Number of Times Participants Themselves Ate
Outside the Home, Ate Home-Cooked Meals and Ate Pre-Packaged Foods
Frequency Percentage Eating Out per Week Once 3 15.00 Two to Four 17 85.00 Five or More Home-Cooked Meals per week Once 1 5.00 Two to Three 4 20.00 Four to Five 8 40.00 Six or More 5 35.00 Pre-Packaged Foods Never 4 20.00 One to Three 11 55.00 Four or More 1 5.00
________________________________________________________________
Participants were also asked how often they ate home-cooked meals when they
were children. As shown in Table 28, 95% of participants stated that they ate home-
cooked meals six to seven times per week (n = 19) while the remaining participant (n =
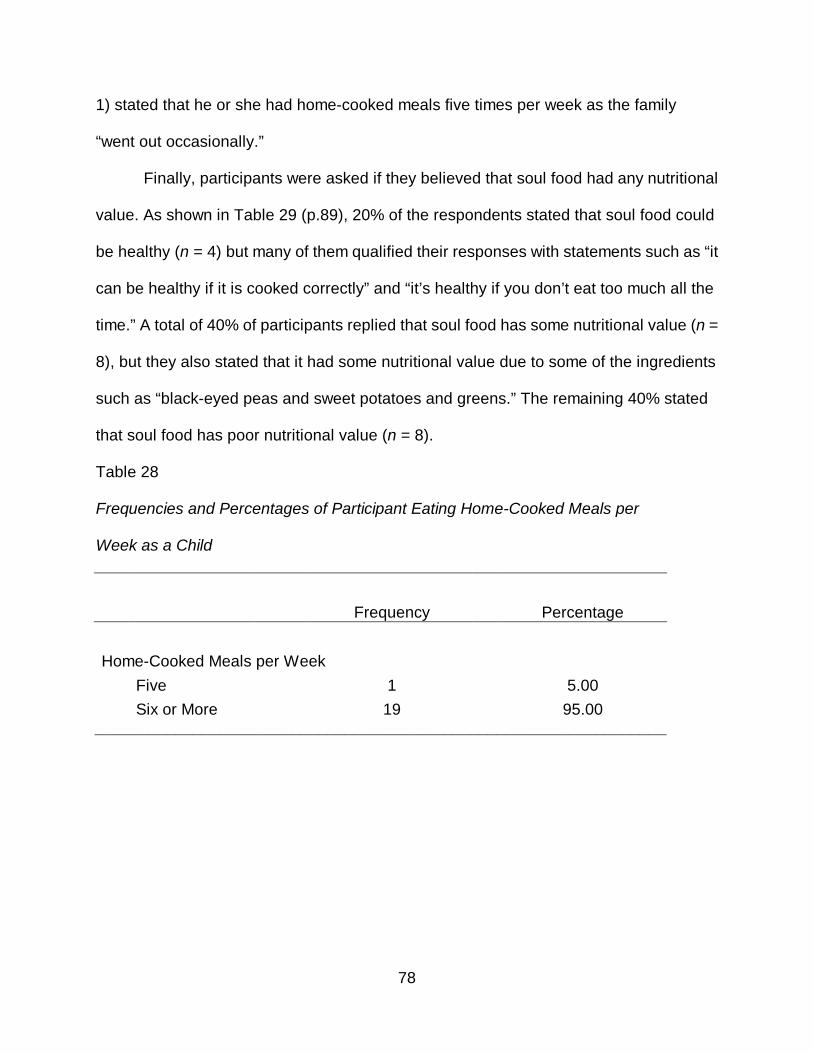
78
1) stated that he or she had home-cooked meals five times per week as the family
“went out occasionally.”
Finally, participants were asked if they believed that soul food had any nutritional
value. As shown in Table 29 (p.89), 20% of the respondents stated that soul food could
be healthy (n = 4) but many of them qualified their responses with statements such as “it
can be healthy if it is cooked correctly” and “it’s healthy if you don’t eat too much all the
time.” A total of 40% of participants replied that soul food has some nutritional value (n =
8), but they also stated that it had some nutritional value due to some of the ingredients
such as “black-eyed peas and sweet potatoes and greens.” The remaining 40% stated
that soul food has poor nutritional value (n = 8).
Table 28
Frequencies and Percentages of Participant Eating Home-Cooked Meals per
Week as a Child
Frequency Percentage Home-Cooked Meals per Week Five 1 5.00 Six or More 19 95.00
________________________________________________________________
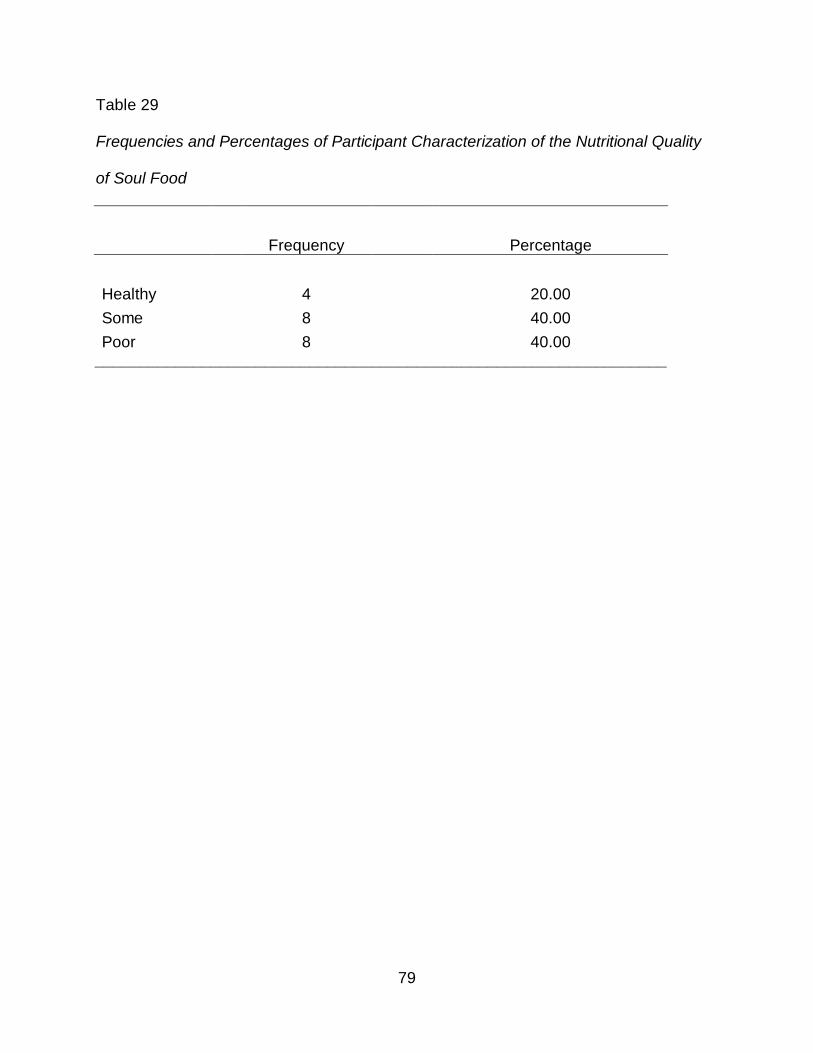
79
Table 29
Frequencies and Percentages of Participant Characterization of the Nutritional Quality
of Soul Food
Frequency Percentage Healthy 4 20.00 Some 8 40.00 Poor 8 40.00
________________________________________________________________
80
CHAPTER 5
SUMMARY AND DISCUSSION
The purpose of this study was to explore the link between parental beliefs and
influences on childhood obesity in African-American households with children ranging
from the ages of 3 to 6-years-old. The investigator examined the habits and knowledge
of nutritional information of African–American parents of differing educational and socio-
economic levels in the Dallas, Texas area. Seventy-five African-American parents
participated in the study by completing a demographic questionnaire and the
Comprehensive Feeding Practices Questionnaire (CFPQ). Twenty African-American
parents participated in oral interviews with the researcher. The results from this study
are presented in the previous chapter.
Demographic Findings
Participants completed a demographic questionnaire created by the researcher.
Findings from this portion of the data provided the following results:
One hundred twenty questionnaires were distributed, 12 were returned incomplete, and
75 were used for data analysis. Seventy-one (94.7%) African-American females and
four (5.3%) African-American males participated in the study. The average age of
participants was 30.83 (SD=6.09). The minimum age was 21 and the maximum age
was 53 years. Marital status varied among the participants. More than half of
participants (60%) reported being single. Almost 20% (17.3%) reported being divorced
and another 4.0% were separated. Married participants made up 13.3% of the sample
and another 5.3% reported that they were cohabitating or living as married. Most
81
participants (45.3%) reported working full-time, while 17.3% worked part time, and over
one third were not employed (37.3%).
Income and education levels varied among the participants as well. Of the 75
participants, one-quarter reported making less than $20,000, 42.7% reported making
$20,000-$39,000, and about 30% (29.3%) reported making $40,000-$59,000. Only
2.7% of participants reported making $90,000-$99,000. No participants reported any
other income levels. Additionally, participants reported on the highest level of education
that they obtained. Just under 20% had completed only some high school (17.3%),
about half had received a high school diploma or GED (48%). Seventeen percent of the
participants had completed some college, 6.7% had an associates degree or technical
school, another 6.7% had a 4 year degree, and 5.3% had a graduate degree. These
numbers may be related directly to the community where data was collected. It is known
to have a high number of unemployed adults and high poverty rates.
Participants reported on the total number of family members, total number of
children as well as the ages of the children in their respective households. Twenty
percent reported having two family members, 36.0% reported three family members,
about 30% reported four family members (29.3%), and 14.7% reported five family
members. Almost half of all participants had two (46.7%) children, about one-quarter
had one (25.3%), and another quarter had three children (28.0%). About 80% of the
households had one child between 3 and 6 years old (81.3%) and the remaining 20%
had two children in this age range (18.7%).
Participants reported on the gender, and weight level for their first child between
3 and 7 years. The number of males (48.0%) and females (52.0%) were almost evenly
82
split. For weight, the majority reported that the child was a normal weight (77.3%), while
12.0% said the child was heavy, 8.0% reported underweight, and 2.7% reported
overweight. Eighty-one percent of participants did not have a second child in this age
range. Parents in the research study also reported on the gender, age, and weight level
for their second child between 3 and 7 years. Eight percent of the sample had a male
child and 10.7% had a female child. For weight, the majority reported that the child was
a normal weight (16.0%), while 1.3% said the child was heavy and 1.3% said the child
was overweight. Eighty-one percent of participants did not have a second child in this
age range.
Meal Types and Food Servings
Participants reported on the frequency of their children’s consumption of fast
food, home cooked meals, and pre-packaged meals per week. For fast food, just under
one-third reported that the children do not eat fast food (30.7%), over half reported fast
food 1-2 times per week (54.7%), and 14.7% reported 4-5 times per week. For home
cooked meals, the majority reported 4-5 times per week, and another quarter (25.3%)
reported 6-7 times per week. Four percent reported 1-2 times per week and almost 10%
reported 8-9 times per week (9.3%).
Participants in the study also provided information about the number of fruit,
vegetable, grain, meat, dairy, and fat/sweet servings their children eat on a daily basis.
For fruit, the majority reported the child eats two servings (37.3%) or three servings
(36.0%). For vegetables, the majority reported the child eats two servings (45.3%) or
three servings (40.0%). For grains, the majority reported the child eats three servings
(49.3%), and for meats, the majority also reported three servings (61.3%). For dairy, the
83
majority reported the child eats two servings (40.0%) or three servings (41.3%). Finally,
for fats/sweets the majority reported two servings per day (54.7%). This data somewhat
refutes the findings of the Haire-Joshu (2003) study which indicated that African-
Americans have a tendency to consume fewer fruits and vegetables and more high-
calorie, high-fat foods.
Relationships Among Demographic Variables
There was a significant relationship between marital status and income level. In
general, those who made less than $40,000 were more often single, while those who
made $40,000 or more were more likely to be married. Those who had a high school
diploma or less were more often single, while those who had some college or more
were more about equally likely to be single, separated/divorced, or married. In general,
those who made less than $40,000 were more often not employed, while those who
made $40,000 or more were more likely to work full time. In general, those who had a
high school diploma or less were more often not employed, while those who had some
college or more were more likely to work full-time.
There was a noteworthy relationship between highest education level and
income level. In general, those who made less than $40,000 were more likely to have a
high school diploma or less, while those who made $40,000 or more were more likely to
have some college or more. There was a significant relationship between total family
members and income level. In general, those who made less than $40,000 had fewer
family members (2, 3, or 4 members), while those who made $40,000 or more were
more likely to have more family members (3, 4, or 5 members).
84
There was a marginally significant relationship between number of children in
household and income level. In general, those who made less than $40,000 were less
likely to have only one child in the household than those who made $40,000 or more.
Interestingly, there was also a significant relationship between child one gender and
income level. In general, those who made less than $40,000 were more likely to have a
girl, while those who made $40,000 or more were more likely to have a boy.
There was also a relationship between home cooked meals per week and
income level. In general, those who made less than $40,000 were more likely to have
home cooked meals 6-9 times per week than those who made $40,000 or more. This
was likely due to the expensive costs associated with frequently eating at restaurants.
There was a significant relationship between home cooked meals per week,
number of grain servings, and education level. In general, those who had a high school
diploma or less were about equally likely to have home cooked meals 1-5 times or 6-9
times per week while those who had some college or more were more likely to have
home cooked meals 1-5 times per week. In general, those who had a high school
diploma or less were more likely to eat 3 or more grain servings, while those who had
some college or more were more likely to eat 2 or less servings of grain.
There was a significant relationship between the gender/age of the children in the
home and income level. Those who made less than $40,000 were more likely to have
six-year-old children (especially 6-year-old girls), while those who made $40,000 or
more were more likely to have 4-year-old children (particularly 4-year-old boys). There
was no relationship between child gender/age and education level.
85
Comprehensive Feeding Practices Questionnaire Findings
The results from the CFPQ indicated that the subscales with the highest
averages were Encourage Balance and Variety (M=4.35, SD=.58), Monitoring (M=4.11,
SD=.83), Restriction for Health (M=3.87, SD=.75), Teaching about Nutrition (M=3.83,
SD=.89), and Modeling (M=3.83, SD=1.09). The subscales with the lowest averages
were Emotion Regulation (M=1.44, SD=.66), Child Control (M=2.13, SD=.64),
Restriction for Weight Control (M=2.65, SD=.85), and Food as Reward (M=2.90,
SD=1.19). The subscales with mid level averages were Involvement (M=3.67, SD=.95),
Environment (M=3.60, SD=.70), and Pressure (M=3.02, SD=.83).
There was a significant difference between Modeling and Encourage Balance
and Variety for those whose children ate different amounts of fast food meals per week.
Both the Modeling and Encourage Balance and Variety scores were higher for those
whose children did not eat fast food than for those whose children ate fast food one or
more times per week. No other significant differences were found for direct hypotheses
questions.
Discussion
Current research has indicated the impact of familial eating behaviors has a
tremendous effect on the risk of overweight and obesity among young children
(Ebbeling, Pawlak, & Ludwig, 2002; Golan & Crow, 2004). Because of this and the
current epidemic of obesity among young children, the need for parent education
regarding healthy eating habits is more important than ever. The results from this study
indicate that African-American parents’ beliefs about food correlate directly with food
they feed their children, which mirrors the results of the study conducted by Tibbs, et. al
86
(2001). This may be the first step in diminishing the problem of early childhood obesity
among not only African- Americans but other minority groups as well.
Limitations
The African-American parents who participated in this research study did so on a
voluntary basis. Quantitative results detailed in the study were comprised from data
derived from the Comprehensive Feeding Practices Questionnaire (CFPQ) and
demographic information completed by the participating parents. The CFPQ examined
parental attitudes, practices, beliefs, and perceptions in a self-reporting format.
“Whereas previous scales have measured only a subset of feeding practices, the 12
subscales of the CFPQ allow researchers and clinicians to measure many aspects of
this complex behavior” (Musher-Eizenman & Holub, 2007, p. 967). Additionally, the
quantitative results were based on self-reports and were subject to bias by the
participants.
Participants represented a convenience sample of African-American mothers and
fathers in the Dallas-Fort Worth, Texas metropolitan area who completed the
Comprehensive Feeding Practices Questionnaire via hard copy. The CFPQ is a self-
reporting instrument, which may have been subject to bias by the participants. Answers
from the interviews conducted by the researcher with the participants were coded and
used to provide qualitative results.
87
Future Research
Obesity is a current public health crises and will continue to be so until
widespread action is taken to inform the public about early detection, prevention and
possible health complications associated with obesity (Stegelin, 2008). Information
derived from current and previous research indicates that although some progress has
been made in the prevention of early childhood obesity, more is necessary. The current
study will add to the existing, although limited, research regarding parental attitudes of
nutrition and obesity of African American parents.
Future areas of research in this area could include longitudinal studies of African-
American children who have been identified as overweight or obese as toddlers, effects
of weight management programs created for young African-American children, or
possibly parent education classes for overweight adults for the prevention of weight
problems in their children. A comparison of parental perceptions could be made
between groups formed by income level, education level, or location of residence.
There are many ideas for further research that could be initiated by the findings
of the current study. All would be worthwhile, and all would benefit the physical well
being of young African-American children.
Summary
The problem of early childhood obesity among young children, particularly
minority children, will continue to be a public health issue until parents and caregivers of
overweight and obese children take more proactive measures to promote healthy eating
habits and physical activity to their children. This research study was intended to add to
current parental education information regarding practices and perceptions about early
88
childhood obesity. It was also intended to shed light on current practices and beliefs of
African American parents in an urban community. If more is done to educate parents
about healthy eating habits and obesity prevention, this research indicates that
knowledge will most likely be passed on to their children as well. More research in this
area is needed before effective solutions can be implemented.
89
APPENDIX A
CONSENT FORM
PARENT LETTER

90
University of North Texas Institutional Review Board
Informed Consent Form
Before agreeing to participate in this research study, it is important that you read and understand the following explanation of the purpose and benefits of the study and how it will be conducted.
Title of Study: African-American Parents' Nutritional Habits: Implications For The Prevention of Early Childhood Obesity
Purpose of the Study: You are being asked to participate in a research study which involves identifying any link between parental beliefs and influences on childhood obesity in African-American households with children between the ages of three and six years old. This study win be conducted to investigate the beliefs and knowledge of nutritional information of African-American parents of all socio-economic backgrounds within the Dallas, Texas area.
Study Procedures: You will be asked to fill out the Comprehensive Feeding Practices Questionnaire and a demographic questionnaire, which will take about 30 minutes of your time. Randomly selected participants will be asked to participate in an interview conducted by the researcher. Interviews will last no more than 30 minutes.
Foreseeable Risks: No foreseeable risks are involved in this study.
Benefits to the Subjects or Others: We expect the project to benefit you by making you more aware of your feeding practices in regards to your child(ren). This study will provide empirical research about these nutritional practices and beliefs as they relate to the African-American community. This research may benefit parents, caregivers, and early childhood researchers and is expected to be beneficial in future parent education forums.
Procedures for Maintaining Confidentiality of Research Records: The principal investigator will maintain signed consent forms and completed surveys. Surveys will be coded with a number for identification purposes only. Names and other identifying words will not be on the questionnaires. Written notes and responses from oral interviews will be maintained in a secure location until the completion of the study and will only be viewed by the principal investigator. All questionnaires and interview responses will be shredded three years after the completion of this study. The confidentiality of your individual information will be maintained in any publications or presentations regarding this study. Questions about the Study: If you have any questions about the study, you may contact Andraya Anderson at telephone number __________ or the faculty advisor, Dr. George Morrison, UNT Department of Teacher Education and Administration, at telephone number 940-565-4476.
91
Review for the Protection of Participants: This research study has been reviewed and approved by the UNT Institutional Review Board (IRB). The UNT IRB can be contacted at 940-565-3940 with any questions regarding the rights of research subjects.
Research Participants' Rights: Your signature below indicates that you have read or have had read to you all of the above and that you confirm all of the following:
• You have read and understand the information regarding the possible benefits and the potential risks and/or discomforts of the study.
• You understand that you do not have to take part in this study, and your refusal to participate or your decision to withdraw will involve no penalty or loss of rights or benefits. The study personnel may choose to stop your participation at any time.
• You understand why the study is being conducted and how it will be performed. • You understand your rights as a research participant and you voluntarily consent to
participate in this study. • You will receive a copy of this form.
Printed Name of Participant
Signature of Participant Date
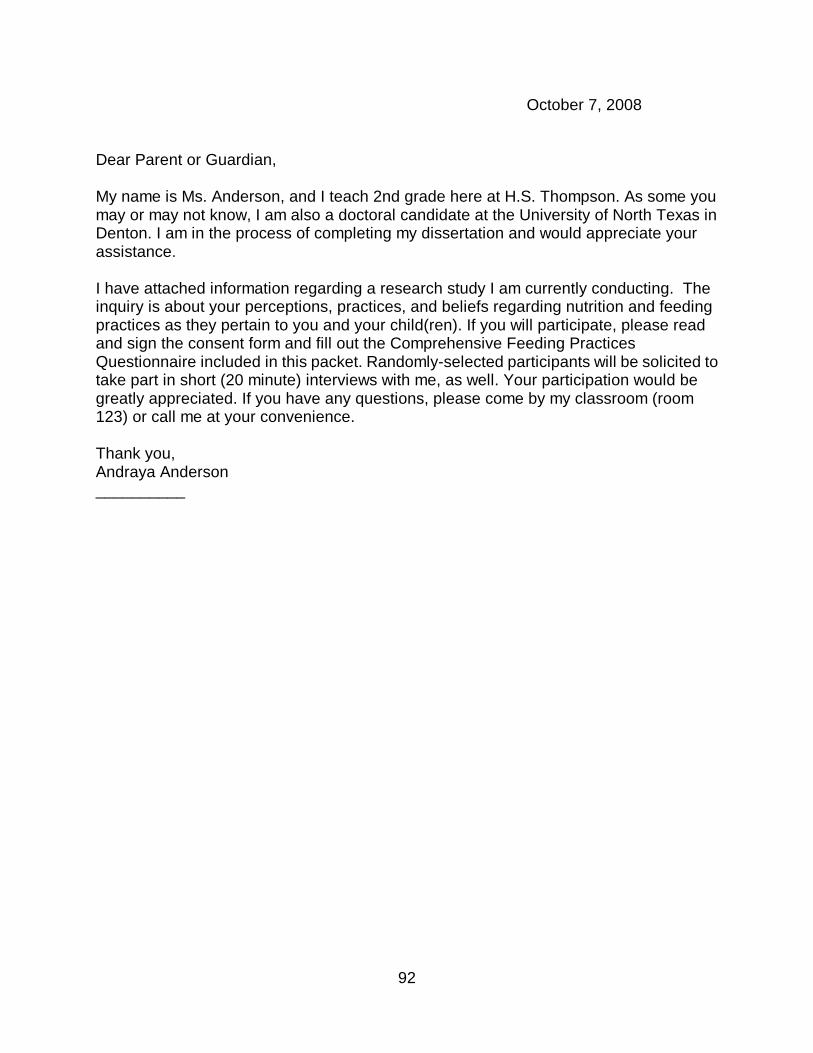
92
October 7, 2008 Dear Parent or Guardian, My name is Ms. Anderson, and I teach 2nd grade here at H.S. Thompson. As some you may or may not know, I am also a doctoral candidate at the University of North Texas in Denton. I am in the process of completing my dissertation and would appreciate your assistance. I have attached information regarding a research study I am currently conducting. The inquiry is about your perceptions, practices, and beliefs regarding nutrition and feeding practices as they pertain to you and your child(ren). If you will participate, please read and sign the consent form and fill out the Comprehensive Feeding Practices Questionnaire included in this packet. Randomly-selected participants will be solicited to take part in short (20 minute) interviews with me, as well. Your participation would be greatly appreciated. If you have any questions, please come by my classroom (room 123) or call me at your convenience. Thank you, Andraya Anderson __________
93
APPENDIX B
COMPREHENSIVE FEEDING PRACTICES QUESTIONNAIRE
Source: Musher-Eizenman & Holub (2007); reproduced with permission from Oxford
University Press
DEMOGRAPHIC QUESTIONNAIRE
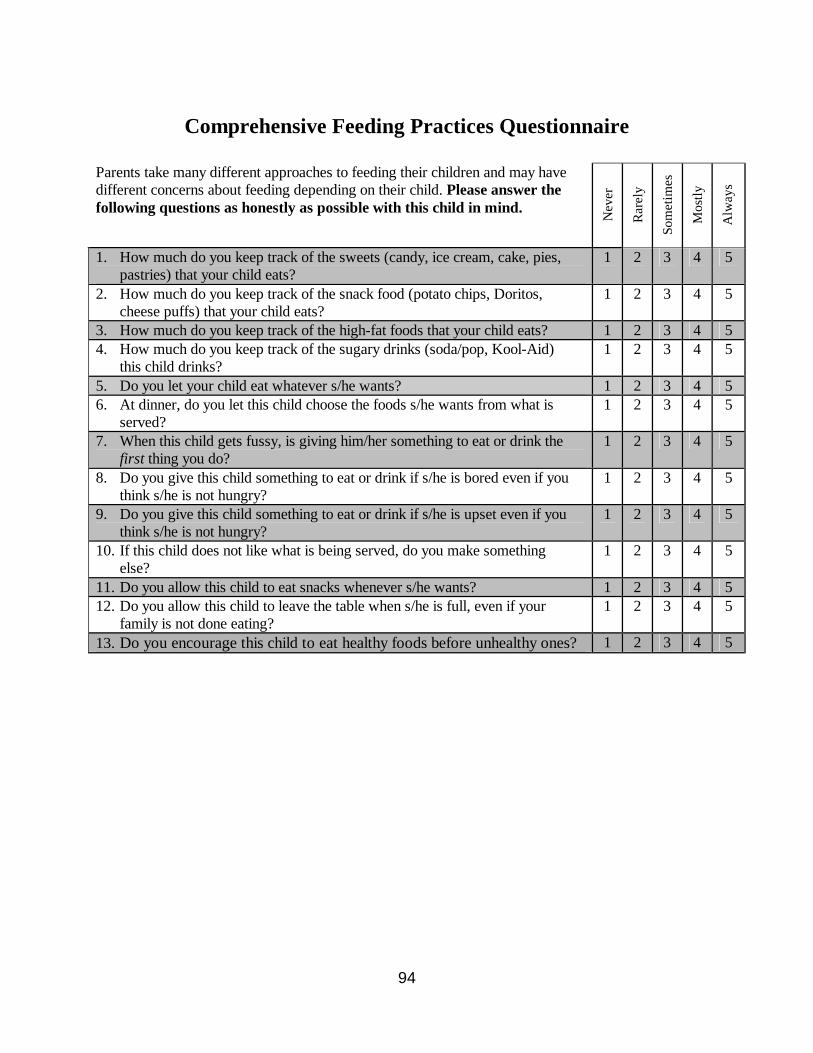
94
Comprehensive Feeding Practices Questionnaire
Parents take many different approaches to feeding their children and may have different concerns about feeding depending on their child. Please answer the following questions as honestly as possible with this child in mind. N
ever
Rar
ely
Som
etim
es
Mos
tly
Alw
ays
1. How much do you keep track of the sweets (candy, ice cream, cake, pies, pastries) that your child eats?
1 2 3 4 5
2. How much do you keep track of the snack food (potato chips, Doritos, cheese puffs) that your child eats?
1 2 3 4 5
3. How much do you keep track of the high-fat foods that your child eats? 1 2 3 4 5 4. How much do you keep track of the sugary drinks (soda/pop, Kool-Aid)
this child drinks? 1 2 3 4 5
5. Do you let your child eat whatever s/he wants? 1 2 3 4 5 6. At dinner, do you let this child choose the foods s/he wants from what is
served? 1 2 3 4 5
7. When this child gets fussy, is giving him/her something to eat or drink the first thing you do?
1 2 3 4 5
8. Do you give this child something to eat or drink if s/he is bored even if you think s/he is not hungry?
1 2 3 4 5
9. Do you give this child something to eat or drink if s/he is upset even if you think s/he is not hungry?
1 2 3 4 5
10. If this child does not like what is being served, do you make something else?
1 2 3 4 5
11. Do you allow this child to eat snacks whenever s/he wants? 1 2 3 4 5 12. Do you allow this child to leave the table when s/he is full, even if your
family is not done eating? 1 2 3 4 5
13. Do you encourage this child to eat healthy foods before unhealthy ones? 1 2 3 4 5
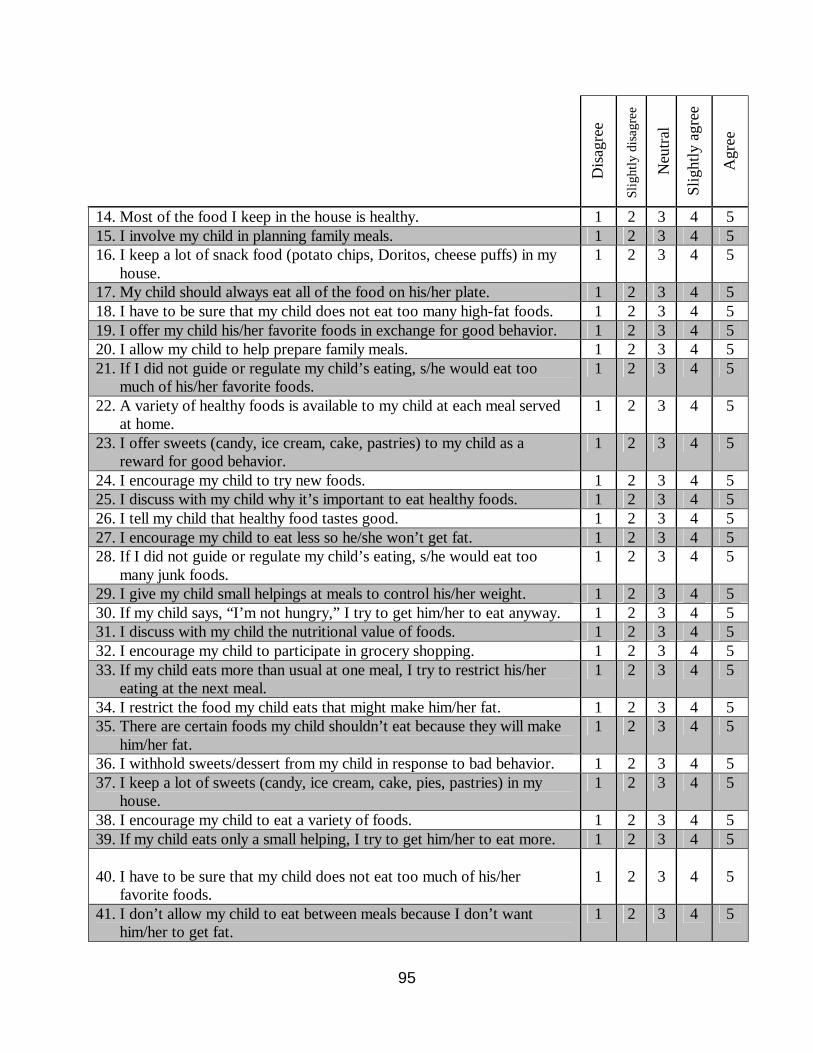
95
Dis
agre
e
Slig
htly
dis
agre
e
Neu
tral
Slig
htly
agr
ee
Agr
ee
14. Most of the food I keep in the house is healthy. 1 2 3 4 5 15. I involve my child in planning family meals. 1 2 3 4 5 16. I keep a lot of snack food (potato chips, Doritos, cheese puffs) in my
house. 1 2 3 4 5
17. My child should always eat all of the food on his/her plate. 1 2 3 4 5 18. I have to be sure that my child does not eat too many high-fat foods. 1 2 3 4 5 19. I offer my child his/her favorite foods in exchange for good behavior. 1 2 3 4 5 20. I allow my child to help prepare family meals. 1 2 3 4 5 21. If I did not guide or regulate my child’s eating, s/he would eat too
much of his/her favorite foods. 1 2 3 4 5
22. A variety of healthy foods is available to my child at each meal served at home.
1 2 3 4 5
23. I offer sweets (candy, ice cream, cake, pastries) to my child as a reward for good behavior.
1 2 3 4 5
24. I encourage my child to try new foods. 1 2 3 4 5 25. I discuss with my child why it’s important to eat healthy foods. 1 2 3 4 5 26. I tell my child that healthy food tastes good. 1 2 3 4 5 27. I encourage my child to eat less so he/she won’t get fat. 1 2 3 4 5 28. If I did not guide or regulate my child’s eating, s/he would eat too
many junk foods. 1 2 3 4 5
29. I give my child small helpings at meals to control his/her weight. 1 2 3 4 5 30. If my child says, “I’m not hungry,” I try to get him/her to eat anyway. 1 2 3 4 5 31. I discuss with my child the nutritional value of foods. 1 2 3 4 5 32. I encourage my child to participate in grocery shopping. 1 2 3 4 5 33. If my child eats more than usual at one meal, I try to restrict his/her
eating at the next meal. 1 2 3 4 5
34. I restrict the food my child eats that might make him/her fat. 1 2 3 4 5 35. There are certain foods my child shouldn’t eat because they will make
him/her fat. 1 2 3 4 5
36. I withhold sweets/dessert from my child in response to bad behavior. 1 2 3 4 5 37. I keep a lot of sweets (candy, ice cream, cake, pies, pastries) in my
house. 1 2 3 4 5
38. I encourage my child to eat a variety of foods. 1 2 3 4 5 39. If my child eats only a small helping, I try to get him/her to eat more. 1 2 3 4 5 40. I have to be sure that my child does not eat too much of his/her
favorite foods.
1
2
3
4
5
41. I don’t allow my child to eat between meals because I don’t want him/her to get fat.
1 2 3 4 5
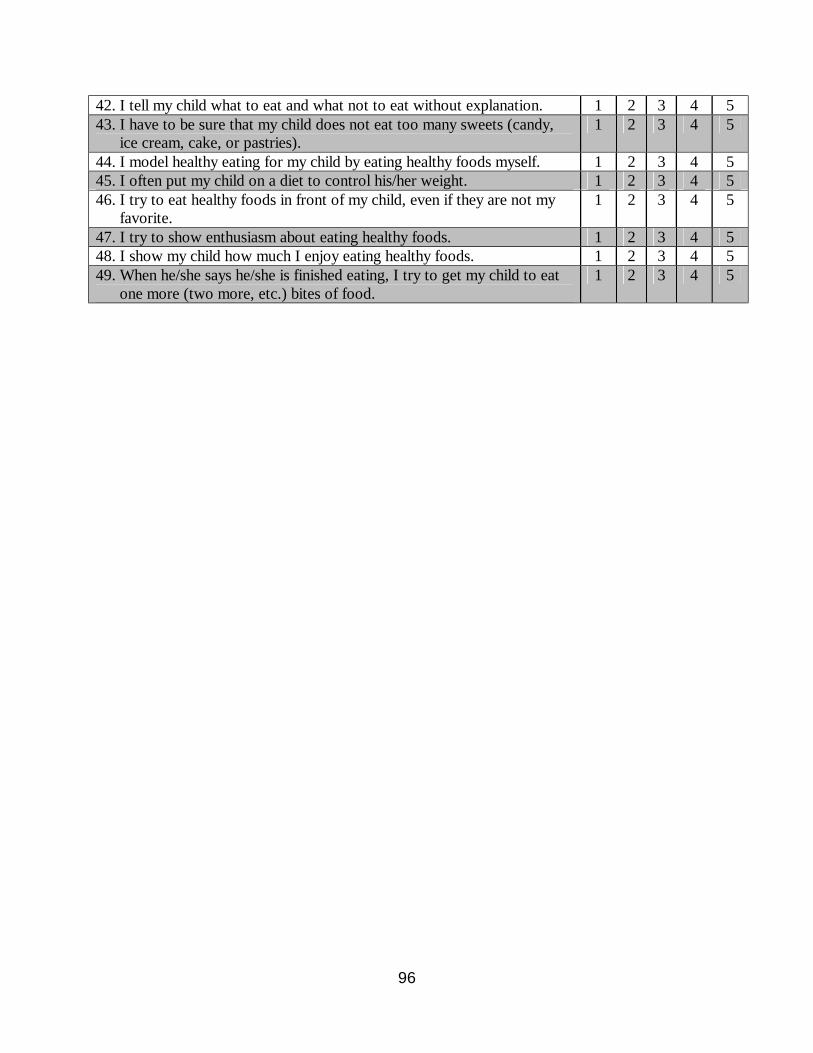
96
42. I tell my child what to eat and what not to eat without explanation. 1 2 3 4 5 43. I have to be sure that my child does not eat too many sweets (candy,
ice cream, cake, or pastries). 1 2 3 4 5
44. I model healthy eating for my child by eating healthy foods myself. 1 2 3 4 5 45. I often put my child on a diet to control his/her weight. 1 2 3 4 5 46. I try to eat healthy foods in front of my child, even if they are not my
favorite. 1 2 3 4 5
47. I try to show enthusiasm about eating healthy foods. 1 2 3 4 5 48. I show my child how much I enjoy eating healthy foods. 1 2 3 4 5 49. When he/she says he/she is finished eating, I try to get my child to eat
one more (two more, etc.) bites of food. 1 2 3 4 5
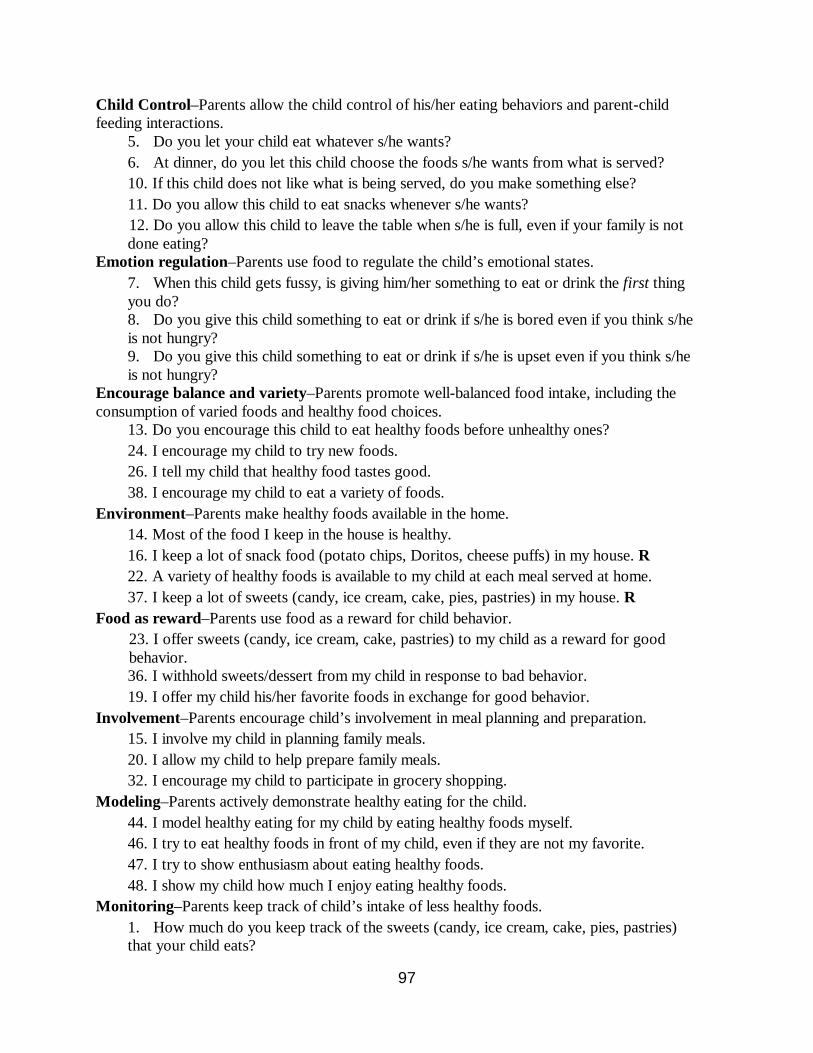
97
Child Control–Parents allow the child control of his/her eating behaviors and parent-child feeding interactions.
5. Do you let your child eat whatever s/he wants? 6. At dinner, do you let this child choose the foods s/he wants from what is served? 10. If this child does not like what is being served, do you make something else? 11. Do you allow this child to eat snacks whenever s/he wants?
12. Do you allow this child to leave the table when s/he is full, even if your family is not done eating?
Emotion regulation–Parents use food to regulate the child’s emotional states. 7. When this child gets fussy, is giving him/her something to eat or drink the first thing you do? 8. Do you give this child something to eat or drink if s/he is bored even if you think s/he is not hungry? 9. Do you give this child something to eat or drink if s/he is upset even if you think s/he is not hungry?
Encourage balance and variety–Parents promote well-balanced food intake, including the consumption of varied foods and healthy food choices.
13. Do you encourage this child to eat healthy foods before unhealthy ones? 24. I encourage my child to try new foods. 26. I tell my child that healthy food tastes good. 38. I encourage my child to eat a variety of foods.
Environment–Parents make healthy foods available in the home. 14. Most of the food I keep in the house is healthy. 16. I keep a lot of snack food (potato chips, Doritos, cheese puffs) in my house. R 22. A variety of healthy foods is available to my child at each meal served at home. 37. I keep a lot of sweets (candy, ice cream, cake, pies, pastries) in my house. R
Food as reward–Parents use food as a reward for child behavior. 23. I offer sweets (candy, ice cream, cake, pastries) to my child as a reward for good behavior. 36. I withhold sweets/dessert from my child in response to bad behavior. 19. I offer my child his/her favorite foods in exchange for good behavior.
Involvement–Parents encourage child’s involvement in meal planning and preparation. 15. I involve my child in planning family meals. 20. I allow my child to help prepare family meals. 32. I encourage my child to participate in grocery shopping.
Modeling–Parents actively demonstrate healthy eating for the child. 44. I model healthy eating for my child by eating healthy foods myself. 46. I try to eat healthy foods in front of my child, even if they are not my favorite. 47. I try to show enthusiasm about eating healthy foods. 48. I show my child how much I enjoy eating healthy foods.
Monitoring–Parents keep track of child’s intake of less healthy foods. 1. How much do you keep track of the sweets (candy, ice cream, cake, pies, pastries) that your child eats?
98
2. How much do you keep track of the snack food (potato chips, Doritos, cheese puffs) that your child eats? 3. How much do you keep track of the high-fat foods that your child eats? 4. How much do you keep track of the sugary drinks (soda/pop, kool-aid) this child drinks?
Pressure–Parents pressure the child to consume more food at meals. 17. My child should always eat all of the food on his/her plate. 30. If my child says, “I’m not hungry,” I try to get him/her to eat anyway. 39. If my child eats only a small helping, I try to get him/her to eat more.
49. When he/she says he/she is finished eating, I try to get my child to eat one more (two more, etc.) bites of food. Restriction for Health–Parents control the child’s food intake with the purpose of limiting less healthy foods and sweets.
21. If I did not guide or regulate my child’s eating, s/he would eat too much of his/her favorite foods. 28. If I did not guide or regulate my child’s eating, he/she would eat too many junk foods. 40. I have to be sure that my child does not eat too much of his/her favorite foods. 43. I have to be sure that my child does not eat too many sweets (candy, ice cream, cake, or pastries).
Restriction for weight control–Parents control the child’s food intake with the purpose of decreasing or maintaining the child’s weight.
18. I have to be sure that my child does not eat too many high-fat foods. 27. I encourage my child to eat less so he/she won’t get fat. 29. I give my child small helpings at meals to control his/her weight.
33. If my child eats more than usual at one meal, I try to restrict his/her eating at the next meal. 34. I restrict the food my child eats that might make him/her fat. 35. There are certain foods my child shouldn’t eat because they will make him/her fat. 41. I don’t allow my child to eat between meals because I don’t want him/her to get fat. 45. I often put my child on a diet to control his/her weight.
Teaching about nutrition–Parents use explicit didactic techniques to encourage the consumption of healthy foods.
25. I discuss with my child why it’s important to eat healthy foods. 31. I discuss with my child the nutritional value of foods. 42. I tell my child what to eat and what not to eat without explanation. R
Note. Factor names are presented with a brief operational definition of the factor content. Item numbers indicate the order in which they were presented in the survey. Items numbered 1-13 utilize a 5-point response scale “never, rarely, sometimes, mostly, always.” Items numbered 14-49 utilize a 5-point scale with different anchors, “disagree, slightly disagree, neutral, slightly agree, agree.” Items marked with an R were reverse coded.

99
1. What is your age:
2. What is your gender?
a. Male
b. Female
3. What is your ethnic background? Please select one:
a. African American
b. Asian American
c. Caucasian
d. Hispanic
e. Na ve Ame r i can
f. Bi-racial
g. Other, Please Specify
4. What is your marital status? Please select one:
a. Married
b. Separated
c. Divorced
d. Widowed
e. Single
f. Living as Married (Cohabita ng)

100
5. Are you employed:
a. Full- me
b. Part- me
c. Not employed
d. Re red
6. What is your household income before taxes in the current year? Please select one:
a. Less than $20,000
b. $20,000 - $39,999
c. $40,000 - $59,999
d. $60,000 - $69,999
e. $70,000 - $79,999
f. $80,000 - $89,999
g. $90,000 - $99,999
h. $100,000 - $119,999
i. $120,000 or more
7. What is the highest level of educa on that you have comp l et ed? Pl ease sel ect one:
a. Some high school
b. High School Diploma or GED
c. Some College
d. Associates Degree or Technical School
e. 4-year College Degree
f. Graduate Degree (MA, MS, PhD., MD, JD)
8. Including yourself, how many total family members live with you?
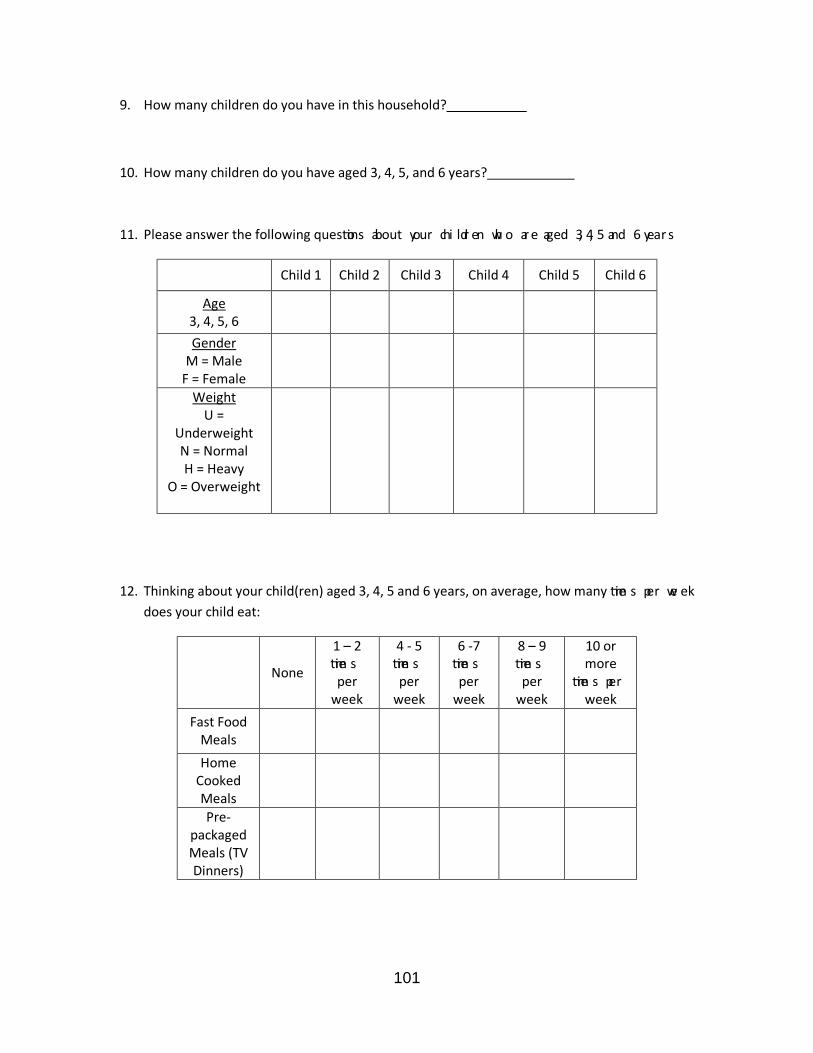
101
9. How many children do you have in this household?
10. How many children do you have aged 3, 4, 5, and 6 years?
11. Please answer the following ques ons about your chi ldr en wh o are aged 3, 4, 5 and 6 year s
Child 1 Child 2 Child 3 Child 4 Child 5 Child 6
Age 3, 4, 5, 6
Gender M = Male F = Female
Weight U =
Underweight N = Normal H = Heavy
O = Overweight
12. Thinking about your child(ren) aged 3, 4, 5 and 6 years, on average, how many me s per we ek does your child eat:
None
1 – 2 me s per week
4 - 5 me s per week
6 -7 me s per week
8 – 9 me s per week
10 or more
me s per week
Fast Food Meals
Home Cooked Meals
Pre-packaged Meals (TV Dinners)
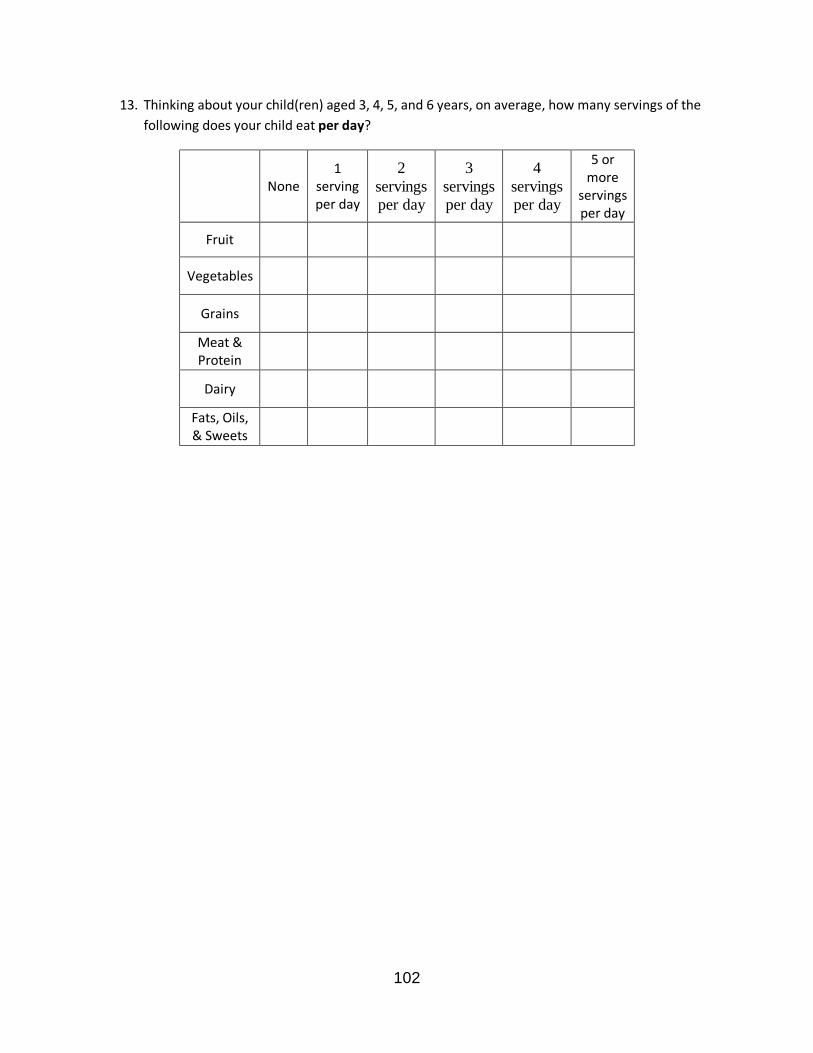
102
13. Thinking about your child(ren) aged 3, 4, 5, and 6 years, on average, how many servings of the following does your child eat per day?
None 1
serving per day
2 servings per day
3 servings per day
4 servings per day
5 or more
servings per day
Fruit
Vegetables
Grains
Meat & Protein
Dairy
Fats, Oils, & Sweets
103
APPENDIX C
INTERVIEW QUESTIONS
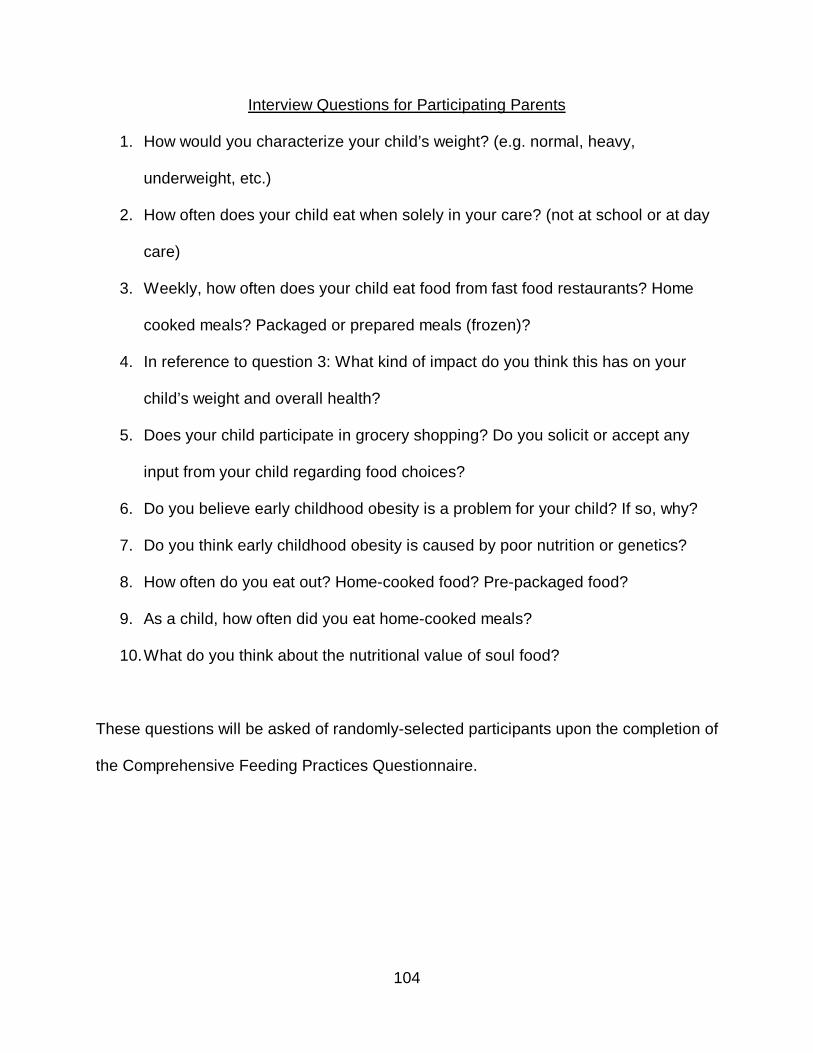
104
Interview Questions for Participating Parents
1. How would you characterize your child’s weight? (e.g. normal, heavy,
underweight, etc.)
2. How often does your child eat when solely in your care? (not at school or at day
care)
3. Weekly, how often does your child eat food from fast food restaurants? Home
cooked meals? Packaged or prepared meals (frozen)?
4. In reference to question 3: What kind of impact do you think this has on your
child’s weight and overall health?
5. Does your child participate in grocery shopping? Do you solicit or accept any
input from your child regarding food choices?
6. Do you believe early childhood obesity is a problem for your child? If so, why?
7. Do you think early childhood obesity is caused by poor nutrition or genetics?
8. How often do you eat out? Home-cooked food? Pre-packaged food?
9. As a child, how often did you eat home-cooked meals?
10. What do you think about the nutritional value of soul food?
These questions will be asked of randomly-selected participants upon the completion of
the Comprehensive Feeding Practices Questionnaire.

105
APPENDIX D
PERMISSION FORMS
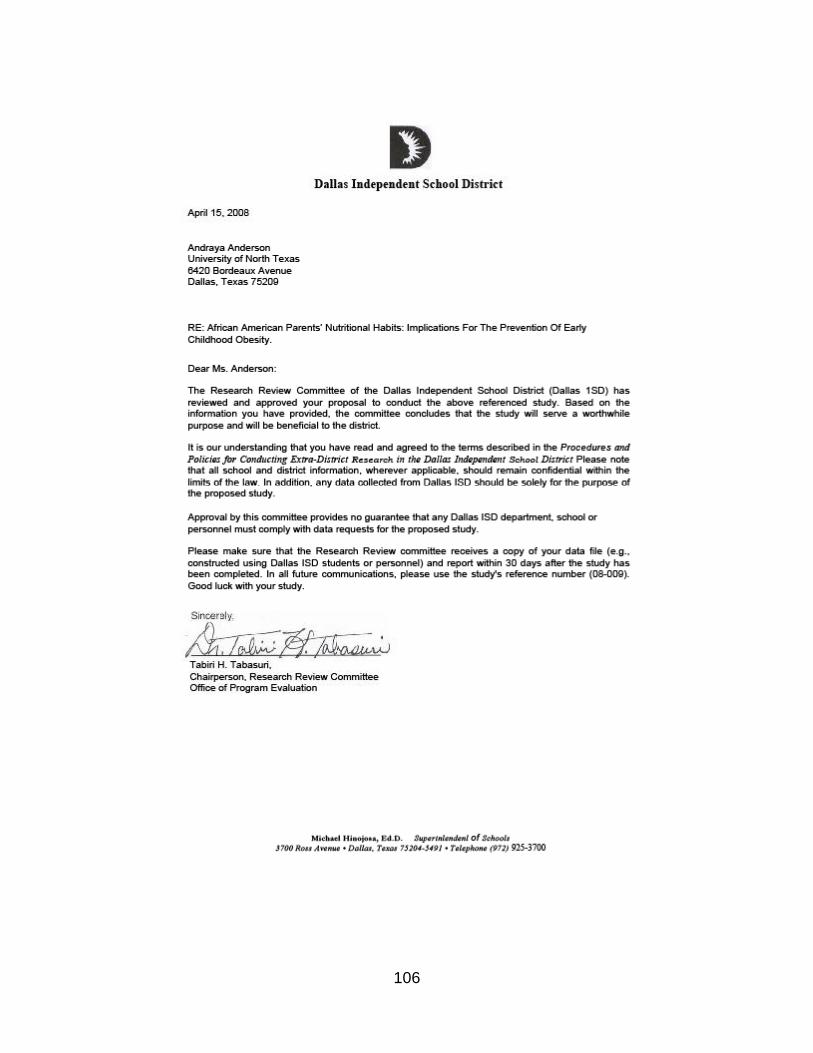
106

107
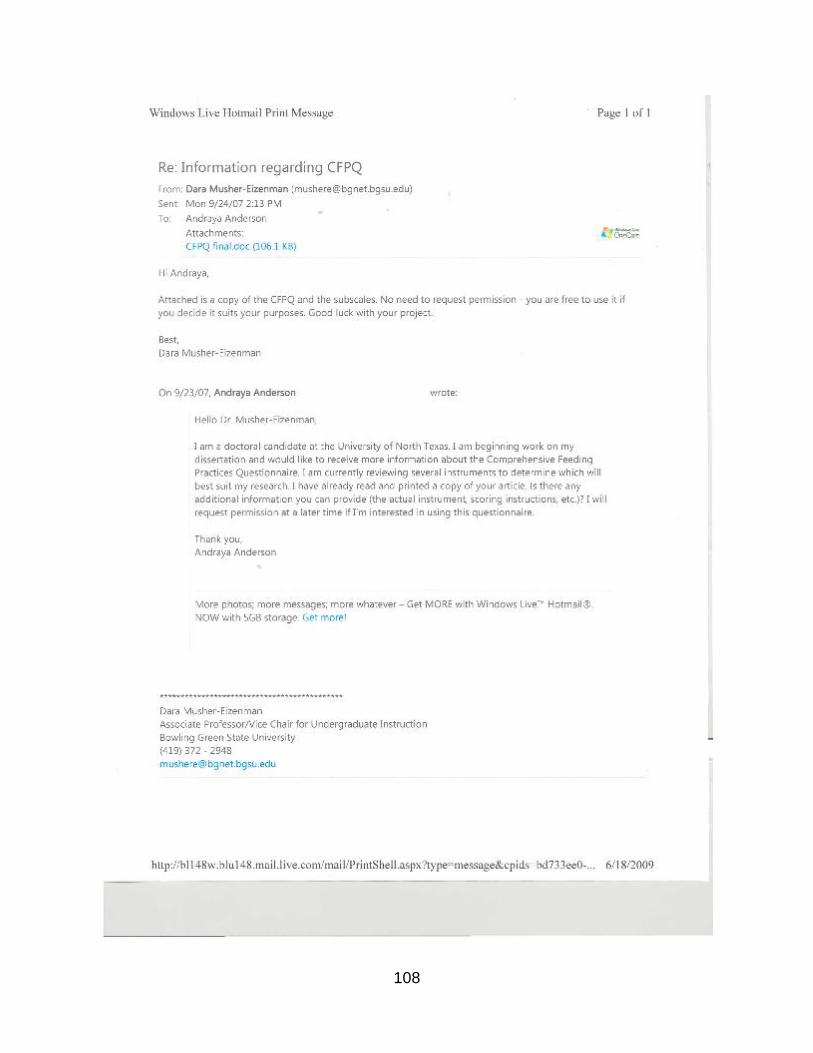
108
109
OXFORD UNIVERSITY PRESS LICENSE TERMS AND CONDITIONS Jun 22, 2009 This is a License Agreement between Andraya D. Anderson ("You") and Oxford University Press ("Oxford University Press") provided by Copyright Clearance Center ("CCC"). The license consists of your order details, the terms and conditions provided by Oxford University Press, and the payment terms and conditions. All payments must be made in full to CCC. For payment instructions, please see information listed at the bottom of this form. License Number 2212570598765 License date Jun 19, 2009 Licensed content publisher Oxford University Press Licensed content publication Journal of Pediatric Psychology Licensed content title Comprehensive Feeding Practices Questionnaire: Validation of a New Measure of Parental Feeding Practices Licensed content author Dara Musher-Eizenman, et. al. Licensed content date September 2007 Type of Use Thesis / Dissertation Institution name University of North Texas Title of your work African-American Parents Nutritional Habits: Implications for the Prevention of Early Childhood Obesity Publisher of your work University of North Texas Expected publication date Aug 2009 Permissions cost 0.00 USD Value added tax 0.00 USD Total 0.00 USD Terms and Conditions STANDARD TERMS AND CONDITIONS FOR REPRODUCTION OF MATERIAL FROM AN OXFORD UNIVERSITY PRESS JOURNAL 1. Use of the material is restricted to your license details specified during the order process. 2. This permission covers the use of the material in the English language in the following territory: world. For permission to translate any material from an Oxford University Press journal into another language, please email [email protected] 3. This permission is limited to the particular use authorized in (1) above and does not allow you to sanction its use elsewhere in any other format other than specified above, nor does it apply to quotations, images, artistic works etc that have been reproduced from other sources which may be part of the material to be used. Rightslink Printable License Page 1 of 3 https://s100.copyright.com/CustomerAdmin/PLF.jsp?lID=2009061_1245427582765 6/22/2009 4. No alteration, omission or addition is made to the material without our written consent. Permission must be re-cleared with Oxford University Press if/when you decide to reprint. 5. The following credit line appears wherever the material is used: author, title, journal, year, volume, issue number, pagination, by permission of Oxford University Press or the
110
sponsoring society if the journal is a society journal. Where a journal is being published on behalf of a learned society, the details of that society must be included in the credit line. 6. For the reproduction of a full article from an Oxford University Press journal for whatever purpose, the corresponding author of the material concerned should be informed of the proposed use. Contact details for the corresponding authors of all Oxford University Press journal contact can be found alongside either the abstract or full text of the article concerned, accessible from www.oxfordjournals.org. Should there be a problem clearing these rights, please contact [email protected] 7. If the credit line or acknowledgement in our publication indicates that any of the figures, images or photos was reproduced, drawn or modified from an earlier source it will be necessary for you to clear this permission with the original publisher as well. If this permission has not been obtained, please note that this material cannot be included in your publication/photocopies. 8. While you may exercise the rights licensed immediately upon issuance of the license at the end of the licensing process for the transaction, provided that you have disclosed complete and accurate details of your proposed use, no license is finally effective unless and until full payment is received from you (either by Oxford University Press or by Copyright Clearance Center (CCC)) as provided in CCC's Billing and Payment terms and conditions. If full payment is not received on a timely basis, then any license preliminarily granted shall be deemed automatically revoked and shall be void as if never granted. Further, in the event that you breach any of these terms and conditions or any of CCC's Billing and Payment terms and conditions, the license is automatically revoked and shall be void as if never granted. Use of materials as described in a revoked license, as well as any use of the materials beyond the scope of an unrevoked license, may constitute copyright infringement and Oxford University Press reserves the right to take any and all action to protect its copyright in the materials. 9. This license is personal to you and may not be sublicensed, assigned or transferred by you to any other person without Oxford University Press's written permission. 10. Oxford University Press reserves all rights not specifically granted in the combination of (i) the license details provided by you and accepted in the course of this licensing transaction, (ii) these terms and conditions and (iii) CCC's Billing and Payment terms and conditions. 11. You hereby indemnify and agree to hold harmless Oxford University Press and CCC, and their respective officers, directors, employs and agents, from and against any and all claims arising our to your use of the licensed material other than as specifically authorized pursuant to this license. Other Terms and Conditions Rightslink Printable License Page 2 of 3 https://s100.copyright.com/CustomerAdmin/PLF.jsp?lID=2009061_1245427582765 6/22/2009 v1.1 Gratis licenses (referencing $0 in the Total field) are free. Please retain this printable license for your reference. No payment is required. If you would like to pay for this license now, please remit this license along with your payment made payable to "COPYRIGHT CLEARANCE CENTER" otherwise you will be invoiced within 30 days of the license date. Payment should be in the form of a check or money order referencing your account number and this license number
111
2212570598765. If you would prefer to pay for this license by credit card, please go to http://www.copyright.com/creditcard to download our credit card payment authorization form. Make Payment To: Copyright Clearance Center Dept 001 P.O. Box 843006 Boston, MA 02284-3006 If you find copyrighted material related to this license will not be used and wish to cancel, please contact us referencing this license number 2212570598765 and noting the reason for cancellation. Questions? [email protected] or +1-877-622-5543 (toll free in the US) or +1-978-646-2777. Rightslink Printable License Page 3 of 3
https://s100.copyright.com/CustomerAdmin/PLF.jsp?lID=2009061_1245427582765 6/22/2009
112
REFERENCES
About BMI for children and teens. (2008). Retrieved September 10, 2008, from
http://www.cdc.gov/nccdphp/dnpa/healthyweight/assessing/bmi/childrens_BMI/ab
out_childrens_BMI.htm
About the Council. (2008). Retrieved August 15, 2008, from
http://www.fitness.gov/home_about.htm
Airhihenbuwa, C., & Kumanyika, S. (1996). Cultural aspects of African American eating
patterns. Ethnicity & Health, 1(3), 245–261.
American Obesity Association. (2003). Childhood obesity: Health risks, diagnosis, and
treatment. Retrieved April 5, 2008, from
http://www.obesity.org/subs/childhood/healthrisks.shtml
Anderson, C., Hughes, S., Fisher, J., & Nicklas, T. (2005). Cross-cultural equivalence of
feeding beliefs and practices: The psychometric properties of the child feeding
questionnaire among Blacks and Hispanics. Preventative Medicine, 41, 521-531.
Ard, J, Skinner, C., Chen, C., Aickin, M., & Svetkey, L. (2005). Informing cancer
prevention strategies for African Americans: The relationship of African American
acculturation to fruit, vegetable, and fat intake. Journal of Behavioral Medicine,
28(3), 239-247.
Basiotis, P., Lino, M., & Anand R. (1998). Report card on the diet quality of African
Americans. Family Economics and Nutrition Review, 11(3), 61-63.
Baughcum, A., Powers, S., Johnson, S., Chamberlin, L., Deeks, C., Jain, A., et al.
(2001). Maternal feeding practices and beliefs and their relationships to
113
overweight in early childhood. Journal of Developmental & Behavioral Pediatrics,
22(6), 391-408.
Birch, L., Fisher, J., Grimm-Thomas, K., Markey, C., Sawyer, R., & Johnson, S. (2001).
Confirmatory factor analysis of the Child Feeding Questionnaire: A measure of
parental attitudes, beliefs and practices about child feeding and obesity
proneness. Appetite, 36, 201-210.
Campbell, K., Crawford, D., & Hesketh, K. (2006). Australian parents’ views on their 5-6
year old children’s food choices. Health Promotion International, 22(1), 11-17.
Carnell, S., Edwards, C., Croker, H., Boniface, D., & Wardle, J. (2005). Parental
perceptions of overweight in 3-5 year olds. International Journal of Obesity, 29,
353-355.
Childhood overweight. (2008). Retrieved August 25, 2008, from
http://www.cdc.gov/nccdphp/dnpa/obesity/childhood/index.htm
Cresswell, J. W. (2003). Research design: Qualitative, quantitative, and mixed methods
approaches. Thousand Oaks, CA: Sage Publications.
Datar, A., & Sturm, R. (2004). Physical education in elementary school and body mass
index: Evidence from the early childhood longitudinal study. American Journal of
Public Health, 94(9), 1501-1505.
Deckelbaum, R., & Williams, C. (2001). Childhood obesity: The health issue. Obesity
Research, 9, 239S-243S.
Dirks, R., & Duran, N. (2001). African American dietary patterns at the beginning of the
20th century. Journal of Nutrition, 131(7), 1881-1889.
114
Ebbeling, C., Pawlak, D., & Ludwig, D. (2002). Childhood obesity: Public health crisis,
common sense cure. The Lancet, 360, 473-482.
Eckstein, K., Mikhail, L., Ariza, A., Thomson, J., Millard, S., & Binns, H. (2006). Parents’
perceptions of their child’s weight and health. Pediatrics, 117(3), 681-690.
Epstein, L., Paluch, R., Roemmich, J., & Beecher, M. (2007). Family-based obesity
treatment, then and now: Twenty-five years of pediatric obesity treatment. Health
Psychology, 26(4), 381-391.
Etelson, D., Brand, D., Patrick, P., & Shirali, A. (2003). Childhood obesity: Do parents
recognize this health risk? Obesity Research, 11(11), 1362-1368.
Faith, M., Scanlon, K., Birch, L., Francis, L., & Sherry, B. (2004). Parent-child feeding
strategies and their relationships to child eating and weight status. Obesity
Research, 12(11), 1711-1722.
Fast food. (n.d.). Dictionary.com Unabridged (v 1.1). Retrieved October 04, 2008, from
Dictionary.com website: http://dictionary.reference.com/browse/fast food
Golan, M., & Crow, S. (2004). Parents are key players in the prevention and treatment
of weight-related problems. Nutrition Reviews, 62(1), 39-50.
Government Accountability Office. (2005). Childhood obesity: Most experts identified
physical activity and the use of best practices as key to successful programs
(GAO-06-127. GAO Reports, 11/7/2005, pp. 1-79). Washington, DC: U.S.
Government Printing Office.
Glaser, B., & Strauss, A. (1967). The discovery of grounded theory: Strategies for
qualitative research. Chicago: Aldine.
115
Haire-Joshu, D., Brownson, R., Nanney, M., Houston, C., Steger-May, K., Schechtman,
K., et al. (2003). Improving dietary behavior in African Americans: The parents as
teachers High 5, low fat program. Preventative Medicine, 36, 684-691.
Hill, J., & Trowbridge, F. (1998). Childhood obesity: Future directions and research
priorities. Pediatrics, 101(3), 570-574.
Hupp, S. (2007, September 28). Schools must start measuring students’ fitness
annually. Retrieved April 5, 2008, from Dallas Morning News
http://www.dallasnews.com/sharedcontent/dws/news/city/richardson/stories/0928
07dnmetfitnessgram.2bd76ee.html
Jain, A., Sherman, S., Chamberlin, l., Carter, Y., Powers, S., & Whitaker, R. (2001).
Why don’t low-income mothers worry about their preschoolers being overweight?
Pediatrics, 107, 1138-1146.
Kimbro, R., Brooks-Gunn, J., & McLanahan, S. (2007). Racial and ethnic differentials in
overweight and obesity among 3-year-old children. American Journal of Public
Health, 97(2), 298-305.
Lamerz, A., Kuepper-Nybelen, J., Wehle, C., Bruning, N., Trost-Brinkhues, G., Brenner,
H., et al. (2005). Social class, parental education, and obesity prevalence in a
study of six-year-old children in Germany. International Journal of Obesity, 29,
373-380.
Lee, E., Murry, V., Brody, G., & Parker, V. (2002). Maternal resources, parenting, and
dietary patterns among rural African American children in single-parent families.
Public Health Nursing, 19(2), 104 -111.
116
Lindsay, A., Sussner, K., Kim, J., & Gortmaker, S. (2006). The role of parents in
preventing childhood obesity. The Future of Children, Childhood Obesity,16(1),
169-186.
Lobstein, T., Baur, L., & Uauy, R. (2004). Obesity in children and young people: A crisis
in public health. Obesity Reviews, 5(Suppl.1), 4-85.
McCaffrey, T., Rennie, K., Wallace, J., & Livingstone, B. ( 2007). Dietary determinants
of childhood obesity: The role of the family. Current Medical Literature:
Pediatrics, 20(4), 89-94.
McGarvey, E., Collie, K., Fraser, G., Shufflebarger, C., Lloyd, B., & Oliver, M. (2006).
Using focus group results to inform preschool childhood obesity prevention
programming. Ethnicity and Health, 11(3), 265-285.
McGarvey, E., Keller, A., Forrester, M., Williams, E., Seward, D., & Suttle, D. (2004).
Feasibility and benefits of a parent-focused preschool child obesity intervention.
American Journal of Public Health (94)9, 1490-1495.
Musher-Eizenman, D., & Holub, S. (2007). Comprehensive feeding practices
questionnaire: Validation of a new measure of parental feeding practices. Journal
of Pediatric Psychology, 32(8), 960-972.
Powers, S., Chamberlin, L., van Schaick, K., Sherman, S., & Whitaker, R. (2006).
Maternal feeding strategies, child eating behaviors, and child BMI in low-income
African-American preschoolers. Obesity, 14(1), 2026-2033.
Puhl , R., & Latner, J. (2007). Stigma, obesity, and the health of the nation’s children.
Psychological Bulletin, 133(4), 557-580.
117
Ritchie, L., Welk, G., Styne, D., Gerstein, D., & Crawford, P. (2005). Family environment
and pediatric overweight: What is a parent to do? Journal of the American
Dietetic Association, 105(Suppl.1), S70-S79.
Salinsky, E. (2006). Effects of food marketing to kids: I’m loving it? National Health
Policy Forum, 814 (1-15).
Santrock, J. (2004). Life-span development (9th ed.). New York: McGraw-Hill.
Schools work to make nutrition fun. (2006). Retrieved June 7, 2008, from
http://weightloss.immunodefence.com/2006/11/schools-work-to-make-
nutrition.html
Schwartz, M., & Puhl, R. (2002). Childhood obesity: A societal problem to solve. Obesity
Reviews, 4, 57-71.
Seth, J., Evans, A., Harris, K., Loyo, J., Ray, T., Spaulding, C., et al. (2007).
Preschooler feeding practices and beliefs, differences among Spanish and
English-speaking WIC clients. Family Community Health, 30(3), 257-270.
Sherry, B., McDivitt, J., Birch, L., Cook, F., Sanders, S., Prish, J., et al. (2004).
Attitudes, practices, and concerns about child feeding and child weight status
among socioeconomically diverse white, Hispanic, and African-American
mothers. Journal of the American Dietetic Association, 104(2), 215-221.
Skelton, J., Busey, S., & Havens, P. (2006). Weight and health status of inner city
African American children: Perceptions of children and their parents. Body
Image, 3, 289-293.
118
Small, L., Anderson, D., & Melnyk, B. (2007). Prevention and early treatment of
overweight and obesity in young children: A critical review and appraisal of the
evidence. Pediatric Nursing, 33(2), 149-162.
Stegelin, D. (2008). Children, teachers, and families working together to prevent
childhood obesity: Intervention strategies. Dimensions of Early Childhood, 36(1),
8-15.
Tibbs, T., Haire-Joshu, D., Schechtman, K., Brownson, R., Nanney, M., Houston, C., et
al. (2001). The relationship between parental modeling, eating patterns, and
dietary intake among African-American parents. Journal of the American Dietetic
Association, 101(5), 535-541.
Vaughn, K., & Waldrop, J. (2007). Parent education key to beating early childhood
obesity. Nurse Practitioner, 32(3), 36-41.
Veugelers, P., & Fitzgerald, A. (2005). Prevalence of and risk factors for childhood
overweight and obesity. Canadian Medical Association Journal, 173(6), 607-613.
Veugelers, P., & Fitzgerald, A. (2005). Effectiveness of school programs in preventing
childhood obesity: A multilevel comparison. American Journal of Public Health,
95(3), 432-435.
Witt, D. (2008). Soul food. Encyclopedia of American Studies. Retrieved April 5, 2008,
from http://eas-ref.press.jhu.edu/search?query=soul+food&x=o&y=o
Young-Hyman, D., Herman, L., Scott, D., & Schlundt, D. (2000). Care giver perception
of children’s obesity-related health risk: A study of African American families.
Obesity Research, 8(3), 241-248.