african economic outlook 2016 - undp.org
TRANSCRIPT

ÉCOLE
SPECIAL THEME:
Sustainable Cities and Structural Transformation
African Economic Outlook 2016
AlgeriaAngolaBeninBotswanaBurkina FasoBurundiCabo VerdeCameroonCentral African RepublicChadComorosCongoCongo, Dem. Rep.Côte d’IvoireDjiboutiEgyptEquatorial GuineaEritreaEthiopiaGabonGambiaGhanaGuineaGuinea-BissauKenyaLesothoLiberiaLibyaMadagascarMalawiMaliMauritaniaMauritiusMoroccoMozambiqueNamibiaNiger NigeriaRwandaSao Tome and PrincipeSenegalSeychellesSierra LeoneSomaliaSouth AfricaSouth SudanSudanSwazilandTanzaniaTogoTunisiaUgandaZambiaZimbabwe
AFRICAN DEVELOPMENT BANK GROUP
E D I T I O NAFRICAN
ECONOMICOUTLOOK

The opinions expressed and arguments employed in this publication are the sole
responsibility of the authors and do not necessarily reflect those of the African
Development Bank, its Boards of Directors or the countries they represent; the OECD, its
Development Centre or their member countries; or the United Nations Development
Programme.
This document and any map included herein are without prejudice to the status of or
sovereignty over any territory, to the delimitation of international frontiers and boundaries
and to the name of any territory, city or area.
ISBN 978-92-64-25646-0 (print)ISBN 978-92-64-25647-7 (PDF)
DOI: http://dx.doi.org/10.1787/aeo-2016-en
Photo credits: Cover design by the Development Centre based on images © Brumarina, Nucleartist, ideyweb, Crystal Home, A7880S, tovovan, quka/Shutterstock.com.
The front cover symbolises the dynamics of tomorrow’s African sustainable cities in an abstract way.
Corrigenda to OECD publications may be found on line at: www.oecd.org/about/publishing/corrigenda.htm.
© African Development Bank, Organisation for Economic Co-operation and Development, United NationsDevelopment Programme (2016)
You can copy, download or print OECD content for your own use, and you can include excerpts from OECD publications, databases and
multimedia products in your own documents, presentations, blogs, websites and teaching materials, provided that suitable
acknowledgement of OECD as source and copyright owner is given. All requests for public or commercial use and translation rights
should be submitted to [email protected]. Requests for permission to photocopy portions of this material for public or commercial use shall
be addressed directly to the Copyright Clearance Center (CCC) at [email protected] or the Centre français d’exploitation du droit de copie
(CFC) at [email protected].

African Economic Outlook2016
SUSTAINABLE CITIES AND STRUCTURAL TRANSFORMATION

3African Economic Outlook© AfDB, OECD, UNDP 2016
Foreword
The African Economic Outlook (AEO) celebrates its 15th edition this year. The African Development Bank, the OECD Development Centre and the United Nations Development Programme partner to produce this annual report. A team of over 100 researchers, economists, statisticians and other experts from Africa and other regions of the world collaborate on the AEO.
The AEO analyses the present state of affairs in Africa, provides two-year forecasts and addresses a special theme, supporting all with extensive data. The five chapters in Part I cover economic and social aspects of the continent and allude to this year’s theme: sustainable cities and structural transformation. Part II’s three chapters concentrate solely on the theme, building on analysis from the African Economic Outlook 2015: Regional Development and Spatial Inclusion. Country notes on each of Africa’s 54 countries constitute Part III; their short version is produced here. For the first time, the statistical annex includes a table on gender, comparing indicators from the three partner organisations.
The African Economic Outlook is available in various editions and formats. For the AEO’s 15th anniversary, the partners have redesigned the website: www.africaneconomicoutlook.org. The site is now easier to navigate and houses past editions, in addition to the following:
• this report in English and French and an abridged version in Portuguese
• the full-length country notes in their original language and accompanying individual tables and figures
• an overview of the report’s chapters with key figures by subregion, in English and French.


5African Economic Outlook© AfDB, OECD, UNDP 2016
Editorial
Africa’s economic performance held firm in 2015, amid global headwinds and regional shocks. Growth in real GDP is estimated at 3.6%, higher than the 3.1% for the global economy and 1.5% for the euro area. Africa remained the world’s second fastest growing economy after East Asia. In 2015, sub-Saharan Africa (excluding South Africa) grew faster than the continental average, at 4.2%, with East Africa leading the way at 6.3%. Growth in Central, North and West Africa was above 3%, while Southern Africa grew by an average of 2.2%. Looking ahead, average growth in Africa is expected to remain moderate at 3.7% in 2016 but could accelerate to 4.5% in 2017. This forecast hinges on the strength of the world economy and a gradual recovery in commodity prices.
In 2015, total external flows to Africa were estimated at USD 208 billion, with remittances remaining the main contributor. Confirming the world’s positive outlook on the continent, African governments have been able to tap into international capital markets through sovereign bond issuances. However, due to global headwinds and some country-specific risks, interest rates inched higher. The global economic environment is affecting African countries differently. Revenues are dropping in resource-rich countries, while oil importers are benefiting from lower inflation as well as less pressure on current accounts. Amid tighter global financial conditions, some countries face large fiscal deficits.
The resilience in Africa’s growth is partly owed to domestic factors, including private consumption, public infrastructure development and private investment. In the medium term, continued improvement in the business environment and fast expanding regional markets may increasingly become new sources of growth for the continent. The rise of intra-regional trade, in particular, illustrates growing opportunities for African producers to diversify their trade. Africa also possesses significant potential for a demographic dividend, spurred by the continent’s young population. However, to benefit from this potential, governments must focus on putting in place and implementing the right policies.
Turning Africa’s steady resilience into better lives for Africans requires strong policy action to promote faster and more inclusive growth. Three out of every four Africans still live under poor human conditions, compared to one in five globally. To achieve the development objectives set by African institutions and the international community, African countries must deepen structural and regulatory reforms, foster macroeconomic stability, and tackle power supply bottlenecks in order to address the obstacles to the transformation of their economies. Coupled with investment in social sectors, this will open up more opportunities for youth and for women.
Africa’s ongoing, multi-faceted urban transition and the densification it produces offer new opportunities for improving economic and social development while protecting the environment. These can be better harnessed to achieve the Sustainable Development Goals (SDGs) – especially SDG 11 on sustainable cities and communities – and the objectives of the African Union’s Agenda 2063. The benefits could accrue to both urban and rural dwellers, provided governments adopt an integrated approach. For instance, connecting urban markets to rural economies could increase productivity of agriculture and raise non-farm incomes. Accelerating investment in urban infrastructure is critical to turn African cities and towns into engines of structural transformation at the local, national and regional levels. In order to seize this “urbanisation dividend”, a number of bold policy reforms are necessary. For example, national urban strategies must be tailored to specific contexts, harness innovative financing instruments, and strengthen ongoing efforts to promote efficient multi-level governance systems.

6 African Economic Outlook © AfDB, OECD, UNDP 2016
In 2016, the emerging common African position on urban development and the international New Urban Agenda provide the opportunity to discuss different options and begin moulding ambitious urbanisation policies into concrete strategies for Africa’s structural transformation.
This edition marks the 15th anniversary of the African Economic Outlook. It is our hope that this report will continue to inform decisions and to stimulate a rich dialogue on the way forward for Africa’s development.
Akinwumi Ayodeji AdesinaPresident,
African Development Bank Group,
Abidjan
Angel GurríaSecretary-General,
Organisation for Economic Co-operation and Development,
Paris
Helen ClarkAdministrator, United Nations
Development Programme, New York
EDitOriAl

7African Economic Outlook© AfDB, OECD, UNDP 20166 African Economic Outlook © AfDB, OECD, UNDP 2016
Acknowledgements
The African Economic Outlook (AEO) was prepared by a consortium of three teams from the African Development Bank (AfDB), the OECD Development Centre and the United Nations Development Programme (UNDP). The Outlook benefited from the overall guidance of Abebe Shimeles (Acting Director, Development Research Department, AfDB), Mario Pezzini (Director, OECD Development Centre) and Ayodele Odusola (Chief Economist and Head of the Strategic Advisory Unit, Regional Bureau for Africa, UNDP). Willi Leibfritz was the Co-ordinator.
The AfDB team was led by Anthony Simpasa. Key team members included Zorobabel T. Bicaba and Adeleke Oluwole Salami. The team at the OECD Development Centre was led by Henri-Bernard Solignac-Lecomte, while the team at UNDP was led by Angela Lusigi.
Part I on Africa’s performance and prospects was drafted by Willi Leibfritz, based on the forecast provided by the AfDB Statistics Department (Chapter 1), Helmut Reisen, Robert Kappel and Birte Pfeiffer (Chapter 2) who also contributed Box 1.1, Mouhamadou Sy, Zorobabel T. Bicaba and Anthony Simpasa (Chapter 3), Angela Lusigi (Chapter 4) and Bakary Traoré, Sébastien Markley, Anissa Bensaïd and Héloïse Daste (Chapter 5). Chapters 2 and 3 benefited from data analysis by Bakary Traoré and Sébastien Markley.
Part II on sustainable cities and structural transformation was drafted by Arthur Minsat with valuable assistance from Thang Nguyen, Héloïse Daste, Paula Misler, Mmachukwu Oyeka, Lennart Ploen, Anissa Bensaïd, Luisa Freitas and Paula Rettl as well as key input from Edgar Pieterse, Susan Parnell and Anton Cartwright (African Centre for Cities).
In collaboration with the partner institutions and under the overall guidance of the AfDB regional directors and lead economists, all AfDB country economists have contributed to the country notes. In most cases, they collaborated with UNDP country economists and/or Development Centre economists. The work on the country notes greatly benefited from the valuable contributions of local consultants in selected countries. The country notes were drafted by the people below.
Country Authors
Algeria Tarik Benbahmed, Hervé Lohoues and Mickaelle Chauvin
Angola Joel Muzima and Glenda Gallardo
Benin Daniel Ndoye, El Hadji Fall and Janvier P. Alofa
Botswana George J. Honde
Burkina Faso Tankien Dayo, Facinet Sylla, Amata Sangho Diabate and Hervé Marie Patrice Kouraogo
Burundi Joel Tokindang and Daniel Gbetnkom
Cabo Verde Adalbert Nshimyumuremyi and Anthony Simpasa
Cameroon Richard Antonin Doffonsou and Corneille Agossou
Central African Republic Kalidou Diallo
Chad Claude N’Kodia and Ali Madaï Boukar
Comoros Alassane Diabate and Attoumane Boina Issa
Congo Nouridine Kane Dia and Ginette Mondongou Camara
Congo, Dem. Rep. Jean Marie Vianney Dabire and Ernest Bamou
Côte d’Ivoire Pascal Yembiline, Idrissa Diagne, El Allassane Baguia and Bakary Traoré
Djibouti Guy Blaise Nkamleu
Egypt Prajesh Bhakta, Assitan Diarra-Thioune and Angus Downie
Equatorial Guinea Dominique Puthod and Domingos Mazivila
Eritrea Nyende Magidu and Luka Jovia Okumu
Ethiopia Admit Wondifraw Zerihun, James Wakiaga and Haile Kibret

8 African Economic Outlook © AfDB, OECD, UNDP 2016
Country Authors
Gabon Dominique Puthod and Celestin Tsassa
Gambia Adalbert Nshimyumuremyi and Yemesrach Assefa Workie
Ghana Eline Okudzeto, Radhika Lal and Kordzo Sedegah
Guinea Olivier Manlan and Mamadou Bobo Sow
Guinea-Bissau Yannis Arvanitis, Francis Jony Andrianarison and Inacio Ie
Kenya Walter Odero, Wilmot Reeves and Julius Chokerah
Lesotho Edirisa Nseera and Asha P. Kannan
Liberia Patrick Hettinger and Janice Olivia James
Libya Kaouther Abderrahim-Ben Salah
Madagascar Simplice Zouhonbi, Tankien Dayo and Adamson Rasolofo
Malawi Peter Mwanakatwe and Alka Bhatia
Mali Becaye Diarra, Abdoulaye Konate and Hamaciré Dicko
Mauritania Marcellin Ndong Ntah, Isiyaka Sabo and Selma Cheikh Malainine
Mauritius Ndoli Kalumiya and Emmanuel Bor
Morocco Vincent Castel
Mozambique Andre Almeida Santos, Luca Monge Roffarello and Manuel Filipe
Namibia Martha Phiri and Fabian Mubiana
Niger Facinet Sylla and Bakary Dosso
Nigeria Barbara Barungi, Ojijo Odhiambo, Robert Asogwa and Alemu Zerihun
Rwanda Edward Batte Sennoga
Sao Tome and Principe Flavio Soares Da Gama and Idrissa Sanoussi
Senegal Toussaint Houeninvo, Khadidiatou Gassama and Souleman Boukar
Seychelles Tilahun Temesgen, Kim Harnack and Jacob Oduor
Sierra Leone Jamal Zayid, Moses Sichei and Milton Korseh-Hindowa
Somalia Richard Walker and Salome Kimani
South Africa Wolassa Lawisso Kumo, Osten Chulu and Arthur Minsat
South Sudan Guy Blaise Nkamleu and Frederick Mugisha
Sudan Suwareh Darbo and Yousif Eltahir
Swaziland Peninah Kariuki and Fatou Leigh
Tanzania Chidozie Emenuga, Rogers Dhliwayo and Prosper Charle
Togo Carpophore Ntagungira, Nicolas Kazadi and Jeanne Bougonou
Tunisia Philippe Trape and Kaouther Abderrahim
Uganda Alexis Rwabizambuga, Vera Kintu Oling, Tony Muhumuza and Simon Peter Nsereko
Zambia Peter Engbo Rasmussen, Colleen Zamba and Elda Chirwa
Zimbabwe Mary Manneko Monyau and Amarakoon Bandara
The committee of peer reviewers of the country notes included Adamon Ndungu, Adeleke Salami, Amadou Boly, Anthony Simpasa, Audrey Chouchane, Bumi Camara, Charlotte Karagueuzian, Cherif Diagne, Dawit Birhanu, El-Haji Mamadou Bah, Emelly Mutambatsere, Eugene Bempong, Gilbert Galibaka, Jacob Oduor, Jacqueline Odula, Jennifer Moyo, John Anyanwu, Kevin Lumbila, Linguere M. Mbaye, Mawuko Kokou Kponnou, Mouhamadou Sy, Philip K. Quarcoo, Qingwei Meng, Sandrine Alissoutin, Thierry Kangoye, Zeke Ger and Zorobabel Bicaba (AfDB); Betty Camara, Elizabeth Asiedu, Sylvain Dessy, Eugenie Maiga, Una Osili, Jean-Michel Salmon, Peter Walkenhorst and Lucia Wegner.
The macroeconomic framework and database used to produce the forecast and statistical annex were managed by Koua Louis Kouakou and Chaouch Anouar at the AfDB. Valuable statistical inputs for updating the database and running the AEO model were provided by Chaouch Anouar, Koffi Dian Adou, Mbiya Kadisha, Soumaila Karambiri, Doffou Marc Elisée Monsoh, Slaheddine Saidi, Stephane Regis Hauhouot, Amel Kchouk, Slim Jerbi and Mustapha Bouzaine in the AfDB Statistics Department, under the guidance of Charles Leyeka Lufumpa, Maurice Mubila, Koua Louis Kouakou and Nirina Letsara.
ACKNOWlEDGEMENtS

9African Economic Outlook© AfDB, OECD, UNDP 20168 African Economic Outlook © AfDB, OECD, UNDP 2016
Bakary Traoré and Sébastien Markley assembled the final dataset for publication at the OECD Development Centre. The project also benefited from the assistance provided by Rhoda Bangurah, Amira Jlassi, Abiana Nelson and Elisabeth Turner.
The report benefited from extremely valuable inputs and comments from a large number of African government representatives, private-sector operators, civil society members, sector specialists in the AfDB country operations departments and field offices, the UNDP Africa Regional Bureau and Country Offices, the Sahel and West Africa Club and the OECD Development Centre, Centre for Tax Policy and Administration, Development Co-operation Directorate, Directorate for Financial and Enterprise Affairs, Public Governance and Territorial Development Directorate, Economics Department, and Trade and Agriculture Directorate.
Part II on sustainable cities and structural transformation drew heavily from the knowledge of international experts invited to the AEO 2016 experts’ meeting in Paris on 8-9 October 2015: Yunzhong Liu (Development Research Center of the State Council [People’s Republic of China]); Deborah Potts (King’s College London); Nathalie Delapalme and Yannick Vuylsteke (Mo Ibrahim Foundation); François Paul Yatta (UCLGA); Javier Sanchez-Reaza and Luc Christiaensen (World Bank); Remi Jedwab (George Washington University); Susan Parnell (Department of Environmental and Geographical Sciences at the University of Cape Town); Serge Allou (Cities Alliance); Jeanette Marie Manjengwa (University of Zimbabwe); Felicity Proctor (Proctor Consulting Ltd.); Nick Godfrey and Russell Bishop (New Climate Economy); Nicolas Ronderos (Consultant); Mariam Yunusa (UN Habitat); Ronald Wall (IHS-Erasmus University Rotterdam / University of the Witwatersrand, Johannesburg); Jean-Fabien Steck (Université Paris Ouest Nanterre); Beacon Mbiba (Oxford Brookes University); Christel Alvergne (UNCDF); Kookie Habtegaber (WWF); Jytte Agergaard (University of Copenhagen); Anthony Bigio (George Washington University); Pierrick Hamon (Global Local Forum); Ambassador Dionisio Pérez-Jácome Friscione (Representation of Mexico to the OECD); Irène Salenson (AFD); Nora Selmet (International Energy Agency); William Tompson (OECD); Vikramdityasing Bissoonauthsing (IRCC) and Wondimu Abeje (Wondimu Consult).
Annex 7.A1 was prepared by Ronald Wall (IHS-Erasmus University, Rotterdam / University of the Witwatersrand, Johannesburg), with assistance by Dorcas Nthoki, Marina Salimgareeva, Monserrat Budding-Polo Ballinas and Taslim Alade (IHS-Erasmus University, Rotterdam). The results of this work form part of UN-Habitat’s forthcoming “State of African Cities Report 2017” developed by Alioune Badiane, Jos Maseland, Katharina Rochell (UN-Habitat) and Ronald Wall, with support from the AfDB and the Department for International Development (DFID).
Rana Roy (Consultant), François Yatta (UCLGA), Ronald Wall (IHS-Erasmus University Rotterdam / University of the Witwatersrand, Johannesburg) and Kookie Habtegaber (WWF) contributed internal research papers. The WWF paper was drafted by Kookie Habtegaber with input from: Laurent Some, Nigel Dudley, Aurélie Shapiro, Pablo Izquierdo, Lars Erik Mangset, Stefano Esposito, Kiran Rajashekariah, Nyambe Nyambe, Denis Landenbergue, Rod Taylor, Stuart Oor, Alexis Morgan, Valerie Burgener and Tabaré A. Currás (WWF), Julia Pierini (BirdLife Zimbabwe), David Satterthwaite (International Institute for Environment and Development), Shlomo (Solly) Angel (Marron Institute of Urban Management, NYU), Stern Nathan Karres (The Nature Conservancy) and Mark Swilling (Stellenbosch University).
Essential contributions to the thematic chapters were also made by José Tonato and Clotilde Baï (AfDB); Marco Kamyia, Oyebanji Oyeyinka, Eduardo López Moreno, Regina Orvananos, Mariam Yunusa and Gulelat Kebede (UN-Habitat); Edlam Abera Yemeru, Semia Guermas Tapia and Sandra Zawedde (UNECA); William Cobbett, Rene Peter
ACKNOWlEDGEMENtS

10 African Economic Outlook © AfDB, OECD, UNDP 2016
Hohmann, Laura Lima and Julian Baskin (Cities Alliance); Christel Alvergne (UNCDF); Nathalie Le Denmat and Charlotte Lafitte (UCLG); Stefanos Fotiou, José Pineda and Nicola da Schio (UNEP); Thierry Giordano (FAO); Irène Salenson and Marie Bjornson-Langen (Agence Française de Développement); John E. Fernandez and Phebe Dudek (MIT); David Albrecht (Consultant); David Ménascé (HEC); David Simon (Mistra Urban Futures); Shlomo (Solly) Angel, Paul Romer, Patrick Lamson-Hall, Brandon Fuller and Alex Blei (NYU Stern Urbanization Project); Remi Jedwab (George Washington University); Mark Swilling (Stellenbosch University); Vanessa Watson (African Centre for Cities, University of Cape Town); Skye Dobson (Shack/Slum Dwellers International (SDI); Sogen Moodley (Municipal Institute of Learning, Ethekwini Municipality); Yitbarek Mengiste (Ministry of Urban Development, Housing and Construction of Ethiopia); Fantu Cheru (Stockholm International Peace Research Institute); Charlie Martial Ngounou (Afroleadership); Graeme Harrison (Oxford Economics); Nora Selmet (IEA) as well as Philipp Heinrigs, Thomas Allen, Rachel Scott, Hugh Macleman, William Tompson, Rudiger Ahrend, Tadashi Matsumoto, Kwame Frimpong, Antonella Noya, Alexander Pick, Alessandra Heinemann, Caroline Tassot, Keiko Nowacka, Gaëlle Ferrant and Annelise Thim (OECD). Amadou Boly and Nadège Désirée Yaméogo (AfDB) provided valuable comments. Finally, the chapters benefited from the guidance of Carl Dahlman and Nicola Harrington-Buhay (OECD).
The dedication of the editing, translation and proof-reading team was essential to the timely production of this report. Jill Gaston managed the editorial process with Vanda Legrandgérard, while Delphine Grandrieux oversaw the production of the publication in both paper and electronic forms with Louise Schets. Aida Buendía and Pykha were responsible for the design and layout of the report. Anne-Lise Prigent offered editorial advice.
Additional financial support to this 2016 edition by Germany (GIZ), Ireland (Delegation of Ireland to the OECD), Italy (Delegation of Italy to the OECD), Portugal (Camões - Instituto da Cooperacão e da Lingua, I.P.) and Switzerland (SDC) is gratefully acknowledged.
ACKNOWlEDGEMENtS

11African Economic Outlook© AfDB, OECD, UNDP 201610 African Economic Outlook © AfDB, OECD, UNDP 2016
Table of contents
Executive summary .........................................................................................................................................................................19
PART I: AFRIcA’s PERFoRmAncE And PRosPEcTs .................................................................................................21
Chapter 1. Africa’s macroeconomic prospects ...............................................................................................................23In brief ................................................................................................................................................................................................24Africa’s growth slowed but is expected to strengthen again .........................................................................24Domestic demand and improved supply conditions support growth against global headwinds ......................................................................................................................................................29Growth remains highest in East Africa ........................................................................................................................32International commodity prices have declined further ...................................................................................35Monetary policy stances diverge as countries face different inflationary and currency pressures ......................................................................................................................................................... 37Fiscal positions and current accounts have deteriorated in many countries .....................................38Will Africa reap a demographic growth dividend from its young population? ..................................41Annex 1.A1. Africa’s potential demographic dividend .......................................................................................44Notes ...................................................................................................................................................................................................48References .......................................................................................................................................................................................49
Chapter 2. External financial flows and tax revenues for Africa......................................................................51In brief ................................................................................................................................................................................................52Africa depends heavily on foreign private and public capital .......................................................................52Africa faces volatile FDI inflows .......................................................................................................................................54Portfolio equity flows are down, but new bonds remain resilient ..............................................................58Bank credit flows slow as repayments grow ............................................................................................................60Remittances are a major, stable resource for African development ..........................................................63Official development assistance remains stable but falls short of official pledges .........................65Domestic revenues fall as resource revenues tumble .......................................................................................69Sustainable benefit is needed from financial flows and public revenues .............................................72Note .....................................................................................................................................................................................................74References .......................................................................................................................................................................................75
Chapter 3. Trade policies and regional integration in Africa ..............................................................................77In brief ................................................................................................................................................................................................78Africa looks to turn strong growth into economic transformation ...........................................................78Regional integration is an aid to income convergence .....................................................................................81Integrated financial markets open a path to accelerated income convergence.................................85Intra-African investment is rising, driven by increased regional integration ....................................88Increased trade finance can help integration and job creation ....................................................................88References .......................................................................................................................................................................................89
Chapter 4. Human development in Africa ........................................................................................................................91In brief ................................................................................................................................................................................................92Human development in Africa has made strong gains, but remains uneven .....................................92Sustainable cities and structural transformation are a priority for human development in Africa ............................................................................................................................... 102Sustainable urbanisation must address inequality and exclusion .......................................................... 104Notes ................................................................................................................................................................................................ 112References .................................................................................................................................................................................... 113

12 African Economic Outlook © AfDB, OECD, UNDP 2016
Chapter 5. Political and economic governance in Africa ..................................................................................... 115In brief ............................................................................................................................................................................................. 116Key governance challenges in Africa are a growing demand for public services, the threats of terrorism and internal conflicts ................................................................................................... 116Several African countries are innovating to meet the growing demand for public services 122Improvements in the business environment require time and must complementstructural reforms to bear fruit ..................................................................................................................................... 129Fighting terrorism requires better regional co-ordination and information sharing ................ 132Several African countries have seen their electoral processes become fairer ................................134Note .................................................................................................................................................................................................. 138References .................................................................................................................................................................................... 139
PART II: susTAInAblE cITIEs And sTRucTuRAl TRAnsFoRmATIon ................................................. 143
Chapter 6. The implications of Africa’s urbanisation for structural transformation ....................... 145In brief ........................................................................................................................................................................................... 146The links between urbanisation and structural transformation in Africa are complex and varied ................................................................................................................................. 146Urbanisation represents challenges for development and the environment ................................... 162Policies should focus on productive jobs and public goods for the growing urban population ................................................................................................................................................................... 170Now is the time to prepare for Africa’s urban transition ............................................................................... 177Annex 6.A1. Methodology for the cluster analysis on urbanisationand structural transformation in African countries ........................................................................................ 181Notes ................................................................................................................................................................................................ 183References ....................................................................................................................................................................................184
Chapter 7. How sustainable cities can contribute to Africa’s development ........................................... 191In brief ........................................................................................................................................................................................... 192Urbanisation improves the conditions for Africa’s economic development...................................... 192Urbanisation can help accelerate social development ................................................................................... 209Africa’s urbanisation can contribute to environmental development ................................................. 218Annex 7.A1. Methodology for mapping financial flows to African cities ........................................... 227Notes ................................................................................................................................................................................................ 228References .................................................................................................................................................................................... 229
Chapter 8. national urban strategies for sustainable cities in Africa ......................................................... 235In brief ........................................................................................................................................................................................... 236New strategies can promote sustainable cities for Africa’s structural transformation ........... 236Priorities include land reform, infrastructure and urban networks ......................................................241Multi-level governance can promote urban development strategies ................................................... 249African governments can use various sources to finance national urban strategies .................254Note .................................................................................................................................................................................................. 264References .................................................................................................................................................................................... 265
PART III: counTRy noTEs ..................................................................................................................................................... 267
sTATIsTIcAl AnnEX .................................................................................................................................................................. 327
tABlE OF CONtENtS

13African Economic Outlook© AfDB, OECD, UNDP 201612 African Economic Outlook © AfDB, OECD, UNDP 2016
Figures
1.1. Africa’s economic growth, 2003-17 ........................................................................................................................25 1.2. Assessment of Africa’s economic situation and six-month expectations, 2000 Q1–2016 Q1 .................................................................................................................................................................25 1.3. Contribution to global growth, 1991-2015, by areas (%) ............................................................................28 1.4. Impact of China’s transition to lower and more balanced growth on growth in sub-Saharan Africa (SSA) .......................................................................................................................................28 1.5. Oil prices and terms of trade of Africa’s main oil exporters, 2001-17 .............................................29 1.6. Number of available hotel rooms in Africa, 2011-15 ...................................................................................31 1.7. Commodity prices, January 1999-January 2016 ............................................................................................36 1.8. Export prices of agricultural products, January 1999-January 2016 ................................................36 1.9. Import prices of basic foodstuffs, January 1999-January 2016 .............................................................37 1.10. Consumer price inflation in Africa, 2003-17 ....................................................................................................38 1.11. Current account balance in Africa’s oil-exporting and oil-importing countries, 2003-17 ........................................................................................................................................................... 40 1.12. Changes in current account and government budget balances in African countries between 2014 and 2015, in percentage points of GDP ............................................................................... 41 1.13. Africa’s potential demographic dividend ..........................................................................................................42 1.A1.1. Potential demographic dividend in Africa by region..................................................................................46 1.A1.2. Development and prospects of total fertility (children per woman) in Africa ..........................46 1.A1.3. Total fertility rate (TFR) per woman and under-5 mortality rate per 1 000 in African countries, 2014 ............................................................................................................47 2.1. External financial flows to Africa, average 2004-08, 2009-16 .............................................................. 52 2.2. Inward FDI by regions 2004-16, USD billion .....................................................................................................55 2.3. Foreign direct investment to Africa: Resource-rich vs. non-resource-rich countries, 2000-16 .....................................................................................................................................................................................56 2.4. Total FDI inflows into Africa from emerging economies, 2003-15, USD billion ........................57 2.5. Africa’s inward and outward portfolio flows, 2004–16, USD billion .................................................58 2.6. Change in debt service cost, sub-Saharan Africa, 2015 ............................................................................60 2.7. Net commercial bank credit flows to Africa, 2004-17, USD billion ...................................................61 2.8. Multilateral and bilateral official bank credit flows to Africa, 2004-17, USD billion ..............62 2.9. Africa’s short-term debt, % of total external debt, 2004-14 ....................................................................63 2.10. Remittances per African subregion, 2004-15 ...................................................................................................65 2.11. Net official development assistance disbursements to Africa, 1997-2016 ..................................... 65 2.12. Net official development assistance disbursements to African countries by income group, 2004-16.............................................................................................................................................67 2.13. Net official development assistance disbursements to African countries by region, 2004-16 .............................................................................................................................................................67 2.14. China’s external assistance expenditures, USD billion ...........................................................................69 2.15. The revenue mix in resource-rich vs. non-resource-rich Africa ........................................................70 3.1. Africa’s total trade flows, trade with selected partners and intra-African trade (USD billion), 2000-14 ...............................................................................................79 3.2. Distribution of Africa’s trade: Traditional versus emerging partners, 2000-14 .........................79 3.3. Intra-African trade by regional economic communities (USD million) .........................................80 3.4. Gross domestic product per capita of selected African countries relative to the regional leading economy (USD), 2011 ................................................................................................82 3.5. Economic diversification in selected African regional economic communities ......................84 3.6. Financial integration in different regional economic communities, 1970-2011 ......................85
tABlE OF CONtENtS

14 African Economic Outlook © AfDB, OECD, UNDP 2016
tABlE OF CONtENtS
3.7. Financial account openness in Africa’s regional economic communities, 1970-2013 ..........86 4.1. Average annual change in human development, 1990-2014 .................................................................92 4.2. Human development dimensions ..........................................................................................................................93 4.3. Change in human development in Africa by category, 1990-2014 .....................................................93 4.4. Share of Africa’s population by level of human development, 2015 and 2030 ...........................95 4.5. Human development index and components by region of Africa .....................................................96 4.6. Overall loss in human development from inequality by region .........................................................98 4.7. Inequality in the dimensions of human development by group in Africa ...................................98 4.8. Gender Inequality Index and components by group in Africa .............................................................99 4.9. Gender gaps in social institutions by human development group in Africa ........................... 101 5.1. Top priorities for African citizens ....................................................................................................................... 117 5.2. Index of public protests in Africa, 1996-2015 ............................................................................................... 119 5.3. Top drivers of public protests in Africa, 2013-15 ........................................................................................ 119 5.4. Political hardening and civil violence, 1996-2015 ...................................................................................... 121 5.5. Violence by non-state actors in Africa, by type, 2013-15 ...................................................................... 122 5.6. Government expense per capita vs. government expense as % of GDP, 2014 ......................... 123 5.7. Public sector management vs. tax-GDP ratio ............................................................................................... 124 5.8. Hiring based on merit and qualifications vs. efficiency in public revenue spending ........ 124 5.9. Out-of-pocket expenditures on healthcare and total health spending in Rwanda, 1995-2013 ............................................................................................................................................................................. 127 5.10. Doing Business scores and GDP per capita, 2015 ........................................................................................... 130 5.11. Change in Doing Business score and GDP per capita between 2010 and 2014 ............................ 130 5.12. Net perception rating for policies regarding reliable electric supply by country, 2014-15 ................................................................................................................................................................................... 131 6.1. Growth trends in Africa’s urban, rural and total population, 1950-2050 .................................. 146 6.2. Global urban population growth, year 100 to 2050 .................................................................................. 147 6.3. Definitions of urban across 54 African countries ..................................................................................... 148 6.4. Global urbanisation levels and GDP per capita in selected countries, 2014 .............................. 150 6.5. Annualised labour productivity growth and urbanisation in Africa, Asia and Latin America, 1960-2010 .................................................................................................................... 151 6.6. Traditional and new patterns of transformation between sectors and type of employment .................................................................................................................................................... 152 6.7. Change in employment in trade services and agriculture in 13 African countries, 2000-10 ........................................................................................................................... 152 6.8. Change in labour productivity and share of employment in trade services in 11 African countries, 2000-10 ........................................................................................................................... 153 6.9. Urban growth rates for selected African countries and Asia, 1960-2010 ................................... 154 6.10. Urban dependency ratios in selected developing regions.................................................................... 155 6.11. Urbanisation levels and total fertility rate by typology of African countries ......................... 157 6.12. Population increase in North and sub-Saharan Africa, and in Latin America and the Caribbean, 1950-2050 ................................................................................................................................ 158 6.13. Contribution to population growth by city size and rural-urban interface by type of African country, 2000-10 ...................................................................................................................................... 159 6.14. Urban farming in big cities and small towns among African countries, 2009-14 ..................161 6.15. Are urbanisation trends sustainable in your country? Africans’ responses ........................... 162 6.16. Urbanisation levels and share of informal work in total employment in six African countries and 26 non-African countries, 2010 ............................................................ 163 6.17. Type of work by size of African city and country typology (%), 2009-14 .................................... 164 6.18. Urban Multidimensional Poverty Index by world region and AEO 2016 typology group ........... 165

15African Economic Outlook© AfDB, OECD, UNDP 201614 African Economic Outlook © AfDB, OECD, UNDP 2016
tABlE OF CONtENtS
6.19. Self-evaluation of current personal economic conditions by African urban respondents ....................................................................................................................................................... 166 6.20. Africans saying “Crime is a very big problem in our country”, 2015 ............................................. 167 6.21. Operating revenue and capital expenditure per capita in selected African capitals and intermediary cities .............................................................................................................................................. 172 6.22. African cities’ expansion of built-up areas and population growth, 1990-2000 .....................174 6.23. Projections of urban land cover for Africa, 2000-50 ................................................................................. 175 6.24. Is urbanisation perceived as a risk or an opportunity in your country? ................................... 179 7.1. Change in urbanisation levels and urban share of total food expenditures for major food groups in six West African countries, 1990-2009 .................................................... 193 7.2. Composition of the West African food basket by food groups and area, 2010 ........................194 7.3. Urban share of jobs in each post-farm food segment in six African countries...................... 195 7.4. Labour productivity in different segments of the agri-food system in six African countries .............................................................................................................................................. 196 7.5. Travel time and crop production in sub-Saharan Africa, 2000 ......................................................... 197 7.6. Population size of big cities and level of economic complexity, 2013 ........................................... 199 7.7. Change in employment and output of business services as a share of the total economy of selected African countries, 2000-10 ............................................................. 203 7.8. Service trade in Africa, 2000-12 ............................................................................................................................204 7.9. Share of middle class by income in Africa (%), 2008 ............................................................................... 205 7.10. Main opportunities associated with the middle class for African countries ..........................206 7.11. Education level of the population aged 15 years or older in Africa, 2009-10 ............................ 207 7.12. Annual mean concentration of particulate matter smaller than ten microns in diameter (PM10) in selected African cities .............................................................................................. 210 7.13. Average travel time to nearest urban areas and skewness of the distribution in Africa, 2010 ................................................................................................................................................................... 213 7.14. Projected electricity demand from the sub-Saharan African population gaining access to electricity, 2020-40 .................................................................................................................................. 220 7.15. African populations relying on solid biomass for cooking, 2012 .....................................................222 7.16. Access to improved water in urban areas and urban population growth in Africa, 1990-2015....................................................................................................................................................... 223 8.1. Prevalence of strategies on sustainable energy use in Africa, 2015 .............................................. 246 8.2. Local authorities’ revenues and spending as share of African national budgets, 2013 .... 255 8.3. Experts’ ratings of local government revenue sources, by revenue potential and stability in primary and secondary cities ............................................................................................ 256 8.4. Revenues from transfers and locally generated resources, selected cities in Africa, Colombia and the Philippines ........................................................................................................ 258 8.5. Examples of the City Prosperity Index for six African cities .............................................................. 264

16 African Economic Outlook © AfDB, OECD, UNDP 2016
tABlE OF CONtENtS
Tables
1.1. Shares of selected trade partners in Africa’s exports and imports, 2000 and 2014 (%) ......28 1.2. Sectoral changes in Africa’s fast-growing countries, 2009-14 ..............................................................32 1.3. Africa’s growth by region, 2014-17 .........................................................................................................................33 1.4. Debt sustainability analysis in African countries: Assessing risks of debt distress .............39 1.5. Macroeconomic developments in Africa, 2007-17 ........................................................................................43 1.A1.1. Estimates and projections of Africa’s population and working-age population .......................45 1.A1.2. Estimates and projections of Africa’s potential demographic dividend .......................................45 2.1. Financial flows and tax revenues to Africa, 2004-16, current USD billion ...................................53 2.2. Funding commitments by origin, USD billion ................................................................................................61 2.3. The 15 largest recipients of remittances in Africa, 2015 ..........................................................................64 2.4. Africa’s country programmable aid estimates and projections, USD billion .............................68 3.1. Comparison of the richest country in a regional economic community (REC) with regional figures .......................................................................................................................................................83 3.2. Intra-regional trade in Africa’s regional economic communities as a percentage of total trade .........................................................................................................................................................................83 4.1. African countries by level of human development .....................................................................................94 4.2. Urbanisation by level of human development in Africa ....................................................................... 105 4.3. Inequality and urbanisation by level of human development in Africa ..................................... 105 5.1. Top ten countries in the world since 2011 according to Doing Business, by year .................... 129 5.2. Overview of national elections in 2016 and 2017 in Africa ................................................................. 137 6.1. Employment sectors of household heads by sex in Ghana, 2000-10 ............................................. 153 6.2. Pace of urbanisation trends in selected African countries, 1980-2012 ........................................ 162 6.3. Premature deaths from selected major risk factors in Africa, 1990-2010 (five-year intervals) and 2013 ................................................................................................................................. 168 6.4. Economic costs of premature deaths from selected major risk factors in Africa (USD million), 2013 ................................................................................................................................... 169 6.5. Pan-African and international events on sustainable urbanisation and structural transformation, 2014-18 ........................................................................................................... 179 6.A1.1. African countries clustered into groups according to their levels of structural transformation .................................................................................................................................. 182 7.1. Examples of instruments for cluster policies in developing countries ...................................... 201 7.2. Mass transportation systems in selected African cities ....................................................................... 211 7.3. Main corridors in Africa ............................................................................................................................................. 213 7.4. Urban activities that can reduce cities’ environmental impact ....................................................... 218 7.5. Classification of African cities based on socio-metabolic transition ........................................... 219 7.6. Sustainable energy projects in Cape Town, South Africa .................................................................... 221 7.7. Typology of ecosystem services from wetlands ......................................................................................... 224 7.8. Sustainable waste management projects in Africa .................................................................................. 225 8.1. Urbanisation strategies in 16 African countries ........................................................................................ 238 8.2. New technologies for urban governance and data collection ........................................................... 240 8.3. Different urban functions of intermediary cities ...................................................................................... 248 8.4. Specialised financial institutions in African countries ........................................................................ 257 8.5. Land-based financing initiatives in Africa .................................................................................................... 259 8.6. ReCalc scenario replacing fossil-fuel subsidies with investments in renewable energy for 24 African cities ....................................................................................................... 262

17African Economic Outlook© AfDB, OECD, UNDP 201616 African Economic Outlook © AfDB, OECD, UNDP 2016
tABlE OF CONtENtS
Annex tables
1. Basic indicators, 2015 ................................................................................................................................................... 336 2. Real GDP growth rates, 2007-17 ............................................................................................................................. 338 3. Demand composition and growth rate, 2014-17 .........................................................................................340 4. Public finances, 2014-17 (percentage of GDP) ...............................................................................................342 5. Monetary indicators, 2014-17 ..................................................................................................................................344 6. Balance of payments indicators, 2014-17 .......................................................................................................346 7. Exports, 2014 ....................................................................................................................................................................349 8. Diversification and competitiveness, 2010-14 ............................................................................................ 352 9. International prices of exports, 2008-15 .......................................................................................................... 355 10. Foreign direct investment, 2009-14 (USD million)..................................................................................... 356 11. Aid flows, 2009-14 (USD million) .......................................................................................................................... 358 12. External debt indicators ...........................................................................................................................................360 13. Demographic indicators ............................................................................................................................................. 362 14. Poverty and income distribution indicators .................................................................................................364 15. Access to services ..........................................................................................................................................................366 16. Basic health indicators ................................................................................................................................................368 17. Major diseases .................................................................................................................................................................. 370 18. Basic education indicators ........................................................................................................................................ 372 19. School enrolment ............................................................................................................................................................374 20. Employment and remittances ................................................................................................................................ 376 21. Corruption Perceptions Index (CPI) .................................................................................................................... 378 22. Public protest ....................................................................................................................................................................380 23. Violence by non-state actors ................................................................................................................................... 382 24. Political hardening .........................................................................................................................................................384 25. Demographic projections (all populations are in thousands) ...........................................................386 26. Gender indicators ...........................................................................................................................................................388
maps
5.1. Intensity of protests in Africa by location, 2015 6.1. Population settlements and urban catchment areas in West Africa, 2000 6.2. African coastal cities affected by climate change 6.3. Current and future urban areas, forest cover and deforestation in Africa 6.4. Accra’s urban expansion (Ghana), 1991-2014 6.5. Algiers’ urban expansion (Algeria), 1987-2014 6.6. Arusha’s urban expansion (Tanzania), 1988-2013 6.7. Nakuru’s urban expansion (Kenya), 1989-2014 7.1. Network of the top 50 foreign direct investments in Africa’s manufacturing cities, 2003-14 7.2. Services network of top 50 investments from top 10 source cities to top 10 African destination cities, 2003-14 7.3. Africa’s city regions attracting hi-tech foreign direct investment at four levels, 2003-14 7.4. Current and future urban areas in relation to watersheds in Africa 8.1. Egypt resource flows: Water 8.2. Cairo resource flows: Water 8.3. Recent and projected urban expansion of Hawassa (Ethiopia), 1989-2010, 1989-2040

18 African Economic Outlook © AfDB, OECD, UNDP 2016

19African Economic Outlook© AfDB, OECD, UNDP 201618 African Economic Outlook © AfDB, OECD, UNDP 2016
Executive summary
The African Economic Outlook 2016 shows that the continent is performing well in regard to economic, social and governance issues and has encouraging prospects for the near future. With its special theme on sustainable cities and structural transformation, this edition looks closely at Africa’s distinctive pathways towards urbanisation and at how this is increasingly shifting economic resources towards more productive activities.
Africa’s economic growth remained resilient in 2015 amid a weak global economy, lower commodity prices and adverse weather conditions in some parts of the continent. Real GDP grew by an average of 3.6% in 2015, higher than the global average growth of 3.1% and more than double that of the euro area. At this growth rate, Africa remained the second fastest growing economy in the world (after emerging Asia), and several African countries were among the world’s fastest growing countries. We forecast that Africa’s economic growth will gradually pick up during 2016/17, predicated on a recovery in the world economy and a gradual rise in commodity prices. However, given the vulnerable global economy and the high volatility of commodity prices, this forecast is uncertain.
Domestic factors have underpinned Africa’s resilience, allowing countries to better cope with the global headwinds. On the supply side, in countries where weather conditions were favourable, agriculture boosted growth, but droughts or floods slowed down growth in countries in East and Southern Africa. In resource-rich countries, growth slowed down as lower commodity prices strained government budgets and affected investment. Manufacturing activity improved in a few countries but was limited by persistent power shortages. On the demand side, private consumption and construction investment remained the main drivers of growth, reflecting relative insulation from external shocks. However, weak global demand curtailed growth of Africa’s exports, especially minerals and oil, and terrorist attacks and general security problems in some countries adversely affected tourism.
Given the increased budgetary pressures in most African countries, keeping debt at sustainable levels has become increasingly important. Governments generally continued to adhere to prudent fiscal policies, limiting spending and improving tax collection. The rapid depreciation in exchange rates and weakening current accounts fuelled a rise in imported inflation. This prompted affected countries to tighten monetary policy to cool down inflationary pressures. Some countries benefited from declining inflation due to lower energy prices. This created additional room for monetary easing through a reduction in interest rates to spur growth.
In 2015, net financial flows to Africa were estimated at USD 208 billion, 1.8% lower than in 2014. Official development assistance rose, but stability in remittances continued to be the main contributing source of Africa’s net financial flows. Sovereign bond issuances rose despite higher interest rates, reflecting general resource starvation among issuing countries. However, direct foreign investment in the oil and metals sectors dropped, as the extractive sector was buffeted by falling commodity prices. Net portfolio equity and commercial bank credit flows dried up, reflecting tight global liquidity conditions and faltering market sentiment. In the wake of slowing growth in large emerging economies, bilateral trade credit suffered as well. Public policies should now aim to stabilise current financing sources and explore new ones, to support infrastructure, training and employment.
Africa’s growth performance over the past 15 years has created new opportunities for trade. The European Union is likely to continue to be Africa’s main trading partner; however the Tripartite Free Trade Agreement proposed between three of Africa’s

20 African Economic Outlook © AfDB, OECD, UNDP 2016
EXECUtiVE SUMMArY
largest trade blocs could increase market size, translating into economic benefits. The agreement could narrow income gaps in African countries and help regions integrate financially, provided that governments strengthen structural and regulatory reforms and foster macroeconomic stability. Governments will also need to give pan-African banks a larger role in financing trade, boost capital market liquidity and attract new financial sources to finance intra-regional trade.
African countries have steadily progressed in enlarging people’s choices in education and health and in improving living standards, but the pace is insufficient. Progress is hampered by inequality between countries, within countries, and between women and men. It is held back by lack of opportunities for the youth, weak structural transformation, especially in sectors dominated by the marginalised groups (including agriculture and informal sectors), and weak investments in gender equality and women empowerment programmes beyond the political sphere. Human progress for rapidly expanding and increasingly mobile populations remains a considerable challenge as espoused in Agendas 2030 and 2063.
Africa’s urbanisation contributes to human development gains but not for everyone. Thus, addressing growing urban poverty should be an integral part of new urbanisation strategies. Underlying tensions between social groups as a result of economic, political and social exclusion can be overcome by ensuring that citizens have secure livelihoods and access to quality services. It also depends on governments enhancing security, promoting human rights and protecting the most vulnerable in society. This will become paramount as African citizens strengthen their demands for better economic opportunities and for more accountable and credible institutions. These demands require an adequate response through sound regulatory policies and effective delivery of public services. Several countries have set good examples that are laying the foundation for reaching developmental goals, including a successful political transition in Burkina Faso in 2015, a Nobel Peace Prize for the Tunisian national dialogue quartet, and successful reforms to health systems in a few other countries.
Africa’s rapid urbanisation represents an immense opportunity, not just for Africa’s urban dwellers but also for rural development. As two-thirds of the investments in urban infrastructure to 2050 have yet to be made, the scope is large for new, wide-ranging urban policies to turn African cities and towns into engines of sustainable structural transformation. The creation of more productive jobs for the rapidly growing urban population is central to achieving this objective. Those new urban policies, at national and local levels, have a key role to play in i) economic development, through higher agricultural productivity, industrialisation and services; ii) social development, targeting safer and inclusive urban housing and robust social safety nets; and iii) sound environmental management, by addressing effects of climate change, scarcity of water and other natural resources, controlling air pollution, developing clean public transportation systems, improved waste collection and increased access to energy. They include stepping up investment in urban infrastructure; improving connectivity with rural areas; matching formal real estate markets better with the housing demand; managing urban land expansion; and developing public mass transport systems within and between cities. The new policies will have to be adapted to the specificities of Africa’s urban realities, tap innovative ways of financing the development of sustainable cities and be implemented through effective multi-level governance systems. In 2016, the common African position on urban development and the emerging international New Urban Agenda offer opportunities to discuss options and start articulating those new urbanisation policies around strategies for Africa’s structural transformation.
20 African Economic Outlook © AfDB, OECD, UNDP 2016
PART I
Africa’s performance and prospects


23African Economic Outlook© AfDB, OECD, UNDP 2016
This chapter looks at macroeconomic conditions in the different
regions and countries of Africa, as well as in the continent as a
whole. It highlights how weaker oil and commodity prices, uncertain
global conditions and domestic political uncertainties are affecting
many African economies and explores how their governments are
responding to these challenges. It examines Africa’s recent economic
growth and prospects for 2016 and 2017 and important driving
forces on the demand and the supply side, as well as headwinds
from adverse developments in terms of trade, which also affect
fiscal positions and current accounts.
Chapter 1
Africa’s macroeconomic prospects

1. AFriCA’S MACrOECONOMiC PrOSPECtS
24 African Economic Outlook © AfDB, OECD, UNDP 2016
In brief
Africa achieved impressive economic growth over the past 15 years with the average gross real domestic product (GDP) rising from just above 2% during the 1980-90s to above 5% in 2001-14. In the past two years, growth has been more moderate; this trend is expected to continue in 2016, but strengthen in 2017. Africa’s growth is adversely affected by headwinds from weaknesses in the global economy and price falls of key commodities, but is supported by domestic demand, improved supply conditions, prudent macroeconomic management and favourable external financial flows. The AEO forecast assumes a gradual strengthening of the world economy and the slow recovery of commodity prices. However, given the fragile state of economic recovery and the high volatility of commodity prices this forecast is uncertain.
Growth remained highest in East Africa, followed by West Africa and Central Africa, and is lowest in Southern Africa and North Africa. Assuming gradual improvement in international and domestic conditions, growth is projected to accelerate in all regions in 2016/17. In West Africa, the Ebola epidemic has abated with Guinea, Liberia and Sierra Leone recovering gradually.
Monetary policy stances diverged as countries faced different inflationary and currency pressures. Monetary policy tightened in countries where current accounts and exchange rates came under pressure and imported inflation increased, however some countries reduced interest rates as inflation declined due to lower energy and food prices. As fiscal pressures intensified governments generally followed prudent fiscal policies. Measures were taken to limit spending and broaden the revenue base.
Africa’s growth slowed but is expected to strengthen again
Africa has achieved impressive economic growth over the past 15 years. Average growth of real gross domestic product (GDP) more than doubled from just above 2% during the 1980s and 1990s to above 5% between 2001 and 2014. In the past two years, growth has been more moderate with Africa’s economies affected by headwinds from the global economy. Average growth of African economies weakened slightly in 2015 to 3.6% (down from 3.7% in 2014), about one percentage point lower than expected in the AEO 2015. Excluding Libya, where oil production remained volatile, Africa’s overall growth reached 3.7% in 2015, down from 4.2% in 2014. The AEO macroeconomic outlook for Africa’s economy assumes a gradual strengthening of the world economy and a slow recovery of commodity prices. Against this international backdrop Africa’s average economic growth is expected to remain moderate in 2016 (3.7%), but strengthen in 2017 (to 4.5%) (Figure 1.1). However, the given the fragile state of the global economic recovery and the high volatility of commodity prices this forecast in uncertain.
The main reasons for the slowdown in growth in 2015 were weaker global demand and lower international commodity prices, which adversely affected Africa’s resource-rich countries. Growth of global real GDP and world trade volumes was more than one percentage point lower than assumed in the AEO 2015. The AEO forecast for 2015 was also based on the assumption that international oil prices would remain on average around 40% lower than in 2014, however prices were almost 50% lower. Metal prices, notably the price of copper and export prices for some agricultural products, such as cotton, were also lower than assumed.
Africa’s growth remained higher than world growth despite strong headwinds from the international economy. Growth was also much higher than in the Latin America and the Caribbean region, where GDP declined slightly due mainly to deep recessions in Brazil and Venezuela. Despite its slowdown, the African continent remained the second fastest-growing economy in the world. Several African countries (Côte d’Ivoire, Djibouti, Ethiopia, Mozambique, Rwanda and Tanzania) were among the fastest-growing countries in the world with growth between 6% and around 10%.

1. AFriCA’S MACrOECONOMiC PrOSPECtS1. AFriCA’S MACrOECONOMiC PrOSPECtS
25African Economic Outlook© AfDB, OECD, UNDP 201624 African Economic Outlook © AfDB, OECD, UNDP 2016
Figure 1.1. Africa’s economic growth, 2003-17
2003 2004 2005 2006 2007 2008 2009 2010 2011 2012 2013 2014 2015 (e) 2016 (p) 2017 (p)0
1
2
3
4
5
6
7
8
Africa excluding LibyaAfrica
%
Note: (e) estimates; (p) projections.Source: Statistics Department, African Development Bank.12 http://dx.doi.org/10.1787/888933349936
In emerging and developing Asia – the fastest-growing region in the world – growth declined from 6.8% in 2014 to 6.5% in 2015. In the People’s Republic of China, the largest economy in the region, growth continued to decline to below 7% from 7.7% in 2013 and 7.3% in 2014. China’s weaker growth and its transition from investment and exports of industrial goods towards consumption and services is an important factor in the recent drop in commodity prices, which suggests that the “commodity super cycle” of the past decade has come to an end. While lower commodity prices are providing significant headwinds to Africa’s commodity exporters, the rebalancing of China’s economy towards more consumption may provide backwinds to Africa’s economies in the coming years. African countries best placed to export consumer goods to China, including agricultural products, are those that will benefit most from China’s switch to more consumption-based growth. China’s rising wages may also erode its competitiveness in low-end manufactures and could further increase FDI inflows to Africa (see Box 1.1).
Figure 1.2. Assessment of Africa’s economic situation and six-month expectations, 2000 Q1–2016 Q1
2001 2002 2003 2004 2005 2006 2007 2008 2009 2010 2011 2012 2013 2014 2015 2016
Good/better
By the end of the next six months
At present
Satisfactory/about the same
Bad/worse
Note: Qualitative assessments by participants of the quarterly survey to questions on the present situation of the economy and expectations for the next six months.Source: Ifo institute World Economic Survey (2016). 12 http://dx.doi.org/10.1787/888933349941
The weakening of Africa’s growth is also reflected in an opinion poll conducted among African participants in the Ifo Institute’s World Economic Survey.1 In the second half of 2015, both the assessment of the current economic situation and expectations

1. AFriCA’S MACrOECONOMiC PrOSPECtS
26 African Economic Outlook © AfDB, OECD, UNDP 2016
for the next six months deteriorated, which – as becomes now obvious from official statistics – reflected the weakening of growth. At the beginning of 2016 these indicators had not yet improved, most probably due to the adverse effects from the still fragile world economy and further declining commodity prices (Figure 1.2).
Box 1.1. How China’s lower and more balanced growth will affect Africa
The slowing of output growth in major emerging economies has been associated with lower commodity prices. Next to supply factors, the marked decline in investment and (rebalanced) growth in China is depressing commodity prices, particularly in metals and energy. Three key factors have underpinned Africa’s good economic performance since the turn of the century: high commodity prices, high external financial flows, and improved policies and institutions. Macroeconomic headwinds for Africa’s net commodity exporters may imply that Africa’s second pillar of past performance – external financial inflows – will suffer as well.
While lower commodity prices are providing significant headwinds to Africa’s commodity exporters, the rebalancing of China may also provide backwinds, albeit gradually. The relocation of low-end manufacturing from China might reinforce positive income effects of lower commodity prices in oil-importing countries. The backwinds can be expected to stimulate FDI inflows into Africa. Benefits from reduced fiscal pressures in countries with high fuel shares in imports (Egypt, Ethiopia, Kenya, Mozambique and Tanzania) mirror significant challenges for energy exporters (Angola, Chad, Congo, Gabon and Nigeria) and other commodity exporters (Ghana, South Africa and Zambia) arising from depressed commodity prices.
Lower commodity prices could shift Africa’s centre of economic gravity from west to east, towards less commodity-dependent economies (Schaffnit-Chatterjee and Burgess, 2015). Investment finance could follow, reinforced by the peripheral outreach of China’s One Belt One Road initiative (OBOR), which includes East Africa for infrastructure finance. China’s new Silk Road Fund is targeting the economies along Africa’s east coast. This suggests a shift away from a traditional focus on securing natural resources towards a more exploratory focus on opportunities for a manufacturing hub in the African region.
China’s slowdown could affect African development finance through several channels:
• Growth linkage: the slowdown lowers global growth in general and low-income country growth in particular, especially for commodity exporters.
• Trade: the slowdown translates into reduced African export earnings and lower corporate savings and trade credits.
• Prices: the negative income effect in commodity-exporting countries of lower terms of trade associated with lower metal and mineral prices reduces household, corporate and public savings.
• Liquidity supply: lower official foreign-exchange reserves and sovereign-wealth fund assets may translate into lower credit supply to Africa.
China’s high growth has boosted global growth in recent years (Figure 1.3). From 2011 to 2015, China’s relative contribution to global growth was on a par with advanced countries, despite stagnating at a high level for a decade. India’s contribution to global growth has also risen since the early 2000s. However, China has contributed almost 30% to global growth in recent years, approximately 20 percentage points more than India. As India is more closed and still considerably poorer than China, it cannot yet offset the impact of China’s slowdown on global growth and trade.
A recent World Bank (2015) study uses a general equilibrium model to quantify how lower and more balanced growth in China might affect Africa’s future growth (Figure 1.4). The model simulated the effects of a slowdown, a rebalancing and the combined effect of both.
The combined effect of China’s lower growth and its rebalancing on sub-Saharan Africa is positive, as the positive effect from the more balanced growth outweighs the negative effect
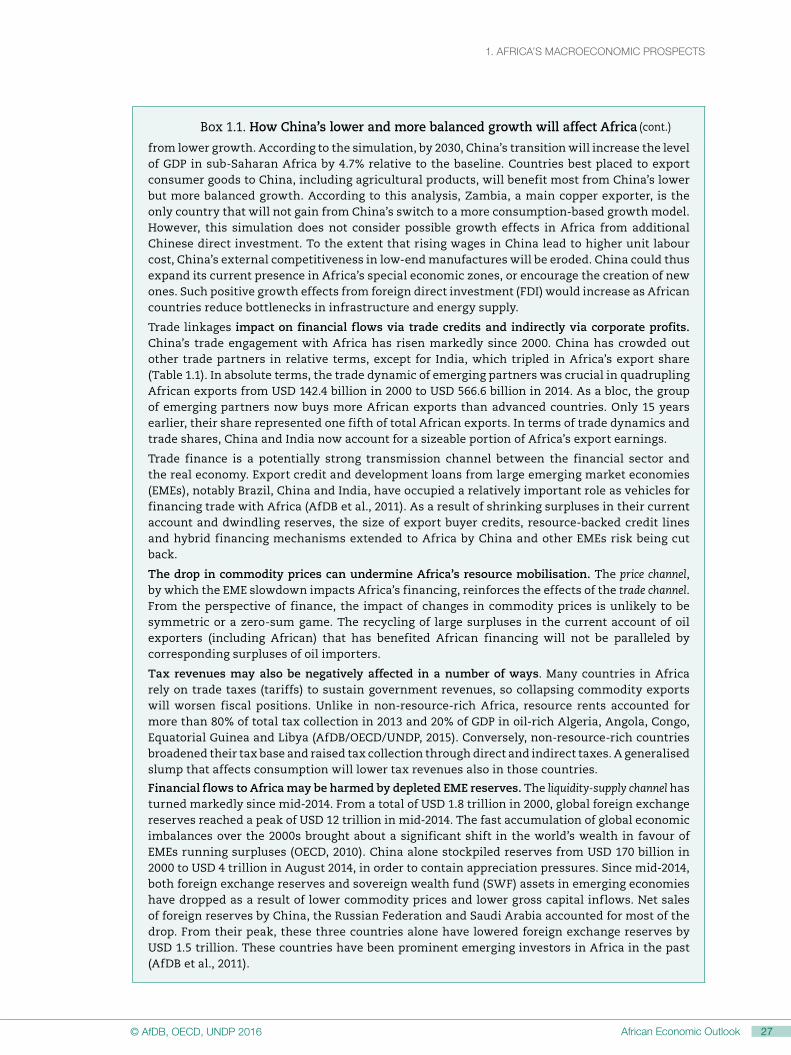
1. AFriCA’S MACrOECONOMiC PrOSPECtS1. AFriCA’S MACrOECONOMiC PrOSPECtS
27African Economic Outlook© AfDB, OECD, UNDP 201626 African Economic Outlook © AfDB, OECD, UNDP 2016
Box 1.1. How China’s lower and more balanced growth will affect Africa
from lower growth. According to the simulation, by 2030, China’s transition will increase the level of GDP in sub-Saharan Africa by 4.7% relative to the baseline. Countries best placed to export consumer goods to China, including agricultural products, will benefit most from China’s lower but more balanced growth. According to this analysis, Zambia, a main copper exporter, is the only country that will not gain from China’s switch to a more consumption-based growth model. However, this simulation does not consider possible growth effects in Africa from additional Chinese direct investment. To the extent that rising wages in China lead to higher unit labour cost, China’s external competitiveness in low-end manufactures will be eroded. China could thus expand its current presence in Africa’s special economic zones, or encourage the creation of new ones. Such positive growth effects from foreign direct investment (FDI) would increase as African countries reduce bottlenecks in infrastructure and energy supply.
Trade linkages impact on financial flows via trade credits and indirectly via corporate profits. China’s trade engagement with Africa has risen markedly since 2000. China has crowded out other trade partners in relative terms, except for India, which tripled in Africa’s export share (Table 1.1). In absolute terms, the trade dynamic of emerging partners was crucial in quadrupling African exports from USD 142.4 billion in 2000 to USD 566.6 billion in 2014. As a bloc, the group of emerging partners now buys more African exports than advanced countries. Only 15 years earlier, their share represented one fifth of total African exports. In terms of trade dynamics and trade shares, China and India now account for a sizeable portion of Africa’s export earnings.
Trade finance is a potentially strong transmission channel between the financial sector and the real economy. Export credit and development loans from large emerging market economies (EMEs), notably Brazil, China and India, have occupied a relatively important role as vehicles for financing trade with Africa (AfDB et al., 2011). As a result of shrinking surpluses in their current account and dwindling reserves, the size of export buyer credits, resource-backed credit lines and hybrid financing mechanisms extended to Africa by China and other EMEs risk being cut back.
The drop in commodity prices can undermine Africa’s resource mobilisation. The price channel, by which the EME slowdown impacts Africa’s financing, reinforces the effects of the trade channel. From the perspective of finance, the impact of changes in commodity prices is unlikely to be symmetric or a zero-sum game. The recycling of large surpluses in the current account of oil exporters (including African) that has benefited African financing will not be paralleled by corresponding surpluses of oil importers.
Tax revenues may also be negatively affected in a number of ways. Many countries in Africa rely on trade taxes (tariffs) to sustain government revenues, so collapsing commodity exports will worsen fiscal positions. Unlike in non-resource-rich Africa, resource rents accounted for more than 80% of total tax collection in 2013 and 20% of GDP in oil-rich Algeria, Angola, Congo, Equatorial Guinea and Libya (AfDB/OECD/UNDP, 2015). Conversely, non-resource-rich countries broadened their tax base and raised tax collection through direct and indirect taxes. A generalised slump that affects consumption will lower tax revenues also in those countries.
Financial flows to Africa may be harmed by depleted EME reserves. The liquidity-supply channel has turned markedly since mid-2014. From a total of USD 1.8 trillion in 2000, global foreign exchange reserves reached a peak of USD 12 trillion in mid-2014. The fast accumulation of global economic imbalances over the 2000s brought about a significant shift in the world’s wealth in favour of EMEs running surpluses (OECD, 2010). China alone stockpiled reserves from USD 170 billion in 2000 to USD 4 trillion in August 2014, in order to contain appreciation pressures. Since mid-2014, both foreign exchange reserves and sovereign wealth fund (SWF) assets in emerging economies have dropped as a result of lower commodity prices and lower gross capital inflows. Net sales of foreign reserves by China, the Russian Federation and Saudi Arabia accounted for most of the drop. From their peak, these three countries alone have lowered foreign exchange reserves by USD 1.5 trillion. These countries have been prominent emerging investors in Africa in the past (AfDB et al., 2011).
(cont.)
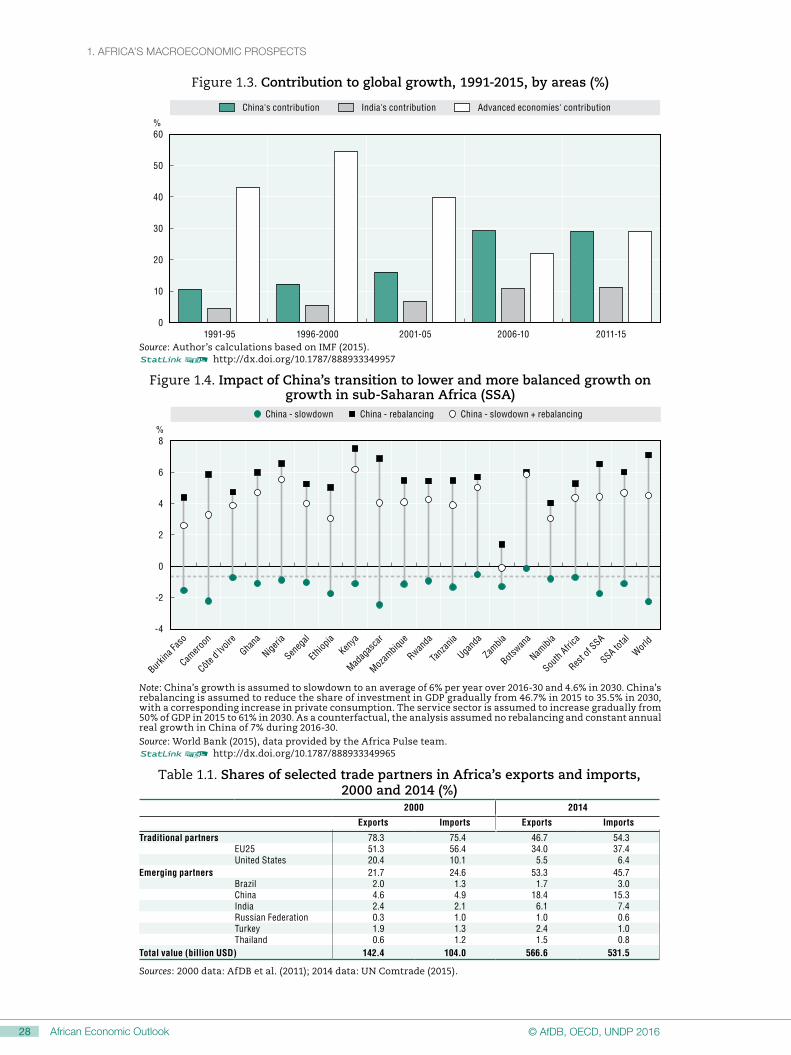
1. AFriCA’S MACrOECONOMiC PrOSPECtS
28 African Economic Outlook © AfDB, OECD, UNDP 2016
Figure 1.3. Contribution to global growth, 1991-2015, by areas (%)
%
0
10
20
30
40
50
60
1991-95 1996-2000 2001-05 2006-10 2011-15
China's contribution India's contribution Advanced economies' contribution
Source: Author’s calculations based on IMF (2015). 12 http://dx.doi.org/10.1787/888933349957
Figure 1.4. Impact of China’s transition to lower and more balanced growth on growth in sub-Saharan Africa (SSA)
%
-4
-2
0
2
4
6
8
China - rebalancingChina - slowdown China - slowdown + rebalancing
Burkin
a Fas
o
Camero
on
Côte d'
Ivoire
Seneg
al
Ethiop
ia
Madag
asca
r
Mozam
bique
Rwanda
Tanz
ania
Ugand
a
Zambia
Botswan
a
Namibi
a
South
Africa
Rest o
f SSA
SSA total
Ghana
Nigeria
Kenya
World
Note: China’s growth is assumed to slowdown to an average of 6% per year over 2016-30 and 4.6% in 2030. China’s rebalancing is assumed to reduce the share of investment in GDP gradually from 46.7% in 2015 to 35.5% in 2030, with a corresponding increase in private consumption. The service sector is assumed to increase gradually from 50% of GDP in 2015 to 61% in 2030. As a counterfactual, the analysis assumed no rebalancing and constant annual real growth in China of 7% during 2016-30.Source: World Bank (2015), data provided by the Africa Pulse team.12 http://dx.doi.org/10.1787/888933349965
Table 1.1. Shares of selected trade partners in Africa’s exports and imports, 2000 and 2014 (%)
2000 2014
Exports Imports Exports Imports
Traditional partners 78.3 75.4 46.7 54.3EU25 51.3 56.4 34.0 37.4United States 20.4 10.1 5.5 6.4
Emerging partners 21.7 24.6 53.3 45.7Brazil 2.0 1.3 1.7 3.0China 4.6 4.9 18.4 15.3India 2.4 2.1 6.1 7.4Russian Federation 0.3 1.0 1.0 0.6Turkey 1.9 1.3 2.4 1.0Thailand 0.6 1.2 1.5 0.8
Total value (billion USD) 142.4 104.0 566.6 531.5
Sources: 2000 data: AfDB et al. (2011); 2014 data: UN Comtrade (2015).

1. AFriCA’S MACrOECONOMiC PrOSPECtS1. AFriCA’S MACrOECONOMiC PrOSPECtS
29African Economic Outlook© AfDB, OECD, UNDP 201628 African Economic Outlook © AfDB, OECD, UNDP 2016
domestic demand and improved supply conditions support growth against global headwinds
In 2015, on the demand side, private consumption continued to support growth, helped by lower oil and food prices and growing remittances (see Chapter 2 for details on external financial flows). Construction investment, both public and private, also remained an important driver of growth. In contrast, exports remained mostly sluggish and often declined due to weak global demand. Thus, Africa’s growth was again supported by domestic factors, which helped to cope with headwinds from the global economy. Given Africa’s vulnerability to external shocks, promotion of regional trade and integration has assumed even greater importance (see Chapter 3).
The recent fall in export prices relative to import prices has led to terms of trade losses, which reduce the purchasing power of domestic output and adversely affect profits and investment. Assuming an average oil price of USD 37 per barrel in 2016 and USD 48 per barrel in 2017, the terms of trade of Africa’s main oil exporters will again be lower in 2016 than in 2015, and will only improve in 2017 (Figure 1.5). However, given the recent volatility of oil and other commodity prices, assumptions about their future development and thus the terms of trade prospects for oil-exporting and other commodity-exporting countries are highly uncertain, with the risks probably weighted more towards the downside.
The recent commodity bust again highlighted the vulnerability of economies that depend on a few commodities, with many governments in resource-rich countries now increasing their efforts to diversify. Lower exchange rates should also help to improve the international competitiveness of other sectors.
Figure 1.5. Oil prices and terms of trade of Africa’s main oil exporters, 2001-17
%
-60
-50
-40
-30
-20
-10
0
10
20
30
40
50
2001 2002 2003 2004 2005 2006 2007 2008 2009 2010 2011 2012 2013 2014 2015 (e) 2016 (p) 2017 (p)
Terms of trade changes of main African oil exportersOil price changes in %
Note: (e) estimates; (p) projections.Source: Author’s calculations.
12 http://dx.doi.org/10.1787/888933349979
Box 1.2. Africa’s terms of trade
Africa’s terms of trade (i.e. the ratio of export prices to import prices) have improved markedly over the past decade. This improvement was driven mainly by development in resource-rich countries, which benefited from the international commodity price boom fuelled by the global economic recovery and high and resource-intensive growth in China. Africa’s average (GDP-weighted) terms of trade reached a peak in 2008, rising 65% from its level in 2000. This positive trend was interrupted by the severe global recession in 2009, when commodity prices plummeted. After commodity prices recovered, Africa’s terms of trade reached a second peak in 2012,

1. AFriCA’S MACrOECONOMiC PrOSPECtS
30 African Economic Outlook © AfDB, OECD, UNDP 2016
Box 1.2. Africa’s terms of trade
over 80% higher than in 2000. In 2014 and 2015, oil and other commodity prices plummeted once more. Earlier terms of trade gains were partially lost, although Africa’s average terms of trade level remained around 50% higher than in 2000 (according to AEO estimates).
Terms of trade changes differ significantly between individual countries. Given their high dependence on oil and non-oil commodities, Africa’s resource-rich countries are particularly affected by the boom and bust of international commodity prices. At the same time, oil-importing countries suffered from the earlier boom in oil prices and now benefit from the lower prices. However, resource-rich countries have to cope with highly volatile terms of trade. This is most notable for the terms of trade of Africa’s main oil exporting countries, which are highly correlated with the development of oil prices (Figure 1.5). Measuring the volatility of terms of trade changes reveals very high volatility in oil-exporting countries such as Algeria, Angola, Democratic Republic of the Congo, Gabon, Libya, Nigeria and Sudan, as well as in Zambia, which depends heavily on copper exports. The Standard Deviation (i.e. the amount of variation from the mean) of annual terms of trade changes in these countries was around 15 or higher between 2001 and 2014. In contrast, volatility was much lower (SD between 2 and around 5) in countries that depend less on commodities and/or are more diversified, such as Ethiopia, Kenya, Senegal, South Africa, Tanzania, Tunisia and Uganda.
The earlier terms of trade boom improved economic prosperity. However, the recent fall in export prices relative to import prices has partly reversed earlier terms of trade gains. The purchasing power of domestic output (“command GDP”) has declined relative to real GDP, but growth of real GDP has also reduced, as lower commodity prices tend to reduce investment and growth in the resource sector. Other sectors also suffer through their direct linkages with the resource sector or indirectly where governments respond to lower revenues by cutting spending. However, this negative effect on growth is mitigated where lower exchange rates enable other firms to export more and/or cope better with import competition.
It is important to also consider the magnitude and speed of terms of trade changes, both of which have risen markedly. While economic growth generally benefits from terms of trade gains, highly volatile shifts in terms of trade can lead to macroeconomic instability and reduce medium-term growth (Awel, 2012). However, the adverse effects of terms of trade boom and busts on the economy can be mitigated if monetary and fiscal policies manage to contain inflation and build up savings during the boom period. This prevents overheating, limits the real appreciation of the exchange rate and also creates fiscal space, which is needed to counteract an economic downturn in the following terms of trade bust. However, if policies are pro-cyclical and unable to contain inflation during the boom, large terms of trade changes will be more disruptive and policies will be less able to mitigate the adverse effects on the economy when the terms of trade deteriorate. (For more details about the recent policies of individual countries see the respective Country Notes.)
On the supply side, many African countries have further improved conditions for doing business. Among the 51 African countries evaluated in the Doing Business report (World Bank, 2016a), 23 improved their ranking in 2015. Conditions for doing business improved most in Kenya, Uganda, Seychelles and Mauritania (as measured by improved rankings). In 20 other countries, conditions (as measured by scores) remained the same or improved, but their rankings declined nonetheless as scores in other countries improved more. In Gabon and Zambia, both the score and the ranking declined, as was the case in Rwanda, which was among the top reformers in recent years. But Rwanda still ranks second best after Mauritius among African countries in ease of doing business (see Chapter 5).
(cont.)

1. AFriCA’S MACrOECONOMiC PrOSPECtS1. AFriCA’S MACrOECONOMiC PrOSPECtS
31African Economic Outlook© AfDB, OECD, UNDP 201630 African Economic Outlook © AfDB, OECD, UNDP 2016
In 2015, agriculture supported growth in countries where weather conditions remained favourable and investment had increased productivity. However, several countries experienced a headwind on growth (notably Ethiopia, Malawi, Namibia, South Africa, Zambia and Zimbabwe) due to droughts or floods. This sector remains vulnerable to weather conditions and volatile prices of agricultural products. In resource-rich countries, growth declined as lower commodity prices strained government budgets and investment. In some countries, production in extractive industries remained unchanged or increased slightly despite lower commodity prices (Nigeria and Zambia), while in others it declined (Botswana, Equatorial Guinea, Gabon, Guinea, Sierra Leone and South Africa).
Manufacturing activity improved in a few countries (Ethiopia, Kenya, Rwanda and South Africa), but was often constrained by weak export demand and/or power shortages. New investment is expected to boost manufacturing in the coming years in several countries (e.g. Botswana and Mauritius). The construction sector continued to boost growth in many countries, often driven by public infrastructure programmes, but also by private investment including in housing. The service sector also remained an important driver of growth in Africa. Both traditional services such as transport, trade, real estate, public and financial services and new information and telecommunication technologies remain important drivers for productivity and growth.
Tourism is also an important and growing service sector in Africa. The number of available hotel rooms continued to increase (Figure 1.6). However, according to the World Tourism Organization (UNWTO, 2016), international tourist arrivals in Africa declined in 2015 by 3% to 53 million. In North Africa, arrivals declined by 8% and in sub-Saharan Africa by 1%, although the latter returned to positive growth in the second half of the year. In some countries, tourism was adversely affected by terrorism and security problems in the region (Burkina Faso, Cameroon, Egypt, Kenya and Tunisia). Meanwhile, in several countries tourism boosted growth in 2015 (Ethiopia, Madagascar, Mauritius, Rwanda, Seychelles and Zimbabwe).
Figure 1.6. Number of available hotel rooms in Africa, 2011-15
0
10 000
20 000
30 000
40 000
50 000
60 000
2011 2012 2013 2014 2015
Sub-Saharan AfricaNorth Africa Africa
Number of rooms
Source: AfDB/NYU Africa House/ATA (2015).12 http://dx.doi.org/10.1787/888933349983
An examination of the fastest-growing African countries over the past five years reveals very different sector patterns (Table 1.2). In Nigeria, structural changes seem to be in accordance with traditional three-sector theory, as shares of the primary sector

1. AFriCA’S MACrOECONOMiC PrOSPECtS
32 African Economic Outlook © AfDB, OECD, UNDP 2016
declined while those of other sectors increased.2 The share of agriculture also declined in many other countries, but increased in Kenya and Tanzania. The share of extractive industries declined in some countries but increased in others as new production started and boosted growth (oil in Ghana and iron-ore mining in Sierra Leone). The share of manufacturing increased in only a few countries (Niger, Nigeria and Uganda), but remained broadly constant or even declined in many others. In contrast, the construction and service sectors were important drivers of growth in many countries.
In short, African countries are achieving growth performance with quite different sectoral patterns. However, the simplistic three-sector theory can be misleading as productivity is not only raised by factor reallocation between sectors, but also through modernisation and reallocation within sectors, as well as via better linkages between sectors. In particular, higher productivity in agriculture can boost food processing and leather processing and manufacturing to the benefit of both sectors (McMillan and Harttgen, 2015).
Table 1.2. Sectoral changes in Africa’s fast-growing countries, 2009-14(Changes of shares in GDP in percentage points)
Agriculture, forestry, fishing
and hunting
Mining and quarrying
including oil and gas extraction Manufacturing Construction
Electricity, gas and water Services
Burkina Faso -0.7 5.4 -3.6 4.2 0.3 -5
Congo 0.1 -3.6 0.1 1.8 0.1 1.5
Democratic Republic of the Congo -1.9 0.4 -1.5 0.5 0 2.5
Ethiopia -10.2 0.6 0.3 4.1 -0.4 5.6
Ghana -12.2 7.4 -1 3.7 -0.1 2.2
Kenya 3.3 0.2 -1.7 0.6 -0.3 -2.1
Malawi -5.3 0.2 -2.1 1.9 -0.1 5.4
Mozambique -2.2 2 -1.8 0.5 -0.1 1.6
Niger -1.6 3.3 1 0 -0.1 -2.6
Nigeria -16.1 -17.1 6.5 1.9 0.4 24.4
Rwanda -1.2 1.1 -0.5 1.5 0.1 -1
Sierra Leone -8.2 17.2 -0.6 -0.5 0.1 -8
Tanzania 1.5 1.6 0 2.1 -0.5 -4.7
Uganda -2.5 -0.5 1.5 2.1 -0.4 -0.2
Zambia -2.9 -2.3 -1.2 3.4 0.1 2.9
Note: Selected countries with average annual real GDP growth during this period of above 5%.Source: Author’s calculations based on data from the Statistics Department, African Development Bank.
Growth remains highest in East Africa
Economic growth varies across countries and regions, reflecting factors such as differences in income levels, dependence on commodity exports, political and social stability, and macroeconomic and structural policies. In 2015, growth continued to be highest in East Africa, followed by West Africa and Central Africa, and remained lowest in Southern Africa and North Africa. Assuming a gradual improvement in international and domestic conditions, growth is projected to accelerate in all regions in 2016/17 (Table 1.3).
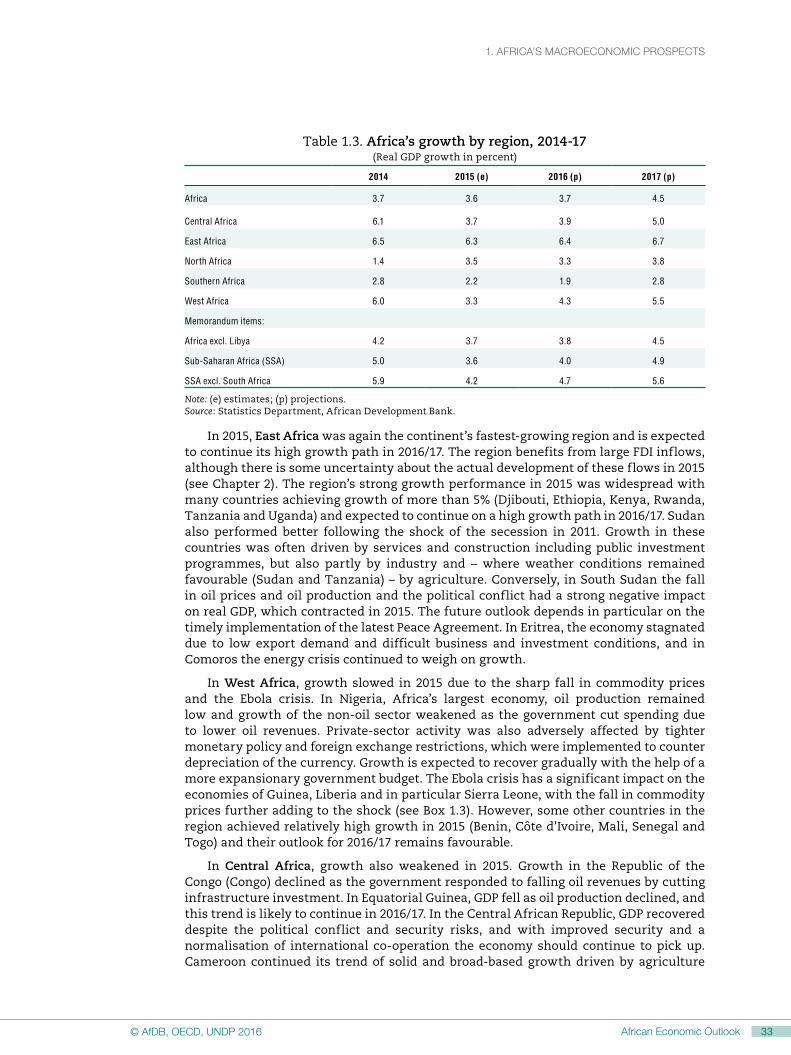
1. AFriCA’S MACrOECONOMiC PrOSPECtS1. AFriCA’S MACrOECONOMiC PrOSPECtS
33African Economic Outlook© AfDB, OECD, UNDP 201632 African Economic Outlook © AfDB, OECD, UNDP 2016
Table 1.3. Africa’s growth by region, 2014-17(Real GDP growth in percent)
2014 2015 (e) 2016 (p) 2017 (p)
Africa 3.7 3.6 3.7 4.5
Central Africa 6.1 3.7 3.9 5.0
East Africa 6.5 6.3 6.4 6.7
North Africa 1.4 3.5 3.3 3.8
Southern Africa 2.8 2.2 1.9 2.8
West Africa 6.0 3.3 4.3 5.5
Memorandum items:
Africa excl. Libya 4.2 3.7 3.8 4.5
Sub-Saharan Africa (SSA) 5.0 3.6 4.0 4.9
SSA excl. South Africa 5.9 4.2 4.7 5.6
Note: (e) estimates; (p) projections.Source: Statistics Department, African Development Bank.
In 2015, East Africa was again the continent’s fastest-growing region and is expected to continue its high growth path in 2016/17. The region benefits from large FDI inflows, although there is some uncertainty about the actual development of these flows in 2015 (see Chapter 2). The region’s strong growth performance in 2015 was widespread with many countries achieving growth of more than 5% (Djibouti, Ethiopia, Kenya, Rwanda, Tanzania and Uganda) and expected to continue on a high growth path in 2016/17. Sudan also performed better following the shock of the secession in 2011. Growth in these countries was often driven by services and construction including public investment programmes, but also partly by industry and – where weather conditions remained favourable (Sudan and Tanzania) – by agriculture. Conversely, in South Sudan the fall in oil prices and oil production and the political conflict had a strong negative impact on real GDP, which contracted in 2015. The future outlook depends in particular on the timely implementation of the latest Peace Agreement. In Eritrea, the economy stagnated due to low export demand and difficult business and investment conditions, and in Comoros the energy crisis continued to weigh on growth.
In West Africa, growth slowed in 2015 due to the sharp fall in commodity prices and the Ebola crisis. In Nigeria, Africa’s largest economy, oil production remained low and growth of the non-oil sector weakened as the government cut spending due to lower oil revenues. Private-sector activity was also adversely affected by tighter monetary policy and foreign exchange restrictions, which were implemented to counter depreciation of the currency. Growth is expected to recover gradually with the help of a more expansionary government budget. The Ebola crisis has a significant impact on the economies of Guinea, Liberia and in particular Sierra Leone, with the fall in commodity prices further adding to the shock (see Box 1.3). However, some other countries in the region achieved relatively high growth in 2015 (Benin, Côte d’Ivoire, Mali, Senegal and Togo) and their outlook for 2016/17 remains favourable.
In Central Africa, growth also weakened in 2015. Growth in the Republic of the Congo (Congo) declined as the government responded to falling oil revenues by cutting infrastructure investment. In Equatorial Guinea, GDP fell as oil production declined, and this trend is likely to continue in 2016/17. In the Central African Republic, GDP recovered despite the political conflict and security risks, and with improved security and a normalisation of international co-operation the economy should continue to pick up. Cameroon continued its trend of solid and broad-based growth driven by agriculture

1. AFriCA’S MACrOECONOMiC PrOSPECtS
34 African Economic Outlook © AfDB, OECD, UNDP 2016
and forestry, construction, industry and oil production, despite security problems in parts of its northern border region. In Gabon, the government continued its investment programme and boosted growth despite lower oil revenues. In the Democratic Republic of the Congo, growth moderated in 2015 but remained solid, driven by agriculture, services and industries, with production increasing in the majority of extractive industries.
In Southern Africa, growth slowed down in 2015 and is expected to recover only in 2017. Weak international conditions including lower commodity prices, the drought and other factors, such as power shortages, dampened growth in the region in 2015. South Africa continued its low growth trajectory and is expected to weaken further in 2016 before recovering in 2017. Many factors, notably low commodity prices, weak export demand, and power shortages, strikes and the drought in agriculture, are depressing consumer and business confidence and production. As South Africa is an important export destination for neighbouring countries its weakness affects the whole region. In other countries in the region that depend even more on commodity exports, notably Angola (oil) and Zambia (copper) as well as Botswana (diamonds), growth also declined. In Mozambique, growth moderated in 2015 but remained solid, and was boosted by higher production in agriculture and the power and extractive industries sectors. Despite a significant reduction in 2015, FDI also remained a major driver of Mozambique’s growth.
In North Africa, the macroeconomic situation remains uneven. In Libya, disruption in oil production and ongoing political conflicts and uncertainty led to another fall in real GDP. Ending the fighting between rival militias and establishing a national government is key for an economic recovery. Tunisia achieved only modest growth in 2015 boosted by good harvests, while production in other sectors remained weak. Mining and industry sectors were adversely affected by weak exports and tourism, which had recovered gradually, declined once again after terrorist attacks. In Algeria, growth remained steady thanks to a rebound in oil production. Morocco achieved the highest broad-based growth in the region supported on the demand side by private consumption and investment and on the production side by the construction sector and agriculture, which benefited from good weather conditions and past investment in irrigation. Tourism was also adversely affected by security problems in the region but to a much lower extent than in Tunisia. In Egypt, growth strengthened as the political scene stabilised and business sentiment improved. Higher wages and social spending supported consumption and investment also increased. On the production side, the service sector boosted growth although tourism was again adversely affected by security concerns. Current plans for economic reforms and mega projects will, if fully implemented, further strengthen the economy.
Box 1.3. The Ebola crisis
Thanks to international support and national policies, the spread of the Ebola Virus Disease (EVD) in the three most-affected countries has been contained. The World Health Organization (WHO) declared West Africa “free of Ebola”, although there is still a risk of flare-ups. The three West African countries most hit by the EVD outbreak, Guinea, Liberia and Sierra Leone, are on their way to recovery. The epidemic caused tremendous human hardship and resulted in high economic and social costs in these countries including possible reversals of gains achieved in various areas. By mid-March 2016, in these three countries there had been 28 603 reported cases of the virus (0.13% of the total population in these countries) and 11 301 reported deaths (4 809 in Liberia, 3 956 in Sierra Leone and 2 536 in Guinea) according to WHO. A large number of health workers also died as a result of infection. Health systems must now be restored to functioning status and further improved. Governments are taking measures not only to restore gains lost due to the EVD crisis, but also to better cope with the risks of epidemics and other health threats, and improve access to quality health services.

1. AFriCA’S MACrOECONOMiC PrOSPECtS1. AFriCA’S MACrOECONOMiC PrOSPECtS
35African Economic Outlook© AfDB, OECD, UNDP 201634 African Economic Outlook © AfDB, OECD, UNDP 2016
Box 1.3. The Ebola crisis
During the height of the epidemic, economic activity came to a standstill in the most-affected regions, unemployment increased and children could not go to school. As these countries also depend on commodity exports (iron ore in Sierra Leone and Liberia, aluminium, oil, gold and diamonds in Guinea), these economies suffered a “double shock”, as commodity prices declined sharply. As a result of these shocks, real GDP shrank in Sierra Leone in 2015 by about one fifth. In Guinea and Liberia, the impact was smaller with GDP estimated to reach levels similar to 2014. In the three years prior to the Ebola outbreak (2011-13), and before the commodity price declines, average growth amounted to almost 14% in Sierra Leone, above 8% in Liberia and above 3% in Guinea.
The economic costs from these shocks include high fiscal costs. Despite massive budget support from donors and direct donor spending to fight the epidemic, fiscal positions weakened in 2014/15. There are also ongoing surveillance and prevention costs. Given the reduced fiscal space, governments now face the challenge of preventing excessive debt and ensuring medium-term fiscal sustainability, while preserving growth-enhancing government expenditures such as infrastructure investment. The economic forecast for these countries is cautiously optimistic. In Guinea and Liberia, real GDP growth is expected to accelerate in 2016 to 4% and almost 3%, respectively, and to strengthen further in 2017. In Sierra Leone, growth is expected to recover only by 2017, but the level of GDP will still be much lower than in 2014.
International commodity prices have declined further
Commodity prices, which started to edge down in 2013, fell sharply during the second half of 2014. The decline continued during 2015 and the beginning of 2016 (Figures 1.7, 1.8 and 1.9). Between mid-2014 and January 2016 the oil price declined by more than 70% and is presently at its lowest level in 13 years, almost 30% lower than at its lowest level during the 2008/09 global recession. The main reason for the plunging prices is global oversupply. With new suppliers coming on stream, demand has not kept pace with supply but is restrained by slower economic growth in industrial and emerging countries, including China. Slowing demand from China and other countries also reduced copper prices to their lowest level in more than seven years. Prices of other commodities, such as iron ore and gold, and export prices of some agricultural products, notably cotton, also declined, with gold price recovering recently. The decline of coffee prices was more moderate and the price of cocoa remained high in 2015.
The AEO 2016 economic forecast for Africa is based on the assumption that the price of oil and other commodities will stabilise and slowly recover. But given current low levels, average prices will still be lower in 2016 than in 2015, and will only increase in 2017. Assuming an average oil price level of USD 37 per barrel in 2016 and USD 48 per barrel in 2017, oil prices will decline by 27% in 2016 before rising by around 30% in 2017. However, given the uncertainties affecting the global economy in general and oil and commodity markets in particular, these assumptions involve significant risks, with downside risks probably more significant than upside risks.
Africa’s main commodity exporters are heavily affected by these price declines. In some countries production in extractive industries has continued to increase, thus boosting GDP, while in others production has been cut. The low price levels also weigh against profits and can have adverse effects on investment and exploration, thus reducing growth potential. In several African countries, revenues from oil and non-oil commodity exports are the main source of finance for both import demand and, through tax revenues, government expenditure. These countries now have to cope with weaker current accounts and exchange rates and additional fiscal pressures. However, lower
(cont.)

1. AFriCA’S MACrOECONOMiC PrOSPECtS
36 African Economic Outlook © AfDB, OECD, UNDP 2016
oil prices also have beneficial effects as they reduce costs for heating, transport and production in energy-intensive sectors. Import prices of basic foodstuffs also continued to decline in 2015. Taken together with lower energy prices, this decline mitigates inflationary pressures, increases the purchasing power of households, tends to boost domestic demand and could also alleviate poverty.
Commodity prices can affect Africa’s economic growth through various channels. The overall effect depends on the size of oil and non-oil commodity exports and oil and food imports. Analysis by the African Development Bank shows that, in the short term, the growth impact (per percentage price change) through the export channel is largest for oil prices, followed by metal prices and export prices of agricultural products. However, over the longer term, the latter have the largest impact on growth in exporting countries. According to this analysis, the average commodity price increase between 2010 and 2014 explains about 30% of growth in Africa’s commodity-exporting countries (AfDB, forthcoming). However, this implies that if commodity prices remain at current low levels, growth prospects for Africa’s commodity-exporting countries would remain weaker than in AEO projections, which assume a gradual recovery of commodity prices during 2016/17.
Figure 1.7. Commodity prices, January 1999-January 2016
January 2000=100700
600
500
400
300
200
0
100
Aluminium Copper GoldPetroleum
Jan
99
Apr 9
9
Jul 9
9
Oct 9
9
Jan
00
Apr 0
0
Jul 0
0
Oct 0
0
Jan
01
Apr 0
1
Jul 0
1
Oct 0
1
Jan
02
Apr 0
2
Jul 0
2
Oct 0
2
Jan
03
Apr 0
3
Jul 0
3
Oct 0
3
Jan
04
Apr 0
4
Jul 0
4
Oct 0
4
Jan
05
Apr 0
5
Jul 0
5
Oct 0
5
Jan
06
Apr 0
6
Jul 0
6
Oct 0
6
Jan
07
Apr 0
7
Jul 0
7
Oct 0
7
Jan
08
Apr 0
8
Jul 0
8
Oct 0
8
Jan
09
Apr 0
9
Jul 0
9
Oct 0
9
Jan
10
Apr 1
0
Jul 1
0
Oct 1
0
Jan
11
Apr 1
1
Jul 1
1
Oct 1
1
Jan
12
Apr 1
2
Jul 1
2
Oct 1
2
Jan
13
Apr 1
3
Jul 1
3
Oct 1
3
Jan
14
Apr 1
4
Jul 1
4
Oct 1
4
Jan
15
Apr 1
5
Jul 1
5
Oct 1
5
Jan
16
Source: World Bank (2016b).12 http://dx.doi.org/10.1787/888933349994
Figure 1.8. Export prices of agricultural products, January 1999-January 2016
January 2000=100
0
100
200
300
400
500
600
Arabica coffeeCocoa Cotton
Jan
99
Apr 9
9
Jul 9
9
Oct 9
9
Jan
00
Apr 0
0
Jul 0
0
Oct 0
0
Jan
01
Apr 0
1
Jul 0
1
Oct 0
1
Jan
02
Apr 0
2
Jul 0
2
Oct 0
2
Jan
03
Apr 0
3
Jul 0
3
Oct 0
3
Jan
04
Apr 0
4
Jul 0
4
Oct 0
4
Jan
05
Apr 0
5
Jul 0
5
Oct 0
5
Jan
06
Apr 0
6
Jul 0
6
Oct 0
6
Jan
07
Apr 0
7
Jul 0
7
Oct 0
7
Jan
08
Apr 0
8
Jul 0
8
Oct 0
8
Jan
09
Apr 0
9
Jul 0
9
Oct 0
9
Jan
10
Apr 1
0
Jul 1
0
Oct 1
0
Jan
11
Apr 1
1
Jul 1
1
Oct 1
1
Jan
12
Apr 1
2
Jul 1
2
Oct 1
2
Jan
13
Apr 1
3
Jul 1
3
Oct 1
3
Jan
14
Apr 1
4
Jul 1
4
Oct 1
4
Jan
15
Apr 1
5
Jul 1
5
Oct 1
5
Jan
16
Source: World Bank (2016b).12 http://dx.doi.org/10.1787/888933350007

1. AFriCA’S MACrOECONOMiC PrOSPECtS1. AFriCA’S MACrOECONOMiC PrOSPECtS
37African Economic Outlook© AfDB, OECD, UNDP 201636 African Economic Outlook © AfDB, OECD, UNDP 2016
Figure 1.9. Import prices of basic foodstuffs, January 1999-January 2016
January 2000=100
0
50
100
150
200
250
300
350
400
450
RiceMaize Wheat
Jan
99
Apr 9
9
Jul 9
9
Oct 9
9
Jan
00
Apr 0
0
Jul 0
0
Oct 0
0
Jan
01
Apr 0
1
Jul 0
1
Oct 0
1
Jan
02
Apr 0
2
Jul 0
2
Oct 0
2
Jan
03
Apr 0
3
Jul 0
3
Oct 0
3
Jan
04
Apr 0
4
Jul 0
4
Oct 0
4
Jan
05
Apr 0
5
Jul 0
5
Oct 0
5
Jan
06
Apr 0
6
Jul 0
6
Oct 0
6
Jan
07
Apr 0
7
Jul 0
7
Oct 0
7
Jan
08
Apr 0
8
Jul 0
8
Oct 0
8
Jan
09
Apr 0
9
Jul 0
9
Oct 0
9
Jan
10
Apr 1
0
Jul 1
0
Oct 1
0
Jan
11
Apr 1
1
Jul 1
1
Oct 1
1
Jan
12
Apr 1
2
Jul 1
2
Oct 1
2
Jan
13
Apr 1
3
Jul 1
3
Oct 1
3
Jan
14
Apr 1
4
Jul 1
4
Oct 1
4
Jan
15
Apr 1
5
Jul 1
5
Oct 1
5
Jan
16
Source: World Bank (2016b).12 http://dx.doi.org/10.1787/888933350018
monetary policy stances diverge as countries face different inflationary and currency pressures
In many African countries, inflation remained moderate in 2015. However, Africa’s average inflation remains higher (7.4%) than median inflation (4.3%) due to particularly high inflation in several countries: South Sudan (41.1%), Malawi (21.2%), Sudan (16.9%), Eritrea (12.5%), Egypt (11.2%), Angola (10.2%) and Zambia (10.1%) (Figure 1.10). Inflationary pressures increased in countries where currencies depreciated in the wake of lower commodity prices, eroding external and fiscal positions and global risk perceptions. In 2015, central banks continued to maintain or achieve price stability, in accordance with their mandate. They used different monetary frameworks to pursue their objectives, such as inflation targeting (Ghana and South Africa) or other regimes, often with money aggregates as operational and intermediate targets (Berg et al., 2015). Exchange rate regimes also differ between countries. In many countries, central banks are labouring to improve the effectiveness of their policies for macroeconomic management. This is particularly difficult in countries with underdeveloped financial markets, and in cases where countries are hit by external shocks and central banks are faced with conflicting targets. This was the case in 2015 when external balances deteriorated and exchange rates came under pressure in resource-rich countries after the fall of oil and other commodity prices. In Nigeria, monetary policy was first eased to stimulate the economy and foreign reserves were used to defend the currency. But towards the end of 2015, foreign exchange restrictions were implemented to stabilise the exchange rate and halt the erosion of foreign reserves. The authorities are expected to gradually lift the restrictions and adopt a more flexible exchange rate policy. Since the end of 2015, a Standby Credit Facility agreement with the International Monetary Fund (IMF) together with further monetary and fiscal tightening is being used to stabilise the exchange rate and shore up reserves.
Several other countries also coped with worsening external positions, sharply falling exchange rates and inflationary pressures. They generally responded by tightening policies (e.g. Algeria, Angola, Ghana, Kenya, Lesotho, Malawi, South Africa, Uganda and Zambia). But several other countries (e.g. Botswana, Morocco, Mauritius)
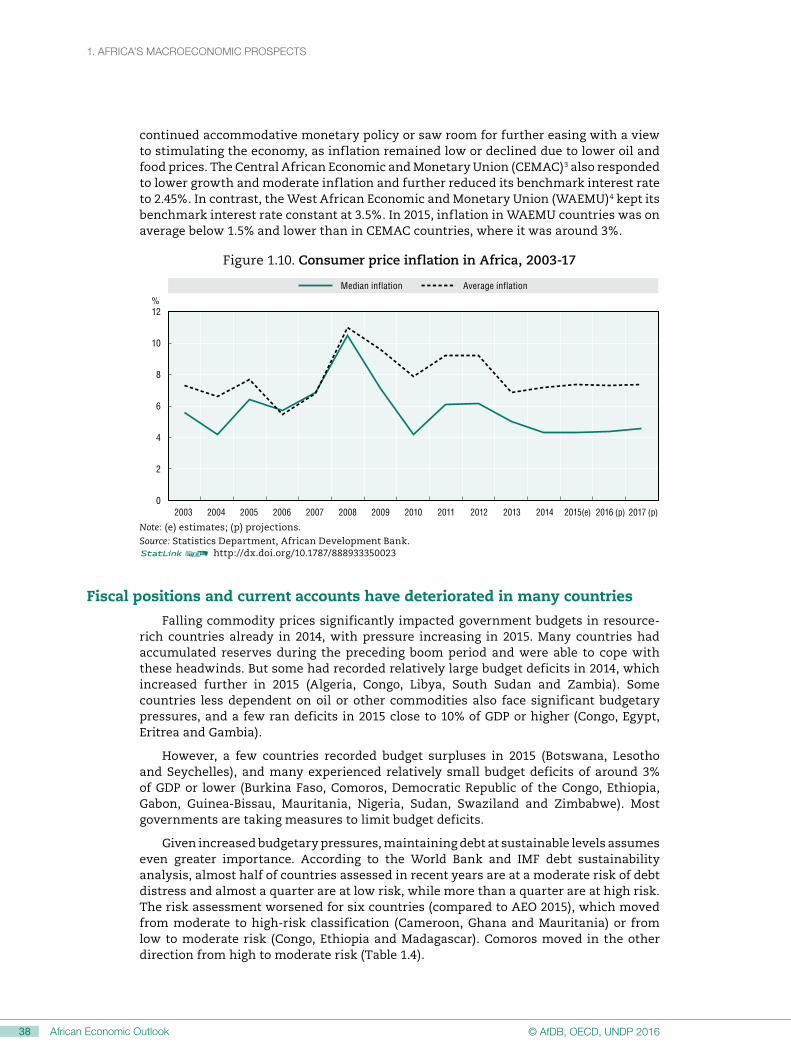
1. AFriCA’S MACrOECONOMiC PrOSPECtS
38 African Economic Outlook © AfDB, OECD, UNDP 2016
continued accommodative monetary policy or saw room for further easing with a view to stimulating the economy, as inflation remained low or declined due to lower oil and food prices. The Central African Economic and Monetary Union (CEMAC)3 also responded to lower growth and moderate inflation and further reduced its benchmark interest rate to 2.45%. In contrast, the West African Economic and Monetary Union (WAEMU)4 kept its benchmark interest rate constant at 3.5%. In 2015, inflation in WAEMU countries was on average below 1.5% and lower than in CEMAC countries, where it was around 3%.
Figure 1.10. Consumer price inflation in Africa, 2003-17
%
0
2
4
6
8
10
12
2003 2004 2005 2006 2007 2008 2009 2010 2011 2012 2013 2014 2015(e) 2016 (p) 2017 (p)
Average inflationMedian inflation
Note: (e) estimates; (p) projections.Source: Statistics Department, African Development Bank.12 http://dx.doi.org/10.1787/888933350023
Fiscal positions and current accounts have deteriorated in many countries
Falling commodity prices significantly impacted government budgets in resource-rich countries already in 2014, with pressure increasing in 2015. Many countries had accumulated reserves during the preceding boom period and were able to cope with these headwinds. But some had recorded relatively large budget deficits in 2014, which increased further in 2015 (Algeria, Congo, Libya, South Sudan and Zambia). Some countries less dependent on oil or other commodities also face significant budgetary pressures, and a few ran deficits in 2015 close to 10% of GDP or higher (Congo, Egypt, Eritrea and Gambia).
However, a few countries recorded budget surpluses in 2015 (Botswana, Lesotho and Seychelles), and many experienced relatively small budget deficits of around 3% of GDP or lower (Burkina Faso, Comoros, Democratic Republic of the Congo, Ethiopia, Gabon, Guinea-Bissau, Mauritania, Nigeria, Sudan, Swaziland and Zimbabwe). Most governments are taking measures to limit budget deficits.
Given increased budgetary pressures, maintaining debt at sustainable levels assumes even greater importance. According to the World Bank and IMF debt sustainability analysis, almost half of countries assessed in recent years are at a moderate risk of debt distress and almost a quarter are at low risk, while more than a quarter are at high risk. The risk assessment worsened for six countries (compared to AEO 2015), which moved from moderate to high-risk classification (Cameroon, Ghana and Mauritania) or from low to moderate risk (Congo, Ethiopia and Madagascar). Comoros moved in the other direction from high to moderate risk (Table 1.4).
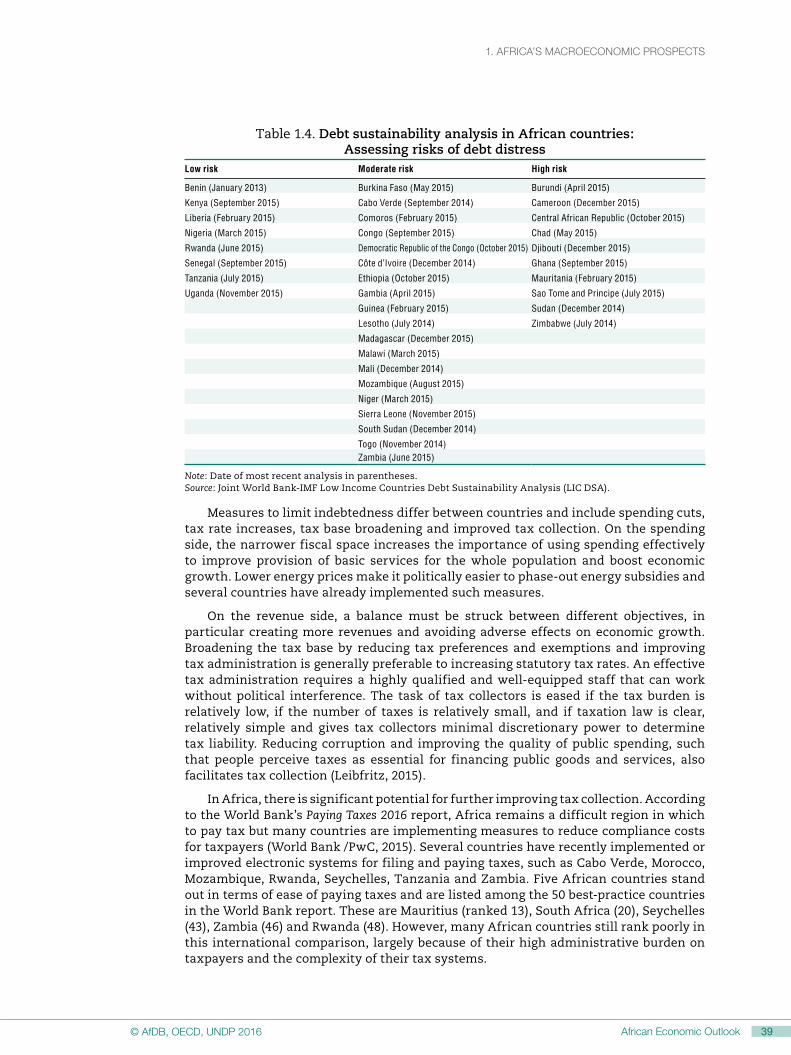
1. AFriCA’S MACrOECONOMiC PrOSPECtS1. AFriCA’S MACrOECONOMiC PrOSPECtS
39African Economic Outlook© AfDB, OECD, UNDP 201638 African Economic Outlook © AfDB, OECD, UNDP 2016
Table 1.4. Debt sustainability analysis in African countries: Assessing risks of debt distress
Low risk Moderate risk High risk
Benin (January 2013) Burkina Faso (May 2015) Burundi (April 2015)
Kenya (September 2015) Cabo Verde (September 2014) Cameroon (December 2015)
Liberia (February 2015) Comoros (February 2015) Central African Republic (October 2015)
Nigeria (March 2015) Congo (September 2015) Chad (May 2015)
Rwanda (June 2015) Democratic Republic of the Congo (October 2015) Djibouti (December 2015)
Senegal (September 2015) Côte d’Ivoire (December 2014) Ghana (September 2015)
Tanzania (July 2015) Ethiopia (October 2015) Mauritania (February 2015)
Uganda (November 2015) Gambia (April 2015) Sao Tome and Principe (July 2015)
Guinea (February 2015) Sudan (December 2014)
Lesotho (July 2014) Zimbabwe (July 2014)
Madagascar (December 2015)
Malawi (March 2015)
Mali (December 2014)
Mozambique (August 2015)
Niger (March 2015)
Sierra Leone (November 2015)
South Sudan (December 2014)
Togo (November 2014)Zambia (June 2015)
Note: Date of most recent analysis in parentheses.Source: Joint World Bank-IMF Low Income Countries Debt Sustainability Analysis (LIC DSA).
Measures to limit indebtedness differ between countries and include spending cuts, tax rate increases, tax base broadening and improved tax collection. On the spending side, the narrower fiscal space increases the importance of using spending effectively to improve provision of basic services for the whole population and boost economic growth. Lower energy prices make it politically easier to phase-out energy subsidies and several countries have already implemented such measures.
On the revenue side, a balance must be struck between different objectives, in particular creating more revenues and avoiding adverse effects on economic growth. Broadening the tax base by reducing tax preferences and exemptions and improving tax administration is generally preferable to increasing statutory tax rates. An effective tax administration requires a highly qualified and well-equipped staff that can work without political interference. The task of tax collectors is eased if the tax burden is relatively low, if the number of taxes is relatively small, and if taxation law is clear, relatively simple and gives tax collectors minimal discretionary power to determine tax liability. Reducing corruption and improving the quality of public spending, such that people perceive taxes as essential for financing public goods and services, also facilitates tax collection (Leibfritz, 2015).
In Africa, there is significant potential for further improving tax collection. According to the World Bank’s Paying Taxes 2016 report, Africa remains a difficult region in which to pay tax but many countries are implementing measures to reduce compliance costs for taxpayers (World Bank /PwC, 2015). Several countries have recently implemented or improved electronic systems for filing and paying taxes, such as Cabo Verde, Morocco, Mozambique, Rwanda, Seychelles, Tanzania and Zambia. Five African countries stand out in terms of ease of paying taxes and are listed among the 50 best-practice countries in the World Bank report. These are Mauritius (ranked 13), South Africa (20), Seychelles (43), Zambia (46) and Rwanda (48). However, many African countries still rank poorly in this international comparison, largely because of their high administrative burden on taxpayers and the complexity of their tax systems.
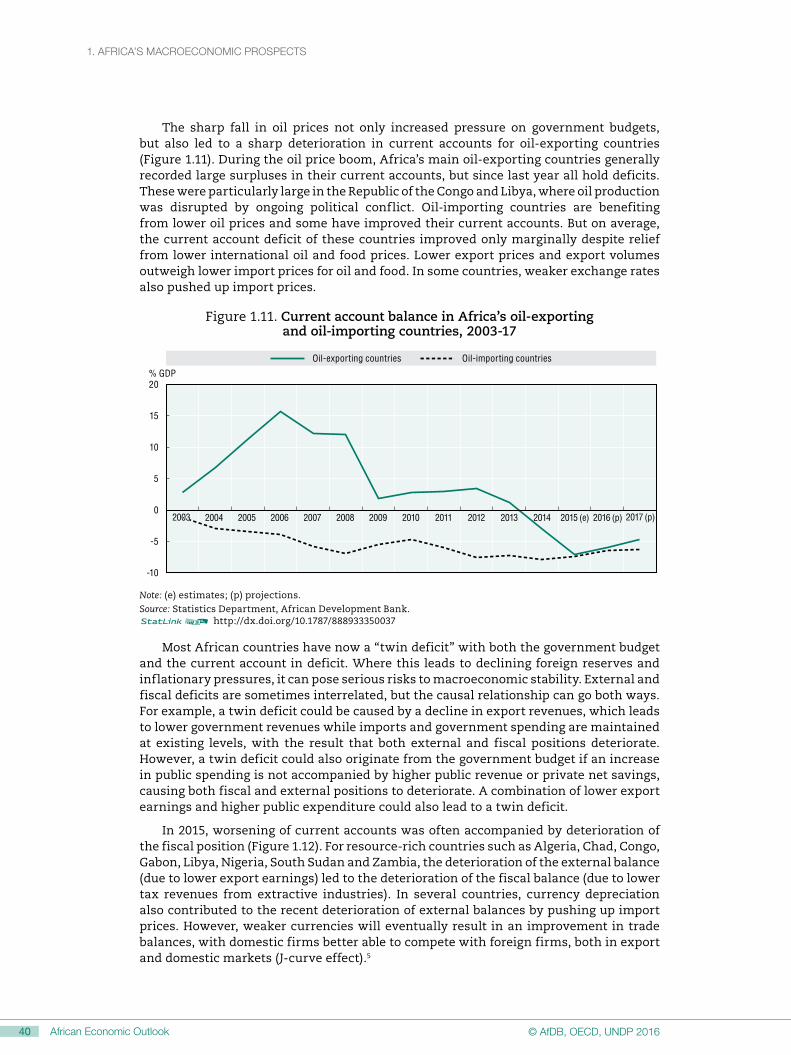
1. AFriCA’S MACrOECONOMiC PrOSPECtS
40 African Economic Outlook © AfDB, OECD, UNDP 2016
The sharp fall in oil prices not only increased pressure on government budgets, but also led to a sharp deterioration in current accounts for oil-exporting countries (Figure 1.11). During the oil price boom, Africa’s main oil-exporting countries generally recorded large surpluses in their current accounts, but since last year all hold deficits. These were particularly large in the Republic of the Congo and Libya, where oil production was disrupted by ongoing political conflict. Oil-importing countries are benefiting from lower oil prices and some have improved their current accounts. But on average, the current account deficit of these countries improved only marginally despite relief from lower international oil and food prices. Lower export prices and export volumes outweigh lower import prices for oil and food. In some countries, weaker exchange rates also pushed up import prices.
Figure 1.11. Current account balance in Africa’s oil-exporting and oil-importing countries, 2003-17
-10
-5
0
5
10
15
20
20032003 2004 2005 2006 2007 2008 2009 2010 2011 2012 2013 2014 2015 (e) 2016 (p) 2017 (p)
Oil-importing countriesOil-exporting countries
% GDP
Note: (e) estimates; (p) projections.Source: Statistics Department, African Development Bank.12 http://dx.doi.org/10.1787/888933350037
Most African countries have now a “twin deficit” with both the government budget and the current account in deficit. Where this leads to declining foreign reserves and inflationary pressures, it can pose serious risks to macroeconomic stability. External and fiscal deficits are sometimes interrelated, but the causal relationship can go both ways. For example, a twin deficit could be caused by a decline in export revenues, which leads to lower government revenues while imports and government spending are maintained at existing levels, with the result that both external and fiscal positions deteriorate. However, a twin deficit could also originate from the government budget if an increase in public spending is not accompanied by higher public revenue or private net savings, causing both fiscal and external positions to deteriorate. A combination of lower export earnings and higher public expenditure could also lead to a twin deficit.
In 2015, worsening of current accounts was often accompanied by deterioration of the fiscal position (Figure 1.12). For resource-rich countries such as Algeria, Chad, Congo, Gabon, Libya, Nigeria, South Sudan and Zambia, the deterioration of the external balance (due to lower export earnings) led to the deterioration of the fiscal balance (due to lower tax revenues from extractive industries). In several countries, currency depreciation also contributed to the recent deterioration of external balances by pushing up import prices. However, weaker currencies will eventually result in an improvement in trade balances, with domestic firms better able to compete with foreign firms, both in export and domestic markets (J-curve effect).5

1. AFriCA’S MACrOECONOMiC PrOSPECtS1. AFriCA’S MACrOECONOMiC PrOSPECtS
41African Economic Outlook© AfDB, OECD, UNDP 201640 African Economic Outlook © AfDB, OECD, UNDP 2016
Prevention of unsustainable twin deficits therefore requires not only prudent fiscal policies, but also competitive real exchange rates and further improvement in conditions for domestic firms and foreign direct investment. Both fiscal and external deficits will then eventually decline. If the remaining current account deficits are to a large extent financed through FDI they will be sustainable, as this type of financing does not increase external debt.
Figure 1.12. Changes in current account and government budget balances in African countries between 2014 and 2015, in percentage points of GDP
5
0
-5
-10
-25 -20 -15 -10 -5 0 155 10
-15
Change in current account balance
Change in fiscal balance
Note: The positive-sloped trend line and the R-square of 0.44 in the regression between the change in current account balance and fiscal balance suggest that both balances are related, although there are other influencing factors.12 http://dx.doi.org/10.1787/888933350041
Will Africa reap a demographic growth dividend from its young population?
Africa is the continent with the fastest-growing population in the world. From 2000 to 2015, population numbers increased by more than 370 million from 814 million to almost 1.2 billion. According to United Nations projections (medium scenario), the population will rise to almost 1.7 billion in 2030 and almost 2.5 billion in 2050.6 Africa’s share of the world population is predicted to increase from currently around 16% to almost 20% in 2030 and above 25% in 2050. A young and growing population is generally seen as providing a “demographic dividend” to GDP growth and GDP per capita growth through labour supply. The underlying reason is growth of the labour force and the proportion of population of working age.
In coming decades, Africa will have the most favourable demographics in the world, in terms of the development of people at working ages. Its population at working age (defined as 15-64) is increasing rapidly and faster than the total population. This absolute and relative increase of potential labour supply opens a window to boost Africa’s annual growth of GDP per capita by up to half a percentage point over the next 15 years (Figure 1.13). However, measuring the positive mechanical demographic effects on labour supply and growth (see Annex 1.A1) only provides a starting point for analysis of the effects. It is important to also consider the labour market and productivity. The positive labour supply effect on growth will only materialise if enough jobs are created. Otherwise, people will be discouraged from entering the labour force (causing labour market participation to fall) or, after entering the labour market, will be unable to find a job (causing unemployment to rise). This requires a fundamental change in policy, as Africa has failed in the past to create enough good jobs despite higher economic growth (Page and Shimeles, 2014; Gallup, 2015).

1. AFriCA’S MACrOECONOMiC PrOSPECtS
42 African Economic Outlook © AfDB, OECD, UNDP 2016
Figure 1.13. Africa’s potential demographic dividend
Percentage points of GDP
0
0.1
0.2
0.3
0.4
0.5
0.6
2001
2002
2003
2004
2005
2006
2007
2008
2009
2010
2011
2012
2013
2014
2015
2016
2017
2018
2019
2020
2021
2022
2023
2024
2025
2026
2027
2028
2029
2030
2031
2032
2033
2034
2035
2036
2037
2038
2039
2040
2041
2042
2043
2044
2045
2046
2047
2048
2049
2050
Note: Potential impact on GDP per capita growth (in percentage points) as calculated by the percentage change in the proportion of the working-age population.12 http://dx.doi.org/10.1787/888933350057
The demographic effect on productivity growth is linked to impacts on savings, investment, labour efficiency and innovation. In principle, productivity growth in young populations should increase in each of these areas. As birth rates decline, both families and the government will have more resources available per child to provide better education and health care, which boosts productivity over time. With relatively more people at working age, the savings rate could increase and also raise productivity through more investment. Migration of workers to areas with higher levels of income and productivity, notably in cities, could also increase Africa’s productivity. By the mid-2030s, about half of Africans are expected to live in cities (see Chapters 6, 7 and 8).
However, a number of downside risks could impact productivity growth. In particular, the growing labour force may lack the necessary skills (human capital), and firms and public infrastructure may not provide adequate physical capital. Africa’s demographics also raise a number of questions: Will current low levels of productivity in agriculture and the effects of global climate change compromise Africa’s ability to provide food security for a growing population? How can Africa attain environmental sustainability in the face of rising populations and increasing economic activity?
Africa’s future demographics thus offer opportunities but also create challenges. Africa’s “economic renaissance” of the past two decades gives reason to hope that the continent will reap the demographic dividend in coming decades. But as much depends on how policy makers respond to these challenges, it is difficult to judge which view will finally prevail (AfDB/OECD/UNDP, 2015: 139ff; Basu and Basu, 2015; Canning, Raja and Yazbeck, 2015; Leridon, 2015; Sachs, 2015).
These considerations suggest that countries in East, West and Central Africa have the potential to reap a significant demographic dividend, while the dividend will be much smaller in Southern Africa and North Africa (see Annex 1.A1). To exploit this potential, countries must make managing demographic transition a key policy priority.
It is of the utmost importance to:
• reduce bottlenecks that still constrain demand for labour by promoting entrepreneurship and private-sector activity in general, while simultaneously helping young people to obtain the skills needed to obtain a decent job (see the Special Theme on Promoting Youth Employment in AfDB et al., 2012)
• ensure food security and environmental sustainability
• speed up the demographic transition towards lower birth rates by improving health care, education and family planning.
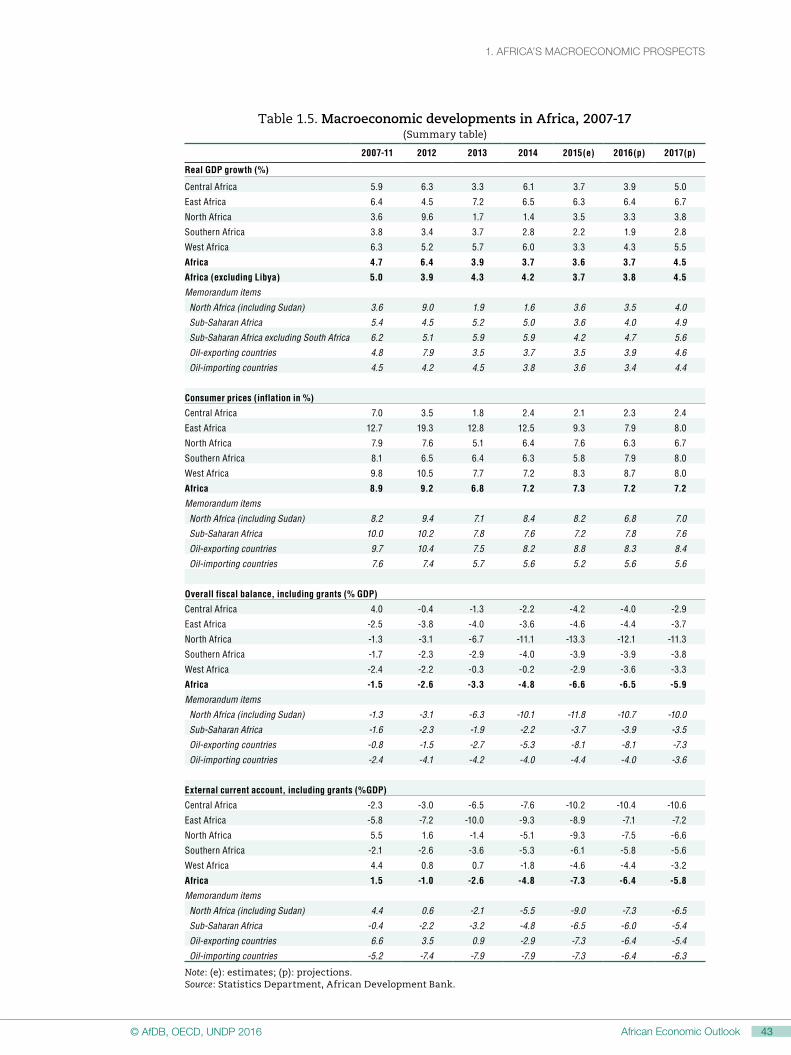
1. AFriCA’S MACrOECONOMiC PrOSPECtS1. AFriCA’S MACrOECONOMiC PrOSPECtS
43African Economic Outlook© AfDB, OECD, UNDP 201642 African Economic Outlook © AfDB, OECD, UNDP 2016
Table 1.5. Macroeconomic developments in Africa, 2007-17(Summary table)
2007-11 2012 2013 2014 2015(e) 2016(p) 2017(p)
Real GDP growth (%)
Central Africa 5.9 6.3 3.3 6.1 3.7 3.9 5.0
East Africa 6.4 4.5 7.2 6.5 6.3 6.4 6.7
North Africa 3.6 9.6 1.7 1.4 3.5 3.3 3.8
Southern Africa 3.8 3.4 3.7 2.8 2.2 1.9 2.8
West Africa 6.3 5.2 5.7 6.0 3.3 4.3 5.5
Africa 4.7 6.4 3.9 3.7 3.6 3.7 4.5
Africa (excluding Libya) 5.0 3.9 4.3 4.2 3.7 3.8 4.5
Memorandum items
North Africa (including Sudan) 3.6 9.0 1.9 1.6 3.6 3.5 4.0
Sub-Saharan Africa 5.4 4.5 5.2 5.0 3.6 4.0 4.9
Sub-Saharan Africa excluding South Africa 6.2 5.1 5.9 5.9 4.2 4.7 5.6
Oil-exporting countries 4.8 7.9 3.5 3.7 3.5 3.9 4.6
Oil-importing countries 4.5 4.2 4.5 3.8 3.6 3.4 4.4
Consumer prices (inflation in %)
Central Africa 7.0 3.5 1.8 2.4 2.1 2.3 2.4
East Africa 12.7 19.3 12.8 12.5 9.3 7.9 8.0
North Africa 7.9 7.6 5.1 6.4 7.6 6.3 6.7
Southern Africa 8.1 6.5 6.4 6.3 5.8 7.9 8.0
West Africa 9.8 10.5 7.7 7.2 8.3 8.7 8.0
Africa 8.9 9.2 6.8 7.2 7.3 7.2 7.2
Memorandum items
North Africa (including Sudan) 8.2 9.4 7.1 8.4 8.2 6.8 7.0
Sub-Saharan Africa 10.0 10.2 7.8 7.6 7.2 7.8 7.6
Oil-exporting countries 9.7 10.4 7.5 8.2 8.8 8.3 8.4
Oil-importing countries 7.6 7.4 5.7 5.6 5.2 5.6 5.6
Overall fiscal balance, including grants (% GDP)
Central Africa 4.0 -0.4 -1.3 -2.2 -4.2 -4.0 -2.9
East Africa -2.5 -3.8 -4.0 -3.6 -4.6 -4.4 -3.7
North Africa -1.3 -3.1 -6.7 -11.1 -13.3 -12.1 -11.3
Southern Africa -1.7 -2.3 -2.9 -4.0 -3.9 -3.9 -3.8
West Africa -2.4 -2.2 -0.3 -0.2 -2.9 -3.6 -3.3
Africa -1.5 -2.6 -3.3 -4.8 -6.6 -6.5 -5.9
Memorandum items
North Africa (including Sudan) -1.3 -3.1 -6.3 -10.1 -11.8 -10.7 -10.0
Sub-Saharan Africa -1.6 -2.3 -1.9 -2.2 -3.7 -3.9 -3.5
Oil-exporting countries -0.8 -1.5 -2.7 -5.3 -8.1 -8.1 -7.3
Oil-importing countries -2.4 -4.1 -4.2 -4.0 -4.4 -4.0 -3.6
External current account, including grants (%GDP)
Central Africa -2.3 -3.0 -6.5 -7.6 -10.2 -10.4 -10.6
East Africa -5.8 -7.2 -10.0 -9.3 -8.9 -7.1 -7.2
North Africa 5.5 1.6 -1.4 -5.1 -9.3 -7.5 -6.6
Southern Africa -2.1 -2.6 -3.6 -5.3 -6.1 -5.8 -5.6
West Africa 4.4 0.8 0.7 -1.8 -4.6 -4.4 -3.2
Africa 1.5 -1.0 -2.6 -4.8 -7.3 -6.4 -5.8
Memorandum items
North Africa (including Sudan) 4.4 0.6 -2.1 -5.5 -9.0 -7.3 -6.5
Sub-Saharan Africa -0.4 -2.2 -3.2 -4.8 -6.5 -6.0 -5.4
Oil-exporting countries 6.6 3.5 0.9 -2.9 -7.3 -6.4 -5.4
Oil-importing countries -5.2 -7.4 -7.9 -7.9 -7.3 -6.4 -6.3
Note: (e): estimates; (p): projections. Source: Statistics Department, African Development Bank.

1. AFriCA’S MACrOECONOMiC PrOSPECtS
44 African Economic Outlook © AfDB, OECD, UNDP 2016
Annex 1.A1. Africa’s potential demographic dividend
Growth in the proportion of the working-age population is boosting growth of per capita GDP (see Box 1.A1.1). Over the past 15 years, the potential demographic impact on Africa’s average annual GDP per capita growth amounted to 0.2%, and is expected to double to 0.4% in the coming 15 years, before declining marginally to 0.3% between 2030 and 2050. The potential demographic dividend will be particularly large in East, West and Central Africa (Tables 1.A1.1 and 1.A1.2 and Figure 1.A1.1), as the demographic transition to lower birth rates has been delayed in these regions, but is now accelerating. This raises the proportion of the working-age population and reduces the dependency ratio. In contrast, the lowering of birth rates in North and Southern Africa is more advanced and the speed of the demographic transition is slowing (Figure 1.A1.2).
The future demographics of Africa can be mapped onto the Demographic Transition Model (DTM), which describes population change over time.7 East, West and Central Africa match stage 3 of the model relatively well, while demographic transition in North and Southern Africa (or at least in the more developed countries in these regions) is more advanced and can be characterised as stage 4. In countries where birth rates are still high, policies could help to accelerate their decline. This would further reduce population growth and increase the potential demographic dividend, as the proportion of the working-age population would increase faster and the dependency ratio would fall further. According to the theory of demographic transition, there is a positive relationship between fertility and child mortality. In order to achieve a desired number of surviving children, fertility tends to be high when child mortality is also high, and declines when child survival increases. While other factors also affect fertility, the impact of child mortality seems to be obvious for African countries (Figure 1.A1.3). This implies that better health care and education together with adequate family planning help to speed up the demographic transition and further improve economic growth and welfare.
In contrast to Africa, the proportion of the working-age population is already declining in more developed countries, as well as in some emerging countries. In the coming years, China will face a pronounced reduction in the proportion of the working-age population, partly as result of the former one-child policy. China’s demographic dividend of past decades could thus act as a “tax” weighing on growth of potential output (West, 2015). Indeed, over the past 15 years China’s demographic transition boosted annual growth of potential GDP per capita by 0.5% (Table 1.A1.2). However, over the next 15 years the change in demographics will, all things being constant, reduce growth by a similar amount (i.e. a turnaround of 1%).

1. AFriCA’S MACrOECONOMiC PrOSPECtS1. AFriCA’S MACrOECONOMiC PrOSPECtS
45African Economic Outlook© AfDB, OECD, UNDP 201644 African Economic Outlook © AfDB, OECD, UNDP 2016
Table 1.A1.1. Estimates and projections of Africa’s population and working-age population
Levels in million (rounded) Annual average growth in %
2000 2015 2030 2050 2002-15 2016-30 2031-50
Africa
Population 814 1 186 1 679 2 478 2.5 2.3 2.0
Working-age population 439 658 985 1 534 2.7 2.7 2.2
East Africa
Population 259 394 579 878 2.8 2.6 2.1
Working-age population 133 211 336 547 3.1 3.1 2.5
Central Africa
Population 96 152 232 369 3.1 2.9 2.4
Working-age population 49 79 128 224 3.2 3.3 2.8
North Africa
Population 172 224 282 354 1.8 1.6 1.1
Working-age population 102 140 181 226 2.2 1.7 1.1
Southern Africa
Population 51 63 70 78 1.3 0.8 0.5
Working-age population 31 41 47 53 1.8 0.9 0.6
West Africa
Population 235 353 516 798 2.7 2.6 2.2
Working-age population 125 188 292 484 2.8 3.0 2.6
Note: The working-age population is aged 15-64.Source: Author’s calculations based on UN DESA (2015).
Table 1.A1.2. Estimates and projections of Africa’s potential demographic dividend
Proportion of population at working age (%)
(Age groups 15-64)Percentage change in the proportion
of population at working age (annual average)
2000 2015 2030 2050 2001-15 2016-30 2031-50
Africa 53.96 55.53 58.56 61.90 0.2 0.4 0.3
East Africa 51.26 53.44 57.98 62.33 0.3 0.6 0.4
Central Africa 50.67 51.66 55.30 60.56 0.1 0.5 0.5
North Africa 59.12 62.61 64.06 63.77 0.4 0.2 0.0
Southern Africa 60.47 65.11 66.99 68.23 0.5 0.2 0.1
West Africa 53.09 53.36 56.54 60.61 0.0 0.4 0.4
Memorandum items:
World 63.00 65.70 64.70 62.70 0.3 -0.1 -0.2
More developed regions 67.50 66.00 61.10 57.80 -0.1 -0.5 -0.3
Less developed regions excluding China 59.60 63.30 64.60 64.30 0.4 0.1 0.0
China 68.30 73.20 68.00 58.90 0.5 -0.5 -0.7
Note: Percentage change refers to the potential demographic impact on annual GDP per capita growth. It refers to the percentage change (not the percentage point change) of the proportion of the working-age population calculated as: 100*(t/t-1 -1). For example, the potential annual average demographic dividend 2015-30 for Africa is calculated as 100*(58.56/55.3-1)/15 = 0.4. Source: Author’s calculations based on UN DESA (2015).

1. AFriCA’S MACrOECONOMiC PrOSPECtS
46 African Economic Outlook © AfDB, OECD, UNDP 2016
Figure 1.A1.1. Potential demographic dividend in Africa by region
0
0.1
0.2
0.3
0.4
0.5
0.6
2001-15 2016-30 2031-45
East Africa Central Africa West Africa North Africa Southern Africa
Percentage points of GDP
Note: The potential impact on GDP per capita growth (in percentage points) is calculated by the percentage change in the proportion of the working-age population (2001-50).Source: Author’s calculations based on UN DESA (2015). 12 http://dx.doi.org/10.1787/888933350060
Figure 1.A1.2. Development and prospects of total fertility (children per woman) in Africa
0
1
2
3
4
5
6
7
8
1970-75 2015-2020 2030-35
Africa East Africa Central Africa North Africa Southern Africa West Africa
Children per woman
Source: UN DESA (2015).12 http://dx.doi.org/10.1787/888933350075

1. AFriCA’S MACrOECONOMiC PrOSPECtS1. AFriCA’S MACrOECONOMiC PrOSPECtS
47African Economic Outlook© AfDB, OECD, UNDP 201646 African Economic Outlook © AfDB, OECD, UNDP 2016
Figure 1.A1.3. Total fertility rate (TFR) per woman and under-5 mortality rate per 1 000 in African countries, 2014
0
1
2
3
4
5
6
7
8
0 20 40 60 80 100 120 140 160 200180
TFR
Under 5-mortality rate
Note: The regression line is TFR = 2.322 + .0237 * U-5MR and the R-square of the regression between the under-5 mortality rate and TFR is 0.623. This mono-causal (and therefore simplistic) approach suggests that TFR of 6 is associated with U-5MR of 155, thus reducing TFR to 3 requires a reduction of U-5MR to around 30. Source: Author’s calculations based on AEO 2015 statistics. 12 http://dx.doi.org/10.1787/888933350087
Box 1.A1.1. Calculating the potential demographic growth dividend
The mechanical demographic impact through labour supply on gross domestic product (GDP) can be seen from the following identities:
(1) GDP = (GDP/E) * E = PROD * E
Where E is the number of employed workers and GDP/E = PROD is productivity per worker. Economic growth is then: (1a) Growth of GDP = growth of E + growth of PROD
With growth of PROD, the share of the employed workers in the labour force (employment rate) and the share of the labour force in the population at working age (participation rate) all remaining constant, the change in growth of GDP is equal to the change in growth of the labour force (LF) and the change in growth of the working-age population (WAPOP).
(1b) Change in growth of GDP = change in growth of employment (E) = change in growth of labour force (LF) = change in growth of working-age population (WAPOP).
The population POP consists of those employed (E) and those non-employed (NE), where NE is the sum of children, pensioners and people at working age who are not employed.
(2) POP = E + NE
Dividing equation (1) by equation (2) gives GDP per capita:
(3) GDP/POP = * PROD
Taking logs of equation 3 and differentiating with respect to time yields:
(3a) Growth of GDP/POP = growth of + growth of PROD
Where is the employment rate (i.e. the share of employed persons in the total population), thus incorporating both participation and employment ( = E/POP). If the share of the labour force in the population at working age (participation rate) and the share of the employed in the labour force (employment rate) remain constant, the growth of GDP per capita is equal to the sum of productivity growth and the growth of the proportion of the working-age population (WAPOP/POP).
(3b) Growth of GDP/POP = growth of PROD + growth of WAPOP/POP
Hence, all other things being equal, increase in the growth of the proportion of the working-age population will increase growth of per capita GDP.

1. AFriCA’S MACrOECONOMiC PrOSPECtS
48 African Economic Outlook © AfDB, OECD, UNDP 2016
Notes
1. The quarterly Ifo World Economic Survey (WES) attempts to draw an up-to-date picture of the current economic situation and the short-term outlook in about 120 industrial, emerging and developing countries. Unlike the official statistics, which are primarily constructed around quantitative information, WES consists of qualitative information including appraisals and expectations of economic experts. The 1 100 survey participants work in research institutes, universities, think tanks, and chambers of industry or financial institutions. In Africa, the survey covers 30 countries and receives on average 150 responses quarterly.
2. According to traditional three-sector theory, the share of the primary sector (agriculture and extractive industry) in overall activity is high during early stages of development, but tends to decline as economies develop. The share of the secondary sector (manufacturing) increases during the low and middle stages of development and declines at higher income levels when labour costs make manufacturing less competitive. In contrast, the share of the tertiary sector (services) continuously increases and becomes most important at higher income levels.
3. The CEMAC members are Cameroon, Central African Republic, Chad, Congo, Equatorial Guinea and Gabon.
4. The WAEMU members are Benin, Burkina Faso, Côte d’Ivoire, Guinea-Bissau, Mali, Niger, Senegal and Togo.
5. The J-curve effect suggests that trade balances initially worsen following currency depreciation, as imports become more costly and exports less valuable. However, the trade balance eventually improves due to low-priced exports, with export volumes increasing and import volumes falling, as local consumers purchase less of the more expensive imports and buy more local goods.
6. The medium scenario assumes that Africa’s total average fertility (children per woman) declines from 4.71 in 2010-15 to 3.11 in 2045-50.
7. The Demographic Transition Model (DTM) distinguishes five stages: i) high stationary population with both high birth rates and death rates; ii) early expanding population with declining death rates, especially among children, as health care improves, while birth rates remain high; iii) late expanding population with continued falling death rates, while birth rates also decline as a result of improved economic conditions, better education and women’s status, and access to contraception; iv) stabilising population with both low birth and death rates (most economically advanced countries are at this stage); and v) declining population with fertility rates falling below the replacement rate (around two children) and the proportion of the elderly increasing (ageing populations).

1. AFriCA’S MACrOECONOMiC PrOSPECtS1. AFriCA’S MACrOECONOMiC PrOSPECtS
49African Economic Outlook© AfDB, OECD, UNDP 201648 African Economic Outlook © AfDB, OECD, UNDP 2016
References
AfDB (forthcoming), “Africa’s performance and prospects in a period of global economic turbulence”, in African Development Report 2015, African Development Bank, Abidjan.
AfDB/NYU Africa House/ATA (2015), Africa Tourism Monitor: Unlocking Africa’s Tourism Potential, Vol. 3/1, African Development Bank, New York University Africa House and Africa Travel Association, Abidjan and New York.
AfDB et al. (2012), African Economic Outlook 2012: Promoting Youth Employment, OECD Publishing, Paris, http://dx.doi.org/10.1787/aeo-2012-en.
AfDB et al. (2011), African Economic Outlook 2011: Africa and its Emerging Partners, OECD Publishing, Paris, http://dx.doi.org/10.1787/aeo-2011-en.
AfDB/OECD/UNDP (2015), African Economic Outlook 2015: Regional Development and Spatial Inclusion, OECD Publishing, Paris, http://dx.doi.org/10.1787/aeo-2015-en.
Awel, A.M. (2012), “Terms of trade volatility and economic growth in sub-Saharan Africa”, MPRA papers no. 48166, University Library of Munich, Germany.
Basu, A.M. and K. Basu (2015), “The prospects for an imminent demographic dividend in Africa: The case for cautious optimism”, in C. Monga and J.Y. Lin (eds.), The Oxford Handbook of Africa and Economics, Vol. II: Policies and Practices, Oxford University Press, Oxford.
Berg, A. et al. (2015), “Monetary policy issues in sub-Saharan Africa”, in C. Monga and J.Y. Lin (eds.), The Oxford Handbook of Africa and Economics, Vol. II: Policies and Practices, Oxford University Press, Oxford.
Canning, D., S. Raja and A.S. Yazbeck (2015), Africa’s Demographic Transition: Dividend or Disaster?, Agence Française de Développement, Paris and World Bank, Washington, DC.
Gallup (2015), Gallup Global Report: Where the Great Jobs Are, October 2015, Gallup Inc., www.gallup.com/services/186197/gallup-global-report-great-jobs-pdf.aspx.
Ifo Institute (2016), World Economic Survey (I/2016), CESifo Group Munich – Ifo Institute, Munich.
IMF (2015), Regional Economic Outlook: Sub-Saharan Africa 2015, International Monetary Fund, Washington, DC, www.imf.org/external/pubs/ft/reo/2015/afr/eng/pdf/sreo0415.pdf.
Leibfritz, W. (2015), “Fiscal policy in Africa”, in C. Monga and J.Y. Lin (eds.), The Oxford Handbook of Africa and Economics, Vol. II: Policies and Practices, Oxford University Press, Oxford.
Leridon, H. (2015), “Afrique subsarienne : une transition démographique explosive”, Futuribles, No. 407 (July-August), pp. 5-21.
McMillan, M. and K. Harttgen (2015), “Africa’s quiet revolution”, in C. Monga and J.Y. Lin (eds.), The Oxford Handbook of Africa and Economics, Vol. II: Policies and Practices, Oxford University Press, Oxford.
OECD (2010), Perspectives on Global Development 2010: Shifting Wealth, OECD Publishing, Paris, http://dx.doi.org/10.1787/9789264084728-en.
Page, J. and A. Shimeles (2014), “Aid, employment, and poverty reduction in Africa”, WIDER Working Paper, 2014/043, United Nations University–WIDER, Helsinki.
Sachs, J.D. (2015), “Africa’s demographic transition and economic prospects”, in C. Monga and J.Y. Lin (eds.), The Oxford Handbook of Africa and Economics, Vol. II: Policies and Practices, Oxford University Press, Oxford.
Schaffnit-Chatterjee, C. and R. Burgess (2015), “African revival shifts east”, Deutsche Bank Research Papers, Deutsche Bank, Frankfurt, http://tinyurl.com/jo7ow56.
UN Comtrade (2015), United Nations Commodity Trade Statistics Database, http://comtrade.un.org/db/ (accessed 15 December 2015).
UN DESA (2015), World Population Prospects: The 2015 Revision (custom data acquired via website), United Nations, Department of Economic and Social Affairs, Population Division, New York.
UNWTO (2016), World Tourism Barometer, Vol. 14, United Nations World Tourism Organization, Madrid, http://www.e-unwto.org.
West, J. (2015), “Great Asian Slowdown”, Asian Century Institute, 21 November, asiancenturyinstitute.com/economy.
World Bank (2015), Africa Pulse: An Analysis of Issues Shaping Africa’s Economic Future, Vol. 12, World Bank Group, Washington, DC, www.worldbank.org/en/region/afr/publication/africas-pulse-an-analysis-issues-shaping-africas-economic-future-october-2015 (accessed 20 January 2016).
World Bank /PwC (2015), Paying Taxes 2016: The Global Picture, World Bank and PricewaterhouseCoopers, Washington, DC.
World Bank (2016a), Doing Business 2016: Measuring Regulatory Quality and Efficiency, World Bank, Washington, DC.
World Bank (2016b), Global Economic Monitor (GEM) Commodities (database), World Bank, Washington, DC, http://data.worldbank.org/data-catalog/commodity-price-data.

51African Economic Outlook© AfDB, OECD, UNDP 2016
Despite falling commodity prices, Africa’s external financial flows
have remained stable overall. This chapter analyses trends in those
flows; from foreign direct investment and portfolio equity which
fell, to remittances and official development assistance which are
increasing. It also studies Africa’s tax revenue collection that has
dropped because of lower resource revenues. The chapter looks
at the policy challenges and opportunities related to attracting
financial inflows ranging from the need to stabilise foreign inflows
and implementing medium- to long-term structural policies as
part of the African Union’s Agenda 2063 to step up the continent’s
development.
Chapter 2
External financial flows and tax revenues for Africa

2. EXtErNAl FiNANCiAl FlOWS AND tAX rEVENUES FOr AFriCA
52 African Economic Outlook © AfDB, OECD, UNDP 2016
In brief
The estimated 208.3 billion USD of external finance – foreign investment, trade, aid, remittances and other sources that Africa attracted in 2015 – was 1.8% lower than the previous year. The total sum is projected to rise again to USD 226.5 billion in 2016. Falling commodity prices, particularly for oil and metals, were one of the key causes for the 2015 fall. Portfolio equity and commercial bank credit flows dried up, reflecting tightening global liquidity and a market sentiment wary of risks. Rising remittances and increased official development assistance largely kept the figure up. African governments have to stabilise financial inflows in the short term and use them for sustained economic diversification for the longer term. Falling resource revenues mean governments must also find ways to broaden the tax base away from oil and commodities.
Africa depends heavily on foreign private and public capital
Flows of finance into Africa – foreign direct investment, portfolio equity and bonds, commercial bank, bilateral and multilateral bank credit, official development assistance and public domestic revenues – have remained broadly stable despite weak conditions in other parts of the world.
Total external flows to Africa for 2015 were estimated at USD 208.3 billion, down from an estimated USD 212.2 billion in 2014. But the figure was predicted to pick up to USD 226.5 billion in 2016.
Figure 2.1. External financial flows to Africa, average 2004-08, 2009-16 current USD billion and % of GDP
0
2
4
6
8
10
12
14
16
18
20
-50
0
50
100
150
200
250
2009 2010 2011 2012 2013 2014 2015 (e) 2016 (p)
Foreign direct investments (FDI) Commercial bank credit (net)
Remittances Official development assistance Portfolio investments
Net official bank credit flows (bilateral and multilateral) UNCTAD projection for FDI
Total flows with corrected UNCTAD projection Total external financial flows in % of GDP (Africa)
Current USD, billion % of GDP
Average 2004-08
Note: ODA estimates (e) and projections (p) are based on the real increase in country programmable aid (CPA) in OECD (2016). The forecast for remittances is based on the projected rate of world growth according to the World Bank.Source: Authors’ calculations based on IMF (2014b, 2015c); OECD (2016); African Economic Outlook data; World Bank (2015a).12 http://dx.doi.org/10.1787/888933350091
There are two starkly different numbers of crucial foreign direct investment (FDI). According to International Monetary Fund (IMF) (2015a) estimates released in October 2015, foreign investment into Africa increased by 16% over the year. In contrast, the United Nations Conference on Trade and Development (UNCTAD) (2016) estimated a 31.4% drop (Figure 2.1) from 2015. Such a decline would suggest that total external
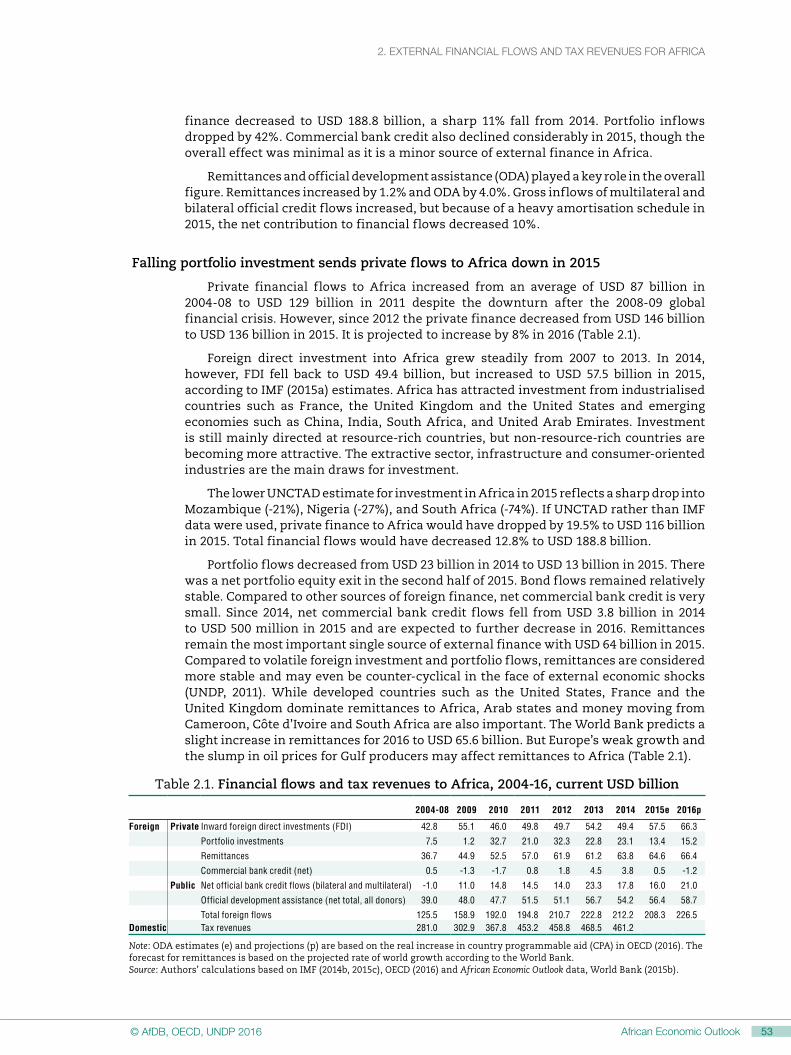
2. EXtErNAl FiNANCiAl FlOWS AND tAX rEVENUES FOr AFriCA2. EXtErNAl FiNANCiAl FlOWS AND tAX rEVENUES FOr AFriCA
53African Economic Outlook© AfDB, OECD, UNDP 201652 African Economic Outlook © AfDB, OECD, UNDP 2016
finance decreased to USD 188.8 billion, a sharp 11% fall from 2014. Portfolio inflows dropped by 42%. Commercial bank credit also declined considerably in 2015, though the overall effect was minimal as it is a minor source of external finance in Africa.
Remittances and official development assistance (ODA) played a key role in the overall figure. Remittances increased by 1.2% and ODA by 4.0%. Gross inflows of multilateral and bilateral official credit flows increased, but because of a heavy amortisation schedule in 2015, the net contribution to financial flows decreased 10%.
Falling portfolio investment sends private flows to Africa down in 2015
Private financial flows to Africa increased from an average of USD 87 billion in 2004-08 to USD 129 billion in 2011 despite the downturn after the 2008-09 global financial crisis. However, since 2012 the private finance decreased from USD 146 billion to USD 136 billion in 2015. It is projected to increase by 8% in 2016 (Table 2.1).
Foreign direct investment into Africa grew steadily from 2007 to 2013. In 2014, however, FDI fell back to USD 49.4 billion, but increased to USD 57.5 billion in 2015, according to IMF (2015a) estimates. Africa has attracted investment from industrialised countries such as France, the United Kingdom and the United States and emerging economies such as China, India, South Africa, and United Arab Emirates. Investment is still mainly directed at resource-rich countries, but non-resource-rich countries are becoming more attractive. The extractive sector, infrastructure and consumer-oriented industries are the main draws for investment.
The lower UNCTAD estimate for investment in Africa in 2015 reflects a sharp drop into Mozambique (-21%), Nigeria (-27%), and South Africa (-74%). If UNCTAD rather than IMF data were used, private finance to Africa would have dropped by 19.5% to USD 116 billion in 2015. Total financial flows would have decreased 12.8% to USD 188.8 billion.
Portfolio flows decreased from USD 23 billion in 2014 to USD 13 billion in 2015. There was a net portfolio equity exit in the second half of 2015. Bond flows remained relatively stable. Compared to other sources of foreign finance, net commercial bank credit is very small. Since 2014, net commercial bank credit flows fell from USD 3.8 billion in 2014 to USD 500 million in 2015 and are expected to further decrease in 2016. Remittances remain the most important single source of external finance with USD 64 billion in 2015. Compared to volatile foreign investment and portfolio flows, remittances are considered more stable and may even be counter-cyclical in the face of external economic shocks (UNDP, 2011). While developed countries such as the United States, France and the United Kingdom dominate remittances to Africa, Arab states and money moving from Cameroon, Côte d’Ivoire and South Africa are also important. The World Bank predicts a slight increase in remittances for 2016 to USD 65.6 billion. But Europe’s weak growth and the slump in oil prices for Gulf producers may affect remittances to Africa (Table 2.1).
Table 2.1. Financial flows and tax revenues to Africa, 2004-16, current USD billion
2004-08 2009 2010 2011 2012 2013 2014 2015e 2016p
Foreign Private Inward foreign direct investments (FDI) 42.8 55.1 46.0 49.8 49.7 54.2 49.4 57.5 66.3
Portfolio investments 7.5 1.2 32.7 21.0 32.3 22.8 23.1 13.4 15.2
Remittances 36.7 44.9 52.5 57.0 61.9 61.2 63.8 64.6 66.4
Commercial bank credit (net) 0.5 -1.3 -1.7 0.8 1.8 4.5 3.8 0.5 -1.2
Public Net official bank credit flows (bilateral and multilateral) -1.0 11.0 14.8 14.5 14.0 23.3 17.8 16.0 21.0
Official development assistance (net total, all donors) 39.0 48.0 47.7 51.5 51.1 56.7 54.2 56.4 58.7
Total foreign flows 125.5 158.9 192.0 194.8 210.7 222.8 212.2 208.3 226.5Domestic Tax revenues 281.0 302.9 367.8 453.2 458.8 468.5 461.2 Note: ODA estimates (e) and projections (p) are based on the real increase in country programmable aid (CPA) in OECD (2016). The forecast for remittances is based on the projected rate of world growth according to the World Bank.Source: Authors’ calculations based on IMF (2014b, 2015c), OECD (2016) and African Economic Outlook data, World Bank (2015b).

2. EXtErNAl FiNANCiAl FlOWS AND tAX rEVENUES FOr AFriCA
54 African Economic Outlook © AfDB, OECD, UNDP 2016
Official financial flows have remained stable
Official development assistance in grants and concessional loans increased in 2015, after a small drop in 2014. At USD 56 billion in 2015, ODA remains the most important source of public finance for Africa and is expected to increase by 4.1% in 2016. Net official bank credit from bilateral and multilateral stakeholders have decreased from USD 17.8 billion in 2014 to USD 16 billion in 2015 but is expected to reach USD 21 billion in 2016.
Important lenders for Africa’s infrastructure investment are the People’s Bank of China, the China Development Bank, and the Export-Import Bank of China. In addition to established lenders such as the World Bank, the African Development Bank and the European Investment Bank, the New Development Bank BRICS, founded in 2014, is expected to significantly contribute to Africa’s campaign to reach the United Nations’ Sustainable Development Goals by complementing existing public and private financial institutions (UN DESA, 2015b; UN DESA, 2016).
Overall, African countries’ total domestic public revenues are down. This is mostly due to a fall in taxes on resource revenues. While countries with commodities have been confronted with a drop in tax-GDP ratios across all categories, non-resource-rich countries have increased tax revenues and tax-GDP ratios.
Africa faces volatile FdI inflows
Foreign investment into Africa increased by 16% from to USD 57.5 billion in 2015, according to IMF figures. Flows to North Africa reversed a downward trend, as investment increased by 20% from USD 17.2 billion in 2014 to USD 20.7 billion in 2015. East Africa has seen higher FDI since 2010. In 2015, the figure rose 16% to USD 8.9 billion in 2015 from USD 7.7 billion the previous year. For West Africa investment rose from USD 9.3 billion to USD 9.7 billion. Central Africa saw a decline from USD 6.6 billion in 2014 to USD 5.4 billion. Southern Africa received USD 12.9 billion of FDI in 2015 against USD 8.7 billion in 2014, and USD 11.4 billion in 2013.
The leading African investment destinations in 2015 were: Egypt (USD 10.2 billion), Mozambique (USD 4.7 billion), Morocco (USD 4.2 billion), South Africa (USD 3.6 billion), Ghana (USD 2.5. billion), the Democratic Republic of the Congo (USD 2.5 billion), Zambia (USD 2.4 billion), Tanzania (USD 2.3 billion), Ethiopia (USD 2.1 billion), Guinea (USD 1.9 billion), and Kenya (USD 1.9 billion). Africa has attracted foreign investment from many countries, notably from the United Kingdom, France, the United States, and from the emerging economies China, India, South Africa, and the United Arab Emirates (Figure 2.2).
Terrorist activity and deteriorating security in some Sahel countries and political instability are a threat to investment. External and domestic factors influence Africa’s investment return, including economic slowdowns in emerging economies and the weak recovery in the European Union. Declining oil and metals prices have led foreign investors to scale down operations in resource-rich countries. There is a positive side too. African manufacturing and services may benefit from increased inflows due to the stronger US dollar and China’s yuan renminbi. Investment from the emerging economies in Africa’s skills and infrastructure development can help to overcome the reliance on resource-driven FDI.
Without Egypt, investment to North Africa would have dropped. FDI to Egypt increased from USD 5.5 billion in 2014 to USD 10.2 billion in 2015. United Arab Emirates investors have played an important role in Egypt’s recovery. Flows into Morocco fell to USD 4.2 billion in 2015 from USD 4.7 billion in 2014. But Morocco became the third-

2. EXtErNAl FiNANCiAl FlOWS AND tAX rEVENUES FOr AFriCA2. EXtErNAl FiNANCiAl FlOWS AND tAX rEVENUES FOr AFriCA
55African Economic Outlook© AfDB, OECD, UNDP 201654 African Economic Outlook © AfDB, OECD, UNDP 2016
largest recipient of foreign investment in Africa in 2015. European firms were leading investors in Morocco, which benefits from historic ties and proximity to Western Europe, as well as a proactive FDI policy and skilled workers who earn lower wages than in Europe. Investment into Tunisia has been seriously affected by political and economic turbulence since 2009. FDI has declined by more than 40% since 2012 to USD 1.1 billion in 2015. The precarious political and security situation in the Sahel is a risk for West and Central Africa.
Figure 2.2. Inward FDI by regions 2004-16, USD billion
0
5
10
15
20
25
30
Central Africa East Africa North Africa Southern Africa West Africa
USD billion
Average 2004-08 2009 2010 2011 2012 2013 2014 2015 (e) 2016 (p)
Source: Authors’ calculation based on IMF data (2014b, 2015c).12 http://dx.doi.org/10.1787/888933350102
Investment in commodities has suffered. Nigeria has seen a sharp decrease in investment over the past five years from USD 8.1 billion in 2011 to USD 1.4 billion in 2015. Ghana attracted the biggest share of West African FDI (USD 2.5 billion), followed by Guinea (USD 1.9 billion), Côte d’Ivoire (USD 1.0 billion) and Mauritania (USD 0.8 billion). Countries such as Liberia, Senegal, Sierra Leone, and Togo received less than USD 500 million each in 2015.
In East Africa, Tanzania (USD 2.3 billion) and Uganda (USD 1.3 billion) received stable investments in 2015. Uganda’s oil sector is expected to be the country’s main investment magnet in future. Kenya’s investment has risen from USD 500 million in 2013 to USD 1.9 billion in 2015. Ethiopia’s has gone up from USD 1.2 billion in 2013 to USD 2.1 billion in 2015. Ethiopia’s FDI is mainly in labour-intensive areas. Although the 32 projects launched there in 2015 accounted for only 4.4% of total investment in Africa, these made up 18.5% of the jobs from the FDI in Africa. Ethiopia has slowly been opening up to foreign investment in the manufacturing and retail sectors (fDi Markets, 2016).
The Democratic Republic of the Congo received USD 2.5 billion in 2015 and the Republic of the Congo USD 1.5 billion, in each case half of the 2014 levels. South Africa remains a key foreign investment destination in Southern Africa but its USD 3.6 billion was down from USD 8.2 billion in 2013 and USD 4 billion in 2014. Mozambique – the biggest recipient of foreign investment to Southern Africa in 2015 – attracted USD 4.7 billion.
Consumer-oriented sectors in Africa attract growing foreign investment
Resource-rich countries still get the most foreign investment, but countries with no major commodities to rely on are taking a larger share of FDI. Countries that are not resource-rich received an estimated 37% of Africa’s FDI in 2015, compared to 30% in 2010 (Figure 2.3). In 2015, the FDI-to-GDP ratio for non-resource-rich countries stood at

2. EXtErNAl FiNANCiAl FlOWS AND tAX rEVENUES FOr AFriCA
56 African Economic Outlook © AfDB, OECD, UNDP 2016
4.4%, up from 3.8% in 2010. The ratio for resource-rich countries increased from 2.0 % to 2.5% from 2010 to 2015. Several countries without significant resources are attracting investors, including Kenya, Tanzania and Uganda, reflecting the shift towards consumer goods. Kenya is becoming an East African business hub for manufacturing, transport, services and information and communications technology (ICT) (McKinsey, 2015a and 2015b).
Figure 2.3. Foreign direct investment to Africa: Resource-rich vs. non-resource-rich countries, 2000-16
0
0.5
1.0
1.5
2.0
2.5
3.0
3.5
4.0
4.5
5.0
0
5
10
15
20
25
30
35
40
45
Resource-rich countries (left axis) Non-resource-rich countries (left axis)
Non-resource-rich countries (right axis)Resource-rich countries (right axis)
Average 2004-08 2009 2010 2011 2012 2013 2014 2015 2016
USD billion % of GDP
Source: Authors’ calculations based on IMF (2014b, 2015c).12 http://dx.doi.org/10.1787/888933350114
The Herfindahl-Hirschman index, a concentration ratio, indicates a shift to ICT, services, and manufacturing across Africa. The index went down from 0.43 in 2003 to 0.18 in 2014 and 0.14 in 2015. This trend is also confirmed by data on announced greenfield projects in 2015 which showed that services and manufacturing accounted for about 54% of the total value of projects in Africa (fDi Markets, 2016). Investment is starting to diversify into consumer-market oriented industries, including ICT, retail, food and financial services.
African cities are future hubs of investment
With urbanisation, African cities are growing consumer markets increasingly targeted by foreign investors. Disposable income and spending power in Africa’s major cities will grow (Oxford Economics, 2015). Forecasts show that the GDP of major cities is increasing. The most important ones will be Cairo, Cape Town, Johannesburg, Lagos and Luanda. This ranking reflects the quality of the business climate, infrastructure and logistics, and availability of skilled workers.
A recent surge in infrastructure investment indicates that states are investing in transport corridors to connect urban agglomerations and transform them into urban clusters. Examples include the Greater Ibadan-Lagos-Accra urban corridor, the Maputo Development Corridor, and the Northern Corridor between East and Central Africa. These investments will surge with deeper market integration through reduced transport and trade costs. They will also foster competition and productivity, which will make African hubs more attractive for foreign investors.

2. EXtErNAl FiNANCiAl FlOWS AND tAX rEVENUES FOr AFriCA2. EXtErNAl FiNANCiAl FlOWS AND tAX rEVENUES FOr AFriCA
57African Economic Outlook© AfDB, OECD, UNDP 201656 African Economic Outlook © AfDB, OECD, UNDP 2016
China, India and other emerging economies are important FDI providers
While the European Union countries and the United States remain the largest investors in Africa, the emerging economies are a vital source too. India’s share of announced greenfield investment projects grew from 3.3% in 2003-08 to 6.1% in 2009-2015. China’s share, however, fell from 4.9% to 3.3%. In 2015 the United States had a 9.7% share of all greenfield investment, while the EU accounted for 37.4% (fDi Markets, 2016). The most important emerging investors are Bahrain, China, India, Qatar, South Africa, and United Arab Emirates (Figure 2.4). Middle East investors, who have injected more than USD 100 billion over the past decade, lead the way.
Figure 2.4. Total FDI inflows into Africa from emerging economies, 2003-15, USD billion
0
10
20
30
40
50
60
70
80
90USD billion
United
Arab
Emira
tes India
China
South
Africa
Bahrai
nQata
r
Russia
Kuwait
Korea
Saudi
Arabia
Brazil
Turke
y
Viet N
am
Malays
ia
Source: Authors’ calculations based on fDi Markets (2016).12 http://dx.doi.org/10.1787/888933350123
Greenfield investment in Africa fosters services and manufacturing
Although greenfield investment declined in 2015, there is a trend toward services, manufacturing and special economic zones, which can nurture structural change in Africa. In 2015, the leading investors in terms of announced greenfield investment were Italy (USD 7.4 billion), the United States (USD 6.9 billion), France (USD 5.8 billion), the United Kingdom (USD 4.9 billion) and the United Arab Emirates (USD 4.3 billion). The United States had 96 greenfield projects in 2015 and the United Kingdom 77 projects. The United Arab Emirates had 50 projects and India 45 projects (fDi Markets 2016).
Services and manufacturing remain key investment areas. Some 39.7% of announced greenfield FDI projects in Africa and 24.6% of related capital expenditure were in manufacturing in 2015. The services sector took 51% of projects and 28.4% of capital expenditure. There were large investments in manufacturing, mainly in electronic equipment, motor vehicles and food. Africa’s services-related FDI stock increased considerably (fDi Markets, 2016).
The relocation of manufacturing and services from emerging and advanced countries to Africa due to wages and efficient special economic zones may gain momentum if support programmes are effectively managed. East African countries are an example of how the continent can exploit comparative advantages:

2. EXtErNAl FiNANCiAl FlOWS AND tAX rEVENUES FOr AFriCA
58 African Economic Outlook © AfDB, OECD, UNDP 2016
• East African countries are economically more diverse than resource-rich countries and relatively well-integrated as a region. Kenya, Tanzania, Uganda, Burundi and Rwanda form the East African Community (EAC) which has established a common market.
• The EAC countries plus the wider East Africa, including Ethiopia, Madagascar, Mauritius and Seychelles, together have 300 million people with a combined GDP of USD 530 billion.
Portfolio equity flows are down, but new bonds remain resilient
Portfolio inflows to Africa in 2015 were half the size of the period from 2012 to 2014. While bond issuances have remained resilient, portfolio equity inflows were reversed in the second half of 2015. Over the last decade, portfolio equity inflows to Africa have increased their share of total investment, with peaks in 2006 and 2012. A key development during the 2000s has been the increasing reliance of African governments on markets for foreign and domestic debt financing.
Compared to the emerging economies, portfolio flows to Africa’s leading markets have been relatively resilient. According to the World Bank (2016a), global investors withdrew about USD 52 billion from emerging market equity and bond funds in the third quarter of 2015.
During the 2008-09 global financial crisis, portfolio inflows fell sharply. Since 2010, by contrast, gross portfolio inflows to Africa have stayed positive. They peaked in 2010 and 2012, adding up to more than USD 32 billion each year. The ending of quantitative easing in the United States, oil market uncertainty and political risks have weighed on investor sentiment towards Africa recently, however. In 2015, gross portfolio inflows to Africa fell by USD 10 billion compared to 2013 and 2014, to USD 13.4 billion. For 2016, they are expected to stay flat.
Gross portfolio outflows from Africa stayed at roughly USD 5 billion each year from 2013 to 2015. Consequently, Africa’s net portfolio flows (inflows minus outflows) have remained positive since 2010. On balance, they have contributed net foreign savings to Africa worth USD 82 billion during 2010-15, or USD 13.7 billion annually on average.
Figure 2.5. Africa’s inward and outward portfolio flows, 2004–16, USD billion
Current USD billion
-10
-5
0
5
10
15
20
25
30
35
Average 2004-08 2009 2010 2011 2012 2013 2014 2015 2016
Outward portfolio investmentsInward portfolio investments Net portfolio flows
Source: Authors’ illustration based on IMF (2015c).12 http://dx.doi.org/10.1787/888933350134

2. EXtErNAl FiNANCiAl FlOWS AND tAX rEVENUES FOr AFriCA2. EXtErNAl FiNANCiAl FlOWS AND tAX rEVENUES FOr AFriCA
59African Economic Outlook© AfDB, OECD, UNDP 201658 African Economic Outlook © AfDB, OECD, UNDP 2016
Equity portfolio flows have been volatile over the past two decades. From a net equity outflow for 2009 they jumped to a net inflow in 2010 of almost USD 20 billion. Since then, they have levelled off, to a mere USD 1.2 billion for 2015. While equity flows can be an important form of participatory finance, they are not a reliable source of foreign finance. International public offerings (IPOs), by contrast, matter more for corporate finance in Africa. From 2010 to 2014, Africa has successfully raised corporate capital through IPOs and further offers that exploited booming African stock markets. Box 2.1 provides detail.
Volatile portfolio equity flows were reflected in most African equity markets that produced negative returns in the second half of 2015. Many observers see the US Federal Reserve’s policy tightening as the culprit for the recent retrenchment. Domestic factors have also contributed to reduced investor demand for assets from emerging economies. Slower world growth added to investor concerns, particularly against the backdrop of the commodity price slump.
Box 2.1. Raising capital through initial public offerings
The ease with which firms list on stock markets through international public offerings (IPOs) matters for Africa’s corporate finance. IPO Watch Africa 2014 found that USD 37.4 billion was raised through 90 IPOs and further offers from 2010 to 2014 in African capital markets. The IPOs brought in USD 6.3 billion. Twenty-four African companies were listed on equity markets in 2014, raising USD 1.7 billion through 24 IPOs and some further listings. Listings on the Johannesburg Stock Exchange accounted for 32% of Africa’s total IPO capital in 2013 and 44% in 2014.
Reflecting improved investor sentiment across the continent during 2010-14, recent IPO trends indicate a greater share of capital raised on markets outside of South Africa. Further offers, in contrast to IPOs, remained dominated by capital raised in South Africa, which accounted for 87% of proceeds in 2014.
Several top IPOs in 2013 and 2014 had a notable international component, either foreign companies raising capital directly on African exchanges, or African companies marketing shares to international investors through dual listings or sales to institutional buyers abroad. In addition to the USD 31.1 billion raised through further offers on African exchanges from 2010 to 2014, USD 1.2 billion of further offer capital was raised by African companies on international exchanges.
Johannesburg (South Africa) has the most companies listed and the biggest capitalisation in Africa, followed by Cairo (Egypt), Lagos (Nigeria) and Casablanca (Morocco). Source: PWC (2014).
Bond issues rose substantially in sub-Saharan countries from 2011 to 2014. In 2011, there were USD 1 billion in bond issues. By the end of 2014 the figure was USD 6.2 billion (Vellos, 2015). Some countries had benefited from debt relief programmes such as the Heavily Indebted Poor Countries initiative and the Multilateral Debt Relief Initiative. Up to mid-2014, steady global market conditions and the potential for higher returns for investors had paved the way for more access to international markets, where the average return for these bond issues is about 6.6%, with an average maturity of 10 years. In 2015, in the face of declining bank credit flows and net portfolio outflows, some countries continued to tap the international bond market to finance investment programmes. Côte d’Ivoire’s sovereign bond issue in 2015 was followed by Gabon, Zambia, Ghana, Angola, and Cameroon. Angola and Cameroon issued maiden 10-year bonds (World Bank, 2016c). The six countries issued bonds worth USD 6 billion by the end of 2015. Eurobond issues by sub-Saharan countries with stronger economies (excluding South Africa) held up well in 2015 (Masetti, 2015). Bond issues in 2015 compare to annual volume at record levels in 2013 and 2014 when 12 countries, many of them debut issuers, placed bonds worth USD 12 billion in international capital markets.

2. EXtErNAl FiNANCiAl FlOWS AND tAX rEVENUES FOr AFriCA
60 African Economic Outlook © AfDB, OECD, UNDP 2016
Bond spreads reflected the tough economy, the change in investor sentiment and rating changes, especially in the second half of 2015. While new issues went ahead, Africa’s borrowers had to offer significantly higher yields, and yields on secondary markets jumped to multi-year highs. For Zambia and Côte d’Ivoire, primary market yields increased by 70 and 100 basis points respectively, and for Ghana, by 260 basis points to 10.8% in relation to the last issues in 2014. Angola, a new bond debt issuer, had to offer a yield of 9.5%.
As all outstanding sovereign Eurobonds in Africa are denominated in US dollars, any depreciation will affect the local currency value of debt service payments. This is potentially more harmful for interest burdens than rising spreads. Currency falls against the US dollar since mid-2014 have been most severe for the Zambian kwacha, the Angolan kwanza, the Namibian dollar, the Ugandan shilling and the Tanzanian shilling which lost between 20% and 51% year-on-year against the US dollar. Zambia has been hit hardest. Its debt service costs rose in 2015 by 18 percentage points of GDP (left-hand scale in Figure 2.6) and by 106% in local currency terms (right-hand scale).
Figure 2.6. Change in debt service cost, sub-Saharan Africa, 2015
0
20
40
60
80
100
120
0
2
4
6
8
10
12
14
16
18
Zambia
Namibi
a
Ghana
Gabon
Côte d’
Ivoire
Ugand
a
Seneg
al
Kenya
Angola
Congo
Rwanda
Tanz
ania
Ethiop
ia
Nigeria
Percentage points of GDP year on year (left) % year on year (right)
Source: Masetti (2015).12 http://dx.doi.org/10.1787/888933350143
bank credit flows slow as repayments grow
Official bank credit flows to Africa from multilateral sources rose again in 2015, while bilateral official bank credit was sharply curtailed. Commercial bank credit to the continent has turned negative in net flow terms as shrinking disbursements fell short of rising amortisation payments. Some countries are increasingly vulnerable to deteriorating debt financing profiles and sensitive to macro-fiscal shocks.
Net bank credit flows to Africa concentrated overwhelmingly on official bank credit in 2015. Figure 2.7 reveals that, by contrast, private commercial banks sharply reduced their new lending. Commercial bank lending was particularly cut for North African borrowers. Gross commercial bank credit flows to Africa fell from USD 9.5 billion in 2014 to USD 3.8 billion in 2015. Allowing for amortisation, net commercial bank lending to the continent shrank from USD 3.8 billion in 2014 to just USD 500 million in 2015. Future commercial bank lending is projected to fall further in 2016 and 2017. Despite scheduled repayments contained at roughly USD 3 billion for 2016 and 2017, respectively, net commercial bank credit flows will likely subtract from rather than add to Africa’s domestic savings. Net private bank credit flow is projected at a negative USD 1.16 billion in 2016 and USD 2.96 billion in 2017.

2. EXtErNAl FiNANCiAl FlOWS AND tAX rEVENUES FOr AFriCA2. EXtErNAl FiNANCiAl FlOWS AND tAX rEVENUES FOr AFriCA
61African Economic Outlook© AfDB, OECD, UNDP 201660 African Economic Outlook © AfDB, OECD, UNDP 2016
Figure 2.7. Net commercial bank credit flows to Africa, 2004-17, USD billion
2009 2010 2011 2012 2013 2014 2015 2016 2017-8
-6
-4
-2
0
2
4
6
8
10
12 USD billion
Disbursements Amortisation Disbursements - amortisation
Average 2004-08
Source: World Bank (2016c). 12 http://dx.doi.org/10.1787/888933350158
Data on sources for bank credit to Africa is hard to find. The People’s Bank of China, the China Development Bank, and the Export-Import Bank of China have supported large-scale investment in African infrastructure but do not publish up-to-date information (Pigato and Tang, 2015). For other bilateral and multilateral lenders, Economist Corporate Network (ECN) (2015) lists the World Bank, African Development Bank, Development Bank of Southern Africa, Export-Import Bank of the United States, African Export-Import Bank, European Investment Bank, Agence Française de Développement (AFD), Japan Bank for International Cooperation (JBIC), Islamic Development Bank and Kreditanstalt für Wiederaufbau (KfW) as the largest creditors.
Despite steady growth in private sector funding over the past decade, official development finance backs 80% of infrastructure funding with China heading the list of investors, according to a 2015 report by ECN. An important source of foreign finance for Africa stems from official creditors, including export credit agencies (Box 2.2). According to the Infrastructure Consortium for Africa Report 2013, grants compose around 30% of funding extended, while 67% comes from bank credit and export credit flows.
Box 2.2. Who is funding Africa’s infrastructure?
The Infrastructure Consortium for Africa (ICA) acts as a platform to increase infrastructure financing, help remove policy and technical barriers, facilitate co-operation, and increase knowledge through monitoring, reporting and sharing best practices. Its annual reports provide some evidence on funding commitments for Africa’s infrastructure in four sectors – energy, transport, water, and information and communication technology. Table 2.2 provides data for the biggest creditors with annual commitments above USD 1 billion reported.
Table 2.2. Funding commitments by origin, USD billionOrigin 2013 2014
China 13.4 3.1Europe 7.4 6.4United States 7.0 n.a.World Bank 4.5 6.5AfDB 3.6 3.6Arab Coordination Group 3.3 3.5Japan 1.5 2.1South Africa 1.2 1.0Total 99.6 74.5
Source: ICA (2014, 2015).

2. EXtErNAl FiNANCiAl FlOWS AND tAX rEVENUES FOr AFriCA
62 African Economic Outlook © AfDB, OECD, UNDP 2016
Official bank credit disbursements to Africa, from bilateral and multilateral sources, have almost doubled since 2008 (Figure 2.8). Then, these sources provided USD 18.6 billion. By 2015, they had reached USD 34.7 billion and are projected to rise in 2016 to USD 39.5 billion. Allowing for amortisation in each corresponding year, Figure 2.11 also provides evidence on net official bank credit flows.
Net official credit flows (disbursements minus amortisation) have declined in 2015, mainly due to a heavy amortisation schedule on bilateral liabilities. Payments to bilateral official creditors jumped to USD 13 billion in 2015 and are projected at that level for 2016, too. This compares to much lower payments for 2009–14 when amortisation to bilateral official creditors averaged USD 5.4 billion. Northern Africa has seen net official bank credit flows curtailed, as bilateral credit to the region turned negative from 2014, mostly as a result of Egypt’s heavy amortisation schedule. The main bilateral borrowers in sub-Saharan Africa were Republic of the Congo and Côte d’Ivoire, mainly through agreements with China. While bilateral official lending accounted for 53.7% of total to Africa in 2013, it fell below multilateral lending in 2014.
Figure 2.8. Multilateral and bilateral official bank credit flows to Africa, 2004-17, USD billion
-30
-20
-10
0
10
20
30
40
50
60
70
2009 2010 2011 2012 2013 2014 2015 2016 (e) 2017 (p)
Multilateral, disbursements Multilateral, amortisationBilateral, disbursements
USD billion
Bilateral, amortisation Bilateral, disbursements - amortisation Multilateral, disbursements - amortisation
Average 2004-08
Note: (e) estimates; (p) projections. Source: World Bank (2016c).12 http://dx.doi.org/10.1787/888933350165
Multilateral development banks currently provide the most significant volume of bank credit resources to Africa (Figure 2.8). While net bilateral bank credit flows have dropped since 2014, the rise of net multilateral bank disbursements to sub-Saharan Africa has continued unabated. New gross multilateral disbursements for African borrowers have risen to record levels, USD 17.3 billion in 2015. Disbursements are projected to rise in 2016 to more than USD 21 billion, but the World Bank predicts they could drop sharply after.
There is a striking divergence in the percentage share of short-term debt (with a maturity of less than one year) in total external debt between sub-Saharan and North Africa (Figure 2.9). In sub-Saharan Africa, the prevalence of official over private flows and the dominance of multilateral development bank credit has helped to keep the share of short-term debt in total external debt contained below 10% in recent years. As a result, the external debt is less volatile and reversible. By contrast, the percentage share of short-term debt in total external debt has been rising in North Africa. In 2014, the share reached 22.5%.

2. EXtErNAl FiNANCiAl FlOWS AND tAX rEVENUES FOr AFriCA2. EXtErNAl FiNANCiAl FlOWS AND tAX rEVENUES FOr AFriCA
63African Economic Outlook© AfDB, OECD, UNDP 201662 African Economic Outlook © AfDB, OECD, UNDP 2016
Figure 2.9. Africa’s short-term debt, % of total external debt, 2004-14
%
0
5
10
15
20
25
Average 2004-08 2009 2010 2011 2012 2013 2014
North Africa Sub-Saharan Africa
Source: World Bank (2016c).12 http://dx.doi.org/10.1787/888933350176
Lower oil and base metal prices since 2014 will make commodity exporting countries more vulnerable to debt. The latest list of debt sustainability analyses for low-income countries (for the Poverty Reduction and Growth Trust Fund) shows that during 2015 the debt sustainability outlook had worsened for Cameroon, Central African Republic, the Republic of the Congo, Ethiopia, Ghana, and Zambia. Debt vulnerability had already been high in Burundi and Chad, while Sudan and Zimbabwe were listed as in debt distress. Among trust fund eligible countries, the debt sustainability outlook improved during 2015 only in Senegal, thanks to the incorporation of heavy remittances in the country’s debt analysis.
Remittances are a major, stable resource for African development
Remittances represent a key source of capital for African countries. They can be leveraged to spur investment and growth, but efforts to maximise their development impact face major obstacles. And recent developments in the resource-rich countries of the Middle East and Russia and the relative stagnation of European Union growth suggest that remittances will slow.
Of an estimated 23.2 million migrants from sub-Saharan Africa, 26% live in OECD countries and 65.6% in Africa (World Bank, 2016b). The largest home countries of migrants were Burkina Faso, the Democratic Republic of the Congo, Côte d’Ivoire, Nigeria, Somalia, and Sudan. Africa hosted 18 million migrants, with the majority going to Côte d’Ivoire, Ethiopia, Kenya, Nigeria, and South Africa.
Developed countries dominate remittances to Africa, but African countries like Cameroon (USD 2.4 billion in 2015), Côte d’Ivoire (USD 1.3 billion), and South Africa (USD 1.1 billion) transferred large remittances to other African countries. Four countries account for nearly half of remittances sent to Africa: the United States (USD 8.4 billion), Saudi Arabia (USD 8.3 billion), France (USD 6.9 billion), and the United Kingdom (USD 5.2 billion) (World Bank, 2015a). Bilateral remittances to Africa amounted to USD 63.8 billion in 2015. Low-income countries such as Liberia, Gambia, Comoros and Lesotho received the largest amount of remittances as a share of GDP (Table 2.3).

2. EXtErNAl FiNANCiAl FlOWS AND tAX rEVENUES FOr AFriCA
64 African Economic Outlook © AfDB, OECD, UNDP 2016
Table 2.3. The 15 largest recipients of remittances in Africa, 2015ranked by % of GDP
% GDP USD per capita Current USD, billion
Liberia 28.18 132.17 0.57
Gambia 23.74 91.24 0.18
Comoros 22.76 167.74 0.13
Lesotho 19.87 211.17 0.40
Cabo Verde 11.81 369.47 0.19
Senegal 11.54 107.84 1.61
Sao Tome and Principe 8.93 143.33 0.03
Togo 8.30 48.00 0.34
Mali 8.17 54.90 0.89
Morocco 6.48 199.37 6.68
Tunisia 5.17 206.17 2.29
Madagascar 4.49 17.64 0.43
Guinea-Bissau 4.41 25.68 0.05
Nigeria 4.23 116.75 20.86
Uganda 4.22 26.39 1.05
Benin 2.70 19.13 0.21
Source: Authors’ calculations based on World Bank (2015b).
The regional distribution of remittances will remain uneven
Official remittances to African countries are unevenly distributed, with North African (49.5%) and West African (40.8%) countries receiving the bulk of flows in 2014 (Figure 2.10). Remittances to North Africa were expected to remain stable in 2015, rising to USD 31.7 billion. They are expected to increase to USD 32.1 billion in 2016 (World Bank, 2015b). Egypt has seen steadily increasing remittances (USD 7.1 billion in 2009 but USD 20.4 billion in 2015) and is now the largest recipient of remittances in North Africa. Large amounts also went to Morocco (USD 6.7 billion in 2015, USD 6.9 billion in 2014), and Tunisia with USD 2.3 billion (2014 and 2015).
Remittances to sub-Saharan Africa are projected to rise 1.6% to USD 32.3 billion in 2015 and are expected to grow again to USD 33.6 billion in 2016. Nigeria alone accounts for about two-thirds of total remittances to sub-Saharan Africa, but these are estimated to have remained flat in 2014 and 2015 at roughly USD 21 billion. There was however strong growth in Kenya (10.7%), South Africa (7.1%) and Uganda (6.8%).
Remittance dependency varies. In Gambia, Lesotho, Liberia and Comoros remittances equalled about 20% of GDP in 2015.
Growth in African remittances is expected to slow due to the weak economic growth in Europe, the impact of lower oil prices in the Middle East, the depreciation of the euro and the tightening of migration controls in many remittance source countries.
Countries with a large population of migrants could harness the potential of remittances to develop their financial sector and spur investment and growth. But more transparency is needed.
Several African countries are tapping into the pool of remittances’ funds by issuing bonds for investments in their homelands. Money raised through diaspora issues could be used to finance projects of interest to overseas migrants, such as housing, schools, hospitals and infrastructure. According to the African Development Bank, Africa could potentially raise USD 17 billion a year by using future remittances as collateral. A number of obstacles prevent African countries from deriving the full benefit of remittances.
Low international oil prices could reduce remittances from the Gulf states in the medium-to-long term. In the short term, however, significant foreign exchange reserves and strong fiscal positions could support current spending, delaying the impact of

2. EXtErNAl FiNANCiAl FlOWS AND tAX rEVENUES FOr AFriCA2. EXtErNAl FiNANCiAl FlOWS AND tAX rEVENUES FOr AFriCA
65African Economic Outlook© AfDB, OECD, UNDP 201664 African Economic Outlook © AfDB, OECD, UNDP 2016
low oil revenues on migrant jobs. Remittances to all of Africa are expected to grow to USD 65.7 billion in 2016 (World Bank, 2016b). Conflict in the Middle East is causing international displacement and remains a major risk factor for remittances.
Figure 2.10. Remittances per African subregion, 2004-15current USD billion
2009 2010 2011 2012 2013 2014 2015e0
0.5
1.0
1.5
2.0
2.5
3.0
3.5
0
10
20
30
40
50
60
70
Southern Africa West Africa
North Africa Central Africa East Africa
Current USD, billion %
Total remittances to Africa as % of GDP
Average 2004-08
Source: Authors’ calculations based on World Bank (2015b).12 http://dx.doi.org/10.1787/888933350186
official development assistance remains stable but falls short of official pledges
There has been a rise in net official development assistance from a low of USD 21 billion (at constant 2012 values) to a 2013 peak of USD 50 billion (Figure 2.11). According to the OECD, in 2014, total net ODA to Africa dropped by USD 3 billion. With Africa’s strong GDP growth, the value of the assistance has fallen from a 2009 peak of 2.63% of African recipients’ GDP to below 2% by 2014. Country programmable aid (CPA), the amount of aid which donors can allot to an individual country and which is considered a good predictor of ODA, had been programmed to increase from 2015. The projection of net ODA disbursements for 2015 and 2016 is based on CPA projections, adjusted to total ODA.
Figure 2.11. Net official development assistance disbursements to Africa, 1997-2016 constant 2012 USD billion
0
10
20
30
40
50
60
1997 1998 1999 2000 2001 2002 2003 2004 2005 2006 2007 2008 2009 2010 2011 2012 2013 2014 2015 2016
Other ODA Bilateral debt relief Humanitarian aid Projection
Constant 2012 USD billion
Source: Authors’ calculations based on OECD (2016).12 http://dx.doi.org/10.1787/888933350195

2. EXtErNAl FiNANCiAl FlOWS AND tAX rEVENUES FOr AFriCA
66 African Economic Outlook © AfDB, OECD, UNDP 2016
In the Addis Ababa Action Agenda (UNDESA, 2015a) adopted at the Third International Conference on Financing for Development, and endorsed by the UN General Assembly in 2015, ODA providers reaffirmed past commitments. Many developed countries promised to reach the target of devoting 0.7% of gross national income (GNI) to ODA and 0.15% to 0.20% of GNI to least developed countries. Members of the OECD’s Development Assistance Committee (DAC) have also committed to reverse the decline of ODA to Africa by adhering to the 0.7% target. In the Addis Ababa Action Agenda, donors are specifically asked to maintain 2013 ODA levels as a minimum.
Multilateral aid and ODA from DAC donors remain stable
Multilateral aid to Africa remained stable in 2014 and reached USD 20.6 billion. A similar figure was reached in 2013. The most important contributors in 2014 were European Union institutions (USD 6.7 billion), the International Development Association (IDA) (USD 6.4 billion), the Global Fund (USD 2 billion) and the African Development Fund (USD 1.9 billion). While EU institutions increased ODA to Africa by 13.6% between 2013 and 2014, the Global Fund decreased disbursements by 22%.
Multilateral aid to Africa may be replaced by non-concessionary multilateral lending and thus fall over the next decade. When countries’ per capita income grows above thresholds for IDA eligibility, they lose their entitlement to multilateral aid, despite the fact that they may have a great number of people in extreme poverty. Reisen and Garroway (2014) project that Cameroon, Guinea, Kenya, Mauritania and Senegal will by 2025 move out of IDA eligibility (per capita GNI below USD 1 215 in 2016). They also project Côte d’Ivoire, Ghana, Lesotho and Nigeria to graduate from the higher, historical IDA eligibility of USD 1 965.
Bilateral ODA from DAC donors also remained almost stable in 2014 at USD 29 billion. The major donors have been the United States (USD 9.3 billion), the United Kingdom (USD 4.3 billion), Germany (USD 3 billion) and France (USD 2.9 billion). ODA from non-DAC members listed in OECD statistics decreased in 2014, mainly because of aid cuts by the United Arab Emirates, Turkey and Kuwait. Non-DAC aid fell about 25% to USD 4.4 billion, mainly because of a 31% reduction in aid from the United Arab Emirates and Saudi Arabia to Egypt.
Just over half of ODA to Africa reaches low-income countries
Just over half of ODA to Africa goes to low-income countries (LICs) (Figure 2.12). The LIC share of Africa-bound development assistance declined from a peak of 58.9% in 2010 to 52.1% in 2013. There was a slight rebound in 2014. In USD terms, ODA to African LICs has remained stable at roughly USD 27 billion from 2011 to 2014. It is estimated to have risen to USD 27.5 billion in 2015. According to CPA projections, the distribution of ODA to low-income, lower-middle income and upper-middle income African countries is expected to remain almost stable in 2016.

2. EXtErNAl FiNANCiAl FlOWS AND tAX rEVENUES FOr AFriCA2. EXtErNAl FiNANCiAl FlOWS AND tAX rEVENUES FOr AFriCA
67African Economic Outlook© AfDB, OECD, UNDP 201666 African Economic Outlook © AfDB, OECD, UNDP 2016
Figure 2.12. Net official development assistance disbursements to African countries by income group, 2004-16
%
0
10
20
30
40
50
60
70
80
90
100
2009 2010 2011 2012 2013 2014 2015 2016
Low-income countries Lower-middle income countries Upper-middle income countries
Average 2004-08
Source: Authors’ calculations based on OECD (2016).
12 http://dx.doi.org/10.1787/888933350209
East Africa and West Africa are the main recipients of ODA
East and West Africa are the continent’s leading recipients of official development assistance from all recorded donors (Figure 2.13). Ethiopia (USD 3.6 billion), Kenya (USD 2.7 billion) and Tanzania (USD 2.6 billion) topped the list in East Africa. Nigeria (USD 2.5 billion) was the leader in the West. Other major recipients in 2014 were Egypt (USD 3.5 billion), Morocco (USD 2.2 billion) and Mozambique (USD 2.1 billion). These seven countries accounted for 36% of total official assistance to Africa.
Several Southern African countries, notably Lesotho, Swaziland, Angola and South Africa, saw less aid in 2014 against 2013. North African countries received 13.5% less, largely due to declining ODA to Egypt and Sudan.
Figure 2.13. Net official development assistance disbursements to African countries by region, 2004-16
0
10
20
30
40
50
60
2009 2010 2011 2012 2013 2014 2015 2016
North Africa Central Africa East Africa Southern Africa West Africa
USD billion
Average 2004-08
Source: Authors’ calculations based on OECD (2016).12 http://dx.doi.org/10.1787/888933350211

2. EXtErNAl FiNANCiAl FlOWS AND tAX rEVENUES FOr AFriCA
68 African Economic Outlook © AfDB, OECD, UNDP 2016
Survey predicts increased country programmable aid to Africa
The 2015 Global Outlook on Aid (OECD, 2015) survey indicates that country-specific aid to the poorest countries should recover, in line with recent donor pledges, after several years of decline.
The survey provides an overview of global aid allocations up to 2018 based on the 2015 DAC Survey on Donors’ Forward Spending Plans, tracing CPA flows. The survey highlights programmed increases starting in 2015 (Table 2.4).
Table 2.4. Africa’s country programmable aid estimates and projections, USD billion
2014 2015 2016 2017 2018
Sub-Saharan Africa 35.1 37.1 38.6 38.9 39.4
North Africa 8.8 8.7 9.0 9.3 9.4
Africa, Total 45.5 47.4 49.3 49.9 50.6
Source: Authors’ calculations based on OECD data (2016).
According to the 2015 survey on forward spending plans, CPA was to increase by USD 2.7 billion in 2015. Multilateral agencies are stepping up their efforts with larger disbursements after receiving cash injections. Least developed and low-income countries will benefit most from this increase, with aid expected to grow by 5.7% in real terms in 2015. Overall CPA to low- and middle- income countries (LMICs) was projected to remain stable in 2015, signalling that donor finance to this group of countries is safeguarded. For upper middle-income countries, overall CPA levels are expected to fall by 4.4%, mostly to the higher income countries.
On a geographical basis, CPA to sub-Saharan Africa was projected to grow more than for other zones, with a predicted rise of 5.7% because of more concessional lending. Global CPA is projected to remain stable up to 2018 with more help to least developed countries after DAC members decided in December 2014 to allocate more ODA to the countries most in need. Two thirds of the least developed countries will see a rise in CPA, with Ebola-affected countries such as Guinea getting significant help.
China’s aid to Africa is increasing
China’s aid to Africa is believed to be increasing even though estimates of the total vary widely. China’s aid to Africa is not reported by the OECD and therefore not included in the above data. The Chinese government also does not provide detailed information about its overseas aid. The China Africa Research Initiative provides information based on the China Statistical Yearbook and other Chinese sources. Figure 2.14 shows a clear upward trend of Chinese aid to Africa from about USD 600 million in 2000 to USD 3.2 billion in 2013.

2. EXtErNAl FiNANCiAl FlOWS AND tAX rEVENUES FOr AFriCA2. EXtErNAl FiNANCiAl FlOWS AND tAX rEVENUES FOr AFriCA
69African Economic Outlook© AfDB, OECD, UNDP 201668 African Economic Outlook © AfDB, OECD, UNDP 2016
Figure 2.14. China’s external assistance expenditures, USD billion USD billion
0
0.5
1.0
1.5
2.0
2.5
3.0
3.5
2000 2001 2002 2003 2004 2005 2006 2007 2008 2009 2010 2011 2012 2013
Source: China Africa Research Initiative (2016).12 http://dx.doi.org/10.1787/888933350229
domestic revenues fall as resource revenues tumble
After a decade-long improvement in domestic resource mobilisation, falling resource prices have brought down African domestic public revenues, according to data collected by the African Development Bank through country missions for the African Economic Outlook. Countries without resources have increased tax revenues and tax-GDP ratios, however.
The 2015 Addis Ababa Action Agenda (UN, 2015a) made domestic public revenues the top action area. Mobilising public revenues is central to achieving the United Nations Sustainable Development Goals on increasing productivity levels and making growth more inclusive. Domestic resource mobilisation reinforces a country’s ownership of public policy and allows it to move towards financial autonomy. African countries still face formidable challenges raising more and better taxes, mostly as a result of economic structure and the prevalence of the informal sector.
A big fall in resource revenues has lowered Africa’s total revenues since 2013
Africa increased public domestic revenues up to 2013, collecting a total of USD 468 billion in that year. Since then, however, the amount has declined because of falling resource revenues. In 2014, Africa’s tax authorities collected USD 461 billion, an annual decrease of 1.5%. As public revenues tumbled in large resource-rich countries in 2015, Africa’s total public revenues decreased. Public revenues in Africa’s resource-rich countries (USD 373 billion) far outweighed those in non-resource-rich countries (USD 88 billion) in 2014.1
Resource revenues – from oil or mineral extraction but also some crops such as cocoa exports – are the main contributor to Africa’s revenue. However, after peaking at USD 171 billion in 2012, resource revenues have fallen. They shrank by 8.3% in 2014, compared to 2013, to USD 155 billion. In 2015, resource revenues fell markedly in Algeria, Angola, Ghana, Libya, Nigeria and South Africa, mostly as a result of plunging oil and metals prices. In some countries there was a 20% fall from 2013 resource revenues. Côte d’Ivoire, Sudan and Zambia, however, escaped the trend despite lower oil and copper prices. The revenue-GDP ratio in resource-rich African countries has fallen from 26.3% in the peak year 2012 to 23.3% in 2014.

2. EXtErNAl FiNANCiAl FlOWS AND tAX rEVENUES FOr AFriCA
70 African Economic Outlook © AfDB, OECD, UNDP 2016
Figure 2.15. The revenue mix in resource-rich vs. non-resource-rich Africa revenue-GDP ratios, 2004-14
0
4
8
12
16
0
3
5
8
10
Indirect taxesDirect taxes Resource revenuesTrade taxes
A. Resource-rich countries
Average 2004-08 2009 2010 2011 2012 2013 2014
Average 2004-08 2009 2010 2011 2012 2013 2014
B. Non-resource-rich countries
% GDP
% GDP
Source: Authors’ calculation based on African Economic Outlook data.12 http://dx.doi.org/10.1787/888933350231
Non-resource-rich countries have increased tax revenues and tax ratios
Non-resource-rich countries have steadily increased public revenues by diversifying from trade sources to direct income and profit taxes, as well as indirect consumption-based taxes. Public revenues rose from USD 62 billion to USD 88 billion between 2010 and 2014. As revenues rose faster than GDP, the average tax ratio in non-resource-rich countries has gradually climbed from 8.2 % of GDP in 2010 to 10.2% of in 2014.
The tax ratios are still very low by international standards. Tax revenues are 34.4% of GDP on average in OECD countries. Correcting tax-GDP ratios for structural differences (mainly GDP per capita, sectoral composition of output, degree of urbanisation and trade openness) produces a measure of tax efforts – how much a country collects against its potential tax revenues. Africa displays a large heterogeneity in tax efforts. Daude et al. (2012) find that many African countries topped an international tax effort index in 2008.

2. EXtErNAl FiNANCiAl FlOWS AND tAX rEVENUES FOr AFriCA2. EXtErNAl FiNANCiAl FlOWS AND tAX rEVENUES FOr AFriCA
71African Economic Outlook© AfDB, OECD, UNDP 201670 African Economic Outlook © AfDB, OECD, UNDP 2016
Box 2.3. A new database of comparable revenue statistics in Africa
To enhance the comparability, quality and accessibility of public revenue data in Africa, the African Union Commission, the African Tax Administration Forum and the OECD launched the first edition of Revenue Statistics in Africa in March 2016, with the support of the AfDB, the World Customs Organisation and the Centre de rencontres et d’études des dirigeants des administrations fiscales (CREDAF) (see Box 2.4 in AfDB et al., 2015).
Tax officials from Cameroon, Côte d’Ivoire, Mauritius, Morocco, Rwanda, Senegal, South Africa and Tunisia worked with the partner institutions to organise their revenue data for 1997-2014 according to a tax classification system already used by 57 other countries in the world. It made their statistics effectively comparable between themselves and with other countries for the first time.
This new database will facilitate policy analysis, help measure or forecast the impact of reforms, devise common policies within regional economic communities, identify best practices, engage in international dialogue and peer learning, and report to citizens and elected representatives.
The work contributes to the financial chapter of the African Charter on Statistics in rolling out the Strategy for the Harmonisation of Statistics in Africa. It also supports the first 10-year implementation plan (2014-2023) of the African Union’s Agenda 2063, which aims to “develop and implement frameworks for policies on revenue statistics and fiscal inclusiveness for Africa.” At a global level, the work will support the Sustainable Development Goals’ target 17.1 to “improve domestic capacity for tax and other revenue collection” and target 17.19 to “support statistical capacity building in developing countries.”
Source: OECD/ATAF/AUC (2016).
Revenue-to-GDP ratios in African resource-rich countries fall across all categories
There are two diverging country groups in terms of revenue-GDP ratios. Ratios fell across all broad tax categories in resource-rich countries after a steep decline in international prices cut their revenues. Since 2011, resource revenues as a proportion of GDP have dropped by 3.7 percentage points from 2011 to 2014, down from 13.4% to 9.7%. Resource revenues had accounted for more than 80% of total revenue collection and 20% of GDP in oil-rich Algeria, Angola, Congo, Equatorial Guinea and Libya still in 2013 (AfDB/OECD/UNDP, 2015).
Resource-rich countries also suffered a pro-cyclical drop in the tax-GDP ratio of direct income and profit taxes as well as indirect taxes, as shown in Figure 2.15. As long as resource-based income permeates the economies of resource-rich countries, it is a formidable policy challenge to diversify revenues toward income, profits and consumption. These tax bases are also affected by the slump in commodity prices in resource-rich countries unless the entire economy is moved away from resource sectors. Progressive income taxes could really attenuate the pro-cyclical features of income taxation.
Direct and indirect taxes rise gradually in non-resource-rich Africa
Countries that are not resource-rich have, conversely, broadened their tax base and raised revenues through higher direct and indirect taxes. Figure 2.15 shows a continuous rise in the GDP ratios of direct and indirect taxes. This helped non-resource-rich countries to increase their total (unweighted) tax ratio from 8.5% in 2011 to 10.2% in 2014.

2. EXtErNAl FiNANCiAl FlOWS AND tAX rEVENUES FOr AFriCA
72 African Economic Outlook © AfDB, OECD, UNDP 2016
Good growth performance and improved tax collection have enabled domestic resource mobilisation, although the tax ratios in Africa’s non-resource-rich countries remain comparatively low.
Several countries in East Africa were noted in 2015 for increasing revenues from indirect (mostly consumption-based) taxes and direct taxes on incomes and corporate profits. Ethiopia doubled indirect and direct tax revenues between 2012 and 2015; Kenya and Rwanda displayed a dynamic upward trend in tax revenues as well into 2015. Overall, non-resource-rich countries in East Africa have a well-balanced mix of indirect, direct and trade taxes, which should help them to maintain a more stable and predictable flow of resources to finance public action.
sustainable benefit is needed from financial flows and public revenues
Mobilising domestic and foreign resources in the face of lower commodity prices and a rebalancing Chinese economy throws up policy challenges – and opportunities. Policy questions arise about how governments of commodity exporting countries absorb the earnings shortfall in the short term. It is also important for Africa’s governments to move in the longer term to diversify their economies to ensure sustainable benefit from financial flows and public revenues.
A wide range of policies are possible for a great diversity of different countries. The main structural distinction runs between countries that are net exporters or importers of fossil fuels and industrial metals. The main financial distinction applies to the level of domestic savings, whether external debt is sustainable and the level of foreign-reserve buffers. A further distinction relates to the degree of exchange rate flexibility. Finally, the quality of domestic governance and institutions play a key role in how successful financial resources will be in helping to make growth inclusive and sustainable.
Stabilising finance for development is a major short-term challenge. Reduced financial foreign flows require higher domestic tax revenues, more stimulus for foreign inflows and better use of foreign reserves, if austerity measures are to be contained:
• Savings needed. Africa is the developing region with the world’s lowest saving rate. This is holding back investment and future output. Africa’s saving rate has been declining since 2009 and the IMF (2015a) projects that the 2015 domestic savings rate will drop further to just 15.4 % of GDP. This compares to an estimated average rate of 31.9% for all the emerging and developing countries in 2015. Recent IMF (2015c) analysis suggests that the median country in sub-Saharan Africa has a potential for a three to 6.5 percentage point increase in tax revenue. With oil prices down, countries may consider removing oil subsidies and increasing non-oil fiscal revenues. They can raise the value-added tax (VAT). However, economic diversification is needed to support non-oil fiscal revenues.
• Fiscal reforms. As resource revenues recede, governments need to broaden the tax base away from the resource sector towards consumption-based taxes. Resource-based revenues can give unexpected answers to challenges, as the case of Democratic Republic of the Congo (DRC) shows. The government received a record USD 2 billion in 2014, despite falling commodity prices. The Extractive Industries Transparency Initiative (EITI, 2016) has reported on DRC’s efforts to increase financial transparency. Resource-rich countries tend to be energy and carbon intensive. Carbon taxes, as planned in South Africa, help to reduce greenhouse emissions and diversify the tax base.
• Higher tax-GDP ratio. African countries without resource wealth need to augment their tax-GDP ratios to the minimum benchmark of 20% proposed by the Sustainable Development Solutions Network (SDSN, 2013). Countries must invest

2. EXtErNAl FiNANCiAl FlOWS AND tAX rEVENUES FOr AFriCA2. EXtErNAl FiNANCiAl FlOWS AND tAX rEVENUES FOr AFriCA
73African Economic Outlook© AfDB, OECD, UNDP 201672 African Economic Outlook © AfDB, OECD, UNDP 2016
in strengthening systems to assess and collect taxes, as well as enforce compliance, improve spending efficiency and curb illicit financial flows.
• Risky bonds. Stimulus for foreign inflows must go hand in hand with financial discipline. Issuing short-term foreign-currency bonds to bridge financing gaps is risky. Certain financial flows can create credit boom distortions and exchange rate appreciation due to the implicit credit guarantee and ill-regulated financial sectors. Sudden withdrawals can cause a slump. The ensuing bail-out cost and the slump in turn cause lower savings. Debt-creating financial flows are inferior to foreign direct investment, which in turn is associated with higher GDP growth (Reisen and Soto, 2001).
• Stronger reserves. The use of official foreign reserves (or buffer stocks as in Chile) may help some prepare for periods of trouble. However, depleting reserves below certain levels (such as the level of short-term domestic and foreign debt) will trigger currency attacks as seen in Zambia in 2015. The difference between the rising local currency cost of Eurobonds – an average 20% in Africa – and a fall in growth rates to low single digits creates unpleasant debt dynamics, which are unlikely to be compensated by a surplus in the non-interest current or fiscal accounts.
Apart from dealing with the short-term effects of the external shocks, Africa’s governments need to determinedly implement medium- to long-term structural policies. The African Union’s Agenda 2063 (AU, 2015) specifies seven aims, including economic and social transformation. With almost 200 million people aged between 15 and 24, Africa has the world’s youngest population and it is growing rapidly. Half of the increase in the global labour force over the next 25 years will originate in Africa.
Africa must create productive jobs for its 500 million potential new labour force. The commodity sector is too capital intensive to offer hope to Africa’s young population. While commodity exporters, like Nigeria, Angola and Zambia, have been hit hard by China’s slowdown, others like Ghana, Kenya, Uganda, Mozambique and Ethiopia are showing greater resilience. They have been forced to diversify their economies, in part because of their dearth of raw materials. Whether African economies come through the challenges generated by lower commodity prices will depend on comparative advantages, the quality of economic policy and the fast implementation of measures. As spelled out in the AEO 2015 (AfDB/OECD/UNDP, 2015), no single sector holds the solution. Labour-intensive manufacturing, commodities processing, higher productivity agricultural and rural employment, all need to absorb the labour force. Regional economic integration is essential for Africa to realise its full growth potential, to participate in the global economy and to share the benefits of an increasingly connected global marketplace. Regional trade is still hampered by Africa’s deficient infrastructure. Among the Agenda 2063 aims, building infrastructure, lowering barriers to business investment and fostering education merit special attention to help Africa’s structural transformation aims:
• Cut volatility. Foreign direct investment, bank credits and portfolio equity flows reflect the global economic environment, but domestic factors also have contributed to turbulence. There is a need for regulatory reforms and stability, including stronger action against militant threats, which have had a cut growth in affected countries.
• Boost aid. Africa’s aid outlook should observe the Addis Ababa Action Agenda. Donors are asked to maintain 2013 official development assistance levels as a minimum. ODA should be prioritised for low-income and lower middle income Africa.
• Remittances. Money from overseas workers represent a key source of finance for Africa. This finance could spur growth and can be used as a catalyst to develop the financial sector.

2. EXtErNAl FiNANCiAl FlOWS AND tAX rEVENUES FOr AFriCA
74 African Economic Outlook © AfDB, OECD, UNDP 2016
• Integration. Some countries benefit from stronger intra-regional co-operation, proximity to Western Europe and deeper co-operation with emerging markets. These countries can assist the growth of others. Further international support of intra-regional investment in corridor roads, electricity, Internet networks and railways will boost growth and regional exchange.
• Infrastructure gap. There has been significant investment in infrastructure in recent years, much of it from China, but African countries are still chasing other developing countries in almost all measures of infrastructure coverage. Access to water, road transport and electricity are particularly limited. Quickly closing the infrastructural gaps would boost growth. A 2014 analysis by Ernst and Young and the Infrastructure Consortium for Africa (ICA) showed that with funds available and projects started, the gap is being closed. But it found that work had yet to begin on two-thirds of identified projects. Africa does not need to identify new sources of funding but rather ensure that planned projects are completed within a reasonable timeframe. This will ensure projects deliver returns to investors and help to attract new investment. Africa needs to remove barriers to finishing projects by lowering the cost of doing business.
• Business costs. The benefit from infrastructure investment is greatly reduced if there are no accompanying improvements to institutions and regulations. According to the World Bank’s (2015c) Doing Business indicators, median African countries rank 151st out of 189, compared with a median 48th for all emerging market countries. Reducing the cost of doing business attracts local and foreign investment. The region undertook the largest number of regulatory reforms making it easier to do business, accounting for about one third of worldwide reforms in 2015 (see Chapter 5).
• Human capital. Though progress has been made in the past decade, Africa still trails other world regions for health, education and training – human capital. More investment is needed in these areas to support industrial development. High vacancy rates while there is also large scale unemployment confirms Africa’s skills mismatches.
Note
1. In line with IMF (2015b), we consider Algeria, Angola, Botswana, Cameroon, Chad, Democratic Republic of the Congo, Republic of the Congo, Côte d’Ivoire, Egypt, Equatorial Guinea, Gabon, Ghana, Guinea, Liberia, Libya, Mauritania, Namibia, Nigeria, Sierra Leone, South Africa, South Sudan, Sudan, and Zambia as resource-rich countries.

2. EXtErNAl FiNANCiAl FlOWS AND tAX rEVENUES FOr AFriCA2. EXtErNAl FiNANCiAl FlOWS AND tAX rEVENUES FOr AFriCA
75African Economic Outlook© AfDB, OECD, UNDP 201674 African Economic Outlook © AfDB, OECD, UNDP 2016
References
AfDB/OECD/UNDP (2015), African Economic Outlook 2015: Regional Development and Spatial Inclusion, OECD Publishing, Paris, http://dx.doi.org/10.1787/aeo-2015-en.
AU, 2015, Agenda 2063: The Africa We Want, African Union Commission, Addis Ababa, September, http://agenda2063.au.int (accessed 19 February 2016).
China Africa Research Initiative (2016), SAIS China Africa Research Initiative, Johns Hopkins Uiversity School of Advanced International Studies, Washington, DC, www.sais-cari.org/data (accessed 15 January 2016).
Daude, C., H. Gutiérrez and A. Melguizo (2012), “What drives tax morale?”, OECD Development Centre Working Paper No. 315, OECD, Paris, DOI: 10.1787/18151949
ECN (2015), “Spanning Africa’s infrastructure gap: How development capital is transforming Africa’s project build-out”, The Economist Corporate Network, November, London, http://ftp01.economist.com.hk/ECN_papers/Infrastructure-Africa (accessed 20 January 2016).
EITI (2016), DRC’s Effort to Increase Transparency Begins to Pay Dividends, Extractive Industries Transparency Initiative, Oslo, 19 January, https://eiti.org/news/drc-effort-increase-transparency-begins-pay-dividends (accessed 25 January 2016).
Ernst & Young (2014), EY’s Attractiveness Survey: Africa 2014: Executing Growth, Ernst & Young, London, www.ey.com/Publication/vwLUAssets/EY-attractiveness-africa-2014/$FILE/EY-attractiveness-africa-2014.pdf. (accessed 20 October 2015).
fDi Markets (2016), fDi Markets (database), www.fdimarkets.com (accessed 6 February 2016).
trends-in-africa-2013-report-28641
ICA (2015), Infrastructure Financing Trends in Africa – 2014. Infrastructure Consortium for Africa, Abidjan, www.icafrica.org/en/news-events/ica-news/article/infrastructure-financing-trends-in-africa-2014-274982 (accessed 24 January 2016).
ICA (2014), Infrastructure Financing. Trends in Africa – 2013. Infrastructure Consortium for Africa, Abidjan. http://www.icafrica.org/en/news-events/ica-news/article/infrastructure-financing-
IMF (2015a), Regional Economic Outlook: Sub-Saharan Africa 2015, International Monetary Fund, Washington, DC, www.imf.org/external/pubs/ft/reo/2015/afr/eng/pdf/sreo0415.pdf (accessed 1 February 2016).
IMF (2015b), “Regional Economic Outlook Update: Middle East and Central Asia, International Monetary Fund, Washington, DC, http://www.imf.org/external/pubs/ft/reo/2015/mcd/eng/mreo0515.htm (accessed 1 February 2016).
IMF (2015c), World Economic Outlook: Adjusting to Lower Commodity Prices, International Monetary Fund, Washington, DC, www.imf.org/external/pubs/ft/weo/2015/02 (accessed 18 February 2016).
IMF (2014a), Regional Economic Outlook: Sub-Saharan Africa 2014, International Monetary Fund, Washington, DC, www.imf.org/external/pubs/ft/reo/2014/afr/eng/sreo0414.pdf (accessed 17 March 2015).
IMF (2014b), World Economic Outlook: Legacies, Clouds, Uncertainties, International Monetary, Washington, DC, www.imf.org/external/pubs/ft/weo/2014/02 (accessed 18 February)
Masetti, O. (2015), African Eurobonds: Will the Boom Continue? Deutsche Bank Research, Research Briefing, Deutsche Bank AG, Frankfurt am Main, Germany, http://tinyurl.com/guxnr2j (accessed 5 February 2016).
McKinsey (2015a), East Africa: The next hub for apparel sourcing?, McKinsey and Company, www.mckinsey.com/insights/consumer_and_retail /east_africa_the_next_hub_for_apparel_sourcing (accessed 19 February 2016).
McKinsey (2015b), The growth opportunity in Africa. McKinsey and Company, www.mckinsey.com/global-themes/employment-and-growth/the-growth-opportunity-in-africa (accessed 19 February 2016).
OECD (2016), CRS Aid Statistics (database), http://stats.oecd.org (accessed 28 January 2016).
OECD (2015), 2015 Global Outlook on Aid, OECD Publishing, Paris, www.oecd.org/dac/aid-architecture/2015%20FSS%20Survey%20flyer.pdf (accessed 20 January 2016).
OECD/ATAF/AUC (2016), Revenue Statistics in Africa, OECD Publishing, Paris, http://dx.doi.org/10.1787/9789264253308-en-fr.
Oxford Economics (2015), Future Trends and Market Opportunities in the World’s Largest 750 Cities. How the Global Urban Landscape Will Look in 2030, Oxford, England. www.oxfordeconomics.com/Media/Default/landing-pages/cities/OE-cities-summary.pdf (accessed 18 December 2015).

2. EXtErNAl FiNANCiAl FlOWS AND tAX rEVENUES FOr AFriCA
76 African Economic Outlook © AfDB, OECD, UNDP 2016
Pigato, M. and W. Tang (2015), China and Africa: Expanding Economic Ties in an Evolving Global Context, World Bank Group, Washington DC, http://documents.worldbank.org/curated/en/2015/03/24177102/china-africa-expanding-economic-ties-evolving-global-context (accessed 15 January 2016).
PWC (2014), IPO Watch Africa 2014, Price Waterhouse Cooper, http://www.pwc.co.za/en/assets/pdf/ipo-watch-africa-2014.pdf (accessed 15 December 2015).
Reisen, H. and C. Garroway (2014), The Future of Multilateral Concessional Finance, BMZ/GIZ: Berlin. www.ifad.org/events/ifi_trends/giz_mcf.pdf. (accessed 15 December 2015).
Reisen, H. and M. Soto (2001), “Which types of capital inflows foster developing-country growth?”, International Finance, Vol. 4(1), pp. 1-14, Spring.
SDSN (2013), An Action Agenda for Sustainable Development, Report to the UN Secretary-General, Sustainable Development Solutions Network, Paris and New York.
UN DESA (2016), World Economic Situation and Prospects 2016, United Nations Department of Economic and Social Affairs, New York, www.un.org/en/development/desa/policy/wesp/ (accessed: 1 February 2016).
UN DESA (2015a), DESA Briefing Note on The Addis Ababa Action Agenda, United Nations Department of Economic and Social Affairs, New York, www.un.org/esa/ffd/ffd3/wp-content/uploads/sites/2/2015/07/DESA-Briefing-Note-Addis-Action-Agenda.pdf ( accessed 15 January 2016).
UN DESA (2015b), World Economic Situation and Prospects 2015, United Nations Department of Economic and Social Affairs, New York., United Nations, New York, www.un.org/en/development/desa/policy/wesp/ (accessed 1 February 2016).
UNCTAD (2016), “FDI recovery is unexpectedly strong, but lacks productive impact”, Global Investment Trends Monitor, No. 22, United Nations Conference on Trade and Development, Geneva, http://unctad.org/en/PublicationsLibrary/webdiaeia2016d1_en.pdf (accessed 25 January 2016).
UNDP (2011), Towards Human Resilience: Sustaining MDG Progress in an Age of Economic Uncertainty, United Nations Development Programme, New York, www.undp.org/content/dam/undp/library/Poverty%20Reduction/Towards_SustainingMDG_Web1005.pdf (accessed 20 November 2015).
Vellos, R. (2015), Sub-Saharan Africa’s bond issuance boom, World Bank, Washington, DC, http://blogs.worldbank.org/opendata/sub-saharan-africa-s-sovereign-bond-issuance-boom (accessed February 2016).
World Bank (2016a), Global Economic Prospects, January, World Bank, Washington, DC, www.worldbank.org/en/publication/global-economic-prospects, (accessed February 2016).
World Bank (2016b), Migration and Remittances Factbook 2016, Global Knowledge Partnership on Migration and Development (KNOMAD) initiative, World Bank, Washington, DC, www.worldbank.org /en/news/press-release/2015/12/18/international-migrants-and-remittances-continue-to-grow-as-people-search-for-better-opportunities-new-report-finds (accessed 1 February 2016).
World Bank (2016c), International Debt Statistics, World Bank, Washington, DC, http://databank.worldbank.org/data/reports.aspx?source=International%20Debt%20Statistics (accessed 12 January 2016).
World Bank (2015a), Migration and Remittances Data, September, World Bank, Washington, DC, www.worldbank.org/en/topic/migrationremittancesdiasporaissues/brief/migration-remittances-data. (accessed January 2016).
World Bank (2015b), “Migration and remittances: Recent developments and outlook – Special Topic: Financing for Development”, Migration and Development Brief 24, World Bank, Washington, DC, https://siteresources.worldbank.org/INTPROSPECTS/Resources/334934-1288990760745/MigrationandDevelopmentBrief24.pdf (accessed February 2016).
World Bank (2015c), Doing Business Report 2016, World Bank, www.doingbusiness.org, (accessed February 2016).

77African Economic Outlook© AfDB, OECD, UNDP 2016
Accelerated growth in Africa since 2000 has increased the opportunities
for enhanced trade while the continent is also looking to step up
integration between its regions to further boost growth and job
creation. This chapter looks at developments in trade, investment flows,
integration and income convergence between regions and countries.
It suggests ways for policy makers to spur growth and seize trade
opportunities so that the income gap can narrow more speedily. The
financial sector, infrastructure and new, bigger free trade areas are all
analysed to see how they can help the effort.
Chapter 3
Trade policies and regional integration in Africa

3. trADE POliCiES AND rEGiONAl iNtEGrAtiON iN AFriCA
78 African Economic Outlook © AfDB, OECD, UNDP 2016
In brief
Africa must embrace structural and regulatory reforms and enhance financial integration to accelerate efforts that have led to increased exchanges with emerging countries in the rest of the world and between its own countries and regions. Intra-African trade remains below levels seen in other parts of the world but there are ways to change this. While the European Union should remain Africa’s main trade partner for the foreseeable future, an accord between three regional blocs, the Tripartite Free Trade Area, could change Africa’s commercial landscape by increasing market size and creating economies of scale. The gains could also help narrow income gaps between African countries and enhance regional financial integration. African countries must foster macroeconomic stability and improve the investment environment to strengthen the role of pan-African banks in facilitating trade finance and boosting capital markets. Success in stimulating trade and growth depends on the policy and investment climate, depth of financial integration and commitment to reform.
Africa looks to turn strong growth into economic transformation
Africa has key factors for success
Growth has accelerated in Africa since 2000 at an average annual rate of 5%. Several factors explain this performance:
1. Greater political stability: The number of violent conflicts has decreased since the turn of the century, boosting political stability.
2. Improved macroeconomic conditions: Prudent fiscal and monetary policies and debt relief have helped contain fiscal deficits and lower inflation. Government reforms have also improved the business environment.
3. Greater public investment in infrastructure. This has helped some countries without natural resources, such as Ethiopia and Rwanda, to attain growth of 8% or more.
4. High commodity prices. During the 2000s, Africa’s resource-rich countries have benefited from greater demand for commodities, especially from China and other emerging economies. The recent decline in prices has scaled back growth however.
5. Foreign direct investment and other financial flows and domestic demand. These factors have responded strongly to a good policy environment and together they have played a key role in Africa’s growth. Yet, the potential of intra-African trade has not been fully exploited.
Trade increases despite a fall in US exchanges
Africa’s trade with the rest of the world has remained high, except with the United States. From 2000 to 2008, Africa’s trade increased by an annual average of 16%. Because of the 2008-09 global financial crisis, trade fell sharply by 24% from 2008 to 2009. Since 2010, Africa’s exports have recovered, growing by an annual average of 8.5%. Trade with the United States has persistently declined however. In 2015, trade with the United States fell to USD 70.5 billion from a peak of USD 124.6 billion in 2011, an 11% decline (Figure 3.1). Historically, oil, gas and petroleum products have dominated US imports from sub-Saharan Africa. In 2007, these accounted for 93% of US imports. By 2013 the figure had declined to 67% as the United States stepped up its campaign for energy self-sufficiency and increased production of domestically produced oil to avoid imports.

3. trADE POliCiES AND rEGiONAl iNtEGrAtiON iN AFriCA3. trADE POliCiES AND rEGiONAl iNtEGrAtiON iN AFriCA
79African Economic Outlook© AfDB, OECD, UNDP 201678 African Economic Outlook © AfDB, OECD, UNDP 2016
Figure 3.1. Africa’s total trade flows, trade with selected partners and intra-African trade (USD billion), 2000-14
0
50
100
150
200
250
300
350
400
450
2000 2001 2002 2003 2004 2005 2006 2007 2008 2009 2010 2011 2012 2013 2014
China IND+BRA+KOR+TUR +RUS Intra-African USAEU27
USD billion
Source: Authors’ calculations based on UN COMTRADE, via http://wits.worldbank.org/wits/.12 http://dx.doi.org/10.1787/888933350245
The European Union remains the key export market for Africa’s products. However, since the financial crisis, euro area demand (72.5% of European Union gross domestic product [GDP]) has been weak, hurting demand for Africa’s products. As a result, Africa’s exports to Europe have increased by a modest 0.2% per year since the 2008-09 financial crisis. Africa has been helped by its diversified trade. Declining exports to the United States and the weak growth in Europe have given an increasing importance to Brazil, Russia, India and China (the BRICs countries), and other emerging economies (Figure 3.2). In 2009, only 24% of Africa’s exports went to emerging countries. In 2014, the BRICs, Korea, Turkey and others accounted for nearly half of Africa’s total exports to the world.
Figure 3.2. Distribution of Africa’s trade: Traditional versus emerging partners, 2000-14
% USD billion
50
0
100
150
200
250
300
350
400
450
0
500
10
20
30
40
50
60
70
80
90
2000 2001 2002 2003 2004 2005 2006 2007 2008 2009 2010 2011 2012 2013 2014
Trade with emerging economies (USD billion)
Traditional (as % of total) Emerging (as % of total)
Source: Authors’ calculations based UN COMTRADE, via http://wits.worldbank.org/wits/.12 http://dx.doi.org/10.1787/888933350251

3. trADE POliCiES AND rEGiONAl iNtEGrAtiON iN AFriCA
80 African Economic Outlook © AfDB, OECD, UNDP 2016
Africa’s exports to emerging economies are dominated by China and mainly comprise oil, metals and other primary products. This exposes the continent to China’s shifting economic model from investment and export to an economy based on domestic consumption and services. This could slow demand for Africa’s products and affect long-term growth. Currently, China accounts for 27% of sub-Saharan Africa’s global exports with primary commodities representing about 83% of exports to China (Pigato and Tang, 2015).
Trade between African regions is also growing, though it remains low compared to other parts of the world. In 2000, intra-regional trade accounted for 10% of Africa’s total trade. In 2014, it was 16%. This trade is mainly in manufactured goods, which are less susceptible to price shocks. Manufactured products account for 60% of total regional trade (AfDB, 2015). Moreover, trade to other regions increased for all of Africa’s regional economic communities except the six-nation Central African Economic and Monetary Community (CEMAC) (Figure 3.3).
Figure 3.3. Intra-African trade by regional economic communities (USD million)
0
10 000
20 000
30 000
40 000
50 000
60 000
2000 2001 2002 2003 2004 2005 2006 2007 2008 2009 2010 2011 2012 2013 2014
COMESA ECCAS ECOWAS SADCCEMAC
USD million
Source: World Trade Organization (2015).12 http://dx.doi.org/10.1787/888933350266
Mega trade blocs gain ground
In recent years, moves towards “mega” regional trade agreements, such as the proposed Transatlantic Trade and Investment Partnership (TTIP) between the United States and European Union, have gained momentum. The aim is to remove tariff and non-tariff trade barriers and restrictions on investment, in a wide range of sectors. The US-EU agreement, when completed, would combine the world’s two largest economic entities. The TTIP could also jump-start discussions on the Doha Development Agenda and renew interest in trade liberalisation.
In Africa, the Tripartite Free Trade Area (TFTA) and the proposed Continental Free Trade Area (CFTA) are designed to spur intra-regional trade and investment. The TFTA takes in the 19-nation Common Market for Eastern and Southern Africa (COMESA), the five-country East African Community (EAC) and 15-member Southern African Development Community (SADC). This makes it the largest free trade zone in Africa’s history, accounting for over 58% of continental output, 48% of its countries and 57% of Africa’s population. The TFTA also accounts for 25% of intra-regional trade, where other blocs account for an average of 15%.
To boost regional trade, the TFTA focuses on i) harmonising existing regional trade agreements; ii) facilitating the flow of goods between countries and along transport corridors; iii) improving links between members by developing cross-border infrastructure; and iv) allowing free movement of business persons.

3. trADE POliCiES AND rEGiONAl iNtEGrAtiON iN AFriCA3. trADE POliCiES AND rEGiONAl iNtEGrAtiON iN AFriCA
81African Economic Outlook© AfDB, OECD, UNDP 201680 African Economic Outlook © AfDB, OECD, UNDP 2016
Reflecting the African Union’s vision of enhanced regional co-operation, the main objective of the CFTA is to take the whole continent into an African Economic Community with a free market of more than 1 billion people that uses the growing middle class and associated demographic dividend. This initiative dates back to the 1991 Abuja Treaty that provided a roadmap for African regional integration. Negotiations for the establishment of the CFTA were officially launched in June 2015 during an African Union summit in Johannesburg, South Africa. The aim is to establish the CFTA by 2017. Given the fragmentation and small size of African markets, a continent-wide common market offers a unique opportunity to invest in cross-border infrastructure, to spur regional integration and to boost growth and employment creation. Once created, the African Economic Community’s proposed continent-wide free trade area would reduce overlaps between Africa’s regional communities.
It is difficult to assess the real impact of the CFTA. However from past experience, it brings benefits to members through “trade creation” rather than “trade diversion” (Freund and Ornelas, 2010).
Regional integration is an aid to income convergence
Regional integration aims to promote political and economic co-operation. Most Africans live in countries where domestic markets are too small and fragmented to achieve the economies of scale necessary to compete internationally. Closer integration is therefore crucial for the continent. Growth is a key aim for each country and so is the desire to narrow divergences in income, unemployment and other social outcomes. Despite compelling evidence that regional integration leads to income convergence (Camarero, Flores, Jr. and Tamarit, 2006; Jones, 2002), some studies have indicated there is no systematic relationship between trade integration and convergence (Milanovic, 2006; Sohn and Lee, 2006).
Convergence indicators across Africa show mixed patterns
Regional integration helps convergence between poor and rich economies through three key factors. First, integration encourages capital and labour mobility, which can increase output and productivity. Agreements, whether free trade areas or customs unions, offer potential benefits to all countries involved through increased trade volume. Finally, regional integration promotes the spread of technology through the exchange of goods, ideas and knowledge.
Forming regional economic communities has had a mixed impact on income convergence in Africa. The eight countries in the West African Economic and Monetary Union (WAEMU) show the highest income convergence rate. Incomes have narrowed at an average rate of 19.6% between WAEMU’s richest and poorest countries over 15 years. As illustrated in Figure 3.4A, in almost all WAEMU countries, the per capita GDP has risen compared to Côte d’Ivoire, the region’s leading economy. Benin and Senegal have caught up with Côte d’Ivoire, while Niger and Togo are still behind. This could mean that poorer countries grew faster than richer ones to narrow the gap. The convergence may also be explained by the slowdown of the Côte d’Ivoire economy during the country’s political crisis of the early 2000s.
Incomes in the Economic Community of West African States (ECOWAS), which has 15 members, have also narrowed, though the convergence rate is lower at an estimated 11.4%. Countries like Ghana or Nigeria have been slowly catching up with Cabo Verde, the region’s richest country. Over the past 15 years, per capita GDP in Nigeria and Ghana, relative to Cabo Verde, has increased by 21.6% and 5%, respectively. However, Côte d’Ivoire has lagged behind the leading countries. Since 2000, when its political crisis began, GDP per capita has declined 37% relative to that of Cabo Verde. In the CEMAC region, income convergence has been estimated at just 5.5%. Over the past five years, Congo has slowly been catching up with Equatorial Guinea while Chad has remained behind (Figure 3.4B).

3. trADE POliCiES AND rEGiONAl iNtEGrAtiON iN AFriCA
82 African Economic Outlook © AfDB, OECD, UNDP 2016
The EAC had a convergence rate of 8.5%. This reflects rapid and sustained economic growth, although there are significant cross-country variations. Against Kenya, the richest country in the region, the GDP per capita of Rwanda and Tanzania grew by 50% and 24%, respectively, between 2000 and 2014. But the GDP per capita of Burundi, the poorest country, decreased by 26% compared to Kenya.
In the five-nation Southern African Customs Union (SACU), incomes have converged by 13.3%. While countries are globally falling behind Botswana, the richest economy in the group, Namibia is slowly reducing its gap with South Africa, the second richest. Still in Southern Africa, SADC countries show a slightly lower convergence rate, estimated at 11.2%. In COMESA, which includes countries in East and Southern Africa, the convergence rate is estimated at 14.8%.
Figure 3.4. Gross domestic product per capita of selected African countries relative to the regional leading economy (USD), 2011
0
0.1
0.2
0.3
0.4
0.5
0.6
0.7
0.8
0.9
20002001
20022003
20042005
20062007
20082009
2010
2011
2012
2013
2014
20002001
20022003
20042005
20062007
20082009
2010
2011
2012
2013
2014
20002001
20022003
20042005
20062007
20082009
2010
2011
2012
2013
2014
20002001
20022003
20042005
20062007
20082009
2010
2011
2012
2013
2014
0
0.05
0.1
0.15
0.2
0.25
0.3
0.35
0.4
0
0.1
0.2
0.3
0.4
0.5
0.6
0.7
0.8
0.9
1.0
0
0.1
0.2
0.3
0.4
0.5
0.6
0.7
0.8
0.9
1.0
Niger Guinea-Bissau
MaliTogoSenegal
BeninBurkina Faso
Chad
Congo Cameroon
Central African Republic
Tanzania Uganda
RwandaBurundi
Namibia Swaziland
LesothoSouth Africa
A. WAEMU countries relative to Côte d’Ivoire B. CEMAC countries relative to Equatorial Guinea
C. EAC countries relative to Kenya D. SACU countries relative to Botswana
Source: AfDB statistics.12 http://dx.doi.org/10.1787/888933350279

3. trADE POliCiES AND rEGiONAl iNtEGrAtiON iN AFriCA3. trADE POliCiES AND rEGiONAl iNtEGrAtiON iN AFriCA
83African Economic Outlook© AfDB, OECD, UNDP 201682 African Economic Outlook © AfDB, OECD, UNDP 2016
Income convergence in Africa remains low
African countries have made progress in removing some national obstacles to narrowing the income gap. However, income convergence is always going to be a long-term task and one carried out at different speeds. Table 3.1 illustrates the disparities within each regional economic community: with few exceptions, the richer economy is often smaller in size and a poor growth performer.
Table 3.1. Comparison of the richest country in a regional economic community (REC) with regional figures
Real GDP per capita growth
(2005-14)
GDP, PPP 2011 USD (2014),
billion
Total GDP, PPP 2011 USD of
the REC (2014), billion
Population (2014), million
Total population of the REC (2014),
million
Equatorial Guinea (CEMAC) 0.81 27.2 181 0.82 48.20
Côte d’Ivoire (WAEMU) 1.44 68.9 204 22.00 110.00
Cabo Verde (ECOWAS) 3.63 3.2 1340 00.51 340.00
Kenya (EAC) 2.54 126.0 342 45.00 157.00
Botswana (SACU) 3.32 34.1 744 20.20 62.00
Seychelles (SADC) 4.48 2.3 1050 0.09 297.00
Source: Authors’ calculations based on World Bank (2015).
Policy makers need to quickly address three key issues to bolster income convergence in Africa’s regional communities. First, there are huge differences within and between Africa’s regions. Intra-African trade remains the lowest among all the continents. In 2014, trade between regions accounted for approximately 16% of Africa’s total (Table 3.2). For Asia, Europe and the Americas, intra-regional trade represented, on average, about 61%, 69% and 56%, respectively, of their total trade in 2014.
There are also differences between Africa’s regions. CEMAC has the lowest proportion of intra-regional trade, a commonly used measure of regional integration, at just 2.1% in 2014. This is mainly because of the limited trade integration in this economic zone. The EAC and SADC are Africa’s most integrated regional communities. In 2014, the SADC had the highest proportion of intra-regional trade at 19.3% of its total trade followed by the EAC at 18.4%. WAEMU and SACU had intra-regional trade proportions of 15.3% and 15.7%, respectively.
Table 3.2. Intra-regional trade in Africa’s regional economic communities as a percentage of total trade
2000 2010 2014
CEMAC (Economic and Monetary Community of Central Africa) 1.19 2.74 2.08
COMESA (Common Market for Eastern and Southern Africa) 4.82 7.36 11.00
EAC (East African Community) 17.73 18.65 18.37
ECOWAS (Economic Community of West African States) 8.91 8.27 8.92
SACU (Southern African Customs Union) 2.56 14.47 15.67
SADC (Southern African Development Community) 11.73 18.18 19.34
WAEMU (West African Economic and Monetary Union) 15.24 12.70 15.30
North Africa 2.52 3.69 5.32
Africa 9.18 13.80 15.71
Note: WAEMU includes Benin, Burkina Faso, Côte d’Ivoire, Guinea Bissau, Mali, Niger, Senegal and Togo; CEMAC includes Cameroon, Central African Republic, Chad, Equatorial Guinea, Gabon and Republic of the Congo; COMESA includes Burundi, Comoros, Democratic Republic of the Congo, Djibouti, Egypt, Eritrea, Ethiopia, Libya, Madagascar, Malawi, Kenya, Mauritius, Rwanda, Seychelles, Sudan, Swaziland, Uganda, Zambia and Zimbabwe; SADC includes Angola, Botswana, Democratic Republic of the Congo, Lesotho, Madagascar, Malawi, Mauritius, Mozambique, Namibia, Seychelles, South Africa, Swaziland, Tanzania, Zambia, Zimbabwe; and ECOWAS includes Benin, Burkina Faso, Cabo Verde, Côte d’Ivoire, Gambia, Ghana, Guinea, Guinea-Bissau, Liberia, Mali, Niger, Nigeria, Senegal, Sierra Leone and Togo.Source: Authors’ calculations based on WTO(2015).

3. trADE POliCiES AND rEGiONAl iNtEGrAtiON iN AFriCA
84 African Economic Outlook © AfDB, OECD, UNDP 2016
Second, lack of economic diversification has limited trade between African countries and regions. For a majority of countries, production and exports are concentrated in oil and gas, minerals and agriculture raw materials. As a result, there is no scope to capitalise on the comparative advantage associated with those products. The most diversified economies are in East and Southern Africa, while West Africa and Central Africa are among the least diversified. The CEMAC countries are the least diversified. SACU is the second most diversified economic community.
In terms of export diversification strategy, differences also exist. Some countries are trying horizontal diversification by producing new products. Kenya, Ethiopia and Uganda have, for example, moved into cut flowers. This supplements or partially replaces traditional exports such as coffee and tea (Yokoyama and Alemu, 2009) and the new products help counter the volatility of global commodity prices. Other countries are trying vertical diversification, moving up the manufactured products value chain. Madagascar, for example, is capturing vertical value chains in clothing and apparel. This strategy requires more sophisticated processing and marketing.
Africa’s regional communities can lay the foundation for diversification by creating common markets, pooling resources and providing a framework for the regional management of infrastructure such as transportation corridors. They can also strengthen human resources capacity, health, security, the environment and services across the regions. In addition, harmonising technological standards and regulations, and reforming customs and border controls will improve Africa’s business climate.
Africa’s improved investment climate has provided opportunities for increased investment from inside and outside Africa. Benin, Kenya, Mauritania, Senegal and Uganda were among the top 10 most improved economies in 2014-15 in areas tracked by the World Bank’s Doing Business 2016 survey. Together, they implemented 39 regulatory reforms making it easier to do business. Sub-Saharan Africa accounted for about 30% of the regulatory reforms making it easier to do business in 2014-15, followed by Europe and Central Asia.
Figure 3.5. Economic diversification in selected African regional economic communities
0 0.1 0.2 0.3 0.4 0.5 0.6
CEMAC
COMESA
ECOWAS
WAEMU
SADC
SACU
EAC
Note: Lower values mean higher diversification. Source: Yameogo et al. (2014). 12 http://dx.doi.org/10.1787/888933350285
Economic transformation can help create sustained growth and other benefits. However, structural change is needed to bring lasting results. Countries need to reallocate labour from low to high productivity activities and to use their relative demographic advantage.

3. trADE POliCiES AND rEGiONAl iNtEGrAtiON iN AFriCA3. trADE POliCiES AND rEGiONAl iNtEGrAtiON iN AFriCA
85African Economic Outlook© AfDB, OECD, UNDP 201684 African Economic Outlook © AfDB, OECD, UNDP 2016
Third, sufficient and efficient infrastructure is critical for the promotion of inclusive and sustainable growth and income convergence in regional communities. African economies can set a course for deep integration if infrastructure networks are designed to link production centres with distribution hubs across the continent. Such infrastructure will enable Africa to compete effectively, tap into regional markets, benefit from globalisation through investment and trade and therefore achieve income convergence (AfDB et al., 2013). The Programme for Infrastructure Development in Africa estimates that Africa will need to spend up to USD 68 billion annually until 2020 on capital investment and maintenance.
Countries have made notable progress at a regional level developing cross frontier infrastructure. The Ethiopia-Kenya Power Interconnector and the Zambia-Tanzania-Kenya Power Interconnector will link the Southern Africa Power Pool and the East Africa Power Pool and create a large regional electricity market. The Grand Inga Hydro Power Plant on the banks of the River Congo in the Democratic Republic of the Congo, when fully developed, could have a power generation capacity exceeding 44 000 megawatts – half of Africa’s current installed electricity capacity.
Other major projects include the multinational Mali-Côte d’Ivoire Road Development and Transport Facilitation Project on the Bamako-Zantiebougou-Boundiali-San-Pedro Corridor. This will help open up production areas in the two countries, improving competitiveness, economic diversification and poverty reduction in the participating countries. The network will turn the port of San Pedro in Côte d’Ivoire into a key transit point for neighbouring landlocked countries such as Mali and Burkina Faso.
Integrated financial markets open a path to accelerated income convergence
Deeper financial integration should speed up income convergence. Africa has already seen 15 years of high economic growth. Better integration of financial markets could spur more growth and speed up income convergence by setting favourable conditions for better risk sharing and the phasing out of constraints, such as low competition and high transaction costs. Regional financial integration could enlarge domestic market size, broaden and deepen financial systems, achieve economies of scale, and make resources more available and more efficiently allocated. Countries and regions with lower growth rates would have a better chance to add growth and reach higher living standards.
Figure 3.6. Financial integration in different regional economic communities, 1970-2011
0
2 000
4 000
6 000
8 000
10 000
12 000
14 000
16 000
18 000
20 000
1970
1972
1974
1976
1978
1980
1982
1984
1986
1988
1990
1992
1994
1996
1998
2000
2002
2004
2006
2008
2010
SADC ECOWASCOMESA
CEMACAfricaEAC
USD million
Note: The median of the sum of assets plus liabilities in USD.Sources: Lane and Milesi-Ferretti (2006), and authors’ calculations.12 http://dx.doi.org/10.1787/888933350293

3. trADE POliCiES AND rEGiONAl iNtEGrAtiON iN AFriCA
86 African Economic Outlook © AfDB, OECD, UNDP 2016
Africa’s financial integration has progressed rapidly over the past 15 years. The stock of assets and liabilities, a good indicator of financial integration, has increased uniformly across Africa’s sub-regional communities (Figure 3.6). One reason could be the increase in Africa’s international trade. From the mid-1990s up to the 2008-09 financial crisis, the sum of merchandise trade (exports plus imports), a sign of trade openness, has increased sustainably and since 2009 has grown at an annual average rate of 2.6%.
Also, since the early 2000s, African countries have implemented macroeconomic, financial and structural policies to remove impediments on external financial activities. From the mid-1990s, the financial account became more open (Figure 3.7) to cross-border transactions, except in the CEMAC area.
Figure 3.7. Financial account openness in Africa’s regional economic communities, 1970-2013
-2.0
-1.5
-1.0
-0.5
0
0.5
1970 1972 1974 1976 1978 1980 1982 1984 1986 1988 1990 1992 1994 1996 1998 2000 2002 2004 2006 2008 2010 2012
COMESA SADC ECOWAS
Africa CEMACEAC
Notes: Higher values mean higher financial integration.Sources: Chinn and Ito (2006) and authors’ calculations.12 http://dx.doi.org/10.1787/888933350309
Banking systems in Africa have boomed, as reflected in the expansion of pan-African banks. Many African countries traditionally depend on bank financing (Sy, 2015) and in the last decade, some large African banking groups have widened their regional footprint. This reflects progressing economic and financial integration in Africa. Ecobank, a leading pan-African bank which has its headquarters in Lomé, Togo, increased its affiliates from 11 to 36 countries while Bank of Africa, based in Nigeria, increased from 1 to 19 countries and Attijariwafa Bank of Morocco from 1 to 12 (Beck et al., 2014). However the expansion of these banks raises regulation and supervision issues given that cross-border banking may increase the likelihood of financial contagion. Consequently, harmonised regulation and supervision frameworks are crucial. Furthermore, since most African countries still use the Basel I international banking regulations, regulatory and supervisory rules will have to be brought in line with Basel III guidelines.
Mobile banking and other financial innovations have become a challenge to conventional ATM cash machines and electronic bank payments. Expanding mobile communication networks and access to mobile phones in Africa has led banks to work with telecommunication companies to pioneer mobile banking systems that bring financial services closer to clients. For example, from its home market in Senegal, the WARI money transfer payment service has expanded to 24 African countries.

3. trADE POliCiES AND rEGiONAl iNtEGrAtiON iN AFriCA3. trADE POliCiES AND rEGiONAl iNtEGrAtiON iN AFriCA
87African Economic Outlook© AfDB, OECD, UNDP 201686 African Economic Outlook © AfDB, OECD, UNDP 2016
Thus, beyond the traditional GDP indicators of financial development such as domestic credit to the private sector or bank deposits, electronic payments are of growing importance and need to be taken into account to show the growing size and sophistication of Africa’s financial systems.
International and domestic sovereign bond issues are on the rise. Although banks remain the main financial sector players in Africa, bond markets have developed over the last decade. Many countries have issued bonds on international markets in recent years, reflecting the desire to diversify sources of financing. In 2006, African countries raised USD 200 million from global capital markets through bonds. In 2015, this figure rose to USD 6.25 billion. However the move by the United States to end its quantitative easing monetary policy, which has stoked a rise in interest rates and appreciation of the US dollar, could push up borrowing costs and the size of external debt in domestic currency terms.
Local bond markets could be an alternative but this must accompanied by macroeconomic stability and rationalisation of government borrowing to reduce interest rates. This would in turn crowd in private sector bond issuance which is essential in deepening the domestic capital markets and hence expand financing sources. The corporate bond market in Africa is underdeveloped. Few countries have an outstanding bond to GDP ratio higher than 5%. In 2014, the total outstanding African debt securities in local currency amounted to USD 486 billion.
To help develop local bond markets, the African Development Bank Group launched the African Financial Markets Initiative (AFMI) in 2008. The AFMI seeks to enhance the medium-to-long term development of African bond markets so governments can improve the terms at which they borrow in domestic financial markets, reducing dependence on foreign currency denominated debt.
Local bond markets would also increase corporate financing options, act as a catalyst for the development and stability of financial markets, boost regional financial market integration and improve the availability and transparency of African fixed income data.
The size of an economy and the development of stock markets are strongly linked. But lack of stock market integration is holding back Africa’s financial integration. Africa has more than 25 stock markets. However, many are fragmented, illiquid and little active. A major exception is the Johannesburg Stock Exchange (JSE) which accounts for nearly 65% of Africa’s total market capitalisation. There have been initiatives to merge some to benefit from economies of scale. The CEMAC group is a monetary union with two stock markets, yet with only four listed companies. The total market capitalisation is less than 0.5% of CEMAC’s total GDP.
However, some economic zones like ECOWAS are actively encouraging securities listings. Rules on some individual and cross-border stock exchanges – notably the Bourse Régionale des Valeurs Mobilières (BRVM), which covers eight West African countries, the Nigerian Stock Exchange and the Ghana Stock Exchange – allow foreign companies to have multiple and cross-border listings.
Stock markets could learn from the model of the new generation of pan-African banks helping financial integration and investment within regions and across the continent. The number of stock markets will have to be rationalised to allow the right regulatory and supervisory framework for pan-African stock markets.

3. trADE POliCiES AND rEGiONAl iNtEGrAtiON iN AFriCA
88 African Economic Outlook © AfDB, OECD, UNDP 2016
Intra-African investment is rising, driven by increased regional integration
Investment between Africa’s regions could be a crucial driver of financial integration, but so far it is limited. Foreign direct investment into Africa has risen from about USD 10 billion in 2000 to about USD 55 billion in 2015. Investment within Africa has played a key role in this expansion.
In terms of project finance, intra-African investment accounts for 19% of total investment in Africa (EY, 2015).
Intra-African investment is less targeted at the extractive sector, helping recipient countries to diversify away from the volatile resources industries.
Investment within Africa has been led by South Africa, Nigeria and Kenya, mainly in banking, retail and telecommunications. Morocco, through banking and insurance companies such as Attijariwafa and Saham Insurance, has become a major investor but mainly in French-speaking countries. South Africa is the top investor in its region. About 80% of foreign investment into Botswana, Lesotho, Namibia and Swaziland comes from South Africa (World Bank, 2016). For some small countries such as Benin and Guinea-Bissau, finance from other African countries accounts for more than 30 % of their foreign inflow.
The African investment flow is growing but is not yet the torrent that many countries want. The potential is much higher and other regions of the world generate a lot more of their own investment. Intra-African investment accounts for only 12% of Africa’s total foreign investment. In Asia, intra-regional investment makes up 33% of the continent’s total.
Two reasons may explain why Africa is not investing in itself. Despite recent trade liberalisation, Africa still has high tariff and non-tariff barriers that hinder foreign investment. Africa also has regulatory and structural impediments. Goods and financial markets are fragmented. This prevents the leveraging of cross-border investment opportunities. Africa’s financial integration needs co-operation between financial regulators in different countries to harmonise their rules.
There are signs of change. The growth of pan-African banks in recent years has revolutionised Africa’s financial sector. They now account for a large share of investment between African regions. The resilience of Africa’s growth performance, supported by strong consumer demand, could also be a launchpad for intra-African investment in consumer-focused areas such as financial services and telecommunications. Current initiatives to rationalise and bring together Africa’s regional communities could dismantle obstacles to bigger markets. The creation of the TFTA, in particular, could boost intra-African trade and investment.
Increased trade finance can help integration and job creation
Despite the increase in Africa’s internal trade in recent years, it remains confined. Limited finance is devoted to intra-African trade. Banks operating in Africa account for about one-third of Africa’s total value of trade finance, estimated at USD 320 billion (AfDB, 2014). However only 19% of bank trade finance is devoted to intra-African trade and this is not uniformly distributed across Africa. With 6%, North Africa has the lowest proportion of bank intermediated trade finance. In East and Southern Africa, around 27% each of bank intermediated trade finance is devoted to intra-regional trade, the highest in Africa.
The expansion of Africa’s trade finance could strengthen regional integration and foster job creation. Africa’s total exports comprise 80% raw commodities and 20% manufacturing. In contrast, 60% of intra-Africa trade is manufactured products, against 40% for primary commodities. Manufacturing is a good driver of productive employment and would push Africa further up the global value chain.
3. trADE POliCiES AND rEGiONAl iNtEGrAtiON iN AFriCA3. trADE POliCiES AND rEGiONAl iNtEGrAtiON iN AFriCA
89African Economic Outlook© AfDB, OECD, UNDP 201688 African Economic Outlook © AfDB, OECD, UNDP 2016
References
AfDB (2015), Fostering Development through Trade Finance, African Development Bank, Abidjan.
AfDB (2014), Trade Finance in Africa, African Development Bank, Abidjan.
AfDB et al. (2013), The Africa Competitiveness Report 2013, www3.weforum.org/docs/WEF_Africa_Competitiveness_Report_2013.pdf
Beck, T. et al. (2014), “Making cross-border banking work in Africa”, Deutsche Gesellschaft für Internationale Zusammenarbeit (GIZ) GmbH, Bonn, Germany.
Camarero, M., R. Flores, Jr. and C. Tamarit (2006), “Monetary union and productivity differences in Mersocur countries”, Journal of Policy Modelling 28, pp.53-66.
Chinn, M. and H. Ito (2006), “What matters for financial development? Capital controls, institutions, and interactions”, Journal of Development Economics, Vol. 81, Issue 1, October, pp. 163-192.
EY (2015), Africa Attractiveness Survey: Making Choices, www.ey.com/Publication/vwLUAssets/EY-africa-attractiveness-survey-2015-making-choices/$FILE/EY-africa-attractiveness-survey-2015-making-choices.pdf.
Freund, C. and E. Ornelas (2010), “Regional trade agreements”, CEP Discussion Paper No. 961 in the Annual Review of Economics 2, September, pp. 139-167.
Jones, B. (2002), “Economic integration and convergence of per capita income in West Africa”, African Development Review, 14(1), pp. 18-47.
Milanovic, B. (2006), “Economic integration and income convergence: Not such a strong link?”, The Review of Economics and Statistics 88(4), pp. 659-670.
Lane, P. and G.M. Milesi-Ferretti (2006), “The external wealth of nations mark II: Revised and extended estimates of foreign assets and liabilities, 1970–2004”, International Monetary Fund, IMF Working Paper WP/06/69, www.imf.org/external/pubs/ft/wp/2006/wp0669.pdf.
Pigato, M. and W. Tang (2015), “China and Africa: Expanding economic ties in an evolving global context”, World Bank, Working Paper N° 95161.
Sohn, C.H. and H. Lee (2006), “How FTAs affect income levels of member countries”, The World Economy 29(12), pp. 1737-1757.
Sy, A. (2015), “2015: A crucial year for financing development in Africa”, Foresight Africa: Top Priorities for the Continent in 2015, Washington, DC, Brookings Institution, pp.22-26, www.brookings.edu/~/media/Research/Files/Reports/2015/01/foresight%20africa/financing%20african%20development%20sy.pdf.
UNCTAD (2014), World Investment Report 2014: Investing in the SDGs: An Action Plan, UN Conference on Trade and Development, Geneva, http://unctad.org/en/pages/PublicationWebflyer.aspx?publicationid=937.
World Bank (2016), Global Economic Prospects: Sub-Saharan Africa, World Bank, Washington, DC, www.worldbank.org/content/dam/Worldbank/GEP/GEP2016a/Global-Economic-Prospects-January-2016-Sub-Saharan-Africa-analysis.pdf.
World Bank (2015), World Development Indicators database, World Bank, Washington, DC, www.worldbank.org.
World Trade Organisation (2015), Statistics, http://stat.wto.org.
Yaméogo, N.D. et al. (2014), “Diversification and sophistication as drivers of structural transformation for Africa: The economic complexity index of African countries”, Journal of African Development, Vol. 16(2), pp. 1-31.
Yokoyama, K., and A.M. Alemu (2009) “The impacts of vertical and horizontal export diversification on growth: An empirical study on factors explaining the gap between sub-Sahara Africa and East Asia’s performances”, Ritsumeikan International Affairs, Institute of International Relations and Area Studies, Ritsumeikan University, Oita-ken, Japan.

91African Economic Outlook© AfDB, OECD, UNDP 2016
This chapter reviews Africa’s progress from a human development
perspective and provides projections building on current trends.
A sub-regional approach is employed to examine the expansion of
people’s capabilities in relation to living standards, healthy lives and
increasing knowledge. The chapter also explores the negative impact
of inequality – including gender inequality – on all levels of human
development. Human progress in expanding cities and settlements
is considered in the context of the global 2030 Agenda and Africa’s
Agenda 2063. The chapter concludes with a range of best practices
from country experiences in promoting human progress through
more equitable and sustainable human settlements.
Chapter 4
Human development in Africa

4. HUMAN DEVElOPMENt iN AFriCA
92 African Economic Outlook © AfDB, OECD, UNDP 2016
In brief
African countries have made steady progress with gains in education, health and living standards. However, the pace of progress in human development varies by country and sub-region and is insufficient to reach the 2030 Agenda targets for sustainable development. Progress is hampered by several factors: inequality weakens the impact of growth on poverty reduction, weak structural transformation limits work opportunities, and limited advances in gender equality hamper skills and entrepreneurial development. Ensuring human progress for youthful, rapidly expanding and increasingly mobile populations remains a considerable challenge in all African countries. Work is central to ensuring that Africa’s current urbanisation pathways contribute to gains for all. Policy responses to rising exclusion, urban poverty and inequality are essential to achieve the 2030 Agenda and Agenda 2063 goals for inclusive human development in sustainable cities and settlements. These must address existing tensions between social groups, as a result of economic, political and social exclusion, through the provision of secure livelihoods, quality social services, enhanced security, private sector investment, improved human rights and affordable social protection.
Human development in Africa has made strong gains, but remains uneven
Human development in Africa must be sustained and accelerated
Progress on the core dimensions of human development is improving in Africa at the same rate as all developing countries combined. The African region currently ranks third behind East Asia and South Asia in terms of the annual percentage change in human development index (HDI) values (Figure 4.1). UNDP’s Human Development Index is an aggregate indicator of achievement in three key dimensions of human development: health, education and income. Concretely, the HDI measures the capacity to lead a long and healthy life, to be knowledgeable and to have access to resources necessary for a decent standard of living.
Figure 4.1. Average annual change in human development, 1990-2014
1.38 1.34
1.06
0.90
0.75
0.58
1.06
0.73
0
0.2
0.4
0.6
0.8
1.0
1.2
1.4
1.6
Africa Arab StatesEast Asia and the Pacific
Europe and Central Asia
Latin America and the Caribbean
South Asia Developingcountries
World
Source: UNDP (2015a).12 http://dx.doi.org/10.1787/888933350319
Human development goes beyond the accumulation of wealth. It embodies the process of enlarging people’s choices to live their lives in a way that is equitable, participatory, productive and sustainable. These choices are created by expanding human capabilities and functioning (UNDP, 1999). Human development therefore encompasses a number

4. HUMAN DEVElOPMENt iN AFriCA4. HUMAN DEVElOPMENt iN AFriCA
93African Economic Outlook© AfDB, OECD, UNDP 201692 African Economic Outlook © AfDB, OECD, UNDP 2016
of additional dimensions including self-respect, human rights, a sense of community, opportunities for creativity and productivity, and political, social, economic and cultural freedom. To achieve sustainable human development, governments and citizens must build an enabling environment that includes participation in political and community life, environmental sustainability, human security and rights, and more equal outcomes and opportunities for women and men (Figure 4.2).
Figure 4.2. Human development dimensions
Dimensions of human development
Directly enhancinghuman abilities
Creating conditions for human development
Long and healthy life
Knowledge
Decent standard of living
Participation in politicaland community life
Environmentalsustainability
Human securityand rights
Source: UNDP (2015b).
The gap between low and high human development in African countries is closing over time. The rate of progress in African countries with poorer conditions in relation to income, health and education1 is faster than the average of all developing countries combined (Figure 4.3). However, the rate of human progress for all African countries has declined in recent years from the high growth rates achieved between 2000 and 2010. This decline is a reflection of the slowdown in increases in income per capita relative to improvements in education and health outcomes. This slowdown is of concern as most African countries still remain in the low human development category.
Figure 4.3. Change in human development in Africa by category, 1990-2014
%
1.0
0.8
0.2 0.4
1.2
0.8 0.9
1.8
1.0 1.0
1.2
0.7
0
0.2
0.4
0.6
0.8
1.0
1.2
1.4
1.6
1.8
2.0
1990-2000 2010-142000-10
High human development Medium human development
Low human development Developing countries
Source: Authors’ calculations based on UNDP (2015a).12 http://dx.doi.org/10.1787/888933350333

4. HUMAN DEVElOPMENt iN AFriCA
94 African Economic Outlook © AfDB, OECD, UNDP 2016
In terms of regional variation, North Africa has the highest proportion of medium and high human development countries (Table 4.1). Southern Africa and Central Africa also have mix of low and medium human development countries. However, in East and West Africa, the majority of countries are in the low human development category with a few exceptions. The focus must therefore remain on accelerating and sustaining progress especially for low human development countries.
Table 4.1. African countries by level of human development
Region
Low human development (less than 0.550)
Medium human development (0.550-0.699)
High human development (0.700-0.799)
Central CameroonCentral African RepublicChad
Congo (Democratic Republic of the)Madagascar
CongoEquatorial GuineaGabon
East BurundiComorosDjiboutiEritrea EthiopiaKenya
RwandaSouth SudanSudanTanzania Uganda
Seychelles
North Mauritania EgyptMorocco
AlgeriaLibya Tunisia
Southern AngolaLesothoMalawi
MozambiqueSwazilandZimbabwe
BotswanaNamibiaSao Tome and Principe
South AfricaZambia
Mauritius
West BeninBurkina FasoCôte d’IvoireGambiaGuineaGuinea-BissauLiberia
MaliNigerNigeriaSenegalSierra LeoneTogo
Cabo VerdeGhana
Source: UNDP (2015a).
Africa’s youth is at risk from slow human progress
Africa still faces a significant deficit in terms of people’s capabilities and choices, with implications for Africa’s youthful population. Three out of every four Africans live in a country with poor foundations for human development, while globally one in every five individuals lives in a low human development country (UNDP, 2015a). Africa is a youthful continent, with over 50% of the population under the age of 18.5 and 19% of the population aged between 15 and 24 years old (UN DESA, 2015). This deficit therefore has tremendous short and long-term implications for inclusive growth and development.
Over time, the number of Africans living in low human development conditions is likely to fall. In 2015, 36 African countries were in the low human development category, while 17 were in the medium to high human development categories. If African countries continue on the same trajectory, the number of countries experiencing low human development is projected to fall to 22 in 2030 and to five countries by 2063 (UNDP, forthcoming).
However, if the current rate of human progress remains steady, global and continental poverty targets will not be met in all countries. In 2015, approximately 879 million Africans lived in countries with low human development, while 295 million lived in medium and high human development countries (Figure 4.4). Recent population projections for individual African countries estimate a fall in the number of Africans living in low human development countries to 456 million by 2030 (UNDP, forthcoming). However, these projections imply that the ambitious goals set by 2030 Agenda and Agenda 2063 to eliminate poverty by 2030 and 2063, respectively, will not be met.
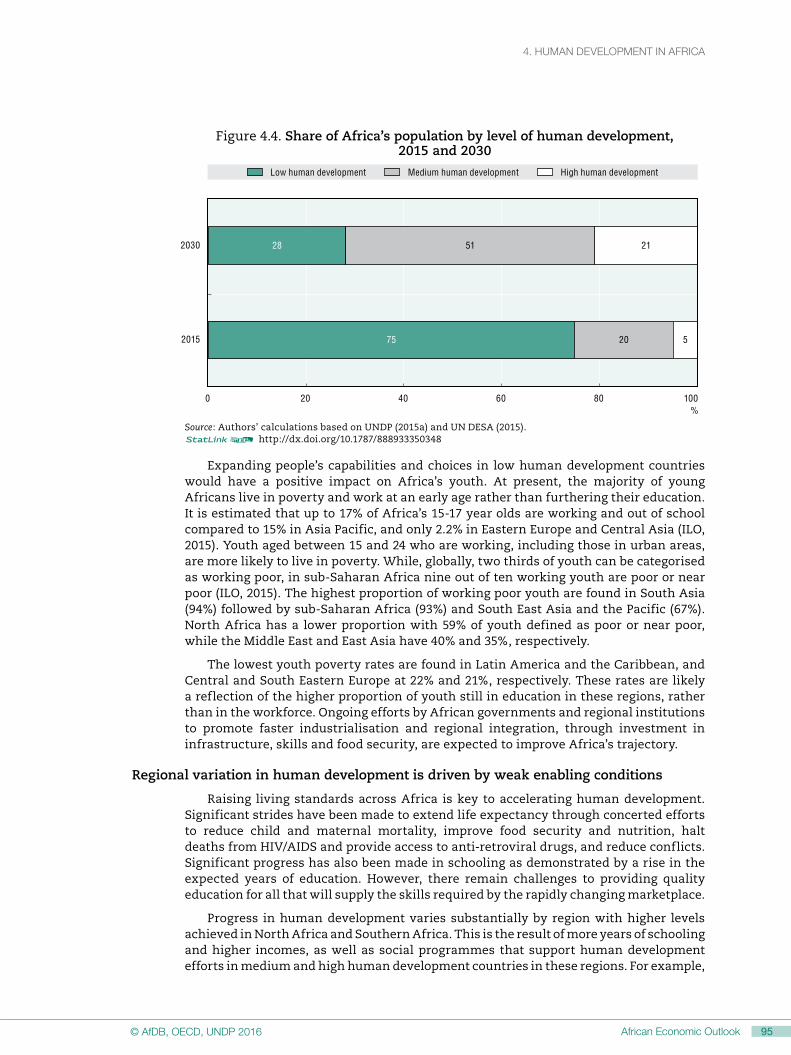
4. HUMAN DEVElOPMENt iN AFriCA4. HUMAN DEVElOPMENt iN AFriCA
95African Economic Outlook© AfDB, OECD, UNDP 201694 African Economic Outlook © AfDB, OECD, UNDP 2016
Figure 4.4. Share of Africa’s population by level of human development, 2015 and 2030
%
2030
2015 75
28
20
51
5
21
0 20 40 60 80 100
Low human development Medium human development High human development
Source: Authors’ calculations based on UNDP (2015a) and UN DESA (2015).12 http://dx.doi.org/10.1787/888933350348
Expanding people’s capabilities and choices in low human development countries would have a positive impact on Africa’s youth. At present, the majority of young Africans live in poverty and work at an early age rather than furthering their education. It is estimated that up to 17% of Africa’s 15-17 year olds are working and out of school compared to 15% in Asia Pacific, and only 2.2% in Eastern Europe and Central Asia (ILO, 2015). Youth aged between 15 and 24 who are working, including those in urban areas, are more likely to live in poverty. While, globally, two thirds of youth can be categorised as working poor, in sub-Saharan Africa nine out of ten working youth are poor or near poor (ILO, 2015). The highest proportion of working poor youth are found in South Asia (94%) followed by sub-Saharan Africa (93%) and South East Asia and the Pacific (67%). North Africa has a lower proportion with 59% of youth defined as poor or near poor, while the Middle East and East Asia have 40% and 35%, respectively.
The lowest youth poverty rates are found in Latin America and the Caribbean, and Central and South Eastern Europe at 22% and 21%, respectively. These rates are likely a reflection of the higher proportion of youth still in education in these regions, rather than in the workforce. Ongoing efforts by African governments and regional institutions to promote faster industrialisation and regional integration, through investment in infrastructure, skills and food security, are expected to improve Africa’s trajectory.
Regional variation in human development is driven by weak enabling conditions
Raising living standards across Africa is key to accelerating human development. Significant strides have been made to extend life expectancy through concerted efforts to reduce child and maternal mortality, improve food security and nutrition, halt deaths from HIV/AIDS and provide access to anti-retroviral drugs, and reduce conflicts. Significant progress has also been made in schooling as demonstrated by a rise in the expected years of education. However, there remain challenges to providing quality education for all that will supply the skills required by the rapidly changing marketplace.
Progress in human development varies substantially by region with higher levels achieved in North Africa and Southern Africa. This is the result of more years of schooling and higher incomes, as well as social programmes that support human development efforts in medium and high human development countries in these regions. For example,

4. HUMAN DEVElOPMENt iN AFriCA
96 African Economic Outlook © AfDB, OECD, UNDP 2016
the average expected duration of schooling in North and Southern Africa is 12 years. This is higher than the African average of 10 years, but lower than the maximum of 18 years, which is equivalent to a Master’s degree. In addition, North Africa has achieved an average life expectancy of 72 years, which is equal to the average life expectancy for all developing countries globally. The average life expectancy in East Africa is only 62 years, while life expectancy in Central, Southern and West Africa ranges from 58 to 60 years.
However, in all regions the standard of living, as measured by the gross national income (GNI) per capita, remains inadequate. An average global inhabitant receives USD 14 301 annually in 2011 purchasing power parity prices, while an average North African receives only USD 9 900, a Southern African receives USD 6 800 and a Central African receives USD 6 400. Inhabitants of East and West Africa lag behind with an average GNI per capita of only USD 3 800 and USD 2 300, respectively (UNDP, 2015a). The aggregate HDI and other sub-components (life expectancy and expected schooling) also differ by region (Figure 4.5).
Figure 4.5. Human development index and components by region of Africa
0 0.1 0.2 0.3 0.4 0.5 0.6 0.7 0.8 0.9
Human development index Life expectancy Expected schooling GNI per capita
West Africa
East Africa
Central Africa
Southern Africa
North Africa
Notes: Average life expectancy, schooling and GNI per capita values, as compared to benchmarks (85 years life expectancy, 18 years expected schooling and USD 75 000 GNI per capita).Source: Authors’ calculations based on UNDP (2015a).12 http://dx.doi.org/10.1787/888933350356
Persistent low human development is strongly correlated with the relatively high population growth rate in low human development countries. High population growth mitigates the positive impact of economic growth and social progress on human development. Low human development countries have the highest fertility rates and twice the average annual population growth of medium and high human development countries. The average annual population growth rate for low human development countries is 2.6%, compared to 1% and 1.9% for high and medium development countries, respectively (UNDP, 2015a). Nine of the ten countries in the world with the highest total fertility rates are African (UN DESA, 2015).
High population growth leads to high dependency and a delayed demographic dividend. High fertility implies that the burden on the working population to support the aged and the young is unlikely to decline rapidly. In Africa, children under the age of 15 account for 41% of the population (UN DESA, 2015). High dependency reduces

4. HUMAN DEVElOPMENt iN AFriCA4. HUMAN DEVElOPMENt iN AFriCA
97African Economic Outlook© AfDB, OECD, UNDP 201696 African Economic Outlook © AfDB, OECD, UNDP 2016
the potential demographic dividend from the growing number of youth entering the workforce, usually characterised by rising levels of national productivity and diversified economies. This is because high dependency diverts time, resources and investments away from productive activities towards care-related activities and household consumption, which slows the pace of economic diversification and human development. Policy responses and determined action are required to tackle population growth and create productive employment opportunities to harness the youth bulge and use this demographic dividend for Africa’s development.
Africa faces critical hurdles to creating the enabling conditions for human development in terms of effective public participation in governance and non-realisation of rights. The annual Ibrahim Index of African Governance (IIAG, 2015a) shows that participation remains one of the lowest scoring areas for most African countries. This is particularly true for the indicator on “political rights”, which measures the extent to which citizens are free to “participate in the political process including the right to vote freely for distinct alternatives in legitimate elections, compete for public office, join political parties and organisations and elect accountable representatives” (IIAG, 2015b).
Another key enabling condition for human development is environmental sustainability. However, significant environmental threats to human development persist in the region including the unsustainable utilisation of Africa’s rich natural resources, which constitute the cornerstone of Africa’s economic growth. African experts have prioritised sustainable land, biodiversity and waste management, and an effective response to natural disasters and climate change, as key areas of intervention for Africa’s sustainable development (UNEP, 2015).
The persistent gender gap in economic opportunities, human development, and law and institutions poses an additional threat. The weakening of legislation on violence against women overrides the positive impact of improvements in gender equality that have taken place in education, the labour force, politics and the judiciary. These effects are demonstrated in the Africa Gender Equality Index (AfDB, 2015) and the Mo Ibrahim Index of African Governance Gender sub-index (IIAG, 2015b). Progress and gaps in relation to gender equality are covered in Table 26 in the Statistical annex of this report, with data from the African Development Bank, OECD and UNDP.
Inequality threatens long-term development
Africa’s human development progress is hampered by inequality in the distribution of opportunities and outcomes within countries. This reduces the impact of interventions aimed at promoting human development. When inequality in the distribution of health, education and income across the population in each country is taken into account, every region in the world registers a drop in the value of human development. This gap between the human development value and the adjusted human development value can be expressed as an overall loss in human development due to inequality.
African countries display the highest inequality gap in human development followed by South Asia, the Arab States and Latin America (Figure 4.6). East Asia and the Pacific and Eastern Europe and Central Asia present the smallest gap in human development due to inequality. These regions have low levels of inequality in health and education outcomes. As such, reducing inequality remains a critical focus for African countries in the implementation of the Sustainable Development Goals (SDGs), including the two dedicated goals on inequality: Goal 5 (gender equality) and Goal 10 (reducing inequality within and among countries).

4. HUMAN DEVElOPMENt iN AFriCA
98 African Economic Outlook © AfDB, OECD, UNDP 2016
Figure 4.6. Overall loss in human development from inequality by region
%0 5 10 15 20 25 30 35
33
29
25
24
19
13
Sub-Saharan Africa
South Asia
Arab States
Latin America and the Caribbean
East Asia and the Pacific
Europe and Central Asia
Source: UNDP (2015a).12 http://dx.doi.org/10.1787/888933350361
African countries with high human development have the lowest overall inequality gap. For example, Cabo Verde and Mauritius – countries with medium and high human development, respectively – have the lowest levels of overall human development inequality. Central African Republic, Chad, Comoros, Guinea Bissau and Sierra Leone – all countries with low human development – have high levels of overall human development inequality.
However, the relative importance of inequality for each dimension of human development varies across high, medium and low development countries (Figure 4.7). In low human development countries, inequality across the population is highest in education and health compared to inequality in income. In medium development countries, however, the disparity is highest in income compared to education and health. For high human development countries, the disparities are highest in education compared to income and are lowest in health.
Figure 4.7. Inequality in the dimensions of human development by group in Africa
18
29
3432
11
26
37
32
24
28
3735
19
35
2829
0
5
10
15
20
25
30
35
40%
Coefficient of human inequality Inequality in life expectancy
Inequality in education Inequality in income
High human development Medium human development Low human development All
Source: Authors’ calculations based on UNDP (2015a).12 http://dx.doi.org/10.1787/888933350376
Income inequality has immediate and long-term implications for human development. It has a decisive impact on economic growth, human capabilities and opportunities, and the transfer of poverty and poor human development outcomes

4. HUMAN DEVElOPMENt iN AFriCA4. HUMAN DEVElOPMENt iN AFriCA
99African Economic Outlook© AfDB, OECD, UNDP 201698 African Economic Outlook © AfDB, OECD, UNDP 2016
across generations. Melamed and Samman (2013) provide a comprehensive review of the relationship between income inequality and growth. In particular, they highlight the emerging consensus that income inequality has a negative impact on poverty reduction at all levels of growth. For example, between 1981 and 2005, economic growth enabled millions of people to escape poverty. However, growth in income inequality ensured approximately 600 million people remain trapped in poverty (Hillebrand, 2009: 7).
Income inequality in the absence of effective distributional mechanisms contributes to unequal education and health attainment. There is evidence that higher income inequality contributes to lower growth, as lower income households are less able to lead healthy lives and access education (Dabla-Norris et al., 2015). This variation in health and education outcomes could be a result of disparity in individual access to economic resources, as well as inequality in the allocation of resources by geographic location, gender and economic or social group.
This inequality in education and health outcomes becomes a long-term barrier to human progress. The negative impact extends to inequitable access to employment, decent wages, entrepreneurship and opportunities to participate in decision making. These all contribute to the inter-generational transfer of low human development, which dampens the poverty-reducing impact of economic growth and transformation and promotes an ongoing cycle of social exclusion and poverty.
Gender inequality slows human progress and hinders structural transformation
Gender inequality remains a barrier to human development in most countries in Africa. According to the Gender Inequality Index, which examines gender inequality in health, education, political representation and the labour market, low human development countries have the highest aggregate levels of gender inequality2 (Figure 4.8). Analysis of this aggregate score reveals that the majority of African countries at all levels of human development still face low levels of political representation for women, and there are significant variations in labour force participation, health and education.
Figure 4.8. Gender Inequality Index and components by group in Africa
0 10 20 30 40 50 60 70 80 90
100
Medium human developmentHigh human development Low human development
Gender Inequality Index
Maternal mortalityper 100 000
Ratio of females/males in parliament
Ratio of females/males with secondary education
Ratio of female/maleparticipation
in the labour force
Source: Authors’ calculations based on UNDP (2015a).12 http://dx.doi.org/10.1787/888933350384

4. HUMAN DEVElOPMENt iN AFriCA
100 African Economic Outlook © AfDB, OECD, UNDP 2016
Many African countries exhibit low levels of female representation in leadership, albeit with large variations. Female representation accounts for over 60% of the lower house of parliament in Rwanda (dropping to 39% in the upper house) but only 3% in Comoros. Overall, female representation accounts for over 30% of parliament in only 14 African countries (IPU, 2015). Reducing this gender gap has the potential to make African societies more vibrant and its institutions more resilient and responsive. In particular, countries with higher female representation in parliament show increased attention to reform in areas such as family land law and land rights, and greater public acceptance of women as political leaders (AfDB, 2015).
Gender inequality in the labour market results in lost benefits to individuals, households and society. Female labour force participation in high human development countries in North Africa and beyond is low, with only 15% to 44% of working age females in the labour force compared to 65.4% in sub-Saharan Africa. This has significant economic implications, as annual economic losses due to gender gaps in the labour force have been estimated at USD 60 billion for the Africa region (Bandara, 2015).
For women in the workplace, low levels of education, poor conditions of work and low remuneration pose an additional challenge to obtaining a fair return on their labour. Recent statistics for 2007-11 show that the female to male literacy ratio for sub-Saharan Africa is only 76 compared to the world average of 90 (UNSD, 2016). Estimates also indicate that 74% of working women in Africa are in low productive agriculture and informal employment, compared with 61% of men (ILO, 2013). Women employed in vulnerable work or the informal economy tend to experience poor working conditions, have limited access to social security and representation, and receive lower earnings than other workers (Vanek et al., 2014).
Inequalities in care and domestic work prevent many women from spending time on education and paid work. Time-use surveys show that women are typically responsible for the majority of unpaid care work such as household chores and caring for children and elderly relatives. Women report doing more than four times as much unpaid care and domestic work than men in Ethiopia, Madagascar and Mauritius, and three times as much in Benin, Ghana, Rwanda, South Africa and the United Republic of Tanzania (UN Women, 2015).
Poor maternal health as a result of early marriage, high adolescent births and low access to reproductive health robs women of the capability to lead long, healthy and productive lives. In 42 out of 53 African countries for which data are available, more women die in childbirth than the average number for all developing countries. Between 240 and 1 100 Africa women die in childbirth per 100 000 live births every year compared to the average of 225 for all developing countries (UNSD, 2016). Seven out of the ten countries with the highest rate of early marriage for girls are in Africa (UNICEF, 2014). In addition, Africa has twice the number of adolescent births as all developing countries combined (UN DESA, 2015).
Low health expenditures limit access to reproductive health services. Low human development countries in Africa spend only USD 134 per capita on health, compared to an average of USD 561 for medium human development countries and USD 827 for high human development countries (World Bank, 2016). This leads to a significant unmet need for family planning in African countries of 23.2% against a global average of 12.8% for all developing countries, due to supply and demand constraints (Alkema et al., 2013).
Gender inequality persists due to discriminatory social institutions, power structures, traditions and socio-cultural norms. Discriminatory social institutions include formal and informal laws, social norms and practices that restrict or exclude women and consequently curtail their access to rights, justice, land ownership, and access to resources and empowerment opportunities. These discriminatory institutions contribute to inequity and unequal development outcomes for women and men (OECD, 2014).
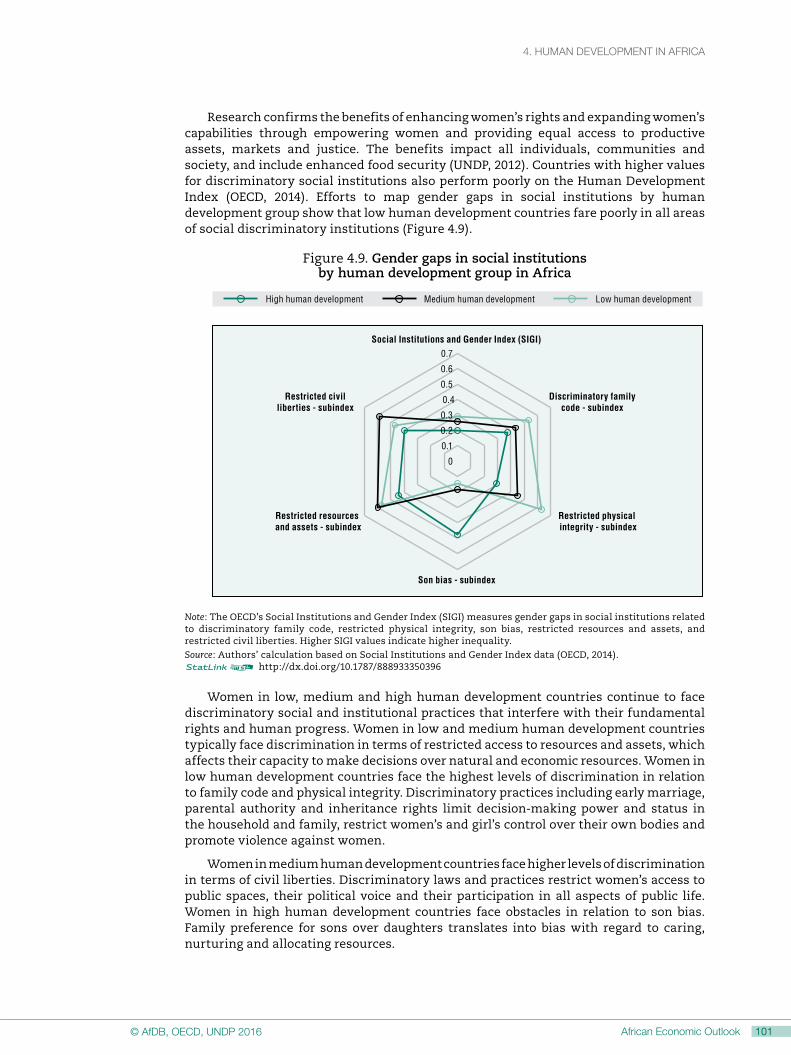
4. HUMAN DEVElOPMENt iN AFriCA4. HUMAN DEVElOPMENt iN AFriCA
101African Economic Outlook© AfDB, OECD, UNDP 2016100 African Economic Outlook © AfDB, OECD, UNDP 2016
Research confirms the benefits of enhancing women’s rights and expanding women’s capabilities through empowering women and providing equal access to productive assets, markets and justice. The benefits impact all individuals, communities and society, and include enhanced food security (UNDP, 2012). Countries with higher values for discriminatory social institutions also perform poorly on the Human Development Index (OECD, 2014). Efforts to map gender gaps in social institutions by human development group show that low human development countries fare poorly in all areas of social discriminatory institutions (Figure 4.9).
Figure 4.9. Gender gaps in social institutions by human development group in Africa
0
0.1
0.2
0.3
0.4
0.5
0.6
0.7
Medium human developmentHigh human development Low human development
Social Institutions and Gender Index (SIGI)
Discriminatory family code - subindex
Restricted physical integrity - subindex
Son bias - subindex
Restricted resources and assets - subindex
Restricted civil liberties - subindex
Note: The OECD’s Social Institutions and Gender Index (SIGI) measures gender gaps in social institutions related to discriminatory family code, restricted physical integrity, son bias, restricted resources and assets, and restricted civil liberties. Higher SIGI values indicate higher inequality.Source: Authors’ calculation based on Social Institutions and Gender Index data (OECD, 2014).12 http://dx.doi.org/10.1787/888933350396
Women in low, medium and high human development countries continue to face discriminatory social and institutional practices that interfere with their fundamental rights and human progress. Women in low and medium human development countries typically face discrimination in terms of restricted access to resources and assets, which affects their capacity to make decisions over natural and economic resources. Women in low human development countries face the highest levels of discrimination in relation to family code and physical integrity. Discriminatory practices including early marriage, parental authority and inheritance rights limit decision-making power and status in the household and family, restrict women’s and girl’s control over their own bodies and promote violence against women.
Women in medium human development countries face higher levels of discrimination in terms of civil liberties. Discriminatory laws and practices restrict women’s access to public spaces, their political voice and their participation in all aspects of public life. Women in high human development countries face obstacles in relation to son bias. Family preference for sons over daughters translates into bias with regard to caring, nurturing and allocating resources.

4. HUMAN DEVElOPMENt iN AFriCA
102 African Economic Outlook © AfDB, OECD, UNDP 2016
sustainable cities and structural transformation are a priority for human development in Africa
The 2030 Agenda and Africa’s Agenda 2063 aim to accelerate human development through sustainable settlements
The Millennium Development Goals (MDGs) highlighted the potential of growing urbanisation to increase living standards. They also recognised the threats to groups excluded from growing prosperity, especially those located in slums. The MDGs aimed to achieve by “2020, a significant improvement in the lives of at least 100 million slum dwellers”. Many African countries have since made significant progress in improving access to social services such as water and sanitation in cities. However, human progress for those living in slums is still constrained by lack of basic services such as improved drinking water and adequate sanitation and poor energy supply, combined with insecure tenure, non-durable housing and overcrowding. According to UN-Habitat, 61.7% of urban Africans in sub-Saharan Africa live in slums (UN-Habitat, 2013b). This figure is significantly higher than that of South Asia, which at 45% has the second-highest incidence of slum prevalence (UNECA et al., 2015).
The Sustainable Development Goals (SDGs) and the 2030 Agenda deepen the focus on equity and rights in human settlements. The 2030 Agenda states that inclusive, safe, resilient and sustainable cities and settlements are critical to advancing human development and structural transformation. Goal 11 affirms the need to ensure the human rights of those in vulnerable situations, women, children, persons with disabilities and older persons. It also identifies a range of human capabilities critical for human progress, including education, health, environmental sustainability, participation in community and political life and gender equality.
These global commitments to promoting the resilience of cities and human settlements aim to safeguard social gains from capital investment in urban infrastructure. It is of critical importance for their implementation in Africa to ensure balanced investment in urban and rural settlements, promote linkages and eliminate urban or rural biases.
Africa’s Agenda 2063 aims to accelerate economic and social transformation from natural resource-based economies with most of the population employed in agriculture to more diversified economies. Labour will move from low productive sectors, such as agriculture and the informal sector, towards more productive sectors, such as industry and services. This economic transformation will be accompanied by a social transformation with migration from rural to urban areas expected to result in a decline in birth and dependency rates (Timmer et al., 2012).
Cities and other settlements play a central role in the objectives of Agenda 2063. These include goals related to inclusive and sustainable development, and continental integration, unity and renaissance. The vision for Agenda 2063 is to develop cities and other settlements as hubs that enhance access to social services and improved living standards, while also creating a network of interconnected cities. Agenda 2063 therefore prioritises critical investments in economic and social infrastructure required to accelerate structural transformation.
Key stakeholders engaged in the implementation of Agenda 2063 objectives for human settlements should therefore take into consideration key elements from the 2030 Agenda regarding the distribution of benefits across populations and their participation in the planning and governance of cities.

4. HUMAN DEVElOPMENt iN AFriCA4. HUMAN DEVElOPMENt iN AFriCA
103African Economic Outlook© AfDB, OECD, UNDP 2016102 African Economic Outlook © AfDB, OECD, UNDP 2016
Sustainable settlements will prioritise decent work for youth and women
Expanding cities are hubs for present and future work, however the nature of work is becoming more technology intensive. Work provides incomes and livelihoods and is therefore an integral part of human development. Work can enhance human development through its contribution to reducing inequality, securing livelihoods and empowering individuals. However, globalisation and technical progress are changing the world of work. The digital revolution has influenced productivity and work opportunities in Africa, which increasingly require access to mobile phones and Internet services (UNDP, 2015). This is the case for emerging high-tech industries and the service sector, as well as informal activities facilitated by mobile phones and services.
More equitable access to economic opportunities arising from the changing world of work could create greater opportunities for Africa’s young and growing population. Unequal access to digital services, especially for women, youth and informal settlements, is generating barriers to work that have an impact on present and future human development. Estimates show that only 19.3% of the population in sub-Saharan Africa uses the Internet, with imbalances found between women and men and rural and urban areas. Provision of Internet access in Africa equivalent to developed countries could generate 44 million new jobs, representing a boost to the young and unemployed (Deloitte, 2014). As African countries continue to prioritise infrastructure development, distributional imperatives must be addressed up front to prevent uneven access from perpetuating existing inequalities.
Barriers to work are compounded by low skills, particularly for youth, creating a challenge for the generation of present and future work opportunities in the region. A healthy and educated workforce is critical to productivity and economic growth. Yet, youth in sub-Saharan Africa have the lowest literacy rates of any region: only 62.7% for women and 74.7% for men (UNSD, 2016). As the population shifts to cities and work becomes more technical, this skills deficit is likely to impede access to emerging well-paying jobs and lock many into low-paying informal work. This situation underscores the link between the underlying gap in capabilities for many Africans and the inability to benefit from emerging work opportunities in cities. Priority actions must focus not only on service delivery and infrastructure improvements, but also on empowerment and eliminating barriers for disadvantaged workers, including young women and men.
Efficient and equitable cities require the engagement of all citizens
Policy imperatives for enhancing access to decent work and livelihoods in cities include effective and inclusive service delivery, accountable governance processes and a human rights-based approach to infrastructure expansion. Pro-poor and gender-sensitive policies that aim to narrow disparities and achieve human development require a stronger commitment to the principles of good governance. Important elements of inclusive governance in cities include upholding the rule of law, promoting human rights, and transparent, participatory and accountable decision-making processes (Leete, 2008). Inclusive governance also requires active engagement on the part of the poor, women, men and youth to ensure pro-poor and gender-sensitive policies that narrow rich-poor disparities.
Greater citizen engagement especially among women contributes to sustainable cities. Such engagement is key to determining resource allocations for the provision of quality and affordable energy services, water, sanitation and shelter in a more equitable manner. Governance programmes and tools designed to improve women’s participation and empowerment have targeted diverse groups of women. These have led

4. HUMAN DEVElOPMENt iN AFriCA
104 African Economic Outlook © AfDB, OECD, UNDP 2016
to greater citizen empowerment, improved gender equality and accountability, and the development of vibrant and sustainable living environments with equitable economic and social benefits in sustainable towns and cities (WomenWatch, 2012). In Peru, decentralisation and new laws that encompass citizen protection and participation led to a higher level of engagement among women in local co-ordinating councils (LCCs) and monitoring committees, resulting in a more equitable allocation of resources (UN-Habitat, 2013a).
The rapid growth of urban areas in Africa with low levels of development has constrained the ability of most governments to make the requisite investments in physical infrastructure and human capital necessary for productivity rises and to manage the unintended negative impact of urban growth. A focus on effective resource mobilisation and management of financial, human and technical resources is therefore key. For human development in cities to be sustainable, the government and citizens must improve urban planning and design to promote resource efficiency, increase access to sustainable transport and energy, and improve access to water, sanitation and waste management (Mutizwa‐Mangisa, 2012). Implementing these reforms while fostering participation and inclusion would decrease the number of slums dwellers and reduce the ecological footprint of cities.
Africa can also draw lessons from other regions regarding human progress in sustainable cities. Asia and Latin America (Mahbub ul Haq, 2014) show that a higher level of urbanisation does not necessarily yield better human development outcomes. Sustainable cities can advance human development through increased economic activities, enhanced employment opportunities and improved access to basic services (see Chapter 7). However, lack of proper management can result in increased deprivation, rising inequality and growing exclusion, which constrain human development.
sustainable urbanisation must address inequality and exclusion
Current urbanisation pathways reduce the pace of human development
Africa’s current urbanisation pathways and growing internal mobility create human development gains, but not for all. Broad-based gains in human development from urbanisation depend on the availability of employment and livelihood opportunities for incoming residents, and an equitable distribution of infrastructure and basic services. If urbanisation occurs without a corresponding increase in economic opportunities and services, the resulting cities will be characterised by concentrations of relatively richer people purchasing low-level services from those migrating to cities, slums and concentrations of basic infrastructure services catering to the higher income parts of the city (Freire, Lall and Leipziger, 2014). There is a danger that the current growth of African cities could result in a poverty transfer from rural to urban areas, thereby creating wider disparities.
The impact of urbanisation on development is a double-edged sword. Population concentration contributes to human development progress, while potentially leading to increases in inequality that fuel underlying tensions between social groups. A strong correlation has been observed between national urbanisation rates and national levels of human development. For example, urban population as a share of total national population in African countries with high human development is close to 60% (Table 4.2). However, urbanisation falls to less than 40% in low HDI countries (UNSD, 2016). This finding is broadly similar to the global finding for high-income and high HDI countries compared to low HDI countries. Rates of urbanisation are much higher in high human development countries (62%), but are also rising in low human development countries (35%).

4. HUMAN DEVElOPMENt iN AFriCA4. HUMAN DEVElOPMENt iN AFriCA
105African Economic Outlook© AfDB, OECD, UNDP 2016104 African Economic Outlook © AfDB, OECD, UNDP 2016
Table 4.2. Urbanisation by level of human development in Africa
African countries by level of human development
Share of population residing in urban areas (%) Urban growth (%)
2015 2030
Low human development 36.1 43.1 3.8
Medium human development 57.5 63.7 2.6
High human development 58.4 62.6 9.7
Source: UNSD (2016).
While a direct causality cannot be implied, economic and social channels lead from growing urbanisation to human development. These channels include more economic and livelihood opportunities, and better provision of urban services and infrastructure to more citizens, leading to better indicators of health, education and income compared to rural areas. Historically, urbanisation is associated with economic and social transformation, greater geographic mobility, lower fertility, longer life expectancy and population ageing. Cities become important drivers of development and poverty reduction in both urban and rural areas when they enhance economic activity, productivity and trade, strengthen links between rural and urban areas, and provide greater opportunities for political participation.
Urban transition often contributes to widening gaps between social groups within cities, leading to conflicts and insecurity, mainly as a result of political and social exclusion. There are limited data to determine the extent to which relative poverty in cities rises as a result of differentials in income between the rich and the poor. However, there is evidence that some of the most urbanised countries, such as Botswana, Central African Republic, Seychelles and South Africa, also have high-income inequality (Table 4.3). In many cases, only limited attention has been paid to the problem of urban poverty with fewer interventions focusing on reducing relative poverty, exclusion and inequality in cities. UN-Habitat refers to this overwhelming focus on rural poverty at the expense of urban poverty as the “urban penalty”. There is an assumption that “all” urban dwellers are healthier, more literate and more prosperous than rural population (UN-Habitat, 2007).
Table 4.3. Inequality and urbanisation by level of human development in Africa
African countries by level of
human development
Urban residents in slums
Countries with highly urban
populations (over 50% urban)
Countries with over 60%
of urban population in slums
High income inequality
Palma ratio and Gini coefficient% ‘000s
Low human development
63% 173 555 Cameroon, Côte d’Ivoire, Gambia, Guinea Bissau, Liberia, Mauritania
Burkina Faso, Central African Republic, Chad, Comoros, Democratic Republic of the Congo, Liberia, Madagascar, Mauritania, Mozambique, Niger, Sierra Leone, Somalia, South Sudan
Central African Republic, Comoros, Lesotho
Medium human development
41% 25 527 Botswana, Cabo Verde, Congo, Gabon, Ghana, Morocco, Sao Tome and Principe, South Africa
Equatorial Guinea, Sao Tome and Principe
Botswana, Namibia, South Africa, Zambia
High human development
8% 593 Algeria, Libya, Tunisia, Seychelles
Seychelles
Notes: The Palma ratio is the ratio of the richest 10% of the population’s share of gross national income (GNI) divided by the share of the poorest 40% based on the work of Palma (2011). The Gini coefficient is the measure of deviation of the distribution of income among individuals or households within a country from a perfectly equal distribution. A value of 0 represents absolute equality and a value of 100 represents absolute inequality.Source: UNSD (2016).
Many urban slum dwellers have to cope with poor health, lack of education, poor-quality housing, limited and more expensive access to public services such as piped water, sanitation facilities and garbage collection, and insecure land tenure. In low human

4. HUMAN DEVElOPMENt iN AFriCA
106 African Economic Outlook © AfDB, OECD, UNDP 2016
development countries, three out every five urban dwellers live in a slum compared to two out of five in medium development countries and less than one in ten in high human development countries (UNSD, 2016). Studies show that pneumonia, diarrhoea, malaria, measles and HIV/AIDS – the five diseases that cause more than half of deaths among children – are prevalent in urban slums as a result of poor living conditions (UN-Habitat, 2007). Poor service delivery and insecurity in slums has a twofold impact on women and girls who bear the burden of care work in the household. Women and girls are typically responsible for fetching water when supply is poor. This can take hours out of their day, reducing time for education, employment, childcare and rest (Women Watch, 2012)
The largest share of slum dwellers is found in low human development countries, which encounter greater challenges in catering for new urban entrants, as they have the largest share of urban residents living in slums without adequate access to economic and social services (Table 4.3). At the same time, large income disparities are found in African countries at all stages of human development. The richest 10% of the population have over five times the income of the poorest 40% in high and medium human development countries (Botswana, Namibia, Seychelles and South Africa). Wide income disparities are also found in low human development countries (Comoros, Central African Republic and Lesotho).
Young women and men in urban areas face particular challenges in relation to social exclusion and poverty. African youth represent a wide spectrum in terms of level of education and skills, with urban youth having access to opportunities that may not be accessible for rural youth. However, some evidence indicates that the majority of Africa’s urban youth are underprivileged and live in informal settlements (UN-Habitat, 2008). Youth residing in informal urban settlements in sub-Saharan Africa are more likely to have a child, be married or lead a household than their counterparts in non-slum areas (Gupte, Lintelo and Barnett, 2014).
Recent evidence shows that new cities in Africa increasingly cater for higher income groups, creating a periphery of low-income neighbourhoods. UN-Habitat notes that this is mainly due to inappropriate urban development strategies and a lack of governance capacities in secondary cities, which are absorbing the bulk of the urban population. This leads to a bias towards providing services for the urban elite (UN-Habitat, 2014).
Effective strategies are needed to overcome exclusion and inequality
Lessons from selected countries highlight best practices to enhance inclusive and equitable human development in the face of rising mobility. The practices are drawn from countries with high mobility and good human development outcomes, as well as countries with high mobility but low human development. Underlying factors contributing to high human development or low human development in the context of rapid urbanisation are mapped against opportunities to promote human development in an urbanising environment. While progress has been made in both instances, tackling income and social inequality in the context of growing cities remains imperative in both low human development and high human development countries.
Algeria, Seychelles and Tunisia are highly urbanised countries with high human development outcomes (Box 4.1). In Algeria, 71% of the population lives in urban areas with good coverage of social services and a well-educated workforce. However, there is a relatively high degree of gender inequality with few working-age women in the workforce and a higher than average maternal mortality rate for high human development African countries. While almost one third of parliamentarians are female, access to secondary education is especially low for girls.
Seychelles and Tunisia are on opposite ends of the spectrum in terms of inequality. Tunisia has a low level of income inequality, while Seychelles has a much higher level of

4. HUMAN DEVElOPMENt iN AFriCA4. HUMAN DEVElOPMENt iN AFriCA
107African Economic Outlook© AfDB, OECD, UNDP 2016106 African Economic Outlook © AfDB, OECD, UNDP 2016
income inequality. In Tunisia, 67% of the population lives in urban areas with only 7% of the population living on less than USD 1 dollar a day, while only 8% of urban residents live in slums (UN DESA, 2014).
Income inequality in Tunisia is moderate with the income of the richest 10% of the population 1.5 times higher than the poorest 40%. In general, gender inequality is low with low maternal mortality and a high share of women in parliament. However, labour force participation for women is extremely low and girls have less access to secondary education than boys.
In Seychelles, 54% of the population lives in urban areas. Income inequality is relatively high with the income of the richest 10% six times higher than the poorest 40%. Gender parity in secondary education has been achieved and two out of every five parliamentarians are female compared to the average for high human development countries of one in five.
There are broad similarities among these high human development countries regarding pathways to inclusive human development for settlements. In Algeria, Seychelles and Tunisia, similarities include enhanced access to work, the wide coverage and effectiveness of social protection systems, good health and education systems, safety and the rule of law.
However, to harness opportunities from urbanisation these countries must address rising social exclusion. Existing gaps need to be addressed in social protection, youth employment and gender inequality, especially in the area of work. These countries also need to create a suitable climate for domestic and external investments in order to create more jobs and generate public and private income in cities. Attention to reducing vulnerability and promoting environmental sustainability is also critical in fragile contexts.
Box 4.1. Highly urbanised countries with high human development outcomes: Algeria, Seychelles and Tunisia
Algeria
Provision of quality social services has led to good health indicators in child nutrition, maternal mortality and child mortality. There is also broad access to water and sanitation, good national security and personal safety.
In education, the availability of skilled education workers, as a result of investment in high pupil to teacher ratios, has resulted in high literacy rates, and primary and secondary completion for both girls and boys.
However, the region’s high youth employment and low youth participation in the labour force, especially for women, must be addressed to unlock growth and improvements in living standards, and reduce social exclusion from poverty and inequality.
Improving the current weak business environment could also unlock sustainable economic and employment opportunities. Areas of focus include flow of investment capital, the soundness of banks and more efficient customs procedure. The quality of electricity supply, road and air transport have also deteriorated.
Effective participation and the realisation of rights enhance economic and social opportunities for all. Building on the country’s ratification of human rights conventions and recent improvement in the representation of women in politics, there is a need for more progress on political rights and the removal of barriers to effective governance by political representatives. The country should aim to increase women’s participation in the labour force, enhance gender equality in the workplace and strengthen legislation on violence against women.

4. HUMAN DEVElOPMENt iN AFriCA
108 African Economic Outlook © AfDB, OECD, UNDP 2016
Box 4.1. Highly urbanised countries with high human development outcomes: Algeria, Seychelles and Tunisia
Seychelles
A comprehensive welfare system and policies to support low-income families and the unemployed have reduced vulnerability and poverty. A good investment climate and living conditions are tied to a high level of safety, including personal safety and national security. Economic activity is spurred by well-developed infrastructure including rail, air, electricity, water and sanitation, IT and strong digital connectivity.
Despite low unemployment rates (3%), youth unemployment is significantly higher (20%). Attention to the existing skills mismatch between education outcomes and private sector needs, and differences in youth expectations and available work, could result in more employment opportunities for youth. In addition, deteriorating gender equality in the workplace, especially in the private sector, is overshadowing improvements in gender equality in education and the high level of participation among women in politics.
Increased investment would provide more economic opportunities to close the income gap. In addition, attention should focus on the business regulatory environment, the efficiency of customs procedures, the removal of constraints on investment flows and the soundness of banks. The biggest challenge noted by the private sector is access to finance. High carbon dependence and vulnerability to the effects of climate change constitute a significant barrier to sustainable urbanisation. More innovation and institutional co-ordination can speed up efforts to address vulnerabilities linked to rising sea levels, marine degradation (coral bleaching), increasing urbanisation and extreme weather phenomena, including floods and droughts.
Tunisia
The government supports active labour market programmes (ALMPs) that include wage subsidies targeting high-skilled youth and provide a stipend, training and social security contributions. On average, 6.4% of GDP is spent on social protection and labour programmes, such as pensions, maternity and disability benefits, and emergency household loans. The provision of health and education services and public expenditure on social sectors account for 19% of GDP.
A high proportion of youth are unemployed, and youth with higher levels of education and women are more likely to be unemployed. A large proportion of unemployed in Tunis are low skilled. Expanding labour market programmes and ensuring equity and gender parity in employment could therefore enhance human progress and counter rising social and economic exclusion among lower and middle-income households.
Up to 45% of workers in the private sector are employed in the informal sector with reduced access to social benefits. Addressing barriers to investment, such as the deteriorating investment climate, high taxes and rising labour costs, could provide a boost to employment and growth.
Gaps in social protection include inefficiency, fragmentation and inequity, and low private social security contributions. The system could be enhanced by reducing reliance on inequitable universal subsidies, improving identification and targeting, and building graduation mechanisms.
Sources: IIAG (2015a), ILO (2015), UNDP (2015a), World Bank (2015) and UNSD (2016).
The second set of countries are urbanising yet have low levels of human development, such as Benin, Gambia and Nigeria (Box 4.2). In Benin, 44% of the population lives in urban areas, higher than the average of 36% for low human development countries. Income inequality is moderately high, as the richest 10% have twice the income of the poorest 40%. About 40% of rural residents live below the national poverty line, but only 31% of urban residents are considered poor. Gender inequality is relatively high with low representation of women in parliament and low access among girls to secondary education.
(cont.)

4. HUMAN DEVElOPMENt iN AFriCA4. HUMAN DEVElOPMENt iN AFriCA
109African Economic Outlook© AfDB, OECD, UNDP 2016108 African Economic Outlook © AfDB, OECD, UNDP 2016
In Nigeria, 48% of the population lives in urban areas. Income inequality is moderate with the richest 10% of the population accounting for twice as much income as the poorest 40%. About 50% of urban dwellers live in slum conditions. 53% of the rural population lives below the poverty line, but only 34% of urban residents are considered poor. Gender inequality is relatively high due to a high rate of maternal mortality, a very low share of women in parliament and low labour force participation rates for women.
Gambia is a low human development country with six out of ten people living in urban areas. Income inequality is moderate: the richest 10% have almost three times the income of the poorest 40%. One out of three urban residents (34%) live in slum conditions. While 74% of the rural residents live below the national poverty line, only 33% of urban residents are considered poor. There is high gender inequality due to the low share of women in parliament, high maternal mortality and low access for girls to secondary education.
These countries display similarities as well as differences in terms of enablers of inclusive human development in cities. In all countries, progress has resulted from economic opportunities found in cities, as well as the presence of a healthy and educated workforce. There is, however, variation in the level of participation in governance, safety and rights, which act as barriers to broader inclusion.
Several development areas that require attention are broadly similar across countries. To enhance human development in cities and elsewhere, these countries need to focus on improving availability and access to physical and digital infrastructure. They also need to reduce social exclusion and gender inequality in the workplace, undertake efforts to engage youth and build resilience to natural disasters.
Box 4.2. Countries that are urbanising but have low levels of human development: Benin, Gambia and Nigeria
Benin
Participation in politics and elections is high with democratically elected political representatives able to govern effectively. A competitive business regulatory environment and good investment climate are overshadowed by challenges related to bureaucracy and red tape, customs procedures and the soundness of banks. Good personal safety and national security create an environment conducive for economic and social progress. In addition, effective and independent judicial processes support the realisation of rights including political, property and human rights.
Improving infrastructure could boost investment and economic opportunities in urban areas. The road and rail network and electricity supply, IT infrastructure and digital connectivity need particular attention. Better digital infrastructure could have a positive impact on accountability, if the current low levels of access to information and online services are improved.
Education outcomes are relatively poor with low literacy levels, gender imbalances and a falling education system quality in terms of the extent to which the education system meets the needs of a competitive economy. Access to water and sanitation is low with a negative impact on health outcomes. Efforts to increase the accountability of public officials and reduce the diversion of public funds could help to increase the effectiveness of public investments.
Youth unemployment is high for educated youth: 39.3% of youth with tertiary education are out of work compared with 22.7% for secondary education and 4.7% for primary education. A significant proportion of the population is fundamentally excluded from society due to poverty and inequality. Efforts to improve social safety nets to address poverty, old age, illness, unemployment and disability would provide a much-needed boost.

4. HUMAN DEVElOPMENt iN AFriCA
110 African Economic Outlook © AfDB, OECD, UNDP 2016
Box 4.2. Countries that are urbanising but have low levels of human development: Benin, Gambia and Nigeria
Gambia
The country enjoys high health and education outcomes, especially in cities, which have higher literacy and enrolment rates creating a pool of skilled labour. Youth in cities are highly literate: between 69% and 75% of youth in Banjul, Brikama and Kanifing are literate. More economic opportunities in cities reduce poverty. Only 7.6% of the population are considered poor in Banjul, compared to 38% in Kanifing, 57% in Brikama and 56% nationally. However, 63% are employed in the informal sector, with a higher share of women (74%) than men (55%). Mechanisms to promote equal access to opportunities for women and men have resulted in a high gender balance in education and female participation in the labour force. However, there are gaps related to gender equality in the workplace, low rates of women in politics, and the status of legislation on violence against women is deteriorating.
Deteriorating road networks and poor rail transport, electricity supply, IT infrastructure and digital connectivity hamper the expansion of economic opportunities in cities. Beyond infrastructure, there is a critical need to provide housing for the poor. The current poor state of public transport and the high cost of taxis force many commuters to walk to work. Improving the efficiency of public transport through the implementation of low-cost, modern systems could improve competitiveness and economic opportunities.
Youth account for almost 37% of the population, the majority of which live in cities. Banjul, Brikama and Kanifing all have a higher youthful population than the national average. Many youth work in agriculture, low-value services and the informal sector. A large proportion of Gambia’s youth is unemployed (38%), with unemployment higher among young women (45%) than young men (30%). Providing more opportunities for economic engagement is critical.
The main city Banjul is a low-lying island threatened by coastal erosion. A one-meter rise in sea level could submerge the city. Challenges affecting drainage and sewage systems also need to be addressed.
Although Gambia has ratified a number of international human rights conventions, the country faces challenges related to political rights and participation, elections and freedom of expression.
Nigeria
Significant investments in infrastructure estimated at USD 95 billion are beginning to bear fruit, particularly in the logistics and power sectors. For example, the Lagos Rail Mass Transit is a modern rail-based public transport system based on a public-private partnership model that generates its own electricity. Existing strong labour policies and national poverty reduction policies, expenditure and revenue-sharing frameworks can be used to drive equitable and inclusive growth in cities. Good health outcomes are the result of improvements in immunisation, child and maternal mortality and child nourishment. However, access to water and sanitation is constrained, which has an impact on health outcomes.
Overcoming constraints in the business environment could unlock domestic and international investment. Key constraints relate to starting a business, contract enforcement, registration, paying taxes, trading across borders and electricity supply. There is room to further develop infrastructure to expand economic opportunities. Road, air, rail, water, electricity supply and IT infrastructure require particular attention.
(cont.)

4. HUMAN DEVElOPMENt iN AFriCA4. HUMAN DEVElOPMENt iN AFriCA
111African Economic Outlook© AfDB, OECD, UNDP 2016110 African Economic Outlook © AfDB, OECD, UNDP 2016
Box 4.2. Countries that are urbanising but have low levels of human development: Benin, Gambia and Nigeria
Efforts to improve current low levels of education provision and quality could reverse low literacy rates and poor outcomes at secondary and tertiary levels, which is critical for growing a competitive economy.
A significant proportion of the population is excluded due to poverty and inequality, including gender inequality. There is need to address poor gender equality in the workplace, women’s participation in the labour force and politics, and legislation on violence against women.
Improvements are needed in terms of safety, the rule of law, national security, political violence and human trafficking. Positive developments have taken place in online services, and in terms of accountability, transparency and corruption in the public sector, but diversion of public funds is increasing.
Sources: Ernst and Young (2013), IIAG (2015a), ILO (2015), UNDP (2015a), World Bank (2015) and UNSD (2016).
Policy imperatives are crucial for inclusive human development in sustainable cities
These examples showcase specific models of equitable and sustainable settlements in Africa and point to key policy reforms and development actions to create equitable and sustainable cities. The analysis presented in the previous section highlights three key policy areas for attention: i) addressing social exclusion through work and effective social protection; ii) creating an enabling environment for private investment; and iii) enhancing environmental sustainability and reducing vulnerability to environmental shocks and climate change. These policy areas mirror the rights-based framework proposed by UN-Habitat, which encompasses cities that have an inclusive vision, flexible plans and implementation mechanisms, and institutions that are accountable and efficient (UN-Habitat, 2010). In particular, the following areas merit greater attention by policy makers (see also Chapter 8):
• Enhanced public capacity for innovative urban planning and management strategies that eliminate urban bias and provide effective social services and infrastructure for urban residents. This involves strengthening government accountability and the ability for public and private providers to provide quality public services to higher population densities, including security, that promote job growth and private sector investment. Sustainable cities must deal with the additional complexity of changing dynamics in urban governance, and provide an active role for local government in service provision.
• Appropriate skills, educational content and job matching. Fostering more equitable human development in the cities of the future requires greater diffusion of appropriate skills and technology and education systems. These should be tailored for a competitive workforce through more effective partnerships between educators and employers.
• Social protection policies and programmes. Effective implementation of regulation that protects the rights of workers and residents is essential, alongside programmes that provide comprehensive and affordable social protection for the most vulnerable.
• Effective participation and equitable resource allocation. Successful cities promote equity and sustainability in government finances, taxation and planning processes. Taxation policies have a significant impact on improving equity and reducing existing disparities (Freire, Lall and Leipziger, 2014). In addition, full civic
(cont.)
4. HUMAN DEVElOPMENt iN AFriCA
112 African Economic Outlook © AfDB, OECD, UNDP 2016
engagement for both women and men must ensure that urban institutions respond adequately to localised needs (Leete, 2008).
• Building resilience and environmental sustainability through technology. In natural resource-constrained environments, efforts to foster more equitable human development in cities must integrate environmentally resilient technology into the provision of services and infrastructure. Adequate disaster risk reduction and resilience building must also form part of long-term strategies for equitable and sustainable human development.
Notes
1. Health is assessed by life expectancy at birth (United Nations Statistics Division), and education is measured by mean years of schooling for adults over 25 years, and expected years of schooling for children of school-entering age (UNESCO). The standard of living is measured by gross national income per capita (World Bank). The HDI only captures part of human development and does not reflect aspects related to inequalities, poverty, human security, empowerment, governance or environmental sustainability.
2. Other important dimensions of gender equality missing from the GII, including economic empowerment, human development, laws and institutions, are captured in the Africa Gender Equality Index (AfDB, 2015) and the Social Institutions and Gender Index (OECD, 2014).
4. HUMAN DEVElOPMENt iN AFriCA4. HUMAN DEVElOPMENt iN AFriCA
113African Economic Outlook© AfDB, OECD, UNDP 2016112 African Economic Outlook © AfDB, OECD, UNDP 2016
References
AfDB (2015), Africa Gender Equality Index 2015. Empowering African Women: An Agenda for Action, African Development Bank Group, Abidjan, Côte d’Ivoire, www.afdb.org/fileadmin/uploads/afdb/Documents/Publications/African_Gender_Equality_Index_2015-EN.pdf.
Alkema, L. et al. (2013), “National, regional, and global rates and trends in contraceptive prevalence and unmet need for family planning between 1990 and 2015: A systematic and comprehensive analysis”, Lancet, Vol. 381/9,878, pp. 1642–52.
Bandara, A. (2015), “The economic costs of gender gaps in effective labour: Africa’s missing growth reserve”, Feminist Economist, Vol. 21/2, pp. 162-186, www.tandfonline.com/doi/pdf/10.1080/13545701.2014.986153.
Dabla-Norris, E. et al. (2015), “Causes and consequences of income inequality: A global perspective”, IMF Discussion Note SDN/15/13, International Monetary Fund, Washington, DC, www.imf.org/external/pubs/ft/sdn/2015/sdn1513.pdf.
Deloitte (2014), “Value of connectivity: Economic and social benefits of expanding internet access”, Deloitte, London, www2.deloitte.com/content/dam/Deloitte/ie/Documents/TechnologyMediaCommunications/2014_uk_tmt_value_of_connectivity_deloitte_ireland.
De Vries, G.J, M.P. Timmer and K. de Vries (2013), “Structural transformation in Africa: Static gains, dynamic losses”, GGDC Research Memorandum 136, University of Groningen, the Netherlands.
Ernst and Young (2013), Africa by numbers 2013-14: Assessing risk and opportunity in Africa, Ernst and Young, London, www.ey.com/Publication/vwLUAssets/EY_Africa_By_Numbers_2013/$FILE/EY%20-%20Africa%20by%20numbers%202013-14.pdf.
Freire, M., S. Lall and D. Leipziger (2014), “Africa’s urbanization: Challenges and opportunities”, Working Paper No. 7, the Growth Dialogue, Washington DC, www.dannyleipziger.com/documents/GD_WP7.pdf.
Gupte, J., D. Lintelo and I. Barnett (2014), “Understanding urban youth and the challenges they face in sub-Saharan Africa: Unemployment, food insecurity and violent crime”, IDS Evidence Report 81, Institute of Development Studies, Brighton, UK.
Hillebrand, E. (2009), “Poverty, growth and inequality over the next 50 years”, paper presented at the Food and Agricultural Organization of the United Nations Expert Meeting on How to Feed the World in 2050, FAO, Rome, 24-26 June.
IIAG (2015a), Ibrahim Index of African Governance 2015 (data portal), Mo Ibrahim Foundation, London, www.moibrahimfoundation.org/iiag/.
IIAG (2015b), Ibrahim Index of African Governance 2015: Executive Summary, Mo Ibrahim Foundation, London, http://static.moibrahimfoundation.org/u/2015/10/02193252/2015-IIAG-Executive-Summary.pdf.
ILO (2015), Global Employment Trends for Youth 2015: Scaling up investments in decent jobs for youth, International Labour Organization, Geneva, www.ilo.org/wcmsp5/groups/public/---dgreports/---dcomm/---publ/documents/publication/wcms_412015.pdf.
ILO (2013), Domestic Workers Across the World: Global and Regional Statistics and the Extent of Legal Protection, International Labour Organization, Geneva, www.ilo.org/wcmsp5/groups/public/---dgreports/---dcomm/---publ/documents/publication/wcms_173363.pdf.
IPU (2015), Women in national parliaments: Situation as of 1st February 2016, website, Inter-Parliamentary Union, Geneva, www.ipu.org/wmn-e/classif.htm.
Leete, R. (2008), “Human development and urbanisation”, ETHOS, World Cities Summit Issue, June 2008, www.cscollege.gov.sg/knowledge/ethos/world%20cities%20summit/Pages/11Human%20Development%20and%20Urbanisation.aspx.
Mahbub ul Haq (2014), Human Development in South Asia 2014, Urbanisation: Challenges and Opportunities, Mahbub ul Haq Human Development Centre, Lahore, Pakistan, http://mhhdc.org/wp-content/themes/mhdc/reports/SAHDR_2014_Urbanisation_Challenges_and_Opportunities.pdf.
Melamed, C. and E. Samman (2013), “Equity, inequality and human development in a post 2015 framework”, UNDP Research Paper, United Nations Development Programme, Human Development Report Office, New York, http://hdr.undp.org/sites/default/files/equity_inequality_human_development_in_post-2015_framework.pdf.
Mutizwa-Mangiza, N. (2012), “Sustainable urbanisation in the post-2015 UN development agenda”, Expert Group Meeting on Post-2015 UN Development Agenda, New York, 27-29 February, 2012, www.un.org/en/development/desa/policy/untaskteam_undf/pres_sustainable_habitat_mutizwa-mangiza.pdf.
OECD (2014), Social Institutions and Gender Index (website), OECD Development Centre, www.genderindex.org/.
Palma, J.G. (2011), “Homogeneous middles vs. heterogeneous tails, and the end of the ‘Inverted-U’: The share of the rich is what it’s all about”, Development and Change, Vol. 42/1, pp. 87-153.

4. HUMAN DEVElOPMENt iN AFriCA
114 African Economic Outlook © AfDB, OECD, UNDP 2016
Timmer, P. et al. (2012), “Patterns of growth and structural transformation in Africa: Trends and lessons for future development strategies”, WCAO Thematic Research Note, International Food Policy Research Institute, Washington, DC.
UN DESA (2015), “World population prospects: The 2015 revision, key findings and advance tables”, Working Paper No. ESA/P/WP.241, United Nations Department of Economic and Social Affairs, Population Division, New York, http://esa.un.org/unpd/wpp/publications/files/key_findings_wpp_2015.pdf.
UN DESA (2014), World Urbanisation Prospects: The 2014 Revision, custom data acquired via website, United Nations Department of Economic and Social Affairs, Population Division, New York, http://esa.un.org/unpd/wup/highlights/wup2014-highlights.pdf.
UNDP (forthcoming), Africa Regional Human Development Report 2016, United Nations Development Programme, New York.
UNDP (2015a), Human Development Report 2015: Work for Human Development, United Nations Development Programme, New York, http://hdr.undp.org/sites/default/files/2015_human_development_report.pdf.
UNDP (2015b), What is Human Development by Human Development? UNDP Human Development Office, New York, http://hdr.undp.org/en/content/what-human-development.
UNDP (2012), Africa Human Development Report 2012: Towards a Food Secure Future, United Nations Development Programme, New York, www.undp.org/content/undp/en/home/librarypage/hdr/africa-human-development-report-2012.html.
UNDP (1999), Human Development Report 1999: Globalization with a Human Face, United Nations Development Programme, New York.
UNECA et al. (2015), MDG Progress Report: Assessing Progress in Africa Toward the Millennium Development Goals, UN Economic Commission for Africa, Addis Ababa, www.undp.org/content/undp/en/home/librarypage/mdg/mdg-reports/africa-collection.html.
UNEP (2015), Global Environment Outlook (GEO) 6: GEO Matters, United Nations Environment Programme, Nairobi, www.unep.org/geo/pdfs/GEO_matter_sept2015.pdf.
UN-Habitat (2014), The State of African Cities 2014: Re-imagining Sustainable Urban Transitions, United Nations Human Settlements Programme, Nairobi.
UN-Habitat (2013a), State of Women in Cities 2012-2013: Gender and the Prosperity of Cities, United Nations Human Settlements Programme, Nairobi.
UN-Habitat (2013b), The State of the World Cities Report 2012/13: Prosperity of cities, United Nations Human Settlement Programme, Nairobi.
UN-Habitat (2010), State of the World’s Cities 2010/11: Cities for all: Bridging the Urban Divide, United Nations Human Settlement Programme, Nairobi.
UN-Habitat (2008), The State of African Cities 2008: A Framework for Addressing Urban Challenges in Africa, United Nations Human Settlements Programme, Nairobi.
UN-Habitat (2007), “The urban penalty: The poor die young”, in State of the World’s Cities 2006/7, United Nations Human Settlements Programme, Nairobi, http://mirror.unhabitat.org/downloads/docs/5636_27492_SOWCR%2022.pdf.
UNICEF (2014), Ending Child Marriage: Progress and Prospects, United Nations Children’s Fund, New York, www.unicef.org/media/files/Child_Marriage_Report_7_17_LR.pdf.
UNSD (2016), United Nations Statistical Division (website), UNstats.un.org, UN data portal, http://data.un.org/.
UN Women (2015), “Fact sheet – sub-Saharan Africa”, Progress of the World’s Women 2015-2016: Transforming Economies, Realizing Rights, UN Women, New York, www2.unwomen.org/~/media/headquarters/attachments/sections/library/publications/2015/poww-2015-factsheet-subsaharanafrica-en.pdf?v=1&d=20151023T211307.
Vanek, J. et al. (2014), “Statistics on the informal economy: Definitions, regional estimates and challenges”, WIEGO Working Paper (Statistics) No. 2, WIEGO, Cambridge, MA, wiego.org/sites/wiego.org/files/publications/files/Vanek-Statistics-WIEGO-WP2.pdf.
WomenWatch (2012), Gender Equality and Sustainable Urbanisation: Factsheet, Information and Resources on Gender Equality and Women’s Empowerment, Women Watch, Information and Resources on Gender Equality and Empowerment of Women, New York, www.un.org/womenwatch/feature/urban/downloads/WomenWatch_Gender_Equality_and_Sustainable_Urbanisation-fact_sheet.pdf.
World Bank (2016), World Development Indicators (database), http://data.worldbank.org/data-catalog/world-development-indicators.
World Bank (2015), “Consolidating social protection and labor policy in Tunisia: Building systems, connecting to jobs”, Policy Note December 2015, World Bank, Washington, DC, www-wds.worldbank.org/external/default/WDSContentServer/WDSP/IB/2016/02/12/090224b08417442b/1_0/Rendered/PDF/Consolidating00o0jobs000policy0note.pdf.

115African Economic Outlook© AfDB, OECD, UNDP 2016
This chapter assesses the governance trends affecting Africa’s
economic outlook by examining the most recent metrics on the
functioning of African public institutions. It looks at how the quality
of public service delivery and the performance of institutions meet
citizens’ expectations. It also lays out the improvements citizens
are asking for and how governments are responding. Finally, the
chapter outlines the prospects for 2016. Key findings are presented
first, and details of how these findings were arrived at are provided
in subsequent sections.
Chapter 5
Political and economic governance in Africa

116 African Economic Outlook © AfDB, OECD, UNDP 2016
5. POlitiCAl AND ECONOMiC GOVErNANCE iN AFriCA
In brief
While employment has been the main concern for Africans over the last decade, demands for better services and infrastructure have been on the rise since 2008, and worries about terrorism and violence are less and less confined to conflict zones. Not only are African countries reforming their public institutions, they are also taking their business environments seriously, which can yield economic dividends over the long term but typically has limited impact in the short term. Some indicators and expert reports hint at improvements in rules and regulations affecting businesses.
The severity and geographic scope of politically motivated violence in the form of terrorism or communitarian conflict has been increasing in Africa over the past few years. This has spurred African countries to work together to find regional solutions, but international co-operation is difficult.
African citizenries are increasingly becoming effective at demanding and obtaining improvements in governance. Success stories include the Nobel-prize winning institutions of Tunisia that managed to create a freer and more democratic society as well as new forms of civil oversight in some countries to give citizens other ways to influence policy beyond voting and protesting.
Key governance challenges in Africa are a growing demand for public services, the threats of terrorism and internal conflicts
This chapter defines governance as the way different state and non-state actors make public decisions and manage economic and social resources for development. State entities, political parties, civil society organisations and private sector actors all play a role in the process. The chapter provides an overview of what the latest data available tells us about governance in Africa, current trends and how this relates to overall development outcomes.
As governance is multi-dimensional, a variety of measures and indicators are considered. These can be divided into four main areas:
• the provision of public goods and services through good management and optimisation of financial resources
• the regulation of economic institutions and the state’s effectiveness in fostering economic activity
• the interaction of political institutions with citizens
• the construction of trusted institutions capable of strengthening social cohesion.
Citizens’ expectations towards governments and key areas of tensions are the starting point of this chapter. This section presents the main results of opinion polls and surveys, as well as findings from updates of the African Economic Outlook (AEO) civil tension indicators.
Opinion surveys show that citizens demand better economic opportunities, as well as better governance of public institutions
The main issues stressed by African respondents to polls are better public services, better institutions and better job opportunities. The MyWorld 2015 survey by the UN highlights good education, better healthcare and an “honest and responsive government” as the top three priorities for Africans (Figure 5.1). These are followed by the desire for better job opportunities and better access to public infrastructure such as clean water, sanitation and roads.

5. POlitiCAl AND ECONOMiC GOVErNANCE iN AFriCA
117African Economic Outlook© AfDB, OECD, UNDP 2016116 African Economic Outlook © AfDB, OECD, UNDP 2016
Figure 5.1. Top priorities for African citizens
26 608 23 849
19 241 18 707
17 090 16 575
16 059 11 057
9 711 8 720 8 630
8 285 7 287 7 264
6 848 5 919
0 5 000 10 000 15 000 20 000 25 000 30 000
A good education
Better healthcare
An honest and responsive government
Better job opportunities
Access to clean water and sanitation
Protection against crime and violence
Affordable and nutritious food
Better transport and roads
Freedom from discrimination and persecution
Equality between men and women
Political freedoms
Support for people who cannot work
Reliable energy at home
Protecting forests, rivers and oceans
Action taken on climate change
Phone and Internet access
Note: This graph represents the answers to the question: “What are the six most important issues for you and your family?” (35 310 respondents in all 54 African countries).Source: UN/ODI/Ipsos MORI (2016). 12 http://dx.doi.org/10.1787/888933350406
Other opinion surveys show similar results. The Afrobarometer survey conducted in 2014/15 found that the three most important problems that Africans in general want their government to address are unemployment (32.4%), health (29.8%) and education (24%), while rural Africans see better electricity and roads as a first priority. The 2015 Pew global survey, which includes nine African countries, also found that top concerns were employment, healthcare and education (Pew Research Center, 2015).
Employment has been the most pressing issue for African citizens throughout the 2000s, according to Afrobarometer surveys, but demand for better services and infrastructure has been on the rise since 2008. For instance, results from this survey over the years show that demand for better education, health, electricity, transportation, water supply and sanitation is rising. In the survey round of 2002/03, nearly 65% of respondents cited concerns about jobs and income as one of their three biggest concerns. The same poll conducted in 2014/15 showed this number had declined to 54% as respondents increasingly cited services and infrastructure issues. Respondents in 13 countries now cite infrastructure as their most pressing problem (Leo et al., 2015).
Major concerns diverge in some countries. Outliers include Nigeria, which is facing the Boko Haram insurgency, and South Africa, which has a high urban crime rate. Nearly one third of respondents cited insecurity as a major national problem. In Egypt and Tunisia – two countries that underwent regime change during the Arab Spring – and Burundi and Mali – two post-conflict states – concerns about security and crime were cited as the second most frequent issue after jobs and income. Problems related to food security appeared among the top three issues in only two countries of the Sahel region, Niger and Mali. Affordable access to housing was at the top of the list of concerns in the Afrobarometer survey in three of the wealthier African countries: Algeria, Egypt and South Africa.
Regarding political institutions, citizens are demanding fairer and more competitive elections. Elections are common practice in most African countries, and citizens want them to be more competitive and inclusive. A large proportion of African citizens believe that elections are a good principle for good governance, but a much lower proportion feel that electoral processes in their countries are honest (Gallup, 2012-13). Africans increasingly demand good governance outcomes: In 32 African countries out of 34 countries, the majority of citizens preferred democracy to “other kinds of government” in the 2011-13 Afrobarometer survey (Bratton and Houessou, 2014). On

5. POlitiCAl AND ECONOMiC GOVErNANCE iN AFriCA
118 African Economic Outlook © AfDB, OECD, UNDP 2016
average, this index of demand for democracy was at 71% in 2012. In 16 countries, the scores ranged between 74% in Burundi and 90% in Zambia (many West African countries appear in this list of 16 countries). And citizens surveyed see elections as the best sign of a democratic regime.
Afrobarometer data shows that higher levels of freedom of speech and information are associated with a higher rating of government performance and trust, notably in the fight against corruption. A solid majority of 69% of citizens support the role of media in oversight of governments (Mitullah and Kamau, 2013).
Public protests are mainly related to jobs, public services and political disagreements
Looking at a variety of metrics is necessary to improve our understanding of citizens’ expectations of governments and other public institutions. Opinion surveys, as described above, and the results of elections are among the best indicators available. However, tracking various forms of public protest and the reaction to them provides an additional indication of the extent to which these opinions and motivations are strong enough to inspire action. Interpreting the variations in civil tension indices requires great care: while they may have economic costs, more frequent demonstrations and strikes may also reflect the maturation of increasingly open governance systems. Following the 2011 regime change in Egypt, constitutional changes were accompanied by riots and protests, undermining the Egyptian economy (Masry, 2015). In South Africa, a five-month-long strike in the mining sector cost about ZAR 12 million in 2014 and is estimated to have knocked off about two percentage points from GDP growth in the first quarter of 2015 (OECD, 2015a). The strike – the most costly in South African history – did not result in substantially higher wages (SARB, 2014). The AEO governance indicators presented in this section help gauge the trends in public protests and their motivations (Box 5.1).
Box 5.1. Assessing the quality of governance
A key to understanding Africa’s growth story over the last decade is assessing the quality of governance. Both economic theory and some cross-country comparisons suggest governance is a key factor in economic development, and it correlates with faster growth, higher investment and increased poverty reduction (ADB, 2013).
Synthesising measures of different aspects of governance into a single evaluation is challenging because the concept of governance is broad (Rhodes, 2012). It is difficult to capture with existing data and often without uniform benchmarks to guide policy (Lin and Monga, 2012; Whaites et al., 2015). Academic debates and empirical work has led to many competing indicators of good governance being proposed. These indicators can be divided into two main types: perception-based measures and fact-based measures. Where information seems to be lacking the most is in fact-based measures (ADB, 2013; The Effective Institutions Platform, 2015).
The AEO governance indicators are a fact-based measure of governance evaluating the quality of the interactions between governments, other political institutions and citizens. They track when African citizens are unsatisfied enough with institutions to take public action and how African institutions respond to this discontent. Public protests, which are defined as strikes or any type of demonstration with political, economic or social motives, are tracked on a daily basis via news reports by journalists and press agencies across Africa and verified by AFP and Reuters. By contrast with other forms of civil tensions – including violence, inter-community conflicts and terrorist acts against populations – which are also monitored, public protests represent a democratic way of voicing demands. Each relevant event is counted and then weighted based on such factors as intensity, duration, number of casualties, etc. The methodology is presented in the Statistical Annex of this report.
Public protests took a sharp downturn in 2015, following a steady rise since 2010 (Figure 5.2). Ebola in West Africa and terrorist attacks in several countries led to reduced tolerance for public demonstrations by authorities. Temporary bans or restrictions were

5. POlitiCAl AND ECONOMiC GOVErNANCE iN AFriCA5. POlitiCAl AND ECONOMiC GOVErNANCE iN AFriCA
119African Economic Outlook© AfDB, OECD, UNDP 2016118 African Economic Outlook © AfDB, OECD, UNDP 2016
imposed on rallies in Guinea, Liberia and Sierra Leone and in the context of officially declared states of emergency1 in Chad, Egypt, Mali, Niger and Tunisia. Protests in South Africa and Gabon declined in duration and intensity compared with 2014. Finally, North African countries witnessed a decrease overall in the level of protests compared with 2014.
Figure 5.2. Index of public protests in Africa, 1996-2015
0
100
200
300
400
500
600
1996 1997 1998 1999 2000 2001 2002 2003 2004 2005 2006 2007 2008 2009 2010 2011 2012 2013 2014 2015
Public protest index (base 100 = 2000)
Note: Public protests refer to strikes and any demonstration with political, economic or social motives. Each event is weighted by its intensity (number of protesters) and duration (number of weeks). See more details in the methodological annex of the report.Source: Authors’ calculations based on news reports by journalists and press agencies across Africa, verified by AFP and Reuters.12 http://dx.doi.org/10.1787/888933350412
The top motivations for public protests in Africa from 2013-15, as reported by newswires, tend to be poor economic conditions and public services. Although there are slight differences between the results of opinion polls and the motivations behind various protests across Africa, some convergence appears on economic issues and on issues of political fairness. The top motivations for public protests continue to be demands for wage increases, followed by demands for a change of government and better working conditions (Figure 5.3).
Figure 5.3. Top drivers of public protests in Africa, 2013-15
1.9%1.9%2.0%2.0%2.1%
2.6%2.8%2.9%
3.4%4.0%4.2%
5.6%5.9%
6.7%8.9%9.1%
11.8%
0 50 100 150 200 250 300 350
More political rights and civil liberties, more equality
International/global mattersLayoffs/pressure for new recruitment plan (from private entities)
Unemployment/pressure for new recruitment plan (from government)Population divides over rules/liberties and related matters
Standard of living (e.g. consumer prices, taxes)Political or legal reforms or proposals thereof
Election results or proceduresUnpaid salaries/premiums (from government)
Governance and management (private entities)Reaction to executive overreach (arrests of journalists, protesters, opposition, etc.)
Accountability and more transparencyBetter public service delivery (from government)
Demand for dissolution of government or stepping down of the head of stateBetter working conditions (from government)
Demand for salary increase (from government)Demand for salary increase (from private entities)
Total weights
Note: Public protests refers to strikes and any demonstration with political, economic or social motives. Each event is weighted by its intensity (number of protesters) and duration (number of weeks). See more details in the methodological annex of the report.Source: Authors’ calculations based on news reports by journalists and press agencies across Africa, verified by AFP and Reuters.12 http://dx.doi.org/10.1787/888933350421

5. POlitiCAl AND ECONOMiC GOVErNANCE iN AFriCA
120 African Economic Outlook © AfDB, OECD, UNDP 2016
There were significant differences between major cities and the rest of the country in terms of the types of protests. Protests and civil unrest may be localised or affect the entire country. In general, there seemed to be more economic protests in rural areas and more political protests in urban areas (Map 5.1). These results should nevertheless be interpreted with care since the lines between rural/urban and political/economic motives may sometimes be blurred.
Map 5.1. Intensity of protests in Africa by location, 2015
Note: The size of the bubbles represents the intensity of public protests in 2015 (e.g. the number of protests weighted by the number of protesters and duration). See more details in the methodological annex of the report.Source: Authors’ calculations based on news reports by journalists and press agencies across Africa, verified by AFP and Reuters.
Terrorism represents a growing share of violence by non-state actors
Like in other parts of the world, terrorism has been a growing factor of violence in Africa in recent years, causing long-term social and economic damage in addition to immediate injury, death and destruction. The full negative impact of terrorist attacks and cross-border violence on social progress is not easily assessed. Nevertheless, reports by international organisations in West Africa, for example, provide some evidence of the extent to which the Boko Haram insurgency has been degrading the security situation in Nigeria and the areas neighbouring Lake Chad. Attacks resulted in more than

5. POlitiCAl AND ECONOMiC GOVErNANCE iN AFriCA5. POlitiCAl AND ECONOMiC GOVErNANCE iN AFriCA
121African Economic Outlook© AfDB, OECD, UNDP 2016120 African Economic Outlook © AfDB, OECD, UNDP 2016
15 000 dead and have displaced more than 2.1 million people across Cameroon, Chad, Nigeria and Niger since 2009, according to the International Organization for Migration. Within the first three months of 2015, more than 1 000 civilians were killed. In Nigeria alone, approximately 600 teachers have been killed since the start of the Boko Haram insurgency to December 2015. Over 2 000 schools remain closed – some of them for more than a year. In addition, hundreds of schools have been attacked, looted or set on fire. More than 1 million children aged 7 to 15 in the region are out of school, of which 380 000 left school within four years, putting them at high risk of dropping out altogether (UNICEF, 2015a).
Looking at the broad trends, the extent and intensity of tracked acts of violence by non-state actors slightly increased in 2015 in Africa (Figure 5.4). The Global Peace Index (GPI) 2015 shows that on average the world became slightly less peaceful, with scores deteriorating in 86 countries, 21 of which were in Africa. Libya experienced the largest decline in peacefulness scores worldwide, as activities by criminal networks and jihadist groups increased (IEP, 2015). The Horn of Africa is also under the threat of terrorism, notably Kenya and Somalia, with multiple attacks by Al-Shabaab terrorists not only against government forces and symbols of power but also against civilians. The attack on the University of Garissa in Kenya in April 2015 left 147 dead.
Inter-community tensions have also been contributing to this increase. For example, in Kenya, acts of terror committed by Al-Shabaab led to inter-community mistrust in 2015. Tensions directed towards Kenyan Somalis have risen as a result. In South Africa, a wave of unrest targeting foreign-owned shops, mainly in Durban and Johannesburg, resulted in seven dead in April 2015 before government forces took control of the situation.
Figure 5.4. Political hardening and civil violence, 1996-2015
0
50
100
150
200
250
1996 1997 1998 1999 2000 2001 2002 2003 2004 2005 2006 2007 2008 2009 2010 2011 2012 2013 2014 2015
Civil violence Political hardening
Index (year 2000 =100)
Note: Each violent act has been weighted by its intensity (number of deaths and/or injured people) according to a scaling methodology detailed in the annex of this report.Source: Authors’ calculations based on news reports by journalists and press agencies across Africa, verified by AFP and Reuters.12 http://dx.doi.org/10.1787/888933350431
Over 2013-15, the three major drivers of violence by non-state actors were: i) terrorism; ii) inter-community conflicts, often fuelled by clashes over scarce resources and ethnic resentments; and iii) complaints about electoral processes whereby political parties have ignited or aggravated civil strife through violence (Figure 5.5).

5. POlitiCAl AND ECONOMiC GOVErNANCE iN AFriCA
122 African Economic Outlook © AfDB, OECD, UNDP 2016
Figure 5.5. Violence by non-state actors in Africa, by type, 2013-15
0 100 200 300 400 500 600
In 2013 In 2014 In 2015
Terrorist acts against populations
Attacks against government forces
Fighting between armed groups
Violence between communities (religious, ethnic, etc.)
Physical assaults/assasination of political personnalities
Violence between supporters of a political leader
Kidnapping
Violence linked to strikes, demonstrations or riots
Crime against civilians (by a rebellion or armed groups)
Violence related to elections
Other
Immolation, etc.
Allegation of ethnic cleansing
Total weights
Note: Each violent act has been weighted by its intensity (number of deaths and/or injuries) according to a scaling methodology detailed in the annex of this report.Source: Authors’ calculations based on news reports by journalists and press agencies across Africa and verified by AFP and Reuters.12 http://dx.doi.org/10.1787/888933350448
several African countries are innovating to meet the growing demand for public services
What are the challenges and opportunities in governments’ ability to deliver public services for its citizens effectively? With growing populations and increasing democratic assertiveness, public service delivery is faced with capacity constraints. Where this happens, institutions have no choice but to innovate and change. Indicators of governance quality suggest that demands by African citizens on their institutions are leading not only to improved services but also to reforms to improve institutional capacity. Finally, there are examples of international initiatives reinforcing the effectiveness of service delivery.
The performance of African governments in delivering public services varies greatly across the continent
In the 46 African countries surveyed in the Gallup World Polls in 2013 and 2014, wide variations can be observed in the net satisfaction rate of service delivery in health, education, transport and housing, reflecting highly heterogeneous citizens’ appreciation of state performance. The wording of the questions was: “In the city or area where you live, are you satisfied or dissatisfied with…?”. With regards to public transportation systems, while there was a net dissatisfaction rate of 15.2% on average, the results ranged from a net dissatisfaction rate of 62% in Central African Republic to a net satisfaction rate of 42% in Mauritius. In health service delivery, Africans are mostly dissatisfied with its provision by their governments, with a net dissatisfaction rate of 22% on average. However, a positive rating of governments’ performance in health delivery was recorded in nine countries, ranging from 5% in Botswana to 59% in Rwanda. As for states’ performance in delivering good and affordable housing, 17% of people were dissatisfied on average across the 46 countries, with again wide disparities, ranging from 65% net dissatisfaction in Libya to 32% net satisfaction in Rwanda. Education is the

5. POlitiCAl AND ECONOMiC GOVErNANCE iN AFriCA5. POlitiCAl AND ECONOMiC GOVErNANCE iN AFriCA
123African Economic Outlook© AfDB, OECD, UNDP 2016122 African Economic Outlook © AfDB, OECD, UNDP 2016
service delivery showing the highest net satisfaction rating, with a net balance of 5.1% of African citizens satisfied on average. Twenty states showed a positive satisfaction rate, while 24 had a negative satisfaction rate (data were missing for two countries). A similar survey by Afrobarometer confirms the relatively more positive perception in governments’ performance in delivering education, with an average 20% satisfaction rate in the 33 countries surveyed.
Government expenses in Africa are lower in absolute terms in relation to GDP than in other regions. The average expense-to-GDP ratio is 29.7% in Africa, compared to 40.9% in OECD countries on average. In 2014, African governments spent under USD 2 000 per capita, with Libya (LBY) and Seychelles (SYC) as the two exceptions (Figure 5.6). In comparison, Brazil (BRA) spent about USD 4 300 per capita, China (CHN) roughly USD 2 500 but India (IND) only USD 360.
Figure 5.6. Government expense per capita vs. government expense as % of GDP, 2014
LBY
SYC SYC
BRA CHN
IND
0
0.1
0.2
0.3
0.4
0.5
0.6
0.7
0.8
0.9
1.0
10 100 1 000 10 000 100 000
Africa OECD Other countries
General government expense per capita in 2014 (USD)
Government expense as percentage of GDP
Source: Authors’ calculations based on IMF (2015a).12 http://dx.doi.org/10.1787/888933350454
Even at low levels of tax collection, several countries in Africa display high levels of efficient public sector management by global standards. Figure 5.7 plots countries in Africa and the rest of the world according to their tax-to-GDP ratios and the quality of public sector management as measured by their ratings in the Country Policy and Institutional Assessment (CPIA) of the World Bank. It helps identify some of the public sector management success stories. For example, despite tax-to-GDP ratios under 20%, Cabo Verde (CPV), Ethiopia (ETH), Rwanda (RWA) and Senegal (SEN) achieve above-middling CPIA scores. By contrast, other countries with higher tax-to-GDP ratios have low scores. The majority of African countries have both low tax-to-GDP ratios and low public sector management scores.
Similar disparities are observed in terms of the readiness of administrations to promote staff on the basis of merit and professional skills. Figure 5.8 compares spending efficiency with an estimate of the degree to which merit is prioritised in hiring (World Economic Forum [WEF] Executive Opinion Survey, 2014). Like in comparator groups, however, the more hiring is based on qualifications, the more efficiently public revenue is allocated. Rwanda scores among the best performing countries on both accounts.

5. POlitiCAl AND ECONOMiC GOVErNANCE iN AFriCA
124 African Economic Outlook © AfDB, OECD, UNDP 2016
Figure 5.7. Public sector management vs. tax-GDP ratio
AGO
CPV
ETH LSO MOZ
RWA SEN
SSD
ZWE
1.5
3.5
0 20 40 60
Africa Other countries
Tax-to-GDP ratio (%)
CPIA public sector management and institutions cluster average (1=low to 6=high)
Note: The public sector management and institutions cluster includes property rights and rule-based governance, quality of budgetary and financial management, efficiency of revenue mobilisation, quality of public administration, and transparency, accountability and corruption in the public sector. Source: Authors’ illustration based on World Bank (2016a) and IMF (2015a).12 http://dx.doi.org/10.1787/888933350465
Figure 5.8. Hiring based on merit and qualifications vs. efficiency in public revenue spending
KEN
MRTNGA
RWA
ZAF
ZMB
1
4
7
1 4 7
Africa OECD Other countries
Efficiency in spending public revenue (1=extremely inefficient in providing goods and services, 7=extremely efficient)
Promotion of merit and qualifications (1=low, 7=high)
Notes: Question 1.7 In your country, to what extent do government officials show favouritism to well-connected firms and individuals when deciding upon policies and contracts? (1=always show favouritism; 7=never show favouritism). Question 1.8 In your country, how efficiently does the government spend public revenue? (1=extremely inefficient in providing goods and services; 7=extremely efficient).Source: Authors’ illustration based on WEF (2014).12 http://dx.doi.org/10.1787/888933350471

5. POlitiCAl AND ECONOMiC GOVErNANCE iN AFriCA5. POlitiCAl AND ECONOMiC GOVErNANCE iN AFriCA
125African Economic Outlook© AfDB, OECD, UNDP 2016124 African Economic Outlook © AfDB, OECD, UNDP 2016
According to Africans, corruption – the exercise of public power for private gain – remains a primary obstacle to the state providing public services and protecting public interest. In 2015, 58% of the African respondents of Transparency International’s survey for its Global Corruption Barometer thought corruption had increased (Transparency International, 2015). In the 12 months preceding the survey 22% of public services users had paid a bribe across sub-Saharan Africa (SSA), equivalent to nearly 75 million people. African anti-corruption bodies tend to lack resources, and very often a high proportion of citizens think their governments are still performing poorly in fighting corruption. On average 64.4 % of Africans declared their government is handling the fight against corruption badly or fairly badly, while 30.6% think government actions against corruption are handled well or fairly well (Afrobarometer, 2015). Formal oversight institutions frequently face limitations in performing their function of holding governments to account (IBP, 2015).
Accountability and the existence of checks and balances on public administrations and public policies are key for effectively providing public goods, delivering services and funding infrastructure. Accountability is a cornerstone of citizens’ perception of good governance and crucial for the quality of public policies and the provision of public goods (World Bank, 2002). A lack of checks and balances enables corruption, which results in large financial costs and losses of quality in service delivery. For example, the office of the auditor general in Kenya, an independent public body promoting good governance and accountability in the management of public resources, revealed that less than 1.2 % of public spending was incurred lawfully and corresponded to accountancy rules (Kenya National Audit Office, 2015). This seriously undermines the capacity of states to respond to citizens’ needs.
Policy initiatives are leading to more efficient, effective and inclusive services
African countries can improve their service delivery despite the great diversity of policy contexts. Both academic literature and some recent policy reforms across the continent suggest that some general principles of policy improvement can apply to many countries. For instance, better priority setting, improved consistency of responsibility assignment across levels of government or agencies, better user information and better-balanced provider payment schemes are worth pursuing in many African countries (OECD, 2010a). If these general principles apply to many countries, however, individual policies do not. A one-size-fits-all approach to reform is not advisable.
Decentralisation can help improve service delivery when most of the regions are economically and fiscally sustainable. In several African countries, regions or municipalities rely primarily on government transfers (AEO, 2015). Administrative performance can be improved through local elections and civil society mobilisation when local government finances do not rely only on central transfers (Cabral, 2011). O’Neil and Cammack et al. (2014) find that in the case of local governments in Malawi, devolution is more likely to succeed in cities than in rural districts, as the former have better infrastructure, can generate more revenue and have more potential for performance monitoring, including by citizens.
Better management and optimisation of financial resources can significantly improve public service delivery. For example, the private not-for-profit (PNFP) contracting experiments in Uganda have shown positive results in terms of resource allocation and service delivery. Since 1997 and under the process of decentralisation and devolution

5. POlitiCAl AND ECONOMiC GOVErNANCE iN AFriCA
126 African Economic Outlook © AfDB, OECD, UNDP 2016
of power to local governance, the Ministry of Health has granted public subsidies to PNFP providers with the aim of expanding access to healthcare through public-private partnerships (PPPs), especially in underserved parts of the country. PNFP facilities now play a significant part in Uganda’s healthcare system, as about one third of all health facilities in the country are operated by them (Lundberg, 2008).
The spread of information and communication technology (ICT) in Africa can also improve policy making and make a difference for people. Mobile phones are the most widely available type of infrastructure across Africa, with availability ranging from 70% to 100% in 2015 (Leo et al., 2015). Telemedicine (i.e. e-health) is one of many examples of ICT providing cost-effective solutions to some of the health challenges facing developing countries. Government policies can help establishing reliable and coherent privacy and security frameworks and accountability mechanisms that both encourage inclusiveness and respond to innovation.
• In Ghana, since 2012, the Novartis Foundation has been leading a PPP initiative providing teleconsultation services across 21 communities, in co-operation with sectoral ministries, the national health insurance agency and medical associations. The 24-hour teleconsultation centre pilot model helped reduce 31% of referrals, improved emergency transport facilitation, and the road map for scale up throughout the whole country is expected to be complete by December 2017 (Novartis Foundation, 2016).
• In Kenya, which already leads globally in mobile money payment facilities through its m-PESA service, an upsurge in telemedicine is enabling rural patients and health practitioners to interact through video conferencing with staff in Kenya’s main hospitals. This has improved quality of care at little cost (Arrow and Sanghi, 2015).
• Tanzania has launched a programme to help parents register their children’s births by mobile phone, as 80% of Tanzanians do not have birth certificates according to a 2012 census (Reuters, 2015a). This has a direct impact on access to public services in education and health and deprives the government of crucial demographic data to plan service provision for children and match decision-making with population needs (UNHCR, 2014).
In terms of reform efforts, Ghana, Mauritius and South Africa are among the wealthier African countries having implemented successful healthcare systems (KPMG, 2012). In Ghana the National Health Insurance Scheme (NHIS) initiated in 2003 has successfully reduced the proportion of out-of-pocket spending in total private healthcare spending, with salutary consequences for the poorest Ghanaians. In Mauritius, basic healthcare is provided even if the share of out-of-pocket expenditure is still high. In South Africa, NGOs and government are collaborating in sometimes innovative ways to improve healthcare outcomes for poorer areas.
Improved effectiveness is first and foremost achieved through sound policies. Despite very low levels of health spending (16 USD per capita in 2010) – the second lowest figure in Africa – Ethiopia has made progress in improving healthcare, mostly by reforming health administration services (KPMG, 2012). In Rwanda (Box 5.2), government has overcome very low per capita health expenditure (57 USD per capita in 2010, although the health budget as a proportion of the total budget is the highest in Africa) to deliver acceptable outcomes by combining different modes of financing, successfully lobbying for external funding and by making improvements to government health bureaucracy a priority (WHO, 2014).

5. POlitiCAl AND ECONOMiC GOVErNANCE iN AFriCA5. POlitiCAl AND ECONOMiC GOVErNANCE iN AFriCA
127African Economic Outlook© AfDB, OECD, UNDP 2016126 African Economic Outlook © AfDB, OECD, UNDP 2016
Box 5.2. Overview of the major improvements in Rwanda’s health system
Under its Health Sector Strategic Plan 2009-2012 (HSSP II), Rwanda recorded outstanding socioeconomic progress following tremendous improvements and innovations in national healthcare policies. Since 2005, the country has developed a comprehensive financing framework for health systems based on best practices in global healthcare financing:
On the supply side, the central government increased transfers to local governments though fiscal decentralisation and offered peripheral health facilities on the basis of needs and performance. Policy actions included a health insurance system, with cross-subsidies from richer to poorer categories and medicine supply facilities (procurement and distribution). Currently, the Rwanda minister of health is conducting a series of reforms in its health management information systems, including automation.
On the demand side, Rwanda made exceptional progress in protecting households against catastrophic health expenditures by strengthening pre-payment mechanisms such as community-based health insurance and other health insurance schemes. There are also direct payments to the population through in-kind incentives. Those efforts have dramatically reduced the burden of out-of-pocket payments. General out-of-pocket expenditures dropped from USD 9.5 in 2006 to USD 4.09 in 2010 (WHO, 2014). Life expectancy at birth increased from 51 in 2002 to 64.5 in 2013 (NISR, 2013).
Figure 5.9. Out-of-pocket expenditures on healthcare and total health spending in Rwanda, 1995-2013
%
0
20
40
60
80
100
120
140
160
180
0
5
10
15
20
25
30
1995 1996 1997 1998 1999 2000 2001 2002 2003 2004 2005 2006 2007 2008 2009 2010 2011 2012 2013
Out-of-pocket health expenditure (% of total expenditure on health)
Health expenditure per capita, PPP (constant 2011 USD)
USD (constant 2011 PPP)
Source: WHO (2014) and authors’ calculations based on World Bank (2015).12 http://dx.doi.org/10.1787/888933350480
A better allocation of international aid can help improve service delivery in low-income countries and fragile states
The effectiveness of international aid in helping improve public service delivery has been challenged in the last decade. An OECD analysis in 2015 found six SSA states are both fragile states and potentially under-aided: Chad, Madagascar, Malawi, Gambia, Guinea, Niger, Sierra Leone and Togo (OECD, 2013a). Such geographical gaps in aid distribution are a consequence of a lack of co-ordination. This is partly due to each donor having its own political priorities and incentives, leading to individual allocation decisions that vary greatly and do not depend on country needs or institutional performance. However, the Ebola virus outbreak of 2014/15 showed that fragile states are vulnerable to catastrophe and should not be neglected. Additional aid channelled as budget support can indeed help such countries when it is accompanied by targeted technical assistance that supports capacity-building and public financial management (Box 5.3).

5. POlitiCAl AND ECONOMiC GOVErNANCE iN AFriCA
128 African Economic Outlook © AfDB, OECD, UNDP 2016
Box 5.3. Enhancing aid effectiveness in fragile states
The OECD defines fragile states as “having weak capacity to carry out basic functions of governing populations, and lacking the ability to develop mutually constructive and reinforcing relations within society” (OECD, 2011).
The dramatic consequences of the Ebola virus outbreak show that epidemics can become humanitarian disasters in countries with weak services. Significant problems were raised not only because of the insufficient resources for the health sector but also because of the fragmentation of the care delivery process and information failures. The under-resourced healthcare systems in Guinea, Liberia and Sierra Leone, where 99% of the victims of Ebola were concentrated, struggled to contain the impact of virus.
Targeting aid to assist governments in the provision of basic services can greatly improve the health environment and increase resilience to epidemics. Even after they were declared free of Ebola in December 2015, the social and economic challenges in these countries remains critical. The World Bank estimates that the tragic outbreak cost USD 2.2 billion in foregone economic growth in 2015 in Guinea, Liberia and Sierra Leone (World Bank, 2016b). Economic activity and investment have still not recovered. About 70 000 births were not registered during the epidemic, putting children at risk (UNICEF, 2015b). The World Bank warned in a report that mortality may increase in Liberia by 111% due to the deaths of healthcare workers in the country. Meanwhile, new health risks continue to arise and the healthcare system remains badly damaged. More than 500 people already died of meningitis in Niger in 2015, where schools have been shut down. The WHO warns of a high risk this disease becomes an epidemic in 2016 in the African meningitis belt from Mali to Ethiopia. This demonstrates that the structural deficiencies in health delivery still need to be addressed. Without improving the quality of healthcare infrastructure and services, these diseases will continue to inflict a vastly disproportional impact on these countries.
The contracting out of government functions and services to external providers is an established practice in many developed and developing countries. In fragile situations, the use of external providers has allowed developing and developed countries alike to provide essential services, such as clean water, and core functions, ranging from customs services to domestic resource mobilisation. When not done properly, contracting out risks bypassing or substituting the state and can undermine the development of its capacity to manage and deliver these services or functions.
Sources: OECD(2010b), OECD (2011), UNICEF (2015b), World Bank (2016b).
Aligning aid modalities with state-building processes can reinforce effective service delivery in the long term. For example, asymmetry in aid allocations has been on the development agenda since the adoption of the Accra Agenda for Action (AAA) in 2008. Strengthening strategic partnerships with national stakeholders is needed, in particular in the case of fragile countries. Some other international initiatives are also bearing fruit in health sector. The Roll Back Malaria (RBM) Partnership, launched in 1998 as a partnership between the World Health Organisation (WHO), the United Nations Children’s Emergency Fund (UNICEF), the United Nations Development Programme (UNDP) and the World Bank, has obtained encouraging results against malaria: in ten years the number of deaths dropped by 50% in 11 African countries (WHO, 2015). The second Global Malaria Action Plan for the period 2016-25 aims to maximise performance through a multi-sectoral framework engaging action for households beyond healthcare provision (RBM/UNDP, 2013). Another example is the polio eradication initiative, a PPP led by national governments and financed by a wide range of donors and foundations. About USD 11 billion invested since its launch in 1988 has reduced the incidence of polio by 99%, with only 75 cases worldwide in 2015, none of which is in Africa (International Monitoring Board Polio, 2015).

5. POlitiCAl AND ECONOMiC GOVErNANCE iN AFriCA5. POlitiCAl AND ECONOMiC GOVErNANCE iN AFriCA
129African Economic Outlook© AfDB, OECD, UNDP 2016128 African Economic Outlook © AfDB, OECD, UNDP 2016
Improvements in the business environment require time and must complement structural reforms to bear fruit
The quality of governance by public institutions affects economic growth through its impact on the business environment. The ability of the private sector to contribute to economic growth depends not only on economic factors such as supply, demand and inputs but also on the set of regulatory, legal and social constraints to its decision-making (Hausmann, Rodrik and Velasco [2005]; OECD [2007]; Xu [2010]; Monga and Lin [2015]). African countries, for their part, have been improving their business regulatory environments.
African countries are making it easier to do business, and several appear among the world’s top reformers
Many African countries have made efforts in recent years to improve their business environments. The World Bank keeps track of the number of reforms to administrative procedures undertaken each year by each country in its annual Doing Business report. The most common types of reforms have been in the categories for starting a business and getting credit. Between 2014 and 2015, 15 countries undertook reforms in the first category and 13 in the second. Since 2010, African countries have regularly been among the 10 best reformers (Table 5.2). Uganda, Kenya and Mauritania are the top three African reformers in the 2016 report.
Table 5.1. Top ten countries in the world since 2011 according to Doing Business, by year
Order 2009/10 2010/11 2011/12 2012/13 2013/14 2014/15
1 Kazakhstan Morocco Poland Ukraine Tajikistan Costa Rica
2 Rwanda Moldova Sri Lanka Rwanda Benin Uganda
3 Peru Macedonia, FYR Ukraine Russian Federation Togo Kenya
4 Viet NamSao Tome and Principe Uzbekistan Philippines Côte d’Ivoire Cyprus
5 Cabo Verde Latvia Burundi Kosovo Senegal Mauritania
6 Tajikistan Cabo Verde Costa Rica Djibouti Trinidad and Tobago Uzbekistan
7 Zambia Sierra Leone Mongolia Côte d’Ivoire Congo, Dem. Rep. Kazakhstan
8 Hungary Burundi Greece Burundi Azerbaijan Jamaica
9 Grenada Solomon Islands Serbia Macedonia, FYR Ireland Senegal
10 Brunei Darussalam Korea Kazakhstan Guatemala United Arab Emirates Benin
Total African 3 2 1 4 5 5
Note by Turkey:The information in this document with reference to “Cyprus” relates to the southern part of the Island. There is no single authority representing both Turkish and Greek Cypriot people on the Island. Turkey recognises the Turkish Republic of Northern Cyprus (TRNC). Until a lasting and equitable solution is found within the context of the United Nations, Turkey shall preserve its position concerning the “Cyprus issue”.Note by all the European Union Member States of the OECD and the European Union:The Republic of Cyprus is recognised by all members of the United Nations with the exception of Turkey. The information in this document relates to the area under the effective control of the Government of the Republic of Cyprus.Source: World Bank (2016c).
African countries are improving their Doing Business scores, although from a low basis when compared to the rest of the world. In 2015, six countries out of 54 in Africa were above the global median value for this score, while 26 out of 37 of the countries in the bottom quintile were African (Figure 5.10). However, some of the low-income countries such as Rwanda have scores close to the level of OECD countries. Mauritius ranked 32 in the world, ahead of 12 OECD countries. By contrast, despite high per capita incomes, several resource-rich countries – whose wealth is less dependent on the quality of their business environment – displayed lower scores.

5. POlitiCAl AND ECONOMiC GOVErNANCE iN AFriCA
130 African Economic Outlook © AfDB, OECD, UNDP 2016
Figure 5.10. Doing Business scores and GDP per capita, 2015
5
6
7
8
9
10
11
12
25 35 45 55 65 75 85
Africa OECD Other countries Linear (Africa) OECD Others
Log of GDP per capita
Doing business scores
Source: Authors’ calculations based on World Bank (2016c) and IMF (2015a).12 http://dx.doi.org/10.1787/888933350492
Reforms may yield improvements over the long term, but short-term benefits are hard to come by
In general, the relationship between economic growth and improvement in the Doing Business scores is weak in the short-tem. Haidar (2011) estimated that GDP growth increases 0.15 percentage points of GDP on average with every positive reform. However, in practice, benefits are masked by the effects of more powerful constraints, such as unreliable electricity supply, low confidence in political institutions, standards and trade relations and informal practices or opacity in delivering trade licences. Figure 5.11 shows how the change in Doing Business scores over 2010-14 has been weakly correlated with the change in GDP per capita over the same period.
Figure 5.11. Change in Doing Business score and GDP per capita between 2010 and 2014
Africa OECD Other countries
Change in Doing Business score, 2010-14
Change in GDP per capita, 2009-14
-5-5-0.4
-0.2
0
0.2
1.0
0.4
0.6
0.8
0 5 10 15 20
Note: 2010-14 is the longest period in which there was a consistent time series for Doing Business scores (the methodology was changed in 2014).Source: Authors’ calculations based on World Bank (2016c) and IMF (2015).12 http://dx.doi.org/10.1787/888933350502

5. POlitiCAl AND ECONOMiC GOVErNANCE iN AFriCA5. POlitiCAl AND ECONOMiC GOVErNANCE iN AFriCA
131African Economic Outlook© AfDB, OECD, UNDP 2016130 African Economic Outlook © AfDB, OECD, UNDP 2016
Indicators of competitiveness show Africa still lags behind other regions. The WEF’s Global Competitiveness Index (GCI) measures what drives an economy’s productivity and prosperity. It is a mix of economic indicators and the results of a survey of business leaders to measure how attractive a country is for investment. Although it does not cover every country in Africa, there is general convergence between it and the World Bank’s Ease of Doing Business index. Africa lags behind other regions of the world not just in the regulatory environment but also in general attractiveness to investment (Kessides, 2015). Rwanda, Botswana, Mauritius and South Africa are the top-performing African countries in both the Doing Business Index and the GCI. On the other hand, Cameroon, Gambia and Senegal have good GCI scores but poor Doing Business scores. Tunisia had a high score in the Doing Business Index but a low one in the GCI.
To create new economic opportunities obstacles such as infrastructure bottlenecks must be lifted
One difficulty in establishing a link between good governance and good economic performance is that changes in laws, regulations and policies will have less effect when substantial corruption or informal practices continue to prevail. Hallward-Driemeier and Pritchett (2015) point out that the World Bank’s Doing Business scores represent de jure regulations and do not correspond to what is reported by businesses in the World Bank Enterprise Surveys. For example, the average number of days required to start a business in Egypt was reported as 138.9 in 2013 in the Entreprise Survey, while the number of days recorded while compiling the Doing Business data set was eight. On the other hand, the data used in the Doing Business scores included 86 days required to start a business in Zimbabwe in 2011, while according to the Enterprise Survey it was only six days on average. Very often, small and medium-sized entrepreneurs suffer more from informal administrative practices and red tape. In countries with high levels of corruption, businesses may even contribute to worsening this problem by using bribery to speed up administrative procedures. In other words, seemingly bold reforms do not necessarily have a meaningful economic effect.
Figure 5.12. Net perception rating for policies regarding reliable electric supply by country, 2014-15
-70
-50
-30
-10
10
30
50
70
90
110National approval rating (%)
Swazila
nd
Ghana
Côte d’
Ivoire
Zimba
bwe
Liberi
a
Leso
tho
Benin
Mali
Tanz
ania
Egyp
t
Burun
di
Nigeria
Ugand
a
Guinea
Maurit
ius
Botswan
a
Algeria
Kenya
Namibi
a
Mozam
bique
South
Africa
Cabo V
erde
Seneg
al
Madag
asca
r
Burkin
a Fas
o
Zambia
Malawi
Sierra
Leon
e To
go
Tunis
ia
Niger
Moroc
co
Camero
on
Note: The Afrobarometer survey includes a range of questions on how the respondents perceive their government’s performance on handling certain issues. Countries with negative scores have more respondents who think the government is doing badly on handling the specified topics. The range is from -100% (the worse) to +100% (the best).Source: Leo et al. (2015), based on Afrobarometer 2014/15 (http://afrobarometer.org/online-data-analysis/analyse-online).12 http://dx.doi.org/10.1787/888933350519

5. POlitiCAl AND ECONOMiC GOVErNANCE iN AFriCA
132 African Economic Outlook © AfDB, OECD, UNDP 2016
Key economic infrastructure needs better maintenance policies and good management systems. In most African countries in 2014/15, a majority of citizens believed governments performed poorly on handling the provision of reliable electricity and road maintenance (Figure 5.12, Afrobarometer, 2015). Inadequate public infrastructure is a key obstacle to growth, particularly in SSA. For example, Patat (2015) points out that due to poor infrastructure, major hydro-electric projects face losses on their lines of up to 50%, often causing power outages in major African cities. Unreliable electricity production in turn seriously affects economic activities in countries such as Ghana, Nigeria, Senegal and South Africa. In Ghana, long electricity cuts came on top of a sharp slowdown in the economy, sparking anger among voters (Reuters, 2015b). Severe electricity shortages in South Africa have become the greatest obstacle to economic activity and growth. This is a problem that may only be solved through structural reforms in infrastructure management (IMF, 2015b).
Fighting terrorism requires better regional co-ordination and information sharing
African co-operation mechanisms have been set up against terrorism. The African Peace and Security Architecture (APSA), led by the African Union and created in 2002, offers a multidimensional framework directed at handling the prevention, management and resolution of conflicts in Africa. To make the APSA operational and to enhance security co-operation in the Sahelo-Saharan region, 11 neighbouring countries launched the Nouakchott process in 2013 (OECD, 2014). The Sahel G5, which includes Burkina Faso, Chad, Mali, Mauritania and Niger and was institutionalised in December 2014, is another initiative aiming to better co-ordinate its members’ development and security policies. In addition, the Multi-National Joint Task Force was formed in May 2014 by Nigeria, Niger, Chad, Cameroon and Benin to fight Boko Haram (Box 5.4).
International efforts have been made to help African countries deal with security issues. In the context of the EU-Africa partnership, the European Union Training Mission in Mali (EUTM Mali) has deployed around 200 EU instructors in Koulikoro to provide training to official Malian armed forces, with a budget of EUR 27.7 million and a 24-month mandate from February 2013. The EUCAP Sahel mission offers another example of EU co-operation with Africa on security matters. It provides advice to the Nigerien and Malian authorities in setting up an integrated approach against terrorism and organised crime. France has been engaged militarily fighting jihadists in Northern Mali since 2012 in accordance with the United Nations Resolution 2100. Operation Barkhane replaced Operation Serval in August 2014, with a broader mandate to counter terrorism across the Sahel region. At the 2015 US-Africa summit, the US administration announced two initiatives to strengthen security and peace in Africa: The African Peacekeeping Rapid Response Partnership (APRRP, or A-Prep) and the Security Governance Initiative (SGI). A-Prep is a new investment of USD 110 million per year for five years to build the capacity of African militaries to rapidly deploy peacekeepers in response to emerging conflicts.
Legal mechanisms to combat terrorism face implementation issues. There are already 19 international conventions dealing with terrorism (UNODC, 2016). In West Africa, the Economic Community Of West African States (ECOWAS) adopted several legal instruments to foster judicial co-operation between West African countries (OECD, 2013b) though implementation has been slow due to differences in legal systems, weak operational capacity and divergent priorities between countries (Yabi, 2010). New anti-terrorism laws passed in 2015 have been criticised as exposing civil organisations and political activists to abuses, raising concerns over possible infringements on the rule of law and civil and political rights (AFP, 2015a).

5. POlitiCAl AND ECONOMiC GOVErNANCE iN AFriCA5. POlitiCAl AND ECONOMiC GOVErNANCE iN AFriCA
133African Economic Outlook© AfDB, OECD, UNDP 2016132 African Economic Outlook © AfDB, OECD, UNDP 2016
Box 5.4. Regional efforts against Boko Haram
The fight against transnational terrorism requires extensive cross-border co-ordination and co-operation. After the kidnapping of more than 200 schoolchildren in Chibok, Nigeria, a Multi-National Joint Task Force (MNJTF) was established in May 2014 by Nigeria, Niger, Chad, Cameroon and Benin. It was set up outside ECOWAS regional conventions through the Lake Chad Basin Commission and formalised through the UN Security Council. Its 8 700-strong force has been deploying slowly, in part due to diplomatic difficulties between Anglophone Nigeria and its Francophone neighbours (AFP, 2015b). After taking office on 29 May 2015, Nigerian President Muhammadu Buhari re-launched the regional co-operation effort, holding many face-to-face meetings with his counterparts. However, although the MNJTF was meant to have been in effect since 30 July 2015, as of February 2016 it was still pending.
In addition to tackling terrorism and cross-border risks, policies addressing the root causes of conflicts and sources of vulnerability can improve the effectiveness of the peacebuilding processes within the countries. For instance, insecurity driven by inter-community conflicts and land disputes is a threat to political stability. Informal mining is one of the factors spurring illicit financial flows (Box 5.5).
Box 5.5. The need for better regulation of mining activities
Estimates of illicit flows of money in West Africa amount to over USD 15 billion, of which USD 3.5 billion originates from artisanal and small-scale gold mining (OECD, forthcoming).
Illegal mining activities are fuelling inter-community tensions in certain cases in West-Africa. Violent disputes can be the consequence of conflicts over resources as is evidenced by attacks over illegal mining activities in some countries. On 22 December 2015, violent clashes over land boundary issues and illegal gold mining activities occurred between the populations of Djélimala in Guinea and Karatou in Mali. The Malian and Guinean ministers organised a joint meeting with the local populations and advocated the banning of gold mining until the authorities had settled the land boundary issues (L’essor, 2016). In 2013, Angovia in Côte d’Ivoire experienced a violent clash between gold panners and the local population (RFI, 2013).
Disputes around land and access to natural resources pose a particular strategic risk, as the cost of inaction can be huge. If the presence of natural wealth can lead to civil unrest in relatively stable countries, it poses a particular hazard in regions that are already under the threat of armed groups. Eastern Democratic Republic of the Congo (DRC) has been destabilised for more than 20 years by armed conflicts triggered by competition for the control of mining resources in the region. A UN report highlighted that the conflict in the eastern DRC is sustained by the prosperous trafficking of natural resources by organised criminal networks. Around 98% of the net profits from illegal natural resource exploitation goes to transnational organised criminal networks operating in and outside the DRC. It is estimated that 57% of mines in eastern DRC have an armed group presence. Illegal taxes are collected from 36% of the mines and provide the militias their income (UNEP et al., 2015). But armed groups retain only 2% of the net profits from illegal natural resource exploitation, the bulk goes to transnational organised criminal networks.

5. POlitiCAl AND ECONOMiC GOVErNANCE iN AFriCA
134 African Economic Outlook © AfDB, OECD, UNDP 2016
several African countries have seen their electoral processes become fairer
The process by which governments are selected and replaced plays a key role in economic development, as does the way in which the governments are monitored. Democratic consolidation in African countries has been associated with economic growth (Masaki and van de Walle, 2015). Principles such as transparency, accountability, non-discrimination or equality can increase development outcomes (OECD, 2012; Malhorta, 2015).
Strong political institutions are essential to not only sustaining governance gains, but also to responding adequately to citizens’ needs. Elections are necessary but not sufficient to assessing the state of governance. The 17 Sustainable Development Goals, which were adopted in 2015, include commitments to building capable institutions. Some countries have seen moves toward stronger and more trusted institutions over the past year. The years 2016 and 2017 will be important steps to testing these positive signals for good governance in Africa.
Fair and competitive elections help to enhance peace building and trust
The year 2015 demonstrated that when held in accordance with the law and principles of fairness elections can play a crucial role towards strengthening the legitimacy and credibility of institutions. In Benin, the intensity of political protests decreased sharply following the announcement of elections to be held in 2016 and a court ruling against a constitutional change that would have allowed the president to stand for a third term (IEP, 2015). In Burkina Faso, in the wake of national protests and a popular uprising leading to the fall of President Blaise Compaoré after 26 years in power, a democratic transition led to the election of Marc Christian Kaboré as the new president in December 2015. The transitional regime led by the diplomat Michel Kafando undertook economic and social reforms and a fight against corruption. The process was nevertheless characterised by tensions: the army attempted a coup in September 2015, which eventually failed, shifting power back to the transitional regime. Guinea-Bissau registered one of the largest improvements in the world in their Global Peace Index score due mainly to the holding of credible and predominantly peaceful elections in 2014 (Ibid). In Zambia, after the death of the sitting president Michael Sata in October 2014, the country held peaceful presidential elections in January 2015.
Despite these peaceful and democratic changes in 2015, election time is still often associated with surges in protests in several countries. As shown in Figure 5.3, protests over elections results or procedures were among the main protest motives reported from 2013-15. For example, the Ibrahim Index of Good Governance (IIAG) shows that Ghana remains one of the best performers in terms of democratic gains in Africa (Mo Ibrahim Foundation, 2015). Yet in 2015, supporters of the main opposition party held demonstrations asking to update the electoral list, which they claimed contained non-existent candidates and non-Ghanaians (AFP, 2015c; Reuters 2015c). In Togo, there was a general strike of schools and public hospitals, with thousands marching in the capital Lomé to protest the results of the presidential election of 25 April 2015. In the Congo, a referendum organised in October 2015 to change the constitution was met with some protests.
Elections are an essential component of democracy and open governance, but some countries are still struggling to make them transparent and fair. The African think tank the Institute for Empirical Research in Political Economy (IERPE) has scored half of the countries in Africa below 4.5 on a scale of 0 to 10 in its index for the freedom, fairness and competitiveness of elections from 2000-13. The index encompasses all the different stages of the electoral process, from the campaign and the election to the post-electoral period, as well as aspects such as procedures, freedom of assembly and legal restrictions
5. POlitiCAl AND ECONOMiC GOVErNANCE iN AFriCA5. POlitiCAl AND ECONOMiC GOVErNANCE iN AFriCA
135African Economic Outlook© AfDB, OECD, UNDP 2016134 African Economic Outlook © AfDB, OECD, UNDP 2016
on political parties (IERPE, 2015). This indicates a need to further improve the electoral processes. Occurrences of vote-buying have been reported (Gutiérrez-Romero, 2014), and political figures may seek political gains by instrumentalising societal divisions to fuel conflict (Bayart, 1989 and 2009). For example, since the overthrow of President Bozizé by the Seleka militia in 2013, the Central African Republic has gone through a severe political crisis which has exacerbated inter-community violence and destroyed economic progress. The crisis has completely paralysed the economy and prevented public administration and taxation, therefore depriving the country of resources.
Civil societies are playing an increasing role in political governance
Civil society movements in Africa seem to shape ways for citizens to influence the quality of governance and political stability, as in Burkina Faso and Tunisia. These movements follow different patterns and different intensities in different countries (Box 5.6). There are now initiatives in seven countries that aim to hold officials accountable by other means than public protests or demonstrations (McNeil and Malena, 2010). They range from participatory budgets to independent budget analysis, participatory monitoring of public expenditures and citizen evaluation of public service. In Benin, the Social Watch Network, initially created to monitor the Millennium Development Goals (MDGs), broadened its activities at the national level by developing strong partnerships and establishing good governance practices among stakeholders (McNeil and Malena, 2010).
More generally, accountability ecosystems within public administrations need to be strengthened to enable civil society to perform its oversight functions. Despite some successes, most African countries provide insufficient information for civil society and the public to understand or monitor budgets. Findings from the 2015 World Bank Open Budget Survey reveal that seven African countries are among the 12 characterised by a lack of budget transparency, weak legislatures, weak auditors and few or no opportunities for public participation (IBP, 2015). Only South Africa, the third best worldwide, scored very well across all dimensions. Malawi had a high ranking, at 18. Francophone West African countries, for their part, made remarkable progress from 2010 to 2015.
Box 5.6. The rise of civil society in Africa
Some civil society movements have played an important role in the political debate and in some cases were instrumental in regime change. In Burkina Faso, the association Le Balai citoyen acted as a major pacific democratic force in the popular uprising leading to the fall of the Compoaré regime in 2014. Made up of musicians, magistrates, journalists and students, it acted as a mediator between the military, the opposition and the population and campaigned to preserve the due process of the transition (Le Monde Diplomatique, 2015). In September 2015 when the RSP (Regiment de sécurité présidentielle) attempted a coup, this group maintained pressure on them to hand power back to the transitional civilian regime. This regime change was a case of democratic transition, where a civil society movement transcended ethnic divisions – often instrumentalised in conflicts in Africa – and united citizens around common aspirations for a social compact based on representativeness, protecting the public interest and democratic debate.
Tunisia offers an example of successful actions led by civil society organisations: A quartet organisation received the Nobel Peace Prize in 2015 for its decisive contribution to the establishment of a pluralist democracy in Tunisia (Norwegian Nobel Committee, 2015). In the wake of the Arab Spring, Tunisia managed to consolidate real democratic gains, and this award is the symbol of the success of civil society organisations in conflict resolution. The coalition was made up of the General Union of Tunisian Work (Union générale tunisienne du travail, UGTT), the Tunisian Union of Industry, Commerce and Arts and Crafts (Union Tunisienne de l’Industrie, du Commerce et de l’Artisanat, UTICA), the Tunisian League of Human Rights (Ligue tunisienne des droits de l’homme, LTDH) and the National Order of Tunisian Lawyers (Ordre national des avocats de Tunisie).

5. POlitiCAl AND ECONOMiC GOVErNANCE iN AFriCA
136 African Economic Outlook © AfDB, OECD, UNDP 2016
Box 5.6. The rise of civil society in Africa
As such, it was able to establish a national dialogue, whose success is based on a true understanding of the local reality and the coalition’s inclusiveness and diversity. By gathering different parts of the population for the common goal of social justice, this experience shows that civil society can play a crucial role in building and strengthening institutions in a given country.
Africa has seen others examples of civil society initiatives. In Morocco, the pro-reform movement M20 played a significant role in the modernisation of the constitution in 2011 (AEO, 2012). In 2011 and 2012, the Senegalese movement Y en a marre was active in pushing for better public services in the country. The Tournons la Page alliance, which has chapters in Cameroon, Congo, Gabon, the DRC, Belgium and France, is seeking to form a transcontinental movement promoting the principle of democratic change. However, the models are still fragile and the patterns are quite difficult to replicate.
Civil society organisations can thus play important roles in democratic transitions. The challenge is to maintain credibility and momentum.
Elections will take place in nearly half of African countries in 2016 and 2017
Looking forward, 26 African countries will hold national elections in 2016 and 2017. These represent opportunities to gauge how African institutions are maintaining governance gains and democratic consolidations (Table 5.2). Democratisation and stronger institutions are interrelated. When free and fair, elections can lead to democratisation and a stronger legitimacy for public institutions.
As countries progress and their societies are more demanding about the quality of governance, public institutions and civil societies need to play their part in improving the functioning of government. Government institutions and public services must be able to respond when citizens call for better economic opportunities. Key political tensions also need to be addressed through sound policies to sustain human well-being and development outcomes. In addition to their ability to serve the needs of populations, the effectiveness of African institutions in supporting development depends on their ability to foster peacebuilding and trust. This includes better processes, methods of governing and more efficient decision making, with effective control and compliance. Constitutionally mandated institutions improve the accountability, transparency and responsiveness of institutions (Sandbrook and Oelbaum, 1997), which in turn has an impact on the economic outlook.
(cont.)

5. POlitiCAl AND ECONOMiC GOVErNANCE iN AFriCA5. POlitiCAl AND ECONOMiC GOVErNANCE iN AFriCA
137African Economic Outlook© AfDB, OECD, UNDP 2016136 African Economic Outlook © AfDB, OECD, UNDP 2016
Table 5.2. Overview of national elections in 2016 and 2017 in Africa
Country Voting for Date
Benin president 06/03 /2016 and 20/03/2016 (second round)
Cabo Verde president 31/08/2016
Central African Republic president and national assembly 14/02/2016
Chad president 10/04/2016
Comoros president 21/02/2016
Congo, Rep. president 20/03/2016
Côte d’Ivoire national assembly Dec/2016 *
Democratic Republic of the Congo president and national assembly 27/11/2016 *
Djibouti president 08/04/2016
Equatorial Guinea president 30/11/2016 *
Gabon national assembly, president 16/08/2016 *
Gambia national assembly 01/12/2016
Ghana president and national assembly 07/11/2016
Morocco national assembly 07/10/2016 *
Niger president and national assembly 21/02/2016
Sao Tome and Principe president 31/07/2016
Seychelles president and national assembly 31/10/2016 *
Uganda president and national assembly 18/02/2016
Zambia president, national assembly 11/08/2016 *
Algeria national assembly 2017 *
Angola national assembly 2017 *
Kenya president, national assembly and senate 31/08/2017 *
Lesotho national assembly 2017*
Liberia president, national assembly 2017 *
Madagascar president 2017 *
Rwanda president 2017 *
Senegal national assembly 2017 *
Sierra Leone national assembly 2017 *
Note: *Election dates to be confirmed.Source: International Foundation for Electoral Systems (IFES) (2016); International Institute for Democracy and Electoral Assistance (IDEA) (2016).

5. POlitiCAl AND ECONOMiC GOVErNANCE iN AFriCA
138 African Economic Outlook © AfDB, OECD, UNDP 2016
Note
1. For example, protests were restricted or banned from August 2014 until the official end of the Ebola epidemy in Guinea (29 December 2015), Liberia (November 2015) and Sierra Leone (7 November 2015).
• Chad established a state of emergency on 09 November 2015, and Mali did so several times between 20 November 2015 and 31 March 2016.
• Egypt, which is facing repetitive jihadist attacks against government forces, instituted a state of emergency from 24 October 2014 to 23 July 2015, renewing it for three months in August 2015.
• Niger declared a state of emergency from 11 February 2015 to 26 January 2016, in particular in the Difa region.
• Tunisia was hit by three waves of terrorists attacks in 2015. It instituted a state of emergency for the whole country for three months from the end of June 2015 to early October 2015, then for four months from 24 November 2015 to 21 March 2016.

5. POlitiCAl AND ECONOMiC GOVErNANCE iN AFriCA5. POlitiCAl AND ECONOMiC GOVErNANCE iN AFriCA
139African Economic Outlook© AfDB, OECD, UNDP 2016138 African Economic Outlook © AfDB, OECD, UNDP 2016
References
ADB (2013), Asian Development Outlook 2013 Update: Governance and Public Service Delivery, Asian Development Bank , Mandaluyong City, Philippines.
AFP (2015a), “Au Tchad, un projet de loi antiterroriste controversé”, press release, 30 July, Agence France Press, Paris.
AFP (2015b), “Boko Haram : face à la stratégie de la terreur, le casse-tête de la future force régionale”, press release, 7 August, Agence France Press, Paris.
AFP (2015c), “Ghana : la police disperse une manifestation de l’opposition”, press release, 16 September, Agence France Press, Paris.
Afrobarometer (2015), Afrobarometer survey R6 2014/2015, http://afrobarometer.org/online-data-analysis/analyse-online (accessed February 2016).
Arrow, K. and A. Sanghi (2015), “Why economists put health first”, Project Syndicate, http://project-syndicate.us10.list-manage.com/track/click?u=9116789a51839e0f88fa29b83&id=f58ee400f7&e=cd5d5ba528.
Bayart, J-F. (2009), The State in Africa: The Politics of the Belly, Polity Press, Cambridge.
Bayart, J-F. (1989), L’Etat en Afrique : la politique du ventre, Paris, Fayard.
Bratton, M. and R. Houessou (2014), “Demand for democracy is rising in Africa, but most political leaders fail to deliver”, Policy Paper 11, Afrobarometer, www.afrobarometer.org/files/documents/policy_brief/ab_r5_policypaperno11.pdf.
Cabral, L. (2011), “Decentralisation in Africa: Scope, motivations and impact on service delivery and poverty”, Future Agricultures Working Papers 020, Overseas Development Institute, London.
Effective Institutions Platform (2015), “An effective institutions index: Draft discussion paper”,
http://effectiveinstitutions.org/en/.Gallup Organization (2015); Gallup World Poll, (database), http://gallup.com/services/170945/world-poll.aspx.
Gutiérrez-Romero, R. (2014), “An inquiry into the use of illegal electoral practices and effects of political violence and vote-buying”, The Journal of Conflict Resolution 2014, Vol. 58/8, pp. 1500-1527, DOI: 10.1177/0022002714547902.
Haidar, J.I. (2011), “The impact of business regulatory reforms on economic growth”, Journal of the Japanese and International Economies, Vol.26, pp. 285-307.
Hallward-Driemeier, M. and L. Pritchett (2015), “How business is done in the developing world: deals vs rules”, Journal of Economic Perspectives, Vol. 29/3, pp. 121-140.
Hausmann, R., D. Rodrik and A. Velasco (2005), “Growth diagnostics”, Inter-American Development Bank, www6.iadb.org/WMSFiles/products/research/files/pubS-852.pdf.
IBP (2015), “The Open Budget Survey 2015”, International Budget Partnership, Washington, DC, http://internationalbudget.org/opening-budgets/open-budget-initiative/open-budget-survey/publications-2/full-report/.
IEP (2015), “Global Peace Index report 2015”, Institute for Economics and Peace, http://visionofhumanity.org/sites/default/files/Global%20Peace%20Index%20Report%202015_0.pdf.
IERPE (2015), “African Electoral Index 2000-13”, The Institute for Empirical Research in Political Economy (IERPE), http://mo.ibrahim.foundation/iiag/methodology/ (accessed January 2015).
IFES (2016), Election Guide Calendar, International Foundation for Electoral Systems, www.electionguide.org (accessed January 2016).
IMB Polio (2015), “Now is the time for peak performance – 12th report: October 2015”, The Independent Monitoring Board of the Global Polio Eradication Initiative, http://polioeradication.org/Aboutus/Governance/IndependentMonitoringBoard/Reports.aspx.
IMF (2015a), World Economic Outlook, October 2015” (database), International Monetary Fund, Washington, DC, www.imf.org/external/pubs/ft/weo/2015/02/weodata/index.aspx.
IMF (2015b), South Africa: Concluding Statement of an IMF Staff Visit, International Monetary Fund, Washington, DC, https://imf.org/external/np/ms/2015/062315.htm.
International IDEA (2016), Voter Turnout Website, International Institute for Democracy and Electoral Assistance, www.idea.int/vt/index.cfm (accessed January 2016).
KENAO (2015), “Report of the auditor-general on the financial statements for national government for the year 2013-2014”, Kenya National Audit Office, Republic of Kenya, http://kenao.go.ke/index.php/reports/cat_view/2-reports/9-national-government/69-government-ministries (accessed February 2016).
Kessides, I.N. (2015), “Regulatory reform for closing Africa’s competitiveness gap”, The Oxford Handbook of Africa and Economics: Volume 2: Policies and Practices, Oxford University Press, Oxford.

5. POlitiCAl AND ECONOMiC GOVErNANCE iN AFriCA
140 African Economic Outlook © AfDB, OECD, UNDP 2016
KPMG (2012), “The State of Healthcare in Africa”, KPMG Africa Limited, www.kpmg.com/africa/en/issuesandinsights/articles-publications/pages/the-state-of-healthcare-in-africa.aspx.
L’essor (2016), “Mali : Frontière Mali-Guinée : ZONE DE FRICTIONS”, http://essor.ml/frontiere-mali-guinee-zone-de-frictions/.
Le Monde Diplomatique (2015), “Coup de Balai citoyen au Burkina Faso”, http://monde-diplomatique.fr/2015/04/COMMEILLAS/52835.
Leo, B., R. Morello and V. Ramachandran (2015), “The face of African infrastructure: Service availability and citizens’ demands”, Center for Global Development Working Paper 393, Washington, DC, http://cgdev.org/publication/face-african-infrastructure-service-availability-and-citizensdemands-working-paper-393.
Lin, J.Y. and C. Monga (2012), “Solving the mystery of African governance”, New Political Economy, Vol. 17/5, pp. 659-666, http://dx.doi.org/10.1080/13563467.2012.732277.
Lundberg, M. (2008), “Client satisfaction and the perceived quality of primary health care in Uganda”, Are you Being Served? New Tools for Measuring Service Delivery, pp. 313-344, World Bank, Washington, DC.
Malhorta, R. (2015), “Delivering development and good governance, making human rights count”, Improving Delivery in Development: The Role of Voice, Social Contract, and Accountability, World Bank Legal Review, Vol. 6, pp. 59-89.
Masaki, T. and N. Van de Walle (2015), “The Impact of Democracy on Economic Growth in Sub-Saharan Africa, 1982-2012”, The Oxford Handbook of Africa and Economics: Volume 1: Context and Concepts, Oxford University Press, Oxford, http://dx.doi.org/10.1093/oxfordhb/9780199687114.013.13.
Masry, M. (2015), “The role of political stability in achieving economic development”, Journal of Economics and Sustainable Development, Vol. 6/16.
McNeil, M. and C. Malena (eds.) (2010), Demanding Good Governance: Lessons from Social Accountability Initiatives in Africa, World Bank Institute, Washington, DC.
Mitullah, W. and P. Kamau (2013), “The partnership of free speech and good governance in Africa”, Policy Brief 3, Afrobarometer, http://afrobarometer.org/sites/default/files/publications/Briefing%20paper/ab_r5_policypaperno3.pdf.
Mo Ibrahim Foundation (2015), Ibrahim Index of African Governance (IIAG) 2015, www.moibrahimfoundation.org/iiag/data-portal/.
Monga, C. and J. Yifu Lin (eds.) (2015), “Africa’s evolving economic policy frameworks”, The Oxford Handbook of Africa and Economics: Volume 2: Policies and Practices, Oxford University Press, Oxford, http://dx.doi.org/10.1093/oxfordhb/9780199687107.013.58.
NISR (2013), “Fourth population and housing census, Rwanda, 2012”, National Institute of Statistics of Rwanda, Kigali.
Norwegian Nobel Committee (2015), “The Nobel Peace Prize for 2015”, press release, http://nobelprize.org/nobel_prizes/peace/laureates/2015/press.html.
Novartis Foundation (2016), “Telemedicine Project in Ghana: Bonsaaso cluster in the Amansie-West district of the Ashanti region”, http:// novartisfoundation.org/programs/more/408/improving-access-with-technology (accessed February 2016).
O’Neil, T. et al. (2014), Fragmented governance and local service delivery in Malawi, Overseas Development Institute, London.
OECD (forthcoming), “Illicit financial flows: The economy of illicit trade in West Africa”, OECD Publishing, Paris.
OECD (2015), OECD Economic Surveys: South Africa 2015, OECD Publishing, Paris, http://dx.doi.org/10.1787/eco_surveys-zaf-2015-en.
OECD (2014), An Atlas of the Sahara-Sahel: Geography, Economics and Security, West African Studies, OECD Publishing, Paris, http://dx.doi.org/10.1787/9789264222359-en.
OECD (2013a), Identification and Monitoring of Potentially Under-aided Countries, OECD Publishing, Paris, www.oecd.org/dac/aid-architecture/Identification%20and%20Monitoring%20of%20Potentially%20Under-Aided%20Countries.pdf.
OECD (2013b), Conflits liés aux ressources et terrorismes : deux facettes de l’insécurité, OECD Publishing, Paris, http://dx.doi.org/10.1787/9789264190306-fr.
OECD (2012), “From aid to development: the global fight against poverty”, OECD Insights, OECD Publishing, Paris, http://dx.doi.org/10.1787/9789264123571-en.
OECD (2011), “Supporting state building in situations of conflict and fragility: Policy guidance”, DAC Guidelines and Reference Series, OECD Publishing, Paris, http://dx.doi.org/10.1787/9789264074989-en.
OECD (2010a), Health Care Systems: Efficiency and Policy Settings, OECD Publishing, Paris, http://dx.doi.org/10.1787/9789264094901-en.

5. POlitiCAl AND ECONOMiC GOVErNANCE iN AFriCA5. POlitiCAl AND ECONOMiC GOVErNANCE iN AFriCA
141African Economic Outlook© AfDB, OECD, UNDP 2016140 African Economic Outlook © AfDB, OECD, UNDP 2016
OECD (2010b), Handbook on Contracting Out Government Functions and Services in Post-Conflict and Fragile Situations, Partnership for Democratic Governance, OECD Publishing, Paris, http://dx.doi.org/10.1787/9789264091993-en.
OECD (2007), Micro-Policies for Growth and Productivity: Summary of Key Findings, OECD Publishing, Paris, www.oecd.org/sti/ind/38151918.pdf.
Pew Research Center (2015), Health Care, Education Are Top Priorities in Sub-Saharan Africa, Washington, DC.
RBM/UNPD (2013), “Multisectoral action framework for Malaria”, Roll Back Malaria Partnership, http://rollbackmalaria.org/about/about-malaria/multisectoral-action-framework.
Reuters (2015a), “Tanzania rolls out birth registrations by mobile phone”, press release, 13 October, www.reuters.com/article/uk-tanzania-goals-birth-registration-idUKKCN0S71XC20151013.
Reuters (2015b), “Ghana averts threat to power supply by agreeing to pay Nigeria gas bill”, press release, 20 October, www.reuters.com/article/ghana-nigeria-gas-idUSL8N12K3NZ20151020.
Reuters (2015c), “Ghana protesters demanding new electoral roll clash with police”, press release, 17 September, http://in.reuters.com/article/ghana-protest-idINKCN0RH01Y20150917?feedType=RSS&feedName=worldNews.
RFI (2013), “Côte d’Ivoire : affrontements meurtriers entre orpailleurs et villageois”, Radio France Internationale, www.rfi.fr/afrique/20130714-nouvelles-violences-cote-ivoire-orpailleurs-villageois.
Rhodes, R.A.W. (2012), “Waves of governance”, The Oxford Handbook of Governance, Oxford University Press, London, http://dx.doi.org/10.1093/oxfordhb/9780199560530.013.0003.
Sandbrook, R and J. Oelbaum (1997), “Reforming dysfunctional institutions through democratisation? reflections on Ghana”, The Journal of Modern African Studies, Vol. 35, pp. 603-646.
SARB (2014), Quarterly Bulletin 273, South African Reserve Bank, September, ISSN 0038-2620, www.resbank.co.za/Publications/QuarterlyBulletins/Pages/QuarterlyBulletins-Home.aspx.
Transparency International (2015), People and Corruption: Africa Survey 2015-Global corruption barometer, www.transparency.org/whatwedo/publication/people_and_corruption_africa_survey_2015.
UN/ODI/Ipsos MORI (2016), The United Nations Global Survey for a Better World, database, United Nations, the Overseas Development Institute, Ipsos MORI and partners, http://data.myworld2015.org/ (accessed February 2016).
UNEP/United Nations Great Lakes/MONUSCO (2015), Experts’ background report on illegal exploitation and trade in natural resources benefitting organized criminal groups and recommendations on MONUSCO’s role in fostering stability and peace in eastern DR Congo, final report, United Nations Environment Programme, United Nations Great Lakes and United Nations Organization Stabilization Mission in the Democratic Republic of the Congo.
UNHCR (2014), Birth Registration and the Right to Everyone to Recognition Everywhere before the Law, United Nations High Commissioner for Human Rights, United Nations General Assembly, A/HCR/27/22.
UNICEF (2015a), “Nigeria conflict forces more than 1 million children from school”, press release, 22 December, www.unicef.org/media/media_86621.html (accessed January 2016).
UNICEF (2015b), “Thousands of unregistered children born in Liberia during Ebola crisis at risk of exploitation”, UN News press, 31 July, www.un.org/apps/news/story.asp?NewsID=51540#.VstDECvzPqk (accessed February 2016).
UNODC (2016), Instruments Universels contre le terrorisme, UN database on country ratification status, https://unodc.org/tldb/fr/universal_instruments_NEW.html (accessed 5 January 2016).
WEF (2014), The Executive Opinion Survey, 2014, World Economic Forum database, http://reports.weforum.org/global-competitiveness-report-2014-2015/introduction-2/.
Whaites, A et al. (2015), A Governance Practitioner’s Notebook: Alternative Ideas and Approaches, OECD, Paris, www.oecd.org/dac/governance-peace/governance/governance-practitioners-notebook.htm.
WHO (2015), World Malaria Report 2014, World Health Organization, Geneva, www.rollbackmalaria.org/files/files/about/9789241564830_eng.pdf.
WHO (2014), “WHO Country Cooperation Strategy 2014-2018: Rwanda”, World Health Organisation, Brazzaville.
World Bank (2016a), Country Policy and Institutional Assessment (database), World Bank, Washington, DC, http://data.worldbank.org/data-catalog/CPIA (accessed January 2016).
World Bank (2016b), “World Bank Group Ebola response fact sheet”, brief, 2 February, World Bank, Washington, DC, www.worldbank.org/en/topic/health/brief/world-bank-group-ebola-fact-sheet.
World Bank (2016c), Doing Business (database), World Bank, Washington, DC, http://doingbusiness.org/.
World Bank (2015), World Development Indicators (database), World Bank, Washington, DC, www.worldbank.org (accessed January 2016).

5. POlitiCAl AND ECONOMiC GOVErNANCE iN AFriCA
142 African Economic Outlook © AfDB, OECD, UNDP 2016
World Bank (2002), World Development Report, Building Institutions for Markets, World Bank, Washington, DC, Oxford University Press, Oxford.
Xu, L.C. (2010), “The effects of business environments on development: Surveying new firm-level evidence”, Policy Research Working Paper 5402, World Bank, Washington, DC.
Yabi, G.l O. (2010), Le rôle de la CEDEAO dans la gestion des crises politiques et des conflits : cas de la Guinée et de la Guinée-Bissau, Friedrich-Ebert-Stiftung, Abuja, http://library.fes.de/pdf-files/bueros/nigeria/07449.pdf.
Yifu Lin, J. and C., Monga, (2012), “Solving the mystery of African governance”, New Political Economy, Vol. 17/5, pp. 659-666.

PART II Sustainable cities and
structural transformation


145African Economic Outlook© AfDB, OECD, UNDP 2016
While there is growing awareness that urbanisation is profoundly
transforming African societies, little attention has been paid so
far to ways in which that process may be harnessed to accelerate
the continent’s structural transformation in a more effective and
sustainable manner. In pursuit of that ambition, this chapter
analyses the diversity and uniqueness of the continent’s urbanisation
experiences. Chapters 7 and 8 then focus on options for seizing the
opportunities that urbanisation provides. An annex to Chapter 6
explains the methodology for the cluster analysis on urbanisation
and structural transformation in diverse African countries.
Chapter 6
The implications of Africa’s urbanisation for structural transformation

6. tHE iMPliCAtiONS OF AFriCA’S UrBANiSAtiON FOr StrUCtUrAl trANSFOrMAtiON
146 African Economic Outlook © AfDB, OECD, UNDP 2016
In brief
Africa is urbanising at a historically rapid rate, bringing about considerable opportunities and challenges. Africa’s urbanisation can allow for structural transformation, if accompanied by productive employment and sufficient public goods. Urbanisation patterns are diverse across Africa, but they generally confirm that unplanned urbanisation can challenge structural transformation.
Current urbanisation patterns should be more sustainable for economic, social and environmental development. In many African countries, a large portion of the urban labour force remains trapped in low-productivity informal services activities and access to public goods is unequal. Urban activities are increasingly connected with rural areas, which remain a pillar of African economies. Despite Africa’s slow industrialisation, the costs of environmental degradation are large and increasing, adding to the economic and social challenges of urbanisation. Specifically, policies must ensure that infrastructure keeps up with rapid urban growth and connects urban centres and must actively promote urban planning and governance. Agenda 2063 and the Sustainable Development Goal 11 on cities provide new impetus for fulfilling Africa’s urbanisation potential.
The links between urbanisation and structural transformation in Africa are complex and varied
The first section below informs the reader of the fast pace and magnitude of Africa’s urbanisation in light of the most recent evidence. It frames Africa’s urbanisation in the context of the “second wave” of the world’s urbanisation process led by Asia. The following section analyses Africa’s experience of rapid urbanisation with slow structural transformation. This contrasts with that of many world regions, most clearly OECD and East Asian countries. The third section looks at the variety of urbanisation patterns observed on the continent. The final section takes account of the staying power of Africa’s rural economy.
Africa is urbanising at a historically rapid rate
The African continent is urbanising fast. The share of urban residents has increased from 14% in 1950 to 40% today. By the mid-2030s, 50% of Africans are expected to become urban dwellers (Figure 6.1).1 Urbanisation is likely to continue and level off at about 56% around 2050.
Figure 6.1. Growth trends in Africa’s urban, rural and total population, 1950-2050
0
500
1 000
1 500
2 000
2 500
3 000
1950 1955 1965 1975 1985 1995 2005 2015 2025 2035 20451960 1970 1980 1990 2000 2010 2020 2030 2040 2050
Rural populationUrban population Total population
Million
Note: Forecasts start from 2010 based on UN DESA’s medium fertility scenario.Source: UN DESA (2014).
12 http://dx.doi.org/10.1787/888933350529
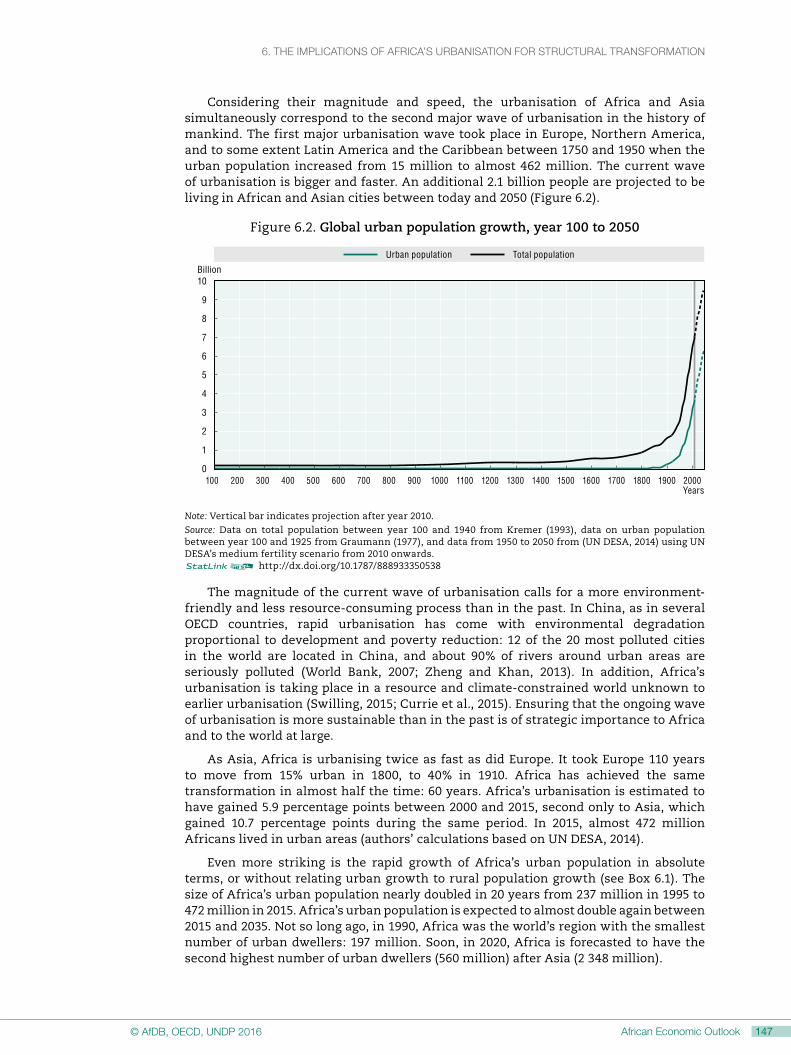
6. tHE iMPliCAtiONS OF AFriCA’S UrBANiSAtiON FOr StrUCtUrAl trANSFOrMAtiON6. tHE iMPliCAtiONS OF AFriCA’S UrBANiSAtiON FOr StrUCtUrAl trANSFOrMAtiON
147African Economic Outlook© AfDB, OECD, UNDP 2016146 African Economic Outlook © AfDB, OECD, UNDP 2016
Considering their magnitude and speed, the urbanisation of Africa and Asia simultaneously correspond to the second major wave of urbanisation in the history of mankind. The first major urbanisation wave took place in Europe, Northern America, and to some extent Latin America and the Caribbean between 1750 and 1950 when the urban population increased from 15 million to almost 462 million. The current wave of urbanisation is bigger and faster. An additional 2.1 billion people are projected to be living in African and Asian cities between today and 2050 (Figure 6.2).
Figure 6.2. Global urban population growth, year 100 to 2050
0
1
2
3
4
5
6
7
8
9
10
100 200 300 400 500 600 700 800 900 1000 1100 1200 1300 1400 1500 1600 1700 1800 1900 2000
Urban population Total population
Billion
Years
Note: Vertical bar indicates projection after year 2010.Source: Data on total population between year 100 and 1940 from Kremer (1993), data on urban population between year 100 and 1925 from Graumann (1977), and data from 1950 to 2050 from (UN DESA, 2014) using UN DESA’s medium fertility scenario from 2010 onwards.12 http://dx.doi.org/10.1787/888933350538
The magnitude of the current wave of urbanisation calls for a more environment-friendly and less resource-consuming process than in the past. In China, as in several OECD countries, rapid urbanisation has come with environmental degradation proportional to development and poverty reduction: 12 of the 20 most polluted cities in the world are located in China, and about 90% of rivers around urban areas are seriously polluted (World Bank, 2007; Zheng and Khan, 2013). In addition, Africa’s urbanisation is taking place in a resource and climate-constrained world unknown to earlier urbanisation (Swilling, 2015; Currie et al., 2015). Ensuring that the ongoing wave of urbanisation is more sustainable than in the past is of strategic importance to Africa and to the world at large.
As Asia, Africa is urbanising twice as fast as did Europe. It took Europe 110 years to move from 15% urban in 1800, to 40% in 1910. Africa has achieved the same transformation in almost half the time: 60 years. Africa’s urbanisation is estimated to have gained 5.9 percentage points between 2000 and 2015, second only to Asia, which gained 10.7 percentage points during the same period. In 2015, almost 472 million Africans lived in urban areas (authors’ calculations based on UN DESA, 2014).
Even more striking is the rapid growth of Africa’s urban population in absolute terms, or without relating urban growth to rural population growth (see Box 6.1). The size of Africa’s urban population nearly doubled in 20 years from 237 million in 1995 to 472 million in 2015. Africa’s urban population is expected to almost double again between 2015 and 2035. Not so long ago, in 1990, Africa was the world’s region with the smallest number of urban dwellers: 197 million. Soon, in 2020, Africa is forecasted to have the second highest number of urban dwellers (560 million) after Asia (2 348 million).

6. tHE iMPliCAtiONS OF AFriCA’S UrBANiSAtiON FOr StrUCtUrAl trANSFOrMAtiON
148 African Economic Outlook © AfDB, OECD, UNDP 2016
Box 6.1. Definitions of urban areas, various agglomerations, urbanisation and urban population growth
The official definitions of urban areas vary across African countries (Figure 6.3). Thirty-five African countries define an urban area by population size, however the size varies. The threshold is between 1 500 to 3 000 inhabitants in 16 countries; 5 000 inhabitants in 11 countries; 10 000 inhabitants in 5 countries; 20 000 in Nigeria and 30 000 in Mali. Twenty-four countries define their urban areas according to administrative or political criteria, whereas for 11 countries the definition takes into account the presence of non-agricultural activities. Socio-economic activity defines urban areas for only 9 countries, while infrastructure is less commonly used in the national definitions. The lack of a single, accurate definition hinders collecting and tabulating urban statistics and prevents harmonised comparisons at regional and international levels (AfDB/OECD/UNDP, 2015). This report uses urbanisation data from UN DESA’s World Urbanization Prospects (2014), which is based on official data produced by national statistical offices.
Figure 6.3. Definitions of urban across 54 African countries
0 5 10 15 20 25 30 35 40
Infrastructure
Socio-economicactivity
Share of non-agriculturalactivities
Administrativedemarcation
Population size
Number of countries
Source: Authors’ classification based on UN DESA (2014).12 http://dx.doi.org/10.1787/888933350541
Urban agglomerations carry various names, often depending on their size. Cities usually refer to large urban agglomerations; they can be big, intermediate or small. Towns refer to even smaller urban agglomerations and villages to the smallest. It is noteworthy, however, that no objective threshold exists and that the distinction between city and town is more common in the English language than in French and Portuguese, the other languages in which this report is published. A megacity is an urban agglomeration with a population of 10 million people or more, and a megalopolis a large agglomeration of adjacent urban centres. A conurbation is an urban agglomeration composed of several cities, initially separated by rural areas, whose growth has overlapped while remaining administratively independent. An urban corridor links cities of different sizes through transport and economic axes. Urban settlement is an all-encompassing category without reference to size.
Urbanisation differs from urban population growth. Urbanisation is the increase in the share of a country’s total population living in urban areas. It is typically measured as the level showing the percentage of a country’s total population that is urbanised. Deep changes accompany this increase, notably economic, social and environmental ones (see Box 6.2). Urban population growth is the absolute growth in a country’s urban population. A country does not urbanise when urban population growth is lower than rural population growth.
Contrary to widely-held assumptions, Africa is urbanising fast mainly because towns and intermediate cities are growing. Between 2000 and 2010, urban agglomerations with fewer than 300 000 inhabitants accounted for 58% of Africa’s urban growth; agglomerations with 300 000-1 million inhabitants only 13%; and those with over
6. tHE iMPliCAtiONS OF AFriCA’S UrBANiSAtiON FOr StrUCtUrAl trANSFOrMAtiON6. tHE iMPliCAtiONS OF AFriCA’S UrBANiSAtiON FOr StrUCtUrAl trANSFOrMAtiON
149African Economic Outlook© AfDB, OECD, UNDP 2016148 African Economic Outlook © AfDB, OECD, UNDP 2016
1 million inhabitants 29%. Between 2010 and 2030, the small agglomerations are forecasted to make up 51% of the urban growth; the intermediate ones 16%; and the biggest 33%.
Africa’s fast pace of urbanisation and urban growth contrasts with the slow pace of structural transformation, as the next sub-section shows. Urbanisation and structural transformation have not been mutually supportive in many African economies.
Urbanisation is part of structural transformation
Economic theory since Adam Smith and Alfred Marshall has long analysed the links between development and urbanisation. Early “dual economy” models viewed urbanisation as a process of rural-urban migration where surplus agricultural workers moved from rural areas into more productive jobs in modern urban industries and services (Haggblade, Hazell and Brown, 1989; Fei and Ranis, 1963; Johnston and Mellor, 1961; Lewis, 1954). Labour-saving technologies and rising agricultural productivity through a “green revolution” can push surplus agricultural workers away from traditional activities in rural areas (Gollin, Parente and Rogerson, 2002). Cities provide a large and diversified pool of labour, a more dynamic local market, more cost-effective access to suppliers and specialised services, lower transaction costs, more diversified contact networks and greater knowledge-sharing opportunities, and an environment that encourages innovation (Krugman, 1991; Spence, 2012; World Bank, 2009; AfDB, 2010).
Box 6.2. Definition of structural transformation
In its economic sense, structural transformation is the process of moving economic resources from low to higher productivity activities (AfDB/OECD/UNDP/UNECA, 2013). Its basic mechanics entail a push factor away from traditional agriculture best described as a “green revolution” and a pull factor into higher productivity manufacturing or services best known as an “industrial revolution”. Structural transformation involves moving away from low-productivity agriculture and re-allocating economic resources to higher productivity activities. The process may also happen within a single sector such as agriculture.
Structural transformation brings about deep changes to societies. In particular, it entails urbanisation and a reduction in total fertility ratios. Fertility ratios fall as people acquire more education, earn higher incomes and live in denser environments (Timmer and Akkus, 2008). Dysfunctions will inevitably be part of such radical transformations. In various regions of the world, these processes have not been linear.
Big and small cities can benefit from agglomeration economies by using fewer resources to support a larger population. Increasing returns from agglomeration makes cities more attractive. Cities offer cultural vibrancy and diverse choices for services. This attractiveness further draws talents and investments, creating a virtuous circle of urbanisation and development. These advantages allow cities to increase productivity and hence economic gains through three broad functions: matching, sharing and learning (Kayizzi-Mugerwa, Shimeles and Yaméogo, 2014; Turok, 2014; Duranton and Puga, 2004):
• First, cities help firms match their unique requirements for labour, material inputs and premises better than towns. Larger markets bring more choices and opportunities.
• Second, cities afford firms access to a wider range of shared services and infrastructure because of the scale of activity.
• Third, firms gain from the superior flow of information in cities, which promotes more learning and innovation and results in higher value-added products and processes.
Hence, industrialised countries have gone through an urbanisation process. Globally, urbanisation closely relates to national income: all countries that pass the USD 10 000 per capita threshold are at least 50% urbanised (Figure 6.4).

6. tHE iMPliCAtiONS OF AFriCA’S UrBANiSAtiON FOr StrUCtUrAl trANSFOrMAtiON
150 African Economic Outlook © AfDB, OECD, UNDP 2016
Figure 6.4. Global urbanisation levels and GDP per capita in selected countries, 2014
0
25
50
75
100
0 10 000 20 000 30 000 40 000 50 000 60 000 70 000 80 000
Size of population Fitted line for high-income countries
% of urban to total population
GDP per capita, USD 2005 (PPP)
Brazil
China
DRC
Germany
Egypt
Ethiopia
France
United Kingdom
Indonesia
India
Iran Italy
JapanKorea
Mexico
Nigeria
Russian Federation
Thailand
Turkey
Tanzania
United States
Viet Nam
South Africa
Note: Exponential fit line for high income countries. Each bubble reflects the size of a country’s total population.Source: UN DESA (2014) and World Bank (2015).12 http://dx.doi.org/10.1787/888933350555
However, urbanisation is a necessary but insufficient condition for structural transformation. Many countries that are more than 50% urbanised still have low-income levels. Urbanisation per se does not bring economic growth, though concentrating economic resources in one place can bring benefits (Henderson, 2003). Further, rapid urbanisation does not necessarily correlate with fast economic growth: Gabon has a high annual urbanisation rate at 1 percentage point despite a negative annual economic growth rate of -0.6% between 1980 and 2011 (Chen M. et al., 2014).
In addition, the benefits of agglomeration greatly depend on the local context, including the provision of public goods. Public goods possess non-rivalry and non-excludable benefits. Lack of sufficient public goods or their unsustainable provision can impose huge costs on third parties who are not necessarily involved in economic transactions. Congestion, overcrowding, overloaded infrastructure, pressure on ecosystems, higher costs of living, and higher labour and property costs can offset the benefits of concentrating economic resources in one place. These negative externalities tend to increase as cities grow. This is especially true if urban development is haphazard and public investment does not maintain and expand essential infrastructure. Dysfunctional systems, gridlocks, power cuts and insecure water supplies increase business costs, reduce productivity and deter private investment. In OECD countries, cities beyond an estimated 7 million inhabitants tend to generate such diseconomies of agglomeration (OECD, 2006). Hence, the balance between agglomeration economies and diseconomies may have an important influence on whether city economies continue to grow, stagnate or begin to decline.
OECD experiences demonstrate that many different patterns of urbanisation can lead to structural transformation, such as industrialisation. Urban structures have varied a great deal among OECD countries; there is no one-size-fits-all pattern. In several countries, primate cities like London and Paris dominate the urban networks. Other countries such as Germany or Italy have more balanced urban networks where intermediary cities, such as Stuttgart or Turin, have driven industrialisation. Moreover, rural regions can grow faster than urban ones. Between 1995 and 2007, OECD regions with lower levels of development tended to grow faster than richer regions, suggesting a catching-up growth process (OECD, 2012a). In Italy, clusters of small and medium enterprises in intermediary cities fostered industrialisation through specialising in closely related industries and forming interconnected production networks.

6. tHE iMPliCAtiONS OF AFriCA’S UrBANiSAtiON FOr StrUCtUrAl trANSFOrMAtiON6. tHE iMPliCAtiONS OF AFriCA’S UrBANiSAtiON FOr StrUCtUrAl trANSFOrMAtiON
151African Economic Outlook© AfDB, OECD, UNDP 2016150 African Economic Outlook © AfDB, OECD, UNDP 2016
Structural transformation has been slow in a context of changing employment patterns
Weak linkages between urbanisation and structural transformation are observable in many regions of the world, though most recent examples are found in Africa and Latin America (UN-Habitat and UNECA, 2015). Previous editions of the African Economic Outlook have documented the slow pace of structural transformation in a majority of African economies, notably when compared with Asia’s performance (AfDB/OECD/UNDP, 2013; AfDB/OECD/UNDP, 2015; see also McMillan and Harttgen, 2014). Figure 6.5 puts this comparison in perspective by showing the paces of urbanisation and structural transformation in 3 regional samples: although the 11 African countries are urbanising at a comparable speed to the 11 countries from Asia, labour productivity has been progressing more slowly; the 9 Latin American countries have experienced faster urbanisation but even slower structural change than the African ones.
Figure 6.5. Annualised labour productivity growth and urbanisation in Africa, Asia and Latin America, 1960-2010
0
0.2
0.4
0.6
0.8
-2
-1
0
1
2
3
4
5
1960-75 1975-90 1990-2000 2000-10 1960-75 1975-90 1990-2010 1960-75 1975-90 1990-2010
6
7
8
1.2 0.2
0.30.5 0.6 0.7 0.5 0.8 0.4
-0.1
1.7
-0.4
0.8
3.6
2.12.7 3.1
1.6
-1.3
1
Structural change Within-productivity growth Annual percentage point change in urbanisation level
Annual productivity growth (%) Annualised percentage point change in urbanisation level
Africa Asia Latin America
Note: The following countries are included in Africa: Botswana, Ethiopia, Ghana, Kenya, Malawi, Mauritius, Nigeria, Senegal, South Africa, Tanzania and Zambia. Asia: China, Hong Kong (China), India, Indonesia, Japan, Korea, Malaysia, Philippines, Singapore, Taiwan and Thailand. Latin America: Argentina, Bolivia, Brazil, Chile, Colombia, Costa Rica, Mexico, Peru and Venezuela. “Within-productivity growth” refers to gains incurred within existing economic activities through capital accumulation or technological change. “Structural change” is incurred from reallocation of labour from low-productivity to high-productivity activities which increases aggregate labour productivity of the economy. Although this analysis uses a ten-sector categorisation with a longer time frame than AfDB/OECD/UNDP/UNECA (2013) albeit with less African countries (11 vs. 19), the final results of the two analyses are consistent.Source: Structural change figures adapted from Figure 1 and Figure 2 in De Vries et al. (2015) and urbanisation data computed from UN DESA (2014).12 http://dx.doi.org/10.1787/888933350566
The quasi halt of industrialisation in many African countries at the end of the 20th century seems to be a turning point. De Vries, Timmer and de Vries (2015) show that, following independence, manufacturing employment progressed quickly in Africa, from 4.7% in 1960 to 7.8% in 1975. During this period, urbanisation levels increased by 0.40 percentage points a year. The development trajectory thus seemed to follow the classic dual economic model explained above. Between 1975 and 1990, however, political and economic turmoil wiped out the nascent manufacturing sector while urbanisation continued. Structural change slowed down, as services kept absorbing workers released from agriculture, but with much lower returns than industry. With Africa’s growth picking up considerably since the early 2000s, structural change has become positive again, albeit still at a slower pace than in Asia.

6. tHE iMPliCAtiONS OF AFriCA’S UrBANiSAtiON FOr StrUCtUrAl trANSFOrMAtiON
152 African Economic Outlook © AfDB, OECD, UNDP 2016
Many countries seem to be by-passing the manufacturing stage altogether in favour of services and risk the consequences of premature deindustrialisation. The sub-Saharan services sector grew from 47% of gross domestic product (GDP) in 1965 in aggregate to 58% in 2014, absorbing the bulk of growth in labour force in the process. Large-scale reallocation into services traditionally occurs in post-industrialised countries owing to the faster growth of labour-saving technologies in manufacturing and demand shifts away from manufactured products (Figure 6.6). There are thus concerns that African countries – and today’s developing countries at large – are moving into the service sector too early without having gone through a proper experience of industrialisation (Rodrik, 2015). “Premature deindustrialisation” may affect future growth prospects, because industrialisation is the most efficient path to sustained growth and economic convergence.
Figure 6.6. Traditional and new patterns of transformation between sectors and type of employment
Agriculture Manufacturing Services
Informal
Organised
A. Traditional pattern B. New patterns
Agriculture Manufacturing Services
Informal
Organised
Source: Adapted from Rodrik (2014).
Farmers may prefer to move into traditional or informal urban services because urban informal work is often more productive than agricultural work, even if considerably less productive than formal employment. In Ghana, the differential between urban informal work and rural farming work was estimated at 2:1 (Spence, Clarke Annez and Buckley, 2009: xiv). This productivity gap largely benefits the trade, hotel and restaurant service sector, which is the largest service sector and mostly consists of informal, micro and small enterprises such as hawkers and convenience shops. Hence, Figure 6.7 shows that, in 9 out of 13 African countries, a decrease in agricultural employment between 2000 and 2010 was related to the increase in employment in the trade, hotel and restaurant service sector (formal and informal services included).
Figure 6.7. Change in employment in trade services and agriculture in 13 African countries, 2000-10
10
-2
-3
0
2
4
6
8
-3 0 3 6 9 12 1815
Percentage point increase in trade employment share
Percentage point decrease in agricultural employment share
Botswana
Egypt
Ethiopia
Ghana
Kenya
Morocco
Mauritius
Malawi
Nigeria
SenegalTanzania
Zambia
South Africa
Note: The size of the bubble reflects the relative share of the country’s labour force in trade employment in 2000.Source: Authors’ calculations based on the GGDC 10-sector database (Timmer, de Vries and de Vries, 2014).12 http://dx.doi.org/10.1787/888933350585
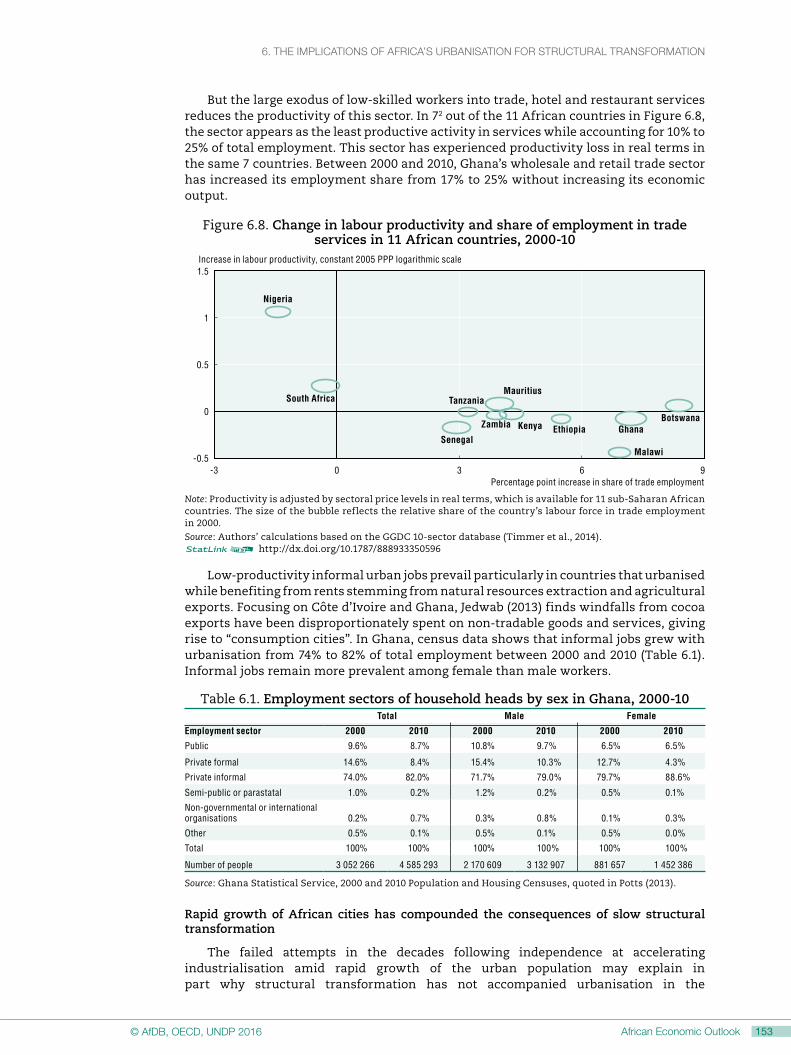
6. tHE iMPliCAtiONS OF AFriCA’S UrBANiSAtiON FOr StrUCtUrAl trANSFOrMAtiON6. tHE iMPliCAtiONS OF AFriCA’S UrBANiSAtiON FOr StrUCtUrAl trANSFOrMAtiON
153African Economic Outlook© AfDB, OECD, UNDP 2016152 African Economic Outlook © AfDB, OECD, UNDP 2016
But the large exodus of low-skilled workers into trade, hotel and restaurant services reduces the productivity of this sector. In 72 out of the 11 African countries in Figure 6.8, the sector appears as the least productive activity in services while accounting for 10% to 25% of total employment. This sector has experienced productivity loss in real terms in the same 7 countries. Between 2000 and 2010, Ghana’s wholesale and retail trade sector has increased its employment share from 17% to 25% without increasing its economic output.
Figure 6.8. Change in labour productivity and share of employment in trade services in 11 African countries, 2000-10
-0.5
0
0.5
1
1.5
-3 0 3 6 9Percentage point increase in share of trade employment
BotswanaEthiopia GhanaKenya
Malawi
Mauritius
Nigeria
Senegal
South Africa Tanzania
Zambia
Increase in labour productivity, constant 2005 PPP logarithmic scale
Note: Productivity is adjusted by sectoral price levels in real terms, which is available for 11 sub-Saharan African countries. The size of the bubble reflects the relative share of the country’s labour force in trade employment in 2000.Source: Authors’ calculations based on the GGDC 10-sector database (Timmer et al., 2014). 12 http://dx.doi.org/10.1787/888933350596
Low-productivity informal urban jobs prevail particularly in countries that urbanised while benefiting from rents stemming from natural resources extraction and agricultural exports. Focusing on Côte d’Ivoire and Ghana, Jedwab (2013) finds windfalls from cocoa exports have been disproportionately spent on non-tradable goods and services, giving rise to “consumption cities”. In Ghana, census data shows that informal jobs grew with urbanisation from 74% to 82% of total employment between 2000 and 2010 (Table 6.1). Informal jobs remain more prevalent among female than male workers.
Table 6.1. Employment sectors of household heads by sex in Ghana, 2000-10 Total Male Female
Employment sector 2000 2010 2000 2010 2000 2010
Public 9.6% 8.7% 10.8% 9.7% 6.5% 6.5%
Private formal 14.6% 8.4% 15.4% 10.3% 12.7% 4.3%
Private informal 74.0% 82.0% 71.7% 79.0% 79.7% 88.6%
Semi-public or parastatal 1.0% 0.2% 1.2% 0.2% 0.5% 0.1%
Non-governmental or international organisations 0.2% 0.7% 0.3% 0.8% 0.1% 0.3%
Other 0.5% 0.1% 0.5% 0.1% 0.5% 0.0%
Total 100% 100% 100% 100% 100% 100%
Number of people 3 052 266 4 585 293 2 170 609 3 132 907 881 657 1 452 386
Source: Ghana Statistical Service, 2000 and 2010 Population and Housing Censuses, quoted in Potts (2013).
Rapid growth of African cities has compounded the consequences of slow structural transformation
The failed attempts in the decades following independence at accelerating industrialisation amid rapid growth of the urban population may explain in part why structural transformation has not accompanied urbanisation in the

6. tHE iMPliCAtiONS OF AFriCA’S UrBANiSAtiON FOr StrUCtUrAl trANSFOrMAtiON
154 African Economic Outlook © AfDB, OECD, UNDP 2016
case of most African countries, particularly in sub-Saharan countries. Natural demographic growth in urban areas has prevailed over economic migration of a working-age labour force from rural areas. This has outstripped the capacities of cities to provide productive economic opportunities and services.
Urban fertility remains much higher than in Asia and contributes to the majority of urban growth in Africa (Figure 6.9). While Africa’s urbanisation rate has been second to Asia’s, Africa’s urban population growth rate was the world’s fastest at 4% between 1960 and 2010. In 2010-14, the urban fertility rate remains at more than five children per woman in Burundi, the Democratic Republic of the Congo (DRC), Mali, Niger and Nigeria. To illustrate, a family of 4 rural migrants in 1960 would have become a family of 43 in 2010 at sub-Saharan Africa’s annual increase of 2.9%, compared with 24 at Asia’s increase of 1.7% (Jedwab, Christiaensen and Gindelsky, 2015).
Figure 6.9. Urban growth rates for selected African countries and Asia, 1960-2010
-1
0
1
2
3
4
5
6
7
Migration residual Urban natural increase
Annual urban growth (%)
Tunis
ia
Egyp
t
Algeria
Seneg
al
Ghana
Côte d'
Ivoire
Madag
asca
r
Kenya
Ethiop
ia
Burkin
a Fas
o Mali
Malawi
Centra
l Afri
can R
epub
lic
Africa
n ave
rage
Asian a
verag
e
Note: The Asian average includes 12 countries: Bangladesh, China, India, Indonesia, Japan, Malaysia, Myanmar, Pakistan, Philippines, Korea, Sri Lanka and Thailand. The African average is a simple average of the 13 African countries in the sample.Source: Adapted from Web Appendix Table 3 in Jedwab, Christiaensen and Gindelsky (2015).12 http://dx.doi.org/10.1787/888933350602
The contribution of migration to Africa’s urbanisation has decreased. Migration from rural areas accounted for at least half of all urban growth in sub-Saharan Africa during the 1960s and 1970s but about 25% of urban growth in the 1980s and 1990s (Brockerhoff, 1995).3 Rural-urban migration accounts for less than a third of urban population growth in 22 African countries. It accounts for over 50% in only 7 African countries (Burkina Faso, Cabo Verde, Lesotho, Namibia, Rwanda, Seychelles and South Africa), whereas it contributed to half of Asia’s urban population growth (Potts, 2009; Tacoli, McGranahan and Satterthwaite, 2015). Dissatisfaction with local public services has been one of the main reasons why Africans migrate to urban areas; this differs from Asia and Latin America where better employment opportunities attract people to cities (Dustmann and Okatenko, 2014; AfDB/OECD/UNDP, 2015). Changing weather patterns, land pressures, conflict and natural disasters also push African rural dwellers to urban areas (Box 6.5).
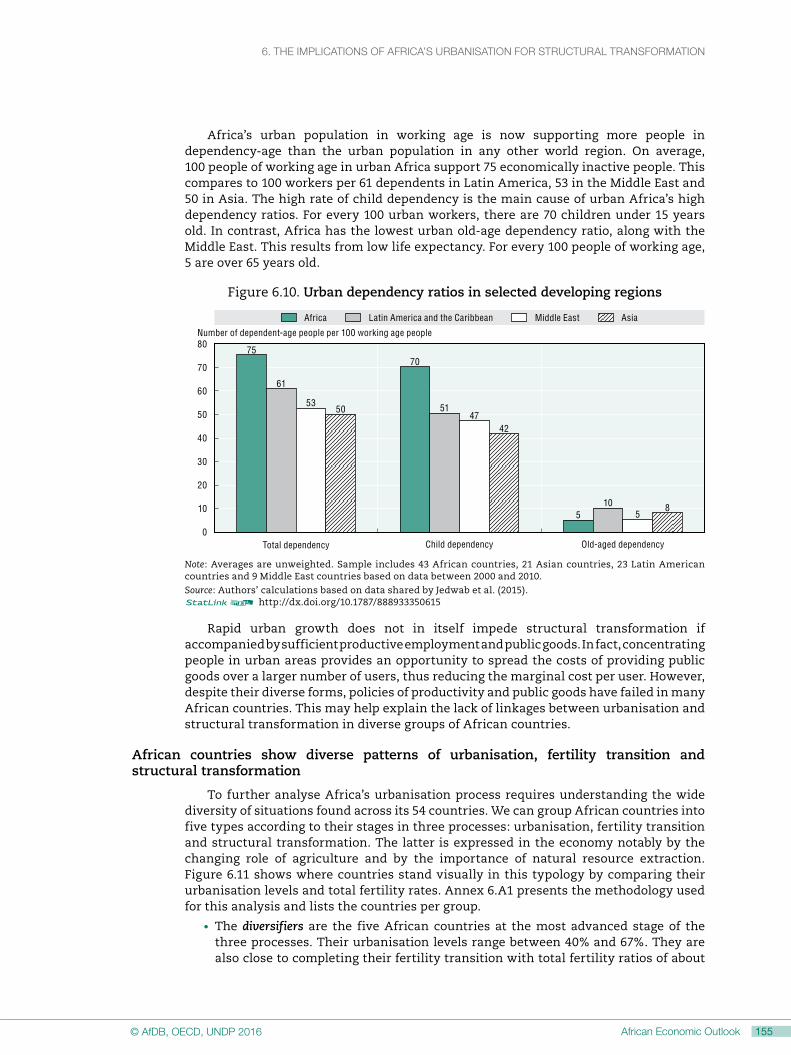
6. tHE iMPliCAtiONS OF AFriCA’S UrBANiSAtiON FOr StrUCtUrAl trANSFOrMAtiON6. tHE iMPliCAtiONS OF AFriCA’S UrBANiSAtiON FOr StrUCtUrAl trANSFOrMAtiON
155African Economic Outlook© AfDB, OECD, UNDP 2016154 African Economic Outlook © AfDB, OECD, UNDP 2016
Africa’s urban population in working age is now supporting more people in dependency-age than the urban population in any other world region. On average, 100 people of working age in urban Africa support 75 economically inactive people. This compares to 100 workers per 61 dependents in Latin America, 53 in the Middle East and 50 in Asia. The high rate of child dependency is the main cause of urban Africa’s high dependency ratios. For every 100 urban workers, there are 70 children under 15 years old. In contrast, Africa has the lowest urban old-age dependency ratio, along with the Middle East. This results from low life expectancy. For every 100 people of working age, 5 are over 65 years old.
Figure 6.10. Urban dependency ratios in selected developing regions
7570
5
61
51
10
5347
5
50
42
8
0
10
20
30
40
50
60
70
80
Africa Latin America and the Caribbean Middle East Asia
Number of dependent-age people per 100 working age people
Total dependency Child dependency Old-aged dependency
Note: Averages are unweighted. Sample includes 43 African countries, 21 Asian countries, 23 Latin American countries and 9 Middle East countries based on data between 2000 and 2010.Source: Authors’ calculations based on data shared by Jedwab et al. (2015).12 http://dx.doi.org/10.1787/888933350615
Rapid urban growth does not in itself impede structural transformation if accompanied by sufficient productive employment and public goods. In fact, concentrating people in urban areas provides an opportunity to spread the costs of providing public goods over a larger number of users, thus reducing the marginal cost per user. However, despite their diverse forms, policies of productivity and public goods have failed in many African countries. This may help explain the lack of linkages between urbanisation and structural transformation in diverse groups of African countries.
African countries show diverse patterns of urbanisation, fertility transition and structural transformation
To further analyse Africa’s urbanisation process requires understanding the wide diversity of situations found across its 54 countries. We can group African countries into five types according to their stages in three processes: urbanisation, fertility transition and structural transformation. The latter is expressed in the economy notably by the changing role of agriculture and by the importance of natural resource extraction. Figure 6.11 shows where countries stand visually in this typology by comparing their urbanisation levels and total fertility rates. Annex 6.A1 presents the methodology used for this analysis and lists the countries per group.
• The diversifiers are the five African countries at the most advanced stage of the three processes. Their urbanisation levels range between 40% and 67%. They are also close to completing their fertility transition with total fertility ratios of about

6. tHE iMPliCAtiONS OF AFriCA’S UrBANiSAtiON FOr StrUCtUrAl trANSFOrMAtiON
156 African Economic Outlook © AfDB, OECD, UNDP 2016
three or fewer children per woman. These countries are Egypt, Mauritius, Morocco, South Africa and Tunisia. This group has Africa’s highest level of income (above USD 10 000 gross national income [GNI] per capita in 2013 with the exception of Morocco) and of human development (with a Human Development Index [HDI] value above 0.60).4 Between 1960 and 2010, a natural increase in the population drove urban growth in Egypt and Morocco. These two countries are more advanced in their structural transformation. Agriculture generates less than 16% of gross domestic product (GDP) and manufacturing 13-18% of GDP. The main challenge for these countries is to increase both productivity and economic complexity, as they have not yet been able to transition to sophisticated manufacturing. Indeed, the share of manufacturing in GDP peaked for all five countries in the diversifiers’ group during the late 1980s and the 1990s and has since declined. Several countries have de-industrialised significantly. For example, South Africa’s manufacturing workforce has shrunk from 16.8% of total employment in 1981 to 11.6% in 2011, shifting towards services; the size of its manufacturing sector decreased from 23.6% in 1990 to 13.3% of GDP in 2014.
• The early urbanisers are seven countries that have made progress in their urbanisation and fertility transition without having been able to diversify their economic base. Mostly found in West Africa, they include Côte d’Ivoire, Ghana and Senegal. These countries are about 35-50% urbanised and have total fertility ratios of about five children per woman. They are typically low- to lower-middle income countries (USD 1 000-4 000 GNI per capita in 2013), with low-to-medium levels of human development (HDI values between 0.40 and 0.57). Between 1960 and 2010, both migration and natural population increase have driven their urban growth. Migration out of agriculture has pushed the labour force to urban areas. Yet the manufacturing sector is small, 2%-14% of GDP, and can hardly absorb the high proportion of unskilled labour. The urban informal services sector has grown significantly. The common challenge for these early urbanisers is to break into higher value activities particularly in the urban formal sector. They should focus on manufacturing that can absorb a low-skilled labour force, pursue ambitious education policies, develop higher value-added urban services, further raise agricultural productivity and continue their demographic transition.
• The late urbanisers are eight countries that are predominantly rural yet have begun their urbanisation and fertility transition and structural transformation more recently. They are located in East Africa and include Ethiopia, Kenya and Tanzania. Less than a third of their population typically lives in urban areas. Their total fertility rates are four to six children per woman. Income levels are low (USD 1 000-3 500 GNI per capita in 2013), and levels of human development are low-to-medium (HDI values between 0.38 and 0.54). Manufacturing makes up less than 4-12% of GDP. While starting from a low base, several of these countries including Ethiopia and Rwanda have positively transformed their economic structures within the past ten years. These are the main challenges for the late urbanisers: continue to improve their infrastructures, particularly transportation linking different urban growth centres, break into manufacturing and higher value services as they continue to move out of agriculture, urbanise, and accelerate their demographic transition. Developing a network of intermediary cities can support the rapid urbanisation that is currently taking place.
• The agrarians are nine pre-dominantly rural countries that are still at a very early stage of their urbanisation and fertility transition. Many agrarian countries are landlocked, such as Niger, Chad and Malawi. Typically less than a third of

6. tHE iMPliCAtiONS OF AFriCA’S UrBANiSAtiON FOr StrUCtUrAl trANSFOrMAtiON6. tHE iMPliCAtiONS OF AFriCA’S UrBANiSAtiON FOr StrUCtUrAl trANSFOrMAtiON
157African Economic Outlook© AfDB, OECD, UNDP 2016156 African Economic Outlook © AfDB, OECD, UNDP 2016
the population resides in urban areas, and women have on average at least six children. These countries’ income levels did not exceed USD 1 900 GNI per capita in 2013, and they have low levels of human development (HDI values between 0.48 and 0.34). Their economies are predominantly agriculture-based: agriculture makes up 25-58% of their GDP and manufacturing 4-12%. For these countries, a natural population increase drove urban population growth between 2000 and 2010. Though rural-urban migration may increase as they are now starting their urban transition, their urban economies have not developed enough to attract much rural migration to urban areas. The agrarian countries are challenged to begin the structural transformation process more decisively by raising agricultural productivity and engaging in a well-planned urbanisation process. Once they have accelerated structural transformation, they will likely start the fertility transition.
• The natural resources-based countries have urbanised with windfalls from natural resources, which have attracted labour out of agriculture. Compared with other countries at similar income levels, these 13 countries show a higher degree of urbanisation (40-78%), generally higher fertility rates and a high degree of urban primacy with the capital usually disproportionally bigger than other cities. The share of GDP in agriculture is low at 3-21%. These countries exhibit huge variations in income levels (USD 500-20 000 per capita), in the types of natural resources they produce (e.g. hydrocarbons, minerals and metals) and in their geography (e.g. Libya is predominantly arid while Nigeria is mostly rain-fed). Their common challenges are to use their competitive advantage in international trade to diversify their economic base away from natural resources and to decrease fertility particularly in urban areas. However, they currently need specific policies to face the adverse global conditions of lower commodity prices.
Figure 6.11. Urbanisation levels and total fertility rate by typology of African countries
0
1
2
3
4
5
6
7
9
8
10 20 30 40 50 60 70 80 90
Diversifiers Early urbanisers Late urbanisers Agrarians Natural resources-based
Total fertility rate, 2010-15
Urbanisation level (%), 2015
EGY
MUS
BWA MAR
ZAFTUN DZA
LBY
GAB
COGMRTBEN
LBR CIV CMR
GHA
SEN
TGO
CAF
ERI
ETH
KEN MDG
MOZ
RWA
SLE SDN
TZA
BFA
BDI
MWI
MLI
NER
UGA AGO
TCD COD
GIN
NGA
SOM
SSD ZMB
ZWE Late urbanisers
Early urbanisers
Agrarians
Diversifiers
Note: Natural resources-based countries are not clustered in the figure because they are more scattered across the board. The history and ability of states to invest resource rents can have implications for their development.Source: UN DESA (2015, 2014). 12 http://dx.doi.org/10.1787/888933350624

6. tHE iMPliCAtiONS OF AFriCA’S UrBANiSAtiON FOr StrUCtUrAl trANSFOrMAtiON
158 African Economic Outlook © AfDB, OECD, UNDP 2016
Rural areas and towns remain pillars of Africa’s urbanisation
As seen above, urbanisation is not synonymous with the decline of agriculture, let alone of the broader rural economy. In most cases, agricultural output continues to grow – though at a slower pace – and accompanies the rise of industry and higher-value-added services as a share of GDP. Some rural regions may even develop faster than some urban ones.
Africa’s urbanisation is not a breakaway from its rural areas for many reasons. First, slow structural transformation, continued demographic growth in the countryside and declining migration flows to big cities mean that rural areas remain pillars of many African countries. Second, urbanisation holds new promise for rural areas by providing greater demand for rural products, upgrading the agricultural supply chain and enhancing the rural factor market (see Chapter 7 for a more detailed discussion). Third, the traditional divides between rural and urban areas have increasingly blurred: almost three-fourths of Africa’s population lives within a rural-urban interface made up of rural areas and cities with fewer than 500 000 inhabitants. Fourth, those trends are not linear and demand careful analysis. Several countries for instance have experienced a deceleration of urbanisation or even de-urbanisation episodes.
Rural population growth will abate only slowly
A characteristic of African urbanisation is that rural population growth will abate only slowly. Except in the diversifiers’ group, most of Africa’s rural areas are not emptying fast (AfDB/OECD/UNDP, 2015; OECD 2016). Thus, while Africa urbanises, its rural population will continue to grow at a rate of more than 1% per annum beyond 2045. Sub-Saharan Africa is expected to grow by more than 353 million additional rural dwellers between 2015 and 2050. Continuing rural population growth in most of sub-Saharan Africa contrasts with other world regions. Globally, rural population is forecasted to start shrinking no later than by 2020. Figure 6.12 shows that sub-Saharan Africa is the region of the world where the rural population will continue to grow the most (in stark contrast to Latin America and the Caribbean).
Figure 6.12. Population increase in North and sub-Saharan Africa, and in Latin America and the Caribbean, 1950-2050
0
200
400
600
800
1 000
1 200
1950
1955
1965
1975
1985
1995
2005201
52025
20352045
1960
1970
1980
1990
2000201
02020
20302040
20500
200
400
600
800
1 000
1 200
1950
1955
1965
1975
1985
1995
2005201
52025
20352045
1960
1970
1980
1990
2000201
02020
20302040
2050
North Africa Latin America and the CaribbeanSub-Saharan Africa
Million Million
A. Urban population B. Rural population
Source: Authors’ calculations based on UN DESA (2014).12 http://dx.doi.org/10.1787/888933350635

6. tHE iMPliCAtiONS OF AFriCA’S UrBANiSAtiON FOr StrUCtUrAl trANSFOrMAtiON6. tHE iMPliCAtiONS OF AFriCA’S UrBANiSAtiON FOr StrUCtUrAl trANSFOrMAtiON
159African Economic Outlook© AfDB, OECD, UNDP 2016158 African Economic Outlook © AfDB, OECD, UNDP 2016
The growth of towns and intermediary cities has strengthened the reciprocal linkages between rural and urban development
While the debate on urbanisation often focuses on big cities, urbanisation has actually been happening mostly in a rural-urban interface. A continuum of rural areas, villages, towns and cities of fewer than 500 000 inhabitants make up this interface.5
Figure 6.13 shows that the rural-urban interface remains important all over Africa, particularly for the late urbanisers and agrarian countries where it has absorbed over 90% of total population growth.
Figure 6.13. Contribution to population growth by city size and rural-urban interface by type of African country, 2000-10
0
10
20
30
40
50
60
70
80
90
100
36 36
6472
38
2339
2719
40
41
25
9 922
Population growth from rural areas, 2000-10 Population growth from urban areas < 500 000 inhabitants, 2000-10
Population growth from cities > 500 000 inhabitants, 2000-10
% of total population growth
Diversi
fiers
Early u
rban
isers
Late ur
banis
ers
Agrari
ans
Natural
resou
rces-b
ased
Note: The countries in each group are listed in Annex 6.A1.Source: Authors’ calculations based UN DESA (2014).12 http://dx.doi.org/10.1787/888933350645
Over 952 million Africans, 82% of Africa’s population, live at such a rural-urban interface. Across the different regions, the share of the population living in settlements smaller than 500 000 inhabitants is as follows: 91% in East Africa, 80% in West Africa, 77% in North Africa, 74% in Central Africa and 65% in Southern Africa. Looking at all of Africa’s urban areas, 55% have a population of fewer than 500 000 people. Africa’s urbanisation has thus to a large extent taken the form of “urban villages”, diffusing urban growth in smaller towns. In 2010, the growth of cities of fewer than 500 000 inhabitants was second to that of the largest cities. The magnitude of this rural-urban interface shows that most Africans retain a close relationship with rural areas.
Box 6.3. Settlement dynamics in West Africa
Urbanisation is the most spectacular manifestation of West African settlement dynamics witnessed in past decades. Between 1950 and 2010, the region’s total population increased by a factor of four (from 72 to 320 million), while its urban population increased by a factor of 22 (from 6 to 133 million). West Africa now counts 1 950 urban agglomerations with more than 10 000 inhabitants. The average distance between cities has been reduced from 111 kilometres to 28 (OECD, 2016). In 2000, 94% of high-density rural areas were located in the urban catchment area of towns with at least 50 000 inhabitants (OECD, 2013; see Map 6.1). Those rural areas, which averaged more than 51 inhabitants per km2, accounted for 58% of the total rural population.

6. tHE iMPliCAtiONS OF AFriCA’S UrBANiSAtiON FOr StrUCtUrAl trANSFOrMAtiON
160 African Economic Outlook © AfDB, OECD, UNDP 2016
Box 6.3. Settlement dynamics in West Africa
Settlement dynamics in West African towns and intermediary cities show that urban and rural populations are moving ever closer together, as documented in the Africapolis database updated by the Sahel and West Africa Club. Rural areas that are well connected to urban markets have more diversified local economies, with a higher share of off-farm employment and income from non-agricultural activities. One-fourth of West Africa’s rural population is engaged in off-farm activities. At current urbanisation levels, the economy-wide share of agricultural employment is 50% at the regional level, down from 90% in 1950 (Moriconi-Ebrard, Harre and Heinrigs, 2016).
The traditional divides between rural and urban areas have increasingly blurred
Static categories of urban and rural no longer capture the hybrid nature of shifting relations between cities and countryside (Agergaard, Fold and Gough, 2010; Berdegué and Proctor, 2014). The phenomenon of “urbanisation of the countryside and ruralisation of the cities” observed in Tunisia by Miossec (1985) has become a general feature of the continent’s urbanisation trends.
Migratory practices have diversified. A gradual improvement in infrastructure, including the adoption of mobile phones, has led to a growing tendency towards shorter and temporary migratory practices (Losch, Magrin and Imbernon, 2013). These new patterns may comprise weeks or days but also daily commuting, where transport conditions allow. The degree of change in migratory practices often reflects the regional density and quality of transportation, showing clear differences in networks. Circular migration has increased since the 1980s. This refers to migration into a town followed by a movement out of the town and back to a rural area, which could be a year or even decades later (Potts, 2012). In South Africa, population trends show increasing circular migration and the development of a rural-urban interface, leading to high formal housing prices and to many informal settlements that are only temporarily occupied (OECD, 2008).
Increased mobility alters family structures and life styles. Different household members may exert activities in different places – the village, the neighbouring villages, the town, the capital or even abroad – thus diversifying their sources of income (Guétat-Bernard, 1998; Tacoli, 2003). Such practices generally do not disturb family cohesion. They sometimes even create a kind of archipelago family economy (Losch, Fréguin-Gresh and White, 2013). Living in multiple places produces functional spaces that often do not correspond to administrative boundaries (Cortes and Fayet, 2009; Ma Mung, 1999). This mobility gradually results in a rural economy that is more diversified and often related to some form of urban economy (Haggblade, Hazell and Reardon, 2007).
Many villagers become urbanised, while urban dwellers continue with some of their previous rural activities, notably urban farming. About 40% of African urban dwellers are “engaged in some sort of agricultural activity” (FAO, 2012). According to Gallup data for the period 2009-14, 85% of dwellers aged 15 or older in the towns of non-diversifier African countries are involved in agriculture, while the share is 49% in big cities and suburbs. In Africa’s diversifier countries, the ratio stands at 32% in towns and 16% in big cities and suburbs (Figure 6.14).
These dynamics lead to new spaces appearing between rural and urban areas, sometimes far from government supervision (Diop, 2010). Urbanisation happens along a continuum of settlements without clear distinction between urban and rural. Next to
(cont.)

6. tHE iMPliCAtiONS OF AFriCA’S UrBANiSAtiON FOr StrUCtUrAl trANSFOrMAtiON6. tHE iMPliCAtiONS OF AFriCA’S UrBANiSAtiON FOr StrUCtUrAl trANSFOrMAtiON
161African Economic Outlook© AfDB, OECD, UNDP 2016160 African Economic Outlook © AfDB, OECD, UNDP 2016
the appearance of megacities, urban population growth and urban sprawl have also led to urban corridors (see Chapter 7). Examples are Cairo-Alexandria, the 600-kilometre Ibadan-Lagos-Cotonou-Accra urban corridor and Kenitra-Casablanca-El Jadida. Such conurbations can also create urban regions or megalopolises, such as Greater Cairo, or Gauteng which includes Johannesburg, Midrand and Pretoria. Peripheral urban growth is often a challenge for local governments that are unable to conduct censuses and to provide services to those populations. For instance, the urban growth of Togo’s capital, Lomé, happens mainly outside the city’s administrative borders: the city has no reliable statistical data, recent urban planning document, or even a land-use inventory for those areas outside its remit. Thus, the municipality has virtually no latitude to increase its receipts (Paulais, 2012: 11; 76; 132).
Figure 6.14. Urban farming in big cities and small towns among African countries, 2009-14
0 10 20 30 40 50 60 70 80 90Share of population aged 15 or older involved in farming
Small towns
Big city and suburbs
Small towns
Big city and suburbs
Div
ersi
fiers
Non
-div
ersi
fiers
Note: Gallup provides the two categories “small towns” and “big city and suburbs” through self-identified questions. Non-diversifiers include Angola, Benin, Botswana, Burkina Faso, Burundi, Cameroon, Central African Republic, Chad, Democratic Republic of the Congo, Gabon, Ghana, Guinea, Côte d’Ivoire, Kenya, Liberia, Madagascar, Malawi, Mali, Mauritania, Mozambique, Niger, Nigeria, Rwanda, Senegal, Sierra Leone, Tanzania, Togo, Uganda, Zambia and Zimbabwe. Diversifiers are Mauritius (1 000 respondents) and South Africa (4 984 respondents).6
Source: Authors’ calculations based on Gallup World Poll (2015). 12 http://dx.doi.org/10.1787/888933350650
Urbanisation has reversed or slowed down in some countries
Rural areas remain important also because Africa’s urbanisation has not been a linear process: over time, urbanisation trends have varied in direction and pace. Since the 1980s, the Central African Republic, Côte d’Ivoire, Mali and Zambia have experienced periods of de-urbanisation according to their censuses. In Benin, Burkina Faso, Mauritania, Mozambique, Niger, Senegal and Zimbabwe, the growth of large and medium sized-towns has stagnated or increased slowly (Potts, 2009: 253). These episodes of de-urbanisation or slow urbanisation were often related to economic crises caused by the shortfall of commodity exports and the ensuing structural adjustment that cut subsidies to urban populations (Potts, 2012). Although de-urbanisation occurred in other parts of the world (for instance in China during the Maoist era, in Cambodia during Polpot’s rule and in Thailand in the aftermath of the 1998 financial crisis), de-urbanisation episodes have been more frequent in sub-Saharan Africa over the past 30 years (Bairoch, 1988; Clark, 2009).

6. tHE iMPliCAtiONS OF AFriCA’S UrBANiSAtiON FOr StrUCtUrAl trANSFOrMAtiON
162 African Economic Outlook © AfDB, OECD, UNDP 2016
Table 6.2. Pace of urbanisation trends in selected African countries, 1980-2012Counter-urbanisation (urban share falling)
Slow urbanisation (<2% between censuses)
Rapid urbanisation
Côte d’Ivoire 1988-98Central African Republic 1988-2003Mali 1987-98Zambia 1980-90, 1990-2000Zimbabwe 2002-12
Benin 1992-2002Ethiopia 1994-2007Malawi 1998-2008Mauritania 1988-2000Niger 1988-2002Sudan 1993-2008Togo 1981-2010
Burkina Faso 1996-2006Cameroon 1987-2005Tanzania 1998-2002
Source: National census data, quoted by Potts, 2013: 11.
According to United Nations estimates, the rural population grew faster than the urban population between 1990 and 2010 in five African countries: Egypt, Liberia, Mauritius, Swaziland and Zambia. In total, 11 African countries experienced negative or slow urbanisation, increasing less than 2.2 percentage points in urbanisation levels between 1990 and 2010: the Central African Republic, Chad, Comoros, Djibouti, Egypt, Liberia, Libya, Mauritius, Niger, Swaziland and Zambia. It is projected that four countries will experience slow urbanisation, increasing less than 2 percentage points in urbanisation levels between 2010 and 2030: Djibouti, Mauritius (which will continue to experience negative urbanisation), Swaziland and Zimbabwe.
urbanisation represents challenges for development and the environment
Rapid urbanisation with slow structural transformation creates a significant obstacle to achieving the development objectives set by Agenda 2063 and the Sustainable Development Goals. While African urbanisation patterns are diverse, up to now few may be deemed sustainable economically, socially or environmentally, as confirmed by the AEO 2016 experts’ survey (Figure 6.15). Without productive jobs in rural areas, most economies have seen labour move from agriculture into urban, low-skilled and informal service activities. Access to public goods remains highly unequal even within urban areas, often putting the social fabric at risk. African cities are facing an unprecedented combination of developmental challenges together with rising environmental risks such as unsafe sanitation, climate change and air pollution.
Figure 6.15. Are urbanisation trends sustainable in your country? Africans’ responses
0 5 10 15 20 25 30 35 40 45
Yes No
Number of respondents
Are they economicallysustainable?
Are they sociallysustainable?
Are they ecologicallysustainable?
Note: Survey responses by country economists of the AfDB and UNDP in 45 country offices in Africa about trends in the country they monitor. Responses are weighted by one per country.Source: AEO experts’ survey, 2016.12 http://dx.doi.org/10.1787/888933350667

6. tHE iMPliCAtiONS OF AFriCA’S UrBANiSAtiON FOr StrUCtUrAl trANSFOrMAtiON6. tHE iMPliCAtiONS OF AFriCA’S UrBANiSAtiON FOr StrUCtUrAl trANSFOrMAtiON
163African Economic Outlook© AfDB, OECD, UNDP 2016162 African Economic Outlook © AfDB, OECD, UNDP 2016
Urban settlements hold informal workers in low value-added service sectors
The steady economic growth and rapid urbanisation of the last decade and a half have not been matched by proportional formal employment creation. The proportion of the labour force in vulnerable employment dropped by only 2% between 2000 and 2015, despite exceptionally robust GDP growth rates of over 5% a year fuelled by a long commodity boom (Parnell, Pieterse and Haysom, 2016). Most male and female workers thus stayed in the informal services sector, for instance as street vendors, with no perspective of moving to more productive activities and durably improving their livelihoods. The informal economy is estimated at 61% of urban employment and 93% of all new jobs created (Kessides, 2005). For African women, the informal economy is estimated to represent 92% of all job opportunities outside of agriculture, overwhelmingly as self-employment or own-account work, though up-to-date statistics are lacking (ILO, 2002, quoted by Kessides, 2005). Informality remains a hallmark of many African countries, though it remains widespread in many other developing countries at different urbanisation levels (Figure 6.16).
Figure 6.16. Urbanisation levels and share of informal work in total employment in six African countries and 26 non-African countries, 2010
0
10
20
30
40
50
60
70
80
90
100
0 10 20 30 40 50 60 9070 80
Other countriesAfrican countries
% of informal jobs in total employment
Urbanisation level (%), 2010
Lesotho
Madagascar Mali Namibia
South Africa
Tanzania
Uganda
Zambia
Argentina
Armenia Bolivia
Brazil Colombia
Costa Rica
Dominican Republic
Ecuador
El Salvador
FYR Macedonia Honduras
India
Liberia
Mexico
Moldova
Nicaragua Panama
Paraguay
Peru
Philippines Serbia
Sri Lanka
Turkey
Uruguay
Venezuela
Viet Nam
Source: ILO (2012) and UN DESA (2014).12 http://dx.doi.org/10.1787/888933350673
The drivers of informality are many. This informality is often an outcome of accommodating rapid population and economic growth in cities. It is also due to a lack of institutional capacity to protect property rights, enforce regulations and manage planned urban expansion (Spence, Clark Annez and Buckley, 2009: 26-27).
The weak performances of the modern manufacturing and service sectors mean that wage-paying jobs are rare, and most people are trapped in vulnerable employment or are forced out of the labour force altogether. Based on an analysis of Gallup data, Africa’s working-age population is more likely to have a wage-paying job in big cities than in towns at 38% and 25% respectively (Figure 6.17). This gap in wage-paying full-time jobs between cities and towns is wider in non-diversifier countries than in diversifier countries, reflecting the deeper extent of structural transformation in smaller cities and towns in the diversifier countries. In contrast, towns have a higher share of populations in vulnerable employment and that are unemployed than big cities, and this share is much higher in towns among non-diversifiers. Thus, 84% of respondents are in vulnerable employment and unemployed, in contrast with a combined 55% in big cities in diversifier countries.

6. tHE iMPliCAtiONS OF AFriCA’S UrBANiSAtiON FOr StrUCtUrAl trANSFOrMAtiON
164 African Economic Outlook © AfDB, OECD, UNDP 2016
Figure 6.17. Type of work by size of African city and country typology (%), 2009-14
0
20
40
60
80
100
3825
45 4128
16
20
30
1718
2537
22 30 17 19 2937
20 1522 22 19
10
% of labour force
Unemployed Part-time employment Self-employment Full-time waged job
Big cityand suburbs
Small towns Big cityand suburbs
Small towns Big cityand suburbs
Small towns
Africa Diversifiers Non-diversifiers
Note: Gallup provides the two categories “small towns” and “big city and suburbs” through self-identified questions. The employment categories are also provided by Gallup. Diversifiers include Egypt, Morocco, South Africa and Tunisia. Non-diversifiers include Algeria, Botswana, Burkina Faso, Burundi, Cameroon, Central African Republic, Chad, Democratic Republic of the Congo, Ghana, Côte d’Ivoire, Kenya, Liberia, Libya, Malawi, Mali, Mauritania, Niger, Nigeria, Rwanda, Senegal, Sierra Leone, Somalia, Sudan, Tanzania, Uganda, Zambia and Zimbabwe (see Annex 6.A.1).Source: Authors’ calculation based on Gallup World Poll (2015). 12 http://dx.doi.org/10.1787/888933350686
Access to public goods remains unequal in most urban areas
Diversifiers have reduced urban poverty more rapidly than other countries
The incidence of urban poverty is much higher in Africa than on other continents: 62% of sub-Saharan Africa’s urban population live in slums (UN-Habitat, 2008).7 A slum household is defined as deprived in at least one of the five following amenities: durable housing, sufficient living area, access to improved water, improved sanitation or secure tenure (UN-Habitat, 2006). Many African countries face a real risk of tripling their slum population by 2050 (UN-Habitat, 2014).
The Multidimensional Poverty Index (MPI) shows that urban poverty is high in Africa. The MPI is a composite measure of poverty headcount and deprivation intensity faced by households. Africa’s urban MPI is 0.151, much higher than the average for the sample of 54 non-African developing countries at 0.026 and twice the level of South Asia, the next poorest region (Figure 6.18):
• Within Africa, the group of diversifier countries has an urban MPI level of 0.009. This is considerably lower than the rest of the continent and even lower than all other developing regions except developing Europe and Central Asia.
• The natural resources-based countries face the highest level of multidimensional poverty, followed by the agrarian countries, the late urbanisers and the early urbanisers.

6. tHE iMPliCAtiONS OF AFriCA’S UrBANiSAtiON FOr StrUCtUrAl trANSFOrMAtiON6. tHE iMPliCAtiONS OF AFriCA’S UrBANiSAtiON FOr StrUCtUrAl trANSFOrMAtiON
165African Economic Outlook© AfDB, OECD, UNDP 2016164 African Economic Outlook © AfDB, OECD, UNDP 2016
Figure 6.18. Urban Multidimensional Poverty Index by world region and AEO 2016 typology group
0 0.05 0.10 0.15 0.250.20
African countries by typology groups Other world regions
Europe and Central Asia
Africa - Diversifiers
Latin America and the Carribean
East Asia and the Pacific
Middle East
South Asia
Africa - Early urbanisers
Africa - Late urbanisers
Africa - Agrarians
Africa - Natural resources-based
Multidimensional Poverty Index in urban areas
Note: The countries included in each group are Africa - natural-resources based: Chad, Congo, Democratic Republic of the Congo, Guinea, Mauritania, Nigeria, Somalia, South Sudan, Zambia, Zimbabwe; agrarians: Burkina Faso, Burundi, Malawi, Mali, Niger, Uganda; late urbanisers: Central African Republic, Ethiopia, Kenya, Madagascar, Mozambique, Rwanda, Sierra Leone, Sudan, Tanzania; early urbanisers: Benin, Cameroon, Côte d’Ivoire, Ghana, Liberia, Senegal, Togo; South Asia: Afghanistan, Bangladesh, Bhutan, India, Maldives, Nepal, Pakistan; Middle East: Iraq, Jordan, Palestine, Syrian Arab Republic, Yemen; East Asia and the Pacific: Cambodia, China, Indonesia, Lao, Mongolia, Philippines, Thailand, Timor-Leste, Vanuatu, Viet Nam; Latin America and Caribbean: Barbados, Belize, Bolivia, Brazil, Colombia, Dominican Republic, Ecuador, Guyana, Haiti, Honduras, Jamaica, Mexico, Nicaragua, Peru, Saint Lucia, Suriname, Trinidad and Tobago; Africa diversifiers: Egypt, Morocco, South Africa, Tunisia; Europe and Central Asia: Albania, Armenia, Azerbaijan, Belarus, Bosnia and Herzegovina, Georgia, Kazakhstan, Kyrgyzstan, Former Yugoslav Republic of Macedonia, Moldova, Montenegro, Serbia, Tajikistan, Ukraine, Uzbekistan.Source: Authors’ calculations based on data from Alkire and Robles (2015).12 http://dx.doi.org/10.1787/888933350695
The urban poor in Africa face four main risks: i) health risks resulting from poor living conditions, overcrowding and lack of basic services; ii) livelihood risks from vulnerable employment, hazardous occupation and discrimination in labour markets; iii) external shocks from natural disasters that disproportionately affect informal settlements; and iv) governance risks of not receiving adequate policy attention (Tacoli, McGranahan and Satterthwaite, 2015). Other than the diversifiers’ group, African urban areas are characterised by higher poverty headcounts as well as more intense deprivations than urban areas in other regions. Thirty-four per cent of Africa’s urban inhabitants living outside the diversifier countries are deprived in at least three of the ten MPI dimensions, in contrast to 3% in the diversifier countries and 9% in other non-African developing countries. Africa’s urban poor are most deprived in their living standards, followed by health care. Almost a third of Africa’s urban poor do not use clean cooking fuel. A quarter of the urban poor lack access to electricity and sanitation.
Poor living conditions affect well-being in urban areas
The past decade of robust economic growth has not improved subjective well-being of Africa’s urban inhabitants. Thirty percent of urban respondents find their living standard good and 5% very good, but the share of positive responses has remained constant at only about 35% since 2002/03 (Figure 6.19). In contrast, the share of urban respondents finding their economic conditions bad or very bad has always been higher and increased from 41% to 45%. Nonetheless, urban residents generally think they are better off than their rural counterparts, 50% of whom consider their living conditions unfavourable.

6. tHE iMPliCAtiONS OF AFriCA’S UrBANiSAtiON FOr StrUCtUrAl trANSFOrMAtiON
166 African Economic Outlook © AfDB, OECD, UNDP 2016
Figure 6.19. Self-evaluation of current personal economic conditions by African urban respondents
A. Titre
0 10 20 30 40 50 60 70 80 90
2002-03
2005-06
2008-09
2011-13
2014-15
100
Very good Fairly good Neither good nor bad Fairly bad Very bad
% of respondents
2014-15 (Rural)
Note: The country coverage gradually increases from 16 countries in 2002/03 to 34 countries in the latest wave (2014/15).Source: Extracted from Afrobarometer (2015). 12 http://dx.doi.org/10.1787/888933350704
With high urban inequality, segregation is becoming an increasing risk for social cohesion
Africa has some of the world’s most unequal cities. The distribution of income among urban households as measured by the Gini coefficient8 stands at 0.539 for the urban areas in a sample of 12 countries (UN-Habitat, 2010a). Johannesburg has one of the world’s highest Gini coefficients at 0.75 (UN-Habitat, 2010b). The social consequences of urban inequality affect human development outcomes, limit access to opportunities and perpetuate inequity (UN-Habitat, 2008). Crime rates and insecurity are high and tend to grow with city size, such as in Johannesburg and Lagos. A survey of 9 sub-Saharan African countries shows that urban residents are much more concerned on average about the problem of crime than rural residents, with differences ranging between 8 to 15 percentage points (Figure 6.20).
The spatial divide heightens social disparities across neighbouring urban areas. Large gated communities heighten spatial segregation and hampers social cohesion. One example is Eko Atlantic City on an artificial island five kilometres away from Lagos that offers exclusive amenities for upper class and expatriate elites (Kester, 2014). In particular for women, perceived or actual threats of violence have direct impacts on their ability to freely move in public spaces. In Nairobi, over 700 gender-based physical violence in public spaces including bus stops and parks were reported in 2010-11 (McEvoy, 2012). Results from a study in Kigali found that 42% of women were concerned about sexual harassment when traveling to educational institutions during the day and 55% after dark (UN Women, 2013).

6. tHE iMPliCAtiONS OF AFriCA’S UrBANiSAtiON FOr StrUCtUrAl trANSFOrMAtiON6. tHE iMPliCAtiONS OF AFriCA’S UrBANiSAtiON FOr StrUCtUrAl trANSFOrMAtiON
167African Economic Outlook© AfDB, OECD, UNDP 2016166 African Economic Outlook © AfDB, OECD, UNDP 2016
Figure 6.20. Africans saying “Crime is a very big problem in our country”, 2015
0
10
20
30
40
50
60
70
80
90
100
RuralUrban
Ethiopia Uganda South Africa Senegal Ghana Burkina Faso
% of respondents
Source: Pew Research Centre (2015).12 http://dx.doi.org/10.1787/888933350713
Box 6.4. The flux of urban refugees to African cities
The flux of refugees to cities, or urban refugees, poses specific challenges for social cohesion, urban economic productivity and the integration of refugees into society for a decent life. International migration within Africa has been linked to political crises, wars and their economic fallout, increasing the number of refugees in urban areas (Naudé, 2008).
Nairobi, Kenya, has 46 000-100 000 refugees from 8 neighbouring countries. Refugee camps such as Dadaab have become as large as towns, sheltering hundreds of thousands refugees from Somalia since the early 1990s. The influx of refugees to Nairobi’s district of Eastlands in the early 1990s led to an increase of over five-fold in rent prices for single rooms pushing many Kenyan tenants out, while refugees often lived in squalid conditions of over-crowding (Campbell, 2006; Lindley, 2007). But the consequences can also be positive: the arrival of refugees created bustling business activity. The Eastleigh Business Community registered a total of 2 800 mainly Somali business people between its founding, in 1999, and 2005 (RCK, 2006).
Other countries have also been affected:
• Sudan’s capital, Khartoum, accommodates 1.5 million displaced persons (Paulais, 2012).
• In Egypt, Cairo hosts a million refugees from Sudan, in addition to those from other countries. The situation is similar in Alexandria, Egypt’s second largest city. Policies generally ignore urban refugees, though many face abuse (Paulais, 2012: 139).
• In South Africa, local governments have created helpdesks for migrants in the cities of Johannesburg, Matatiele, Musina and Tshwane. They attempted to respond to violent riots against foreigners in 2008 and 2015 (AfDB/OECD/UNDP, 2009).

6. tHE iMPliCAtiONS OF AFriCA’S UrBANiSAtiON FOr StrUCtUrAl trANSFOrMAtiON
168 African Economic Outlook © AfDB, OECD, UNDP 2016
High environmental risks compound the developmental challenges of Africa’s urbanisation
As it urbanises, the African continent faces a conjunction of important environmental and developmental challenges, which other regions have not faced simultaneously with such magnitude. Those include the fast rising impact of air pollution on the health and economy of African people as well as the multiple consequences of global climate change affecting urban areas.
The costs of air pollution are abnormally high
Urbanising Africa faces multiple environmental and developmental issues. Unlike regions that urbanised earlier, Africa must deal with them simultaneously.
Environmental risks – air pollution, unsafe water and unsafe sanitation – require attention. In 2013, ambient particulate matter pollution (APMP) caused at least 246 000 premature deaths. Deaths from household air pollution (HAP) have risen, with indoor air pollution being the number one cause of respiratory illness among women and children in African informal settlements (UN-Habitat, 2008). By contrast, deaths from other long-standing environmental risk factors such as unsafe water and unsafe sanitation have fallen steadily (Table 6.3).
Table 6.3. Premature deaths from selected major risk factors in Africa, 1990-2010 (five-year intervals) and 2013
1990 1995 2000 2005 2010 2013
Unsafe water 837 702 780 095 751 892 644 136 561 342 542 855
Unsafe sanitation 615 540 573 084 551 948 468 815 407 092 391 656
Childhood underweight 474 819 467 921 420 606 309 945 273 294 275 813
Household air pollution 396 094 422 895 436 463 429 199 450 969 466 079
Ambient PM pollution 181 291 190 933 200 854 213 429 227 428 246 403
Source: Roy (forthcoming).
As they face those new challenges, African cities cannot borrow from others’ experience. Other world regions have never exhibited such convergence of important environmental and developmental challenges. By 1990, China’s childhood underweight death toll was low enough for APMP deaths to dominate it at a ratio of 11:1. By 2013, China’s childhood underweight death toll had been more or less eliminated, and APMP deaths dominated it at a ratio of 671:1. Africa can hardly tackle the new risk factor of APMP, with its approximately 250 000 deaths in 2013, together with the old problem of childhood underweight, with its 275 000 deaths. Environmental challenges such as APMP are to a great extent caused by urbanisation and, more specifically, by motorisation. While it can be viewed as a post-industrial risk, APMP is already relatively high in Africa although the continent has reached only the early stages of industrialisation. Developmental challenges like under nourishment also need attention. “Childhood undernutrition” remains the leading risk factor for premature deaths in sub-Saharan Africa.9 Being underweight is the third cause of premature deaths in Africa (Table 6.3).
Roy (forthcoming) translates premature deaths into economic costs. Using the value of statistical life (VSL) method, measuring the cost of mortalities at the level of society as a whole, he estimates that air pollution cost Africa USD 447 billion in 2013, a third of its GDP (Table 6.4). For Africa, the estimated economic cost of premature deaths from all four selected environmental risk factors, APMP, HAP, unsafe water and unsafe sanitation, exceeds USD 850 billion or almost two-thirds of GDP.

6. tHE iMPliCAtiONS OF AFriCA’S UrBANiSAtiON FOr StrUCtUrAl trANSFOrMAtiON6. tHE iMPliCAtiONS OF AFriCA’S UrBANiSAtiON FOr StrUCtUrAl trANSFOrMAtiON
169African Economic Outlook© AfDB, OECD, UNDP 2016168 African Economic Outlook © AfDB, OECD, UNDP 2016
Table 6.4. Economic costs of premature deaths from selected major risk factors in Africa (USD million), 2013
Ambient particulate
matter pollutionHousehold air
pollution Unsafe water Unsafe sanitationChildhood
underweight
Total (of countries with available data) 215 212 231 798 248 191 160 670 134 468
Note: All computations use the OECD base value of USD 3 million in 2005, which reflects an aggregation of individual values for small changes in risk of death, as found in the OECD countries (OECD, 2012b). This base value is adjusted for differences in per capita GDP and adjusted for post-2005 income growth and inflation. Available data are insufficient to complete calculations for the following countries: Eritrea, Sierra Leone, Somalia and Zimbabwe. Source: Roy (forthcoming).
Climate change and urban growth will heighten environmental pressures on urban areas
Although African countries contribute less than 4% to global gas emissions, climate change imposes increasingly high costs on the continent (FAO, 2008). Average temperatures in Africa are predicted to increase 1.5-3°C by 2050, magnifying the impacts of climate change that can already be witnessed (UNEP, 2007). Should climate change continue unmitigated, the sole effect of rising temperatures could lead most African countries to be poorer in 2100 than today (Burke, Hsiang and Miguel, 2015). Strong urban demographic growth inevitably magnifies environmental pressures on urban ecosystems. The poorest households, which are highly dependent on natural resources, are the most affected by environmental degradation.
Climate change and environmental degradation caused by urban growth have different impacts on various African cities and regions:
• Flooding risks in low elevation coastal zones: 50% of African settlements with 1-5 million inhabitants lie at low elevation coastal zones (Kamal-Chaoui and Robert, 2009). Flooding increases in cities because they have more impervious surfaces (Paulais, 2012). The populations and assets of port cities like Abidjan, Douala or Tunis are vulnerable to sea level rise. Agricultural land may be lost as well (Map 6.2). Egypt’s coastal zone contains 40% of the country’s total population and is expected to experience a 6.4% decrease in GDP per meter of sea level rise (Brown, Kebede and Nicholls, 2011). For Nigeria, estimates lay at a 0.3% GDP loss, and for Senegal at 12-17%.
• Abrupt weather changes: Several countries face changes in weather patterns, varying in duration and intensity. East African countries tend to have heavier rainfall. Southern Africa experiences dryness, drought and wildfires. In parts of the Sahel, lower than average rainfall could lower corn production and endanger access to food, for example in Nairobi as shown by the Agricultural Stress Index (FAO, 2014).
• Changing rain patterns: An acceleration of the hydrologic cycle will increase patterns of extreme rainfall (IPCC, 2007). Annual average adaptation costs in Africa could amount to USD 18 billion between 2010 and 2050, mainly costs in the water sector and coastal protection. While the mean flow of water would increase, water availability would drop in Ethiopia’s capital Addis Ababa by 73%, in Botswana and South Africa by 20%, and in Somalia by 42% (AfDB, 2011).
• Heat extremes: Heat extremes and urban heat islands have impacts on health and vegetation and create further climate warming (Huang and Lu, 2015). Urban heat islands are higher temperatures in the cities resulting from human activity such as pollution, the modification of the physical and chemical properties of

6. tHE iMPliCAtiONS OF AFriCA’S UrBANiSAtiON FOr StrUCtUrAl trANSFOrMAtiON
170 African Economic Outlook © AfDB, OECD, UNDP 2016
the atmosphere, and the covering of the soil surface. In North Africa, heat stress currently causes 2 000 fatalities per year but they are predicted to rise to 47 000 in 2080 (OECD, 2015). Regions close to the Sahel cities such as Ouagadougou will also be affected. African countries could experience 907 000 deaths in 2080. In a city like Johannesburg, the hottest vulnerable areas identified are suburbs where density is high and vegetation low (Hardy and Nel, 2015).
• Deforestation: Fuelwood supplies more than 80% of household fuel in Africa and accounts for 90% of harvested wood. Map 6.3 shows that recent deforestation in Central Africa clusters especially around major transport links and urban centres such as Kinshasa.
• Desertification: Land degradation and conflicting land-use patterns are consequences of continuous land desertification, high population growth and exhaustive exploitation of resources. Desertification already affects two-thirds of Africa’s land and 65% of its population. It is responsible for large parts of rural-urban migration, for example to Ouagadougou, Burkina Faso (Pauleit, 2015). In the Sahel and in the Horn of Africa, 60 million people are likely to migrate between 2016 and 2020 because of degraded areas.
Box 6.5. Climate change and rural-urban migration in sub-Saharan Africa
Climate change has led to rural-urban migration in sub-Saharan Africa. This is largely because the area’s agriculture depends heavily on rainfall, more so than other world regions (Barrios, Bertinelli and Strobl, 2006: 4).
• Declining rainfall has increased urbanisation rates in sub-Saharan Africa (ibid.: 18).
• The decline in moisture (measured by an index combining precipitation and potential evapotranspiration) has affected agricultural productivity, pushing rural dwellers to urban areas (Henderson, Storeygard and Deichmann, 2014: 2).
• While rainfall trends have fallen steadily since the 1970s, a 1% fall in precipitation is estimated to have increased sub-Saharan Africa’s urbanisation rate by 0.45% (Barrios, Bertinelli and Strobl, 2006: 18).
• Inefficient management of rural water and land resources has also contributed to rural-urban migration by lowering agricultural productivity. Likewise, inappropriate land tenure systems have deterred sustainable investment (Global Centre for Food Systems Innovation 2014: 59).
It is unlikely that urbanisation driven by decreases in rainfall promotes Africa’s structural transformation. By pushing the labour force out of rural areas, drier conditions can increase urban productivity in cities endowed with an industrial base, particularly those with an export sector not wholly dependent on local agriculture (Henderson, Storeygard and Deichmann, 2014: 1; 22). However, few African cities have a sufficiently industrialised export base to make productive use of additional rural migration (ibid.: 25).
Policies should focus on productive jobs and public goods for the growing urban population
The history of Africa’s urbanisation is certainly singular but not fundamentally different from urbanisation experiences in other world regions. This singularity owes mainly to the continent urbanising at lower levels of income than others but also to a number of policy dysfunctions over the past decades (UN-Habitat, 2014). While

6. tHE iMPliCAtiONS OF AFriCA’S UrBANiSAtiON FOr StrUCtUrAl trANSFOrMAtiON6. tHE iMPliCAtiONS OF AFriCA’S UrBANiSAtiON FOr StrUCtUrAl trANSFOrMAtiON
171African Economic Outlook© AfDB, OECD, UNDP 2016170 African Economic Outlook © AfDB, OECD, UNDP 2016
dysfunctions are a part of any urbanisation process, rapid urban growth has compounded their consequences, particularly in terms of urban overcrowding, lack of connectivity and inefficiencies impeding the provision of public goods.
Investment in urban infrastructure must keep up with rapid urban growth
Among the policy-induced factors explaining why urban infrastructure has not kept up with strong urban growth, three areas stand out: public and private actors have not sufficiently upgraded the urban infrastructure; steadily high fertility rates in urban areas have contributed to overcrowding through fast urban growth; and dysfunctional real estate markets have led to the explosion of informal housing.
Governments must upgrade the urban infrastructure
Urban planning and urban finance have greatly lagged all over Africa (UN-Habitat, 2014; 2008). Most African countries have urbanised later than other world regions. Many big cities are colonial legacies that were not planned to host large populations. As such, several African capitals stemmed from a rent-based or extractive vision of the economy that is not conducive to structural transformation (AfDB/OECD/UNDP, 2015).
Some planned cities built soon after independence have faced unexpectedly high population density leading to severe congestion. Mauritania’s capital, Nouakchott, was built in 1958 as an administrative capital for an expected capacity of fewer than 15 000 inhabitants, but it has grown by more than 9% annually since 1950 to reach almost 1 million inhabitants in 2015 (AfDB/OECD/UNDP, 2015: 182). Similarly, booming urban growth at 5.3% a year in Angola has overwhelmed the existing capacity of provincial capitals where existing systems were originally designed for smaller populations. Two-thirds of the population live in urban slums and peri-urban areas with limited access to basic services. Outside Luanda, only four cities have sewerage collection systems, and these serve only central urban areas covering 17% of the population (USAID, 2010).
Investment in urban infrastructure has not kept pace with rapid urban population growth, decreasing the marginal utility that comes from economies of scale when providing services to a larger urban consumer base. On average in sub-Saharan African countries, gross domestic investment has remained constant at less than 22% of GDP since 1960, whereas it has increased to 42% in the East Asian developing countries (World Bank, 2015). Large pockets of poverty and vulnerable employment have often prevented public and private investment in urban infrastructures, magnifying urban congestion effects.
One-third of developing countries’ total infrastructure needs concern urban areas (UCGL, 2007). African cities’ investment needs have been estimated at around USD 30 billion per year, of which USD 20 billion for sub-Saharan Africa (Paulais, 2012: 100). Depending on development levels, African countries would need to spend 5-7% of their GDP on public infrastructure, i.e. a minimum of USD 100 billion per year (World Bank, 2005). Determining the local finance gap for specific cities depend on specific needs, urban density and various methods of calculation.
Municipal governments of African cities do not have the resources to tackle these challenges by themselves. Cities’ expenses and receipts per inhabitant are very low (Figure 6.21). At around USD 40 per capita per year, the revenues of capital cities such as Dakar and Nairobi fall very short of the financial needs induced by urban growth, and infrastructure expenses cannot match demand (Figure 6.21). The financial situation of intermediary cities is even weaker with less than USD 1 spent per capita per year on average.

6. tHE iMPliCAtiONS OF AFriCA’S UrBANiSAtiON FOr StrUCtUrAl trANSFOrMAtiON
172 African Economic Outlook © AfDB, OECD, UNDP 2016
Figure 6.21. Operating revenue and capital expenditure per capita in selected African capitals and intermediary cities
39.0
23.0
14.4
26.3
8.6 7.1
12.0
3.9
11.4
3.1 3.0 2.2 2.7 0.8 1.9 2.1
0.6
12.5
7.6 10.3
5.5
2.1 2.0 1.2 0.7 0.9 0.5 0.3 0.3 0.2 0.1 0.1 0 00
15
30
45
14.0
44.0
Operating revenue (USD per inhabitant) Capital expenditure (USD per inhabitant)N
airo
bi (K
enya
)
Dak
ar (S
eneg
al)
Braz
zavi
lle (C
ongo
)
Banj
ul (G
ambi
a)
Kam
pala
(Uga
nda)
Kiga
li (R
wan
da)
N’d
jam
ena
(Cha
d)
Lom
é (T
ogo)
Buju
mbu
ra (B
urun
di)
Sain
t-Lo
uis
(Sen
egal
)
Mbe
lwa
(Mal
awi)
Mom
bass
a (K
enya
)
Bam
beri
(Cen
tral
Afr
ican
Rep
ublic
)
Boua
ké (C
ôte
d'Iv
oire
)
Mat
ana
(Bur
undi
)
Maj
unga
(Mad
agas
car)
Bogh
e (M
auri
tani
a)
Maf
ia (
Tanz
ania
)
USD per inhabitant
Capital cities Intermediary cities
Source: Yatta (2016) based on CGLUA (2014).12 http://dx.doi.org/10.1787/888933350725
Gender blind infrastructure also contributes to urban dysfunctions by exacerbating inequalities existing between women and men. Women are affected by urban infrastructures unsuitable to their needs. Longer distances from the closest water source contribute to women’s time poverty: on average, women in sub-Saharan Africa travel over six kilometres every day for clean water, and women and girls are responsible for 71% of water collection in the region (UN et al, 2010). In Addis Ababa, exposure to violence and sexual harassment in public places influences women’s employment choices (ActionAid, 2011). Gender blind infrastructure also affects girls’ education opportunities and the unequal time women spend on unpaid care activities.
Policies should provide more affordable formal housing
Weak land rights can constrain urban economies, particularly formal housing markets. Formal housing markets do not respond efficiently to the growing demand of urban housing. Important housing demand outstrips the formal market, causing a housing shortage and contributing to high prices. As a result, formal housing is often unaffordable for middle- or lower-income households, pushing them into the informal housing market. In the East African Community, less than 10% of the population can afford a house on the formal market (CAHF, 2015: 220). Over 62% of sub-Saharan Africa’s urban dwellers live in informal settlements.
By and large, Africa’s housing markets suffer from inadequate and unco-ordinated housing policies. Land rights and legal ownership are generally weak, except in the diversifier countries, which boast some successful examples of containing the expansion

6. tHE iMPliCAtiONS OF AFriCA’S UrBANiSAtiON FOr StrUCtUrAl trANSFOrMAtiON6. tHE iMPliCAtiONS OF AFriCA’S UrBANiSAtiON FOr StrUCtUrAl trANSFOrMAtiON
173African Economic Outlook© AfDB, OECD, UNDP 2016172 African Economic Outlook © AfDB, OECD, UNDP 2016
of informal urban housing (see Chapter 7). Land tenure systems in most sub-Saharan African countries are inherited from customary law where land titles do not exist. Land ownership is often unclear, and legalisations of settlement are disputed (Collier, 2013: 8). Land grabbing – the misallocation of public land to private actors with political connections – occurs commonly at the expense of affordable housing. At the same time, informal housing can be extremely expensive relative to residents’ income. In Kibera and Mathare, Kenya’s largest slums, landlords investing in rental housing are able to reap return rates on their investments as high as 100% and 70%, respectively (Paulais, 2012).
By contrast, diversifier countries show examples of improving the housing market in urban areas. Slums in North Africa have diminished substantially, particularly in Morocco and Tunisia (CAHF, 2015: 223). Rate of homeownership is high, for instance at 89% in Mauritius. Comprehensive management of housing and land has contributed significantly to turning Mauritius’ real estate sector into a driver of economic growth. South Africa has a well-established property market and a world class cadastral system (ibid.: 136-181). Allocating clearly defined land rights is fundamental for investment in land or infrastructure development (King and Napier, 2015: 7).
More broadly, lack of financial support and inadequate structure of banks affect the construction industry and households. The few formal construction firms in sub-Saharan Africa cater to high-end housing and housing for civil servants (Collier, 2013: 10). Lack of mortgage institutions and inadequate administrative structures of commercial banks prevent firms from financing mass housing. Due to the lack of collateral and restrictive lending policies, 85% of Africa’s urban population cannot secure formal housing loans (Mo Ibrahim Foundation, 2015: 22). In the Economic and Monetary Community of Central Africa, only 5% of private-sector employees have access to mortgage finance from commercial banks (CAHF, 2015: 215).
Atypically high construction costs increase the price of formal housing. Materials such as cement are around three times higher than world prices, which also accounts for the low competitiveness of savings and loan agencies (Collier, 2013: 6).10 Government initiatives to build residential districts have sometimes ended up erecting “ghost cities” due to the high costs of apartments, such as the district of Nova Cidade de Kilamba, built 30 kilometres outside Luanda and hosting only 10% of its capacity (Mo Ibrahim Foundation, 2015: 22).
Lack of urban connectivity has offset economies of agglomeration
Urban connectivity helps to support economies of agglomeration, or use less material infrastructure to support a larger population. Urban policies must better promote the connectivity among workers and firms (labour markets), among firms themselves (input markets), and among producers and consumers (local and international consumer markets) (Collier, 2016). Urban sprawl spreads people further away from each other, while weak transportation infrastructure increases the cost of connecting them together.
Most cities have expanded through urban sprawl
In many sub-Saharan African cities, urban expansion has been fragmented and sparse, with new development leapfrogging from the central cores (Angel et al, 2010a). African cities thus suffer from the challenges of urban sprawl, decreasing the benefits of connectivity within urban areas.

6. tHE iMPliCAtiONS OF AFriCA’S UrBANiSAtiON FOr StrUCtUrAl trANSFOrMAtiON
174 African Economic Outlook © AfDB, OECD, UNDP 2016
African cities are expanding into rural areas, similar to the global trend (Angel et al., 2010a). The Atlas of Urban Expansion shows that 12 sub-Saharan African cities have a low density at 81 inhabitants/km2, while 6 North African cities have densities similar to Southeast Asian cities at 155 inhabitants/km2. The African cities studied have built up rapidly; the lowest rate is 2.3% a year (Johannesburg). The rates have often surpassed and even more than doubled that of population growth. Kigali has expanded by 18% a year, tripling the size of its population in only 15 years. Several cities, such as Kampala, have achieved rapid population growth at 4.3% with even faster physical expansion at 10.6% a year, reducing their density level (Figure 6.22).
Figure 6.22. African cities’ expansion of built-up areas and population growth, 1990-2000
0
5
10
15
20
25
-2 -1 0 1 2 3 4 5 6 7
Annual expansion of built-up areas (%)
Annual population growth (%)
Other world regions
North Africa
Sub-Saharan Africa
Density remains constant
Built-up area expands twice as fast as the urban population
Built-up area expands three times faster than the urban population
Port Sudan Marrakech
Algiers
AlexandriaAswanCairo
Casablanca
Johannesburg
Ouagadougou
Ibadan
Accra
Addis Ababa
Tebessa
Alexandria Port Sudan
AswanCairoCasablanca
Harare
PretoriaNdola
Kigali
Algiers
OuagadougouAccra
Kampala
BanjulBamako
JohannesburgIbadan
Addis AbabaMarrakech
Source: Authors’ calculations based on Angel et al. (2010a). 12 http://dx.doi.org/10.1787/888933350732
Sub-Saharan Africa’s ratio of urban to arable land has changed quickly, though it remains currently low at 1.5%. In Lagos, frontier residential development, replacing forests and farmlands, already affects rural livelihoods at the urban fringe. This problem is compounded by institutional factors such as the skewed distribution of private land, the high costs of undeveloped land, and weak land-use planning regulations. Pro-poor land tenure and housing policy reforms can address such issues (Braimoh and Onishi, 2007).
At current rates of population growth and decreasing density, African urban areas will continue to expand quickly. Sub-Saharan Africa’s urban areas will likely grow at least four-fold between 2010 and 2050, even if the rate of land expansion remains constant, since the urban population is expected to quadruple from 295 million to 1.15 billion. However, if the consumption of land per capita increases at 1% or 2% per annum, the land area of cities is likely to increase six- or eight-fold, respectively (Figure 6.23). By comparison, the density of urban areas in developing countries decreased at nearly 2.5% per annum between 1990 and 2000. Between 2000 and 2010, Accra’s density decreased at an average annual rate of nearly 2.5%, while Algiers’ density has decreased by 4.3% per year (Angel et al., 2015). Such high rates of urban expansion seem environmentally unsustainable as they reduce the supply of ecosystem services such as arable land, freshwater and waste absorption. They may also affect hydrologic cycles and vegetation cover (Grant, 2015).
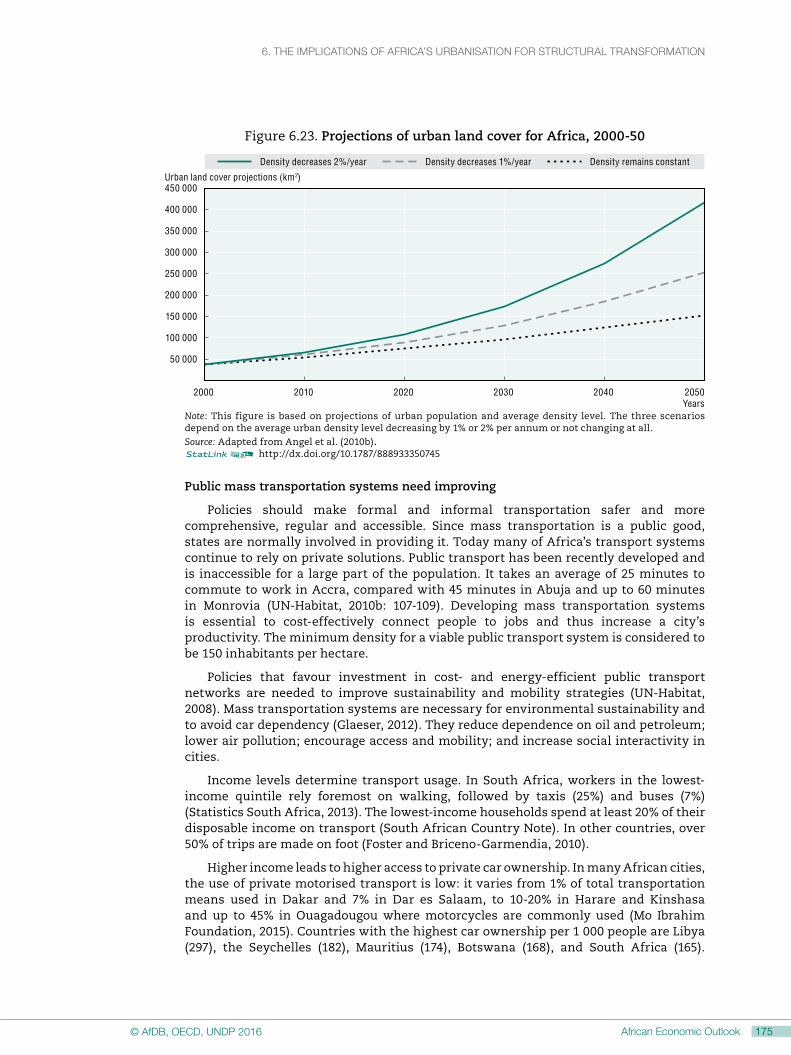
6. tHE iMPliCAtiONS OF AFriCA’S UrBANiSAtiON FOr StrUCtUrAl trANSFOrMAtiON6. tHE iMPliCAtiONS OF AFriCA’S UrBANiSAtiON FOr StrUCtUrAl trANSFOrMAtiON
175African Economic Outlook© AfDB, OECD, UNDP 2016174 African Economic Outlook © AfDB, OECD, UNDP 2016
Figure 6.23. Projections of urban land cover for Africa, 2000-50
50 000
100 000
150 000
200 000
250 000
300 000
350 000
400 000
450 000
2000 2010 2020 2030 2040 2050
Density decreases 2%/year Density decreases 1%/year Density remains constant
Urban land cover projections (km2)
YearsNote: This figure is based on projections of urban population and average density level. The three scenarios depend on the average urban density level decreasing by 1% or 2% per annum or not changing at all.Source: Adapted from Angel et al. (2010b). 12 http://dx.doi.org/10.1787/888933350745
Public mass transportation systems need improving
Policies should make formal and informal transportation safer and more comprehensive, regular and accessible. Since mass transportation is a public good, states are normally involved in providing it. Today many of Africa’s transport systems continue to rely on private solutions. Public transport has been recently developed and is inaccessible for a large part of the population. It takes an average of 25 minutes to commute to work in Accra, compared with 45 minutes in Abuja and up to 60 minutes in Monrovia (UN-Habitat, 2010b: 107-109). Developing mass transportation systems is essential to cost-effectively connect people to jobs and thus increase a city’s productivity. The minimum density for a viable public transport system is considered to be 150 inhabitants per hectare.
Policies that favour investment in cost- and energy-efficient public transport networks are needed to improve sustainability and mobility strategies (UN-Habitat, 2008). Mass transportation systems are necessary for environmental sustainability and to avoid car dependency (Glaeser, 2012). They reduce dependence on oil and petroleum; lower air pollution; encourage access and mobility; and increase social interactivity in cities.
Income levels determine transport usage. In South Africa, workers in the lowest-income quintile rely foremost on walking, followed by taxis (25%) and buses (7%) (Statistics South Africa, 2013). The lowest-income households spend at least 20% of their disposable income on transport (South African Country Note). In other countries, over 50% of trips are made on foot (Foster and Briceno-Garmendia, 2010).
Higher income leads to higher access to private car ownership. In many African cities, the use of private motorised transport is low: it varies from 1% of total transportation means used in Dakar and 7% in Dar es Salaam, to 10-20% in Harare and Kinshasa and up to 45% in Ouagadougou where motorcycles are commonly used (Mo Ibrahim Foundation, 2015). Countries with the highest car ownership per 1 000 people are Libya (297), the Seychelles (182), Mauritius (174), Botswana (168), and South Africa (165).

6. tHE iMPliCAtiONS OF AFriCA’S UrBANiSAtiON FOr StrUCtUrAl trANSFOrMAtiON
176 African Economic Outlook © AfDB, OECD, UNDP 2016
Countries with the lowest are Ethiopia (3.1), Togo (2.3), Sao Tome and Principe (2.2) and the Central African Republic (0.31) (World Bank, 2015).
As fares for urban public transport are too high for poorer populations, informal means of transport prevail. The average family can afford no more than one daily round trip on a public bus, while the poorest households are excluded. Minibuses are more frequently used than large, official buses (Accra 52% vs. 10%, Bamako 10% vs. 1% and Nairobi 29% vs. 7%) (Kumar and Barrett, 2008). Fares for minibuses vary and are often lower than those for large buses (the cost of a trip with minibus compared to a large bus is on average USD 0.25/0.31 per trip (World Bank, 2011). On average, lowest-income quintile households spend 30-50% of their disposable income on daily commutes a month, though commutes cost as much as 105% of their income in Lagos.
Structures of public transport systems have a disproportionate influence on women’s time use and well-being. Women are less likely to drive and more likely to make multiple trips and use multiple forms of transport. In Bamako, for example, 87% of women walk for almost all trips compared to 57% of men. Thus, bus timetables, costs of transport and travel routes that do not take women’s specific travel needs into account can increase the time and costs of travel and consequently women’s time poverty.
The availability of transport and services cause large differences of accessibility between income groups. In low-income countries, one in five respondents to the Afrobarometer survey has no access to transport services. In upper-middle-income countries, over 80% of respondents live in areas with at least three infrastructure services at their disposal (Leo, Morello and Ramachandran, 2015).
Urban planning and governance should focus on informal settlements
Human settlements in Africa have largely grown unplanned (UN-Habitat, 2014; 2008; Grant, 2015). Master plans for African cities were conceived during the colonial period, based on European experience of cities. Few of these plans were implemented as they did not fit with Africa’s social, political or economic specificities. The rural bias in the 1970s also contributed to the policy makers’ difficulty in coherently planning cities. The shortages of qualified and (active) planners and other built-environment professionals have compounded inadequate planning systems, legal frameworks, and obsolete building standards (Silva, 2015). Moreover, most countries suffer from insufficient funds to carry out urban planning. Some must face challenges of poor governance, corruption and wasted resources.
Urban planning should take account of informal settlements. Some governments have viewed cities’ informal settlements, where most urban inhabitants work and live, as leading to a waste of resources. Legislation has sometimes ensnared urban planning, like in the eviction case of 700 000 informal settlers during operation Murambatsvina in Zimbabwe in 2005 (Watson and Agbola, 2013). Urban planning has recently focused on retrofitting central business districts or planning new satellite towns altogether. Certain large-scale luxury projects and gated communities have created spatial segregation and bypassed the development of slums.
The share of public space for parks and roads in Africa’s urban land is about 15-20%. This is half of the world’s average of 30-40%. According to UN-Habitat (2013), the generally accepted minimum standard for public space in urban areas is 45%, broken down into 30% for streets and sidewalks and 15% for green spaces. This standard aims to achieve a minimum density of 150 inhabitants per hectare.

6. tHE iMPliCAtiONS OF AFriCA’S UrBANiSAtiON FOr StrUCtUrAl trANSFOrMAtiON6. tHE iMPliCAtiONS OF AFriCA’S UrBANiSAtiON FOr StrUCtUrAl trANSFOrMAtiON
177African Economic Outlook© AfDB, OECD, UNDP 2016176 African Economic Outlook © AfDB, OECD, UNDP 2016
Box 6.6. Cities for the next two billion urban dwellers
The current United Nations population projections suggest that the world will add over 2.3 billion new urban dwellers between 2015 and 2050. The total urban population at mid-century will exceed the entire global population in 2000. Urban form tends to last, and the lock-in effects from urbanisation decisions endure, so the urbanisation decisions of the next 30-60 years are likely to shape living conditions on earth for centuries to come.
Massive urban growth is both a challenge and an opportunity. It is a challenge because mistakes will be costly to reverse. It is an opportunity for reforms of all types. Thus urbanisation and structural transformation need to reinforce one another, especially through the use of urbanisation policies. Urbanisation policies must address issues such as human capital, entrepreneurship and industrialisation, as well as the core urban concerns of infrastructure and urban form.
Environmentally, the stakes are high. The emergence of sprawling, car-dependent cities for the next two or three billion urbanites would be a huge environmental setback. At the same time, policies favouring transit-oriented development, green building design and sustainable land use could help make the current wave of urbanisation part of the solution to the world’s environmental challenges, rather than part of the problem (OECD, 2012c). However, time is running out: cities are growing fast and in much of the world they are growing in ways that augur ill for the future when it comes to issues like climate change and air quality.
The experiences of OECD countries, where urbanisation is largely complete, point to some important lessons for today’s fast-urbanising countries:
• Governance matters. Successful cities require co-ordination across policy sectors and jurisdictions. This is especially true of dynamic issues like resilience and sustainability. Governments must build them into institutions and policy processes, rather than considering them as isolated objectives to be attained by this or that policy intervention.
• Some mistakes are harder to rectify than others. For example, the failure to set aside land for public infrastructure and amenities or to provide for an arterial grid of roads can be incredibly costly, or even impossible, to correct once development has taken place and land prices have risen.
National urban policies are critical to all of this. Even where powers are devolved, senior governments largely determine both what cities can do and what they have incentives to do. National policy makers need to be attentive to the way sectoral policies may create unexpected or unwelcome incentives and constraints for cities – as, for example, when regulatory and property tax regimes favour extensive development, in contradiction to policies aimed at curbing sprawl.
Source: OECD (2014; 2015).
now is the time to prepare for Africa’s urban transition
Africa has the opportunity to promote sustainable urbanisation and accelerate structural transformation
Africa’s fast pace of urbanisation requires massive investment in infrastructure. In order to accommodate African urbanites, governments and the private sector will have to invest twice as much by 2050 as they have since the years of independence. Investments in urban infrastructure have strong lock-in effects and can determine city

6. tHE iMPliCAtiONS OF AFriCA’S UrBANiSAtiON FOr StrUCtUrAl trANSFOrMAtiON
178 African Economic Outlook © AfDB, OECD, UNDP 2016
growth half a century after they have been made. Experience from OECD countries shows that retrofitting infrastructure can prove much more costly than carrying out early “no regret” policies (Brahmbhatt et al., forthcoming).
Policy makers are increasingly aware of urbanisation’s central place in the process of structural transformation (UN-Habitat and UNECA, 2015). Four-fifths of survey respondents consider urbanisation as an opportunity for sustainable development (Figure 6.24). This departs from the post-independence approach which tended to dismiss Africa’s urbanisation as too fast, unmanageable and needing to be constrained (Box 6.7 on urban bias). However, policies attempting to restrain urbanisation instead of tapping its potential for structural transformation remain commonplace. According to a United Nations survey, 80% of African countries continue to desire a “major change in the spatial distribution of their population”, and a similar proportion (85%) have implemented policies to limit rural-urban migration (UN, 2013: 109; 114).
Box 6.7. Economists’ “urban bias” in a rural Africa
The concept of the urban bias largely emerged after African countries’ independence. This academic debate contending that cities are harmful to rural development has pitted the rural against the urban and negatively influenced the perception of the role cities can play in Africa’s development (Yatta, 2016). Development economists have developed three main notions of the “urban bias”:
• As a “price twist” leading to rural exploitation by the urban. Developed in the late 1960 and 1970s, this model of price twists describes how prices of goods produced in cities are significantly higher than rural products, whereas agricultural products are sold under value (Corbridge and Jones, 2005).
• As an investment monopoly parasitic to the national economy. Cities absorb a large proportion of the national budget and become net consumers of credits while rural areas provide supply (Schikele, 1968; Chandavarkar, 1985).
• As a waste of human resources by attracting the rural labour force into the unproductive urban informal sector and creating food scarcity (Dumont, 1966; Balogh, 1966). The seminal Todaro Paradox showed that increasing urban working opportunities would increase urban unemployment by attracting more rural-urban migration (Todaro, 1969).
International organisations have echoed this academic debate. The World Bank’s “Berg-Report” suggested that ruling regimes in sub-Saharan Africa imposed urban-biased policies to muffle unrest in towns and cities and support their interest group (Berg, 1981).
By the 1990s, the stance of international organisations started changing. In 1991, the World Bank highlighted how urban economic activities could positively influence economic growth (World Bank, 1991). Founded in 1999 at the Summit of Mayors, the joint World Bank-UNDP initiative City Alliances’ “Cities Without Slums” started to address urban poverty in developing countries. This more positive perspective was echoed in the World Development Report 2009: Reshaping Economic Geography (World Bank, 2009).
The ongoing international debates on the roles of cities and human settlements in advancing regional and global development agendas are therefore an important opportunity to rethink policies. Those that have shaped current, unsatisfactory outcomes can be made more conducive in the future to sustainable development and effective sustainable transformation.

6. tHE iMPliCAtiONS OF AFriCA’S UrBANiSAtiON FOr StrUCtUrAl trANSFOrMAtiON6. tHE iMPliCAtiONS OF AFriCA’S UrBANiSAtiON FOr StrUCtUrAl trANSFOrMAtiON
179African Economic Outlook© AfDB, OECD, UNDP 2016178 African Economic Outlook © AfDB, OECD, UNDP 2016
Figure 6.24. Is urbanisation perceived as a risk or an opportunity in your country?
81%
19%
Opportunity
Risk
Note: Survey responses by country economists of the AfDB and UNDP in 48 country offices in Africa. Response is weighted by one per country.Source: AEO experts’ survey, 2016.12 http://dx.doi.org/10.1787/888933350754
International events highlight Africa’s urbanisation and structural transformation
Today, the political momentum is focusing on urbanisation and structural transformation at both pan-African and global levels (Table 6.5). The African Union is developing its urbanisation agenda to support Africa Agenda 2063 in co-ordination with global partners. UN-Habitat’s African Urban Agenda (AUA) is supported by Ghana and Nigeria and strives for the buy-in of other African governments. This momentum inspired the drafting of the Abuja Declaration in February 2016, with a view to feeding a Common African Position for the Third United Nations Conference on Housing and Sustainable Urban Development (Habitat III) as “a people-centred and leadership-driven process”. The continent aspires to speak with one voice in order for the New Urban Agenda to reflect the pan-African vision of Agenda 2063.
Table 6.5. Pan-African and international events on sustainable urbanisation11 and structural transformation, 2014-18
2014 The African Union establishes a Specialized Technical Committee on Public Service, Local Government, Urban Development and Decentralization, gathering African Ministers of Housing and Urban Development.
January 2014 The African Union’s African Common Position on the Post-2015 Agenda prioritises “Structural economic transformation and inclusive growth”.
March 2015 UN-Habitat and the Economic Commission for Africa hold a side event on the Role of Urbanisation in the Structural Transformation of Africa at the Eighth Joint Annual Meeting of the African Union’s Specialized Technical Committee on Finance, Monetary Affairs, Economic Planning and Integration/UNECA Conference of African Ministers of Finance, Planning and Economic Development in Addis Ababa, Ethiopia.
April 2015 African Ministers of Housing and Urban Development initiate a process of drafting an Africa Common Position on the Third UN Conference on Housing and Sustainable Urban Development (Habitat III).
June 2015 The First Ten Years Implementation Plan (2014-23) of the African Union’s Agenda 2063, which lays out the objective of increasing urban investment, is adopted at the 25th Summit of the African Union.
September 2015 The African Union announces it will develop an African Charter on Urban Development and Human Settlements.
December 2015 The 7th Africities Summit is held in Johannesburg, South Africa, co-organised by United Cities and Local Governments of Africa.
March 2016 During the Africa Regional Conference on Habitat III in Abuja, Nigeria, African ministers and civil society organisations adopt the Abuja Declaration opening the way to a Common African Position to Habitat III.
July 2016 African heads of states are scheduled to adopt a Common African Position to Habitat III.
October 2016 Habitat III will be held in Quito, Ecuador.
November 2016 The 22nd session of the Conference of the Parties (COP 22) to the UN Framework Convention on Climate Change will take place in Marrakech, Morocco.
January 2018 UN-Habitat will host the 9th World Urban Forum in Kuala Lumpur, Malaysia.

6. tHE iMPliCAtiONS OF AFriCA’S UrBANiSAtiON FOr StrUCtUrAl trANSFOrMAtiON
180 African Economic Outlook © AfDB, OECD, UNDP 2016
The Sustainable Development Goal on cities gathers momentum
At the international level, sustainable cities and human settlements are at the heart of the Sustainable Development Goals (SDGs) adopted during the UN General Assembly in September 2015, with SDG 11 aiming to “Make cities and human settlements inclusive, safe, resilient and sustainable”. This new, stand-alone urban goal is path breaking because it acknowledges that cities can be pathways to sustainable development (Parnell, 2015). The Draft Africa Common Position on Habitat III undertakes “to ensure that goal 11, as it stands now, needs to be considered together with goals 8, 9 and 10 on matters relating to promoting economic growth as well as full and productive employment; building infrastructure, industrialization and innovation, as well as reducing inequality within and between countries” (AUHF, 2015).
The Third UN Conference on Housing and Sustainable Urban Development is an opportunity to promote Africa’s position on the New Urban Agenda. The conference aims to secure renewed political commitment for sustainable urban development, assess accomplishments to date, address poverty, and identify new and emerging challenges. Habitat III and the New Urban Agenda will propose a global strategy for urbanisation for the 20 years until the next Habitat conference.

6. tHE iMPliCAtiONS OF AFriCA’S UrBANiSAtiON FOr StrUCtUrAl trANSFOrMAtiON6. tHE iMPliCAtiONS OF AFriCA’S UrBANiSAtiON FOr StrUCtUrAl trANSFOrMAtiON
181African Economic Outlook© AfDB, OECD, UNDP 2016180 African Economic Outlook © AfDB, OECD, UNDP 2016
Annex 6.A1. methodology for the cluster analysis on urbanisation and structural transformation in African countries
This chapter clusters the 54 African countries into five groups to highlight the diversity of their structural transformation processes. The groups are diversifiers, early urbanisers, late urbanisers, agrarians and natural resources-based countries. This cluster analysis identifies common characteristics of countries.
This methodology focuses on country characteristics at the national level. We have clustered the African countries following the four processes of structural transformation described by Timmer and Akkus (2008): i) a declining share of agriculture in GDP and employment, ii) urbanisation, iii) a demographic transition from high rates of births and deaths and iv) the rise of a modern industrial and service economy.
First, we filtered the 54 countries by dropping 12 that had a population of fewer than 2.5 million inhabitants in 2013. Such small countries tend to have a much higher share of urban population than larger countries, and their urbanisation processes differ as well. The primary city of larger countries often has more than 2.5 million inhabitants. Despite their small size, we kept Botswana and Mauritius in the sample because both are widely recognised as typical case studies of structural transformation in Africa.
Second, we identified the natural resources-based countries within the remaining 42. The literature points out the structural differences of resource-based countries compared to non-resource-based countries. Building on previous editions of the African Economic Outlook, we defined natural resources-based countries as those where the production of minerals, metals and hydrocarbons accounts for more than 30% of GDP in 2010 (AfDB/OECD/UNDP/UNECA, 2013: Table 6.3).
Third, we classified countries by their urbanisation levels as of 2015, using UN DESA (2014). We defined countries as:
• urbanised when at least 60% of the population resides in urban areas
• having started the urbanisation process when they have an urbanisation level of at least 40% and less than about 50%
• predominantly rural countries when they have an urbanisation level of less than 20%. We kept Burkina Faso and Mali in this category because their agriculture produces more than 35% of their GDP.
Fourth, we distinguished countries by their total fertility rate (TFR) where most data was available – between 2010 and 2015 – using UN DESA (2014). We based the demographic typology on previous editions of the African Economic Outlook which grouped African countries by their TFR (AfDB/OECD/UNDP, 2015; see also Guengant and May, 2013). We opted to use national TFRs, instead of urban TFRs (Jedwab, Christiaensen and Gindelsky, 2015b), so as to reflect employment challenges at the national level and integrate rural dynamics into the analysis of structural transformation. Using urban TFR would not produce significant differences in the country clustering. This demographic clustering produced the following categories:
• Countries are classified as more advanced in their demographic transition when the TFR falls below 3.5 children per woman, which corresponds approximately to Egypt’s TFR.
• Countries having started the process of fertility transition are those with TFRs between 3.5 and 5.5 children per woman.
• Countries with TFRs of 5.5 children or more are classified as not having started the fertility transition.

6. tHE iMPliCAtiONS OF AFriCA’S UrBANiSAtiON FOr StrUCtUrAl trANSFOrMAtiON
182 African Economic Outlook © AfDB, OECD, UNDP 2016
The economic dimensions used in the cluster analysis are discussed in greater detail throughout Part II of this report.
Using this process, we have classified African countries as shown in Table 6.A1.1.
Table 6.A1.1. African countries clustered into groups according to their levels of structural transformation
Non-resource-based countries Resource-based countries
Diversifiers Advanced in fertility transition, urbanised
Early urbanisers Started fertility transition and urbanising
Late urbanisersStarted fertility transition but not yet urbanising
Agrarians Have not started fertility transition nor urban transition
Natural resources-based countries
Egypt Benin Eritrea Burkina Faso AlgeriaMauritius* Cameroon Ethiopia Burundi AngolaMorocco Côte d’Ivoire Kenya Chad Botswana*South Africa Ghana Madagascar Central African Republic** Republic of the Congo
Tunisia Liberia Mozambique MalawiDemocratic Republic of the Congo
Senegal Rwanda Mali GuineaTogo Sudan Niger Libya
Tanzania Sierra Leone** MauritaniaUganda Nigeria
SomaliaSouth SudanZambiaZimbabwe
Note: * Countries kept in the sample despite having less than 2.5 million inhabitants. ** Central African Republic and Sierra Leone have a total fertility rate of about 4.5 children per woman and an urbanisation level of approximately 40%. Yet their economies are overwhelmingly agrarian (58% of GDP and 56% of GDP respectively).

6. tHE iMPliCAtiONS OF AFriCA’S UrBANiSAtiON FOr StrUCtUrAl trANSFOrMAtiON6. tHE iMPliCAtiONS OF AFriCA’S UrBANiSAtiON FOr StrUCtUrAl trANSFOrMAtiON
183African Economic Outlook© AfDB, OECD, UNDP 2016182 African Economic Outlook © AfDB, OECD, UNDP 2016
Notes
1. United Nations estimates project that Africa will be 50% urbanised in 2037.
2. These countries are Botswana, Ethiopia, Ghana, Kenya, Mauritius, Malawi and Senegal.
3. Weeks (1994) argues that “special factors account in part for Africa’s rapid rates of urbanisation in the immediate postcolonial period. Colonial prohibitions on migration to cities in East Africa – and control of population movements more broadly – were deeply resented. A one-time stock adjustment that may have had little to do with economic factors took place in the early years to compensate”.
4. The UNDP Human Development Index measures countries’ achievements in key dimensions of human development: health, education and standard of living (see Chapter 4). The health dimension includes life expectancy at birth, the education dimension years of schooling for adults aged 25 years and over and expected years of schooling for children of school-entering age. The standard of living is measured by gross national income (GNI) per capita.
5. Many varying definitions of intermediary cities exist. For a working definition, see Annex 6.A3 of the African Economic Outlook 2015 (AfDB/OECD/UNDP, 2015: 170).
6. Only two countries are in the diversifiers group because Gallup asked the question solely to sub-Saharan African countries.
7. UN-Habitat’s “State of World Cities 2008/2009” refers to data from 2005. This comprehensive estimate has not yet been updated.
8. The Gini index measures the extent to which the distribution of income among individuals or households within an economy deviates from a perfectly equal distribution. A Gini index of 0 represents perfect equality, while an index of 100 implies total inequality.
9. “Childhood undernutrition” encompasses “childhood underweight”, “childhood wasting” and “childhood stunting”.
10. A saving and loan agency is a financial institution that offers banking and related financial services, especially savings and mortgage lending. It is equivalent to the term “building society” in the United Kingdom.
11. Sustainable urbanisation is the transition of societies from majority rural to majority urban in a sustainable way. Although it has many dimensions (Allen, 2009), this report focuses on its economic, social and environmental ones.

6. tHE iMPliCAtiONS OF AFriCA’S UrBANiSAtiON FOr StrUCtUrAl trANSFOrMAtiON
184 African Economic Outlook © AfDB, OECD, UNDP 2016
References
ActionAid (2011), Women and the City, ActionAid, Johannesburg.
AfDB (2011), “Middle of the pyramid: Dynamics of the middle class in Africa”, Market Brief, African Development Bank, Tunis.
AfDB (2010), The Bank Group’s Urban Development Strategy: Transforming Africa’s Cities and Towns into Engines of Economic Growth and Social Development, African Development Bank, www.afdb.org/fileadmin/uploads/afdb/Documents/Policy-Documents/Urban-Development%20Strategy-Rev%201.pdf.
AfBD/OECD/UNDP (2015), African Economic Outlook 2015: Regional Development and Spatial Inclusion, OECD Publishing, Paris, http://dx.doi.org/10.1787/aeo-2015-en.
AfDB/OECD/UNDP (2009), “South Africa country note”, African Economic Outlook 2009, OECD Publishing, Paris, http://dx.doi.org/10.1787/aeo-2009-47-en.
AfDB/OECD/UNDP/UNECA (2013), African Economic Outlook 2013: Structural Transformation and Natural Resources, OECD Publishing, Paris, http://dx.doi.org/10.1787/aeo-2013-en.
Afrobarometer (2015), Afrobarometer database, www.afrobarometer.org/data (accessed in February 2016).
Agergaard, J., N. Fold and K. Gough (eds.) (2010), Rural-Urban Dynamics: Livelihoods, mobility and markets in African and Asian Frontiers, Routledge, Abingdon, Oxon, UK.
Alkire, S. and G. Robles (2015), Multidimensional Poverty Index 2015: Brief Methodological Note and Results, Oxford Poverty and Human Development Initiative, Oxford, UK.
Allen, A. (2009), “Sustainable cities or sustainable urbanisation?”, Palette: UCL’s Journal of Sustainable Cities, summer.
Angel, S. et al. (2010a), “A planet of cities: Urban land cover estimates and projections for all countries, 2000-2050”, Lincoln Institute of Land and Policy Working Papers, No.10SA3.
Angel, S. et al. (2010b), Atlas of Urban Expansion, Lincoln Institute of Land and Policy, www.lincolninst.edu/subcenters/atlas-urban-expansion (accessed in February 2016).
AUHF (2015), “Draft Africa common position on Habitat III (guided by Agenda 2063)”, African Union, www.auhf.co.za/wordpress/assets/Draft-Africa-Common-Position-on-Habitat-III.pdf.
Bairoch, P. (1988), Cities and Economic Development, From the Dawn of History to the Present, Mansell, London, UK.
Barrios, S., L. Bertinelli and E. Strobl (2006), “Climatic change and rural-urban migration: The case of sub-saharan Africa”, Core Discussion Paper No. 2006/46, http://papers.ssrn.com/sol3/papers.cfm?abstract_id=925652&download=yes (accessed in March 2016).
Berdegué, J. and F. Proctor (2014), “Inclusive rural-urban linkages”, Working Paper Series, No. 123, Working Group: Development with Territorial Cohesion, Territorial Cohesion for Development Program, Rimisp, Santiago, Chile.
Brahmbhatt, M. et al. (forthcoming), “Economic transformation and lessons from development experience for building a new climate economy in low-income Africa”, joint report of the New Climate Economy and the Overseas Development Institute, London and Washington, DC.
Braimoh, A.K. and T. Onishi (2007), “Spatial determinants of urban land use change in Lagos, Nigeria”, Land Use Policy, Vol. 24/2, pp. 502-515, http://doi.org/10.1016/j.landusepol.2006.09.001.
Brockerhoff, M. (1995), “Child survival in big cities: The disadvantages of migrants”, Social Science and Medicine, Vol. 40/10, pp. 1371-1383, http://doi.org/10.1016/0277-9536(94)00268-X.
Brown, S., A.S. Kebede and R.J. Nicholls (2011), Sea-Level Rise and Impacts in Africa, 2000 to 2100, report by the School of Civil engineering and the Environment, www.unep.org/climatechange/adaptation/Portals/133/documents/AdaptCost/9%20Sea%20Level%20Rise%20Report%20Jan%202010.pdf.
Brundtland Commission (1987), Report of the World Commission on Environment and Development: Our Common Future, Oxford University Press.
Burke, M., S.M. Hsiang and E. Miguel (2015), “Global non-linear effect of temperature on economic production”, Nature, Vol. 527, pp. 235-239, http://doi.org/10.1038/nature15725.
CAHF (2015), “Housing finance in Africa, a review of some of Africa’s housing finance markets”, 2015 Yearbook, Centre for Affordable Housing Finance in Africa (CAHF) Publishing.
Campbell, E.H. (2006), “Urban refugees in Nairobi: Problems of protection, mechanisms of survival, and possibilities for integration”, Journal of Refugee Studies, Vol. 19/3, pp. 396-413, http://doi.org/10.1093/jrs/fel011.
CGLUA (2014), État des finances locales en Afrique, Cités et Gouvernements Locaux Unis d’Afrique (CGLUA), Rabat, Morocco.

6. tHE iMPliCAtiONS OF AFriCA’S UrBANiSAtiON FOr StrUCtUrAl trANSFOrMAtiON6. tHE iMPliCAtiONS OF AFriCA’S UrBANiSAtiON FOr StrUCtUrAl trANSFOrMAtiON
185African Economic Outlook© AfDB, OECD, UNDP 2016184 African Economic Outlook © AfDB, OECD, UNDP 2016
Chen, M. et al. (2014), “The global pattern of urbanization and economic growth: Evidence from the last three decades”, PLOS One, Vol. 9/8, e103799, http://doi.org/10.1371/journal.pone.0103799.
Clark, P. (2009), European Cities and Towns 400-2000, Oxford University Press, Oxford, UK.
Collier, P. (2016), “African urbanization: An analytic policy guide”, International Growth Centre, www.theigc.org/wp-content/uploads/2016/01/African-UrbanizationJan2016_Collier_Formatted-1.pdf.
Collier, P. (2013), “Building African cities that work”, paper prepared for the Centre for Development and Enterprise, commissioned for Cities of Hope project.
Corbridge, S. and G.A. Jones (2005), “The continuing debate about urban bias: The thesis, its critics, its influence, and implications for poverty reduction”, Environmental and Spatial Analysis Research Papers, No. 99, London School of Economics and Political Science, Department of Geography and Environment, London, UK.
Cortes, G. and L. Fayet (2009), Les circulations transnationales, Armand Colin.
Currie, P. et al. (2015), “Towards urban resource flow estimates in data scarce environments: The case of African cities”, Journal of Environmental Protection, Vol. 6, pp. 1066/1083.
De Vries, G., M. Timmer and K. de Vries (2015), “Structural transformation in Africa: Static gains , dynamic losses”, The Journal of Development Studies, Vol. 51/6, pp. 674-688, http://doi.org/10.1080/00220388.2014.997222.
Diop, A. (2010), « Les nouveaux enjeux de l’aménagement du territoire : à la recherche de territoire pertinents de développement », in Systèmes spatiaux et structures régionales en Afrique, Khartala, Paris.
Duranton, G. and D. Puga (2004), “Micro-foundations of urban agglomeration economies”, in Henderson, J.V. and J.F. Thisse (eds.), Handbook of Regional and Urban Economics, 1st Edition.
Dustmann, C. and A. Okatenko (2014), “Out-migration, wealth constraints, and the quality of local amenities”, Journal of Development Economics, Vol. 110, pp. 52-63. http://doi.org/10.1016/j.jdeveco.2014.05.008.
FAO (2014), Understanding the Drought Impact of El Nino on the Global Agricultural Areas: An Assessment Using FAO’s Agricultural Stress Index (ASI), Food and Agricultural Organization of the United Nations, Rome.
FAO (2012), Growing Greener Cities in Africa: First Status Report on Urban and Peri-urban Horticulture in Africa, Food and Agricultural Organization of the United Nations, Rome.
FAO (2008), “Africa could reduce greenhouse gases”, Food and Agricultural Organization of the United Nations, Rome, www.fao.org/news/story/en/item/8664/icode (accessed in March 2016).
Fei, J.C.H. and G. Ranis (1963), “Innovation, capital accumulation, and economic development”, The American Economic Review, Vol. 53/3, pp. 283-313, www.jstor.org/stable/1809159.
Foster V. and C. Briceno-Garmendia (eds.) (2010), Africa’s Infrastructure: A Time for Transformation, a co-publication of the Agence Française de Development and the World Bank.
Gallup World Poll (2015), Gallup World Poll (database), www.gallup.com/services/170945/world-poll.aspx (accessed in February 2016).
Glaeser, H. (2012), Triumph of the City, How our Greatest Invention Makes Us Richer, Smarter, Greener, Healthier and Happier, Macmillan Publisher, London, UK.
Global Centre for Food Systems Innovation (2014), Population Growth, Climate Change and Pressure on the Land – Eastern and Southern Africa, Michigan State University.
Gollin, D., S. Parente and R. Rogerson (2002), “The role of agriculture in development”, The American Economic Review, Vol. 92/2, pp. 160-164, http://doi.org/10.2307/3083394.
Grant, R. (2015), “Sustainable African urban futures: Stocktaking and critical reflection on proposed urban projects”, American Behavioral Scientist, Vol. 59, pp. 294-310, http://doi.org/10.1177/0002764214550301.
Graumann, J. (1977), Orders of Magnitude of the World’s Urban and Rural Population in History, Population Division of the Department of Economic and Social Affairs, United Nations, http://esa.un.org/unpd/wup/Archive/Files/studies/United%20Nations%20%281977%29%20-%20Orders%20of%20magnitude%20of%20the%20world’s%20urban%20population%20in%20history.PDF.
Guétat-Bernard, H. (1998), «Nouvelles articulations villes-campagnes : pluri- appartenance et mobilité spatiale et professionnelle des ruraux du delta du Nil», L’Espace Géographique, Vol. 27/3, pp. 253-264.
Haggblade, S., P.B.R. Hazell and T. Reardon (eds.) (2007), Transforming the Rural Nonfarm Economy, Opportunities and Threats in the Developing World, International Food Policy Research Institute, The John Hopkins University Press, Baltimore.

6. tHE iMPliCAtiONS OF AFriCA’S UrBANiSAtiON FOr StrUCtUrAl trANSFOrMAtiON
186 African Economic Outlook © AfDB, OECD, UNDP 2016
Haggblade, S., P. Hazell and J. Brown (1989), “Farm-nonfarm linkages in rural sub-Saharan Africa”, World Development, Vol. 17/8, pp. 1173-1201, http://doi.org/10.1016/0305-750X(89)90232-5.
Hardy, C.H. and A.L. Nel (2015), “Data and techniques for studying the urban heat island effect in Johannesburg”, The International Archives of the Photogrammetry, Remote Sensing and Spatial information Sciences, Vol. XL/W3, 36th International Symposium on Remote Sensing of Environment, Berlin.
Henderson, V. (2003), “The urbanization process and economic growth: The so-what question”, Journal of Economic Growth, Vol. 8/1, pp. 47-71, http://doi.org/10.1023/A:1022860800744.
Henderson, V., A. Storeygard and U. Deichmann (2014), “Is climate change driving urbanization in Africa?”, World Bank Policy Research Working Paper.
Huang, Q. and Y. Lu (2015), “The effect of urban heat island on climate warming in the Yangtze River delta urban agglomeration in China”, International Journal of Environmental Research and Public Health, Vol. 12/8, pp. 8773-8789.
ILO (2012), Statistical update on employment in the informal economy, ILO-Department of Statistics, http://laborsta.ilo.org/applv8/data/INFORMAL_ECONOMY/2012-06-Statistical%20update%20-%20v2.pdf.
ILO (2002), Decent Work and the Informal Economy, International Labour Conference 90th
session, International Labour Organization.
IPCC (2007), Climate Change Report: Synthesis Report, Contribution of Working Groups I, II and III to the Fourth Assessment Report of the Intergovernmental Panel on Climate Change.
Jedwab, R. (2013), “Urbanization without structural transformation: Evidence from consumption cities in Africa”, Working Paper, George Washington University, Washington, DC.
Jedwab, R., L. Christiaensen and M. Gindelsky (2015), “Demography, urbanization and development: Rural push, urban pull and…urban push?”, World Bank Policy Research Working Paper, No. 7333, http://home.gwu.edu/~jedwab/JGC2015_JUE_WebAppx.pdf.
Johnston, B.F. and J.W. Mellor (1961), “The role of agriculture in economic development”, American Economic Review, Vol. 51, http://doi.org/10.1300/J064v07n02_10.
Kamal-Chaoui, L. and A. Robert (2009), “Competitive cities and climate change”, OECD RegionalDevelopment Working Papers, No. 2009/02, OECD Publishing, Paris, http://dx.doi.org/10.1787/218830433146.
Kayizzi-Mugerwa, S., A. Shimeles and N.D. Yaméogo (eds.) (2014), Urbanization and Socio-Economic Development in Africa: Challenges and Opportunities, Routledge African Studies, New York.
Kessides, C. (2005), “The urban transition in sub-saharan Africa : Implications for economic growth and poverty reduction”, Transport and Urban Development Department, Working Paper Series, No. 97, World Bank, www.worldbank.org/afr/wps/wp97.pdf.
Kester, A.A. (2014), “Emerging’ new cities’ in Africa and socio-spatial inequality : A case study of the Eko Atlantic City project in Lagos, Nigeria”, Thesis submitted at the University of Amsterdam, Netherlands.
King, N. and M. Napier (2015), “Market interventions for sustainable cities: Understanding land markets”, The Urban Land Paper Series, Vol. 1, South African Cities Network.
Kremer, M. (1993), “Population growth and technological change: One million B.C. to 1990”, The Quarterly Journal of Economics, Vol. 108/3, pp. 681-716.
Krugman, P. (1991), “Increasing returns and economic geography”, The Journal of Political Economy, Vol.99/3, pp. 483-499.
Kumar, A and F. Barrett (2008), Stuck in Traffic: Urban Transport in Africa, Africa Infrastructure Country Diagnostic.
Leo, B., R. Morello and V. Ramachandran (2015), “The face of African infrastructure: Service availability and citizens’ demands”, Center for Global Development, Working Paper 393.
Lewis, W.A. (1954), “Economic development with unlimited supplies of labour”, The Manchester School, Vol.22/2, pp. 139-191, http://doi.org/10.1111/j.1467-9957.1954.tb00021.x.
Lindley, A. (2007), “Protracted displacement and remittances: The view from Eastleigh, Nairobi”, New Issues in Refugee Research, Vol. 143, pp. 1-18, www.unhcr.org/46ea519d2.html.
Losch, B., S. Fréguin-Gresh and E.T White (2013), Transformations rurales et développement : les défis du changement structurel dans un monde globalisé, World Bank and Agence Française de Development.
Losch, B., G. Magrin and J. Imbernon (2013), «A new emerging rural world: An overview of rural change in Africa», Atlas for the NEPAD Rural Futures Programme», Centre de Coopération Internationale en Recherche Agronomique pour le Développement, Montpellier.
Ma Mung, E. (1999), Autonomie, migrations et alterité, submission to earn the Habilitation à diriger des recherches, Université de Poitiers, https://tel.archives-ouvertes.fr/tel-00337679.
McEvoy, C. (2012), “Battering, rape, and lethal violence: A baseline of information on physical threats against women in Nairobi”, Small Arms Survey, Working Paper, No. 13.

6. tHE iMPliCAtiONS OF AFriCA’S UrBANiSAtiON FOr StrUCtUrAl trANSFOrMAtiON6. tHE iMPliCAtiONS OF AFriCA’S UrBANiSAtiON FOr StrUCtUrAl trANSFOrMAtiON
187African Economic Outlook© AfDB, OECD, UNDP 2016186 African Economic Outlook © AfDB, OECD, UNDP 2016
McMillan, M.S. and K. Harttgen (2014), “What is driving the ‘Africa growth miracle’?” NBER Working Paper, No. 20077.
Miossec, J.-M. (1985), «Urbanisation des campagnes et ruralisation des villes en Tunisie», Annales de Géographie, Vol. 94/521, pp. 38-62.
Mo Ibrahim Foundation (2015), Facts and Figures: African Urban Dynamics, http://static.moibrahimfoundation.org/u/2015/11/19115202/2015-Facts-Figures-African-Urban-Dynamics.pdf.
Moriconi-Ebrard, F., D. Harre and P. Heinrigs (2016), Urbanisation Dynamics in West Africa 1950-2010: Africapolis I, 2015 Update, West African Studies, OECD Publishing, Paris, http://dx.doi.org/10.1787/9789264252233-en.
Naudé, W. (2008), “Conflict, disasters and no jobs: Reasons for international migration from sub-Saharan Africa”, Research Paper (85), United Nations University - WIDER.
OECD (2016), A New Rural Development Paradigm for the 21st Century: A Toolkit for Developing Countries, Development Centre Studies, OECD Publishing, Paris, http://dx.doi.org/10.1787/9789264252271-en.
OECD (2015), The Metropolitan Century: Understanding Urbanisation and Its Consequences, OECD Publishing, Paris, http://dx.doi.org/10.1787/9789264228733-en.
OECD (2014), Regional Outlook: Regions and Cities: Where Policies and People Meet, OECD Publishing, Paris, http://dx.doi.org/ 10.1787/9789264201415-en.
OECD (2013), Settlement, Market and Food Security, West African Studies, OECD Publishing, Paris, http://dx.doi.org/10.1787/9789264187443-en.
OECD (2012a), Promoting Growth in All Regions, OECD Publishing, Paris, http://dx.doi.org/10.1787/9789264174634-en.
OECD (2012b), Mortality Risk Valuation in Environment, Health and Transport Policies, OECD Publishing, Paris, http://dx.doi.org/10.1787/9789264130807-en.
OECD (2012c), Compact City Policies: A Comparative Assessment, OECD Green Growth Studies, OECD Publishing, http://dx.doi.org/10.1787/9789264167865-en.
OECD (2008), Territorial Reviews of Cape Town, South Africa, OECD Publishing, Paris, http://dx.doi.org/10.1787/9789264049642-en.
OECD (2006), Competitive Cities in the Global Economy, OECD Publishing, Paris, http://dx.doi.org/ 10.1787/9789264027091-en.
Parnell, S. (2016), “Defining a global urban development agenda”, World Development, Vol. 78, pp. 529-540, http://doi.org/10.1016/j.worlddev.2015.10.028.
Parnell, S., E. Pieterse and G. Haysom (2016), African Dreams: Locating Urban Life and Infrastructure in the Post 2015 Developmental Agenda.
Paulais, T. (2012), Financing Africa’s Cities: The Imperative of Local Investment, World Bank, Washington, DC, http://doi.org/10.1596/978-0-8213-9455-7.
Pauleit, S. et al. (eds.) (2015), “Urban vulnerability and climate change in Africa”, Future City, Vol. 4, Springer International Publishing Switzerland, DOI: 10.1007/978-3-319-03982-4.
Pew Research Centre (2015), Global Attitudes and Trends (database), www.pewglobal.org (accessed in February 2016).
Potts, D. (2013), “Cities of hope: Accelerating access to urban opportunities for young people in the developing world”, paper prepared for the Centre for Development and Enterprise, commissioned for Cities of Hope project.
Potts, D. (2012), “Whatever happened to Africa’s rapid urbanisation?”, Counterpoints Series, Africa Research Institute, http://dspace.cigilibrary.org/jspui/handle/123456789/32571.
Potts, D (2009), “The slowing of sub-Saharan Africa’s urbanization: Evidence and implications for urban livelihoods”, Environment and Urbanization, Vol. 21/1, pp. 253-259.
RCK (2006), Improving Security and the State of Migration in Kenya: The Refugee Bill 2006, The Refugee Consortium of Kenya, Nairobi.
Rodrik, D. (2015), “Premature deindustrialization”, Economics Working paper, No. 107, School of Social Science, Institute for Advanced Study, Princeton.
Rodrik, D (2014), “The future of economic transformation in developing countries”, www.odi.org/events/4213-economic-transformation-growth-dani-rodrik.
Roy, R. (forthcoming), “The cost of air pollution in Africa”, OECD Development Centre Working Paper, Paris.
Silva, C.N (eds.) (2015), “Urban Planning in Sub-Saharan Africa”, in Urban Planning in Sub-Saharan Africa, Colonial and Post-Colonial planning Cultures, Routledge.
Spence, M. (2012), The Next Convergence: The Future of Economic Growth in a Multispeed World, New York, Farrar, Straus and Giroux.

6. tHE iMPliCAtiONS OF AFriCA’S UrBANiSAtiON FOr StrUCtUrAl trANSFOrMAtiON
188 African Economic Outlook © AfDB, OECD, UNDP 2016
Spence, M., P. Clarke Annez and R.M. Buckley (eds.) (2009), Urbanization and Growth, Commission on Growth and Development, World Bank, Washington, DC.
Statistics South Africa (2013), National Household Travel Survey, Statistical release P0320.
Swilling, M. (2015), Greening African Cities: Urbanization, Structural Transformation and Sustainable Resource Use, report commissioned by United Nations Economic Commission for Africa.
Tacoli, C. (2003), “The links between urban and rural development”, Environment & Urbanization, Vol. 15/1, pp.1-10, http://pubs.iied.org/pdfs/G00486.pdf.
Tacoli, C., G. McGranahan and D. Satterthwaite (2015), “Urbanisation, rural-urban migration and urban poverty”, IIED Working Paper, London, http://pubs.iied.org/10725IIED.
Timmer, B. and S. Akkus (2008), “The structural transformation as a pathway out of poverty: Analytics, empirics and politics”, Center for Global Development, Working Paper, No. 150.
Timmer, M., G. de Vries and K. de Vries (2014), “Patterns of structural change in developing countries”, Groningen Growth and Development Centre (GGDC), Research Memorandum, No. 149, www.ggdc.net/publications/memorandum/gd149.pdf.
Todaro, M.P. (1969), “A model of labor migration and urban unemployment in less developed countries”, The American Economic Review, Vol. 59, No. 1, pp. 138-148, www.jstor.org/stable/1811100UCGL (2007), United Cities and Local Governments network Support Paper on Local Finance, background paper to the UCLG Policy Paper in Local Finance, UCLG, Barcelona.
Turok, I. (2014), “Cities as drivers of development”, in S. Kayizzi-Mugerwa, A. Shimeles and N.D. Yaméogo (eds.) (2014), Urbanization and Socio-Economic Development in Africa: Challenges and Opportunities, Routledge African Studies, New York.
UCGL (2007), “United cities and local governments network support paper on local finance”, background paper to the UCLG Policy Paper in Local Finance, United Cities and Local Governments, Barcelona.
UN (n.d.), Introduction and Proposed Targets on Sustainable Development for the Post-2015 Development Agenda: Zero Draft Rev. 1, United Nations, New York, https://sustainabledevelopment.un.org/content/documents/4523zerodraft.pdf.
UN (2013), World Population Policies 2013, Department of Economic and Social Affairs, ST/ESA/SER.A/341, United Nations.
UN et al. (2010), “The right to water”, Fact Sheet, No. 35, United Nations.
UN DESA (2015), World Population Prospects (database), United Nations Department of Economic and Social Affairs, http://esa.un.org/unpd/wpp.
UN DESA (2014), World Urbanization Prospects (database), United Nations Department of Economic and Social Affairs, http://esa.un.org/unpd/wup.
UN Women (2013), Safe Cities Global Initiative, NY, www.unwomen.org/~/media/headquarters/attachments/sections/library/publications/2013/12/un%20women-evaw-safecities-brief_us-web%20pdf.ashx.
UN-Habitat (2014), State of African Cities 2014: Reinventing the Urban Transition, Nairobi.
UN-Habitat (2013.) Streets as Public Spaces and Drivers of Urban Prosperity, Nairobi.
UN-Habitat (2010a), State of the World’s Cities 2010/2011, Bridging the Urban Divide, Nairobi.
UN-Habitat (2010b), The State of African Cities 2010: Governance, Inequality and Urban Land markets, Nairobi, http://doi.org/10.1163/156853010X510807.
UN-Habitat (2008), State of the World’s Cities 2008/2009, Harmonious Cities, State of the World’s Cities report, http://doi.org/10.1142/9789814280730.
UN-Habitat (2006), Analytical Perspective of Pro-Poor Slum Upgrading Frameworks, Nairobi.
UN-Habitat and UNECA (2015), Towards an Africa Urban Agenda, Nairobi.
UNCTAD (2012), Economic Development in Africa Report 2012, Structural Transformation and Sustainable Development in Africa, United Nations Conference on Trade and Development, Unites Nations Publications, Geneva, http://unctad.org/en/PublicationsLibrary/aldcafrica2012_embargo_en.pdf.
UNDP (2011), Human Development Report, Sustainability and Equity: A Better Future for All, United Nations Development Programme.
UNEP (2007), “Fact sheet: Climate change in Africa - What is at stake?”, Excerpts from IPCC reports, the Convention and BAP, www.unep.org/roa/amcen/docs/AMCEN_Events/climate-change/2ndExtra_15Dec/FACT_SHEET_CC_Africa.pdf.
USAID (2010), Angola: Water and Sanitation Profile, United States Agency for International Development, Vermont, www.hip.fhi360.org/page/3332.html.

6. tHE iMPliCAtiONS OF AFriCA’S UrBANiSAtiON FOr StrUCtUrAl trANSFOrMAtiON6. tHE iMPliCAtiONS OF AFriCA’S UrBANiSAtiON FOr StrUCtUrAl trANSFOrMAtiON
189African Economic Outlook© AfDB, OECD, UNDP 2016188 African Economic Outlook © AfDB, OECD, UNDP 2016
Watson, V. and B. Agbola (2013), “Who will plan Africa’s cities”, Counterpoints, Africa Research Institute, www.africaresearchinstitute.org/newsite/wp-content/uploads/2013/09/ARI-Counterpoint-Who-will-plan-Africas-cities1.pdf.
Weeks, J. (1994), “Economic Aspects of Rural–Urban Migration.” In Urbanization in Africa: A Handbook, Tarver, J. (ed.). Greenwood Press, London.
World Bank (2015) World Development Indicators (database), http://data.worldbank.org/data-catalog/world-development-indicators (accessed in February 2015).
World Bank (2011), Africa’s Transport Infrastructure: Mainstreaming Maintenance and Management, World Bank, Washington, DC.
World Bank (2009), World Development Report 2009: Reshaping Economic Geography, World Bank, Washington, DC.
World Bank (2007), Cost of Pollution in China: Economic Estimates of Physical Damages, World Bank, Washington, DC.
World Bank (2005), Infrastructure and the World Bank: A Progress Report, World Bank, Washington, DC.
World Bank (1981), Accelerated Development in Sub-Saharan Africa, World Bank, Washington, DC, http://documents.banquemondiale.org/curated/fr/1981/01/438047/accelerated-development-sub-saharan-africa-agenda-action.
WWF (2016) “Policy demand: Why Africa’s urban transition needs bold actions”, OECD Development Centre Background Papers for African Economic Outlook 2016.
Yatta, F. (2016), Urbanisation et transformation structurelle en Afrique : comment supprimer les contraintes qui entravent le développement des économies locales, OECD Development Centre Background Papers for African Economic Outlook 2016.
Zheng, S and M.E. Kahn (2013), “Understanding China’s urban pollution dynamics”, Journal of Economic Literature, Vol. 51/3, pp. 731-772.


191African Economic Outlook© AfDB, OECD, UNDP 2016
Urbanisation can be an important driver of Africa’s sustainable
development. As Chapter 6 shows, however, this requires new, more
effective urban development policies. This chapter identifies the
main channels through which urbanisation can accelerate economic,
social and environmental development, as well as the policy
options to seize those opportunities for structural transformation.
Good practices in Africa highlight the need for place-based and
participative policies to develop more sustainable cities.
Chapter 7
How sustainable cities can contribute to Africa’s development

7. HOW SUStAiNABlE CitiES CAN CONtriBUtE tO AFriCA’S DEVElOPMENt
192 African Economic Outlook © AfDB, OECD, UNDP 2016
In brief
Urbanisation is playing an essential role in improving sustainable development outcomes in Africa, although it also brings new challenges as Chapters 4 and 6 highlighted. This chapter demonstrates in detail that urbanisation has been improving Africa’s prospects for structural transformation through economic linkages and social innovations. New urban development policies can better harness the potential of sustainable cities to foster three types of development:
• economic development, through higher agricultural productivity, industrialisation, more productive urban services and foreign direct investment (FDI) in urban corridors
• social development, by providing cost-efficient transport systems, safer housing, social safety nets, social businesses on a larger scale and safer cities
• environmental development, by sustainably managing natural resources, notably by providing better access to renewable energy, safe water and sanitation, and sustainable waste collection. Managing urbanisation well will be essential to bridge the energy gap, mitigate the rising cost of air pollution and preserve surrounding ecosystems such as urban wetlands.
An annex to the chapter explains the method used to map FDI flows to African cities.
urbanisation improves the conditions for Africa’s economic development
Urbanisation can contribute to economic development and structural transformation through four main channels:
1. higher agricultural productivity and rural development, by better connecting rural economic activities, in particular food production chains, to large urban markets
2. industrialisation, by providing a favourable business environment where companies realise economies of scale and share knowledge more easily
3. services-led growth, by encouraging innovation and developing the skills of the urban labour force, which will increase the supply of modern services for the growing urban middle class
4. more FDI in African cities, by attracting investment through better connected urban corridors.
Urbanisation is changing the labour and food markets
Africa’s urbanisation could increase agricultural productivity and rural development by changing the labour and food markets. Between 2000 and 2013, Africa’s agricultural sector has maintained a real growth rate of 5.1% per year, well above the population growth rate of 2.7%. Africa’s food system is fundamentally changing, and urbanisation plays a central role in this process. Urbanisation i) creates upward demand for food production in Africa; ii) increases efficiency in post-farm segments; and iii) transforms the rural on-farm and non-farm economy (Reardon and Timmer, 2014). Different types of cities play specific roles in realising these transformations.
Urbanisation increases the consumer base for African food producers
Urban markets have become the main destination of African food production. Domestic and intra-Africa trade account for 95% of the sub-Saharan African food market. The urban sector currently accounts for 40% of the total population, 50% of total food consumption (including home production) and 60% of the food market

7. HOW SUStAiNABlE CitiES CAN CONtriBUtE tO AFriCA’S DEVElOPMENt7. HOW SUStAiNABlE CitiES CAN CONtriBUtE tO AFriCA’S DEVElOPMENt
193African Economic Outlook© AfDB, OECD, UNDP 2016192 African Economic Outlook © AfDB, OECD, UNDP 2016
(Reardon et al., 2013). Food imports from outside of Africa account for less than 5% of the total food market, although large differences appear between countries.1 Figure 7.1 shows that urban food expenditure increased faster than urbanisation in six West African countries between 1990 and 2010. Even if Nigeria’s urban households, for example, spend a lower share of their expenditure on food (at 55%) than rural residents (at 72%), they still spend more in absolute terms thanks to their higher incomes.
Figure 7.1. Change in urbanisation levels and urban share of total food expenditures for major food groups in six West African countries, 1990-2009
10
15
20
25
30
35
40
45
50
55
60
10 15 20 25 30 35 40 45 50 55 60
Share of urban in total food expenditure (%)
Burkina Faso, 1994
Côte d'Ivoire, 1993
Ghana, 1992
Mali, 1989
Nigeria, 2004
Senegal, 1994
Burkina Faso, 2009
Côte d'Ivoire, 2008 Côte d'Ivoire, 2008
Ghana, 2006
Mali, 2006
Nigeria, 2010
Senegal, 2002
Urbanisation level (%)
Note: Major food groups include cereals, roots and tubers, pulses, oils and oilseeds, fruits and vegetables, animal products and fish, beverages, and other food products. Source: Adapted from Table 6.3, AfDB/FAO (2015) and World Bank (2015a).12 http://dx.doi.org/10.1787/888933350768
The more diverse food diets of urban dwellers can raise productivity levels. Following Bennett’s law, African consumers are changing their food preferences from starchy staples towards higher-value processed and pre-prepared food as they become wealthier (De Haen et al., 2003; Popkin, 2001; see Box 7.1). While Asian exporters dominate Africa’s grain markets such as wheat and rice, urban consumers increasingly consume locally available meat and fresh fruits. The African urban middle class2 does not consume a higher share of imported food out of its total consumption than the urban poor. Local products also generate higher margins for farmers: selling meat and dairy products to towns and cities can increase farmers’ income 5 to 10 times per hectare compared to grains (Tschirley et al., 2015a).
In rural areas too, markets increasingly supply food. This is due to more diversified rural economies, spreading urban products, changing lifestyles and farming methods, and better transportation. Stronger rural-urban linkages are helping the rural supply chain meet the demand of urban areas. Evidence abounds of farmers who have increased their production when connected to growing urban and regional markets (Reardon et al., 2013). This is the case of farmers growing teff in Ethiopia, vegetables in Mali or Senegal, or potatoes in Rwanda or of dairy farmers in Kenya. They have invested in soil conservation, added organic matter into their soils, used productivity-enhancing seeds, breeds and fertiliser, as well as irrigation and machines.

7. HOW SUStAiNABlE CitiES CAN CONtriBUtE tO AFriCA’S DEVElOPMENt
194 African Economic Outlook © AfDB, OECD, UNDP 2016
Box 7.1. Urbanisation and the emerging food economy in West Africa
Urbanisation has led to more diversified diets in 17 West African countries. Fruits and vegetables, meat and fish now account for 50% of urban households’ total food expenditure, while consumption of cereals and pulses is declining. All income groups show higher demand for convenience, reflected in the expansion of street food and stronger demand for processed and pre-prepared foods. Processed foods represent 41% of food budgets for urban households, compared to 36% for rural households (Figure 7.2).
The West African food economy is estimated at USD 178 billion for 2010. This represents 36% of regional gross domestic product (GDP), making it the largest sector of the West African economy. In many countries, the domestic food market is becoming more attractive for farmers than traditional export cash crops. The non-agricultural post-harvest activities of the food economy, such as processing, logistics and retail, are developing quickly. The Sahel and West Africa Club estimates that, today, these activities account for 40% of the sector’s value added and will continue to expand with more urbanisation (Allen, forthcoming).
Figure 7.2. Composition of the West African food basket by food groups and area, 2010
A. Urban B. RuralDairy4% Beverages
5%
Other12%
Meat and fish
22%
Grains26%
Fruits and vegetables
31%
Beverages5%
Cereals20%
Unprocessed33%
Processed41%
Dairy2% Beverages
4%
Other13%
Meat and fish
16%
Grains37%
Fruits and vegetables
27%
Beverages4%
Cereals34%
Unprocessed26%
Processed36%
Note: The sample includes 17 West African countries: Benin, Burkina Faso, Cabo Verde, Chad, Côte d’Ivoire, Gambia, Ghana, Guinea, Guinea-Bissau, Liberia, Mali, Mauritania, Niger, Nigeria, Senegal, Sierra Leone and Togo.Sources: OECD (2013a).12 http://dx.doi.org/10.1787/888933350778

7. HOW SUStAiNABlE CitiES CAN CONtriBUtE tO AFriCA’S DEVElOPMENt7. HOW SUStAiNABlE CitiES CAN CONtriBUtE tO AFriCA’S DEVElOPMENt
195African Economic Outlook© AfDB, OECD, UNDP 2016194 African Economic Outlook © AfDB, OECD, UNDP 2016
Urbanisation can benefit the post-farm food value chain
More densely populated places tend to support post-farm segments of food value chains, i.e. activities beyond primary production. These include wholesaling, processing, logistics, distribution, retails and food stalls, which benefit from the economic effects of more concentrated urban areas. The larger pool of urban customers enables firms to avoid under-utilisation and other seasonal effects. Research and development and agricultural extension – training farmers in innovative practices and technologies – benefit from linkages with universities and research institutions, nurturing the cross-sector fertilisation of ideas (Jacobs, 1969). Similar to Asia, a “Quiet Revolution” is emerging in African supply chains whereby small and medium-sized enterprises lead investments in post-farm activities such as trucking, wholesale, warehousing, cold storage, processing and retail (Reardon et al., 2013). In six African countries, urban areas account for 42% of jobs in food marketing and transport and 24% in the food manufacturing segment, even though urban dwellers represent only 22% of the total population (Figure 7.3). Indeed, the efficiency of post-farm activities depends on basic infrastructure available in urban areas and on the connectivity between farms and their urban markets. Efficient transport and electricity are necessary to attract productivity-enhancing investments in cold-chain and storage facilities.
Figure 7.3. Urban share of jobs in each post-farm food segment in six African countries
24
42
52
0
10
20
30
40
50
60
Urbanisation level (22%)
Urban share of jobs in post-farm food segment (%)
Food manufacturing Marketing and transport Food preparation away from home
Note: These six African countries include Ethiopia, Malawi, Mozambique, Tanzania, Uganda and Zambia.Source: Adapted and recalculated from Table VI in Tschirley et al. (2015b).12 http://dx.doi.org/10.1787/888933350788
These post-farm segments of food production offer strong potential to increase the efficiency of the food value chains. In the six African countries mentioned above, the post-farm food segments already account for a total of USD 31 billion, or 39% of domestic food expenditure (Tschirley et al., 2015b). Agglomerations in secondary cities create opportunities for further investment in cold-chain and storage facilities. Such investments are key to enhancing productivity in particular by reducing food spoilage. Total food spoilage could feed about 300 million people per year in sub-Saharan Africa (FAO, 2011). Secondary cities and towns also play an important role in enhancing the efficiency of wholesale markets and supply chains and in helping increase human capital to meet the new skill demands of the food system.

7. HOW SUStAiNABlE CitiES CAN CONtriBUtE tO AFriCA’S DEVElOPMENt
196 African Economic Outlook © AfDB, OECD, UNDP 2016
In some countries, the development of supermarkets contributes to modernising food production (Reardon and Timmer, 2014), but policies are needed to avoid harming traditional small and medium producers and retailers. Demand from supermarkets can accelerate the trend towards farms’ formalisation and commercialisation, by exposing farms to modern technologies through demand for more efficient supply chains. Local supermarkets can also cut intermediary costs by contracting directly with farmers. However, this process of commercialisation can create barriers to entry for small and medium producers and processors. These are typically family farms, which make up the large majority of actors in the food value chain. Ensuring that supermarket development benefits the poor requires a sequenced approach, both fostering productivity, competition and technological learning and applying safeguards for the poor through regulation. Involving retail corporations, smallholders and local communities in adapting regulations over FDI entrance, zoning and opening hours, sourcing requirements, food waste and environmental standards can help ensure proper design and implementation (Altenburg et al., 2016). Opportunities to develop alternative short supply chains should be fostered to diversify food chains and retail options in the interest of both producers and consumers.
Urbanisation can transform the rural non-farm economy
More productive rural non-farm jobs flourish in close proximity to cities and towns. Farmers close to urban areas can also take advantage of employment opportunities in urban and peri-urban areas for seasonal work. The rural non-farm economy needs to sell goods and services in urban areas to function properly. The emergence of local food industries and processing facilities creates more productive employment opportunities than the farming segment, where harvests take up on average three months of labour per year. In Ethiopia, rural households are 30% more likely to start a non-farm enterprise when they are close to clusters of micro-enterprises, and 7% more likely when they are close to clusters of big manufacturing firms in urban areas (Ali and Peerlings, 2012). Labour productivity is highest in food manufacturing, followed by marketing and transport and by food preparation away from home (Figure 7.4).
Figure 7.4. Labour productivity in different segments of the agri-food system in six African countries
0.7
3.5
3.6
3.8
5.1
0 1 2 3 4 5 6
Farming, self-employmentand wage labour
Jobs not in agri-food system
Marketing and transport
Food preparation awayfrom home
Food manufacturing
Value added per job (USD thousand)
Note: These six African countries include Ethiopia, Malawi, Mozambique, Tanzania, Uganda and Zambia.Source: Authors’ adaptation from Table II of Tschirley et al. (2015b).12 http://dx.doi.org/10.1787/888933350796

7. HOW SUStAiNABlE CitiES CAN CONtriBUtE tO AFriCA’S DEVElOPMENt7. HOW SUStAiNABlE CitiES CAN CONtriBUtE tO AFriCA’S DEVElOPMENt
197African Economic Outlook© AfDB, OECD, UNDP 2016196 African Economic Outlook © AfDB, OECD, UNDP 2016
Non-farm activities supported by urbanisation can improve agricultural productivity in four main ways:
1. Income from circular migration and rural non-farm employment is a major purveyor of funds for farm investments.
2. Urbanisation facilitates the development of credit markets and other farm input markets including fertiliser, other farm chemicals, water and machinery, and land rental and purchase/sale markets.
3. Rural workers can buy services from local markets and specialise in their own productions. Specialisation can improve annual labour input per agricultural worker which is an important factor explaining the annual output gap between agricultural and non-agricultural workers. In Ethiopia, Malawi, Tanzania and Uganda, agricultural workers provide 700 working hours a year compared with 1 900 hours a year by non-agricultural workers (Resnick, 2015).
4. Relieving workers from farms increases the land-labour ratio and enables agriculture to adopt modern technologies that are more capital-intensive. In many countries such as the Democratic Republic of the Congo (DRC), Rwanda and Uganda, the availability of arable land is already very low at less than 0.2 hectare per rural worker.
Big and intermediary cities play different roles in the rural transformation
Cities and towns of different sizes play different roles in the transformation process that builds on reciprocal rural-urban linkages. Reardon and Timmer (2014) classify human settlements into three types of zones according to their stage in the transformation. The first, “dynamic, commercial zones”, are the large and medium cities and the surrounding areas within their eight- to ten-hour catchments. The second, “intermediate zones”, facilitate the rural-urban food supply chains and provide economic pull for rural supply. Their climate and ecological conditions offer medium to high potential for agricultural development, however they have not fulfilled this potential yet. The third, “hinterland, traditional, semi-subsistence zones”, are more remote and face much higher ecological and climatic challenges in developing agriculture.
Figure 7.5. Travel time and crop production in sub-Saharan Africa, 2000
0
0.05
0.10
0.15
0.20
0.25
0.30
0.35
0.40
0.45
0.50
0 5 10 15 20 3025
Total crop production/potential
Average travel time to nearest large city (hours)
Note: Each diamond represents travel time deciles based on estimated time to the nearest city with 100 000 or more inhabitants. The line represents an exponential fit of the ten average points. Total crop production/potential measures the ratio of actual crop production (in value terms) to potential crop production (determined by agro-ecology and agronomic characteristics of individual crops and regions). Source: Dorosh et al. (2012).
12 http://dx.doi.org/10.1787/888933350803

7. HOW SUStAiNABlE CitiES CAN CONtriBUtE tO AFriCA’S DEVElOPMENt
198 African Economic Outlook © AfDB, OECD, UNDP 2016
Tanzania offers examples of the first two types of zones. Its primary city, Dar es Salaam, is more advanced in retail transformation than two of its secondary cities, Arusha and Mwanza (Ijumba et al., 2015). Large supermarkets and new formats of retail centres often start in Dar es Salaam before gradually expanding to intermediary cities. Nonetheless, secondary cities connected to global markets can play a complementary role to primary cities: Arusha is more advanced than Dar es Salaam in food processing, with more complex product packaging and more companies having larger national coverage. Productivity in farming, logistics and wholesales depends on their proximity to different types of urban centres. Cities that emerge from rural-urban agricultural linkages, such as the peanut basin in Kaolack, Senegal, have a stronger impact on the development of surrounding rural areas than cities growing as enclaves around extractive activities such as mining (Reardon and Timmer, 2014). In addition, improving access to road infrastructure and urban markets could increasingly exploit agricultural potential in the long term. Dorosh et al. (2012) estimate that reducing the travel time to the nearest city of 100 000 inhabitants from 24 to 4 hours increases the ratio of actual to potential crop production by 16 (Figure 7.5). Greater agricultural production also develops the rural non-farm sector in countries at a lower stage of the post-farm food value chain, creating a virtuous circle of agricultural and rural development.
Cities can provide enabling conditions for Africa’s industrialisation
Urbanisation can create a demand for industrial products, thereby contributing to structural transformation. Rising incomes shift the household demand towards industrial products, while the middle-class preference for diversity allows value-creation through differentiation. Moreover, mending Africa’s infrastructure deficit and building new cities, housing and commercial properties will generate tremendous demand for construction materials and supporting industries. The infrastructure deficit for sub-Saharan Africa alone stands at more than USD 93 billion a year (Foster and Briceño-Garmendia, 2010).
Cities also generate agglomeration economies, which can be classified into three functions: matching, sharing and learning (see Chapters 4 and 6; Kayizzi-Mugerwa, Shimeles and Yaméogo, 2014). First, cities can help firms mix and match their unique requirements for labour, material inputs and premises. The concentrated pool of workers and supply industries allows firms to specialise in their comparative advantage and outsource uncompetitive activities. Subcontractors can take advantage of the group of potential customers inside the clusters to scale up their operations.
Second, the larger scales of cities facilitate access to a wider range of shared services and infrastructure. The concentration of users spreads the fixed cost of indivisible goods and facilities such as public mass transportation, skill training centres, universities and machineries. Investments in cities offer surrounding regions better connectivity to national and global customers. Cities provide a diverse range of inputs that enable increasing returns through product specialisation.
Third, cities enable knowledge sharing and the cross-fertilisation of ideas. Proximity facilitates communication and sharing complex ideas among firms, research hubs and related actors through a process of comparing, competing and collaborating. Close contact generates the trust and formation of formal and informal networks of innovation. The innovation-generated productivity gains attract mobile capital and talent to enforce a virtuous circle of endogenous growth.
A few empirical studies point to a positive relationship between agglomerations and productivity in Africa. However, robust evidence is scarce because of the dearth of quality data and the difficulty of disentangling agglomeration economies from other economic variables. Most studies find that there is a greater presence of localisation

7. HOW SUStAiNABlE CitiES CAN CONtriBUtE tO AFriCA’S DEVElOPMENt7. HOW SUStAiNABlE CitiES CAN CONtriBUtE tO AFriCA’S DEVElOPMENt
199African Economic Outlook© AfDB, OECD, UNDP 2016198 African Economic Outlook © AfDB, OECD, UNDP 2016
economies from a concentration of firms in the same industry, than urbanisation economies stemming from a concentration of firms in various industries:
• Firm-level surveys from Arusha, Dar es Salaam, Mbeya (Tanzania) and Kampala (Uganda), show that increasing the number of firms in the same industry and area by 10% would cut down costs for firms by 0.3-0.4% on average (Iimi, Humphrey and Melibaeva, 2015).
• Using an enterprise census in Ethiopia and controlling for endowment, Siba et al. (2012) find that the entry of each new firm in a cluster increases by 0.91% the total factor productivity of its competing co-locators that produce the same products, but not the total factor productivity of its co-locators producing different products.
• Also in Ethiopia, information sharing enables clustered horticulture farms to achieve a 91% higher sales revenue per worker, a 210% higher value added per worker and a 273% higher gross profit per worker (Mano and Suzuki, 2013). Agglomerated farms frequently share technological knowledge and market information that help improve product quality, deal with diseases and insects, and make decisions based on consumer demands.
Big cities can facilitate innovation and the adoption of new technologies, enabling diversification into new industries and high-tech manufacturing. At a macro level, an economic base with different industries is generally better at absorbing external market risks, such as unpredictable global conditions and fluctuating commodity prices. From a micro perspective, these diversified cities fulfil “nursery” roles by developing new products and trying business processes borrowed from different activities (Duranton and Puga, 2001). This process of trial and error through deductive tinkering adds to the country’s know-how and complexity. This can be measured by the Economic Complexity Index for each country through its export basket. For non-resource-based African countries, the size of the population living in cities of at least one million inhabitants correlates with the country’s level of economic complexity (Figure 7.6). This pattern is also present for the global sample yet not exhibited in the resources-based economies among the five country groups presented in Chapter 6.
Figure 7.6. Population size of big cities and level of economic complexity, 2013
-3
-2
-1
0
1
2
3
12 13 14 15 16 17 18
Non-resources-based African countries Natural resources-based African countries Non-African countries
Other world regions Non-resources-based African countries
Natural resources-based African countries
Economic Complexity Index
Total population living in cities of 1 million inhabitants or more, logarithmic scale
Note: The green solid line is the linear fit for non-resources-based African countries. The black solid line is the linear fit for the group of natural resources-based African countries. The dotted line is the linear fit for non-African countries.Source: Population data from UN DESA (2014) and Center for International Development at Harvard University (2016). 12 http://dx.doi.org/10.1787/888933350814

7. HOW SUStAiNABlE CitiES CAN CONtriBUtE tO AFriCA’S DEVElOPMENt
200 African Economic Outlook © AfDB, OECD, UNDP 2016
By contrast, intermediary cities can specialise in and foster the development of mature industries. Once they have mastered the business processes leading to specialisation, firms switch to mass production and relocate to specialised cities in search of lower production costs. Labour-intensive industries such as textiles thrive in the intermediary cities that offer cheaper labour, land and other inputs for firms and their suppliers.
Cities have supported industrialisation
Cities and urbanisation will play important roles in industrialising Africa. The automobile industry in Durban (South Africa), Casablanca and, more recently, Tangier (Morocco) relies on the skilled-labour pools, available local know-how and interconnected networks among various stakeholders such as universities, research institutions and business associations that epitomise the power of cities. Mauritius’ success in textile industries relied heavily on the shipping capacity of Port Louis and on connective infrastructure between the export processing zone and raw cotton producers (Ramdoo, 2014). Similarly, one-third of Tunisia’s firms are concentrated in two central business districts – Tunis and Sfax – to take advantage of the close proximity to their consumer base (Ayadi and Mattoussi, 2014). Exporting industries tend to agglomerate in specific provinces, such as textile firms in Monastir, chemical firms in Ben Arous and agro-food firms in Sfax and Nabeul. In most African countries, despite some successes, urbanisation has yet to support industrialisation on a larger scale. Examples abound of cities developing their own manufacturing base, generally in the informal sector, which can export intermediate and consumption goods to other African countries (Box 7.2).
Box 7.2. Intermediate cities can develop their manufacturing base
Several intermediate cities in Africa are developing a manufacturing sector based on trade and the existing informal economy.
• Since the late 1990s, Nigeria’s Otigba cluster in Lagos has developed into a sub-regional hub for computer assembly and repairs and for the manufacturing and sales of computer parts.
• Similarly, Nnewi, a city of 750 000 inhabitants in Eastern Nigeria, upgraded from trading imported Japanese automobile spare parts in 1980s to being the manufacturing base of Nigeria’s automobile sector. Today, 70% of automobile components used in Nigeria are sourced domestically, mostly from Nnewi.
• In Ghana, the city of Kumasi houses Suame Magazine, a cluster of artisanal workshops for metal engineering and vehicle repairs. As many as 200 000 people work there with complementary skills such as smelting scrap metal, trading automobile parts, fine-tuning truck engines, and retrofitting electronics. To support common challenges faced by firms in the cluster, Suame Magazine Industrial Development Organisation has been working to scale up training and local manufacturing.
Cities provide an entry point for industrialisation policies
Cities provide a possible entry point for efficient policies that can revive manufacturing industries in Africa. The lack of input industries, weak trade logistics, limited access to finance and to industrial land, as well as a dearth of technical and entrepreneurial skills, are often binding constraints to Africa’s light manufacturing industries (Dinh et al., 2012). Policies that address them in a co-ordinated manner through “place-based approaches” can exploit synergies, improve accountability and better link governments with the private sector. Cities also provide a testing ground for policy implementation before multiplying to national scales.

7. HOW SUStAiNABlE CitiES CAN CONtriBUtE tO AFriCA’S DEVElOPMENt7. HOW SUStAiNABlE CitiES CAN CONtriBUtE tO AFriCA’S DEVElOPMENt
201African Economic Outlook© AfDB, OECD, UNDP 2016200 African Economic Outlook © AfDB, OECD, UNDP 2016
Supporting the clustering of firms can reduce the per-user cost of programmes such as infrastructure development and allow for spill-overs among enterprises. In 11 African countries, clustering has an overall positive impact on firms’ performance (McCormick and Oyelaran-Oyeyinka, 2007). For example, 72% of the clustered firms surveyed felt that clustering enhanced their exposure to different useful ideas and provided them with opportunities to seek common solutions and strategies for shared problems. Subcontracting within the clusters has helped Uganda’s fish processing firms to meet European markets’ changing standards and trade terms. Firms in the Durban Automotive Cluster co-operated in supplier development, human resource development, logistics and benchmarking. In Tunisia’s garment industrial clusters, borrowing and lending tools is common so as to avoid underutilisation of machinery.
In supporting industrial clusters, government action proves more successful when playing a facilitating role rather than a leading role. For example, special economic or exporting zones in Africa are often government-driven initiatives seeking to concentrate investment in one region to jump start export-oriented industries such as automobiles, food processing and textiles. However, notwithstanding the sustained success of Mauritius’ early textile and clothing clusters, most have been hampered by various factors, ranging from bad locations to heavy reliance on trade preferences (Farole, 2011). Table 7.1 provides examples of instruments governments can use to support industrial clusters indirectly.
Table 7.1. Examples of instruments for cluster policies in developing countries
Labour mobility Recruitment of qualified recent graduates : job fairs, public relations initiatives for the clusters
Labour mobility among companies and research institutions : direct matching between employers and qualified job-seekers, secondment programmes
Apprenticeship inside clusters : job and internship information, scholarships for placements, direct matching
Entrepreneurship Spinoff formation : entrepreneurship or business plan competitions
Venture capital : allocation of venture capital, direct coaching for spinoffs, development of business incubators out of technology centres
Inter-firm co-operation Horizontal co-operation among companies : formation of industry associations or working groups, financial incentive for intra-industry co-operation
Vertical co-operation among companies : management of co-operation projects, financial support for collaboration, shared use of leading companies’ infrastructure, intra-cluster networking events, formation of industry associations
Competition Intensive local competition : public procurement, standardisation and certification, targeted subsidies for exporters
Competition in the local social hierarchy : entrepreneur awards, social media
Public-private engagement “Cafeteria effects”: establishment of technology centres, use of public research infrastructure by industry
Social networks : field visits and networking events, exchanges or secondments of professionals, collaboration in designing a strategy for a cluster competition
Source: Adapted from Benner (2013).
Infrastructure policies are essential to activating the comparative advantages of all cities. Firms need supportive infrastructure, especially transport and energy, to avoid being spatially trapped inside crowded city centres. In Africa’s more diversified economies, automobile sectors have started in primary cities such as Casablanca and Johannesburg. A combination of environmental regulations, spatially targeted investments in physical and soft infrastructure and business networks have enabled mature automobile sectors to shift to secondary cities such as Tangier and Durban. The experience of Thailand has shown that appropriate place-based government intervention can help develop heavy industries and add value to the extraction of natural resources. The country developed petrochemical industries in the Eastern seaboard following the discovery of gas fields in the Siam Gulf.

7. HOW SUStAiNABlE CitiES CAN CONtriBUtE tO AFriCA’S DEVElOPMENt
202 African Economic Outlook © AfDB, OECD, UNDP 2016
China’s two-pronged strategy provides an example of leveraging the potential of both cities and towns in achieving industrialisation. During the reform period of 1978 to the late 1990s, township- and village-controlled enterprises drove industrialisation and diversification in rural areas, while special economic zones that were allowed to accept foreign direct investment soon became central to China’s export-oriented and labour-intensive manufacturing strategy.
African cities can drive service-led growth
Urbanisation creates new opportunities for developing more productive and competitive service hubs that support Africa’s structural transformation. First, Africa’s service sector already accounts for one-third of total formal employment (ILO, 2014). As shown in Chapter 6, services can absorb low-skilled labour while still enhancing productivity. Second, the growth of service sectors such as tourism indirectly creates jobs in supplier industries. For example, in South Africa, 25% of intermediate inputs into services come from manufacturing (Tregenna, 2008).
Services also play an increasing role in helping manufacturing firms to access global value chains. Goods and services are intertwined in global production networks. The value created directly and indirectly by services as intermediate inputs represents over 30% of the total value added in manufactured goods (AfDB/OECD/UNDP, 2014; Figure 6.3). Services such as transport, logistics and warehousing, but also banking, insurance, business services, professional services and communication services, play an important role at every stage of the production phase. These services facilitate efficient movements of goods and intermediate inputs across borders to reduce the cost of trade in manufacturing.
African countries have experienced growth in the output share of modern services, which are mostly based in urban areas, albeit at different paces and with uneven job creation effects (Figure 7.7). The five groups of African countries below are divided according to their stages in urbanisation, fertility transition and structural transformation, as explained in Chapter 6 (see Annex 6.A1):
• Diversifier countries have the highest output share from modern services such as business, transportation and communication. In 2010, business services accounted for more than 10% of total output in Mauritius, Morocco and South Africa. Mauritius and Egypt have expanded the output of transport, storage and communication sectors to about 15% of the total. Cities such as Cairo and Alexandria (Egypt), Casablanca and Rabat (Morocco), Cape Town and Johannesburg (South Africa), account for more than half the national value added in modern services. Countries such as Mauritius and South Africa have significantly shifted their workers into these highly capital- and skill-intensive sectors.
• Some natural resources-based countries also made significant progress in these sectors. Botswana and Nigeria, for example, have expanded their employment share in business services. Surulere in Lagos State (Nigeria) fostered Nollywood, the third biggest cinema cluster in the world.

7. HOW SUStAiNABlE CitiES CAN CONtriBUtE tO AFriCA’S DEVElOPMENt7. HOW SUStAiNABlE CitiES CAN CONtriBUtE tO AFriCA’S DEVElOPMENt
203African Economic Outlook© AfDB, OECD, UNDP 2016202 African Economic Outlook © AfDB, OECD, UNDP 2016
• In the remaining groups, progress is patchy. A late urbaniser, Kenya in particular has significantly developed its services, with large urban centres playing a leading role: Nairobi and Mombasa account for half of the value added in financial and business services and three-quarters of the value added in the transport and ICT sectors. Some early urbanisers such as Ghana and Senegal have diversified so quickly into transport and communication that these sectors now account for roughly 15% of total output. However in many late urbaniser and most agrarian countries such as Ethiopia, Malawi and Tanzania, modern service sectors are still nascent: neither business nor transportation and communication account for more than 10% of output or 3% of employment.
Figure 7.7. Change in employment and output of business services as a share of the total economy of selected African countries, 2000-10
BWA
EGY
ETH GHA KEN
MOR
MUS
MWI
NGA
SEN
TZA
ZAF
ZMB
0
2
4
6
8
10
12
14
16
18
20
0 2 4 6 8 10 12
Share of total output (%)
Share of total employment (%)
Source: Authors’ calculations based on Timmer, de Vries and de Vries (2014).12 http://dx.doi.org/10.1787/888933350821
In the longer term, modern, tradable services could significantly absorb more labour without losses in relative productivity. Given the underdeveloped market for modern services in most African countries, lower prices will not necessarily offset production gains in modern service sectors. These sectors are increasingly tradable: global trade in services tripled between 2000 and 2012 with transportation, tourism and business services expanding quickly (Figure 7.8). Africa has only captured 3% of the global trade in services, mostly in the tourism and transportation sectors. It can harness more of this global demand by developing more specialised services and training a skilled labour force. Modern services such as finance and business are more integrated into global value chains, particularly through the trade networks established in Southern Africa with city hubs such as Johannesburg and Gaborone. Furthermore, services are increasingly disaggregated and traded as separate tasks, allowing countries and cities to further specialise in particular segments of the service value chains. Several diversifier countries, as well as Nigeria and Kenya, are looking to develop their business process offshoring sub-sectors around established research centres in urban areas.

7. HOW SUStAiNABlE CitiES CAN CONtriBUtE tO AFriCA’S DEVElOPMENt
204 African Economic Outlook © AfDB, OECD, UNDP 2016
Figure 7.8. Service trade in Africa, 2000-12
0
20
40
60
80
100
2000 2001 2002 2003 2004 2005 2006 2007 2008 2009 2010 2011 2012
120
TransportationOther services (personal, government, etc.) Travel Other business services
Communication and ICT services Construction Financial services and insurance
USD billion
Source: Authors’ calculations based on data from AfDB/OECD/UNDP (2014).12 http://dx.doi.org/10.1787/888933350837
In the short and medium terms however, the informal sector should be acknowledged as a source of livelihood. Engaging informal firms through direct procurements or through contracts with enterprises that provide waste, sanitation and water purification services could offer a low-cost solution to improve community welfare. The concentration of people reduces the cost of spatially-targeted investments in education, training and skill-matching; these facilitate the transition of workers into more productive activities. A comprehensive reform package will be necessary to bring these workers under some form of legal protection, ensure minimum wages and non-wage safeguards, train them and match them with jobs for a gradual progression into higher-value, formal work.
Participatory approaches can help integrate informal firms into the urban fabric and facilitate the development of an organised formal urban sector. Appropriate regulations and targeted incentives can enable informal employers to move beyond merely subsisting to saving for and investing in productivity growth. Formal businesses in Africa often have strong links with informal firms to take advantage of their flexibility and market concentration. A participatory approach considering local specificities can be more efficient in engaging informal enterprises into formal processes and mechanisms (see Box 7.3; see also Chapter 4). In Kenya, the second-largest retailer, Tusker Mattresses, is franchising informal retail businesses to penetrate this market (Mulupi, 2016).
Box 7.3. How participatory local policies can tackle informal street trading
Informal street trading is often contained by repressive policies because it is generally perceived as an illegal activity overcrowding Africa’s city centres. Police forces tend to regularly evict informal street traders by force. However, repressive policies have shown limited success in containing informal traders in the long term. Dakar and Monrovia have used more effective participatory and consultative approaches.

7. HOW SUStAiNABlE CitiES CAN CONtriBUtE tO AFriCA’S DEVElOPMENt7. HOW SUStAiNABlE CitiES CAN CONtriBUtE tO AFriCA’S DEVElOPMENt
205African Economic Outlook© AfDB, OECD, UNDP 2016204 African Economic Outlook © AfDB, OECD, UNDP 2016
Box 7.3. How participatory local policies can tackle informal street trading
The city of Dakar is building a commercial centre for former street merchants. From March to April 2011, a local census registered 4 980 street merchants who could participate. They choose their own property developer via the merchants’ associations and arrange the new commercial complex according to their needs. The project’s overall cost is estimated at XOF 9 million.
Following negotiations between 2009 and 2011, the National Petty Traders Union of Liberia and the Ministry of Commerce adopted a memorandum of agreement to define a limited trading space on the streets and give rights to petty traders. Petty traders pay fees to the municipality to obtain identification cards and taxes to the ministry to obtain these rights to trade in a designated street. Between the memorandum’s adoption in 2011 and 2015, 500 street traders were registered, and conflicts with the police decreased.
Source: Authors’ interviews with municipal officers of Dakar and Monrovia, December 2015.
The emerging urban middle class could fuel services growth
The middle class is growing rapidly in Africa, but it has been concentrated in diversifier countries (see Figure 7.9).3 Using the AfDB (2011) definition of the middle class as those with a consumption of USD 4-20 a day in purchasing power parity, a third of the diversifier countries’ population belongs to the middle class with 11% firmly in the upper middle class in 2008. Elsewhere the middle class is still small: 5% of the population in the late urbanisers and agrarian countries and roughly 14% in early urbanisers and natural resources-based countries. Lack of inclusiveness has limited the growth of the urban middle class in natural resources-based countries such as Angola, Nigeria and Zambia despite their higher income level.
Figure 7.9. Share of middle class by income in Africa (%), 2008
Share of total population (%)
20
8 3 3
8
11
5
2 2
6
0
5
10
15
20
25
30
35
Upper middle class (USD 10-20/day) Lower middle class (USD 4-10/day)
Diversifiers Early urbanisers Late urbanisers Agrarians Natural resources-based
Note: Constant 2005 purchasing power parity USD. Numbers are simple averages, unweighted for population size. Our definition does not include the “floating” middle class, those with consumption of USD 2-4 a day, since this threshold is barely above the poverty line and this group is vulnerable to falling back into poverty. Source: Authors’ calculations based on AfDB (2011).12 http://dx.doi.org/10.1787/888933350848
(cont.)

7. HOW SUStAiNABlE CitiES CAN CONtriBUtE tO AFriCA’S DEVElOPMENt
206 African Economic Outlook © AfDB, OECD, UNDP 2016
The growth of the urban middle class can boost both supply of and demand for the domestic services sector in Africa.
• First, as they graduate from poverty, the middle class can pursue entrepreneurial activities, creating employment and productivity growth (Acemoglu and Zilibotti, 1997).
• Second, the middle class provides the workforce and resources necessary for entrepreneurs as this group values human capital accumulation and savings (Doepke and Zilibotti, 2007).
• Third, the middle class generates renewed demand for consumer goods, especially durable ones. It has a stronger preference for product differentiation that leads to value added in branding. Consumer spending in Africa could grow from about USD 860 billion in 2008 to USD 1.4 trillion in 2020 (McKinsey Global Institute, 2010).
Growth driven by expansion of the middle class tends to be more sustainable than “export-led” growth (Gill and Kharas, 2007). Our experts’ survey shows that this boost in demand is perceived as the biggest opportunity associated with Africa’s middle class, followed by their potential as entrepreneurs (Figure 7.10).
Figure 7.10. Main opportunities associated with the middle class for African countries
0 5 10 15 20 25 30 35Number of times featured in the top two opportunities
Other (democracy, attracting foreign direct investment, etc.)
More capable labour force
Value added through product differentiation
Entrepreneurship drive
Greater demand for domestic products
Note: Survey responses by country economists of the AfDB and UNDP in 45 country offices in Africa. Responses are weighted by one per country.Source: AEO experts’ survey, 2016. 12 http://dx.doi.org/10.1787/888933350850
The majority of Africa’s middle class resides in urban areas. In Ethiopia, Malawi, Mozambique, Tanzania, Uganda and South Africa, 63% of the middle class with a consumption of USD 4-20 a day resided in urban areas in 2010. Their urban middle class totalled 11.9 million people, or 20% of the urban population, with an annual expenditure of USD 27 billion, or 43% of total urban expenditure (authors’ calculations based on Tschirley et al., 2015: Table 4).
Realising the potential of the urban middle class as workers for skill-intensive service sectors requires a continued push for education in urban areas. Overall, Africa’s big cities have a higher share of people with tertiary degrees than towns: 18% of the population aged 15 or over in big cities have tertiary degrees as compared to 11% in towns, according to our analysis of the Gallup World Poll (2016). The gap in tertiary degree attainment is more pronounced in non-diversifier countries than in diversifier countries (Figure 7.11).

7. HOW SUStAiNABlE CitiES CAN CONtriBUtE tO AFriCA’S DEVElOPMENt7. HOW SUStAiNABlE CitiES CAN CONtriBUtE tO AFriCA’S DEVElOPMENt
207African Economic Outlook© AfDB, OECD, UNDP 2016206 African Economic Outlook © AfDB, OECD, UNDP 2016
Figure 7.11. Education level of the population aged 15 years or older in Africa, 2009-10
17 26
18 26
13 25
28
31
26 23
31
36
37
33
39 39
35
29
18 11
17 12 21
10
0
10
20
30
40
50
60
70
80
90
100
Tertiary degree 9 years of education/secondary education
1-8 years of education No education
Big citiesand suburbs
Small towns Big citiesand suburbs
Small towns Big citiesand suburbs
Small towns
Africa Diversifiers Non-diversifiers
% of labour force
Note: The non-diversifiers include Algeria, Botswana, Burkina Faso, Burundi, Cameroon, Central African Republic, Chad, Democratic Republic of the Congo, Ghana, Côte d’Ivoire, Kenya, Liberia, Libya, Malawi, Mali, Mauritania, Niger, Nigeria, Rwanda, Senegal, Sierra Leone, Somalia, Sudan, Tanzania, Uganda, Zambia and Zimbabwe. The diversifiers include Egypt, Morocco, South Africa and Tunisia.Source: Authors’ calculations based on Gallup World Poll (2016) for surveys between 2009 and 2010.12 http://dx.doi.org/10.1787/888933350869
African cities attract a growing share of foreign direct investment
Foreign direct investment to cities is strategic to develop the necessary urban base in manufacturing and services that could drive Africa’s structural transformation. FDI in African cities can be analysed by using data on greenfield FDI, which represents investments where parent firms start entirely new projects and facilities in host countries (see Annex 7.A1). Although Africa has one of the highest regional growth rates of FDI at 2% a year between 2003 and 2014, its volume share of FDI compared to other regions is small. Cairo, Tunis, Tripoli and Algiers are Africa’s top global FDI destinations by volume, with Cairo capturing USD 37 billion and Tunis USD 22 billion between 2003 and 2014. The top six cities are Arabic-speaking cities in North Africa, while the Anglophone cities of sub-Saharan Africa rank lower. Johannesburg and Cairo are Africa’s prime global cities, one anchoring the south of the continent to the world economy, the other the north. Johannesburg is the first source city of African FDI (71st globally), but ranks seventh as an FDI destination (104th globally). Cairo is second in terms of FDI source and first in terms of destination. With regard to FDI from within Africa, the most popular destinations are Cairo (18%), Luanda (11%), Lagos (10%), Tunis (6%) and Johannesburg (6%). Maps 7.1 and 7.2 show the global FDI networks investing in the main African destination cities for manufacturing and services, respectively (Wall, 2016; forthcoming).
African cities attract higher levels of greenfield foreign direct capital investment than would be expected considering city GDP levels (World Bank, 2015b). Relative to GDP, sub -Saharan African cities featured in the top 10% attractors of greenfield FDI between 2002 and 2012, as often as cities in the East Asia and Pacific region. In Morocco,

7. HOW SUStAiNABlE CitiES CAN CONtriBUtE tO AFriCA’S DEVElOPMENt
208 African Economic Outlook © AfDB, OECD, UNDP 2016
Tangiers has utilised national investment in a large new seaport facility and connective infrastructure from the port to the surrounding hinterland to attract a European automobile assembly line. City stakeholders collaborated with the national investment promotion agency and helped set up a dedicated training centre to upgrade the local labour force and address the skill shortage of the automotive sector.
Cities of various sizes can form economies of scale through clustering to attract investors. Regional integration, complementarity and collaboration are essential to improving a city’s competiveness. Africa has four major “FDI corridors”: i) a North African corridor including Casablanca, Tunis and Tripoli; ii) a Nile corridor including cities like Cairo; iii) a West African corridor including Lagos, Abuja, Abidjan and Accra; and iv) a Gauteng-Maputo corridor which includes cities like Johannesburg, Midrand, Pretoria and emerging Maputo (Wall, 2016; forthcoming). These corridors attract FDI because they are comprised of several primary cities at close proximity to each other and connected through good networks of road, rail and port infrastructure. The West African corridor sees a high concentration of big cities like Lagos, Abuja, Lomé, Accra and Abidjan, which benefit from dense clusters of secondary and tertiary cities and complement each other in a reinforcing urban hierarchy. Finally, each of the four powerful regions depends on globally well-established cities like Johannesburg, Cairo, Casablanca and Lagos to anchor them to the global economy but also on rising investment destinations like Maputo and Kigali.
FDI into urban Africa is both “market seeking” and “resource seeking”. Econometric analysis shows that the most significant determinants of FDI in Africa’s manufacturing sector are domestic market size and infrastructure (e.g. ports, rail and road) to access natural resources. These two factors explain 28% of variations in FDI attraction to Africa. For comparison, technological readiness is the most powerful explanatory factor of foreign investments in Asia, followed by infrastructure and market size. Hence, the types of technology-sensitive investments that dominate FDI in Asia are not yet present in Africa. Expanding Africa’s base in advanced manufacturing may imply further investment into a country’s technological absorption capacity, improve the ease of doing business and implement efficient customs regulations.
Foreign investment in Africa’s high-tech sector is much more concentrated in fewer highly urban areas than is the case of other sectors (Map 7.3). The quality of infrastructure (road, rail, airports and ports) is the most determinant variable for the production of high-tech goods and for their distribution. The map also shows strong clusters around Nairobi, Johannesburg, Port Elizabeth, the West Africa corridor, North Africa corridor and Cairo corridor (red regions on Map 7.3), and some emergent high-tech clusters for instance between Zimbabwe and Zambia (yellow regions on Map 7.3). Whereas Nairobi is not a hot-spot in terms of total FDI, it receives a significant flow into high-tech industries. This shows that regional strengths can vary strongly across investment sectors (Wall, 2016; forthcoming).
FDI usually brings knowledge and technology to a region, activates the development of local business, and leads to new urban projects, but it does not always directly create many jobs. In 23 African countries, trade and growth are mutually-supportive (Seyoum, Wu and Lin, 2014). However, the growth-enhancing effect of FDI stems from the productivity spill-over to domestic firms rather than from direct employment by FDI firms. The agglomeration economies from industries’ locating in a given area are higher in sub-Saharan Africa when domestic firms locate close to foreign multinationals, especially those coming from developing countries from the “Global South” (Sanflippo and Seric, 2014). By contrast, in a sample of 750 cities all over the world, FDI only created

7. HOW SUStAiNABlE CitiES CAN CONtriBUtE tO AFriCA’S DEVElOPMENt7. HOW SUStAiNABlE CitiES CAN CONtriBUtE tO AFriCA’S DEVElOPMENt
209African Economic Outlook© AfDB, OECD, UNDP 2016208 African Economic Outlook © AfDB, OECD, UNDP 2016
1 400 jobs per city directly, or 0.1% of the employment base, among the FDI-recipient cities in 2012 (Fikri and Zhu, 2015). Among all the jobs directly created by FDI in Africa between 2003 and 2014, 83% were located in cities. Over the same period, FDI in manufacturing is estimated to have directly created over 646 000 jobs, or half the total of FDI-related jobs; FDI in services 281 000 jobs; FDI in high-tech 159 000 jobs; while FDI in resources (or non-urban FDI) created 220 000 jobs (Wall, 2016; forthcoming).
While the success of each investment strategy depends on specific characteristics of the city and country, Zhu, Larrey and Santos (2015) point out a four-step method for city governments: i) identify and communicate the city’s value proposition through self-assessment of the city in line with regional and national strategies; ii) build the city’s brand and address any negative perceptions; iii) co-ordinate with different institutions and government agencies to provide comparable, credible and timely information to investors, especially on entry requirements into the domestic market while nurturing local partners and networks; and iv) provide targeted incentives to those firms hesitating to invest and foster positive relationships with existing investors.
urbanisation can help accelerate social development
Urbanisation provides opportunities to accelerate social development in Africa in different ways. First, urbanisation could support inclusive growth and improve material well-being through higher disposable incomes for food, shelter and investment in human capital which enhances one’s potential for generating income. Second, agglomeration enables economies of scale in delivering indivisible public goods such as transportation and communication systems. Third, densification creates a web of interconnected community groups and stakeholders in cities which can more easily engage in governmental poverty alleviation programmes, or grassroots social development initiatives. Realising these benefits requires co-ordinated and holistic policies to make structural transformation more inclusive. This section highlights how new urban development policies might do the following:
• improve transportation infrastructure within and between cities to connect people, resources and ideas across regions
• improve housing conditions, income equality and gender equality
• lift vulnerable groups out of urban poverty by providing new social safety nets and public employment programmes
• expand social businesses to better tap the potential of the urban informal economy
• curb urban insecurity.
Better transportation infrastructure within and between cities can connect people, resources and ideas across regions
Transportation policies will have a significant impact on sustainable development. Continuing to develop mass transportation systems, notably public transportation, within cities will decrease congestion costs and contribute to more sustainable cities. Better transportation networks between cities will strengthen regional linkages.
Mass intra-city transportation systems can foster more inclusive development
Good transportation increases the efficiency of doing business in the cities. It reduces the costs of moving goods and people and enables “just-in-time” logistic development. Experience from other regions of the world show that reducing the uncertainty of transit time is as important for increasing business efficiency as reducing transportation time.

7. HOW SUStAiNABlE CitiES CAN CONtriBUtE tO AFriCA’S DEVElOPMENt
210 African Economic Outlook © AfDB, OECD, UNDP 2016
Better connective networks allow firms to expand their catchment areas and scale up their operations thanks to a larger, more diversified pool of potential customers. Improving connections between city centres and their surrounding areas enables firms to move out of cities centres to scale up operations while reducing congestion costs (McCormick and Oyelaran-Oyeyinka, 2007).
Transportation policies play a major role in connecting the urban poor to jobs. The urban poor usually face a spatial mismatch, such as those residing in the ghettos of Johannesburg’s outskirts, for example. Car-oriented transit disproportionately hurts the poor who cannot afford their own vehicles and cannot find jobs within a walkable distance from their homes. An experiment in Addis Ababa showed that reducing transportation costs could increase the intensity of one’s job search, decrease participation in temporary and informal work, and increase the likelihood of permanent employment by six percentage points (Franklin, 2015a). In Lagos where transportation costs account for 20% of the urban poor’s income, the Bus Rapid Transit system started in 2008 has provided 2 000 direct jobs and 500 000 indirect jobs. The system reduced the cost of public transportation by 30% and offered a more stable price even amid a fuel scarcity.
Transportation policies help curb pollution. A review of 27 African countries reveals that the majority have adopted environment protection acts, and established vehicle fuel parameters, emission standards and air quality controls (SEI, 2012). A substantial improvement has been the phase-out of lead, which started in 2003, and is now essentially completed. However, monitoring and enforcement remains limited: only eight countries have operational routine monitoring systems for air quality. The annual mean concentration of particulate matter smaller than ten microns in diameter (PM10) is higher in many African cities than the average city at global level (Figure 7.12).
Figure 7.12. Annual mean concentration of particulate matter smaller than ten microns in diameter (PM10) in selected African cities
0
40
80
120
160
200PM10 concentration (microgram/m3)
Port L
ouis,
Mau
ritius
Durba
n, Sou
th Afri
ca
Cape T
own,
South
Africa
Morog
oro,
Tanz
ania
Highve
ld Prio
rity A
rea
Networ
k, Sou
th Afri
ca
Tshw
ane (
Pretor
ia),
South
Africa
Vaal P
riorit
y Area
,
South
Africa
Bucha
nan (
rural
),
Liberi
a
World
avera
ge
Accra,
Gha
na
Joha
nnes
burg
,
South
Africa
Southe
ast A
sia
avera
ge
Beau-
Bassin
Ros
e-Hill,
Maurit
ius
Cairo,
Egyp
t
Delta c
ities a
verag
e,
Egyp
t
Dakar,
Seneg
al
Source: WHO (2014).12 http://dx.doi.org/10.1787/888933350872

7. HOW SUStAiNABlE CitiES CAN CONtriBUtE tO AFriCA’S DEVElOPMENt7. HOW SUStAiNABlE CitiES CAN CONtriBUtE tO AFriCA’S DEVElOPMENt
211African Economic Outlook© AfDB, OECD, UNDP 2016210 African Economic Outlook © AfDB, OECD, UNDP 2016
Given that the bulk of African transport infrastructure has yet to be built to accommodate the 867 million Africans that will live in urban areas by 2050, African cities can learn from past successes and mistakes. Africa has less than 3% of the world’s motor vehicles but more than 11% of global road fatalities (SEI, 2012). Making roads more friendly to non-motorised use can reduce the death and injury costs of traffic accidents. The modernist ideal of car-centric urban planning in the early 20th century has proved to be detrimental to the well-being of urban residents and environmentally unsustainable (Frenchman, 2014; Glaeser, 2012). In OECD countries, the transportation sector contributes to half of total air pollution. Many OECD countries are trying to break the cycle of car dependency and reverse their consequences at great costs. The experiences of Paris and London have shown that constructing more roads will not solve the traffic congestion problem due to the additionally generated vehicle use. Compact cities promoting non-motorised and public transportation can efficiently connect the urban flow of people, goods and ideas at a lower social cost per capita.
Some African cities are developing integrated public transport networks to break the cycle of car dependency and create better connectivity within cities. This model reflects the pursuit of efficient and integrated public transport that improves mobility, inclusivity and access in cities. Table 7.2 lists several initiatives identified in this report’s country notes.
Table 7.2. Mass transportation systems in selected African cities
Project Stakeholders Cost Development outcome of the project Price per trip
Addis Abeba Light Rail, Ethiopia
Operated by Shenzen metro group and constructed by Ethiopian Railways Cooperation.
USD 475 million (financed 85% by China Railway Engineering Cooperation)
Capacity of 60 000 passengers per hour, total length of 31.6 km for the two lines. The first 17km of rail connect the industrial suburbs south of Addis to the centre. Another east-west line is still under construction, and additional lines are planned.
ETB 2-6 (USD 0.27-0.82)
2012-15
Lagos Bus Rapid Transit (BRT-Lite), Nigeria
Launched in 2008
Run by Lagos Metropolitan Area Transport Authority.
USD 1.7 million per km Africa’s first Bus Rapid Transportation system serves 47 different routes, carries as many as 200 000 passengers per day who pay on average 30% less in fares and spend 40% less time travelling.
NGN 20 (USD 0.23)
The transport sector employs 2.5 million people (15% of the city’s population).The system relieves congestion in the city and provides more effective public transport at lower cost.
DART System (Bus Rapid Transit), Dar es Salaam/Tanzania
Phase 1: 2003-present Phase 2: from 2017
Will be managed in Public Private Partnership with two private bus operators.
USD 290 million for Phase 1 (funded by the World Bank) USD 159.32 million for Phase 2 (funded by AfDB, AGTF and the Government of Tanzania)
Capacity of 495 000 passengers per day.By using cleaner fuels and reducing the roadside concentration of greenhouse gas emissions, it is environmentally efficient.
TZS 500-900 (USD 0.80-1.45)
Rea Vaya Bus Rapid Transit (BRT), Johannesburg, South Africa Phase 1: 2007-09 Phase 2: 2009-12
Financed by Public Transport Infrastructure and Systems Grant (PTIS) by central government.
USD 300 million overall Used by 45 000 commuters per day. The Employment Framework Agreement (EFA) signed between the city and the taxi industry whose drivers received training was expected to create 700 permanent jobs in Phase 1A and 3 300 temporary jobs during the construction period.
ZAR 3.5-9 (USD 0.64-1.67)
Constantine Tramway, Algeria 2007-13
Setram/Alstom (49%), ETUSA (36%) and the Entreprise du métro d’Alger (15 %), with a second line to be constructed by the French RATP.
DZD 44 billion (line 1)(about USD 400 million)
Capacity of 100 000 passengers per day over 8km for the first line. The extension will serve the new city Ali Mendjeli and the airport.
DZD 40 (USD 1.28)
Casablanca Citadis Tramway, Morocco Phase 1: 2009-12 Phase 2: 2016-18
Moroccan government, local government Alstom, CDG Capital, Banque Populaire du Maroc and King Hassan II Fund.
MAD 6 billion(about USD 400 million)
Provides service to 100 000 passengers a day over 31 km.
MAD 6 (USD 1.68)
Note: Prices are converted into international USD, 2014 prices.Source: AEO experts’ survey, 2016; AEO Country Notes, 2016.

7. HOW SUStAiNABlE CitiES CAN CONtriBUtE tO AFriCA’S DEVElOPMENt
212 African Economic Outlook © AfDB, OECD, UNDP 2016
Transportation policies are more efficient when developed in tandem with land-use planning and along urban catchment areas. Angel et al. (2015) recommend that capacity-constrained governments first focus on predicting urban growth, in order to set aside the public space for parklands and establish the arterial grid. An arterial grid of dirt roads allows allocating public space without spending much on infrastructure. The eventual spending can occur later as the city expands and new residents need more services. Involving the peri-urban population and identifying the functional catchment areas of cities help establish more coherent governance structures beyond administrative boundaries.
Better transportation networks between cities can improve regional linkages
Inter-city transportation holds the key to spatially inclusive urban development (AfDB/OECD/UNDP, 2015). In a study of 15 African countries whose primate city is a port, Storeygard (2013) finds that reducing transport costs by 1% can raise growth in the hinterland city by 0.2%. The effects differ depending on the surface of roads: cities connected to the port by paved roads are chiefly affected by transport costs to the port, while cities connected to the port by unpaved roads are more affected by connections to secondary centres. This suggests that firms in cities not connected to the port may rely more on their rural hinterland and intermediate cities for trade.
Each group of African countries exhibits a different pattern of road networks and connectivity. The accessibility of the road network can be characterised by the distribution of average per-person travel time to the nearest settlement with more than 50 000 people and the skewness of this distribution (Figure 7.13).
• The diversifier countries have moderately aggregated populations where 90% of the population live on 20-40% of the land surface. Their more developed networks of cities and good transportation leave a small proportion of the population in inaccessible areas as shown by the low average travel time and high skewness level.
• The transportation network in early urbaniser countries slightly lags behind the diversifiers as manifested by their lower average and more skewed distribution of travel time to the closest towns of 50 000 inhabitants. They often have a more uniform distribution of the population than countries in other groups. This results from a fairly even distribution of rain-fed areas and a more frequent expansion of agricultural land due to farming crops such as cacao and cotton which lead to spreading out the population.
• Late urbanisers and agrarian countries have the least developed road networks. Average travel times to the nearest towns and cities are high, at three hours or more, and a large share of the population is located in remote, inaccessible areas.
Governments can increase connectivity between cities and deepen regional integration through development corridors. Corridors link different cities and regional markets through transport, fostering trade exchanges while providing positive externalities to local populations. In a regional context, an urban corridor becomes a line of economic integration. Unlike the colonial import/export corridors connecting landlocked countries to the coast which contribute relatively less to intra-regional and inter-cities trade, development corridors connect cities of different countries among themselves and with regional trade markets, following coastal, trans-Sahelian or trans-Saharan directions (see Table 7.3).

7. HOW SUStAiNABlE CitiES CAN CONtriBUtE tO AFriCA’S DEVElOPMENt7. HOW SUStAiNABlE CitiES CAN CONtriBUtE tO AFriCA’S DEVElOPMENt
213African Economic Outlook© AfDB, OECD, UNDP 2016212 African Economic Outlook © AfDB, OECD, UNDP 2016
Figure 7.13. Average travel time to nearest urban areas and skewness of the distribution in Africa, 2010
EGY
MAR TUN ZAF
BEN
CIV CMR GHA
LBR
SEN TGO
CAF ERI
ETH
KEN
MDG
MOZ
RWA
SDN
SLE TZA
BDI BFA
MLI
MWI
NER UGA
AGO
BWA
COD
COG
DZA GAB
GIN
LBY
MRT
NGA
SOM
SSD
TCD
ZMB
ZWE
0
1
2
3
4
5
6
0 1 2 3 4 5 6 7 8
Skewness of the travel time distribution
Average travel time to the nearest city of 100 000 inhabitants or more (hours)
Diversifiers Early urbanisers Late urbanisers Agrarians Natural resources-based
DiversifiersEarly urbanisers
Agrarians
Late urbanisers
Note: The x-axis represents the average per-person travel time to the nearest settlement with more than 50 000 people and the Y-axis is the skewness (measuring the asymmetry of the probability distribution) of the average per-person travel time. A lower skewness level in this case implies a longer right tail of the distribution, which means more people in the country reside in the remote, inaccessible areas. Source: Linard et al. (2012).12 http://dx.doi.org/10.1787/888933350885
Table 7.3. Main corridors in AfricaCorridor Passing by Length
Cairo-Dakar Cairo – Tripoli – Tunis – Algiers – Rabat – Nouakchott – Dakar 8 636 km
Algiers-Lagos Algiers – Tamanrasset – Agadez – Tamanrasset – Kano – Lagos 4 504 km
Tripoli-Cape Town Tripoli – N’Djamena – Kinshasa – Windhoek – Cape Town 10 808 km
Cairo-Cape Town Cairo – Khartoum – Addis Ababa – Nairobi – Dodoma – Lusaka – Gaborone – Cape Town 10 228 km
Dakar-N’Djamena Dakar – Bamako – Ouagadougou – Niamey – Kano – N’Djamena 4 496 km
N’Djamena -Djibouti N’Djamena – Djibouti 4 219 km
Dakar-LagosDakar – Banjul – Bissau – Conakry – Free Town – Monrovia – Abidjan – Accra – Lomé – Cotonou- Lagos 4 010 km
Lagos-Mombasa Lagos – Yaoundé – Bangui – Kisangani – Kampala-Nairobi – Mombasa 6 259 km
Lobito-Beira Lobito – Lubumbashi – Lusaka – Harare 3 523 km
Box 7.4. Urban corridors contribute to West Africa’s structural transformation
The case of the Abidjan Lagos Highway Corridor (ALHC) illustrates the contribution of urban corridors to West Africa’s structural transformation. The ALHC links Abidjan (Côte d’Ivoire) to Lagos (Nigeria), passing through Accra (Ghana), Lomé (Togo) and Cotonou (Benin), connecting functional, urban economic areas and building on economic interdependency. This line concentrates 70% of West Africa’s regional economy. It is designed to promote the integration of these five national markets and help overcome the size limitations of several of them. Urban corridors provide local populations with simultaneous access to several types of infrastructure and services, such as highways, electricity, water and ICT connections. Connecting the Lagos-Abidjan-Dakar and Tanger-Rabat corridors would open opportunities for accelerating economic expansion from West Africa towards North Africa. Financing a highway between Senegal and Mauritania will complete the South-South co-operation between the Arab Maghreb Union countries and the Economic Community of West African States (ECOWAS). The African Development Bank finances urban corridors such as the ALHC, reinforcing integration between African cities.

7. HOW SUStAiNABlE CitiES CAN CONtriBUtE tO AFriCA’S DEVElOPMENt
214 African Economic Outlook © AfDB, OECD, UNDP 2016
By reducing trade costs, cities specialise in niche functions and complementary products. Improved transport and communication can expand the market catchment for firms. Better transportation between cities reduces the transaction cost of sourcing intermediate inputs from specialised cities within a chain. Network analysis of non-resource FDI in African cities reveals that cities can, but do not necessarily, compete with other cities from the same region. More specialised cities tend to attract more FDI, because foreign investors find it more difficult to substitute a specialised city with competitive advantages in a given sector by another investment destination. Reducing trade costs can also strengthen certain cities’ positions as “broker gates” of investment in other cities: Johannesburg is the primary broker of all flows into Africa, followed by Nairobi, Lagos and Cairo. These cities offer stock exchanges and infrastructure that can facilitate financial flows into the surrounding regions (Wall, 2016; forthcoming).
Facilitating safe housing is key for urban development
Cities can improve housing conditions, particularly in informal settlements or slums, to ensure more inclusive development (see Chapter 6).4 Numerous practices of slum upgrading in Africa show that place-based and comprehensive packages of sectoral reforms, financing, job creation, urban governance and empowerment of community groups can overcome the interlinked challenges of informal settlements and vulnerable jobs.
• South Africa’s free stand-alone housing programme has shown that access to affordable housing can alleviate house chores for women, reduce household poverty and increase female participation in the labour force (Franklin, 2015b). Increased tenure security has positively increased housing investment in many countries.
• In Nairobi, improved tenure security and basic infrastructure at home creates an “enabling” environment for slum dwellers to pursue entrepreneurial activities which can provide additional income and diversify household livelihoods (Gulyani and Talukdar, 2008).
• On the downside, certain slum upgrading programmes may also have often excluded tenants, subtenants and newly-established occupants who tend to be the most vulnerable. In Nairobi, certain programmes targeting housing inside slums have led to higher property values captured by structure owners rather than aiding low-income tenants (Gulyani and Talukdar, 2008).
A participative and holistic approach can allow policies to be sufficiently flexible and tailored to the needs and capacity of local populations. Local governments and city authorities can play a key role in planning land use more effectively and in mobilising local resources, while co-ordinating with regional and national authorities. Where rental mode dominates the slum housing supply, the government can facilitate the negotiations between tenants and owners and use infrastructure investment and tenure legitimisation as incentives to explicitly enhance owner occupancy in slums (Gulyani and Talukdar, 2008). Participatory slum upgrading has produced impressive results in several cities, for instance in Dar es Salaam since 2004 (Collin, Sandefur and Zeitlin, 2015).
Morocco’s Villes sans bidonvilles programme provides a good example of place-based and participatory slum improvements. Between 2000 and 2010, Morocco ranked second globally in achieving 46% of the objectives in slum improvements under Target 11 of the 7th Millennium Development Goal. By the end of March 2010, 154 000 households benefited from a housing unit, including 62 000 households in the 40 centres already declared slum free. The success of the programme relied on the following:
1) actively involving local authorities and holding them accountable through specific contractual frameworks (City Contracts)
2) enabling the private sector to supply the majority of housing
3) increasing affordable housing stock with a goal of 100 000 social housing units and service land plots annually.

7. HOW SUStAiNABlE CitiES CAN CONtriBUtE tO AFriCA’S DEVElOPMENt7. HOW SUStAiNABlE CitiES CAN CONtriBUtE tO AFriCA’S DEVElOPMENt
215African Economic Outlook© AfDB, OECD, UNDP 2016214 African Economic Outlook © AfDB, OECD, UNDP 2016
The Villes sans bidonvilles programme aimed to build a consensus among all stakeholders in choosing between three types of interventions: on-site re-housing, relocation and in situ upgrading. Innovative financial business models attracted private-sector participation, while targeted subsidies alleviated access to finance constraints for the majority of the poor. The programme was financed 40% through the general budget and a tax of USD 12 per tonne of cement, 30% through beneficiary household contributions and the rest through profits from housing sales to upper-income householders and from international donors.
Similarly, Tunisia’s slum upgrading policy decreased the prevalence of slums from 24% of the total housing stock in 1975 to 2% in 1994 (World Bank, 2003). The Agence de Réhabilitation et de Rénovation Urbaine (ARRU) introduced a significant amount of formal housing to the market, alongside construction improvements and an increased rate of infrastructure connection. Between 2007 and 2009, ARRU’s rehabilitation programme allocated 70% of its budget to infrastructure and public facilities and 30% to small and micro enterprises (UN-Habitat, 2008).
Social safety nets can lift vulnerable groups out of urban poverty
The recent development of social protection schemes in Africa can be extended to urban areas to also benefit the urban poor. Social protection schemes – be they public or private, formal or informal – are intended to lift individuals out of poverty and protect them from the risks of falling back into poverty. In 2015, 40 African countries provided unconditional cash transfer schemes, twice the number in 2010. Social assistance programmes support 15% of all households in extreme poverty, versus 25% in rural areas. These programmes are evolving to respond better to the demands of the growing urban poor, many of whom are extremely poor (Chapter 6).
Burkina Faso, the DRC, Ethiopia, Mali and Tanzania have recently started implementing what the World Bank refers to as a “first generation” of urban social protection programmes. Their common objective is to alleviate poverty and mitigate inequality, while connecting individuals to services, enhancing human capital and promoting economic activity. Achieving effective coverage remains a challenge, however. General subsidy schemes are generally regressive, whereas the benefit levels and targeting methods require adjusting to the higher cost of living in cities. Individuals’ high mobility in informal settlements and income fluctuations make it difficult to target beneficiaries. Administrative fragmentation and poor information flows between national and local entities also impede the effective implementation of social protection schemes.
Box 7.5. South Africa’s Expanded Public Work Programme
South Africa’s Expanded Public Work Programme (EPWP) shows that social protection programmes can support urban services and promote economic activity. The EPWP was established principally to employ the large numbers of low-skilled workers structurally excluded from the formal economy. They were initially hired to construct and maintain infrastructure in informal urban settlements. The programme has expanded to include social services and environmental work. It creates more than 1 million short-term jobs per year, at a cost to government of approximately ZAR 30 billion (USD 1.8 billion, or 0.8% of GDP). The average duration of an EPWP job is 70 days, and the daily wage is well below the minimum for formal sector employment but (pro rata) above the level of the most generous monthly social grant. The EPWP interacts with other social protection arrangements. Participants are covered by unemployment insurance and workers’ compensation benefits. Although such coverage is globally low in South Africa, it is higher in urban areas than in rural areas: 4.3% vs. 1.9%, respectively. Ensuring such coverage may help sustain the gains in welfare that this first generation of urban social protection schemes hopes to achieve. Social insurance mechanisms should also be consistent despite inevitably irregular and small contributions by precarious workers.

7. HOW SUStAiNABlE CitiES CAN CONtriBUtE tO AFriCA’S DEVElOPMENt
216 African Economic Outlook © AfDB, OECD, UNDP 2016
Box 7.5. South Africa’s Expanded Public Work Programme
The EPWP has not made the impact on unemployment that had been expected, however. Its decentralised model – whereby the national government incentivises local administrations to leverage their budgets and employ their own staff – has experienced major challenges in terms of buy-in, reporting and compliance with national guidelines. Moreover, the continuing structural weakness of the formal labour market has caused a high proportion of participants to remain in the programme rather than take up formal employment. However, the innovations piloted by the EPWP, both in terms of programme design and institutional structure, are a benchmark for large-scale programmes elsewhere in Africa and beyond.
Expanding social businesses can help tap the potential of the urban informal economy
African urban dwellers adopt and create new forms of social businesses adapted to their urban realities. Social businesses have long existed in Africa, extending back to traditional systems of mutual support. Unlike traditional businesses, social businesses are not driven by profits but by the mission to provide solutions to social challenges. Nowadays, mutual assistance groups or community enterprises (mainly co-operatives) are widespread in urban areas (Fafchamps and La Ferrara, 2012). Co-operatives offer financial services to underprivileged people. In Kenya, for example, Savings and Credit Cooperative Societies provide alternative to banks for low-income earners. Moreover, the informal economy often relies on digital payment technology. The spread of digital payment systems (e.g. mobile phone-based money transfers such as MPesa in Kenya and Tanzania or Orange Money in Côte d’Ivoire) allows integrating more formal businesses with informal micro-entrepreneurs by providing both greater financial flexibility (working capital, micro-credits, etc.) and more efficient monitoring of transactions. In addition, using digital applications, informal entrepreneurs can manage operations even better by working from a simple smartphone such as Sokotext and Kaymu, which can link urban consumers in informal settlements to local fresh food producers, for instance.
Innovative business models joining formal businesses and informal micro-entrepreneurs are being developed. The Bel Group uses its digital platform Sharing Cities to build on existing networks of street vendors to develop its distribution strategies across Africa. The company partners with many stakeholders, public, private or voluntary, to provide sellers benefits in the form of micro-insurance, micro-credits, vocational training and administrative support to help them formalise their activities. This initiative allows Bel Group to optimise its distribution network while improving the livelihood of sellers and contributing to the gradual formalisation of their businesses (Ménascé, forthcoming).
Social businesses can offer manufacturing and affordable social services. In Agadir (Morocco), more than 7 000 women work in some 150 co-operatives that produce beauty products using oil from the region’s argan trees. The 60 women workers receive 100% of the profits, and the co-operative carries out actions to improve living standards in rural and urban Morocco. South Africa’s International Centre for Eyecare Education provides eye care products at a price affordable for the poor.
Some African countries are already implementing concrete policies to support the development of social businesses. For example, in 2014, the Malian government adopted the National Policy for the Promotion of the Social Economy and the Action Plan for
(cont.)

7. HOW SUStAiNABlE CitiES CAN CONtriBUtE tO AFriCA’S DEVElOPMENt7. HOW SUStAiNABlE CitiES CAN CONtriBUtE tO AFriCA’S DEVElOPMENt
217African Economic Outlook© AfDB, OECD, UNDP 2016216 African Economic Outlook © AfDB, OECD, UNDP 2016
2014-2018. The policy includes simplification of the legislation, support to existing social enterprises networks and better access to credit for social enterprises. South Africa’s New Growth Path framework of 2011 explicitly recognised the role of the social economy in creating sustainable jobs while the Preferential Procurement Regulations reaffirmed that engagement with disadvantaged South Africans was a key criterion for winning public sector procurement (Littlewood and Holt, 2015). Common strategies to help develop social businesses across Africa and on other continents include these:
• promote appropriate legal frameworks that simplify the institutionalisation of informal initiatives (e.g. allow co-operatives to operate in different sectors)
• facilitate access to finance for social businesses
• provide financial support directly to social businesses based on their needs
• increase awareness about social entrepreneurship through training programmes, research and communication strategies
• support existing networks that promote social entrepreneurship and foster their development.
Holistic and integrated strategies can promote urban security
The multi-faceted nature of violence and crime requires an integrated and holistic strategy. The Lagos State Security Trust Fund launched in 2007 has managed to reduce the levels of insecurity and perceptions of crime problems (UNODC, 2011: 19). The initiative aims for broader community response by fostering effective and enduring public-private partnerships at all stages. Its multi-faceted strategies have included job creation, improved social services, redevelopment of public spaces and the building of a culture of prevention rather than repression. Similarly, the Safer Cities Programme by UN-Habitat combines crime prevention, the establishment of ward tribunals, neighbourhood watch initiatives, employment creation and skills training for youth, and safety audits for women.
Urban projects successfully providing public goods and safety highlight the importance of community involvement. Municipal actors and local communities such as neighbourhood watch organisations, women’s associations and religious organisations are influential in urban Africa (Kilcullen, Mills and Trott, 2015). Women’s safety audits have been experimented in Durban, Dar es Salaam, Nairobi and Abidjan. They have permitted women to identify safe spaces and make recommendations based on lighting, signage, isolation, movement predictors, maintenance and overall design. In Lagos, the Makako floating school project relied on community involvement. The Lagos State Ministry of Physical Planning and Urban Development is incorporating the school into a regeneration plan for the entire Makoko slum.
Tailored policies responding to the specificities of local contexts through multi-partnerships can prove efficient. In the Western Cape province, the Community Safety Improvement Partnership programme has organised Policing Needs and Priorities meetings in 150 police stations to define local priorities and needs. The Chrysalis Youth Development Programme trained more than 1 450 young people in the safety and security sectors between 2012 and 2015 (ISS, 2015). These programmes reveal extensive interaction between the public and private sectors within the public security sphere (Abrahamsen and Williams, 2008: 547).

7. HOW SUStAiNABlE CitiES CAN CONtriBUtE tO AFriCA’S DEVElOPMENt
218 African Economic Outlook © AfDB, OECD, UNDP 2016
Africa’s urbanisation can contribute to environmental development
Urban areas can facilitate the efficient use of environmental resources through sharing land, other natural resources, goods and services. For example, cities endowed with efficient mass transportation systems reduce per capita pollution more substantially than less densely populated places that rely on individual motorised transportation (Glaeser, 2012). Moreover, sustainable cities show potential for shifting to greener methods of production, because they bring larger economies of scale: “urban green growth is fostering economic growth and development through urban activities that reduce environmental impact, for example low air pollution and CO2 emissions; low consumption of natural resources including water, energy and undeveloped land; and the protection of ecological services” (OECD, 2013b: 9).
Tackling urban environmental challenges is strategic for Africa’s sustainable development. The stakes may be even higher for Africa than for other world regions (see Chapters 4 and 6).
• Because it is still urbanising, Africa can reap huge benefits by leap-frogging to a green economy. For instance, two-thirds of urban investments are to be made between now and 2050. Making investments in “no regret” urban infrastructure and planning urban development are necessary. Today’s technologies provide additional momentum for a new ecological model of service delivery in African urban areas, thus shaping more sustainable cities (Cartwright, 2015).
• The costs of environmental degradation are high in Africa given the continent’s levels of human development (see Chapter 6; Roy, forthcoming). Ignoring the already high costs of air pollution – in terms of both public health and economic cost – will act as a binding constraint on sustainable development. The environmental impact of local urban development goes beyond administrative boundaries to reach peri-urban and rural areas. Further, Africa is more vulnerable to climate change than other world regions, although it does not contribute much to this global challenge.
Urbanisation is an opportunity to address climate change more efficiently by developing more sustainable cities. Urbanisation gives governments the chance to use and manage natural resources more sustainably, to sustainably manage waste, to create green jobs for the low-skilled population, to improve public health through better access to safe water and sanitation, and to minimise the rising costs of air pollution.
Policy makers can play an important role in making structural transformation more sustainable. Table 7.4 presents some examples of activities in various urban sectors that can reduce their environmental impact.
Table 7.4. Urban activities that can reduce cities’ environmental impact
Sector Activities
Land-use planning Zoning that allows for a mix of land uses so as to reduce travel distances between home, work and other activitiesTax reform to encourage the development of underused lands in urban cores and to discourage urbanisation of underdeveloped land on the urban fringe
Transport Expansion of and/or improvements to public transportPhysical improvements to encourage walking and cyclingFees for personal vehicle travel (e.g. congestion charges)
Buildings Retrofitting of existing building stock to increase energy efficiency Minimum energy efficiency standards for new buildings
Energy Installation of distributed renewable energy generation (e.g. solar panels)District heating and cooling systemsFees that discourage peak energy use
Waste Recycling of household and industrial waste Waste-to-energy and landfill methane-to-energy systemsFees that discourage waste generation
Water Fees that encourage water conservationGovernance mechanisms to improve efficiency of water delivery
Source: OECD (2013b).

7. HOW SUStAiNABlE CitiES CAN CONtriBUtE tO AFriCA’S DEVElOPMENt7. HOW SUStAiNABlE CitiES CAN CONtriBUtE tO AFriCA’S DEVElOPMENt
219African Economic Outlook© AfDB, OECD, UNDP 2016218 African Economic Outlook © AfDB, OECD, UNDP 2016
Where city-level data is scarce, material flow analysis and data scaling from national to city levels can be used to identify different types of African cities according to their energy consumption, as depicted in Table 7.5. This approach can inform the growth of cities and the management of resource consumption through better energy efficiency, material cycling, waste management and more sustainable infrastructure in urban systems. A sustainable urban metabolism can be defined as an urban system restoring biodiversity, reducing carbon emissions to a minimum of two tonnes of CO2
per capita and improving resources efficiency, so that on average city dwellers consume approximately eight tonnes per capita (Swilling, 2015: 4). Resource consumption by cities is a result as well as a driver of the urban economy. Accounting for urban consumption of resources, identifying the mechanisms behind their mobilisation, and measuring the intensity and efficiency of urban consumption patterns can help better understand the potential for urban resource efficiency and sustainability.
Table 7.5. Classification of African cities based on socio-metabolic transitionGroup 1Resource-poor cities
Low consumption of all materials except biomass and water. This suggests limited industry and low income and that the city is growing fast.
Kinshasa, Kigali, Antananarivo, Lagos, Ouagadougou, Niamey, Port Harcourt, Bujumbura, Bangui, N’Djamena and Addis Ababa
Group 2Cities in transition
Medium consumption of biomass, water, electricity, construction materials and fossil fuels.
Pointe-Noire, Luanda, Kampala, Douala, Libreville, Mombasa, Nairobi, Harare, Lusaka, Maputo, Dar es Salaam, Abidjan, Accra and Kumasi
Group 3Resource-sufficient cities
Medium or high consumption of biomass, electricity, fossil fuels and construction materials.
Algiers, Constantine, Alexandria, Cairo, Casablanca, Cape Town, Johannesburg, Malabo, Tunis, Marrakesh and Durban
Source: Swilling (2015).
Renewable energy can help fill the energy gap
Investment in green energy can help solve Africa’s challenge of synchronising economic and environmental development. It would relieve firms of their energy constraints while avoiding repeating other regions’ experiences of rising household and ambient air pollution.
Increasing access to electricity is a chance to invest in renewable resources
Tackling the energy challenge, especially in urban areas, can improve the performance of African firms. Inadequate or unreliable access to electricity remains one of the biggest binding constraints on economic development:
• Power outages are considered one of the biggest obstacles faced by firms. In sub-Saharan Africa, 49% of small and medium-sized enterprises consider electricity as a major constraint. The manufacturing sector experiences power outage 56 days per year on average. Investing in generators costs three times the price of purchasing electricity from the public grid.
• Unreliable electricity is one of the main reasons preventing firms from growing bigger. In the informal sector, power outages cause up to 16% loss of sales revenues compared to 6% in the formal sector. Outages also discourage start-ups as they lack capital to invest in generators.
• Lack of access to electricity also leads banks to decline loans because it increases firms’ economic risks.
Bridging the energy gap is easier in urban areas than in rural ones. In its Africa Energy Outlook, the International Energy Agency (IEA) has developed a “central scenario” to meet Africa’s electricity demand. In that scenario, two-thirds of the population gaining access would live in urban areas and be connected to a main grid. Figure 7.14 shows that this increase in electricity access would add around 190 terawatt-hours (TWh) to total

7. HOW SUStAiNABlE CitiES CAN CONtriBUtE tO AFriCA’S DEVElOPMENt
220 African Economic Outlook © AfDB, OECD, UNDP 2016
power consumption in 2040, mainly through urban on-grid access. Currently, around two-thirds of sub-Saharan Africa’s population, or 635 million people, do not have access to electricity. Over a third of the area’s urban population lacks access to electricity, compared to less than 5% in developing Asia or Latin America. Sub-Saharan Africa’s electricity demand per capita averages 400 kWh, 75% below developing Asia and less than the electricity needed to power one 50-watt light bulb continuously for a year.
Figure 7.14. Projected electricity demand from the sub-Saharan African population gaining access to electricity, 2020-40
2020 2040203520302025
0
30
60
90
120
150
Off-gridMini-grid On-grid
Terawatt-hours
Urban Rural Urban Rural Urban Rural Urban Rural Urban Rural
Note: These projections correspond to the “New Policies Scenario” of the IEA (2014).Source: IEA (2014).12 http://dx.doi.org/10.1787/888933350896
The IEA estimates that increasing the electrification rate in sub-Saharan Africa from around 30% today to 70% in 2040 would cost USD 205 billion in capital investment. This sum is less than one-fifth of total power sector investment in the region. Achieving this level of investment requires steadily improving the investment conditions for electricity access-related projects, while rapidly improving capacity and effective co-ordination among the various actors involved. Clarity and consultation over the pace of grid extension allows the stakeholders, including local communities, to make an informed assessment of the best options for expanding access. Donor programmes likewise need to be managed carefully, both to ensure that the beneficiaries are fully involved from the outset, not least to guarantee adequate and on-going maintenance, and to avoid undercutting fledgling commercial energy providers.
Renewable energy sources in Africa are mainly wind and solar (IRENA, 2015), though hydropower and geothermal sources also show potential to supply sustainable cities with renewable energy.
• Africa could potentially generate 460 petawatt hours (PWh) annually through wind energy. Wind energy is currently the lowest cost source of electricity available and generated a 2 462-megawatt (MW) capacity at the end of 2014. Installed wind power capacity in Africa is likely to rise to 75-86 gigawatts (GW) by 2030 (GWEC, 2014). Morocco has the largest wind network. South Africa’s Cookhouse wind farm is the continent’s largest, with 66 turbines generating 138 MW of clean power.
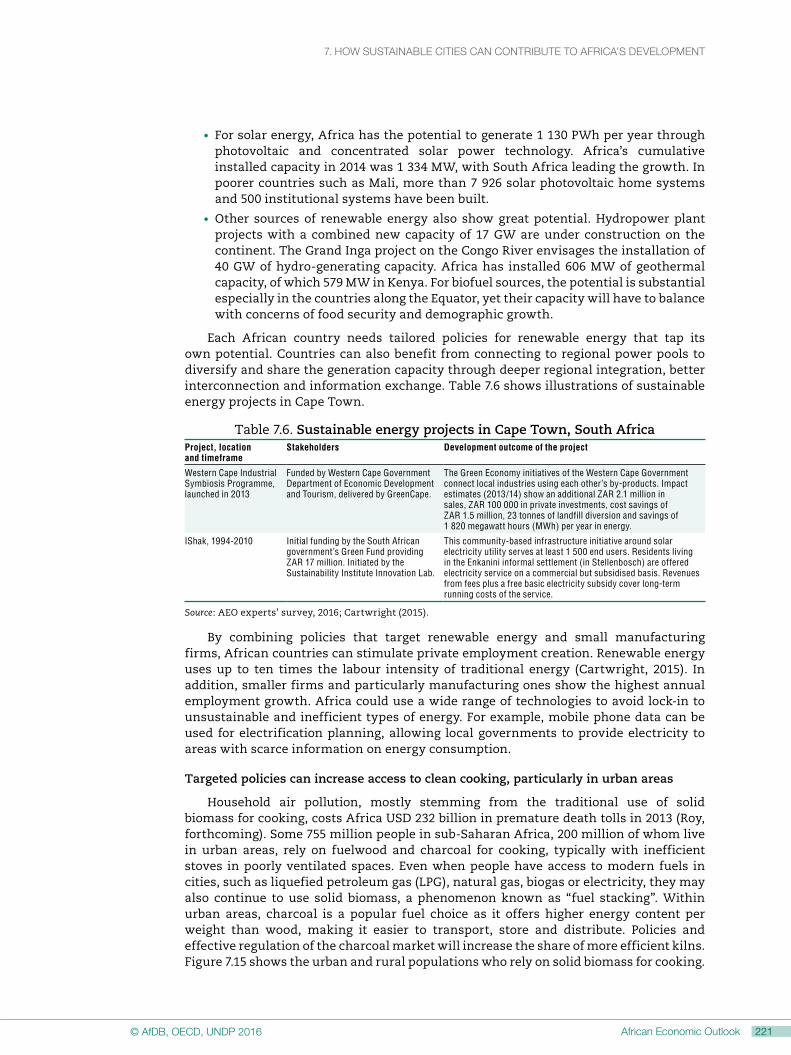
7. HOW SUStAiNABlE CitiES CAN CONtriBUtE tO AFriCA’S DEVElOPMENt7. HOW SUStAiNABlE CitiES CAN CONtriBUtE tO AFriCA’S DEVElOPMENt
221African Economic Outlook© AfDB, OECD, UNDP 2016220 African Economic Outlook © AfDB, OECD, UNDP 2016
• For solar energy, Africa has the potential to generate 1 130 PWh per year through photovoltaic and concentrated solar power technology. Africa’s cumulative installed capacity in 2014 was 1 334 MW, with South Africa leading the growth. In poorer countries such as Mali, more than 7 926 solar photovoltaic home systems and 500 institutional systems have been built.
• Other sources of renewable energy also show great potential. Hydropower plant projects with a combined new capacity of 17 GW are under construction on the continent. The Grand Inga project on the Congo River envisages the installation of 40 GW of hydro-generating capacity. Africa has installed 606 MW of geothermal capacity, of which 579 MW in Kenya. For biofuel sources, the potential is substantial especially in the countries along the Equator, yet their capacity will have to balance with concerns of food security and demographic growth.
Each African country needs tailored policies for renewable energy that tap its own potential. Countries can also benefit from connecting to regional power pools to diversify and share the generation capacity through deeper regional integration, better interconnection and information exchange. Table 7.6 shows illustrations of sustainable energy projects in Cape Town.
Table 7.6. Sustainable energy projects in Cape Town, South AfricaProject, location and timeframe
Stakeholders Development outcome of the project
Western Cape Industrial Symbiosis Programme, launched in 2013
Funded by Western Cape Government Department of Economic Development and Tourism, delivered by GreenCape.
The Green Economy initiatives of the Western Cape Government connect local industries using each other’s by-products. Impact estimates (2013/14) show an additional ZAR 2.1 million in sales, ZAR 100 000 in private investments, cost savings of ZAR 1.5 million, 23 tonnes of landfill diversion and savings of 1 820 megawatt hours (MWh) per year in energy.
IShak, 1994-2010
Initial funding by the South African government’s Green Fund providing ZAR 17 million. Initiated by the Sustainability Institute Innovation Lab.
This community-based infrastructure initiative around solar electricity utility serves at least 1 500 end users. Residents living in the Enkanini informal settlement (in Stellenbosch) are offered electricity service on a commercial but subsidised basis. Revenues from fees plus a free basic electricity subsidy cover long-term running costs of the service.
Source: AEO experts’ survey, 2016; Cartwright (2015).
By combining policies that target renewable energy and small manufacturing firms, African countries can stimulate private employment creation. Renewable energy uses up to ten times the labour intensity of traditional energy (Cartwright, 2015). In addition, smaller firms and particularly manufacturing ones show the highest annual employment growth. Africa could use a wide range of technologies to avoid lock-in to unsustainable and inefficient types of energy. For example, mobile phone data can be used for electrification planning, allowing local governments to provide electricity to areas with scarce information on energy consumption.
Targeted policies can increase access to clean cooking, particularly in urban areas
Household air pollution, mostly stemming from the traditional use of solid biomass for cooking, costs Africa USD 232 billion in premature death tolls in 2013 (Roy, forthcoming). Some 755 million people in sub-Saharan Africa, 200 million of whom live in urban areas, rely on fuelwood and charcoal for cooking, typically with inefficient stoves in poorly ventilated spaces. Even when people have access to modern fuels in cities, such as liquefied petroleum gas (LPG), natural gas, biogas or electricity, they may also continue to use solid biomass, a phenomenon known as “fuel stacking”. Within urban areas, charcoal is a popular fuel choice as it offers higher energy content per weight than wood, making it easier to transport, store and distribute. Policies and effective regulation of the charcoal market will increase the share of more efficient kilns. Figure 7.15 shows the urban and rural populations who rely on solid biomass for cooking.

7. HOW SUStAiNABlE CitiES CAN CONtriBUtE tO AFriCA’S DEVElOPMENt
222 African Economic Outlook © AfDB, OECD, UNDP 2016
Figure 7.15. African populations relying on solid biomass for cooking, 2012
20
0
40
60
80
100
120
Rural UrbanRural Urban Rural Urban Rural Urban
Nig
eria
Gha
na
West Africa Central Africa East Africa Southern Africa
Nig
er
Côte
d'Iv
oire
Cong
o, D
em. R
ep.
Cam
eroo
n
Chad
Cent
ral A
fric
an R
ep.
Ethi
opia
Keny
a
Uga
nda
Suda
n
Tanz
ania
Moz
ambi
que
Mad
agas
car
Mal
awi
Million
Source: IEA (2014).12 http://dx.doi.org/10.1787/888933350905
In the Africa Energy Outlook’s “central scenario”, the investments for access to clean cooking in sub-Saharan Africa will reach USD 9.5 billion over the period to 2040. These investments are largely made in urban areas where households mainly switch to LPG. Policies play a major role in households’ decisions to spend a portion of their incremental income on cleaner cooking facilities, which they generally would not consider. Among the regional initiatives in place, ECOWAS initiated a programme in 2012 called the West African Clean Cooking Alliance. It aims to ensure that by 2030 the entire ECOWAS population has access to modern cooking fuels and devices. Kenya has plans to eliminate kerosene use in households by 2022 and has a relatively developed market for improved biomass cook stoves in urban areas. In Senegal, incentives have supported LPG use, and less than 25% of the urban population now uses solid biomass.
Multisectoral and co-ordinated policies can mitigate the rising cost of air pollution
Removing coal and petroleum subsidies could create large welfare gains. Phasing out energy subsidies would account for more than a 50% welfare gain in Africa and at least a 50% reduction in deaths from air pollution (Coady et al., 2015: Figure 12). Furthermore, Africa’s diversifier countries may consider implementing transport-related mitigation measures already tested in OECD countries, such as road-user pricing or subsidies for company-car usage, and adapt them to the local context (Harding, 2014; Roy, 2014).
Low oil prices provide an opportunity for African countries to gradually phase out costly fossil fuel subsidies. Fossil fuels cost African governments 5.5% of GDP in 2015, including 1.8% of GDP to cover the difference between the final energy price and the actual cost of fossil fuels. However, a gradual approach may be desirable, given the size of the required price increases and uncertainty about the optimum level of taxes. A slow increase would allow time for households and firms to adjust and for governments to further refine estimates and implement measures to protect the poor. The funds

7. HOW SUStAiNABlE CitiES CAN CONtriBUtE tO AFriCA’S DEVElOPMENt7. HOW SUStAiNABlE CitiES CAN CONtriBUtE tO AFriCA’S DEVElOPMENt
223African Economic Outlook© AfDB, OECD, UNDP 2016222 African Economic Outlook © AfDB, OECD, UNDP 2016
released from phasing out the subsidies can be used for targeted social protection to ensure the welfare of those most affected by a price hike.
The need to mitigate Africa’s main environmental risks is obvious. Household air pollution (HAP) is Africa’s most significant environmental problem, followed by unsafe water and unsafe sanitation. Opportunities lie in comprehensive programmes of public investment in urban improvements, simultaneously tackling these problems, along with APMP as part of a comprehensive urban policy agenda. The cost for Africa of these four environmental risk factors was USD 850 billion in 2013 and is heading towards USD 1 trillion in the near future. A cost-benefit analysis must be performed and peer-to-peer learning applied in regard to “old-style” environmental problems, such as unsafe water and household air pollution, which advanced and emerging economies have largely eliminated. But new environmental risks, such as APMP, should not be ignored because their costs are rising (see Chapter 6).
The world has an interest in helping Africa reduce its air pollution. “Local” air pollution is also a transnational and indeed a global problem that requires international co-ordination. For example, black carbon is an important greenhouse pollutant; it is a product of open wood fires and of “the exhaust pipes of unsophisticated diesel vehicles” (Roy, forthcoming). As Africa’s population will increase to approximately 40% of the world’s population in 2100, its air pollution could significantly contribute to climate change.
Better access to safe water and sanitation in urban areas significantly improves public health
232 million more urban residents in Africa have access to improved water in 2014 than in 1990, and 128 million urban residents more have gained access to sanitation over the same period. Countries that have made the most significant progress are those starting from a lower base such as Guinea-Bissau, Mali, and Niger where less than two-thirds of the urban population had access to water in 1990. By 2015, these countries have increased the share by at least 40 percentage points. Other countries are catching up albeit at slower pace. Angola, Cabo Verde, Central African Republic, Mauritania, and Tanzania have successfully increased the rates of urban access to improved sanitation by more than 20 percentage points during this period. In contrast, urban access to water, sanitation and hygiene (WASH) services delivery has deteriorated in several countries during the same period as in Algeria, the DRC and Sudan.
Figure 7.16. Access to improved water in urban areas and urban population growth in Africa, 1990-2015
Annual urban population growth (%)
DZA
AGO
BEN
BWA
BFA
BDI
CPV CMR
CAF
TCD
COM
COD COG
CIV
DJI
EGY
GNQ
ERI ETH
GAB GMB GHA GIN
GNB
KEN LSO
LBR MDG
MWI
MLI
MRT
MUS MAR
MOZ
NAM
NER
NGA RWA
STP
SEN
SYC
SLE
SOM
ZAF SWZ
TZA
TGO
TUN
UGA
ZMB
-1
ZWE 0
1
2
3
0 1 2 3 4 5 6 7 8 9
Annual increase in share of urban inhabitants with access to clean water (percentage points)
Source: WHO (2014); UN DESA (2014).12 http://dx.doi.org/10.1787/888933350912

7. HOW SUStAiNABlE CitiES CAN CONtriBUtE tO AFriCA’S DEVElOPMENt
224 African Economic Outlook © AfDB, OECD, UNDP 2016
Policies in several countries have successfully increased urban access to improved water and sanitation despite strong urban population growth. In Mali, the share of population with access to improved water has increased from 53% in 1990 to 97% in 2015 even if the urban population has increased by 5% a year during the same period (Figure 7.16). The combination of decentralisation and public-private partnerships has enabled the urban water service sector to operate more efficiently than other utilities in West Africa (USAID, 2010a). Water service management is decentralised to about 700 administrative districts or communal councils, while a semi-private firm, Energie du Mali SA, holds concessional contracts to provide service and expand coverage to 16 urban areas including Bamako.
Box 7.6. Decentralisation for improved water supply and sanitation performance in Angola
In Angola, infrastructure investments in the water supply and sanitation sector as well as decentralisation of service delivery have significantly transformed the sector. Service delivery was decentralised to autonomous or commercial provincial water and sanitation utilities with technical assistance from the central government. As a result, between 1990 and 2015 urban access to an “improved water source” increased from 52% to 75%, and urban access to improved sanitation increased from 65% to 89%.
Source: USAID (2010b).
Good management of urban wetlands leads to flood control, storage and purification of water and preserves biodiversity
Urban expansion requires sustainable management of ecosystems surrounding urban areas, and the case of wetlands shows their value is often ignored. The International Water Management Institute estimates total value of wetland services in Africa at USD 25 billion a year (McCartney et al., 2010). While significant, this is far less than the USD 70 billion for Asia, showing potential for greater returns. Wetlands and mangrove forests buffer coastlines against storms, ocean surges and sea-level rises, serve as spawning grounds for fish, and allow for activities such as beekeeping, carbon sequestration, fisheries, aquaculture, fuelwood harvesting, ecotourism, research and education.5 Table 7.7 shows a variety of ecosystem services from wetlands with African case studies.
Table 7.7. Typology of ecosystem services from wetlandsServices Ecosystem service Example
Supporting Nutrient cycling The swamps of Kampala’s Lutembe Bay filter silt, sediment and excess nutrients from surface run-off, sewage and industrial waste.
Biodiversity Zambia wetlands support over 400 bird species and 120 fish.
Primary production Photosynthesis takes place in aquatic plants and wetland vegetation.
Recharging aquifers Standing wetlands are a key resource for water cycles.
Provisioning Capture of species Urban and peri-urban fishing includes fish from freshwaters. The African inland catch exceeds 2.5 million tonnes per year.
Collection of plant foods Palm species are collected for food in the Okavango Delta.
Collection of materials Papyrus is harvested to make mats and baskets in Uganda.
Livestock grazing Over a million goats graze the Inner Delta of the Niger River.
Crop growing Rich peat soils support productive agriculture.
Energy source Papyrus is compacted into fuel briquettes in Rwanda.
Timber from wetland forests Fuelwood and building timber is also collected from mangroves and riparian forests.
Medicines Freshwater plant species are used as medicine in Tanzania.
Freshwater resources Many African cities draw their drinking water from nearby wetlands, rivers and lakes.
Regulating Flooding Wetlands absorb floodwater.
Storm protection Mangroves and coastal forests help to buffer cities against storms and ocean surges.

7. HOW SUStAiNABlE CitiES CAN CONtriBUtE tO AFriCA’S DEVElOPMENt7. HOW SUStAiNABlE CitiES CAN CONtriBUtE tO AFriCA’S DEVElOPMENt
225African Economic Outlook© AfDB, OECD, UNDP 2016224 African Economic Outlook © AfDB, OECD, UNDP 2016
Table 7.7. Typology of ecosystem services from wetlandsServices Ecosystem service Example
Carbon sequestration Wetlands and particularly peatlands are major carbon stores.
Climate stabilisation Evaporation from major lakes helps to reduce climatic extremes and stabilise temperatures.
Water purification Wetlands help to neutralise various pollutants entering the water system from cities and agriculture.
Cultural Recreational Wetlands can be a tourist attraction. The Okavango Delta brings 120 000 tourists a year, creating jobs for 600 guides.
Spiritual Many wetlands have local sacred values; Lake Fundudzi in South Africa is believed to be the home of ancestral spirits.
Source: Prepared by the WWF for this edition of the African Economic Outlook.
Unplanned urban expansion can endanger wetlands’ ecosystems. When wetlands are degraded or destroyed, the associated ecosystem services are lost, for instance in the Sierra Leone River estuary and Haramous-Loyada in Djibouti. Urban expansion around Lagos, Nigeria, caused losses of wetlands in four local government areas of 38-100% between 1986 and 2006 (Adelekan, 2009). Map 7.4 highlights the four cities which are likely to see their urban expansion taking place on the watersheds that supply them with fresh water, possibly reducing their water provisions.
But planned management can help to reverse losses. Fish catch from Lake Malawi tripled after part of the lake was protected and stocks were allowed time to recover (Drill, 2008).
Waste management is an opportunity for sustainable development
Waste management can generate valuable resources and be a source of energy and jobs for more sustainable cities. Recycling can limit the demand for virgin material and products from extractive industries. Waste, methane collected from landfills and bio digesters can produce heat, electricity and other sources of energy. Landfill gas projects can reduce methane emissions from municipal solid waste landfills by capturing 60-90% of carbon emissions (Agbelie, Bawakyillenuo and Lemaire, 2015). In Kampala, where 40% of the residents have their waste collected, community involvement in solid-waste collection and recycling has prevented drain blockages, flooding and contamination of Lake Victoria (Cartwright, 2015: 22). Table 7.8 provides illustrations of projects led by different types of stakeholders in selected African countries.
Table 7.8. Sustainable waste management projects in AfricaProject, location and timeframe Stakeholders Development outcome
Recycling factories, 2008-present. Viana (Luanda) and Lobito (Benguela), Angola
Moncartel/Neuerth Group The Portuguese group Moncartel constructs recycling factories for glass, plastic and engine oils. Neuerth Group invested USD 20 million in a scrap steel recycling plant with the capacity of producing 1 200 tonnes of aluminium bars per month.
Zabaleen Waste Collection, Cairo, Egypt
Zabaleen Community 65 000 Zabaleen waste collectors pick up about 9 000 of Cairo’s 15 000 tonnes of daily household rubbish. Up to 80% is recycled.
Solid Waste Recycling, Mauritius
Mauritius’ Solid Waste Recycling Company Ltd.
The company produces 20 000 tonnes of compost per year out of municipal solid waste; this has enhanced agricultural productivity and replaced imports of chemical fertilisers for agriculture.
Reliance Compost, launched in 1998. Cape Town, South Africa
Local municipalities Reliance Compost removes green waste and turns it into organic compost for sale to the agricultural sector. In Cape Town, the company employs 220 people and saves 180 000 tonnes worth of CO2 emissions per year. In Western Cape, it has reduced 13 million cubic meters of green waste in land fields since 1998.
AgriProtein, launched in 2014. Cape Town, South Africa
Africa Enterprise Challenge Fund, Stellenbosch University, The Bill and Melinda Gates Foundation, Biocycle initiative
This project consists of using municipal waste as a feedstock in breeding fly larvae, which are sold to livestock and poultry farmers to reduce dependence on fishmeal and scarce fish stocks. The environmental savings from lower fossil fuel consumption, land use and carbon emissions is USD 2 500 for every tonne of MagMeal produced.
Source: AEO experts’ survey, 2016; AEO country notes 2016; Cartwright (2015); ILO (2014); Swilling (2015).
(cont.)
7. HOW SUStAiNABlE CitiES CAN CONtriBUtE tO AFriCA’S DEVElOPMENt
226 African Economic Outlook © AfDB, OECD, UNDP 2016
Currently sub-Saharan Africa generates about 62 million tonnes of waste per year. The urban lifestyle and urban sprawl increase the costs of waste disposal (Cartwright, 2015). Bio-waste from vegetables and other biological products still make up the majority of Africa’s waste, at 50-80% (Okot-Okumu, 2012). A global trend in the increase in electrical and electronic goods points towards a change in waste composition and more plastic and e-waste in Africa’s cities. Africa has the lowest waste collection rate, below 50% on average compared to OECD countries’ rates largely over 90% (World Bank, 2012). In Egypt, collection rates lie at only 40% of total municipal solid waste, recycling at 2.5% and unsound disposal at 83.5% (D-Waste, 2016).
Reforming the waste collection system allows for financial savings. In Dar es Salaam, the collection rate of solid waste production is only 37%, however the municipality’s waste collection operating costs approach 50% of the overall municipal budget (World Bank, 2012). While most African cities spend 20-50% of their annual budget on solid waste management, only 20-80% of the waste is collected (MSO, 2013). The legislation for different waste streams is often fragmented and low collection coverages suggest inefficiency in waste management (UNECA, 2012).
In the long run, African sustainable cities can develop a zero waste approach adapted to the local context. The zero waste approach could eventually achieve 100% recycling through better waste management (Zero Waste Europe, 2014). In 2001, the Polokwane Declaration on Waste Management developed a zero waste plan for South Africa by 2022 (Mohee and Simelane, 2015). A zero waste city requires combining social, political, economic and technical interventions in targeted urban areas that complement one another. Options for policy makers include user-pays waste charges, the demarcation of space for recycling, bio-digesters, upcycling and composting.

7. HOW SUStAiNABlE CitiES CAN CONtriBUtE tO AFriCA’S DEVElOPMENt7. HOW SUStAiNABlE CitiES CAN CONtriBUtE tO AFriCA’S DEVElOPMENt
227African Economic Outlook© AfDB, OECD, UNDP 2016226 African Economic Outlook © AfDB, OECD, UNDP 2016
Annex 7.A1. methodology for mapping financial flows to African cities
Today highly dense global and regional networks of foreign direct investment (FDI) have emerged, tying cities together worldwide (Wall et al., 2011; Wall and van der Knaap, 2011). FDI concerns a firm in one country investing in a firm in another country, with the intent of gaining control over its operations. It is made up of two parts: “mergers and acquisitions” and “greenfield investments”. Mergers consolidate particular firms into one, and acquisitions take monetary possession of other firms. Greenfield investments represent investments where parent firms start entirely new projects and facilities in host countries. Greenfield investments relate more directly to the actual development of urban economic activities and are therefore analysed in this chapter, notably for Maps 7.1, 7.2 and 7.3.
The data analysed in this study concern “cross-border” greenfield investments. The data draws from the Financial Times’ database fDi Markets (2016), which is the most complete set of data on international investments between cities and countries. The data concerns global FDI flows to African cities.
• First, the fDi Markets data was verified by testing it against similar data used in the UNCTAD 2015 report, which also partly made use of the same database. The results show very high correlations across a similar panel for the same period (2003-14).
• Next, missing values of fDi Markets data were completed using the Orbis database (Bureau van Dijk, 2016) and online sources. The data was then geocoded with Cartesian co-ordinates for all the origin and destination cities in the Africa dataset. Based on this data, the three maps were generated by means of ArcGIS software.
• To derive the main variables determining FDI to African, Asian and European world regions, we have used data on the volume (count) of greenfield investments and the indicators from the Global Competitiveness Report 2014-2015 indicators (World Economic Forum, 2015), creating a matching panel of nine years, i.e. 2006 to 2014.
• Out of 24 sub-indicators, we created composite indices for the following 7 categories to calculate each country’s competitiveness index: goods market efficiency, infrastructure, macroeconomic environment, labour market efficiency, technological readiness, market size and health. Each index is adapted to the scale and nature of this study: we selected a set of dimensions and indicators corresponding to factors that contribute to inward greenfield investments in countries. The selection of the indicators is based on theory and the P2 computation. This computation uses a synthetic distance index that combines all indicators into a single value. This allows comparisons between entities (both temporal and spatial) and is considered to be an exhaustive synthetic indicator because it is not based on a reduction of information.
• To calculate the P2 distance (Pérez-Luque et al., 2015; Bonet-García et al., 2015), we started with a matrix X of order (m, n) in which m is the number of spatial units (countries) and n, the number of variables. Each element of this matrix, xri, is the value of the variable i in the spatial entity r. The P2 distance indicator calculates the distance of each spatial entity with regard to a theoretical spatial entity of reference. Initially, a distance matrix D is calculated as:
Dri = |Xri-X*i|
where x ⁄i is the r-th element of the reference base vector X ⁄ = (x ⁄1, x ⁄2, . . ., x ⁄n). For each variable a reference value must be defined to compare different spatial entities.
• Next, all basic assumptions were tested on the data including multicollinearity, heteroskedasticity, normality and outliers. Because the dependent variable is considered to be count data, we employed the negative binomial model, which is a member of the Poisson estimation family.
Source: Prepared by Ronald Wall and Dorcas Nthoki (2016), Institute for Housing and Urban Studies/Erasmus University Rotterdam on assignment for UN-Habitat, Nairobi for this edition of the African Economic Outlook.

7. HOW SUStAiNABlE CitiES CAN CONtriBUtE tO AFriCA’S DEVElOPMENt
228 African Economic Outlook © AfDB, OECD, UNDP 2016
Notes
1. Food imports, at USD 86 billion per year on average between 2011 and 2013, represent only a small share of the urban food market (authors’ calculations based on UNCTAD, 2014).
2. The middle class is defined here as those with an income of USD 4-20 a day in purchasing power parity (AfDB, 2011).
3. There are multiple definitions of the middle class in developing countries. Some are non-monetary definitions such as aspirations and lifestyle, or asset-based measures. Most definitions set a monetary threshold based on per-person income or consumption using monetary data. They reflect different ideologies, and each has its own limitations in methodology.
4. A slum household is defined as deprived in at least one of the five following amenities: durable housing, sufficient living area, access to improved water, improved sanitation or secure tenure (UN-Habitat, 2006).
5. In Viet Nam a USD 1.1 million investment in community restoration of mangroves saved an estimated USD 7.3 million per year in sea dyke maintenance.

7. HOW SUStAiNABlE CitiES CAN CONtriBUtE tO AFriCA’S DEVElOPMENt7. HOW SUStAiNABlE CitiES CAN CONtriBUtE tO AFriCA’S DEVElOPMENt
229African Economic Outlook© AfDB, OECD, UNDP 2016228 African Economic Outlook © AfDB, OECD, UNDP 2016
References
Abrahamsen, R. and M.C. Williams (2008), “Public/private, global/local: The changing contours of Africa’s security governance”, Review of African Political Economy, No. 118, pp. 539-553.
Acemoglu, D. and F. Zilibotti (1997), “Was Prometheus unbound by chance? Risk, diversification, and growth”, Journal of Political Economy, 105/4, pp. 709–751, http://dx.doi.org/10.1086/262091.
Adelekan, I. (2009), “Vulnerability of poor urban coastal communities to climate change in Lagos, Nigeria”, Environment and Urbanization, Vol. 22/2, pp. 433-450, http://dx.doi.org/10.1177/0956247810380141.
AfDB (2011), Middle of the Pyramid: Dynamics of the Middle Class in Africa, African Development Bank, Tunis.
AfDB/FAO (2015), Agricultural Growth in West Africa Market and Policy Drivers, F. Hollinger and J.M. Staatz (eds.), Rome.
AfBD/OECD/UNDP (2015), African Economic Outlook 2015: Regional Development and Spatial Inclusion, OECD Publishing, Paris, http://dx.doi.org/10.1787/aeo-2015-en.
AfDB/OECD/UNDP (2014), African Economic Outlook 2014: Global Value Chains and Africa’s Industrialisation, OECD Publishing, Paris, http://dx.doi.org/101787/aeo-2014-en.
Agbelie, I., S. Bawakyillenuo and X. Lemaire (2015), “Waste-to-energy: African cities can transform their energy landscapes”, www.urbanafrica.net/urban-voices/waste-to-energy-african-cities-can-transform-their-energy-landscapes.
Ali, M. and J. Peerlings (2012), “Farm households and nonfarm activities in Ethiopia: Does clustering influence entry and exit ?”, Agricultural Economics, Vol. 43/3, pp. 253–266, http://dx.doi.org/10.1111/j.1574-0862.2012.00580.x.
Allen, T. (forthcoming), “Adjusting food policies to emerging value chain opportunities in West Africa”, OECD West African Papers.
Altenburg, T. et al. (2016), “Making retail modernisation in developing countries inclusive: A development policy perspective”, Discussion Paper, German Development Institute (DIE), Bonn.
Angel, S. et al. (2015), “Monitoring the quantity and quality of global urban expansion, Working Paper, No. 24, NYU Stern Urbanisation Project and The Marron Institute for Urban Management, New York.
Ayadi, M. and W. Matoussi (2014), “Disentangling the pattern of geographic concentration in Tunisian manufacturing industries”, Working Paper Series, No. 213, African Development Bank, Tunis.
Benner, M. (2013), “Cluster policy in developing countries”, University of Toronto, http://siteresources.worldbank.org/EXTPREMNET/Resources/489960-1338997241035/Growth_Commission_Workshops_Industrial_Innovation_Policy_Duranton_Presentation.pdf.
Bonet-García, F. J. et al. (2015), “Protected areas as elicitors of human well-being in a developed region: A new synthetic (socioeconomic) approach”, Biological Conservation, 187, pp. 221-229.
Bureau van Dijk (2016), Orbis (database), data from 2003-14, www.bvdinfo.com (accessed in March 2016).
Cartwright, A. (2015), “Better growth, better cities: Rethinking and redirecting urbanisation in Africa”, Working Paper, African Center for Cities and The New Climate Economy: The Global Commission on the Economy and Climate, Washington, DC, http://2015.newclimateeconomy.report/wp-content/uploads/2015/09/NCE-APP-final.pdf.
Center for International Development at Harvard University (2016), The Atlas of Economic Complexity, www.atlas.cid.harvard.edu (accessed in March 2016).
Coady, D. et al. (2015), “How large are global energy subsidies?”, IMF Working Paper, www.imf.org/external/pubs/ft/wp/2015/wp15105.pdf.
Collin, M., J. Sandefur and A. Zeitlin (2015), “Falling off the map: The impact of formalizing (some) informal settlements in Tanzania”, CSAE Working Paper WPS/2015-09, Centre for the Study of African Economies.
D-Waste (2016), Waste atlas – interactive map, University of Leeds, ISWA, Sweepnet,WIERT, SWAPI, www.atlas.d-waste.com (accessed in March 2016).
De Haen, H. et al. (2003), “The world food economy in the twenty-first century: Challenges for international co-operation”, Development Policy Review, Vol. 21/5-6, pp. 683–696, http://doi.org/10.1111/j.1467-8659.2003.00232.x.
Dinh, H.T. et al. (2012), Light Manufacturing in Africa: Targeted Policies to Enhance Private Investment and Create Jobs, World Bank, Washington, DC, http://doi.org/10.1596/978-0-8213-8961-4.

7. HOW SUStAiNABlE CitiES CAN CONtriBUtE tO AFriCA’S DEVElOPMENt
230 African Economic Outlook © AfDB, OECD, UNDP 2016
Doepke, M. and F. Zilibotti (2007), “Occupational choice and the spirit of capitalism”, Quarterly Journal of Economics, 1/2, pp. 747–793, http://dx.doi.org/10.1162/qjec.2008.123.2.747.
Dorosh, P. et al. (2012), “Road connectivity, population, and crop production in sub-Saharan Africa”, Agricultural Economics, Vol. 43/1, pp. 89–103, http://doi.org/10.1111/j.1574-0862.2011.00567.x.
Duranton, G. and D. Puga (2001), “Nursery cities: Urban diversity, process innovation and the life cycle of products”, The American Economic Review, Vol. 91/5, pp. 1454–1477.
Drill, S. (2008), “The use of protected areas for biodiversity and stock conservation in an East African lake”, Reconciling Fisheries With Conservation, American Fisheries Society Symposium No. 49, pp. 1253-1262.
Fafchamps, M. and E. La Ferrara (2012), “Self-help groups and mutual assistance: Evidence from urban Kenya”, Economic Development and Cultural Change, Vol 60/4, pp. 707-733.
FAO (2011), “Extent of food losses and waste”, Global Food Losses and Food Waste: Extent, Causes and Prevention, Food and Agriculture Organization, Rome, www.fao.org/docrep/014/mb060e/mb060e00.pdf.
Farole, T. (2011), Special Economic Zones in Africa, Comparing Performance and Learning from Global Experiences, World Bank, Washington, DC, http://hdl.handle.net/10986/2268.
fDi Markets (2016), fDi Markets (database), www.fdimarkets.com (accessed in March 2016).
Fikri, K.T. and T.J. Zhu (2015), „City analytics”, Working Paper, No. 101718, World Bank, Washington, DC, http://documents.worldbank.org/curated/en/2015/12/25658521/city-analytics
Foster V. and C. Briceno-Garmendia (eds.) (2010), Africa’s Infrastructure: A Time for Transformation, a co-publication of the Agence Francaise de Development and the World Bank.
Franklin, S. (2015a), “Location, search costs and youth unemployment: A randomised trial of transport subsidies in Ethiopia”, SCAE Working Paper Series, No. 11/2015, Centre for the Study of African Economies, University of Oxford, http://EconPapers.repec.org/RePEc:csa:wpaper:2015-11.
Franklin, S. (2015b), “Enabled to work: The impact of government housing on slum dwellers in South Africa”, CSAE Working Paper WPS/2015-10, Centre for the Study of African Economies, University of Oxford, www.csae.ox.ac.uk/workingpapers/pdfs/csae-wps-2015-10.pdf.
Frenchman, D. (2014), “Designing better cities”, in S. Yusuf (ed.), The Buzz in City: New Economic Thinking, The Growth Dialogue, Washington, DC, pp. 19–30.
Gallup World Poll (2016), Gallup World Poll (database), www.gallup.com/services/170945/world-poll.aspx (accessed in February 2016.
GreenCape (2014), “GreenCape sector development agency: Progress report on strategic project”, Western Cape Industrial Symbiosis Programme (WISP), Cape Town, http://greencape.co.za/assets/Uploads/13003-WISP-Executive-Summary-Final-1.pdf.
Gill, I. and H. Kharas (2007), An East Asian Renaissance: Ideas for Economic Growth, World Bank, Washington, DC.
Glaeser, E. (2012), Triumph of the City: How Our Greatest Invention Makes Us Richer, Smarter, Greener, Healthier, and Happier, Penguin US, New York.
Gulyani, S. and D. Talukdar (2008), “Slum real estate: The low-quality high-price puzzle in Nairobi’s slum rental market and its implications for theory and practice”, World Development, Vol. 36/10, pp. 1916-1937, http://doi.org/10.1016/j.worlddev.2008.02.010.
GWEC (2014),Global Wind Report 2014: Annual Market Update, Global Wind Energy Council, Brussels, www.gwec.net/publications/global-wind-report-2/global-wind-report-2014-annual-market-update.
Harding, M. (2014), “The diesel differential: Differences in the tax treatment of gasoline and diesel for road use” OECD Taxation Working Papers, No. 21, OECD Publishing, Paris, http://dx.doi.org/10.1787/5jz14cd7hk6b-en.
IEA (2014), Africa Energy Outlook: World Energy Outlook Special Report, OECD/IEA, Paris.
Iimi, A., R. Humphrey and S. Melibaeva (2015), “Firm productivity and infrastructure costs in East Africa”, Policy Research Working Paper, No. 7278, World Bank, Washington DC, http://elibrary.worldbank.org/doi/abs/10.1596/1813-9450-7278.
Ijumba, C. et al. (2015), Stages of transformation in food processing and marketing: Results of an initial inventory of processed food products in Dar es Salaam, Arusha and Mwanza, Tanzania Policy Research Brief, Feed the Future: The U.S Government’s Global Hunger and Food Security Initiative, http://purl.umn.edu/210883.
ILO (2014), Green Jobs Assessment Mauritius, International Labour Organisation, Geneva, www.ilo.org/wcmsp5/groups/public/---ed_emp/---emp_ent/documents/publication/wcms_317238.pdf, (accessed March 2016).

7. HOW SUStAiNABlE CitiES CAN CONtriBUtE tO AFriCA’S DEVElOPMENt7. HOW SUStAiNABlE CitiES CAN CONtriBUtE tO AFriCA’S DEVElOPMENt
231African Economic Outlook© AfDB, OECD, UNDP 2016230 African Economic Outlook © AfDB, OECD, UNDP 2016
IRENA (2015), Africa 2030: A Roadmap for a Renewable Energy Future,Technologies to Harness Africa’s Renewable Resources, International Renewable Energy Agency, Abu Dhabi, www.irena.org/DocumentDownloads/Publications/IRENA_Africa_2030_REmap_2015_low-res.pdf.
ISS (2015), “Can violent cities deliver economic growth? Lessons from South Africa and Colombia”, Institute of Security Studies Seminar, www.issafrica.org/uploads/8-06-2015-Seminar-Violent-Cities.pdf.
Jacobs, J. (1969), The Economy of Cities, Random House, New York.
Kayizzi-Mugerwa, S., A. Shimeles and N. Yaméogo (eds.) (2014), Ubanization and Socio-Economic Development in Africa, Routledge African Studies, New York.
Kilcullen, D., G. Mills and W. Trott (2015), “Poles of prosperity or slums of despair? The future of African cities”, Discussion Paper, The Brenthurst Foundation, No. 5/2015.
Linard, C. et al. (2012), “Population distribution, settlement patterns and accessibility across Africa in 2010”, PlOS One, 7/2, e31743, http://dx.doi.org/10.1371/journal.pone.0031743.
Littlewood, D. and D. Holt (2015), “Social entrepreneurship in South Africa: Exploring the influence of environment”, Business and Society, http://dx.doi.org/10.1177/0007650315613293.
Mano, Y. and A. Suzuki (2013), “Measuring agglomeration economies: The case of the Ethiopian cut flower industry”, Hitotsubashi University Discussion Papers, No 4/2013, Graduate School of Economics, http://hdl.handle.net/10086/25583.
McCartney, M. et al. (2010), Wetlands, Agriculture and Poverty Reduction, International Water Management Institute , Colombo, http://dx.doi.org/10.5337/2010.230.
McCormick, D. and B. Oyelaran-Oyeyinka (eds.) (2007), Industrial clusters and innovation systems in Africa: Institutions, markets and policy, United Nations University Press, Vol. 53, Tokyo, http://doi.org/10.1017/CBO9781107415324.004.
McKingsey Global Institute (2010), Lions on the Move: The Progress and Potential of African Economies, McKingsey and Company, www.mckinsey.com/global-themes/middle-east-and-africa/lions-on-the-move.
Ménascé, D. (forthcoming), Les évolutions du secteur informel, HEC.
Mohee, R. and T. Simelane (eds.) (2015), Future Directions of Municipal Solid Waste Management in Africa, Pretoria, South Africa.
MSO (2013), “Current status of municipal solid waste management practise in FCT Abuja”, Research Journal of Environmental and Earth Sciences, 5(6), Maxwell Scientific Organisation, pp. 295-304.
Mulupi, D. (2016), “Partnering with informal shops: Supermarket chain’s new growth strategy”, How We Made It in Africa, Maritz Africa, January, www.howwemadeitinafrica.com/partnering-with-informal-shops-supermarket-chains-new-growth-strategy (accessed in March 2016).
OECD (2013a), Settlement, Market and Food Security, West African Studies, OECD Publishing, Paris, http://dx.doi.org/10.1787/9789264187443-en.
OECD (2013b), Green Growth in Cities, OECD Green Growth Studies, OECD Publishing, Paris, http://dx.doi.org/10.1787/9789264195325-en.
Okot-Okomu, J. (2012), “Solid waste management in Africancities - East Africa”, in L. Marmolejo Rebellon (ed.), Waste Management - An Integrated Vision, InTech, http://dx.doi.org/10.5772/50241.
Pérez-Luque, A.J. et al. (2015), “p2distance: Well-being’s synthetic indicator, R Package Version 1.0.1”.
Popkin, B. (2001), “The nutrition transition and obesity in the developing world”, The Journal of Nutrition, Vol. 131/3, pp. 871S–873S, http://doi.org/10.1093/acprof:oso/9780199571512.003.0010.
Ramdoo, I. (2014), “Economic transformation in Mauritius: A heterodox journey”, ECDPM Great Insights, Vol. 3/5.
Reardon, T. et al. (2013), “The emerging ‘Quiet Revolution’ in African agrifood systems”, brief for Harnessing Innovation for African Agriculture and Food Systems: Meeting Challenges and Designing for the 21st Century, Addis Ababa.
Reardon, T. and C.P. Timmer (2014), “Five inter-linked transformations in the Asian agrifood economy: Food security implications”, Global Food Security, Vol 3/2, Elsevier, pp. 108–117, http://doi.org/10.1016/j.gfs.2014.02.001i.
Resnick, D. (2015), “The political economy of Africa’s emergent middle class: Retrospect and prospects”, Journal of International Development, 27/5, pp. 573–587, http://dx.doi.org/10.1002/jid.3110.
Rodrik, D. (2015), “Premature deindustrialization”, Economics Working paper, No. 107, School of Social Science, Institute for Advanced Study, Princeton.

7. HOW SUStAiNABlE CitiES CAN CONtriBUtE tO AFriCA’S DEVElOPMENt
232 African Economic Outlook © AfDB, OECD, UNDP 2016
Roy, R. (forthcoming), “The cost of air pollution in Africa”, OECD Development Centre Working Paper, Paris.
Roy R. (2014), “Environmental and related social costs of the tax treatment of company cars and commuting expenses”, OECD Environment Working Papers, No. 70, http://dx.doi.org/10.1787/5jxwrr5163zp-en.
Sanfilippo, M. and A. Seric (2014), “Spillovers from agglomerations and inward FDI: A multilevel analysis on SSA domestic firms”, Robert Schuman Centre for Advanced Studies Research Paper, No. RSCAS 2014/76, http://dx.doi.org/10.2139/ssrn.2461195.
SEI (2012), “Transport and environment in sub-Saharan Africa”, Stockholm Environment Institute Policy Brief, Stockholm, www.sei-international.org/mediamanager/documents/Publications/sei-pb-2013-africa-transport.pdf.
Seyoum, M., R. Wu and J. Lin (2014), “Foreign direct investment and trade openness in sub-Saharan economies: A panel data granger causality analysis”, South African Journal of Economics, 82/3, pp. 402–421, http://dx.doi.org/10.1111/saje.12022.
Siba, E. et al. (2012), “Enterprise agglomeration, output prices, and physical productivity: Firm-level evidence from Ethiopia”, UNU-WIDER Working Paper, No. 85/2012, http://ideas.repec.org/p/unu/wpaper/wp2012-85.html.
Storeygard, A. (2013), “Farther on down the road: Transport costs, trade and urban growth in sub-Saharan Africa”, Policy Research Working Paper, No. 6444, World Bank, Washington, DC, http://elibrary.worldbank.org/doi/pdf/10.1596/1813-9450-6444.
Swilling, S. (2015), Greening African Cities: Urbanization, Structural Transformation and Sustainable Resource Use, report commissioned by United Nations Economic Commission for Africa.
Timmer, M., G. de Vries and K. de Vries (2014), “Patterns of structural change in developing countries”, GGDC Research Memorandum, No. 149, www.ggdc.net/publications/memorandum/gd149.pdf.
Tregenna, F. (2008), “Sectoral engines of growth in South Africa: An analysis of services and manufacturing”, Research Paper, No. 2008/98, UNU-WIDER, Helsinki.
Tschirley, D. et al. (2015a), “The rise of a middle class in East and Southern Africa: Implications for food system transformation”, Journal of International Development, Vol. 27/5, SI, pp. 628–646, http://dx.doi.org/10.1002/jid.3107.
Tschirley D. et al. (2015b), “Africa’s unfolding diet transformation: Implications for agrifood system employment”, Journal of Agribusiness in Developing and Emerging Economies, Vol. 5/2, pp. 102 –136, http://dx.doi.org/10.1108/JADEE-01-2015-0003.
UN-Habitat (2008), State of African Cities: A Framework for Addressing Urban Challenges in Africa, Nairobi.
UN-Habitat (2006), Analytical Perspective of Pro-Poor Slum Upgrading Frameworks, Nairobi.
UNCTAD (2015), World Investment Report: Reforming International Investment Governance, United Nations Conference on Trade and Development, New York and Geneva.
UNCTAD (2014), “International trade in goods and services”, UNCTADstat (database), http:// unctadstat.unctad.org/ReportFolders/reportFolders.aspx?sCSreferer=&sCSChosenLan=en (accessed 1 February 2015).
UN DESA (2014), World Urbanization Prospects (database), United Nations Department of Economic and Social Affairs, http://esa.un.org/unpd/wup.
UNECA (2012), African Review on Waste Management (Executive Summary), United Nations Economic Commission for Africa, Addis Ababa, www.uncsd2012.org/content/documents/AfricanReviewReport-onWasteManagementSummary.pdf.
UNODC (2011), Practical Approaches to Urban Crime Prevention, proceedings of the workshop held at the 12th UN Congress on Crime Prevention and Criminal Justice, Salvador, Brazil, United Nations Office on Drugs and Crime, Montreal.
USAID (2010a), Mali: Water and Sanitation Profile, United States Agency for International Development, Washington, DC, www.washplus.org/sites/default/files/mali.pdf (accessed in March 2016).
USAID (2010b), Angola: Water and Sanitation Profile, United States Agency for International Development, Washington, DC, www.hip.fhi360.org/page/3332.html (accessed on 18 March 2016).
Wall, R. (forthcoming), Raw data from fDi Markets, Orbis and IHS-Erasmus University, in A.Badiane, J. Maseland, R. Wall and K. Rochell, State of African Cities 2017, UN-Habitat.
Wall, R. (2016), “State of foreign direct investment to African cities”, OECD Development Centre Background Papers for the African Economic Outlook 2016.

7. HOW SUStAiNABlE CitiES CAN CONtriBUtE tO AFriCA’S DEVElOPMENt7. HOW SUStAiNABlE CitiES CAN CONtriBUtE tO AFriCA’S DEVElOPMENt
233African Economic Outlook© AfDB, OECD, UNDP 2016232 African Economic Outlook © AfDB, OECD, UNDP 2016
Wall, R.S. and G.A. van der Knaap (2011), “Sectoral differentiation and network structure within contemporary worldwide corporate networks”, Economic Geography, 87-3, pp. 266-308.
Wall, R.S., M.J. Burger and G.A. van der Knaap (2011), “The geography of global corporate networks: The poor, the rich and the happy few countries”, Environment and Planning A, 43 (4), pp. 904-927.
WHO (2014), Ambient Air Pollution (database), World Health Organization.
World Bank (2015a), World Development Indicators (database).
World Bank (2015b), Competitive Cities for jobs and Growth: What, Who, and How, World Bank, Washington DC.
World Bank (2013), “Building sustainability in an urbanizing world: A partnership report”, Urban Development Series, Knowledge Papers, No. 17.
World Bank (2012), “What a waste: A global review of solid waste management”, Urban Development Series, Knowledge Paper, http://siteresources.worldbank.org/INTURBANDEVELOPMENT/Resources/336387-1334852610766/What_a_Waste2012_Final.pdf.
World Bank (2003), Tunisie: évaluation des programmes de réhabilitation urbaine, www-wds.worldbank.org/external/default/WDSContentServer/WDSP/IB/2006/03/16/000090341_20060316132747/Rendered/PDF/354890TUN0MNA11cess071710501PUBLIC1.pdf.
World Economic Forum (2015), Global Competitiveness Report 2014-2015, Geneva.
Zero Waste Europe (2014), “Zero waste?”, www.zerowasteeurope.eu/about/principles-zw-europe, (accessed in March 2016).
Zhu, T., Y. Aranda Larrey and V.J. Santos (2015), “What do multinational firms want from cities?”, World Bank Working Paper, Report No. 101716, World Bank, Washington, DC, http://documents.worldbank.org/curated/en/2015/12/25658516/multinational-firms-want-cities.


235African Economic Outlook© AfDB, OECD, UNDP 2016
While urbanisation does not in and of itself create structural
transformation, it is a fundamental megatrend that will continue
to profoundly transform African societies and economies in the
coming decades (Chapter 6). More can and must be made of this
megatrend for advancing the agenda of sustainable development on
the continent (Chapter 7). Although policy priorities and sequencing
will depend on each country’s specific context, new and ambitious
national urban strategies will need to tackle three broad challenges:
i) how to better manage the country’s economic and social spaces
in the context of rapid urbanisation; ii) what governance structures
should frame the design and implementation of those strategies;
and iii) how to finance the necessary investment.
Chapter 8
national urban strategies for sustainable cities in Africa

8. NAtiONAl UrBAN StrAtEGiES FOr SUStAiNABlE CitiES iN AFriCA
236 African Economic Outlook © AfDB, OECD, UNDP 2016
In brief
This chapter proposes elements of a new policy agenda for improving the contribution of sustainable cities to Africa’s structural transformation. It explains how urbanisation may be harnessed through deliberate policy and enabling services. Participative, multi-sectoral and place-based national urban strategies can catalyse citizen-led urban development to increase well-being in cities and in their catchment areas. While strategies will necessarily be context-specific, countries will likely have three overarching priorities: clarifying land rights; accelerating and improving the provision of infrastructure and services; and managing the growth of intermediary cities. Successfully implementing those new urban strategies requires effective multi-level governance systems, brought about by context-specific decentralisation, capacity building and increased transparency at all government levels. National and local governments also can draw from a wide range of financial instruments to support urban development. Mobilising all of those instruments will be necessary to bridge the financing gap and fulfil the potential of Africa’s urbanisation.
new strategies can promote sustainable cities for Africa’s structural transformation
How can African governments put in place or improve their national urban strategies successfully? The African Economic Outlook 2015 laid out seven main steps guiding the design and implementation of regional development strategies by governments and local stakeholders, of which urban strategies may be considered as a sub-set (AfDB/OECD/UNDP, 2015). The first section below considers the first two after a short introduction: step one: collect as much reliable data as possible with local stakeholders; and step two: identify integrated priorities that complement existing national development strategies. The second section identifies core policy priorities that apply to most African countries as a contribution to step three: define a strategy of multi-annual policies. The third section focuses on phasing in the multi-level governance system necessary for steps four to six: implement policies, monitor implementation and evaluate outcomes. The last section reviews options for mobilising financial resources (step seven) in support of national urban strategies.
While Africa’s sturdy urbanisation trends have produced a number of positive effects, in most countries urban policies have yet to promote structural transformation in a sustainable manner. As a result, “slum urbanism” is a reality for most of Africa’s city dwellers. It is characterised by low productivity and exposure to multiple risks and is void of conventional urban advantages (Pieterse, 2011). In many countries, this situation compounds existing societal inequalities along ethnic, economic and gender dividing lines. In turn, pressing social problems produce short-term and reactive policies which cannot solve the structural challenges nor seize the opportunities generated by urbanisation. African countries can break this vicious circle of inadequate urban policies and slum urbanism by adopting new, comprehensive, effective national urban strategies, with a view to making African cities sustainable (Box 8.1).
The New Urban Agenda to be agreed on at the Habitat III Conference in October 2016 can give impetus to that process. Shaped by the Sustainable Development Goals, COP21 and a series of preparatory meetings and documents (Table 6.5), Habitat III focuses the attention of decision makers on the imperative of forging the policies, governance and financial arrangements necessary to benefit more from urbanisation.
In the context of this New Urban Agenda, and in line with the basic principles defined in the African Economic Outlook 2015 for promoting regional development, Africa’s new

8. NAtiONAl UrBAN StrAtEGiES FOr SUStAiNABlE CitiES iN AFriCA8. NAtiONAl UrBAN StrAtEGiES FOr SUStAiNABlE CitiES iN AFriCA
237African Economic Outlook© AfDB, OECD, UNDP 2016236 African Economic Outlook © AfDB, OECD, UNDP 2016
urban strategies should be multisectoral, participatory and place-based. They should be designed and implemented as part of multisectoral development strategies, in order to address in a coherent and effective manner the complex urbanisation challenges documented in Chapters 6 and 7 of this report. They should be participatory so as to draw from the knowledge of the various actors involved and fit their needs. Finally they should be place-based, and especially consider the continuum of rural-urban linkages, to ensure that the urbanisation dividend is reaped by urban and rural dwellers alike.
Box 8.1. What is a sustainable city?
Definition. This report applies the Brundtland Commission (1987) definition of sustainable development as “meeting the needs of the present without compromising the ability of future generations to meet their own needs” at the city level. It goes beyond a strictly ecological definition and is similar to the World Bank (2013) definition of “urban communities committed to improving the well-being of their current and future residents, while integrating economic, environmental, and social considerations”.
Measurement. Several indices measure the sustainability of cities, such as UN-Habitat’s City Prosperity Index, The Economist Intelligence Unit’s Africa Green City Index, Arcadis’ Sustainable Cities Index, AT Karney’s Global Cities Index, or Mastercard’s Global Destination Index. However, most are limited by the lack of data at city level. New methods based on the concept of “urban metabolism” can offer a solution (Currie et al., 2015): Resource Flow Mapping uses geographic information systems to illustrate the distribution of urban and national resource flows and their volumes. Maps 8.1 and 8.2 present the example of flows of water in Cairo and Egypt at local and national scales. They show that 50% of the city’s water, entirely drawn from the Nile River, goes for refined uses and the other 50% for unrefined uses. Refined water is consumed mostly in residential areas, followed by commercial areas, industry, government agencies and other. Cairo treats only a small amount of wastewater: 17.8%. The untreated water is dumped in the Nile and the North Lakes, polluting the country’s main water sources.
Remit. This report considers the sustainability of cities at local as well as national levels. Cities “import” resources such as energy, water, air and food and often store their waste far away. Their resource consumption footprint therefore goes well beyond their immediate surroundings. Labour and capital mobility also imply that their development has a profound impact on the entire country. Finally, as the functional and built-up areas of a city often surpass its administrative boundaries, managing it calls for more encompassing governance systems that take into account its surrounding areas.
Progress in designing and implementing strategies is uneven across Africa
To date, 16 out of the 51 African countries reviewed by Yatta (2016) have adopted national urbanisation strategies, i.e. less a third of African countries. Of the 35 which have no explicit urban strategy, 7 have considered formulating one, while 28 have yet to. Table 8.1 reviews the strategies of those 16 countries, their priorities and extent of implementation: most of them focus on infrastructure, social service delivery, financing and land ownership. Urban poverty, spatial distribution and mobility are other recurrent issues. Six countries (Algeria, Benin, Burkina Faso, Ethiopia, Mali and Niger) aim to foster regional economic centres outside of the main urban agglomerations and provide basic services balancing rural and urban regions. Ghana, Morocco, Senegal and Swaziland are most advanced in formulating clear and pertinent urbanisation plans; the latter two have embedded their urban strategy in national development plans.

8. NAtiONAl UrBAN StrAtEGiES FOr SUStAiNABlE CitiES iN AFriCA
238 African Economic Outlook © AfDB, OECD, UNDP 2016
Table 8.1. Urbanisation strategies in 16 African countriesCountry Name of national strategy Time frame Strategies Comments
Algeria Stratégie de développement des villes
2000-25 -Balanced urban growth-Improved urban economy and environment
Linked to national spatial strategy
Benin Agenda spatial Permanent -Specific economic functions planned for different regions -Territorial development
Insufficient means to implement
Burkina Faso Programme de Développement des Villes Moyennes
Permanent -Balanced growth of big cities-Rural-urban linkages
Incomplete implementationInsufficient financing
Côte d’Ivoire Programme d’infrastructures urbaines d’urgence
2008-15 -Infrastructures International Development Association grant of USD 144 million for targeted interventions in five sectors: drinking water, urban sanitation, solid waste, urban roads and local authorities
Ethiopia Urban local government development project
2014-19 -Municipal services and infrastructure Connected to urban management strategy
Gabon Stratégie Nationale d’Habitat et de Développement Urbain
Permanent -Housing-Infrastructure-Institutional development
Insufficient resources
Ghana National Urban Policy 2012-30 -Balanced urban growth-Rural-urban linkages-Improved urban environment -Infrastructure -Affordable housing
Implemented with international agencies, weak links with national development
Malawi Malawi City Development Strategy and Slum Upgrading Programme
2010-20 -Urban management-Institutional development-Infrastructure
Insufficient resources andco-ordination among regional authorities
Mali Politique Nationale de la ville Permanent -Quality of livelihoods-Enhancing local economies -Infrastructures
Based on the strengthening of the role of intermediary cities and on the importance of rural-urban linkages
Morocco Stratégie Nationale de Développement Urbain
Permanent -Regional growth poles-Large-scale infrastructure-Promotion of middle-sized cities
Competitive cities, growth poles favouring social cohesion and efficient use of resources
Niger Stratégie Nationale de Développement Urbain
2010-30 -Stronger urban networks -Urban management -Land rights-Infrastructure and services
Insufficient resources
Rwanda Stratégie nationale de mise en place des infrastructures publiques et de renforcement des capacités des institutions administratives décentralisées
2000-20 -Infrastructure and capacity building Political commitment but insufficient resources
Senegal Programme d’Appui aux Communes
2006-10 -Capacity building-Legal tools-City contracts-Investment -Infrastructure
Implemented on a national scale through 450 city projects and supported by the Agence Française de Développement
South Africa Integrated Urban Development Framework
2014-present - Integrated package of spatial planning (transport, housing, infrastructure, land governance, local economic development, community empowerment and urban governance)
In its formulation process
Swaziland Local Government Project 2011-17 -Institutional support-Infrastructure
In line with national development
Uganda National Urban Policy 2013-30 -Urban management-Institutional development-Infrastructure
Insufficient resources
Source: Yatta (2016) and République de Côte d’Ivoire (2016).
Having an urban strategy is not enough. It needs to be integrated into the long-term national development strategy, decided on and implemented coherently with the participation of local actors, and supported by adequate financing. Some countries provide successful examples of meeting some of these challenges. Morocco in particular has devoted considerable human, financial and technical resources to implement its strategy: cities are considered engines for regional and national growth and part

8. NAtiONAl UrBAN StrAtEGiES FOr SUStAiNABlE CitiES iN AFriCA8. NAtiONAl UrBAN StrAtEGiES FOr SUStAiNABlE CitiES iN AFriCA
239African Economic Outlook© AfDB, OECD, UNDP 2016238 African Economic Outlook © AfDB, OECD, UNDP 2016
of a strategy to make the country more competitive. The government encouraged investments in skills and connective infrastructures in the two port cities (Tanger Med Project and Casablanca port), and fostered the development of new towns such as Chrafate or Tamensourt. Ethiopia has also undertaken important reforms towards political, fiscal and administrative decentralisation, laying emphasis on the process of capacitating cities (Box 8.2). Participatory exercises building alternative future scenarios help identify opportunities as Ethiopia urbanises. Developing special economic zones or clusters is one of several policy options envisioned to unlock the potential of the country’s secondary urban growth centres. The Ethiopian Cities Prosperity Initiative and its index developed by Ethiopia’s government and UN-Habitat help monitor progress.
Box 8.2. Ethiopia’s integrated approach to urban and socio-economic development
Two main policies underpin Ethiopia’s integrated approach. First, the Growth and Transformation Plan (GTP) has framed Ethiopia’s urban policies since 2010. The Ministry of Urban Development, Housing and Construction foresees three five-year episodes of large-scale industrial and structural development. Initiated at the national level, the GTP emphasises participatory governance involving citizens and private actors. Second, the “Ethiopian Cities Resilient, Green Growth and Governance Program Package” focuses on multiple development pillars, including job creation, urban planning and capacity building (Cheru, 2014).
In addition, substantial financial resources have been allocated. For instance, a loan of ETB 4.8 billion by micro finance institutions helped create some 3 million jobs between 2005 and 2011. A total of 583 877 micro and small enterprises were granted credit for various business activities.
In other countries, however, most existing urban development strategies simultaneously face several major challenges. They are not adequately co-ordinated with other key policy frameworks, such as infrastructure investment programmes. Also, consulting the various stakeholders of the urban system proves difficult, as closely intertwined formal and informal economies make it hard to even recognise all of them; finally, limited capacity and finance impede effective implementation: several of the 16 countries are deemed to have allocated insufficient resources to carry out their strategies.
Effective strategies start with reliable data and participation of civil society
Urban strategies are only as good as their evidence base
The data collection and analytical component of national urban strategies helps grasp a country’s demographic shifts and economic geography in its sub-regional and global contexts. It identifies the binding constraints (e.g. infrastructure, energy, skilled workers, information) holding back the specific potential of cities and regions. Policy makers can then better understand the contribution of specific places to job creation and economic output by sectors, and how different categories of the urban system relate to rural areas and other cities. Optimising the connections between sectors or regions ultimately enhances the aggregate productivity and performance of the national economy.
For example, Nairobi might be a crucial export node of freshly cut flowers for the European market, but it depends on growing regions well beyond the capital city, and on the connective infrastructure to quickly ship the flowers from the point of production to processing sites close to the airport. It is essential for policy makers to understand

8. NAtiONAl UrBAN StrAtEGiES FOr SUStAiNABlE CitiES iN AFriCA
240 African Economic Outlook © AfDB, OECD, UNDP 2016
how this value chain operates spatially and how effective cross-municipal border management can optimise the prospects of this sector for it to grow.
The resulting economic map should then be overlaid with demographic movement and mobility analyses, which are key to managing national logistics and planning investment for the provision of essential services to populations. To assess the relative strengths and weaknesses of a country’s functional urban areas, one may categorise them by number of inhabitants. A territorial (place-based) analysis – rather than traditional, national analysis by sectors – allows assessing multi-sectoral performance and exploring both the formal and informal dimensions of the local economy.
Such analysis requires drawing from the unique knowledge of local actors, including informal ones. While this is inevitably difficult, a number of successful examples exist. Some from Dakar, Monrovia and Morocco’s Villes sans bidonvilles programme, among others, are documented in Chapter 7 and others in Box 8.3. The coming 2020 census round provides an opportunity to gather complementary data on informal settlements by inserting a location identifier in the questionnaire (e.g. de jure population, housing conditions, economic activities, infrastructure and services).
Box 8.3. Data collection by citizens’ initiatives
Several initiatives involve citizens collecting social and environmental data used for proposing, driving and monitoring new education, housing, health and infrastructure projects. “Citizen-experts” working at village and neighbourhood scales can collect information quickly and with local insight. For instance, the Map Kibera (2016) project started in 2009 gave marginalised communities greater visibility, information and power to change their living conditions. Similarly, the Spatial Collective works at grassroots level doing demand-led community mapping that feeds geographic information systems, which can be turned into powerful visualisation devices.
New technologies such as geographic information systems (GIS) can enable cheaper, more accurate and faster data collection. The data can serve, for example, for spatial analysis of populations vulnerable to climate change or for detecting growth hotspots in a city (Table 8.2). In Kampala and Abidjan, mobile phone data analysis is providing new information on economic and mobility patterns, although not yet from fully representative samples.
Table 8.2. New technologies for urban governance and data collectionProject Stakeholders Development outcomes
Revenue collection information system (LGRCIS), 2014, Arusha, Tanzania
Governments of Denmark and Tanzania, World Bank
Using satellite data and GIS to identify and register taxpayers and satellite photographs to register houses. Increased tax revenues by 71% between 2014 and 2015.
City Dashboard, 2013, Fez, Morocco
City of Fez, AfDB, Microsoft Monitoring service performance and 70 quantitative and qualitative socio-economic, service-visibility, and quality-of-life indicators.
Know Your City Campaign Slum/Shack Dwellers International working with different African affiliates, e.g. the Ghana Federation for the Urban Poor
Collecting “slum data” through mapping, house-to-house surveys or settlement profiling. More than 600 settlement profiles created since 2009. Also serving policy negotiations with city authorities.
AfriLabs Pan-African network of technology hubs Serving some 40 tech hubs in 20 African countries and providing business start-up incubators, co-working spaces, innovation labs, and community-building and peer learning spaces.
Source: AEO experts’ surveys, 2016; AEO country notes, 2016; Cartwright, 2015; Swilling, 2015.

8. NAtiONAl UrBAN StrAtEGiES FOr SUStAiNABlE CitiES iN AFriCA8. NAtiONAl UrBAN StrAtEGiES FOr SUStAiNABlE CitiES iN AFriCA
241African Economic Outlook© AfDB, OECD, UNDP 2016240 African Economic Outlook © AfDB, OECD, UNDP 2016
Urban priorities must be integrated into long-term, national development strategies
National urban development strategies can succeed when a government identifies the priorities that contribute the most to the country’s long-term development strategy. Priorities must be few, to avoid scattering resources, and place-based so as to avoid the lack of co-ordination often induced by purely sectoral approaches (AfDB/OECD/UNDP, 2015). Alternative scenarios for a city’s future can help formulating the priorities more effectively, by developing foresight studies involving formal and informal stakeholders. The Ethiopian Urban Expansion Initiative is an example of how scenario building and data collection can help plan for the country’s expected rapid urbanisation (Box 8.4).
Box 8.4. The Ethiopia Urban Expansion Initiative
The Ethiopia Urban Expansion Initiative (UXI) assists rapidly growing cities in preparing for their spatial expansion. It was established in 2013 by New York University Stern Urbanization Project and Ethiopia’s Ministry of Urban Development, Housing, and Construction. The UXI relies on a planning mechanism that prioritises securing land for a 1 km2 grid of arterial roads and environmentally sensitive public open spaces. It emphasises leadership by local planners and is tailored to match the capacity of the officials responsible for implementation. It aims for a 30-year planning horizon, with the understanding that more detailed area plans can be developed as the city expands. The UXI has been incorporated into the national Growth and Transformation Plan II, which forecasts urbanisation in mid-sized cities as a key part of Ethiopia’s plan to become a middle-income country by 2025.
The UXI started by calculating future land area per person for four mid-sized, rapidly growing Ethiopian cities: Bahir Dar, Hawassa, Adama and Mekele. This was combined with population estimates to identify the amount of land for expansion that would be needed in 2040. These cities then created small urban expansion teams led by a local senior administrator tasked with developing and implementing the arterial grid plans. The cities initially worked with regional governments to expand their municipal boundaries and then started a programme of surveys to estimate the total cost of compensation for the land for the arterial road network – no more than 5% of the total land in the 2040 expansion area. This was followed by the submission of budget requests and a commitment of USD 8.9 million in 2014/15 and USD 24 million in 2015/16. The cities have begun formal surveys and compensation payments and are constructing roads on the immediate periphery. The four cities have paid compensation for many hundreds of kilometres of roads and have constructed 41.5 km.
In Hawassa, surveying and compensation of the entire network is nearly complete, and 16 km of 30-metre wide arterial roads have been constructed on the urban periphery (see Map 8.3). Municipal revenue from plot leasing in Hawassa has increased 2.2-fold since the start of the programme, and spending on roads has increased 6-fold. In Bahir Dar and Mekele, 4 647 additional residential plots have been made available for leasing, comprising an area of 77.6 hectares.
Priorities include land reform, infrastructure and urban networks
While urban development strategies must be highly context-specific, this report suggests that new urban strategies in most countries are likely to include three generic priorities that cut across the sectoral priorities identified in Chapter 7:
1) clarifying land rights and their enforcement
2) delivering better infrastructure and services
3) improving the pivotal function of intermediary cities between rural areas and primary cities.

8. NAtiONAl UrBAN StrAtEGiES FOr SUStAiNABlE CitiES iN AFriCA
242 African Economic Outlook © AfDB, OECD, UNDP 2016
Urban land reform lies at the heart of new national urban strategies
Urban land is the primary building block of cities, and land policy lies at the heart of Africa’s sustainable urban transition and structural transformation. Who owns land and how it is managed will determine the density of a city, the street layout, the zoning scheme, building codes and tax regimes. Land-use management systems, formal and informal, shape the dynamics of economic agglomerations, natural resource use, social inclusion and political representation.
Land-use management systems often hinder sustainable urbanisation
African land-use management systems are not fit for increasing sustainable urban development and absorbing the rapid population expansion of the next decades. Current systems are not only complex, they are typically not well understood and are rarely effectively recorded or formally codified. They typically draw from an eclectic, often contradictory mix of old colonial planning norms; privatised settlement and company towns; the ancient practices of royal, communal or tribal land; or ad hoc and unregulated regimes that have emerged around informal settlements.
As a result, land regulation is often chaotic, hindering Africa’s economic growth, creating environmental risks and entrenching social inequality. “In cities and rural areas, insecure tenure and informal settlements combine with other factors […] to reduce public revenues, infrastructure investment, employment and economic growth” (UN-Habitat, 2008: 5). In addition, elites controlling the land are difficult to identify, incentivise or control; yet their support is essential for improving how cities are run.
In the case of cities, the current mismatch between land and fiscal systems prevents governments, especially local governments, from undertaking the large-scale investments needed to shift urban development trajectories. The lack of transparency over urban land markets impedes effective and sustainable personal and corporate investment, creates opportunities for political power bases to flourish outside of democratic structures, and makes land-based climate mitigation and adaptation measures difficult to enforce. In most countries, urban land reform should thus be a priority in the context of national urban strategies.
Impetus for urban land reforms is growing across the continent
Africa is land rich and, until recently, the absence of large, complex urban settlements and a disregard for the role of towns in the wider economy may have distracted from the urgency of urban land reforms. Rapid urban growth, the rise of land-based corruption and the consolidation of unsustainable urban land management practices are now raising awareness of those issues.
The nature and modalities of such reforms should, again, be context specific: there is no single way to achieve sustainable authority over urban land. However, more secure land rights should be a key objective, as they are a prerequisite for long-term urban investment anywhere. Furthermore, systems of urban land regulation are most effective for preserving the environment and less prone to aggravate inequalities (e.g. against women) when they are appropriate, legible, predictable and free of corruption. They should also be complemented by formal affordable housing, property taxes and land construction in order to harness the land value (see the last section of this chapter). The scope of land reform extends beyond urban administrative boundaries to rural-urban periphery, so as to mitigate potential conflicts on land use change.

8. NAtiONAl UrBAN StrAtEGiES FOr SUStAiNABlE CitiES iN AFriCA8. NAtiONAl UrBAN StrAtEGiES FOr SUStAiNABlE CitiES iN AFriCA
243African Economic Outlook© AfDB, OECD, UNDP 2016242 African Economic Outlook © AfDB, OECD, UNDP 2016
Land being much more than an economic asset, urban land reform implies much more than a narrow technical, legal exercise. Urban land shapes the African identity, because urban land regulation, finance, economy, inheritance law, culture, design and construction materials are inextricable parts of the urban fabric. Recent experiences demonstrate that reforms can be successful when based on pragmatic approaches adapted to local contexts. Chad is currently revising its land ownership and customary law, which dates back to 1967, so as to formalise customary practices. Public consultations helped identify areas needing clarification, such as the legal processes of expropriation or land title registrations. Ethiopia led a land reform in 2003 aiming at better establishing land titles. It introduced a system of certification mainly relying on a locally elected Land Administration Committee in order to register customary titles at low cost. In three years, some 20 million land titles have been granted through a decentralised and participatory approach (OECD, 2016).
In Malawi, over 90% of land is governed by a customary regime, and even if customary law guarantees usufruct rights, they are unregistered and not recognised under statutory law, hindering access to land and agricultural development. In 2004, the government instituted the Community-Based Rural Land Development Project, based on voluntary acquisition, farm development and registration of redistributed land. Selected family beneficiaries received a grant of USD 1 050 of which up to 30% was for land acquisition, and the rest for farm development and shelter. The project lasted until 2011 and cost about USD 27.3 million, partly funded by the World Bank, the government and private donations.
Delivering better infrastructure and services is the primary catalyst for sustainable urban development
Investment in infrastructure shapes the nature of urbanisation and the location and productivity of households, informal business and established firms of all sizes. Affordable energy, sanitation, solid waste, transport and health care services provide the means by which urban citizens become more productive. Where infrastructure is insufficient, expensive and poorly maintained, it underpins the high cost of urban services and reduces the potential of reaping an urbanisation dividend (Chapter 6).
This situation remains widespread. Although data is limited, an estimated 62% of urban people in sub-Saharan Africa live without at least one of the ingredients of formal urbanism: water, sanitation, housing and sufficient space under secure tenure. On average, while urban dwellers have greater access to services than their rural counterparts, the backlog remains acute and the cost of services roughly double that in developing countries on other continents. Sixty percent of urban dwellers did not have access to “improved sanitation” in 2015, 28% of urban dwellers had no access to electricity (down just 2.6% since 2011). Many urban dwellers with grid-access experienced daily outages, and half the children under five had never visited a health care practitioner.
How can countries better manage urban infrastructure and service delivery so as to move on from the prevalent “slum urbanism”? Our central argument is that improving the provision of all urban services requires: i) tailoring infrastructure and service systems around the needs of residents; ii) ensuring that prices are affordable to them; and iii) circumventing slow and costly central co-ordination. In particular, in order to bring down costs and enhance efficiency, experience points to: i) planning for an integrated delivery of soft and hard infrastructure; ii) engaging positively with informal settlements; and iii) making full use of innovative technologies.

8. NAtiONAl UrBAN StrAtEGiES FOr SUStAiNABlE CitiES iN AFriCA
244 African Economic Outlook © AfDB, OECD, UNDP 2016
Hard and soft infrastructures should come together
The strategic agenda of National Infrastructure Investment Strategies (NITS) is to address the needs for physical infrastructure together with the provision of services and the crafting of adequate institutional frameworks. In particular, NITS recognise the importance of soft infrastructure, including governance institutions, legislation, public engagement capacity and fiscal accounting mechanisms, for the efficacy of hard infrastructure (UCLG, 2014). NITS are multi-sectoral and sequenced with other urban policies. They specify, locate and address the financing of the infrastructure to deliver the wide range of services listed below. The groups of African countries referred to – diversifier, early urbaniser, late urbaniser, agrarian and natural resources-based – are classified according to their stages in urbanisation, fertility transition and structural transformation (see Chapter 6).
• Economic infrastructure and services such as energy, transport, information and communication technology, and land-use management are critical in all country groups, though particularly in the diversifier and early urbaniser countries to increase productivity and competitiveness.
• Social infrastructure and services, including education, health, housing, and care for the elderly and children, leverage the innate human capital that aggregates in cities.
• Basic infrastructure and services such as water and sanitation, waste collection and management, transport, and energy are necessary everywhere, but most critical in late urbanisers, agrarian and natural resources-based countries. They increase productivity and remove negative externalities such as indoor air pollution, water contamination and congestion that coalesce in cities to constitute poverty traps.
• Quality-of-life services – public safety, urban planning, culture and entertainment, sport, and accessible public spaces – provide the basis for inclusive cities and new urban identities. The lack of attention to ecological capital from much of Africa’s existing built environment results in costly engineered infrastructure, the destruction of social safety nets provided by ecosystems and the inefficient functioning of the built infrastructure stock as dams silt up, flood buffering capacity of wetlands is destroyed and places of cultural and recreational value are lost (Chapter 6). Quality-of-life services also offer opportunities for labour absorption and place making, particularly where low educational attainment precludes a portion of the urban population from accessing skilled jobs (Chapter 7).
Engaging urban communities is key to improving infrastructure and service delivery
In the context of ”slum urbanism”, urban infrastructure development requires understanding how the urban poor and rural migrants have begun to access services where the state did not cater for them (Angelakis and Rose, 2014; Jaglin, 2014). Many urban Africans have to invent their own service delivery systems outside of formal governance. These institutions are not necessarily egalitarian or efficient and they do not necessarily optimise productivity. They are, however, an entrenched fact of life in how cities are organised and run. At their best these organisations reflect an organic strength in urban systems that could be harnessed. And yet traditional infrastructure plans are not well equipped to support “informal” service provision efforts; in many cases, instead, these organisations are criminalised and victimised.
A more positive approach to engaging informal settlers may be considered to meet Africa’s urban challenge, for at least two reasons. Firstly, Africa’s limited fiscal resources offer little choice but to prioritise service delivery models that are rooted in local communities, draw on local resources, and are labour intensive, highly transactional and

8. NAtiONAl UrBAN StrAtEGiES FOr SUStAiNABlE CitiES iN AFriCA8. NAtiONAl UrBAN StrAtEGiES FOr SUStAiNABlE CitiES iN AFriCA
245African Economic Outlook© AfDB, OECD, UNDP 2016244 African Economic Outlook © AfDB, OECD, UNDP 2016
able to deepen both social and financial capital at the neighbourhood scale. Universal access to services will require, at least partly, legitimising and incorporating these contingency forms of service delivery with formal state-supplied services.
Secondly, the participatory delivery of infrastructure can generate a sense of place, where the location and construction of infrastructure engages local needs and ideas, and where the people who benefit from services are charged with infrastructure monitoring and maintenance. Ecological infrastructure and ecosystem goods and services are well suited to this purpose (wetland maintenance, greening of public spaces and coastal zone rehabilitation), but there is equal potential to engage the urban labour force in waste management, aspects of infrastructure maintenance, energy monitoring, non-motorised transport systems at community level, and community policing (Chapter 7). The forging of new urban identities through public work schemes and place making, is considered particularly valuable in the context of Africa’s circular migratory patterns. Numerous successful examples exist of urban infrastructure strategies engaging non-government actors in policy and service endeavours deliberately (Box 8.5).
Box 8.5. A participatory approach to transforming settlements of the poor in Uganda’s intermediate cities
The Transforming the Settlements of the Urban Poor (TSUPU) programme was launched in 2010 as a partnership initiative of the Government of Uganda and support partners (Shack/Slum Dwellers International, co-ordinated by Cities Alliance). It aligns urban development efforts at the national, local government and community levels in five intermediate cities: Mbale, Mbarara, Jinja, Arua and Kabale. The programme aims to increase the capacity of actors at each level to manage urban growth, improve access to services, and formulate and implement inclusive urban development policies. It privileges community participation.
The programme organised slum communities by mobilising women-led savings groups and federating these at the settlement, city and national levels. These groups were supported to profile and map all slums in each city producing data for planning. The programme institutionalised spaces for dialogue between communities, academia, business and local government where urban stakeholders reflect on the rich, community-gathered data. The TSUPU project then established Community Upgrading Funds in each municipality so small projects in informal settlements could implement local partners’ resolutions.
Community groups have completed close to 100 upgrading projects in each of the 5 secondary cities in partnership with local authorities. These small projects have catalysed efforts in the cities to undertake settlement-wide upgrading and secure the tenure of thousands of informal settlers. The efforts of informal settlers’ groups to convene forums have resulted in allocations of municipal office space for community data centres in 10 urban councils. Since the first phase of the programme officially ended in 2013, the slum dweller movement (National Slum Dwellers Federation of Uganda, NSDFU), local and national government partners have expanded TSUPU to an additional 14 municipalities and Kampala’s five divisions.
New technology can reduce the costs of infrastructure and service delivery
Sustainable urban development could tap new service delivery opportunities created by the use of new technologies in the water, sanitation and energy sectors more efficiently. Providing enough electricity to only 70% of the 635 million Africans who do not have grid access would require an estimated USD 205 billion in capital investment for the next two decades in urban and rural areas (Chapter 7). This gap can be bridged, but it is huge considering the weak fiscal resources of cities. Yet, the 300 million urban Africans without access to electricity spend up to 50 times more per kilowatt hour (as much as

8. NAtiONAl UrBAN StrAtEGiES FOr SUStAiNABlE CitiES iN AFriCA
246 African Economic Outlook © AfDB, OECD, UNDP 2016
USD 10/kWh) on charcoal, candles, batteries and kerosene; most urban companies rely on expensive diesel powered generators as back-up (APP, 2015). Africa’s grid reticulated electricity is twice as expensive as Latin America’s and three times Asia’s. It is often unreliable: 19 sub-Saharan African countries experienced at least 10 electricity outages per month between 2005-08, which cost firms an average of USD 307 per hour (Dinh et al., 2012; Lighting Africa, 2010).
Channelling this money into more efficient energy solutions would create new business opportunities and improve energy security (see Chapter 7). However, their institutional, technical and financial fit with the needs of urban energy users has driven their uptake so far, rather than policies. Results from our AEO survey show that less than 20% of African countries have implemented strategies on sustainable energy use (Figure 8.1). To be relevant, infrastructure plans must resonate with commitments made under the Paris Agreement in the form of Intended Nationally Determined Contributions.
Figure 8.1. Prevalence of strategies on sustainable energy use in Africa, 2015
0 10 20 30 40 50 60 70 80 90 100
Adopted and implemented effectively Adopted but not implemented effectively
Planned for the near future Not planned
Setting environmental regulations for urban industries
Increasing urban households' and firms' energy efficiency
Integrating renewable energy into the national grid
% of respondentsNote: Survey answered by country economists of the AfDB and UNDP in 45 country offices in Africa. Response is weighted to one answer per country.Source: AEO experts’ survey, 2016.12 http://dx.doi.org/10.1787/888933350927
Planning the growth of intermediary cities contributes to national development
National urban strategies are not only about articulating a metropolitan agenda. They are holistic approaches to linking cities and towns of different sizes and with different, evolving functions.
Intermediary cities are essential to reaping the urbanisation dividend but need special attention
Dealing with the conundrum of Africa’s towns and planning for the growth of intermediary cities are essential elements of any national urban strategy. As shown in Chapter 6, two-thirds of the growth in the urban population by 2030 is expected to take place in cities of less than 500 000 inhabitants. Intermediary cities and towns will thus play an increasing role in sustaining the benefits of urbanisation in terms of poverty alleviation and in fostering structural transformation at two main levels:

8. NAtiONAl UrBAN StrAtEGiES FOr SUStAiNABlE CitiES iN AFriCA8. NAtiONAl UrBAN StrAtEGiES FOr SUStAiNABlE CitiES iN AFriCA
247African Economic Outlook© AfDB, OECD, UNDP 2016246 African Economic Outlook © AfDB, OECD, UNDP 2016
1) Intermediary cities and towns help alleviate the congestion of megacities by capturing a share of demographic growth and rural migration (AfDB/OECD/UNDP, 2015). They can enhance the country’s overall governance capacity by better mobilising the available capacity in provincial and national governments. Intermediary cities and towns will assume a more active role as economic and social service hubs.
2) They spread the benefits of urbanisation nation-wide and across borders by enhancing productivity and promoting development in surrounding rural areas (as described in Chapter 7). Connections between smaller and intermediary cities and the rural hinterland within the national and transnational economy are therefore critical. Intermediary cities can leverage economies of scale to deliver public services to surrounding areas and develop labour-intensive industries such as textiles and agro-processing or services like tourism, especially those services that do not require high knowledge spill-overs.
But whether those capacities and connections are there to ensure that growing intermediary cities and towns effectively play those roles will crucially depend on new investment and the quality of public policies, by national as well as local governments. Indeed, most towns and intermediary cities suffer from rapid expansion, high poverty, little investment and scant formal employment opportunities. Even in a diversifier country such as South Africa, most intermediate cities have a narrow single-sector economic base that depends largely on old technologies vulnerable to external market shocks. Unless their potential is actively developed, intermediary cities and towns run the risk of a relatively rapid economic decline, expanding further the patterns of “slum urbanism”.
Tapping the specific assets of intermediary cities requires differentiated policies
In line with the new paradigm of regional policy making, mainstreaming the promotion of intermediary cities into national urban strategies should aim to tap their specific assets and unexploited potential rather than compensate them for their disadvantages, whether induced by size or location (see Chapter 8 in AfDB/OECD/UNDP, 2015). This requires the following:
• Base the allocation of resources on a thorough understanding of how the optimal organisation of urban services in intermediary cities – e.g. markets, clinics, schools, taxi ranks, post offices, and police and petrol stations – might complement subsistence agriculture and serve the needs of residents.
• Improve connections both between urban cores and their immediate hinterland and between intermediary cities and the regional and global economy, which can also reduce peri-urban slums currently existing in most African cities.
• Focus on the development of functional urban areas rather than administrative perimeters, including functional, transnational urban corridors. The West African seaboard, along the coast of the Gulf of Guinea, which incorporates big cities as well as smaller coastal hubs, is a pressing example of the imperative for cross-national collaboration on such corridors, not least to ensure that the collective response to urban risks takes account of towns’ realities within larger regional plans.
• Differentiate the planning, finance and institutional support between towns and intermediary cities in a way that allows them to assume a distinct function in the national urban network by tapping their specific locational or sectoral advantages. This can be done through new infrastructure investment or the relocation of a major public service providing long-term job opportunities; for instance, it might

8. NAtiONAl UrBAN StrAtEGiES FOr SUStAiNABlE CitiES iN AFriCA
248 African Economic Outlook © AfDB, OECD, UNDP 2016
make more economic sense to locate certain administrative services in cities rather than in towns where less of the population would benefit from them. Categorising intermediary cities for targeted support needs to be flexible and multi-layered and allow them to move up or down the hierarchy over time. The experience of South Africa shows that too narrow a focus on the size criterion over functional characteristics can lead to pressure from local leaders to reclassify intermediary cities as metropolitan regions without due consideration for changes in their actual economic potential. The categorisation process may thus: i) include other aspects such as local governance performance and international competitiveness; and ii) ensure through adequate incentives that becoming a metropolitan municipality is not the only development pathway for intermediate cities. Table 8.3 illustrates possible urban functions of intermediary cities within the national urban network.
Table 8.3. Different urban functions of intermediary citiesUrban function Description
Regional market The city is the main area for production and exchange of goods and services in the local and regional economy.
Service centre The city offers public and private services to the intermediate community and surrounding population.
Regional capital The city hosts regional or national political and administrative institutions.
Tourist centre The city promotes activities linked to domestic or international tourism.
Communication hub The city acts as a platform for movement of people, goods and information.
Economic location The city holds a strategic role in the national, regional and global economy thanks to its geographic location and development strategy (e.g. duty-free zone).
Source: Adapted from Song (2013).
Several African countries are promoting intermediary cities
Although they are still a minority, several African countries are already explicitly targeting the promotion of intermediary cities as a vehicle for a more sustainable urbanisation:
• Ethiopia has identified intermediary cities as key actors of its national economic plan: 16 urban centres of less than 500 000 inhabitants now receive targeted support to develop manufacturing and tourism while Diré Dawa has a special administration status.
• Madagascar has adopted a multi-sectoral strategy for urban growth poles, investing in roads and water supply, as well as in vocational training, higher education, service delivery and capacity building. This has created 13 000 new formal jobs, mainly in the cities of Nosy Be and Tolanaro (Speakman and Koivisto, 2013: 97).
• Morocco has invested in intermediary cities like Tangier and Meknès by developing tourism and the industrial sector. The government’s new regional plan (découpage territorial) extends decentralisation and greater means for regional development to cities within Casablanca’s periphery, such as Sidi Slimane and Beni Mellal.
• Rwanda is investing in intermediary cities as a response to rapid population growth. The plan focuses on the economic development and improved access to public services in Huye, Muhanga, Musanze, Nyagatare, Rubavu and Rusizi. Four provincial industrial zones which specialise in agro-processing and low-skill manufacturing (Bugesera, Huye, Nyabihu and Rusizi) aim to strengthen rural-urban economic linkages and increase economic opportunities in rural areas.
• South Africa has been aiming to streamline the role of intermediary cities by implementing a differentiated approach to municipal financing, planning and support for these cities.

8. NAtiONAl UrBAN StrAtEGiES FOr SUStAiNABlE CitiES iN AFriCA8. NAtiONAl UrBAN StrAtEGiES FOr SUStAiNABlE CitiES iN AFriCA
249African Economic Outlook© AfDB, OECD, UNDP 2016248 African Economic Outlook © AfDB, OECD, UNDP 2016
multi-level governance can promote urban development strategies
To effectively implement national urban strategies depends on three major actions in the area of governance: i) empowering local levels of policy making; ii) attracting and growing the necessary capacity for local governments to function; and iii) enhancing transparency at all levels of government. A cross-cutting challenge to multi-level governance and service delivery is to stitch together the initiatives of local communities, often developed in the absence of formal state involvement, with the financing and roll-out of formal services.
African urban policy makers at different levels of government need empowering
Central governments are neither equipped, nor well-placed to design and implement national urban strategies on their own. Urban policies, unlike the wider regional development policies, require “a more sophisticated participatory multi-level government approach, involving national, regional and local governments plus other stakeholders, with the central government playing a convener role” (AfDB/OECD/UNDP, 2015). While the notion is widely accepted at pan-African level, effective implementation has been slow and difficult as would be expected in policy areas where political stakes are high. A number of key principles, however, can guide reforms towards effective multi-level governance.
Countries recognise the need to empower local governments but have yet to promote effective decentralisation
African countries largely agree on the need for pursuing more comprehensive decentralisation to achieve the vision spelled out in Agenda 2063. In June 2014, the African Union (AU) adopted the African Charter on Values and Principles of Decentralisation, Local Governance and Local Development (AU, 2014). This has brought the pan-African policy environment in line with global norms.1 At the same AU conference, heads of state and government approved the creation of the High Council of Local Governments as an AU institution. Its purpose is to reflect the voice of local governments in the deliberations of the African Union. The African Charter and the High Council provide a new impetus for decentralisation and a strong basis for driving reform across the continent. At the time of writing, however, only Chad, Republic of the Congo (Congo), Guinea Bissau, Mauritania and Mali have signed the Charter, and Mali is the only country to have ratified it (Elong-Mbassi, 2016). Furthermore, in many countries the lack of progress in fiscal decentralisation has greatly hampered progress in administrative and political decentralisation (AfDB/OECD/UNDP, 2015).
Delayed multi-level governance stands in the way of crucial infrastructural investment decisions based on thorough spatial analysis. As shown in the African Economic Outlook 2015, much existing infrastructure and development planning has been done while ignoring the spatial dimension, i.e. their systemic economic, social and environmental implications at local level and in the wider regional context. This often produces suboptimal investment decisions, made without understanding how the advantages brought about by urbanisation can best be seized to meet the goals of structural transformation, social inclusion and greater environmental sustainability. As a result, dysfunctional urban development further prevails.
Although local governments and stakeholders detain unique knowledge on such systemic implications, without decision-making powers they are deprived of the capacity to carry out more effective projects at the city level. Weak decentralisation often means that local projects depend excessively on decisions from the central

8. NAtiONAl UrBAN StrAtEGiES FOr SUStAiNABlE CitiES iN AFriCA
250 African Economic Outlook © AfDB, OECD, UNDP 2016
government, and this can discourage local initiatives. Where central states concentrate the responsibilities of defining and achieving national sustainable development policies, decisions are likely to remain ill-suited to solving African cities’ economic, social and environmental challenges. These challenges – while global in nature – are deeply anchored and intertwined in local contexts. Sustainable policies can therefore only be effective in the long run if aligned with local needs and owned by local people (Pinel, 2013).
The pace and extent of multi-level governance reforms depend on local contexts
The main reasons for the mismatch between discourse and implementation in the multi-level governance reform agenda are to be found in the specific context of each country’s specific political environment, including social hierarchies, status of land ownership (see above) or the vested interests of key decision makers. Every country and subnational area can therefore only put international commitments into action gradually through trial and error, as part of their own, individual process of political reforms. Conflict, competition and risks of embezzlement will arise during the reallocation of authority, power and resources. Effective multi-level governance reforms thus require committed political leadership in order for negotiations to produce practical decisions about the form, pace and focus of decentralisation. Examples from Africa across the five groups classified according to their levels of urbanisation and fertility rates (see Chapter 6) illustrate the importance of history, the socio-political context and the design of reform processes for successful implementation.
Angola (natural resources-based): Since Angola’s civil war almost wiped out capacity at communal and municipal levels, the central government has been managing Luanda directly, securing the flow of foreign direct investment into infrastructure and real estate. When Luanda annexed the two adjacent municipalities Icolo e Bengo and Quiçama, and part of Cacuaco in 2011, an “administrative committee” was directly appointed to govern the new city and is therefore not a reflection of direct citizen control or democratic election. This may explain why investments purveying to the needs of elites have been financed, while issues of large-scale urban poverty, ill-health and lack of basic services continued to prevail (Lawanson, 2015).
Ethiopia (late urbaniser): The country’s governance structure has three main tiers: federal, regional and local. The 1995 constitution recognises and assigns powers, functions and revenues between the federal government and the nine regional states and partly treats two cities – Addis Ababa and Dire Dawa – like state-level governments. The regions establish local governments according to their own constitutions. The most prevalent structures – woredas in rural areas and urban local governments – provide education, health, justice, security and “municipal” services (roads, drainage, etc.). However, most local governments are unable to cope with rapid economic and demographic growth due to lack of authority, fiscal resources and skilled personnel. While local governments can collect revenue to cover the costs of basic services, user charges are insufficient. While bigger cities depend on unsustainable land-lease revenues, many of the others lack control over the terms or rate of the lease. Intergovernmental transfers barely cover recurrent expenditure, let alone capital requirements (World Bank, 2015a).
Nigeria (natural resources-based): The government comprises three distinct administrative levels: national, state and local. The 1999, post-military rule constitution lodged responsibility for basic services with both state and local governments without a clear delineation of their respective roles. State governments have their own revenue sources and receive intergovernmental transfers, while local governments are merely administrative extensions of the state. Thus in a megacity state such as Lagos, the state government is clearly the dominant actor, creating a large democratic distance between local communities and institutions making decisions about regional infrastructure and service delivery (Lawanson, 2015).

8. NAtiONAl UrBAN StrAtEGiES FOr SUStAiNABlE CitiES iN AFriCA8. NAtiONAl UrBAN StrAtEGiES FOr SUStAiNABlE CitiES iN AFriCA
251African Economic Outlook© AfDB, OECD, UNDP 2016250 African Economic Outlook © AfDB, OECD, UNDP 2016
Senegal (early urbaniser): In 2013, the parliament passed a law increasing decentralisation and reforming the Code des Collectivités locales (Local Government Code). It did not grant local authorities the power to collect taxes but clarified which tax revenues local councils are entitled to. It granted greater fiscal autonomy to local authorities and gave taxpayers the right to ask about local fiscal decisions (République du Sénégal, 2013).
South Africa (diversifier): The South African 1996 constitution provides one of the most empowering approaches to democratic decentralisation. Instead of delineating responsibilities between the three government levels, it extends the notion of autonomous “spheres” to local government, charging it with an explicit developmental mandate. A schedule of functions is set out in the constitution for each sphere. Many functions are concurrent between the three spheres of government, but even in those cases, local government may still come to a different decision to other spheres of government. This autonomy is underpinned by significant powers to raise local revenues. In fact, provincial governments rely more on transfers from national government. Two years after the constitution was adopted, a White Paper on Local Government was published which sets the basis for rolling legal reform to entrench the constitutional vision.
Key principles can help advance effective multi-level governance
National urban and regional development strategies must have explicit multi-level governance arrangements to enable more sustainable and inclusive patterns of urbanisation. An underlying dilemma is that African countries with a weak national government capacity tend to have even weaker local government institutions. Efforts to improve their urban planning capacity are essential in the medium term (see next section), but an immediate challenge is to identify the multi-level governance architecture that builds on the local context. Since no blueprint can be applied across all African countries, a number of guiding principles may help define adequate multi-level governance systems in a pragmatic way.
First, the basis for decentralisation is recognising that local actors are best placed to calibrate housing and public transport investment with land-use management regulations. Infrastructure is inherently spatial, and certain public functions shape the built environment more than others. For example, energy, transport, housing and land-use management are essential to foster denser, mixed-use and inclusive urban forms. Combining them in strategic locations within a spatially coherent framework can improve economic opportunities and influence urban form but is not easily co-ordinated at the national scale. The information asymmetries that prevail between national and local actors are part of the rationale for promoting the active participation of local stakeholders (AfDB/OECD/UNDP, 2015: xxvi). It is impossible for national or provincial authorities, acting without local stakeholders, to understand enough the nuances and complexity of local areas. It falls to local actors to ensure that strategic investment decisions, inputs and the complex array of interests are mutually reinforcing.
Second, certain functions that address the overall efficiency of the territorial system are best co-ordinated and financed at national and regional scales. This includes managing water basins and addressing inter-regional logistics imperatives (long distance roads, freight, airports, ports) and the cross border migration of the labour force. Dedicated structures such as metropolitan authorities can enable the governments of cities, surrounding communes and peri-urban areas to work together across functional areas for better metropolitan transport or water governance. However, such functions must speak to the local management of the built environment, which highlights the importance of legislated co-ordination forums. South Africa’s Inter-governmental Relations Framework Act (IGR Act no. 13 of 2005) provides one such example. The Act provides for regular and systemic policy discussions between different levels of government on all matters of intergovernmental concern. It outlines mechanisms for

8. NAtiONAl UrBAN StrAtEGiES FOr SUStAiNABlE CitiES iN AFriCA
252 African Economic Outlook © AfDB, OECD, UNDP 2016
settling intergovernmental disputes and for collaboration on strategic initiatives that span domestic boundaries. In each province of South Africa, the involved government actors can determine the scope and focus of the inter-governmental forum. This creates a mechanism for context-specific dialogue, co-ordination and joint effort without losing the national perspective. The president also convenes his own national, provincial and metropolitan political forum.
Third, any effective intergovernmental system must be designed to allow local empowerment of the majority of urban dwellers who are effectively building their own communities, towns and cities in the absence of effective state provision (see previous section). Over time, urban management has to evolve to stitch together the “top-down” policy agenda of the state and the “bottom-up” efforts of the citizens. There is wide scope to improve the efficacy and impact of both of these. This will undoubtedly find expression over time in the emergence of various types of partnerships.
Box 8.6. Small steps to guide multi-level governance reform
For post-conflict and fragile states, “muddling through” may be a strategy for implementing certain governance reforms. The approach focuses on building institutions through a series of small, incremental steps, especially when these involve positive deviations from extant realities. Andrews, Prichett and Woolcock (2012) propose a Problem-Driven Iterative Adaptation (PDIA), based on four core principles:
1) PDIA focuses on solving locally nominated and defined problems in performance.
2) It seeks to create an authorising environment for decision-making that encourages experimentation, as opposed to requiring agents to implement projects exactly as pre-designed.
3) It embeds this experimentation in short-time feedback that facilitates rapid experimental learning, as opposed to enduring long lag times in learning from ex post “evaluation”.
4) It actively engages broad sets of agents to ensure that reforms are applicable, legitimate and relevant, as opposed to a narrow set of external experts promoting the top-down diffusion of innovation.
China’s “crossing the river by feeling the stones” approach to reforms illustrates these principles.
Building public-sector capacity is a pillar of national urban strategies
Effective multi-level governance requires new sets of skills, managerial approaches and institutional culture across all levels and dimensions of the public sector that implement or contribute to urban policies. In many African countries, inadequate local capacity is compounded by the lack of incentives for qualified professionals to embrace a career in local government. Moreover, many governments lack building professionals such as engineers, planners, urban finance experts, project managers, local economic development practitioners, environmental and building regulation inspectors, transport planners, engineers, and land-use lawyers. Thirty-six African countries do not have an urban planning school. Among those that do, Nigeria has 10 times less registered urban planners than the United Kingdom despite having 20 million more urban inhabitants. Africa needs tens of thousands of professionals to manage its cities and towns. It also needs a new breed of professionals that can cope with the complexities of the urban environment shaped by informal actors as well as global information networks.

8. NAtiONAl UrBAN StrAtEGiES FOr SUStAiNABlE CitiES iN AFriCA8. NAtiONAl UrBAN StrAtEGiES FOr SUStAiNABlE CitiES iN AFriCA
253African Economic Outlook© AfDB, OECD, UNDP 2016252 African Economic Outlook © AfDB, OECD, UNDP 2016
Filling this gap requires systematic capacity-building programmes. Governments need the leadership and skills to produce, implement, monitor and evaluate urban strategies and action plans. Civil society organisations and businesses involved in the urban agenda can also benefit from the same learning environment. New African institutions and networks are forming to plug this capacity gap, but these initiatives need to be scaled up and adapted to local contexts. Here are three successful examples:
• South Africa’s eThekwini Municipality established the Municipal Institute of Learning (MILE) to build capacity for local government. Since 2009, MILE has trained 3 600 local government practitioners in strategic planning, water and sanitation, solid waste management, and revenue management. The programme has provided technical support to municipalities neighbouring Durban, as well as in Malawi, Mozambique, Namibia and Zimbabwe. It fosters collaboration and learning partnerships and networks with local and international universities, research institutes in Africa and international development agencies.
• The Association of African Planning Schools is a network of 54 university-based city and regional planning schools across the continent. It trains urban planners in Africa to address issues such as informality, land, participation, governance, climate change, spatial planning and infrastructure. Moreover the network initiated an African planning law reform process.
• The Ethiopian Civil Service University and Ministry of Urban Development and Housing scaled up their graduate-level training in urban management to about 350 Master students per year between 2008 and 2015, representing a 12-fold increase since 2006.
To be successful, a national capacity building programme must involve many stakeholders. It should include the senior nodal point in the government, ideally with the president; the national department responsible for territorial planning and development; the department responsible for regional and local government; and the national departments charged with infrastructure and economic development. This cluster must work with the respective national association of local governments to refine the capacity-building agenda and develop a coherent programme bringing together the various stakeholders. Once the coalition for capacity-building and the right career incentives for young professionals are in place, it is possible to leverage the resources and offerings of various international agencies, according to the local priorities and demands.
Finally, incentives such as funded bursaries tied to in-service professionals can help ensure that adequate skills are available in more remote centres, as experimented in Ethiopia and Zambia. International experiences of in-service training in various sectors, such as the deployment of doctors to rural hospitals, could be adapted for building professions. Innovative approaches could also be explored.
Transparency is a key to the success of multi-level governance reforms
Embedding transparency in the seven steps set out at the beginning of this chapter for the formulation of urban development strategies can help attract finance, increase the efficiency of projects and improve fiscal legitimacy.
As the next section shows in more detail, accessing new finance for urban development requires providing potential financiers with information on opportunities and risks, as well as accountability systems documenting infrastructure inventories, rates and levy collection, cost recovery and debt-asset ratios. Beyond financial actors,

8. NAtiONAl UrBAN StrAtEGiES FOr SUStAiNABlE CitiES iN AFriCA
254 African Economic Outlook © AfDB, OECD, UNDP 2016
however, local actors, close to the point of expenditure, service delivery and citizen experience, should be among the main beneficiaries of enhanced transparency and accountability. Open data is one of several instruments for redefining the relationships between urban actors. By turning data into widely available resources, it can generate socio-economic innovations, pave the way for new entrepreneurial ambitions or be the source of new jobs. However, access to national data alone is not enough to enable civic participation: citizens need to believe in the quality of the information and government responsiveness. Several countries have developed open data initiatives:
• In Cameroon, the Association Internationale des Maires Francophones (AIMF) is encouraging the full participation of citizens in the budget cycle. A local government budget management system based on a software called SIM_ba helps inform decisions and foster accountability and data availability. As it rolls it out to different communes, AIMF claims that the use of open data might increase the share of administrative and public accounts deposited before the Audit Bench of the Supreme Court from 10% today to at least 50%. The software is being used in other countries including Burkina Faso, Chad, Comoros, Congo, Guinea, Mali, Madagascar, Niger and Togo.
• The Kenya Open Data Initiative (KODI) was launched in 2011 to give free access to government datasets and promote more transparent and effective governance. It stalled in 2013, as the dataset was not updated, but was re-launched in July 2015 with an improved online portal bringing more timely and diverse data. Today, 31 ministries contribute data, alongside increasing efforts of local governments. Journalists and civil society are being trained to use it. More than 94 million visitors have been able to consult 830 data sets, 92 maps and 301 charts. KODI remains a top-down initiative but plans to adopt more participatory means of generating data by working with grassroots open data and crowd-sourcing movements. It has generated interest from Ghana, Rwanda and Tunisia.
Finally, participatory budgets featuring a specific type of open data on the collection and use of local taxes can improve tax legitimacy. They promote fiscal decentralisation, making local authorities more inclusive, autonomous and accountable. The YTAX system set up by Enda Tiers-monde shows how new technology can facilitate participatory budgets by integrating all actors who manage local taxes: the collector, the inspector, the controller and the mayor. Each actor has an account within the system and is thus accountable to the others.
African governments can use various sources to finance national urban strategies
Step seven of the urban development framework outlined at the outset of this chapter is to mobilise financial resources in support of national urban strategies and the new urban agenda for Africa’s structural transformation. As explained above, the financing gap is huge, and bridging it requires context-specific solutions that tap the opportunities available in different countries, by:
1) empowering local authorities and making them accountable as part of the multi-level governance reforms outlined above
2) raising new financial resources through innovative finance mechanisms
3) harnessing the international community’s financial resources and opportunities for knowledge exchange.
Massive investment in a wide range of infrastructure is necessary for promoting vibrant and inclusive African cities (Box 8.7). How to mobilise the necessary financing is addressed here.

8. NAtiONAl UrBAN StrAtEGiES FOr SUStAiNABlE CitiES iN AFriCA8. NAtiONAl UrBAN StrAtEGiES FOr SUStAiNABlE CitiES iN AFriCA
255African Economic Outlook© AfDB, OECD, UNDP 2016254 African Economic Outlook © AfDB, OECD, UNDP 2016
Box 8.7. The size of sub-Saharan Africa’s urban infrastructure gap
Sub-Saharan Africa needs to invest around USD 90 billion per year in infrastructure, of which USD 60 billion in new infrastructure and USD 30 billion in maintenance. This estimation is based on the Africa Infrastructure Country Diagnostic (AICD), which assesses infrastructure needs globally using a sample of 24 countries. The AICD approach divides infrastructure into three categories:
• productive infrastructure at the national level (for example energy generation and transmission, telecommunication networks, highways, railways, airports and ports) which represent 34% of total needs (about USD 31 billion)
• public utilities and services in urban areas (for example roads, electricity, water and telecommunications) which represent 32% of total needs (about USD 29 billion)
• public utilities and services in rural areas (for example roads, electricity, water, drainage and irrigation) which represent 34% of total needs (about USD 31 billion).
The base-cost approach, which looks more specifically into needs for urban investment, estimates that sub-Saharan Africa requires between USD 12.5 billion and USD 35 billion per year depending on urban extension and population densities. This estimate does not include the cost of land and superstructure facilities (Paulais, 2012: 96-102).
Fiscal decentralisation comes with capable and accountable local authorities
The lack of financial resources of local authorities in Africa is striking. To ensure that momentum for policy reform is established and maintained, attention to the financial dimensions of the urban reform agenda is essential. According to preliminary estimates by the Global Observatory of Local Finances, 9.5% of national revenues are granted to local authorities in 19 African states (Figure 8.2), compared with 26% in the European Union.
Figure 8.2. Local authorities’ revenues and spending as share of African national budgets, 2013
0
5
10
15
20
25
30
Spending by local government Revenue from local government
% of national budgets
Rwanda
South
Africa
Kenya
Mali
Angola
Moroc
co
Cabo V
erde
Egyp
t
Zimba
bwe
Democ
ratic
Repub
lic
of the
Congo
Seneg
al
Benin
Tunis
ia
Burkin
a Fas
o
Gabon
To
go
Swazila
nd
Maurit
ania
Niger
Africa
-avera
ge
Note: Preliminary data. The collection of data and checking is ongoing, and the first results have yet to be fully validated. The panel does not include federal states. Data is for the year 2013 except Angola (2012); Burkina Faso (2012); Cabo Verde (2011); Egypt (2010); Gabon (2007); Mauritania (2008); South Africa (2012); Togo (spending 2006); Tunisia (2012); Zimbabwe (2012).Source: UCLG (forthcoming).12 http://dx.doi.org/10.1787/888933350932

8. NAtiONAl UrBAN StrAtEGiES FOr SUStAiNABlE CitiES iN AFriCA
256 African Economic Outlook © AfDB, OECD, UNDP 2016
Cities cannot address the infrastructure challenge without sufficient empowerment. The difficult task of providing social assistance to the poor, which is so important in African cities, can be best managed at the local level. Further, local budget decisions are more likely to result in well-located infrastructure, aligned to local needs that will crowd in local resources. However, fiscal decentralisation has proven the most controversial aspect of multi-level governance reforms due to low capacity and weak accountability. Local authorities must prove they are accountable, transparent institutions able to deliver basic services.
The financing tools cities can use depend greatly on the local context (Figure 8.3). According to the AEO survey, central government transfers and local taxes are ranked as having the greatest potential for revenue mobilisation, both in terms of magnitude and stability of funding. However, central government transfer is rated more important in secondary than in primary cities. In about 40% of the countries, funding from external donors, land value capture mechanisms and public private partnerships (PPPs) feature as other important sources of revenue for local governments. Engaging in PPPs seems more common in primary cities. Globalisation has brought opportunities for innovative finance, but not all cities can use these new tools equally. Co-operation between local governments can also rationalise resource mobilisation efforts.
Figure 8.3. Experts’ ratings of local government revenue sources, by revenue potential and stability in primary and secondary cities
A. Titre
0 10 20 30 40 50 60 70 80 100 90
0 10 20 30 40 50 60 70 80 100 90
Secondary city Primary city
Other
Public private partnerships
Land value captureand property taxes
External donors
Local taxes
National transfers
% of respondents
% of respondents
B. Highest degree of stability
A. Highest potential for generating revenue
Other
Public private partnerships
External donors
Land value captureand property taxes
Local taxes
National transfers
Note: “Other” includes local government bonds, remittances, and loans from local development banks and from private financial institutions. Survey answered by country economists of the AfDB and UNDP in 45 country offices in Africa. Response is weighted to one answer per country.Source: AEO experts’ survey, 2016.12 http://dx.doi.org/10.1787/888933350945

8. NAtiONAl UrBAN StrAtEGiES FOr SUStAiNABlE CitiES iN AFriCA8. NAtiONAl UrBAN StrAtEGiES FOr SUStAiNABlE CitiES iN AFriCA
257African Economic Outlook© AfDB, OECD, UNDP 2016256 African Economic Outlook © AfDB, OECD, UNDP 2016
Enhanced local finance and effective multi-level governance are two sides of the same coin
Provided local governments are transparent and accountable, fiscal decentralisation can allow them to finance urban infrastructure through three main channels:
• national transfers, which remain the core of cities’ revenue in many countries
• local taxes and complementary instruments such as land value capture mechanisms
• private finance.
National financial transfers and specialised financial institutions can boost cities’ resources
Mechanisms of equalisation and modalities of transfers vary greatly across African countries, depending on the extent of the fiscal disequilibrium, the institutional context of decentralisation or their history. For example, Nigeria automatically transfers 13% of oil revenue to the states hosting production, 60% of which is granted directly to local authorities. In South Africa, a formula determines the revenue support grant by using costs estimates. In Uganda, fiscal transfers to local authorities are conditional and determined on an ad hoc basis. For an analysis of political, administrative and fiscal decentralisation in Africa, see also AfDB/OECD/UNDP (2015: 189-193).
A dozen countries have set up specialised financial institutions (SFIs) to expand local authorities’ financial capacity, because most local authorities can hardly access commercial credits and private capital markets. The status and mandates of SFIs depend on diverse administrative contexts, levels of economic development and willingness of the central government to delegate financing mechanisms. SFIs must also respect macro-prudential guidance. In Tunisia, SFIs have led to over-indebtedness of local governments (UCLG, 2010: 53). Table 8.4 sketches a typology of SFIs.
Table 8.4. Specialised financial institutions in African countries
Characteristics Country Financing institution Donor loan Capital market Own resources TaxationCentral
government
State-owned orprivate-sector SFI
Morocco FEC √ √ √
Nigeria UDBN √ √
Active municipalcredit mechanisms
South Africa DBSA/INCA √ √ √
Tunisia CPSCL √ √ √
Investment fund
Limited or non-existent municipal credit mechanism
Burkina Faso FICOM/ FPCL √ √
Cameroon FEICOM √
Kenya LGLA √ √ √
Mali ANICT √
Senegal ADM √ √ √
Note: FEC = Fonds d’Équipement Communal, DBSA = Development Bank of Southern Africa, INCA = Infrastructure Finance Corporation Limited; CPSCL = Caisse de Prêts et de Soutien des Collectivités Locales; FEICOM = Fonds Spécial d’Équipement et d’Intervention Intercommunale; LGLA = Local Government Loans Authority; ANICT = Agence Nationale d’Investissement des Collectivités Territoriales; FICOM = Fonds d’Investissement pour les Collectivités Décentralisées; UDBN = Urban Development Bank of Nigeria.Source: Paulais (2012).
Local governments can use local tax and land value capture mechanisms more effectively
Cities can also increase their revenues by expanding the fiscal base to local property and economic activities. Strengthening local fiscal capacities is indispensable for all African countries: it can build the capacity of local governments but also increase fiscal legitimacy in general, including among agents in the informal sector. However, local tax collection is estimated to be about 1% of national income in most countries (AfDB/OECD/

8. NAtiONAl UrBAN StrAtEGiES FOr SUStAiNABlE CitiES iN AFriCA
258 African Economic Outlook © AfDB, OECD, UNDP 2016
UNDP/UNECA, 2010: 114). Yatta (2016: 19) estimates that local taxation is extremely low in seven Central and West African countries according to three indicators:
• Local governments taxed an estimated 0.7% of local households’ revenues.
• Tax on local property is close to 0%.
• The local collection rate was estimated at 0.20-0.58% of the “gross local product”: when a city generates USD 100 its return is less than USD 0.60.
Evidence suggests similar situations in other countries. Out of 42 African countries, at least 5 do not levy any local tax (AEO experts’ survey, 2015).
Comparing the revenues of some African cities to some in Colombia and the Philippines reveals the difficulties African cities face in generating local resources (Figure 8.4). A dearth of local revenues results in African cities’ strong dependence on national transfers. Transfers make up over 85% of the revenues of cities such as Banha, Egypt, or Nyagatare and Rubavu, Rwanda. Having too few locally generated resources contributes to African cities’ financing gap.
Figure 8.4. Revenues from transfers and locally generated resources, selected cities in Africa, Colombia and the Philippines
0
50
100
150
200
250
300
From intergovernmental transfers From city revenues
City expenditure in USD per capita
Medell
in (C
olombia
)
Bogota
(Colo
mbia)
Santa
Marta (
Colombia
)
Cagay
an de
Oro
(Phil
ippine
s)
Iloilo
(Phil
ippine
s)
Banha
(Egyp
t)
Nacala
Porto
(Moz
ambiq
ue)
Nampu
la (M
ozam
bique
)
Nyaga
tare (
Rwanda
)
Rubav
u (Rwan
da)
Note: USD in purchasing power parity, 2013.Source: UN-Habitat (2015a).12 http://dx.doi.org/10.1787/888933350956
Developing efficient and fair local fiscal systems can require difficult, profound and context-specific reforms. For instance, most local taxes are direct taxes, although direct taxes tend to be more subject to tax evasion when fiscal legitimacy is low. In addition, local taxes can be more difficult to collect than indirect taxes, in particular where tax collection is not within local governments’ capacity. Local economic accounts in Central and West Africa show that the urban informal sector is sometimes taxed at 0.30%, against 0.10% for the formal sector. In some cases, the informal sector may effectively pay value-added tax on much of their input already purchased as final goods, while the formal sector may benefit from certain tax exemptions, for instance those enticing new investments (Yatta, 2016: 19). Expanding the local tax base, however, especially property tax, is politically sensitive. The right tax mix largely depends on the national and local context.

8. NAtiONAl UrBAN StrAtEGiES FOr SUStAiNABlE CitiES iN AFriCA8. NAtiONAl UrBAN StrAtEGiES FOr SUStAiNABlE CitiES iN AFriCA
259African Economic Outlook© AfDB, OECD, UNDP 2016258 African Economic Outlook © AfDB, OECD, UNDP 2016
The capture of land value can complement local revenue collection, although it should not replace local taxes because they are legitimate fiscal instruments. In a context of rapid urban expansion, land could give national or local authorities a powerful tool for structuring and financing urbanisation. Land value capture can usefully internalise the fluctuation of land prices that come with the urbanisation dividend. Usually, it requires a three-step process:
• Regulatory decisions (change in land use, infrastructure investment, etc.) trigger an increase in land values.
• The government then institutes a process to capture part or all of the gains in land valuations.
• The captured land value finances infrastructure investments to offset the negative effects that come with higher land prices, such as densification and gentrification. For instance, the government can use these funds to provide affordable housing (Suzuki et al., 2015).
One example is the tiers associé (associated third party) initiative started in 2007 in the context of Morocco’s National Slum Removal Policy. To relocate informal settlements, households were collectively granted a plot of land with rights to build up to three or four floors. Two households may form an association with a third party who finances the construction in exchange for parts of the new building, and the households receive two apartments. This mechanism allowed the rapid creation of formal housing, commercial real estate and free land for urban development (Toutain, 2015). Table 8.5 shows some examples of land-based financing initiatives.
Table 8.5. Land-based financing initiatives in AfricaMechanisms Examples Description
Formal urban extension through voluntary private land readjustment
Land readjustment in the secondary city of Huango, Angola
Land readjustment operations on a 312-hectare (3.12 km2) rural area in the Fatima district have generated 255 lots for housing. A 35% land surface and a land title were given to original owners, 30% to public utilities and the 35% remaining sold to finance the project. USD 800 000 were collected from land sale and financed small infrastructure upgrades.
Property tax and land titling Registre Foncier Urbain (RFU), Benin
By clarifing land titles, the RFU intended to increase property taxes and local fiscal revenues. These dramatically increased in the early 1990’s but decreased towards the end of the decade, mainly for two reasons: 1) the central administration retains the power to collect taxes, and local taxes are not a priority; and 2) local policy makers hesitate to promote a tax that is unpopular among voters.
Public land sale Sale of public land in Addis Ababa, Ethiopia
In Addis Ababa, 94% of land is sold by the communes at a price set by administrative rules. For 2014, the revenue from the sale of land development rights represented 6% of the city’s total budget of USD 900 million and 9% of its total investment spending.
Source: UN-Habitat (2013) and UCLG (n.d.).
Land value capture opens perspectives for the future. However, it remains incipient partly due to Africa’s structural weaknesses related to difficult land registry and titling procedures (see above), dysfunctional real estate and financial markets, and weak planning policies. Land value capture mechanisms are often ad hoc and difficult to replicate due to a lack of institutionalisation. Rampant corruption and favouritism can lead to powerful elites pocketing the increase in land value, as observed in Bamako, Mali (Durand-Lasserve et al., 2015). Land value capture mechanisms are often the product of negotiations between various public bodies, owners, users and real estate agencies, which implies reaching a consensus on the value and on sharing the benefits (Suzuki et al., 2015). Securing land rights and institutionalising a system for giving formal approval to land development projects remain a prerequisite.
8. NAtiONAl UrBAN StrAtEGiES FOr SUStAiNABlE CitiES iN AFriCA
260 African Economic Outlook © AfDB, OECD, UNDP 2016
Fiscal decentralisation allows local governments to raise private finance
Within strict macro-prudential regulations, the third dimension of fiscal decentralisation consists in enabling local governments to use financing mechanisms from the private sector, such as local debt instruments. With a better tax base, local governments can borrow from financial markets, provided they respect national guidance for macroeconomic stability:
• Johannesburg gained access to capital markets in 2004 and has successfully emitted six municipal bonds, the last one valued at ZAR 90 million in December 2015.
• In Cabo Verde, local governments can borrow from commercial banks within certain limits to avoid over-indebtedness. Credits are mostly limited to five years and have relatively costly interest rates of 13-14%. To reduce risks, the central government has to approve every loan. Cabo Verde’s average local government budget is relatively high: in 2007, it represented EUR 276 per inhabitant, against EUR 7 in Senegal.
• Federal states in Nigeria are allowed to borrow on domestic capital markets with the permission of the central government. Lagos State generates 60% of its own resources. Through the emission of bonds and public private partnerships, Lagos has managed to mobilise additional resources and improve local infrastructure since 2008 (Paulais, 2012: 321-51; quoted in AfDB/OECD/UNDP, 2015).
Nonetheless, Nigeria’s bond-emission model cannot be a universal solution. It is mainly appropriate for large entities and local governments with high growth perspectives. Besides, local governments may not necessarily obtain the approval of national authorities, who may object for financial, administrative or political reasons.
Another instrument consists in attracting foreign direct investment (FDI) into urban infrastructure. Globally, some USD 50 trillion in savings and pensions are available (CCFLA, 2015). Some of it could finance the development of Africa’s urban infrastructure, but the continent receives insufficient investment finance (AfDB, 2012). USD 328 billion was spent on African infrastructure between 2009 and 2014, but FDI inflows to Africa have contracted as a result of the decline in commodity prices (Chapters 1 and 2). Cities in diversifier and early urbaniser countries (Accra, Casablanca, Cairo, Tunis, Johannesburg and Lagos) are showing some resilience to the downturn. Initiatives such as Africa50 infrastructure fund and the Private Infrastructure Development Group provide African governments with technical expertise and a pipeline of standardised projects that reduce transaction costs for external investors. To alleviate risk for investors, African governments can use hedging mechanisms such as risk insurance and commitment devices offered by international organisations such as the Multilateral Investment Guarantee Agency, the insurance arm of the World Bank.
Innovative finance offers new ways of raising and allocating resources
Innovative finance mechanisms can offer new ways to deliver services and avoid the obstacles of financing service infrastructure through conventional “user-pay” arrangements. Providing partial access to state-owned utilities and facilities could encourage investment, if well-structured and transparent. In Ethiopia, Kenya, South Africa and Tunisia, private-sector involvement in state-owned energy, waste management and water utilities has attracted investment and improved accountability. While private-sector involvement presents the risk of corruption of public entities, a well-structured process can reduce financing constraints. Examples of how public assets can be leveraged to attract private finance for services include the extraction of valuable material from state land-fills, such as at Lagos’ Olusosun landfill, and others that convert landfill gas into energy (such as Durban’s Bisaser Road) and municipal green waste into compost (e.g. Cape Town’s Reliance Compost). New gas reserves present opportunities to apply this approach, which could lead the way to a less onerous, more stable and inclusive energy sector in Africa.

8. NAtiONAl UrBAN StrAtEGiES FOr SUStAiNABlE CitiES iN AFriCA8. NAtiONAl UrBAN StrAtEGiES FOr SUStAiNABlE CitiES iN AFriCA
261African Economic Outlook© AfDB, OECD, UNDP 2016260 African Economic Outlook © AfDB, OECD, UNDP 2016
Co-production of infrastructure investment can lead to virtuous cycles of services, work and reduced risk. While low per-capita income is a general finance problem in Africa, the potential of mobilising local financial resources from across the socio-economic spectrum remains untapped. This is most likely when local authorities and community-based organisations are not excluded. For example, the excessive household expenditure on batteries and paraffin directed companies to privately financed models of household energy. Household resources can be added to international finance to produce affordable services. This is shown by energy service companies Off-Grid Electric and M-KOPA Solar in East Africa and by the sanitation “bio-centres” in the informal settlement of Kibera, Nairobi. Bills can be paid by mobile phone technology, which is growing rapidly. In the process, local authorities can generate greater financial leverage from their available balance sheets and enhance them with private resources.
Green funds and climate finance can offer new sources of investment, if they address structural challenges in attracting investment and use these funds efficiently. All but two African countries made Nationally Determined Mitigation Commitments, at COP21 in Paris. Adopting renewable energy technologies will have to catalyse financial innovation. The Green Climate Fund of the United Nations Framework Convention on Climate Change will provide new funding options for low-carbon projects. The greater hope is that African countries will use the fund’s USD 16 trillion investment in renewable energy and clean technology to comply with the Paris Agreement and the 2°C warming limit (Mathres, 2016). Climate funding for African cities can modernise the manner in which infrastructure is financed. It can also replace centrally co-ordinated mega-infrastructure projects with alternatives, such as locating energy sources closer to the point of demand. However, the multinational agencies dispensing these funds need to align with local needs and initiatives.
Finding ways to value ecological capital offers potential for service provision. In the absence of formal services, many urban residents rely disproportionately on goods and services provided by the natural environment for potable water, flood buffering and recreation (see Chapters 6 and 7). Though vulnerable, ecosystem goods and services can be fiscally efficient. This is the logic behind the Upper Tana-Nairobi Water Fund (Box 8.8). Finance recognising the role of ecological capital can create jobs for low-skilled unemployed urban youth.
Other innovative finance mechanisms for Africa’s urban development are available. These include funding from emerging countries, sovereign wealth funds, remittances and diaspora bonds (AfDB/OECD/UNDP, 2015: 219).
Box 8.8. The Upper Tana-Nairobi Water Fund
The planned Upper Tana-Nairobi Water Fund, which focuses on the watershed that supplies Nairobi with 95% of its water, would be the first of its kind in Africa. A water fund supports both water and soil conservation. It funds “green infrastructure” using natural systems and is cheaper than “grey infrastructure” such as reservoirs, multiple dams and water treatment plants. Water funds have been implemented in cities such as Quito or Rio de Janeiro.
For a budget of USD 10 million over ten years, key investments include management of riparian areas (the interface between river and land), agroforestry, terracing, reforestation, grass strips and road mitigation. Local farmers are expected to benefit from reductions in soil erosion and related damages to production and to water quality and supply. The area would therefore enjoy increased agricultural productivity (TNC, 2015).

8. NAtiONAl UrBAN StrAtEGiES FOr SUStAiNABlE CitiES iN AFriCA
262 African Economic Outlook © AfDB, OECD, UNDP 2016
Phasing out fossil fuel subsidies could free up investment in renewable energy
A hypothetical scenario modelled for this report shows how phasing out fossil-fuel subsidies could free up investment in renewable energy. Globally, investment in renewable energy systems has undergone an unprecedented boom: from USD 39 billion in 2004 to USD 329 billion in 2011. In sub-Saharan Africa, coal-fuelled electricity generation is projected to drop from 56% of total energy in 2012 to 27% by 2040. By the same year, renewable energy sources are estimated to provide 41% of total electricity, over half of which from hydropower. Investing in off-grid renewable energy is an attractive option in sub-Saharan Africa where 50% of the urban population live without grid connection. Off-grid solar energy, in particular, can enable users to access lighting and in some cases afford mini renewable-based electricity generators.
According to analysis by the ReCalc programme of World Wildlife Fund for Nature (WWF) on a sample of 24 African cities, re-allocating fossil-fuel subsidies could free up some USD 16 billion for investment in renewable energy between 2017 and 2025 (Table 8.6). These investments could increase the cities’ installed electricity capacity by 6 600 megawatts and generate 16 million megawatt hours annually. At current consumption levels, the added capacity would meet the demand of 55 million more people. Replacing fossil fuel by renewable sources for electricity could reduce lifetime greenhouse gas emissions by 590 million tonnes of carbon dioxide and directly save 20 million litres of water.
Table 8.6. ReCalc scenario replacing fossil-fuel subsidies with investments in renewable energy for 24 African cities
City National pre-tax fossil-fuels subsidies
(2015)
Net investment in renewable
energy (2017-25)
Capacity added
(2017-25)
People whose annual electricity
consumption would be covered
(annually)
Greenhouse gas emissions
averted (2017-74)
Water consumption
averted (2017-74)
Jobs created (2017-74)
USD billion USD billion MegawattsMillion tonnes CO2 equivalent Million litres
Abidjan 0.99 1.7 692 7 563 470 55 1 723 013 42 012
Accra 0.10 0.1 26 194 348 2 63 816 1 555
Antananarivo 0.11 0.1 42 188 266 4 132 418 2 497
Cape Town 2.51 1.3 523 203 471 35 1 224 320 31 382
Dar es Salaam 0.75 0.6 256 5 890 533 24 801 073 15 107
Douala 0.77 0.6 309 3 837 944 31 1 026 728 17 052
Durban 2.51 0.8 406 157 817 27 949 708 24 340
Harare 2.70 1.9 751 3 037 570 71 2 346 154 44 249
Jos 0.92 0.0 14 215 978 1 39 806 823
Kampala 0.32 0.1 52 290 245 6 197 304 2 931
Kigali 0.03 0.0 10 58 210 1 39 529 588
Kinshasa 0.68 0.8 320 9 921 751 33 1 063 633 17 663
Kumasi 0.10 0.1 33 247 137 3 81 176 1 980
Libreville 0.10 0.3 120 358 661 12 400 853 6 655
Luanda 0.96 1.8 706 7 291 376 66 2 203 822 41 562
Lusaka 2.06 2.4 948 3 774 481 89 2 960 824 55 838
Maputo 1.05 0.3 133 679 462 12 414 552 7 818
Marrakech 0.25 0.1 28 77 529 2 77 988 1 652
Matola 1.05 0.3 117 600 013 11 366 016 6 903
Mombasa 0.16 0.0 13 224 642 1 47 736 709
Nairobi 0.16 0.1 45 812 782 5 172 662 2 565
Ouagadougou 0.14 0.2 78 396 313 6 192 601 4 707
Pointe-Noire 0.69 1.1 441 7 896 555 45 1 467 183 24 363
Tunis 1.04 1.4 560 962 151 46 1 560 855 33 038
TOTAL 16.3 16.1 6 621 54 880 707 590 19 553 772 387 992
Note: The International Monetary Fund does not provide data for Gabon or Ghana, and subsidies’ estimates from the International Energy Agency have therefore been used. Based on electricity consumption per capita (World Bank, 2015b), sub-Saharan average has been used for four countries lacking data (Burkina Faso, Madagascar, Rwanda, Uganda).Source: Prepared by the WWF for this edition of the African Economic Outlook. More information on the tool is available at http://recalc.wwf.no/.

8. NAtiONAl UrBAN StrAtEGiES FOr SUStAiNABlE CitiES iN AFriCA8. NAtiONAl UrBAN StrAtEGiES FOr SUStAiNABlE CitiES iN AFriCA
263African Economic Outlook© AfDB, OECD, UNDP 2016262 African Economic Outlook © AfDB, OECD, UNDP 2016
International co-operation can support national urban strategies
International co-operation can provide funding and technical know-how to support integrated urban strategies. Since 2000, the African Development Bank has invested over USD 3.2 billion in urban water supply and sanitation and is setting up a sub-national financing policy and a municipality trust fund. The Agence Française de Développement (AFD) has recently adopted an integrated urban strategy based on a regional approach, mobilising local actors and promoting decentralised co-operation. AFD also accommodates the financing to the level of maturity of urban plans: direct loans to local authorities, and credit facility or loans to states for on-lending to local authorities. The AFD has made loans to the cities of Johannesburg and Ouagadougou, but few other donors have yet made loans to local governments.
Other donor agencies have often helped urban governance through: i) enhancing co-ordination with clear jurisdictional boundaries between the central government and local authorities; ii) granting greater financial autonomy to the local authorities mainly by improving their fiscal base; and iii) establishing equalisation mechanisms between local authorities. Box 8.9 shows how co-operation between local, national and international actors can help monitor the achievement of Sustainable Development Goal 11 on sustainable cities.
Growing South-South co-operation can diffuse trial-and-tested experience among countries facing common challenges. For example, the Bus Rapid Transit (BRT), a model of public transport originally implemented in Curitiba (Brazil) in 1974, has been adopted by many cities in the Southern Hemisphere, including Lagos in 2008. The standards and priorities required by the BRT system, relative to the more complex solutions in the North, prove more appropriate for African cities facing uncontrolled urban growth and “slumisation” without adequate capacity. Similarly the successful Chamanculo slum upgrading initiative in Salvador (Brazil) characterised by strong community participation, inspired similar experimentation in Maputo (Mozambique).
Box 8.9. Measuring progress towards Sustainable Development Goal 11
New methods and processes of data collection allow city governments to monitor their progress towards SDG 11, urbanisation and their own agendas. UN-Habitat has adapted the City Prosperity Initiative (CPI) to the global monitoring framework of the SDGs, including SDG 11, and the future New Urban Agenda. By adopting the CPI, a municipal government can monitor progress by using a single platform for multi-scale decision making between different levels of government. The CPI is already being implemented in more than 200 cities in Egypt and Ethiopia. The government of Addis Ababa has been using a contextualised CPI to monitor the implementation of Ethiopia’s Structural Transformation Plan. After an initial assessment, local authorities are organising public consultations to understand critical problems and to propose action plans to address them.
However, many indicators proposed to monitor progress in the SDG 11 prove challenging for cities to measure. The Mistra Urban Futures centre found that the draft targets and indicators for SDG 11 pose significant challenges for all five local governments it works with (Bangalore (Bengaluru), India; Cape Town, South Africa; Gothenburg, Sweden; Greater Manchester, United Kingdom; and Kisumu, Kenya). The issues of data availability, ease of access or collection, and perceived relevance pose difficulties for the African, European and Asian cities. Even indicators like the availability and accessibility of transport services reveal important disparities. The diversity of urban contexts also hinders the application of universal measures. For example, the European definition of sub-standard housing, based on tenure types and security, proves inappropriate to classify two-thirds of Kisumu’s residents. Similarly, informal and semi-regulated transport services would be included in most African and Asian cities yet excluded from cities in other world regions (Simon et al., 2015).

8. NAtiONAl UrBAN StrAtEGiES FOr SUStAiNABlE CitiES iN AFriCA
264 African Economic Outlook © AfDB, OECD, UNDP 2016
Box 8.9. Measuring progress towards Sustainable Development Goal 11
Figure 8.5. Examples of the City Prosperity Index for six African cities
10 20 30 40 50 60 70
10 20 30 40 50 60 70
Kampala
HarareDar es Salaam
Nairobi
LusakaLagos
Productivity
Infrastructure
Quality of life
Social inclusion
Sustainability
Governance
Productivity
Infrastructure
Quality of life
Social inclusion
Sustainability
Governance
Note: Each dimension has a scale of 0 to 100, with a higher score representing a better outcome in the respective dimension.Source: UN Habitat (2015b).12 http://dx.doi.org/10.1787/888933350960
Note
1. The UN-Habitat Governing Council, a subsidiary body of the United Nations General Assembly, adopted Guidelines on decentralisation and strengthening of local authorities in 2007. The Guidelines are the only non-binding international declaration supporting decentralisation as a strategy for development, the only other comparable document being the European Charter of local self-government, which only applies to the members of the Council of Europe.
(cont.)
8. NAtiONAl UrBAN StrAtEGiES FOr SUStAiNABlE CitiES iN AFriCA8. NAtiONAl UrBAN StrAtEGiES FOr SUStAiNABlE CitiES iN AFriCA
265African Economic Outlook© AfDB, OECD, UNDP 2016264 African Economic Outlook © AfDB, OECD, UNDP 2016
References
AfDB (2012), Programme for Infrastructure Development in Africa (PIDA): Interconnecting, Intergrating and Transforming a Continent, African Development Bank, Addis Ababa.
AfBD/OECD/UNDP (2015), African Economic Outlook 2015, Regional Development and Spatial Inclusion, OECD Publishing, Paris, http://dx.doi.org/10.1787/aeo-2015-en.
AfDB/OECD/UNDP/UNECA (2010), African Economic Outlook 2010, OECD Publishing, Paris, http://dx.doi.org/10.1787/aeo-2010-en.
Andrews, M., L. Prichett and M. Woolcock (2012), “Escaping capability traps through problem driven iterative adaptation”, CID Working papers, No. 240, Center for International Development at Harvard University.
Angelakis, A.N. and J.B. Rose (2014), Evolution of Sanitation and Wastewater Management through the Centuries, IWA Publishing, London.
APP (2015), “PowerPeople Planet: Seizing Africa’s energy and climate opportunities”, African Progress Report 2015, Africa Progress Panel, www.africaprogresspanel.org/publications/policy-papers/2015-africa-progress-report (accessed in March 2016).
AU (2014), “African charter on the values and principles of decentralisation, local governance and local development”, adopted by the Twenty-Third Ordinary Session of the Assembly, Malabo, Equatorial Guinea, 27 June, African Union, Addis Ababa.
Brundtland Commission (1987), “Report of the World Commission on environment and development: Our common future”, Oxford University Press.
Cartwright, A. (2015), “Better growth, better cities: Rethinking and redirecting urbanisation in Africa”, Working Paper, African Center for Cities and The New Climate Economy: The Global Commission on the Economy and Climate, Washington, DC, http://2015.newclimateeconomy.report/wp-content/uploads/2015/09/NCE-APP-final.pdf.
CCFLA (2015), “The Bangkok-Johannesburg blueprint”, Cities Climate Finance Leadership Alliance, New York.
Cheru, F. (2014), Structural Transformation in Ethiopia: The Urban Dimension, UN-Habitat, Nairobi.
Currie, P. et al. (2015), “Towards urban resource flow estimates in data scarce environments: The case of African cities”, Journal of Environmental Protection, Vol. 6, pp. 1066-1083.
Dinh, H. et al. (2012), Light Manufacturing in Africa, World Bank, Washington, DC, http://doi.org/10.1596/978-0-8213-8961-4.
Durand-Lasserve, A., M. Durand-Lasserve and H. Selod (2015), Le Système d’approvisionnement en terres dans les villes d’Afrique de l’Ouest : l’exemple de Bamako, Forum pour le développement de l’Afrique, Agence Française de Développement and World Bank.
Elong Mbassi, J.-P. (2016), “National urban policies, urban planning and governance: Think national, act global” high level panel speech on behalf of United Cities and Local Governments, Habitat III Africa Regional Meeting, 24-26 February, Abuja.
Jaglin, S. (2014), “Regulating service delivery in southern cities: Rethinking urban heterogeneity”, in S. Parnell and S. Oldfield (eds.), A Routledge Handbook on Cities of the Global South, Routledge, Abingdon and New York.
Lawanson, T. (2015), “Governing Lagos in the urban century: The need for a paradigm shift, Conclusion and Outlook”, in F. Hoelzel (ed.), Urban Planning Processes in Lagos: Policies, Laws, Planning Instruments, Strategies and Actors of Urban Projects, Urban Development, and Urban Services in Africa’s Largest City, Heinrich Böll Stiftung Nigeria and Fabulous Urban, Lagos.
Lighting Africa (2010), Solar Lighting for the Base of the Pyramid: Overview of an Emerging Market, International Finance Corporation and World Bank, June.
Map Kibera (2016), “Making the invisible visible”, http://mapkibera.org (accessed 24 March 2016).
Mathres, M. (2016), “Paris Agreement unleashes $16 trillion of investment in renewables and cleantech”, EcoWatch Website, http://ecowatch.com/2016/01/26/investment-renewables-cleantech (accessed in March 2016).
OECD (2016), Examen multidimensionnel de la Côte d’Ivoire : Volume 1, Évaluation initiale, OECD Publishing, Paris, http://dx.doi.org/10.1787/9789264248557-fr.
Paulais, T. (2012). Financing Africa’ s Cities: The Imperative of Local Investment, World Bank, Washington, DC, http://doi.org/10.1596/978-0-8213-9455-7.
Pieterse, E. (2011), “Grasping the unknowable: Coming to grips with African urbanisms”, Social Dynamics, 38/1, pp. 5-23.
Pinel, A. (2013), “Lorsque le Sud innove en matière durable : le projet de transport en commun d’Amman”, Environnement Urbain/Urban Environment, Vol. 7, http://dx.doi.org/10.7202/1027725ar.

8. NAtiONAl UrBAN StrAtEGiES FOr SUStAiNABlE CitiES iN AFriCA
266 African Economic Outlook © AfDB, OECD, UNDP 2016
République de Côte d’Ivoire (2016), website of the Ministère des Infrastructures économiques, www.infrastructures.gouv.ci/principal.php?page=10 (accessed in April 2016).
République du Sénégal (2013), Loi n° 2013-10 du 28 décembre 2013 portant Code général des Collectivités locales, Government Publication, www.au-senegal.com/IMG/pdf/code_general6119.pdf (accessed in March 2016).
Simon, D. et al. (2015), “Developing and testing the urban sustainable development goal’s targets and indicators: A five-city study”, Environment and Urbanization, http://dx.doi.org/10.1177/0956247815619865.
Song, L. (2013), Southeast Asian Secondary Cities: Frontiers of Opportunity and Challenges, Community Innovators Lab, Massachusetts Institute of Technology.
Speakman, J. and M. Koivisto (2013), “Growth poles: Raising competitiveness and deepening regional integration”, in The Africa Competitiveness Report 2013, World Bank, Washington, DC.
Suzuki, et al. (2015), “Financing Transit-Oriented Development with Land Values: Adapting Land Value Capture in Developing countries”, Urban Development Series, World Bank Group.
Swilling, S. (2015), Greening African Cities: Urbanization, Structural Transformation and Sustainable Resource Use, report commissioned by United Nations Economic Commission for Africa.
TNC (2015), Upper Tana-Nairobi Water Fund: Business Case, Version 2, The Nature Conservancy, Nairobi, Kenya, www.nature.org/ourinitiatives/regions/africa/upper-tana-nairobi-water-fund-business-case.pdf.
Toutain, O. (2015), “Regard sur la pratique de financement du relogement des bidonvillois par des investisseurs privés : cas de Casablanca”, presentation at the seminar “Gouvernance territoriale et projets d’habitat social au Maroc”, EGE Rabat – INAU, 14 April.
UCLG (forthcoming), Global Observatory on Local Finance, preliminary results, United Cities and Local Governments, Barcelona.
UCLG (n.d.), Financement local et capital foncier-immobilier : quelles options et quelles conditions de mise en œuvre ?, United Cities and Local Governments, Barcelona.
UCLG (2014), Basic Services for All in an Urbanizing World, Third Global Report on Local Democracy and Decentralisation (Gold III), United Cities and Local Governments, Barcelona.
UCLG (2010), Local Government Finance: The Challenges of the 21st Century, Second Global Report on Decentralization and Local Democracy (GOLD II), United Cities and Local Governments, Barcelona, www.cities-localgovernments.org/gold/Upload/gold_report_2/2010%20EXECUTIVE%20SUMMARY%20baixa.pdf.
UN-Habitat (2015a), UN-Habitat Governing Council Presentation on Achieving Sustainable Urban Development Programme, Habitat III Conference on Urbanization, Nairobi, Kenya, 17 April.
UN-Habitat (2015b), “City Prosperity Index: Ethiopian city – Addis Ababa” UN-Habitat Global Urban Observatory, Research and Capacity Development Branch, http://unhabitat.org/city-prosperity-index-ethiopian-city-addis-ababa.
UN-Habitat (2013), “Huambo Land Readjustment”, Urban Legal Case Studies, Vol. 1, United Nations Human Settlements Programme, Nairobi, www.gltn.net/jdownloads/GLTN%20Documents/huambo_land_readjustment_case_study_final.pdf.
UN-Habitat (2008), Secure Land Rights for All, United Nations Human Settlements Programme, Nairobi.
World Bank (2015a), Ethiopia Urbanization Review: Urban Institutions for a Middle-Income Ethiopia, World Bank, Ethiopian Government and Cities Alliance, Washington, DC.
World Bank (2015b), World Development Indicators (database), http://data.worldbank.org/data-catalog/world-development-indicators (accessed in December 2015).
World Bank (2013), “Building sustainability in an urbanizing world: A partnership report”, Urban Development Series Knowledge Papers, No. 17, World Bank, Washington, DC.
Yatta, F. (2016), “Urbanisation et transformation structurelle en Afrique : comment supprimer les contraintes qui entravent le développement des économies locales”, OECD Development Centre Background Papers for African Economic Outlook 2016.

PART III
Country notes

COUNtrY NOtES
268 African Economic Outlook © AfDB, OECD, UNDP 2016
AlGERIA
• Growth reached an estimated 3.9% in 2015, mostly driven by agriculture and a rebound in oil and gas activity.
• With approximately 49% of government revenues and 96% of exports depending on the oil sector, the drop in oil prices has reduced budgetary and external savings, underscoring the need to diversify the sources of public finance.
• A process of urban transition begun in 1987-88 has led to 70% of the population’s 40 million people living in urban areas by 2015.
Real gross domestic product (GDP) growth in 2015 was 3.9%, against 3.8% in 2014, driven mostly by agriculture, especially vegetable production, and by a noticeable rebound in oil and gas activity in Q4 of 2015. Against a background of falling global oil prices since June 2014, this rebound followed nine consecutive years of decline. This should be an opportunity to speed up reforms aimed at diversifying the economy and its structural transformation. Real GDP growth should reach 3.4% and 3.0% in 2016 and 2017 respectively.
Rising prices of food and manufactured goods pushed up inflation, which had declined for two consecutive years, to 4.8% in 2015. The price hikes were due to problems in the distribution channels, especially for fresh agricultural produce and industrial foodstuffs.
The economic situation is mostly dominated by the drastic fall in oil prices and its effects on the country’s external position, as well as on public accounts. For the first time in 16 years, in 2015 the trade balance was negative (-9% of GDP) because imports (31% of GDP) were not covered by exports (21% of GDP), resulting in lower official foreign-exchange reserves.
Public accounts have been affected by erosion in the resources of the revenue-stabilisation fund (Fonds de regulation des recettes) from the notable fall in oil-taxation receipts, down from 20% to 13% of GDP between 2014 and 2015. With total revenues falling (27% of GDP in 2015 versus 33% in 2014) and fiscal expenditure still high (43% of GDP in 2015 and 2014), the overall deficit grew to 16% of GDP in 2015 from 8.3% in 2014.
Regional planning has systematically included “urban” and “sustainability” as concepts in the regulations and development plans for the three major zones: Littoral, High Plateaux and Sahara. In 2015, more than 70% of the country’s population of 40 million lived in urban areas.
Macroeconomic indicators
2014 2015(e) 2016(p) 2017(p)
Real GDP growth 3.8 3.9 3.4 3.0
Real GDP per capita growth 1.8 2.1 1.6 1.2
CPI inflation 2.9 4.8 4.3 4.0
Budget balance % GDP -8.3 -16.0 -15.4 -14.7
Current account % GDP -4.4 -15.6 -17.1 -15.2
Source: Data from domestic authorities; estimates (e) and projections (p) based on authors’ calculations.

COUNtrY NOtES
269African Economic Outlook© AfDB, OECD, UNDP 2016268 African Economic Outlook © AfDB, OECD, UNDP 2016
AnGolA
• Angola’s economy grew by 3.8% in 2015, and GDP growth will remain subdued, at 3.3% in 2016 and 3.5% in 2017, due to lower crude oil prices.
• Policies to accelerate economic diversification and strengthen human development and equitable growth are needed to reduce vulnerability to external shocks.
• Investment in economic and social infrastructure is needed to enhance the sustainability of the country’s urbanisation process.
Angola’s natural resource wealth helped attract foreign direct investment and ensured strong economic growth over the past decade. But the economy has recently undergone a major structural shock due to lower crude oil prices, and forecasts for the coming years remain filled with uncertainty about the evolution of the country’s oil exports and international commodity prices. Growth of gross domestic product (GDP) is projected to remain subdued, at 3.3% in 2016 and 3.5% in 2017, down from 3.8% in 2015. Growth of the oil sector will average 4%, while the non-oil sector is expected to show a small improvement, growing by 3.4%, driven mainly by a strong recovery in agriculture.
In January 2016, the government adopted a strategy for mitigation of the oil crisis aimed at finding substitutes for oil as a major source of revenue. Agriculture is expected to play a key role in boosting the country’s exports and generating foreign currency earnings. The strategy also envisages investments in infrastructure, gradual reduction of imports, deepening of financial sector reforms, skills development and improvement of the business environment. The main initiatives for enhancing the ease of doing business involve reducing bureaucracy and facilitating credit. Notwithstanding these reforms, the legal framework still needs adjustment to ease the business environment. Income inequality, unemployment and poverty remain a challenge in Angola. Regional economic imbalances also persist. Transformative investments are required to decongest large cities and reconnect them with major economic growth poles, particularly in rural areas.
Although Angola is perceived as highly urbanised, with 62.3% of the population living in urban areas, the country needs to broaden human development opportunities for the population. Under its National Development Plan 2013-2017, the government is contemplating a territorial development strategy to create a network of development poles. The country has a National Urbanisation and Housing Programme, a 2015-2030 Metropolitan Plan for Luanda and several ongoing urbanisation projects in other areas. Rural to urban migration has been a major driver of urbanisation, especially during the 27 years of armed conflict that followed independence in 1975. The country counts 18 provinces divided into municipalities, communes, villages and towns. Depending on the setting, the government recognises different criteria for classifying urban areas. There is a need to integrate informal housing progressively into city planning and management and to strengthen national institutional capacities for managing urbanisation and urban and rural development.
Macroeconomic indicators
2014 2015(e) 2016(p) 2017(p)
Real GDP growth 4.8 3.8 3.3 3.5
Real GDP per capita growth 1.5 0.5 0.1 0.3
CPI inflation 7.3 10.2 14.1 14.8
Budget balance % GDP -5.6 -4.1 -5.5 -5.6
Current account % GDP -2.5 -7.2 -5.4 -5.4
Source: Data from domestic authorities; estimates (e) and projections (p) based on authors’ calculations.

COUNtrY NOtES
270 African Economic Outlook © AfDB, OECD, UNDP 2016
bEnIn
• Growth, estimated at 5.2% in 2015 against 6.5% in 2014, dipped slightly due to a decline in cotton production and disruptions in the electricity supply.
• Projected growth rates of 5.5% in 2016 and 5.7% in 2017 will depend on political and social developments, marked by the March 2016 presidential election.
• With Benin’s cities expanding, sustainable urbanisation through regional development hubs will require new funding, notably from private sources.
Growth, estimated at 5.2 % in 2015, down from 6.5 % in 2014, slowed for three main reasons: disruptions in electricity supply, less favourable rainfall and the slowdown in economic activity in neighbouring Nigeria. Inflation remained low due to the drop in oil and food prices. The government deficit widened, however, with an increase in public investment and current expenditure, leading to greater recourse to government securities.
Growth is forecast to reach 5.5% in 2016 and 5.7% in 2017 thanks to support for the agriculture sector and investment in infrastructure. Economic policy in 2016 and 2017 should work towards the Sustainable Development Goals for 2030. The political and social environment will be decisive in a context marked by the presidential election of March 2016. The vote threatened to raise tensions among political parties, although the risk of a political crisis or instability remained low.
The challenge of urbanisation must be addressed in order to ensure balanced development and reduce poverty. Urban growth, which has accelerated in recent years, creates challenges in terms of transit and pollution, as well as housing and land management. The authorities intend to promote sustainable urbanisation through the emergence of several regional development hubs that will require greater private-sector investment. Mechanisms to support public-private partnerships (PPPs) and access to banking for local communities therefore need to be promoted.
Macroeconomic indicators
2014 2015(e) 2016(p) 2017(p)
Real GDP growth 6.5 5.2 5.5 5.7
Real GDP per capita growth 2.7 2.7 2.6 2.6
CPI inflation -1.1 0.4 2.3 2.4
Budget balance % GDP -1.9 -4.3 -3.6 -3.7
Current account % GDP -7.2 -7.1 -7.1 -7.0
Source: Data from domestic authorities; estimates (e) and projections (p) based on authors’ calculations.

COUNtrY NOtES
271African Economic Outlook© AfDB, OECD, UNDP 2016270 African Economic Outlook © AfDB, OECD, UNDP 2016
boTsWAnA
• The pace of economic growth has slowed reflecting weak demand for mineral exports and a gloomy outlook for the global economy.
• Growth prospects look promising, but the weak pickup in global growth, subdued commodity prices and persistent electricity supply problems pose substantial downside risks.
• The country has experienced a rapid pace of urbanisation which has been associated with some environmental harm and is straining urban areas’ capacity to provide jobs, infrastructure and other essential amenities.
The Botswana economy rebounded in the last five years after a significant setback following the 2008 global economic downturn. However, the country’s pace of economic activity moderated in 2014, reflecting modest growth in mining and persistent electricity and water supply problems. Real gross domestic product (GDP) growth is estimated to have weakened further in 2015 mainly due to subdued demand for mineral exports on account of the gloomy global economy.
Despite this, Botswana’s growth prospects look promising, with real GDP growth projected to pick up slightly in 2016-17. The improvement in growth over the medium term is predicated on the government’s Economic Stimulus Programme (ESP), a gradual recovery in the global diamond market, and increased energy availability following the completion of remedial measures at Morupule B Power Station. The favourable outlook is also underpinned by expected growth in manufacturing following the commission, in 2015, of a steel manufacturing plant and a horticultural processing plant. Downside risks persist from the weak pickup in global economic growth and subdued commodity prices.
In keeping with the government’s fiscal stance targeting a balanced budget, fiscal operations resulted in a budget surplus in FY 2014/15 for the third successive financial year. The government also projected a budget surplus for FY 2015/16. However, government operations during the first half of FY 2015/16 resulted in a fiscal deficit. The deteriorating fiscal situation is on account of a decline in mineral exports receipts. Therefore, Botswana is expected to record a fiscal deficit in FY 2015/16 for the first time in four years.
Inflation continued to fall and breached the lower end of the Bank of Botswana’s medium-term target range in February, March, September and November 2015. Annual average inflation ended the year in 2015 much lower than in 2014, reflecting lower fuel prices and the government’s commitment to prudent monetary policy.
Botswana has experienced a high rate of urbanisation, with nearly two-thirds of the country’s total population now living in urban areas. Although rural-urban migration and natural population increase have played a role in urban population increase, the positive trend is mainly due to the reclassification of some villages to urban settlements.
Macroeconomic indicators
2014 2015(e) 2016(p) 2017(p)
Real GDP growth 4.4 2.5 3.2 3.5
Real GDP per capita growth 2.4 0.6 1.4 1.7
CPI inflation 4.4 3.1 4.5 4.3
Budget balance % GDP 5.6 3.6 -2.8 -2.3
Current account % GDP 15.7 16.0 5.6 5.2
Source: Data from domestic authorities; estimates (e) and projections (p) based on authors’ calculations.

COUNtrY NOtES
272 African Economic Outlook © AfDB, OECD, UNDP 2016
buRKInA FAso
• Economic growth is expected to reach at least 5% in 2016 and 5.9% in 2017 due to the recovery of mining and the return to democratic institutions.
• Strengthening security to combat jihadist threats is still a major challenge to economic revival, especially after the January 2016 terrorist attack.
• Urban growth has speeded up in the past decade and the urban population could reach 35% of the total by 2026, but towns and cities are still poorly equipped to sustainably manage this growth.
Economic prospects for 2016 are good, with overall growth forecast at 5.0% (slightly up from 4.8% in 2015) thanks to the return of democratic institutions after the 2015 elections and the resumption of mineral production. Inflation should remain modest (about 2% in 2016 and 2017) due to a good harvest and low world oil prices.
This growth rate is still far from the robust 2010-13 period, when it was well above an annual 6%. The economy has been damaged since 2014 by the political transition following the October 2014 popular uprising and two factors that are likely to persist in 2016: a drop in gold and cotton prices and higher defence spending in the final quarter of 2015.
Economic prospects also still depend on the new democratically elected government’s ability to foster political peace to ensure institutional stability. Stronger security measures to tackle jihadist threats remain a major challenge too, especially after the January 2016 terrorist attack. Although the poverty rate fell to 40.1% in 2014 (from 46.7% in 2009), the social situation remains worrying, with vast inequalities, so poverty is a source of future uncertainty, along with unemployment and under-employment among urban youth and women.
Burkina Faso is one of the world’s least urbanised countries, but its towns and cities have grown more quickly in the last decade. Urban-dwellers were 22.7% of the population in 2014 and could reach 35% in 2026. Weak urban governance has produced slums, and the country faces economic, ecological and infrastructural challenges. The dual land management system may seriously threaten national development policy. Large towns and cities are poorly equipped for sustainable development, and the economies of second-category urban areas are dominated by raw materials production, which is an obstacle to real efforts to turn them into centres of sustainable development.
Macroeconomic indicators
2014 2015(e) 2016(p) 2017(p)
Real GDP growth 5.0 4.8 5.0 5.9
Real GDP per capita growth 2.1 1.8 2.1 3.0
CPI inflation -0.3 0.8 2.0 1.9
Budget balance % GDP -1.8 -2.5 -3.1 -3.7
Current account % GDP -6.1 -4.5 -5.3 -6.9
Source: Data from domestic authorities; estimates (e) and projections (p) based on authors’ calculations.

COUNtrY NOtES
273African Economic Outlook© AfDB, OECD, UNDP 2016272 African Economic Outlook © AfDB, OECD, UNDP 2016
buRundI
• Burundi achieved average annual growth of 4% between 2010 and 2014, but due to the social and political environment in 2015, the growth rate fell and GDP is estimated to have dropped by 4.1%.
• The deterioration in public finances led to large-scale recourse to advances from the central bank (Banque de la République du Burundi) to finance the budget deficit in 2015.
• Continuation of the current socio-political climate and the accompanying fall in support from donors could do serious damage to the country’s remarkable advances in development and poverty reduction since 2005.
The socio-political strains from which Burundi has suffered since April 2015 have created major difficulties for economic activity, which has slowed markedly, interrupting the growth dynamic of the start of this century. Latest estimates suggest that growth of real gross domestic product (GDP) was negative, at around -4.1% in 2015 as against 4.7% in 2014 and 4.5% in 2013. This contraction was chiefly the consequence of a drop in activity in the secondary sector, in particular in industry and construction. Inflation remained steady at an average 5.5% in 2015, compared with 4.4% in 2014, thanks to the relative stability of the exchange rate, good harvests and the continuing drop in international oil prices. In respect of the budget, Burundi continues to suffer from a weak mobilisation of internal resources (11.7% of GDP in 2015 compared with 12.9% in 2014 and 13.1% in 2013) and from a substantial fall in foreign aid (-33% in 2015), according to the Finance Ministry. The budget deficit rose from 1.2% of GDP in 2014 to 5.7% in 2015. The deterioration in the public finances was strongly reflected in the accounts of the central bank (BRB), in particular with a steep fall in the official reserves (less than two months of import cover in 2015, compared with four months in 2014), mainly because of broad government recourse to BRB advances to finance the deficit. This financing, which amounts to an injection of liquidity into the economy, resulted in a greater demand for foreign exchange. The current account deficit, transfers included, is estimated at 4.5% of GDP in 2015 compared with 9.5% of GDP in 2014.
The implementation of the second-generation strategic framework for growth and poverty reduction, adopted in February 2012, brought significant progress in human development. The present political context, however, could call into question much of what has been achieved. The prolonged absence of support from technical and financial partners has negative consequences for the country and risks endangering the progress that has been made, particularly in social dimensions. Renewed engagement by these participants is largely dependent on a political solution to political tensions, which would make it possible to avoid an even more serious deterioration in the socio-economic situation. The whole international community is worried by the persistent tensions in the country, which also carry risks for the entire sub-region. Several Western countries have already announced the suspension of support to Burundi. Furthermore, the problems observed in 2015 surrounding the implementation of reforms supported by the extended credit facility (ECF) could also have a negative impact on the budget in the short and medium term.
Macroeconomic indicators
2014 2015(e) 2016(p) 2017(p)
Real GDP growth 4.7 -4.1 3.3 4.4
Real GDP per capita growth 1.4 -7.4 0.0 1.0
CPI inflation 4.4 5.5 7.5 6.7
Budget balance % GDP -1.2 -5.7 -2.2 -2.1
Current account % GDP -9.5 -4.5 -6.0 -6.6
Source: Data from domestic authorities; estimates (e) and projections (p) based on authors’ calculations.

COUNtrY NOtES
274 African Economic Outlook © AfDB, OECD, UNDP 2016
cAbo VERdE
• Cabo Verde’s real GDP growth increased to 3.6% in 2015 from 1.8% in 2014 and 0.8% in 2013 as tourism receipts increased, domestic demand improved and energy prices remained low. However, the economy is still underperforming due to deflation and high unemployment.
• While government deficit has narrowed from previously high levels, fiscal consolidation remains a priority to reduce the risk of debt distress, reassure investors and safeguard macroeconomic stability.
• Despite Cabo Verde’s insularity and unequal distribution of the population across islands, its urban renewal can drive structural transformation by providing informal and micro-entrepreneurs opportunities to upgrade and expand their market reach.
Cabo Verde’s economic recovery remains feeble due to the weak global economy and domestic vulnerability. Tourism and tourism-related foreign investment, including construction, continue to be the main engines of growth. In fact, economic growth recovered to around 3.6% in 2015 (from 1.8% in 2014 and 0.8% in 2013) due to the return of foreign direct investment (FDI) – which grew by 13% in 2014 – especially in tourism. However, economic activity is still catching up with its potential. In addition to public sector efficiency, Cabo Verde’s long-term growth depends on bolstering productivity. In 2016 and 2017, growth is expected to recover to an average rate of 4%, below the rate of the boom years before the global financial crisis.
The fiscal situation improved slightly in 2015 due to public investment programme (PIP) phase-out, yet it remains vulnerable. The overall central government deficit is expected to fall in 2015 to 4.5% (from 7.4% in 2014), and again in 2016 to 4%. Challenges also remain to find the appropriate policy path given debt sustainability requirements and a need to improve economic growth. Public debt is expected to reach 118% of GDP in 2015 from 94.7% in 2013. While external public debt is high (76.2% of total public debt in 2015), it remains overwhelmingly concessional, and debt service indicators show that the country shall remain comfortable in servicing its future debt obligations.
Cabo Verde’s urban population accounts for about 65% of the country’s 514 000 population. The high rate of urbanisation is due mostly to rural-urban migration. Although the increase in the rate of urbanisation is a source of social problems, it also presents an opportunity for informal and micro-entrepreneurs to upgrade and expand their market reach. With a remarkable literacy rate exceeding 85%, Cabo Verde has the foundation for an economic lift-off driven by a robust urban population with skills for a competitive private sector. The country’s urban renewal can therefore be an important driver of structural transformation in the years ahead.
Macroeconomic indicators
2014 2015(e) 2016(p) 2017(p)
Real GDP growth 1.8 3.6 4.0 4.0
Real GDP per capita growth 0.5 2.4 2.8 2.7
CPI inflation -0.2 0.0 1.6 2.7
Budget balance % GDP -7.4 -4.5 -4.0 -3.8
Current account % GDP -8.0 -9.0 -9.8 -10.4
Source: Data from domestic authorities; estimates (e) and projections (p) based on authors’ calculations.

COUNtrY NOtES
275African Economic Outlook© AfDB, OECD, UNDP 2016274 African Economic Outlook © AfDB, OECD, UNDP 2016
cAmERoon
• Cameroon’s economy grew by a brisk 5.7% in 2015, led mainly by the secondary sector.
• In the current context of declining oil prices, the country must rationalise public investment and improve the effectiveness of its expenditure.
• Urbanisation has had a positive impact on poverty reduction, but more proactive policies are needed to diminish inequalities and imbalances.
In 2015, Cameroon’s economy, the engine of the Central African Economic and Monetary Community (CAEMC), continued to prove resilient despite an unfavourable global economic context (stagnation in the Organisation for Economic Co-operation and Development [OECD] member countries, slowdown of growth in China and in several emerging countries, and a fall in oil prices and in the country’s export earnings). The region is facing persistent pockets of insecurity at its northern and eastern borders because of the threat of Boko Haram and the crisis in the Central African Republic. Cameroon’s growth in 2015 has been estimated at a solid 5.7%, led mainly by the secondary sector, which grew by 8.4%. The tertiary sector grew by 5% and the primary sector by 4.9%. Oil production, which makes the country a net oil exporter, rose by an exceptional 28.3% as new fields began production. The construction sector also grew, by 7.3%.
Fiscal policy remained moderately expansionary, in line with the furtherance of major infrastructure projects. The 2015 budget, like those of 2013 and 2014, was developed and implemented under the programme-budgeting method. Monetary policy was aimed at stabilising prices and the real effective exchange rate by preventing public expenditure from crowding out private investment. Inflation increased in 2015 by 0.8 of a percentage point to 2.7% because of the rising price of fuel at the pump, itself due to a 40% cut in subsidies to oil products in July 2014, but remained under the 3% CEMAC convergence criterion.
Macroeconomic indicators
2014 2015(e) 2016(p) 2017(p)
Real GDP growth 5.9 5.7 5.3 5.1
Real GDP per capita growth 3.4 3.2 2.8 2.6
CPI inflation 1.9 2.7 2.2 2.1
Budget balance % GDP -3.9 -5.3 -5.7 -4.9
Current account % GDP -15.2 -14.0 -14.6 -15.0
Source: Data from domestic authorities; estimates (e) and projections (p) based on authors’ calculations.

COUNtrY NOtES
276 African Economic Outlook © AfDB, OECD, UNDP 2016
cEnTRAl AFRIcAn REPublIc
• The economic upturn that began in 2014 continued in 2015, but was then interrupted by the resurgence of the security and political crisis, resulting in economic growth of 4.1% of real GDP compared with an initial forecast of 5.5%.
• The political transition was completed when presidential and legislative elections were held, with former Prime Minister Faustin-Archange Touadéra being elected president in the second round of voting.
• The huge movement of people that followed the March 2013 crisis has exacerbated the challenges linked to urban planning and development of the territory.
The upturn in economic activity that began in 2014 was confirmed during the first nine months of 2015, but its dynamism was interrupted by the resurgence of cross-community violence at the end of September. The worsening security environment held back growth of real gross domestic product (GDP) to an estimated 4.1% in 2015, compared with an initial target of 5.5%. Even so, the economy grew faster than in 2014, when growth of 1.0% was recorded. Most sectors accelerated in 2014, even though the export sector continued to suffer from the country’s suspension from the Kimberley Process. This measure effectively means that there is a ban on the export of diamonds, although the restrictions were partly lifted in July 2015. In spite of this difficult climate, there was a significant improvement in the management of public finances thanks in particular to the substantial efforts undertaken by the transition authorities and the support of the technical and financial partners (TFP). Most of the quantitative targets of the budget were achieved, with a progressive return to the normal procedure for public expenditure and greater transparency in the management of public resources.
Presidential and legislative elections were important events in 2015, with Faustin-Archange Touadéra being elected president. Touadéra previously served as prime minister during François Bozizé’s presidency. The vote was organised in an unpredictable security environment and uncertain political climate, but brought an end to the transition process that began three years earlier. These elections followed the Bangui Forum in June 2015, which was concluded by the signing of the Republican Pact for Peace, National Reconciliation and Reconstruction of the Central African Republic (CAR) and by the adoption of a new constitution in November 2015. Overall conditions in the social and humanitarian areas were relatively stable for part of 2015, but deteriorated amid fresh outbreaks of cross-community violence, which claimed many victims and swelled the number of people displaced both inside and outside the country.
The state of affairs in the country’s urban areas was greatly affected by the political and security crisis, which particularly damaged prospects for the development of towns and cities. A study is underway to redesign urban development and planning in Bangui, with the aim of bringing structure to its breakneck urbanisation and establishing a healthy housing environment.
Macroeconomic indicators
2014 2015(e) 2016(p) 2017(p)
Real GDP growth 1.0 4.1 5.2 6.0
Real GDP per capita growth -1.0 2.1 3.2 4.0
CPI inflation 11.6 5.6 4.7 4.0
Budget balance % GDP 3.2 -3.2 -2.8 -2.3
Current account % GDP -6.1 -11.5 -5.1 -4.0
Source: Data from domestic authorities; estimates (e) and projections (p) based on authors’ calculations.

COUNtrY NOtES
277African Economic Outlook© AfDB, OECD, UNDP 2016276 African Economic Outlook © AfDB, OECD, UNDP 2016
cHAd
• Economic growth reached an estimated 4.1% in 2015, possibly falling to only 2.6% in 2016 due to the collapse in oil prices and a steep fall in export revenues.
• The need to maintain internal and external balances in 2016 makes budgetary consolidation indispensable in the face of numerous financial, social, security and humanitarian challenges.
• Among other things, work towards structural transformation of the economy is driven by an integrated development strategy in the urban centres, especially through planning, promoting decent housing and equitable access to social services.
The Chadian economy, which is particularly dependent on the oil industry, is likely to experience a serious slowdown in 2016. After reaching 6.3% in 2014, GDP growth could fall to 4.1% in 2015 and then to 2.6 % in 2016, mainly due to the collapse in oil prices on international markets. This sharp decline could result in a significant reduction in the level of public investment, particularly in the extractive sector, and lead to a fall in domestic demand in 2016 and 2017. Agriculture’s poor performance is likely to worsen the unfavourable economic situation. This important sector of the economy suffered from a lack of rainfall in 2015, resulting in a sharp decline in cereal production of around 12% according to government estimates. The Chadian state’s capacity to implement the public investment programmes in its economic policy is being severely challenged. The significant expenditure in 2015 on meeting the threats and violence of the terrorist sect Boko Haram and jihadist movements also affected the country’s economy. In 2015, the inflation rate could rise from the 1.7% recorded in 2014 to reach 4.0%, breaching the community standard of 3.0% for the Central African Economic and Monetary Community (CEMAC), before falling to 2.6% in 2016. The main causes are disturbances to the country’s supply chains and exports related to the security situation. Preserving the country’s economic gains, especially the benefits of achieving the Heavily Indebted Poor Countries (HIPC) target in late April 2015, makes prudent debt management essential now, given the current highly volatile oil prices.
The structural transformation of the country’s emerging economy – which remains one of the government’s major objectives – faces many obstacles, including the inefficient organisation of urban spaces. Better spatial inclusion would enable them to become effective centres of production and thereby contribute to job creation, strengthening the country’s social cohesion and the resilience of its economy.
Macroeconomic indicators
2014 2015(e) 2016(p) 2017(p)
Real GDP growth 6.3 4.1 2.6 4.9
Real GDP per capita growth 2.9 0.8 -0.6 1.7
CPI inflation 1.7 4.0 2.7 4.0
Budget balance % GDP -4.7 -6.4 -7.0 -7.4
Current account % GDP -8.9 -9.9 -8.6 -8.5
Source: Data from domestic authorities; estimates (e) and projections (p) based on authors’ calculations.

COUNtrY NOtES
278 African Economic Outlook © AfDB, OECD, UNDP 2016
comoRos
• The energy crisis restrained economic growth to under 1.1% in 2015.
• Saudi Arabian budget support and the resumption of electricity generation should push growth to 4.1% in 2016 and 2017.
• As a small-island developing state, rapid urbanisation is a threat to peace in the Comoros, where there are few job opportunities for young people.
Since reaching its completion point under the Heavily Indebted Poor Countries (HIPC) Initiative in December 2012, the Comoros has returned to economic growth. Nevertheless, the archipelago still faces major obstacles, including a poorly diversified economy, electricity shortages and vulnerability to external shocks. The power generation crisis penalises tax-paying sectors such as importers of frozen goods and large retail outlets, which have accumulated salary arrears. Despite these constraints, the Comorian economy has rebounded, with positive growth rates since 2012. Growth in 2016 will depend largely on two factors: the political climate, with presidential elections taking place in April, and the solutions adopted in response to the energy crisis. The International Monetary Fund (IMF) initially projected growth of 2.2% in 2016, but that was before the Comoros received huge budget support from Saudi Arabia on 31 December and Chinese technical assistance for the energy sector to the tune of EUR 4 million. Forecasters are now projecting 4.1% growth in 2016 and 2017 thanks to the gradual recovery of electricity generation, and more importantly, the impact of Saudi Arabian budget support on household consumption.
The political situation is still marked by the electoral process that began in February 2015, when a general election, municipal elections, and island council elections were held. This process concluded with the second round of presidential elections on 18 April 2016 on all the islands. The first round took place on 21 February only on Grande Comore, which will hold the rotating presidency until 2021. The latest rulings by the Constitutional Court on the eligibility of candidates confirmed that democracy is established.
The Comoros moved up five places to 154th out of 189 countries in the 2016 edition of the World Bank’s annual Doing Business report. Some 45% of the population live below the poverty line, and the Comoros is ranked 159th out of 187 countries in the United Nations Human Development Index, falling well short of achieving the Millennium Development Goals (MDGs).
Macroeconomic indicators
2014 2015(e) 2016(p) 2017(p)
Real GDP growth 0.6 1.1 4.1 4.1
Real GDP per capita growth -1.8 -1.3 1.7 1.8
CPI inflation 2.9 2.1 2.2 2.6
Budget balance % GDP -0.7 -1.2 -2.2 -1.7
Current account % GDP -6.1 -7.4 -6.9 -7.9
Source: Data from domestic authorities; estimates (e) and projections (p) based on authors’ calculations.

COUNtrY NOtES
279African Economic Outlook© AfDB, OECD, UNDP 2016278 African Economic Outlook © AfDB, OECD, UNDP 2016
conGo
• After rebounding to about 6% in 2014, growth fell back to 1.2% in 2015 but should reach 4.2% in 2016, though prospects could be affected by persistent low prices for oil.
• The speed and range of structural reform and of the diversification of the economy are still not enough to improve significantly the country’s social indicators and to achieve the Millennium Development Goals.
• Despite great potential, urban areas are not yet driving economic structural transformation and the national urban strategy still has to be developed to tackle the problems of rapid urban growth.
Growth slipped to 1.2% in 2015 (from 6% in 2014) because of a sharp fall in the world price of oil (60% of the country’s gross domestic product [GDP]) and slower expansion of the non-oil sector caused by less government investment. Inflation was stable at around 0.9%. Budget policy was tighter because of lower government revenue but the primary deficit still reached 9.3% of GDP in 2015. The current account deficit widened (with lower oil prices) from 2.6% of GDP in 2014 to 14.5% in 2015. Overall growth should be 4.2% in 2016 and 4.7% in 2017, driven by greater oil production from new wells and by robust transport and agriculture sectors. But fluctuating oil prices could upset these predictions.
Congo’s score on the UN Human Development Index improved slightly from 0.564 in 2013 to 0.591 in 2014, but the country’s social indicators remain below those of African states with similar income levels. Poverty fell from 50.7% of the population in 2005 to 40.9% in 2011 but is still higher than average for middle-income countries. Unemployment is high, affecting in particular 30% of young people between the ages of 15 and 29, because of the capital-intensive nature of the oil sector and the weakness of the non-oil private sector. Significantly improving social indicators is a major challenge and requires stronger and more inclusive growth, along with faster structural reform and economic diversification. This is urgent, especially because of rapid urban growth.
Congo is one of Africa’s most urban countries, with more than two-thirds of the population living in towns and cities. The chief motor for urban growth is the concentration of public services and economic activity in the two big cities, Brazzaville and Pointe-Noire. The urban economy supplies 80% of GDP, mainly from oil production at Pointe-Noire and administration and services based in Brazzaville. Urban areas have great economic potential but have not developed to drive the economy because of inadequate access to basic social services for a growing population; inadequate infrastructure that reduces urban mobility; unplanned urban spread; high unemployment (16%); and insufficient funding. The government aims to tackle these problems with the 2012-16 national development plan (PND) and has increased funding of the towns and cities (through its programme of “accelerated municipalisation”) which aims to build major social and administrative infrastructure there. But much remains to be done and the government needs to take on the challenges represented by towns and cities by coming up with a national urban development strategy that remains to be drawn up and complete town planning blueprints being drafted.
Macroeconomic indicators
2014 2015(e) 2016(p) 2017(p)
Real GDP growth 6.0 1.2 4.2 4.7
Real GDP per capita growth 3.5 -1.4 1.6 2.1
CPI inflation 3.0 0.9 1.5 1.0
Budget balance % GDP -4.8 -9.6 -1.8 1.3
Current account % GDP -2.6 -14.5 -12.4 -9.6
Source: Data from domestic authorities; estimates (e) and projections (p) based on authors’ calculations.

COUNtrY NOtES
280 African Economic Outlook © AfDB, OECD, UNDP 2016
conGo, dEm. REP.
• The growth of the Congolese economy slowed in 2015, falling to 7.7% from 9.2% in 2014, a trend set to continue in 2016 (7%), with a recovery expected to start in 2017 (8%).
• Poverty remains widespread, although the country has made significant progress in implementing the Millennium Development Goals (MDGs), moving up 11 spots in the 2014 world ranking of the Human Development Index (HDI).
• The country faces significant challenges in the planning and financing of urban development in order to improve quality of life and to capitalise on the opportunities provided by urbanisation.
In 2015, economic growth was 7.7%, down from 9.2% in 2014, and below the 10.3% growth initially projected. The growth was supported by the extractive and manufacturing industries, transport, and telecommunications. Inflation was held at 0.8% and the exchange rate of the Congolese franc (CDF) to the United States dollar (USD) remained stable, fluctuating by 0.2%. Despite the drastic fall in the price of raw materials,1 macroeconomic stability was preserved due to a tightening of tax revenue, international reserves and an increase in the current account deficit. Economic activity is expected to slow slightly to 7.0% in 2016 before climbing to 8.0% in 2017, due to a recovery of mining prices, expected from 2017, and the positive effects of structural reforms and the rebuilding of infrastructure. To strengthen the economy’s stability and resilience to shocks, in January 2016 the government adopted 28 urgent measures, and as part of the strategic national plan for development (PNSD) currently being drawn up, it decided to diversify the country’s economy and to broaden the value creation chain.
On social issues, although the Democratic Republic of the Congo (DRC) did not achieve the Millennium Development Goals (MDGs) by the end of 2015, it did make significant progress, although considerable challenges still remain. Despite the fragile political and security context, the incidence of poverty fell from 80% in 1990 to 63.4% in 2012. The continual increase in the national budget allocated to social sectors led to an increase in the enrolment, literacy and primary school-completion rates; a significant reduction in infant and maternal mortality; and improved electricity provision and access to water, sanitation and housing. This progress led to the country improving on the Human Development Index (HDI), moving from 0.329 in 2000 to 0.439 in 2014, thus climbing 11 spots in the 2014 world ranking. The holding of free, democratic elections planned for 2016, within the constitutional deadline, is the country’s main political challenge to consolidate the achievements of the democratic process that began in 2006.
Although urbanisation is viewed as an opportunity by the Congolese authorities, it faces a real challenge in terms of the planning and financing of urban development. Urban areas dominate the national economy and offer better living conditions than rural areas. However, there are risks associated with current urbanisation trends in the DRC: an increase in unplanned and informal neighbourhoods, poor quality of urban transport and congestion in cities, and limited access to social infrastructure. The country does not have a national urbanisation strategy, although it does have some measures and ongoing national initiatives which could directly or indirectly contribute to urban development, especially the land-use planning reform, construction projects for special economic zones and agro-industrial parks.
Macroeconomic indicators
2014 2015(e) 2016(p) 2017(p)
Real GDP growth 9.2 7.7 7.0 8.0
Real GDP per capita growth 6.0 4.5 3.8 4.9
CPI inflation 1.0 0.8 2.1 2.5
Budget balance % GDP 0.5 -0.5 -0.7 1.0
Current account % GDP -9.2 -8.7 -10.8 -13.9
Source: Data from domestic authorities; estimates (e) and projections (p) based on authors’ calculations.
1. The price of copper traded on the London Metal Exchange (LME) lost 28% of its value between December 2014 and December 2015. Oil, cobalt and gold lost respectively 38.26%, 28.35% and 10.70% of their value over the same period.

COUNtrY NOtES
281African Economic Outlook© AfDB, OECD, UNDP 2016280 African Economic Outlook © AfDB, OECD, UNDP 2016
cÔTE d’IVoIRE
• The economy grew strongly for the fourth straight year in 2015, with booming agriculture, a better business climate, returning investors, but also international uncertainty; these trends should continue in 2016 and 2017.
• The incumbent president was re-elected in October 2015 in a peaceful vote that was a big step in consolidating peace and economic confidence in the country.
• Towns and cities have emerged because of the physical expansion of exported raw-material areas, but these urban centres are not very attractive because of poor electricity supply, inadequate logistics and fragmented regional policies.
Economic growth remained strong despite international uncertainty, estimated at 8.8% in 2015, close to previous years (8.7% in 2013 and 7.9% in 2014) according to the African Development Bank (AfDB). It was driven by agriculture, investment, services and an improved business climate. This performance is projected to continue in 2016 (at 8.6%) and 2017 (at 8.3%). The government intends to continue its efforts, after the success of the 2012-15 national development plan (PND), to make Côte d’Ivoire an emerging country by 2020 and see that growth is more inclusive.
Budget policy focused on increased investment as well as funding other post-conflict development needs. The primary account was nearly balanced in 2014 and 2015, while the overall deficit was around 3% of gross domestic product (GDP). Inflation was 1.5% in 2015, loans to the private sector increased, and foreign reserves remained strong. The current account deficit was expected to widen from 2.5% of GDP in 2015 to 3% in 2016 due to more investment in exports and infrastructure.
The improved business and macroeconomic environment boosted investment with more firms set up, a greater flow of foreign direct investment (FDI) and growth of public-private partnerships (PPP), which need to be better implemented for a fairer distribution of risks. Problems remain in taxation and in access to land titles and funding.
The October 2015 presidential election was a landmark in the consolidation of political peace, with incumbent President Alassane Ouattara re-elected in the first round with 83.7% of the vote. The main challenges of his new five-year term will be to ensure social cohesion, strengthen civil peace and improve the justice system. Access to healthcare and education has increased.
The 2014 census showed that 49.7% of Ivorians lived in towns and cities, including 19.4% in Abidjan where most economic activity is. Except for Abidjan, most urban areas are not very attractive for want of formal planning. Three ongoing projects may change this: investment to double electricity output by 2020, an urban plan for the Abidjan district and upgrading the road between Bamako and San Pédro.
Macroeconomic indicators
2014 2015(e) 2016(p) 2017(p)
Real GDP growth 7.9 8.8 8.6 8.3
Real GDP per capita growth 5.4 6.3 6.2 5.9
CPI inflation 0.4 1.5 1.8 1.9
Budget balance % GDP -2.3 -3.5 -3.4 -3.8
Current account % GDP -2.3 -2.5 -3.0 -3.9
Source: Data from domestic authorities; estimates (e) and projections (p) based on authors’ calculations.

COUNtrY NOtES
282 African Economic Outlook © AfDB, OECD, UNDP 2016
djIbouTI
• Growth of about 7.4% is forecast for 2016, compared to 6.7% in 2015 and 6% in 2014, an improvement which has not prevented widespread poverty or unemployment.
• The budgetary deficit improved in 2015, but the country’s level of debt remains critical, with a service economy centred on transport.
• Activities and jobs are largely concentrated in the capital, which has led the government to contemplate the development of economic hubs in the country’s interior.
Djibouti has a dual economy. On the one hand, it has a modern sector, based on rental revenue from the ports and military bases rented by foreigners. On the other hand, it still has a large informal sector. The economy is focused on services, in particular transport and related services, due to the country’s geostrategic position on the Gulf of Aden, at the intersection of maritime corridors important to the transport of goods and oil. The construction, hotel and telecommunication sectors are growing but are not yet significant. The Chinese investment of the past three years could change the economy’s structure, given the development of special economic zones (SEZs) to attract processing industries as part of global value chains.
Djibouti is developing its infrastructure, particularly its ports, to promote rapid growth and reduce poverty. Led by major investment projects, the growth of recent years (6.7% in 2015 and 6% in 2014) will continue, with rates of 7.4% and 7.1% forecast for 2016 and 2017. Despite this upturn, extreme poverty and unemployment remain endemic. Critically, Djibouti’s debt was 65.8% of GDP in 2015 and is expected to reach 75.8% in 2016 before reaching the 79% threshold in 2017, placing the country at high risk of over-indebtedness.
To face these challenges, since March 2014 a new strategic framework, Djibouti Vision 2035, is aimed at the country’s economic emergence by that date. Its first medium-term product is a five-year strategy for rapid growth and job creation (Stratégie de croissance accélérée et de promotion de l’emploi, Scape), launched in August 2015.
Macroeconomic indicators
2014 2015(e) 2016(p) 2017(p)
Real GDP growth 6.0 6.7 7.4 7.1
Real GDP per capita growth 4.7 5.4 6.1 5.8
CPI inflation 3.0 3.1 3.3 3.4
Budget balance % GDP -10.5 -6.7 -5.8 -5.8
Current account % GDP -25.6 -16.0 -14.0 -12.8
Source: Data from domestic authorities; estimates (e) and projections (p) based on authors’ calculations.

COUNtrY NOtES
283African Economic Outlook© AfDB, OECD, UNDP 2016282 African Economic Outlook © AfDB, OECD, UNDP 2016
EGyPT
• Economic outlook for Egypt in 2016 remains cautiously optimistic, partly based on the government’s ability to deliver on expectations, as well as effective implementation of the Sustainable Development Strategy and ongoing macroeconomic reforms.
• Growth is expected to accelerate, conditional on improved investor confidence, although global economic headwinds present challenges to the outlook.
• Overall, success will be demonstrated by effectively addressing long-standing domestic challenges of low and non-inclusive growth, and the implications of high population on the sustainability of urban growth.
There has been a lengthy political transition following President Mubarak’s removal from office in 2011. The formal “political roadmap” has now been completed. A fragile security situation, however, reflects the fight against radical Islamists. Meanwhile, growth has been steadily picking up, driven by the gas, manufacturing and real estate sectors, alongside an increase in foreign direct investment (FDI). But tourism performance weakened following the bombing of a Russian tourist aircraft at the end of October 2015, and import-dependent industries faced foreign exchange shortages, resulting in reduced activity. The cautiously optimistic 2016 economic outlook is largely based on the government’s ability to deliver on its policy reforms and growth strategy.
Throughout 2015 the authorities faced continuing policy pressures. Recent sluggish economic growth and an expansionary fiscal policy led to the fiscal deficit remaining large. In response, the government’s fiscal consolidation exercise aims to increase revenues and rationalise expenditures, with savings directed towards social safety nets. To finance the deficit, the government borrowed heavily, which pushed domestic debt up significantly, crowding out the private sector. Faced with these strains, the Central Bank of Egypt (CBE) laboured with some success to strike a balance between curbing inflationary pressures and boosting growth while keeping the exchange rate steady. The CBE may decide to ease monetary policy in the rest of 2016 to prevent growth from slowing. However, a tight stance will be needed to support the Egyptian pound (EGP), given the sharp fall in foreign exchange reserves.
On the assumption that the government continues to implement its economic reform programme, the prospects for 2016 and beyond suggest a steady recovery. Success in stabilising the economy and boosting growth will be demonstrated by lowering the fiscal deficit while at the same time increasing pro-poor spending; managing price stability in a context of exchange rate uncertainty; increasing meaningful employment (especially among the young); enhancing the business environment; and improving security and strengthening social justice.
Egypt continues to work towards achieving sustainable cities and structural transformation. However, strains are evident, such as Egypt’s high population growth that has major implications for the sustainability of urban growth. As job-seekers move to urban areas, city populations will rise, adding more strains on urban infrastructure. Moreover, urbanisation has a direct impact on Egypt’s food security, given urban sprawl has overrun crop-growing areas. The government of Egypt has financed several new projects in response to urban growth. These include those in Upper Egypt, northwest coast and along the new Suez Canal.
Macroeconomic indicators
2013/14 (e) 2014/15(p) 2015/16(p) 2016/17(p)
Real GDP growth 2.2 4.2 4.3 4.5
Real GDP per capita growth 0.0 2.0 2.2 2.4
CPI inflation 10.8 11.2 8.8 10.2
Budget balance % GDP -12.2 -11.5 -9.6 -8.7
Current account % GDP -0.9 -3.7 -1.1 -1.4
Source: Data from domestic authorities; estimates (e) and projections (p) based on authors’ calculations.

COUNtrY NOtES
284 African Economic Outlook © AfDB, OECD, UNDP 2016
EquAToRIAl GuInEA
• GDP fell by 10.2% in 2015 due to the drop in oil prices, and according to the latest forecasts it will contract by 8% in 2016.
• The government, aware of financial imbalances, took major steps in May 2015 to reduce public investment by half and make drastic cuts in government operating costs.
• Equatorial Guinea’s strong dependence on petroleum has enabled it to use oil revenues to carry out structural changes over the last 15 years and implement a housing policy for new homes and better access to water and electricity.
The drop in oil prices since July 2014 has caused a recession. Oil and gas production fell by 10%, compared to 2014, to around 165 000 barrels a day in 2015. The non-oil economy, although in relative growth with respect to the rest of the economy, is nonetheless in decline. The recession, corresponding to a drop of 10.2% of GDP in 2015, is likely to continue until 2020 because of unfavourable forecasts for crude oil prices. While difficult to quantify, domestic government arrears and lower public investment tend to reduce fiscal space and constrict growth in the non-oil economy.
The importance of oil and gas (90% of GDP, 87% of fiscal revenues and 89% of exports) in the economy meant that the drop in oil prices had a spillover effect on public investment spending, which, at XAF 1 951 billion (CFA francs) in 2015, accounted for 86% of all public expenditure and is the engine of growth. The Amending Finance Law of May 2015 was based on an oil price of USD 40 per barrel, but further falls to close to USD 30 per barrel in January 2016 risk exacerbating budgetary pressures. Major steps have been announced for optimising revenues through fiscal reform and a reduction in tax exemptions. At the same time, spending is being reduced through controls on government operating costs. Moreover, the authorities have expressed their desire to return to balanced budgets in the coming years, in accordance with the second phase of the National Programme for Economic and Social Development (PNDES) 2013-17, which calls for less public investment.
The country’s proactive policy on urbanisation and housing improvement is ambitious. The new city of Djibloho, in the centre of mainland Equatorial Guinea, will be created under the framework of the policy of regrouping the populations of the main cities – Malabo, Bata, Mongomo, Ebebiyin, Evinayong and Luba. A complementary approach was taken in drafting the master plans for roads, housing and social infrastructure in order to improve the quality of urban life through economies of scale. Implementation of these plans will need to take account of the drop in oil revenues.
Macroeconomic indicators
2014 2015(e) 2016(p) 2017(p)
Real GDP growth 2.3 -10.2 -8.0 -3.4
Real GDP per capita growth -0.7 -13.2 -10.9 -6.3
CPI inflation 4.3 3.6 2.6 2.3
Budget balance % GDP -6.8 -6.9 -7.3 -9.0
Current account % GDP -10.0 -7.1 -2.3 -1.8
Source: Data from domestic authorities; estimates (e) and projections (p) based on authors’ calculations.

COUNtrY NOtES
285African Economic Outlook© AfDB, OECD, UNDP 2016284 African Economic Outlook © AfDB, OECD, UNDP 2016
ERITREA
• Growth is projected at 0.3% in 2015, from 1.7% in 2014 and 1.3% in 2013, reflecting challenges in the business and investment environment, and a poor global economic environment.
• The government’s commitment to strengthening public financial management and natural-resource management through the African Development Bank’s technical assistance has helped to create favourable medium-term prospects.
• Eritrea has been promoting urbanisation but this is limited by financial capacity and a shortage of urban housing.
In the 22 years since independence in 1993, the Government of the State of Eritrea (GoSE) has prioritised investments in infrastructure (communication networks, energy, and water facilities); agriculture (mainly for food security); marine resources; social and other services; and manufacturing. In 2016, GoSE priorities are human-resource development; investment in machinery and equipment; transport and communication facilities; water supply; energy; and essential social services. The government is also creating an attractive environment for the active participation of local and foreign private investors. However, these efforts are being severely curtailed by unresolved border issues, the government’s relatively substantial spending on security, the UN sanctions and macroeconomic instability. Real gross domestic product (GDP) growth is projected to slow from 1.7% in 2014 to 0.3% in 2015 because of slower economic activity and increasing challenges in the global market. However growth should recover in 2016 to 2.2%. Over the medium term, the government sees further prospects in improved trade with Middle-Eastern and Asian countries, additional mining activities, growth in the food sector, and the development of tourism. The GDP is heavily based on services (59.2%), with a very small manufacturing sector (6%). Agriculture, hunting, forestry and fisheries constitute 17.2% of GDP.
The budget deficit declined slightly to 10.3% of GDP in FY 2015/16 from 10.7% in 2014/15, and this trend will continue to 9.9% in 2016/17 as a result of increasing revenue from mining projects, access to more grant resources, and a reduction in unproductive expenditures. Inflation remained at 12.5% in 2015 mainly because of food-supply shocks and high foreign exchange demand. Food-crop production in 2015 was only about 50% of its 2014 level. Lower international food and oil prices in 2015 and 2016 should contain 2015/16 inflation below 12.5%.
Exports are expected to have grown in 2014-15 due to the start of mineral production at the Asmara project and gold extraction by the Zara Mining Share Company. The current account deficit is forecast to increase to 3.4% of GDP in 2015 from 2.4% of GDP in 2014 and this trend will continue in 2016 despite rising levels of both remittances and the “development and recovery tax” (a 2% tax levied on the Eritrean Diaspora). Eritrea has continued to benefit from the IMF’s capacity-building institute, the East African Regional Technical Assistance Centre (E-Afritac), located in Tanzania. Moreover, Eritrea will be able to access the resources of the AfDB’s Transition Support Facility (TSF), a component of the Bank’s Pillar I grants window, which will further strengthen natural-resource governance, public-finance management, and data collection and analysis.
In addition to capacity-building support, the AfDB will help to strengthen institutional governance, especially in the Ministries of Finance and National Development because of their critical roles in ensuring macroeconomic stability and growth. Two projects are in preparation to support reform within the Ministry of Finance to improve public-finance management and tax and customs administration. The Drought Resilience Livelihood Support Program (DRLSP) II aims at integrating private-sector involvement into Bank projects and at developing the private sector

COUNtrY NOtES
286 African Economic Outlook © AfDB, OECD, UNDP 2016
in a decentralised environment as key components in skills development and the promotion of employment and entrepreneurship.
Macroeconomic indicators
2014 2015(e) 2016(p) 2017(p)
Real GDP growth 1.7 0.3 2.2 3.4
Real GDP per capita growth -0.5 -2.0 -0.2 1.0
CPI inflation 12.3 12.5 12.0 11.7
Budget balance % GDP -14.6 -10.7 -10.3 -9.9
Current account % GDP -2.4 -3.4 -4.1 -4.5
Source: Data from domestic authorities; estimates (e) and projections (p) based on authors’ calculations.

COUNtrY NOtES
287African Economic Outlook© AfDB, OECD, UNDP 2016286 African Economic Outlook © AfDB, OECD, UNDP 2016
ETHIoPIA
• The strong growth of Ethiopia’s economy in 2014/15, estimated at 10.2%, is expected to continue in 2016 and 2017, while public investment is expected to ease infrastructure bottlenecks and bolster economic structural transformation.
• Ethiopia faced severe drought in 2015 requiring emergency food and aid in 2016 and causing inflationary pressure, while the risk of public-debt distress increased due to rising non-concessional borrowing and export underperformance in 2014/15.
• The urban population, growing at 3.8% per annum, is expected to reach 42.3 million by 2037, which could pose significant development challenges if not addressed.
Ethiopia has experienced double-digit economic growth, averaging 10.8% since 2005, which has mainly been underpinned by public-sector-led development. Real gross domestic product (GDP) is estimated to have grown by 10.2% in fiscal year 2014/15. The agriculture, services and industry sectors accounted for 38.8%, 46.6% and 15.2% of real GDP, respectively. Public investments are expected to continue driving growth in the short and medium term with huge investments in infrastructure and the development of industrial parks, prioritised to ease bottlenecks to structural transformation, which will still have to take shape with industry playing a significant role in the economy.
Fiscal policy has remained prudent, focused mainly on increasing spending on pro-poor and growth-enhancing sectors, and on boosting efforts in tax-revenue collection. The monetary-policy stance has been geared to ensure a stable exchange rate and single-digit inflation targets. Despite this, inflation has tended to rise from single digits and reached 10.1% in December 2015. Although Ethiopia has been pursuing a sound debt-management policy, debt-burden indicators signalled a rise in debt distress from low to moderate in 2015, as indicated by the World Bank/International Monetary Fund (IMF) debt-sustainability analysis. Moreover, poor performance and volatility in export earnings, and ever-increasing demand for imports have led to a deterioration of the balance of trade deficit.
In 2015, Ethiopia faced one of the worst droughts in 30 years caused by the El Niño climate conditions, leading to failed harvests and shortages of livestock forage. Some 10.2 million persons have been affected by the drought and will need emergency food and non-food aid into 2016.
Ethiopia, the second most populated country in Africa after Nigeria, is also the least urbanised, with urbanisation at only 19%, significantly below the sub-Saharan average of 37%. The urban population has grown at an average 3.8% per annum since 2005 and is expected to triple from 15.2 million in 2012 to 42.3 million by 2037. This could pose a significant development challenge if not addressed. Since 2004/05, the government has focused more on developing housing, upgrading slums, providing infrastructure and promoting small urban enterprises.
Macroeconomic indicators
2013/14 2014/15(e) 2015/16(p) 2016/17(p)
Real GDP growth 10.3 10.2 8.1 7.7
Real GDP per capita growth 7.7 7.7 5.6 5.2
CPI inflation 8.1 7.7 7.4 8.9
Budget balance % GDP -2.6 -2.0 -1.3 -0.8
Current account % GDP -10.9 -14.6 -8.4 -9.3
Source: Data from domestic authorities; estimates (e) and projections (p) based on authors’ calculations.

COUNtrY NOtES
288 African Economic Outlook © AfDB, OECD, UNDP 2016
GAbon
• Estimated at 4.2%, growth remained vigorous in 2015 despite falling hydrocarbon prices, which reduced the country’s tax revenue.
• In 2015 Gabon continued to adopt reforms intended, among others, to streamline the management of performance-related bonuses in public administration.
• The great majority of Gabon’s population (at 1.8 million) is urban; efforts to upgrade housing have been undertaken, as well as measures to stimulate rural areas.
Despite the impact of the fall in hydrocarbon prices, growth remained relatively strong in 2014 at 4.4% and has been estimated at 4.2% in 2015 and projected at 4.5% in 2016. It is projected to continue at a rate higher than 5% until 2020. The economy remains dominated by hydrocarbon production, though manganese production and wood processing still play a major part in it. Gabon needs to diversify its economy, and recent outlooks and projections show non-oil activities on a stronger growth path than hydrocarbons thanks to public policy devised in this direction. Tax revenue fell sharply in 2015 as a result of declining oil prices and a slight drop in oil production.
The economic situation has pushed the authorities to accelerate ongoing reform programmes, in particular those intended to streamline performance-related bonuses paid to civil servants, with a view to having greater control over the wage bill and to improve public services. In terms of its operating expenditures, the government has also made important budgetary decisions to keep public investment at 22% of revenue under its “emerging Gabon” strategy plan (Plan stratégique Gabon émergent, PSGE) while maintaining a proactive social policy. The authorities also aim to raise tax revenue by broadening the tax base and modernising procedures for filing and paying taxes.
Gabon is highly urbanised, and its urbanisation level is growing. In 2015, 86% of the population lived in the country’s four big cities: Libreville, Port-Gentil, Franceville and Oyem. The capital, Libreville, has a population of nearly 800 000, or half the total population of Gabon. Outside of urban areas, however, the population density is lower than 2 people per km², which is similar to that of Sahelian desert countries. Housing policies are designed to fight against precarious housing and simplify legislation, while improving the housing stock and sanitation conditions in urban areas. Otherwise, the ambitious ongoing agricultural-development programme, Gabonaise des réalisations agricoles et des initiatives des nationaux engagés (GRAINE), includes developing 3 000 km of tracks leading to plantations, integrating about 1 600 villages into the basic-infrastructure development plan and involving 30 000 families in the formation of agricultural co-operatives. The programme aims to fight against rural-urban migration, promote youth employment, create 15 000 to 20 000 jobs and triple agricultural production. It should have a strong impact on rural housing, because it encourages participants to settle on a reserved farmland area.
Macroeconomic indicators
2014 2015(e) 2016(p) 2017(p)
Real GDP growth 4.4 4.2 4.5 5.1
Real GDP per capita growth 2.1 2.0 2.3 2.9
CPI inflation 3.2 1.2 2.4 2.4
Budget balance % GDP 2.7 -2.7 -4.6 -2.3
Current account % GDP 8.3 -6.1 -9.6 -4.1
Source: Data from domestic authorities; estimates (e) and projections (p) based on authors’ calculations.

COUNtrY NOtES
289African Economic Outlook© AfDB, OECD, UNDP 2016288 African Economic Outlook © AfDB, OECD, UNDP 2016
GAmbIA
• Growth rebounded to an estimated 4.7% in 2015 from its low level of 0.9% in 2014, and could exceed 5% in 2016 if the government implements appropriate policy reforms.
• The fiscal balance deteriorated further in 2015 and international reserves came under pressure, while the outlook is clouded by policy slippages related to financing another large programmed deficit of 9.3% of GDP in 2016.
• With almost half of the population residing in urban areas and rapid unplanned urbanisation, Gambia is facing significant socio-economic and environmental challenges.
Gambia’s economic performance has been affected by a series of external shocks. The impact of the regional Ebola outbreak on tourism and delayed summer rains in 2014, together with weak economic policy implementation, led to a contraction in real gross domestic product (GDP) growth to 0.9% in 2014, sharply down from an initial estimate of 7%. Growth is projected to rebound to 4.7% in 2015 and to 5.5% in 2016 due to a recovery in tourism and agriculture.
The country has experienced large fiscal imbalances, caused by persistent policy slippages in recent years and financial difficulties in public enterprises. Higher than budgeted levels of spending pushed the overall fiscal deficit from 4.4% of GDP in 2012 to 11% in 2014 and around 9.6% in 2015. The fiscal deficit is largely financed from domestic borrowing due to difficulties in mobilising external resources. This has led to an increase of ten percentage points since mid-2013 in the government’s one-year treasuries borrowing interest rate, which reached 21.9% in November 2015. The stock of public debt rose from just below 70% of GDP at end-2010 to 108% by end-2015. Consequently, interest payments on public sector debt increased to absorb 40% of government revenues in 2015, up from 25% in 2013. The outlook for 2016 is clouded by policy slippages related to financing another large programmed deficit of 9.3% of GDP. Associated with the fiscal deficit, Gambia experienced a significant balance of payments crisis, which led to a decrease in its official reserves from six months of import cover at end-2012 to less than three months in early 2016. Inflation hovered at around 6.5% at the end of 2015, up from around 5.3% in 2013.
Despite the enormous opportunities that urbanisation offers in Gambia, it has been perceived as a risk in recent decades. This is largely due to rapid and unplanned urbanisation that has resulted in large-scale flooding and other environmental hazards, as well as pressure on social services. Almost 50% of Gambia’s population live in urban areas. To date, urbanisation has not been guided by a comprehensive policy or strategy despite the fact that urban areas generate a large share of the economy and employment opportunities. Urbanisation is largely driven by high rural-urban migration and high population growth. The lack of adequate policy frameworks and the weakness of institutions have significantly undermined the potential of urbanisation and the management of its associated risks.
Macroeconomic indicators
2014 2015(e) 2016(p) 2017(p)
Real GDP growth 0.9 4.7 5.5 5.6
Real GDP per capita growth -2.4 1.5 2.3 2.4
CPI inflation 6.3 6.5 5.5 5.5
Budget balance % GDP -11.0 -9.6 -9.3 -6.1
Current account % GDP -17.7 -20.0 -15.0 -10.2
Source: Data from domestic authorities; estimates (e) and projections (p) based on authors’ calculations.

COUNtrY NOtES
290 African Economic Outlook © AfDB, OECD, UNDP 2016
GHAnA
• Ghana’s economic growth, which had slowed from 4.0% in 2014 to 3.7% in 2015, is expected to recover to 5.8% in 2016 and 8.7% in 2017, following consolidation of macroeconomic stability and implementation of measures to resolve the crippling power crisis.
• Monetary and fiscal policies were tightened in 2015 and are expected to remain so in 2016 in line with the fiscal and monetary policy consolidation reforms underway as Ghana prepares for national elections in late 2016.
• Ghana continues to experience rapid urbanisation, which has led to a number of sustainable development challenges, particularly regarding sanitation and transportation infrastructure.
In 2015, the Ghanaian economy grew at an estimated 3.7%, down from 4% in 2014. The 2015 slowdown resulted from a number of economic challenges, most of which were in play in 2014. These include a 3-year power crisis, rising fiscal deficit and public debt levels, a significant external sector deficit and unpredictably low world market prices for the country’s oil and gold exports. The services sector was the main driver of growth. The industrial sector also posted a positive growth rate of 9.1%. Over the medium term the country should see a recovery with a projected GDP growth of 5.8% in 2016 and 8.7% in 2017. The forecasted recovery in economic growth in 2016/17 depends on fiscal consolidation measures remaining on track, quick resolution of the power crisis, two new oil wells coming on-stream, and improved cocoa harvest and gold production.
Ghana maintained a tight monetary and fiscal policy in 2015. The government’s fiscal consolidation programme aimed to address demand pressures exacerbated mostly by the wage bill and by public debt services, which account for most un-earmarked revenues. Monetary policy in 2015 continued to be tightened with measures to contain rising inflation and the depreciation of the domestic currency. To address these challenges, government entered into a 3-year Extended Credit Facility (ECF) agreement with the International Monetary Fund (IMF) in April 2015, successfully undertaking two reviews under the programme. The fiscal consolidation stance is expected to meet the conditions of the reviews in 2016 as well. Ghana will hold its national election in late 2016; peaceful and credible elections will be key for policy continuity and for solidifying the country’s democratic dividend, especially after the closely contested 2012 elections and the judicial adjudication of the presidential elections.
By 2010 over half of Ghana’s population lived in urban areas (localities with a population of 5 000 or more), as compared to 30% at independence in 1957. The urbanisation rate is projected to increase to 72% by 2035. While rural-urban disparities are still significant, there are signs that Ghana’s cities are facing considerable challenges with land use, infrastructure and services provision (particularly with regard to housing, sanitation and transportation), and the absence of gainful and productive employment opportunities, especially for the youth. The critical policy challenge has been to ensure orderly and sustainable spatial development, co-ordination and planning, and measures to enable metropolitan and municipal authorities to secure adequate financing for infrastructure and services.
Macroeconomic indicators
2014 2015(e) 2016(p) 2017(p)
Real GDP growth 4.0 3.7 5.8 8.7
Real GDP per capita growth 1.6 1.4 3.5 6.4
CPI inflation 17.0 17.2 10.2 7.9
Budget balance % GDP -6.4 -5.7 -5.0 -3.9
Current account % GDP -9.5 -8.2 -7.7 -6.0
Source: Data from domestic authorities; estimates (e) and projections (p) based on authors’ calculations.

COUNtrY NOtES
291African Economic Outlook© AfDB, OECD, UNDP 2016290 African Economic Outlook © AfDB, OECD, UNDP 2016
GuInEA
• The Ebola epidemic ended in December 2015, but left the country in a state of devastation, with near-zero growth, a budget deficit of more than 7% of GDP and major constraints on its capacity to accelerate essential reforms to relaunch development and transform the economy structurally.
• Progress has been slow to materialise in the social sectors, with poverty on the increase, made worse by the negative impact of Ebola on income-generating activities and by spending on presidential elections.
• Rapid, poorly controlled urbanisation is adding to social pressures, and implementation of the national housing policy (Vision Habitat 2021) is a national priority that should place young people at the centre of challenges and issues that lie ahead.
Guinea recorded a major economic slowdown for the third year running in 2015, with growth estimated at 0.1% of gross domestic product (GDP) in real terms (equal to a 2.7% decline in per capita GDP), compared with 1.1% growth in 2014 and 2.3% in 2013. The culprit was the Ebola epidemic that struck the sub-region, especially Guinea, Sierra Leone and Liberia, between December 2013 and December 2015. Other contributing factors included a wait-and-see approach to governance in the run-up to the 11 October 2015 presidential election, and the adverse international economic outlook, which hurt the prices of export goods.
In addition to this drastic fall in growth, the government relaxed its fiscal discipline, mainly through increased capital outlays on infrastructure (roads, energy, etc.). This downturn in growth, combined with low domestic and foreign revenue, increased the budget deficit from 4.1% of GDP in 2014 to 7.5% in 2015 and reduced external assets in foreign currency from four months’ worth of imports in 2013 to two months in 2015. Despite good performances since 2011 in implementing the International Monetary Fund’s (IMF) Extended Credit Facility (ECF), most performance criteria and indicative targets were not achieved.
Growth prospects are expected to improve in 2016 thanks to a more peaceful political climate and the end of the Ebola epidemic, with Guinea officially declared Ebola-free on 29 December 2015. Furthermore, the government’s commitment to redress the macroeconomic situation and vast improvements to the electricity supply thanks to the new Kaleta hydroelectric dam will improve the business environment. Economic growth is therefore expected to accelerate again, reaching 4.0% in real terms in 2016 and 4.8% in 2017.
Like many other developing countries, Guinea is facing major challenges as a result of urbanisation. In 2014, urban areas were estimated to be home to 3.7 million people, or 34.7% of the population, up from 30.6% in 1996. Guinea’s urban growth is the result of its natural population growth, the rural exodus and the transformation of the outskirts of the country’s towns and cities. Imbalances in the urban structure of towns and cities have increased, confirming the predominant role of the capital, which had 1 667 864 residents in 2014 (15.7% of the national population). The main challenges for the country are youth unemployment, worsening urban poverty (incidence increased from 23.5% in 2002/03 to 30.5% in 2007 and 35.4% in 2012) and the shortage of basic public services, including education, health care, security and decent housing.
Macroeconomic indicators
2014 2015(e) 2016(p) 2017(p)
Real GDP growth 1.1 0.1 4.0 4.8
Real GDP per capita growth -1.6 -2.7 1.3 2.1
CPI inflation 9.7 8.0 8.5 8.8
Budget balance % GDP -4.1 -7.5 -5.0 -4.6
Current account % GDP -26.1 -23.6 -28.4 -25.6
Source: Data from domestic authorities; estimates (e) and projections (p) based on authors’ calculations.

COUNtrY NOtES
292 African Economic Outlook © AfDB, OECD, UNDP 2016
GuInEA-bIssAu
• Despite 4.8% growth estimated for 2015, and 5.7% projected for 2016 and 6.2% for 2017, the outlook remains fragile because the economy is highly dependent on the social and political climate, the performance of the cashew-nut subsector and on continuation of reforms.
• There has been significant progress in reforms thanks to better consideration of the country’s development priorities, but the state’s capacity to continue and reinforce its management of public finances will be critical for recovery in the medium term.
• The city of Bissau is the country’s main economic magnet, but for inclusive growth, public policies must energise secondary towns as well as work for the economic and social development of rural areas.
Guinea-Bissau’s return to constitutional order in 2014 allowed the country to improve its socio-economic situation and return to growth. After three years of stagnation due to the 2012 coup, Guinea-Bissau’s economy has returned to significant growth – estimated at 4.8% in 2015, up from only 0.8% in 2013 and 2.7% in 2014. The growth is because of a good year of cashew-nut sales and a sharp increase in subsistence food crops, as well as the private sector’s increased confidence, public-sector reforms (budgetary consolidation in particular) having been resumed and the return of donors, as illustrated by the success of the partners’ round table held in Brussels in March 2015. There was also some political mayhem in 2015, which could jeopardise the projected growth and the viability of reforms. The major challenges to growth in the short term are the political situation and climate hazards that could affect the primary sector. Assuming that political tensions are resolved, rainfall is similar to 2015 and reforms are continued, growth is projected at 5.7% in 2016 and 6.2% in 2017.
Compared to previous years, 2015 was marked by a considerable rise in revenues and expenditure. During the transition period, the country’s management of public finances had taken a turn for the worse. During 2015, the authorities were able to improve tax management and administration by setting up treasury committees and bolstering customs-related posts and functions. Even though much remains to be done to secure and develop the progress made since the end of the transition period, these improvements have allowed the state to function better (wages paid on time, auditing of wage arrears, etc.). Thus, the tax burden rose from 8.7% in 2014 to 10.5% in 2015, while the overall balance stood at -2.2% of gross domestic product (GDP) and the primary balance at -1.6%. Measured by the Harmonised Index of Consumer Prices, inflation has been estimated at 1.5% in 2015 in a context of demand recovery.
Compared to 2014, there was very little improvement in the social situation and in human development. Although the consolidation of public finances and support from the country’s technical and financial partners improved education and health coverage, the overall situation remains disturbing. The country holds one of the lowest ranks in the Human Development Index, and data from the latest multiple-indicator cluster survey (MICS IV) has highlighted major human-development deficiencies, particularly in relation to women and the rural populations.
Macroeconomic indicators
2014 2015(e) 2016(p) 2017(p)
Real GDP growth 2.7 4.8 5.7 6.2
Real GDP per capita growth 0.2 2.4 3.4 3.8
CPI inflation 1.9 1.5 2.1 1.8
Budget balance % GDP -2.1 -2.2 -2.7 -3.1
Current account % GDP -1.3 1.5 -2.4 -2.6
Source: Data from domestic authorities; estimates (e) and projections (p) based on authors’ calculations.

COUNtrY NOtES
293African Economic Outlook© AfDB, OECD, UNDP 2016292 African Economic Outlook © AfDB, OECD, UNDP 2016
KEnyA
• Real GDP growth was 5.3% in 2014, while the 2015 estimate and the 2016 and 2017 projections show economic expansion of 5.5%, 6.0%, and 6.4% respectively.
• In 2014 and 2015, the economy experienced a stable macroeconomic environment, with single-digit inflation despite a 10.0% currency depreciation in 2015. At the same time, calls to amend the constitution to increase finances to the 47 county governments dominated the political scene.
• Kenya is set to experience rapid urbanisation in the foreseeable future.
GDP growth remained robust in 2014 at 5.3%. The expansion of construction, manufacturing, finance and insurance, information, communications and technology, and wholesale and retail trade buoyed GDP. The economy slowed in the first half of 2015, but growth is estimated to have reached 5.5% by year-end. As shown in the table below, overall GDP growth prospects are 6.0% and 6.4% for the years 2016 and 2017 respectively. Consumer Price Index (CPI) inflation projections remain at around 6.0% over the same period. The short- to medium-term positive growth projections are based on the assumptions of increased rainfall and enhanced agricultural production, a stable macroeconomic environment, continued low international oil prices, the stability of the Kenya shilling (KES), improved security boosting tourism and reforms in governance and justice.
Political activity in 2015 continued to centre on two areas: a call by the opposition party, Coalition for Reforms and Democracy (CORD), to amend the constitution and county governments seeking to raise national government financial transfers from 15% to 45%.
Macroeconomic indicators
2014 2015(e) 2016(p) 2017(p)
Real GDP growth 5.3 5.5 6.0 6.4
Real GDP per capita growth 2.6 2.9 3.4 3.8
CPI inflation 6.9 6.0 6.0 5.2
Budget balance % GDP -5.7 -8.8 -8.2 -6.3
Current account % GDP -10.0 -7.9 -6.3 -6.9
Source: Data from domestic authorities; estimates (e) and projections (p) based on authors’ calculations.

COUNtrY NOtES
294 African Economic Outlook © AfDB, OECD, UNDP 2016
lEsoTHo
• After four years of robust growth averaging 4.3% annually, growth dropped to an estimated 3.4% in 2015, largely due to weakness in the construction and manufacturing sectors and it is expected to remain subdued in 2016 and 2017.
• Unemployment, poverty and inequality have remained pervasive in the face of non-inclusive growth.
• The high rate of urbanisation has outpaced the ability of the authorities to provide necessary services, and the sustainability of living conditions for much of the urban population remains a critical challenge.
Economic growth in Lesotho slowed to an estimated rate of 3.4% in 2015, down from 3.6% in 2014. Growth is projected to remain subdued at 2.6% in 2016 and 2.9% in 2017. Growth in 2015 was significantly affected by low implementation of the public investment budget, which weighed heavily on the construction sector and other inter-related sectors highly dependent on government spending. Slow growth in manufacturing and spillovers from slower growth in South African economy were a further brake on growth.
Despite the country’s solid economic performance in recent years (2010-14), growth remained non-inclusive. Consequently, a large population is still languishing in extreme poverty. Unemployment remains high at 24%, and the country’s Gini coefficient of 0.5 means that inequality is still a problem. Based on the poverty headcount ratio at USD 1.25 a day, 56.2% of the population is still trapped in extreme poverty. Efforts to promote inclusive growth are constrained by the pressure of high HIV prevalence (22.9% of the total population) and the volatility of receipts from the Southern African Customs Union (SACU), which finance 50% of the budget.
A massive influx of the population from rural to urban centres has led to rapid urbanisation. This has been triggered by a multitude of factors, the most important being climate change, which has led to low agricultural productivity, and spatial differences in the provision of services and the location of opportunities, often in favour of urban areas. With urban dwellers estimated at 22.8% of the overall population and the urban population growing at a rate of 37% every ten years, sustainability remains a critical challenge. The urban population has outpaced the ability of the authorities to provide commensurate social services. This in turn has often resulted in other challenges, such as poor waste disposal, pollution of water bodies, poor housing and inadequate social and economic infrastructure. For urbanisation to remain sustainable, innovative policies are required, along with commitment towards their effective implementation. The government plans to link urban growth poles to the rural economy, and its commitment to implement climate change adaptation initiatives are highly commendable.
Macroeconomic indicators
2014 2015(e) 2016(p) 2017(p)
Real GDP growth 3.6 3.4 2.6 2.9
Real GDP per capita growth 2.4 2.2 1.4 1.7
CPI inflation 5.3 3.8 3.9 4.0
Budget balance % GDP -2.5 0.6 -3.1 -5.5
Current account % GDP -10.6 -8.4 -6.5 -15.7
Source: Data from domestic authorities; estimates (e) and projections (p) based on authors’ calculations.

COUNtrY NOtES
295African Economic Outlook© AfDB, OECD, UNDP 2016294 African Economic Outlook © AfDB, OECD, UNDP 2016
lIbERIA
• The drop in commodity prices and after effects of the Ebola outbreak cut Liberia’s economic growth in 2015 to 0.4%. However, gold production and the resumption of public infrastructure projects will support a modest pickup in growth in 2016 to 2.8%.
• Lower revenue growth, tighter borrowing limits, and a large wage bill increase the need to align expenditure and borrowing with development priorities in the lead up to the 2017 presidential elections.
• The rapidly increasing population in Monrovia requires stronger urban policies to reduce congestion and improve the quality of life in informal settlements and continued effort to increase economic opportunities in rural areas.
Liberia is facing headwinds to growth following two major shocks over the past year. The country is recovering from the effects of the Ebola Virus Disease (EVD) outbreak combined with the drop in international export prices for Liberia’s traditional engines of growth – iron ore and rubber – to slow economic growth in 2015 to 0.4%. Public infrastructure projects and the commencement of gold production will support estimated GDP growth of 2.8% in 2016, but the drawdown of the United Nations peacekeeping force will reduce demand for services while requiring the government to assume full responsibility for the security sector and its costs.
Liberia is facing lower revenue growth and tighter borrowing limits, calling for increased efforts to contain the wage bill and align expenditure and borrowing with development priorities in the lead up to the 2017 presidential elections. Energy production will gradually increase through 2018, but improved management of the sector will be necessary to maximise considerable investments and sustain service delivery. While gradually improving infrastructure will be a crucial support for economic growth, increased focus on improving the business environment will be necessary to diversify the economy and enable inclusive growth. Task forces on agriculture and manufacturing are prioritising interventions to improve the environment for business growth, to increase value-added and to attract investment in non-extractive sectors.
With urbanisation increasing rapidly in Monrovia, increased efforts on urban governance issues will be needed to sustain growth and improve the quality of life. Inadequate infrastructure and weak planning have led to a build-up of informal settlements, a lack of access to basic services, and traffic congestion. The urban road network and the water supply is expanding, but from a very low base. Increasing economic opportunities outside of Monrovia will help reduce urban migration. There is growing momentum to de-concentrate services and expand infrastructure in rural areas, but the process will take several years.
Macroeconomic indicators
2014 2015(e) 2016(p) 2017(p)
Real GDP growth 0.7 0.4 2.8 4.4
Real GDP per capita growth -1.7 -2.0 0.3 1.9
CPI inflation 9.9 7.7 7.0 7.5
Budget balance % GDP -2.9 -9.9 -5.6 -5.7
Current account % GDP -24.1 -36.9 -32.0 -29.5
Source: Data from domestic authorities; estimates (e) and projections (p) based on authors’ calculations.

COUNtrY NOtES
296 African Economic Outlook © AfDB, OECD, UNDP 2016
lIbyA
• GDP contracted by 6.0% in 2015 but in the event of a resolution to conflict and a rapid resumption of oil production, economic growth could recover quickly.
• Prospects for a unity government have improved, although the coastal cities of Sirte and Derna remain controlled by the Islamic State.
• The urban policies adopted in the 1970s have had positive effects on structural transformation, in particular with the impulse of the industrial dynamism of cities like Tobruk, Misrata, Zawya, Al Bayda and Derna.
Following months of delay, Libya’s House of Representatives (HoR) was elected in June 2014, replacing the General National Congress (GNC), which had acted as Libya’s legislative body since July 2012. The election of HoR was disputed by the Islamist factions who subsequently reconvened the GNC in Tripoli in August. Consequently, there are currently two rival governments in Libya: one linked to the HoR, the internationally recognised government, the other to the GNC, indicating the depth of administrative and bureaucratic chaos in the country.
The United Nations and humanitarian partners estimate that 4.35 million people, almost half the population, have been affected by the armed conflict. Political divisions and the intense fighting between rival militias since August 2014 have cost hundreds lives, and displaced over 435 000 people. Most of the displaced are living in urban centres within host communities, with just over 100 000 living in collective centres in the open or in makeshift buildings such as schools and empty warehouses. The largest number of displaced are located in Benghazi, Al Jabal Al GhaRbi, Al Zawiya, Tripoli and Misrata. The conflict has also caused serious damage in terms of provision of and access to basic goods and services, especially health care, food, shelter, clean water and sanitation and education in Tripoli and across the country.
The poor political and security situation has had serious consequences for the economy, public finance and official reserves in 2015. The continuing clashes between tribal and militia associated with different political factions around the oil sites have steadily reduced oil production and exports by almost two-thirds, compared to pre-crisis levels. An average of 400 000 barrels per day (bpd) were produced in 2015 and 1.8 million bpd in 2010. As a result, GDP contracted by an estimated 6.0% in 2015, against a contraction of 23.5% in 2014, and is projected to show a decline of 0.8% in 2016 if the security situation does not improve.
After several attempts, international efforts to forge a consensual roadmap succeeded in December 2015 when the factions agreed on a national unity government deal at an UN-facilitated meeting in Tunisia. A Government of National Accord (GNA) was announced on 19 January 2016, and 32 ministers were proposed. However, the HoR parliament rejected the UN-backed unity government because it included too many ministers and asked the Tunis-based Presidential Council to propose a new, shorter list of ministers within 10 days. A revised and shorter list was presented on 15 February but, by the end of the month, agreement had still not been reached.
The economic situation in 2016 will largely depend on the implementation of the Government of National Accord and the extent of security stabilisation. In this context, the economic recovery will proceed slowly, especially in the oil sector. In 2017, the implementation of an important reforms programme could release substantial growth potential and significant improvements in both the budget and current balances. This would stabilise Libya’s official reserves and help create a climate of trust and confidence for potential investors.

COUNtrY NOtES
297African Economic Outlook© AfDB, OECD, UNDP 2016296 African Economic Outlook © AfDB, OECD, UNDP 2016
Macroeconomic indicators
2014 2015(e) 2016(p) 2017(p)
Real GDP growth -23.5 -6.0 -0.8 3.9
Real GDP per capita growth -23.4 -6.3 -1.6 3.1
CPI inflation 2.4 8.6 9.7 5.8
Budget balance % GDP -43.5 -58.9 -60.7 -56.8
Current account % GDP -30.1 -51.0 -44.5 -33.3
Source: Data from domestic authorities; estimates (e) and projections (p) based on authors’ calculations.

COUNtrY NOtES
298 African Economic Outlook © AfDB, OECD, UNDP 2016
mAdAGAscAR
• Economic growth in Madagascar is estimated to have plateaued at 3.2% in 2015, but is projected to accelerate to 4.0% in 2016 and 4.5% in 2017.
• In 2015, the International Monetary Fund approved a second disbursement under the Rapid Credit Facility, while technical and financial partners provided support for the National Development Plan.
• Sustainable growth requires rational territorial management and controlled urbanisation.
In 2015, Madagascar consolidated the institutions set up the previous year, adopted a decentralisation policy, held elections for local councils and for the senate, convened talks on national reconciliation attended by former presidents, launched a national consultation on public-security reform, and swore in the second government since the transition. Despite this progress, stability still seems to be fragile due to the rise in poverty and unemployment, and to ongoing tensions between the executive branch and parliament.
Economic growth is estimated to have stagnated in 2015 at 3.2%, falling short of the minimum 5% target set in the National Development Plan to reduce poverty. This poor performance was the result of political uncertainties, limited progress in terms of governance, low investment in the social sectors and in infrastructure, energy shortages, a 40-day summer strike at Air Madagascar and an overall deterioration of the business environment. These factors were compounded by exogenous shocks, including drought in the south, floods in the north, lower mineral prices and weak growth in the country’s European partner.
Economic growth is still driven by the secondary sector (export processing zones, agro-industry, and the metal and wood industries) and the services sector (banking, tourism, insurance and construction). As a whole, the primary sector recorded poor growth in 2015 (0.7%, down from 3.3% in 2014) due to floods in the north and drought in the south. Inflation was kept below 10%. The budget deficit widened to an estimated 4.6% of GDP in 2015, from 2.3% in 2014, and the current-account deficit deteriorated from 0.2% to 2.3% of GDP, so macroeconomic stability remains fragile and food insecurity is still a concern. Consequently, Madagascar still has a poor Human Development Index of 0.510, ranking the economy as 154th in the United Nations Development Programme’s 2015 Human Development Report. The country has become less resilient to external shocks.
In terms of the outlook for the future, a calmer political environment with better governance and the recovery of public and private investment should allow economic growth to reach 4.0% in 2016 and 4.5% in 2017, driven by agriculture, production in export processing zones, new information and communications technology, transport, tourism and construction. This economic growth should alleviate poverty and unemployment.
Sustainable development will require a structural transformation of the economy, with resources reallocated to the more productive sectors, rural and urban areas that are better integrated into the economy, and public policies to support efficient land management and better control of the rapid urbanisation taking place.
Macroeconomic indicators
2014 2015(e) 2016(p) 2017(p)
Real GDP growth 3.3 3.2 4.0 4.5
Real GDP per capita growth 0.5 0.4 1.2 1.7
CPI inflation 6.0 7.9 7.4 7.8
Budget balance % GDP -2.3 -4.6 -3.1 -3.6
Current account % GDP -0.2 -2.3 -1.7 -2.0
Source: Data from domestic authorities; estimates (e) and projections (p) based on authors’ calculations.

COUNtrY NOtES
299African Economic Outlook© AfDB, OECD, UNDP 2016298 African Economic Outlook © AfDB, OECD, UNDP 2016
mAlAWI
• Malawi’s economic growth decelerated to 2.9% in 2015 (down from 5.7% in 2014), due largely to external and internal shocks to the economy, but it may pick up to 4% in 2016.
• High inflation in 2015 continued to undermine Malawi’s prospects for economic growth and poverty reduction, necessitating a further tightening of monetary and fiscal policy.
• Key challenges to Malawi’s urbanisation process stem from the lack of capacity to meet the basic social and economic needs of a growing urban population.
In 2015, buffeted by weather and policy shocks, Malawi’s real GDP growth was estimated at 2.9%, down from 5.7% in 2014. Floods and dry spells reduced maize production by 30%, resulting in a 2.3% slowdown in agriculture sector growth. This caused food insecurity for an estimated 2.8 million people (16% of the population). The contraction in agricultural production and reduced demand affected the wholesale, retail and manufacturing sectors. The services sector, particularly information and communication, proved more resilient, registering 9% growth. This was partly driven by rapid expansion in mobile phone services. In 2016, economic growth is projected to rebound to 4%, possibly reaching 4.9% in 2017, with agriculture as the main driver. The growth outlook is premised on favourable weather conditions, macroeconomic stability, consistency in policy implementation and renewed private-sector confidence. Population growth of 2.8% a year will require consistent economic growth to reduce poverty and improve progress towards the Sustainable Development Goals.
Fiscal pressures intensified in the 2014/15 fiscal year because of shortfalls in external financing due to the continued suspension of budgetary support, lower domestic revenue, and expenditure overruns, particularly on wages and salaries and on interest payments. Restoring confidence will require deeper public financial management reforms to improve accountability and transparency in the management of public funds. Inadequate fiscal adjustments widened the fiscal deficit beyond forecasts, driving up net domestic borrowing, inflation and interest rates. Inflation surged to 24.9 % in December 2015 as food supplies ran low and the Malawi kwacha (MWK) depreciated more than expected. Monetary policy was further tightened to contain inflation and achieve exchange rate stability. Inflation is projected to decline to 18.1% in 2016, remaining above the government’s initial 12% target. The sharp decline in the local currency has been driven by foreign-exchange demand pressures and persistent current account deficits, estimated at 6.0% of GDP in 2015 and expected to remain within the 6-7% range in 2016 and 2017, reflecting the narrow export base and strong dependence on imports and external aid.
Urbanisation in Malawi poses both challenges and opportunities for transformation. The country is one of the least urbanised in the region, but the 3.8% urban growth rate is higher than the overall population growth rate of 2.8%. The major challenge is to meet demand for housing and other basic services, despite limited resources. However, urbanisation presents an opportunity if its potential to transform the economy can be harnessed.
Macroeconomic indicators
2014 2015(e) 2016(p) 2017(p)
Real GDP growth 5.7 2.9 4.0 4.9
Real GDP per capita growth 2.6 -0.2 0.9 1.8
CPI inflation 23.8 21.2 18.1 16.0
Budget balance % GDP -5.9 -5.7 -3.3 -3.1
Current account % GDP -8.2 -6.0 -6.1 -6.7
Source: Data from domestic authorities; estimates (e) and projections (p) based on authors’ calculations.

COUNtrY NOtES
300 African Economic Outlook © AfDB, OECD, UNDP 2016
mAlI
• The country’s peace and reconciliation agreement, signed on 15 May and 20 June 2015, has stabilised political life, but the security situation is still fragile.
• Growth slowed in 2015 to an estimated 5.2%, down from 5.8% in 2014, but the economic recovery since the 2012 crisis has reduced poverty slightly, to 46.9% in 2014 (from 47.1% in 2013).
• Population growth (3.6%) remains high but the government has pledged, through its national urban policy, to improve the life of urban dwellers, boost local economies, tackle under-unemployment and poverty, support socio-cultural diversity and strengthen local civic rights.
Economic activity slowed in 2015, with real gross domestic product (GDP) increasing an estimated 5.2% (5.8% in 2014), due to poor agricultural sector performance (growth of only 3.9%, down from 14.8% in 2014). The secondary sector fared badly too, with growth of 2.6% (9.2% in 2014). In agro-industry, overwhelmingly plant-oil mills, growth fell to 18% (down from 35% in 2014) because of poor agricultural output, especially cotton. However, growth strengthened in the tertiary (services) sector, at 6.9% (up from 3.6% in 2014). The current account deficit (including grants) improved to 3.6% of GDP (from 5.7% in 2014) due to lower oil prices and more volume exports of gold, improving the terms of trade to 15.2% (from 5.3% in 2014). The current account deficit is expected to be entirely funded by foreign direct investment (FDI) in gold and telecommunications and by foreign loans.
Medium-term macroeconomic prospects are good, with overall growth forecast as 5.2% in 2016 and 5.0% in 2017, driven partly by more public investment and foreign aid and by the agricultural and service sectors. But the current account (including grants) deficit is expected to widen to 4.1% of GDP in 2016 and 5.2% in 2017 due to lower gold production and poorer terms of trade. The deficit should again be funded by FDI in gold and telecommunications and by foreign loans. The good prospects could be undermined by continuing risks such as the security situation, unpredictable gold and cotton prices and bad rainfall.
Mali has made progress in recent years towards the Millennium Development Goals (MDG) of universal primary education (Goal 2), combating HIV/AIDS (Goal 6) and access to safe drinking water (Goal 7, target 10). The security crisis has set back this progress but it should be strengthened with implementation of the 2015-30 UN Sustainable Development Goals that the country has also signed up to.
The humanitarian situation remains a worry in the north, especially for 2.5 million people dependent on humanitarian aid, internally displaced people (62 000) and refugees (140 000). These difficult conditions did not stop 423 427 refugees and displaced people returning to the region. Humanitarian groups have drafted a USD 354 million (US dollars) plan for 2016 to help the most vulnerable.
Macroeconomic indicators
2014 2015(e) 2016(p) 2017(p)
Real GDP growth 5.8 5.2 5.2 5.0
Real GDP per capita growth 2.9 2.2 2.1 2.0
CPI inflation 0.9 2.0 2.7 1.8
Budget balance % GDP -3.5 -3.7 -3.5 -3.6
Current account % GDP -5.7 -3.6 -4.1 -5.2
Source: Data from domestic authorities; estimates (e) and projections (p) based on authors’ calculations.

COUNtrY NOtES
301African Economic Outlook© AfDB, OECD, UNDP 2016300 African Economic Outlook © AfDB, OECD, UNDP 2016
mAuRITAnIA
• Mauritania’s economy grew an estimated 3.1% in 2015, down from 6.6% in 2014, primarily because of the drop in the price of iron ore, the country’s main export.
• The economic outlook remains promising in the short term, due particularly to new mining development at the Guelb II deposit, the recovery of manufacturing activity and the intensification of structural reforms.
• Transformation of Mauritanian cities into engines of growth is slow because of unplanned and unmanaged urbanisation, which has had a negative impact on local development.
The ongoing drop in world iron prices has derailed the Mauritanian economy from its high-growth track. Its gross domestic product (GDP) grew at an estimated 3.1% in 2015, down from 6.6% in 2014. In 2015, there was a significant drop in the mining industry’s share of GDP to 7.4%, from 12.8% in 2014. The slowdown in growth is also due to a decline in gross investment. The economic outlook remains promising in the short term, however, due particularly to the new mining development of the Guelb II deposit, the recovery of manufacturing activity and the intensification of structural reforms.
The country’s macroeconomic achievements were sustained in 2015. Inflation (3.5% in 2014) was contained at 1.5%, thanks in particular to a fall in international food prices. The fiscal stance remains viable, with a manageable overall balance deficit equal to 2.9% of GDP (3.7% in 2014). By the end of 2015, official foreign-exchange reserves had remained comfortable at an estimated US dollar (USD) 809 million, or 6.8% of non-extractive imports (5.5 months of imports), against USD 639.1 million in 2014, or 4.7 months of imports. The tertiary sector’s share of GDP continued growing to reach 44.8%, its highest ever. The current account deficit maintained its gradual recovery, expected to continue until 2017, falling to 22.2% of GDP in 2015 from 30% in 2014.
The encouraging results of the 2014 survey on household living conditions (EPCVM) published in 2015 show significant progress in poverty reduction, falling to 31% from 42% in 2008. In the 2015 United Nations Development Programme (UNDP) Human Development Index (HDI) rankings Mauritania was placed 156th with a score of 0.506, 5 places higher than in 2014. While other social indicators have improved, the country’s social performance remains mixed, and Mauritania is still categorised as a low HDI country. The first Millennium Development Goal (MDG), which was to reduce the poverty rate to 28% by the end of 2015, was not reached. Despite the relatively low unemployment rate (12.8% in 2014), the labour market remains highly precarious and informal, with a vulnerable-employment rate of 54.62%.
Significant among the country’s major development challenges are: managing urbanisation, as strong urban-population growth has brought the urban share of the total population to 48.3%; the persistence of districts with precarious housing; improving land management; better application of taxation; and reducing vulnerability to climate change. In this context, a well-structured and clearly-focused urbanisation process is essential to local development.
Macroeconomic indicators
2014 2015(e) 2016(p) 2017(p)
Real GDP growth 6.6 3.1 3.5 4.5
Real GDP per capita growth 4.1 0.7 1.0 2.2
CPI inflation 3.5 1.5 6.7 6.1
Budget balance % GDP -3.7 -2.9 -2.4 -2.2
Current account % GDP -30.0 -22.2 -20.3 -19.3
Source: Data from domestic authorities; estimates (e) and projections (p) based on authors’ calculations.

COUNtrY NOtES
302 African Economic Outlook © AfDB, OECD, UNDP 2016
mAuRITIus
• The Mauritian economy grew by 3.7% in 2015 – slightly more than the 3.6% recorded in 2014 – and is projected to grow by 3.8% in 2016 and 4.0% in 2017 on the back of stronger domestic and external demand.
• Mauritius was rated as the best performing economy in Africa and was ranked 46th out of 140 economies in the latest edition of the World Economic Forum Global Competitiveness Report.
• The government introduced an innovative urban development approach, consisting of 8 “Smart Cities” and 5 techno-parks, in an effort to boost sustainable economic growth and enhance the competitiveness of Mauritius.
The Mauritian economy recorded real growth of 3.7% in 2015, up from the 3.6% recorded in 2014. Economic growth in 2015 was driven by the information and communications technology and by the financial and insurance sectors, which grew by 6.3% and 5.6%, respectively. These gains were partially offset by the poor performance of the construction sector, which contracted by 5.4% over the same period. The government’s fiscal stance in 2015 remained expansionary, with the budget deficit increasing to 4.4% of GDP, compared with 3.2% at the end of 2014. The Bank of Mauritius (BoM) lowered the key repo rate to 4.4%, from 4.65%, taking into account the slow pace of growth and subdued inflation levels. Inflationary pressures in the domestic economy were generally low on account of subdued food prices and declining international commodity prices. Inflation stood at 1.3% in December 2015, and is expected to remain within the 2.5-3.0% range in the short term. Mauritius’ current account deficit fell to 4.9% in 2015, compared with 5.9% in 2014, largely due to the impact of weak oil prices on merchandise imports and a booming tourist sector on service exports.
Evidence from the first year in office for the Alliance Lepep (AL), led by Sir Anerood Jugnauth, supports the view that the policy proposals of the new government will focus on promoting inclusive growth and investment in the economy, with fiscal consolidation a secondary concern in the short term. The government’s main announcements to date have been its Economic Mission Statement (Achieving the Second Economic Miracle and Vision 2030 – delivered in August 2015) and its first budget (Mauritius at the Crossroad – delivered in March 2015), which had a distinctly expansionary flavour (e.g. higher social spending), but was also largely aimed at drawing in private investment through tax incentives and major infrastructure projects. The budget also included a proposal to improve fiscal transparency by abolishing special funds and boosting sustainability with the creation of a “Legacy Sovereign Fund”. The 2015-19 government programme also places special emphasis on infrastructure development and promoting the “Blue Economy” while at the same time enhancing human capital development as the country looks to reduce the stubbornly high levels of unemployment which remain in the 8.5-9% range.
During the delivery of its 2015/16 national budget, the Government of Mauritius announced the set-up of the “Smart City Scheme” to provide an enabling framework and a package of attractive fiscal and non-fiscal incentives to investors for the development of smart cities across the island. The smart-city concept is about providing investors, nationals and foreigners, with options for living in sustainable, convenient and enjoyable urban surroundings. These new cities will be built around the “work-live-play” lifestyle in a vibrant environment with technology and innovation at their core.
Macroeconomic indicators
2014 2015(e) 2016(p) 2017(p)
Real GDP growth 3.6 3.7 3.8 3.7
Real GDP per capita growth 3.2 3.3 3.4 3.3
CPI inflation 3.2 1.3 2.8 2.5
Budget balance % GDP -3.2 -4.4 -3.9 -3.8
Current account % GDP -5.9 -4.9 -4.7 -4.0
Source: Data from domestic authorities; estimates (e) and projections (p) based on authors’ calculations.

COUNtrY NOtES
303African Economic Outlook© AfDB, OECD, UNDP 2016302 African Economic Outlook © AfDB, OECD, UNDP 2016
moRocco
• Morocco is posting more balanced macroeconomic results with a budget deficit of 4.3% of GDP in 2015 and a clear improvement in foreign exchange reserves to about seven months of imports at the end of the year.
• The government is continuing its reforms and major investments (Nador West Med port, TGV high-speed train, Noor solar complex, Kenitra Atlantique port) to improve the business climate and attract foreign investors as drivers of innovation and value-added.
• Territorial reform and successful regional and local elections held in 2015 bode well for the introduction of a new dynamic in governance and local development, allowing towns and cities to be developed in a more sustainable way.
Morocco continued making significant efforts to balance its macroeconomic results in 2015. The budget deficit stood at 4.3% of gross domestic product (GDP), thanks in particular to the economy’s strong performance (growth of 4.5%) and a reduction in government subsidies. Foreign exchange reserves increased to about seven months of imports at the end of 2015 due to a strong export sector and a reduction in imports following the drop in oil prices. These results also reflect the country’s proactive policy of improving the business climate to help to transform its economic model. On the one hand, major steps were taken in the legal and fiscal domains and in exchange regulations. On the other, major public investments are moving forward: the financing of the Nador West Med port has been completed, a call for tenders for the Kenitra Atlantique port was issued in January 2016, and work on the TGV high-speed rail line has continued. These initiatives are bearing fruit, with the automobile sector becoming the country’s chief exporter in 2015. The developments are occurring in parallel with a search for new partners, with Morocco continuing to position itself as a platform for access to African markets. Nonetheless, efforts must be pursued to make growth less volatile through lower dependency on the low-intensity agricultural sector. In 2016, low rainfall is expected to have a strong effect on this sector, with knock-on effects for GDP growth, projected at 1.8%.
Other challenges endure. Morocco must tackle deep inequalities (in terms of gender, geography, education and access to basic services) that can undermine the inclusive nature of its growth. With this in mind, Morocco kept up its strong reform momentum in 2015 to put its regulatory and institutional framework in line with the requirements of its 2011 constitution. First, the decentralisation process took a major step forward with territorial reform and regional and local elections, which are leading to the progressive transfer of power from the central government to local authorities. Second, the government is seeking to improve access to basic social benefits (medical coverage has been extended to the 260 000 students in public higher education and access to Tayssir cash subsidies for keeping primary pupils in school has become widespread). Third, the government remained committed to improving public services and making them more accessible (public services charter, e-government, anti-corruption measures). Finally, the government continued to promote gender equality by implementing quotas for female politicians in the 2015 elections.
Morocco is seeking to develop its economic model in a sustainable way. This approach is being promoted as part of the national sustainable development strategy, but also through the adoption of new legislation like the water law. Morocco, which will host COP22 in 2016, was the second African country to commit to reducing greenhouse gas emissions. However, these initiatives need to be better decentralised, notably to the municipal level. Numerous challenges remain concerning the sustainable development of urban zones, in particular due to the rapid expansion of suburbs.

COUNtrY NOtES
304 African Economic Outlook © AfDB, OECD, UNDP 2016
Macroeconomic indicators
2014 2015(e) 2016(p) 2017(p)
Real GDP growth 2.4 4.5 1.8 3.5
Real GDP per capita growth 1.0 3.2 0.5 2.3
CPI inflation 0.4 1.8 1.4 1.6
Budget balance % GDP -4.9 -4.3 -3.5 -3.0
Current account % GDP -5.7 -2.7 -0.7 -0.9
Source: Data from domestic authorities; estimates (e) and projections (p) based on authors’ calculations.

COUNtrY NOtES
305African Economic Outlook© AfDB, OECD, UNDP 2016304 African Economic Outlook © AfDB, OECD, UNDP 2016
moZAmbIquE
• Mozambique’s GDP growth declined in 2015 to 6.3% because of lower export earnings and public expenditure but is expected to expand to 6.5% in 2016.
• Amid government-opposition political tensions, improved financial management and public expenditure are needed to counter growing inequalities.
• The number of Mozambicans in cities will rise from 31% now to 40% by 2040 and they will need better transport and facilities.
After a decade of average annual economic growth above 7%, Mozambique saw a slowdown to 6.3% in 2015 as the country faces defining economic and political challenges. The slower gross domestic product (GDP) growth was due to lower than expected exports and a decrease in public expenditure and foreign direct investment. A reduced influx of hard currency assisted the devaluation of the metical (MZN) against the US dollar and pressured the balance of payments. This was halted only by a USD 282.9 million standby credit facility agreement with the International Monetary Fund in December 2015. The budget deficit was reduced from 6.6% in 2014 to 5.4% in 2015. The main short-term challenge is to regain growth momentum while ensuring fiscal and debt sustainability. Predicted GDP growth of 6.5% in 2016 and 7.5% in 2017 hinges on the advancement of gas and coal production projects and attracting foreign investment.
President Filipe Nyusi’s government faces many challenges. Negotiations between the authorities and liquefied natural gas (LNG) operators on new projects have taken longer than expected. This has held up final investment decisions now expected in late 2016. Lower oil and gas prices are a further concern for the development of the projects. The political situation remains uncertain with renewed low intensity conflict between the government and RENAMO opposition party, which refuses to recognise the result of the 2014 presidential election. The government is struggling to repay a bond issued for the Empresa Mocambicana de Atum (EMATUM) state tuna company. This will require some kind of restructuring. Finally, the currency’s devaluation is expected to spike up inflation, affecting living conditions for the wider population.
Data has revealed rising household expenditure since 2009, but Mozambique’s ranking dropped in the United Nations Development Programme’s 2015 Human Development Index. It showed rising disparities between regions and stressed the underdevelopment of rural areas.
The urban population is growing strongly but still represents less than a third of the total population. Rural population growth is bigger in absolute terms. Urban unemployment is higher than in rural areas and a large part of the city population is not reaching its full economic potential. Public policy in general considers urbanisation as a challenge, rather than an opportunity, focusing on rural development. Nonetheless, progressively more recognition is being given to structured urbanisation. The first post-independence new city developments are being designed and implemented.
Macroeconomic indicators
2014 2015(e) 2016(p) 2017(p)
Real GDP growth 7.2 6.3 6.5 7.5
Real GDP per capita growth 4.4 3.5 3.7 4.7
CPI inflation 2.3 2.0 5.7 5.2
Budget balance % GDP -6.6 -5.4 -3.7 -2.4
Current account % GDP -41.6 -44.0 -46.1 -47.9
Source: Data from domestic authorities; estimates (e) and projections (p) based on authors’ calculations.

COUNtrY NOtES
306 African Economic Outlook © AfDB, OECD, UNDP 2016
nAmIbIA
• Growth moderated to 4.4% in 2015 on the back of low global commodity prices and should remain subdued in 2016 as fragile external demand dims the outlook.
• Political stability and sound macroeconomic management are promoting investor confidence but education and skills must improve to achieve a more competitive and inclusive economy.
• The public housing programme will need to be complemented with accelerated urban infrastructure development and further strengthening of rural growth centres to create more rural jobs and contain rapid rural to urban migration.
Gross domestic product (GDP) growth moderated to 4.4% in 2015 from 6.4% in 2014 on the back of weak commodity prices and prevailing drought conditions. Growth at 4.2% in 2016 is expected to remain subdued due to weak external demand but should rebound in 2017 as new mines start producing and exporting. Falling Southern Africa Customs Union (SACU) revenues due to a fragile South African economy, inadequate international reserves and a rapid rise in house prices are key risk factors going forward. Tight monetary policy to contain rising credit linked to luxury imports and low global oil prices has reduced inflation, year-on-year, from 5.3% in 2014 to 3.5% in 2015. The repo rate was increased twice in 2015 to reach the current 6.5%. However, further depreciation of the local currency and higher anticipated food prices due to drought are expected to counter the benefits from lower international oil prices and should push inflation to breach the upper end of the South African Reserve Bank (SARB) target range of 3-6%.
Political stability and sound macroeconomic management are promoting investments and sustaining Namibia’s high growth rates. Benefiting from its strong links to South Africa, Namibia attracts more investment than average sub-Saharan countries. However, to accelerate convergence with high-income countries in line with its current National Development Plan, the authorities need to address remaining structural bottlenecks. Having passed a new Public Procurement Law in 2015, work on Public Finance Management law must be speeded up to reinforce economic governance. Fiscal consolidation, including current expenditure prioritisation and public sector wage bill containment, should complement revenue mobilisation measures to improve fiscal and current account balances. Efforts to improve the quality and relevance of education must be stepped up and anti-corruption efforts redoubled to recapture public confidence and strengthen the country’s strong governance record.
Namibia’s rate of urbanisation has accelerated. Growing at 4.5% per year, the urban population as a share of total population increased from 28% in 1991 to 43% in 2011. The rate of urbanisation has been higher than the population growth rate of 3.5%. This has led to mushrooming of informal settlements in the major towns and urban centres. This has largely resulted from low access to serviced land and low incomes among unskilled and semi-skilled immigrants. About 74% of the Namibian households cannot afford conventional housing and only 57% of urban households have access to sanitation facilities, which has serious environmental and health implications. The government’s ongoing public housing programme will need to be completed with better urban infrastructure development programmes and further strengthening of rural growth points to create more rural jobs.
Macroeconomic indicators
2014 2015(e) 2016(p) 2017(p)
Real GDP growth 6.4 4.4 4.2 6.0
Real GDP per capita growth 4.0 2.1 1.9 3.8
CPI inflation 5.3 3.5 3.9 5.5
Budget balance % GDP -4.3 -3.8 -3.1 -3.7
Current account % GDP -10.4 -8.1 -11.3 -11.1
Source: Data from domestic authorities; estimates (e) and projections (p) based on authors’ calculations.

COUNtrY NOtES
307African Economic Outlook© AfDB, OECD, UNDP 2016306 African Economic Outlook © AfDB, OECD, UNDP 2016
nIGER
• Economic growth slowed to 3.6% in 2015 (down from 7.0% in 2014) because of weather problems and the steady fall in world prices of uranium and oil, but is forecast to pick up again in 2016 (projected at 5.0%) and 2017 (at 5.5%).
• The Boko Haram rebels, their effect on trade and managing the flow of refugees continue to be a major economic, security, social and budgetary challenge.
• Only 16.2% of the population is urban, but this group is growing fast (at an average 4% a year) and faces poor housing, water and electricity supplies and other services for businesses and households.
Niger’s economic growth eased to 3.6% in 2015 from 7.0% in 2014 due to weather problems, less activity in the Diffa area (affected by the fight against the Boko Haram rebels) and the drop in uranium prices. Agriculture continues to drive the economy, and as it is mostly rain-fed, it is very much at the mercy of climate-related shocks. Economic prospects are quite good, mainly because of the expected expansion of extractive industries and more investment in agriculture and transport. Growth is projected to improve to 5.0% in 2016 and 5.5% in 2017.
Security and humanitarian problems due to increased attacks by Boko Haram rebels undermined budget execution and could slow planned reforms and major development under the 2012-15 economic and social development programme (PDES) and its successor. The sharp rise in spending on national security increased current expenditure in the budget. Continued spending on infrastructure for development in remote areas is important to reduce the vulnerability that feeds extremism there.
Niger is a vast landlocked country of 1 267 000 km² with only 16.2% of the population living in towns and cities in 2012, slightly up from 15.2% in 1988. The urban population’s average annual growth rate of 4% means the number of urban dwellers will double over the next 15 years, but this growth has not been matched by expansion of infrastructure (housing, water, electricity and other services to business and households) and has led to great inequality in towns and cities. The main risk of current urban growth is the rise of unplanned neighbourhoods in urban and peri-urban areas. The government set up an institutional and legal framework for urban development (SNDU) in 2004 and gave it various means to operate, but these have been little used.
Macroeconomic indicators
2014 2015(e) 2016(p) 2017(p)
Real GDP growth 7.0 3.6 5.0 5.5
Real GDP per capita growth 2.9 -0.5 0.9 1.4
CPI inflation -0.9 1.0 1.3 0.9
Budget balance % GDP -5.5 -7.1 -6.7 -4.4
Current account % GDP -20.9 -21.2 -21.9 -17.5
Source: Data from domestic authorities; estimates (e) and projections (p) based on authors’ calculations.
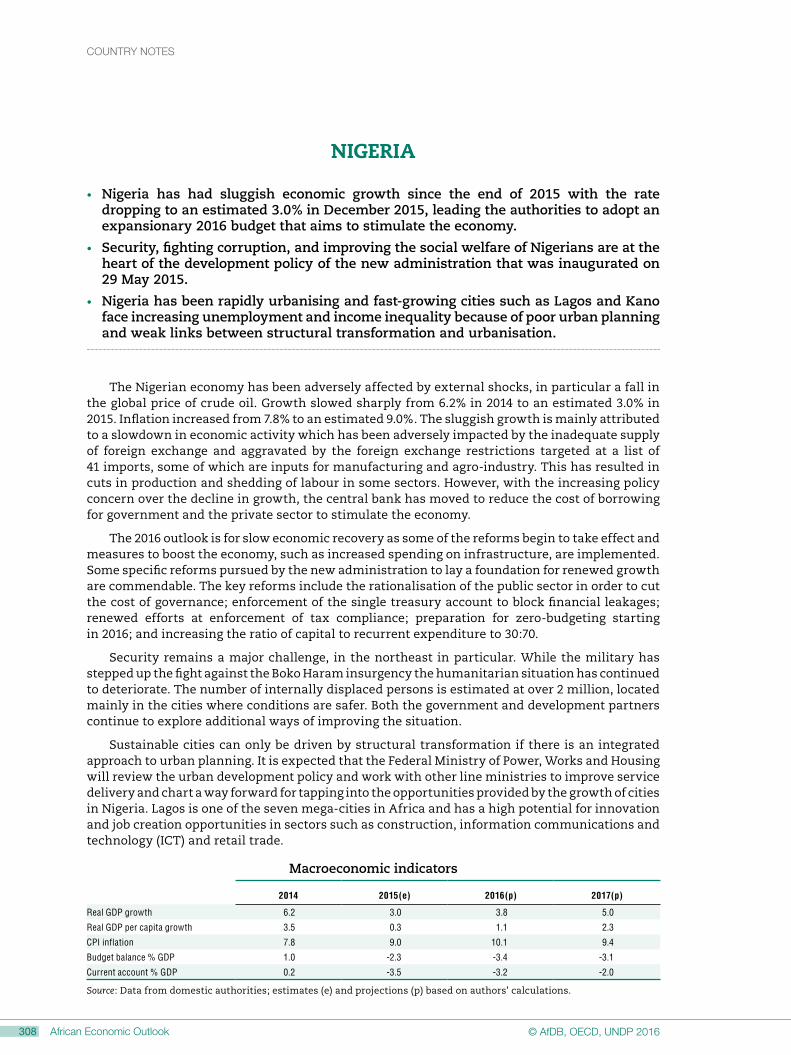
COUNtrY NOtES
308 African Economic Outlook © AfDB, OECD, UNDP 2016
nIGERIA
• Nigeria has had sluggish economic growth since the end of 2015 with the rate dropping to an estimated 3.0% in December 2015, leading the authorities to adopt an expansionary 2016 budget that aims to stimulate the economy.
• Security, fighting corruption, and improving the social welfare of Nigerians are at the heart of the development policy of the new administration that was inaugurated on 29 May 2015.
• Nigeria has been rapidly urbanising and fast-growing cities such as Lagos and Kano face increasing unemployment and income inequality because of poor urban planning and weak links between structural transformation and urbanisation.
The Nigerian economy has been adversely affected by external shocks, in particular a fall in the global price of crude oil. Growth slowed sharply from 6.2% in 2014 to an estimated 3.0% in 2015. Inflation increased from 7.8% to an estimated 9.0%. The sluggish growth is mainly attributed to a slowdown in economic activity which has been adversely impacted by the inadequate supply of foreign exchange and aggravated by the foreign exchange restrictions targeted at a list of 41 imports, some of which are inputs for manufacturing and agro-industry. This has resulted in cuts in production and shedding of labour in some sectors. However, with the increasing policy concern over the decline in growth, the central bank has moved to reduce the cost of borrowing for government and the private sector to stimulate the economy.
The 2016 outlook is for slow economic recovery as some of the reforms begin to take effect and measures to boost the economy, such as increased spending on infrastructure, are implemented. Some specific reforms pursued by the new administration to lay a foundation for renewed growth are commendable. The key reforms include the rationalisation of the public sector in order to cut the cost of governance; enforcement of the single treasury account to block financial leakages; renewed efforts at enforcement of tax compliance; preparation for zero-budgeting starting in 2016; and increasing the ratio of capital to recurrent expenditure to 30:70.
Security remains a major challenge, in the northeast in particular. While the military has stepped up the fight against the Boko Haram insurgency the humanitarian situation has continued to deteriorate. The number of internally displaced persons is estimated at over 2 million, located mainly in the cities where conditions are safer. Both the government and development partners continue to explore additional ways of improving the situation.
Sustainable cities can only be driven by structural transformation if there is an integrated approach to urban planning. It is expected that the Federal Ministry of Power, Works and Housing will review the urban development policy and work with other line ministries to improve service delivery and chart a way forward for tapping into the opportunities provided by the growth of cities in Nigeria. Lagos is one of the seven mega-cities in Africa and has a high potential for innovation and job creation opportunities in sectors such as construction, information communications and technology (ICT) and retail trade.
Macroeconomic indicators
2014 2015(e) 2016(p) 2017(p)
Real GDP growth 6.2 3.0 3.8 5.0
Real GDP per capita growth 3.5 0.3 1.1 2.3
CPI inflation 7.8 9.0 10.1 9.4
Budget balance % GDP 1.0 -2.3 -3.4 -3.1
Current account % GDP 0.2 -3.5 -3.2 -2.0
Source: Data from domestic authorities; estimates (e) and projections (p) based on authors’ calculations.

COUNtrY NOtES
309African Economic Outlook© AfDB, OECD, UNDP 2016308 African Economic Outlook © AfDB, OECD, UNDP 2016
RWAndA
• Real GDP grew by an average of 6.9% during the first three quarters of 2015, in line with the 7.0% target for 2015. It is projected to decrease to 6.8% this year before going back up to 7.2% in 2017.
• The indicators for rule of law, political rights and civil liberties, participation and inclusiveness, and safety and security have all improved.
• With urbanisation an emerging priority, measures are being implemented to position Kigali as a centre for investment and business growth. There is also a focus on promoting balanced and transformative urbanisation through the development of secondary cities.
Real GDP grew by an average of 6.9% in the first three quarters of 2015, lower than the 7.2% average recorded during the same period in 2014. However, the 6.9% rate is in line with the 7.0% target for 2015. The services and industry sectors led the expansion during this period. Growth in the agriculture sector, however, was moderate in part due to fluctuations in weather conditions. For 2016 and 2017, sustained investments to address energy and transport infrastructure constraints, continued progression in industry and a recovery in services are expected to lead growth. Agriculture is projected to grow at a moderate rate.
Headline inflation is projected to remain below the central bank’s medium-term target in 2016 and 2017. Inflationary pressures are expected to remain subdued due to low fuel and food prices. Strong demand for capital, intermediate goods and fuel products is projected to persist in the short to medium term in line with the public investment programme. Current account deficits are expected to remain high in the near term as export receipts continue to account for only 25% of imports.
Rwanda’s urban population accounted for 28.0% of its total population in 2014, which is lower than the sub-Saharan Africa (SSA) and global averages of 37.0% and 53.0% respectively. However, the 5.9% annual urbanisation rate exceeds the averages of 4.2% and 2.1% for SSA and the world respectively. This calls for an integrated urban/rural development approach to ensure sustainability and to link urban development objectives with other goals, notably socio-economic transformation. Implementation of the Urbanization and Rural Settlement Strategy (2013-18) is underway. This strategy focuses on two objectives. The first objective is to enhance Kigali’s development and provide urban planning and management support to the districts. The second objective relates to the creation of balanced urbanisation for economic inclusion and transformation. In this regard, six secondary cities are at various levels of development, the goal being to transform budding trade and transport centres into regional growth poles. Achieving these objectives is expected to increase the urbanisation rate to 35.0% by 2020.
Macroeconomic indicators
2014 2015(e) 2016(p) 2017(p)
Real GDP growth 7.0 7.1 6.8 7.2
Real GDP per capita growth 4.6 4.7 4.5 4.9
CPI inflation 2.4 2.5 3.0 3.0
Budget balance % GDP -4.0 -5.0 -4.9 -5.6
Current account % GDP -11.8 -12.3 -11.9 -11.4
Source: Data from domestic authorities; estimates (e) and projections (p) based on authors’ calculations.

COUNtrY NOtES
310 African Economic Outlook © AfDB, OECD, UNDP 2016
sAo TomE And PRIncIPE
• The Sao Tome and Principe economy grew by 5.3% in 2015, up from 4.5% in 2014, but should drop back to 5% in the next two years
• Sao Tome and Principe was the top Central African performer for overall governance in the 2015 Ibrahim index with key improvements in economic opportunity, human rights and rule of law.
• The rural move into the city has made a national urbanisation strategy imperative in the absence of any national planning.
The Sao Tome and Principe economy grew by 5.3% in 2015, up from 4.5% in 2014. Economic growth is expected to remain above 5% in 2016 and 5.4% in 2017. Increased foreign direct investment in construction, agriculture, tourism and new projects funded by donors should lead and boost future growth. Inflation will decline to about 4.6% in 2016 and 4.7% in 2017, from 5.3% in 2015, backed by the fixed exchange rate regime. Structural reforms for sustainable economic growth and job creation are central to the government’s economic reform agenda. The reforms include improving the taxpayer registry and expanding the tax base by registering new taxpayers. The government has also revised its investment code, prepared financial sector and private sector development strategies and is implementing an automatic price adjustment mechanism for petroleum products. Effective implementation of the reforms and strategies will improve public administration efficiency and social services for the population.
The credibility, accountability and transparency of the SAFE financial administration system remain critical for the government. The system was started as a pilot project in four ministries dealing with decentralisation and was used to prepare the 2010, 2011, and 2012 financial accounts. The government is also finalising the establishment of an electronic financial control department to assist with financial accounts reporting.
The capital, Sao Tome, is the only urban agglomeration. Its 131 000 people in 2015 represented 68% of the total population. The city and its surrounding area is subject to increased urbanisation. The island of Principe (7 450 inhabitants in 2015) has no urban agglomeration. Although migration to the city seems to be slowing, the average annual urbanisation growth rate is estimated at 1.87% for 2013 to 2018.
Macroeconomic indicators
2014 2015(e) 2016(p) 2017(p)
Real GDP growth 4.5 5.3 5.0 5.4
Real GDP per capita growth 2.3 3.1 2.9 3.3
CPI inflation 6.7 5.3 4.6 4.7
Budget balance % GDP -5.5 -6.1 -3.9 -4.0
Current account % GDP -24.2 -14.0 -13.8 -13.5
Source: Data from domestic authorities; estimates (e) and projections (p) based on authors’ calculations.

COUNtrY NOtES
311African Economic Outlook© AfDB, OECD, UNDP 2016310 African Economic Outlook © AfDB, OECD, UNDP 2016
sEnEGAl
• Growth of gross domestic product (GDP) in Senegal in 2015 is estimated to have been 5.1% in 2015 and is predicted to reach 6.0% in 2016 and 6.5% in 2017.
• The establishment of a precautionary reserve in 2015 and its continuation in the 2016 budget are examples of results-based management in line with the directives of the West African Economic and Monetary Union (WAEMU) relating to public finances.
• Urban development provides opportunities linked to economic sector diversification, but the inflow of people from the countryside raises the issue of sustainable urban management.
The growth rate is on the rise and should have reached 5.1% in 2015, as against 4.3% in 2014, driven by the vigour of the agricultural sector, the continuing recovery of the vegetable oil and sugar industries, the dynamic cement industry, building and public works, energy, telecommunications and financial services. Nevertheless growth was slightly lower than the authorities’ predictions of 5.4% and is forecast to be 6% and 6.5% in 2016 and 2017 respectively.
The implementation of the flagship projects in the Emerging Senegal Plan (Plan Sénégal émergent [PSE]) entered its second year in 2015, along with the major reforms which should speed up their completion. Of the 17 flagship projects launched so far (out of a total of 27) 10 are being implemented, one is operational and six are in the study phase. One of the PSE flagship projects is the development of integrated industrial platforms, and work began in 2015 on the special economic zone of Diamniadio, which will be a multifunctional urban platform. The authorities must ensure the sustained implementation of the major reforms, in particular in the fields of energy, property rights, logistics and infrastructure, as well as information and communication technologies and the business environment.
Urbanisation is constantly increasing in Senegal, where the urban population rose from 38% in 1988 to 45.2% in 2013 due mainly to the exodus from the countryside. Urban development provides opportunities linked to economic sector diversification and to transport infrastructure development between the country’s different regions. The promotion of urban hubs in regions with strong economic potential is achieved through a policy of major equipment and infrastructure projects with significant economic and social impacts. However the inflow of people from rural areas brings with it a substantial demand for socio-economic infrastructure and leads to environmental damage, thereby raising the issue of sustainable urban management.
Macroeconomic indicators
2014 2015(e) 2016(p) 2017(p)
Real GDP growth 4.3 5.1 6.0 6.5
Real GDP per capita growth 1.1 2.0 3.0 3.4
CPI inflation -0.5 0.0 -0.4 1.2
Budget balance % GDP -5.2 -4.6 -4.1 -3.2
Current account % GDP -9.0 -8.1 -6.0 -4.2
Source: Data from domestic authorities; estimates (e) and projections (p) based on authors’ calculations.

COUNtrY NOtES
312 African Economic Outlook © AfDB, OECD, UNDP 2016
sEycHEllEs
• In July 2015 Seychelles reached high-income status, reflecting the government’s sound macroeconomic policies and comprehensive structural reforms in recent years that have supported robust economic growth, averaging 5.3% during 2011-15.
• Seychelles’ medium-term growth outlook is moderate, with GDP projected to grow at 3.1% in 2016 and 3.7% in 2017 while the traditional tourism and fisheries sectors are expected to remain the main drivers.
• With potential increases in economic activities in non-traditional sectors, such as high-value added manufacturing and growth of population, changing consumption patterns and the limited land available, rapid urbanisation represents a major challenge for the towns of Seychelles and, indeed, all small island developing states.
In July 2015 Seychelles reached high-income status, after average gross national income (GNI) per capita reached USD 13 710 in 2013-14. The government has implemented sound macroeconomic policies and comprehensive structural reforms in recent years, which have supported robust economic growth, averaging 5.3% during 2011-15, driven primarily by tourism and information and communication technology (ICT). Growth rates nonetheless registered an overall downward trend from about 7.9% in 2011 to an estimated 4.6% in 2015, mainly because of decelerating growth in construction, as several large projects ended in those years. Seychelles’ medium-term growth outlook is moderate, with gross domestic product (GDP) projected to grow at 3.1% in 2016 and 3.7% in 2017. The traditional tourism and fisheries sectors are expected to remain the main drivers of growth. Prudent fiscal and monetary policies have helped consolidate macroeconomic stability, and inflation is expected to remain below 3% in 2016 and 2017.
Seychelles continues to face a number of challenges. The country suffers from insufficient economic diversification and vulnerability to external shocks, given the dependence of its economy on tourism and fisheries. The development of the private sector is therefore paramount in achieving a more diversified economy, reducing vulnerability and shielding the country from shocks. However, the private sector requires a more enabling environment to exploit its potential fully and expand into new business areas. Furthermore, growth needs to be made greener to protect Seychelles’ fragile natural environment better against the adverse impacts of climate change.
To promote the socio-economic development of the country, the government adopted the National Development Strategy (NDS) 2015-19 in November 2015, with the concept of the “Blue Economy” as its centrepiece. The concept emphasises the economic potential of Seychelles’ vast Exclusive Economic Zone (EEZ), a marine area of 1 374 000 km2 (the second largest in Africa), for inclusive growth. This innovative concept integrates conservation and sustainable use of ocean resources, oil and mineral wealth extraction, bio-prospecting, sustainable energy production and marine transport, as well as branding Seychelles a “blue” tourism destination. The NDS 2015-19 focuses on four “key results areas”: governance, economic development, social development, and environment and energy.
Seychelles is a small island developing state (SIDS), with high income inequality: the 2006/07 household survey measured the Gini coefficient of income inequality at 65.8. Poverty levels are, however, very low with only 0.25% of the population living on USD 1.25 or less per day in 2007. Around 90% of the 94 000 inhabitants live on Mahé, one of three main islands. However, with its limited land space and high population density, the country needs to observe a delicate balance in addressing land use, conservation and economic development. The country has begun to design policies and plans to address these issues holistically.

COUNtrY NOtES
313African Economic Outlook© AfDB, OECD, UNDP 2016312 African Economic Outlook © AfDB, OECD, UNDP 2016
Macroeconomic indicators
2014 2015(e) 2016(p) 2017(p)
Real GDP growth 3.7 4.6 3.1 3.7
Real GDP per capita growth 3.0 4.0 2.5 3.1
CPI inflation 1.4 4.4 2.6 2.7
Budget balance % GDP 2.2 1.9 1.4 1.0
Current account % GDP -21.3 -14.2 -15.4 -15.9
Source: Data from domestic authorities; estimates (e) and projections (p) based on authors’ calculations.

COUNtrY NOtES
314 African Economic Outlook © AfDB, OECD, UNDP 2016
sIERRA lEonE
• Sierra Leone is currently grappling with the after-effects of the Ebola crisis and the sustained decline in iron ore prices. Accordingly, GDP for 2015 is estimated to have contracted by more than one-fifth.
• Remedial actions and policies are needed to improve the indicators that may have been reversed by the Ebola Virus Disease (EVD) crisis, following positive strides in improved economic and political governance.
• Sierra Leone, with approximately 40% urban population is experiencing its urbanisation without industrialisation (manufacturing), which does not promote appropriate structural linkages and sustained transformation of the economy.
Sierra Leone is on the path to recovery following the effects of an 18-month Ebola outbreak and the sustained decline of iron ore prices. The Ebola outbreak affected the socio-economic livelihoods of the country, disrupting normal health care and education services, agricultural production and trade. The iron ore price decline affected macro-financial stability and reversed the country’s remarkable positive growth trajectory as economic growth declined from a buoyant 20.1% in 2013 to 4.6% in 2014 and thereafter contracted by 21.5% in 2015 according to the latest estimates. GDP in 2016 is expected to remain relatively unchanged and to rise moderately in 2017. Inflation, which was moderate in the first quarter of 2015, is now estimated at 9.9% for 2015 and is expected to hover around 10% in 2016 and 2017. The Bank of Sierra Leone (BSL) needs to be vigilant as regards second-round inflationary pressures resulting from the depreciation of the Leone and the bottoming out of crude oil prices. Fiscal space in Sierra Leone is very limited due to the historically low revenue to GDP ratio and higher government expenditure.
There have been significant gains in the Human Development Index (HDI) from 0.344 in 2005 to 0.413 in 2014 (an improvement of more than 20%), and this will most likely be reversed due to the impact of the EVD on health (i.e. life expectancy at birth), education (years of schooling) and standard of living (gross national income per capita). Having failed to achieve most Millennium Development Goals (MDGs) by 2015, government authorities and development partners on the ground are now aware of the pertinence and inseparability of the 17 Sustainable Development Goals (SDGs) which essentially means that development work should be across all sectors. Government needs to do more on poverty reduction using the new poverty-related data and information which will be generated by the population and housing census conducted in December 2015.
Sierra Leone has a population of about 6.3 million with approximately 39.1% living in urban areas (Freetown, Bo, Kenema, Makeni and other urban areas) in 2015 and the urbanisation rate is projected to reach 43.8% in 2030. Manufacturing is the “missing link” in Sierra Leone’s structural transformation as labour migrates from low productivity agricultural activities in the rural areas directly to low productivity services (informal jobs in the urban areas) without a transformative industrial sector.
Macroeconomic indicators
2014 2015(e) 2016(p) 2017(p)
Real GDP growth 4.6 -21.5 0.2 3.7
Real GDP per capita growth 2.4 -23.7 -1.9 1.6
CPI inflation 7.1 9.9 10.0 10.1
Budget balance % GDP -3.0 -3.7 -6.0 -6.0
Current account % GDP -16.4 -11.3 -8.4 -8.1
Source: Data from domestic authorities; estimates (e) and projections (p) based on authors’ calculations.

COUNtrY NOtES
315African Economic Outlook© AfDB, OECD, UNDP 2016314 African Economic Outlook © AfDB, OECD, UNDP 2016
somAlIA
• The country’s economic base continues to be narrow with the majority of people depending on livestock and fisheries.
• The small tax base and weak public financial management continue to cause serious constraints on the government budget, thus leaving the country almost totally dependent on foreign assistance and remittances.
• While the main obstacles to commerce, investment, and government revenue collection continue to be a lack of peace and security, the Somali National Army (SNA) has had success in recovering many areas that were under Al-Shabaab’s control.
Somalia’s economy remains fragile, as recovery continues to be hampered by the challenging security environment, poor infrastructure and limited financial resources. The country’s dependence on agriculture and livestock in particular (which is a vital export commodity) reflects its narrow economic base and vulnerability to adverse external and environmental shocks. This also constrains the Federal Government of Somalia’s (FGS) capacity to generate sufficient revenue to support its economic reconstruction and development agenda and stabilise the macroeconomic environment.
The IMF estimated real GDP to be 2.7% in 2015, driven by growth in agriculture, financial services, construction and telecommunications. Assuming gradual progress on the security front and absence of droughts, medium-term annual real GDP growth is projected at about 5%. Nevertheless, growth will remain inadequate to address the widespread poverty in the country. Creating jobs for the youth, providing social services such as education and health, and building sustainable livelihoods continue to be Somalia’s key development challenges.
In a bid to attract investment, the FGS is taking steps in a few strategic areas. These include: i) trying to ease the flow of imports and exports; ii) creating more financial stability and legitimacy in the country; iii) facilitating the continued flow of remittances; and iv) rebuilding and developing basic infrastructure.
In June 2015, the Ministry of Planning and International Co-operation initiated the process of developing a National Development Plan (NDP) that will be the post-2016 planning framework for Somalia. The NDP framework will define the country’s development priorities over a five-year period. The plan will also outline internal and external financing needs and major sources of funding and will guide the allocation of resources and prioritisation of government actions and international development support. The NPD will also serve as the Interim Poverty Reduction Strategy Paper (IPRSP), until a full-fledged official one is developed, and will include a vision and direction for Somalia’s socio-economic development and poverty reduction.
The FGS has also set up a unit within the Prime Minister’s office to develop a framework for public sector capacity building. This process is ongoing and will slowly start to enhance the Federal government capabilities and responsiveness. However, the current tight fiscal space, with extremely limited revenue raising capacity, combined with the challenging security situation, makes it difficult to attract skilled professionals into the public sector, thereby limiting the government’s capacity to deliver services.

COUNtrY NOtES
316 African Economic Outlook © AfDB, OECD, UNDP 2016
souTH AFRIcA
• GDP growth declined from 1.5% in 2014 to 1.3% in 2015, and is expected to weaken further to 0.7% in 2016. Electricity shortages, low commodity prices and low consumer and business confidence continue to restrain the growth of economic activity.
• Slow progress in delivering economic and social services in townships and rural areas remains one of the major challenges to government.
• South African cities are dynamic poles of socio-economic activity facing high inequality and environmental risks.
Economic performance remained challenging in 2015, with GDP growth of only 1.3%. This sluggish growth was primarily due to depressed commodity demand from China, low global commodity prices, low investment, erratic capital flows and low consumer and business confidence. Real GDP growth is forecast to continue its downward trend in 2016, with an estimated rate of just 0.7%. The public sector wage bill has been expanding while economic growth has been very slow. Persistent shortages in electricity have had a knock-on effect on the economy, while the worst drought in two decades continues to devastate agriculture whose real proportion of GDP has been reduced by 16.2%.
The Rand (ZAR) depreciated by more than 30% between December 2014 and December 2015. Consumer price index (CPI) inflation remained in 2015 within the target range of 3% to 6% year-on-year but, owing to the continued currency depreciation and the ongoing drought, pressures on the CPI will persist in 2016. Limited electricity supply has also weighed down manufacturing, mining and service-sector activity.
National government revenue increased by 8.4% to reach ZAR 955 billion (24.8% of GDP) boosted by higher personal income tax, taxes on property and value added taxes, while national-government expenditure increased by 8% to reach ZAR 1.13 trillion (29.4% of GDP). Monetary policy has been tightened with the repurchase rate reaching 6.75% to respond to the rising inflation risk. Despite the increased rate, demand for credit by the private sector rose by 8.6% in August 2015 compared to 8% in June.
Unemployment remains stubbornly high at 25.3%, and is particularly pervasive among the youth, at 52.5% in 2015. High unemployment, especially among black South Africans, is the main cause of the widening income inequality, as shown by a Gini Coefficient of 0.69, which is one of the highest in the world. To resolve these challenges, the government unveiled a nine-point plan to kick-start economic growth, increase investment and create jobs.
Socio-economic inequalities continue to threaten long-term stability. The legacies of apartheid, poor service delivery and widespread poverty have characterised socio-political discourse throughout 2015. Protests against service delivery were widespread in various parts of the country.
Macroeconomic indicators
2014 2015(e) 2016(p) 2017(p)
Real GDP growth 1.5 1.3 0.7 1.8
Real GDP per capita growth 0.5 0.3 -0.2 0.9
CPI inflation 6.1 4.6 6.8 7.0
Budget balance % GDP -3.6 -3.9 -3.3 -3.1
Current account % GDP -5.4 -4.3 -4.1 -4.0
Source: Data from domestic authorities; estimates (e) and projections (p) based on authors’ calculations.

COUNtrY NOtES
317African Economic Outlook© AfDB, OECD, UNDP 2016316 African Economic Outlook © AfDB, OECD, UNDP 2016
souTH sudAn
• The drop in oil revenues is having a significant negative impact on the South Sudan’s economy; the level of GDP is estimated to have fallen by more than 5% in 2015, and the government net oil-revenue forecast for the 2015/16 fiscal year was only 17% of the previous year.
• The parties to the South Sudan civil conflict signed a Peace Agreement in August, although significant progress in its implementation has been slow.
• The humanitarian situation continues to deteriorate, with over 2.2 million people displaced by the continuing civil conflict as of November 2015.
Since independence in 2011, the political landscape in South Sudan has continued to be dominated by both internal and external threats to sustainable peace and stability. In December 2013, the country descended into protracted strife which has heightened uncertainty in the country. The parties to the conflict finally signed a peace agreement in August 2015 but timely implementation is a significant challenge. For instance, the time for the parties to form a transitional government expired. The conflict comes at a huge humanitarian cost. As of November 2015, over 2.2 million people, an increase of 200 000 since the beginning of 2015, have been displaced. Over 1.6 million people have been displaced internally while over 616 000 people have fled to neighbouring states. Severe food insecurity is expected to affect 4.6 million people this year, compared to 3.8 million last year, at the height of the lean season. The incidence of poverty has worsened from 44.7% in 2011 to more than 57% in 2015.
The challenges of the civil conflict are compounded by enormous economic and fiscal problems. The government budget is facing a huge shortfall caused by the sharp decline in oil revenues. South Sudan is one of the most oil-dependent countries in the world, with oil accounting for almost the totality of exports, around 60% of gross domestic product (GDP), and over 95% of the government revenues in previous fiscal years. Oil production in 2014-15 was 40% lower than projected in November 2013. In addition to the sharp fall in production, there has been a collapse of international oil prices, declining from close to 110 United States dollars (USD) per barrel in July 2014 to less than USD 35 per barrel in January 2016. The drop in oil revenues has led to a sharp reduction in the government’s revenues, preventing investment in development activities. Government net oil-revenue forecast for the 2015/16 fiscal year is only 17% of the previous year. In the last few years, GDP growth has been very erratic, driven by conflict and fluctuations in oil prices. By the African Development Bank estimates, after experiencing a 15.9% increase in 2014, growth is expected to experience a decline of -5.3% in 2015. The predictions are a small recovery in 2016 with 0.7% growth rate, and a revival in 2017 with 8.8% growth rate. However, the realisation of the forecast will depend on the recovery of oil prices and the implementation of the peace agreement.
Macroeconomic indicators
2014 2015(e) 2016(p) 2017(p)
Real GDP growth 15.9 -5.3 0.7 8.8
Real GDP per capita growth 13.3 -7.9 -1.8 6.3
CPI inflation 1.7 41.1 14.7 25.0
Budget balance % GDP -10.9 -21.3 -22.0 -18.1
Current account % GDP 4.0 -2.5 0.9 2.8
Source: Data from domestic authorities; estimates (e) and projections (p) based on authors’ calculations.

COUNtrY NOtES
318 African Economic Outlook © AfDB, OECD, UNDP 2016
sudAn
• Sudan’s economic growth rose to above 5% in 2015 and is expected to increase further to above 6% in 2016 and 2017, mainly driven by agriculture and extractive industries and supported by improved macroeconomic policies.
• Challenges continue to be sustaining economic policy reforms, economic stability, civil war, and meeting the country’s Millennium Development Goals (MDGs); but a positive outcome of the national dialogue is hoped to lead to an end of the civil war and improvement in economic stability.
• A coherent urban-development strategy is needed to better cope with population growth, the internal displacements of people due to the continuing civil war and the currently weak urban-rural linkages.
Inflation declined to 16.9% in 2015, while real GDP growth remained buoyant at 5.3%, supported by agriculture, minerals, services, oil-transit fees and foreign direct investment (FDI). Growth is expected to strengthen to 6.2% in 2016 and 6% in 2017, despite the fall in oil prices, reduced gold purchases by the Central Bank and the unstable security situation. The forecast is based on the assumption of strong agricultural revival, a gradual recovery of global oil prices, political stability in South Sudan, sustained inflows of FDI and a positive outcome from the national dialogue to end the civil war and conflicts.
Fiscal and monetary consolidation, together with low global food prices and a significant increase in FDI by 37%, have boosted economic growth and helped to reduce inflation from 36.9% in 2014 to 16.9%. Nonetheless, the challenges of diversification and social development, including high unemployment, poverty and unequal distribution of wealth, in the context of the civil war still remain. Spending on social development in 2015 is unlikely to be higher than it was in 2014 (0.3% of GDP) and is not expected to rise in 2016. Challenges of the external-debt problem and normalisation of relations with creditors also continue to persist. The government has yet to agree on a new IMF-Staff Monitored Programme (SMP) as a prelude for reaching a decision on the Heavily Indebted Poor Countries (HIPCs) Initiative. In 2015, Sudan was removed from the “black list” of the Financial Action Task Force, an international financial-fraud monitoring body located at the OECD. However, the continued difficulties of processing international banking transactions may fuel informal transfers, contribute to exchange-rate distortion, and reduce fiscal revenues.
Sudan‘s cities contributed an estimated 60% of GDP in 2014, with a skills base 62% higher than in rural areas. In urban areas, job creation is above average and the poverty rate is less than half of the national average. By 2030, the urban population will represent 48.6% of the total, reflecting a continuing contraction in the share of the rural population. However, since 1990 urban growth has been propelled by rural-urban migration, internally displaced people (IDPs) due to the civil war and conflict, climate-change impacts on the environment, and population growth. This has led to serious strains on urban services and disrupted the urban-rural market links that are of key importance for agriculture-based structural transformation. Policies adopted to upgrade slums have resulted in low-density, auto-dependent sprawl, further adding to urban services delivery inefficiencies. The adoption of an urban-development strategy aiming to improve infrastructure, land governance, and involve the private sector more in urban development is, therefore, inevitable if Sudan is to harness the potential benefits of its rapidly growing urban sector.
Macroeconomic indicators
2014 2015(e) 2016(p) 2017(p)
Real GDP growth 3.6 5.3 6.2 6.0
Real GDP per capita growth 1.4 3.1 3.9 3.7
CPI inflation 36.9 16.9 13.1 11.2
Budget balance % GDP -1.0 -1.5 -1.4 -1.0
Current account % GDP -9.0 -6.5 -6.4 -6.2
Source: Data from domestic authorities; estimates (e) and projections (p) based on authors’ calculations.

COUNtrY NOtES
319African Economic Outlook© AfDB, OECD, UNDP 2016318 African Economic Outlook © AfDB, OECD, UNDP 2016
sWAZIlAnd
• Economic growth slowed down in 2015 to 1.7%, mainly because of severe drought, with prospects in 2016 and 2017 remaining poor.
• The political scene has remained relatively calm since the September 2013 elections, but the ranking in participation and human rights remains low.
• Increased urbanisation has resulted in development tensions and challenges that the government remains committed to address so as to ensure maximum economic benefit and sustainability.
Real gross domestic product (GDP) growth slowed from 2.5% in 2014 to 1.7% in 2015. The major factors include a drought that hurt agricultural production, a weaker mining sector and subdued prospects in South Africa, the major trading partner. Growth in the tertiary sector also slowed down, but the overall impact was cushioned by an increase in investment in government capital investment programmes. Short-term prospects in 2016 and 2017 remain muted, with economic growth expectations remaining below 2% per annum. Growth prospects are predicated on improved weather conditions and enhanced policy efforts to address critical challenges in areas such as the business climate and export diversification. This is particularly important in view of the country’s loss of eligibility under the African Growth and Opportunity Act (AGOA) in January 2015 and its high dependence on volatile revenues from the Southern African Customs Union (SACU).
Major social challenges include the high rate of HIV/AIDS and an uneven distribution of resources. Despite its classification as a low middle-income country, the incidence of poverty is high, with 63% of the population living below the poverty line. Other problems include a high unemployment rate of 28.1%, and a low Human Development Index (HDI) ranking of 150 out of 187 countries; Swaziland’s HDI score of 0.531 is mainly due to the high maternal mortality rate, underdeveloped labour markets and mistrust in national government. There has been some progress over the past three decades in the fight against HIV/AIDS and the incidence rate has declined trend from 3.1% in 2010 to 2.23% in 2013, to 1.94% in 2015, but the HIV prevalence of 26% among 15-49 year olds is among the highest in the world. This has translated into increased health spending and high numbers of orphaned and vulnerable children requiring social protection.
Swaziland is among the smallest countries in Africa in both size and population of whom 78% live in rural areas and 22% in urban areas. It is projected that the share of the population living in towns and cities will rise to 26.5% by 2030. The main urban centres are Mbabane, the administrative capital, and Manzini, the commercial hub. The two cities and the corridor between them support approximately 75% of the country’s urban population. Growth in both Manzini and Mbabane has been largely informal and about 60% of urban Swazi households live in unplanned and/or un-serviced informal settlements. The central location of the Manzini-Mbabane corridor makes it a prime area for transportation networks linking to other areas in the country, with consequent overcrowding as a result of internal migration. Other challenges arising from increased urbanisation include providing adequate access to sanitation and power, and dealing with air and water pollution, inadequate waste management and increased crime rates. Local governments are hard pressed to raise adequate financial resources to address these challenges and mainly rely on transfers from the central government. The government remains committed to prioritising urban development, through initiatives such as the Urban Development Programme, so as to harness fully the inherent potential from this key segment of the economy while ensuring its sustainability.
Macroeconomic indicators
2014 2015(e) 2016(p) 2017(p)
Real GDP growth 2.5 1.7 0.8 1.7
Real GDP per capita growth 1.0 0.3 -0.5 0.4
CPI inflation 5.7 5.6 6.0 6.7
Budget balance % GDP 0.7 -1.4 -1.8 -2.1
Current account % GDP 2.9 0.9 1.6 1.5
Source: Data from domestic authorities; estimates (e) and projections (p) based on authors’ calculations.

COUNtrY NOtES
320 African Economic Outlook © AfDB, OECD, UNDP 2016
TAnZAnIA
• The economy grew by 7% in 2014 and estimates suggest the same growth rate in 2015, mainly driven by the services, industry, construction, and information and communication sectors. The fiscal position was healthy with an overall deficit of 3.4% of GDP in 2013/14. Similar prospects are expected over the medium term.
• Successful and peaceful general elections in October 2015 transferred power to a new president who has committed to prudent resource management, fighting corruption and pursuing inclusive growth.
• There is a growing rate of urbanisation with associated unemployment, pressure on infrastructure and overstretched government capacity to manage urban development.
Economic performance has remained stable and strong over the past decade. There was 7% growth in 2014 and preliminary estimates indicate the same growth rate in 2015, driven mainly by the services, industry, construction, and information and communication sectors, each of which grew in double digits. For the medium term, growth is projected to outperform the records of 2014 and 2015, increasing to 7.2%. While other sectors are expected to at least perform at their recent levels, higher growth performance is expected largely from increased industrial activities and investment in infrastructure. The inflation rate in 2014 was 6.1%, and is expected to further reduce to 5.6% in 2015 due to favourable weather conditions that led to a sustained level of agricultural output and prudent fiscal and monetary policy management. The government’s total debt is sustainable at 30.2% of GDP in 2014/15.
On social and human development, there has been an improvement in Tanzania’s Human Development Index value from 0.371 to 0.521 between 1985 and 2014. Between 1980 and 2014, life expectancy at birth increased by 14.5 years, expected years of schooling increased by 3.3 years and infant mortality declined from 68 deaths per 1 000 live births in 2005 to 41 in 2012/13. However, a major area of weakness is poverty reduction where, due to the structure of the Tanzanian economy, high economic growth has not been reflected in a proportional reduction in poverty levels. While the average growth rate has been about 7%, the agriculture sector that employs about 70% of workers has been growing at less than 4%. The latest household budget survey (2011/12) revealed that 28.2% of Tanzanians are poor, with a higher incidence of poverty in rural areas.
The general election of October 2015 led to the emergence of Dr. John Magufuli as the president of the United Republic of Tanzania, with a five-year mandate. The president has unveiled a comprehensive five-year work plan that focuses on addressing land ownership, water, health services, education, agriculture, electricity and justice delivery issues. The plan also focuses on government effectiveness and efficiency, increasing government revenue and combating corruption. Faithful implementation of policies and programmes in these areas outlined by the president will be crucial in addressing Tanzania’s poverty problem in the medium term.
Urbanisation has become a major development challenge in Tanzania. In the city of Dar-es-Salaam and other major cities, unemployment is higher than in the rural areas, basic infrastructure (roads, electricity, water, bus transit, etc.) have become highly insufficient to meet the demands of users and there is inadequate provision of recreational facilities, sewage systems, water drainage channels and environmental protection. Planned residential areas are rare, although land itself is in abundance. Intra-city transportation presents a serious challenge to commuters due to poor road networks and the absence of intra-city mass rail transport systems. A comprehensive and co-ordinated “Urban Development and Management Policy” is under preparation and success in finalising and implementing the policy will be a big achievement for the new government.

COUNtrY NOtES
321African Economic Outlook© AfDB, OECD, UNDP 2016320 African Economic Outlook © AfDB, OECD, UNDP 2016
Macroeconomic indicators
2014 2015(e) 2016(p) 2017(p)
Real GDP growth 7.0 7.0 7.2 7.2
Real GDP per capita growth 3.8 3.9 4.0 4.0
CPI inflation 6.1 5.6 5.9 6.0
Budget balance % GDP -3.4 -3.9 -4.4 -5.4
Current account % GDP -10.3 -9.4 -8.2 -7.0
Source: Data from domestic authorities; estimates (e) and projections (p) based on authors’ calculations.

COUNtrY NOtES
322 African Economic Outlook © AfDB, OECD, UNDP 2016
ToGo
• The economy expanded 5.5% in 2015, but funding of infrastructure increased government debt to 62.5% of GDP in 2015, up from 46.0% in 2012.
• The time needed to legally set up a business fell from 38 days in 2012 to 19 in 2013, and 10 in 2014 and 2015.
• The country’s land tenure system has not adjusted to the growth of urban areas and trade and an average 288 days are needed for property transactions, making them the slowest in Africa.
Major infrastructure investment begun in 2010 continued more slowly in 2015. Erratic rainfall undermined buoyant agriculture and the economy grew a more modest 5.5%, down from 5.9% in 2014. Agriculture was the main source of economic expansion in 2014, contributing 3.7 percentage points of GDP growth, though this fell by 0.7 points in 2015. Phosphates, clinker and cotton production should improve in 2016, and the Scanmines limestone and cement company is expected to do well. Continuing government reforms to increase competition in hotels, electricity, banks and telecommunications, along with support for agriculture and extractive industries, should drive growth, forecast at 5.9% in 2016 and 6.0% in 2017.
Funding of public investment over the past five years has contributed to growth but also increased public debt, from 46.0% of GDP in 2012 à 62.5% in 2015. Interest on internal debt in 2015 was put at XOF 26 billion (CFA francs), at least three times more than on external debt, and the International Monetary Fund (IMF) says Togo risks further accumulation of public debt. Government revenue has grown significantly in the past two years due to better collection by the new national tax office (OTR). Revenue increased 13.6% in 2014 and 4.8% in 2015 to reach XOF 480.4 billion (20.2% of GDP). Due to the creation of a body to fight corruption and related crimes (la Haute autorité de prévention et de lutte contre la corruption et les infractions assimilées) was set up in 2015. As a result, Transparency International’s Corruption Perceptions Index ranked Togo 19 places higher than in 2014: 107 out of 168 countries.
Some 2.8 million people live in Togo’s towns and cities, a 160.0% increase between 1990 and 2014, representing 39.5% of the total population in 2014. This is up from 28.6% in 1990 and is expected to reach 50.0% by 2030. The steady decline of the share of industries and services in GDP over the past 30 years reflects the meagre structural transformation of the economy. The country’s land tenure system requires 288 days for property transactions, making it the slowest in Africa (the sub-Saharan average is 58 days). The cost of energy and communications since the 1990s, as well as market weakness and limited access to funding, are serious obstacles to the growth of towns and cities and to the country’s structural transformation. These constraints, which must be removed, stem mostly from a land tenure system that has failed to adapt over the past half-century to the growth of urban areas and market demands.
Macroeconomic indicators
2014 2015(e) 2016(p) 2017(p)
Real GDP growth 5.9 5.5 5.9 6.0
Real GDP per capita growth 3.2 2.8 3.2 3.4
CPI inflation 0.2 1.9 2.1 2.2
Budget balance % GDP -3.4 -5.3 -4.7 -4.4
Current account % GDP -13.2 -11.9 -11.0 -10.5
Source: Data from domestic authorities; estimates (e) and projections (p) based on authors’ calculations.

COUNtrY NOtES
323African Economic Outlook© AfDB, OECD, UNDP 2016322 African Economic Outlook © AfDB, OECD, UNDP 2016
TunIsIA
• The new government that took office in February 2015 has continued the economic recovery plan launched in 2011, with a striking 21.6% increase in investment in 2015.
• The worsening security situation after the terrorist attacks in Sousse and Tunis and rising social unrest affected growth, which is not expected to exceed 0.5% in 2015, as the country entered a recession in the second quarter of the year.
• The start of decentralisation in 2015 and municipal elections in 2016 should boost local democracy, a key to successful and sustainable urban policy that involves citizens.
Growth for the year was anticipated as 3% in the 2015 budget but it was no more than 0.5% in the end (down from 2.3% in 2014), due to the contraction of non-manufacturing industries in the first quarter, notably oil production and an almost complete halt in phosphate mining in the centre of the country because of strikes. This was partly offset by growth in agriculture, non-commercial services and manufacturing. Tourism (7% of gross domestic product), the traditional source of foreign currency and jobs (400 000 direct and indirect), took a sharp dive, with revenue 35% down on 2014.
Domestic consumption is expected to continue as the chief engine of the economy in 2016 and 2017. Investment was 18.5% of GDP in 2015 (down from 21.9% in 2014) despite a slight recovery of foreign direct investment (FDI) in the second quarter after the elections went well. Government capital investment increased 21.6%.
The weak 2015 performance, along with macroeconomic imbalances, prevent the country from dealing with its main problems, such as unemployment, which remains high (15% in 2015) despite much more hiring in the public sector since 2011. Joblessness is greater among women (21.1%) than men (12.5%) and especially hits college graduates (31.4%).
Regional disparities persist because of meagre government investment and inefficient local authorities. The country is administratively centralised and economically polarised, with activity concentrated in the expanding towns and cities of the coastal regions, so the gap between these and smaller urban areas in the interior is widening. To a lesser extent, overall disparity is growing between urban and rural areas, notably in three of the country’s six regions (Nord-Ouest, Centre-Ouest and Sud).
The last census (2014) showed that facilities, roads, health care and leisure services in the governorates of Kasserine, Sidi Bouzid, Gafsa, Jendouba, Kebili and Kairouan were lagging behind the national average and also behind the average in coastal governorates and even regions of the interior.
Macroeconomic indicators
2014 2015(e) 2016(p) 2017(p)
Real GDP growth 2.3 0.5 2.0 2.4
Real GDP per capita growth 1.1 -0.6 0.9 1.3
CPI inflation 5.5 5.0 4.0 3.5
Budget balance % GDP -4.4 -4.2 -3.9 -3.7
Current account % GDP -9.0 -7.6 -5.9 -5.8
Source: Data from domestic authorities; estimates (e) and projections (p) based on authors’ calculations.

COUNtrY NOtES
324 African Economic Outlook © AfDB, OECD, UNDP 2016
uGAndA
• Uganda’s economy continued to improve in 2015, despite external shocks, with real GDP growth projected to reach 5.1% in 2016, and 5.8% in 2017, driven by industry, services and public infrastructure investment.
• Uganda’s economic stance remains focused on containing inflationary pressures and on enabling growth by ensuring exchange rate stability and maximising domestic resources mobilisation.
• Uganda has made progress in reducing poverty and in enhancing gender equality and women’s empowerment.
Uganda’s economic outlook is positive, with real GDP growth expected to reach 5.1% in 2016, compared to 5.3% in 2015, and 4.7% for 2014. This assumes that the government will maintain macroeconomic stability and tackle corruption. Growth will mainly be driven by strong performances in the industry and services sectors, and also by public infrastructure investment and other investments in priority sectors. Large infrastructure projects will boost manufacturing, as well as services, notably tourism. Rising private consumption will also drive growth. Credit expansion, which increased by 16% in February 2015, more than double last year’s growth rate, will boost consumption, as will higher government consumption in the run-up to elections. Investment in the energy sector will also boost growth, although the pace of growth has slowed in the past year as oil prices have fallen sharply. The issue of new licences for further oil exploration in the greater Albertan region will boost much-needed foreign direct investment.
Uganda’s Human Development Index (HDI) improved slightly to 0.483 in 2014, from 0.478 in 2013. This still falls below the 0.502 average for the world’s least developed countries (LDCs), and the 0.518 average for sub-Saharan Africa. Moreover, earlier progress towards Millennium Development Goals (MDGs) for health and education has stalled, with outcomes underperforming the goals due to insufficient funding. Nonetheless, there has been significant progress in increasing access to anti-retroviral treatment, in preventing mother-to-child HIV transmission, and in reducing the prevalence of malaria, which fell from 43% in 2009 to 19% in 2014. Poverty fell in all regions except the Eastern region, where it increased between 2009/10 and 2012/13. Although the Northern region has witnessed a significant reduction in poverty – from 60.7% in 2005/06 to 43.7% in 2012/13 – this still remains more than twice the national average. Uganda has steadily improved its performance in gender equality and women’s empowerment. Nonetheless, women continue to face discrimination, particularly in their access to economic opportunities and ownership of assets.
Macroeconomic indicators
2014 2015(e) 2016(p) 2017(p)
Real GDP growth 4.7 5.3 5.1 5.8
Real GDP per capita growth 1.4 2.0 1.8 2.5
CPI inflation 4.3 4.5 5.2 5.3
Budget balance % GDP -4.1 -4.5 -6.0 -5.5
Current account % GDP -9.6 -9.1 -9.1 -9.1
Source: Data from domestic authorities; estimates (e) and projections (p) based on authors’ calculations.

COUNtrY NOtES
325African Economic Outlook© AfDB, OECD, UNDP 2016324 African Economic Outlook © AfDB, OECD, UNDP 2016
ZAmbIA
• Zambia is facing its worst economic crisis in more than ten years, with falling copper prices, pressure on the government’s operating and investment budget, and electricity-supply shortages affecting the real economy.
• For Zambia’s national elections in 2016, the Constitutional Amendment Act has set the date at 11 August and introduced a 50% +1 requirement for winning the election, as well as a presidential running mate.
• In 2015, urban growth continued at an estimated rate of 42% as people moved to towns in search of jobs and opportunities.
In 2015, the Zambian economy faced economic headwinds initially due to fast rising expenditures and a fiscal deficit that more than doubled in 2013. Slowing demand from China had reduced copper prices to their lowest level in more than seven years. The situation was exacerbated by low agriculture output and a growing electricity crisis. Real economic growth fell to its lowest in 15 years, with gross domestic product (GDP) growth estimated to have slowed to 3.7% from 5.0% in 2014. Maize output declined by 22% due to poor rains. Copper prices declined by 28% while mining output remained roughly the same as in 2014. Slow economic growth is projected for the medium term as the electricity-supply deficit continues and Zambia continues to import electricity from neighbouring countries. The 2016 agricultural season is expected to slow following El Niño weather effects. In addition, elections planned for 2016 will add pressure to public spending. Copper prices are expected to remain flat as world copper supply is sufficient to meet global demand.
The electricity-supply deficit, which began in June 2015, has affected manufacturing and other businesses. It is estimated at 40-50% of baseload, necessitating considerable daily load shedding. This has increased operating costs as firms have had to invest in diesel generators, and the increase in costs has been passed on to consumers. Combined with waning confidence in the economy, the Zambia kwacha (ZMW) depreciated by 42% against the United States dollar (USD), raising end-of-year inflation to 21%. The slowdown in the economy led to more than 9 000 job losses in the formal private sector.
In 2010, 60% of Zambians were living in rural areas. Official projections show that urbanisation will have risen to 45% by 2025. The greatest contributors to the country’s domestic product are the capital city, Lusaka, and other major mining towns. Urbanisation is both a result of natural population growth and rural-to-urban migration.
Macroeconomic indicators
2014 2015(e) 2016(p) 2017(p)
Real GDP growth 5.0 3.7 3.6 4.9
Real GDP per capita growth 2.5 0.6 0.5 1.8
CPI inflation 7.8 10.1 10.8 8.9
Budget balance % GDP -5.9 -8.2 -6.6 -6.2
Current account % GDP 2.2 -3.0 -1.1 1.3
Source: Data from domestic authorities; estimates (e) and projections (p) based on authors’ calculations.

COUNtrY NOtES
326 African Economic Outlook © AfDB, OECD, UNDP 2016
ZImbAbWE
• Economic growth slowed from 3.8% in 2014 to an estimated 1.5% in 2015 as a result of weak domestic demand, high public debt, tight liquidity conditions, drought, poor infrastructure, institutional weaknesses and an overvalued exchange rate with projected negative inflation in 2016 and 2017.
• The business environment improved according to the World Bank report, Doing Business 2016, with the country moving up 16 places to 155 out of 189 countries.
• Zimbabwe has experienced reverse urbanisation in recent years as an economic slowdown hampered opportunities in cities.
GDP growth declined from 3.8% in 2014 to an estimated 1.5% in 2015 but is projected to slightly increase to 1.6% in 2016. This improvement is due to an anticipated expansion in the tourism, construction and financial sectors. The poor performance of government revenue against the background of high recurrent expenditures continues to constrain the fiscal space.
The depreciation of the South African rand against the US dollar (USD) has resulted in a decline in prices of imports from South Africa. This trend, along with weak domestic demand, tight liquidity conditions and declines in crude oil and global food prices, resulted in negative inflation. Annual average inflation declined from -0.2% in 2014 to -2% in 2015. Inflation is projected to remain negative in 2016 and 2017.
The country remains in debt distress, exacerbated by the lack of a diversified export base and declining terms of trade that make it difficult for the country to adjust to changing world demand for tradable goods. These structural weaknesses have constrained the country’s ability to generate high and sustainable growth that is necessary to mitigate the debt distress. Moreover, the external position is projected to remain under severe pressure in the medium term on account of poor export and import performance on the back of an appreciating US dollar. The Public Debt Management Act, passed into law in September 2015, is expected to strengthen the legal and institutional framework for debt management.
The fiscal space remains constrained due to underperformance of domestic revenues, increase in public expenditures, depressed exports, limited foreign direct investment (FDI) and other capital inflows into the country. This has undermined development expenditure and social services provision in both urban and rural areas, exacerbating the incidence of poverty. Financing for urban development, both housing and transport, has been negatively affected.
Macroeconomic indicators
2014 2015(e) 2016(p) 2017(p)
Real GDP growth 3.8 1.5 1.6 3.1
Real GDP per capita growth 1.5 -0.9 -0.4 0.8
CPI inflation -0.2 -2.0 -1.3 -0.7
Budget balance % GDP -1.9 -1.6 -1.5 -1.2
Current account % GDP -23.2 -21.4 -19.8 -18.7
Source: Data from domestic authorities; estimates (e) and projections (p) based on authors’ calculations.

Statistical annex


StAtiStiCAl ANNEX
329African Economic Outlook© AfDB, OECD, UNDP 2016
Methodology
The aggregate figure for Africa, when reported, does not include countries whose data are unavailable.
Table 4. Public finances (percentage of GDP)
Where indicated, the figures are reported on a fiscal-year basis. Figures for Egypt, Eritrea, Ethiopia, Kenya, Liberia, Malawi, Rwanda, South Sudan, Tanzania, and Uganda are from July to June in the reference year. For Botswana, Lesotho, Namibia, and Swaziland, the fiscal year 2014 is from April 2013 to March 2014. For South Africa, the fiscal year 2014 is from April 2014 to March 2015.
Table 7. Exports
The table is based on exports disaggregated at six-digit level (following the Harmonised System, rev. 2).
Table 8. Diversification and competitiveness
The diversification indicator measures the extent to which exports are diversified. It is constructed as the inverse of a Herfindahl index, using disaggregated exports at four digits (following the Harmonised System, rev. 2). A higher index indicates more export diversification.
The competitiveness indicator has two aspects: the sectoral effect and the global competitivity effect. In order to compute both competitiveness indicators, we decompose the growth of exports into three components: the growth rate of total international trade over the reference period (2010-14) (not reported); the contribution to a country’s export growth of the dynamics of the sectoral markets where the country sells its products, assuming that its sectoral market shares are constant (a weighted average of the differences between the sectoral export growth rates – measured at the world level – and total international trade growth, the weights being the shares of the corresponding products in the country’s total exports); the competitiveness effect, or the balance (export growth minus world growth and sector effect), measuring the contribution of changes in sectoral market shares to a country’s export growth.
Table 10. Foreign direct investment
The UNCTAD Inward Potential Index is based on 12 economic and structural variables measured by their respective scores on a range of 0-1 (raw data are available at www.unctad.org/wir). It is the unweighted average of scores of the following: GDP per capita, the rate of growth of GDP, the share of exports in GDP, telecom infrastructure (the average number of telephone lines per 1 000 inhabitants and number of mobile phones per 1 000 inhabitants), commercial energy use per capita, share of R&D expenditures in gross national income, share of tertiary students in the population, country risk, exports of natural resources as a percentage of the world total, imports of parts and components of electronics and automobiles as a percentage of the world total, and inward FDI stock as a percentage of the world total.
Table 11. Aid flows
The DAC countries are Australia, Austria, Belgium, Canada, the Czech Republic, Denmark, the European Union, Finland, France, Germany, Greece, Iceland, Ireland, Italy, Japan, Korea, Luxembourg, the Netherlands, New Zealand, Norway, Poland, Portugal, the Slovak Republic, Slovenia, Spain, Sweden, Switzerland, the United Kingdom, and the United States.

StAtiStiCAl ANNEX
330 African Economic Outlook © AfDB, OECD, UNDP 2016
Table 13. Demographic indicators
Infant mortality rate: the number of child deaths under the age of one per live birth per year.
Total fertility rate: the average number of children per woman.
Mortality under age five: the probability that a new-born infant will die before the age of five.
Table 14. Poverty and income distribution indicators
National poverty line: the poverty line corresponding to the value of consumption necessary to satisfy minimum subsistence needs. It is set at two-thirds of average consumption.
International poverty line: the absolute poverty line corresponding to a level of income or consumption of USD 1.90 or USD 3.10 a day.
Gini index: an index measuring the intensity of inequality in income or consumption expenditure distribution. Perfect equality leads to a Gini index of zero and maximum inequality to a Gini index of 100.
Share of consumption: the share of total consumption for a decile of the population ranked by level of consumption.
Table 15. Access to services
Sanitation coverage: the percentage of the population with access to improved sanitation technologies (connection to a public sewer, connection to a septic system, pour-flush latrine, simple pit latrine or ventilated improved pit latrine).
Water supply coverage: the percentage of the population with access to improved water supply (household connection, public standpipe, borehole, protected dug well and protected spring or rainwater collection).
Table 16. Basic health indicators
Life expectancy at birth: the average number of years a new-born infant would live under the hypothesis that, during his or her life, the conditions of mortality remain the same as observed at birth.
Life expectancy at birth with AIDS: the estimated average number of years a new-born infant would live under the hypothesis that, during his or her life, the conditions of mortality remain the same as observed at birth, and that in particular, the current effect of AIDS on mortality are taken into account.
Life expectancy at birth in the no-AIDS scenario: the estimated number of years a new-born infant would live under the hypothesis that he/she does not contract AIDS during his/her life.
Undernourishment prevalence: the proportion of the population that is suffering insufficient food intake to meet dietary energy requirements continuously.
Food availability: the available nutritious food for human consumption expressed in kilo-calories per person per day (note that the recommended daily caloric intake for an active healthy life is 2 100 calories).
Public share of total health expenditure: calculated by defining public health expenditure as current and capital outlays of government, compulsory social security

StAtiStiCAl ANNEXStAtiStiCAl ANNEX
331African Economic Outlook© AfDB, OECD, UNDP 2016330 African Economic Outlook © AfDB, OECD, UNDP 2016
schemes, extra-budgetary funds dedicated to health services delivery or financing, and grants and loans provided by international agencies, other national authorities and commercial banks.
Private share of total health expenditure: calculated by defining private expenditure as private insurance schemes and prepaid medical care plans, services delivered or financed by enterprises, outlays by non-governmental organisations and non-profit institutions serving mainly households, out-of-pocket payments, and other privately funded schemes not elsewhere classified, including investment outlays.
Table 17. Major diseases
Healthy life expectancy at birth: the average equivalent number of years in full health a newborn infant would live under the hypothesis that, during his/her life, the conditions of mortality and ill-health remain the same as observed at his/her birth.
People living with HIV/AIDS: estimated whether or not the people have developed symptoms of AIDS. HIV/AIDS adult prevalence is the estimate of the adult population (age 15-49) living with HIV/AIDS.
Malaria: cases of malaria reported from the different local case detection and reporting systems. These figures should be considered with caution because of the diversity of sources and probable underestimation.
Measles incidence: the number of new cases of measles reported during the reference year.
DTP3: Third dose of diphtheria, tetanus toxoids and pertussis vaccine.
Table 19. School enrolment
Gross enrolment ratio: the population enrolled in a specific level of education, regardless of age, expressed as a percentage of the official school-age pupils enrolled in that level.
Net enrolment ratio: the official school-age population enrolled in a specific level of education expressed as a percentage of the total population enrolled in that level.
Table 20. Employment and remittances
Participation rate: the measure of the proportion of a country’s working-age population that engages actively in the labour market, either by working or looking for work. It provides an indication of the relative size of the supply of labour available to engage in the production of goods and services.
Total unemployment: the proportion of the labour force that does not have a job and is actively looking for work.
Inactivity rate: percentage of the population that is neither working nor seeking work (that is, not in the labour force).
Table 21. Corruption Perceptions Index
The Corruption Perceptions Index (CPI): a composite indicator based on surveys of business people and assessments of country analysts. A background paper presenting the methodology and validity of the CPI is available on the Transparency International website: www.transparency.org/cpi2014/results
StAtiStiCAl ANNEX
332 African Economic Outlook © AfDB, OECD, UNDP 2016
Tables 22 to 24. Political indicators
The political indicators presented in Tables 22 to 24 and discussed in Chapter 5 of this report measure public protests, violence by non-state actors and political hardening in African countries. The indicators have been assembled on the basis of a detailed monitoring of daily press briefs verified by the AFP, Reuters and Marchés Tropicaux et Méditerranéens news agencies, aiming to take into account the daily events and decisions that make up the reality of political life and government attitudes in African countries.
The methodology was first proposed by Dessus et al. (1998).1 All three indicators are composites combining 4-value variables (with a scale of 0 to 3: 0: non-occurrence, 1: occurrence but weak intensity, 2: medium intensity and 3: strong intensity) and/or binary variables with values 0 and 1, with 0 being the non-occurrence of the event and 1 its occurrence. The detailed contents of each indicator are listed below.
These indices have been assembled since 1996 for 30 African countries,2 and have progressively covered all 54 countries of the continent. The calculations are based on news verified by the press agencies, thereby capturing much more news than via one single newspaper. AFP’s and Reuters’ daily press briefs have been the source for the indicators since 2006. Before that, Marchés Tropicaux et Méditerranéens (MTM) served as the source for the indicators. This change in the source introduced a break in the series. Comparing both sources for 52 countries in two consecutive years (2006 and 2007), we found that the number of reported relevant events was higher in AFP, which reports daily, than in the weekly reporting by MTM. A slight upward adjustment of past data to ensure comparability has been done, using country-specific coefficients estimated for each time series. The indicators presented in the tables have been adjusted accordingly for the years 1996-2005 (the average coefficients were 1.10 for public protests, 1.04 for public violence and 1.46 for political hardening).
In AEO reports prior to 2010 the public protest and violence by non-state actors indicators were combined in a civil tensions indicator. This series has been split up into its components in the reports starting from 2011 onwards to allow for a separate analysis of these two time series. The indicators for 2015 can also be found on the AEO website: www.africaneconomicoutlook.org.
Further improvements to the methodology have been implemented since 2010. The motivations behind public protests and civil violence across the entire content have been collected and analysed since 2006, allowing for a better understanding of the public demands and aspirations as well as governance issues (see Chapter 5). Historic revisions and backwards projections have been undertaken to expand and complete the series.
Weighting methods
We assign an appropriate weight to each variable of the composite index for the “Political hardening” indicator. First, we take into account the intensity level of each variable. By construction, a “dead” victim gets attributed a higher weight than an “injured” victim: intensity value 1 corresponds to between 1 and 9 dead victims, compared to between 1 and 49 injured victims. Second, a principal component analysis was performed to assign each variable the following weights: each intensity value of police violence is multiplied by 0.261 (if dead), 0.423 (if injured) and 0.402 (if arrested). For dichotomous variables, the weights are: state of emergency (0.631), additional resources for the police (0.603), extrajudicial prosecution (0.583), prohibition of strikes (0.383), prohibition of the press (0.292), hardening of the political climate (0.253) and closure of schools (0.092).

StAtiStiCAl ANNEXStAtiStiCAl ANNEX
333African Economic Outlook© AfDB, OECD, UNDP 2016332 African Economic Outlook © AfDB, OECD, UNDP 2016
Table 22: Public protest
• Strikes0 = non-occurrence1 = 1 strike or 1-999 strikers2 = 2 strikes or 1 000-5 000 strikers 3 = 3 strikes or 5 000 or more strikers
• Demonstrations0 = non-occurrence 1 = 1 demonstration or 1-4 999 protesters2 = 2 demonstrations or 5 000-9 999 protesters3 = 3 demonstrations or 10 000 or more protesters
Table 23: Violence by non-state actors
• Unrest and violence: number of dead and injured0 = none1 = 1-9 dead or 1-49 injured2 = 10-99 dead or 50-499 injured3 = 100 or more dead or 500 or more injured
Table 24: Political hardening
• State of emergency (0 or 1)
• Arrests and incarcerations of opponents (protesters, journalists, opposition actors) or for other political reasons
0 = non-occurrence1 = between 1 and 9 2 = between 10 and 99 3 = 100 or more
• Additional means for police repression, judicial harassment, death threats, propaganda or censorship (0 or 1)
• Toughening of the political environment, e.g. dissolution of political parties, new law against democracy, expulsions, dismissals, curfew (0 or 1)
• Violence perpetuated by the police: number of dead and injured0 = none1 = 1-9 dead or 1-49 injured2 = 10-99 dead or 50-499 injured3 = 100 or more dead or 500 or more injured
• Extrajudicial prosecutions and executions (0 or 1)
• Bans on strikes and demonstrations (0 or 1)
• Bans on press or public debates (0 or 1)
• Closing of schools for political reasons (0 or 1)
Table 25. Demographic projections
The demographic trends are projected using the medium variant fertility scenario.
Activity ratio: the ratio between working age population (15-64 years old) and dependent age population (less than 15 or at least 65 years old). It is the inverse of the dependent ratio.
Yearly cohort of new labour entrants: the size of the population entering working age (15 years old) each year. It is estimated by taking the population aged 15-24 and dividing by ten.

StAtiStiCAl ANNEX
334 African Economic Outlook © AfDB, OECD, UNDP 2016
Total entrance inflow: the number of new entrants into the working-age population. This refers to the population that was below 15 at the beginning of the period, and between 15 and 64 at the end of the period.
Active population: the population of people that furnish the supply of labour for the production of goods and services during a given period.
Table 26. Gender indicators
The African Development Bank’s Gender Equality Index (AfDB GEI) reflects the status of women in Africa along three dimensions of equality: economic opportunity (business and employment), human development (education and health), and law and institutions. Each dimension draws on a series of indicators, measuring equality in business and employment, education, health, political representation, and legal and household rights. Countries are scored on a scale from 0 to 100, where 100 indicates perfect gender equality. For more details on computation see the technical note available at www.afdb.org/fileadmin/uploads/afdb/Documents/Publications/African_Gender_Equality_Index_2015-EN.pdf.
The OECD Development Centre’s Social Institutions and Gender Index (SIGI) measures discriminatory social institutions, i.e formal and informal laws, social norms and practices that restrict or exclude women and consequently curtail their access to rights, justice, resources and empowerment opportunities. The SIGI scores 108 countries on 14 indicators grouped into five sub-indices: discriminatory family code, restricted physical integrity, son bias, restricted resources and assets, and restricted civil liberties. The SIGI is an unweighted average of a non-linear function of its five sub-indices. The SIGI and its sub-indices values are between 0 and 1, with 0 indicating very low levels of inequality and 1 indicating very high levels of inequality. For more details on computation see the technical note available at www.genderindex.org.
The United Nations Development Programme’s Gender Development Index (GDI) measures gender gaps in human development achievements by accounting for disparities between women and men in three basic dimensions of human development – health, knowledge and living standards – using the same component indicators as in the Human Development Index (HDI). The GDI is the ratio of the HDIs calculated separately for women and men showing the female HDI as a percentage of the male HDI. For more details on computation see the technical note available at hdr.undp.org/sites/default/files/hdr2015_technical_notes.pdf.
The United Nations Development Programme’s Gender Inequality Index (GII) measures gender inequalities in three important aspects of human development: reproductive health, measured by maternal mortality ratio and adolescent birth rates; empowerment, measured by the proportion of parliamentary seats occupied by females and the proportion of adult females and males aged 25 years and older with at least some secondary education; and economic status, expressed as labour market participation and measured by the labour force participation rate of female and male populations aged 15 years and older. The higher the GII value the more disparities there are between females and males. For more details on computation see the technical note available at hdr.undp.org/sites/default/files/hdr2015_technical_notes.pdf.

StAtiStiCAl ANNEXStAtiStiCAl ANNEX
335African Economic Outlook© AfDB, OECD, UNDP 2016334 African Economic Outlook © AfDB, OECD, UNDP 2016
Notes
1. Dessus, S., D. Lafay and C. Morrisson (1998), “A Politico-economic Model for Stabilisation in Africa”, Journal of African Economies.
2. The following countries are included in this sample: Algeria, Benin, Botswana, Burkina Faso, Cabo Verde, Cameroon, Chad, Côte d’Ivoire, Egypt, Equatorial Guinea, Ethiopia, Gabon, Ghana, Kenya, Libya, Malawi, Mali, Mauritius, Morocco, Mozambique, Namibia, Nigeria, Senegal, South Africa, Tanzania, Togo, Tunisia, Uganda, Zambia and Zimbabwe.

336
Afri
can
Eco
nom
ic O
utlo
ok©
AfD
B, O
EC
D, U
ND
P 2
016
StA
tiS
tiC
Al
AN
NE
X
Tab
le 1
. Bas
ic i
nd
icat
ors,
201
5
Popu
latio
n (t
hous
ands
)La
nd a
rea
(tho
usan
ds o
f km
2 )Po
pula
tion
dens
ity
(pop
. / k
m2 )
GD
P ba
sed
on P
PP
valu
atio
n
(USD
mill
ion)
GD
P pe
r cap
ita
(P
PP v
alua
tion,
U
SD)
Annu
al r
eal
GD
P gr
owth
(a
vera
ge o
ver 2
007-
15)
Alge
ria39
667
2 38
217
570
638
14 3
863.
1
Ango
la25
022
1 24
720
185
246
7 40
36.
2
Beni
n10
880
115
95 2
1 15
61
945
4.5
Bots
wan
a2
262
582
4 3
7 16
016
424
4.7
Burk
ina
Faso
18 1
06 2
7466
31
184
1 72
25.
9
Buru
ndi
11 1
79 2
840
2 7
882
705
3.4
Cabo
Ver
de 5
21 4
129
3 4
796
684
3.0
Cam
eroo
n23
344
475
49 7
2 10
93
089
4.1
Cent
ral A
fric
an R
epub
lic4
900
623
8 3
052
623
-1.4
Chad
14 0
371
284
11 3
2 00
32
280
5.0
Com
oros
788
242
4 1
214
1 53
91.
7
Cong
o4
620
342
14 2
8 91
96
259
4.4
Cong
o, D
em. R
ep.
77 2
672
345
33 6
3 26
6 8
196.
9
Côte
d’Iv
oire
22 7
02 3
2270
78
335
3 45
14.
6
Djib
outi
888
23
38 3
093
3 48
45.
2
Egyp
t*91
508
1 00
191
995
969
10 8
844.
1
Equa
toria
l Gui
nea
845
28
30 2
5 94
430
701
6.8
Eritr
ea5
228
118
44 7
939
1 51
91.
9
Ethi
opia
*99
391
1 10
490
159
224
1 60
210
.5
Gab
on1
725
268
6 3
4 40
919
944
4.5
Gam
bia
1 99
1 1
117
6 3
269
1 64
23.
7
Gha
na27
410
239
115
113
349
4 13
56.
7
Gui
nea
12 6
09 2
4651
15
276
1 21
22.
2
Gui
nea-
Biss
au1
844
36
51 2
676
1 45
13.
3
Keny
a46
050
580
79 1
43 0
513
106
5.1
Leso
tho
2 13
5 3
070
5 7
772
706
4.7
Libe
ria4
503
111
40 3
781
840
6.3
Liby
a6
278
1 76
04
92
875
14 7
930.
2
Mad
agas
car
24 2
35 5
8741
35
556
1 46
72.
6
Mal
awi
17 2
15 1
1814
5 2
0 55
81
194
5.6
Mal
i17
600
1 24
014
29
151
1 65
63.
9
Mau
ritan
ia4
068
1 03
14
16
427
4 03
93.
7
Mau
ritiu
s1
273
262
4 2
4 50
919
250
4.0
Mor
occo
34 3
78 4
4777
274
526
7 98
64.
1

337
Afri
can
Eco
nom
ic O
utlo
ok©
AfD
B, O
EC
D, U
ND
P 2
016
STA
TIS
TIC
AL
AN
NE
X
Tab
le 1
. Bas
ic i
nd
icat
ors,
201
5
Popu
latio
n (t
hous
ands
)La
nd a
rea
(tho
usan
ds o
f km
2 )Po
pula
tion
dens
ity
(pop
. / k
m2 )
GD
P ba
sed
on P
PP
valu
atio
n
(USD
mill
ion)
GD
P pe
r cap
ita
(P
PP v
alua
tion,
U
SD)
Annu
al r
eal
GD
P gr
owth
(a
vera
ge o
ver 2
007-
15)
Moz
ambi
que
27 9
78 7
9935
33
726
1 20
57.
0
Nam
ibia
2 45
9 8
243
24
839
10 1
024.
6
Nige
r 19
899
1 26
716
18
960
953
5.6
Nige
ria18
2 20
2 9
2419
71
105
343
6 06
76.
0
Rwan
da11
610
26
441
20
321
1 75
07.
5
Sao
Tom
e an
d Pr
inci
pe 1
90 1
198
664
3 48
84.
8
Sene
gal
15 1
29 1
9777
36
300
2 39
93.
8
Seyc
helle
s 9
60.
460
210
2 5
3326
259
4.7
Sier
ra L
eone
6 45
3 7
290
9 8
321
524
5.1
Som
alia
10 7
87 6
3817
……
…
Sout
h Af
rica
54 4
901
219
45 7
24 0
1013
287
2.3
Sout
h Su
dan
12 3
40 6
44 1
9 2
2 46
11
820
9.0
Suda
n40
235
1 87
921
167
421
4 16
14.
0
Swaz
iland
1 28
7 1
774
10
869
8 44
61.
9
Tanz
ania
53 4
70 9
4756
138
304
2 58
76.
7
Togo
7 30
5 5
712
9 1
0 81
61
481
4.1
Tuni
sia
11 2
54 1
6469
127
213
11 3
042.
7
Ugan
da39
032
242
162
79
753
2 04
36.
5
Zam
bia
16 2
12 7
5322
64
647
3 98
87.
0
Zim
babw
e15
603
391
40 2
7 91
61
789
3.1
AFRI
CA1
184
501
30 0
6639
5 76
8 93
248
704.
6
Not
e: *
Fo
r Eg
yp
t an
d E
thio
pia
, fis
cal y
ear
July
(n
-1)/
Jun
e (n
).So
urce
s: U
nit
ed N
atio
ns,
Dep
art
men
t of
Eco
no
mic
an
d S
oci
al A
ffa
irs,
Po
pu
lati
on
Div
isio
n, W
orld
Pop
ulat
ion
Pros
pect
s, T
he 2
015
Rev
isio
n.
AfD
B S
tati
stic
s D
epa
rtm
ent,
va
rio
us
do
mes
tic
auth
ori
ties
an
d A
fDB
est
imat
es.
(con
t.)

338
Afri
can
Eco
nom
ic O
utlo
ok©
AfD
B, O
EC
D, U
ND
P 2
016
StA
tiS
tiC
Al
AN
NE
X
Tab
le 2
. Rea
l G
DP
grow
th r
ates
, 20
07-1
7
2007
2008
2009
2010
2011
2012
2013
2014
2015
(e)
2016
(p)
2017
(p)
Alge
ria3.
42.
41.
63.
62.
83.
32.
83.
83.
93.
43.
0
Ango
la14
.011
.22.
43.
43.
95.
26.
84.
83.
83.
33.
5
Beni
n4.
65.
02.
72.
63.
35.
45.
66.
55.
25.
55.
7
Bots
wan
a8.
36.
2-7
.78.
66.
04.
89.
34.
42.
53.
23.
5
Burk
ina
Faso
4.1
5.8
2.9
8.4
6.6
9.0
6.6
5.0
4.8
5.0
5.9
Buru
ndi
3.5
4.9
3.8
5.1
4.0
4.4
4.5
4.7
-4.1
3.3
4.4
Cabo
Ver
de8.
66.
7-1
.31.
54.
01.
10.
81.
83.
64.
04.
0
Cam
eroo
n3.
32.
91.
93.
34.
14.
65.
65.
95.
75.
35.
1
Cent
ral A
fric
an R
epub
lic4.
62.
11.
73.
03.
34.
1-3
6.1
1.0
4.1
5.2
6.0
Chad
3.1
2.5
2.8
13.6
0.1
8.9
3.9
6.3
4.1
2.6
4.9
Com
oros
0.8
0.6
1.1
2.2
2.5
3.0
3.5
0.6
1.1
4.1
4.1
Cong
o-1
.65.
97.
58.
73.
43.
84.
96.
01.
24.
24.
7
Cong
o, D
em. R
ep.
6.3
6.2
2.8
7.2
6.9
7.2
8.5
9.2
7.7
7.0
8.0
Côte
d’Iv
oire
1.6
2.3
3.8
2.4
-4.7
10.7
8.7
7.9
8.8
8.6
8.3
Djib
outi
5.1
5.8
5.0
3.5
4.5
4.8
5.0
6.0
6.7
7.4
7.1
Egyp
t*7.
17.
24.
94.
81.
82.
22.
12.
24.
24.
34.
5
Equa
toria
l Gui
nea
24.8
20.8
19.0
-0.8
7.7
9.5
-12.
12.
3-1
0.2
-8.0
-3.4
Eritr
ea1.
4-9
.83.
92.
28.
77.
01.
31.
70.
32.
23.
4
Ethi
opia
*11
.510
.88.
812
.411
.28.
610
.610
.310
.28.
17.
7
Gab
on4.
85.
3-2
.76.
97.
05.
35.
64.
44.
24.
55.
1
Gam
bia
3.6
5.7
6.4
6.5
-4.3
5.3
4.3
0.9
4.7
5.5
5.6
Gha
na6.
58.
44.
03.
414
.09.
37.
34.
03.
75.
88.
7
Gui
nea
1.8
4.9
-0.3
1.9
3.9
3.9
2.3
1.1
0.1
4.0
4.8
Gui
nea-
Biss
au3.
23.
23.
34.
49.
4-1
.80.
82.
74.
85.
76.
2
Keny
a6.
90.
23.
38.
46.
14.
65.
75.
35.
56.
06.
4
Leso
tho
4.7
5.7
3.4
7.9
4.0
5.0
4.5
3.6
3.4
2.6
2.9
Libe
ria13
.06.
25.
46.
37.
98.
38.
70.
70.
42.
84.
4
Liby
a6.
42.
7-0
.84.
3-6
1.4
92.1
-12.
3-2
3.5
-6.0
-0.8
3.9
Mad
agas
car
6.5
7.2
-3.5
0.1
1.5
2.5
2.4
3.3
3.2
4.0
4.5
Mal
awi
5.5
8.6
7.6
9.5
3.8
1.9
5.2
5.7
2.9
4.0
4.9
Mal
i4.
35.
04.
55.
82.
70.
01.
75.
85.
25.
25.
0
Mau
ritan
ia2.
81.
1-1
.04.
84.
46.
05.
56.
63.
13.
54.
5
Mau
ritiu
s5.
45.
53.
14.
23.
93.
23.
23.
63.
73.
83.
7
Mor
occo
3.5
5.9
4.2
3.8
5.2
3.0
4.7
2.4
4.5
1.8
3.5

339
Afri
can
Eco
nom
ic O
utlo
ok©
AfD
B, O
EC
D, U
ND
P 2
016
STA
TIS
TIC
AL
AN
NE
X
Tab
le 2
. Rea
l G
DP
grow
th r
ates
, 20
07-1
7
2007
2008
2009
2010
2011
2012
2013
2014
2015
(e)
2016
(p)
2017
(p)
Moz
ambi
que
7.3
6.8
6.5
7.1
7.4
7.1
7.4
7.2
6.3
6.5
7.5
Nam
ibia
5.4
2.6
0.3
6.0
5.1
5.1
5.7
6.4
4.4
4.2
6.0
Nig
er
3.1
9.6
-0.7
8.4
2.3
11.8
5.3
7.0
3.6
5.0
5.5
Nig
eria
6.4
6.0
7.0
10.6
4.9
4.3
5.4
6.2
3.0
3.8
5.0
Rw
anda
7.6
11.2
6.3
7.3
7.9
8.8
4.7
7.0
7.1
6.8
7.2
Sao
Tom
e an
d Pr
inci
pe2.
09.
14.
04.
54.
94.
64.
24.
55.
35.
05.
4
Sene
gal
5.0
3.7
2.4
4.2
1.8
4.4
3.5
4.3
5.1
6.0
6.5
Seyc
helle
s10
.4-2
.1-1
.15.
97.
96.
06.
63.
74.
63.
13.
7
Sier
ra L
eone
8.0
5.2
3.2
5.3
6.0
15.2
20.1
4.6
-21.
50.
23.
7
Som
alia
......
......
......
......
......
...
Sout
h Af
rica
5.4
3.2
-1.5
3.0
3.2
2.2
2.2
1.5
1.3
0.7
1.8
Sout
h Su
dan
......
......
......
29.3
15.9
-5.3
0.7
8.8
Suda
n5.
83.
84.
56.
50.
91.
44.
43.
65.
36.
26.
0
Swaz
iland
3.5
2.4
1.3
1.9
-0.6
1.9
3.0
2.5
1.7
0.8
1.7
Tanz
ania
8.5
5.6
5.4
6.4
7.9
5.1
7.3
7.0
7.0
7.2
7.2
Togo
2.1
2.4
3.4
4.0
4.8
4.8
4.0
5.9
5.5
5.9
6.0
Tuni
sia
6.3
4.5
3.1
3.0
-1.9
3.9
2.4
2.3
0.5
2.0
2.4
Uga
nda
8.1
10.4
8.1
7.7
6.8
2.6
4.4
4.7
5.3
5.1
5.8
Zam
bia
8.4
7.8
9.2
10.3
6.4
6.8
6.7
5.0
3.7
3.6
4.9
Zim
babw
e-3
.7-1
7.7
5.3
11.4
11.9
10.6
4.5
3.8
1.5
1.6
3.1
AFR
ICA
6.1
5.3
3.5
5.8
2.9
6.4
3.9
3.7
3.6
3.7
4.5
Not
e: *
Fo
r Eg
yp
t an
d E
thio
pia
, fis
cal y
ear
July
(n
-1)/
Jun
e (n
).So
urce
s: A
fDB
Sta
tist
ics
Dep
art
men
t, v
ari
ou
s d
om
esti
c au
tho
riti
es a
nd
AfD
B (
e) e
stim
ates
an
d (
p) p
roje
ctio
ns.
(con
t.)

340
Afri
can
Eco
nom
ic O
utlo
ok©
AfD
B, O
EC
D, U
ND
P 2
016
StA
tiS
tiC
Al
AN
NE
X
Tab
le 3
. Dem
and
com
pos
itio
n a
nd
gro
wth
rat
e, 2
014
-17
2014
2015
(e)
2016
(p)
2017
(p)
Fina
l con
sum
ptio
nG
ross
cap
ital
fo
rmat
ion
Exte
rnal
sec
tor
Tota
l fin
al
con-
su
mpt
ion
Gro
ss
capi
tal
form
atio
n to
tal
Expo
rts
Impo
rts
Tota
l fin
al
con-
sum
ptio
n
Gro
ss
capi
tal
form
atio
n to
tal
Expo
rts
Impo
rts
Tota
l fin
al
cons
ump-
tion
Gro
ss
capi
tal
form
atio
n to
tal
Expo
rts
Impo
rts
Priv
ate
Publ
icPr
ivat
ePu
blic
Ex
port
sIm
port
s
% o
f GD
PR
eal p
erce
ntag
e gr
owth
Rea
l per
cent
age
grow
thR
eal p
erce
ntag
e gr
owth
Alge
ria36
.419
.416
.928
.730
.532
.09.
20.
6-1
.53.
60.
26.
83.
02.
11.
96.
6-0
.63.
3
Ango
la34
.930
.25.
323
.740
.734
.7-9
.0-2
9.1
23.6
-22.
70.
012
.50.
81.
05.
89.
3-4
.00.
9
Beni
n68
.015
.919
.65.
436
.145
.13.
68.
11.
61.
36.
314
.13.
710
.76.
75.
75.
36.
9
Bots
wan
a46
.016
.422
.38.
362
.255
.2-5
.54.
63.
8-4
.25.
517
.0-1
.19.
93.
3-7
.25.
3-2
.8
Burk
ina
Faso
86.1
12.2
4.5
6.3
21.9
30.9
2.9
10.2
3.7
0.5
3.7
11.4
5.0
3.8
4.8
13.2
3.1
4.0
Buru
ndi
79.1
15.1
16.6
16.5
10.4
37.6
-11.
9-5
.95.
8-1
8.5
9.7
-14.
11.
2-0
.35.
94.
71.
37.
0
Cabo
Ver
de59
.026
.926
.96.
652
.371
.7-7
.58.
06.
9-4
.60.
5-1
.37.
0-0
.52.
2-6
.37.
2-0
.9
Cam
eroo
n76
.911
.818
.22.
521
.731
.24.
47.
87.
54.
84.
210
.65.
35.
84.
710
.12.
66.
0
Cent
ral A
fric
an R
epub
lic10
6.5
8.1
8.1
2.1
12.3
37.1
2.2
4.2
10.9
1.5
0.4
11.1
23.3
0.8
2.1
29.1
9.6
4.9
Chad
74.4
7.7
20.9
9.6
31.5
44.1
0.6
1.7
9.1
-0.5
2.5
1.7
2.6
1.7
-0.7
3.8
14.8
0.7
Com
oros
100.
514
.410
.68.
017
.050
.5-3
.33.
55.
5-6
.04.
72.
73.
74.
77.
2-7
.43.
56.
0
Cong
o29
.716
.442
.121
.469
.979
.45.
2-1
5.8
9.9
-6.0
3.5
-12.
710
.3-6
.24.
1-2
.51.
0-5
.1
Cong
o, D
em. R
ep.
80.7
11.5
9.3
6.4
33.8
41.8
2.7
10.6
12.0
5.3
7.6
1.3
9.2
8.4
18.2
11.9
7.4
26.0
Côte
d’Iv
oire
71.7
8.7
10.8
6.0
42.3
39.4
7.3
22.6
6.6
9.0
5.7
9.5
9.5
4.5
11.7
15.2
-0.7
8.1
Djib
outi
65.5
22.6
14.1
30.0
32.1
64.3
7.6
10.5
0.8
7.2
7.6
10.7
2.0
7.1
9.1
7.1
1.8
6.9
Egyp
t*82
.712
.08.
15.
714
.423
.03.
411
.90.
34.
63.
78.
62.
64.
83.
98.
62.
85.
0
Equa
toria
l Gui
nea
16.8
6.9
21.2
26.7
95.6
67.1
20.4
24.8
-4.5
5.0
9.8
-6.8
5.3
1.4
13.0
1.3
0.0
2.8
Eritr
ea78
.319
.32.
06.
018
.924
.512
.67.
0-6
.829
.46.
35.
40.
011
.8-0
.65.
55.
3-1
.7
Ethi
opia
*70
.29.
210
.727
.311
.629
.15.
331
.4-2
.023
.014
.44.
71.
913
.411
.64.
73.
210
.0
Gab
on32
.416
.420
.06.
756
.732
.45.
92.
51.
31.
43.
5-3
.36.
4-0
.33.
62.
55.
31.
1
Gam
bia
84.8
10.2
13.2
11.3
29.6
49.1
7.1
3.9
-4.4
4.1
6.2
11.0
1.0
7.9
1.1
22.1
5.8
4.2
Gha
na64
.318
.022
.25.
039
.548
.9-0
.69.
02.
0-4
.35.
3-5
.418
.04.
519
.11.
81.
123
.6
Gui
n ea
89.4
11.5
12.6
5.7
25.7
44.8
-3.1
12.1
-3.8
-1.0
5.8
-7.5
0.4
-1.7
1.4
8.7
3.8
0.1
Gui
nea-
Biss
au91
.511
.93.
34.
720
.632
.03.
910
.515
.19.
89.
59.
1-1
0.9
6.1
2.3
8.1
14.5
0.1
Keny
a82
.114
.015
.65.
716
.433
.98.
40.
71.
27.
54.
98.
10.
72.
111
.3-1
3.5
0.9
4.6
Leso
tho
92.2
35.0
19.6
14.4
40.0
101.
2-1
.89.
21.
5-2
.7-4
.64.
56.
0-6
.9-0
.77.
31.
5-0
.9
Libe
ria73
.023
.415
.17.
629
.949
.028
.477
.8-3
6.6
38.9
-25.
534
.041
.3-0
.1-1
2.0
2.0
10.3
-9.4
Liby
a44
.752
.123
.67.
933
.561
.92.
4-1
.4-1
8.3
1.6
1.9
-19.
32.
0-5
.63.
4-5
.98.
60.
7
Mad
agas
car
78.5
10.2
11.6
3.9
32.8
37.1
0.4
8.2
1.0
-2.7
3.0
10.1
3.0
3.8
5.8
13.4
-0.2
7.6
Mal
awi
78.7
12.5
10.1
4.0
34.0
39.3
-1.0
14.8
3.8
-4.2
2.4
1.9
1.7
-4.5
5.3
7.5
-0.3
3.2

341
Afri
can
Eco
nom
ic O
utlo
ok©
AfD
B, O
EC
D, U
ND
P 2
016
STA
TIS
TIC
AL
AN
NE
X
Tab
le 3
. Dem
and
com
pos
itio
n a
nd
gro
wth
rat
e, 2
014
-17
2014
2015
(e)
2016
(p)
2017
(p)
Fina
l con
sum
ptio
nG
ross
cap
ital
fo
rmat
ion
Exte
rnal
sec
tor
Tota
l fin
al
con-
su
mpt
ion
Gro
ss
capi
tal
form
atio
n to
tal
Expo
rts
Impo
rts
Tota
l fin
al
con-
sum
ptio
n
Gro
ss
capi
tal
form
atio
n to
tal
Expo
rts
Impo
rts
Tota
l fin
al
cons
ump-
tion
Gro
ss
capi
tal
form
atio
n to
tal
Expo
rts
Impo
rts
Priv
ate
Publ
icPr
ivat
ePu
blic
Ex
port
sIm
port
s
% o
f GD
PR
eal p
erce
ntag
e gr
owth
Rea
l per
cent
age
grow
thR
eal p
erce
ntag
e gr
owth
Mal
i63
.817
.314
.411
.924
.331
.86.
63.
21.
54.
58.
64.
0-3
.17.
62.
84.
84.
0-1
.2
Mau
ritan
ia61
.221
.937
.19.
343
.072
.41.
87.
42.
33.
63.
99.
12.
16.
43.
27.
64.
95.
2
Mau
ritiu
s73
.914
.518
.24.
951
.563
.06.
86.
43.
17.
7-2
.06.
47.
10.
70.
24.
04.
10.
3
Mor
occo
60.3
19.9
28.3
3.9
34.3
46.6
5.2
7.0
2.5
5.9
1.3
4.1
1.8
2.6
4.0
6.0
2.5
5.2
Moz
ambi
que
73.4
25.6
31.9
14.3
30.7
75.9
5.3
13.6
-4.9
3.6
1.8
-2.3
-3.0
-8.3
-3.1
3.7
5.7
-9.0
Nam
ibia
64.5
27.5
29.8
4.4
39.9
66.1
-1.8
2.4
8.4
-3.6
4.4
-8.6
4.0
-3.5
-5.1
13.5
12.6
-3.1
Nig
er
65.5
15.0
26.7
11.1
21.0
39.2
4.5
14.2
-15.
45.
52.
413
.02.
06.
44.
6-1
.316
.81.
0
Nig
eria
70.9
7.4
10.3
5.5
18.4
12.5
-7.0
5.8
33.3
-0.9
-6.0
-1.4
28.2
-2.9
9.2
10.4
-6.7
3.1
Rw
anda
75.0
15.5
13.0
13.0
14.8
31.3
7.7
7.6
4.1
7.9
6.9
7.0
3.0
5.4
6.7
10.5
2.7
7.0
Sao
Tom
e an
d Pr
inci
pe92
.213
.115
.515
.79.
746
.2-0
.27.
47.
1-1
.24.
34.
51.
62.
94.
23.
70.
21.
1
Sene
gal
77.7
16.6
18.1
6.8
28.1
47.2
8.8
7.1
2.7
12.6
4.0
2.5
6.1
0.1
2.3
4.1
8.4
-2.6
Seyc
helle
s54
.626
.330
.06.
678
.696
.120
.752
.80.
438
.07.
128
.35.
219
.80.
816
.79.
811
.0
Sier
ra L
eone
100.
510
.27.
95.
439
.863
.8-3
0.7
6.7
-12.
8-2
1.4
-1.6
17.2
-2.3
2.0
7.6
11.8
0.1
8.7
Som
alia
……
……
……
……
……
……
……
……
……
Sout
h Af
rica
60.6
20.9
13.3
7.1
31.3
33.1
0.4
3.1
1.8
0.5
-1.3
3.7
1.1
-2.5
1.5
4.0
-0.9
-0.2
Sout
h Su
dan
……
……
……
……
……
……
……
……
……
Suda
n80
.29.
611
.83.
66.
411
.63.
913
.50.
66.
96.
011
.01.
510
.64.
710
.92.
65.
1
Swaz
iland
77.1
19.0
4.0
5.2
49.8
55.2
2.9
10.7
-0.7
3.8
-1.1
7.3
-0.2
-2.5
0.0
8.8
1.1
-0.5
Tanz
ania
65.6
13.8
26.2
4.8
19.5
29.9
8.8
10.5
5.3
13.3
8.0
10.7
2.5
9.8
8.1
9.3
4.3
9.7
Togo
81.1
14.2
13.8
9.4
39.7
58.1
7.0
5.6
-0.2
4.4
7.0
5.7
4.9
7.0
5.1
4.3
5.7
3.6
Tuni
sia
69.1
18.7
14.4
8.8
45.0
55.9
-0.5
1.0
-1.5
-2.7
1.1
0.5
2.3
-0.1
1.8
1.6
3.3
1.7
Uga
nda
76.4
9.1
21.3
4.8
16.9
28.4
6.6
3.2
6.8
7.6
5.9
4.2
4.0
5.8
6.2
4.5
3.5
4.4
Zam
b ia
52.7
9.0
31.7
3.1
41.8
38.3
18.9
6.9
-15.
37.
4-1
.98.
21.
9-3
.01.
86.
03.
1-0
.9
Zim
babw
e88
.124
.110
.52.
727
.152
.510
.92.
45.
120
.80.
28.
32.
30.
91.
36.
16.
31.
8
Not
e: *
Fo
r Eg
yp
t an
d E
thio
pia
, fis
cal y
ear
July
(n
-1)/
Jun
e (n
).So
urce
s: A
fDB
Sta
tist
ics
Dep
art
men
t, v
ari
ou
s d
om
esti
c au
tho
riti
es a
nd
AfD
B (
e) e
stim
ates
an
d (
p) p
roje
ctio
ns.
(con
t.)

342
Afri
can
Eco
nom
ic O
utlo
ok©
AfD
B, O
EC
D, U
ND
P 2
016
StA
tiS
tiC
Al
AN
NE
X
Tab
le 4
. Pu
blic
fin
ance
s, 2
014
-17
(per
cen
tage
of
GD
P)
2014
2015
(e)
2016
(p)
2017
(p)
Tota
l rev
enue
an
d gr
ants
Tota
l ex
pend
iture
an
d ne
t le
ndin
gO
vera
ll ba
lanc
eTo
tal r
even
ue
and
gran
ts
Tota
l ex
pend
iture
an
d ne
t le
ndin
gO
vera
ll ba
lanc
eTo
tal r
even
ue
and
gran
ts
Tota
l ex
pend
iture
an
d ne
t le
ndin
gO
vera
ll ba
lanc
eTo
tal r
even
ue
and
gran
ts
Tota
l ex
pend
iture
an
d ne
t le
ndin
gO
vera
ll ba
lanc
e
Alge
ria33
.441
.7-8
.326
.942
.9-1
6.0
25.7
41.2
-15.
426
.341
.0-1
4.7
Ango
la30
.135
.7-5
.625
.930
.0-4
.125
.030
.5-5
.524
.730
.4-5
.6
Beni
n17
.419
.4-1
.917
.722
.0-4
.318
.422
.0-3
.618
.322
.0-3
.7
Bots
wan
a**
37.8
32.2
5.6
38.4
34.8
3.6
36.0
38.8
-2.8
36.2
38.5
-2.3
Burk
ina
Faso
21.4
23.2
-1.8
22.1
24.6
-2.5
21.8
24.9
-3.1
21.7
25.4
-3.7
Buru
ndi
28.9
30.1
-1.2
28.3
34.0
-5.7
31.7
33.9
-2.2
29.0
31.1
-2.1
Cabo
Ver
de25
.032
.4-7
.426
.531
.0-4
.525
.929
.9-4
.025
.729
.5-3
.8
Cam
eroo
n18
.222
.1-3
.917
.622
.9-5
.317
.122
.8-5
.717
.322
.2-4
.9
Cent
ral A
frica
n Re
p.15
.612
.43.
211
.014
.2-3
.212
.315
.1-2
.810
.813
.1-2
.3
Chad
17.5
22.2
-4.7
16.5
22.9
-6.4
15.7
22.6
-7.0
15.6
23.0
-7.4
Com
oros
23.9
24.5
-0.7
23.4
24.6
-1.2
22.6
24.8
-2.2
22.7
24.4
-1.7
Cong
o41
.246
.0-4
.841
.651
.2-9
.642
.344
.1-1
.840
.439
.11.
3
Cong
o, D
em. R
ep.
13.7
13.3
0.5
14.8
15.3
-0.5
14.7
15.4
-0.7
15.2
14.2
1.0
Côte
d'Iv
oire
19.8
22.0
-2.3
20.8
24.3
-3.5
20.6
24.0
-3.4
20.9
24.7
-3.8
Djib
outi
35.6
46.0
-10.
537
.043
.8-6
.736
.442
.2-5
.835
.441
.2-5
.8
Egyp
t*21
.733
.9-1
2.2
21.3
32.8
-11.
522
.932
.5-9
.622
.531
.1-8
.7
Equa
toria
l Gui
nea
33.6
40.4
-6.8
29.7
36.6
-6.9
30.1
37.4
-7.3
29.3
38.3
-9.0
Eritr
ea*
14.7
29.3
-14.
618
.629
.4-1
0.7
18.7
28.9
-10.
318
.728
.6-9
.9
Ethi
opia
*15
.117
.7-2
.616
.118
.1-2
.014
.515
.7-1
.314
.215
.0-0
.8
Gabo
n26
.123
.52.
724
.827
.5-2
.724
.228
.8-4
.624
.326
.5-2
.3
Gam
bia
21.9
32.9
-11.
023
.132
.7-9
.623
.532
.8-9
.323
.329
.3-6
.1
Ghan
a21
.828
.2-6
.423
.128
.7-5
.723
.428
.4-5
.022
.726
.5-3
.9
Guin
ea19
.423
.5-4
.118
.125
.6-7
.518
.423
.4-5
.018
.022
.7-4
.6
Guin
ea-B
issa
u23
.125
.2-2
.122
.925
.1-2
.221
.223
.9-2
.720
.924
.0-3
.1
Keny
a*20
.025
.7-5
.722
.531
.3-8
.822
.030
.1-8
.220
.727
.0-6
.3
Leso
tho*
*60
.462
.9-2
.560
.660
.00.
660
.563
.5-3
.162
.067
.5-5
.5
Libe
ria*
27.3
30.2
-2.9
27.0
37.0
-9.9
27.2
32.8
-5.6
25.0
30.8
-5.7
Liby
a40
.984
.4-4
3.5
41.8
100.
7-5
8.9
41.4
102.
1-6
0.7
40.7
97.5
-56.
8
Mad
agas
car
12.4
14.7
-2.3
12.3
16.9
-4.6
12.8
15.9
-3.1
13.4
17.0
-3.6
Mal
awi*
22.3
28.2
-5.9
21.2
26.9
-5.7
22.3
25.6
-3.3
22.4
25.4
-3.1
Mal
i20
.824
.4-3
.520
.824
.5-3
.720
.824
.3-3
.521
.024
.7-3
.6
Mau
ritan
ia27
.831
.5-3
.728
.831
.7-2
.927
.129
.5-2
.426
.228
.3-2
.2
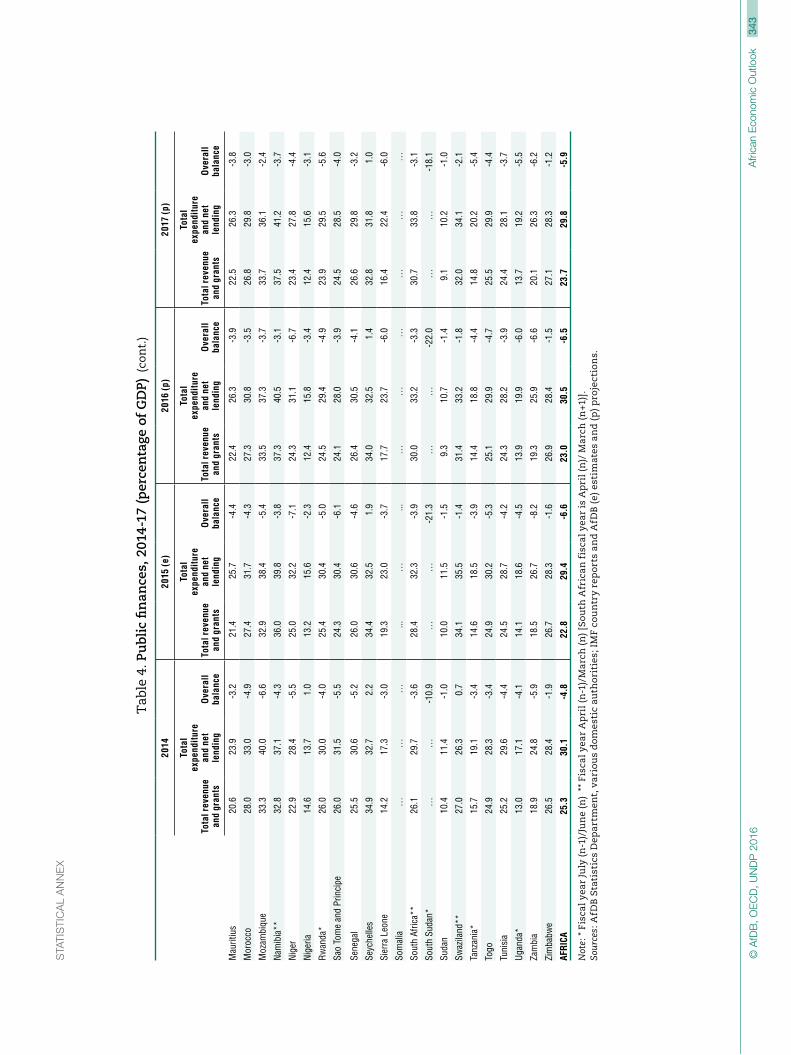
343
Afri
can
Eco
nom
ic O
utlo
ok©
AfD
B, O
EC
D, U
ND
P 2
016
STA
TIS
TIC
AL
AN
NE
X
Tab
le 4
. Pu
blic
fin
ance
s, 2
014
-17
(per
cen
tage
of
GD
P)
2014
2015
(e)
2016
(p)
2017
(p)
Tota
l rev
enue
an
d gr
ants
Tota
l ex
pend
iture
an
d ne
t le
ndin
gO
vera
ll ba
lanc
eTo
tal r
even
ue
and
gran
ts
Tota
l ex
pend
iture
an
d ne
t le
ndin
gO
vera
ll ba
lanc
eTo
tal r
even
ue
and
gran
ts
Tota
l ex
pend
iture
an
d ne
t le
ndin
gO
vera
ll ba
lanc
eTo
tal r
even
ue
and
gran
ts
Tota
l ex
pend
iture
an
d ne
t le
ndin
gO
vera
ll ba
lanc
e
Mau
ritiu
s20
.623
.9-3
.221
.425
.7-4
.422
.426
.3-3
.922
.526
.3-3
.8
Mor
occo
28.0
33.0
-4.9
27.4
31.7
-4.3
27.3
30.8
-3.5
26.8
29.8
-3.0
Moz
ambi
que
33.3
40.0
-6.6
32.9
38.4
-5.4
33.5
37.3
-3.7
33.7
36.1
-2.4
Nam
ibia
**32
.837
.1-4
.336
.039
.8-3
.837
.340
.5-3
.137
.541
.2-3
.7
Nige
r22
.928
.4-5
.525
.032
.2-7
.124
.331
.1-6
.723
.427
.8-4
.4
Nige
ria14
.613
.71.
013
.215
.6-2
.312
.415
.8-3
.412
.415
.6-3
.1
Rwan
da*
26.0
30.0
-4.0
25.4
30.4
-5.0
24.5
29.4
-4.9
23.9
29.5
-5.6
Sao
Tom
e an
d Pr
inci
pe26
.031
.5-5
.524
.330
.4-6
.124
.128
.0-3
.924
.528
.5-4
.0
Sene
gal
25.5
30.6
-5.2
26.0
30.6
-4.6
26.4
30.5
-4.1
26.6
29.8
-3.2
Seyc
helle
s34
.932
.72.
234
.432
.51.
934
.032
.51.
432
.831
.81.
0
Sier
ra L
eone
14.2
17.3
-3.0
19.3
23.0
-3.7
17.7
23.7
-6.0
16.4
22.4
-6.0
Som
alia
……
…...
…...
……
……
……
Sout
h Af
rica*
*26
.129
.7-3
.628
.432
.3-3
.930
.033
.2-3
.330
.733
.8-3
.1
Sout
h Su
dan*
……
-10.
9…
…-2
1.3
……
-22.
0…
…-1
8.1
Suda
n10
.411
.4-1
.010
.011
.5-1
.59.
310
.7-1
.49.
110
.2-1
.0
Swaz
iland
**27
.026
.30.
734
.135
.5-1
.431
.433
.2-1
.832
.034
.1-2
.1
Tanz
ania
*15
.719
.1-3
.414
.618
.5-3
.914
.418
.8-4
.414
.820
.2-5
.4
Togo
24.9
28.3
-3.4
24.9
30.2
-5.3
25.1
29.9
-4.7
25.5
29.9
-4.4
Tuni
sia
25.2
29.6
-4.4
24.5
28.7
-4.2
24.3
28.2
-3.9
24.4
28.1
-3.7
Ugan
da*
13.0
17.1
-4.1
14.1
18.6
-4.5
13.9
19.9
-6.0
13.7
19.2
-5.5
Zam
bia
18.9
24.8
-5.9
18.5
26.7
-8.2
19.3
25.9
-6.6
20.1
26.3
-6.2
Zim
babw
e26
.528
.4-1
.926
.728
.3-1
.626
.928
.4-1
.527
.128
.3-1
.2
AFRI
CA25
.330
.1-4
.822
.829
.4-6
.623
.030
.5-6
.523
.729
.8-5
.9
Not
e: *
Fis
cal y
ear
July
(n
-1)/
Jun
e (n
) **
Fis
cal y
ear
Ap
ril (
n-1
)/M
arc
h (
n) [
So
uth
Afr
ican
fis
cal y
ear
is A
pri
l (n
)/ M
arc
h (
n+1
)].
Sour
ces:
AfD
B S
tati
stic
s D
epa
rtm
ent,
va
rio
us
do
mes
tic
auth
ori
ties
; IM
F co
un
try
rep
ort
s an
d A
fDB
(e)
est
imat
es a
nd
(p
) pro
ject
ion
s.
(con
t.)

344
Afri
can
Eco
nom
ic O
utlo
ok©
AfD
B, O
EC
D, U
ND
P 2
016
StA
tiS
tiC
Al
AN
NE
X
Tab
le 5
. Mon
etar
y in
dic
ator
s, 2
014
-17
Infla
tion
(%
)Ex
chan
ge r
ate
(L
CU /
USD
)Br
oad
mon
ey (
LCU
billi
on)
2015
Res
erve
s, e
xclu
ding
gol
d,
(USD
mill
ion)
20
15
2014
2015
(e)
2016
(p)
2017
(p)
2013
2014
2015
Leve
l%
of G
DP
Gro
wth
20
14-1
5St
ock
at
year
-end
Eq. m
onth
s
of im
port
s
Alge
ria2.
94.
84.
34.
079
.480
.610
0.7
13 4
57.2
77.1
-1.6
144
677.
529
.1
Ango
la7.
310
.214
.114
.896
.598
.312
0.1
5 71
2.9
44.0
11.5
23 9
01.2
8.1
Beni
n-1
.10.
42.
32.
449
4.0
494.
459
1.4
2 75
4.9
51.5
17.1
731.
62.
2
Bots
wan
a4.
43.
14.
54.
38.
49.
010
.167
.949
.47.
77
958.
913
.4
Burk
ina
Faso
-0.3
0.8
2.0
1.9
494.
049
4.4
591.
42
477.
236
.914
.525
9.6
0.9
Buru
ndi
4.4
5.5
7.5
6.7
1 55
5.1
1 54
6.7
1 57
0.6
906.
522
.30.
013
5.1
2.1
Cabo
Ver
de-0
.20.
01.
62.
783
.183
.199
.415
4.6
90.7
4.7
428.
44.
6
Cam
eroo
n1.
92.
72.
22.
149
4.0
494.
459
1.4
4 09
1.6
23.9
8.6
3 35
3.2
4.7
Cent
ral A
fric
an R
epub
lic11
.65.
64.
74.
049
4.0
494.
459
1.4
275.
428
.912
.522
1.8
4.8
Chad
1.7
4.0
2.7
4.0
494.
049
4.4
591.
41
115.
915
.93.
520
7.3
0.5
Com
oros
2.9
2.1
2.2
2.6
370.
537
0.8
443.
610
0.0
40.9
2.9
136.
66.
0
Cong
o3.
00.
91.
51.
049
4.0
494.
459
1.4
2 65
9.7
50.1
1.4
2 25
9.9
2.8
Cong
o, D
em. R
ep.
1.0
0.8
2.1
2.5
919.
892
5.2
926.
04
217.
013
.96.
71
215.
91.
2
Côte
d’Iv
oire
0.4
1.5
1.8
1.9
494.
049
4.4
591.
43
070.
816
.317
.44
715.
75.
0
Djib
outi
3.0
3.1
3.3
3.4
177.
717
7.7
177.
725
7.5
81.4
9.7
364.
94.
4
Egyp
t*10
.811
.28.
810
.26.
97.
17.
71
765.
473
.616
.413
282
.02.
5
Equa
toria
l Gui
nea
4.3
3.6
2.6
2.3
494.
049
4.4
591.
41
320.
114
.4-1
5.2
1457
.21.
9
Eritr
ea12
.312
.512
.011
.715
.415
.415
.482
.712
8.1
12.9
……
Ethi
opia
*8.
17.
77.
48.
918
.619
.720
.736
9.7
28.3
24.2
……
Gab
on3.
21.
22.
42.
449
4.0
494.
459
1.4
2 07
7.0
25.3
-5.2
2 08
3.6
5.0
Gam
bia
6.3
6.5
5.5
5.5
36.0
41.7
47.2
22.6
56.5
11.0
143.
34.
6
Gha
na17
.017
.210
.27.
92.
02.
63.
845
.143
.422
.5…
…
Gui
nea
9.7
8.0
8.5
8.8
6 99
5.9
7014
.17
425.
71
6974
.031
.215
.723
3.5
1.0
Gui
nea-
Biss
au1.
91.
52.
11.
849
4.0
494.
459
1.4
272.
443
.111
.333
2.1
11.5
Keny
a6.
96.
06.
05.
286
.187
.998
.12
694.
741
.915
.67
762.
44.
6
Leso
tho
5.3
3.8
3.9
4.0
9.7
10.9
12.8
9.3
39.6
3.1
904.
25.
8
Libe
ria9.
97.
77.
07.
51.
01.
01.
00.
725
.40.
4…
…
Liby
a2.
48.
69.
75.
81.
31.
31.
481
.017
3.2
3.5
74 8
63.0
38.3
Mad
agas
car
6.0
7.9
7.4
7.8
2 20
6.9
2 41
4.8
2 93
4.4
6 66
2.0
23.3
1.7
832.
02.
9
Mal
awi
23.8
21.2
18.1
16.0
364.
442
4.9
499.
580
4.6
27.3
27.8
640.
23.
8
Mal
i0.
92.
02.
71.
849
4.0
494.
459
1.4
2 23
8.5
35.9
13.2
624.
02.
5

345
Afri
can
Eco
nom
ic O
utlo
ok©
AfD
B, O
EC
D, U
ND
P 2
016
STA
TIS
TIC
AL
AN
NE
X
Tab
le 5
. Mon
etar
y in
dic
ator
s, 2
014
-17
Infla
tion
(%
)Ex
chan
ge r
ate
(L
CU /
USD
)Br
oad
mon
ey (
LCU
billi
on)
2015
Res
erve
s, e
xclu
ding
gol
d,
(USD
mill
ion)
20
15
2014
2015
(e)
2016
(p)
2017
(p)
2013
2014
2015
Leve
l%
of G
DP
Gro
wth
20
14-1
5St
ock
at
year
-end
Eq. m
onth
s
of im
port
s
Mau
ritan
ia3.
51.
56.
76.
130
2.1
303.
331
8.6
530.
426
.54.
0…
…
Mau
ritiu
s3.
21.
32.
82.
530
.730
.635
.141
8.4
91.6
5.2
3 95
7.0
5.7
Mor
occo
0.4
1.8
1.4
1.6
8.4
8.4
9.8
1 14
9.2
106.
65.
822
253
.95.
8
Moz
ambi
que
2.3
2.0
5.7
5.2
30.1
31.4
40.1
239.
80.
017
.12
411.
40.
0
Nam
ibia
5.3
3.5
3.9
5.5
9.7
10.9
12.8
81.8
59.1
9.8
1 20
8.7
2.1
Nig
er
-0.9
1.0
1.3
0.9
494.
049
4.4
591.
41
113.
926
.90.
31
039.
04.
1
Nig
eria
7.8
9.0
10.1
9.4
157.
315
8.6
192.
420
612
.623
.09.
631
561
.86.
2
Rw
anda
2.4
2.5
3.0
3.0
646.
668
1.9
729.
01
416.
724
.715
.81
029.
85.
4
Sao
Tom
e an
d Pr
inci
pe6.
75.
34.
64.
718
450
.018
466
.42
2090
.62
877.
340
.615
.178
.47.
3
Sene
gal
-0.5
0.0
-0.4
1.2
494.
049
4.4
591.
43
752.
348
.07.
72
011.
83.
9
Seyc
helle
s1.
44.
42.
62.
712
.112
.713
.311
.651
.85.
754
1.5
5.0
Sier
ra L
eone
7.1
9.9
10.0
10.1
4 33
2.5
4 52
4.2
4 90
5.3
5 44
6.7
26.4
10.5
556.
52.
6
Som
alia
......
......
......
...…
……
…
Sout
h Af
rica
6.1
4.6
6.8
7.0
9.7
10.9
12.8
2 86
6.2
72.8
6.3
41 6
19.5
5.0
Sout
h Su
dan
1.7
41.1
14.7
25.0
3.0
3.0
3.0
9.1
21.8
16.6
229.
90.
8
Suda
n36
.916
.913
.111
.24.
85.
76.
091
.715
.018
.018
1.5
0.2
Swaz
iland
5.7
5.6
6.0
6.7
9.7
10.9
12.8
12.5
27.8
7.4
553.
63.
1
Tanz
ania
6.1
5.6
5.9
6.0
1 60
0.4
1 65
4.0
1 97
9.7
21 6
26.3
23.1
16.2
4 07
1.9
4.1
Togo
0.2
1.9
2.1
2.2
494.
049
4.4
591.
41
212.
351
.310
.557
4.0
3.1
Tuni
sia
5.5
5.0
4.0
3.5
1.6
1.7
2.0
62.9
77.6
6.9
7 20
5.5
4.3
Uga
nda
4.3
4.5
5.2
5.3
2 58
6.9
2 59
9.8
3 24
1.4
17 3
23.9
22.5
13.3
2 82
9.8
4.6
Zam
bia
7.8
10.1
10.8
8.9
5.4
6.2
8.6
39.7
18.7
13.4
2 96
7.6
3.5
Zim
babw
e-0
.2-2
.0-1
.3-0
.7…
……
4.6
36.7
5.1
328.
00.
6
AFR
ICA
7.2
7.3
7.2
7.2
……
……
……
……
Not
e: *
Fo
r Eg
yp
t an
d E
thio
pia
, fis
cal y
ear
July
(n
-1)/
Jun
e (n
).So
urce
s: A
fDB
Sta
tist
ics
Dep
art
men
t, v
ari
ou
s d
om
esti
c au
tho
riti
es; I
nte
rnat
ion
al F
inan
cia
l Sta
tist
ics
and
AfD
B (
e) e
stim
ates
an
d (
p) p
roje
ctio
ns.
(con
t.)

346
Afri
can
Eco
nom
ic O
utlo
ok©
AfD
B, O
EC
D, U
ND
P 2
016
StA
tiS
tiC
Al
AN
NE
X
Tab
le 6
. Bal
ance
of
pay
men
ts i
nd
icat
ors,
201
4-1
7
Trad
e ba
lanc
e (U
SD m
illio
n)Cu
rren
t acc
ount
bal
ance
(U
SD m
illio
n)Cu
rren
t acc
ount
bal
ance
(a
s %
of G
DP)
2014
2015
(e)
2016
(p)
2017
(p)
2014
2015
(e)
2016
(p)
2017
(p)
2014
2015
(e)
2016
(p)
2017
(p)
Alge
ria 3
26-1
6 15
7-2
0 58
8-1
8 67
7-9
465
-26
957
-29
288
-27
077
-4.4
-15.
6-1
7.1
-15.
2
Ango
la30
583
16 5
3119
601
20 0
65-3
722
-7 8
24-6
165
-6 5
39-2
.5-7
.2-5
.4-5
.4
Beni
n-5
89-4
26-4
75-5
35-6
90-6
39-6
95-7
30-7
.2-7
.1-7
.1-7
.0
Bots
wan
a 5
41 7
73 5
8 1
412
496
2 16
5 7
57 6
7815
.716
.05.
65.
2
Burk
ina
Faso
-242
-32
-107
-111
-767
-515
-630
-845
-6.1
-4.5
-5.3
-6.9
Buru
ndi
-600
-399
-391
-440
-275
-116
-173
-215
-9.5
-4.5
-6.0
-6.6
Cabo
Ver
de-6
10-5
01-4
62-4
55-1
39-1
54-1
75-1
93-8
.0-9
.0-9
.8-1
0.4
Cam
eroo
n-3
913
-3 4
94-3
772
-4 0
39-4
857
-4 0
46-4
430
-4 8
11-1
5.2
-14.
0-1
4.6
-15.
0
Cent
ral A
fric
an R
epub
lic-3
25-2
51-1
85-1
76-1
05-1
85-8
9-7
6-6
.1-1
1.5
-5.1
-4.0
Chad
393
-3 2
37 1
12-1
240
-1 1
77-1
072
-1 0
68-8
.9-9
.9-8
.6-8
.5
Com
oros
-189
-137
-150
-171
-42
-41
-40
-48
-6.1
-7.4
-6.9
-7.9
Cong
o4
488
1 74
12
504
3 08
4-3
59-1
302
-1 1
57-9
98-2
.6-1
4.5
-12.
4-9
.6
Cong
o, D
em. R
ep.
116
559
658
-857
-3 2
91-2
866
-3 9
59-5
987
-9.2
-8.7
-10.
8-1
3.9
Côte
d’Iv
oire
3 67
13
908
3 67
12
791
-766
-791
-1 0
43-1
484
-2.3
-2.5
-3.0
-3.9
Djib
outi
-674
-645
-681
-764
-407
-285
-278
-283
-25.
6-1
6.0
-14.
0-1
2.8
Egyp
t*-3
4 06
3-3
4 95
0-3
6 55
6-3
9 18
8-2
716
-11
467
-3 8
78-5
547
-0.9
-3.7
-1.1
-1.4
Equa
toria
l Gui
nea
9 28
68
038
8 39
28
212
-1 5
49-1
097
-364
-282
-10.
0-7
.1-2
.3-1
.8
Eritr
ea-2
35-3
74-4
65-4
55-9
3-1
43-2
07-2
49-2
.4-3
.4-4
.1-4
.5
Ethi
opia
*-1
0 24
3-1
1 10
6-1
2 63
3-1
4 69
0-5
876
-9 2
14-6
184
-7 6
80-1
0.9
-14.
6-8
.4-9
.3
Gab
on6
313
3 10
32
391
3 53
81
510
-841
-1 2
84-6
148.
3-6
.1-9
.6-4
.1
Gam
bia
-235
-208
-224
-252
-146
-169
-146
-112
-17.
7-2
0.0
-15.
0-1
0.2
Gha
na-1
897
-1 4
03-2
277
-2 3
31-4
208
-2 2
54-2
415
-2 2
10-9
.5-8
.2-7
.7-6
.0
Gui
nea
-1 2
09-1
275
-1 2
83-1
321
-1 8
89-1
730
-2 2
65-2
215
-26.
1-2
3.6
-28.
4-2
5.6
Gui
nea-
Biss
au-5
6 7
-30
-31
-13
16
-27
-30
-1.3
1.5
-2.4
-2.6
Keny
a-5
880
-10
647
-10
390
-11
824
-6 0
97-5
158
-4 5
01-5
009
-10.
0-7
.9-6
.3-6
.9
Leso
tho
-1 0
55-7
92-6
54-6
67-2
31-1
54-1
04-2
40-1
0.6
-8.4
-6.5
-15.
7
Libe
ria-6
07-1
052
-980
-836
-495
-1 0
14-9
17-8
19-2
4.1
-36.
9-3
2.0
-29.
5
Liby
a-6
118
-12
121
-11
089
-9 0
51-1
2 38
7-1
7 24
7-1
5 69
7-1
3 16
0-3
0.1
-51.
0-4
4.5
-33.
3
Mad
agas
car
-457
-293
-429
-488
-21
-226
-167
-203
-0.2
-2.3
-1.7
-2.0
Mal
awi
-586
-339
-234
-219
-495
-356
-349
-373
-8.2
-6.0
-6.1
-6.7
Mal
i-4
41-6
6-3
09-3
74-6
70-3
80-4
51-6
00-5
.7-3
.6-4
.1-5
.2
Mau
r itan
ia-7
11-9
46-9
95-1
033
-1 4
71-1
394
-1 4
04-1
475
-30.
0-2
2.2
-20.
3-1
9.3
Mau
ritiu
s-2
220
-2 0
46-2
030
-1 9
61-7
40-6
44-6
24-5
52-5
.9-4
.9-4
.7-4
.0

347
Afri
can
Eco
nom
ic O
utlo
ok©
AfD
B, O
EC
D, U
ND
P 2
016
STA
TIS
TIC
AL
AN
NE
X
Tab
le 6
. Bal
ance
of
pay
men
ts i
nd
icat
ors,
201
4-1
7
Trad
e ba
lanc
e (U
SD m
illio
n)Cu
rren
t acc
ount
bal
ance
(U
SD m
illio
n)Cu
rren
t acc
ount
bal
ance
(a
s %
of G
DP)
2014
2015
(e)
2016
(p)
2017
(p)
2014
2015
(e)
2016
(p)
2017
(p)
2014
2015
(e)
2016
(p)
2017
(p)
Mor
occo
-20
611
-16
239
-15
053
-18
094
-6 2
26-2
992
-770
-1 1
04-5
.7-2
.7-0
.7-0
.9
Moz
ambi
que
-5 0
51-5
455
-4 6
28-3
865
-7 0
55-7
732
-7 0
21-6
514
-41.
6-4
4.0
-46.
1-4
7.9
Nam
ibia
-2 7
36-1
788
-1 5
76-1
297
-1 3
55-8
75-1
101
-1 0
19-1
0.4
-8.1
-11.
3-1
1.1
Nig
er
-874
-987
-1 0
21-7
43-1
724
-1 4
81-1
624
-1 3
57-2
0.9
-21.
2-2
1.9
-17.
5
Nig
eria
20 9
92-1
576
-3 8
785
146
1 27
9-1
6 12
7-1
4 64
2-1
0 66
60.
2-3
.5-3
.2-2
.0
Rw
anda
-1 4
22-1
269
-1 3
11-1
499
-929
-968
-978
-977
-11.
8-1
2.3
-11.
9-1
1.4
Sao
Tom
e an
d Pr
inci
pe-6
3-5
7-5
3-4
7-8
1-4
5-4
8-5
0-2
4.2
-14.
0-1
3.8
-13.
5
Sene
gal
-5 7
81-4
172
-4 1
58-4
247
-1 3
76-1
070
-843
-629
-9.0
-8.1
-6.0
-4.2
Seyc
helle
s-5
23-4
56-5
33-5
69-2
97-2
38-2
89-3
23-2
1.3
-14.
2-1
5.4
-15.
9
Sier
ra L
eone
-340
-155
-184
-336
-813
-475
-385
-436
-16.
4-1
1.3
-8.4
-8.1
Som
alia
……
……
……
……
……
……
Sout
h Af
rica
-6 3
25-1
450
309
-759
-19
041
-13
361
-11
476
-10
330
-5.4
-4.3
-4.1
-4.0
Sout
h Su
dan
1 04
4-9
40-1
023
-1 0
93 5
72-3
22 1
24 3
924.
0-2
.50.
92.
8
Suda
n-5
230
-5 9
23-4
878
-5 1
50-7
434
-6 6
84-6
989
-7 2
35-9
.0-6
.5-6
.4-6
.2
Swaz
iland
213
123
182
224
128
33
54
48
2.9
0.9
1.6
1.5
Tanz
ania
-3 3
85-1
663
-1 2
10-1
847
-4 9
47-4
453
-4 2
06-3
872
-10.
3-9
.4-8
.2-7
.0
Togo
-902
-693
-724
-759
-591
-474
-474
-488
-13.
2-1
1.9
-11.
0-1
0.5
Tuni
sia
-6 6
70-3
228
-2 4
09-2
947
-4 3
02-3
136
-2 4
97-2
453
-9.0
-7.6
-5.9
-5.8
Uga
nda
-2 3
60-1
968
-2 0
32-2
236
-2 6
25-2
165
-2 3
01-2
510
-9.6
-9.1
-9.1
-9.1
Zam
bia
1 62
5-1
22 3
45 6
06 6
04-7
32-2
50 2
792.
2-3
.0-1
.11.
3
Zim
babw
e-3
437
-2 9
67-2
888
-2 8
65-3
288
-2 6
83-2
507
-2 4
08-2
3.2
-21.
4-1
9.8
-18.
7
AFR
ICA
-59
274
-115
991
-116
602
-115
346
-120
714
-164
180
-147
676
-142
734
-4.8
-7.3
-6.4
-5.8
Not
e: *
Fo
r Eg
yp
t an
d E
thio
pia
, fis
cal y
ear
July
(n
-1)/
Jun
e (n
). (
e) E
stim
ates
; (p
) pro
ject
ion
s.So
urce
s: A
fDB
Sta
tist
ics
Dep
art
men
t; I
MF
WEO
Oct
ob
er 2
015.
(con
t.)


349
Afri
can
Eco
nom
ic O
utlo
ok©
AfD
B, O
EC
D, U
ND
P 2
016
STA
TIS
TIC
AL
AN
NE
X
Tab
le 7
. Ex
por
ts, 2
014
Th
ree
ma
in e
xp
ort
s, w
ith
th
eir
shar
e in
tot
al e
xp
ort
s*
Pr
oduc
t I
Prod
uct I
I
Prod
uct I
II
No.
of p
rodu
cts
acco
untin
g fo
r mor
e th
an 7
5% o
f exp
orts
Alge
riaPe
trol
eum
oils
and
oils
obt
aine
d fr
om b
itum
inou
s m
iner
als,
cru
de (4
0.0%
)N
atur
al g
as, i
n ga
seou
s st
ate
(15.
3%)
Ligh
t oils
and
pre
para
tions
(12.
1%)
4
Ango
laPe
trol
eum
oils
and
oils
obt
aine
d fr
om b
itum
inou
s m
iner
als,
cru
de (9
6.0%
)1
Beni
nPe
trol
eum
oils
, oth
er th
an c
rude
(40.
1%)
Ligh
t oils
and
pre
para
tions
(13.
6%)
Cott
on, n
ot c
arde
d/co
mbe
d (9
.6%
)5
Bots
wan
aD
iam
onds
, non
-indu
stria
l, un
wor
ked/
sim
ply
saw
n/cl
eave
d/br
uted
(72.
9%)
Dia
mon
ds, n
on-in
dust
rial,
othe
r tha
n un
wor
ked/
sim
ply
saw
n/cl
eave
d/br
uted
(8.0
%)
Nic
kel m
atte
s (6
.4%
)2
Burk
ina
Faso
Gol
d (in
cl. g
old
plat
ed w
ith p
latin
um),
in u
nwro
ught
fo
rms
(exc
l. po
wde
r) (
65.2
%)
Cott
on, n
ot c
arde
d/co
mbe
d (1
9.8%
)2
Buru
ndi
Coff
ee, n
ot ro
aste
d, n
ot d
ecaf
fein
ated
(46.
1%)
Tea,
bla
ck (f
erm
ente
d) a
nd p
artly
ferm
ente
d te
a,
whe
ther
or n
ot fl
avou
red
(17.
3%)
Nio
bium
/tan
talu
m/v
anad
ium
ore
s an
d co
ncen
trat
es (
6.9%
)5
Cabo
Ver
dePe
trol
eum
oils
and
oils
obt
aine
d fr
om b
itum
inou
s m
iner
als,
cru
de (
50.1
%)
Coco
a be
ans,
who
le/b
roke
n, r
aw/r
oast
ed (1
1.4%
)W
ood
saw
n/ch
ippe
d le
ngth
wis
e, s
liced
/pee
led,
w
heth
er o
r not
pla
ned,
san
ded
or e
nd-jo
inte
d (6
.7%
)5
Cam
eroo
nSk
ipja
ck/s
trip
e-be
llied
bon
ito (E
uthy
nnus
[Kat
suw
onus
] pe
lam
is),
froz
en (2
3.0%
)M
acke
rel,
prep
ared
/pre
serv
ed, w
hole
/in p
iece
s (e
xcl.
min
ced)
(14.
6%)
Fish
who
le/in
pie
ces
(13.
8%)
7
Cent
ral A
fric
an R
epub
licTr
opic
al w
ood,
exc
ludi
ng D
ark
Red
Mer
anti,
Lig
ht R
ed
Mer
anti
and
Mer
anti
Baka
u, in
the
roug
h (4
4.0%
)Co
tton
, not
car
ded/
com
bed
(20.
6%)
Woo
d sa
wn/
chip
ped
leng
th w
ise,
slic
ed/p
eele
d,
whe
ther
or n
ot p
lane
d, s
ande
d or
end
-join
ted
(16.
8%)
3
Chad
Petr
oleu
m o
ils a
nd o
ils o
btai
ned
from
bitu
min
ous
min
eral
s, c
rude
(95.
2%)
1
Com
oros
Clov
es (w
hole
frui
t, cl
oves
and
ste
ms)
(53
.4%
)Va
nilla
(14.
5%)
Vess
els
and
othe
r flo
atin
g st
ruct
ures
for b
reak
ing
up (1
2.6%
)3
Cong
oPe
trol
eum
oils
and
oils
obt
aine
d fr
om b
itum
inou
s m
iner
als,
cru
de (7
8.9%
)Ca
thod
es a
nd s
ectio
ns o
f cat
hode
s, o
f ref
ined
co
pper
, unw
roug
ht (9
.9%
)1
Cong
o, D
em. R
ep.
Cath
odes
and
sec
tions
of c
atho
des,
of r
efin
ed c
oppe
r, un
wro
ught
(37,
6%)
Copp
er o
res
and
conc
entr
ates
(22.
1%)
Petr
oleu
m o
ils a
nd o
ils o
btai
ned
from
bitu
min
ous
min
eral
s, c
rude
(16.
8%)
3
Côte
d’Iv
oire
Coco
a be
ans,
who
le/b
roke
n, r
aw/r
oast
ed (3
3.9%
)Co
coa
past
e, n
ot d
efat
ted
(7.6
%)
Coco
a bu
tter
, fat
and
oil
(5.6
%)
10
Djib
outi
Woo
d ch
arco
al (i
ncl.
shel
l/nut
cha
rcoa
l) (1
6.2%
)Co
ffee
, not
roas
ted,
not
dec
affe
inat
ed (1
4.7%
)Se
sam
e se
eds,
whe
ther
or n
ot b
roke
n (6
.5%
)16
Egyp
tPe
trol
eum
oils
and
oils
obt
aine
d fr
om b
itum
inou
s m
iner
als,
cru
de (2
8.4%
)80
Equa
toria
l Gui
nea
Petr
oleu
m o
ils a
nd o
ils o
btai
ned
from
bitu
min
ous
min
eral
s, c
rude
(68
.2%
)N
atur
al g
as, l
ique
fied
(23.
5%)
2
Eritr
eaCo
pper
ore
s an
d co
ncen
trat
es (9
3.7%
)1
Ethi
opia
Sesa
me
seed
s, w
heth
er o
r not
bro
ken
(24.
7%)
Coff
ee, n
ot ro
aste
d, n
ot d
ecaf
fein
ated
(24.
2%)
Cut f
low
ers
and
flow
er b
uds
of a
kin
d su
itabl
e fo
r bo
uque
ts/o
rnam
enta
l pur
pose
s, fr
esh
(9.8
%)
6
Gab
onPe
trol
eum
oils
and
oils
obt
aine
d fr
om b
itum
inou
s m
iner
als,
cru
de (8
1.3%
)M
anga
nese
ore
s an
d co
ncen
trat
es, i
ncl.
ferr
ugin
ous
man
gane
se o
res
and
conc
entr
ates
w
ith a
man
gane
se c
onte
nt o
f 20%
or m
ore
(8.5
%)
1
Gam
bia
Cash
ew n
uts,
in s
hell
(36.
6%)
Woo
d, in
the
roug
h, w
heth
er o
r not
str
ippe
d (2
7.6%
)G
roun
d-nu
t oil,
cru
de (
5.0%
)5

350
Afri
can
Eco
nom
ic O
utlo
ok©
AfD
B, O
EC
D, U
ND
P 2
016
StA
tiS
tiC
Al
AN
NE
X
Tab
le 7
. Ex
por
ts, 2
014
Th
ree
ma
in e
xp
ort
s, w
ith
th
eir
shar
e in
tot
al e
xp
ort
s*
Pr
oduc
t I
Prod
uct I
I
Prod
uct I
II
No.
of p
rodu
cts
acco
untin
g fo
r mor
e th
an 7
5% o
f exp
orts
Gha
naPe
trol
eum
oils
and
oils
obt
aine
d fr
om b
itum
inou
s m
iner
als,
cru
de (3
2.5%
)Co
coa
bean
s, w
hole
/bro
ken,
raw
/roa
sted
(19.
8%)
Gol
d (in
cl. g
old
plat
ed w
ith p
latin
um),
in
unw
roug
ht fo
rms
(exc
l. po
wde
r) (1
9.7%
)5
Gui
nea
Petr
oleu
m o
ils a
nd o
ils o
btai
ned
from
bitu
min
ous
min
eral
s, c
rude
(40.
4%)
Alum
iniu
m o
res
and
conc
entr
ates
(35.
6%)
Gol
d (in
cl. g
old
plat
ed w
ith p
latin
um),
in
unw
roug
ht fo
rms
(exc
l. po
wde
r) (1
0.8%
)2
Gui
nea-
Biss
auCa
shew
nut
s, in
she
ll (7
5.0%
)W
ood,
in th
e ro
ugh
(exc
l. tr
eate
d, c
onfe
rous
, tr
opic
al, b
eech
and
oak
) (19
.8%
)1
Keny
aTe
a, b
lack
(fer
men
ted)
and
par
tly fe
rmen
ted
tea,
whe
ther
or
not
flav
oure
d (1
5.9%
)Cu
t flo
wer
s an
d flo
wer
bud
s (1
1.5%
)Pe
trol
eum
oils
and
oils
obt
aine
d fr
om b
itum
inou
sm
iner
als,
(exc
l. cr
ude)
(8.1
%)
52
Leso
tho
Dia
mon
ds, n
on-in
dust
rial,
unw
orke
d/si
mpl
y sa
wn/
clea
ved/
brut
ed (4
0.2%
)M
en's
/boy
s' tr
ouse
rs, b
ib a
nd b
race
ove
ralls
, br
eech
es a
nd s
hort
s (e
xcl.
swim
wea
r) (1
1.1%
)W
omen
's/g
irls'
trou
sers
, bib
and
bra
ce o
vera
lls,
bree
ches
and
sho
rts
(exc
l. Sw
imw
ear)
(6.
0%)
9
Libe
riaIr
on o
res
and
conc
entr
ates
(exc
l. ro
aste
d iro
n py
rites
), no
n-ag
glom
erat
e (4
0.7%
)Ve
ssel
s an
d ot
her f
loat
ing
stru
ctur
es (1
3.9%
)Te
chni
cally
spe
cifie
d na
tura
l rub
ber (
TSN
R)
(12.
9%)
4
Liby
aPe
trol
eum
oils
and
oils
obt
aine
d fr
om b
itum
inou
s m
iner
als,
cru
de (7
8.5%
)N
atur
al g
as, i
n ga
seou
s st
ate
(13.
4%)
1
Mad
agas
car
Nic
kel,
not a
lloye
d, u
nwro
ught
(24.
0%)
Vani
lla (9
.1%
)Cl
oves
(who
le fr
uit,
clov
es a
nd s
tem
s) (4
.7%
)25
Mal
awi
Toba
cco,
par
tly/w
holly
ste
mm
ed/s
trip
ped
(59.
7%)
Tea,
bla
ck (f
erm
ente
d) a
nd p
artly
ferm
ente
d te
a,
whe
ther
or n
ot fl
avou
red
(8.0
%)
Cane
sug
ar, r
aw, i
n so
lid fo
rm (
6.2%
)4
Mal
iCo
tton
, not
car
ded/
com
bed
(43.
0%)
Gol
d (in
cl. g
old
plat
ed w
ith p
latin
um),
in
unw
roug
ht fo
rms
(exc
l. po
wde
r) (3
4.2%
)Se
sam
e se
eds,
whe
ther
or n
ot b
roke
n (6
.2%
)2
Mau
ritan
iaIr
on o
res
and
conc
entr
ates
(exc
l. ro
aste
d iro
n py
rites
), no
n-ag
glom
erat
e (4
2.4%
)G
old
(incl
. gol
d pl
ated
with
pla
tinum
), in
un
wro
ught
form
s (e
xcl.
pow
der)
(11.
4%)
Oct
opus
, oth
er th
an li
ve/f
resh
/chi
lled
(7.3
%)
6
Mau
ritiu
sTu
nas,
ski
pjac
k an
d bo
nito
(13.
8%)
Cane
/bee
t sug
ar a
nd c
hem
ical
ly p
ure
sucr
ose
(9.3
%)
Men
's/b
oys'
shi
rts
(exc
l. kn
itted
or c
roch
eted
),
of c
otto
n (6
.8%
)40
Mor
occo
Igni
tion
wiri
ng s
ets
and
othe
r wiri
ng s
ets
of a
kin
d us
ed
in v
ehic
les,
airc
raft
or s
hips
(8.8
%)
Phos
phor
ic a
cid
and
poly
phos
phor
ic a
cids
, w
heth
er o
r not
che
mic
ally
def
ined
(6.
0%)
66
Moz
ambi
que
Alum
iniu
m, n
ot a
lloye
d, u
nwro
ught
(20.
7%)
Prec
ious
sto
nes
(exc
l. di
amon
ds, r
ubie
s,
sapp
hire
s an
d em
eral
ds) a
nd s
emi-p
reci
ous
ston
es, u
nwor
ked/
sim
ply
saw
n/ro
ughl
y sh
aped
bu
t not
str
ung/
mou
nted
/set
(16.
8%)
Ligh
t oils
and
pre
para
tions
(8.8
%)
9
Nam
ibia
Dia
mon
ds, n
on-in
dust
rial,
unw
orke
d/si
mpl
y sa
wn/
clea
ved/
brut
ed (2
8.0%
)Zi
nc, n
ot a
lloye
d, u
nwro
ught
(13.
7%)
Fish
fille
ts, f
roze
n (6
.8%
)13
Nig
er
Ligh
t oils
and
pre
para
tions
(32.
3%)
Petr
oleu
m o
ils a
nd o
ils o
btai
ned
from
bitu
min
ous
min
eral
s (e
xcl.
crud
e) (1
9.7%
)Se
sam
e se
eds,
whe
ther
or n
ot b
roke
n (1
6.2%
)4
Nig
eria
Petr
oleu
m o
ils a
nd o
ils o
btai
ned
from
bitu
min
ous
min
eral
s, c
rude
(81.
4%)
Nat
ural
gas
, liq
uefie
d (1
2.3%
)1
Rw
anda
Nio
bium
/tan
talu
m/v
anad
ium
ore
s an
d co
ncen
trat
es
(27.
0%)
Tin
ores
and
con
cent
rate
s (1
9.8%
)Co
ffee
, not
roas
ted,
not
dec
affe
inat
ed (1
5.5%
)5
Sao
Tom
e an
d Pr
inci
peCo
coa
bean
s, w
hole
/bro
ken,
raw
/roa
sted
(61
.2%
)Ve
ssel
s an
d ot
her f
loat
ing
stru
ctur
es fo
r bre
akin
g up
(13.
3%)
Chem
ical
s pr
oduc
ts a
nd p
repa
ratio
ns o
f the
ch
emic
al/ a
llied
indu
strie
s (5
.6%
)3
(con
t.)

351
Afri
can
Eco
nom
ic O
utlo
ok©
AfD
B, O
EC
D, U
ND
P 2
016
STA
TIS
TIC
AL
AN
NE
X
Tab
le 7
. Ex
por
ts, 2
014
Th
ree
ma
in e
xp
ort
s, w
ith
th
eir
shar
e in
tot
al e
xp
ort
s*
Pr
oduc
t I
Prod
uct I
I
Prod
uct I
II
No.
of p
rodu
cts
acco
untin
g fo
r mor
e th
an 7
5% o
f exp
orts
Sene
gal
Gol
d (in
cl. g
old
plat
ed w
ith p
latin
um),
in u
nwro
ught
fo
rms
(exc
l. po
wde
r) (1
6.8%
)Fi
sh fr
ozen
(exc
l. fil
lets
/oth
. fis
h m
eat /
liver
s an
d ro
es) (
10.3
%)
Phos
phor
ic a
cid
and
poly
phos
phor
ic a
cids
, w
heth
er o
r not
che
mic
ally
def
ined
(7.3
%)
27
Seyc
helle
sTu
nas,
ski
pjac
k an
d bo
nito
(56
.3%
)Ye
llow
fin tu
nas
(8.7
%)
Bige
ye tu
nas
(7.9
%)
4
Sier
ra L
eone
Iron
ore
s an
d co
ncen
trat
es (e
xcl.
roas
ted
iron
pyrit
es),
non-
aggl
omer
ate
(76.
8%)
Dia
mon
ds, n
on-in
dust
rial,
unw
kd./
sim
ply
saw
n/cl
eave
d/br
uted
(8.1
%)
1
Som
alia
Sesa
me
seed
s, w
heth
er o
r not
bro
ken
(29.
0%)
Live
goa
ts (2
4.2%
)Li
ve b
ovin
e an
imal
s ot
her t
han
pure
-bre
d br
eedi
ng
anim
als
(22.
8%)
3
Sout
h Af
rica
Gol
d (in
cl. g
old
plat
ed w
ith p
latin
um),
in u
nwro
ught
fo
rms
(exc
l. po
wde
r) (8
.9%
)Ir
on o
res
and
conc
entr
ates
(exc
l. ro
aste
d iro
n py
rites
), no
n-ag
glom
. (6.
1%)
Plat
inum
, unw
roug
ht/in
pow
der f
orm
(5.
5%)
75
Sout
h Su
dan
Petr
oleu
m o
ils a
nd o
ils o
btai
ned
from
bitu
min
ous
min
eral
s, c
rude
(99.
8%)
1
Suda
nPe
trol
eum
oils
and
oils
obt
aine
d fr
om b
itum
inou
s m
iner
als,
cru
de (
66.1
%)
Sesa
me
seed
s, w
heth
er o
r not
bro
ken
(7.7
%)
3
Swaz
iland
Mix
ture
s of
odo
rifer
ous
subs
tanc
es a
nd m
ixtu
res
(incl
. al
coho
lic s
olut
ions
) (24
.3%
)Ca
ne s
ugar
, raw
, in
solid
form
, not
con
tain
ing
adde
d fla
vour
ing/
colo
urin
g m
atte
r (15
.1%
)O
ther
che
m. p
rods
. and
pre
ps. o
f the
che
m./
allie
d in
dust
ries
(incl
. tho
se c
onsi
stin
g of
mix
ts. o
f nat
. pr
ods.
) (10
.8%
)
21
Tanz
ania
Gol
d (in
cl. g
old
plat
ed w
ith p
latin
um),
in u
nwro
ught
fo
rms
(exc
l. po
wde
r) (1
5.5%
)To
bacc
o, p
artly
/who
lly s
tem
med
/str
ippe
d (1
0.3%
)Se
sam
e se
eds,
whe
ther
or n
ot b
roke
n (6
.5%
)22
Togo
Gol
d (in
cl. g
old
plat
ed w
ith p
latin
um),
in u
nwro
ught
fo
rms
(exc
l. po
wde
r) (2
4.6%
)Pe
trol
eum
oils
and
oils
obt
aine
d fr
om b
itum
inou
sm
iner
als
(exc
l. cr
ude)
(18.
2%)
Elec
tric
al e
nerg
y (6
.2%
)11
Tuni
sia
Petr
oleu
m o
ils a
nd o
ils o
btai
ned
from
bitu
min
ous
min
eral
s, c
rude
(9.0
%)
Igni
tion
wiri
ng s
ets
and
othe
r wiri
ng s
ets
of a
kin
d us
ed in
veh
icle
s, a
ircra
ft or
shi
ps (7
.8%
)M
en's
/boy
s' tr
ouse
rs, b
ib a
nd b
race
ove
ralls
, br
eech
es a
nd s
hort
s (e
xcl.
Swim
wea
r) (
5.2%
)88
Uga
nda
Coff
ee, n
ot ro
aste
d, n
ot d
ecaf
fein
ated
(30.
1%)
Sesa
me
seed
s, w
heth
er o
r not
bro
ken
(6.3
%)
Port
land
cem
ent (
excl
. whi
te c
emen
t, w
heth
er o
r no
t art
ifici
ally
col
oure
d) (
5.5%
)16
Zam
bia
Cath
odes
and
sec
tions
of c
atho
des,
of r
efin
ed c
oppe
r, un
wro
ught
(59
.7%
)To
bacc
o, p
artly
/who
lly s
tem
med
/str
ippe
d (5
.8%
)7
Zim
babw
eTo
bacc
o, p
artly
/who
lly s
tem
med
/str
ippe
d (3
9.9%
)Fe
rro-
chro
miu
m, c
onta
inin
g by
wei
ght m
ore
than
4%
of c
arbo
n, in
gra
nula
r/po
wde
r for
m (1
0.9%
)Ca
ne s
ugar
, raw
, in
solid
form
, not
Con
tain
ing
adde
d fla
vour
ing/
colo
urin
g m
atte
r (6.
9%)
10
A FR
ICA
Petr
oleu
m o
ils a
nd o
ils o
btai
ned
from
bitu
min
ous
min
eral
s, c
rude
(38
.2%
) [12
.3%
]N
atur
al g
as, l
ique
fied
(3.7
%) [
12.0
%]
Nat
ural
gas
, in
gase
ous
stat
e (3
.1%
) [8.
4%]
36
Not
es: *
Pro
du
cts
are
rep
ort
ed w
hen
acc
ou
nti
ng
for
mo
re t
han
4%
of
tota
l ex
po
rts.
** F
igu
res
in [
] re
pre
sen
t th
e sh
are
of
Afr
ica
in t
he
wo
rld
ex
po
rt f
or
each
pro
du
ct.
Sour
ces:
AfD
B S
tati
stic
s D
epa
rtm
ent;
CO
MT
RA
DE
WIT
S O
nlin
e D
atab
ase
- U
N S
tati
stic
s D
ivis
ion
.
(con
t.)

352
Afri
can
Eco
nom
ic O
utlo
ok©
AfD
B, O
EC
D, U
ND
P 2
016
StA
tiS
tiC
Al
AN
NE
X
Tab
le 8
. D
iver
sifi
cati
on a
nd
com
pet
itiv
enes
s, 2
010
-14
Div
ersi
ficat
ion
inde
x
Annu
al e
xpor
t gr
owth
(%
)Co
mpe
titiv
enes
s in
dica
tor
2010
-14
(%)
2010
2011
2012
2013
2014
2010
-14
Sect
oral
ef
fect
Glob
al
com
petit
iven
ess
effe
ct
Alge
ria4.
03.
63.
63.
84.
50.
01.
8-5
.8
Ango
la1.
11.
11.
11.
11.
15.
00.
60.
4
Beni
n6.
17.
48.
07.
84.
815
.85.
06.
8
Bots
wan
a4.
71.
82.
01.
71.
829
.4-1
.737
.3
Burk
ina
Faso
4.0
2.9
1.8
1.9
2.1
60.1
-1.1
57.3
Buru
ndi
2.2
2.1
2.7
3.7
4.0
-1.7
-2.0
-3.7
Cabo
Ver
de9.
88.
49.
95.
18.
513
.5-1
.110
.5
Cam
eroo
n4.
95.
34.
34.
73.
65.
9-0
.22.
2
Cent
ral A
fric
an R
epub
lic6.
34.
85.
05.
43.
7-1
1.6
-2.7
-12.
8
Chad
1.5
1.1
1.4
1.1
1.1
-0.2
0.5
-4.6
Com
oros
4.3
2.3
2.7
3.3
3.0
10.7
10.4
-3.8
Cong
o1.
31.
41.
31.
41.
6-1
.50.
6-6
.0
Cong
o, D
em. R
ep.
5.2
5.1
3.8
4.2
4.3
7.8
-5.0
8.8
Côte
d’Iv
oire
7.7
6.4
8.2
8.3
7.2
5.0
-1.7
2.7
Djib
outi
3.6
4.7
7.9
11.2
14.9
-14.
6-6
.1-1
2.5
Egyp
t23
.514
.313
.514
.311
.7-1
.70.
9-6
.6
Equa
toria
l Gui
nea
1.7
1.8
1.7
2.1
1.9
8.8
1.9
2.9
Eritr
ea21
.31.
11.
22.
51.
192
4.4
-4.3
924.
8
Ethi
opia
4.3
4.2
5.8
7.1
7.0
15.8
3.1
8.7
Gab
on1.
81.
81.
61.
81.
54.
0-0
.10.
2
Gam
bia
11.4
7.8
3.7
3.4
4.6
16.7
3.4
9.3
Gha
na4.
15.
75.
56.
25.
443
.3-2
.341
.6
Gui
nea
5.1
4.5
4.2
3.8
3.3
3.1
2.1
-3.0
Gui
nea-
Biss
au3.
12.
01.
52.
21.
711
.35.
91.
4
Keny
a15
.416
.617
.617
.219
.310
.6-1
.07.
7
Leso
tho
9.7
6.3
7.4
7.8
5.4
6.3
3.6
-0.4
Libe
ria8.
28.
29.
05.
74.
60.
6-8
.85.
4
Liby
a1.
51.
41.
31.
51.
6-1
4.7
0.8
-19.
6
Mad
agas
car
32.7
12.6
22.1
18.8
12.9
29.4
5.1
20.3
Mal
awi
3.0
4.3
3.4
3.2
2.7
0.1
-2.9
-1.0
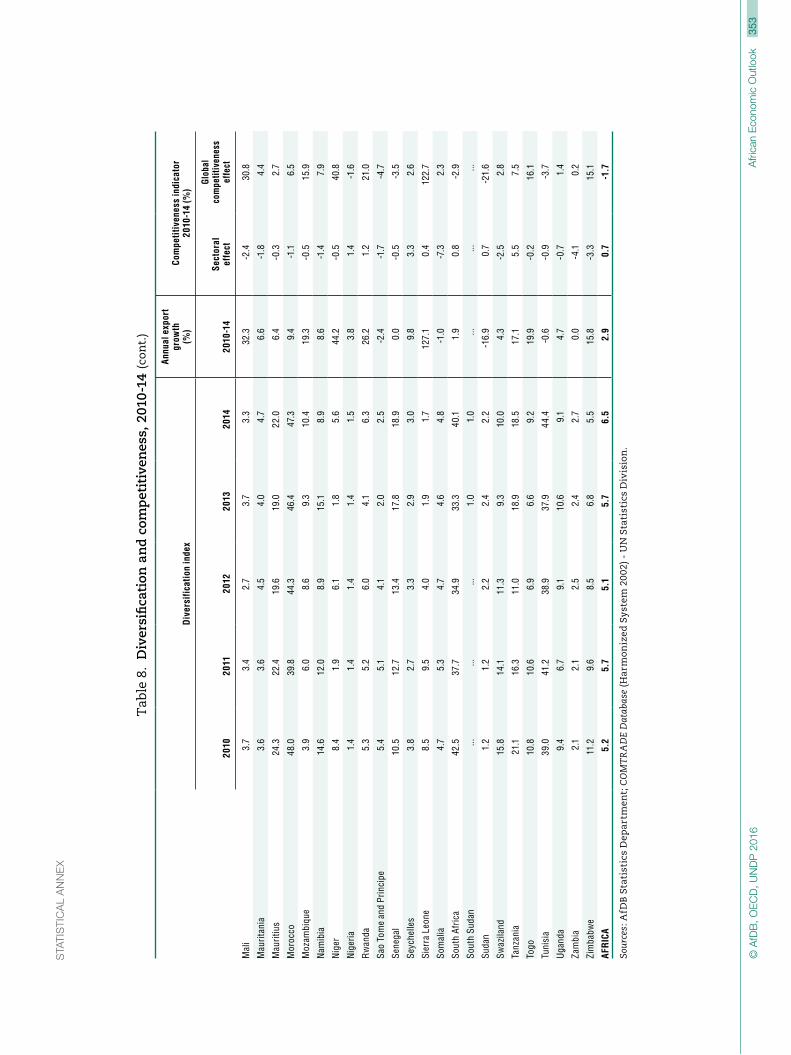
353
Afri
can
Eco
nom
ic O
utlo
ok©
AfD
B, O
EC
D, U
ND
P 2
016
STA
TIS
TIC
AL
AN
NE
X
Tab
le 8
. D
iver
sifi
cati
on a
nd
com
pet
itiv
enes
s, 2
010
-14
Div
ersi
ficat
ion
inde
x
Annu
al e
xpor
t gr
owth
(%
)Co
mpe
titiv
enes
s in
dica
tor
2010
-14
(%)
2010
2011
2012
2013
2014
2010
-14
Sect
oral
ef
fect
Glob
al
com
petit
iven
ess
effe
ct
Mal
i3.
73.
42.
73.
73.
332
.3-2
.430
.8
Mau
ritan
ia3.
63.
64.
54.
04.
76.
6-1
.84.
4
Mau
ritiu
s24
.322
.419
.619
.022
.06.
4-0
.32.
7
Mor
occo
48.0
39.8
44.3
46.4
47.3
9.4
-1.1
6.5
Moz
ambi
que
3.9
6.0
8.6
9.3
10.4
19.3
-0.5
15.9
Nam
ibia
14.6
12.0
8.9
15.1
8.9
8.6
-1.4
7.9
Nig
er
8.4
1.9
6.1
1.8
5.6
44.2
-0.5
40.8
Nig
eria
1.4
1.4
1.4
1.4
1.5
3.8
1.4
-1.6
Rw
anda
5.3
5.2
6.0
4.1
6.3
26.2
1.2
21.0
Sao
Tom
e an
d Pr
inci
pe5.
45.
14.
12.
02.
5-2
.4-1
.7-4
.7
Sene
gal
10.5
12.7
13.4
17.8
18.9
0.0
-0.5
-3.5
Seyc
helle
s3.
82.
73.
32.
93.
09.
83.
32.
6
Sier
ra L
eone
8.5
9.5
4.0
1.9
1.7
127.
10.
412
2.7
Som
alia
4.7
5.3
4.7
4.6
4.8
-1.0
-7.3
2.3
Sout
h Af
rica
42.5
37.7
34.9
33.3
40.1
1.9
0.8
-2.9
Sout
h Su
dan
......
...1.
01.
0...
......
Suda
n1.
21.
22.
22.
42.
2-1
6.9
0.7
-21.
6
Swaz
iland
15.8
14.1
11.3
9.3
10.0
4.3
-2.5
2.8
Tanz
ania
21.1
16.3
11.0
18.9
18.5
17.1
5.5
7.5
Togo
10.8
10.6
6.9
6.6
9.2
19.9
-0.2
16.1
Tuni
sia
39.0
41.2
38.9
37.9
44.4
-0.6
-0.9
-3.7
Uga
nda
9.4
6.7
9.1
10.6
9.1
4.7
-0.7
1.4
Zam
bia
2.1
2.1
2.5
2.4
2.7
0.0
-4.1
0.2
Zim
babw
e11
.29.
68.
56.
85.
515
.8-3
.315
.1
AFR
ICA
5.2
5.7
5.1
5.7
6.5
2.9
0.7
-1.7
Sour
ces:
AfD
B S
tati
stic
s D
epa
rtm
ent;
CO
MT
RA
DE
Dat
abas
e (H
arm
on
ized
Sy
stem
20
02) -
UN
Sta
tist
ics
Div
isio
n.
(con
t.)


355
Afri
can
Eco
nom
ic O
utlo
ok©
AfD
B, O
EC
D, U
ND
P 2
016
STA
TIS
TIC
AL
AN
NE
X
Tab
le 9
. In
tern
atio
nal
pri
ces
of e
xp
orts
, 20
08-1
5
Uni
t20
0820
0920
1020
1120
1220
1320
1420
15
Alum
inum
($
/mt)
2 57
2.79
1 66
4.83
2 17
3.12
2 40
1.39
2 02
3.28
1 84
6.67
1 86
7.42
1 66
4.68
Bana
na (U
S)($
/mt)
844
.21
847
.14
868
.32
967
.99
983
.98
924
.07
927
.79
957
.06
Coal
(Aus
tral
ia)
($/m
t) 1
27.1
0 7
1.84
98.
97 1
21.4
5 9
6.36
84.
56 7
0.13
57.
51
Coco
a(c
ents
/kg)
257
.71
288
.88
313
.30
298
.01
239
.19
243
.88
306
.22
313
.50
Coff
ee (A
rabi
ca)
(cen
ts/k
g) 3
08.1
6 3
17.1
1 4
32.0
1 5
97.6
1 4
11.1
0 3
07.6
0 4
42.3
8 3
52.6
1
Coff
ee (R
obus
ta)
(cen
ts/k
g) 2
32.0
9 1
64.4
2 1
73.5
9 2
40.7
6 2
26.6
8 2
07.5
9 2
21.6
4 1
94.1
1
Copp
er($
/mt)
6 95
5.88
5 14
9.74
7 53
4.78
8 82
8.19
7 96
2.35
7 33
2.10
6 86
3.40
5 51
0.46
Cott
on(c
ents
/kg)
157
.39
138
.20
228
.34
332
.85
196
.71
199
.27
183
.20
155
.74
Fish
mea
l($
/mt)
1 13
3.08
1 23
0.25
1 68
7.42
1 53
7.42
1 55
8.33
1 74
7.17
1 70
8.85
1 55
7.75
Gol
d($
/toz
) 8
71.7
1 9
72.9
71
224.
661
569.
211
669.
521
411.
461
265.
581
160.
66
Gro
undn
ut o
il($
/mt)
2 13
1.12
1 18
3.67
1 40
3.96
1 98
8.17
2 43
5.67
1 77
3.04
1 31
3.00
1 33
6.92
Iron
ore
(cen
ts/d
mt)
140
.60
100
.95
145
.86
167
.75
128
.50
135
.36
96.
94 5
5.83
Lead
(cen
ts/k
g) 2
09.0
7 1
71.9
3 2
14.8
4 2
40.0
8 2
06.4
6 2
13.9
8 2
09.5
5 1
78.7
8
Logs
(Cam
eroo
n)($
/m3 )
526
.89
421
.47
428
.56
484
.81
451
.39
463
.53
465
.17
388
.58
Mai
ze($
/mt)
223
.12
165
.51
185
.91
291
.68
298
.42
259
.39
192
.88
169
.75
Oil
(cru
de)
($/b
bl)
97.
64 6
1.86
79.
04 1
04.0
1 1
05.0
1 1
04.0
8 9
6.24
50.
75
Palm
oil
($/m
t) 9
48.5
4 6
82.8
3 9
00.8
31
125.
42 9
99.3
3 8
56.9
0 8
21.4
4 6
22.6
7
Phos
phat
e (r
ock)
($/m
t) 3
45.5
9 1
21.6
6 1
23.0
2 1
84.9
0 1
85.8
9 1
48.1
1 1
10.2
2 1
17.4
6
Rub
ber (
US)
(cen
ts/k
g) 2
84.0
8 2
14.6
4 3
86.6
2 4
82.3
2 3
37.7
3 2
79.4
5 1
95.6
6 1
55.9
4
Suga
r (EU
)(c
ents
/kg)
69.
69 5
2.44
44.
18 4
5.46
42.
01 4
3.38
43.
40 3
6.26
Suga
r (W
orld
)(c
ents
/kg)
28.
21 4
0.00
46.
93 5
7.32
47.
49 3
9.00
37.
50 2
9.63
Suga
r (U
S)(c
ents
/kg)
46.
86 5
4.88
79.
25 8
3.92
63.
56 4
5.05
53.
11 5
4.63
Tea
(Avg
. 3 a
uctio
ns)
(cen
ts/k
g) 2
42.0
5 2
72.4
0 2
88.4
9 2
92.0
5 2
89.7
8 2
86.2
0 2
72.0
5 2
70.7
3
Tea
(Mom
basa
)(c
ents
/kg)
221
.76
251
.96
256
.00
271
.90
288
.05
239
.88
204
.51
274
.16
Toba
cco,
US
impo
rt($
/mt)
3 58
8.74
4 24
1.18
4 30
4.78
4 48
5.05
4 30
2.35
4 58
8.82
4 99
0.77
4 90
8.30
Not
es: $
= U
S d
olla
r; b
bl =
ba
rrel
; cen
ts =
US
cen
ts; d
mt
= d
ry m
etri
c to
n; k
g =
kil
og
ram
; m3
= c
ub
ic m
eter
; mt
= m
etri
c to
n; t
oz
= t
roy
oz.
Sour
ces:
Wo
rld
Ban
k, G
loba
l Com
mod
ity
Pric
e Pr
ospe
cts,
Ma
rch
201
6.

356
Afri
can
Eco
nom
ic O
utlo
ok©
AfD
B, O
EC
D, U
ND
P 2
016
StA
tiS
tiC
Al
AN
NE
X
Tab
le 1
0. F
orei
gn d
irec
t in
vest
men
t, 2
009
-14
(US
D m
illi
on)
FDI i
nflo
ws
FDI o
utflo
ws
FDI i
nflo
ws/
GFC
F (%
)
Inw
ard
FDI*
po
tent
ial
inde
x
2009
2010
2011
2012
2013
2014
2009
2010
2011
2012
2013
2014
2012
2013
2014
2012
Alge
ria 2
746
2 3
00 2
580
3 0
52 2
661
1 4
88 2
14 2
20 5
34 1
93 1
17-4
5 4
2 6
2
Ango
la 2
205
-3 2
27-3
024
-6 8
98-7
120
-3 8
81 7
1 3
40 2
093
2 7
41 6
044
2 1
31-4
0-3
9-2
0 1
00
Beni
n 1
34 1
77 1
61 2
30 3
60 3
77 3
1-1
8 6
0 1
9 5
9 3
1 1
8 1
8 2
1 1
42
Bots
wan
a 1
29 2
18 1
371
487
398
393
6-1
10
-8-8
5-4
3 9
8 8
107
Burk
ina
Faso
101
35
144
329
490
342
8-4
102
73
58
59
14
20
14
151
Buru
ndi
0 1
3 1
7 3
2 0
0 0
0 0
0 0
1 5
172
Cabo
Ver
de 1
74 1
59 1
55 7
0 7
0 7
8 1
0 1
-3-5
-5 1
0 1
0 1
0 1
53
Cam
eroo
n 7
40 5
38 6
52 5
26 3
26 5
01-6
9 5
03 1
87-2
84-3
79-1
59 1
0 5
8 1
16
Cent
ral A
fric
an
Rep
ublic
42
62
37
70
2 3
0 0
0 0
0 0
22
1 2
177
Chad
375
313
282
343
538
761
0 0
0 0
0 0
9 1
5 1
4 1
58
Com
oros
14
8 2
3 1
0 9
14
0 0
0 0
0 0
10
7 9
175
Cong
o 1
274
928
2 1
80 2
152
2 9
14 5
502
-5 4
53
-31
0 7
61
70
108
128
Cong
o, D
em. R
ep.
864
2 9
39 1
687
3 3
12 2
098
2 0
63 3
5 7
91
421
401
344
59
33
29
106
Côte
d’Iv
oire
377
339
302
330
407
462
-9 2
5 1
5 1
4-6
9 9
7 7
141
Djib
outi
75
37
79
110
286
153
......
......
......
30
69
24
161
Egyp
t 6
712
6 3
86-4
83 6
031
4 1
92 4
783
571
1 1
76 6
26 2
11 3
01 2
53 1
5 1
1 1
2 4
6
Equa
toria
l Gui
nea
1 6
36 2
734
1 9
75 2
015
1 9
14 1
933
0 0
0 0
0 0
22
21
23
119
Eritr
ea 9
1 9
1 3
9 4
1 4
4 4
7...
......
......
... 1
4 1
5 1
5 1
68
Ethi
opia
221
288
627
279
953
1 2
00...
......
......
... 2
6 8
112
Gab
on 5
73 4
99 6
96 8
32 9
68 9
73 8
7 8
1 8
8 8
5 8
5 8
6 1
5 1
7 1
9 8
7
Gam
bia
1 2
0 6
6 9
3 3
8 2
8...
......
......
... 4
5 2
5 1
4 1
65
Gha
na 2
897
2 5
27 3
237
3 2
93 3
226
3 3
57 7
0 2
5 1
9 1
2 2
5 3
0 4
0 7
3
Gui
nea
141
101
956
606
135
566
0 0
1 2
0 1
44
10
65
139
Gui
nea-
Biss
au 1
7 3
3 2
5 7
20
21
0 6
1 0
0 0
15
44
45
171
Keny
a 1
15 1
78 3
35 2
59 5
05 9
89 4
6 2
9 1
6 6
0 3
5 8
98
Leso
tho
92
30
61
57
50
46
2-2
1-4
1-3
8-3
4-3
1 7
7 5
173
Libe
ria 2
18 4
50 7
85 9
85 1
061
302
364
369
372
1 3
54 6
98 0
......
... 1
70
Liby
a 3
310
1 9
09 0
1 4
25 7
02 5
0 1
165
2 7
22 1
31 2
509
180
940
11
5 0
…
Mad
agas
car
1 0
66 8
08 8
10 8
12 5
67 3
51 0
0 0
0 0
0 4
7 3
0 2
0 1
54
Mal
awi
49
97
129
129
120
130
-1 4
2 5
0 5
0-4
6-5
0 2
1 2
1 1
7 1
35

357
Afri
can
Eco
nom
ic O
utlo
ok©
AfD
B, O
EC
D, U
ND
P 2
016
STA
TIS
TIC
AL
AN
NE
X
Tab
le 1
0. F
orei
gn d
irec
t in
vest
men
t, 2
009
-14
(US
D m
illi
on)
FDI i
nflo
ws
FDI o
utflo
ws
FDI i
nflo
ws/
GFC
F (%
)
Inw
ard
FDI*
po
tent
ial
inde
x
2009
2010
2011
2012
2013
2014
2009
2010
2011
2012
2013
2014
2012
2013
2014
2012
Mal
i 7
48 4
06 5
56 3
98 3
08 1
99-1
7 4
16
3 8
23
15
6 1
57
Mau
ritan
ia-3
131
589
1 3
89 1
126
492
4 4
4 4
4 4
93
74
31
147
Mau
ritiu
s 2
48 4
30 4
33 5
89 2
59 4
18 3
7 1
29 1
58 1
80 1
35 9
1 2
2 1
0 1
5 1
10
Mor
occo
1 9
52 1
574
2 5
68 2
728
3 2
98 3
582
470
589
179
406
332
444
9 1
1 1
0 6
9
Moz
ambi
que
898
1 0
18 3
559
5 6
29 6
175
4 9
02 3
2 3
3 0
0 8
2 8
1 5
9 1
03
Nam
ibia
506
793
816
1 1
33 8
01 4
14-3
4 5
-11
-13
-34
40
26
13
125
Nig
er
791
940
1 0
66 8
41 7
19 7
69 5
9-6
0 9
2 1
01 2
1 3
4 2
9 2
0 1
55
Nig
eria
8 6
50 6
099
8 9
15 7
127
5 6
08 4
694
1 5
42 9
23 8
24 1
543
1 2
38 1
614
10
7 5
53
Rw
anda
119
251
119
255
258
268
0 0
0 0
14
0 1
5 1
4 1
4 1
44
Sao
Tom
e an
d Pr
inci
pe 1
6 5
1 3
2 2
3 1
1 2
0 0
0 0
0 0
0 1
8 1
0 1
4 1
63
Sene
gal
320
266
338
276
311
343
77
2 4
7 5
6 3
3 3
7 8
8 8
121
Seyc
helle
s 1
71 2
11 2
07 2
60 1
70 2
29 5
6 8
9 8
8 6
1 3
2 4
3 9
6
Sier
ra L
eone
110
238
951
225
144
440
0 0
0 0
-4-2
22
14
57
164
Som
alia
108
112
102
107
107
106
......
......
......
41
38
...…
Sout
h Af
rica
7 5
02 3
636
4 2
43 4
559
8 3
00 5
712
1 1
51-7
6-2
57 2
988
6 6
49 6
938
6 1
2 9
34
Sout
h Su
dan
......
... 0
-78
-700
......
......
......
......
...…
Suda
n 1
726
2 0
64 1
734
2 3
11 1
688
1 2
77...
......
......
... 2
2 1
4 1
1 1
11
Swaz
iland
66
120
107
32
84
13
7-8
-2 3
9 4
-1 1
0 2
3 3
166
Tanz
ania
953
1 8
13 1
229
1 8
00 2
131
2 1
42 0
0 0
0 0
0 1
9 2
0 1
9 9
1
Togo
49
86
711
122
184
292
37
37
1 0
60 4
20-2
1 4
64 1
6 2
3 2
9 1
43
Tuni
sia
1 6
88 1
513
1 1
48 1
603
1 1
17 1
060
77
74
21
13
22
39
16
12
11
86
Uga
nda
842
544
894
1 2
05 1
096
1 1
47 2
9 3
7-1
2 4
6-4
7 0
23
20
17
132
Zam
bia
426
634
1 1
10 2
433
1 8
10 2
484
270
1 0
95-2
-702
66
-213
32
23
34
109
Zim
babw
e 1
05 1
66 3
87 4
00 4
00 5
45 0
43
43
49
27
72
19
23
... 1
14
AFR
ICA
54
379
44
072
47
705
56
435
53
969
53
912
6 2
25 9
264
6 5
00 1
2 38
6 1
5 95
1 1
3 07
3 1
2 1
1 1
1…
Not
e: *
Th
e Po
ten
tia
l In
dex
is
bas
ed o
n 1
6 ec
on
om
ic a
nd
pol
icy
vari
able
s. S
ee n
ote
on
met
ho
dol
og
y fo
r fu
rth
er d
eta
ils.
Sour
ces:
UN
CT
AD
, FD
I O
nlin
e D
atab
ase
(Jan
ua
ry 2
016)
an
d W
orld
Inve
stm
ent
Rep
ort
2015
.
(con
t.)

358
Afri
can
Eco
nom
ic O
utlo
ok©
AfD
B, O
EC
D, U
ND
P 2
016
StA
tiS
tiC
Al
AN
NE
X
Tab
le 1
1. A
id fl
ows,
* 20
09-1
4 (U
SD
mil
lion
)
OD
A ne
t tot
al, a
ll do
nors
OD
A ne
t tot
al, D
AC c
ount
ries
OD
A ne
t tot
al, m
ultil
ater
al
2009
2010
2011
2012
2013
2014
2009
2010
2011
2012
2013
2014
2009
2010
2011
2012
2013
2014
Alge
ria 3
18 1
98 1
91 1
45 2
01 1
58 2
00 1
43 1
18 9
9 9
8 1
02 1
07 5
7 7
2 4
9 5
7 4
7
Ango
la 2
39 2
37 1
93 2
41 2
83 2
31 1
41 1
52 1
18 1
33 1
44 9
2 9
8 8
5 7
4 1
08 1
39 1
39
Beni
n 6
82 6
90 6
73 5
09 6
60 6
00 3
26 3
40 4
24 2
60 2
54 2
53 3
53 3
49 2
49 2
44 3
98 3
38
Bots
wan
a 2
79 1
53 1
18 7
3 1
07 1
00 2
23 1
03 8
8 6
2 9
0 6
2 5
6 5
1 2
2 1
0 1
7 3
7
Burk
ina
Faso
1 0
82 1
044
982
1 1
42 1
044
1 1
20 4
53 4
41 4
51 5
22 5
26 5
62 6
28 5
98 5
29 6
17 5
14 5
53
Buru
ndi
561
629
570
521
556
502
264
282
269
225
249
216
297
347
301
296
307
285
Cabo
Ver
de 1
96 3
28 2
52 2
46 2
45 2
30 1
62 2
48 2
20 2
18 2
17 1
80 3
4 8
1 3
2 2
7 2
5 4
9
Cam
eroo
n 6
48 5
41 6
11 5
96 7
48 8
52 2
68 2
67 3
26 2
57 3
62 4
47 3
80 2
74 2
85 3
39 3
84 3
99
Cent
ral A
fric
an
Rep
ublic
242
261
269
227
202
610
99
113
108
73
112
281
143
148
160
154
88
327
Chad
561
491
458
472
458
388
356
290
246
246
219
158
205
202
213
226
239
229
Com
oros
50
67
52
69
79
74
28
22
28
32
39
31
21
28
23
25
38
41
Cong
o 2
83 1
315
261
139
151
106
226
1 2
19 1
76 4
9 7
8 4
9 5
7 9
5 8
4 8
9 7
2 5
6
Cong
o, D
em. R
ep.
2 3
57 3
481
5 5
25 2
847
2 5
84 2
398
1 1
00 2
384
4 2
40 1
655
1 1
90 1
166
1 2
55 1
090
1 2
85 1
191
1 3
92 1
231
Côte
d’Iv
oire
2 4
02 8
45 1
435
2 6
35 1
272
922
1 7
21 4
37 7
22 2
102
723
245
678
406
711
525
545
673
Djib
outi
167
131
141
149
148
163
98
98
88
86
76
83
58
25
46
54
64
64
Egyp
t 1
000
589
416
1 8
07 5
508
3 5
32 5
86 3
63 2
32 3
04 3
06 2
296
148
74
897
36
366
Equa
toria
l Gui
nea
31
85
24
14
4 1
25
79
22
13
6 5
6 6
3 1
-1-5
Eritr
ea 1
44 1
61 1
33 1
34 8
1 8
3 4
3 3
6 3
4 1
5 1
4 1
5 8
6 1
05 9
5 6
4 6
7 6
9
Ethi
opia
3 8
19 3
453
3 4
93 3
221
3 8
85 3
585
1 8
18 1
857
1 9
30 1
798
1 9
14 1
915
1 9
83 1
562
1 5
48 1
406
1 9
61 1
661
Gab
on 7
7 1
04 7
3 7
3 9
0 1
11 5
3 8
4 6
2 6
1 7
5 9
9 2
5 2
0 9
13
14
12
Gam
bia
127
120
135
139
115
100
22
33
36
30
34
22
105
85
97
107
77
73
Gha
na 1
582
1 6
90 1
800
1 7
99 1
330
1 1
26 8
21 8
98 8
98 8
44 7
34 6
06 7
55 7
89 9
02 9
49 5
95 5
14
Gui
nea
214
218
204
340
473
561
171
92
82
147
249
183
47
128
121
196
201
358
Gui
nea-
Biss
au 1
47 1
25 1
20 7
9 1
04 1
09 5
2 5
4 5
2 3
7 4
2 2
7 9
5 7
1 6
7 4
1 6
0 8
1
Keny
a 1
776
1 6
25 2
481
2 6
53 3
312
2 6
65 1
225
1 1
57 1
564
1 6
69 2
019
1 6
02 5
47 4
64 9
12 9
79 1
284
1 0
55
Leso
tho
122
256
257
274
320
104
71
94
143
152
186
49
47
159
110
118
128
41
Libe
ria 5
13 1
413
761
566
535
744
342
699
519
334
318
417
171
712
242
232
216
322
Liby
a 4
1 9
641
87
129
210
32
17
464
104
72
102
8-1
0 5
9-2
0 5
2 4
5
Mad
agas
car
444
472
445
375
499
583
242
217
226
185
226
191
201
246
215
189
274
393
Mal
awi
771
1 0
15 7
97 1
169
1 1
30 9
30 4
39 5
12 4
48 6
40 6
46 5
09 3
32 5
04 3
50 5
29 4
83 4
16
Mal
i 9
84 1
089
1 2
67 9
94 1
398
1 2
34 5
75 6
85 7
77 7
32 7
23 6
78 4
08 4
04 4
87 2
61 6
63 5
48
Mau
ritan
ia 3
73 3
70 3
81 4
08 2
93 2
57 1
22 1
02 1
29 1
66 1
25 9
1 2
31 2
50 2
39 1
91 1
60 1
40

359
Afri
can
Eco
nom
ic O
utlo
ok©
AfD
B, O
EC
D, U
ND
P 2
016
STA
TIS
TIC
AL
AN
NE
X
Tab
le 1
1. A
id fl
ows,
* 20
09-1
4 (U
SD
mil
lion
)
OD
A ne
t tot
al, a
ll do
nors
OD
A ne
t tot
al, D
AC c
ount
ries
OD
A ne
t tot
al, m
ultil
ater
al
2009
2010
2011
2012
2013
2014
2009
2010
2011
2012
2013
2014
2009
2010
2011
2012
2013
2014
Mau
ritiu
s 1
55 1
25 1
87 1
78 1
48 4
9 6
4 5
8 1
13 8
6 6
5 7
5 9
3 6
9 7
5 9
3 8
6-1
6
Mor
occo
1 0
47 9
90 1
435
1 4
65 2
004
2 2
47 7
05 5
96 8
49 8
84 1
144
1 0
61 3
23 3
82 5
62 5
94 7
39 6
62
Moz
ambi
que
2 0
12 1
941
2 0
65 2
074
2 3
15 2
103
1 2
89 1
349
1 6
92 1
466
1 6
42 1
425
723
590
371
608
658
669
Nam
ibia
326
256
283
255
261
227
249
213
236
191
200
180
78
44
46
65
61
46
Nig
er
469
739
645
890
797
918
255
375
298
413
336
315
212
361
342
472
453
600
Nig
eria
1 6
57 2
058
1 7
65 1
912
2 5
15 2
476
688
846
852
895
1 1
38 1
062
967
1 2
10 9
11 1
014
1 3
75 1
413
Rw
anda
934
1 0
31 1
263
879
1 0
86 1
034
520
547
590
424
567
474
411
482
664
453
516
555
Sao
Tom
e an
d Pr
inci
pe 3
1 4
9 7
2 4
9 5
2 3
9 2
0 3
3 3
8 2
8 2
2 1
8 1
1 1
6 3
4 2
0 2
9 2
0
Sene
gal
1 0
16 9
37 1
055
1 0
73 9
92 1
107
515
535
590
706
635
800
497
388
456
370
348
304
Seyc
helle
s 2
3 5
6 2
2 3
6 2
5 1
0 1
2 2
9 7
6 7
3 1
1 1
0 1
0 1
8 1
1 4
Sier
ra L
eone
448
458
423
440
447
911
196
191
173
188
208
521
252
266
245
249
235
383
Som
alia
662
506
1 0
99 9
90 1
054
1 1
09 5
00 3
17 7
58 6
59 7
17 7
64 1
52 1
81 2
30 2
37 2
11 2
45
Sout
h Af
rica
1 0
75 1
027
1 3
95 1
066
1 2
95 1
070
862
818
1 0
26 6
83 1
015
735
211
207
368
382
279
333
Sout
h Su
dan
...
...
437
1 1
87 1
400
1 9
64 ..
. ..
. 3
90 1
039
1 1
37 1
629
...
...
46
147
261
327
Suda
n 2
351
2 0
28 1
741
1 3
66 1
503
872
1 9
12 1
509
1 3
15 8
62 1
073
533
379
487
402
416
390
325
Swaz
iland
56
91
124
88
116
86
19
31
66
55
45
51
38
60
54
30
69
35
Tanz
ania
2 9
33 2
957
2 4
40 2
823
3 4
31 2
648
1 4
09 1
654
1 6
60 1
764
1 9
52 1
455
1 5
26 1
298
773
1 0
44 1
468
1 1
83
Togo
499
404
542
241
224
208
362
253
327
114
83
80
136
151
214
123
135
130
Tuni
sia
503
550
922
1 0
17 7
10 9
21 3
50 3
55 4
92 3
75 2
02 2
20 1
59 1
92 4
13 5
74 4
64 4
53
Uga
nda
1 7
85 1
688
1 5
73 1
642
1 7
01 1
633
1 0
17 1
001
990
923
964
1 0
30 7
68 6
86 5
81 7
18 7
35 6
01
Zam
bia
1 2
67 9
17 1
034
955
1 1
42 9
95 7
02 5
97 7
01 6
51 7
29 7
75 5
64 3
21 3
27 3
04 3
81 2
20
Zim
babw
e 7
36 7
13 7
23 9
99 8
24 7
58 6
21 5
05 5
47 6
71 5
42 5
38 1
15 2
09 1
76 3
28 2
83 2
20
Afric
a un
spec
ified
5 1
95 4
335
5 0
25 5
183
4 4
76...
3 0
52 3
157
3 4
60 3
754
3 3
84...
2 0
83 1
148
1 4
67 1
364
1 0
18...
AFR
ICA
47
411
47
061
51
427
50
950
56
460
47
775
27
621
28
485
32
409
30
089
29
870
24
186
19
421
18
239
18
387
19
727
20
754
19 2
70
Not
e: O
DA
: of
fici
al d
evel
op
men
t as
sist
ance
. DA
C :
Dev
elo
pm
ent
Ass
ista
nce
Co
mm
itte
e of
OEC
D.
* N
et d
isb
urs
emen
ts.
Sour
ces:
OEC
D D
evel
op
men
t A
ssis
tan
ce C
om
mit
tee
2016
.
(con
t.)

360
Afri
can
Eco
nom
ic O
utlo
ok©
AfD
B, O
EC
D, U
ND
P 2
016
StA
tiS
tiC
Al
AN
NE
X
Tab
le 1
2. E
xte
rnal
deb
t in
dic
ator
s
Deb
t out
stan
ding
, at y
ear e
ndTo
tal d
ebt o
utst
andi
ng
(as
% o
f GD
P)D
ebt s
ervi
ce
(as
% o
f exp
orts
of g
oods
and
ser
vice
s)O
f whi
ch:
Tota
l
(mill
ion
USD
)
Mul
tilat
eral
Bila
tera
lPr
ivat
e
(as
% o
f tot
al)
2014
2014
2014
2015
(e)
2016
(p)
2017
(p)
2014
2015
(e)
2016
(p)
2017
(p)
Alge
ria3
735
0.1
63.7
36.2
1.7
1.9
1.9
1.8
2.6
2.2
2.8
2.8
Ango
la32
993
4.0
96.0
0.0
22.2
36.1
31.4
30.5
6.1
3.2
7.8
8.5
Beni
n1
784
72.3
27.7
0.0
18.6
19.5
19.4
19.6
2.8
3.3
2.7
2.8
Bots
wan
a4
013
73.3
22.5
4.2
25.3
27.9
28.4
29.6
6.2
8.1
7.7
7.3
Burk
ina
Faso
2 51
978
.121
.90.
020
.223
.224
.627
.03.
74.
54.
85.
4
Buru
ndi
508
45.5
54.5
0.0
17.5
18.2
15.0
12.5
10.4
12.6
13.2
12.0
Cabo
Ver
de1
840
45.4
54.6
0.0
105.
811
0.1
107.
810
5.7
10.0
9.0
9.1
9.2
Cam
eroo
n4
894
27.6
67.2
5.2
15.3
20.7
23.4
25.5
4.3
5.8
6.6
7.6
Cent
ral A
fric
an R
epub
lic 4
8810
.589
.50.
028
.327
.025
.924
.67.
98.
99.
16.
0
Chad
3 98
150
.549
.50.
028
.625
.724
.424
.010
.18.
116
.615
.4
Com
oros
153
43.0
57.0
0.0
22.4
28.5
29.3
30.0
7.2
2.9
3.9
4.4
Cong
o4
577
4.6
95.4
0.0
32.8
50.7
52.2
49.9
3.6
4.2
4.3
4.4
Cong
o, D
em. R
ep.
6 68
635
.964
.10.
018
.626
.627
.527
.61.
62.
22.
23.
2
Côte
d’Iv
oire
12 7
037.
474
.518
.137
.742
.841
.639
.58.
010
.212
.813
.7
Djib
outi
854
44.8
55.2
0.0
53.7
65.8
75.8
78.5
6.7
18.8
17.3
14.5
Egyp
t46
067
27.2
72.7
0.1
15.5
15.0
16.0
16.5
23.2
30.9
28.7
29.8
Equa
toria
l Gui
nea
1 02
2...
99.0
1.0
6.6
6.4
6.3
6.2
2.3
1.8
2.3
2.0
Eritr
ea 8
9465
.834
.20.
023
.223
.920
.321
.16.
86.
14.
04.
0
Ethi
opia
12 4
9236
.163
.90.
023
.224
.524
.224
.314
.119
.021
.722
.8
Gab
on3
865
11.4
88.6
0.0
21.3
34.1
39.6
35.6
5.5
8.1
9.4
10.7
Gam
bia
437
57.8
42.2
0.0
53.0
50.7
44.4
39.9
41.2
42.3
41.7
39.0
Gha
na15
821
23.6
74.5
1.9
35.6
64.4
60.4
52.6
5.8
13.2
12.7
15.3
Gui
nea
1 63
445
.654
.40.
023
.529
.534
.638
.73.
57.
26.
86.
6
Gui
nea-
Biss
au 2
7137
.562
.50.
026
.226
.224
.924
.60.
80.
71.
11.
5
Keny
a13
368
38.5
61.5
0.0
21.9
24.5
25.0
28.0
14.7
7.3
9.1
10.5
Leso
tho
920
72.9
27.1
0.0
42.2
52.1
61.1
65.2
4.3
5.1
5.1
5.5
Libe
ria 3
6528
.771
.30.
017
.824
.028
.130
.97.
78.
75.
15.
1
Liby
a5
574
...57
.442
.613
.616
.518
.917
.00.
00.
00.
00.
0
Mad
agas
car
4 61
565
.334
.40.
343
.249
.849
.849
.622
.123
.522
.220
.7
Mal
awi
1 80
256
.543
.50.
029
.834
.236
.437
.84.
05.
85.
24.
8

361
Afri
can
Eco
nom
ic O
utlo
ok©
AfD
B, O
EC
D, U
ND
P 2
016
STA
TIS
TIC
AL
AN
NE
X
Tab
le 1
2. E
xte
rnal
deb
t in
dic
ator
s
Deb
t out
stan
ding
, at y
ear e
ndTo
tal d
ebt o
utst
andi
ng
(as
% o
f GD
P)D
ebt s
ervi
ce
(as
% o
f exp
orts
of g
oods
and
ser
vice
s)O
f whi
ch:
Tota
l
(mill
ion
USD
)
Mul
tilat
eral
Bila
tera
lPr
ivat
e
(as
% o
f tot
al)
2014
2014
2014
2015
(e)
2016
(p)
2017
(p)
2014
2015
(e)
2016
(p)
2017
(p)
Mal
i3
285
69.6
30.4
0.0
27.9
35.3
36.6
38.0
6.6
9.9
7.6
8.4
Mau
ritan
ia4
553
50.6
49.4
0.0
93.0
66.9
64.4
60.4
9.9
11.0
11.6
12.5
Mau
ritiu
s13
301
8.5
15.9
75.6
105.
393
.894
.897
.14.
74.
54.
35.
0
Mor
occo
33 4
7231
.155
.613
.330
.430
.230
.931
.27.
77.
58.
09.
6
Moz
ambi
que
12 8
2640
.759
.30.
075
.783
.111
6.7
158.
115
.125
.227
.430
.1
Nam
ibia
5 51
2...
20.0
80.0
42.4
56.5
66.5
76.9
42.2
50.4
55.0
56.2
Nig
er
4 24
842
.857
.20.
051
.570
.873
.075
.46.
09.
021
.329
.3
Nig
eria
9 90
625
.112
.362
.61.
72.
12.
42.
10.
40.
50.
50.
5
Rw
anda
1 78
654
.545
.50.
022
.627
.930
.335
.06.
07.
37.
712
.3
Sao
Tom
e an
d Pr
inci
pe 2
3317
.282
.80.
069
.092
.693
.291
.613
.613
.913
.112
.9
Sene
gal
11 5
3548
.545
.65.
975
.380
.579
.476
.910
.79.
111
.012
.7
Seyc
helle
s1
670
...49
.146
.511
9.7
106.
410
0.3
99.1
2.8
4.0
4.7
4.7
Sier
ra L
eone
1 23
045
.654
.40.
024
.833
.633
.428
.92.
33.
52.
23.
2
Som
alia
......
......
......
......
......
......
Sout
h Af
rica
145
082
2.5
51.9
45.6
41.5
48.0
56.6
66.2
42.3
46.3
45.8
48.7
Sout
h Su
dan
......
......
......
......
......
......
Suda
n47
116
16.0
84.0
0.0
56.8
47.7
46.2
44.4
2.4
2.1
2.2
2.7
Swaz
iland
507
42.9
57.1
0.0
11.5
15.2
17.0
18.5
8.1
7.6
8.8
9.0
Tanz
ania
14 0
4447
.237
.015
.829
.235
.235
.736
.43.
75.
15.
76.
7
Togo
1 15
329
.470
.60.
025
.731
.532
.233
.24.
84.
24.
33.
6
Tuni
sia
27 3
5233
.458
.28.
457
.569
.070
.773
.29.
27.
19.
38.
7
Uga
nda
7 96
471
.128
.90.
029
.041
.345
.347
.87.
210
.212
.611
.6
Zam
bia
6 17
016
.465
.318
.322
.731
.940
.048
.12.
94.
26.
57.
3
Zim
babw
e13
080
14.5
33.2
52.3
92.1
121.
213
5.4
147.
621
.726
.027
.027
.0
AFR
ICA
556
897
37.6
55.1
10.1
22.3
26.3
27.7
27.9
10.7
12.1
11.8
12.3
Not
e: E
stim
ates
(e)
an
d p
roje
ctio
ns
(p).
So
urce
s: A
fDB
Sta
tist
ics
Dep
art
men
t; I
MF,
Wor
ld E
cono
mic
Ou
tloo
k D
atab
ase,
Oct
ob
er 2
015;
Wo
rld
Ban
k, G
DF
Onl
ine
Dat
abas
e.
(con
t.)

362
Afri
can
Eco
nom
ic O
utlo
ok©
AfD
B, O
EC
D, U
ND
P 2
016
StA
tiS
tiC
Al
AN
NE
X
Tab
le 1
3. D
emog
rap
hic
in
dic
ator
s
Tota
l po
pula
tion
(tho
usan
ds)
2015
Urb
an
popu
latio
n (%
of t
otal
) 20
15
Sex
ratio
(m
ales
per
10
0 fe
mal
es)
2015
Popu
latio
n gr
owth
rat
e (%
)In
fant
m
orta
lity
rate
(p
er 1
000
) 20
15
Tota
l fe
rtili
ty r
ate
(per
wom
an)
2015
Mor
talit
y un
der a
ge 5
(p
er 1
000
) 20
15
Dis
trib
utio
n by
age
(%
)
0-14
15-6
465
+
2008
2015
2015
Alge
ria39
667
72.5
101.
31.
61.
921
.92.
825
.528
.565
.55.
9
Ango
la25
022
40.2
98.5
3.4
3.3
96.0
6.0
156.
947
.750
.02.
3
Beni
n10
880
44.0
99.5
3.1
2.7
64.2
4.7
99.5
42.2
55.0
2.9
Bots
wan
a2
262
52.2
99.9
1.9
1.9
34.8
2.8
43.6
32.0
64.4
3.6
Burk
ina
Faso
18 1
0629
.598
.53.
12.
960
.95.
488
.645
.652
.02.
4
Buru
ndi
11 1
7911
.797
.73.
63.
354
.15.
981
.744
.852
.72.
5
Cabo
Ver
de 5
2164
.097
.40.
51.
320
.72.
324
.529
.765
.84.
6
Cam
eroo
n23
344
54.5
100.
02.
62.
557
.14.
687
.942
.554
.33.
2
Cent
ral A
fric
an R
ep.
4 90
039
.297
.21.
92.
091
.54.
213
0.1
39.1
57.1
3.9
Chad
14 0
3721
.810
0.3
3.3
3.3
85.0
6.1
138.
747
.749
.82.
5
Com
oros
788
27.6
101.
82.
52.
455
.14.
473
.540
.356
.92.
8
Cong
o4
620
66.1
100.
13.
22.
633
.24.
845
.042
.653
.73.
7
Cong
o, D
em. R
ep.
77 2
6739
.299
.53.
33.
274
.55.
998
.346
.051
.03.
0
Côte
d'Iv
oire
22 7
0250
.810
3.5
2.1
2.5
66.6
4.9
92.6
42.5
54.5
3.0
Djib
outi
888
78.4
100.
91.
31.
354
.23.
165
.332
.763
.14.
2
Egyp
t91
508
39.9
102.
11.
82.
220
.33.
324
.033
.261
.65.
2
Equa
toria
l Gui
nea
845
37.8
105.
13.
12.
968
.24.
794
.139
.357
.92.
9
Eritr
ea5
228
29.2
100.
42.
12.
334
.14.
246
.542
.854
.62.
6
Ethi
opia
99 3
9119
.499
.62.
72.
541
.44.
359
.241
.455
.13.
5
Gab
on1
725
88.5
102.
32.
32.
236
.13.
850
.837
.157
.85.
1
Gam
bia
1 99
159
.098
.03.
33.
347
.95.
768
.946
.251
.52.
3
Gha
na27
410
53.2
99.0
2.6
2.3
42.8
4.1
61.6
38.8
57.8
3.4
Gui
nea
12 6
0936
.410
0.6
2.7
2.7
61.0
4.9
93.7
42.5
54.4
3.1
Gui
nea-
Biss
au1
844
47.8
98.6
2.2
2.4
60.3
4.8
92.5
40.8
56.0
3.2
Keny
a46
050
26.0
99.9
2.7
2.6
35.5
4.3
49.4
41.9
55.3
2.8
Leso
tho
2 13
527
.198
.00.
81.
269
.23.
190
.236
.159
.84.
1
Libe
ria4
503
49.7
101.
64.
32.
452
.84.
669
.942
.354
.73.
0
Liby
a6
278
79.0
101.
11.
70.
311
.42.
413
.429
.865
.64.
5
Mad
agas
car
24 2
3535
.199
.42.
92.
835
.94.
449
.641
.755
.52.
8
Mal
awi
17 2
1516
.499
.73.
03.
143
.45.
064
.045
.251
.43.
4
Mal
i17
600
36.9
101.
93.
43.
074
.56.
111
4.7
47.5
50.0
2.5

363
Afri
can
Eco
nom
ic O
utlo
ok©
AfD
B, O
EC
D, U
ND
P 2
016
STA
TIS
TIC
AL
AN
NE
X
Tab
le 1
3. D
emog
rap
hic
in
dic
ator
s
Tota
l po
pula
tion
(tho
usan
ds)
2015
Urb
an
popu
latio
n (%
of t
otal
) 20
15
Sex
ratio
(m
ales
per
10
0 fe
mal
es)
2015
Popu
latio
n gr
owth
rat
e (%
)In
fant
m
orta
lity
rate
(p
er 1
000
) 20
15
Tota
l fe
rtili
ty r
ate
(per
wom
an)
2015
Mor
talit
y un
der a
ge 5
(p
er 1
000
) 20
15
Dis
trib
utio
n by
age
(%
)
0-14
15-6
465
+
2008
2015
2015
Mau
ritan
ia4
068
60.0
101.
32.
62.
565
.14.
584
.740
.056
.83.
2
Mau
ritiu
s*1
273
39.1
97.6
0.4
0.4
11.8
1.5
13.5
19.3
71.1
9.6
Mor
occo
34 3
7859
.597
.71.
11.
323
.72.
527
.627
.266
.66.
2
Moz
ambi
que
27 9
7831
.295
.52.
82.
856
.75.
378
.545
.351
.33.
3
Nam
ibia
2 45
945
.494
.81.
62.
332
.83.
545
.436
.759
.83.
5
Nig
er19
899
18.1
101.
63.
84.
157
.17.
695
.550
.547
.02.
6
Nig
eria
182
202
48.1
103.
82.
72.
769
.45.
610
8.8
44.0
53.3
2.7
Rw
anda
11 6
1030
.891
.92.
82.
431
.13.
841
.741
.156
.22.
8
Sao
Tom
e an
d Pr
inci
pe 1
9069
.399
.12.
22.
134
.64.
547
.342
.654
.33.
1
Sene
gal
15 1
2943
.396
.52.
83.
141
.75.
047
.243
.853
.32.
9
Seyc
helle
s 9
652
.410
2.6
0.9
0.6
11.7
2.3
13.6
23.4
69.7
6.9
Sier
ra L
eone
6 45
339
.198
.02.
42.
287
.14.
512
0.4
42.4
55.0
2.7
Som
alia
10 7
8740
.899
.12.
52.
685
.06.
413
6.8
46.7
50.5
2.8
Sout
h Af
rica
54 4
9063
.696
.81.
31.
033
.62.
340
.529
.265
.75.
0
Sout
h Su
dan
12 3
4018
.510
0.3
4.5
3.6
60.3
4.9
92.6
42.1
54.4
3.5
Suda
n40
235
33.3
100.
82.
52.
247
.64.
370
.140
.556
.23.
3
Swaz
iland
1 28
721
.397
.81.
71.
444
.53.
260
.737
.459
.13.
6
Tanz
ania
53 4
7030
.998
.83.
23.
235
.25.
148
.745
.251
.63.
2
Togo
7 30
539
.297
.72.
82.
752
.34.
578
.442
.255
.02.
8
Tuni
sia
11 2
5466
.797
.71.
11.
112
.12.
114
.023
.469
.17.
6
Uga
nda
39 0
3216
.699
.93.
43.
337
.75.
754
.648
.149
.42.
5
Zam
bia
16 2
1239
.299
.73.
03.
143
.35.
364
.045
.951
.22.
9
Zim
babw
e15
603
31.2
97.1
1.5
2.3
46.6
3.9
70.7
41.6
55.4
3.0
AFR
ICA
1 18
4 50
139
.710
0.1
2.6
2.6
52.2
4.6
75.5
41.0
55.5
3.5
Not
e: *
Incl
ud
ing
Aga
lega
, Ro
dri
gu
es a
nd
Sa
int
Bra
nd
on
.So
urce
s: U
nit
ed N
atio
ns,
Dep
art
men
t of
Eco
no
mic
an
d S
oci
al A
ffa
irs,
Po
pu
lati
on
Div
isio
n, W
orld
Pop
ulat
ion
Pros
pect
s, T
he 2
015
Rev
isio
n.
AfD
B S
tati
stic
s D
epa
rtm
ent,
va
rio
us
do
mes
tic
auth
ori
ties
an
d A
fDB
est
imat
es.
(con
t.)

364
Afri
can
Eco
nom
ic O
utlo
ok©
AfD
B, O
EC
D, U
ND
P 2
016
StA
tiS
tiC
Al
AN
NE
X
Tab
le 1
4. P
over
ty a
nd
in
com
e d
istr
ibu
tion
in
dic
ator
s
Nat
iona
l pov
erty
line
* Po
pula
tion
belo
w th
e po
vert
y lin
e (%
)In
tern
atio
nal p
over
ty li
ne
Popu
latio
n be
low
the
pove
rty
line
(%)
Gin
i coe
ffic
ient
**Sh
are
of c
onsu
mpt
ion
(%)
Surv
ey y
ear
Rur
alU
rban
Nat
iona
lSu
rvey
yea
rBe
low
U
SD 1
.90
Belo
w
USD
3.1
0Su
rvey
yea
rIn
dex
Low
est 1
0%H
ighe
st 1
0%
Alge
ria...
......
......
......
1995
35.3
2.9
26.9
Ango
la20
0858
.318
.736
.620
0830
.154
.520
0842
.72.
132
.3
Beni
n20
1139
.731
.436
.220
1153
.175
.620
1143
.42.
534
.5
Bots
wan
a20
0924
.311
.019
.320
0918
.235
.720
0960
.51.
149
.6
Burk
ina
Faso
2009
52.8
25.2
46.7
2009
55.3
80.5
2009
39.8
2.7
32.1
Buru
ndi
2006
68.9
34.0
66.9
2006
77.7
92.2
2006
33.4
4.0
28.0
Cabo
Ver
de20
0744
.313
.226
.620
0717
.639
.320
0747
.22.
037
.1
Cam
eroo
n20
0755
.012
.239
.920
0729
.354
.320
0742
.82.
533
.0
Cent
ral A
fric
an R
epub
lic20
0869
.449
.662
.020
0866
.382
.320
0856
.21.
246
.2
Chad
2011
52.5
20.9
46.7
2011
38.4
64.8
2011
43.3
1.8
32.4
Com
oros
2004
48.7
34.5
44.8
2004
13.5
32.3
2004
55.9
1.5
48.1
Cong
o20
1174
.8...
46.5
2011
28.7
52.9
2011
40.2
2.2
29.9
Cong
o, D
em. R
ep.
2012
64.9
61.6
63.6
2012
77.2
90.7
2012
42.1
2.1
32.0
Côte
d’Iv
oire
2015
56.8
35.9
46.3
2008
29.0
55.1
2008
43.2
1.8
32.6
Djib
outi
......
......
2012
18.3
37.0
2012
45.1
1.3
34.4
Egyp
t20
1032
.315
.325
.2...
......
2008
30.8
4.0
26.6
Equa
toria
l Gui
nea
2006
79.9
31.5
76.8
......
......
......
...
Eritr
ea19
93...
62.0
69.0
......
......
......
...
Ethi
opia
2010
30.4
25.7
29.6
2010
33.5
71.3
2010
33.2
3.2
27.4
Gab
on20
0544
.629
.832
.720
058.
024
.420
0542
.22.
333
.2
Gam
bia
2010
73.9
32.7
48.4
2003
45.3
68.0
2003
47.3
1.8
36.9
Gha
na20
1237
.910
.624
.220
0525
.249
.020
0542
.81.
932
.7
Gui
nea
2012
64.7
35.4
55.2
2012
35.3
68.7
2012
33.7
3.0
26.4
Gui
nea-
Biss
au20
1075
.651
.069
.320
1067
.183
.620
1050
.71.
642
.0
Keny
a20
0549
.133
.745
.920
0533
.658
.920
0548
.51.
738
.8
Leso
tho
2010
61.2
39.6
57.1
2010
59.7
77.3
2010
54.2
0.9
40.9
Libe
ria20
0767
.755
.163
.820
0768
.689
.620
0736
.52.
428
.3
Liby
a...
......
......
......
......
......
Mad
agas
car
2010
81.5
51.1
75.3
2010
81.8
92.9
2010
40.6
2.6
33.2
Mal
awi
2010
56.6
17.3
50.7
2010
70.9
87.6
2010
46.1
2.2
37.5
Mal
i20
0950
.618
.943
.620
0949
.377
.720
0933
.03.
325
.7
Mau
ritan
ia20
0859
.420
.842
.020
0810
.932
.520
0837
.52.
527
.9

365
Afri
can
Eco
nom
ic O
utlo
ok©
AfD
B, O
EC
D, U
ND
P 2
016
STA
TIS
TIC
AL
AN
NE
X
Tab
le 1
4. P
over
ty a
nd
in
com
e d
istr
ibu
tion
in
dic
ator
s
Nat
iona
l pov
erty
line
* Po
pula
tion
belo
w th
e po
vert
y lin
e (%
)In
tern
atio
nal p
over
ty li
ne
Popu
latio
n be
low
the
pove
rty
line
(%)
Gin
i coe
ffic
ient
**Sh
are
of c
onsu
mpt
ion
(%)
Surv
ey y
ear
Rur
alU
rban
Nat
iona
lSu
rvey
yea
rBe
low
U
SD 1
.90
Belo
w
USD
3.1
0Su
rvey
yea
rIn
dex
Low
est 1
0%H
ighe
st 1
0%
Mau
ritiu
s...
......
...20
120.
53.
020
1235
.83.
029
.0
Mor
occo
2007
14.4
4.8
8.9
2007
3.1
15.5
2007
40.7
2.6
33.1
Moz
ambi
que
2008
56.9
49.6
54.7
2008
68.7
87.5
2008
45.6
1.9
36.8
Nam
ibia
2009
37.4
14.6
28.7
2009
22.6
45.7
2009
61.0
1.3
51.8
Nig
er
2011
55.2
18.6
48.9
2011
50.3
81.8
2011
31.5
3.8
26.4
Nig
eria
2009
52.8
34.1
46.0
2009
53.5
76.5
2009
43.0
2.0
32.7
Rw
anda
2010
48.7
22.1
44.9
2010
60.3
80.7
2010
51.3
2.1
44.3
Sao
Tom
e an
d Pr
inci
pe20
0959
.463
.861
.720
1033
.969
.220
1030
.83.
524
.2
Sene
gal
2010
57.1
33.1
46.7
2011
38.0
66.3
2011
40.3
2.3
31.1
Seyc
helle
s20
0637
.239
.037
.820
060.
41.
020
0642
.82.
433
.8
Sier
ra L
eone
2011
66.1
31.2
52.9
2011
52.3
80.0
2011
34.0
3.3
26.9
Som
alia
......
......
......
......
......
...
Sout
h Af
rica
2010
77.0
39.2
53.8
2011
16.6
34.7
2011
63.4
0.9
51.3
Sout
h Su
dan
2009
55.4
24.4
50.6
......
......
......
...
Suda
n20
0957
.626
.546
.520
0914
.938
.920
0935
.42.
626
.7
Swaz
iland
2009
73.1
31.1
63.0
2009
42.0
63.1
2009
51.5
1.5
40.0
Tanz
ania
2011
33.3
15.5
28.2
2011
46.6
76.1
2011
37.8
3.1
31.0
Togo
2011
73.4
34.6
58.7
2011
54.2
74.5
2011
46.0
1.9
34.5
Tuni
sia
2010
......
15.5
2010
2.0
8.4
2010
35.8
2.6
27.0
Uga
nda
2012
22.4
9.6
19.5
2012
33.2
63.0
2012
42.4
2.4
33.9
Zam
bia
2010
77.9
27.5
60.5
2010
64.4
78.9
2010
55.6
1.5
45.2
Zim
babw
e20
1184
.346
.572
.3...
......
......
......
Not
es: *
Th
e n
atio
na
l po
vert
y li
ne
is d
efin
ed a
s tw
o-t
hir
ds
of t
he
aver
age
con
sum
pti
on
.
*
* T
he
Gin
i co
effi
cien
t is
bas
ed o
n i
nco
me
dis
trib
uti
on
.So
urce
s: D
om
esti
c au
tho
riti
es a
nd
Wo
rld
Ban
k, O
nlin
e D
atab
ase,
Cou
ntry
DH
S.
(con
t.)

366
Afri
can
Eco
nom
ic O
utlo
ok©
AfD
B, O
EC
D, U
ND
P 2
016
StA
tiS
tiC
Al
AN
NE
X
Tab
le 1
5. A
cces
s to
ser
vice
s
Tele
com
mun
icat
ions
Acce
ss to
ele
ctri
city
Wat
er s
uppl
y co
vera
geSa
nita
tion
cove
rage
Mai
n te
leph
one
line
per 1
00 in
habi
tant
sM
obile
line
pe
r 100
inha
bita
nts
Inte
rnet
use
rs p
er
100
inha
bita
nts
Elec
tric
ity
cons
umpt
ion
(KW
h - m
illio
ns)
(%)
(%)
Tota
lU
rban
Rur
alTo
tal
Urb
anR
ural
2007
2014
2007
2014
2007
2014
2007
2014
2013
2013
Alge
ria8.
747.
7678
.53
92.9
59.
4518
.09
37 8
2754
928
8484
8288
9082
Ango
la0.
531.
2728
.01
63.4
83.
2021
.26
3 94
85
848
4975
2852
8922
Beni
n1.
271.
8523
.56
99.6
51.
795.
30 8
911
208
7885
7220
367
Bots
wan
a7.
158.
3060
.14
167.
305.
2818
.50
3 21
63
650
9699
9263
7943
Burk
ina
Faso
0.82
0.72
13.0
571
.74
0.75
9.40
730
1 21
282
9776
2050
7
Buru
ndi
0.34
0.21
3.24
30.4
60.
701.
38 1
83 2
5076
9174
4844
49
Cabo
Ver
de14
.84
11.6
231
.47
121.
798.
2840
.26
275
386
9294
8772
8254
Cam
eroo
n0.
994.
6123
.75
75.6
92.
9311
.00
5 19
75
942
7695
5346
6227
Cent
ral A
fric
an R
ep.
...0.
028.
2824
.54
0.38
4.03
160
170
6890
5422
447
Chad
0.30
0.18
8.59
39.7
50.
852.
50 1
37 1
8651
7245
1231
6
Com
oros
4.11
3.12
9.82
50.9
02.
506.
98 4
3 4
190
9389
3648
31
Cong
o0.
360.
3634
.26
108.
152.
767.
11 7
861
612
7696
4015
206
Cong
o, D
em. R
ep.
0.01
0.00
11.5
353
.49
0.37
3.00
6 91
88
348
5281
3129
2929
Côte
d'Iv
oire
1.38
1.17
41.6
110
6.25
1.80
14.6
04
911
6 55
282
9369
2233
10
Djib
outi
1.77
2.47
8.71
32.3
91.
6210
.71
326
396
9097
6547
605
Egyp
t15
.13
7.57
40.5
411
4.31
16.0
331
.70
129
177
162
149
9910
099
9597
93
Equa
toria
l Gui
nea
1.56
1.94
23.4
566
.39
1.56
18.8
6 1
00 9
748
7331
7580
71
Eritr
ea0.
720.
981.
626.
390.
410.
99 2
71 3
4658
7353
1645
7
Ethi
opia
1.09
0.85
1.50
31.5
90.
372.
903
504
7 74
257
9349
2827
28
Gab
on1.
831.
0880
.77
171.
385.
779.
811
742
2 31
893
9767
4243
32
Gam
bia
3.18
2.93
52.3
311
9.63
6.21
15.5
6 2
36 2
6190
9484
5962
55
Gha
na1.
670.
9833
.76
114.
823.
8518
.90
8 04
312
127
8993
8415
209
Gui
nea
0.22
0.00
19.9
172
.10
0.78
1.72
819
652
7793
6720
3412
Gui
nea-
Biss
au0.
310.
2919
.96
63.4
82.
213.
32 3
0 3
579
9960
2134
8
Keny
a1.
230.
4030
.06
73.8
47.
9543
.40
6 41
58
412
6382
5730
3130
Leso
tho
2.43
1.96
24.6
785
.02
3.45
11.0
0 5
90 7
9482
9577
3037
28
Libe
ria0.
060.
2315
.98
73.3
50.
555.
41 2
30 2
8076
8963
1728
6
Liby
a16
.76
11.3
077
.83
161.
124.
7217
.76
29 8
8328
231
......
...97
9796
Mad
agas
car
0.69
1.06
11.4
541
.21
0.65
3.70
1 26
11
570
5282
3512
189
Mal
awi
1.28
0.38
7.66
33.4
70.
975.
831
689
1 56
690
9689
4147
40
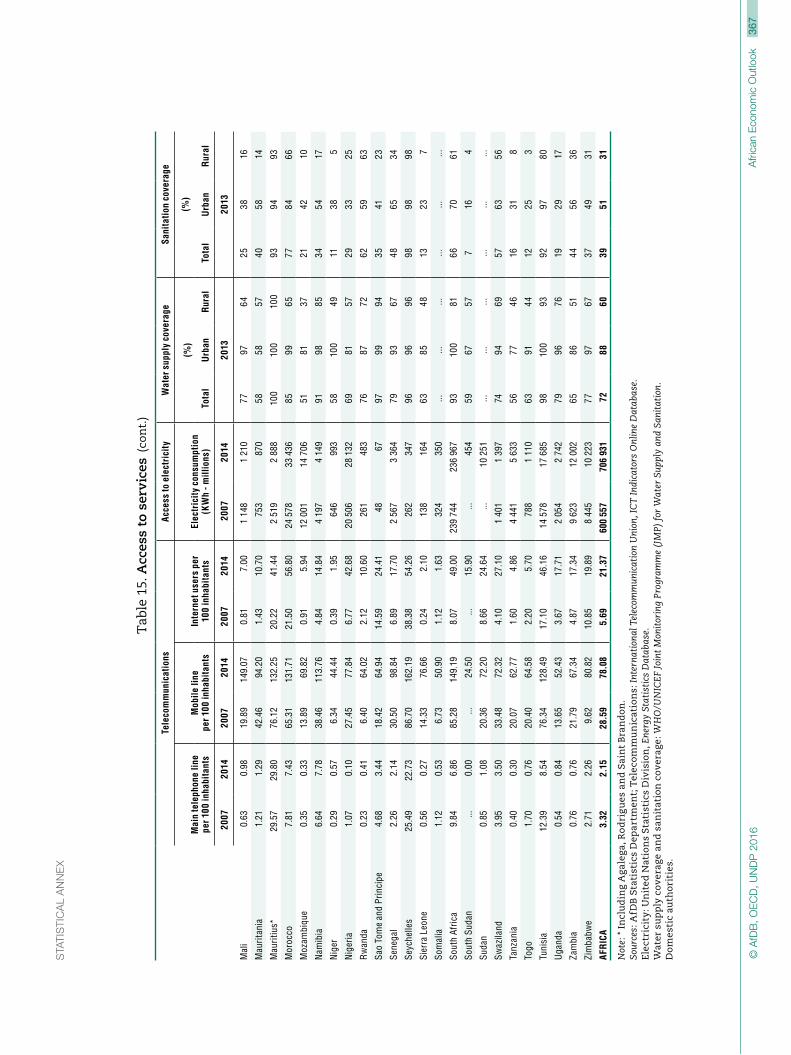
367
Afri
can
Eco
nom
ic O
utlo
ok©
AfD
B, O
EC
D, U
ND
P 2
016
STA
TIS
TIC
AL
AN
NE
X
Tab
le 1
5. A
cces
s to
ser
vice
s
Tele
com
mun
icat
ions
Acce
ss to
ele
ctri
city
Wat
er s
uppl
y co
vera
geSa
nita
tion
cove
rage
Mai
n te
leph
one
line
per 1
00 in
habi
tant
sM
obile
line
pe
r 100
inha
bita
nts
Inte
rnet
use
rs p
er
100
inha
bita
nts
Elec
tric
ity
cons
umpt
ion
(KW
h - m
illio
ns)
(%)
(%)
Tota
lU
rban
Rur
alTo
tal
Urb
anR
ural
2007
2014
2007
2014
2007
2014
2007
2014
2013
2013
Mal
i0.
630.
9819
.89
149.
070.
817.
001
148
1 21
077
9764
2538
16
Mau
ritan
ia1.
211.
2942
.46
94.2
01.
4310
.70
753
870
5858
5740
5814
Mau
ritiu
s*29
.57
29.8
076
.12
132.
2520
.22
41.4
42
519
2 88
810
010
010
093
9493
Mor
occo
7.81
7.43
65.3
113
1.71
21.5
056
.80
24 5
7833
436
8599
6577
8466
Moz
ambi
que
0.35
0.33
13.8
969
.82
0.91
5.94
12 0
0114
706
5181
3721
4210
Nam
ibia
6.64
7.78
38.4
611
3.76
4.84
14.8
44
197
4 14
991
9885
3454
17
Nig
er0.
290.
576.
3444
.44
0.39
1.95
646
993
5810
049
1138
5
Nig
eria
1.07
0.10
27.4
577
.84
6.77
42.6
820
506
28 1
3269
8157
2933
25
Rw
anda
0.23
0.41
6.40
64.0
22.
1210
.60
261
483
7687
7262
5963
Sao
Tom
e an
d Pr
inci
pe4.
683.
4418
.42
64.9
414
.59
24.4
1 4
8 6
797
9994
3541
23
Sene
gal
2.26
2.14
30.5
098
.84
6.89
17.7
02
567
3 36
479
9367
4865
34
Seyc
helle
s25
.49
22.7
386
.70
162.
1938
.38
54.2
6 2
62 3
4796
9696
9898
98
Sier
ra L
eone
0.56
0.27
14.3
376
.66
0.24
2.10
138
164
6385
4813
237
Som
alia
1.12
0.53
6.73
50.9
01.
121.
63 3
24 3
50...
......
......
...
Sout
h Af
rica
9.84
6.86
85.2
814
9.19
8.07
49.0
023
9 74
423
6 96
793
100
8166
7061
Sout
h Su
dan
...0.
00...
24.5
0...
15.9
0...
454
5967
577
164
Suda
n0.
851.
0820
.36
72.2
08.
6624
.64
...10
251
......
......
......
Swaz
iland
3.95
3.50
33.4
872
.32
4.10
27.1
01
401
1 39
774
9469
5763
56
Tanz
ania
0.40
0.30
20.0
762
.77
1.60
4.86
4 44
15
633
5677
4616
318
Togo
1.70
0.76
20.4
064
.58
2.20
5.70
788
1 11
063
9144
1225
3
Tuni
sia
12.3
98.
5476
.34
128.
4917
.10
46.1
614
578
17 6
8598
100
9392
9780
Uga
nda
0.54
0.84
13.6
552
.43
3.67
17.7
12
054
2 74
279
9676
1929
17
Zam
bia
0.76
0.76
21.7
967
.34
4.87
17.3
49
623
12 0
0265
8651
4456
36
Zim
babw
e2.
712.
269.
6280
.82
10.8
519
.89
8 44
510
223
7797
6737
4931
AFR
ICA
3.32
2.15
28.5
978
.08
5.69
21.3
760
0 55
7 7
06 9
31 7
288
6039
5131
Not
e: *
In
clu
din
g A
gale
ga, R
od
rig
ues
an
d S
ain
t B
ran
do
n.
Sour
ces:
AfD
B S
tati
stic
s D
epa
rtm
ent;
Tel
eco
mm
un
icat
ion
s: In
tern
atio
nal T
elec
omm
unic
atio
n U
nion
, IC
T In
dica
tors
Onl
ine
Dat
abas
e.
Elec
tric
ity
: Un
ited
Nat
ion
s S
tati
stic
s D
ivis
ion
, Ene
rgy
Stat
isti
cs D
atab
ase.
W
ater
su
pp
ly c
ove
rage
an
d s
anit
atio
n c
ove
rage
: WH
O/U
NIC
EF
Join
t M
onit
orin
g Pr
ogra
mm
e (J
MP)
for
Wat
er S
upp
ly a
nd S
anit
atio
n.
Do
mes
tic
auth
ori
ties
.
(con
t.)
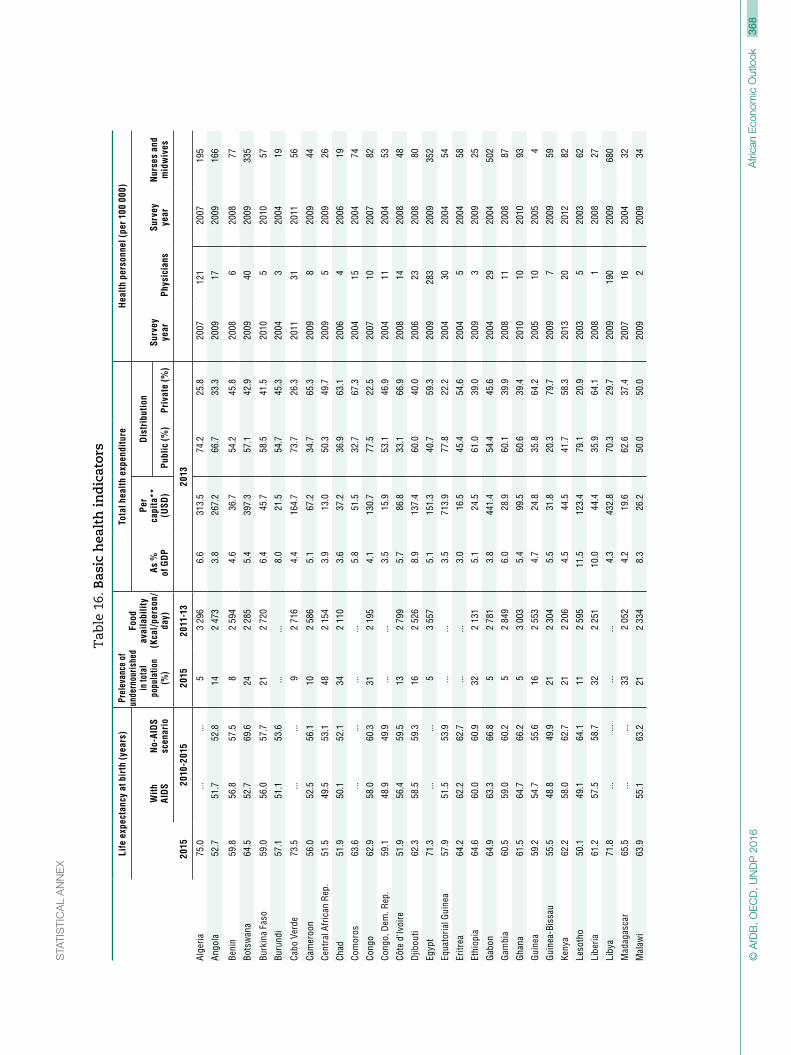
368
Afri
can
Eco
nom
ic O
utlo
ok©
AfD
B, O
EC
D, U
ND
P 2
016
StA
tiS
tiC
Al
AN
NE
X
Tab
le 1
6. B
asic
hea
lth
in
dic
ator
s
Life
exp
ecta
ncy
at b
irth
(yea
rs)
Prel
evan
ce o
f un
dern
ouris
hed
in to
tal
popu
latio
n
(%)
Food
av
aila
bilit
y (K
cal/
pers
on/
day)
Tota
l hea
lth e
xpen
ditu
reH
ealth
per
sonn
el (
per 1
00 0
00)
With
AI
DS
No-
AID
S sc
enar
ioAs
%
of G
DP
Per
capi
ta**
(U
SD)
Dis
trib
utio
nSu
rvey
ye
arPh
ysic
ians
Surv
ey
year
Nur
ses
and
mid
wiv
esPu
blic
(%)
Priv
ate
(%)
2015
2010
-201
520
1520
11-1
320
13
Alge
ria75
.0...
...5
3 29
66.
631
3.5
74.2
25.8
2007
121
2007
195
Ango
la52
.751
.752
.814
2 47
33.
826
7.2
66.7
33.3
2009
1720
0916
6
Beni
n59
.856
.857
.58
2 59
44.
636
.754
.245
.820
086
2008
77
Bots
wan
a64
.552
.769
.624
2 28
55.
439
7.3
57.1
42.9
2009
4020
0933
5
Burk
ina
Faso
59.0
56.0
57.7
212
720
6.4
45.7
58.5
41.5
2010
520
1057
Buru
ndi
57.1
51.1
53.6
......
8.0
21.5
54.7
45.3
2004
320
0419
Cabo
Ver
de73
.5...
...9
2 71
64.
416
4.7
73.7
26.3
2011
3120
1156
Cam
eroo
n56
.052
.556
.110
2 58
65.
167
.234
.765
.320
098
2009
44
Cent
ral A
fric
an R
ep.
51.5
49.5
53.1
482
154
3.9
13.0
50.3
49.7
2009
520
0926
Chad
51.9
50.1
52.1
342
110
3.6
37.2
36.9
63.1
2006
420
0619
Com
oros
63.6
......
......
5.8
51.5
32.7
67.3
2004
1520
0474
Cong
o62
.958
.060
.331
2 19
54.
113
0.7
77.5
22.5
2007
1020
0782
Cong
o, D
em. R
ep.
59.1
48.9
49.9
......
3.5
15.9
53.1
46.9
2004
1120
0453
Côte
d'Iv
oire
51.9
56.4
59.5
132
799
5.7
86.8
33.1
66.9
2008
1420
0848
Djib
outi
62.3
58.5
59.3
162
526
8.9
137.
460
.040
.020
0623
2008
80
Egyp
t71
.3...
...5
3 55
75.
115
1.3
40.7
59.3
2009
283
2009
352
Equa
toria
l Gui
nea
57.9
51.5
53.9
......
3.5
713.
977
.822
.220
0430
2004
54
Eritr
ea64
.262
.262
.7...
...3.
016
.545
.454
.620
045
2004
58
Ethi
opia
64.6
60.0
60.9
322
131
5.1
24.5
61.0
39.0
2009
320
0925
Gab
on64
.963
.366
.85
2 78
13.
844
1.4
54.4
45.6
2004
2920
0450
2
Gam
bia
60.5
59.0
60.2
52
849
6.0
28.9
60.1
39.9
2008
1120
0887
Gha
na61
.564
.766
.25
3 00
35.
499
.560
.639
.420
1010
2010
93
Gui
nea
59.2
54.7
55.6
162
553
4.7
24.8
35.8
64.2
2005
1020
054
Gui
nea-
Biss
au55
.548
.849
.921
2 30
45.
531
.820
.379
.720
097
2009
59
Keny
a62
.258
.062
.721
2 20
64.
544
.541
.758
.320
1320
2012
82
Leso
tho
50.1
49.1
64.1
112
595
11.5
123.
479
.120
.920
035
2003
62
Libe
ria61
.257
.558
.732
2 25
110
.044
.435
.964
.120
081
2008
27
Liby
a71
.8...
......
...4.
343
2.8
70.3
29.7
2009
190
2009
680
Mad
agas
car
65.5
......
332
052
4.2
19.6
62.6
37.4
2007
1620
0432
Mal
awi
63.9
55.1
63.2
212
334
8.3
26.2
50.0
50.0
2009
220
0934

369
Afri
can
Eco
nom
ic O
utlo
ok©
AfD
B, O
EC
D, U
ND
P 2
016
STA
TIS
TIC
AL
AN
NE
X
Tab
le 1
6. B
asic
hea
lth
in
dic
ator
s
Life
exp
ecta
ncy
at b
irth
(yea
rs)
Prel
evan
ce o
f un
dern
ouris
hed
in to
tal
popu
latio
n
(%)
Food
av
aila
bilit
y (K
cal/
pers
on/
day)
Tota
l hea
lth e
xpen
ditu
reH
ealth
per
sonn
el (
per 1
00 0
00)
With
AI
DS
No-
AID
S sc
enar
ioAs
%
of G
DP
Per
capi
ta**
(U
SD)
Dis
trib
utio
nSu
rvey
ye
arPh
ysic
ians
Surv
ey
year
Nur
ses
and
mid
wiv
esPu
blic
(%)
Priv
ate
(%)
2015
2010
-201
520
1520
11-1
320
13
Mal
i58
.552
.153
.55
2 83
37.
153
.339
.760
.320
108
2010
43
Mau
ritan
ia63
.2...
...6
2 79
13.
848
.449
.051
.020
0913
2009
67
Mau
ritiu
s*74
.6...
...5
3 05
54.
846
2.5
49.1
50.9
2004
106
2004
373
Mor
occo
74.3
......
53
334
6.0
189.
233
.966
.120
0962
2009
89
Moz
ambi
que
55.5
51.0
58.2
252
283
6.8
40.3
46.4
53.6
2012
420
1241
Nam
ibia
65.1
62.7
71.3
422
086
7.7
422.
660
.439
.620
0737
2007
278
Nig
er61
.9...
...10
2 54
66.
527
.236
.763
.320
082
2008
14
Nig
eria
53.1
52.5
55.1
72
700
3.7
115.
023
.976
.120
0941
2008
161
Rw
anda
64.7
55.8
57.5
322
148
11.1
70.5
58.8
41.2
2010
620
1069
Sao
Tom
e an
d Pr
inci
pe66
.6...
...7
2 67
66.
911
0.0
28.8
71.2
2004
4920
0418
7
Sene
gal
66.9
......
252
454
4.2
45.6
52.3
47.7
2008
620
0842
Seyc
helle
s73
.3...
......
...4.
055
0.8
92.0
8.0
2012
107
2012
481
Sier
ra L
eone
51.3
48.2
49.1
222
333
11.8
95.8
14.3
85.7
2010
220
1017
Som
alia
55.7
......
......
......
......
2006
420
0611
Sout
h Af
rica
57.7
53.8
65.8
53
007
8.9
593.
548
.451
.620
1378
2013
511
Sout
h Su
dan
56.1
……
......
2.2
18.1
35.3
64.7
......
......
Suda
n63
.7...
......
2 34
66.
511
5.0
21.1
78.9
2008
2820
0884
Swaz
iland
48.9
49.2
63.7
272
275
8.4
256.
174
.725
.320
0917
2009
160
Tanz
ania
65.5
59.3
63.7
322
208
7.3
49.3
36.3
63.7
2012
320
1244
Togo
60.2
57.8
60.1
112
366
8.6
54.4
52.1
47.9
2008
520
0827
Tuni
sia
75.0
......
53
362
7.1
308.
659
.340
.720
1012
220
0932
8
Uga
nda
59.2
54.7
59.0
262
279
9.8
59.1
44.4
55.6
2005
1220
0513
1
Zam
bia
60.8
49.6
57.7
481
930
5.0
92.8
58.3
41.7
2012
1720
1078
Zim
babw
e59
.253
.567
.533
2 11
0...
......
...20
118
2011
134
AFR
ICA
61.2
54.2
57.9
162
448
5.7
236.
145
.554
.5…
……
…
Not
e: *
In
clu
din
g A
gale
ga, R
od
rig
ues
an
d S
ain
t B
ran
do
n.
**
At
aver
age
exch
ange
rat
e.So
urce
s: A
fDB
Sta
tist
ics
Dep
art
men
t; L
ife
exp
ecta
ncy
at
bir
th a
nd
HIV
/AID
S: U
nit
ed N
atio
ns,
Dep
art
men
t of
Eco
no
mic
an
d S
oci
al A
ffa
irs,
Po
pu
lati
on
Div
isio
n, W
orld
Pop
ulat
ion
Pros
pect
s, T
he 2
015
Rev
isio
n.U
nd
ern
ou
rish
men
t p
reva
len
ce a
nd
fo
od
ava
ilab
ilit
y: F
AO
, Foo
d In
secu
rity
Onl
ine
Dat
abas
e.T
ota
l hea
lth
ex
pen
dit
ure
an
d p
ub
lic
hea
lth
ex
pen
dit
ure
: WH
O O
nlin
e D
atab
ase.
(con
t.)

370
Afri
can
Eco
nom
ic O
utlo
ok©
AfD
B, O
EC
D, U
ND
P 2
016
StA
tiS
tiC
Al
AN
NE
X
Tab
le 1
7. M
ajor
dis
ease
s
Hea
lthy
life
expe
ctan
cy a
t bir
th (y
ears
)H
IV /
AID
SM
alar
iaTu
berc
ulos
isM
easl
esVa
ccin
atio
n (%
)
Tota
lM
ale
Fem
ale
Peop
le li
ving
w
ith H
IV /
AIDS
(0
00)
Adul
t pr
eval
ence
(%
)
AID
S de
aths
in
adu
lts
&
child
ren
(0
00)
(num
ber o
f rep
orte
d ca
ses)
(new
and
re
laps
e ca
ses)
Inci
denc
e (n
umbe
r of
repo
rted
ca
ses)
MCV
DTP
3
2013
2014
Surv
ey y
ear
20
1420
1420
14
Alge
ria62
6263
11
0.1
0.2
2013
16
22 5
17 0
9595
Ango
la44
4346
304
2.4
11.8
2013
1 99
9 86
853
552
11 6
9985
80
Beni
n50
5051
78
1.1
2.4
2013
1 07
8 83
43
886
786
6370
Bots
wan
a54
5355
392
25.2
5.1
2013
0 4
566
019
197
95
Burk
ina
Faso
5150
51 1
080.
93.
820
133
769
051
5 54
6 3
4388
91
Buru
ndi
4847
49 8
51.
13.
920
134
141
387
7 22
6 0
9495
Cabo
Ver
de64
6166
31.
10.
120
13 0
022
274
093
95
Cam
eroo
n49
4849
657
4.8
34.2
2013
26
651
26 0
38 8
3180
87
Cent
ral A
fric
an R
epub
lic44
4344
135
4.3
9.9
2013
116
300
10 1
86 2
1049
47
Chad
4444
45 2
152.
511
.720
13 7
54 5
6511
973
1 27
554
46
Com
oros
5453
55...
......
2013
53
156
148
080
80
Cong
o50
5051
81
2.8
4.4
2013
43
232
10 0
17 7
180
90
Cong
o, D
em. R
ep.
4443
46 4
471.
024
.120
136
715
223
115
795
33 7
1177
80
Côte
d’Iv
oire
4645
46 4
603.
521
.820
132
506
953
23 2
75 5
063
67
Djib
outi
5352
54 1
01.
60.
620
13 1
684
2 22
0...
7178
Egyp
t62
6163
90.
10.
320
13 0
7 17
71
314
9394
Equa
toria
l Gui
nea
4747
48 3
26.
20.
820
13 1
3 12
91
166
13
4424
Eritr
ea55
5356
16
0.7
0.7
2013
21
317
2 39
1 1
2796
94
Ethi
opia
5654
57 7
301.
223
.420
132
645
454
119
592
12 7
3970
77
Gab
on54
5355
48
3.9
1.5
2013
28
982
5 60
8 3
361
70
Gam
bia
5352
54 2
01.
80.
920
13 2
40 7
922
552
196
96
Gha
na54
5355
250
1.5
9.2
2013
1 63
9 45
114
668
124
9298
Gui
nea
5049
50 1
181.
63.
820
13 2
11 2
5711
734
175
5251
Gui
nea-
Biss
au46
4547
42
3.7
1.9
2013
54
584
2 28
2 1
6980
Keny
a53
5254
1 36
75.
333
.020
132
335
286
88 0
25 3
5479
81
Leso
tho
4341
44 3
1523
.49.
3...
...8
840
092
96
Libe
ria52
5253
33
1.2
2.0
2013
1 24
4 22
02
702
34
5850
Liby
a64
6465
......
......
...1
153
372
9394
Mad
agas
car
5554
56 3
90.
33.
220
13 3
87 0
4528
466
364
73
Mal
awi
5150
521
064
10.0
32.6
2013
1 28
0 89
216
267
385
91

371
Afri
can
Eco
nom
ic O
utlo
ok©
AfD
B, O
EC
D, U
ND
P 2
016
STA
TIS
TIC
AL
AN
NE
X
Tab
le 1
7. M
ajor
dis
ease
s
Hea
lthy
life
expe
ctan
cy a
t bir
th (y
ears
)H
IV /
AID
SM
alar
iaTu
berc
ulos
isM
easl
esVa
ccin
atio
n (%
)
Tota
lM
ale
Fem
ale
Peop
le li
ving
w
ith H
IV /
AIDS
(0
00)
Adul
t pr
eval
ence
(%
)
AID
S de
aths
in
adu
lts
&
child
ren
(0
00)
(num
ber o
f rep
orte
d ca
ses)
(new
and
re
laps
e ca
ses)
Inci
denc
e (n
umbe
r of
repo
rted
ca
ses)
MCV
DTP
3
2013
2014
Surv
ey y
ear
20
1420
1420
14
Mal
i49
5048
133
1.4
5.3
2013
1 36
7 21
85
809
290
8077
Mau
ritan
ia54
5355
16
0.7
1.1
2013
1 5
872
420
14
8484
Mau
ritiu
s65
6268
80.
90.
5...
... 1
26 0
9897
Mor
occo
6160
62 2
90.
11.
120
12 0
29 8
43 1
099
99
Moz
ambi
que
4646
471
543
10.6
44.9
2013
2 99
8 87
457
773
985
78
Nam
ibia
5856
60 2
6416
.05.
120
13 4
911
8 97
2 4
7783
88
Nig
er
5151
51 5
20.
53.
420
131
431
798
10 8
511
142
7268
Nig
eria
4747
473
392
3.2
174.
320
10 5
51 1
8786
464
6 85
551
66
Rw
anda
5655
57 2
112.
83.
020
13 9
62 6
185
761
10
9899
Sao
Tom
e an
d Pr
inci
pe57
5659
10.
80.
120
13 9
243
158
092
95
Sene
gal
5555
56 4
40.
52.
420
13 3
45 8
8913
332
32
8089
Seyc
helle
s67
6371
......
......
... 1
3 0
9999
Sier
ra L
eone
3939
40 5
41.
42.
720
131
701
958
12 4
771
006
7883
Som
alia
4645
47 3
50.
52.
420
13 1
0 47
012
903
10 2
7846
42
Sout
h Af
rica
5249
546
836
18.9
138.
420
13 8
645
306
166
66
7070
Sout
h Su
dan
4848
49 1
932.
712
.720
13 2
62 5
208
335
441
2239
Suda
n53
5254
53
0.2
2.9
2013
592
383
19 2
66 6
7686
94
Swaz
iland
4545
45 2
1427
.73.
520
13 4
025
583
086
98
Tanz
ania
5352
551
499
5.3
46.1
2013
1552
444
61 5
71 8
899
97
Togo
5049
51 1
142.
44.
320
13 8
82 4
302
525
577
8287
Tuni
sia
6665
68 3
0.1
0.1
......
3 13
4 1
598
98
Uga
nda
5049
521
487
7.3
32.9
2013
1 50
2 36
244
187
314
8278
Zam
bia
5049
511
150
12.4
18.9
......
37 9
31 9
8586
Zim
babw
e50
4852
1 55
016
.738
.620
13 4
22 6
3329
653
092
91
AFR
ICA
5251
5325
950
3.8
801.
120
1345
368
192
1 37
6 54
8 8
6 57
975
79
Not
e s: D
TP:
Dip
hth
eria
, tet
anu
s to
xo
ids
and
per
tuss
is a
nti
gen
. MC
V: M
easl
es C
on
tain
ing
Vac
cin
e.
Sour
ces:
UN
AID
S an
d W
HO
, Glo
ba
l rep
ort
, UN
AID
S re
port
on
the
glob
al A
IDS
epid
emic
201
5; M
ala
ria
rep
ort
ed c
ases
, tu
ber
culo
sis
new
an
d r
elap
se c
ases
,
mea
sles
in
cid
ence
, MC
V a
nd
DT
P3
vacc
inat
ion
co
vera
ge: W
HO
, Glo
bal H
ealt
h O
bser
vato
ry D
ata
Rep
osit
ory
onlin
e D
atab
ase,
Feb
rua
ry 2
016.
(con
t.)

372
Afri
can
Eco
nom
ic O
utlo
ok©
AfD
B, O
EC
D, U
ND
P 2
016
StA
tiS
tiC
Al
AN
NE
X
Tab
le 1
8. B
asic
ed
uca
tion
in
dic
ator
s
Estim
ated
adu
lt lit
erac
y ra
te, 2
010-
15 (%
) (p
eopl
e ov
er 1
5)Es
timat
ed y
outh
lite
racy
rat
e, 2
010-
15 (%
) (p
eopl
e be
twee
n 15
and
24)
Publ
ic e
xpen
ditu
re o
n ed
ucat
ion
2000
-13
Tota
lM
ale
Fem
ale
Tota
lM
ale
Fem
ale
(% o
f GD
P)
Alge
ria80
.287
.273
.195
.695
.695
.54.
3
Ango
la71
.182
.060
.772
.978
.667
.33.
5
Beni
n38
.449
.927
.352
.562
.642
.55.
0
Bots
wan
a88
.588
.088
.997
.996
.199
.69.
5
Burk
ina
Faso
36.0
43.0
29.3
45.4
47.6
43.2
4.3
Buru
ndi
85.6
88.2
83.1
87.6
87.4
87.8
5.4
Cabo
Ver
de87
.692
.183
.198
.398
.198
.64.
9
Cam
eroo
n75
.081
.268
.983
.887
.180
.43.
0
Cent
ral A
fric
an R
epub
lic36
.850
.724
.436
.448
.927
.01.
2
Chad
40.2
48.5
31.9
52.7
55.3
50.2
2.3
Com
oros
77.8
81.8
73.7
87.6
86.9
88.2
7.8
Cong
o79
.386
.472
.980
.985
.776
.96.
2
Cong
o, D
em. R
ep.
77.3
88.9
66.0
86.0
91.6
80.5
1.5
Côte
d’Iv
oire
43.1
53.1
32.5
50.2
59.6
40.7
4.4
Djib
outi
......
......
......
4.5
Egyp
t75
.283
.267
.393
.394
.592
.13.
8
Equa
toria
l Gui
nea
95.3
97.4
93.0
98.3
97.7
98.8
0.7
Eritr
ea73
.882
.465
.593
.294
.591
.92.
1
Ethi
opia
49.1
57.2
41.1
69.5
71.1
67.8
4.7
Gab
on83
.285
.381
.089
.187
.890
.53.
8
Gam
bia
55.5
63.9
47.6
73.2
75.6
70.8
4.1
Gha
na76
.682
.071
.490
.691
.389
.98.
1
Gui
nea
30.4
38.1
22.8
45.2
43.0
47.5
3.5
Gui
nea-
Biss
au59
.971
.848
.377
.380
.873
.7...
Keny
a78
.081
.174
.985
.985
.286
.65.
5
Leso
tho
79.4
70.1
88.3
85.1
77.0
93.4
13.0
Libe
ria47
.662
.432
.854
.564
.744
.02.
8
Liby
a91
.096
.785
.610
0.0
100.
099
.9...
Mad
agas
car
64.7
66.7
62.6
65.1
65.4
64.8
2.1
Mal
awi
65.8
73.0
58.6
75.1
74.9
75.2
7.7
Mal
i38
.748
.229
.254
.161
.546
.44.
2
Mau
ritan
ia52
.162
.641
.662
.670
.055
.04.
0

373
Afri
can
Eco
nom
ic O
utlo
ok©
AfD
B, O
EC
D, U
ND
P 2
016
STA
TIS
TIC
AL
AN
NE
X
Tab
le 1
8. B
asic
ed
uca
tion
in
dic
ator
s
Estim
ated
adu
lt lit
erac
y ra
te, 2
010-
15 (%
) (p
eopl
e ov
er 1
5)Es
timat
ed y
outh
lite
racy
rat
e, 2
010-
15 (%
) (p
eopl
e be
twee
n 15
and
24)
Publ
ic e
xpen
ditu
re o
n ed
ucat
ion
2000
-13
Tota
lM
ale
Fem
ale
Tota
lM
ale
Fem
ale
(% o
f GD
P)
Mau
ritiu
s90
.692
.988
.598
.798
.499
.13.
7
Mor
occo
72.4
82.7
62.5
95.1
96.6
93.5
6.3
Moz
ambi
que
58.8
73.3
45.4
76.7
83.7
69.7
6.6
Nam
ibia
81.9
79.2
84.5
89.9
86.5
93.3
8.3
Nig
er
19.1
27.3
11.0
26.6
36.4
17.1
4.5
Nig
eria
59.6
69.2
49.7
72.8
79.9
65.3
...
Rw
anda
70.5
73.2
68.0
80.4
78.5
82.2
5.0
Sao
Tom
e an
d Pr
inci
pe74
.981
.868
.483
.284
.082
.39.
5
Sene
gal
55.7
68.5
43.8
69.8
75.9
63.6
5.6
Seyc
helle
s95
.294
.795
.799
.098
.699
.63.
6
Sier
ra L
eone
48.1
58.7
37.7
67.6
75.8
59.3
2.8
Som
alia
......
......
......
...
Sout
h Af
rica
94.3
95.5
93.1
99.0
98.6
99.4
6.0
Sout
h Su
dan
31.9
38.6
25.3
44.3
46.9
41.7
...
Suda
n75
.983
.368
.689
.691
.387
.82.
2
Swaz
iland
87.5
87.4
87.5
94.8
93.5
96.0
7.8
Tanz
ania
80.3
84.8
75.9
87.3
87.4
87.2
3.5
Togo
66.5
78.3
55.3
85.1
88.9
81.4
4.4
Tuni
sia
81.8
89.6
74.2
98.1
98.3
97.8
6.2
Uga
nda
73.9
80.8
66.9
87.0
87.4
86.6
2.2
Zam
bia
63.4
70.9
56.0
65.8
69.4
62.1
1.1
Zim
babw
e86
.588
.584
.691
.790
.093
.52.
0
AFR
ICA
67.1
74.7
59.6
78.4
81.5
75.3
4.7
Sour
ces
: AfD
B S
tati
stic
s D
epa
rtm
ent;
UN
ESC
O In
stit
ute
for
Sta
tist
ics
(UIS
), D
atab
ase
Janu
ary
2016
; do
mes
tic
auth
ori
ties
.(con
t.)

374
Afri
can
Eco
nom
ic O
utlo
ok©
AfD
B, O
EC
D, U
ND
P 2
016
StA
tiS
tiC
Al
AN
NE
X
Tab
le 1
9. S
choo
l en
rolm
ent
Prim
ary
scho
ol, 2
010-
15Se
cond
ary
scho
ol, 2
010-
15En
rolm
ent r
atio
in te
chni
cal a
nd
voca
tiona
l pro
gram
mes
Gro
ss e
nrol
men
t rat
io (%
)N
et e
nrol
men
t rat
io (%
)Pu
pil /
teac
her
Gro
ss e
nrol
men
t rat
io (%
)Pu
pil /
teac
her
2006
-08
(%)
Tota
lM
ale
Fem
ale
Tota
lM
ale
Fem
ale
Rat
io (%
)To
tal
Mal
eFe
mal
eR
atio
(%)
Tota
l se
cond
ary
Lowe
r se
cond
ary
Uppe
r se
cond
ary
Alge
ria11
8.7
122.
311
5.1
97.3
......
23.7
99.9
98.1
101.
7...
……
…
Ango
la12
8.7
156.
910
0.4
84.0
94.9
73.0
42.5
28.9
35.1
22.7
27.4
……
…
Beni
n12
5.6
131.
111
9.9
95.9
99.9
88.2
45.9
54.4
64.8
43.9
9.9
……
…
Bots
wan
a10
8.6
110.
110
7.0
91.0
90.4
91.6
22.6
83.9
81.6
86.2
11.2
6.1
…19
.1
Burk
ina
Faso
86.9
88.7
85.1
67.5
69.2
65.7
44.5
30.3
32.4
28.2
27.1
6.0
1.9
23.8
Buru
ndi
127.
612
6.8
128.
495
.494
.596
.243
.737
.941
.134
.837
.25.
21.
819
.0
Cabo
Ver
de11
3.2
116.
310
9.9
98.2
98.0
98.3
22.6
92.6
86.8
98.5
16.0
……
…
Cam
eroo
n11
3.6
120.
110
6.9
91.6
96.6
86.6
44.2
56.4
60.9
51.9
20.4
19.1
19.7
17.7
Cent
ral A
fric
an R
epub
lic93
.510
7.3
79.8
70.6
79.1
62.1
80.1
17.4
23.0
11.8
68.1
……
…
Chad
101.
411
4.6
88.0
84.4
94.7
74.0
62.4
22.4
30.7
14.0
29.8
1.1
0.1
4.2
Com
oros
105.
210
8.3
102.
083
.285
.580
.827
.859
.358
.360
.48.
7…
……
Cong
o11
0.9
107.
011
4.8
91.4
87.6
95.2
44.4
54.5
58.4
50.6
18.7
……
…
Cong
o, D
em. R
ep.
107.
011
2.0
101.
8...
......
35.3
43.5
53.6
33.3
14.6
19.2
1.9
34.1
Côte
d’Iv
oire
89.6
95.6
83.6
74.7
79.2
70.1
42.5
40.1
47.0
33.2
22.3
……
…
Djib
outi
66.3
70.1
62.3
57.4
60.7
54.0
33.0
47.1
52.1
41.9
22.8
5.4
1.4
15.9
Egyp
t10
5.5
106.
010
5.1
99.9
99.5
97.1
23.2
86.0
86.8
85.3
...…
……
Equa
toria
l Gui
nea
84.5
85.2
83.7
56.8
56.8
56.8
26.2
......
......
……
…
Eritr
ea51
.255
.247
.140
.642
.738
.440
.335
.539
.331
.638
.50.
7…
1.9
Ethi
opia
100.
110
4.3
95.8
85.8
88.7
82.9
64.3
36.2
37.9
34.5
38.8
6.2
…54
.2
Gab
on14
2.0
144.
013
9.9
......
...24
.5...
......
...…
……
Gam
bia
85.8
83.5
88.0
67.9
65.3
70.6
36.8
57.5
58.9
56.0
...…
……
Gha
na10
9.9
109.
910
9.9
91.1
90.9
91.3
31.3
71.0
72.9
69.1
16.6
4.0
…13
.5
Gui
nea
89.4
94.8
83.8
74.0
77.8
70.1
44.6
38.8
46.8
30.7
33.1
2.1
0.2
6.9
Gui
nea-
Biss
au11
3.7
117.
510
9.8
68.2
69.8
66.7
51.9
......
......
1.8
……
Keny
a11
1.4
111.
211
1.6
84.9
83.2
86.6
56.6
67.6
70.1
65.2
41.1
1.0
…2.
1
Leso
tho
107.
110
8.3
105.
880
.278
.781
.832
.852
.244
.160
.424
.71.
63.
83.
3
Libe
ria95
.699
.591
.637
.738
.636
.726
.537
.942
.533
.114
.9…
……
Liby
a...
......
......
......
......
......
……
…
Mad
agas
car
146.
714
6.9
146.
5...
......
41.7
38.4
38.8
38.1
23.1
3.5
0.9
14.5
Mal
awi
146.
514
5.1
148.
0...
......
61.4
39.5
41.4
37.5
70.4
……
…
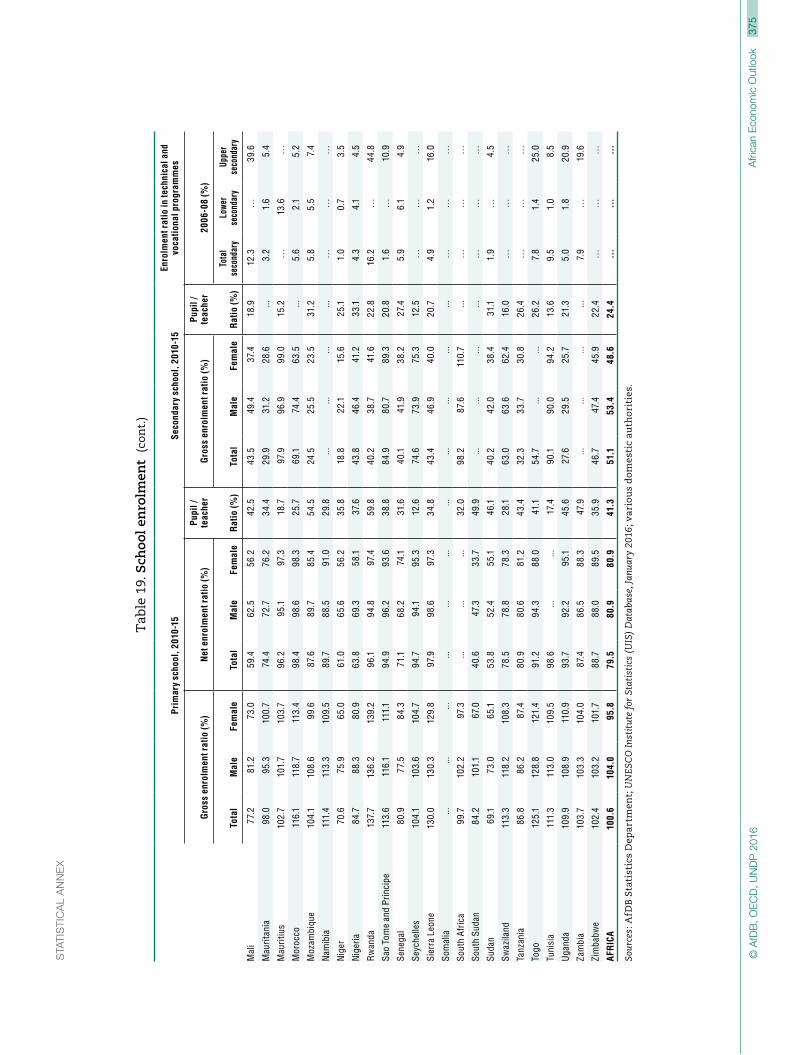
375
Afri
can
Eco
nom
ic O
utlo
ok©
AfD
B, O
EC
D, U
ND
P 2
016
STA
TIS
TIC
AL
AN
NE
X
Tab
le 1
9. S
choo
l en
rolm
ent
Prim
ary
scho
ol, 2
010-
15Se
cond
ary
scho
ol, 2
010-
15En
rolm
ent r
atio
in te
chni
cal a
nd
voca
tiona
l pro
gram
mes
Gro
ss e
nrol
men
t rat
io (%
)N
et e
nrol
men
t rat
io (%
)Pu
pil /
teac
her
Gro
ss e
nrol
men
t rat
io (%
)Pu
pil /
teac
her
2006
-08
(%)
Tota
lM
ale
Fem
ale
Tota
lM
ale
Fem
ale
Rat
io (%
)To
tal
Mal
eFe
mal
eR
atio
(%)
Tota
l se
cond
ary
Lowe
r se
cond
ary
Uppe
r se
cond
ary
Mal
i77
.281
.273
.059
.462
.556
.242
.543
.549
.437
.418
.912
.3…
39.6
Mau
ritan
ia98
.095
.310
0.7
74.4
72.7
76.2
34.4
29.9
31.2
28.6
...3.
21.
65.
4
Mau
ritiu
s10
2.7
101.
710
3.7
96.2
95.1
97.3
18.7
97.9
96.9
99.0
15.2
…13
.6…
Mor
occo
116.
111
8.7
113.
498
.498
.698
.325
.769
.174
.463
.5...
5.6
2.1
5.2
Moz
ambi
que
104.
110
8.6
99.6
87.6
89.7
85.4
54.5
24.5
25.5
23.5
31.2
5.8
5.5
7.4
Nam
ibia
111.
411
3.3
109.
589
.788
.591
.029
.8...
......
...…
……
Nig
er
70.6
75.9
65.0
61.0
65.6
56.2
35.8
18.8
22.1
15.6
25.1
1.0
0.7
3.5
Nig
eria
84.7
88.3
80.9
63.8
69.3
58.1
37.6
43.8
46.4
41.2
33.1
4.3
4.1
4.5
Rw
anda
137.
713
6.2
139.
296
.194
.897
.459
.840
.238
.741
.622
.816
.2…
44.8
Sao
Tom
e an
d Pr
inci
pe11
3.6
116.
111
1.1
94.9
96.2
93.6
38.8
84.9
80.7
89.3
20.8
1.6
…10
.9
Sene
gal
80.9
77.5
84.3
71.1
68.2
74.1
31.6
40.1
41.9
38.2
27.4
5.9
6.1
4.9
Seyc
helle
s10
4.1
103.
610
4.7
94.7
94.1
95.3
12.6
74.6
73.9
75.3
12.5
……
…
Sier
ra L
eone
130.
013
0.3
129.
897
.998
.697
.334
.843
.446
.940
.020
.74.
91.
216
.0
Som
alia
......
......
......
......
......
...…
……
Sout
h Af
rica
99.7
102.
297
.3...
......
32.0
98.2
87.6
110.
7...
……
…
Sout
h Su
dan
84.2
101.
167
.040
.647
.333
.749
.9...
......
...…
……
Suda
n69
.173
.065
.153
.852
.455
.146
.140
.242
.038
.431
.11.
9…
4.5
Swaz
iland
113.
311
8.2
108.
378
.578
.878
.328
.163
.063
.662
.416
.0…
……
Tanz
ania
86.8
86.2
87.4
80.9
80.6
81.2
43.4
32.3
33.7
30.8
26.4
……
…
Togo
125.
112
8.8
121.
491
.294
.388
.041
.154
.7...
...26
.27.
81.
425
.0
Tuni
sia
111.
311
3.0
109.
598
.6...
...17
.490
.190
.094
.213
.69.
51.
08.
5
Uga
nda
109.
910
8.9
110.
993
.792
.295
.145
.627
.629
.525
.721
.35.
01.
820
.9
Zam
bia
103.
710
3.3
104.
087
.486
.588
.347
.9...
......
...7.
9…
19.6
Zim
babw
e10
2.4
103.
210
1.7
88.7
88.0
89.5
35.9
46.7
47.4
45.9
22.4
……
…
AFR
ICA
100.
610
4.0
95.8
79.5
80.9
80.9
41.3
51.1
53.4
48.6
24.4
……
…
Sour
ces:
AfD
B S
tati
stic
s D
epa
rtm
ent;
UN
ESC
O In
stit
ute
for
Sta
tist
ics
(UIS
) D
atab
ase,
Janu
ary
2016
; va
rio
us
do
mes
tic
auth
ori
ties
.
(con
t.)

376
Afri
can
Eco
nom
ic O
utlo
ok©
AfD
B, O
EC
D, U
ND
P 2
016
StA
tiS
tiC
Al
AN
NE
X
Tab
le 2
0. E
mp
loym
ent
and
rem
itta
nce
s
Une
mpl
oym
ent r
ate*
Part
icip
atio
n ra
te*
Inac
tivit
y ra
te*
(age
15-
64)
Wor
ker r
emit
tanc
es (
USD
mill
ion)
ILO
’s la
test
est
imat
es (
a)20
1320
1320
1120
1220
1320
1420
15 (e
)
Year
Tota
lM
ale
Fem
ale
Tota
l (a
ge 1
5+)
Tota
l am
ong
yout
h (a
ge 1
5-24
)To
tal
Mal
eFe
mal
e
Alge
ria20
13 (b
)9.
88.
316
.343
.628
.2 5
3 2
5 8
21
942
1 94
22
000
2 00
02
000
Ango
la20
137.
67.
08.
468
.351
.6 3
1 2
2 3
911
.211
.111
.111
.1 1
1
Beni
n20
131.
00.
91.
271
.641
.7 2
8 2
6 2
9 1
72 2
08 2
08 2
08 2
08
Bots
wan
a20
1317
.414
.420
.677
.157
.6 2
1 1
8 2
4 2
0 1
8 3
6 4
2 4
3
Burk
ina
Faso
2013
3.2
4.1
2.3
83.6
77.8
15
9 2
1 1
20 1
20 1
20 1
20 1
20
Buru
ndi
2013
1.6
1.2
1.9
83.4
65.6
16
17
15
45
46
49
49
50
Cabo
Ver
de20
1310
.59.
112
.567
.659
.9 2
9 1
4 4
4 1
77 1
78 1
76 1
89 1
94
Cam
eroo
n20
134.
03.
44.
875
.956
.4 2
3 1
8 2
8 2
19 2
10 2
44 2
44 2
44
Cent
ral A
fric
an R
epub
lic20
138.
48.
08.
877
.960
.1 2
2 1
5 2
8...
......
......
Chad
2013
5.6
4.6
6.8
71.6
56.4
28
21
35
......
......
...
Com
oros
2013
19.1
17.4
23.2
57.1
39.3
42
20
64
108
110
116
126
134
Cong
o20
137.
36.
68.
069
.944
.8 2
9 2
6 3
1...
......
......
Cong
o, D
em. R
ep.
2013
3.8
3.1
4.5
71.2
44.4
28
28
29
115
12
33
22
23
Côte
d’Iv
oire
2013
9.4
8.5
10.9
67.0
50.9
32
18
47
373
373
373
373
373
Djib
outi
...
……
…52
.042
.8 4
5 2
9 6
1 3
2 3
3 3
6 3
6 3
6
Egyp
t20
13 (b
)13
.29.
625
.349
.233
.4 4
8 2
0 7
514
324
19 2
3617
833
19 5
7020
391
Equa
toria
l Gui
nea
2013
7.8
7.3
8.5
82.0
71.4
16
6 2
8...
......
......
Eritr
ea20
138.
07.
38.
883
.877
.2 1
5 9
20
......
......
...
Ethi
opia
2013
(b)
5.0
3.0
7.2
83.1
78.1
15
9 2
0 5
13 6
24 6
24 6
24 6
35
Gab
on20
1320
.314
.528
.948
.218
.3 4
9 4
1 5
9...
......
......
Gam
bia
2013
29.8
21.8
38.6
77.4
63.8
22
17
27
108
141
181
181
181
Gha
na20
13 (b
)5.
25.
05.
476
.855
.0 2
2 2
1 2
3 1
52 1
38 1
19 1
19 1
19
Gui
nea
2013
1.7
2.4
0.8
82.3
72.6
16
14
18
65
66
93
93
93
Gui
nea-
Biss
au20
137.
66.
98.
372
.552
.9 2
6 2
1 3
2 5
2 4
6 4
6 4
6 4
6
Keny
a20
139.
17.
910
.566
.839
.7 3
3 2
8 3
8 9
341
211
1 30
41
441
1 57
1
Leso
tho
2013
(b)
24.4
22.4
26.9
66.0
45.3
33
25
40
649
554
462
399
405
Libe
ria20
133.
73.
53.
860
.934
.4 3
8 3
6 4
1 3
60 5
16 3
8 3 4
66 5
68
Liby
a20
1320
.617
.130
.353
.836
.2 4
4 1
8 7
0...
......
......
Mad
agas
car
2013
1.3
1.0
1.6
86.6
76.7
12
10
14
398
397
427
427
427
Mal
awi
2013
(b)
6.4
6.1
6.7
80.9
59.3
20
20
19
25
28
28
28
29
Mal
i20
13 (b
)7.
35.
510
.266
.158
.8 3
3 1
7 4
9 7
84 8
27 8
95 8
95 8
95

377
Afri
can
Eco
nom
ic O
utlo
ok©
AfD
B, O
EC
D, U
ND
P 2
016
STA
TIS
TIC
AL
AN
NE
X
Tab
le 2
0. E
mp
loym
ent
and
rem
itta
nce
s
Une
mpl
oym
ent r
ate*
Part
icip
atio
n ra
te*
Inac
tivit
y ra
te*
(age
15-
64)
Wor
ker r
emit
tanc
es (
USD
mill
ion)
ILO
’s la
test
est
imat
es (
a)20
1320
1320
1120
1220
1320
1420
15 (e
)
Year
Tota
lM
ale
Fem
ale
Tota
l (a
ge 1
5+)
Tota
l am
ong
yout
h (a
ge 1
5-24
)To
tal
Mal
eFe
mal
e
Mau
ritan
ia20
1330
.828
.835
.347
.126
.9 5
2 3
4 7
0..
....
....
Mau
ritiu
s20
13 (b
)7.
65.
011
.759
.941
.7 3
4 2
0 4
9 2
49 2
49 2
49 2
49 2
49
Mor
occo
2013
(b)
9.2
9.1
9.5
49.0
34.6
48
22
74
7 25
66
508
6 88
27
053
6 68
0
Moz
ambi
que
2013
22.6
20.6
24.2
79.2
71.3
20
25
16
157
220
217
118
118
Nam
ibia
2013
(b)
29.6
26.3
33.1
58.7
31.1
40
36
44
15
13
11
11
12
Nig
er
2013
2.4
2.7
1.8
64.7
57.3
34
9 5
9 1
66 1
52 1
52 1
52 1
52
Nig
eria
2013
(b)
7.1
6.4
8.0
56.1
37.6
44
36
52
20 6
1920
633
20 8
9020
921
20 8
65
Rw
anda
2013
3.4
3.2
3.7
85.1
71.3
13
16
11
174
182
170
170
172
Sao
Tom
e an
d Pr
inci
pe20
1313
.612
.016
.260
.338
.5 3
7 2
2 5
3 7
6 2
7 2
9 2
9
Sene
gal
2013
10.3
8.0
13.6
56.8
41.7
41
28
54
1 61
41
614
1 61
41
614
1 61
4
Seyc
helle
s…
……
……
……
……
25
18
13
15
15
Sier
ra L
eone
2013
3.2
4.3
2.2
66.6
44.1
32
31
33
59
61
68
68
72
Som
alia
2013
7.6
7.1
8.6
54.1
43.4
44
22
66
......
......
...
Sout
h Af
rica
2013
(b)
24.6
23.1
26.4
52.5
26.1
44
38
50
1 15
81
085
971
913
1 00
3
Sout
h Su
dan
……
……
73.2
63.2
25
24
27
......
......
...
Suda
n20
1313
.010
.919
.248
.029
.6 5
1 2
7 7
5 4
42 4
01 4
24 3
43 3
48
Swaz
iland
2013
27.1
25.7
29.2
51.0
33.9
47
34
58
38
31
30
30
30
Tanz
ania
2013
(b)
2.9
2.0
3.9
78.6
65.0
20
16
25
78
67
59
59
61
Togo
2013
7.7
7.0
8.4
80.8
65.1
18
19
17
244
345
345
345
345
Tuni
sia
2013
(b)
15.9
13.6
22.2
47.8
35.1
48
23
72
2 00
42
266
2 29
12
291
2 29
1
Uga
nda
2013
4.3
3.8
4.9
85.0
75.9
14
12
16
816
914
935
1 02
91
053
Zam
bia
2013
7.8
7.5
8.2
75.3
57.5
24
19
29
46
73
54
58
59
Zim
babw
e20
1312
.410
.614
.282
.471
.9 1
7 1
2 2
2..
....
....
AFR
ICA
2013
8.3
7.3
9.6
65.1
50.1
......
...56
870
61 8
8761
199
63 1
7863
962
Not
e: *
See
no
te o
n m
eth
od
olo
gy
for
def
init
ion
s. (
e) E
stim
ates
. So
urce
s: E
mp
loy
men
t: I
LO, K
ILM
dat
abas
e, n
inth
ed
itio
n; T
ren
ds
Esti
mat
ion
Mo
del
: (a
) Ha
rmo
nis
ed e
stim
ates
fo
r 20
13. (
b) D
ata
as r
epo
rted
by
do
mes
tic
auth
ori
ties
.W
ork
ers’
rem
itta
nce
s: W
orl
d B
ank
, Wor
ld D
evel
opm
ent
Indi
cato
rs, R
emit
tan
ces
dat
a (u
pd
ated
as
of O
cto
ber
201
5).
(con
t.)

378
Afri
can
Eco
nom
ic O
utlo
ok©
AfD
B, O
EC
D, U
ND
P 2
016
StA
tiS
tiC
Al
AN
NE
X
Tab
le 2
1. C
orru
pti
on P
erce
pti
ons
Ind
ex (
CPI
)*
2009
2010
2011
2012
2013
2014
2015
Inde
xCo
untr
y
rank
/ 18
0In
dex
Coun
try
ra
nk /
178
Inde
xCo
untr
y
rank
/ 18
2In
dex
Coun
try
ra
nk /
174
Inde
xCo
untr
y
rank
/ 17
5In
dex
Coun
try
ra
nk /
174
Inde
xCo
untr
y
rank
/ 16
7
Alge
ria2.
811
12.
910
52.
911
23.
410
53.
694
3.6
100
3.6
88
Ango
la1.
916
21.
916
82.
016
82.
215
72.
315
31.
916
11.
516
3
Beni
n2.
910
62.
811
03.
010
03.
694
3.6
943.
980
3.7
83
Bots
wan
a5.
637
5.8
336.
132
6.5
306.
430
6.3
316.
328
Burk
ina
Faso
3.6
793.
198
3.0
100
3.8
833.
883
3.8
853.
876
Buru
ndi
1.8
168
1.8
170
1.9
172
1.9
165
2.1
157
2.0
159
2.1
150
Cabo
Ver
de5.
146
5.1
455.
541
6.0
395.
841
5.7
425.
540
Cam
eroo
n2.
214
62.
214
62.
513
42.
614
42.
514
42.
713
62.
713
0
Cent
ral A
fric
an R
epub
lic2.
015
82.
115
42.
215
42.
614
42.
514
42.
415
02.
414
5
Chad
1.6
175
1.7
171
2.0
168
1.9
165
1.9
163
2.2
154
2.2
147
Com
oros
2.3
143
2.1
154
2.4
143
2.8
133
2.8
127
2.6
142
2.6
136
Cong
o1.
916
22.
115
42.
215
42.
614
42.
215
42.
315
22.
314
6
Cong
o, D
em. R
ep.
1.9
162
2.2
146
2.0
168
2.1
160
2.2
154
2.2
154
2.2
147
Côte
d’Iv
oire
2.1
154
216
42.
215
42.
913
02.
713
63.
211
53.
210
7
Djib
outi
2.8
111
3.2
913.
010
03.
694
3.6
943.
410
73.
499
Egyp
t2.
811
13.
198
2.9
112
3.2
118
3.2
114
3.7
943.
688
Equa
toria
l Gui
nea
1.8
168
1.9
168
1.9
172
2.0
163
1.9
163
……
……
Eritr
ea2.
612
62.
612
32.
513
42.
515
02.
016
01.
816
61.
815
4
Ethi
opia
2.7
120
2.7
116
2.7
120
3.3
113
3.3
111
3.3
110
3.3
103
Gab
on2.
910
62.
811
03.
010
03.
510
23.
410
63.
794
3.4
99
Gam
bia
2.9
106
3.2
913.
575
3.4
105
2.8
127
2.9
126
2.8
123
Gha
na3.
969
4.1
623.
969
4.5
644.
663
4.8
614.
756
Gui
nea
1.8
168
216
42.
116
42.
415
42.
415
02.
514
52.
513
9
Gui
nea-
Biss
au1.
916
22.
115
42.
215
42.
515
01.
916
31.
916
11.
715
8
Keny
a2.
214
62.
115
42.
215
42.
713
92.
713
62.
514
52.
513
9
Leso
tho
3.3
893.
578
3.5
754.
564
4.9
554.
955
4.4
61
Libe
ria3.
197
3.3
873.
291
4.1
753.
883
3.7
943.
783
Liby
a2.
513
02.
214
62.
016
82.
116
01.
517
21.
816
61.
616
1
Mad
agas
car
3.0
992.
612
33.
010
03.
211
82.
812
72.
813
32.
812
3
Mal
awi
3.3
893.
485
3.0
100
3.7
883.
791
3.3
110
3.1
112
Mal
i2.
811
12.
711
62.
811
83.
410
52.
812
73.
211
53.
595
Mau
ritan
ia2.
513
02.
314
32.
414
33.
112
33.
011
93.
012
43.
111
2

379
Afri
can
Eco
nom
ic O
utlo
ok©
AfD
B, O
EC
D, U
ND
P 2
016
STA
TIS
TIC
AL
AN
NE
X
Tab
le 2
1. C
orru
pti
on P
erce
pti
ons
Ind
ex (
CPI
)*
2009
2010
2011
2012
2013
2014
2015
Inde
xCo
untr
y
rank
/ 18
0In
dex
Coun
try
ra
nk /
178
Inde
xCo
untr
y
rank
/ 18
2In
dex
Coun
try
ra
nk /
174
Inde
xCo
untr
y
rank
/ 17
5In
dex
Coun
try
ra
nk /
174
Inde
xCo
untr
y
rank
/ 16
7
Mau
ritiu
s5.
442
5.4
395.
146
5.7
435.
252
5.4
475.
345
Mor
occo
3.3
893.
485
3.4
803.
788
3.7
913.
980
3.6
88
Moz
ambi
que
2.5
130
2.7
116
2.7
120
3.1
123
3.0
119
3.1
119
3.1
112
Nam
ibia
4.5
564.
456
4.4
574.
858
4.8
574.
955
5.3
45
Nig
er
2.9
106
2.6
123
2.5
134
3.3
113
3.4
106
3.5
103
3.4
99
Nig
eria
2.5
130
2.4
134
2.4
143
2.7
139
2.5
144
2.7
136
2.6
136
Rw
anda
3.3
894
665.
049
5.3
505.
349
4.9
555.
444
Sao
Tom
e an
d Pr
inci
pe2.
811
13
101
3.0
100
4.2
724.
272
4.2
764.
266
Sene
gal
3.0
992.
910
52.
911
23.
694
4.1
774.
369
4.4
61
Seyc
helle
s4.
854
4.8
494.
850
5.2
515.
447
5.5
435.
540
Sier
ra L
eone
2.2
146
2.4
134
2.5
134
3.1
123
3.0
119
3.1
119
2.9
119
Som
alia
1.1
180
1.1
178
1.0
182
0.8
174
0.8
175
0.8
174
0.8
167
Sout
h Af
rica
4.7
554.
554
4.1
644.
369
4.2
724.
467
4.4
61
Sout
h Su
dan
……
……
……
……
1.1
174
1.5
171
1.5
163
Suda
n1.
517
61.
617
21.
617
71.
317
31.
417
31.
117
31.
216
5
Swaz
iland
3.6
793.
291
3.1
953.
788
3.9
824.
369
……
Tanz
ania
2.6
126
2.7
116
3.0
100
3.5
102
3.3
111
3.1
119
3.0
117
Togo
2.8
111
2.4
134
2.4
143
3.0
128
2.9
123
2.9
126
3.2
107
Tuni
sia
4.2
654.
359
3.8
734.
175
4.1
774.
079
3.8
76
Uga
nda
2.5
130
2.5
127
2.4
143
2.9
130
2.6
140
2.6
142
2.5
139
Zam
bia
3.0
993
101
3.2
913.
788
3.8
833.
885
3.8
76
Zim
babw
e2.
214
62.
413
42.
215
42.
016
32.
115
72.
115
62.
115
0
Not
e: *
CPI
sco
re r
elat
es t
o p
erce
pti
on
s of
th
e d
egre
e of
co
rru
pti
on
as
seen
by
bu
sin
ess
peo
ple
an
d c
ou
ntr
y an
aly
sts,
an
d r
ange
s b
etw
een
10
(hig
hly
cle
an)
and
0 (
hig
hly
co
rru
pt)
.
Sour
ce: T
ran
spa
ren
cy I
nte
rnat
ion
al:
ww
w.t
ran
spa
ren
cy.o
rg.
(con
t.)

380
Afri
can
Eco
nom
ic O
utlo
ok©
AfD
B, O
EC
D, U
ND
P 2
016
StA
tiS
tiC
Al
AN
NE
X
Tab
le 2
2. P
ubl
ic p
rote
st
1997
1998
1999
2000
2001
2002
2003
2004
2005
2006
2007
2008
2009
2010
2011
2012
2013
2014
2015
Alge
ria2.
36.
71.
4…
9.9
10.0
6.6
1.3
0.7
4.0
1.5
2.5
1.8
9.0
23.3
5.0
11.0
8.5
3.0
Ango
la…
……
……
……
1.5
0.0
1.0
0.0
0.0
0.3
0.0
2.5
1.8
1.5
0.3
2.3
Beni
n0.
80.
00.
80.
00.
00.
50.
01.
50.
00.
50.
00.
00.
00.
00.
80.
00.
08.
30.
3
Bots
wan
a0.
00.
00.
00.
00.
00.
00.
00.
00.
00.
00.
00.
00.
00.
36.
00.
00.
00.
00.
0
Burk
ina
Faso
1.5
0.8
3.2
9.4
0.5
1.1
0.0
1.6
0.9
3.8
0.5
2.5
4.3
0.8
9.8
2.8
2.8
6.5
5.5
Buru
ndi
……
……
……
……
…2.
311
.80.
04.
83.
85.
30.
31.
01.
35.
5
Cabo
Ver
de0.
00.
00.
00.
00.
00.
00.
00.
00.
00.
00.
00.
00.
00.
50.
00.
00.
00.
00.
0
Cam
eroo
n4.
40.
32.
20.
30.
01.
52.
01.
02.
74.
52.
81.
04.
06.
81.
00.
80.
30.
31.
0
Cent
ral A
fric
an R
epub
lic…
……
……
……
……
12.8
3.5
1.8
1.8
3.3
1.5
1.3
2.5
4.5
2.8
Chad
3.0
0.7
0.5
0.0
2.2
0.0
1.5
0.0
1.6
1.3
5.3
1.0
2.5
0.5
2.3
4.0
0.3
0.5
2.5
Com
oros
……
……
……
……
…0.
51.
01.
81.
80.
00.
51.
30.
31.
52.
3
Cong
o…
……
……
……
1.5
0.0
0.3
0.0
0.0
0.8
0.0
0.0
0.5
1.0
0.0
3.3
Cong
o, D
em. R
ep.
……
……
……
…2.
02.
87.
34.
81.
86.
01.
82.
33.
31.
57.
05.
5
Côte
d’Iv
oire
8.2
6.7
10.0
6.7
0.0
2.9
0.8
2.4
1.1
12.8
6.8
4.9
7.2
3.0
1.8
1.3
2.3
1.0
2.3
Djib
outi
……
……
……
……
…0.
00.
80.
00.
00.
00.
80.
01.
00.
00.
3
Egyp
t4.
20.
00.
01.
63.
22.
61.
33.
12.
34.
15.
84.
63.
03.
516
.520
.819
.87.
01.
3
Equa
toria
l Gui
nea
0.0
0.0
0.0
0.0
0.0
0.0
0.0
0.0
0.0
0.0
0.0
0.0
0.0
1.0
0.5
0.0
0.3
0.0
0.0
Eritr
ea…
……
……
……
……
……
……
…0.
00.
00.
30.
00.
0
Ethi
opia
1.2
0.8
0.0
0.0
1.3
0.3
0.0
0.0
2.3
0.6
0.3
0.0
0.3
0.0
0.0
0.8
1.8
0.5
1.3
Gab
on0.
02.
11.
30.
00.
01.
30.
00.
55.
06.
11.
50.
94.
57.
53.
09.
06.
830
.35.
8
Gam
b ia
……
……
……
……
…0.
00.
00.
00.
00.
00.
00.
00.
30.
00.
0
Gha
na0.
00.
32.
00.
00.
00.
00.
50.
00.
00.
00.
00.
50.
00.
00.
30.
30.
50.
52.
0
Gui
nea
……
……
……
……
…3.
811
.80.
83.
53.
03.
54.
06.
81.
85.
0
Gui
nea-
Biss
au1.
80.
02.
00.
80.
33.
30.
01.
31.
54.
01.
80.
50.
00.
84.
30.
84.
30.
30.
3
Keny
a4.
48.
10.
00.
00.
50.
00.
92.
42.
22.
51.
05.
11.
40.
53.
04.
54.
53.
54.
0
Leso
tho
……
……
……
……
…0.
00.
80.
00.
00.
00.
00.
00.
00.
00.
0
Libe
ria…
……
……
……
……
3.3
0.3
0.0
0.3
0.0
0.5
0.0
1.8
1.8
0.3
Liby
a0.
00.
00.
00.
50.
00.
00.
00.
50.
50.
30.
00.
00.
00.
05.
07.
528
.013
.57.
0
Mad
agas
car
0.0
0.3
0.0
0.0
0.0
12.8
0.0
1.0
3.3
0.8
1.0
0.0
8.3
0.8
0.5
6.5
1.3
1.0
2.5
Mal
awi
1.3
1.5
0.0
0.0
0.8
0.8
1.0
0.3
0.8
0.3
0.8
0.0
0.0
0.5
0.5
0.8
3.3
0.5
0.0
Mal
i3.
91.
20.
90.
00.
00.
00.
70.
50.
40.
52.
10.
01.
40.
81.
07.
01.
51.
32.
0
Mau
ritan
ia…
……
……
……
……
1.8
0.5
5.3
2.3
0.3
10.8
11.8
3.5
1.5
6.5
Mau
ritiu
s0.
00.
00.
80.
00.
00.
00.
00.
00.
00.
00.
30.
00.
00.
00.
50.
00.
00.
50.
0
Mor
occo
1.6
1.4
0.7
0.7
0.0
0.0
0.0
1.2
0.5
2.0
3.9
2.7
2.2
1.0
10.0
9.5
7.0
9.5
2.8

381
Afri
can
Eco
nom
ic O
utlo
ok©
AfD
B, O
EC
D, U
ND
P 2
016
STA
TIS
TIC
AL
AN
NE
X
Tab
le 2
2. P
ubl
ic p
rote
st
1997
1998
1999
2000
2001
2002
2003
2004
2005
2006
2007
2008
2009
2010
2011
2012
2013
2014
2015
Moz
ambi
que
0.0
0.0
1.5
0.5
0.0
0.0
0.8
0.0
0.0
0.0
0.0
0.5
0.8
0.5
0.5
0.5
7.0
1.0
0.3
Nam
ibia
0.0
0.0
0.0
0.0
0.0
0.0
0.0
0.0
0.0
0.0
0.0
0.0
0.0
0.3
0.8
0.0
0.0
0.3
0.0
Nig
er
……
……
……
…1.
31.
56.
01.
81.
07.
30.
01.
00.
54.
03.
87.
8
Nig
eria
2.3
2.8
6.3
4.1
5.3
1.0
0.8
2.9
0.5
3.2
2.3
2.8
3.6
3.8
2.8
4.8
6.8
11.0
3.0
Rw
anda
……
……
……
…0.
00.
00.
00.
00.
80.
00.
00.
00.
00.
30.
00.
3
Sao
Tom
e an
d Pr
inci
pe…
……
……
……
……
0.8
2.3
0.0
0.5
0.0
0.3
0.0
0.0
0.0
0.0
Sene
gal
5.0
1.9
1.1
0.0
1.4
0.0
0.0
1.3
2.2
5.4
4.5
2.5
2.9
2.5
5.0
11.0
1.3
1.8
5.3
Seyc
helle
s…
……
……
……
……
0.3
0.0
0.0
0.0
0.0
0.0
0.0
0.0
0.0
0.0
Sier
ra L
eone
……
……
……
……
…0.
51.
30.
30.
00.
30.
51.
00.
52.
30.
5
Som
alia
……
……
……
……
……
……
……
……
0.3
0.3
0.3
Sout
h Af
rica
10.3
2.0
5.6
1.9
1.5
1.0
0.6
3.0
1.0
3.6
7.5
2.3
8.8
6.3
7.8
22.3
31.8
39.5
14.0
Sout
h Su
dan
……
……
……
……
……
……
……
0.3
0.3
0.0
0.0
0.0
Suda
n…
……
……
……
……
2.0
0.5
1.0
1.3
1.3
6.0
7.3
4.5
1.5
1.0
Swaz
iland
……
……
……
……
…0.
01.
80.
00.
00.
02.
52.
00.
00.
30.
0
Tanz
ania
0.0
0.8
0.0
0.0
1.0
0.0
0.3
0.3
0.3
0.0
0.0
0.3
0.0
0.3
0.8
1.8
1.3
0.8
0.3
Togo
0.5
0.8
0.3
1.8
1.3
0.3
0.5
0.0
6.3
0.0
0.3
0.0
0.5
1.8
3.0
3.5
4.0
2.5
2.8
Tuni
sia
0.0
0.3
0.7
0.7
0.0
0.0
2.8
0.0
1.3
5.6
1.9
1.7
3.4
0.8
19.3
30.5
18.8
10.5
9.0
Uga
nda
0.0
0.0
0.0
0.0
0.0
0.0
0.0
1.0
1.0
0.3
1.3
0.0
0.5
0.0
4.3
1.3
0.8
1.3
0.0
Zam
bia
1.5
2.1
1.5
0.5
5.0
0.5
3.4
1.8
0.9
6.6
2.4
1.5
1.6
0.3
2.0
1.0
1.5
0.3
1.3
Zim
babw
e3.
74.
84.
61.
31.
41.
05.
90.
31.
02.
06.
92.
74.
43.
55.
00.
80.
30.
32.
0
Not
e: T
he
chan
ge i
n t
he
sou
rce
mig
ht
affe
ct t
he
com
pa
rab
ilit
y of
th
e 20
06 i
nd
icat
or
to it
s h
isto
rica
l va
lues
. Th
e in
dic
ato
rs p
rese
nte
d i
n t
he
tab
les
hav
e b
een
ad
just
ed a
cco
rdin
gly.
Fo
r m
ore
det
ail
s ab
ou
t th
e so
urc
es a
nd
co
mp
uta
tio
n, s
ee n
ote
on
met
ho
dol
og
y.So
urce
s: A
uth
ors
’ ca
lcu
lati
on
s b
ased
on
new
s ve
rifi
ed b
y th
e p
ress
age
nci
es (
Mar
chés
Tro
pica
ux
et M
édit
erra
néen
s fo
r 19
96-2
005
, AFP
an
d R
eute
rs f
or
2006
on
wa
rds)
.
(con
t.)
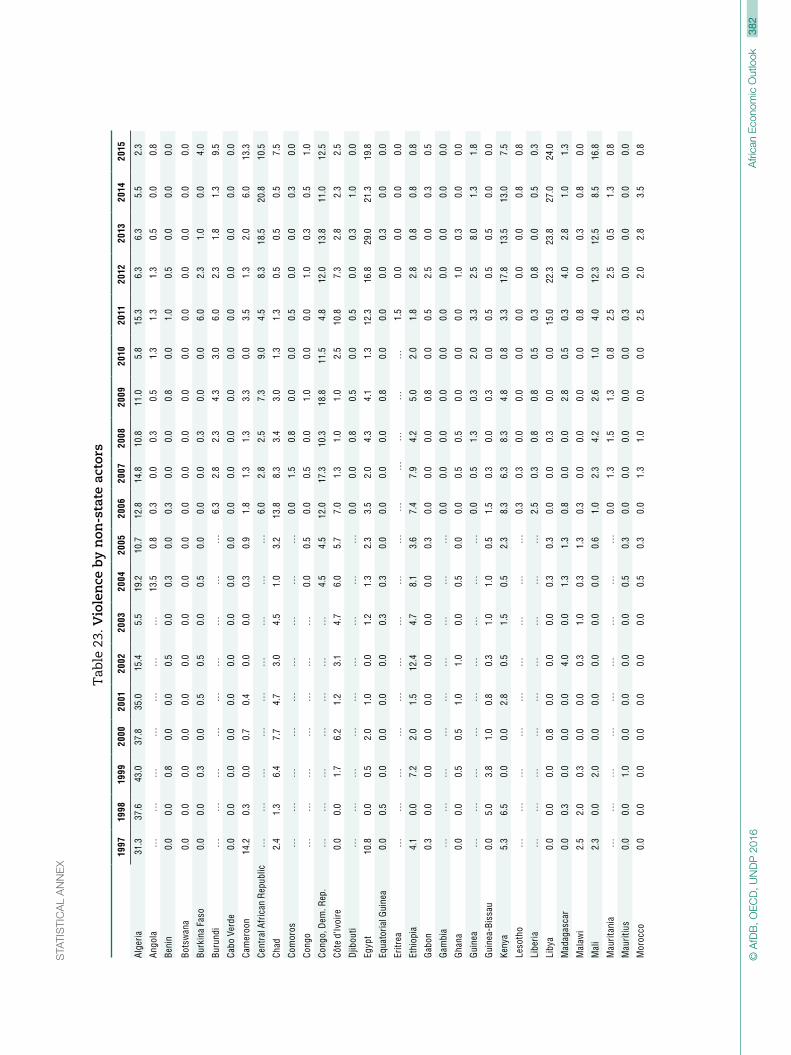
382
Afri
can
Eco
nom
ic O
utlo
ok©
AfD
B, O
EC
D, U
ND
P 2
016
StA
tiS
tiC
Al
AN
NE
X
Tab
le 2
3. V
iole
nce
by
non
-sta
te a
ctor
s
1997
1998
1999
2000
2001
2002
2003
2004
2005
2006
2007
2008
2009
2010
2011
2012
2013
2014
2015
Alge
ria31
.337
.643
.037
.835
.015
.45.
519
.210
.712
.814
.810
.811
.05.
815
.36.
36.
35.
52.
3
Ango
la…
……
……
……
13.5
0.8
0.3
0.0
0.3
0.5
1.3
1.3
1.3
0.5
0.0
0.8
Beni
n0.
00.
00.
80.
00.
00.
50.
00.
30.
00.
30.
00.
00.
80.
01.
00.
50.
00.
00.
0
Bots
wan
a0.
00.
00.
00.
00.
00.
00.
00.
00.
00.
00.
00.
00.
00.
00.
00.
00.
00.
00.
0
Burk
ina
Faso
0.0
0.0
0.3
0.0
0.5
0.5
0.0
0.5
0.0
0.0
0.0
0.3
0.0
0.0
6.0
2.3
1.0
0.0
4.0
Buru
ndi
……
……
……
……
…6.
32.
82.
34.
33.
06.
02.
31.
81.
39.
5
Cabo
Ver
de0.
00.
00.
00.
00.
00.
00.
00.
00.
00.
00.
00.
00.
00.
00.
00.
00.
00.
00.
0
Cam
eroo
n14
.20.
30.
00.
70.
40.
00.
00.
30.
91.
81.
31.
33.
30.
03.
51.
32.
06.
013
.3
Cent
ral A
fric
an R
epub
lic…
……
……
……
……
6.0
2.8
2.5
7.3
9.0
4.5
8.3
18.5
20.8
10.5
Chad
2.4
1.3
6.4
7.7
4.7
3.0
4.5
1.0
3.2
13.8
8.3
3.4
3.0
1.3
1.3
0.5
0.5
0.5
7.5
Com
oros
……
……
……
……
…0.
01.
50.
80.
00.
00.
50.
00.
00.
30.
0
Cong
o…
……
……
……
0.0
0.5
0.0
0.5
0.0
1.0
0.0
0.0
1.0
0.3
0.5
1.0
Cong
o, D
em. R
ep.
……
……
……
…4.
54.
512
.017
.310
.318
.811
.54.
812
.013
.811
.012
.5
Côte
d’Iv
oire
0.0
0.0
1.7
6.2
1.2
3.1
4.7
6.0
5.7
7.0
1.3
1.0
1.0
2.5
10.8
7.3
2.8
2.3
2.5
Djib
outi
……
……
……
……
…0.
00.
00.
80.
50.
00.
50.
00.
31.
00.
0
Egyp
t10
.80.
00.
52.
01.
00.
01.
21.
32.
33.
52.
04.
34.
11.
312
.316
.829
.021
.319
.8
Equa
toria
l Gui
nea
0.0
0.5
0.0
0.0
0.0
0.0
0.3
0.3
0.0
0.0
0.0
0.0
0.8
0.0
0.0
0.0
0.3
0.0
0.0
Eritr
ea…
……
……
……
……
……
……
…1.
50.
00.
00.
00.
0
Ethi
opia
4.1
0.0
7.2
2.0
1.5
12.4
4.7
8.1
3.6
7.4
7.9
4.2
5.0
2.0
1.8
2.8
0.8
0.8
0.8
Gab
on0.
30.
00.
00.
00.
00.
00.
00.
00.
30.
00.
00.
00.
80.
00.
52.
50.
00.
30.
5
Gam
bia
……
……
……
……
…0.
00.
00.
00.
00.
00.
00.
00.
00.
00.
0
Gha
na0.
00.
00.
50.
51.
01.
00.
00.
50.
00.
00.
50.
50.
00.
00.
01.
00.
30.
00.
0
Gui
nea
……
……
……
……
…0.
00.
51.
30.
32.
03.
32.
58.
01.
31.
8
Gui
nea-
Biss
au0.
05.
03.
81.
00.
80.
31.
01.
00.
51.
50.
30.
00.
30.
00.
50.
50.
50.
00.
0
Keny
a5.
36.
50.
00.
02.
80.
51.
50.
52.
38.
36.
38.
34.
80.
83.
317
.813
.513
.07.
5
Leso
tho
……
……
……
……
…0.
30.
30.
00.
00.
00.
00.
00.
00.
80.
8
Libe
ria…
……
……
……
……
2.5
0.3
0.8
0.8
0.5
0.3
0.8
0.0
0.5
0.3
Liby
a0.
00.
00.
00.
80.
00.
00.
00.
30.
30.
00.
00.
30.
00.
015
.022
.323
.827
.024
.0
Mad
agas
car
0.0
0.3
0.0
0.0
0.0
4.0
0.0
1.3
1.3
0.8
0.0
0.0
2.8
0.5
0.3
4.0
2.8
1.0
1.3
Mal
awi
2.5
2.0
0.3
0.0
0.0
0.3
1.0
0.3
1.3
0.3
0.0
0.0
0.0
0.0
0.8
0.0
0.3
0.8
0.0
Mal
i2.
30.
02.
00.
00.
00.
00.
00.
00.
61.
02.
34.
22.
61.
04.
012
.312
.58.
516
.8
Mau
ritan
ia…
……
……
……
……
0.0
1.3
1.5
1.3
0.8
2.5
2.5
0.5
1.3
0.8
Mau
ritiu
s0.
00.
01.
00.
00.
00.
00.
00.
50.
30.
00.
00.
00.
00.
00.
30.
00.
00.
00.
0
Mor
occo
0.0
0.0
0.0
0.0
0.0
0.0
0.0
0.5
0.3
0.0
1.3
1.0
0.0
0.0
2.5
2.0
2.8
3.5
0.8

383
Afri
can
Eco
nom
ic O
utlo
ok©
AfD
B, O
EC
D, U
ND
P 2
016
STA
TIS
TIC
AL
AN
NE
X
Tab
le 2
3. V
iole
nce
by
non
-sta
te a
ctor
s
1997
1998
1999
2000
2001
2002
2003
2004
2005
2006
2007
2008
2009
2010
2011
2012
2013
2014
2015
Moz
ambi
que
0.0
0.0
0.3
1.5
0.0
0.0
0.8
1.0
0.3
0.0
0.0
0.8
0.3
0.8
0.0
4.0
5.0
0.8
2.0
Nam
ibia
0.0
0.0
2.0
1.0
0.0
0.0
0.0
0.0
0.0
0.0
0.0
0.0
0.3
0.0
0.3
0.0
0.0
0.3
0.0
Nig
er
……
……
……
…1.
00.
30.
37.
35.
52.
80.
33.
30.
52.
31.
89.
5
Nig
eria
16.6
5.7
16.0
12.4
12.7
6.4
6.0
11.3
0.8
16.4
22.5
12.9
13.8
12.5
31.5
34.8
30.5
36.5
37.8
Rw
anda
……
……
……
…0.
00.
00.
00.
30.
50.
81.
01.
55.
02.
00.
00.
0
Sao
Tom
e an
d Pr
inci
pe…
……
……
……
……
0.0
0.0
0.0
0.0
0.0
0.0
0.0
0.0
0.0
0.0
Sene
gal
4.2
0.6
1.4
1.6
1.4
2.2
1.9
2.1
0.3
1.9
1.9
0.3
4.1
4.8
7.5
6.0
2.0
0.3
0.3
Seyc
helle
s…
……
……
……
……
0.0
0.0
0.0
0.3
0.0
0.0
0.0
0.0
0.0
0.0
Sier
ra L
eone
……
……
……
……
…0.
00.
50.
01.
50.
00.
50.
80.
30.
30.
0
Som
alia
……
……
……
……
……
……
……
……
20.3
16.5
14.5
Sout
h Af
rica
7.0
4.5
8.3
4.5
0.0
0.5
0.3
2.0
0.3
0.5
0.0
4.3
4.3
0.5
4.3
8.3
8.3
3.5
5.3
Sout
h Su
dan
……
……
……
……
……
……
……
16.0
8.3
8.0
4.8
2.8
Suda
n…
……
……
……
……
8.8
9.5
9.5
24.0
18.3
17.5
15.0
18.5
10.8
3.8
Swaz
iland
……
……
……
……
…0.
50.
00.
00.
50.
00.
50.
30.
00.
00.
0
Tanz
ania
0.5
0.0
0.0
0.0
1.0
0.0
0.0
0.0
1.3
0.0
0.0
0.0
0.0
0.0
2.0
1.8
2.5
0.3
0.3
Togo
0.0
0.5
0.0
0.8
0.0
0.0
0.5
0.0
2.8
0.0
0.0
0.0
0.8
0.0
1.0
0.0
0.3
0.0
1.0
Tuni
sia
0.0
0.0
0.5
0.0
0.0
0.8
0.0
0.0
0.3
0.0
0.0
0.3
0.3
0.0
7.0
11.5
10.3
8.8
8.3
Uga
nda
4.0
2.8
2.5
0.0
6.3
3.8
4.5
10.3
1.8
3.8
2.5
1.8
3.5
0.0
2.8
1.0
0.0
0.5
0.5
Zam
bia
0.8
0.5
0.5
0.0
2.8
0.0
0.8
0.0
0.3
0.5
0.0
0.3
0.0
0.0
1.3
0.5
1.0
0.0
0.0
Zim
babw
e1.
51.
00.
03.
83.
03.
80.
30.
80.
80.
00.
08.
00.
80.
82.
30.
01.
00.
00.
3
Not
e: T
he
chan
ge i
n t
he
sou
rce
mig
ht
affe
ct t
he
com
pa
rab
ilit
y of
th
e 20
06 i
nd
icat
or
to it
s h
isto
rica
l va
lues
. Th
e in
dic
ato
rs p
rese
nte
d i
n t
he
tab
les
hav
e b
een
ad
just
ed
acco
rdin
gly.
Fo
r m
ore
det
ail
s ab
ou
t th
e so
urc
es a
nd
co
mp
uta
tio
n, s
ee n
ote
on
met
ho
dol
og
y.So
urce
s: A
uth
ors
’ ca
lcu
lati
on
s b
ased
on
new
s ve
rifi
ed b
y th
e p
ress
age
nci
es (
Mar
chés
Tro
pica
ux
et M
édit
erra
néen
s fo
r 19
96-2
005
, AFP
an
d R
eute
rs f
or
2006
on
wa
rds)
.
(con
t.)

384
Afri
can
Eco
nom
ic O
utlo
ok©
AfD
B, O
EC
D, U
ND
P 2
016
StA
tiS
tiC
Al
AN
NE
X
Tab
le 2
4. P
olit
ical
har
den
ing
1997
1998
1999
2000
2001
2002
2003
2004
2005
2006
2007
2008
2009
2010
2011
2012
2013
2014
2015
Alge
ria7.
06.
56.
15.
67.
49.
06.
57.
55.
54.
66.
16.
85.
11.
84.
73.
44.
23.
21.
7
Ango
la...
......
......
......
1.4
0.1
0.5
0.2
0.8
0.4
0.7
2.9
1.1
2.1
0.3
1.6
Beni
n0.
00.
00.
00.
00.
00.
00.
00.
10.
10.
30.
10.
50.
10.
20.
40.
10.
40.
00.
4
Bots
wan
a0.
10.
00.
20.
00.
00.
00.
00.
30.
10.
00.
00.
00.
00.
00.
10.
00.
20.
00.
0
Burk
ina
Faso
0.5
0.2
1.2
0.4
0.3
0.7
0.6
0.7
0.2
0.2
0.1
0.8
0.3
0.1
2.1
0.1
0.5
0.8
0.4
Buru
ndi
......
......
......
......
...3.
61.
41.
21.
82.
51.
90.
81.
61.
55.
7
Cabo
Ver
de0.
00.
00.
00.
00.
00.
00.
00.
00.
00.
00.
30.
20.
00.
00.
00.
00.
00.
00.
0
Cam
eroo
n2.
31.
31.
31.
11.
71.
11.
41.
50.
91.
91.
21.
61.
51.
82.
31.
60.
71.
91.
2
Cent
ral A
fric
an R
epub
lic...
......
......
......
......
4.2
0.8
0.5
1.7
1.9
0.8
1.5
0.4
1.7
0.3
Chad
0.3
0.3
0.0
0.3
0.6
0.4
1.6
0.2
1.7
4.3
2.2
5.7
1.2
0.8
1.7
0.4
1.5
0.2
1.4
Com
oros
......
......
......
......
...0.
40.
90.
60.
40.
00.
00.
80.
20.
70.
3
Cong
o...
......
......
......
0.3
0.3
0.5
0.4
0.2
0.9
0.3
1.1
0.5
0.4
0.6
1.4
Cong
o, D
em. R
ep.
......
......
......
...6.
98.
110
.58.
94.
04.
75.
01.
71.
12.
53.
83.
9
Côte
d’Iv
oire
0.9
0.5
2.8
2.3
0.7
1.1
2.1
2.7
2.1
3.3
1.2
1.5
0.6
4.0
6.0
1.8
1.5
0.6
1.4
Djib
outi
......
......
......
......
...0.
20.
10.
60.
00.
10.
60.
10.
70.
60.
3
Egyp
t5.
34.
94.
15.
44.
66.
44.
84.
66.
45.
77.
17.
94.
75.
48.
77.
516
.510
.47.
9
Equa
toria
l Gui
nea
0.3
1.3
0.0
0.0
0.2
1.5
0.2
2.1
0.0
0.5
0.3
0.5
0.8
0.5
1.2
1.2
0.3
0.1
0.1
Eritr
ea...
......
......
......
......
......
......
...0.
30.
00.
50.
00.
0
Ethi
opia
3.2
2.8
2.2
2.4
3.1
4.2
2.5
2.5
5.2
3.4
3.4
1.9
2.0
1.4
1.5
1.5
0.6
1.1
0.7
Gab
on1.
40.
30.
70.
20.
10.
30.
51.
02.
10.
70.
50.
21.
30.
91.
02.
60.
71.
10.
5
Gam
b ia
......
......
......
......
...1.
40.
30.
92.
10.
20.
10.
21.
10.
41.
3
Gha
na0.
20.
60.
60.
00.
20.
30.
00.
10.
00.
00.
00.
10.
00.
20.
10.
70.
10.
00.
0
Gui
nea
......
......
......
......
...1.
73.
02.
85.
41.
63.
41.
91.
50.
41.
4
Gui
nea-
Biss
au0.
02.
00.
80.
70.
40.
50.
00.
00.
31.
20.
80.
62.
00.
10.
50.
50.
70.
00.
2
Keny
a2.
70.
90.
00.
00.
20.
30.
50.
60.
71.
82.
67.
40.
40.
00.
51.
00.
93.
31.
7
Leso
tho
......
......
......
......
...0.
10.
30.
00.
00.
00.
00.
00.
00.
00.
0
Libe
ria...
......
......
......
......
0.8
0.3
0.5
0.2
0.0
0.4
0.0
0.5
0.6
0.1
Liby
a0.
40.
00.
00.
00.
10.
00.
10.
30.
10.
60.
50.
50.
40.
17.
93.
52.
83.
13.
6
Mad
agas
car
0.0
0.1
0.0
0.0
0.0
0.6
0.0
0.8
0.3
1.1
0.9
0.0
2.7
0.7
0.4
2.7
1.1
0.6
0.8
Mal
awi
0.5
0.3
0.0
0.0
0.4
0.2
0.2
0.2
0.8
0.3
0.3
0.3
0.6
0.5
1.2
0.0
0.3
0.1
0.2
Mal
i1.
30.
00.
10.
30.
30.
10.
30.
10.
00.
40.
51.
91.
20.
10.
34.
76.
11.
61.
7
Mau
ritan
ia...
......
......
......
......
1.3
1.1
9.0
1.3
0.6
1.9
1.5
0.7
0.6
0.5
Mau
ritiu
s0.
00.
00.
10.
00.
00.
00.
60.
10.
20.
00.
00.
00.
00.
00.
00.
00.
00.
00.
0
Mor
occo
4.4
3.9
3.8
4.3
4.2
4.1
4.4
4.9
4.0
4.3
4.4
4.6
2.0
2.2
2.4
3.9
2.8
2.6
1.9

385
Afri
can
Eco
nom
ic O
utlo
ok©
AfD
B, O
EC
D, U
ND
P 2
016
STA
TIS
TIC
AL
AN
NE
X
Tab
le 2
4. P
olit
ical
har
den
ing
1997
1998
1999
2000
2001
2002
2003
2004
2005
2006
2007
2008
2009
2010
2011
2012
2013
2014
2015
Moz
ambi
que
0.2
0.6
0.3
0.9
0.3
0.0
0.1
0.4
0.0
0.0
0.0
0.4
0.5
0.9
0.1
0.4
3.0
0.3
0.3
Nam
ibia
0.1
0.0
0.3
0.4
0.1
0.1
0.2
0.1
0.0
0.0
0.0
0.0
0.1
0.0
0.0
0.0
0.0
0.1
0.0
Nig
er
......
......
......
...0.
40.
81.
31.
42.
23.
90.
70.
50.
00.
31.
72.
2
Nig
eria
4.2
3.4
3.1
3.1
2.7
2.6
2.9
5.0
2.7
4.6
3.7
4.3
2.9
0.6
3.2
8.3
5.2
2.2
2.9
Rw
anda
......
......
......
...1.
10.
10.
10.
10.
20.
20.
60.
70.
60.
11.
40.
3
Sao
Tom
e an
d Pr
inci
pe...
......
......
......
......
0.1
0.3
0.1
0.7
0.0
0.0
0.0
0.0
0.0
0.0
Sene
gal
2.0
1.9
1.3
1.2
1.7
1.5
1.6
1.5
1.9
1.5
2.6
1.8
1.2
1.4
1.3
3.5
0.8
0.6
0.6
Seyc
helle
s...
......
......
......
......
0.4
0.0
0.0
0.4
0.0
0.0
0.0
0.0
0.0
0.0
Sier
ra L
eone
......
......
......
......
...0.
40.
60.
21.
00.
20.
40.
80.
60.
30.
2
Som
alia
......
......
......
......
......
......
......
......
1.2
1.6
0.7
Sout
h Af
rica
3.6
1.5
1.1
0.5
0.3
0.5
0.4
1.0
1.1
0.5
1.2
1.5
1.6
0.4
0.3
7.1
4.5
1.1
0.9
Sout
h Su
dan
......
......
......
......
......
......
......
2.5
1.3
0.9
0.7
0.8
Suda
n...
......
......
......
......
3.5
3.6
7.6
5.0
6.2
7.9
7.3
2.0
4.4
1.7
Swaz
iland
......
......
......
......
...0.
30.
30.
90.
20.
01.
21.
10.
30.
40.
2
Tanz
ania
0.1
0.1
0.0
0.1
0.1
0.0
0.1
0.0
0.4
0.0
0.0
0.0
0.3
0.2
1.4
1.0
1.6
0.4
0.5
Togo
0.0
0.3
0.2
0.5
0.6
0.3
0.0
0.0
0.8
0.0
0.0
0.0
0.7
0.8
0.8
1.0
1.2
0.1
0.4
Tuni
sia
1.8
1.8
2.0
1.8
2.2
2.1
1.8
3.0
2.1
1.3
1.9
3.4
2.1
1.1
4.9
8.9
7.6
3.6
3.1
Uga
nda
0.4
0.6
0.7
0.4
1.9
0.8
1.4
3.5
1.1
3.3
2.0
0.9
3.0
0.9
2.3
2.3
1.5
1.8
1.1
Zam
bia
2.7
1.6
1.3
0.9
1.8
1.9
1.0
1.2
0.9
1.7
0.5
0.2
0.5
0.6
0.7
0.2
1.9
0.3
0.4
Zim
babw
e0.
91.
91.
31.
23.
14.
43.
94.
13.
32.
23.
09.
93.
30.
73.
60.
53.
51.
40.
4
Not
e: T
he
chan
ge i
n t
he
sou
rce
mig
ht
affe
ct t
he
com
pa
rab
ilit
y of
th
e 20
06 i
nd
icat
or
to it
s h
isto
rica
l va
lues
. Th
e in
dic
ato
rs p
rese
nte
d i
n t
he
tab
les
hav
e b
een
ad
just
ed a
cco
rdin
gly.
Fo
r m
ore
det
ail
s ab
ou
t th
e so
urc
es a
nd
co
mp
uta
tio
n, s
ee n
ote
on
met
ho
dol
og
y.So
urce
s: A
uth
ors
’ ca
lcu
lati
on
s b
ased
on
new
s ve
rifi
ed b
y th
e p
ress
age
nci
es (
Mar
chés
Tro
pica
ux
et M
édit
erra
néen
s fo
r 19
96-2
005
, AFP
an
d R
eute
rs f
or
2006
on
wa
rds)
.
(con
t.)

386
Afri
can
Eco
nom
ic O
utlo
ok©
AfD
B, O
EC
D, U
ND
P 2
016
StA
tiS
tiC
Al
AN
NE
X
Tab
le 2
5. D
emog
rap
hic
pro
ject
ion
s (a
ll p
opu
lati
ons
are
in t
hou
san
ds)
Popu
latio
n in
crea
se,
1980
-201
5
Proj
ecte
d po
pula
tion
incr
ease
, 20
15-5
0
Popu
latio
n 20
50/2
015
ratio
Activ
e po
pula
tion
incr
ease
, 20
15-3
0
Year
ly c
ohor
t of
new
labo
ur
entr
ants
, 20
15
Year
ly c
ohor
t of
new
labo
ur
entr
ants
, 20
30
Tota
l en
tran
ce
inflo
w,
201
5-30
Activ
ity
ra
tio,
2015
Activ
ity
ra
tio,
2050
Urb
an
popu
latio
n,
2015
Proj
ecte
d ur
ban
popu
latio
n in
crea
se,
2015
-50
Proj
ecte
d ru
ral
popu
latio
n in
crea
se,
2015
-50
Alge
ria20
329
16 7
95 1
.4
5 95
3 6
60 8
3110
756
1.9
1
.7
28 7
3916
048
-2 1
59
Ango
la16
810
40 4
51 2
.6
8 46
3 4
87 8
0710
283
1.0
1
.4
10 0
5224
624
6 88
1
Beni
n7
162
11 6
69 2
.1
3 24
0 2
17 3
104
240
1.2
1
.7
4 78
28
792
2 46
5
Bots
wan
a1
266
1 12
6 1
.5
438
44
50
733
1.8
2
.1
1 18
1 7
61-3
7
Burk
ina
Faso
11 2
8324
683
2.4
5
914
361
562
7 36
8 1
.1
1.6
5
349
15 9
507
068
Buru
ndi
7 05
217
489
2.6
3
593
215
352
4 31
9 1
.1
1.4
1
304
5 72
110
157
Cabo
Ver
de 2
35 1
86 1
.4
80
11
10
164
1.9
2
.1
333
160
-33
Cam
eroo
n14
412
25 0
18 2
.1
6 68
7 4
73 6
699
094
1.2
1
.7
12 7
2121
281
3 92
5
Cent
ral A
fric
an R
epub
lic2
626
3 88
1 1
.8
1 17
3 1
01 1
251
807
1.3
1
.9
1 92
32
908
780
Chad
9 52
521
093
2.5
4
818
284
454
5 87
7 1
.0
1.5
3
057
9 38
510
526
Com
oros
480
714
1.9
2
06 1
6 2
1 2
92 1
.3
1.8
2
18 3
58 3
80
Cong
o2
819
6 11
1 2
.3
1 39
1 8
6 1
371
760
1.2
1
.5
3 05
45
114
791
Cong
o, D
em. R
ep.
50 9
0911
8 01
0 2
.5
26 3
561
504
2 44
231
340
1.0
1
.5
30 2
7563
589
20 4
56
Côte
d’Iv
oire
14 4
3626
095
2.1
5
930
460
631
8 71
5 1
.2
1.6
11
538
18 4
592
585
Djib
outi
529
298
1.3
1
37 1
8 1
9 2
88 1
.7
2.1
6
96 3
33 1
2
Egyp
t48
139
59 6
03 1
.7
18 1
451
584
2 14
128
372
1.6
1
.8
36 5
3832
326
4 76
6
Equa
toria
l Gui
nea
624
971
2.1
2
36 1
6 2
3 3
10 1
.4
1.8
3
19 5
08 3
16
Eritr
ea2
844
5 19
4 2
.0
1 63
3 1
00 1
542
039
1.2
1
.8
1 52
54
504
3 07
2
Ethi
opia
64 1
5189
064
1.9
30
603
2 14
52
746
39 9
56 1
.2
2.0
19
266
51 2
5637
375
Gab
on 9
961
438
1.8
4
41 3
4 4
4 6
14 1
.4
1.9
1
526
1 47
8 7
3
Gam
bia
1 38
72
990
2.5
6
75 3
9 6
4 8
14 1
.1
1.5
1
175
2 29
4 6
02
Gha
na16
608
22 6
61 1
.8
6 83
4 5
33 7
259
868
1.4
1
.8
14 5
8317
610
1 07
6
Gui
nea
8 10
214
878
2.2
3
737
250
366
4 89
7 1
.2
1.7
4
589
9 17
52
943
Gui
nea-
Biss
au 9
941
720
1.9
4
77 3
7 5
0 6
85 1
.3
1.7
8
821
386
330
Keny
a29
782
49 4
54 2
.1
13 7
23 8
961
320
17 7
07 1
.2
1.7
11
978
30 6
5819
766
Leso
tho
828
852
1.4
2
83 4
9 5
0 7
72 1
.5
2.1
5
79 7
37-3
9
Libe
ria2
611
4 93
2 2
.1
1 31
8 8
7 1
281
742
1.2
1
.7
2 23
83
883
1 00
5
Liby
a3
087
2 09
7 1
.3
1 09
2 1
00 1
291
839
1.9
1
.9
4 96
22
193
-160
Mad
agas
car
15 4
8931
058
2.3
7
449
498
694
9 52
9 1
.2
1.6
8
508
22 0
119
251
Mal
awi
11 0
5225
939
2.5
6
078
355
543
7 08
1 1
.1
1.6
2
816
9 62
114
273
Mal
i10
510
27 8
04 2
.6
6 02
4 3
38 5
787
242
1.0
1
.5
6 49
020
744
8 16
6
Mau
r itan
ia2
533
3 98
2 2
.0
1 09
4 7
9 1
111
522
1.3
1
.7
2 44
23
425
416
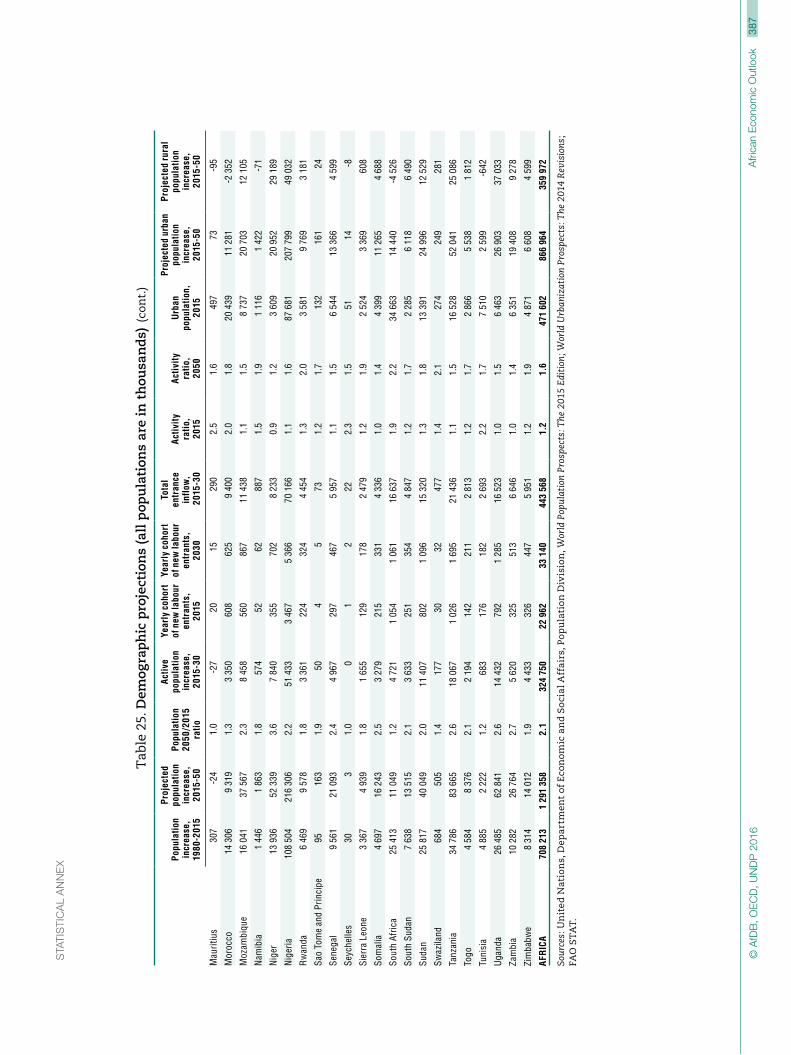
387
Afri
can
Eco
nom
ic O
utlo
ok©
AfD
B, O
EC
D, U
ND
P 2
016
STA
TIS
TIC
AL
AN
NE
X
Tab
le 2
5. D
emog
rap
hic
pro
ject
ion
s (a
ll p
opu
lati
ons
are
in t
hou
san
ds)
Popu
latio
n in
crea
se,
1980
-201
5
Proj
ecte
d po
pula
tion
incr
ease
, 20
15-5
0
Popu
latio
n 20
50/2
015
ratio
Activ
e po
pula
tion
incr
ease
, 20
15-3
0
Year
ly c
ohor
t of
new
labo
ur
entr
ants
, 20
15
Year
ly c
ohor
t of
new
labo
ur
entr
ants
, 20
30
Tota
l en
tran
ce
inflo
w,
201
5-30
Activ
ity
ra
tio,
2015
Activ
ity
ra
tio,
2050
Urb
an
popu
latio
n,
2015
Proj
ecte
d ur
ban
popu
latio
n in
crea
se,
2015
-50
Proj
ecte
d ru
ral
popu
latio
n in
crea
se,
2015
-50
Mau
ritiu
s 3
07-2
4 1
.0
-27
20
15
290
2.5
1
.6
497
73
-95
Mor
occo
14 3
069
319
1.3
3
350
608
625
9 40
0 2
.0
1.8
20
439
11 2
81-2
352
Moz
ambi
que
16 0
4137
567
2.3
8
458
560
867
11 4
38 1
.1
1.5
8
737
20 7
0312
105
Nam
ibia
1 44
61
863
1.8
5
74 5
2 6
2 8
87 1
.5
1.9
1
116
1 42
2-7
1
Nig
er
13 9
3652
339
3.6
7
840
355
702
8 23
3 0
.9
1.2
3
609
20 9
5229
189
Nig
eria
108
504
216
306
2.2
51
433
3 46
75
366
70 1
66 1
.1
1.6
87
681
207
799
49 0
32
Rw
anda
6 46
99
578
1.8
3
361
224
324
4 45
4 1
.3
2.0
3
581
9 76
93
181
Sao
Tom
e an
d Pr
inci
pe 9
5 1
63 1
.9
50
4 5
73
1.2
1
.7
132
161
24
Sene
gal
9 56
121
093
2.4
4
967
297
467
5 95
7 1
.1
1.5
6
544
13 3
664
599
Seyc
helle
s 3
0 3
1.0
0
1 2
22
2.3
1
.5
51
14
-8
Sier
ra L
eone
3 36
74
939
1.8
1
655
129
178
2 47
9 1
.2
1.9
2
524
3 36
9 6
08
Som
alia
4 69
716
243
2.5
3
279
215
331
4 33
6 1
.0
1.4
4
399
11 2
654
688
Sout
h Af
rica
25 4
1311
049
1.2
4
721
1 05
41
061
16 6
37 1
.9
2.2
34
663
14 4
40-4
526
Sout
h Su
dan
7 63
813
515
2.1
3
633
251
354
4 84
7 1
.2
1.7
2
285
6 11
86
490
Suda
n25
817
40 0
49 2
.0
11 4
07 8
021
096
15 3
20 1
.3
1.8
13
391
24 9
9612
529
Swaz
iland
684
505
1.4
1
77 3
0 3
2 4
77 1
.4
2.1
2
74 2
49 2
81
Tanz
ania
34 7
8683
665
2.6
18
067
1 02
61
695
21 4
36 1
.1
1.5
16
528
52 0
4125
086
Togo
4 58
48
376
2.1
2
194
142
211
2 81
3 1
.2
1.7
2
866
5 53
81
812
Tuni
sia
4 88
52
222
1.2
6
83 1
76 1
822
693
2.2
1
.7
7 51
02
599
-642
Uga
nda
26 4
8562
841
2.6
14
432
792
1 28
516
523
1.0
1
.5
6 46
326
903
37 0
33
Zam
bia
10 2
8226
764
2.7
5
620
325
513
6 64
6 1
.0
1.4
6
351
19 4
089
278
Zim
babw
e8
314
14 0
12 1
.9
4 43
3 3
26 4
475
951
1.2
1
.9
4 87
16
608
4 59
9
AFR
ICA
708
213
1 29
1 35
8 2
.1
324
750
22 9
6233
140
443
568
1.2
1
.6
471
602
866
964
359
972
Sour
c es:
Un
ited
Nat
ion
s, D
epa
rtm
ent
of E
con
om
ic a
nd
So
cia
l Aff
air
s, P
op
ula
tio
n D
ivis
ion
, Wor
ld P
opul
atio
n Pr
ospe
cts:
The
201
5 Ed
itio
n; W
orld
Urb
aniz
atio
n Pr
ospe
cts:
The
201
4 R
evis
ions
; FA
O S
TA
T.
(con
t.)

388
Afri
can
Eco
nom
ic O
utlo
ok©
AfD
B, O
EC
D, U
ND
P 2
016
StA
tiS
tiC
Al
AN
NE
X
Tab
le 2
6. G
end
er i
nd
icat
ors
Afri
ca G
ende
r Equ
alit
y In
dex
2015
1So
cial
Inst
itutio
ns a
nd G
ende
r Ind
ex (
SIG
I), 2
0142
Gen
der
Ineq
ualit
y In
dex
(GII
),
2014
3
Gen
der
Dev
elop
men
t In
dex
(GD
I),
2014
4
Ove
rall
sc
ore
Econ
omic
op
port
uniti
esH
uman
de
velo
pmen
tLa
ws
and
Inst
itutio
nsO
vera
ll
scor
e
Dis
crim
inat
ory
fam
ily
code
Res
tric
ted
phys
ical
in
tegr
ity
Son
bias
Res
tric
ted
reso
urce
s an
d as
sets
Res
tric
ted
civi
l lib
ertie
sO
vera
ll
scor
eO
vera
ll
scor
e
Alge
ria58
4289
42...
......
......
...41
84
Ango
la53
5541
6417
4650
859
20...
...
Beni
n52
6247
4728
2844
3759
8061
82
Bots
wan
a69
7691
41...
......
......
...48
98
Burk
ina
Faso
5763
6046
2854
7319
5945
6388
Buru
ndi
6469
6163
1756
5117
4126
4991
Cabo
Ver
de67
5588
57...
......
......
......
...
Cam
eroo
n47
5465
2228
5053
2179
4559
88
Cent
ral A
fric
an R
epub
lic47
7733
3133
5361
159
8066
77
Chad
4271
2432
4797
820
5961
7177
Com
oros
4447
7213
......
......
......
...81
Cong
o49
4077
3120
5147
041
6159
92
Cong
o, D
em. R
ep.
4975
5122
4352
537
9681
6783
Côte
d’Iv
oire
4434
5740
2550
5919
5954
6881
Djib
outi
4152
675
......
......
......
......
Egyp
t49
4785
1643
6774
3759
8157
87
Equa
toria
l Gui
nea
4950
6831
......
......
......
......
Eritr
ea53
6148
50...
......
......
......
...
Ethi
opia
5168
3352
2528
879
5920
5684
Gab
on52
6075
2240
6553
1779
8151
...
Gam
bia
5578
6621
5251
850
100
8062
89
Gha
na62
6867
5230
3955
3180
5455
89
Gui
nea
4045
4035
3254
9523
3945
...78
Gui
nea-
Biss
au48
5758
2921
4149
759
54...
...
Keny
a63
6369
5822
3561
4459
2055
91
Leso
tho
7071
8158
943
4121
200
5495
Libe
ria48
5348
4538
5789
241
8065
79
Liby
a38
1290
13...
......
......
...13
95
Mad
agas
car
6561
7559
1049
310
2035
...95
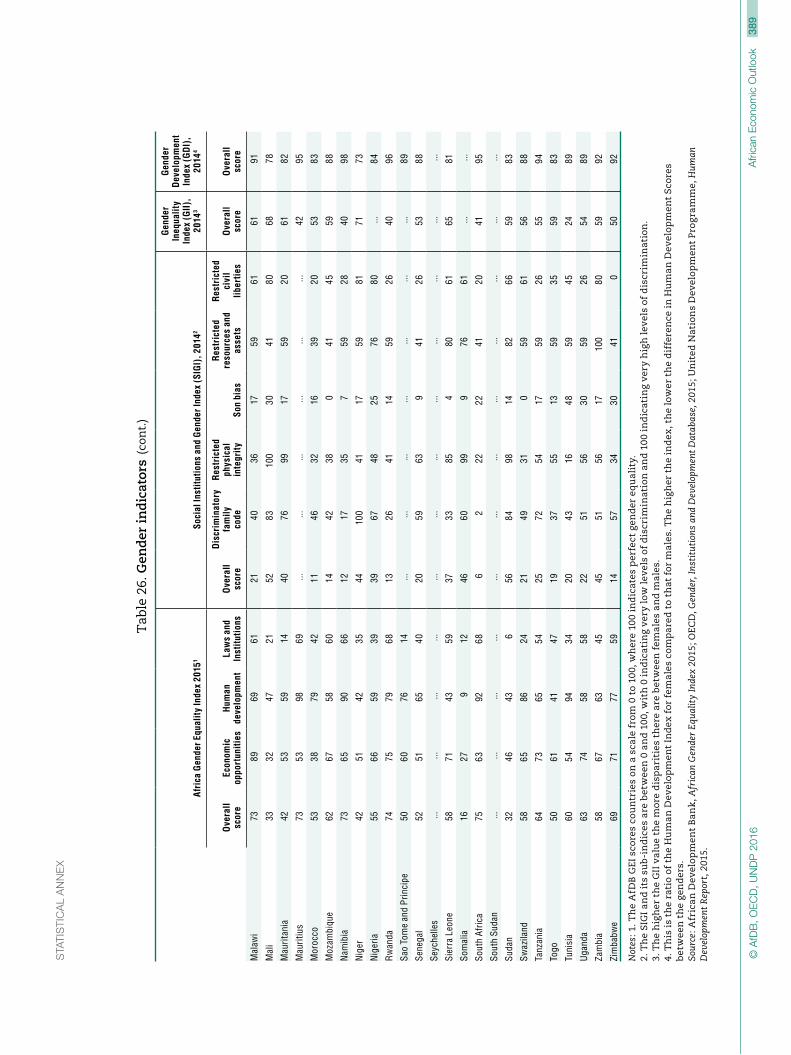
389
Afri
can
Eco
nom
ic O
utlo
ok©
AfD
B, O
EC
D, U
ND
P 2
016
STA
TIS
TIC
AL
AN
NE
X
Tab
le 2
6. G
end
er i
nd
icat
ors
Afri
ca G
ende
r Equ
alit
y In
dex
2015
1So
cial
Inst
itutio
ns a
nd G
ende
r Ind
ex (
SIG
I), 2
0142
Gen
der
Ineq
ualit
y In
dex
(GII
),
2014
3
Gen
der
Dev
elop
men
t In
dex
(GD
I),
2014
4
Ove
rall
sc
ore
Econ
omic
op
port
uniti
esH
uman
de
velo
pmen
tLa
ws
and
Inst
itutio
nsO
vera
ll
scor
e
Dis
crim
inat
ory
fam
ily
code
Res
tric
ted
phys
ical
in
tegr
ity
Son
bias
Res
tric
ted
reso
urce
s an
d as
sets
Res
tric
ted
civi
l lib
ertie
sO
vera
ll
scor
eO
vera
ll
scor
e
Mal
awi
7389
6961
2140
3617
5961
6191
Mal
i33
3247
2152
8310
030
4180
6878
Mau
ritan
ia42
5359
1440
7699
1759
2061
82
Mau
ritiu
s73
5398
69...
......
......
...42
95
Mor
occo
5338
7942
1146
3216
3920
5383
Moz
ambi
que
6267
5860
1442
380
4145
5988
Nam
ibia
7365
9066
1217
357
5928
4098
Nig
er
4251
4235
4410
041
1759
8171
73
Nig
eria
5566
5939
3967
4825
7680
...84
Rw
anda
7475
7968
1326
4114
5926
4096
Sao
Tom
e an
d Pr
inci
pe50
6076
14...
......
......
......
89
Sene
gal
5251
6540
2059
639
4126
5388
Seyc
helle
s...
......
......
......
......
......
...
Sier
ra L
eone
5871
4359
3733
854
8061
6581
Som
alia
1627
912
4660
999
7661
......
Sout
h Af
rica
7563
9268
62
2222
4120
4195
Sout
h Su
dan
......
......
......
......
......
......
Suda
n32
4643
656
8498
1482
6659
83
Swaz
iland
5865
8624
2149
310
5961
5688
Tanz
ania
6473
6554
2572
5417
5926
5594
Togo
5061
4147
1937
5513
5935
5983
Tuni
sia
6054
9434
2043
1648
5945
2489
Uga
nda
6374
5858
2251
5630
5926
5489
Zam
bia
5867
6345
4551
5617
100
8059
92
Zim
babw
e69
7177
5914
5734
3041
050
92
Not
es: 1
. Th
e A
fDB
GEI
sco
res
cou
ntr
ies
on
a s
cale
fro
m 0
to
100,
wh
ere
100
ind
icat
es p
erfe
ct g
end
er e
qu
ali
ty.
2. T
he
SIG
I an
d it
s su
b-i
nd
ices
are
bet
wee
n 0
an
d 1
00,
wit
h 0
in
dic
atin
g ve
ry l
ow
lev
els
of d
iscr
imin
atio
n a
nd
10
0 in
dic
atin
g ve
ry h
igh
lev
els
of d
iscr
imin
atio
n.
3.
Th
e h
igh
er t
he
GII
va
lue
the
mo
re d
isp
ari
ties
th
ere
are
bet
wee
n f
ema
les
and
ma
les.
4.
Th
is i
s th
e ra
tio
of t
he
Hu
man
Dev
elo
pm
ent
Ind
ex f
or
fem
ale
s co
mp
are
d t
o th
at f
or
ma
les.
Th
e h
igh
er t
he
ind
ex, t
he
low
er t
he
dif
fere
nce
in
Hu
man
Dev
elo
pm
ent
Sco
res
bet
wee
n t
he
gen
der
s.
Sour
ce: A
fric
an D
evel
op
men
t B
ank
, Afr
ican
Gen
der
Equ
alit
y In
dex
2015
; OEC
D, G
ende
r, In
stit
uti
ons
and
Dev
elop
men
t D
atab
ase,
201
5; U
nit
ed N
atio
ns
Dev
elo
pm
ent
Pro
gra
mm
e, H
uman
D
evel
opm
ent
Rep
ort,
201
5.
(con
t.)

Maps

mapsmaps
african Economic Outlook© afDB, OECD, UNDp 2016african Economic Outlook © afDB, OECD, UNDp 2016
90 km
120 km
150 km
180 km
< 2 2 –15 16 – 50 51 – 150 > 150 50 000 – 100 000
100 000 – 350 000
350 000 – 1 million
> 1 million
0.3 10043329
3 100947329
City population Urban catchment area
Radial bufferfunction of agglomeration size
Rural density (inhabitants per km²)
Share of total rural population (%)
Share of land area in urban catchment area (%)
Map 6.1. Population settlements and urban catchment areas in West Africa, 2000
Map 6.2. African coastal cities affected by climate change
Source: OECD (2013), Settlement, Market and Food Security, West African Studies, OECD Publishing, Paris, http://dx.doi.org/10.1787/9789264187443-en.
Source: WWF (2016), prepared for this edition of the African Economic Outlook, World Wildlife Fund, Washington, DC.
90 km
120 km
150 km
180 km
< 2 2 –15 16 – 50 51 – 150 > 150 50 000 – 100 000
100 000 – 350 000
350 000 – 1 million
> 1 million
0.3 10043329
3 100947329
City population Urban catchment area
Radial bufferfunction of agglomeration size
Rural density (inhabitants per km²)
Share of total rural population (%)
Share of land area in urban catchment area (%)

mapsmaps
african Economic Outlook© afDB, OECD, UNDp 2016african Economic Outlook © afDB, OECD, UNDp 2016
Map 6.3. Current and future urban areas, forest cover and deforestation in Africa
Source: WWF (2016), prepared for this edition of the African Economic Outlook, World Wildlife Fund, Washington, DC.
Esri, DeLorme, GEBCO, NOAA NGDC, and other contributors
Algiers, Algeria 1987-2014
0 4 8 12 16km‡
Footprint in 1987
Expansion 1987 - 2000Expansion 2000 - 14
City footprint
WaterRoads
Map 6.4. Accra’s urban expansion (Ghana), 1991-2014
Source: UN-Habitat (forthcoming), Atlas of Urban Expansion: The New 2016 Revision, UN-Habitat/New York University/The Lincoln Institute of Land Policy.© UN-Habitat with New York University and the Lincoln Institute of Land Policy.
Esri, DeLorme, GEBCO, NOAA NGDC, and other contributors
Accra, Ghana 1991-2014
0 5 10 15 20km ‡ Footprint in 1991
Expansion 1991 - 2000Expansion 2000 - 14
City footprint
WaterRoads
Map 6.5. Algiers’ urban expansion (Algeria), 1987-2014

mapsmaps
african Economic Outlook© afDB, OECD, UNDp 2016african Economic Outlook © afDB, OECD, UNDp 2016
Map 6.6. Arusha’s urban expansion (Tanzania), 1988-2013
Map 6.7. Nakuru’s urban expansion (Kenya), 1989-2014
Source: UN-Habitat (forthcoming), Atlas of Urban Expansion: The New 2016 Revision, UN-Habitat/New York University/The Lincoln Institute of Land Policy.© UN-Habitat with New York University and the Lincoln Institute of Land Policy.
Arusha, Tanzania1988-2013
0 1.5 3 4.5 6km ‡ Footprint in 1988
Expansion 1988 - 2000Expansion 2000 - 13
City footprint
WaterRoads
Esri, DeLorme, GEBCO, NOAA NGDC, and other contributors
Nakuru, Kenya1989-2014
0 2.5 5 7.5 10km‡
Footprint in 1989
Expansion 1989 - 2000Expansion 2000 - 14
City footprint
WaterRoads
Map 7.1. Network of the top 50 foreign direct investments in Africa’s manufacturing cities, 2003-14
Note: The cities written in red are the top ten source cities, and those in blue are the top ten African destination cities.Source: Wall, R. (forthcoming), based on raw data from fDi Markets, Orbis and IHS-Erasmus, in A. Badiane, J. Maseland, R. Wall and K. Rochell, State of African Cities 2017, UN-Habitat, Nairobi.

mapsmaps
african Economic Outlook© afDB, OECD, UNDp 2016african Economic Outlook © afDB, OECD, UNDp 2016
Map 7.2. Services network of top 50 investments from top 10 source cities to top 10 African destination cities, 2003-14
Note: The cities written in red are the top ten source cities, and those in blue are the top ten African destination cities.Source: Wall, R. (forthcoming), based on raw data from fDi Markets, Orbis and IHS-Erasmus, in A. Badiane, J. Maseland, R. Wall and K. Rochell, State of African Cities 2017, UN-Habitat, Nairobi.
Map 7.3. Africa’s city regions attracting hi-tech foreign direct investment at four levels, 2003-14
interpolation using a geographic information system
Source: Wall, R. (forthcoming), based on raw data from fDi Markets, Orbis and IHS-Erasmus, in A. Badiane, J. Maseland, R. Wall and K. Rochell, State of African Cities 2017, UN-Habitat, Nairobi.

mapsmaps
african Economic Outlook© afDB, OECD, UNDp 2016african Economic Outlook © afDB, OECD, UNDp 2016
Map 7.4. Current and future urban areas in relation to watersheds in Africa
Source: WWF (2016), prepared for this edition of the African Economic Outlook, World Wildlife Fund, Washington, DC.

mapsmaps
african Economic Outlook© afDB, OECD, UNDp 2016african Economic Outlook © afDB, OECD, UNDp 2016
Map 8.1. Egypt resource flows: Water
Source: Dudek, P., N. Magdy and J. Fernandez (forthcoming), Urban Metabolism – Resource Flow Mapping: The Case of Cairo and Egypt.
Map 8.2. Cairo resource flows: Water
Created by Phebe Dudek for the MIT Urban Metabolism Group led by Prof. John Fernandez in collaboration with Nourhan Magdy. July 2014Sources Map: Aerial Picture: 2013 Google Earth; Admin border, Towns, Rivers, Agriculture: 2002 AFRICOVER; Aquifers: 2003 Atlas of the MiddleEast, National Geographic Society; Desalination plants: 2007 EgyptHolding Water & Waste Water; Rainfall: 2011, General Authority forPhysical Planning; Industrial areas: 2013, General Authority for Physical Planning. Water bodies: 1992 Digital Chart of the World Sources Data: CAPMAS 2010/2011
River
Industrial Area
Desalination Plants
Urbanised Area
Agriculture
Aquifer
Egypt depends on the Nile River for most of its water needs. Water provision is insufficient with consumption 6.3% higher than production. Any change in water provision would have a major effect on agriculture.
Resource – Egypt draws water from five different sources. The Nile River is the major source, accounting for 79%. Additional sources are aquifers (9%), desalination plants (0.1%), rainwater (1.9%) and recycled agricultural drainage and treated water (10.2%). With 95% bare land, Egypt’s hot desert climate forces urbanisation to develop close to water sources: the Nile Valley and the coastlines of the Mediterranean and Red Seas. Use – Agriculture is a major consumer of non-purified water (64.4% of total water consumption). Most of the purified water feeds into households (13.5%), and industrial uses accounted for 1.7%. Some 3% of the water evaporates due to the climate, and 21.6% of the water is lost through leaks in the distribution network.
Waste – Only 35% of the domestic wastewater and 50% of the agricultural wastewater are treated. Large amounts of untreated wastewater are discharged into the Nile River, lakes and the Mediterranean Sea, contaminating some of the water sources.
Resource – Cairo draws its water entirely from the Nile River.Use – Half of the city’s water is refined for the following: residential areas (22.2%), commercial areas (1.3%), industry (3.1%), governmental agencies (5.6%) and other uses (8.4%). No information is available regarding the exact use of the unrefined half of the water. Some 17.5% of the refined water (or 8.6% of the total water provision) is lost due to leaks in the distribution network.
Waste – Only 17.8% of wastewater is treated. The remainder is dumped in the Nile and the North Lakes.
WATERRESOURCE FLOWS
Created by Phebe Dudek for the MIT Urban Metabolism Group led by Prof. John Fernandez in collaboration with Nourhan Magdy. July 2014
Sources Map:Aerial Picture: 2013 Google Earth; Refined Water and Sewage Network: 2013, General Authority Physical Planning; Admin border: Wagih, A. 1995; Land use: 2010 Land Info Worldwide Mapping, LLCSources Data: CAPMAS 2010/2011(diagram based on Cairo Governorate data – Giza Governorate not included)
Water Purification Stations
Sewage network
Sewage Lifting Stations
Water Treatment Plants
River
Residential
Industry & Commercial
Urbanised Area
Informal Area

maps
african Economic Outlook © afDB, OECD, UNDp 2016
Map 8.3. Recent and projected urban expansion of Hawassa (Ethiopia), 1989-2010, 1989-2040
Source: New York University (2016), prepared for this edition of the African Economic Outlook, Ethiopia Urban Expansion Initiative, New York.

OECD PUBLISHING, 2, rue André-Pascal, 75775 PARIS CEDEX 16
(41 2016 07 1 P) ISBN 978-92-64-25646-0 – 2016
African Economic Outlook 2016SUSTAINABLE CITIES AND STRUCTURAL TRANSFORMATION
The African Economic Outlook 2016 presents the continent’s current state of affairs and forecasts its situation for the coming two years. This annual report examines Africa’s performance in crucial areas: macroeconomics, financing, trade policies and regional integration, human development, and governance. For its 15th edition, the African Economic Outlook takes a hard look at urbanisation and structural transformation in Africa and proposes practical steps to foster sustainable cities.
A section of country notes summarises recent economic growth, forecasts gross domestic product for 2016 and 2017, and highlights the main policy issues facing each of the 54 African countries. A statistical annex compares country-specific economic, social and political variables.
Contents
Part I: Africa’s performance and prospects
Chapter 1: Africa’s macroeconomic prospects
Chapter 2: External financial flows and tax revenues for Africa
Chapter 3: Trade policies and regional integration in Africa
Chapter 4: Human development in Africa
Chapter 5: Political and economic governance in Africa
Part II: Sustainable cities and structural transformation
Chapter 6: The implications of Africa’s urbanisation for structural transformation
Chapter 7: How sustainable cities can contribute to Africa’s development
Chapter 8: National urban strategies for sustainable cities in Africa
Part III: Country notes
Statistical annex
Full-length country notes are available on www.africaneconomicoutlook.org/en/countries.
ISBN 978-92-64-25646-0412016071P1
ÉCOLE