afrl-ml-wp-tr-2006-4139 · laser surface preparation for adhesive bonding ii ......
TRANSCRIPT

AFRL-ML-WP-TR-2006-4139 LASER SURFACE PREPARATION FOR ADHESIVE BONDING II Task Order 5TS5703D035S Craig T. Walters Craig Walters Associates 6145 Scherers Place, Suite F Dublin, OH 43016 DECEMBER 2004 Final Report for 01 June 2003 – 31 December 2004
Approved for public release; distribution is unlimited.
STINFO COPY
MATERIALS AND MANUFACTURING DIRECTORATE AIR FORCE RESEARCH LABORATORY AIR FORCE MATERIEL COMMAND WRIGHT-PATTERSON AIR FORCE BASE, OH 45433-7750

NOTICE
Using Government drawings, specifications, or other data included in this document for any purpose other than Government procurement does not in any way obligate the U.S. Government. The fact that the Government formulated or supplied the drawings, specifications, or other data does not license the holder or any other person or corporation; or convey any rights or permission to manufacture, use, or sell any patented invention that may relate to them. This report was cleared for public release by the Air Force Research Laboratory Wright Site (AFRL/WS) Public Affairs Office (PAO) and is releasable to the National Technical Information Service (NTIS). It will be available to the general public, including foreign nationals. PAO Case Number: AFRL/WS 06-1132, 01 May 2006. THIS TECHNICAL REPORT IS APPROVED FOR PUBLICATION. //Signature// //Signature// ______________________________________ __________________________________ THOMAS A. NAGUY EDWARD E. HERMES Project Engineer/Team Lead Chief Acquisition Systems Support Branch Acquisition Systems Support Branch Systems Support Division Systems Support Division //Signature// ______________________________________ GARY A. KEPPLE Deputy Division Chief Systems Support Division Materials and Manufacturing Directorate This report is published in the interest of scientific and technical information exchange and its publication does not constitute the Government’s approval or disapproval of its ideas or findings.

i
REPORT DOCUMENTATION PAGE Form Approved OMB No. 0704-0188
The public reporting burden for this collection of information is estimated to average 1 hour per response, including the time for reviewing instructions, searching existing data sources, searching existing data sources, gathering and maintaining the data needed, and completing and reviewing the collection of information. Send comments regarding this burden estimate or any other aspect of this collection of information, including suggestions for reducing this burden, to Department of Defense, Washington Headquarters Services, Directorate for Information Operations and Reports (0704-0188), 1215 Jefferson Davis Highway, Suite 1204, Arlington, VA 22202-4302. Respondents should be aware that notwithstanding any other provision of law, no person shall be subject to any penalty for failing to comply with a collection of information if it does not display a currently valid OMB control number. PLEASE DO NOT RETURN YOUR FORM TO THE ABOVE ADDRESS.
1. REPORT DATE (DD-MM-YY) 2. REPORT TYPE 3. DATES COVERED (From - To)
December 2004 Final 06/01/2003 – 12/31/2004 5a. CONTRACT NUMBER
GS-23-F-0061L 5b. GRANT NUMBER
4. TITLE AND SUBTITLE
LASER SURFACE PREPARATION FOR ADHESIVE BONDING II Task Order 5TS5703D035S
5c. PROGRAM ELEMENT NUMBER 63859F
5d. PROJECT NUMBER
4852 5e. TASK NUMBER
00
6. AUTHOR(S)
Craig T. Walters
5f. WORK UNIT NUMBER
FJ 7. PERFORMING ORGANIZATION NAME(S) AND ADDRESS(ES) 8. PERFORMING ORGANIZATION
REPORT NUMBER
Craig Walters Associates 6145 Scherers Place, Suite F Dublin, OH 43016
9. SPONSORING/MONITORING AGENCY NAME(S) AND ADDRESS(ES) 10. SPONSORING/MONITORING AGENCY ACRONYM(S)
AFRL-ML-WP Materials and Manufacturing Directorate Air Force Research Laboratory Air Force Materiel Command Wright-Patterson AFB, OH 45433-7750
11. SPONSORING/MONITORING AGENCY REPORT NUMBER(S)
AFRL-ML-WP-TR-2006-4139 12. DISTRIBUTION/AVAILABILITY STATEMENT
Approved for public release; distribution is unlimited. 13. SUPPLEMENTARY NOTES
Report contains color. PAO Case Number: AFRL/WS 06-1132, 01 May 2006.
14. ABSTRACT (Maximum 200 words) For several years, research has been undertaken for the U.S. Air Force to assess the utility of pulsed laser beams in the cleaning of surfaces without the use of solvents or abrasives. Initial efforts led to the development of a prototype laser-based cleaning system that could effectively remove paint, contaminants, and oxides from metal surfaces such as aluminum, stainless steel, and titanium. In follow-on research, the basic laser cleaning concepts were applied to the development of a more powerful and user-friendly Advanced Laser Cleaner Prototype. This advanced prototype was then employed in a program to investigate the feasibility of using pulsed laser cleaning as part of a prebond treatment process for aluminum surfaces. The results of the latter program clearly showed that compact laser systems employing flexible fiber optic beam transport to a handheld beam delivery tool can successfully pretreat aluminum surfaces prior to their preparation for adhesive bonding by means of a sol-gel process. In bond durability tests, the laser-pretreated surfaces generally performed as well as standard solvent wipe/grit blast pretreatment techniques.
15. SUBJECT TERMS laser cleaning; paint stripping; aluminum alloy surfaces; adhesive bonding; surface pretreatment; laser pretreatment
16. SECURITY CLASSIFICATION OF: 19a. NAME OF RESPONSIBLE PERSON (Monitor) a. REPORT Unclassified
b. ABSTRACT Unclassified
c. THIS PAGE Unclassified
17. LIMITATION OF ABSTRACT:
SAR
18. NUMBER OF PAGES
74 Thomas A. Naguy 19b. TELEPHONE NUMBER (Include Area Code)
N/A Standard Form 298 (Rev. 8-98)
Prescribed by ANSI Std. Z39-18

iii
Table of Contents 1 Introduction............................................................................................................................. 1 2 Research Objectives................................................................................................................ 1 3 Characterization of Laser Paint Stripping Systems ................................................................ 2
3.1 Clean Laser System CL120Q......................................................................................... 3 3.1.1 Modifications to the CL120Q Handpiece.............................................................. 4 3.1.2 CL120Q Beam Power at the Work Surface .......................................................... 5 3.1.3 CL120Q Beam Transverse Scanning Capability................................................... 7 3.1.4 CL120Q Beam Irradiance Pattern at the Work Surface ........................................ 8
3.2 Quantel Laserblast 1000................................................................................................. 9 3.2.1 LB1000 Beam Power at the Work Surface ......................................................... 10 3.2.2 LB1000 Beam Irradiance Pattern at the Work Surface ....................................... 11
3.3 LaserLine LDF600-500................................................................................................ 13 3.3.1 LDF600-500 Beam Power at the Work Surface.................................................. 14 3.3.2 LDF600-500 Beam Irradiance Pattern at the Work Surface ............................... 14
4 Laser Beam Surface Interaction............................................................................................ 15 4.1 Surface Response to CL120Q Laser System ............................................................... 16 4.2 Surface Response to LB1000 Laser System ................................................................ 17 4.3 Surface Response to the LDF600-500 Laser System................................................... 17
5 Laser Pretreatment Test Methodology.................................................................................. 17 5.1 Laser Pretreatment with the CL120Q Laser System.................................................... 19
5.1.1 Automated Scanning of Adherends with the CL120Q........................................ 20 5.1.2 Manual Scanning of Adherends with the CL120Q ............................................. 22
5.2 Laser Pretreatment with the LB1000 Laser System..................................................... 25 5.3 Laser Pretreatment with the LDF600-500 Laser system.............................................. 27
6 Microscopy of Laser Pretreated Surfaces ............................................................................. 29 7 Adhesive Bond Performance Test Results............................................................................ 31
7.1 Mechanical Test Results for Pretreatment with the CL120Q Laser System................ 32 7.1.1 Baseline CL120Q Wedge Test Results (Crack Growth) ..................................... 32 7.1.2 Increased-Temperature Wedge Test Results for CL120Q Pretreatment ............. 34 7.1.3 Baseline CL120Q Wedge Test Results (Failure Mode) ...................................... 35 7.1.4 Baseline CL120Q Lap-Shear Strength Test Results ........................................... 37 7.1.5 Baseline CL120Q Peel Strength Test Results ..................................................... 37 7.1.6 CL120Q Wedge Test Results (Automatic versus Manual Scanning) ................. 39 7.1.7 CL120Q Wedge Test Results (EA 9696 Adhesive) ............................................ 40 7.1.8 CL120Q Wedge Test Results (Clad versus Unclad Aluminum)......................... 40 7.1.9 CL120Q Wedge Test Results (Chemical Surface Preparations) ......................... 41 7.1.10 CL120Q Wedge Test Results (Precured Primer Effects) .................................... 42 7.1.11 CL120Q Wedge Test Results (Manual Scan with Crossing Pattern).................. 44
7.2 Mechanical Test Results for Pretreatment with the LB1000 Laser System................. 45 7.2.1 LB1000 Wedge Test Results (Crack Growth)..................................................... 45 7.2.2 LB1000 Wedge Test Results (Failure Mode)...................................................... 45 7.2.3 Elevated Temperature Wedge Test Results for LB1000 Pretreatment................ 47 7.2.4 LB1000 Lap-Shear Strength Test Results ........................................................... 47 7.2.5 LB1000 Peel Strength Test Results..................................................................... 48
7.3 Mechanical Test Results for Pretreatment with the LDF600-500 Laser System......... 48 8 Conclusions and Recommendations ..................................................................................... 49 9 References............................................................................................................................. 51 Appendix A. Test Condition Summary ........................................................................................ 53

1
1 Introduction For several years, research has been undertaken for the US Air Force to assess the utility of pulsed laser beams in the cleaning of surfaces without the use of solvents or abrasives. Initial efforts led to the development of a prototype laser-based cleaning system that could effectively remove paint, contaminants, and oxides from metal surfaces such as aluminum, stainless steel, and titanium [1-6]. In follow-on research, the basic laser cleaning concepts were applied to the development of a more powerful and user-friendly Advanced Laser Cleaner Prototype [7,8]. This advanced prototype was then employed in a program to investigate the feasibility of using pulsed laser cleaning as part of a prebond treatment process for aluminum surfaces [9]. The results of the latter program clearly showed that compact laser systems employing flexible fiber optic beam transport to a handheld beam delivery tool can successfully pretreat aluminum surfaces prior to their preparation for adhesive bonding by means of a sol-gel process. In bond durability tests, the laser-pretreated surfaces generally performed as well as standard solvent wipe/grit blast pretreatment techniques. The laser cleaning system employed in the previous laser pretreatment research was a custom-built device with relatively low average power (about 6 W). The rate of area coverage is proportional to the laser average power, and it was estimated that more than ten times greater average power would be required for a practical bond surface pretreatment application in the field. Such an application might be a composite patch repair, where the metal area to be repaired might be on the order of 1000 cm2 or more. Laser systems having beam properties similar to the custom-built device used in the early pretreatment trials are emerging as candidates for small area paint stripping applications. These commercial laser systems have average power levels in the range of interest (50 to 500 W) and may be suited to dual-use application in aircraft maintenance operations (paint stripping and surface pretreatment for adhesive bonding). An investigation of the ability of commercial paint stripping laser systems available at the Air Force Research Laboratory (AFRL) to pretreat surfaces for adhesive bonding was conducted under this program.
2 Research Objectives The main objective of the research undertaken in this program was to:
• Experimentally measure the effectiveness of available commercial paint stripping laser systems in pretreating aluminum alloy surfaces for adhesive bonding
This objective was pursued by conducting a series of laser exposures of test coupons which were adhesively bonded after laser pretreatment of the surfaces. The test coupons were subjected to ASTM standard mechanical tests to measure bond durability (wedge test), lap shear strength, and peel strength. The research was a collaborative effort of Craig Walters Associates (CWA), Anteon Corporation, the Air Force Research Laboratory (AFRL) at Wright-Patterson Air Force Base (WPAFB), and the University of Dayton Research Institute (UDRI). Nine separate test series were conducted wherein the laser exposure parameters were varied in order to identify the best conditions for
2
achieving adhesive bond performance comparable to that of grit-blast pretreated surfaces. The results of each series of tests were used to select laser exposure conditions for subsequent tests. Variations in test conditions included laser type, pulse repetition rate, laser spot size, scan speeds, average power, substrate type, and adhesive type. The following sections summarize characteristics of the laser systems employed in the program, the laser pretreatment methodology, and the results of the mechanical testing
3 Characterization of Laser Paint Stripping Systems Four commercial laser systems were acquired by the Air Force for use in the evaluation of laser technology for paint removal from aircraft surfaces. Extensive study of coating removal from aerospace substrates using these lasers is being conducted under the Portable Handheld Laser Small Area Supplemental Coating Removal System (PLCRS) and Specialty Coatings Laser Removal System (SCLRS) programs. Three of these laser systems were available at AFRL (WPAFB) for use in the laser pretreatment studies reported herein. These lasers are:
• Clean Laser System Model CL120Q • Quantel Model Laserblast 1000 • LaserLine Model LDF600-500
The manufacturer’s listing of basic characteristics for these laser systems are summarized in Table 1. Table 1. Lasers available for pretreatment of surfaces for adhesive bonding
Property Quantel Laserblast 1000
Clean Laser CL120Q
LaserLine LDF600-500
Rated Average Power (W)
40 120 250
Laser Type Pulsed Nd:YAG, EO q-switched
Pulsed Nd:YAG, AO q-switched
CW diode laser stack (on/off pulse
option) Laser Wavelength
(nm) 1064 1064 808 or 940
(selectable) Pulse Width (ns) 9 120-290 (depending
on pulse rate) NA
Pulse Repetition Rate (Hz)
2, 6, 30, 60, 120 (selectable)
8,000 – 35,000 (adjustable)
NA
Beam Spot Size on Surface
2.9 mm x 2.9 mm to 5.2 mm x 5.2 mm
0.4 mm diameter 0.5 mm diameter
Throughout the program, the detailed characteristics of the beams produced by these laser systems were measured. A discussion of these characteristics is presented in the following subsections.

3
3.1 Clean Laser System CL120Q The CL120Q laser system is based on an arc-lamp pumped Nd:YAG laser with an acousto-optic modulator q-switch in the oscillator cavity. The output beam of the laser is launched into a fiber-optic cable with a 200 µm core which leads to a handheld tool for delivery of the beam to the surface to be cleaned or processed. The laser and thermal management system are housed in a relatively compact cart which may be rolled around and positioned for convenient use. The cart, fiber optic cable, and handpiece are shown in the photograph of Figure 1.
Figure 1. Photograph of Clean Laser CL120Q laser paint stripping system The acousto-optic modulator approach provides very high pulse repetition rates and relatively good operating efficiency, but pulse widths are limited to values greater than about 100 ns. In this approach, the arc-lamps pumping the gain medium are operated continuously and the q-switch turns on and off at high repetition rates. As the pulse repetition rate is changed, the laser beam pulse width and pulse energy change considerably. This is because the pulse width and pulse energy in a given pulse depend on how much time is available for the gain medium inversion to rebuild between pulses. This relationship is illustrated in the data of Figure 2 obtained from the manufacturer’s specification for the CL120Q. As noted in the figure, the pulse width increases from 120 to 290 ns and the pulse energy drops from 13 to 4 mJ as the pulse repetition rate increases from 8 kHz to 35 kHz. These changes have a dramatic effect on peak power in a pulse,

4
while the average power of the beam stays relatively constant. The peak power in a pulse is critical in determining the survivability of fiber optics transporting the beam to the handpiece and strongly affects the nature of the beam interaction with the material being processed.
0
50
100
150
200
250
300
350
0 5,000 10,000 15,000 20,000 25,000 30,000 35,000 40,000
Pulse Repetition Rate
Valu
e
0.0
2.0
4.0
6.0
8.0
10.0
12.0
14.0
Puls
e En
ergy
(mJ)
Pulse Width (ns)
Average Power (W)
Peak Power (kW)
Figure 2. Manufacturer’s data for the CL120Q beam parameters
3.1.1 Modifications to the CL120Q Handpiece The function of the handpiece is to take the expanding beam exiting the fiber optic and transform it optically into a useful beam at the surface of the workpiece. This is accomplished by optics which re-image the output face of the fiber core to a small spot on the work surface. An oscillating mirror driven by a galvanometer scans the beam transversely on the surface. The Clean Laser handpiece also employs a set of wheels to facilitate manual scanning in the forward and backward direction while maintaining a fixed distance of the handpiece from the surface. A simple modification of the handpiece was implemented to permit scanning of 6-inch wide surface pretreatment test coupons without having the wheels roll over cleaned areas. This modification consisted of inserting extension posts between the wheels and the current wheel mounting position on the handpiece. This modification was used in early hand scanning pretreatment tests with the CL120Q handpiece. In these tests, it was observed that the effectiveness of the pretreatment depended critically on the angle at which the handpiece was held by the operator because tilting of the handpiece produced out-of-focus elliptical beam spots on the work surface. While this effect would simply reduce the coverage rate in a paint stripping application, the lower surface fluence associated with the out-of-focus spots did not create the desired surface condition necessary for adhesive bond pretreatment. This problem was resolved with a further modification which introduced a third wheel behind

5
the handle to help the operator scan a surface while maintaining a constant angle between the handpiece and the work surface. This modification is shown in the photograph of Figure 3. In the photograph, the modified handpiece is resting on an aluminum plate with a 6-inch by 6-inch recessed area designed to hold test samples (adherends) to be surface processed.
Figure 3. Photograph of CL120Q handpiece modifications for adhesive bond pretreatment tests
3.1.2 CL120Q Beam Power at the Work Surface While the CL120Q system was specified as a 120 W laser system, the average power arriving at the work surface was less, as determined by power meter measurements. This may have been a result of losses in the fiber launch optics, the fiber faces, or the scanning and focusing optics. Before each test series employing the CL120Q, calibration measurements of average beam power out of the handpiece were performed using the geometry illustrated in the photograph of Figure 4. A Coherent Model LM-200-HTD power meter head with Field Master GS display unit was used for the measurement. In the photograph, the beam exits the handpiece and travels left to right into the aperture of the power meter head placed on the lab jack shown at the right. The sensing surface of the power head was placed beyond the focal plane of the handpiece optics to avoid damage of the sensing surface, and the scan width was adjusted to be less than the power meter aperture diameter.

6
The results of the output power calibration measurements taken over the course of the program are presented in Figure 5 (dates indicate when data sets were taken) . In the figure, the manufacturer’s data are presented as pink squares and the calibration data are given by the other symbols. The general trend of the calibration data with frequency is similar to that of the manufacturer’s data, however, the level of output power is considerably less (20 to 30 percent lower). The actual calibration data were used in reporting test results.
Figure 4. Photograph of power calibration arrangement for CL120Q handpiece

7
0
20
40
60
80
100
120
140
0 5 10 15 20 25 30 35 40
Pulse Repetition Rate (kHz)
Ave
rage
Pow
er M
easu
red
(W)
Cleanlaser CL120QPower Calibration with
New Window09-24-03
Coherent LM-200 HTD
Manufacturer's Data
10-15-03
11-19-03 1-20-04
3-4-044-28-04
10-6-04
11-3-04
Figure 5. Output power calibration data for CL120Q handpiece
3.1.3 CL120Q Beam Transverse Scanning Capability The speed of the transverse scan was also measured in the laser system characterization process. This speed is critical for the laser pretreatment application because it determines, in combination with the pulse repetition rate, the degree of overlap of successive pretreatment spots on the work surface. The speed of the scan was measured by placing the handpiece in a rigid fixture over a test work surface. The work surface was translated at a high, calibrated speed under the handpiece in a direction perpendicular to the transverse scan. The bidirectional transverse scan produced marks on the surface with clear measurable spacing between successive scans. This spacing divided by the work surface translation speed gave a direct measure of the scan period and, hence, the transverse scan frequency. Figure 6 presents results for several settings of the handpiece scan control dial. As noted in the figure, measured scan rates were considerably lower than those reported by the manufacturer. This is not unusual, because the actual scan rates in the intended coating removal application are not a critical factor in coating removal rates. The calibrated values of transverse scan frequency were used in setting test conditions in the pretreatment tests.

8
0
20
40
60
80
100
120
0 2 4 6 8 10 12
Scan Frequency Setting
Tran
sver
se S
can
Freq
uenc
y (H
z)
Cleanlaser CL120Q
Manufacturer's Data
3-4-04
4-28-04
10-6-04
Figure 6. Calibration results for transverse scan frequency of the CL120Q handpiece
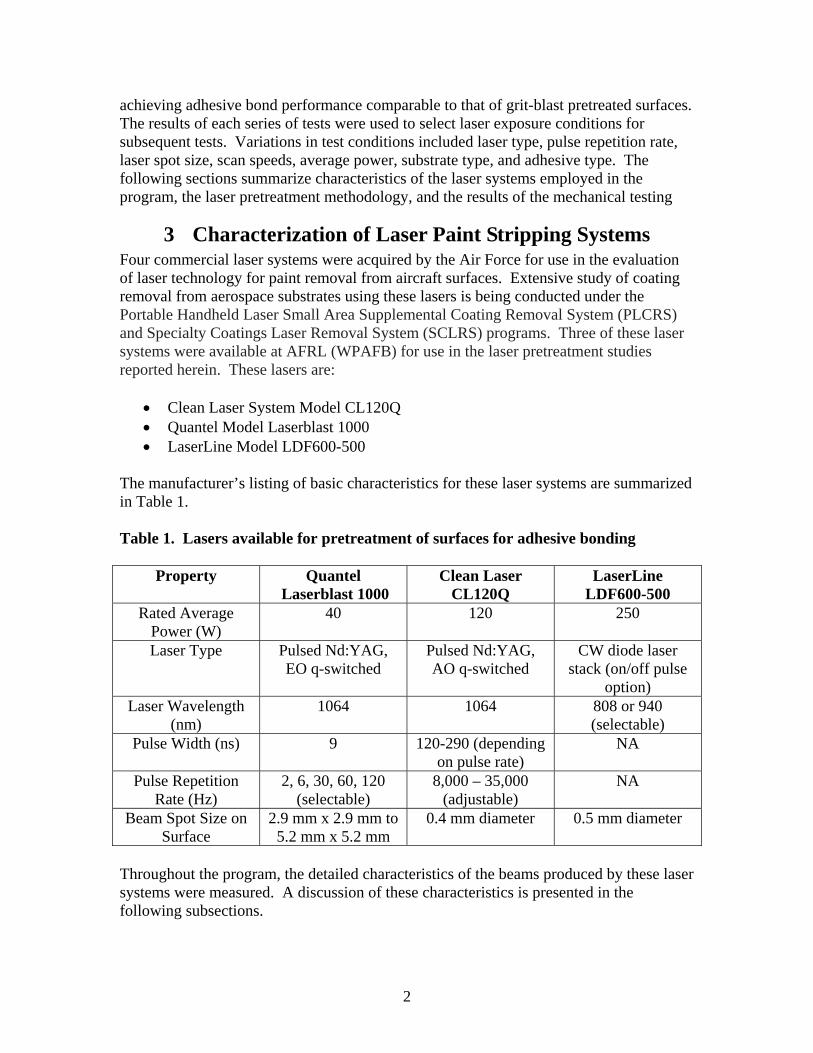
3.1.4 CL120Q Beam Irradiance Pattern at the Work Surface The CL120Q handpiece produces a flat-top circular beam spot irradiance pattern on the work surface when the work surface is at the image plane formed by the re-imaging of the circular output face of the fiber core. The diameter of this spot is critical to the laser pretreatment process for adhesive bonding because the process of texturizing the surface is sensitive to the pulse peak irradiance (pulse peak power density – W/cm2). This is not necessarily the case for paint stripping, which is tolerant to considerable variation in peak irradiance. The manufacturer’s data sheet indicates that the spot diameter on the work surface should be 0.4 mm. The actual spot size was measured to be as small as 0.25 to 0.30 mm for some positions of the work surface relative to the handpiece. The spot size was measured by translating an aluminum sample under the fixed handpiece at high speed as described above. The translation speed was selected to separate successive lateral scans of the surface made by the handpiece scanner. The sample was then viewed normally at high magnification with a charge-coupled device (CCD) camera. Figure 7 presents images of the surface of the aluminum plate obtained in this manner. Images of a precision scale were used to calibrate dimensions. The surface texturization caused by the individual laser pulses is seen in clearly defined circles which are displaced vertically in the image by the lateral scan of the handpiece. The image was acquired near the end of a lateral scan where the scan reversal leads to the overlap pattern seen. Surface roll marks are seen as vertical lines in the unprocessed areas between scan lines. In normal processing, the translation perpendicular to the lateral scan would be slow and all of the surface area would be processed.
9
Figure 7. Single pulse beam marks on aluminum surface (nominal laser parameters, pulse rate 10 kHz, transverse scan rate 46 Hz, scan width 33 mm)
3.2 Quantel Laserblast 1000 The Laserblast 1000 (LB1000) paint stripping system is based on a flashlamp-pumped Nd:YAG laser with an electro-optical q-switch. In this system, a single laser pulse is delivered for every flashlamp pulse. The maximum pulse repetition rate of 120 Hz is lower than that of the CL120Q laser, but the energy per pulse is greater (300 mJ versus 7 mJ for the CL120Q). The pulse width obtained by electro-optic q-switching is 9 ns, which is much narrower than the 120 to 290 ns obtained with the CL120. The higher peak power (30 MW versus 60 to 140 kW) requires breaking the beam into multiple beamlets for launching into multiple fibers to avoid fiber damage. The higher peak power also means the same work surface irradiance may be achieved with a larger beam spot on the surface. These features are evident in the LB1000 design. Figure 8 presents a view of the system cabinet on the left and the beam delivery handpiece on the right. The cabinet contains the power supply, laser module, beam splitters, and fiber launch optics. Not shown is the chiller, which occupies a second cabinet similar in size to the laser cabinet. An umbilical cable contains four fibers to deliver the beams to the handpiece. The handpiece employs a kaleidoscope beam integrator (glass prism) to bring the output beams from each fiber together into a square pattern. The output of the integrator is re-imaged to the work surface with zoom optics that provide a square surface irradiance pattern adjustable in the range of 2.9 mm x 2.9 mm to 5.2 mm x 5.2 mm. The working distance from the handpiece to the surface for these patterns ranges from 80 to 120 mm, respectively. The handpiece has no mechanism for maintaining a constant working distance, no scanning device, and no means for evacuating effluent from the work surface. The plastic hose adapter seen at the right of
300 µm300 µm300 µm

10
Figure 8 was added by AFRL contractors to facilitate effluent removal in paint stripping activities. The basic design of the handpiece is consistent with the original application for the LB1000, which was cleaning of statuary and other objects where rapid stripping of paint from a flat surface was not an objective.
Figure 8. Laserblast 1000 paint stripping system (chiller not shown)
3.2.1 LB1000 Beam Power at the Work Surface The LB1000 laser system is specified as having an average output beam power of 40 W, nominally 0.33 J at 120 Hz pulse repetition rate with all four fibers active. Measurements were conducted to calibrate the output power delivered by the handpiece for various system parameter settings. A Scientech Model 380401 4-inch absorbing plate calorimeter was used for the measurement with a Scientech Model S310 digital display module operating in power meter mode. The absorbing plate surface was placed well beyond the beam image plane to avoid damage to the plate surface. Figure 9 presents a photograph of the physical arrangement for all calibrations of the LB1000.

11
Figure 9. Photograph of arrangement for output power calibration of LB1000 Results of the LB1000 calibrations conducted throughout the program are given in Figure 10 for two pulse repetition rates. At a power setting of 20 W, the output of the handpiece was measured to be in the 20 to 25 W range for a pulse repetition rate of 120 Hz, depending on the age of the flashlamp. As the power settings were increased to 40 W, however, the actual output measured by the power meter increased slowly and produced a maximum power only in the 26 to 29 W range for 120 Hz pulse repetition rate. The failure to meet the manufacturer’s specifications in this power setting range is not understood. It is possible that the fiber launch optics are sensitive to power level and the fiber capture efficiency is lower at high power settings. Actual power calibration values for average power out of the handpiece were used in reporting the data herein rather than the power settings.
3.2.2 LB1000 Beam Irradiance Pattern at the Work Surface The LB1000 handpiece re-images a square irradiance pattern from the output of the square prism to the work surface. This pattern was recorded by the video imaging technique described above. Figure 11 presents an image recorded for a single pulse interaction with an aluminum plate for a nominal 3 mm x 3 mm pattern. If the individual beamlets for the four fibers were mixed thoroughly in the prism, the texturization of the aluminum surface would be very uniform. One corner of the pattern received more energy than the rest of the treated area as indicated in the figure and in other tests. This variation in irradiance is probably acceptable for paint stripping applications, but may not be ideal for surface pretreatment.

12
0
5
10
15
20
25
30
35
0 5 10 15 20 25 30 35 40 45
Power Setting (W)
Ave
rage
Pow
er M
easu
red
(W)
120 Hz
60 Hz
Laserblast 1000Power Calibration
4 Fibers ActiveScientech 380401
09-24-03
10-15-03After Lamp Change
3-3-04
6-9-04
Figure 10. Results of LB1000 calibrations of average output power
Figure 11. Single pulse beam mark on aluminum surface (nominal laser parameters: pulse rate 120 Hz, average power 28 W, spot dimension 3 mm x 3 mm)
3.0 mm3.0 mm3.0 mm

13
3.3 LaserLine LDF600-500 The LaserLine Model LDF600-500 is a continuous diode laser system that was designed primarily for laser marking applications. The laser module consists of two diode laser stacks (808 and 940 nm wavelength), either one of which may be focused into a single 600-µm diameter core beam transport fiber. The maximum output power from either diode stack is 250 W. The efficiency of the laser diode approach leads to a very compact package for a laser with this output power capability. The laser device and fiber launching optics are housed in a small box as shown on the left in the photograph of Figure 12. The control electronics, power supply, and chiller are built into a small rack cabinet as shown on the right in the figure.
Figure 12. LDF600-500 laser module (left) and power supply/controller cabinet (right) There is no handpiece for this laser, but there is a bench-mounted two-dimensional scan head (designated a DioScan unit by the manufacturer) which would normally be used for forming vector graphic characters on a surface to be marked. For paint stripping and adhesive bonding surface pretreatment applications, this scanner was programmed to provide a simple raster scan of a rectangular area to be treated. The scanner employs two galvanometer driven mirrors and an 80-mm focal length f-theta lens to re-image the output face of the fiber core to the work surface with a flat image plane over a 45-mm x 45-mm square area. The dimensions of the scan and scan rate were selectable through the computer control system. A photograph of the scan head is shown in Figure 13. In the photograph, the beam delivery fiber enters the head from the left and the beam exits the head downward.

14
Figure 13. Diode laser system two-dimensional scanner (DioScan unit)
3.3.1 LDF600-500 Beam Power at the Work Surface The LDF600-500 is a continuous laser capable of 250 W output at either diode wavelength (808 or 940 nm). There is a pulsing capability for the system, however this employs a modulation technique which does not increase the peak power and, therefore, it was not used in the tests. The output beam power is continuously adjustable by setting a computer control parameter. The output power was calibrated using the Coherent Model LM-200-HTD power meter head with Field Master GS display unit in an arrangement similar to that shown in Figure 4. In this case, the power meter head was positioned on the optical table under the DioScan unit and the scanner was set to scan an area that fit within the power meter aperture. The results of the calibration are presented in Figure 14. As noted in the figure, the calibration values are about 20 percent below the manufacturer’s specification.
3.3.2 LDF600-500 Beam Irradiance Pattern at the Work Surface The beam power density at the work surface for the LDF600-500 was insufficient to mark aluminum when the beam was scanned at practical rates. Exposed photographic paper was used as a burn impression material to measure laser beam spot diameter. The diameter, 0.50 mm ± 0.05 mm, agreed with the manufacturer’s data.

15
0
50
100
150
200
250
300
0 20 40 60 80 100 120
Power Setting (percent of full power)
Ave
rage
Pow
er M
easu
red
(W)
Laserline LDF600-500Power Calibration with Coherent LM-200 HTD
Manufacturer's Specification
11-20-03
Figure 14. Results of LDF600-500 calibrations of average output power
4 Laser Beam Surface Interaction Selection of the beam parameters for initial pretreatment tests under this program was based on prior research with the Advanced Laser Cleaning Prototype (ALCP)[9]. In the previous work, the laser pulses were formed with a Nd:YAG laser having an electro-optic q-switch similar to that in the LB1000 device. The pulse width for the ALCP was 15 ns and the total energy per pulse was 0.55 J delivered via three optical fibers. The pulse repetition rate for the ALCP was 12 Hz and the average power was 6.6 W. Good pretreatment results were achieved on 2024-T3 aluminum in the previous work with single pulse fluences in the 2.0-2.5 J/cm2 per pulse range with spatial overlap of pulse irradiance areas sufficient to produce an average fluence in the 15-20 J/cm2 range for a single pass over the area of interest. The detailed mechanisms of surface pretreatment are not yet well understood, however, in prior research it was clear that, for a bare aluminum surface, short pulses (15 ns) with fluence greater than 2 J/cm2 per pulse removed oxides and organic contaminants and left the surface with a matte finish appearance. Microscopic examination revealed that the surface topography had changed due to the rapid laser heating and local melting. This local roughening of the surface, referred to as texturizing, provides more surface area for adhesive bonding. Figure 15 presents estimates of the thermal response of 2024-T3 aluminum alloy to single laser pulses. It is assumed that texturizing a surface entails bringing the surface temperature to a point near or above the alloy melt range (502-638°C for 2024-T3) to cause ejection of material. The process is probably complex and involves blowoff of oxides, loosely attached metal flakes, contaminants, adsorbed gases, alloying constituents, etc. The blue line in Figure 15 shows the estimated fluence per

16
pulse required to achieve a temperature rise of 660°C with a single laser pulse versus the pulse width. The fluence is assumed to be constant over the spot area. The estimates are consistent with the previous pretreatment results with the ALCP where it was found that a fluence of about 2 J/cm2 was required to texturize the aluminum surface.
1.E-01
1.E+00
1.E+01
1.E+02
1.E+03
1.E-09 1.E-08 1.E-07 1.E-06 1.E-05 1.E-04
Laser Pulse Width (s)
Sing
le P
ulse
Flu
ence
for 6
60 C
(J/c
m2 )
1.E-04
1.E-03
1.E-02
1.E-01
1.E+00
Sing
le P
ulse
The
rmal
Con
duct
ion
Dep
th (m
m)Aluminum 2024
Absorptance = 0.12Assumed Surface
Temperature Change = 660 C
Laserblast 1000
ALCP CL 120Q LDF600-500 (10 m/s)
Figure 15. Estimates of thermal response of 2024 Aluminum to laser pulses
4.1 Surface Response to CL120Q Laser System If it is assumed that the physical processes will be similar as pulse width is extended over a limited range, the estimate in Figure 15 suggests that about 5 J/cm2 would be required for texturizing aluminum with the CL120Q device (at the 120 ns pulse width setup condition). The pink line in Figure 15 shows how limited the heat affected zone is for these short pulses. For the ALCP, the characteristic thermal penetration depth is about 1 µm for a single pulse, whereas it is about 3 µm for the CL 120Q. Cumulative heating from multiple pulses will depend on the degree of overlap of successive pulse irradiance areas as the beam is scanned over the surface and the pulse repetition rate. Since the pulses will be separated by time intervals much greater than the pulse width, these estimates of heat affected zone should be fairly accurate. The effect of the surface “skin” heating on mechanical properties of the substrate is not known for the laser parameters considered in this program, but preliminary results from mechanical testing of substrates in the paint stripping program suggest that there is no significant effect. Based on the estimates of Figure 15, it was anticipated that good texturization for adhesive bonding would be achieved with the CL120Q system using single pulse fluences and total fluences that were about twice those employed in the early studies with

17
the ALCP. Thus, CL120Q laser parameters were selected to produce about 5-10 J/cm2 (lowest pulse repetition rate) and scan parameters were selected to get total fluence levels greater than 40 J/cm2.
4.2 Surface Response to LB1000 Laser System The response of aluminum surfaces to laser pulses from the LB1000 laser was anticipated to be very similar to that studied with the ALCP because the pulse width produced by the LB1000 is 9 ns which is slightly less than that from the ALCP (15 ns). For this reason, the initial parameters for surface pretreatment using the LB1000 laser system were selected to be very similar to those used for the ALCP tests (2.0-2.5 J/cm2 per pulse and 15-20 J/cm2 total average fluence).
4.3 Surface Response to the LDF600-500 Laser System The LDF600-500 laser system is based on a continuous (CW) diode laser which produces a 0.5-mm diameter spot on the surface of the panel to be pretreated. The surface scan speed for the laser spot can be as high as 1000 cm/s based on the operating parameters of the DioScan unit. An effective temporal pulse width that a small area of the surface will receive as the beam sweeps over it can be estimated by dividing the spot size by this scan speed. If the spot diameter is 0.5 mm, then the effective temporal pulse width of the scanned spot is about 50 µs at 1000 cm/s. The surface irradiance at the 250 W power level is about 127 kW/cm2 for this spot size. For this irradiance, the incident fluence is about 6 J/cm2 for a single scan line. As shown in Figure 15, the fluence required to raise the surface temperature to 660°C in 50 µs is about 100 J/cm2. Thus the scanned spot at this surface speed will produce a transient surface temperature of only about 40°C above the substrate temperature. The heat affected zone for 50-µs effective pulse width is about 60 µm. It is clear from this calculation that the surface will not reach melt temperatures and cannot be texturized with these beam parameters. If the scan speed were reduced, melt might be produced, but the surface would not be appropriate (heavily oxidized and not texturized) and the melt depth would be unacceptable. For completeness, a few pretreatment tests were conducted with this laser. The laser may be used effectively for paint stripping, if high-speed, low-duty cycle scanning perpendicular to the lateral scan is used to minimize substrate heating.
5 Laser Pretreatment Test Methodology The research on laser pretreatment of surfaces for adhesive bonding was conducted in nine test series spread over the duration of the program at approximately one-month time intervals. This permitted evaluation of test results from one test series to be used in setting objectives and test parameters for the following test series. The laser pretreatments were carried out in a dedicated laser test facility operated by Anteon Corporation for the Air Force Research Laboratory at WPAFB. This facility housed all of the laser paint stripping systems used in the research. For each test series, the laser pretreatment of adherends was conducted over a two-day period. The adherends were of three types, specifically designed for three types of standard ASTM mechanical tests of bond quality:
1. Standard Test Method for Adhesive-Bonded Surface Durability of Aluminum (Wedge Test) ASTM D 3762 [10]

18
2. Standard Test Method for Apparent Shear Strength of Single-Lap-Joint Adhesively Bonded Metal Specimens by Tension Loading (Lap Shear Test) ASTM D 1002 [11]
3. Standard Test Method for Floating Roller Peel Resistance of Adhesives (Peel Test) ASTM D 3167 [12]
Chemical surface preparations were applied immediately after laser pretreatment of each adherend on-site in the laser facility. Bonding of the test panels was performed within 12 hours of laser pretreatment. The purpose of each of the test series is summarized in Table 2. Details of the pretreatment approach are discussed in the following subsections by laser system. Table 2. Objectives of laser pretreatment test series
Test Series
Dates Laser(s)* Objectives Panel Types**
LPT-1 10-15-03 10-16-03
CL120Q (M) LB1000 (A)
Acquire initial data on two laser systems with estimated process parameters
W, L, P
LPT-2 11-19-03 11-20-03
CL120Q (M) LDF600-500
Improve pretreatment with manual scan of CL120Q; acquire initial data with LDF600-500
W, L, P
LPT-3 01-20-04 01-21-04
CL120Q (A) CL120Q (M)
Acquire initial data with automatic scan of CL120Q; high fluence manual scan
W, L, P
LPT-4 03-03-04 03-04-04
CL120Q (A) LB1000 (A)
Strip paint and pretreat surface for bonding with one set of laser parameters
W, L, P
LPT-5 04-28-04 04-29-04
CL120Q (A) Vary laser parameters; vary substrate; prepare panels for high temperature wedge test; prepare microscopy samples
W, L, P
LPT-6 06-09-04 06-10-04
LB1000 (A) Vary laser parameters; vary substrate; prepare panels for high temperature wedge test; prepare microscopy samples
W, L, P
LPT-7 10-06-04 10-08-04
CL120Q (A) CL120Q (M)
Acquire data with manual scan of handpiece modified for tilt control; acquire automatic scan data with same beam parameters; test alternative adhesive
W
LPT-8 11-03-04 11-05-04
CL120Q (A) CL120Q (M)
Acquire data for clad aluminum substrate; vary chemical surface preparation (no sol-gel, no primer, no sol-gel or primer, pre-cure primer)
W
LPT-9 12-07-04 12-08-04
CL120Q (A) CL120Q (M)
Vary the manual scan pattern; Gather additional data on the pre-cured primer and pretreatment without sol-gel application
W
* M = manual scan; A = automatic scan ** W = wedge test; L = lap shear test; P = peel test

19
5.1 Laser Pretreatment with the CL120Q Laser System The CL120Q laser was used for laser pretreatment initially in the manual scan mode with limited success. The automated scan tests showed that the laser beam parameters could provide good pretreatment conditions and that manual scanning should work if more uniform scanning and complete surface coverage could be achieved. Good pretreatment conditions were eventually achieved with manual scanning after modification of the handpiece to provide tilt angle control. The evolution of beam parameters employed for the CL120Q tests are summarized in Table 3 and are given in complete detail in Appendix A. The overlap percentages reported were determined from the beam spot size, pulse repetition rate, and transverse and forward scan rates. In the Test Series LPT-7, -8, and -9, the beam parameters and overlap conditions were maintained the same for automatic and manual forward scanning (modified handpiece) to give a good basis for comparison of the two approaches. Table 3. CL120Q beam parameters employed in pretreatment tests LPT Test
Series
Test Condition*
Laser Aver. Power
(W)
Pulse Rep. Rate (kHz)
Pulse Fluence (J/cm2)
Trans-verse
Overlap (%)
Forward Overlap
(%)
Average Total
Fluence (J/cm2)
Cover-age Rate (cm2/s)
1 1-CL (M) 78 10 6.2 60 69 39 2.0 1 2-CL (M-2) 78 10 6.2 60 69 78 1.0 2 3-CL(M-2) 71 10 5.7 60 84 142 0.5 2 4-CL (M-4) 76 15 4.0 47 84 152 0.5 3 5-CL (A) 75 10 10.6 44 58 36 2.1 3 6-CL (A-2) 75 10 10.6 44 58 71 1.1 3 7-CL (A-2) 75 10 10.6 44 79 143 0.5 3 8-CL (M-4) 75 10 6.0 0 84 120 0.6 4 9-CL (A) 73 10 10.3 15 70 32 2.3 4 10-CL (A) 81 25 6.6 15 86 43 1.9 5 11-CL (A) 95 24 8.1 2.3 80 32 3.0 5 12-CL (A) 95 24 8.1 2.3 90 63 1.5 5 13-CL (A) 86 10 12.2 -1.6 89 81 1.1 7 14, 18-CL (A,M) 79 11 10.2 19 75 40 2.0 7 15, 19-CL (A,M) 79 11 10.2 19 83 58 1.4 7 16, 20-CL (A,M) 79 11 10.2 19 88 80 1.0 7 17, 21-CL (A,M) 79 11 10.2 19 90 102 0.8 8 22, 26-CL (A,M) 75 11 9.7 19 75 38 2.0 8 23, 27-CL (A,M) 75 11 9.7 19 83 55 1.4 8 24, 28-CL (A,M) 75 11 9.7 19 88 76 1.0 8 25, 29-CL (A,M) 75 11 9.7 19 90 97 0.8 9 30, 34-CL (A,M) 75 11 9.7 16 75 37 2.0 9 31, 35-CL (A,M) 75 11 9.7 16 83 53 1.4 9 32, 36-CL (A,M) 75 11 9.7 16 88 73 1.0 9 33, 37-CL (A,M) 75 11 9.7 16 90 94 0.8
* M-2 = two manual passes, M-4 = four manual passes, A-2 = two automatic passes

20
5.1.1 Automated Scanning of Adherends with the CL120Q Automated scanning tests entailed setup of a temporary frame to hold the CL120Q handpiece at a fixed position over the sample. The spacing between the handpiece and the adherend were adjusted to provide beam conditions on the surface obtained when the handpiece was held correctly for manual scanning with the wheels in place. The adherend sample was mounted on a translation stage which provided uniform translation of the sample under the laser beam. A second translation stage moved the sample to a new track after each scan. The test arrangement is shown in the photograph of Figure 16.
Figure 16. Fixturing of CL120Q handpiece for automatic scanning In the photograph, the lower translation stage, which moves left and right, provided forward scanning simulating operator-controlled motion. The scanner in the handpiece provided rapid scanning of the beam transverse to the forward scan direction. The width of the transverse scan was limited to 20 to 40 mm by the optics in the handpiece. In order to provide complete coverage of the bond area on the adherend, the second translation stage (mounted on the lower stage) moved the adherend by one track width after each pass of the lower stage. The use of automated scanning ensured complete coverage of the adherend, provided that sufficient overlap of the individual pulses was employed in the test. The transverse overlap was set by selection of the transverse scan speed at the surface to be less than the beam spot diameter divided by the time interval between pulses. The transverse overlap was generally in the 20 to 60 percent range except for a few test conditions. The forward
21
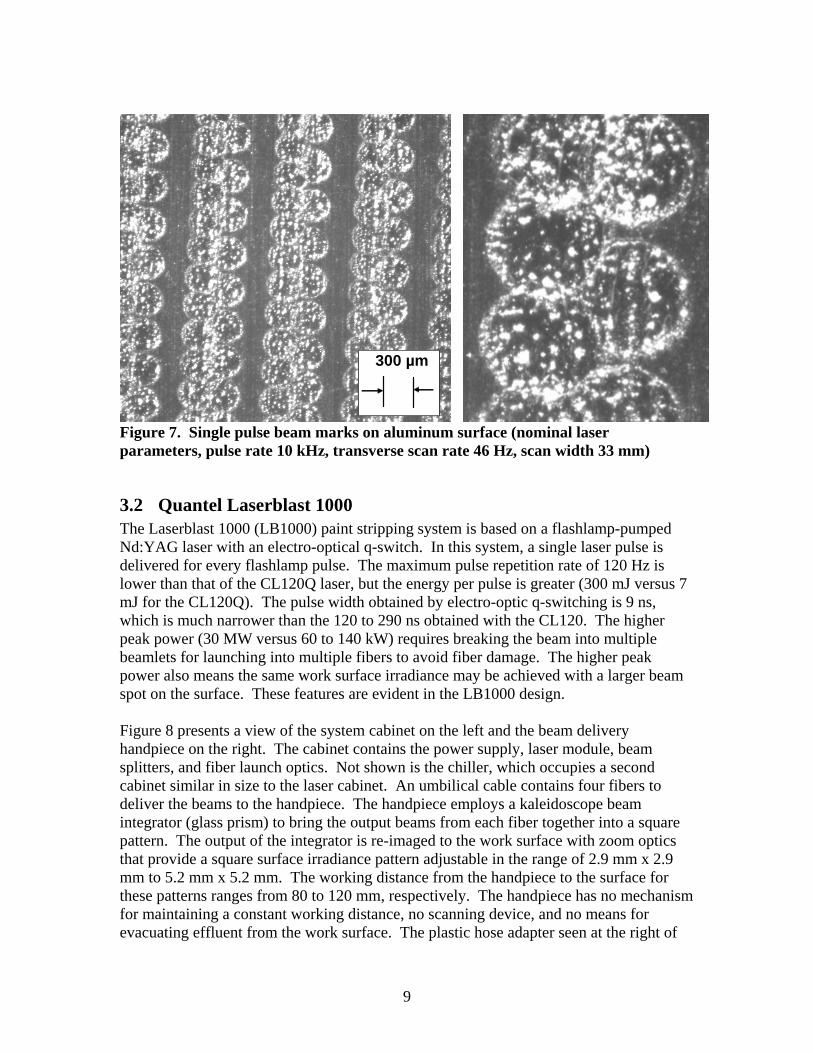
overlap was set by the translation rate of the lower stage. This overlap was the primary beam variable in the LPT-7, -8, and -9 test series and was in the range of 75 to 90 percent. A close-up view of typical processing of a wedge-test adherend with the automated scan system is shown in Figure 17. In the photograph, pretreatment is in progress on the third track of a wedge test adherend using Test Condition 11-CL in Test Series LPT-5. The track width for this case was 44 mm.
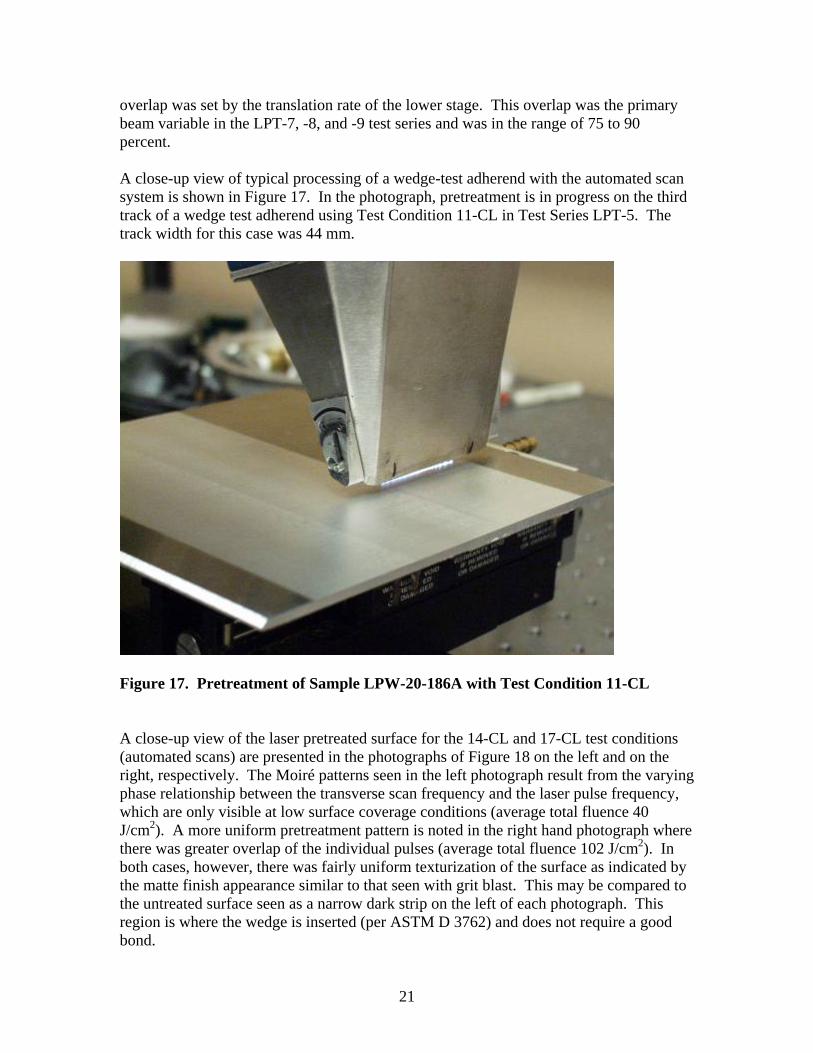
Figure 17. Pretreatment of Sample LPW-20-186A with Test Condition 11-CL A close-up view of the laser pretreated surface for the 14-CL and 17-CL test conditions (automated scans) are presented in the photographs of Figure 18 on the left and on the right, respectively. The Moiré patterns seen in the left photograph result from the varying phase relationship between the transverse scan frequency and the laser pulse frequency, which are only visible at low surface coverage conditions (average total fluence 40 J/cm2). A more uniform pretreatment pattern is noted in the right hand photograph where there was greater overlap of the individual pulses (average total fluence 102 J/cm2). In both cases, however, there was fairly uniform texturization of the surface as indicated by the matte finish appearance similar to that seen with grit blast. This may be compared to the untreated surface seen as a narrow dark strip on the left of each photograph. This region is where the wedge is inserted (per ASTM D 3762) and does not require a good bond.
22
Figure 18. Surface appearance of wedge adherends processed with automated scanning using Test Condition 14-CL (left, 40 J/cm2 average total fluence) and with Test Condition 17-CL (right, 102 J/cm2 average total fluence)
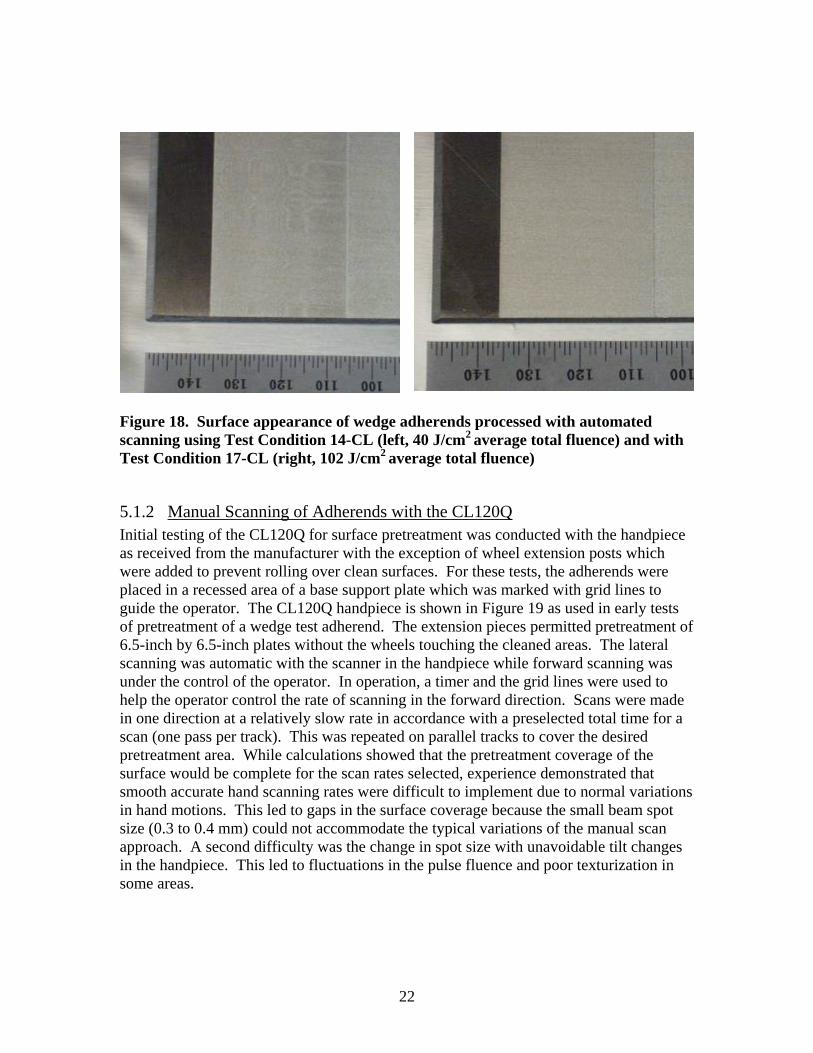
5.1.2 Manual Scanning of Adherends with the CL120Q Initial testing of the CL120Q for surface pretreatment was conducted with the handpiece as received from the manufacturer with the exception of wheel extension posts which were added to prevent rolling over clean surfaces. For these tests, the adherends were placed in a recessed area of a base support plate which was marked with grid lines to guide the operator. The CL120Q handpiece is shown in Figure 19 as used in early tests of pretreatment of a wedge test adherend. The extension pieces permitted pretreatment of 6.5-inch by 6.5-inch plates without the wheels touching the cleaned areas. The lateral scanning was automatic with the scanner in the handpiece while forward scanning was under the control of the operator. In operation, a timer and the grid lines were used to help the operator control the rate of scanning in the forward direction. Scans were made in one direction at a relatively slow rate in accordance with a preselected total time for a scan (one pass per track). This was repeated on parallel tracks to cover the desired pretreatment area. While calculations showed that the pretreatment coverage of the surface would be complete for the scan rates selected, experience demonstrated that smooth accurate hand scanning rates were difficult to implement due to normal variations in hand motions. This led to gaps in the surface coverage because the small beam spot size (0.3 to 0.4 mm) could not accommodate the typical variations of the manual scan approach. A second difficulty was the change in spot size with unavoidable tilt changes in the handpiece. This led to fluctuations in the pulse fluence and poor texturization in some areas.

23
Figure 19. Test arrangement for early pretreatment trials with the CL120Q handpiece under manual control After several test series with the automated scan system as described in the previous subsection, additional manual scan tests were undertaken. A manual scan system would be simpler and easier to use in field applications, if reliable pretreatment could be achieved. The handpiece was modified to provide positive tilt angle control by adding a third wheel attached to an extension piece on the handle. A photograph of the modified handpiece is shown in Figure 3 and in the inset of Figure 20. The third wheel, in combination with the two outrigger wheels, allowed the handpiece to be moved smoothly over the work surface with constant working distance and tilt angle. These modifications led to very constant laser beam diameters on the work surface and made scanning of the surface more comfortable for the operator. An additional change in the scanning approach was to let the operator scan the surface at more easily controlled forward and backward speeds and move the handpiece laterally at will to achieve coverage of the adherend surface. The operator was instructed to cover the entire surface relatively quickly and continue to scan with visual feedback employed to cover any bare (untreated) spots that were observed. A natural forward scan speed turned out to be about ten times that used in the automatic scans which were designed to obtain complete coverage in one pass. Multiple fast passes were made manually, and the fractional coverage of the surface increased with time due to the statistical nature of the random scanning process. In order to have some basis for comparison of the automated and hand scan methods, a total time limit was placed on the operator to process the 6.5-inch by 6.5-inch plate. Four time limits were set to produce the same average total fluence conditions produced by the four automated scan conditions in LPT-7. The total

24
time limits for Test Conditions 18-CL through 21-CL were 129, 188, 258, and 330 s, respectively. It was not anticipated that the shortest time would produce complete coverage because of the irregularity of the manual scan process, however, at some total time value, substantially complete coverage would be expected by statistics. The appearance of the adherend at the beginning of a manual scan with the modified handpiece is shown in Figure 20.
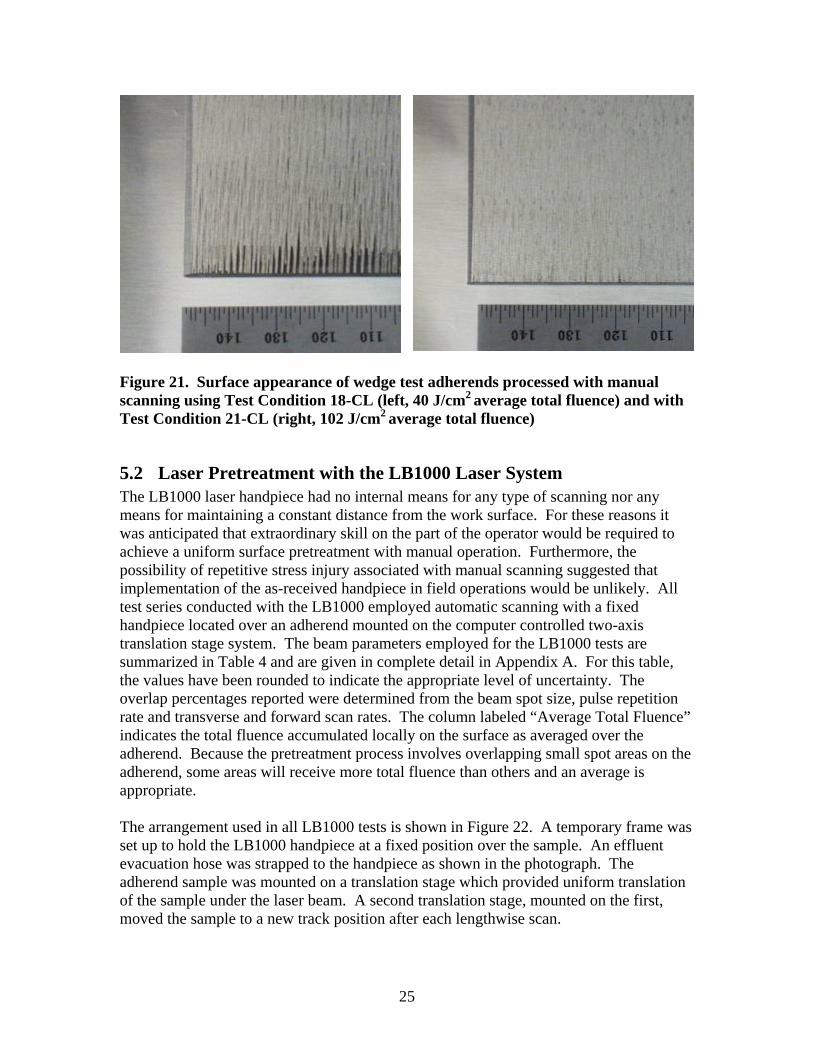
Figure 20. Initial passes in manual scanning of the modified CL120Q handpiece using Test Condition 19-CL (inset shows third wheel for controlling tilt angle) The surface appearance of the manually scanned wedge test adherends obtained with the modified handpiece is shown in the photographs of Figure 21. For Test Condition 18-CL, the coverage was not complete as shown in the left-hand image of the figure, which shows a close-up view of the surface near an edge. Discounting the edge effect, the coverage appears to be greater than about 90 percent. For the longest processing time (Test Condition 21-CL, 330 s), the coverage appears to be complete and fairly uniform as seen in the right-hand image of Figure 21. For all of the manual scan pretreatments employed up through Test Series LPT-8, the scan direction was maintained in one direction for a given set of adherends for a bonded panel. A possible improvement was employed in LPT-9 wherein the forward manual scan direction was along one axis for the first half of the pretreatment period and along an axis perpendicular to the first axis for the second half of the pretreatment period.
25
Figure 21. Surface appearance of wedge test adherends processed with manual scanning using Test Condition 18-CL (left, 40 J/cm2 average total fluence) and with Test Condition 21-CL (right, 102 J/cm2 average total fluence)
5.2 Laser Pretreatment with the LB1000 Laser System The LB1000 laser handpiece had no internal means for any type of scanning nor any means for maintaining a constant distance from the work surface. For these reasons it was anticipated that extraordinary skill on the part of the operator would be required to achieve a uniform surface pretreatment with manual operation. Furthermore, the possibility of repetitive stress injury associated with manual scanning suggested that implementation of the as-received handpiece in field operations would be unlikely. All test series conducted with the LB1000 employed automatic scanning with a fixed handpiece located over an adherend mounted on the computer controlled two-axis translation stage system. The beam parameters employed for the LB1000 tests are summarized in Table 4 and are given in complete detail in Appendix A. For this table, the values have been rounded to indicate the appropriate level of uncertainty. The overlap percentages reported were determined from the beam spot size, pulse repetition rate and transverse and forward scan rates. The column labeled “Average Total Fluence” indicates the total fluence accumulated locally on the surface as averaged over the adherend. Because the pretreatment process involves overlapping small spot areas on the adherend, some areas will receive more total fluence than others and an average is appropriate. The arrangement used in all LB1000 tests is shown in Figure 22. A temporary frame was set up to hold the LB1000 handpiece at a fixed position over the sample. An effluent evacuation hose was strapped to the handpiece as shown in the photograph. The adherend sample was mounted on a translation stage which provided uniform translation of the sample under the laser beam. A second translation stage, mounted on the first, moved the sample to a new track position after each lengthwise scan.

26
Table 4. LB1000 beam parameters employed in pretreatment tests LPT Test
Series
Test Condition*
Laser Aver. Power
(W)
Pulse Rep. Rate (Hz)
Pulse Fluence (J/cm2)
Trans-verse
Overlap (%)
Forward Overlap
(%)
Average Total
Fluence (J/cm2)
Cover-age Rate (cm2/s)
1 1-LB (A) 25 120 2.4 81 45 22 1.2 1 2-LB (A) 29 120 2.7 81 45 26 1.2 4 3-LB(A) 28 120 2.6 81 45 25 1.2 4 4-LB (A) 28 120 1.9 89 53 36 0.80 6 5-LB (A) 15 60 2.6 72 45 18 0.83 6 6-LB (A) 28 120 2.5 81 45 24 1.2 6 7-LB (A) 28 120 2.5 81 69 42 0.66
* A = automatic scan
Figure 22. Fixturing of LB1000 handpiece for the LPT-6 Test Series The test conditions employed in the LPT-6 test series were designed to span the lower limits on total average fluence found in previous research to produce good pretreatment with short pulses. Test Condition 5-LB used an average total fluence of 17 J/cm2, which was on the low side of fluence levels found in the past to be suitable for pretreatment with the very short laser pulse (15 ns). The pulse repetition rate for this case was 60 Hz and the average power was 14 W. Coverage of the surface was good, however non-uniformity in the fluence distribution over the square exposure area led to some streaking in the final appearance of the pretreated surface. The left-hand image of Figure 23 presents a photograph of the surface after laser pretreatment of a wedge test adherend.

27
Test Condition 6-LB employed a 120 Hz pulse repetition rate which provided 27 W average power at the work surface. The scan rate was increased from 5 cm/s to 7 cm/s. These conditions produced an average total fluence on the surface of 23 J/cm2, which is believed to be well into the range of good pretreatment. Test Condition 7-LB employed the same beam conditions and transverse scan rates as were used for Test Condition 6-LB, however the spacing was reduced between tracks. The spacing was decreased to compensate for the beam non-uniformity. The resulting average total fluence was 41 J/cm2, which should provide a highly modified surface. The surface appearance after laser pretreatment with Test Condition 7-LB is shown in the right-hand image of Figure 23.
Figure 23. Surface appearance of wedge adherends processed with automated scanning using Test Condition 5-LB (left, 17 J/cm2 average total fluence) and with Test Condition 7-LB (right, 41 J/cm2 average total fluence)
5.3 Laser Pretreatment with the LDF600-500 Laser system As discussed previously, the LDF600-500 laser system employs a continuous diode laser with output beam power of about 200 W and a beam spot diameter on the work surface of 0.5 mm. The calculations of Section 4 indicated that the LDF600-500 beam would not texturize an aluminum surface and this was confirmed in the pretreatment tests. The best that might have been anticipated was a cleaning of the surface. The original plan was to scan the beam at the maximum transverse rate available with the DioScan unit (10 m/s). Absolutely no cleaning effect was observed at this speed, and, therefore, slower scan rates were employed in the pretreatment tests in an attempt to obtain higher transient surface temperatures. DioScan controlled surface scan speeds of 150 and 300 mm/s were employed in the tests which led to the beam parameters shown in Table 5 for the three test conditions. Some evidence of organic contaminant removal was observed at these speeds. Temperature peaks on the surface for the 150 mm/s scan speed were estimated at

28
about 280°C for transient times on the of order 3 ms and thermal conduction depths of 0.4 mm. These heating levels may be unacceptable from a substrate damage point of view. For this reason, only the wedge panels were pretreated with the LDF600-500. The faster scan (300 mm/s) was used to reduce substrate heating (Test Condition 3-DL) and was estimated to produce temperature peaks of about 200°C for 1.5 ms. Table 5. LDF600-500 beam parameters employed in pretreatment tests LPT Test
Series
Test Condition*
Laser Aver. Power
(W)
Effective Pulse Width (ms)
Effective Pulse
Fluence (J/cm2)
Trans-verse
Overlap (%)
Forward Overlap
(%)
Average Total
Fluence (J/cm2)
Cover-age Rate (cm2/s)
2 1-DL (A-2) 207 3.3 352 NA -52 362 0.6 2 2-DL (A-1) 207 3.3 352 NA 25 368 0.6 2 3-DL(A-2) 207 1.6 176 NA -50 184 1.1
* A-2 = two automatic passes; A-1 = one automatic pass The first two conditions were similar except that the forward scan rate (provided by the translation stage) in Test Condition 1-DL was twice that of Test Condition 2-DL. This left gaps in the treatment (“underlap”) in the forward scan direction for 1-DL tests. This was compensated by making two passes of the surface to fill in the gaps for the latter test condition. Two passes were also made for Test Condition 3-DL to fill gaps. Figure 24 presents a photograph of the setup for pretreatment of surfaces with the LDF600-500 direct diode laser system. The LDF600-500 does not have a handpiece, but employs an X-Y scan head which is placed in a fixed position over the workpiece. The scan head takes the output of the fiber and scans the beam in two dimensions with galvanometer mounted mirrors. The beam is imaged to a 0.5-mm diameter spot on the work surface with an 80-mm f-theta lens. The scan field on the surface may be made square with sides up to 45 mm wide. For the surface pretreatment of the test adherends (which were much larger than this square), a 1-mm by 45-mm rectangular scan pattern was used and the adherend was translated under the beam in a direction perpendicular to the long dimension of the beam scan. The translation stage speed and scan speed were selected to provide area coverage of a swath on the adherend that was 45-mm wide and up to 170 mm long. For pretreatment areas wider than 45 mm, the adherend was re-positioned on the translation stage. As noted in Figure 24, there was no texturizing effect for the LDF600-500 tests. The only indication of an effect was a slight amount of smoke where organic contaminants were encountered on the surface.

29
Figure 24. Arrangement for pretreatment of surfaces with the LDF600-500 laser system in LPT-2
6 Microscopy of Laser Pretreated Surfaces The details of the interaction of the laser beam with the surface in the laser pretreatment process are not yet well understood. Removal of contaminants and oxides is certainly important, however, the surface roughness is also believed to play some role in promoting adhesion. A limited study of the surface topology produced by the various laser beam conditions was undertaken. In the LPT-5 and LPT-6 test series, special coupons of 2024-T3 aluminum (3 inch x 0.25 inch x 0.063 inch) were pretreated using the automated scan setup. Pretreatments employed the 11-CL, 12-CL, and 13-CL test conditions in LPT-5 and the 5-LB, 6-LB, and 7-LB test conditions in LPT-6. The coupons were examined via scanning electron microscopy (SEM) at several magnifications. Figure 25 presents SEM images of the samples pretreated with the CL120Q laser system in the LPT-5 test series. In that series, variations of pulse repetition rate and average total fluence were investigated. Figure 25 (a) and (b) show the topography for the pulse rate of 24 kHz which produced a single pulse width of 210 ns and a single-pulse fluence at the surface of 8.1 J/cm2. These beam parameters combine to give a peak irradiance on the surface of 39 MW/cm2. Both images show evidence of surface melting, but the overall surface appearance is relatively smooth. Figure 25 (b) shows slightly more roughness

30
due to more overlap between transverse scans created by a slower longitudinal scan (average total fluence 63 J/cm2 versus 32 J/cm2). The image of Figure 25 (c) indicates considerably more roughness as might be expected for a shorter laser pulse. The 13-CL test condition employed a 10-kHz pulse repetition rate which produced 130-ns pulses with a single-pulse fluence at the surface of 12.2 J/cm2. These parameters combine to yield a surface peak irradiance of 94 MW/cm2, which is more than twice that used for the surfaces shown in Figure 25 (a) and (b). The rougher surface was believed to give better adhesion and, therefore, the 10-kHz setting (130-ns) was used for all of the CL120Q pretreatments in LPT-7,-8, and -9.
Figure 25. SEM images of 2024-T3 aluminum pretreated with the CL120Q laser system. Legends show single pulse characteristics. Average total fluences for the three surfaces (a, b, and c) were 32, 63, and 81 J/cm2, respectively.
Figure 26. SEM images of 2024-T3 aluminum pretreated with the LB1000 laser system. Legends show single pulse characteristics. Average total fluences for the three surfaces (a, b, and c) were 17, 23, and 41 J/cm2, respectively. Figure 26 presents a set of three SEM images for the coupons pretreated with the LB1000 laser system. In this case, the single-pulse beam parameters were the same and three levels of average total fluence were achieved by scanning at different rates. All three images exhibit similar features characteristic of the very short laser pulse (9 ns). The
50 µm
a. 11-CL (210 ns, 8.1 J/cm2) b. 12-CL (210 ns, 8.1 J/cm2) c. 13-CL (130 ns, 12.2 J/cm2)
50 µm
a. 5-LB (9 ns, 2.6 J/cm2) b. 6-LB (9 ns, 2.5 J/cm2) c. 7-LB (9 ns, 2.5 J/cm2)

31
peak irradiance for the LB1000 tests was 278 MW/cm2, which was three times the peak irradiance for the surface shown in Figure 25 (c). The scale of the roughness is very fine compared to that seen for the 210 and 130 ns pulses in Figure 25. Also seen in Figure 26 are pores which are believed to be created by explosive vaporization of alloying constituents or inclusions. The surface area available for adhesive bonding appears to be similar for all three LB1000 test conditions studied.
7 Adhesive Bond Performance Test Results An evaluation of the relative performance of adhesive bonds prepared using adherends having various laser pretreatments was conducted by mechanical tests of bonded panels. As discussed above, three types of standard mechanical tests were conducted: (1)Wedge Test (ASTM D 3762) [10], (2) Lap Shear Test (ASTM D 1002) [11], and (3) Peel Test (ASTM D 3167) [12]. Details on the methods employed in the performance of these tests are given in the summary report for the previous laser pretreatment research program [9]. Preparation of panels for testing for this program was identical except that a brush-on application of the primer was used in place of the spray-on method described in Reference 9. A summary of the preparation steps is given below.
1. Pretreat adherends with laser (2024-T3 or 7075-T6 aluminum) 2. Brush apply sol-gel adhesion promoter (AC-130) 3. After air dry, brush apply bond primer (Cytec Engineered Materials BR 6747-1) 4. After air dry, apply film adhesive (3M Company AF 163-2M or Loctite EA 9696) 5. Cure assembled panel in autoclave at 250°F under 35-40 psi (121°C under 0.24-
0.27 MPa) for 60 minutes 6. Cut fully cured panels into samples having dimensions appropriate to the test (5
samples per panel), in accordance with the standards. 7. Conduct tests according to the standards, unless otherwise stated.
Laser pretreatment was intended to perform the roles typically required of one or more conventional pretreatment steps. These roles include removal of contaminants and native oxide from the metal surface as well as imparting some amount of roughness or texture (physical morphology). The AC-130 sol-gel adhesion promoter applied to the pretreated surfaces prior to bonding was developed for AFRL by the Boeing Company and is commercially available from Advanced Chemistry & Technology (AC Tech) in Garden Grove, CA [13]. Grit-blasting is a conventional pretreatment step used to deoxidize and texturize metal prior to AC-130 application. Over the course of the program, 224 panels were prepared and tested. Results of these tests are discussed below.
32
7.1 Mechanical Test Results for Pretreatment with the CL120Q Laser System
Most of the initial laser pretreatment tests were devoted to exploration of the effects of beam parameter variation on bond performance. These tests employed the standard panel preparation steps outlined above after the laser pretreatment, and results are referred to as baseline test results. In the later part of the program, variations in adhesive type, sol-gel application, primer application, and primer curing were explored. The latter are referred to below as excursion test results.
7.1.1 Baseline CL120Q Wedge Test Results (Crack Growth) The wedge test can be used to assess bonded joint environmental durability and the relative performance of surface preparations. In the test, a wedge is inserted into one end of the specimen, loading it in Mode I and creating an initial crack in the bondline within the adhesive layer. The sample is then put in a conditioning environment, typically hot and wet, and the progress of the crack is measured at regular intervals. According to ASTM D 3762, the wedge test can be conducted using a variety of conditioning environments and can be run for different lengths of time. AFRL frequently conducts the test for 28 days at 120°F and 95-100% relative humidity. Surface preparations that perform well in this test have demonstrated good service performance [14]. The average total crack growth and failure modes of the opened specimens are relative measures of the anticipated long-term durability of the bond. The 28-day crack growth results for the 120°F (49°C) wedge test on aluminum coupons treated with the CL120Q laser device in the early part of the program are presented in Figure 27. Each data point is the average of five wedge test coupons cut from the same laser pretreated panel. The error bars indicate the standard deviation for the five coupons. The horizontal lines show results for grit-blast pretreated control coupons. Smaller crack growth values reflect relatively better environmental durability.

33
0.00
0.10
0.20
0.30
0.40
0.50
0.60
0.70
0.80
0.90
0 50 100 150 200
Average Total Fluence (J/cm2)
Cum
ulat
ive
Cra
ck G
row
th a
t 28
Day
s (in
)LPT-1LPT-2LPT-3LPT-4LPT-5
Grit Blast Controls
Wedge Tests at 120 F, 95 - 100% RHAl 2024-T3 (except as noted)
BR 6747-1 Primer, AF 163-2M Adhesive P = Painted
CL120Q Laser
P
PPP 7075
7075
PAA
Figure 27. Wedge test crack growth results for CL120Q pretreatment The data for manual scanning of the laser handpiece on coupons obtained in the early part of the program during the LPT-1 and LPT-2 test series (blue diamonds and pink squares) show unacceptably high crack growth except for one data point at 170 J/cm2 average total fluence. The reason for the poor performance is believed to result from several features of the handpiece. First, the laser spot is quite small (< 0.4 mm diameter) and this, in combination with irregular manual forward motion of the handpiece, leads to uncertain coverage of the surface area by the laser beam pretreatment. This is not a problem when the handpiece is used for paint stripping, because the operator can easily identify unstripped areas. Another difficulty with manual use of the as-received handpiece is maintenance of the angle of the handpiece with the work surface. Tilting the handpiece significantly changes the optical working distance which, in turn, changes the laser beam spot size on the coupon surface. The fact that one data point for the hand scanning gave good results suggested that the laser beam parameters were acceptable for laser pretreatment, if the mechanics of scanning could be managed more reliably. Starting with the LPT-3 test series, the handpiece was held in a fixture over the coupon which was translated under the handpiece with uniform speed on an automated translation stage to accomplish complete coverage of the surface. The LPT-3 wedge test results (light blue triangles in Figure 27) show good low crack-growth performance (comparable to that of the grit-blast controls) over a wide range of average total fluence. This confirmed the assertion that the laser parameters were suitable for laser pretreatment. In LPT-4, the adherends received a coating system prior to laser pretreatment. This system included a conversion coating (Henkel Surface Technologies

34
Alodine 1200S), MIL-PRF-23377H epoxy primer (Deft, Inc. 02-Y-40) at approximately 0.0007-inch thick and approximately 0.0018-inch of MIL-PRF-85285D polyurethane topcoat (Deft, Inc. 03-GY-321). In the tests, the coating system was laser stripped in one or two passes and then the clean surface was pretreated for bonding in one pass with the same test conditions. The data show that paint stripping followed by laser pretreatment achieved good crack-growth performance with the same uniform scanning technique and relatively low average total fluence for the pretreatment pass (purple circles in Figure 27). Finally, in LPT-5, good crack growth performance was obtained with both 2024 and 7075 aluminum alloys using uniform scanning. It is important to note that average total fluence is not the only critical parameter that determines the performance of the pretreatment in the wedge test. The data of LPT-4 and LPT-5 indicate that the individual pulse fluence is also an important factor in bond performance. With the exception of one of the 7075 aluminum data points, the data with crack growth greater than the grit-blast controls had a single-pulse fluence level of 7-8 J/cm2 (210 ns). The data points with the lower single-pulse fluence have a small flag to distinguish them from those with the higher single-pulse fluence (10-12 J/cm2, 130 ns). The results suggest that higher single-pulse fluences with shorter pulses may provide better texturization of the surface. This is in agreement with the SEM results presented in Figure 25.
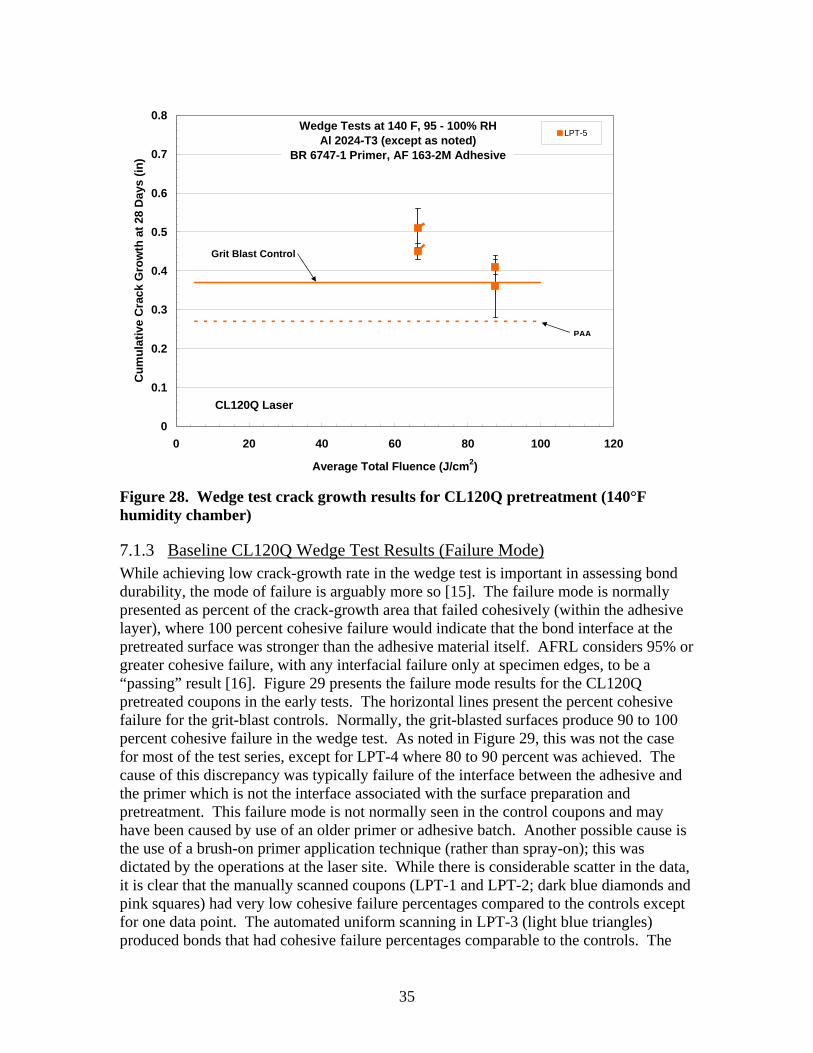
7.1.2 Increased-Temperature Wedge Test Results for CL120Q Pretreatment When evaluating surface preparations using state-of-the-art 250°F-curing modified epoxy adhesives, AFRL often conducts the wedge test at 140°F as well as 120°F since the former is a more severe test that discriminates bond durability performance between treatments that perform well at 120°F. Figure 28 presents the 28-day crack growth for four panels pretreated with the CL120Q laser system and aged at 140°F. As was the case for the standard 120°F wedge test, the short pulse pretreatment was more effective than the long pulse pretreatment (flagged symbols). These limited data suggest that CL120Q pretreatment can be as effective as grit blast in the more severe 140°F wedge test. The dashed line indicates the result for phosphoric acid anodize (PAA) surface preparation. This surface preparation is generally considered to be the premier prebond treatment for aluminum alloys, performs well in the 140°F wedge test, and has established a good in-service record [14, 15].
35
0
0.1
0.2
0.3
0.4
0.5
0.6
0.7
0.8
0 20 40 60 80 100 120
Average Total Fluence (J/cm2)
Cum
ulat
ive
Cra
ck G
row
th a
t 28
Day
s (in
)LPT-5
Grit Blast Control
Wedge Tests at 140 F, 95 - 100% RHAl 2024-T3 (except as noted)
BR 6747-1 Primer, AF 163-2M Adhesive
CL120Q Laser
PAA
Figure 28. Wedge test crack growth results for CL120Q pretreatment (140°F humidity chamber)
7.1.3 Baseline CL120Q Wedge Test Results (Failure Mode) While achieving low crack-growth rate in the wedge test is important in assessing bond durability, the mode of failure is arguably more so [15]. The failure mode is normally presented as percent of the crack-growth area that failed cohesively (within the adhesive layer), where 100 percent cohesive failure would indicate that the bond interface at the pretreated surface was stronger than the adhesive material itself. AFRL considers 95% or greater cohesive failure, with any interfacial failure only at specimen edges, to be a “passing” result [16]. Figure 29 presents the failure mode results for the CL120Q pretreated coupons in the early tests. The horizontal lines present the percent cohesive failure for the grit-blast controls. Normally, the grit-blasted surfaces produce 90 to 100 percent cohesive failure in the wedge test. As noted in Figure 29, this was not the case for most of the test series, except for LPT-4 where 80 to 90 percent was achieved. The cause of this discrepancy was typically failure of the interface between the adhesive and the primer which is not the interface associated with the surface preparation and pretreatment. This failure mode is not normally seen in the control coupons and may have been caused by use of an older primer or adhesive batch. Another possible cause is the use of a brush-on primer application technique (rather than spray-on); this was dictated by the operations at the laser site. While there is considerable scatter in the data, it is clear that the manually scanned coupons (LPT-1 and LPT-2; dark blue diamonds and pink squares) had very low cohesive failure percentages compared to the controls except for one data point. The automated uniform scanning in LPT-3 (light blue triangles) produced bonds that had cohesive failure percentages comparable to the controls. The

36
painted coupons treated in LPT-4 (purple circles) appear to have low percentages of cohesive failure, however most of those failures were at the adhesive-primer interface. Similar adhesive-primer interface failures were seen in LPT-5.
0
10
20
30
40
50
60
70
80
90
100
0 50 100 150 200
Average Total Fluence (J/cm2)
Perc
ent o
f Are
a Fa
iled
Coh
esiv
ely
(%)
LPT-1LPT-2LPT-3LPT-4LPT-5
CL120Q Laser
Grit Blast Controls (LPT-3)
Wedge Tests at 120 F, 95 - 100% RHAl 2024-T3 (except as noted)
BR 6747-1 Primer AF 163-2M Adhesive
P = Painted
Grit Blast Controls (LPT-4)
PP
PP
7075
PAA
Figure 29. Wedge test percent cohesive failure results for CL120Q pretreatment The data in Figure 29 show the percent of area that failed cohesively, with the remainder of the area failing either at the adhesive-primer interface or at the primer aluminum interface. In an attempt to further understand the level of performance of the surfaces pretreated with the CL120Q, the samples were re-examined to determine the percent of area that failed at the aluminum-primer interface. These results are presented in Figure 30. The horizontal lines indicate the grit-blast controls, none of which had significant failure at the primer-aluminum interface. All of the LPT-1 and LPT-2 coupons, except one, failed mainly at the primer-aluminum interface, indicating poor surface pretreatment with manual scanning as also shown in the crack growth results. The remaining coupons showed good performance (10 percent or less aluminum surface failure), except the coupons pretreated at the lower single-pulse fluence (flagged symbols).

37
0
10
20
30
40
50
60
70
80
90
100
0 50 100 150 200
Average Total Fluence (J/cm2)
Perc
ent o
f Are
a Fa
iled
at A
lum
inum
Sur
face
(%) LPT-1
LPT-2LPT-3LPT-4LPT-5
CL120Q Laser
Grit Blast Controls
Wedge Tests at 120 F, 95 - 100% RHAl 2024-T3 (except as noted)
BR 6747-1 Primer AF 163-2M Adhesive
P = Painted
P 7075
Figure 30. Wedge test percent aluminum-primer interface failure results for CL120Q pretreatment
7.1.4 Baseline CL120Q Lap-Shear Strength Test Results Generally, lap-shear strength tests are less discriminating of surface preparation effects on bond performance than the wedge test. However, lap-shear strength tests must be passed for the laser pretreatment process to be considered effective. Figure 31 presents lap-shear strength as a function of average total fluence for the early CL120Q tests. The adhesive used for these test samples was AF 163-2M, and the tests were conducted at room temperature (72°F). In all cases, the laser-pretreated coupons exhibited a lap-shear strength greater than or comparable to that of the grit-blast pretreated control coupons. The percent cohesive failure was also determined by examination of the coupons after each test. Nearly all coupons exhibited 100 percent cohesive failure, with no coupons having less than 93 percent cohesive failure.
7.1.5 Baseline CL120Q Peel Strength Test Results Peel strength test results for the coupons pretreated with the CL120Q laser system are presented in Figure 32. In most cases, the peel strength was within the scatter band of strengths of the grit-blast pretreated control coupons. One manually scanned coupon set from LPT-2 had a very low peel strength, and two coupon sets from LPT-3 had a peel strength that was about 10 percent below the middle of the control coupon scatter band. Examination of the coupons after test showed that all failures were 93-100 percent cohesive, except for the three coupon sets with low peel strength.

38
0
1000
2000
3000
4000
5000
6000
7000
0 20 40 60 80 100 120 140 160
Average Total Fluence (J/cm2)
Lap
Shea
r Str
engt
h (p
si)
LPT-1LPT-2LPT-3LPT-4LPT-5
Grit Blast Controls
Lap Shear Tests at Room TemperatureAl 2024-T3 (except as noted)
BR 6747-1 Primer, AF 163-2M Adhesive P = Painted
CL120Q Laser
PP
Figure 31. Lap shear strength test results for CL120Q laser pretreatment
50
55
60
65
70
75
80
0 50 100 150 200
Average Total Fluence (J/cm2)
Peel
Str
engt
h (p
li)
LPT-1
LPT-2
LPT-3
LPT-4
Grit Blast Controls
Peel Tests at Room TemperatureAl 2024-T3 (except as noted)
BR 6747-1 Primer, AF 163-2M Adhesive P = Painted
CL120Q Laser
PP
Figure 32. Peel strength test results for CL120Q laser pretreatment

39
7.1.6 CL120Q Wedge Test Results (Automatic versus Manual Scanning) In the LPT-7 test series, pretreatments were conducted with the shortest pulse available from the CL120Q laser system. Automatic scanning and manual scanning with the modified handpiece were employed in the tests. Figure 33 presents a graph of the 28-day crack growth versus average total fluence applied in the pretreatment of the surfaces for adherends bonded with the standard AF 163-2M adhesive. All data taken over the course of the program with the CL120Q laser system operating at the shortest pulse width are shown for comparison, except for the early manual scan results with no tilt angle control. The solid lines present the grit-blast control results and the dashed lines indicate the PAA control data. The solid blue squares present the results of the automated scan pretreatment panels from LPT-7. The crack growth at 28 days for these panels was comparable to that of the PAA control sample for all values of total fluence investigated. The open blue squares present the results for manual scanning with the same average total fluence applied in the pretreatment. In this case, the lower fluence levels did not have as low a crack growth as obtained with automated scanning. Gaps in pretreatment of the surface due to the randomness of the manual scanning were observed in post-test photographs, as noted previously. For manual scanning at total fluences near 100 J/cm2, the crack growth was comparable to that of the automatically scanned panels. All manual scanning was unidirectional for LPT-7.
0.00
0.05
0.10
0.15
0.20
0.25
0.30
0.35
0.40
0 50 100 150 200
Average Total Fluence (J/cm2)
Cum
ulat
ive
Cra
ck G
row
th a
t 28
Day
s (in
)
LPT-3LPT-4LPT-5LPT-7ALPT-7B
Grit Blast Controls
Wedge Tests at 120 F, 95 - 100% RHAl 2024-T3, BR 6747-1 Primer, AF 163-2M Adhesive
P = Painted, Automatic Scan (solid symbols), Manual Scan (open symbols)
CL120Q Laser
P
PPAA
PAA
Figure 33. Wedge test crack growth results for CL120Q pretreatment with upgraded manual scanning and with automatic scanning (130-ns pulse data only)

40
7.1.7 CL120Q Wedge Test Results (EA 9696 Adhesive) Figure 34 presents similar results for EA 9696 adhesive bonding. Again, the automatically scanned panels exhibited low crack growth at 28 days comparable to the PAA control sample. The manually scanned panels had crack growth comparable to the grit-blast control sample, but exhibited crack growth greater than that of the automatically scanned panels for all fluences tested.
0.00
0.05
0.10
0.15
0.20
0.25
0.30
0.35
0.40
0 20 40 60 80 100 120
Average Total Fluence (J/cm2)
Cum
ulat
ive
Cra
ck G
row
th a
t 28
Day
s (in
)
LPT-7A
LPT-7B
Grit Blast Controls
Wedge Tests at 120 F, 95 - 100% RHAl 2024-T3, BR 6747-1 Primer, EA 9696 Adhesive
Automatic Scan (solid symbols) Manual Scan (open symbols)
CL120Q Laser
PAA
Figure 34. Wedge test crack growth results for CL120Q pretreatment with upgraded manual scanning and with automatic scanning (EA9696 adhesive)
7.1.8 CL120Q Wedge Test Results (Clad versus Unclad Aluminum) Another set of excursion tests was conducted with laser pretreated clad 2024-T3 aluminum. In some cases, adhesives are applied to clad aluminum skin material in repair applications. For standard pretreatment with grit blast, the clad layer may be abraded away before surface preparation. It was of interest to see if laser pretreatment, followed by application of AC-130 adhesion promoter as a surface preparation, would be effective directly on a clad surface. Figure 35 presents 28-day crack growth results for 120°F wedge test coupons that were pretreated with the CL120Q system using both the automatic scan (solid triangles) and manual scanning with the modified handpiece (open triangles). The unclad aluminum data are shown for comparison (square symbols). The crack growth at 28 days for the clad aluminum coupons was substantially independent of scanning method and indicated some improvement with increased average total fluence. Overall the crack growth for the clad aluminum coupons was slightly greater than that of the grit blast control for the LPT-8 test series (unclad control coupon), but still within an

41
acceptable range for durability performance. The failure mode for the clad coupons had considerable variation in the percent of area failed cohesively, but except for the low fluence manual scan case, the failures were either cohesive or at the adhesive-primer interface.
0.00
0.05
0.10
0.15
0.20
0.25
0.30
0.35
0.40
0 20 40 60 80 100 120
Average Total Fluence (J/cm2)
Cum
ulat
ive
Cra
ck G
row
th a
t 28
Day
s (in
)
LPT-7A
LPT-8A
LPT-8B
Grit Blast Controls
Wedge Tests at 120 F, 95 - 100% RHAl 2024-T3, BR 6747-1 Primer, AF 163-2M Adhesive
Automatic Scan (closed symbols) Manual Scan (open symbols)
Unclad Al (squares), Clad Al (triangles)
CL120Q Laser
PAA
Figure 35. Wedge test crack growth results for CL120Q pretreatment with upgraded manual and automatic scanning (clad and unclad 2024-T3 aluminum)
7.1.9 CL120Q Wedge Test Results (Chemical Surface Preparations) The application of a sol-gel adhesion promoter and adhesive primer after laser pretreatment was used in most of the studies throughout the program. It was of interest to see if good bond performance could be achieved without these additional chemical surface preparations by using the laser pretreatment only. In LPT-8A, a series of laser pretreatments was conducted with the CL120Q laser system at constant average total fluence in which various combinations of chemical surface preparations were employed after laser pretreatment. These included application of AC-130 sol-gel only (no primer), primer only (no sol-gel), and no primer nor sol-gel. Figure 36 presents 28-day crack growth results for these tests along with LPT-7A results for the standard AC-130 sol-gel and primer application at the same average total fluence (blue bars). The crack growth was surprisingly low for all cases except in the case of sol-gel application without a following primer application. Use of an alternative adhesive (EA 9696, purple bars) showed even higher crack growth at 28 days for the no-primer case. In all of the no-primer cases, the percent cohesive failure was low (18-28 percent) apparently indicating that the adhesive did not bond well to the sol-gel treated surface. It must be noted that previous AFRL work produced good wedge test results for both adhesives when using grit-blast/sol-gel surface preparation and no primer [17]. Bonding of the adhesive

42
directly to the laser-pretreated surface in the no sol-gel, no-primer case was better (58-66 percent cohesive), but not as good as the control coupons in this series (>90 percent cohesive failure).
0.00
0.05
0.10
0.15
0.20
0.25
0.30
0.35
0.40
0.45
0.50
Primer &Sol-Gel
Primer &Sol-Gel
NoPrimer
NoPrimer
No Sol-Gel
No Sol-Gel
No Sol-Gel orPrimer
No Sol-Gel orPrimer
NoPrimer
NoPrimer
Cum
ulat
ive
Cra
ck G
row
th a
t 28
days
(in)
Wedge Tests at 120 F, 95 - 100% RHAl 2024-T3, BR 6747-1 Primer
AF 163-2M Adhesive (except as noted) Automatic Scan
Average Total Fluence 78-82 J/cm2
CL120Q Laser
9696 Adhesive
Figure 36. Wedge test crack growth results for CL120Q pretreatment with automatic scanning and various surface preparation/primer combinations
7.1.10 CL120Q Wedge Test Results (Precured Primer Effects) An alternative primer surface preparation was also studied in LPT-8 after manual scanning pretreatment with the CL120Q laser system. Often, the BR 6747-1 adhesive primer is cocured with the adhesive in an autoclave at 250°F for 60 minutes after adhesive application and assembly of the panel in order to reduce repair time. For this excursion test, the primer was precured at 250°F for 60 minutes in an oven prior to assembly of the panel with the adhesive layer. Figure 37 presents the 28-day cumulative crack growth results for the precured primer coupons (triangles) along with the results of similar manual scan test results with standard cocured primer for comparison (squares). In both cases, increasing average total fluence led to better bond performance (low crack growth) due to better statistics in achieving total area coverage with the manual scanning technique. Based on these results, there appears to be a slight improvement in bond performance with the precured primer coupons. It is significant that the crack growth for the highest average total fluence coupons with precured primer is comparable to the best phosphoric acid anodize (PAA) control coupons. The failure mode for all coupons had significant variation in percent of area failed cohesively, but the remaining area always failed at the adhesive-primer interface rather than at the treated aluminum interface. Similar results are presented in Figure 38 for automatic scanning in LPT-9A. In this case, the precured primer coupon results (light blue diamonds) were comparable to those of the grit-blast controls for all fluences.

43
0.00
0.05
0.10
0.15
0.20
0.25
0.30
0.35
0.40
0 20 40 60 80 100 120
Average Total Fluence (J/cm2)
Cum
ulat
ive
Cra
ck G
row
th a
t 28
Day
s (in
)LPT-7B
LPT-8B
Grit Blast Controls
Wedge Tests at 120 F, 95 - 100% RHAl 2024-T3, BR 6747-1 Primer, AF 163-2M Adhesive
Manual Scan
CL120Q Laser
PAA
Precured Primer
Figure 37. Wedge test crack growth results for CL120Q pretreatment with upgraded manual scanning; standard cocured primer (squares) and precured primer (triangles)
0.00
0.05
0.10
0.15
0.20
0.25
0.30
0.35
0.40
0 20 40 60 80 100 120
Average Total Fluence (J/cm2)
Cum
ulat
ive
Cra
ck G
row
th a
t 28
Day
s (in
)
LPT-7A
LPT-9A
LPT-9A
Grit Blast Controls
Wedge Tests at 120 F, 95 - 100% RHAl 2024-T3, BR 6747-1 Primer, AF 163-2M Adhesive
Automatic Scan
CL120Q Laser
PAA
Precured Primer
No Sol-Gel
Figure 38. Wedge test crack growth results for CL120Q pretreatment with automatic scanning; standard cocured primer (squares), precured primer (light blue diamonds), and no sol-gel with standard cocured primer (pink diamonds)

44
All bond failures for the precured primer coupons were cohesive over 30-70 percent of the area with the remaining area failing at the adhesive primer interface. Also shown in Figure 38 are 28-day crack growth results for automatic scanning with the CL120Q followed by surface preparation without sol-gel (pink diamond symbols, primer only, standard cocure procedure). These crack growth results exhibited scatter, but low levels comparable to those of the control coupons at the highest fluence. However, the area that failed cohesively ranged from 30-48 percent, and some area failed at the primer- aluminum interface (5-20 percent). The crack growth at 78 J/cm2 (0.21 inch) appears to be anomalously high compared to results under similar conditions shown in Figure 36 (0.10-0.12 inch). This variation suggests that more data are needed to confirm bond durability performance without a sol-gel application.
7.1.11 CL120Q Wedge Test Results (Manual Scan with Crossing Pattern) In LPT-9B, manual scanning pretreatment tests were conducted with an alternative scan method in an attempt to achieve more complete surface coverage at low average total fluence. In these tests, the operator spent half the processing time scanning in one direction and half the time scanning in a direction perpendicular to the first direction (cross scan). Figure 39 presents crack growth results for these tests (diamonds) along with results for unidirectionally scanned coupons in LPT-7B for comparison (squares). In both cases the 28-crack growth decreases with increasing fluence and there appears to be no significant benefit for cross scanning. Also shown in the figure are the data for cross-scanned coupons with no sol-gel surface preparation (circles). These data also show decreasing crack growth with increasing average total fluence. At the highest fluence levels, the crack growth for the no-sol-gel case was comparable to that of the grit blast controls.
0.00
0.05
0.10
0.15
0.20
0.25
0.30
0.35
0.40
0 20 40 60 80 100 120
Average Total Fluence (J/cm2)
Cum
ulat
ive
Cra
ck G
row
th a
t 28
Day
s (in
)
LPT-7B
LPT-9B
LPT-9B
Grit Blast Controls
Wedge Tests at 120 F, 95 - 100% RHAl 2024-T3, BR 6747-1 Primer, AF 163-2M Adhesive
Manual Scan
CL120Q Laser
PAA
Cross Scan Pattern
Cross Scan Pattern, No Sol-Gel
Figure 39. Wedge test crack growth results for CL120Q pretreatment with upgraded manual scanning; unidirectional scan (squares), cross scan (diamonds), and cross scan with no sol-gel (circles)

45
7.2 Mechanical Test Results for Pretreatment with the LB1000 Laser System
The LB1000 laser system provided the shortest pulse (9 ns) in the pretreatment tests, and bond performance was anticipated to be similar to that seen in the previous program [9] which employed similar laser beam parameters. All pretreatments were performed with automated 2-D scanning of the adherends under the fixed position of the handpiece as discussed in a previous section. The following subsections present the results of the mechanical tests performed on coupons pretreated with the LB1000 laser system and bonded using 3M Company AF 163-2M adhesive.
7.2.1 LB1000 Wedge Test Results (Crack Growth) The handpiece on the LB1000 laser system has no scanning capability and no means for maintaining a constant distance from the work surface. For these reasons, all tests with this system were conducted with uniform 2-D scanning of the coupon under the handpiece with an automated translation stage. The wedge test data for crack growth at 28 days for the LB1000 pretreatment tests are shown in Figure 40. The grit-blast and phosphoric acid anodize (PAA) control results are presented as horizontal lines. The laser pretreatment results were generally comparable to the grit-blast control crack-growth, although there was considerable scatter in both.
0.00
0.05
0.10
0.15
0.20
0.25
0.30
0.35
0 20 40 60 80 100 120
Average Total Fluence (J/cm2)
Cum
ulat
ive
Cra
ck G
row
th a
t 28
Day
s (in
)
LPT-1
LPT-4
LPT-6Grit Blast Controls (LPT-1)
Wedge Tests at 120 F, 95 - 100% RHAl 2024-T3 (except as noted)
BR 6747-1 Primer, AF 163-2M AdhesiveP = PaintedLB1000 Laser
Grit Blast Controls (LPT-4)
P
P
P
P
70757075
PAA
GBGB, 7075
PAA, 7075
PAA, 7075
Figure 40. Wedge test crack growth results for LB1000 pretreatment
7.2.2 LB1000 Wedge Test Results (Failure Mode) Figure 41 presents the failure mode results in terms of the percent of crack growth area that failed cohesively. The remaining fraction of the failed area failed either at the adhesive-primer interface or at the primer-aluminum interface, as discussed in Section 7.1.3. Based on these results, it is clear that the LPT-6 pretreatments at 40 J/cm2 average

46
total fluence (green triangles) performed as well in the wedge test as the controls. As with the CL120Q tests, there was some uncertainty arising from the adhesive and/or primer condition which led to adhesive-primer interface failures which do not normally occur. The wedge test coupons were re-inspected to determine the fraction of the failure that occurred at the primer-aluminum interface. These data are presented in Figure 42. These results suggest that the LB1000 beam parameters work well as long as the average total fluence is in the 25 to 40 J/cm2 range.
0
10
20
30
40
50
60
70
80
90
100
0 20 40 60 80 100 120
Average Total Fluence (J/cm2)
Perc
ent o
f Are
a Fa
iled
Coh
esiv
ely
(%)
LPT-1LPT-4LPT-6
LB1000 Laser
Grit Blast Controls (LPT-1)
Grit Blast Controls (LPT-4)
Wedge Tests at 120 F, 95 - 100% RHAl 2024-T3 (except as noted)
BR 6747-1 Primer, AF 163-2M AdhesiveP = Painted
P
P
P
P
7075
7075
GB
PAAGB, 7075
GB, 7075
PAA, 7075
PAA, 7075
Figure 41. Wedge test percent cohesive failure results for LB1000 pretreatment
0
10
20
30
40
50
60
70
80
90
100
0 20 40 60 80 100 120
Average Total Fluence (J/cm2)
Perc
ent o
f Are
a Fa
iled
at A
lum
inum
Sur
face
(%)
LPT-1LPT-4LPT-6
LB1000 Laser
Grit Blast Controls
Wedge Tests at 120 F, 95 - 100% RHAl 2024-T3 (except as noted)
BR 6747-1 Primer, AF 163-2M AdhesiveP = Painted
P P 7075
Figure 42. Wedge test percent aluminum-primer interface failure results for LB1000 pretreatment

47
7.2.3 Elevated Temperature Wedge Test Results for LB1000 Pretreatment Four panels were prepared in LPT-6 for wedge tests to be performed in a 140°F humidity chamber. Figure 43 presents the 28-day crack growth test results for these LB1000 pretreatments. As noted in the figure, the laser pretreated coupons exhibited higher 28-day crack growth than for the standard 120°F test, but the crack growth was comparable to that of the grit-blast pretreated coupons. This indicates that the laser pretreatment provided good bond performance, however, not at the level of the PAA control coupons. Inspection of the coupons after the test revealed a mixture of cohesive failure and interfacial failure at the aluminum surface. The cohesive failure area for the laser pretreated coupons was greater than that of the grit-blast controls (36-52 percent versus 24 percent), but lower than that of the PAA controls (87 percent).
0.00
0.05
0.10
0.15
0.20
0.25
0.30
0.35
0.40
0.45
0.50
0 20 40 60 80 100 120
Average Total Fluence (J/cm2)
Cum
ulat
ive
Cra
ck G
row
th a
t 28
Day
s (in
)
LPT-6
Wedge Tests at 140 F, 95 - 100% RHAl 2024-T3
BR 6747-1 Primer, AF 163-2M Adhesive
LB1000 Laser
Grit Blast Control
PAA
Figure 43. Wedge test crack growth results at 140°F for LB1000 pretreatment
7.2.4 LB1000 Lap-Shear Strength Test Results The LB1000 laser system was also used to pretreat adherends for testing lap-shear strength at ambient laboratory temperature (approximately 72°F). Figure 44 presents the lap-shear strength measured for these coupons along with horizontal lines indicating the strength of control coupons. In all cases, the lap-shear strength of the laser-pretreated coupons was greater than or comparable to that of the control coupons, including the PAA treated coupons. The failure mode was always in the range of 97-100 percent cohesive.

48
0
1000
2000
3000
4000
5000
6000
7000
0 20 40 60 80 100 120
Average Total Fluence (J/cm2)
Lap
Shea
r Str
engt
h (p
si)
LPT-1
LPT-4
LPT-6
Grit Blast Controls
Lap Shear Tests at Room TemperatureAl 2024-T3 (except as noted)
BR 6747-1 Primer, AF 163-2M Adhesive P = Painted
LB1000 Laser
PAA
PPP
P
Figure 44. Lap shear strength test results for LB1000 laser pretreatment
7.2.5 LB1000 Peel Strength Test Results In the LB1000 laser system tests, a set of coupons was also prepared for peel strength testing at ambient laboratory temperature. Figure 45 presents the peel strength test results for these coupons. As noted in the figure, the peel strength was generally comparable to or at most 10 percent less than that of the control coupons.
7.3 Mechanical Test Results for Pretreatment with the LDF600-500 Laser System
In LPT-2 a set of four wedge test panels was prepared using the LDF600-500 laser system for pretreatment of the surface. As discussed in a previous section, no oxide removal or surface texturization was observed in these pretreatments. The wedge tests were carried out in the standard manner in the 120°F humidity chamber and the results confirmed that the pretreatment was totally inadequate. The crack growth at 1 hour was in the range of 0.36-0.47 inch compared to 0.03-0.05 inch for the grit-blast controls. The 28-day crack growth was 0.60-0.67 inch and the failure mode was 0 percent cohesive (100 percent failure at the aluminum surface).

49
50
55
60
65
70
75
80
0 20 40 60 80 100 120
Average Total Fluence (J/cm2)
Peel
Str
engt
h (p
li)LPT-1
LPT-4
LPT-6
Grit Blast Controls
Peel Tests at Room TemperatureAl 2024-T3 (except as noted)
BR 6747-1 Primer, AF 163-2M Adhesive P = Painted
LB1000 Laser
PAA
PP
P
P
Figure 45. Peel strength test results for LB1000 laser pretreatment
8 Conclusions and Recommendations Three commercial laser systems under consideration by the Air Force for use in small area paint stripping applications on aircraft and other equipment have been investigated for a dual use in the pretreatment of aluminum surfaces prior to surface preparation for adhesive bonding using AC-130 sol-gel adhesion promoter. This laser pretreatment would replace solvent wipe and grit blast pretreatments used in the past. The results of the research indicated that two of the laser systems could be suitable for laser pretreatment after modification of the handpiece, while the third was unsuitable. Specifically, it was concluded that:
• The Clean Laser Model CL120Q laser system (nominal average power 80 W) has a handpiece that could be modified for pretreating surfaces. The modifications would include wheel extensions to prevent rolling over the cleaned surface and a third wheel to control the handpiece tilt angle. With this modified handpiece, an operator could pretreat an area on a flat or slightly curved surface, given the proper training. The operator would translate the handpiece in the forward direction while the handpiece internal mechanism would scan the laser beam transversely. Pretreatment would be successful if sufficient time were taken to cover all surface area in the desired bond area (about 0.5-1.0 cm2/s).
• The Quantel Model Laserblast 1000 (LB1000) laser system (nominal average power 30 W) has a handpiece with no internal scanning mechanism and no means to control working distance to the surface being pretreated. Manual scanning was

50
not studied in this program, because the requirements for the operator were too strenuous. Manual surface pretreatment for adhesive bonding could be accomplished with the as-received LB1000 handpiece, if the operator were able to accomplish complete area coverage by careful 2-D scanning, while maintaining a relatively constant working distance. Extensive modification of the handpiece would be required to make it convenient to use for laser pretreatment of practical surfaces. Assuming efficient coverage of the surface, the pretreatments rate would be about 0.5-1.0 cm2/s.
• The LaserLine Model LDF600-500 laser system (nominal power 200 W) is completely inadequate for surface pretreatment of aluminum surfaces for adhesive bonding. The laser is not pulsed and cannot produce peak irradiance levels on the surface necessary for texturization.
Specific results of the mechanical testing of aluminum coupons pretreated with the CL120Q laser system and bonded with film adhesive include:
• Lap-shear strength and peel strength of CL120Q pretreated coupons were comparable to those of the grit-blast pretreated control coupons except in a few cases where the unmodified handpiece was employed in the early tests.
• Cumulative 28-day crack growth of wedge test coupons pretreated with the CL120Q handpiece in a fixed position over a uniform translation motion stage (automatic scanning) was comparable to that of grit-blast pretreated control coupons for a wide range of pretreatment conditions provided that the short-pulse-width, low-pulse-repetition-rate setting (130 ns, 10 kHz) was used. Using these conditions, the CL120Q laser pretreatment used with the AC-130 sol-gel adhesion promoter produced wedge test results that were also comparable to those obtained from specimens prepared via phosphoric acid anodizing. The average total fluence for good bond durability was in the range 40-100 J/cm2.
• Similar good wedge test performance was observed for coupons pretreated using manual scanning with the modified handpiece when the average total fluence was greater than 70 J/cm2.
• Laser pretreatment of various substrates (unclad 2024-T3, clad 2024-T3, and 7075-T6 aluminum) with the CL120Q followed by application of AC-130 adhesion promoter and subsequent bonding with AF 163-2M adhesive showed that there was no particular sensitivity of wedge test results to aluminum substrate type.
• Bonding of CL120Q-pretreated unclad 2024-T3 aluminum coupons with EA9696 film adhesive as an alternative to AF 163-2M demonstrated that the wedge test results were not significantly sensitive to adhesive formulation except in the special case where no primer was applied.
• A marginal reduction in 28-day crack growth in the wedge test was observed for laser pretreated coupons which had precured primer relative to those that were cocured with the adhesive in the standard manner.
While fewer mechanical tests were conducted on coupons laser pretreated with the LB1000 laser system, the results showed that:

51
• Lap-shear strength and peel strength of laser pretreated coupons was generally
comparable to or greater than those of the grit-blast/sol-gel and PAA control coupons except for the painted coupons which were less than 10 percent weaker than the controls in the peel tests.
• Wedge test coupons pretreated with the LB1000 exhibited 28-day crack growth performance comparable to the grit-blast/sol-gel and PAA control coupons for most conditions, although there was considerable scatter in the results due to failures at the adhesive-primer interface. Based on the examination of the failure location, pretreatment with the LB1000 should be satisfactory provided that the average total fluence is greater than 25 J/cm2.
Based on the results obtained in this program, it is recommended that future research explore the following areas:
• Assess the effects of the best pretreatment laser-beam parameters on the mechanical properties of the substrates of interest
• Acquire additional data on the bond performance (wedge, lap-shear, and peel tests) of coupons pretreated with a laser and subsequently prepared for bonding using alternative approaches (e.g., no sol-gel; no sol-gel and no primer; etc.)
• Measure bond performance of alternative substrates (titanium, carbon-epoxy composite, etc.) pretreated with a laser
• Perform a demonstration of laser pretreatment of an area for composite patch repair with a simulated or condemned aircraft part
• Develop sensor techniques to aid an operator in determining the acceptability of a manually-scanned laser-pretreated surface
9 References 1. C. T. Walters, “Laser Cleaning of Oxygen Lines,” Final Report on Contract F33615-
94-C-5803, D. O. 14 , January, 1997. 2. C. T. Walters, S. A. Siwecki, L. R. Dosser, C. J. Kershner, R. J. Hull, and B. E.
Campbell, “Laser Removal of Contaminant Films from Metal Surfaces,” Proceedings of ICALEO ‘96, held October 14-17, 1996, LIA Volume 81, p. A-95.
3. C. T. Walters, “Laser-Based Cleaning Processes for Solvent Replacement,” Proceedings of 42nd International SAMPE Symposium and Exhibition, held May 4-8, 1997, Anaheim, California.
4. C. T. Walters, “Laser Cleaning of Oxygen Lines – Pre-Production Prototype Development,” Final Report on Contract F33615-94-C-5803, D. O. 22, February, 1998.
5. C. T. Walters, B. E. Campbell, and R. J. Hull, “Laser Cleaning of Metal Surfaces,” Proceedings of SPIE’s High Power Laser Ablation Conference, held April 27-30, 1998, SPIE Volume 3343, p. 859.

52
6. C. T. Walters, C. Flint Webb, and Jay Tiley, “Laser Cleaning for Pollution Prevention,” Paper presented at Third Annual Joint Service Pollution Prevention Conference, August 25-27, 1998, San Antonio, Texas
7. C. T. Walters, “Use of Laser Cleaning Techniques to Remove Organic Contaminants,” Craig Walters Associates Final Report on Contract No. F33615-95-D-5615, Delivery Order No. 43, February 21, 2000.
8. C. T. Walters, “Short Pulse Laser Removal of Organic Coatings,” Proceedings of SPIE’s High Power Laser Ablation III, held April 24-28, 2000, SPIE Volume 4065, p. 567.
9. C. T. Walters and S. Susta, “DEM/VAL Laser Surface Preparation for Adhesive Bonding,” Final Report on Contract GS09K99BH0010, Task Order 5TS5701D101I, March 18, 2002.
10. ASTM D 3762, “Standard Test Method for Adhesive-Bonded Surface Durability of Aluminum (Wedge Test).” Annual Book of ASTM Standards, Volume 15.06: Adhesives.
11. ASTM D 1002, “Standard Test Method for Apparent Shear Strength of Single-Lap-Joint Adhesively Bonded Metal Specimens by Tension Loading (Metal-to-Metal).” Annual Book of ASTM Standards, Volume 15.06: Adhesives.
12. ASTM D 3167, “Standard Test Method for Floating Roller Peel Resistance of Adhesives.” Annual Book of ASTM Standards, Volume 15.06: Adhesives.
13. J. J. Mazza, G. B. Gaskin, W.S. De Piero, and K. Y. Blohowiak, “Sol-Gel Technology for Low-VOC, Nonchromated Adhesive Bonding Applications: SERDP Project PP-1113, Task 1,” AFRL-ML-WP-TR-2004-4063, April 2004, p.1.
14. J. J. Mazza, J. B. Avram, and R. J. Kuhbander, “Grit-Blast/Silane (GBS) Aluminum Surface Preparation for Structural Adhesive Bonding,” WL-TR-94-4111, April 2003, p. 31.
15. H. M. Clearfield, D. K. McNamara, and G. D. Davis, “Surface Preparation of Metals,” Engineered Materials Handbook Volume 3: Adhesives and Sealants, H. F. Brinson, technical chairman, ASM International, 1990, pp. 259-264.
16. J. J. Mazza, J. B. Avram, and R. J. Kuhbander, “Grit-Blast/Silane (GBS) Aluminum Surface Preparation for Structural Adhesive Bonding,” WL-TR-94-4111, April 2003, p.7.
17. J. J. Mazza, G. B. Gaskin, W.S. De Piero, and K. Y. Blohowiak, “Sol-Gel Technology for Low-VOC, Nonchromated Adhesive Bonding Applications: SERDP Project PP-1113, Task 1,” AFRL-ML-WP-TR-2004-4063, April 2004, pp. 65-70.

53
Appendix A. Test Condition Summary Table A-1. Test matrix for Clean Laser CL120Q in the LPT-1 and -2 Test Series (Manual Scanning).
Test Parameter Test Condition
1-CL
Test Condition
2-CL
Test Condition
3-CL
Test Condition
4-CL
Laser Average Power (W) 78 78 71 76 Pulse Repetition Rate (Hz) 10000 10000 10000 15000 Pulse Energy (mJ) 8 8 7 5 Spot Diameter (mm) 0.4 0.4 0.4 0.4 Pulse Fluence (J/cm2) 6.21 6.21 5.65 4.03 Transverse Scan Rep. Rate (Hz) 40 40 40 80 Transverse Scan Rate (cm/s) 160.00 160.00 160.00 320.00 Transverse Scan Width (cm) 2.0 2.0 2.0 2.0 Forward Scan Rate (cm/s) 1.00 1.00 0.50 1.00 Transverse Overlap (%) 60.0 60.0 60.0 46.7 Forward Overlap (%) 68.8 68.8 84.4 84.4 Average Pulses per Pass 6.3 6.3 12.6 9.4 Total No. of Passes 1 2 2 4 Average Total Fluence (J/cm2) 39.0 78.0 142.0 152.0 Coverage Rate per Pass (cm2/s) 2.0 2.0 1.0 2.0 Total Coverage Rate (cm2/s) 2.0 1.0 0.5 0.5 No. of Wedge Test Adherends* 4-2024 4-2024 4-2024 4-2024 No. of Lap Shear Adherends* 4-2024 4-2024 4-2024 4-2024 No. of Peel Adherends* 4-2024 4-2024 4-2024 4-2024
* Entry gives number of samples (adherends) processed and alloy type (4 samples yields two test panels)

54
Table A-2. Test matrix for Clean Laser CL120Q in the LPT-3 Test Series.
Test Parameter Test Condition
5-CL*
Test Condition
6-CL*
Test Condition
7-CL*
Test Condition
8-CL**
Laser Average Power (W) 75 75 75 75 Pulse Repetition Rate (Hz) 10000 10000 10000 10000 Pulse Energy (mJ) 8 8 8 8 Spot Diameter (mm) 0.3 0.3 0.3 0.4 Pulse Fluence (J/cm2) 10.62 10.62 10.62 5.97 Transverse Scan Rep. Rate (Hz) 40 40 40 80 Transverse Scan Rate (cm/s) 168.00 168.00 168.00 400.00 Transverse Scan Width (cm) 2.1 2.1 2.1 2.5 Forward Scan Rate (cm/s) 1.00 1.00 0.50 1.00 Transverse Overlap (%) 44.0 44.0 44.0 0.0 Forward Overlap (%) 58.3 58.3 79.2 84.4 Average Pulses per Pass 3.4 3.4 6.7 5.0 Total No. of Passes 1 2 2 4 Average Total Fluence (J/cm2) 35.7 71.4 142.9 120.0 Coverage Rate per Pass (cm2/s) 2.1 2.1 1.1 2.5 Total Coverage Rate (cm2/s) 2.1 1.1 0.5 0.6 No. of Wedge Test Adherends*** 4-2024 4-2024 4-2024 4-2024 No. of Lap Shear Adherends*** 4-2024 4-2024 4-2024 4-2024 No. of Peel Adherends*** 4-2024 4-2024 4-2024 4-2024
* Automatic scanning in the forward direction **Manual scanning in the forward direction (last two passes transverse to first two) *** Entry gives number of samples (adherends) processed and alloy type (4 samples yield two test panels)

55
Table A-3. Test matrix for Clean Laser CL120Q in the LPT-4 Test Series.
Test Parameter Test Condition
9-CL*
Test Condition
10-CL*
Laser Average Power (W) 73 81 Pulse Repetition Rate (Hz) 10000 25000 Pulse Energy (mJ) 7 3 Spot Diameter (mm) 0.3 0.25 Pulse Fluence (J/cm2) 10.33 6.60 Transverse Scan Rep. Rate (Hz) 42 53 Transverse Scan Rate (cm/s) 253.80 529.00 Transverse Scan Width (cm) 3.0 5.0 Forward Scan Rate (cm/s) 0.75 0.38 Transverse Overlap (%) 15.4 15.4 Forward Overlap (%) 70.4 85.6 Average Pulses per Pass 3.1 6.5 Total No. of Passes 1 1 Average Total Fluence (J/cm2) 32.4 42.6 Coverage Rate per Pass (cm2/s) 2.3 1.9 Total Coverage Rate (cm2/s) 2.3 1.9 No. of Wedge Test Adherends** 4-2024P 4-2024P No. of Lap Shear Adherends** 4-2024P No. of Peel Adherends** 4-2024P
* Automatic scanning in the forward direction ** Entry gives number of samples (adherends) processed and alloy type (4 samples yield two test panels); P = painted

56
Table A-4. Test matrix for Clean Laser CL120Q in the LPT-5 Test Series.
Test Parameter Test Condition
11-CL*
Test Condition
12-CL*
Test Condition
13-CL*
Laser Average Power (W) 95 95 86 Pulse Repetition Rate (Hz) 24000 24000 10000 Pulse Energy (mJ) 4.0 4.0 8.6 Spot Diameter (mm) 0.25 0.25 0.3 Pulse Fluence (J/cm2) 8.07 8.07 12.17 Transverse Scan Rep. Rate (Hz) 59 59 46 Transverse Scan Rate (cm/s) 586.00 586.00 304.92 Transverse Scan Width (cm) 5.0 5.0 3.3 Forward Scan Rate (cm/s) 0.60 0.30 0.32 Transverse Overlap (%) 2.3 2.3 -1.6 Forward Overlap (%) 79.5 89.8 88.5 Average Pulses per Pass 3.9 7.9 6.7 Total No. of Passes 1 1 1 Average Total Fluence (J/cm2) 31.7 63.3 81.4 Coverage Rate per Pass (cm2/s) 3.0 1.5 1.1 Total Coverage Rate (cm2/s) 3.0 1.5 1.1 No. of Wedge Test Adherends** 4-2024 4-2024 4-2024
4-7075 No. of Wedge Test Adherends** 4-2024*** 4-2024***No. of Lap Shear Adherends** 4-2024 4-2024 4-2024 No. of Peel Adherends** 4-2024 4-2024 4-2024 No. of SEM Coupons 4-2024
4-7075 4-2024 4-7075
4-2024 4-7075
* Automatic scanning in the forward direction ** Entry gives number of samples (adherends) processed and alloy type (4 samples yield two test panels) *** These panels were subjected to 140°F wedge test; control coupons included phosphoric acid anodize (PAA) surface preparation

57
Table A-5. Test matrix for Clean Laser CL120Q in the LPT-7A Test Series.
Test Parameter Test Condition
14-CL*
Test Condition
15-CL*
Test Condition
16-CL*
Test Condition
17-CL*
Laser Average Power (W) 79 79 79 79 Pulse Repetition Rate (Hz) 11000 11000 11000 11000 Pulse Energy (mJ) 7.2 7.2 7.2 7.2 Spot Diameter (mm) 0.3 0.3 0.3 0.3 Pulse Fluence (J/cm2) 10.17 10.17 10.17 10.17 Transverse Scan Rep. Rate (Hz) 43 43 43 43 Transverse Scan Rate (cm/s) 266.60 266.60 266.60 266.60 Transverse Scan Width (cm) 3.1 3.1 3.1 3.1 Forward Scan Rate (cm/s) 0.64 0.44 0.32 0.25 Transverse Overlap (%) 19.2 19.2 19.2 19.2 Forward Overlap (%) 75.2 82.9 87.6 90.3 Average Pulses per Pass 3.9 5.7 7.8 10.0 Total No. of Passes 1 1 1 1 Average Total Fluence (J/cm2) 39.8 57.9 79.6 101.9 Coverage Rate per Pass (cm2/s) 2.0 1.4 1.0 0.8 Total Coverage Rate (cm2/s) 2.0 1.4 1.0 0.8 No. of Wedge Test Adherends** (AF 163-2M adhesive)
4-2024 4-2024 4-2024 4-2024
No. of Wedge Test Adherends** (9696 adhesive)
4-2024 4-2024 4-2024 4-2024
* Automatic scanning in the forward direction ** Entry gives number of samples (adherends) to be processed and alloy type (4 samples yield two test panels)

58
Table A-6. Test matrix for Clean Laser CL120Q in the LPT-7B Test Series.
Test Parameter Test Condition
18-CL*
Test Condition
19-CL*
Test Condition
20-CL*
Test Condition
21-CL*
Laser Average Power (W) 79 79 79 79 Pulse Repetition Rate (Hz) 11000 11000 11000 11000 Pulse Energy (mJ) 7.2 7.2 7.2 7.2 Spot Diameter (mm) 0.3 0.3 0.3 0.3 Pulse Fluence (J/cm2) 10.17 10.17 10.17 10.17 Transverse Scan Rep. Rate (Hz) 43 43 43 43 Transverse Scan Rate (cm/s) 266.60 266.60 266.60 266.60 Transverse Scan Width (cm) 3.1 3.1 3.1 3.1 Average Forward Scan Rate (cm/s) 0.64 0.44 0.32 0.25 Transverse Overlap (%) 19.2 19.2 19.2 19.2 Average Forward Overlap (%) 75.2 82.9 87.6 90.3 Average Pulses per Pass 3.9 5.7 7.8 10.0 Total No. of Passes 1 1 1 1 Average Total Fluence (J/cm2) 39.8 57.9 79.6 101.9 Coverage Rate per Pass (cm2/s) 2.0 1.4 1.0 0.8 Total Coverage Rate (cm2/s) 2.0 1.4 1.0 0.8 No. of Wedge Test Adherends** (AF 163-2M adhesive)
4-2024 4-2024 4-2024 4-2024
No. of Wedge Test Adherends** (9696 adhesive)
4-2024 4-2024
* Manual scanning in the forward direction with modified handpiece with tilt angle control. Individual forward scans were relatively rapid with total time limit for coupon area fixed. Operator visually inspected as pretreatment proceeded. ** Entry gives number of samples (adherends) processed and alloy type (4 samples yield two test panels)
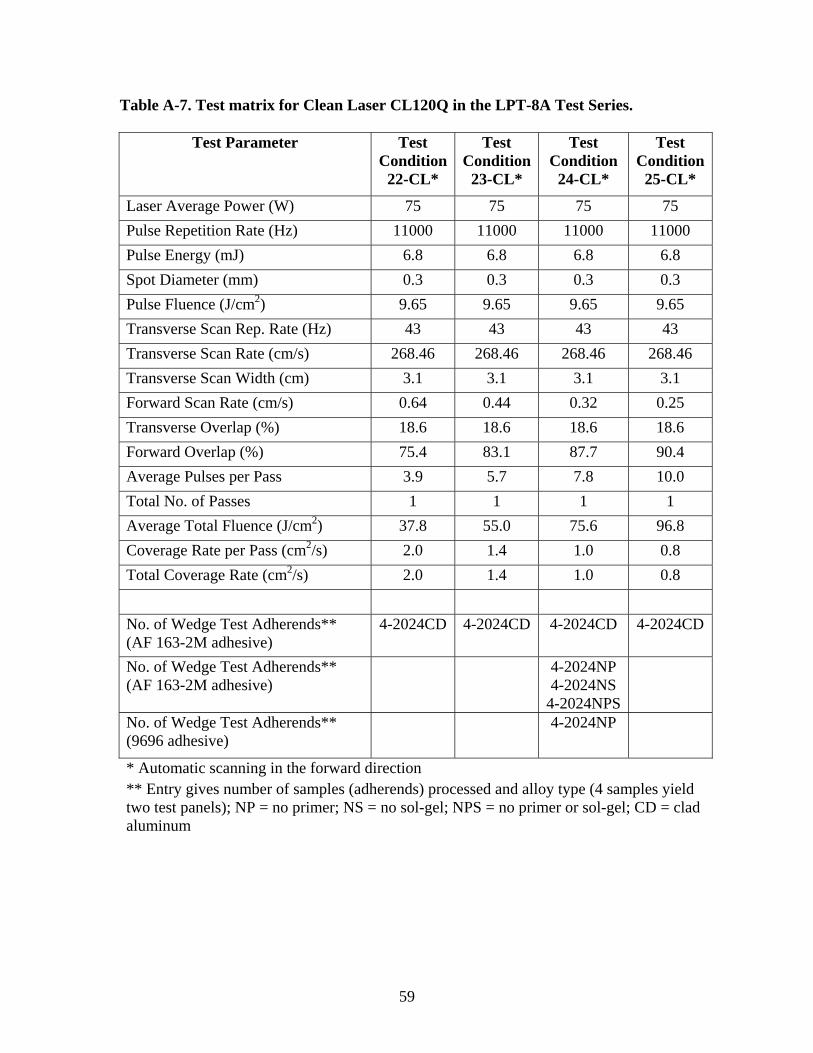
59
Table A-7. Test matrix for Clean Laser CL120Q in the LPT-8A Test Series.
Test Parameter Test Condition
22-CL*
Test Condition
23-CL*
Test Condition
24-CL*
Test Condition
25-CL*
Laser Average Power (W) 75 75 75 75 Pulse Repetition Rate (Hz) 11000 11000 11000 11000 Pulse Energy (mJ) 6.8 6.8 6.8 6.8 Spot Diameter (mm) 0.3 0.3 0.3 0.3 Pulse Fluence (J/cm2) 9.65 9.65 9.65 9.65 Transverse Scan Rep. Rate (Hz) 43 43 43 43 Transverse Scan Rate (cm/s) 268.46 268.46 268.46 268.46 Transverse Scan Width (cm) 3.1 3.1 3.1 3.1 Forward Scan Rate (cm/s) 0.64 0.44 0.32 0.25 Transverse Overlap (%) 18.6 18.6 18.6 18.6 Forward Overlap (%) 75.4 83.1 87.7 90.4 Average Pulses per Pass 3.9 5.7 7.8 10.0 Total No. of Passes 1 1 1 1 Average Total Fluence (J/cm2) 37.8 55.0 75.6 96.8 Coverage Rate per Pass (cm2/s) 2.0 1.4 1.0 0.8 Total Coverage Rate (cm2/s) 2.0 1.4 1.0 0.8 No. of Wedge Test Adherends** (AF 163-2M adhesive)
4-2024CD 4-2024CD 4-2024CD 4-2024CD
No. of Wedge Test Adherends** (AF 163-2M adhesive)
4-2024NP 4-2024NS
4-2024NPS
No. of Wedge Test Adherends** (9696 adhesive)
4-2024NP
* Automatic scanning in the forward direction ** Entry gives number of samples (adherends) processed and alloy type (4 samples yield two test panels); NP = no primer; NS = no sol-gel; NPS = no primer or sol-gel; CD = clad aluminum

60
Table A-8. Test matrix for Clean Laser CL120Q in the LPT-8B Test Series.
Test Parameter Test Condition
26-CL*
Test Condition
27-CL*
Test Condition
28-CL*
Test Condition
29-CL*
Laser Average Power (W) 75 75 75 75 Pulse Repetition Rate (Hz) 11000 11000 11000 11000 Pulse Energy (mJ) 6.8 6.8 6.8 6.8 Spot Diameter (mm) 0.3 0.3 0.3 0.3 Pulse Fluence (J/cm2) 9.65 9.65 9.65 9.65 Transverse Scan Rep. Rate (Hz) 43 43 43 43 Transverse Scan Rate (cm/s) 266.60 266.60 266.60 266.60 Transverse Scan Width (cm) 3.1 3.1 3.1 3.1 Average Forward Scan Rate (cm/s) 0.64 0.44 0.32 0.25 Transverse Overlap (%) 19.2 19.2 19.2 19.2 Average Forward Overlap (%) 75.2 82.9 87.6 90.3 Average Pulses per Pass 3.9 5.7 7.8 10.0 Total No. of Passes 1 1 1 1 Average Total Fluence (J/cm2) 37.8 55.0 75.6 96.8 Coverage Rate per Pass (cm2/s) 2.0 1.4 1.0 0.8 Total Coverage Rate (cm2/s) 2.0 1.4 1.0 0.8 No. of Wedge Test Adherends** (AF 163-2M adhesive)
4-2024CD 4-2024CD 4-2024CD 4-2024CD
No. of Wedge Test Adherends** (AF 163-2M adhesive)
4-2024PR 4-2024PR 4-2024PR 4-2024PR
* Manual scanning in the forward direction with modified handpiece with tilt angle control. Individual forward scans were relatively rapid with total time limit for coupon area fixed. Operator visually inspected as pretreatment proceeded. ** Entry gives number of samples (adherends) processed and alloy type (4 samples yield two test panels); PR = pre-cured primer; CD = clad aluminum

61
Table A-9. Test matrix for Clean Laser CL120Q in the LPT-9A Test Series.
Test Parameter Test Condition
30-CL*
Test Condition
31-CL*
Test Condition
32-CL*
Test Condition
33-CL*
Laser Average Power (W) 75 75 75 75 Pulse Repetition Rate (Hz) 11000 11000 11000 11000 Pulse Energy (mJ) 6.8 6.8 6.8 6.8 Spot Diameter (mm) 0.3 0.3 0.3 0.3 Pulse Fluence (J/cm2) 9.65 9.65 9.65 9.65 Transverse Scan Rep. Rate (Hz) 43 43 43 43 Transverse Scan Rate (cm/s) 277.12 277.12 277.12 277.12 Transverse Scan Width (cm) 3.2 3.2 3.2 3.2 Forward Scan Rate (cm/s) 0.64 0.44 0.32 0.25 Transverse Overlap (%) 16.0 16.0 16.0 16.0 Forward Overlap (%) 75.4 83.1 87.7 90.4 Average Pulses per Pass 3.8 5.5 7.6 9.7 Total No. of Passes 1 1 1 1 Average Total Fluence (J/cm2) 36.6 53.3 73.2 93.8 Coverage Rate per Pass (cm2/s) 2.0 1.4 1.0 0.8 Total Coverage Rate (cm2/s) 2.0 1.4 1.0 0.8 No. of Wedge Test Adherends** (AF 163-2M adhesive)
4-2024PR 4-2024PR 4-2024PR 4-2024PR
No. of Wedge Test Adherends** (AF 163-2M adhesive)
4-2024NS 4-2024NS 4-2024NS 4-2024NS
* Automatic scanning in the forward direction ** Entry gives number of samples (adherends) processed and alloy type (4 samples yield two test panels); NS = no sol-gel; PR = pre-cured primer;

62
Table A-10. Test matrix for Clean Laser CL120Q in the LPT-9B Test Series.
Test Parameter Test Condition
34-CL*
Test Condition
35-CL*
Test Condition
36-CL*
Test Condition
37-CL*
Laser Average Power (W) 75 75 75 75 Pulse Repetition Rate (Hz) 11000 11000 11000 11000 Pulse Energy (mJ) 6.8 6.8 6.8 6.8 Spot Diameter (mm) 0.3 0.3 0.3 0.3 Pulse Fluence (J/cm2) 9.65 9.65 9.65 9.65 Transverse Scan Rep. Rate (Hz) 43 43 43 43 Transverse Scan Rate (cm/s) 292.40 292.40 292.40 292.40 Transverse Scan Width (cm) 3.4 3.4 3.4 3.4 Average Forward Scan Rate (cm/s) 0.64 0.44 0.32 0.25 Transverse Overlap (%) 11.4 11.4 11.4 11.4 Average Forward Overlap (%) 75.2 82.9 87.6 90.3 Average Pulses per Pass 3.6 5.2 7.1 9.1 Total No. of Passes 1 1 1 1 Average Total Fluence (J/cm2) 34.5 50.1 68.9 88.2 Coverage Rate per Pass (cm2/s) 2.2 1.5 1.1 0.9 Total Coverage Rate (cm2/s) 2.2 1.5 1.1 0.9 No. of Wedge Test Adherends** (AF 163-2M adhesive)
4-2024 4-2024 4-2024 4-2024
No. of Wedge Test Adherends** (AF 163-2M adhesive)
4-2024NS 4-2024NS 4-2024NS 4-2024NS
* Manual scanning in the forward direction with modified handpiece with tilt angle control. Individual forward scans were relatively rapid with total time limit for coupon area fixed. Operator will visually inspected as pretreatment proceeded. Half way through, the operator scanned perpendicular to original direction.
** Entry gives number of samples (adherends) processed and alloy type (4 samples yield two test panels); NS = no sol-gel

63
Table A-11. Test matrix for Laserblast 1000 in the LPT-1 and LPT-4 Test Series.
Test Parameter Test Condition
1-LB*
Test Condition
2-LB*
Test Condition
3-LB*
Test Condition
4-LB*
Laser Average Power (W) 25.4 29.4 28.3 28.3 Pulse Repetition Rate (Hz) 120 120 120 120 Pulse Energy (mJ) 212 245 236 236 Spot Dimen. (mm x mm) 3 3 3 3.5 Pulse Fluence (J/cm2) 2.35 2.72 2.62 1.93 Transverse Scan Rate (cm/s) 7.00 7.00 7.00 4.83 Transverse Scan Width (cm) 16.5 16.5 16.5 16.5 Forward Scan Rate (cm/s) 0.07 0.07 0.07 0.05 Transverse Overlap (%) 80.6 80.6 80.6 88.5 Forward Overlap (%) 45.0 45.0 45.0 52.9 Average Pulses per Pass 9.4 9.4 9.4 18.4 Total No. of Passes 1 1 1 1 Average Total Fluence (J/cm2) 22.0 25.5 24.5 35.5 Coverage Rate (cm2/s) 1.16 1.16 1.16 0.80 No. of Wedge Test Adherends** 4-2024 4-2024 4-2024P 4-2024P No. of Lap Shear Adherends** 4-2024 4-2024 4-2024P 4-2024P No. of Peel Adherends** 4-2024 4-2024 4-2024P 4-2024P
* Automatic scanning in both directions ** Entry gives number of samples (adherends) processed and alloy type (4 samples yield two test panels); P = painted

64
Table A-12. Test matrix for LaserBlast 1000 in the LPT-6 Test Series.
Test Parameter Test Condition
5-LB*
Test Condition
6-LB*
Test Condition
7-LB*
Laser Average Power (W) 15 28 28 Pulse Repetition Rate (Hz) 60 120 120 Pulse Energy (mJ) 250 233 233 Spot Dimen. (mm x mm) 3 3 3 Pulse Fluence (J/cm2) 2.78 2.59 2.59 Transverse Scan Rate (cm/s) 5.00 7.00 4.00 Transverse Scan Width (cm) 16.5 16.5 16.5 Forward Scan Rate (cm/s) 0.05 0.07 0.04 Transverse Overlap (%) 72.2 80.6 88.9 Forward Overlap (%) 45.0 45.0 45.0 Average Pulses per Pass 6.5 9.4 16.4 Total No. of Passes 1 1 1 Average Total Fluence (J/cm2) 18.2 24.2 42.4 Coverage Rate (cm2/s) 0.83 1.16 0.66 No. of Wedge Test Adherends** 4-2024 4-2024 4-2024
4-7075 No. of Wedge Test Adherends** 4-2024*** 4-2024*** No. of Lap Shear Adherends** 4-2024 4-2024 4-2024 No. of Peel Adherends** 4-2024 4-2024 4-2024 No. of SEM Coupons 4-2024
4-7075 4-2024 4-7075
4-2024 4-7075
* Automatic scanning in the forward direction ** Entry gives number of samples (adherends) processed and alloy type (4 samples yield two test panels) *** These panels were subjected to 140°F wedge test; control coupons included phosphoric acid anodize (PAA) surface preparation

65
Table A-13. Test matrix for Laserline LDF600-500 in the LPT-2 Test Series.
Test Parameter Test Condition
1-DL
Test Condition
2-DL
Test Condition
3-DL
Laser Average Power (W) 207 207 207 Spot Diameter (mm) 0.5 0.5 0.5 Irradiance (kW/cm2) 105 105 105 Effective Pulse Width (µs) 3334 3334 1667 Effective Pulse Fluence (J/cm2) 351.63 351.63 175.79 Transverse Scan Rep. Rate (Hz) 3.33 3.33 6.67 Transverse Scan Rate (cm/s) 15.00 15.00 30.00 Transverse Scan Width (cm) 4.5 4.5 4.5 Forward Scan Rate (cm/s) 0.25 0.13 0.50 Forward Overlap (%) -52.4 25.0 -50.0 Total No. of Passes 2 1 2 Average Total Fluence (J/cm2) 362.2 368.0 184.0 Coverage Rate per Pass (cm2/s) 1.1 0.6 2.3 Total Coverage Rate (cm2/s) 0.6 0.6 1.1 No. of Wedge Test Adherends* 4-2024 2-2024 2-2024 No. of Lap Shear Adherends* No. of Peel Adherends*
* Entry gives number of samples (adherends) to be processed and alloy type (4 samples yields two test panels)