age structure, dispersion and diet of a population of stoats
TRANSCRIPT
Purdey et al.—Stoat population ecology 205
*Author for correspondence.Z04005; Online publication date 23 August 2004 Received 28 February 2004; accepted 3 May 2004
New Zealand Journal of Zoology, 2004, Vol. 31: 205–2250301–4223/04/3103–0205 © The Royal Society of New Zealand 2004
Age structure, dispersion and diet of a population of stoats (Mustela erminea) in southern Fiordland during the decline phase of the beechmast cycle
Fenn trapping at the same 30 sites, but with multiple traps per station (1333.5 trap nights), in late January 2001 collected carcasses of 35 males and 28 females (including 12 of the marked live-trapped ones). Another two marked males were recovered dead. The stoat population showed no sign of chronic nutritional stress (average fat reserve index = 2.8 on a scale of 1–4 where 4 = highest fat content); and only one of 63 guts analysed was empty. Nev-ertheless, all 76 stoats handled were adults with 1–3 cementum annuli in their teeth, showing that reproduction had failed that season. Prey categories recorded in descending frequency of occurrence were birds, carabid beetle (ground beetle), weta, pos-sum, rat, and mouse. The frequencies of occurrence of mice and birds in the diet of these stoats (10% and 48%, respectively) were quite different from those in stoats collected in Pig Creek, a tributary of the Borland River (87%, 5%), 12 months previously when mice were still abundant. Five of the six stoat guts containing mice were collected within 1 km of stations 14–22.
Keywords stoat; Mustela erminea; home range width; radio tracking; diet analysis; age structure; mouse; Mus musculus
INTRODUCTION
The stoat is the most common mammalian carnivore in South Island beech (Nothofagus spp.) forests. A heavy beech seed-fall (also known as a mast) sets off a predictable sequence of events, the beechmast cycle (Wardle 1984; Murphy & Dowding 1995; King 2002). An increase in numbers and/or availability of mice over the winter and early spring after the seed-fall is followed by an irruption of stoats in summer (9 months after the seed-fall), which declines in autumn (King 1983). In undisturbed populations, capture rates may still be higher than normal in the following summer, 21 months after the seed-fall (Murphy & Dowding 1995), even though mice are by then very scarce.
D. C. PURDEYC. M. KING*
University of WaikatoPrivate Bag 3105Hamilton, New Zealand
B. LAWRENCEMalaghans Road, RD1Queenstown, New Zealand
Abstract The dispersion, age structure and diet of stoats (Mustela erminea) in beech forest in the Borland and Grebe Valleys, Fiordland National Park, were examined during December and January 2000/01, 20 months after a heavy seed-fall in 1999. Thirty trap stations were set along a 38-km transect through almost continuous beech forest, at least 1 km apart. Mice were very scarce (<1 capture per 100 trap nights, C/100TN) along two standard index lines placed at either end of the transect, compared with November 1999 (>60/100TN), but mice were detected (from footprints in stoat tunnels) along an 8 km central section of the transect (stations 14–22). Live trapping with one trap per station (total 317.5 trap nights) in December 2000 caught 2 female and 23 male stoats, of which 10 (including both females) were radio collared. The minimum range lengths of the two females along the transect represented by the trap line were 2.2 and 6.0 km; those of eight radio-tracked males averaged 2.9 ± 1.7 km. Stations 14–22 tended to be visited more often, by more marked individual stoats, than the other 21 stations.
New Zealand Journal of Zoology, 2004, Vol. 31206
The population dynamics of a local stoat popula-tion is profoundly affected by a heavy beech seed-fall. Stoats born during the post-seed-fall bonanza of mice grow larger but suffer higher fi rst-year mortal-ity than those born in non-seed-fall years (Powell & King 1997), and those that do survive to their fi rst breeding season achieve much lower breeding suc-cess or even none at all (King et al. 2003b). Riney et al. (1959) were the fi rst to suggest that the responses of mice and stoats to a seed-fall might be causally linked, and also that there might be a period of increased danger for birds from temporary prey-switching by stoats after the mice declined. However, direct evidence for Riney et al.’s second hypothesis has been hard to establish. Stoats eat many birds at all stages of the beech cycle, not only when mice are declining (King & Moody 1982; Murphy & Dowding 1995). King (1983) found that individual stoats collected through two beech cycles in the 1970s did not eat signifi cant-ly fewer birds per head in summers when there were plenty of mice, but more birds in total were eaten in those summers because of the strong numerical response of stoats to mice and the lack of “buffering” of birds by abundant mice. In the autumns of two post-seed-fall years, stoats did not switch to birds in the autumn as mice declined. However, the stoats examined by King were collected from regularly harvested populations in the Eglinton and Hollyford Valleys, northern Fiordland, and at Craigieburn For-est Park, where the maximum capture rate for mice recorded was 25 C/100TN (the number of captures per 100 corrected trap nights), and the numbers of stoats and of mice declined together from mid summer onwards. It would be a better test of Riney et al.’s hypothesis to ask whether the same lack of switching to birds would be observed in non-har-vested populations in areas where the peak capture rate of mice, and the ratio of stoats to rodents during the mouse decline, are both higher than in the areas previously studied. Stoats in New Zealand also include invertebrates in their diets, just as they do overseas (Day 1968; McDonald et al. 2000). Insects constitute a signifi -cant proportion of the items taken by stoats in New Zealand beech forests, even though insects provide little nutritive biomass for stoats (Rickard 1996). Among the insects eaten by New Zealand stoats are Carabidae, or ground beetles, and weta (Orthoptera); some species of these families are considered threat-ened (McGuinness 2001), and these too might be at greater risk during mouse declines in non-harvested populations.
METHODS
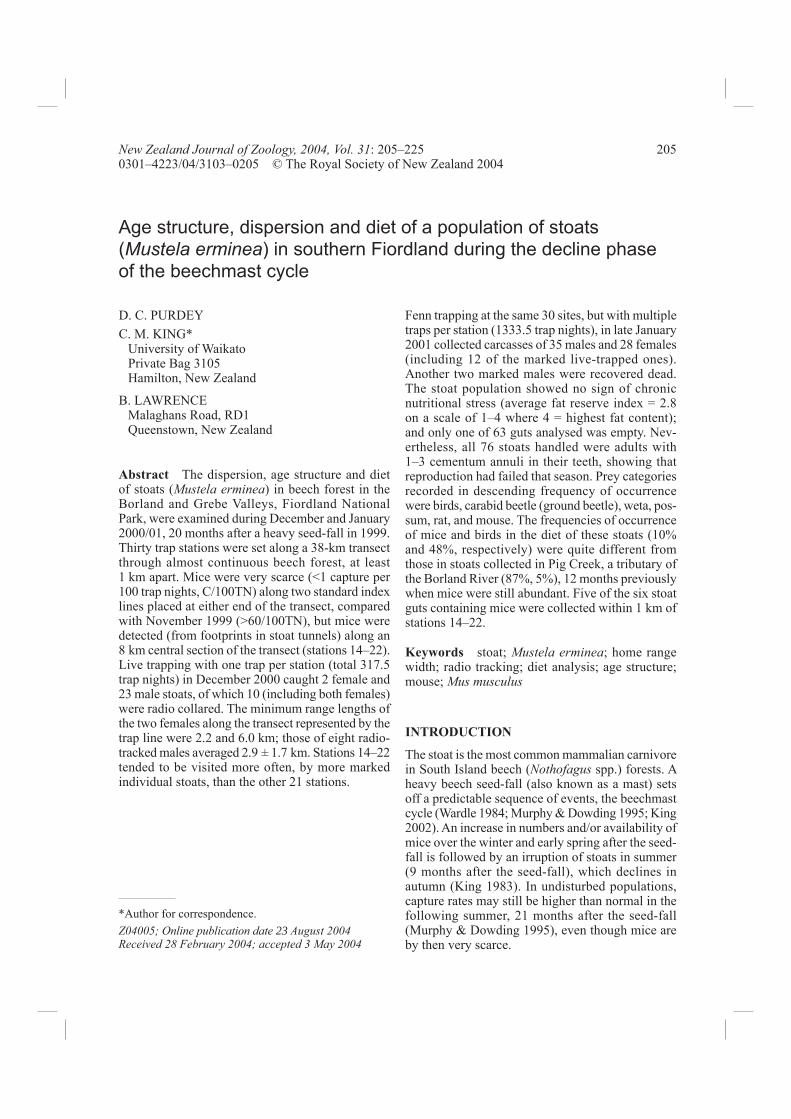
Study siteWe sampled a population of stoats in the Borland and Grebe Valleys, in southern Fiordland National Park, during a fi eld trial of a new bait delivery system in December and January 2000–01 (Purdey et al. 2001, 2003). A 38-km gravel track runs from Borland Lodge to the South Arm of Lake Manapouri (Fig. 1), for servicing part of an electrical pylon line, which provided a well-defi ned transect of suffi cient length through almost continuous forest. Only two previous small mammal trapping stud-ies had been done in this area. (1) In the summer of 1979/80, King (1983) compared the capture rates of stoats and rodents in the Grebe and Borland with those in the Eglinton and Hollyford Valleys after the heavy beech seed-fall of 1979. (2) In the summer of 1999/2000, mouse index lines run in November and February, in the same positions as in 1979/80, confi rmed an irruption of mice after the seed-fall of 1999, and from October to March the Department of Conservation operated a stoat trap line along the Pig Creek (Fig.1) tributary of the Borland River (Riddell & Southey 2001), but not along the track to Lake Manapouri. We therefore expected that any stoats caught along the transect in 2000/01 would represent a population relatively free from human interference. In most of Fiordland there had been a heavy beech seed-fall in the autumn of 1999, and in places also, untypically, a second one in 2000 (Dilks et al. 2003). We had no seed records for our study area, but confi rmed the 1999 seed-fall from the massive sprouting of beech seedlings in summer 1999/2000 (C. M. King pers. obs.). We had no seed-fall obser-vations for the 2000 season in our study area, but deduced in retrospect that it was not a heavy mast year there.
Sampling of miceIn order to avoid the cleared swathe under the power lines, the rodent traps were placed in closed-canopy forest along Pig Creek (representing the Borland Val-ley) and along the lower Grebe Valley (past the point where the power lines turn west up Percy Stream) (Fig. 1). The trap lines were set in December 2000, and run according to the same protocol (36 stations with two traps each, 50 m between each station) used previously in the same area in 1979 (King 1983). The Borland Valley line was also run by P. Jamieson in November 1999 (King et al. 2003b). Results were expressed as the number of captures per
Purdey et al.—Stoat population ecology 207
Fig. 1 The Borland and Grebe Valleys in Fiordland National Park. Solid line = the gravel track we used as a transect, with sampling stations 1–30 (fi lled circles) at nominal 1-km intervals; shaded areas = beech (Nothofagus) for-est; stars = the locations of the two rodent index lines set during December 2000.
100 corrected trap nights, allowing for unavailable traps (Nelson & Clark 1973), with 95% confi dence intervals.
Sampling of stoatsThe trial was conducted in three phases. First, thirty trap stations were positioned at nominal 1-km inter-vals along the track (Fig. 1, Table 1), in the expecta-tion that each station would sample the population independently of the others (Brown & Miller 1998). At each station, two sites, one on each side of the track, were established between 10 and 20 m apart. In places, especially where the terrain was very steep, spacing had to be varied somewhat. From the pass at 950 m a.s.l. down into the Grebe Valley, the track drops 400 m between stations 12 and 15, along a series of hairpin bends which exaggerate the real spacings between these four stations as measured along the track. Only two other inter-station dis-tances exceeded 1200 m.
Phase 1: Live trapping: 11–23 December 2000 At one site of the two at each station (determined by the fl ip of a coin) a live trap was set. At the other, a Philproof™ trap tunnel, with a corfl ute fl oor support-ing plain brown tracking papers and food colouring for ink, was set. All were baited with a piece of beef. Live traps (30, mixed Edgars and Elliotts) were run for 12 consecutive nights (total 317.5 trap nights; not all traps were set every night) and inspected daily. A live trap was decommissioned if an individual had been recaptured at that station more than once over
the previous 3 nights, in case it might not survive another night in the trap. All live traps were removed on 23 December 2000. Tracking papers were changed daily, and tracks identifi ed with the help of the key provided by Ratz (1997). Captured animals were anaesthetised with Halo-thane and ear tagged, and 10 were also fi tted with two-phase radio collars weighing 13.5 g (Sirtrack Wildlife Tracking Systems, Havelock North, New Zealand). Radio tracking of the 10 collared stoats began on the day after each animal’s fi rst capture in December, and continued until 13 January except for the period 24–31 December. A vehicle-mounted receiver and a hand-held, three-element yagi antenna were used to give daily locations.
Phase 2: Bait trials: 1–13 January 2001At the 20 stations where stoats were most often live-trapped, we set experimental Scentinel® bait stations (Purdey et al. 2001) at one site, and locked-open Fenn traps at the other, both in identical Phil-proof tunnels and equipped with footprint tracking papers to identify animals taking the baits. Baits at the two sites carried different systemic bait mark-ers: Scentinel baits were marked with Rhodamine B (15 mg per 3-g bait, or 5 mg/g body weight when one bait is eaten by a 250 g stoat), and the egg baits in the Fenn sets with iophenoxic acid (1 ml IPA in ethanol at 2 mg/ml injected into a 50-g egg, or 8 mg IPA per kg body weight if the whole egg is eaten by a 250 g stoat) (Purdey et al. 2003). Five
New Zealand Journal of Zoology, 2004, Vol. 31208
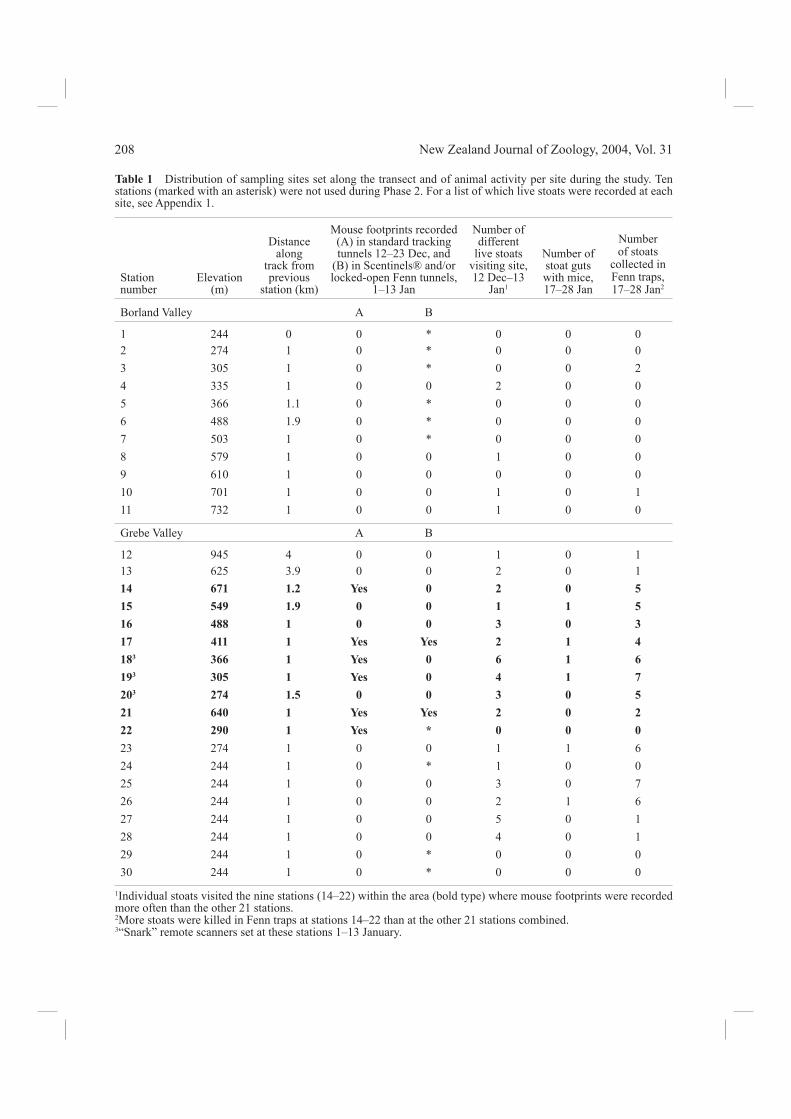
Table 1 Distribution of sampling sites set along the transect and of animal activity per site during the study. Ten stations (marked with an asterisk) were not used during Phase 2. For a list of which live stoats were recorded at each site, see Appendix 1.
Station number
Elevation (m)
Distance along
track from previous
station (km)
Mouse footprints recorded (A) in standard tracking tunnels 12–23 Dec, and
(B) in Scentinels® and/or locked-open Fenn tunnels,
1–13 Jan
Number of different
live stoats visiting site, 12 Dec–13
Jan1
Number of stoat guts with mice, 17–28 Jan
Number of stoats
collected in Fenn traps, 17–28 Jan2
Borland Valley A B
1 244 0 0 * 0 0 02 274 1 0 * 0 0 03 305 1 0 * 0 0 24 335 1 0 0 2 0 05 366 1.1 0 * 0 0 06 488 1.9 0 * 0 0 07 503 1 0 * 0 0 08 579 1 0 0 1 0 09 610 1 0 0 0 0 010 701 1 0 0 1 0 111 732 1 0 0 1 0 0
Grebe Valley A B
12 945 4 0 0 1 0 113 625 3.9 0 0 2 0 114 671 1.2 Yes 0 2 0 515 549 1.9 0 0 1 1 516 488 1 0 0 3 0 317 411 1 Yes Yes 2 1 4183 366 1 Yes 0 6 1 6193 305 1 Yes 0 4 1 7203 274 1.5 0 0 3 0 521 640 1 Yes Yes 2 0 222 290 1 Yes * 0 0 023 274 1 0 0 1 1 624 244 1 0 * 1 0 025 244 1 0 0 3 0 726 244 1 0 0 2 1 627 244 1 0 0 5 0 128 244 1 0 0 4 0 129 244 1 0 * 0 0 030 244 1 0 * 0 0 0
1Individual stoats visited the nine stations (14–22) within the area (bold type) where mouse footprints were recorded more often than the other 21 stations. 2More stoats were killed in Fenn traps at stations 14–22 than at the other 21 stations combined. 3“Snark” remote scanners set at these stations 1–13 January.
Purdey et al.—Stoat population ecology 209
“Snark” remote scanners (designed by the Depart-ment of Conservation, Wellington), programmed to record the frequencies of the 10 radio collars, were set at the three adjacent stations that produced most live-trapping records. They registered any radio-collared animal(s) that came within a 10-m radius of the tunnels at stations 18 (both sites), 19 (Scentinel site), and 20 (both sites). Video surveillance cameras were set up at stations 18 and 20.
Phase 3: Kill-trapping: 17–28 January 2001 During the third and last phase of the trial, both sites at the 30 stations were equipped with double Mark IV Fenn traps baited with a hen’s egg (total 1333.5 trap nights) in Philproof tunnels. The Fenn traps were set on 16 January and inspected daily for 12 days.
Estimation of range length (radio collars, tracking, and live-kill trapping)Three methods were used to estimate the approxi-mate length of the transect (represented by the track) used by each monitored animal. Servicing of the trap line took 10 h each day, so each collared stoat was located only once between the hours of 8 a.m. and 6 p.m. Actual home ranges could not be measured. Instead, only the minimal extent of linear movement and dispersion of the stoats was recorded along the transect. Minimum range length was taken as the greatest distance between the stations at which each animal was recorded in live traps, or live trapped and later Fenn trapped, plus half the distance to the next adjacent station in both directions. For collared stoats these data were supplemented with informa-tion from Snarks and radio locations.
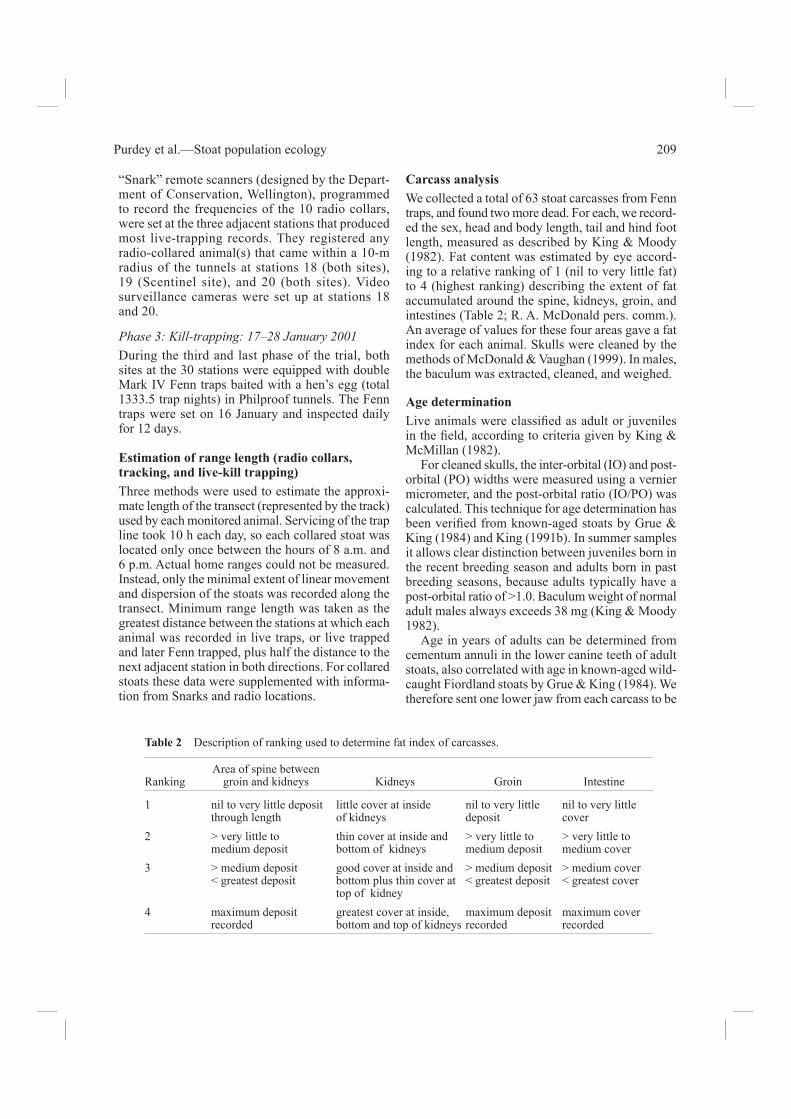
Carcass analysisWe collected a total of 63 stoat carcasses from Fenn traps, and found two more dead. For each, we record-ed the sex, head and body length, tail and hind foot length, measured as described by King & Moody (1982). Fat content was estimated by eye accord-ing to a relative ranking of 1 (nil to very little fat) to 4 (highest ranking) describing the extent of fat accumulated around the spine, kidneys, groin, and intestines (Table 2; R. A. McDonald pers. comm.). An average of values for these four areas gave a fat index for each animal. Skulls were cleaned by the methods of McDonald & Vaughan (1999). In males, the baculum was extracted, cleaned, and weighed.
Age determinationLive animals were classifi ed as adult or juveniles in the fi eld, according to criteria given by King & McMillan (1982). For cleaned skulls, the inter-orbital (IO) and post-orbital (PO) widths were measured using a vernier micrometer, and the post-orbital ratio (IO/PO) was calculated. This technique for age determination has been verifi ed from known-aged stoats by Grue & King (1984) and King (1991b). In summer samples it allows clear distinction between juveniles born in the recent breeding season and adults born in past breeding seasons, because adults typically have a post-orbital ratio of >1.0. Baculum weight of normal adult males always exceeds 38 mg (King & Moody 1982). Age in years of adults can be determined from cementum annuli in the lower canine teeth of adult stoats, also correlated with age in known-aged wild-caught Fiordland stoats by Grue & King (1984). We therefore sent one lower jaw from each carcass to be
Table 2 Description of ranking used to determine fat index of carcasses.
RankingArea of spine between
groin and kidneys Kidneys Groin Intestine
1 nil to very little deposit through length
little cover at inside of kidneys
nil to very little deposit
nil to very little cover
2 > very little to medium deposit
thin cover at inside and bottom of kidneys
> very little to medium deposit
> very little to medium cover
3 > medium deposit < greatest deposit
good cover at inside and bottom plus thin cover at top of kidney
> medium deposit < greatest deposit
> medium cover < greatest cover
4 maximum deposit recorded
greatest cover at inside, bottom and top of kidneys
maximum deposit recorded
maximum cover recorded
New Zealand Journal of Zoology, 2004, Vol. 31210
sectioned and read for cementum annuli by Matson’s Laboratory, Montana, USA.
Diet analysisThe contents of the digestive tracts, from stomach to rectum, were examined. The entire tract was removed as one section and the contents squeezed out through its length into a fi ne-gauge (0.5 mm) sieve. Lightly pressured tap water was then applied to the mass of digesta to remove all fl uid material so that only the undigested solids were retained. The material was examined under a low-power stereomicroscope (×8 to ×35) to identify prey items. The data were expressed as a percentage frequency distribution of prey items among all stomachs with contents. A stoat was considered to have consumed one prey item if any number of remains from that category was discovered in its gut.
Categories of prey identifi edBirds: Feathers were the most easily identifi able bird remains, though sections of leg with scaled skin attached, or bones and claws, were occasionally found. Identifi cation went no further than “bird” for all feathers.Egg shell: The few pieces of egg shell found were usually too small to identify to species. Mammals: Mammal identification followed the methods described by Day (1966) and King & Moody (1982). Guard hairs retrieved from digesta were examined for length, shape and colour, and the internal medulla was examined under a compound microscope (×100 to ×400). Hairs were then placed on a slide in 5% gelatine, left to set dry, then pulled away to leave an impression of the external scale pattern, which was examined at ×40. Hairs were identifi ed to genus or species when possible. The
list of possible identifi cations was short (mouse, rat, lagomorph, possum, or stoat). Unidentifi ed hairs were listed simply as “unidentifi ed mammal”.Invertebrates: Recognisable remains included legs, parts of abdomens, wing cases and occasionally a distorted portion of a head. These were classi-fi ed to order, family or genus level where possible. Fragments beyond recognition or unidentifi ed were categorised as “other invertebrate” (Sharell 1971; Child 1974; Walker & Cox 1984).
Statistical analysisA Wilcoxon rank-sum test was used to compare the frequency of occurrence of stoats recorded per day during Phase 1 in the live traps and the tracking tunnels. Data from gut analyses were collated as the per-centage frequency of occurrence of each category of prey among the 63 guts examined. A 2 × 2 Fisher’s exact test was used to compare the frequency of oc-currence of prey items in diets of males and female stoats.
RESULTS
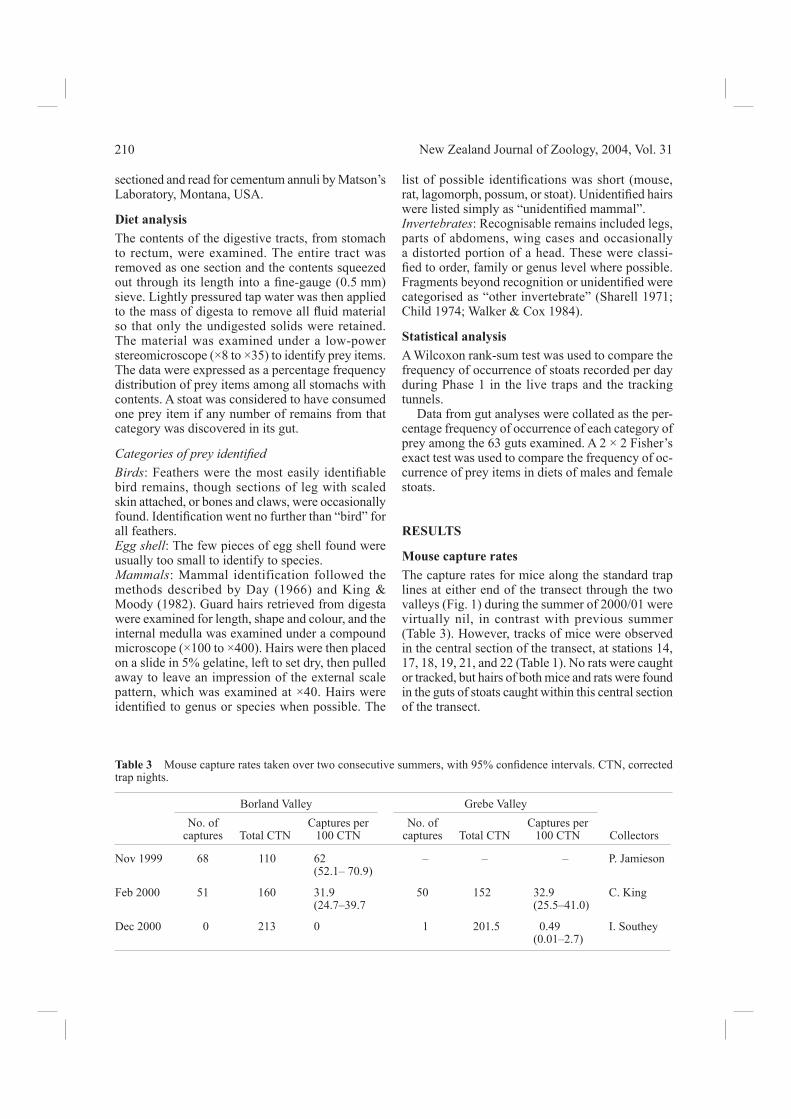
Mouse capture ratesThe capture rates for mice along the standard trap lines at either end of the transect through the two valleys (Fig. 1) during the summer of 2000/01 were virtually nil, in contrast with previous summer (Table 3). However, tracks of mice were observed in the central section of the transect, at stations 14, 17, 18, 19, 21, and 22 (Table 1). No rats were caught or tracked, but hairs of both mice and rats were found in the guts of stoats caught within this central section of the transect.
Table 3 Mouse capture rates taken over two consecutive summers, with 95% confi dence intervals. CTN, corrected trap nights.
Borland Valley Grebe ValleyNo. of
captures Total CTNCaptures per
100 CTNNo. of
captures Total CTNCaptures per
100 CTN Collectors
Nov 1999 68 110 62 (52.1– 70.9)
– – – P. Jamieson
Feb 2000 51 160 31.9 (24.7–39.7
50 152 32.9 (25.5–41.0)
C. King
Dec 2000 0 213 0 1 201.5 0.49 (0.01–2.7)
I. Southey
Purdey et al.—Stoat population ecology 211
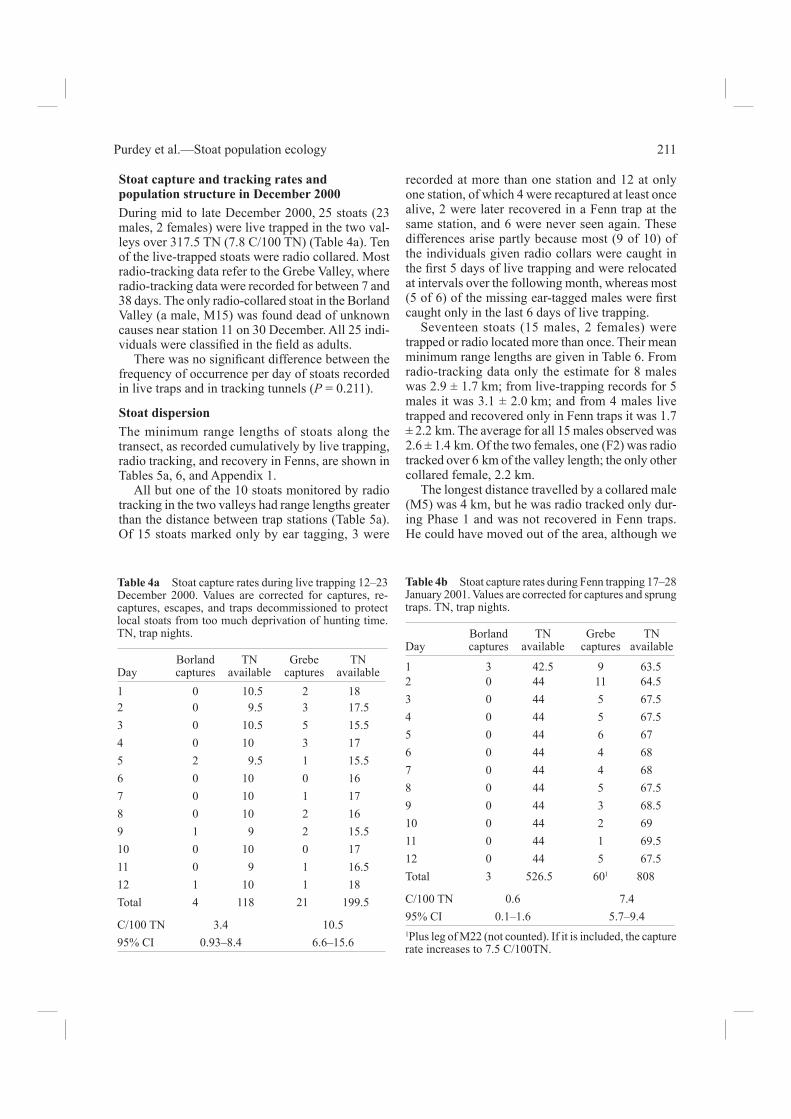
Stoat capture and tracking rates and population structure in December 2000 During mid to late December 2000, 25 stoats (23 males, 2 females) were live trapped in the two val-leys over 317.5 TN (7.8 C/100 TN) (Table 4a). Ten of the live-trapped stoats were radio collared. Most radio-tracking data refer to the Grebe Valley, where radio-tracking data were recorded for between 7 and 38 days. The only radio-collared stoat in the Borland Valley (a male, M15) was found dead of unknown causes near station 11 on 30 December. All 25 indi-viduals were classifi ed in the fi eld as adults. There was no signifi cant difference between the frequency of occurrence per day of stoats recorded in live traps and in tracking tunnels (P = 0.211).
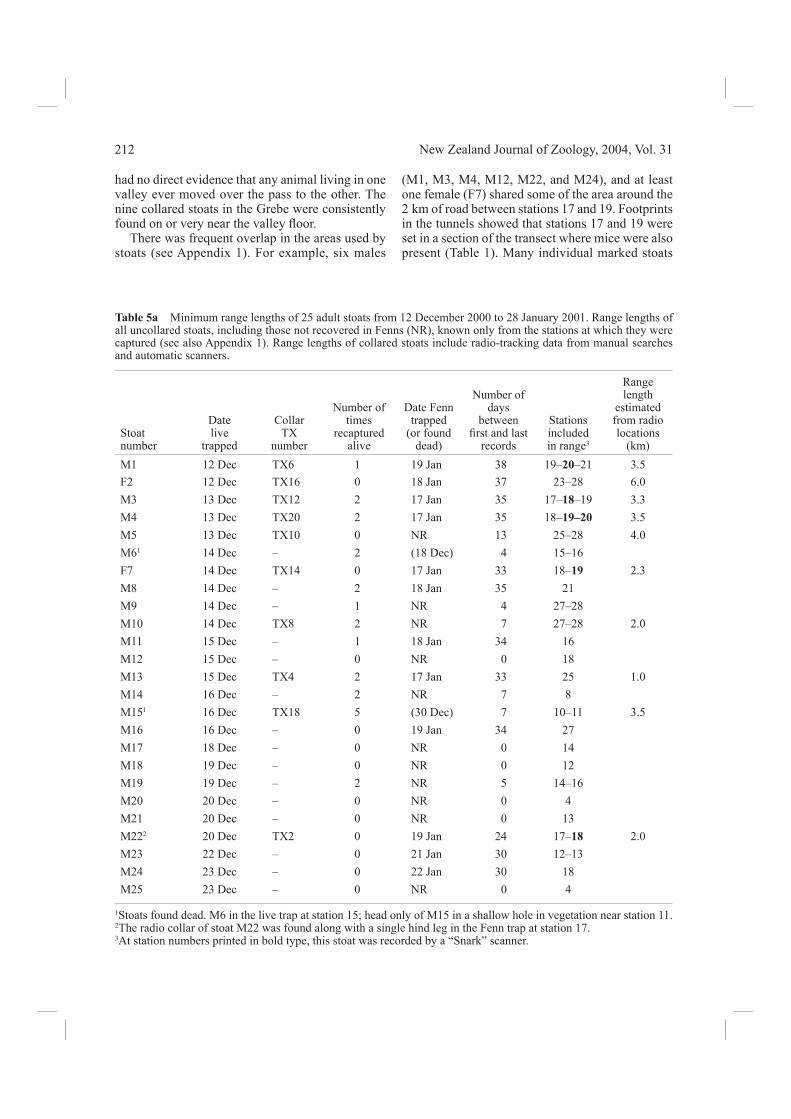
Stoat dispersionThe minimum range lengths of stoats along the transect, as recorded cumulatively by live trapping, radio tracking, and recovery in Fenns, are shown in Tables 5a, 6, and Appendix 1. All but one of the 10 stoats monitored by radio tracking in the two valleys had range lengths greater than the distance between trap stations (Table 5a). Of 15 stoats marked only by ear tagging, 3 were
recorded at more than one station and 12 at only one station, of which 4 were recaptured at least once alive, 2 were later recovered in a Fenn trap at the same station, and 6 were never seen again. These differences arise partly because most (9 of 10) of the individuals given radio collars were caught in the fi rst 5 days of live trapping and were relocated at intervals over the following month, whereas most (5 of 6) of the missing ear-tagged males were fi rst caught only in the last 6 days of live trapping. Seventeen stoats (15 males, 2 females) were trapped or radio located more than once. Their mean minimum range lengths are given in Table 6. From radio-tracking data only the estimate for 8 males was 2.9 ± 1.7 km; from live-trapping records for 5 males it was 3.1 ± 2.0 km; and from 4 males live trapped and recovered only in Fenn traps it was 1.7 ± 2.2 km. The average for all 15 males observed was 2.6 ± 1.4 km. Of the two females, one (F2) was radio tracked over 6 km of the valley length; the only other collared female, 2.2 km. The longest distance travelled by a collared male (M5) was 4 km, but he was radio tracked only dur-ing Phase 1 and was not recovered in Fenn traps. He could have moved out of the area, although we
Table 4a Stoat capture rates during live trapping 12–23 December 2000. Values are corrected for captures, re-captures, escapes, and traps decommissioned to protect local stoats from too much deprivation of hunting time. TN, trap nights.
DayBorlandcaptures
TNavailable
Grebecaptures
TNavailable
1 0 10.5 2 182 0 9.5 3 17.53 0 10.5 5 15.54 0 10 3 175 2 9.5 1 15.56 0 10 0 167 0 10 1 178 0 10 2 169 1 9 2 15.510 0 10 0 1711 0 9 1 16.512 1 10 1 18Total 4 118 21 199.5
C/100 TN 3.4 10.595% CI 0.93–8.4 6.6–15.6
Table 4b Stoat capture rates during Fenn trapping 17–28 January 2001. Values are corrected for captures and sprung traps. TN, trap nights.
DayBorlandcaptures
TN available
Grebecaptures
TNavailable
1 3 42.5 9 63.52 0 44 11 64.53 0 44 5 67.54 0 44 5 67.55 0 44 6 676 0 44 4 687 0 44 4 688 0 44 5 67.59 0 44 3 68.510 0 44 2 6911 0 44 1 69.512 0 44 5 67.5Total 3 526.5 601 808
C/100 TN 0.6 7.495% CI 0.1–1.6 5.7–9.41Plus leg of M22 (not counted). If it is included, the capture rate increases to 7.5 C/100TN.
New Zealand Journal of Zoology, 2004, Vol. 31212
had no direct evidence that any animal living in one valley ever moved over the pass to the other. The nine collared stoats in the Grebe were consistently found on or very near the valley fl oor. There was frequent overlap in the areas used by stoats (see Appendix 1). For example, six males
(M1, M3, M4, M12, M22, and M24), and at least one female (F7) shared some of the area around the 2 km of road between stations 17 and 19. Footprints in the tunnels showed that stations 17 and 19 were set in a section of the transect where mice were also present (Table 1). Many individual marked stoats
Table 5a Minimum range lengths of 25 adult stoats from 12 December 2000 to 28 January 2001. Range lengths of all uncollared stoats, including those not recovered in Fenns (NR), known only from the stations at which they were captured (see also Appendix 1). Range lengths of collared stoats include radio-tracking data from manual searches and automatic scanners.
Stoatnumber
Datelive
trapped
CollarTX
number
Number oftimes
recapturedalive
Date Fenntrapped
(or founddead)
Number ofdays
betweenfi rst and last
records
Stationsincludedin range3
Range length
estimatedfrom radiolocations
(km)M1 12 Dec TX6 1 19 Jan 38 19–20–21 3.5F2 12 Dec TX16 0 18 Jan 37 23–28 6.0M3 13 Dec TX12 2 17 Jan 35 17–18–19 3.3M4 13 Dec TX20 2 17 Jan 35 18–19–20 3.5M5 13 Dec TX10 0 NR 13 25–28 4.0M61 14 Dec – 2 (18 Dec) 4 15–16F7 14 Dec TX14 0 17 Jan 33 18–19 2.3M8 14 Dec – 2 18 Jan 35 21M9 14 Dec – 1 NR 4 27–28M10 14 Dec TX8 2 NR 7 27–28 2.0M11 15 Dec – 1 18 Jan 34 16M12 15 Dec – 0 NR 0 18M13 15 Dec TX4 2 17 Jan 33 25 1.0M14 16 Dec – 2 NR 7 8M151 16 Dec TX18 5 (30 Dec) 7 10–11 3.5M16 16 Dec – 0 19 Jan 34 27M17 18 Dec – 0 NR 0 14M18 19 Dec – 0 NR 0 12M19 19 Dec – 2 NR 5 14–16M20 20 Dec – 0 NR 0 4M21 20 Dec – 0 NR 0 13M222 20 Dec TX2 0 19 Jan 24 17–18 2.0M23 22 Dec – 0 21 Jan 30 12–13M24 23 Dec – 0 22 Jan 30 18M25 23 Dec – 0 NR 0 4
1Stoats found dead. M6 in the live trap at station 15; head only of M15 in a shallow hole in vegetation near station 11. 2The radio collar of stoat M22 was found along with a single hind leg in the Fenn trap at station 17. 3At station numbers printed in bold type, this stoat was recorded by a “Snark” scanner.
Purdey et al.—Stoat population ecology 213
were detected visiting the nine stations in this sector (Table 1). Snarks at stations 18, 19, and 20 confi rmed that at least two different collared stoats visited all three stations (Table 5a). The range of F2 included stations 23–28 in the Grebe Valley during Phase 1, but during Phase 2 she was recorded only at station 23. Stoat M5 ranged between stations 25–28 in Phase 1 but was absent in Phases 2 and 3, while stoat F7 was confi ned to station 19 in Phase 1 but ranged between two sta-tions (18 and 19) in Phase 2. Stoat M22 increased his range from one (17) to two stations (17 and 18) between Phases 1 and 2. M1, M4, M11, and M22 all increased their ranges by one station. The remaining animals whose movement could be tracked did not appear to alter their range lengths through the trial. Two of the three collared stoats (M3, M22) that had been captured at station 18 were recorded by scanners at that station, but not two other stoats (M4, F7) known to be present within 1.5 km. Re-peat visits here could not be confi rmed because the scanner at this site malfunctioned after the second night, but video footage confi rmed the presence of a collared stoat on several occasions. Two of the fi ve
collared animals (M4, F7) captured within 1.5 km of station 19 came within 10 m of the bait station and were recorded by the scanner beside it, but not two others (M1, M3) known to be present within 1.5 km. At station 20, two of three collared animals (M1, M4) present within 1.5 km came within range of the scanners, and the video cameras operating here confi rmed that they triggered and fed from the dispenser, but another (F7) did not.
DietThe results of the diet analysis are listed in Table 7. All prey items identifi ed were terrestrial or arboreal animals, known or expected to be present in the beech forest environment. Birds were the most frequently identifi ed prey item (found in 47.6% of guts). Four samples con-tained eggshell, but only a few, minute fragments. One was clearly part of a hen’s egg so, as hen’s eggs were used for baiting the Fenn traps in Phase 3, this record was excluded from the analysis. Colours on the remaining three sets of fragments were cream, cream with reddish-brown speckles, and pale blue.
Table 5b Fates of the 76 stoats handled in the two valleys during Phases 1 and 3, December–January 2000/01.
Borland Valley Grebe Valley
Phase 1Total number caught 4 (all M) 21 (19 M, 2 F)Number ear tagged and radio collared
1 9 (7 M, 2 F)
Ear-tagged only 3 12 (M)Found dead in a live trap in vegetation
–1 (collared)
1 (M)–
Maximum number surviving to Phase 3
3 20
Phase 3 Tagged but never recovered radio collared ear-tagged only
03 (M)
2 (M)6 (M)
Tagged and recovered 0 12 collared, whole carcass collared, scavenged
––
7 (5 M, 2 F)1 (M)
tagged only – 4 (M)Untagged 3 (F) 48 (25 M, 23 F)Totals 7 69
New Zealand Journal of Zoology, 2004, Vol. 31214
Remains of rats (probably Rattus rattus) and mice (Mus musculus), were found, six each (9.5%), in 11 stoats. Four of the six stoats containing mouse remains were trapped at stations 15, 17, 18, and 19, and another within 1 km of station 22, all of which were in the area where the tracking tunnels recorded mouse activity (Table 1). Stoat hairs were found infrequently and only in small numbers scattered among the digesta, prob-ably a result of self-grooming. One stoat found dead 3 weeks before the start of Fenn trapping (M15) had been scavenged, presumably by other stoats; another (M22) was scavenged whilst held in a Fenn trap. Ten of the stoat guts (16%) contained possum hairs and four contained maggots. The maggots might have been ingested with possum carrion, but possum remains and maggots were found together in only one gut. The Fenn traps were checked daily, but it is possible that some of the maggots could have hatched from eggs laid on the stoat carcasses, and found their way into the gut by the time the carcass was collected. Of the invertebrates, Coleoptera were the most common (found in 35% of guts). The remains of legs, wing cases, and sections of the head allowed most to be further identifi ed as members of the fam-ily Carabidae (ground beetle), possibly belonging to the genera Megadromus or Mecodema. Large beetles were sometimes observed on the ground during the mouse index trapping in December (I. Southey pers. comm.), and they could have been taken easily by stoats living within the study area during that sea-son. Weta were the second most common invertebrate found (in 20.6% of guts). Up to fi ve abdomens with ovipositors attached were taken from the gut con-tents of three stoats. All weta in this category were
of the family Anostostomatidae, most likely the genus Hemiandrus and/or Hemideina (or possibly, though less likely, a small species of Deinacrida), so all confi rmed weta remains were considered to be ground weta. The category “Orthoptera” (8%) was used to label head and leg remains that resembled those of crickets, grass hoppers, and related genera, but were clearly not weta. Fragments of spiders were clearly of the order Araneae but too incomplete to classify further. The category “other invertebrate” included grubs, an earthworm, a species of Odonata, and insect eggs. Altogether, invertebrates were found in 44 of 63 guts (70%).
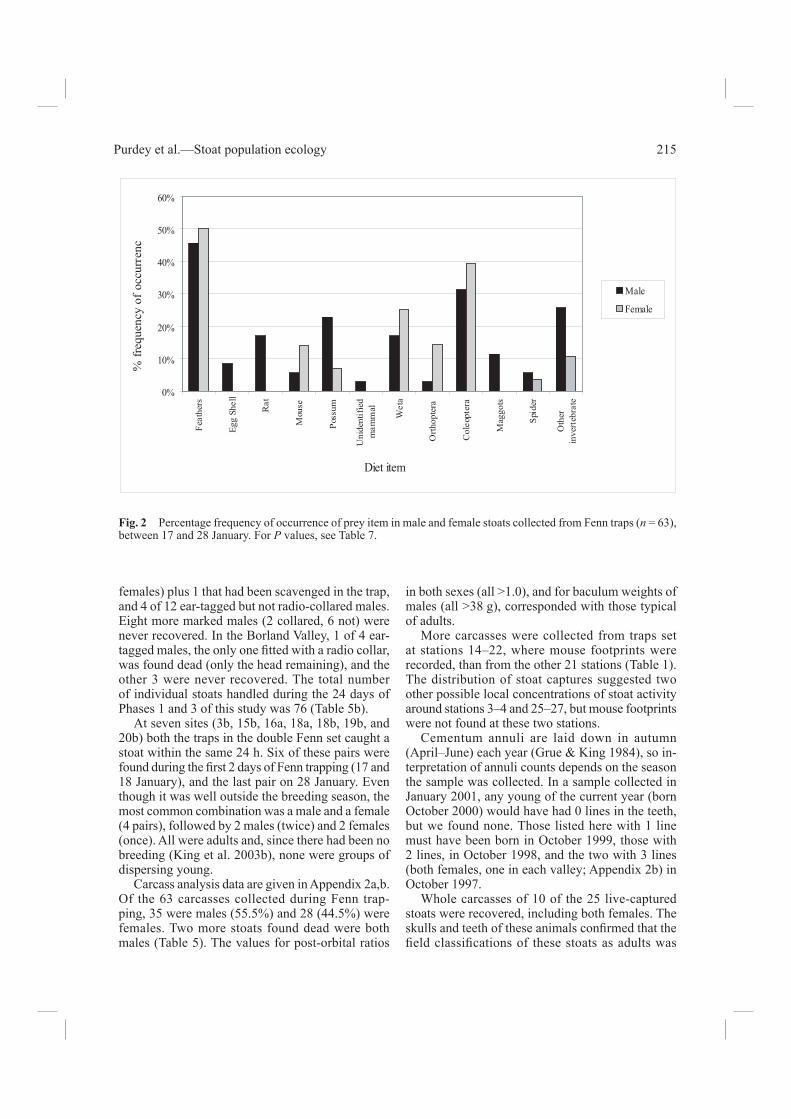
Male and female dietsThe only signifi cant difference between the diets of the two sexes (Fig. 2) was that all six rats found were eaten by males (P = 0.021). Both sexes of stoats took more birds than any other prey type (Table 7). Both also took possums or possum carrion.
Stoat capture rates and population structure in January 2001During the Fenn trapping of mid to late January, the capture rate was 63 stoats over 1335 CTN (4.7 per 100 CTN), of which 3 came from the Borland Valley (0.6 per 100 CTN) and 60 from the Grebe Valley (7.4 per 100 CTN) (Table 4b). In the Grebe Valley, one of the 21 ear-tagged stoats died in a live trap before the Fenns were set. The other carcasses recovered (Table 5b) included 12 of the (at most) 20 stoats which were potentially (if still alive) available to be recaptured (4 on the fi rst day of Fenn trapping, 3 on the second, 3 on the third and 1 each on the fi fth and sixth of the 12 days of trapping). They included 7 of 9 stoats radio collared in the Grebe Valley (5 of 7 males plus both
Table 6 Mean minimum range lengths measured for all male and female stoats located more than once. Techniques used: RT, radio tracking; L, recaptures in live traps; L/F, recaptured only in Fenn traps. Range lengths of uncollared stoats were calculated from the distance between the two furthest stations at which they were caught, plus half the distance to the next station on either side. Six males located only once, and 2 found dead, are omitted (total 25). Grebe and Borland data pooled.
Male range lengths Female range lengthsTechnique used Sample size Mean range length SD Sample size Mean range length SD
RT n = 8 2.9 km ±1.7 n = 2 4.1 km ±2.6L n = 5 3.1 km ±2.2 n = 0 0 0L/F n = 4 1.7 km ±2.2 n = 0 0 0All techniques n = 15 2.6 km ±1.4 n = 2 4.1 km ±2.6
Purdey et al.—Stoat population ecology 215
Fig. 2 Percentage frequency of occurrence of prey item in male and female stoats collected from Fenn traps (n = 63), between 17 and 28 January. For P values, see Table 7.
females) plus 1 that had been scavenged in the trap, and 4 of 12 ear-tagged but not radio-collared males. Eight more marked males (2 collared, 6 not) were never recovered. In the Borland Valley, 1 of 4 ear-tagged males, the only one fi tted with a radio collar, was found dead (only the head remaining), and the other 3 were never recovered. The total number of individual stoats handled during the 24 days of Phases 1 and 3 of this study was 76 (Table 5b). At seven sites (3b, 15b, 16a, 18a, 18b, 19b, and 20b) both the traps in the double Fenn set caught a stoat within the same 24 h. Six of these pairs were found during the fi rst 2 days of Fenn trapping (17 and 18 January), and the last pair on 28 January. Even though it was well outside the breeding season, the most common combination was a male and a female (4 pairs), followed by 2 males (twice) and 2 females (once). All were adults and, since there had been no breeding (King et al. 2003b), none were groups of dispersing young. Carcass analysis data are given in Appendix 2a,b. Of the 63 carcasses collected during Fenn trap-ping, 35 were males (55.5%) and 28 (44.5%) were females. Two more stoats found dead were both males (Table 5). The values for post-orbital ratios
in both sexes (all >1.0), and for baculum weights of males (all >38 g), corresponded with those typical of adults. More carcasses were collected from traps set at stations 14–22, where mouse footprints were recorded, than from the other 21 stations (Table 1). The distribution of stoat captures suggested two other possible local concentrations of stoat activity around stations 3–4 and 25–27, but mouse footprints were not found at these two stations. Cementum annuli are laid down in autumn (April–June) each year (Grue & King 1984), so in-terpretation of annuli counts depends on the season the sample was collected. In a sample collected in January 2001, any young of the current year (born October 2000) would have had 0 lines in the teeth, but we found none. Those listed here with 1 line must have been born in October 1999, those with 2 lines, in October 1998, and the two with 3 lines (both females, one in each valley; Appendix 2b) in October 1997. Whole carcasses of 10 of the 25 live-captured stoats were recovered, including both females. The skulls and teeth of these animals confi rmed that the fi eld classifi cations of these stoats as adults was
0%
10%
20%
30%
40%
50%
60%Fe
athe
rs
Egg
Shel
l
Rat
Mou
se
Poss
um
Uni
dent
ifie
dm
amm
al
Wet
a
Orth
opte
ra
Col
eopt
era
Mag
gots
Spid
er
Oth
erin
vert
ebra
te
Diet item
% fr
eque
ncy
of o
ccur
renc
Male
Female
New Zealand Journal of Zoology, 2004, Vol. 31216
Table 7 Frequency of occurrence of prey items in 63 stoat guts (35 males, 28 females) collected 17–28 January 2001, with SE.
Prey itemTotal stoats
containing prey
% frequency of occurrence of
prey item SE
Difference between sexes (P value, 2 × 2
exact test)
Bird 30 47.6 ±0.07 0.74Egg shell 3 4.8 ±0.15 0.11Rat (Rattus) 6 9.5 ±0.13 0.02Mouse (Mus musculus) 6 9.5 ±0.13 0.25Possum(Trichosurus vulpecula)
10 16.0 ±0.11 0.90
Unidentifi ed mammals 1 1.6 – 0.37Ground weta 13 20.6 ±0.10 0.44Orthoptera 5 8.0 ±0.13 0.10Coleoptera (Carabidae) 22 35.0 ±0.08 0.52Maggots 4 6.3 ±0.13 0.07Spider 3 4.8 ±0.15 0.70Other invertebrates 12 19.0 ±0.11 0.13All invertebrates 44 70 ±0.04 0.1
correct. Assuming the rest of the fi eld classifi cations were also correct, the ratio of young to adult in the total sample was therefore 0:76. All ear-tagged stoats retrieved in Fenn traps (Table 5a), and most stoats carrying bait markers (Purdey et al. 2003), were collected by Day 6 (22 January) of the 12 days of Phase 3. Stoats containing neither of the bait markers offered during Phase 2 (1–13 January) were caught throughout the Fenn trapping in Phase 3 (17–28 January) (Purdey et al. 2003). From these data we cannot distinguish between three possible explanations for these unmarked stoats: (1) they were resident but did not have access to the baits or (2) did not take any of the baits; or (3) they had recently moved into the area. Fenn traps were checked daily during Phase 3. At least six of the 63 captured stoats were not immediately incapacitated by the Fenn traps even when caught correctly, by both the neck and lower abdomen. We found four still alive and attempting to escape from the tunnel. M1 had died only after dragging itself with the trap to the tunnel exit, and M4 after attempting to dig its way out. Others had chewed the tunnel interior extensively. These obser-vations on wild stoats are few but unusual because most Fenn trap lines run in recent years have not been checked daily. They confi rm laboratory tests (B. Warburton unpubl.) showing that the Fenn trap
is not humane enough to meet New Zealand’s new ethical standards for kill traps.
Size and fat contentThe fat content (Appendix 2a,b) of the carcasses (around the kidneys, groin, and abdomen) aver-aged 2.8 ± 0.9 (males = 3 ± 0.9, n = 35; females = 2.7 ± 0.8, n = 28) on a scale of 1–4 (4 = most fat; see Table 2). These fat indices give no evidence of chronic starvation among the Fenn-trapped stoat population, and only one individual had no food remains in its gut.
DISCUSSION
Mouse populationThe rodent index lines were positioned at either end of the transect (Fig. 1), and the mouse capture rates they recorded in both valleys were almost zero (Table 3). No mouse footprints were recorded on the tracking papers in the tunnels at either end of the stoat trap line (stations 1–13 and 23–30). By contrast, in the central section of the line (sta-tions 14–22), mouse footprints were recorded at fi ve stations, and stoats containing mouse remains were trapped at four stations (Table 1). This central
Purdey et al.—Stoat population ecology 217
section of the transect was also the area where most individual live stoats were recorded (Appendix 1) and most carcasses were collected. These observa-tions suggest that, during the periods of low density between mast years, mice may survive in scattered patches of forest that are more easily detected by stoats than by widely separated rodent index lines.
Stoat populationThe very low rodent densities during the 2000/01 summer were typical of crash years following a heavy seed-fall. From the drastic decline in numbers of mice since the previous summer, we had expected to fi nd that the stoats we sampled would be thin and in poor condition. However, the high mean fat indices and the low frequency of empty guts we ob-served gave no evidence of long-term starvation. On the other hand, the potential for short-term starvation of captured animals was a matter of great concern. One (M6) died in a live trap on 18 De-cember, after spending 3 of the previous 5 nights in live traps, and another (M15), found dead on 30 December, had spent 5 nights confi ned to live traps since 16 December. An alternative suggestion is that M15 (and perhaps others that we did not recapture in January) did not starve but, weakened by recent enforced confi nement, was highly stressed and/or less able to defend itself in an aggressive encounter with another stoat. Its body was extensively scav-enged, and found as if cached, lodged in a shallow hole in the ground. The total lack of young of the year in such a large sample is evidence of a complete reproductive fail-ure for that season. This is a well-known character-istic of stoat populations during the second summer after a heavy seed-fall (Murphy & Dowding 1994). The mechanism controlling it is unknown, but is ap-parently more subtle than simple body condition. We have suggested (King et al. 2003b) three alternative hypotheses: (1) physical or social stress associated with large home ranges and higher probability of aggressive interactions, (2) absence of a key limit-ing resource or physiological cue, or (3) chilling of the young consequent upon the prolonged hunting excursions of the lactating females (Segal 1975).
Trap effi ciency Live traps and tracking tunnels were equally effective (or equally ineffective) at detecting the presence of stoats during this trial. Live traps had the advantage of enabling us to count at least the trap-pable individuals, whereas tracking tunnels could not. On the other hand, live traps were limited to
recording only one visitor a day, and prevented captured animals from continuing to hunt for up to 24 h at a time. By contrast, tracking tunnels could have been visited by several individuals each day, all counted as one, but none was restrained. This method was probably less threatening to the resident animals, but yielded less information. In Phase 1 we caught 23 males and 2 females, whereas during Phase 3 we caught 35 males and 28 females. Untagged individuals of both sexes containing neither of the bait markers were caught throughout the Fenn trapping. Stoat capture rates in December and January (Table 4a,b) are not strictly comparable, because the methods used were too different (Lawrence 1997). These results suggest that the live traps and bait stations in Phases 1 and 2 (both set at one per sta-tion) were saturated, and failed to catch or deliver bait to many individuals that lived in the area but were excluded from the live traps or bait stations by other, more dominant residents. Analysis of the live-trapping records (King et al. 2003a) showed that the probability of fi rst capture among adult males in the Grebe Valley (n = 19) during 12 days in mid–late December was only 0.12 per day. That means that the accumulated probability of adult males declining to enter a trap, or fi nding the trap they visited already occupied, for the 11 nights of Phase 1 was 0.245, which would have allowed for almost a quarter of the resident males to remain un-detected during that period. The same effect would be observed if, for example, dominant individuals left intimidating scent-marks at the sites they visited. However, a month later during Phase 3, when Fenn traps were set at both sites at every station, 12 of 21 tagged residents in the Grebe were recaptured, plus 48 previously unmarked stoats. Many sampling designs assume that unsociable animals such as stoats are roughly evenly distributed throughout a study area, and that all individuals have an equal chance of being captured. In fact, capture probabilities vary between individuals, not only with gender and age but also with opportunity to be trapped (King et al. 2003a). This observation suggests two hypotheses that could account for the change in sex ratio of captures between December and January: (1) the beginning of intensive removal trapping with a much higher density of traps permit-ted more untagged and low-status or new animals (including many females) to fi nd an unoccupied trap at the stations they visited; (2) there was a change, either in ratio of more to less trappable in-dividual stoats as trapping progressed, or in the
New Zealand Journal of Zoology, 2004, Vol. 31218
capture probability of females in general. Further experiments would be needed to distinguish between these hypotheses.
Habitat differences between the Borland and Grebe ValleysThere was a clear difference between the numbers of stoats in the two valleys as estimated by both types of traps (Table 4a,b). Far more stoats were caught in the Grebe Valley than in the Borland, so almost all the monitoring of individuals was concentrated in the Grebe, and King et al. (2003a) analysed only the Grebe data. The Grebe Valley may offer more attractive habitat for stoats because the vegetation regrowth in the cleared area under the power lines was especially dense there. In podocarp forest at least, mice favour thick ground cover (King et al. 1996). Experienced trappers have always known that some sites are more productive than others, as-suming that this is because sites must vary in their positions relative to the normal runways used by resident animals. Our results suggest that, in habitats where stoats and rodents are patchily distributed, the need for a trapper to fi nd a good trap position within a good patch may be less important than the need to identify and avoid bad patches. To test this suggestion, both stoats and rodents would need to be monitored at the same sites.
Movement and range lengthHome ranges of stoats could not be measured dur-ing this trial. The sample sizes were small and there was little apparent difference between the minimum range lengths of males and females. The 15 stoats that carried ear tags but not radio collars could not be monitored after the end of live trapping on 23 December, and of these, nine were not recovered. Twelve stoats (including M22; Table 5a) were both live trapped in December and recovered in Fenns in January, so the ranges of these individuals were relatively stable over at least a month. This may be because they belonged to an established adult population well past the juvenile dispersal stage (Erlinge 1977a; King & McMillan 1982). The ranges measured, by the combination of trapping data and radio locations, were on average larger than the 1 km interval between stations, so our assumption that each station would sample the population independently was wrong. The degree of range overlap we recorded among males is surprising, as males and females typically exclude others of their sex from a large territory,
particularly when prey is scarce (Erlinge 1977b; Murphy & Dowding 1994). Remote monitoring data from Snarks were available only from three stations in the zone of greatest overlap, but the pattern was clear from live trapping and Fenn trapping as well. However, as Lockie (1966) and Powell (1979) sug-gest, exclusive territoriality breaks down when prey density declines past a certain threshold. Small mammals (represented in New Zealand only by mice) are optimal prey for stoats throughout their range (King 1989). Our results suggest that the distribution of marked stoats was infl uenced more by the need to hunt in the area of a surviving popula-tion of mice than by the need to avoid other stoats that might also be hunting there. Alterio (1998) also observed substantial overlap in stoat home ranges in a South Island Nothofagus forest during a period of conditions similar to those described here (low rodent density, high stoat density) but at a different season (spring 1996), when males range widely in search of females (Erlinge & Sandell 1986). The territorial behaviour of stoats in New Zealand beech forests remains little understood, except that their activity tends to be concentrated near the valley fl oors (Murphy & Dowding 1994; Dilks & Lawrence 2000).
Diet analysis The gut contents of a sample of stoats collected from Pig Creek by Riddell & Southey (2001) during the 1999/2000 mouse and stoat irruption summer (12 months before our study) were dominated by mice (identifi ed in 87% of 36 guts), while birds and insects were scarce (each found in 5% of guts) (R. A. Mc-Donald et al. unpubl.). By contrast, the gut contents of the stoats we collected in the summer of 2000/01 were dominated by birds (48%) and insects (70%) (Fig. 2). The stoats we sampled were apparently substituting birds and insects for the lack of rodent prey, as in podocarp forests after rodent numbers had been reduced with poison (Murphy et al. 1998). Our results therefore support Riney et al.’s (1959) prediction, that stoats might take more birds each during the decline phase of the beech cycle, at least in our study area in southern Fiordland. On the other hand, where a strong numerical response of stoats to a seed-fall produces a large cohort of predators each eating about the same number of birds per head as usual, as in northern Fiordland during the 1970s, the period of most threat to forest birds in total is during the mouse irruption, not after it (King 1983). Both conclusions could be correct, because they derive from very different circumstances: (1) the
Purdey et al.—Stoat population ecology 219
peak capture rates for mice were much higher in southern than in northern Fiordland, for unknown reasons (King 1983); (2) the southern stoat popula-tions were undisturbed. We suggest that the combi-nation of very high mouse densities and absence of year-round stoat trapping in the southern Fiordland study areas produced a much larger and longer dis-ruption in ratio of stoats to rodents during the mouse decline than observed elsewhere. Results expressed as frequency of occurrence tend to overestimate the importance of small items such as insects. For example, Coleopterans are large, slow and easily caught, and were frequent prey, as in previous studies (King & Moody 1982; Murphy & Dowding 1995), but they provide less net energy gain than larger prey (Erlinge 1981). Expression of results in terms of percentage total biomass can cor-rect this problem: for example, insects found at a fre-quency of occurrence of 41% probably contributed <10% of biomass ingested (King & Moody 1982, p. 71). But it also introduces a new problem, since it prevents comparisons between prey categories (by defi nition, all are relative to the total, so are not independent). Because reproduction is so very energy-intensive, there is a minimum density of available prey below which small mustelids cannot raise a litter. For stoats in Sweden, a spatial correlation between distribution of preferred prey and breeding success was dem-onstrated by Erlinge (1981). Common weasels (M. nivalis) need about 10–15 voles per hectare, prefer-ably Microtus (Henttonen et al. 1987), or at least fi ve reproducing female voles per hectare (Erlinge 1974; Tapper 1979; Delattre 1984) or about 400 rodents per territory (Jedrzejewski et al. 1995) to support a breeding female. In contrast to other small predators like shrews and hedgehogs, for which invertebrates are staple prey, weasels and stoats take invertebrates mainly when their favoured foods, especially small mam-mals, are not abundant (King 1989). A model by Carbone et al. (1999) predicted that, because inver-tebrates can be harvested fast enough to sustain a small body, most small carnivores should be able to live and breed largely on invertebrates, whereas larger carnivores with high energy requirements cannot. But Mustela spp. have high energy require-ments for their size (Brown & Lasiewski 1972), take an exceptionally large proportion of vertebrate prey, and eat large prey (relative to their own size) much more often than expected for small carnivores (King 1989). Our data illustrate the point made by
Carbone et al. (1999); carnivores with very high food requirements cannot breed on a diet dominated by invertebrates, even though stoats do eat lots of them, especially the females (King 1991a). The small mustelid specialisation on small rodents gives them a trump card in the Northern Hemisphere, but not in New Zealand, where large insects are much less abundant than they once were and are clearly not an adequate substitute when small rodents are scarce. Although not identifi ed here to species, at least some of the coleopteran remains may represent one or more of the several endangered carabid species known in the area (McGuinness 2001). Further in-vestigation would be needed to quantify the extent to which predation by stoats damages populations of threatened Carabidae. The same applies to ground weta, because most species of ground weta are listed as threatened (McGuinness 2001). Possums were often (16%) eaten by stoats during the period we were collecting stoats. On 4 nights of the study, carcasses of possums shot by pest control contractors were left on the road, still fully furred. On average, we found fi ve possum carcasses on each of the following mornings. We removed all the possum carcasses we could during our daily regular patrols along the two valleys, but not during the 8 days between Phases 1 and 2, and the 3 days between Phases 2 and 3, when the transect line was unattended. Even after they had begun to decay, possum car-casses were still being scavenged, by Australasian harriers and rats as well as stoats. The carcasses on the road were undoubtedly only a portion of those available, as possums shot away from the road were left to decay in the bush. The presence of large chunks of undigested meat and with a few possum hairs in 10 stoat guts shows that the diet of these stoats was indeed supplemented by this convenient food source, and so at least some of the scavenging we observed upon the possum carcasses was due to stoats. The only signifi cant difference in the diets of male and female stoats was in the frequency of occurrence of rats, taken by six males and no females. Female stoats typically prefer smaller prey than males (Er-linge 1981; McDonald et al. 2000; King et al. 2001), although in New Zealand they may not always have the choice (King 1991a). King & Moody (1982) found that signifi cantly more males than females ate possums, and attrib-uted the difference to the higher food requirements of males, since carrion is equally accessible to both
New Zealand Journal of Zoology, 2004, Vol. 31220
large and small stoats. On the other hand, Murphy & Dowding (1994) showed by radio tracking along State Highway 94 through the Eglinton Valley that females avoided the road side, but males did not and so had better access to road-killed possums. The road through our study area was a quiet gravel track, and there was no signifi cant difference in the proportions of male and female stoats that had eaten possums. This may indicate that female stoats do take pos-sum carrion if they can get it away from too much disturbance. In a large survey of stoat gut contents from forests throughout New Zealand, King & Moody (1982) found maggots in 1.6% of non-empty guts (20 of 1250), and suggested that stoats prefer fresh meat of their own or a recent kill. In this study, maggots were found in four stoat guts (6.3%), but it was not clear whether these came from ingested carrion or had hatched from fl y eggs laid on the Fenn-trapped carcasses. For this reason, although stoats did appear to be scavenging dead possums, we cannot be sure whether they were consuming any well-decayed carrion. Few stoat hairs were found in the guts, and most were probably due to self-grooming. The bodies of M15 and M22 had been scavenged, although M15 was found 23 days before the fi rst day of Fenn trapping, and its remains could not have still been present in any stoat at the time of the diet analysis.
CONCLUSIONS
The undisturbed stoat populations we sampled dur-ing the second summer after the last heavy seed-fall were still at relatively high numbers, although rodents were by then very scarce, and none of the adult females had bred. Non-mammalian foods such as birds and insects were eaten at a much higher rate than in the previous summer when mice were still abundant, and may have been enough to prevent short-term starvation among adult stoats, but not enough to support breeding. The mean range lengths of the 10 radio-collared stoats in the two valleys were much larger than the 1-km intervals between sampling stations, so the assumption that a 1-km spacing should permit independent comparisons between stations did not hold during our study. Mice were detected only along an 8-km central sector of the 38-km transect line, where the ranges of up to six individual stoats
overlapped, and where we later collected 37 of the 63 carcasses. During the decline phase of the beechmast cycle, stoat and mouse populations may contract to local patches rather than remain widespread at low density. This hypothesis needs testing, but if it is correct, it may have implications for sampling popu-lation fl uctuations of small mammals in this habitat. More research is required to understand the ecology of stoats in New Zealand beech forests during the decline phase of the beech cycle.
ACKNOWLEDGMENTS
We thank the Department of Conservation and the University of Waikato Animal Ethics Committee for permits to undertake this study in Fiordland National Park. Funding was provided by the Waikato Branch of the Royal Forest and Bird Society and the New Zealand Lotteries Board (Environment and Heritage); and fi eld assistance by David Riddell, Ian Southey, and Ken Ayers. For technical support and loan of fi eld equipment we are greatly indebted to the Bioengineering Technologies group of HortResearch (especially Rod McDonald, Phil Harris, and Mira Petcu), and to the Department of Conservation (Peter Dilks). We thank Gary and Lyn Tong of Borland Lodge for fi eld accommodation and many small kindnesses, Gary Matson for sectioning the teeth and reading the slides; Robbie McDonald and Neil Cox for statistical advice; Des Smith and Robbie McDonald for the 1999 stoat diet data; and Ken Ayers, Deb Wilson, and Graeme Elliott for many helpful comments on the manuscript. The Department of Conservation granted DCP time for writing.
REFERENCES
Alterio, N. 1998: Spring home range, spatial organisation and activity of stoats Mustela erminea in a South Island Nothofagus forest, New Zealand. Ecogra-phy 21: 18–24.
Brown, J. H.; Lasiewski, R. C. 1972: Metabolism of weasels: the cost of being long and thin. Ecology 53: 939–943.
Brown, J. A.; Miller, C. J. 1998: Monitoring stoat (Mustela erminea) control operations: power analysis and design. Science for Conservation 96: 1–21.
Carbone, C.; Mace, G. M.; Roberts, S. C.; Macdonald, D. W. 1999: Energetic constraints on the diet of large carnivores. Nature 402: 286–288.
Child, J. 1974: New Zealand insects. Auckland, New Zealand, William Collins.
Purdey et al.—Stoat population ecology 221
Day, M. G. 1966: Identifi cation of hair and feather remains in the gut and faeces of stoats and weasels. Journal of Zoology 148: 201–217.
Day, M. G. 1968: Food habits of British stoats (Mustela erminea) and weasels (Mustela nivalis). Journal of Zoology (London) 155: 485–497.
Delattre, P. 1984: Infl uence de la pression de prédation exercée par une population de belettes (Mustela nivalis L.) sur un peuplement de microtidae. Acta OEcologica/OEcologia Generalis 5: 285–300.
Dilks, P. J.; Lawrence, B. 2000: The use of poison eggs for the control of stoats. New Zealand Journal of Zoology 27: 173–182.
Dilks, P. J.; Willans, M.; Pryde, M.; Fraser, I. 2003: Large scale stoat control to protect mohua (Mohua ochrocephala) and kaka (Nestor meridionalis) in the Eglinton Valley, Fiordland, New Zealand. New Zealand Journal of Ecology 27: 1–9.
Erlinge, S. 1974: Distribution, territoriality and numbers of the weasel Mustela nivalis in relation to prey abundance. Oikos 25: 308–314.
Erlinge, S. 1977a: Home range utilization and movements of the stoat, Mustela erminea. International Con-gress of Game Biologists 13: 31–42.
Erlinge, S. 1977b: Spacing strategy in stoat Mustela er-minea. Oikos 28: 32–42.
Erlinge, S. 1981: Food preference, optimal diet and re-productive output in stoats Mustela erminea in Sweden. Oikos 36: 303–315.
Erlinge, S.; Sandell, M. 1986: Seasonal changes in the so-cial organization of male stoats, Mustela erminea: an effect of shifts between two decisive resources. Oikos 47: 57–62.
Grue, H. E.; King, C. M. 1984: Evaluation of age crite-ria in New Zealand stoats (Mustela erminea) of known age. New Zealand Journal of Zoology 11: 437–443.
Henttonen, H.; Oksanen, T.; Jortikka, A.; Haukisalmi, V. 1987: How much do weasels shape microtine cycles in the northern Fennoscandian taiga? Oikos 50: 353–365.
Jedrzejewski, W.; Jedrzejewska, B.; Szymura, L. 1995: Weasel population response, home range, and pre-dation on rodents in a deciduous forest in Poland. Ecology 76: 179–195.
King, C. M. 1983: The relationships between beech (Nothofagus sp.) seedfall and populations of mice (Mus musculus), and the demographic and dietary responses of stoats (Mustela erminea), in three New Zealand forests. Journal of Animal Ecology 52: 141–166.
King, C. M. 1989: The natural history of weasels and stoats. London, Christopher Helm.
King, C. M. 1991a: Body size-prey size relationships in European stoats (Mustela erminea): a test case. Holarctic Ecology 14: 173–185.
King, C. M. 1991b: A review of age determination methods for the stoat Mustela erminea. Mammal Review 21: 31–49.
King, C. M. 2002: Cohort variation in the life-history parameters of stoats Mustela erminea in relation to fl uctuating food resources: a challenge to boreal ecologists. Acta Theriologica 47: 225–244.
King, C. M.; McMillan, C. D. 1982: Population struc-ture and dispersal of peak-year cohorts of stoats (Mustela erminea) in two New Zealand forests, with especial reference to control. New Zealand Journal of Ecology 5: 59–66.
King, C. M.; Moody, J. E. 1982: The biology of the stoat (Mustela erminea) in the national parks of New Zealand. New Zealand Journal of Zoology 9: 49–144.
King, C. M.; Innes, J. G.; Flux, M.; Kimberley, M. O.; Leathwick, J. R.; Williams, D. S. 1996: Distri-bution and abundance of mammals in relation to habitat in Pureora Forest Park. New Zealand Journal of Ecology 20: 215–240.
King, C. M.; Griffi ths, K.; Murphy, E. C. 2001: Advances in New Zealand mammalogy 1990–2000: Stoat and weasel. Journal of the Royal Society of New Zealand 31: 165–183.
King, C. M.; Davis, S. A.; Purdey, D. C.; Lawrence, B. 2003a: Capture probability and heterogeneity of trap response in stoats, Mustela erminea. Wildlife Research 30: 611–619.
King, C. M.; White, P. C. L.; Purdey, D.; Lawrence, B. 2003b: Matching productivity to resource availability in a small predator, the stoat (Mus-tela erminea). Canadian Journal of Zoology 81: 662–669.
Lawrence, B. 1997: A review of the relationship between beechmast (Nothofagus spp.), stoats (Mustela erminea) and mohua (Mohoua ochrocephala). Unpublished Diploma in Wildlife Management, University of Otago, Dunedin.
Lockie, J. D. 1966: Territory in small carnivores. Sym-posia of the Zoological Society of London 18: 143–165.
McDonald, R. A.; Vaughan, N. 1999: An effi cient way to prepare mammalian skulls and bones. Mammal Review 29: 265–266.
McDonald, R. A.; Webbon, C.; Harris, S. 2000: The diet of stoats (Mustela erminea) and weasels (Mustela nivalis) in Great Britain. Journal of Zoology, Lon-don 252: 363–371.
New Zealand Journal of Zoology, 2004, Vol. 31222
McGuinness, C. A. 2001: The conservation requirements of New Zealand’s nationally threatened inverte-brates. Biodiversity Recovery Unit, Department of Conservation, Wellington.
Murphy, E. C.; Dowding, J. E. 1994: Range and diet of stoats (Mustela erminea) in a New Zealand beech forest. New Zealand Journal of Ecology 18: 11–18.
Murphy, E. C.; Dowding, J. E. 1995: Ecology of the stoat in Nothofagus forest: home range, habitat use and diet at different stages of the beech mast cycle. New Zealand Journal of Ecology 19: 97–109.
Murphy, E. C.; Clapperton, B. K.; Bradfi eld, P. M. F.; Speed, H. J. 1998: Effects of rat-poisoning opera-tions on abundance and diet of mustelids in New Zealand podocarp forests. New Zealand Journal of Zoology 25: 315–328.
Nelson, L. Jr; Clark, F. W. 1973: Correction for sprung traps in catch/effort calculations of trapping re-sults. Journal of Mammalogy 54: 295–298.
Powell, R. A. 1979: Mustelid spacing patterns: variations on a theme by Mustela. Zeitschrift für Tierpsy-chologie 50: 153–165.
Powell, R. A.; King, C. M. 1997: Variation in body size, sexual dimorphism and age-specifi c survival in stoats, Mustela erminea (Mammalia: Carnivora), with fl uctuating food supplies. Biological Journal of the Linnean Society 62: 165–194.
Purdey, D.; King, C. M.; McDonald, R. M.; Harris, P.; Lawrence, B. 2001: An automated bait delivery system for wildlife conservation management. In: Anon. ed. 12th Australasian Vertebrate Pest Conference, Melbourne. 243 p.
Purdey, D.; Petcu, M.; King, C. M. 2003: A simplifi ed protocol for detecting two systemic bait mark-ers (rhodamine B and iophenoxic acid) in small mammals. New Zealand Journal of Zoology 30: 175–184.
Ratz, H. 1997: Identifi cation of footprints of some small mammals. Mammalia 61: 431–441.
Rickard, C. G. 1996: Introduced small mammals and inver-tebrate conservation in a lowland podocarp forest, South Westland, New Zealand. Unpublished MSc thesis, University of Canterbury, Christchurch.
Riddell, D.; Southey, I. 2001: Pig Creek stoat trapping results, 1999/2000. Unpublished report, Tua-tapere, Department of Conservation, Southland Conservancy.
Riney, T.; Watson, J. S.; Bassett, C.; Turbott, E. G.; Howard, W. E. 1959: Lake Monk expedition: an ecological study in southern Fiordland. DSIR Bulletin 135: 1–75.
Segal, A. N. 1975: Postnatal growth, metabolism, and ther-moregulation in the stoat. Ékologia 1: 38–44.
Sharell, R. 1971: New Zealand insects and their story. Auckland, Collins Bros. & Co. Ltd.
Tapper, S. C. 1979: The effect of fl uctuating vole numbers (Microtus agrestis) on a population of weasels (Mustela nivalis) on farmland. Journal of Animal Ecology 48: 603–617.
Walker, A.; Cox, G. 1984: Common insects 2: Insects of the bush and fresh water. Wellington, A. H. and A. W. Reed Ltd.
Wardle, J. 1984: The New Zealand beeches: ecology, utilisation and management. Wellington, New Zealand, New Zealand Forest Service.
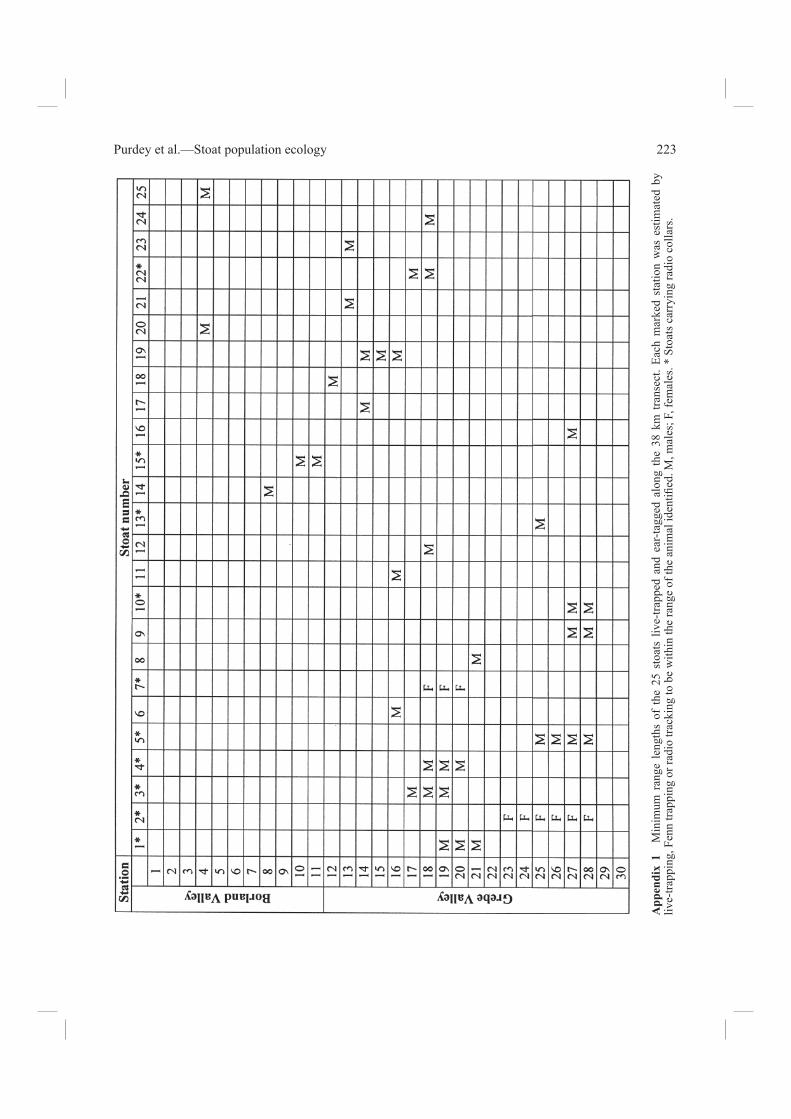
Purdey et al.—Stoat population ecology 223
App
endi
x 1
Min
imum
ran
ge l
engt
hs o
f th
e 25
sto
ats
live-
trapp
ed a
nd e
ar-ta
gged
alo
ng t
he 3
8 km
tra
nsec
t. Ea
ch m
arke
d st
atio
n w
as e
stim
ated
by
live-
trapp
ing,
Fen
n tra
ppin
g or
radi
o tra
ckin
g to
be
with
in th
e ra
nge
of th
e an
imal
iden
tifi e
d. M
, mal
es; F
, fem
ales
. * S
toat
s car
ryin
g ra
dio
colla
rs.
New Zealand Journal of Zoology, 2004, Vol. 31224
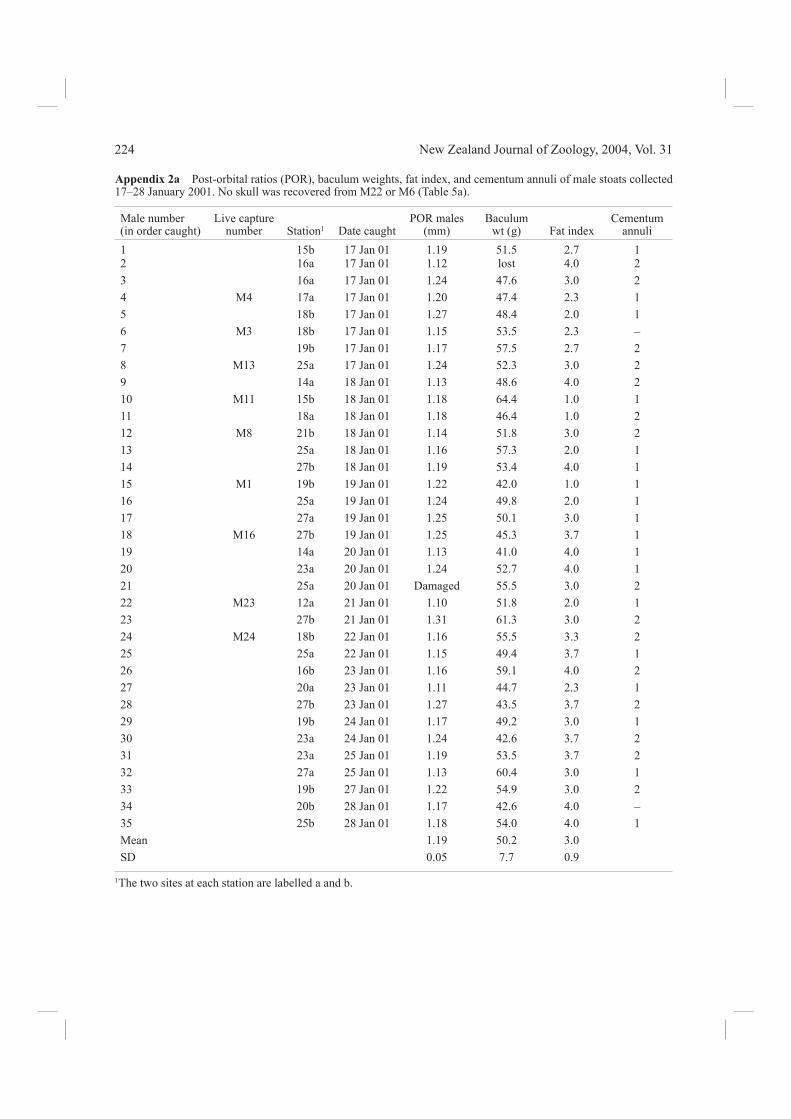
Appendix 2a Post-orbital ratios (POR), baculum weights, fat index, and cementum annuli of male stoats collected 17–28 January 2001. No skull was recovered from M22 or M6 (Table 5a).
Male number (in order caught)
Live capture number Station1 Date caught
POR males (mm)
Baculum wt (g) Fat index
Cementum annuli
1 15b 17 Jan 01 1.19 51.5 2.7 12 16a 17 Jan 01 1.12 lost 4.0 23 16a 17 Jan 01 1.24 47.6 3.0 24 M4 17a 17 Jan 01 1.20 47.4 2.3 15 18b 17 Jan 01 1.27 48.4 2.0 16 M3 18b 17 Jan 01 1.15 53.5 2.3 –7 19b 17 Jan 01 1.17 57.5 2.7 28 M13 25a 17 Jan 01 1.24 52.3 3.0 29 14a 18 Jan 01 1.13 48.6 4.0 210 M11 15b 18 Jan 01 1.18 64.4 1.0 111 18a 18 Jan 01 1.18 46.4 1.0 212 M8 21b 18 Jan 01 1.14 51.8 3.0 213 25a 18 Jan 01 1.16 57.3 2.0 114 27b 18 Jan 01 1.19 53.4 4.0 115 M1 19b 19 Jan 01 1.22 42.0 1.0 116 25a 19 Jan 01 1.24 49.8 2.0 117 27a 19 Jan 01 1.25 50.1 3.0 118 M16 27b 19 Jan 01 1.25 45.3 3.7 119 14a 20 Jan 01 1.13 41.0 4.0 120 23a 20 Jan 01 1.24 52.7 4.0 121 25a 20 Jan 01 Damaged 55.5 3.0 222 M23 12a 21 Jan 01 1.10 51.8 2.0 123 27b 21 Jan 01 1.31 61.3 3.0 224 M24 18b 22 Jan 01 1.16 55.5 3.3 225 25a 22 Jan 01 1.15 49.4 3.7 126 16b 23 Jan 01 1.16 59.1 4.0 227 20a 23 Jan 01 1.11 44.7 2.3 128 27b 23 Jan 01 1.27 43.5 3.7 229 19b 24 Jan 01 1.17 49.2 3.0 130 23a 24 Jan 01 1.24 42.6 3.7 231 23a 25 Jan 01 1.19 53.5 3.7 232 27a 25 Jan 01 1.13 60.4 3.0 133 19b 27 Jan 01 1.22 54.9 3.0 234 20b 28 Jan 01 1.17 42.6 4.0 –35 25b 28 Jan 01 1.18 54.0 4.0 1Mean 1.19 50.2 3.0SD 0.05 7.7 0.9
1The two sites at each station are labelled a and b.
Purdey et al.—Stoat population ecology 225
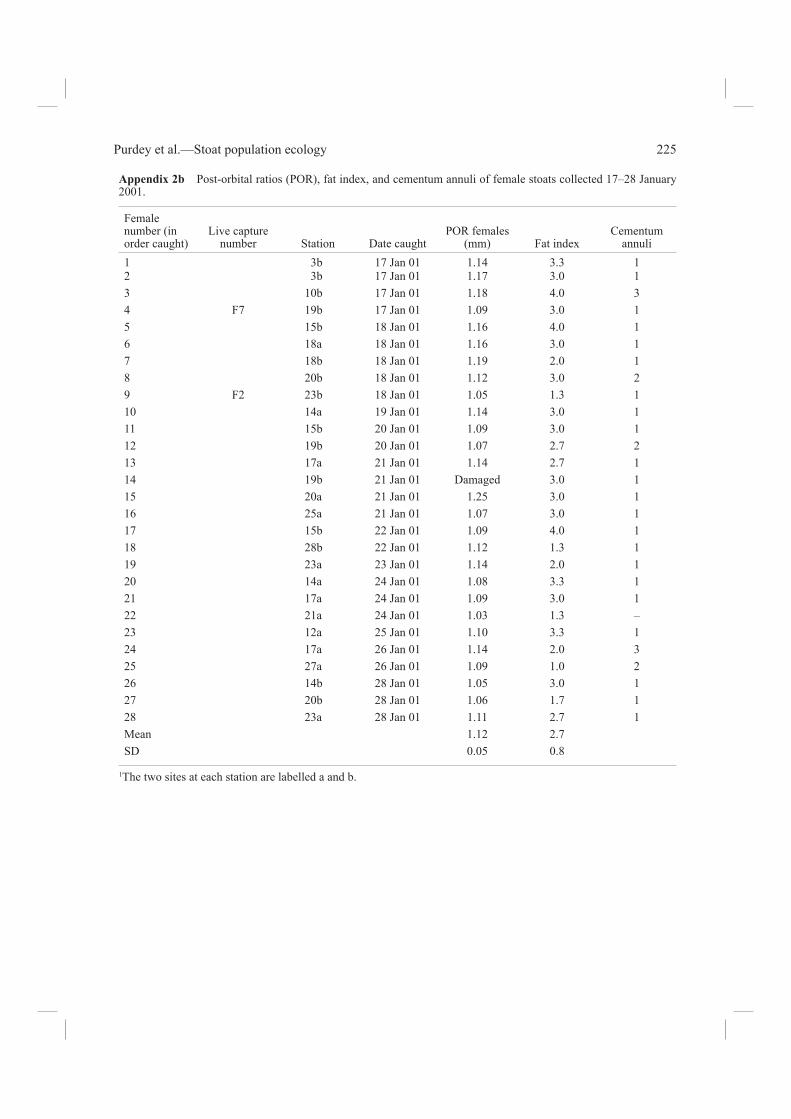
Appendix 2b Post-orbital ratios (POR), fat index, and cementum annuli of female stoats collected 17–28 January 2001.
Female number (in order caught)
Live capture number Station Date caught
POR females (mm) Fat index
Cementum annuli
1 3b 17 Jan 01 1.14 3.3 12 3b 17 Jan 01 1.17 3.0 13 10b 17 Jan 01 1.18 4.0 34 F7 19b 17 Jan 01 1.09 3.0 15 15b 18 Jan 01 1.16 4.0 16 18a 18 Jan 01 1.16 3.0 17 18b 18 Jan 01 1.19 2.0 18 20b 18 Jan 01 1.12 3.0 29 F2 23b 18 Jan 01 1.05 1.3 110 14a 19 Jan 01 1.14 3.0 111 15b 20 Jan 01 1.09 3.0 112 19b 20 Jan 01 1.07 2.7 213 17a 21 Jan 01 1.14 2.7 114 19b 21 Jan 01 Damaged 3.0 115 20a 21 Jan 01 1.25 3.0 116 25a 21 Jan 01 1.07 3.0 117 15b 22 Jan 01 1.09 4.0 118 28b 22 Jan 01 1.12 1.3 119 23a 23 Jan 01 1.14 2.0 120 14a 24 Jan 01 1.08 3.3 121 17a 24 Jan 01 1.09 3.0 122 21a 24 Jan 01 1.03 1.3 –23 12a 25 Jan 01 1.10 3.3 124 17a 26 Jan 01 1.14 2.0 325 27a 26 Jan 01 1.09 1.0 226 14b 28 Jan 01 1.05 3.0 127 20b 28 Jan 01 1.06 1.7 128 23a 28 Jan 01 1.11 2.7 1Mean 1.12 2.7SD 0.05 0.8
1The two sites at each station are labelled a and b.