r dispersion 1ρ r dispersion 2 - university of wisconsin
TRANSCRIPT
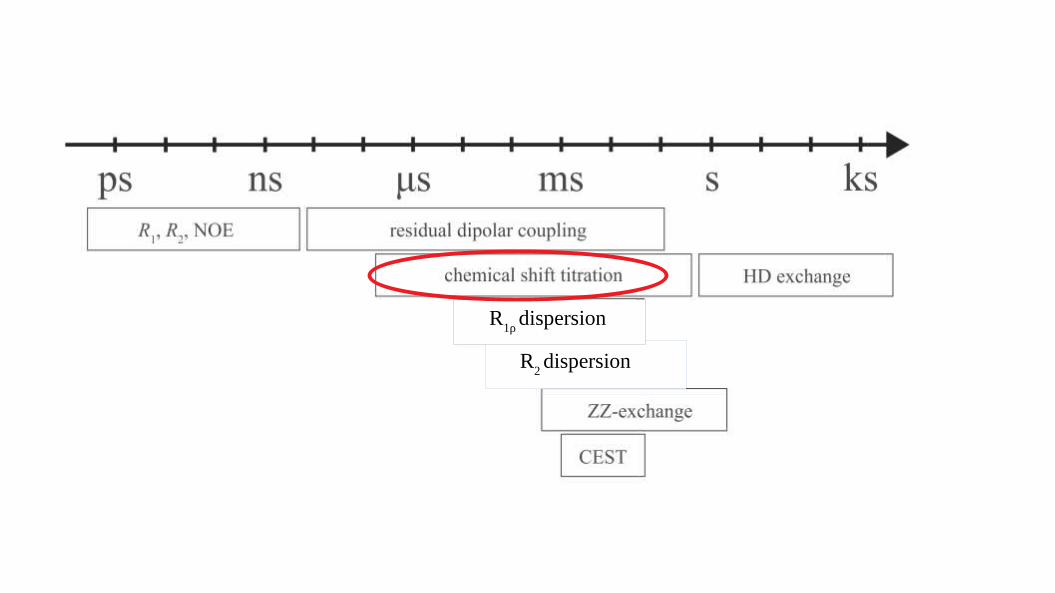
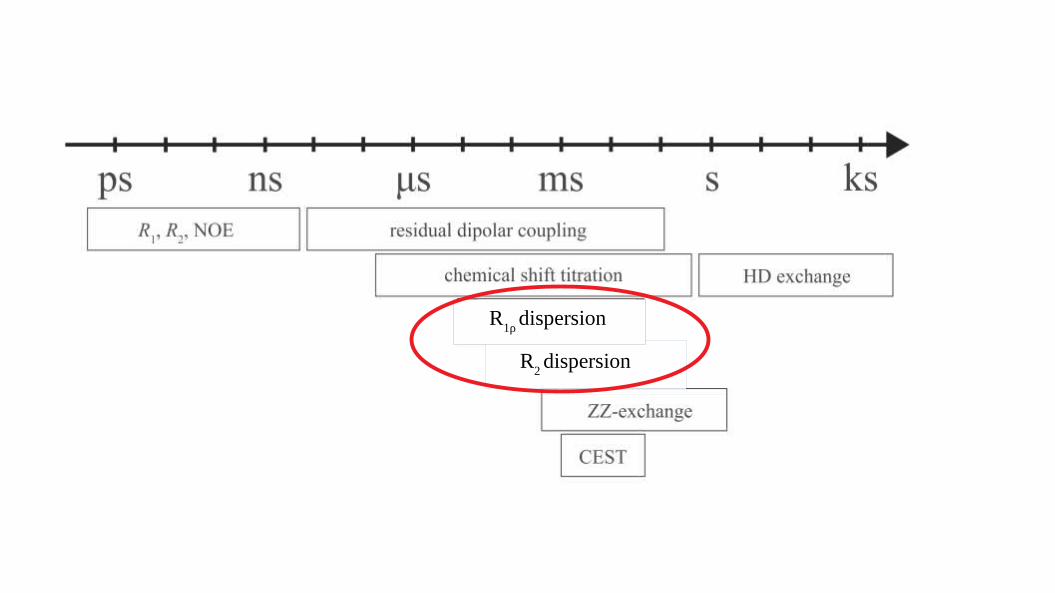
R2 dispersion
R1ρ
dispersion
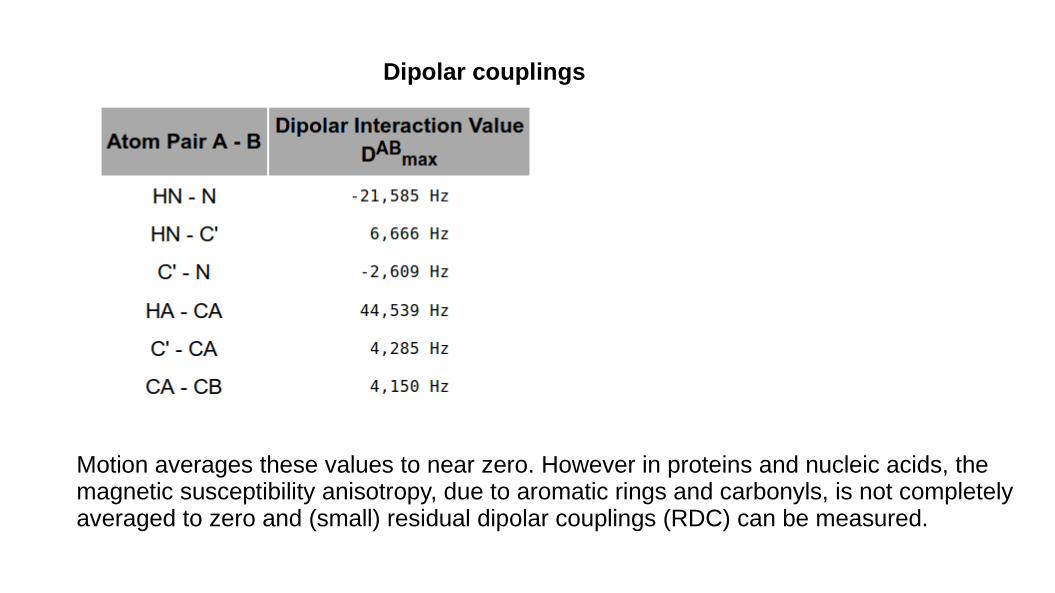
Dipolar couplings
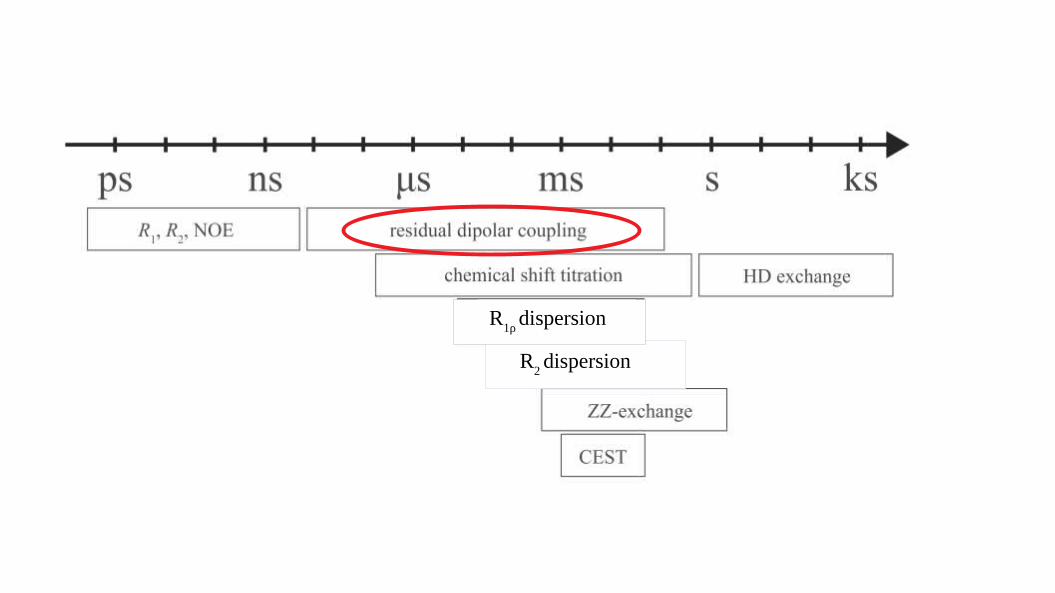
Motion averages these values to near zero. However in proteins and nucleic acids, the magnetic susceptibility anisotropy, due to aromatic rings and carbonyls, is not completely averaged to zero and (small) residual dipolar couplings (RDC) can be measured.
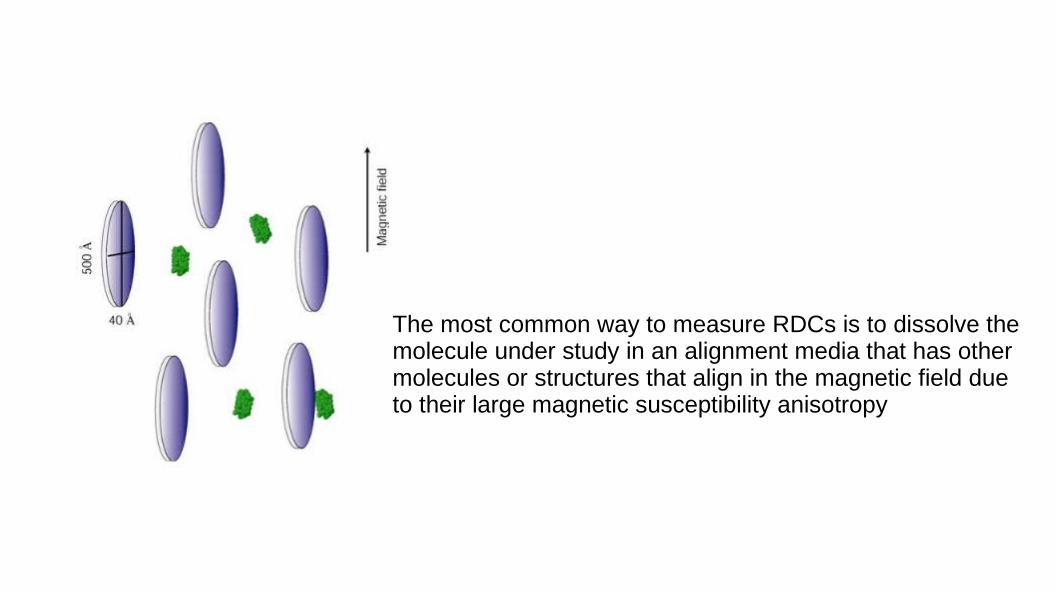
The most common way to measure RDCs is to dissolve the molecule under study in an alignment media that has other molecules or structures that align in the magnetic field due to their large magnetic susceptibility anisotropy
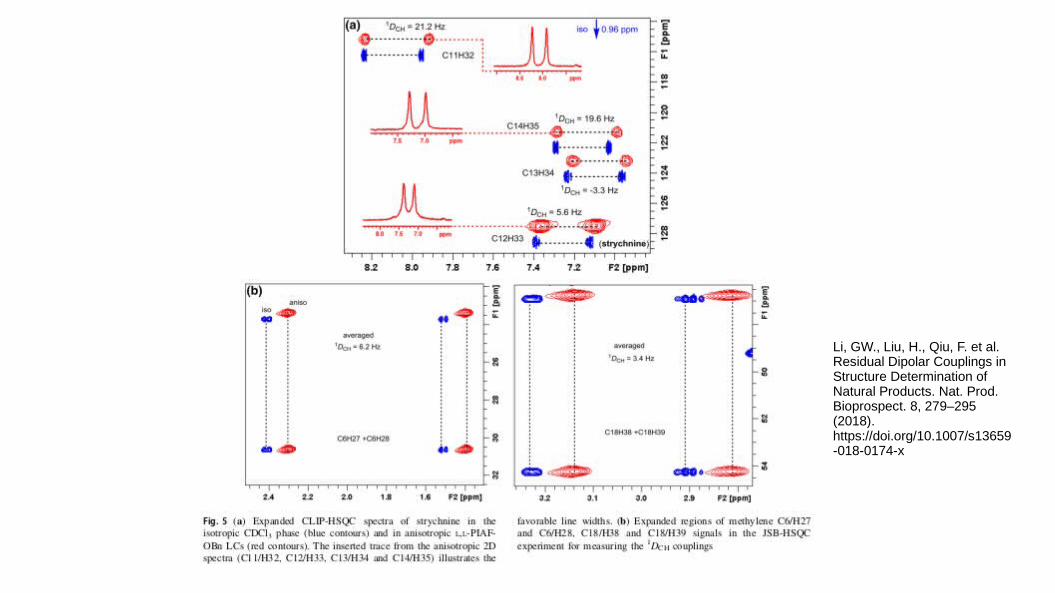
Li, GW., Liu, H., Qiu, F. et al. Residual Dipolar Couplings in Structure Determination of Natural Products. Nat. Prod. Bioprospect. 8, 279–295 (2018). https://doi.org/10.1007/s13659-018-0174-x
R2 dispersion
R1ρ
dispersion
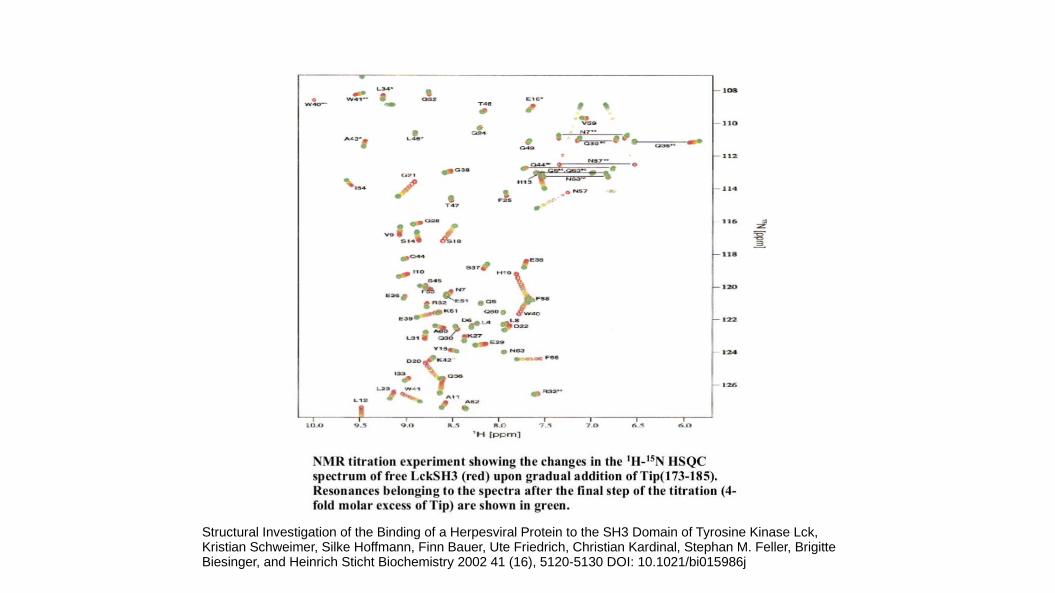
Structural Investigation of the Binding of a Herpesviral Protein to the SH3 Domain of Tyrosine Kinase Lck, Kristian Schweimer, Silke Hoffmann, Finn Bauer, Ute Friedrich, Christian Kardinal, Stephan M. Feller, Brigitte Biesinger, and Heinrich Sticht Biochemistry 2002 41 (16), 5120-5130 DOI: 10.1021/bi015986j
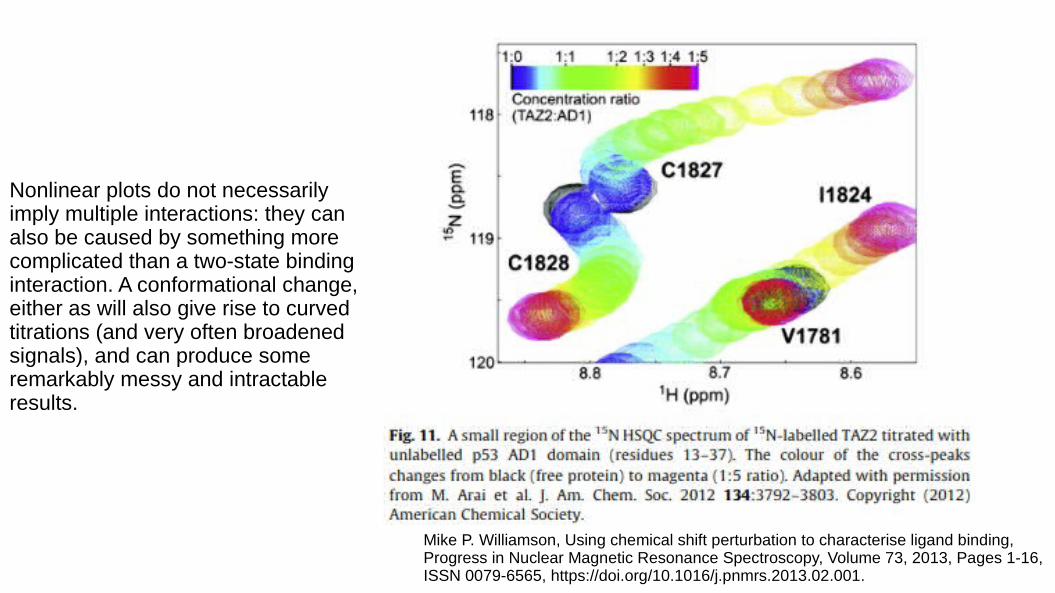
Mike P. Williamson, Using chemical shift perturbation to characterise ligand binding,Progress in Nuclear Magnetic Resonance Spectroscopy, Volume 73, 2013, Pages 1-16,ISSN 0079-6565, https://doi.org/10.1016/j.pnmrs.2013.02.001.
Nonlinear plots do not necessarily imply multiple interactions: they can also be caused by something more complicated than a two-state binding interaction. A conformational change, either as will also give rise to curved titrations (and very often broadened signals), and can produce some remarkably messy and intractable results.
R2 dispersion
R1ρ
dispersion
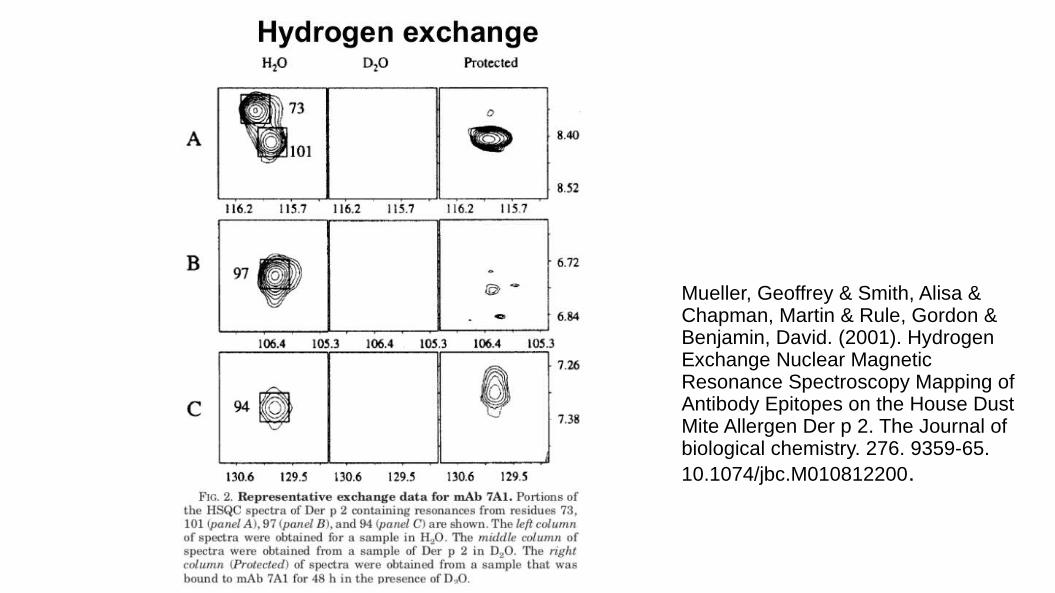
Mueller, Geoffrey & Smith, Alisa & Chapman, Martin & Rule, Gordon & Benjamin, David. (2001). Hydrogen Exchange Nuclear Magnetic Resonance Spectroscopy Mapping of Antibody Epitopes on the House Dust Mite Allergen Der p 2. The Journal of biological chemistry. 276. 9359-65. 10.1074/jbc.M010812200.
R2 dispersion
R1ρ
dispersion
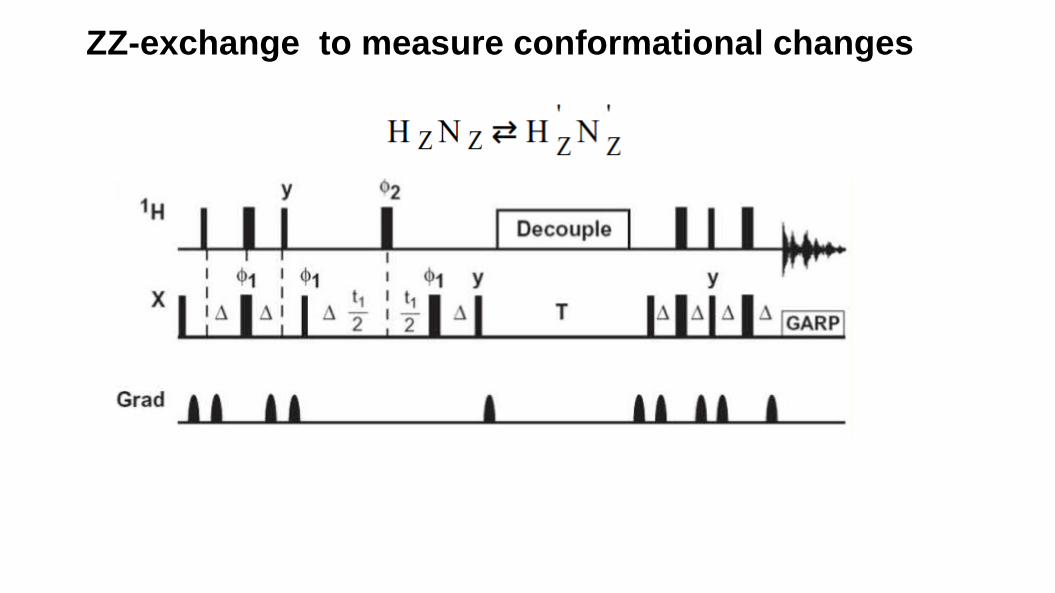
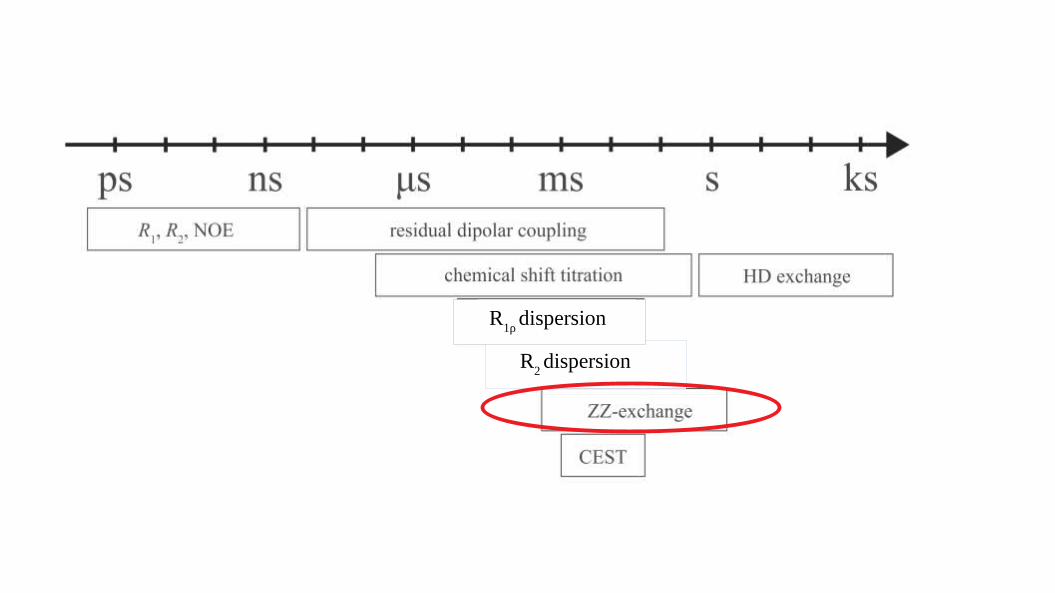
ZZ-exchange to measure conformational changes
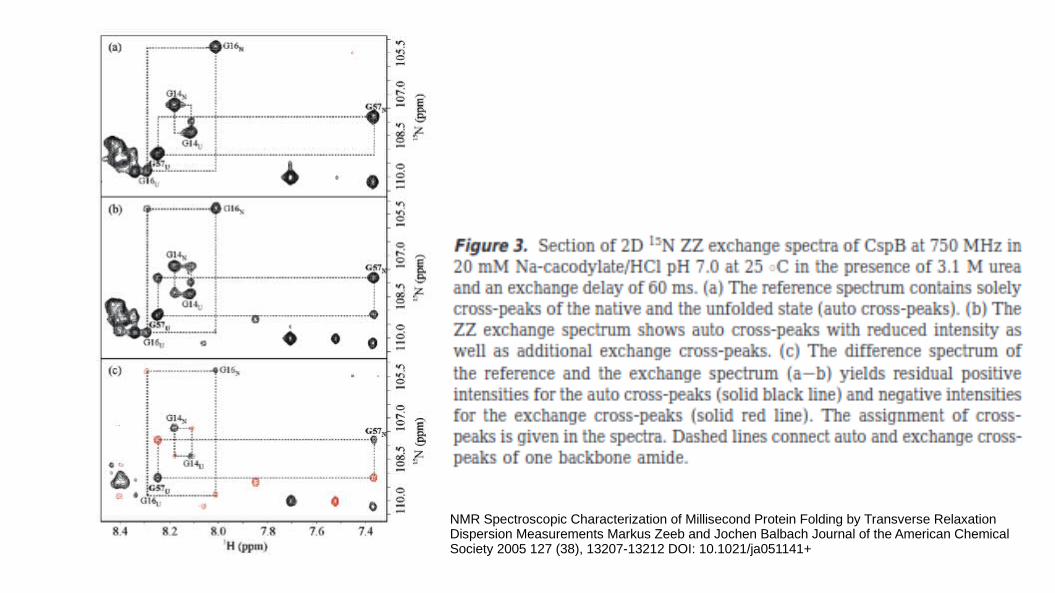
NMR Spectroscopic Characterization of Millisecond Protein Folding by Transverse Relaxation Dispersion Measurements Markus Zeeb and Jochen Balbach Journal of the American Chemical Society 2005 127 (38), 13207-13212 DOI: 10.1021/ja051141+
R2 dispersion
R1ρ
dispersion
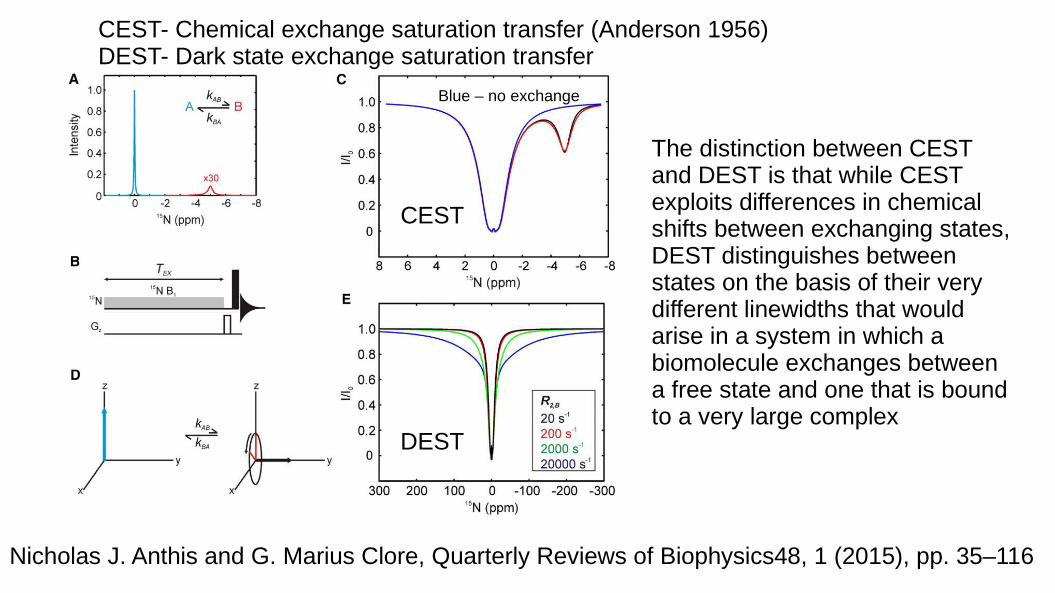
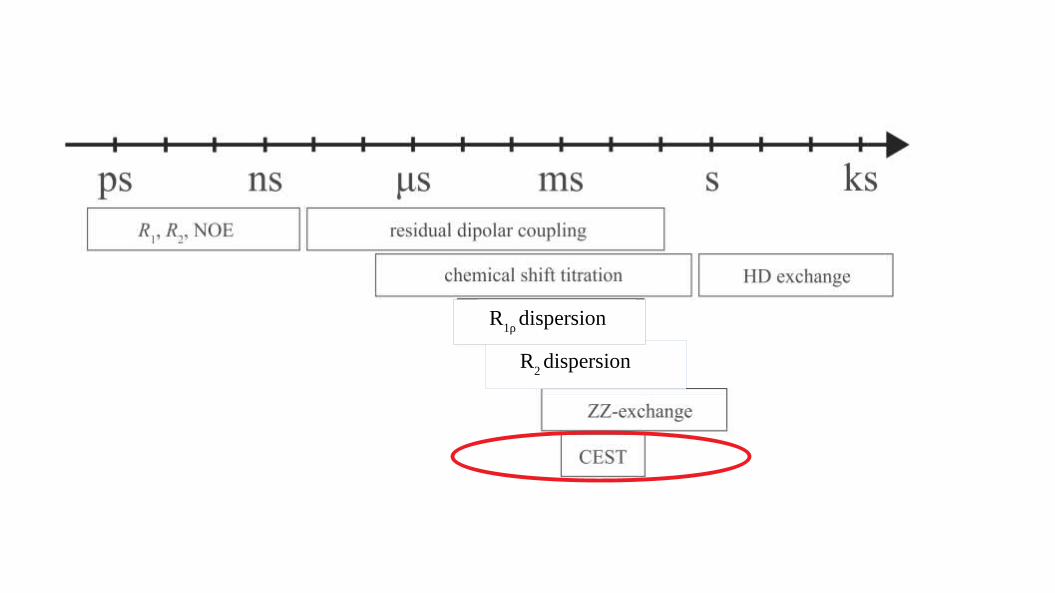
CEST- Chemical exchange saturation transfer (Anderson 1956)DEST- Dark state exchange saturation transfer
DEST
CEST
The distinction between CEST and DEST is that while CEST exploits differences in chemical shifts between exchanging states, DEST distinguishes between states on the basis of their very different linewidths that would arise in a system in which a biomolecule exchanges between a free state and one that is bound to a very large complex
Blue – no exchange
Nicholas J. Anthis and G. Marius Clore, Quarterly Reviews of Biophysics48, 1 (2015), pp. 35–116
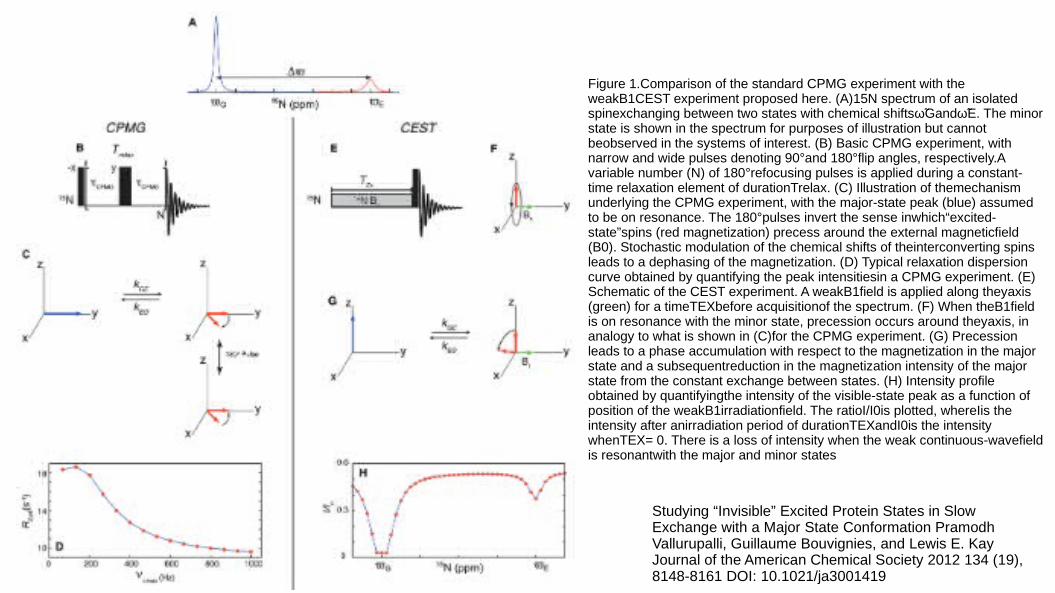
Figure 1.Comparison of the standard CPMG experiment with the weakB1CEST experiment proposed here. (A)15N spectrum of an isolated spinexchanging between two states with chemical shiftsω̃Gandω̃E. The minor Gandω̃Gandω̃E. The minor E. The minor state is shown in the spectrum for purposes of illustration but cannot beobserved in the systems of interest. (B) Basic CPMG experiment, with narrow and wide pulses denoting 90°and 180°flip angles, respectively.A variable number (N) of 180°refocusing pulses is applied during a constant-time relaxation element of durationTrelax. (C) Illustration of themechanism underlying the CPMG experiment, with the major-state peak (blue) assumed to be on resonance. The 180°pulses invert the sense inwhich“excited-state”spins (red magnetization) precess around the external magneticfield (B0). Stochastic modulation of the chemical shifts of theinterconverting spins leads to a dephasing of the magnetization. (D) Typical relaxation dispersion curve obtained by quantifying the peak intensitiesin a CPMG experiment. (E) Schematic of the CEST experiment. A weakB1field is applied along theyaxis (green) for a timeTEXbefore acquisitionof the spectrum. (F) When theB1field is on resonance with the minor state, precession occurs around theyaxis, in analogy to what is shown in (C)for the CPMG experiment. (G) Precession leads to a phase accumulation with respect to the magnetization in the major state and a subsequentreduction in the magnetization intensity of the major state from the constant exchange between states. (H) Intensity profile obtained by quantifyingthe intensity of the visible-state peak as a function of position of the weakB1irradiationfield. The ratioI/I0is plotted, whereIis the intensity after anirradiation period of durationTEXandI0is the intensity whenTEX= 0. There is a loss of intensity when the weak continuous-wavefield is resonantwith the major and minor states
Studying “Invisible” Excited Protein States in Slow Exchange with a Major State Conformation Pramodh Vallurupalli, Guillaume Bouvignies, and Lewis E. Kay Journal of the American Chemical Society 2012 134 (19), 8148-8161 DOI: 10.1021/ja3001419
R2 dispersion
R1ρ
dispersion
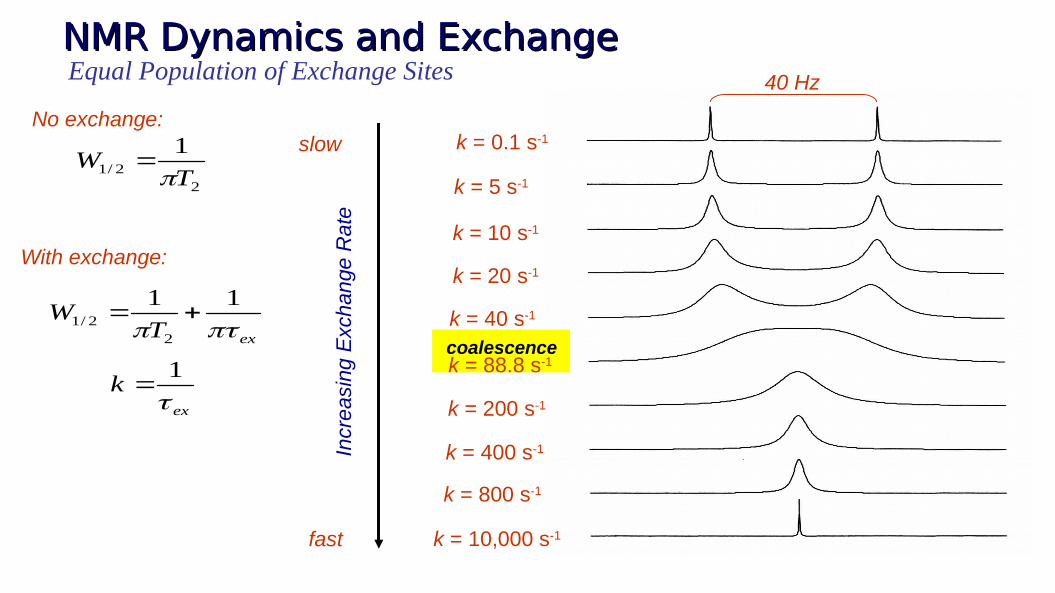
coalescence
NMR Dynamics and ExchangeNMR Dynamics and Exchange
k = 0.1 s-1
k = 5 s-1
k = 200 s-1
k = 88.8 s-1
k = 40 s-1
k = 20 s-1
k = 10 s-1
k = 400 s-1
k = 800 s-1
k = 10,000 s-1
40 Hz
Incr
easi
ng E
xcha
nge
Rat
e
slow
fast
22/1
1
TW
No exchange:
With exchange:
exTW
11
22/1
ex
k
1
Equal Population of Exchange Sites
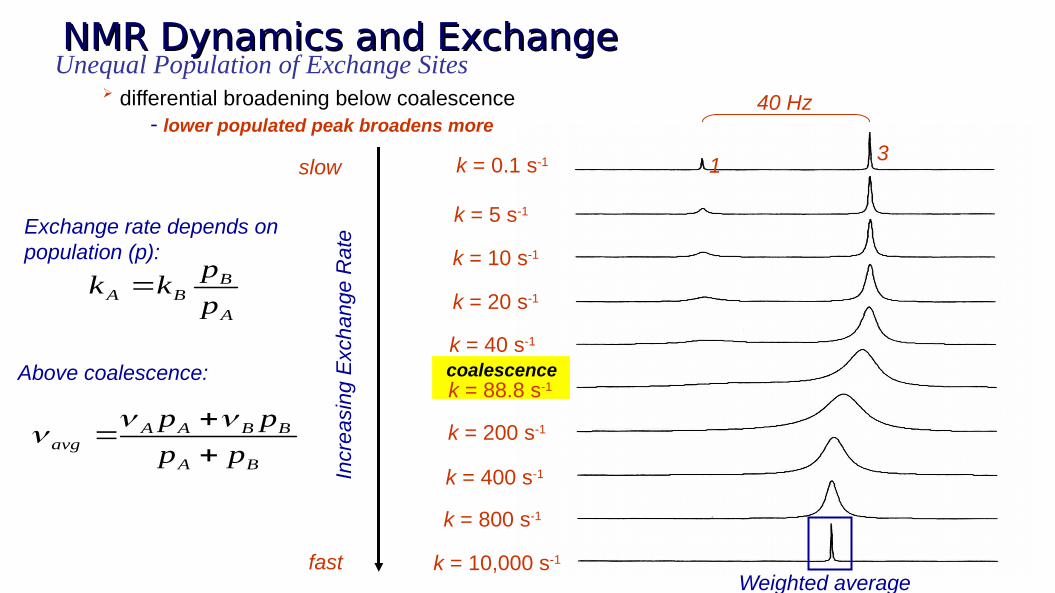
NMR Dynamics and ExchangeNMR Dynamics and ExchangeUnequal Population of Exchange Sites
differential broadening below coalescence- lower populated peak broadens more
k = 0.1 s-1
k = 5 s-1
k = 200 s-1
k = 88.8 s-1
k = 40 s-1
k = 20 s-1
k = 10 s-1
k = 400 s-1
k = 800 s-1
k = 10,000 s-1
Incr
easi
ng E
xcha
nge
Rat
e
slow
fast
40 Hz
31
A
BBA p
pkk
Exchange rate depends on population (p):
coalescenceAbove coalescence:
BA
BBAAavg pp
pp
Weighted average
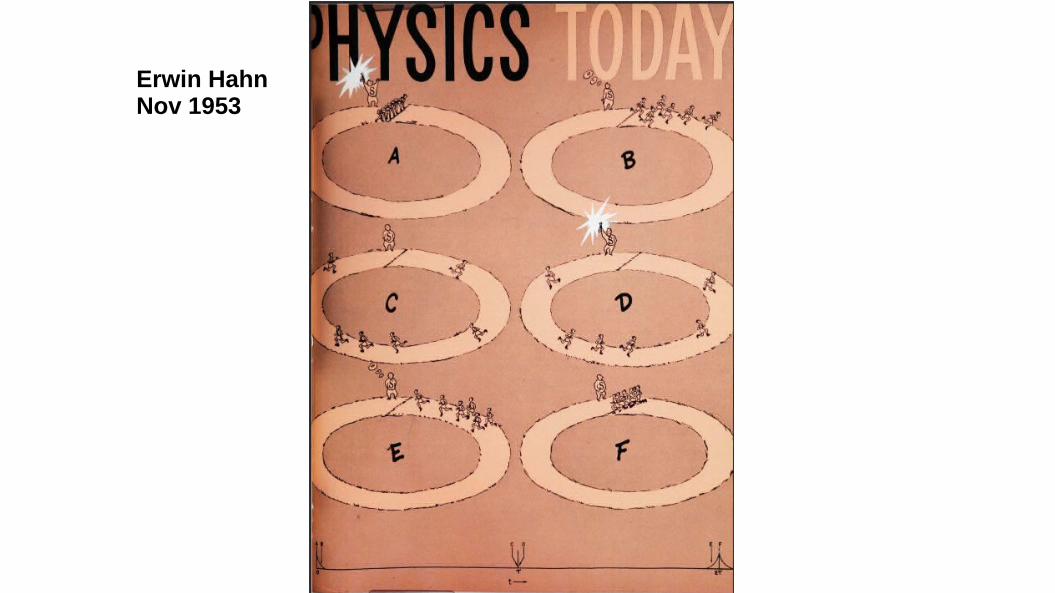
Erwin HahnNov 1953
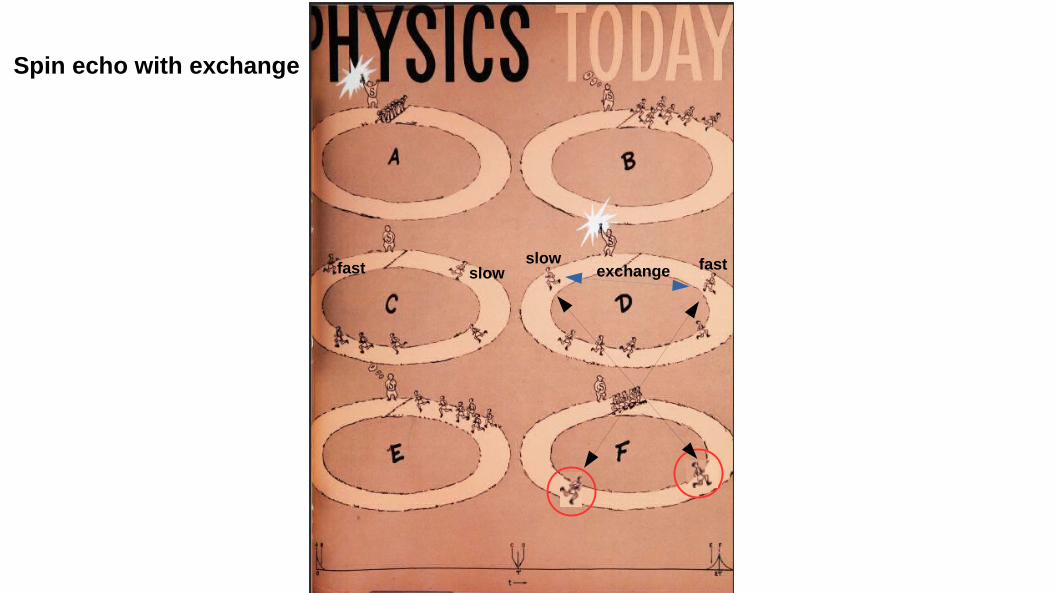
Spin echo with exchange
exchangeslow fastfast slow
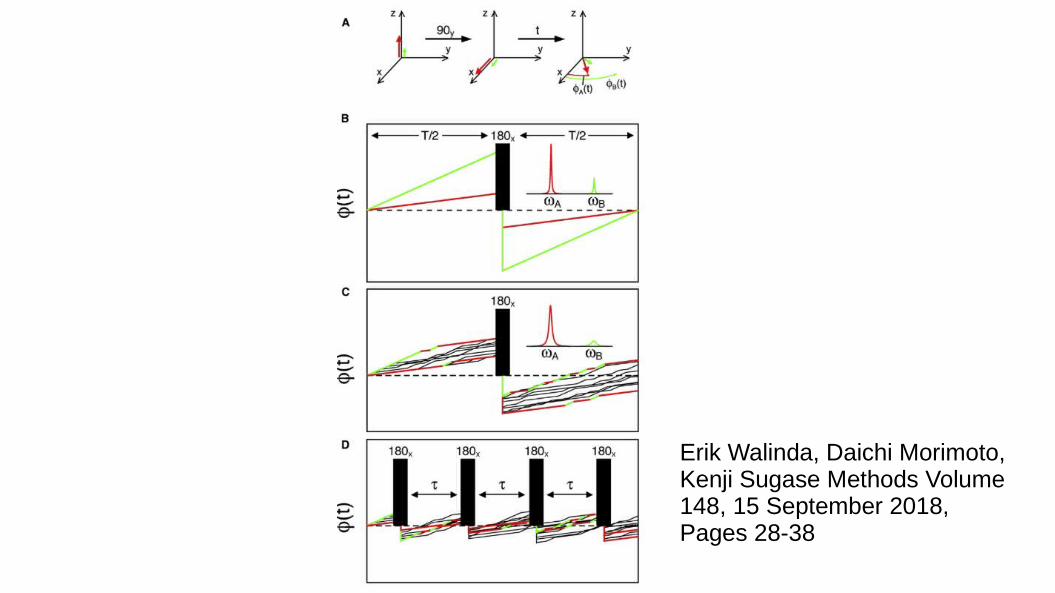
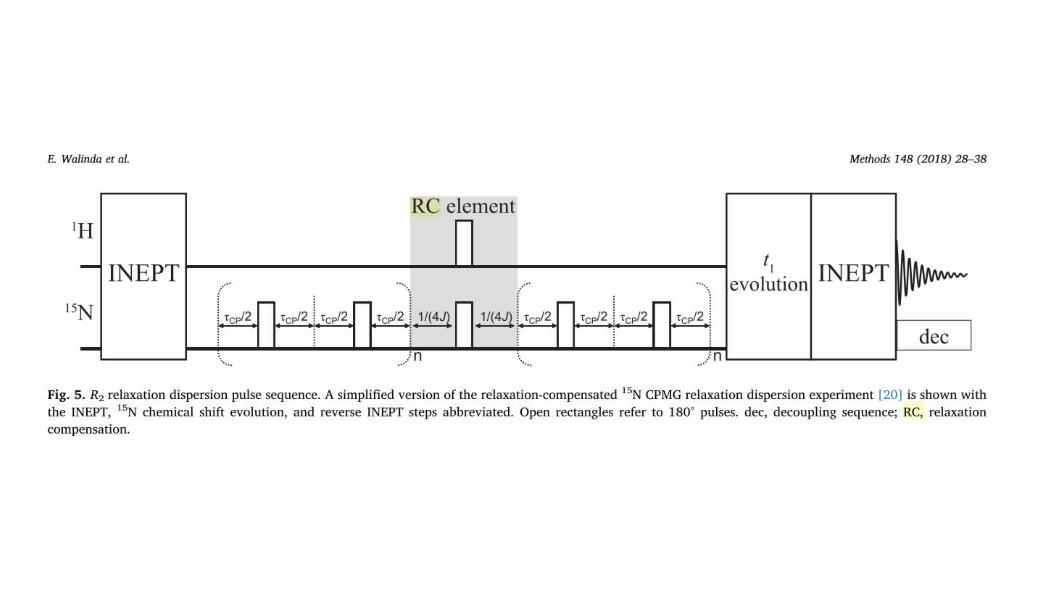
Erik Walinda, Daichi Morimoto, Kenji Sugase Methods Volume 148, 15 September 2018, Pages 28-38
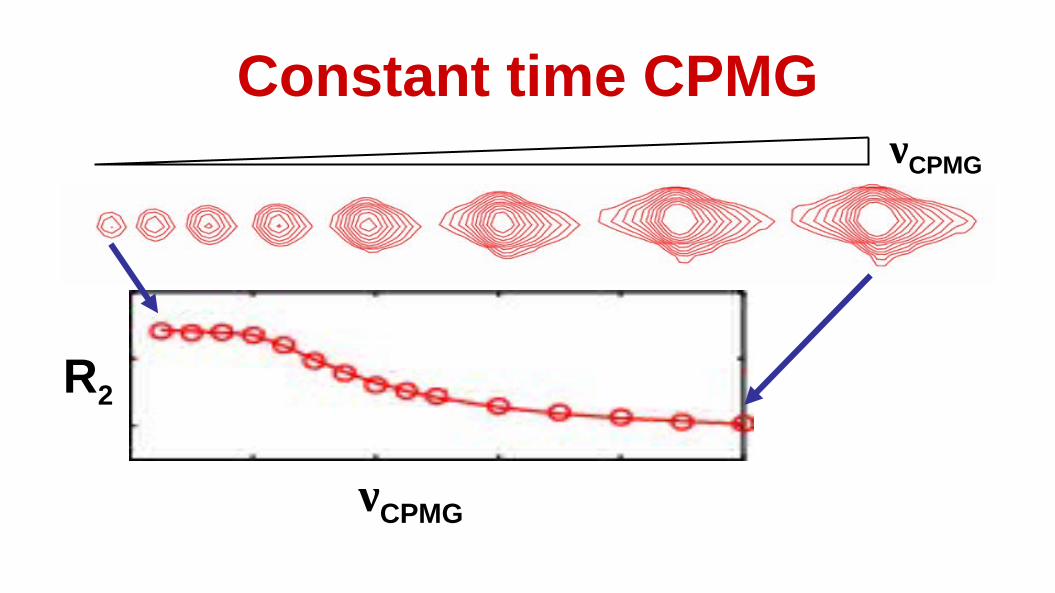
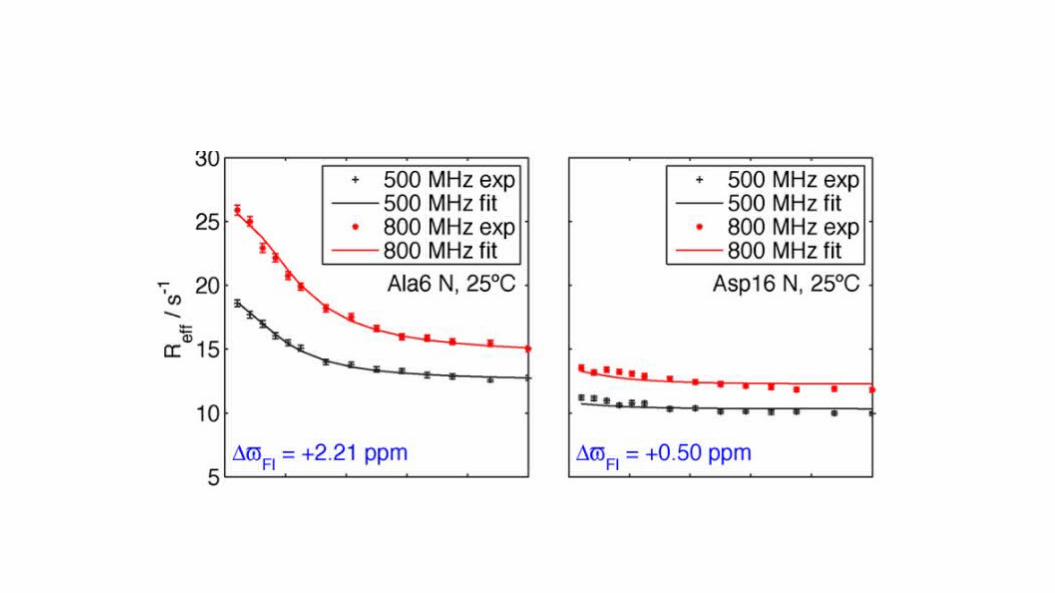
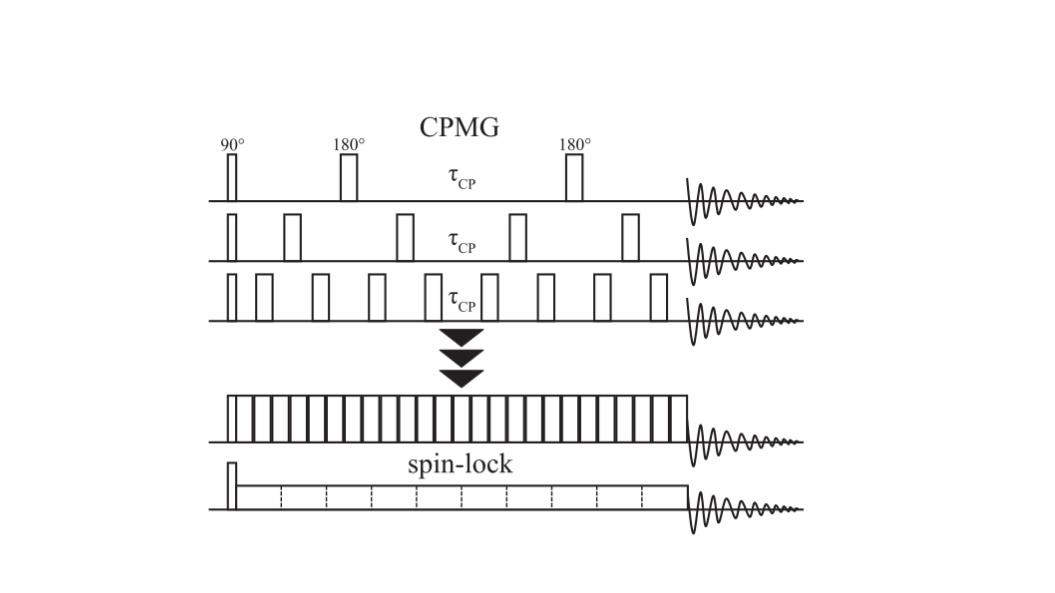
Constant time CPMGνCPMG
R2
νCPMG
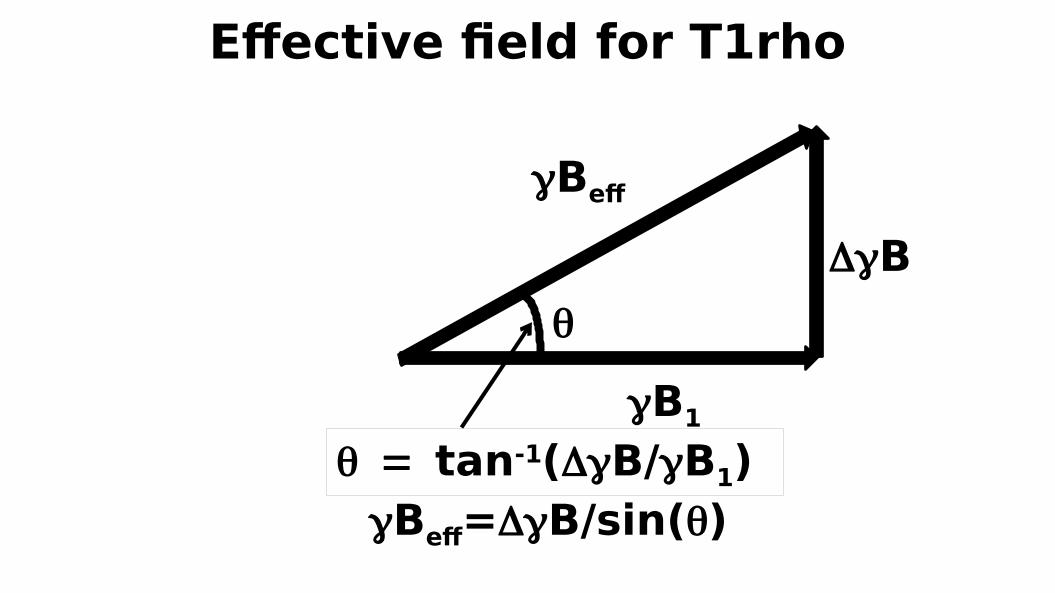
DgB
gBeff
gB1
q = = tan-1(DgB/gB1) = gBeff=DgB/sin(q)
Effective field for T1rho
q
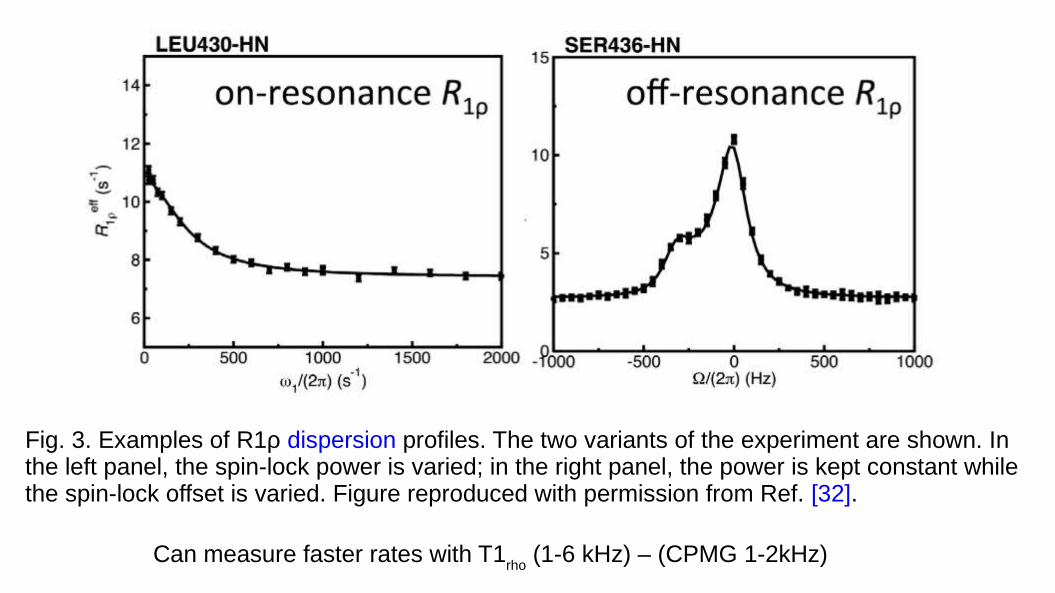
Can measure faster rates with T1rho
(1-6 kHz) – (CPMG 1-2kHz)
Fig. 3. Examples of R1ρ dispersion profiles. The two variants of the experiment are shown. In the left panel, the spin-lock power is varied; in the right panel, the power is kept constant while the spin-lock offset is varied. Figure reproduced with permission from Ref. [32].
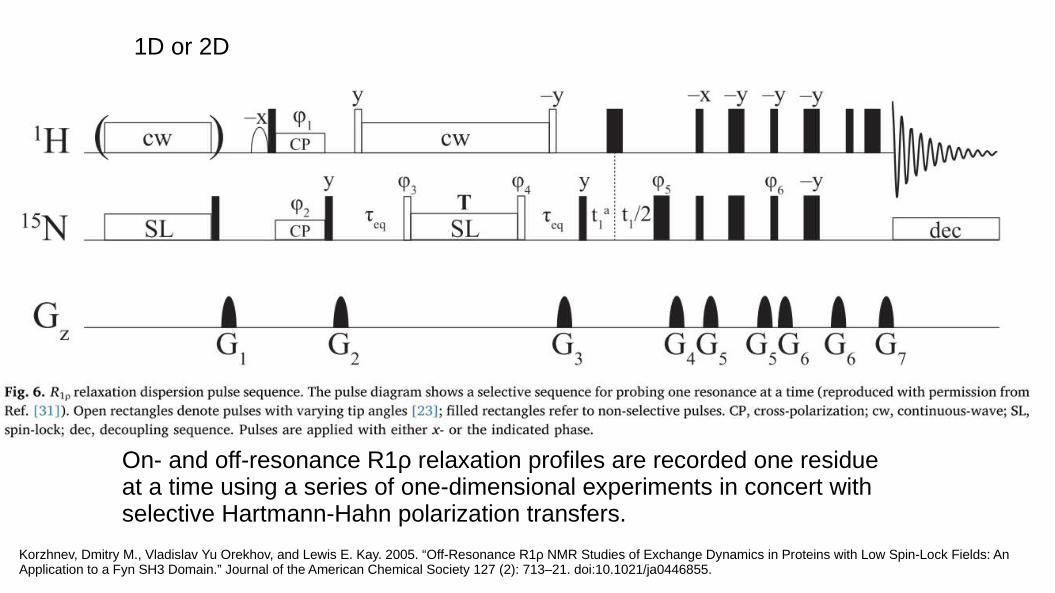
On- and off-resonance R1ρ relaxation profiles are recorded one residue at a time using a series of one-dimensional experiments in concert with selective Hartmann-Hahn polarization transfers.
Korzhnev, Dmitry M., Vladislav Yu Orekhov, and Lewis E. Kay. 2005. “Off-Resonance R1ρ NMR Studies of Exchange Dynamics in Proteins with Low Spin-Lock Fields: An Application to a Fyn SH3 Domain.” Journal of the American Chemical Society 127 (2): 713–21. doi:10.1021/ja0446855.
1D or 2D
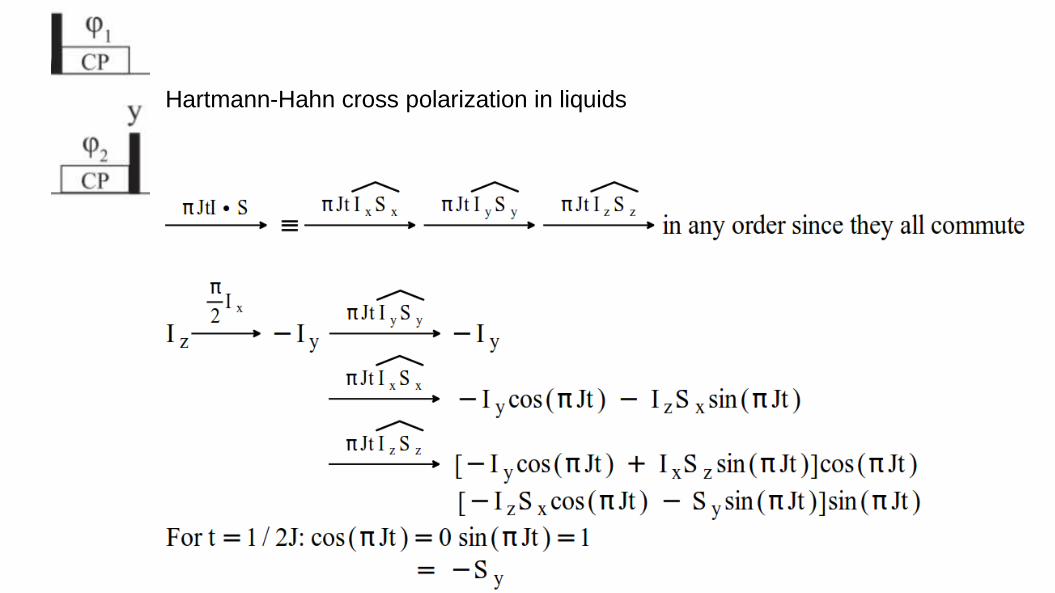
Hartmann-Hahn cross polarization in liquids
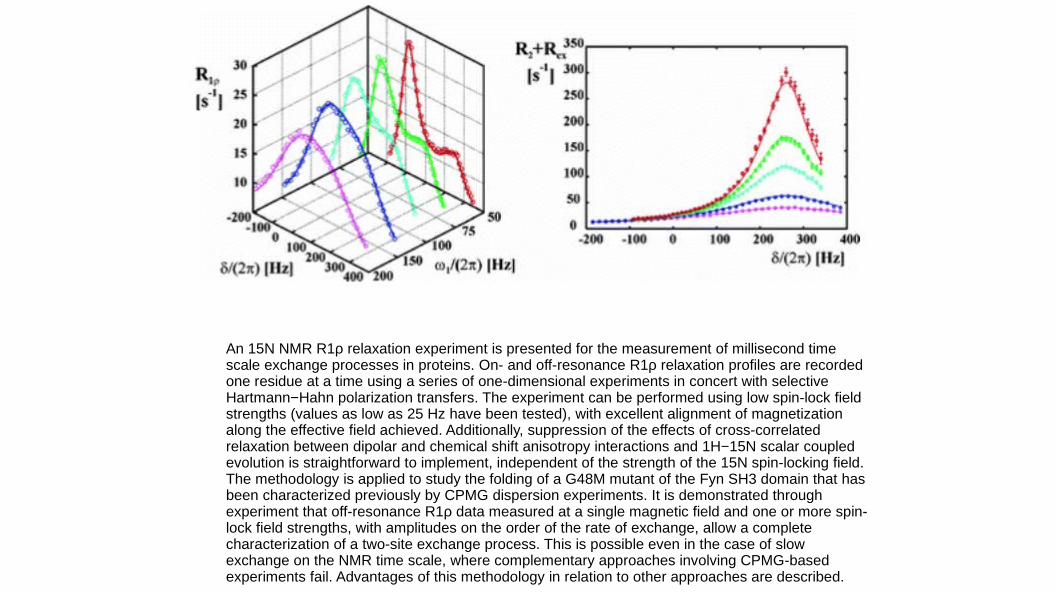
An 15N NMR R1ρ relaxation experiment is presented for the measurement of millisecond time scale exchange processes in proteins. On- and off-resonance R1ρ relaxation profiles are recorded one residue at a time using a series of one-dimensional experiments in concert with selective Hartmann−Hahn polarization transfers. The experiment can be performed using low spin-lock field strengths (values as low as 25 Hz have been tested), with excellent alignment of magnetization along the effective field achieved. Additionally, suppression of the effects of cross-correlated relaxation between dipolar and chemical shift anisotropy interactions and 1H−15N scalar coupled evolution is straightforward to implement, independent of the strength of the 15N spin-locking field. The methodology is applied to study the folding of a G48M mutant of the Fyn SH3 domain that has been characterized previously by CPMG dispersion experiments. It is demonstrated through experiment that off-resonance R1ρ data measured at a single magnetic field and one or more spin-lock field strengths, with amplitudes on the order of the rate of exchange, allow a complete characterization of a two-site exchange process. This is possible even in the case of slow exchange on the NMR time scale, where complementary approaches involving CPMG-based experiments fail. Advantages of this methodology in relation to other approaches are described.
Other References
Chemical exchange in biomacromolecules: Past, present, and future Arthur G. Palmer III, J Magn Reson. 2014 April ; 241: 3–17. doi:10.1016/j.jmr.2014.01.008