agenda for board of directors auburn school district … · 1. written communications . 2....
TRANSCRIPT

AGENDA FOR BOARD OF DIRECTORS AUBURN SCHOOL DISTRICT NO. 408
Monday, March 9, 2015
I. TIME AND PLACE
1. 7 p.m. at the James P. Fugate Administration Building
II. ROLL CALL
1. Roll call of board members
III. PLEDGE OF ALLEGIANCE
IV. AUDIENCE PARTICIPATION
1. Written communications
2. Scheduled communications
3. Unscheduled communications
4. Community groups and organizations
Brenda Austin, Loss Control Consultant for the Washington Schools Risk Management Pool, would like to present the district and Randy Thomas, executive director of maintenance and operations, the Award for Achievement for the 2014 Risk Assessment Survey Award for Facility Management.
V. LEGISLATIVE UPDATE
VI. STUDENT PARTICIPATION
1. Ilalko Elementary School art display
2. Activity/athletic report
3. West Auburn High School prom plan
4. Requests for travel
VII. SCHOOL PROGRAMS AND STUDENT ACHIEVEMENT
1. 2013-16 Alpac Elementary School improvement plan
2. Instructional technology implementation progress report
VIII. PERSONNEL
1. Certificated and classified personnel report
2. Requests for travel
IX. BUILDING PROGRAM
1. Asset preservation program
2. Authorization of award of contract
X. FINANCE
1. Vouchers

XI. DIRECTORS
1. Approval of minutes
2. Discussion
3. Executive session
LEGISLATIVE UPDATE The board will discuss legislative items.

March 9, 2015 Page 2
STUDENT PARTICIPATION
1. Ilalko Elementary School Art Display
Tim Carstens, Ilalko Elementary School principal, will introduce
Adylin Edwards and Olivia Morrow, students, who will present the Ilalko Elementary School art display and answer questions from the board.
2. Activity/Athletic Report—Auburn Riverside High School Fast Pitch Program Dave Halford, Auburn Riverside High School principal, will introduce
Bryce Strand, Auburn Riverside High School coach, who will introduce Taylor Poe and Hannah Juth, students. The students will report on the Auburn Riverside High School fast pitch program and answer questions from the board.
3. West Auburn High School Prom Plan
Lenny Holloman, West Auburn High School principal, will introduce Steven Payne, West Auburn High School teacher and ASB advisor, who will introduce Claudia Flores and Billis Sawej, West Auburn High School’s ASB president and treasurer, respectively. The team will present the West Auburn High School prom plan which will be held at West Auburn High School on Saturday, April 25, from 8:00 p.m. to 11:00 p.m.
Recommendation: That the board approve the West Auburn High School prom plan as outlined and requested.
4. Requests for Travel
a. Sixteen Auburn Riverside High School students request permission to travel to Seattle, Friday to Sunday, March 13-15. The purpose of the trip is to attend the Seattle Key Club Division Conference. Lodging will be at the Seattle Sheraton hotel, meals will be at local restaurants, and travel will be by train. All expenses will be paid by Valley Kiwanis. Kelly Jensen, Auburn Riverside High School teacher, requests permission to accompany the students. A substitute will be needed for one day.
Kevin Gazay, parent chaperone, requests permission to accompany the
students. b. Thirty Auburn Mountainview High School students request permission
to travel to Mt. Vernon, Friday to Sunday, March 13-15. The purpose of the trip is to attend the FIRST (For Inspiration and Recognition of Science and Technology) Robotics Competition. Lodging will be at the Hampton Inn and private homes, meals will be at local restaurants, and travel will be by school bus and personal vehicle. All expenses will be paid by CTE and ASB funds. Tim Scott, Regina Grubb, and Robert Moritz, Auburn Mountainview High School teachers, request permission to accompany the students. One substitute will be needed for one day.

March 9, 2015 Page 3
Mr. and Mrs. Kroon, Mr. and Mrs. Hamburg, and Mr. Kukay, parent
chaperones, request permission to accompany the students. c. Five Auburn Mountainview High School students request permission to
travel to Wenatchee, Tuesday to Friday, March 24-27. The purpose of the trip is to attend the Family, Career, and Community Leaders of America (FCCLA) Conference. Lodging will be at the Wenatchee Coast Convention, meals will be at local restaurants, and travel will be by personal van. Lodging and travel expenses will be paid by CTE funds and meal expenses will be paid by CTE and personal funds. Dr. Vivian Baglien, Auburn Mountainview High School teacher, requests permission to accompany the students. A substitute will be needed for three and a half days.
d. Twelve Auburn High School students, 12 Auburn Mountainview High
School students, and 13 Auburn Riverside High School students request permission to travel to Portland, Oregon, Wednesday to Thursday, April 1-2. The purpose of the trip is to attend the DECA Sports Marketing Field Study. Lodging will be at the DoubleTree hotel, meals will be at local restaurants, and travel will be by charter bus. All expenses will be paid by ASB funds, with students helping to pay for their own meals. Lori Jacobs, Derek Enz, and Doug Aubert, DECA advisors for Auburn High School, Auburn Mountainview High School, and Auburn Riverside High School, respectively, and Shelley Davis, Auburn High School para-educator, request permission to accompany the students. Substitutes will be needed for one day.
e. Thirteen Auburn Riverside High School students request permission to
travel to Denver, Colorado, Thursday to Sunday, April 16-19. The purpose of the trip is to attend the JEA/NSPA National Journalism Conference. Lodging will be at the Sheraton hotel, meals will be at local restaurants, and travel will be by airplane. Travel and registration expenses will be paid by ASB funds and students will pay for their own meals and lodging. Patrick Swenson, Auburn Riverside High School teacher, requests permission to accompany the students. A substitute will be needed for two days.
Russ and Kathy Brown, parent chaperones, request permission to
accompany the students. f. Sixty-two Auburn Riverside High School students request permission
to travel to Pasco, Friday to Saturday, April 17-18. The purpose of the trip is to compete in the Green River Music Region Choir Festival. Lodging will be at the Courtyard-Richland, meals will be at local restaurants, and travel will be by school bus. Travel and lodging expenses will be paid by booster club funds and students will pay for their own meals. Jon Stenson and Eric Makhonov, Auburn Riverside High School teacher and student teacher, respectively, and Frank Ramirez, Auburn Riverside High School assistant principal, request permission to accompany the students. Two substitutes will be needed for one day. Sarah Samuelson, volunteer, requests permission to accompany the students as a chaperone.

March 9, 2015 Page 4
g. Twenty-four Auburn Riverside High School students request permission
to travel to Beaverton, Oregon, Friday to Sunday, April 17-19. The purpose of the trip is to compete in the Tualatin Hills Water Polo Rose Cup Tournament. Lodging will be at the Fairfield Inn & Suites, meals will be at local restaurants, and travel will be by personal cars. Travel, lodging and entry fee expenses will be paid by ASB funds and students will be paying for their own meals. Mike Van Eaton and Blair Jackson, Auburn Riverside High School coaches, request permission to accompany the students. A substitute will be needed for one day.
Leslie Ridge, Vicki Freelund, and Mary Dorn, parent chaperones,
request permission to accompany the students. h. Eleven Auburn High School students, 12 Auburn Mountainview High
School students, and five Auburn Riverside High School students request permission to travel to Orlando, Florida, Friday to Wednesday, April 24-29. The purpose of the trip is to attend the DECA International Conference. Lodging will be at the Rosen Shingle Creek hotel, meals will be at local restaurants, and travel will be by airplane and car rental. All expenses will be paid by ASB and CTE funds, with students helping to pay for their own meals. Lori Jacobs, Derek Enz, and Doug Aubert request permission to accompany the students. Substitutes will be needed for four days.
i. Six Auburn High School students request permission to travel to
Arlington, Friday to Saturday, March 20-21. The purpose of the trip is to compete in the State Floral Competition. Lodging will be at the Best Western hotel, meals will be at local restaurants, and travel will be by rental car. All expenses will be paid by ASB and CTE funds. Ronda Kurka, Auburn High School teacher, requests permission to accompany the students. A substitute will be needed for one day.
Recommendation: That the above trips be approved as
requested.

March 9, 2015 Page 5
SCHOOL PROGRAMS AND STUDENT ACHIEVEMENT 1. 2013-16 Alpac Elementary School Improvement Plan
Rodney Luke, associate superintendent of technology and learning, will introduce Chelsi Kessler, Title 1 Reading teacher, and Rachel Laukala, Title 1 Math teacher. The team will present the 2013-16 Alpac Elementary School Improvement Plan, share a PowerPoint presentation and answer questions from the board. This presentation aligns with the 2013-16 district strategic plan, Goal 1: student achievement, Objective 2 school improvement plans and the 2014-15 stated district goals, Standard III “create conditions district wide for student and staff success.”
Recommendation: That the board approve the 2013-16 Alpac
Elementary School Improvement Plan. 2. Instructional Technology Implementation Progress Report for Auburn High
School and Auburn Riverside High School
Rodney Luke will introduce Douglas Gonzales, coordinator of instructional technology, who will introduce Richard Zimmerman and Dave Halford, Auburn High School principal and Auburn Riverside High School principal, respectively. Principal Zimmerman will introduce social studies teacher Abe VanDerPuy and Principal Halford will introduce social studies teacher Shawn Martinson. The team will present research tools within Google Docs utilized by students to cite evidence in their papers and the integration of Schoolwires, Google Classroom and Google Forms. This presentation aligns with the 2013-16 district strategic plan, goal 1: student achievement, objective 4: technology, and the 2013-16 stated district goals standard III, “create conditions district wide for student and staff success,” goal 2: “increase the use of instructional technology for student achievement by having a process in place to support evaluation and updating of technology.”


Planning & Staff Communication
SIP Leadership Team Reading Specialist, Math Specialist, Perception Committee Leader, Principal
Reading/Math/Perception CommitteesAll Staff, Parent Representative
SMART Goals and Action Steps Determined by Leadership Team, Voted on by Staff

Third Grade Gap Data for 2013-2014:
73% of students met standard on the MSP. Alpac third graders performed 5.2% below
the district average of 78.20%. Alpac third graders performed 1% higher
than the state average of 72.00%.
Year School District State 2005-06 WASL 62.89% 66.90% 68.2% 2006-07 WASL 64.79% 67.20% 70.8% 2007-08 WASL 60.00% 70.29% 70.7% 2008-09 WASL 74.59% 78.20% 71.4% 2009-10 MSP 66.59% 74.20% 72.0% 2010-11 MSP 73.09% 83.50% 73.1% 2011-12 MSP 64.59% 73.59% 68.7% 2012-13 MSP 77.29% 80.59% 73.0% 2013-14 MSP 73.00% 78.20% 72.0%

Year School District State 1996-97 WASL 47.89% 51.10% 47.8% 1997-98 WASL 57.60% 57.60% 55.6% 1998-99 WASL 52.79% 60.60% 59.0% 1999-00 WASL 52.29% 67.40% 65.7% 2000-01 WASL 69.59% 66.20% 65.9% 2001-02 WASL 74.00% 69.50% 65.5% 2002-03 WASL 76.09% 64.00% 66.7% 2003-04 WASL 73.09% 72.29% 74.3% 2004-05 WASL 79.50% 78.00% 79.5% 2005-06 WASL 81.00% 80.90% 81.1% 2006-07 WASL 71.20% 74.70% 76.6% 2007-08 WASL 73.29% 72.79% 72.6% 2008-09 WASL 69.79% 76.09% 73.6% 2009-10 MSP 74.00% 71.20% 67.1% 2010-11 MSP 76.59% 74.00% 67.3% 2011-12 MSP 86.20% 82.40% 71.5% 2012-13 MSP 72.50% 80.90% 72.5% 2013-14 MSP 88.79% 79.59% 70.0%
Fourth Grade Gap Data for 2013-2014
88.79% of students met standard on the MSP.
Alpac fourth graders performed 9.2% above the district average of 79.59%.
Alpac fourth graders performed 18.79% higher than the state average of 70.00%.
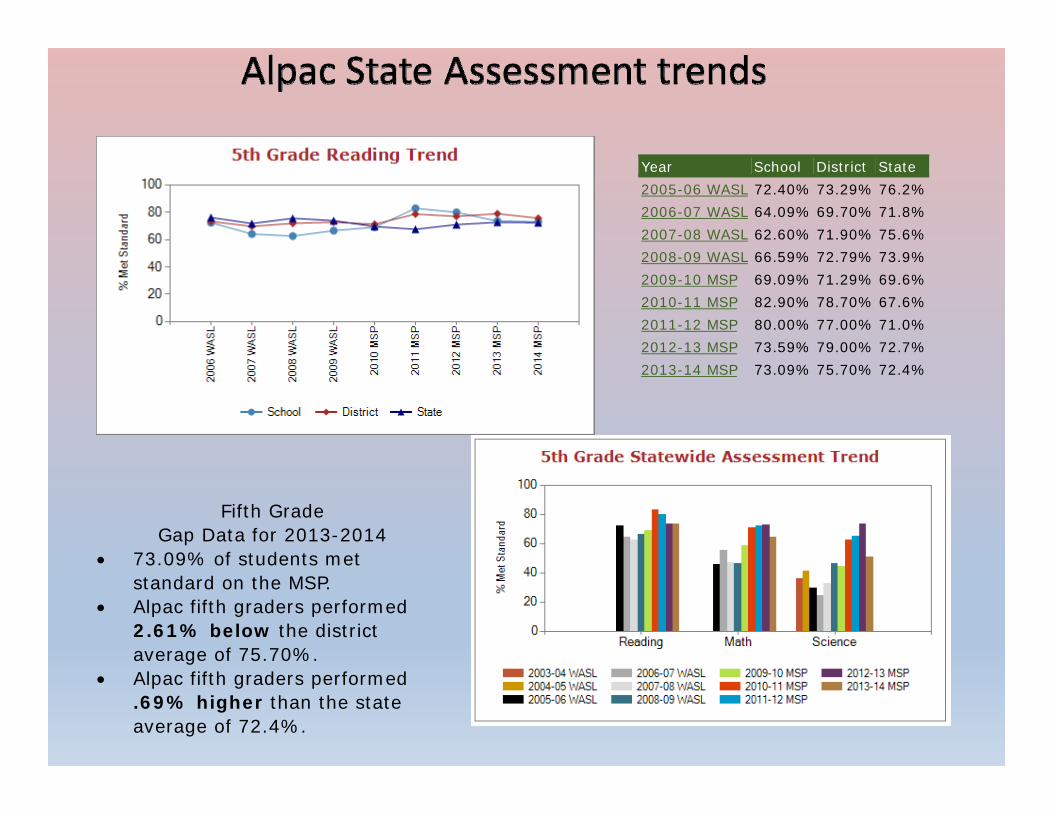
Fifth Grade Gap Data for 2013-2014
73.09% of students met standard on the MSP.
Alpac fifth graders performed 2.61% below the district average of 75.70%.
Alpac fifth graders performed .69% higher than the state average of 72.4%.
Year School District State 2005-06 WASL 72.40% 73.29% 76.2% 2006-07 WASL 64.09% 69.70% 71.8% 2007-08 WASL 62.60% 71.90% 75.6% 2008-09 WASL 66.59% 72.79% 73.9% 2009-10 MSP 69.09% 71.29% 69.6% 2010-11 MSP 82.90% 78.70% 67.6% 2011-12 MSP 80.00% 77.00% 71.0% 2012-13 MSP 73.59% 79.00% 72.7% 2013-14 MSP 73.09% 75.70% 72.4%

SIP Reading Goal• SMART Goal 1: Reading, The percentage of Alpac students at grades
3‐5 meeting standard in ELA will increase from 76.9% in 2012 to 85.4% by 2016 as measured by the Washington State Assessment.
– 84.6% of third grade students will meet standard in reading as measured by the state assessment in 2016.
– 90% of fourth grade students will meet standard in reading as measured by the state assessment in 2016.
– 86.1% of fifth grade students will meet standard in reading as measured by the state assessment in 2016.
Our Reality:– The percentage of third grade students that met standard in reading, as measured by
the state assessment, increased from 64.59% in 2012 to 73.0% in 2014.– The percentage of fourth grade students that met standard in reading, as measured by
the state assessment, increased from 86.2% in 2012 to 88.79% in 2014.– In 2014, 73.09% of fifth grade students that met standard in reading, as measured by
the state assessment, outscoring the state by 0.7 percent.

• SMART Goal 2: Math, The percentage of Alpac students at grades 3‐5 meeting standard in math will increase from 73.57% in 2012 to 85.57% by 2016 as measured by the Washington State Assessment.
– 86.2% of third grade students will meet standard in math as measured by the state assessment in 2016.
– 85.4% of fourth grade students will meet standard in math as measured by the state assessment in 2016.
– 85.1% of fifth grade students will meet standard in math as measured by the state assessment in 2016.
Our Reality:– The percentage of third grade students that met standard in math, as measured by the
state assessment, increased from 68.4% in 2012 to 68.79% in 2014.– The percentage of fourth grade students that met standard in math, as measured by the
state assessment, increased from 72% in 2012 to 76.5% in 2014. – In 2014, 64.09% of fifth grade students that met standard in math, as measured by the
state assessment, outscoring the state by 0.6 percent.
SIP Math Goal

Action PlansSMART Goal 1
ELASMART Goal 2
MathSMART Goal 3Perceptual
1. Systematically and explicitly teach, reinforce and assess Tier 2 content vocabulary at all grade levels, K‐5.
2. Each grade level, K‐5, will explicitly teach writing of summaries of non‐fiction text.
3. Systematically and explicitly, teach, reinforce and assess academic vocabulary at all grade levels, K‐5.
1. Each grade level, K‐5, will explicitly and consistently teach number sense in core instruction.
2. Strengthen Tier 2/3 math intervention within core math instruction.
1. Learning targets are clearly aligned with standards (Washington State and Common Core State Standards) and are communicated and clearly understood by students.
Our Reality• Explicitly taught, reinforced and are
assessing academic vocabulary through the use of the textbook, Teaching the Critical Vocabulary of the Common Core, Marilee Sprenger.
• Implemented Read Well in grades k‐3, students exit upon mastery.
• Implemented district created ELA comprehension packets and novel studies in grades 3, 4, and 5.
• Strategically planned, created, and implemented assessment mirrors for ELA and math.
• Extended Day Math program • Full implementation of the Balanced
Math program in grades K‐5• Introduced Kim Sutton’s Block 10
Program for fact fluency in grades 1‐5
• Strategically planned, created, and implemented assessment mirrors for ELA and math
• Teachers collaborate as grade level teams to develop “I can” statements for target boards in reading and math
• All teachers display common core state standards in kid friendly language for reading and math

Tier 1 All Students90 minutes
Walk‐to‐Read/CoreDistrict ELA Passages, Read Well, Read Naturally, Rewards, Novel Studies, Harcourt, SBA prep materials , Step‐Up to
Writing, Phonics for Reading
Tier 2Qualifying intensive/strategic studentsAdditional 30 minutes of small groups
Title/LAP Specialists Phonics for Reading, Read Well, Read Naturally, Phonics Boost, SBA Prep
Tier 3 Most Intensive30 minutes
ELL, Resource Room, Title/LAP
Explicit foundational skills
Intervention/Enrichment

ELA Math Perceptual
• Anita Archer – August 2013, July 2014
• K-2 Phonics Bootcamp, Cory Ekstorm – August 2014
• Randy Jones, ICA/ICB Training –
February 2014
• Evelyn Probert, Phonics
Instruction – February 2014
• Phonics Boost Instruction
• Grade Level Planning PD (ie:
cross curriculum biography
lesson created by fourth grade
and librarian)
• Brendan Jeffreys, Problem Solving/Balanced Math – August 2013
• Kim Sutton – Block 10 math fact training –multiple grade level trainings 2013-14
• Book Study: 7 Strategies of Assessment for Learning –August 2013
• Book Study: Teaching with Poverty in Mind, August 2014
• Doug Gonzales, Google Docs Training – August 2014
• Ongoing PD in Google Technologies
• PBIS - August 2014

Math Spreadsheets Monitor:MAP
Weekly Problem Solving (3-5) Trimester Assessments (K-2)
Fact Fluency
Example ELA Comprehension (above) Example of Reading Assessments (right)
• Student Scores • Weekly monitoring • PLCs• Student movement, challenges, celebrations • Fourth Grade Piloting Google Docs as a
Spreadsheet

Instructional Technology
• AR
• Assessments (STAR, MAP, etc)
• IXL
• Research on laptops in classrooms
• Ongoing PD in Google Technologies
• ATLA Members Google trained
• Student and Teacher Chromebooks
• ICAs and ICBs as teaching tools from WCAP

1 | P a g e 2 / 2 7 / 1 5
Implementation September 2013-June 2016 Alpac Elementary
Strategic Improvement Plan
School Improvement Plan Adopted by the Auburn School Board of Directors in June, 2013

2 | P a g e 2 / 2 7 / 1 5
2009 - 2012 Auburn School District Strategic Improvement Plan
District Improvement Goal 1: Student Achievement
With district support, leadership, and guidance each student will achieve proficiency in the Washington Comprehensive Assessment Program (WCAP) and all schools will meet adequate yearly progress by meeting or exceeding the Washington State uniform bar in reading and mathematics in grades 3 through 8 and 10. District Improvement Goal 2: Dropout Rate and On-time Graduation
Schools will reduce dropout rates and meet additional Adequate Yearly Progress indicators as determined by K-8 attendance and high school on-time graduation rates. District Improvement Goal 3: Parents/Guardians and Community Partnerships
The district and schools will continue to develop partnerships to support student academic achievement and success. District Improvement Goal 4: Policies and Resource Management
The district will focus on improving student academic achievement and narrowing the achievement gaps in its policy decisions and resource allocation.
School: Alpac Elementary School
Date of SIP Team District Improvement Goal Review:
SIP Team Members:
Jim Riley Holly Lancaster Tanya Cicero Tana Miller
Chelsi Kessler Milene Henry Roxanne Harlor Julie McKenzie
Rachel Laukala Angie Linn Adrienne Heier Tanya McGarvey

3 | P a g e 2 / 2 7 / 1 5

4 | P a g e 2 / 2 7 / 1 5
Signatures for Approval
Department of Technology
Rod Luke Associate Superintendent,
Technology
Department of Student Learning
Heidi Harris Assistant Superintendent,
Student Learning
Cindi Blansfield Executive Director,
Secondary Education
Julie DeBolt Director,
Assessment and NCLB
Department of Principal Leadership & School Programs
Ryan Foster
Assistant Superintendent,
Principal Leadership &
School Programs
Department of Family Engagement & Student Success
Rhonda Larson
Assistant Superintendent,
Family Engagement &
Student Success
Superintendent
Kip Herren Superintendent
School Board
Anne Baunach School Board
Ryan Van Quill School Board
Laurie Bishop School Board
Carol Seng School Board
Ray Vefik School Board

5 | P a g e 2 / 2 7 / 1 5
Executive Summary
Auburn School District Mission In a safe environment, all students will achieve high standards of learning in order to become ethically responsible decision makers and lifelong learners.
Auburn School District Vision The vision of Auburn School District is to develop in students the skills and attitudes that will maximize their potential for lifelong learning and ethically responsible decision making.
School Mission Our staff mission is:
To educate all students in a supportive and positive environment, so they reach their full potential. All adults are collaboratively working together using best practices to reach all levels of learners.
Our student mission is to be:
Active Learners with Positive attitudes Achieving excellence in a Caring community. We do our best and help the rest.
School Vision The Alpac School Community is committed to developing life-long learners by providing a challenging, caring, and stable environment where children respect themselves and others, and grow to their fullest academic, social, and emotional potential.
Background Information WAC 180-16-220 Requirements for School Improvement Plan
Each school shall be approved annually by the school board of directors under an approval process determined by the district board of directors and “At a minimum the annual approval shall require each school to have a school improvement plan that is data driven, promotes a positive impact on student learning, and includes a continuous improvement process that shall mean the ongoing process used by a school to monitor, adjust, and update its school improvement plan.” School Improvement plans must include a brief summary of use of data to establish improvement; acknowledging the use of data which may include DIBELS, MAP, WELPA, Credit Attainment, Enrollment in Honors/AP Courses, CEE Perceptual Data, SAT/ACT, Discipline, and MSP or HSPE.
6 | P a g e 2 / 2 7 / 1 5
Stakeholder Input Our SIP team consists of 12 highly qualified staff members and parent and community representatives. We meet once a month to discuss the changes and implementations for our current School Improvement Plan. The staff is notified of all changes and updates at regular bi-weekly staff meetings. Reading, Math, and Perceptual data is analyzed at four data carousels throughout the year; strengths and challenges are determined and strategies are discussed for immediate implementation.
Highly Qualified Staff All staff at Alpac Elementary School are highly qualified.
Demographic data Upon analyzing Alpac’s demographic data from 2008-2012 distinct patterns were identified. The free and reduced data has shown a rise each year, throughout the span, for a total increase of 11.6%. Alpac’s white population has remained the same from 2008-2012. Alpac’s Asian population has decreased each year for a total 8.4% throughout the five years. The ELL population has declined each year for a total of 5.8% in the five year.
Discipline and Attendance Analysis Upon analyzing the discipline and attendance data from 2010 – 2013 distinct patterns were identified. In 2010-2011, we had 19 suspensions; a number that has decreased the last two years to a total of 5 suspensions in 2011-12 and 7 suspensions in 2012-2013.
Assessment Decisions Alpac’s building decision making committee has recommended to the staff that we use the following assessments to drive all instruction. MAP in grades 2-5 to assess both reading and math strands; DIBELS to assess reading fluency in grades K-5; STAR to assess reading comprehension and vocabulary in grades 1-5; MSP in grades 3-5 to assess reading, writing, math and science; Common Grade Level Formative assessments for grades K-5 to assess vocabulary, reading and listening comprehension, fact fluency, number sense, problem solving, science, social studies and writing.
Data Analysis- DIBELS The percent of students meeting benchmark at each grade level for the years 2007 through 2012 were reviewed. Challenge: the percent of students at intensive increases significantly from spring to fall. Cohort data reveals a pattern in third grade scores reaching a plateau from fall to spring.
7 | P a g e 2 / 2 7 / 1 5
Data Analysis- MAPS The percent of students meeting benchmark at each grade level in reading and math for the years 2009 through 2012 were reviewed. Challenge: the percent of students at intensive in the fall is larger than desired in both reading and math. Disaggregation of the data by socio-economic status, special education, and ELL indicates the need to focus on special education and low income students. Cohort data for reading and math revealed that student scores are increasing from fall to fall in all grade levels.
Data Analysis- WELPA The percent of students meeting/exceeding standard on the WELPA for the years 2009 through 2012 were reviewed. Challenge: between second and third grade, level 3 students are only decreasing by 0.7%.
Data Analysis- Credit Attainment, Honors/AP Enrollment Does not pertain to Alpac Elementary School.
Data Analysis- CEE Perceptual Survey The percentage of staff who believes we have high standards and expectations at each grade level has been compared for the years 2008, 2010, and 2012. Challenge: Only 68% of staff believes we have high standards and expectations as measured by the CEE survey in 2012. Cohort data reveals an increase from 50% in 2008 to 56% in 2010 to 68% in 2012. This is an 18% increase over the last four years. When comparing school data to High Performing Schools (Top 20%), Alpac is about 10% higher in believing we have high standards and expectations.
MSP/HSPE Reading The percent of students meeting/exceeding standard at each grade level for the years 2006 through 2012 were reviewed in comparison to state averages for the same years. Challenge: gap between the performance of our students and the students across the state in third grade. Cohort data reveals a pattern of increased scores from 3rd to 4th grade but a decrease in scores from 4th grade to 5th grade. Disaggregation of the data by socio-economic status, special education, and ELL indicates the need to focus on special education and low income students. There is not a significant gap between both subgroups compared to sate achievement for these groups. Level data at each grade level for 2006 through 2012 indicates little movement of students from Levels 1 and 2 to Levels 3 and 4.
MSP/EOC Math The percent of students meeting/exceeding standard at each grade level for the years 2006-2012 were reviewed in comparison to state averages for the same years. Challenge; in comparing the 6 years of data, results indicated that from 2009 to 2011, our 4th grade students meeting standard in writing decreased from 83.5% to 68%. Disaggregation of the data by socio-economic status, special education, and ELL indicates the need to focus on special education and low income

8 | P a g e 2 / 2 7 / 1 5
students. Cohort data reveals a pattern of increased level 4 scores within 4th grade writing. Level data at grade 4 from 2006-2012 indicates little movement from level 2 to levels 3 and 4.
MSP Science/EOC Science The percentage of students meeting/exceeding standard in Science in 5th grade for the years 2008-09 through 2011-12 were reviewed in comparison to state averages for the same years. Although both Low income and Non Low income are outperforming state averages, a consistent gap has been identified within our school. Challenge: consistent gap between the performances of our Low Income students compared to Non Low income students each year. Disaggregation of the data by socio-economic status, special education, and ELL indicates the need to focus on special education and low income students. Cohort data reveals a pattern of approximately 30% lower scores for Low Income Students each year. Disaggregation of the data by Low Income vs. Non Low Income indicates the need to focus on the achievement of Low Income Students in the area of Science.
MSP Writing The percent of students meeting/exceeding standard at each grade level for the years 2006-2012 were reviewed in comparison to state averages for the same years. Challenge; in comparing the 6 years of data, results indicated that from 2009 to 2011, our 4th grade students meeting standard in writing decreased from 83.5% to 68%. Disaggregation of the data by socio-economic status, special education, and ELL indicates the need to focus on special education and low income students. Cohort data reveals a pattern of increased level 4 scores within 4th grade writing. Level data at grade 4 from 2006-2012 indicates little movement from level 2 to levels 3 and 4. Strengths 1. In Winter 2013, fourth grade students scoring at intensive for DIBELS decreased 16% from 30% in the Fall of 2012 to 14% in the Winter 2013.
2. In 2011-2012, third grade students were 6% above the district and 11.3% above the state on the math section of the MSP.
3. The percentage of staff that believes we expect all staff to perform responsibilities with high levels of excellence was 94%.

9 | P a g e 2 / 2 7 / 1 5
Prioritized Challenges
In this section, prioritize the challenges identified in the Executive Summary that
will drive the direction for your study teams. Your SMART GOALS and Action
Steps must address the Prioritized Challenge Narratives from this section
Reading:
1. From 2009-2010 to 2010-2011, fourth grade students meeting standard in writing
decreased from 83.5% to 68%.
2. In 2012, third grade non-low income students decreased from 84.4% to 60% at
benchmark on the MSP.
3. In 2012, 35.4% of 3rd grade MSP reading students are still not meeting standard.
Math:
1. From 2004-2012 Low income vs. Non-Low income math WASL/MSP in third through
fifth grade has remained stagnant.
2. In 2011-2012, 80% of limited English fifth grade students are not performing at
benchmark on the MSP.
3. In 2011- 2012, approximately 50% of second grade students were not at benchmark for
their subtraction facts in the spring.
Perception:
1. The sample size for the 2012 CEE survey was only sixteen people out of our certificated
and classified staff.
2. From October 2010 to November 2012, we decreased 20% in believing that our staff
shares new ideas and strategies with one another.
3. On the 2012 CEE survey, 25% of our staff did not believe we hold one another
accountable for student learning.

10 | P a g e 2 / 2 7 / 1 5
Study Teams
Literacy Goal Group: Chelsi Kessler, Brenda Leyda, Jill Escalara, Joy Huft, Angelica Howell, Angie Linn, Rebecca Bunker, Andrea Leverton, Suzie Chipps-Freeman, Lisa Nickel Reading Goal Group Research Materials:
The ELA study team reviewed identified best practice strategies and the Common Core State Standards to develop a plan to address our reading and writing challenges.
Writing Goal Group Research Materials: The ELA study team reviewed identified best practice strategies and the Common Core State Standards to develop a plan to address our reading and writing challenges.
Oral Communication Goal Group Research Materials: The ELA study team reviewed identified best practice strategies and the Common Core State Standards to develop a plan to address our reading and writing challenges.
Math Goal Group: Rachel Laukala, Adrienne Heier, Stacy Leitzke, Kelli Johnson, Holly Lancaster, Cheri Wilcox, Roxanne Harlor, Natalie Johnston, Tanya Cicero Math Goal Group Research Materials:
The math study team reviewed identified best practice strategies and the Common Core State Standards to develop a plan to address our math challenges.
Supportive Learning Environment Goal Group: Mary Beckett, Milene Henry, Brent Botkin, Alice Wren, , Julie McKenzie, Sandy Bohman, Jenny Ford, Tana Miller, Tanya McGarvey Supportive Learning Environment Research Materials:
The perception study team reviewed identified best p ractice strategies to align with the 9 Characteristics of Effective Schools.

11 | P a g e 2 / 2 7 / 1 5
Rationale for SMART Goals:
When establishing our SMART goals, we analyzed our previous School Improvement Plan and State Assessment Data to pinpoint areas of high needs. It was then determined as a building to continue to improve upon our previous goals increasing our State Assessment scores in the areas of ELA and Math.
For SMART Goal 1, we have increased from 70.4% in 2009 to 76.9% in 2012 and are continuing to work towards the goal of 86.9% of students meeting standard as measured by the 2016 Washington State Assessment. For SMART Goal 2we have increased from 51.9% in 2009 to 73.6% in 2012, meeting our initial goal of 69.9% of students meeting standard as measured by the Washington State Assessment. We have increased our goal from 69.9% to 85.6% of students meeting standard by 2016. This goal is attainable for grades 3-5 only if grades K-2 continue working hard and meeting their grade level standards. Upon analyzing the CEE survey data, we determined that although we have met and exceeded our previous goal of 68% of staff believing we have high standards and expectations, it is still an area of high need, when comparing all of the 9 Characteristics of High Achieving Schools. To further our work in high standards and expectations our goal is to have 84% of staff believing that we have high standards and expectations as measured by the 2016 CEE survey.
SMART Goal 1:
The average percentage of Alpac students at grades 3-5 meeting standard in reading will increase from 76.9% in 2012 to 86.9% by 2016 as measured by the Washington State Assessment. The grade level targets are:
1. 84.6% of third grade students will meet standard in reading as measured by the state assessment in 2016.
2. 90% of fourth grade students will meet standard in reading as measured by the state assessment in 2016.
3. 86.1% of fifth grade students will meet standard in reading as measured by the state assessment in 2016.
SMART Goal 2:
The average percentage of Alpac students at grades 3-5 meeting standard in math will increase from 73.6% in 2012 to 85.6% by 2016 as measured by the Washington State Assessment. The grade level targets are:
1. 86.2% of third grade students will meet standard in math as measured by the state assessment in 2016.
2. 85.4% of fourth grade students will meet standard in math as measured by the state assessment in 2016.
3. 85.1% of fifth grade students will meet standard in math as measured by the state assessment in 2016.

12 | P a g e 2 / 2 7 / 1 5
SMART Goal 3:
The average percentage of Alpac staff who believes that we have high standards and expectations will increase from 72% in 2012 to 84% in 2016 as measured by the CEE survey. The following are the targets for SMART Goal 3:
1. 2014: 78% of staff will believe we have high standards and expectations. 2. 2016: 84% of staff will believe we have high standards and expectations.

13 | P a g e 2 / 2 7 / 1 5
Needs Assessment Data Documents
In this section include all supporting documents you used to write your SMART GOALS and ACTION STEPS. These documents include but are not limited to:
o DIBELS Dashboard
o MAP Data Dashboard
o WELPA results
o CEE Spider chart
o Discipline Dashboards
o Demographic charts
o STATE ASSESSMENT GOALS (AMO) Results
o MSP/HSPE/EOC Results and trend charts
o PLC Survey Data
o Other data

14 | P a g e 2 / 2 7 / 1 5
MAP Reading Test Comparison Percentage of Students at Level Alpac Elementary 2009-10 2010-11 2011-12 2012-13 Fall Winter Spring Fall Winter Spring Fall Winter Spring Fall Winter Spring
Gra
de 3
Median RIT 192 197 200 192 197 200 192 197 200 182 191 199
Number Tested 81 79 78 89 95 95 65 64 65 74 74 73
Benchmark 43% (35)
46% (36) 45% (35) 37% (33) 40%
(38) 44% (42)
42% (27)
48% (31)
49% (32)
38% (28)
42% (31)
49% (36)
Strategic 19% (15)
23% (18) 23% (18) 20% (18) 26%
(25) 33% (31)
20% (13)
25% (16)
25% (16)
20% (15)
28% (21)
26% (19)
Intensive 38% (31)
32% (25) 32% (25) 43% (38) 34%
(32) 23% (22)
38% (25)
27% (17)
26% (17)
42% (31)
30% (22)
25% (18)
Gra
de 4
Median RIT 201 205 207 201 205 207 201 205 207 198 200 204
Number Tested 80 77 77 92 91 87 60 63 62
Benchmark X X X 41% (33) 49% (38)
48% (37)
46% (33)
52% (47)
61% (53)
48% (29)
41% (26)
44% (27)
Strategic X X X 34% (27) 23% (18)
25% (19)
25% (23)
31% (28)
22% (19)
15% (9)
29% (18)
24% (15)
Intensive X X X 25% (20) 27% (21)
27% (21)
39% (36)
18% (16)
17% (15)
37% (22)
30% (19)
32% (20)
Gra
de
5
Median RIT 208 211 212 208 211 212 208 211 212 209 212 213
Number 66 67 69 79 83 76 72 72 75 86 87 89
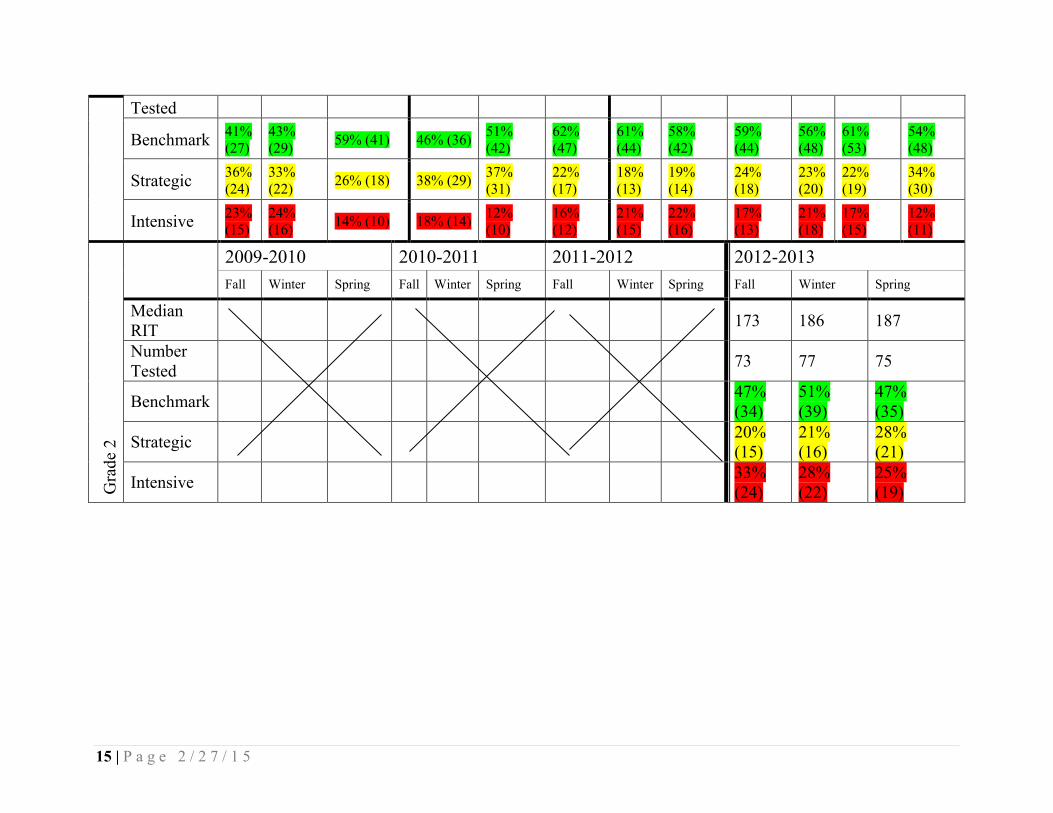
15 | P a g e 2 / 2 7 / 1 5
Tested
Benchmark 41% (27)
43% (29) 59% (41) 46% (36) 51%
(42) 62% (47)
61% (44)
58% (42)
59% (44)
56% (48)
61% (53)
54% (48)
Strategic 36% (24)
33% (22) 26% (18) 38% (29) 37%
(31) 22% (17)
18% (13)
19% (14)
24% (18)
23% (20)
22% (19)
34% (30)
Intensive 23% (15)
24% (16) 14% (10) 18% (14) 12%
(10) 16% (12)
21% (15)
22% (16)
17% (13)
21% (18)
17% (15)
12% (11)
Gra
de 2
2009-2010 2010-2011 2011-2012 2012-2013 Fall Winter Spring Fall Winter Spring Fall Winter Spring Fall Winter Spring
Median RIT
173 186 187
Number Tested
73 77 75
Benchmark 47% (34)
51% (39)
47% (35)
Strategic 20% (15)
21% (16)
28% (21)
Intensive 33% (24)
28% (22)
25% (19)

16 | P a g e 2 / 2 7 / 1 5
MAP Math Test Comparison Percentage of Students at Level Alpac Elementary 2009-10 2010-11 2011 - 2012 2012 - 2013 Fall Winter Spring Fall Winter Spring Fall Winter Spring Fall Winter Spring
Grade 3
Median RIT 192 199 203 192 199 203 188 199 203 187 194 202
Number Tested 80 79 79 88 90 95 65 64 61 76 72 74
Benchmark 41% (32)
43% (34) 34% (27) 34%
(30) 36% (32) 56% (53) 37% (24) 30%
(19) 51% (31) 38% (29) 35% (25) 58% (42)
Strategic 25% (21)
25% (20) 35% (28) 30%
(26) 36% (32) 25% (24) 20% (13) 28%
(18) 21% (13) 26% (20) 33% (24) 19% (14)
Intensive 34% (27)
32% (25) 30% (23) 36%
(32) 29% (26) 19% (18) 43% (28) 42%
(27) 28% (17) 36% (27) 32% (23) 24% (18)
Grade 4
Median RIT 203 208 211 203 208 211 201 208 211 198 203 209
Number Tested 80 77 77 91 91 86 60 65 61
Benchmark X X X 43% (35)
49% (38)
58% (45) 35% (32) 44%
(40) 60% (52) 40% (24) 35% (23) 39% (24)
Strategic X X X 27% (21)
29% (22) 22% (17) 42% (38) 32%
(29) 23% (20) 23% (14) 26% (17) 30% (18)
Intensive X X X 30% (24)
22% (17) 20% (15) 23% (21) 24%
(22) 16% (14) 37% (22) 38% (25) 31% (19)
Grade 5
Median RIT 212 216 220 212 216 220 212 216 220 210 216 223
Number Tested 69 68 69 79 83 80 71 72 75 86 87 90

17 | P a g e 2 / 2 7 / 1 5
Benchmark 38% (26)
49% (33) 56% (39) 47%
(37) 61% (51) 60% (48) 48% (34) 46%
(33) 55% (41) 40% (34) 45% (39) 60% (54)
Strategic 39% (27)
34% (23) 28% (19) 39%
(28) 21% (17) 28% (22) 30% (21) 28%
(20) 20% (15) 35% (30) 38% (33) 27% (24)
Intensive 23% (16)
18% (12)
16% (11)
14% (14)
18% (15) 13% (10) 22%
(16) 26% (19) 25% (19) 26%
(22) 17% (15)
13% (12)
Grade 2
2009-2010 2010-2011 2011-2012 2012-2013 Fall Winter Spring Fall Winter Spring Fall Winter Spring Fall Winter Spring
Median RIT 174 184 187 Number Tested 73 76 77
Benchmark 33% (24)
43% (33)
35% (27)
Strategic 33% (24)
30% (23)
26% (20)
Intensive 34% (25)
26% (20)
39% (30)

18 | P a g e 2 / 2 7 / 1 5

19 | P a g e 2 / 2 7 / 1 5

20 | P a g e 2 / 2 7 / 1 5
Math Fact Fluency Data (Grades 1 – 5) Percentage of Students at Level
Alpac Elementary 2012-2013
Grade 1
Entry + Entry - Tri. 1 + Tri. 1 - Tri. 2 + Tri. 2 - Tri. 3 + Tri. 3 - Benchmar
k 5 0 47 13 77 51 94 81
Strategic 2 0 10 6 2 5 2 6 Intensive 94 100 44 81 21 44 5 13
Grade 2
Entry + Entry - Tri. 1 + Tri. 1 - Tri. 2 + Tri. 2 - Tri. 3 + Tri. 3 - Benchmar
k 8 1 64 23 52 16 42 18
Strategic 19 3 25 30 28 27 25 21 Intensive 73 96 11 47 20 57 33 61
Grade 3
Entry +/-
Entry X Tri. 1 +/- Tri. 1 X Tri. 2 +/- Tri. 2 X Tri. 3 +/- Tri. 3 X
Benchmark
19 0 69 0 79 27 93 78
Strategic 13 0 5 0 7 15 3 10 Intensive 68 100 26 100 14 58 4 12
Grade 4
Entry +/-
Entry X Tri. 1 +/- Tri. 1 X Tri. 2 +/- Tri. 2 X Tri. 3 +/- Tri. 3 X
Benchmark
50 15 67 53 75 71 82 81
Strategic 10 5 7 15 9 12 2 3 Intensive 40 80 25 33 17 17 17 16

21 | P a g e 2 / 2 7 / 1 5
Grade 5
Entry +/-
Entry X Tri. 1 +/- Tri. X Tri. 2 +/- Tri. 2 X Tri. 3 +/- Tri. 3 X
Benchmark
45 36 70 78 80 79 85 90
Strategic 10 11 9 1 5 8 1 1 Intensive 46 53 21 21 15 14 14 9

22 | P a g e 2 / 2 7 / 1 5
DIBELS Fluency Comparison Percentage of Students at Level Alpac Elementary 2009-2010 2010 - 2011 2011 - 2012 2012-2013
Fall SPR Fall SPR Fall SPR Fall SPR
Kindergarten LNF
Benchmark 44% 44% 50% 76% 49% 64% 58% 74%
Strategic 25% 26% 22% 14% 18% 25% 16% 16%
Intensive 30% 30% 28% 10% 33% 11 % 26% 10%
First Grade NWF (CLS)
Benchmark 44% 89% 55% 81% 69% 90% 56% 78%
Strategic 30% 11% 31% 17% 20% 9% 27% 21%
Intensive 26% 0% 14% 1% 11% 1% 17% 2%
First Grade ORF (Winter/Spring)
Benchmark 58% 67% 48% 68% 56% 75% 56% 63%
Strategic 30% 25% 41% 22% 40% 21% 39% 32%
Intensive 12% 8% 11% 10% 4% 4% 5% 5%
Second Grade ORF
Benchmark 60% 66% 56% 61% 45% 62% 58% 62%
Strategic 21% 17% 28% 24% 30% 22% 27% 14%
Intensive 19% 18% 16% 15% 25% 16% 15% 23%
Third Grade ORF
Benchmark 46% 49% 55% 55% 57% 44% 44% 39%
Strategic 30% 35% 22% 31% 20% 39% 38% 45%
Intensive 24% 16% 23% 14% 23% 17% 18% 16%
Fourth Grade ORF
Benchmark 49% 61% 46% 64% 49% 67% 47% 63%
Strategic 30% 27% 28% 25% 24% 23% 23% 21%
Intensive 21% 12% 26% 12% 26% 10% 30% 16%
Fifth Grade ORF
Benchmark 69% 70% 73% 78% 71% 70% 78% 74%
Strategic 13% 14% 19% 16% 17% 13% 9% 16%
Intensive 19% 16% 9% 6% 12% 17% 13% 10%

23 | P a g e 2 / 2 7 / 1 5
Select a category of students: 3rd
All
Chart
Grade 3 Students Scoring in Each Level
Reading
Did Not Meet Standard Met Standard
School Year No Score Level 1 Level 2 Level 3 Level 4
2005-06 0.0% 11.1% 25.9% 22.2% 40.7% 2006-07 2.1% 14.9% 18.1% 40.4% 24.5% 2007-08 0.0% 15.0% 25.0% 37.5% 22.5% 2008-09 0.0% 3.6% 21.7% 39.8% 34.9% 2009-10 0.0% 14.1% 19.2% 33.3% 30.8% 2010-11 0.0% 5.4% 21.5% 46.2% 25.8% 2011-12 0.0% 7.7% 27.7% 33.8% 27.7%

24 | P a g e 2 / 2 7 / 1 5
Math
Did Not Meet Standard Met Standard
School Year No Score Level 1 Level 2 Level 3 Level 4 2005-06 1.2% 15.9% 17.1% 48.8% 15.9% 2006-07 3.2% 21.1% 9.5% 53.7% 12.6% 2007-08 0.0% 17.5% 21.3% 41.3% 20.0% 2008-09 0.0% 16.9% 19.3% 30.1% 33.7% 2009-10 0.0% 12.8% 25.6% 39.7% 20.5% 2010-11 0.0% 9.7% 12.9% 50.5% 25.8% 2011-12 0.0% 9.4% 14.1% 40.6% 32.8%

25 | P a g e 2 / 2 7 / 1 5
Select a category of students: 3rd
Limited English
Chart
Grade 3 Students Scoring in Each Level
Reading
Did Not Meet Standard Met Standard
School Year No Score Level 1 Level 2 Level 3 Level 4 2005-06 0.0% 0.0% 46.2% 23.1% 30.8% 2006-07 0.0% 50.0% 25.0% 25.0% 0.0% 2007-08 0.0% 25.0% 50.0% 20.0% 5.0% 2008-09 0.0% 10.0% 30.0% 50.0% 10.0% 2009-10 0.0% 27.8% 27.8% 27.8% 11.1% 2010-11 0.0% 27.3% 9.1% 63.6% 0.0% 2011-12 0.0% 9.1% 27.3% 54.5% 9.1%

26 | P a g e 2 / 2 7 / 1 5
Math
Did Not Meet Standard Met Standard
School Year No Score Level 1 Level 2 Level 3 Level 4 2005-06 7.1% 35.7% 7.1% 35.7% 14.3% 2006-07 0.0% 58.3% 25.0% 16.7% 0.0% 2007-08 0.0% 25.0% 30.0% 45.0% 0.0% 2008-09 0.0% 40.0% 30.0% 10.0% 20.0% 2009-10 0.0% 27.8% 44.4% 16.7% 5.6% 2010-11 0.0% 18.2% 27.3% 45.5% 9.1% 2011-12 0.0% 20.0% 10.0% 40.0% 30.0%

27 | P a g e 2 / 2 7 / 1 5
Select a category of students: 3rd
Low Income
Chart
Grade 3 Students Scoring in Each Level
Reading
Did Not Meet Standard Met Standard
School Year No Score Level 1 Level 2 Level 3 Level 4 2005-06 0.0% 13.0% 32.6% 19.6% 34.8% 2006-07 2.0% 20.0% 26.0% 40.0% 12.0% 2007-08 0.0% 21.6% 29.7% 40.5% 8.1% 2008-09 0.0% 6.4% 23.4% 46.8% 23.4% 2009-10 0.0% 14.3% 21.4% 37.5% 23.2% 2010-11 0.0% 4.9% 27.9% 47.5% 19.7% 2011-12 0.0% 6.0% 28.0% 36.0% 26.0%

28 | P a g e 2 / 2 7 / 1 5
Math
Did Not Meet Standard Met Standard
School Year No Score Level 1 Level 2 Level 3 Level 4 2005-06 0.0% 23.9% 13.0% 43.5% 19.6% 2006-07 2.0% 30.0% 12.0% 50.0% 6.0% 2007-08 0.0% 21.6% 21.6% 45.9% 10.8% 2008-09 0.0% 19.1% 27.7% 29.8% 23.4% 2009-10 0.0% 14.3% 28.6% 41.1% 14.3% 2010-11 0.0% 8.2% 14.8% 59.0% 16.4% 2011-12 0.0% 8.2% 16.3% 36.7% 34.7%

29 | P a g e 2 / 2 7 / 1 5
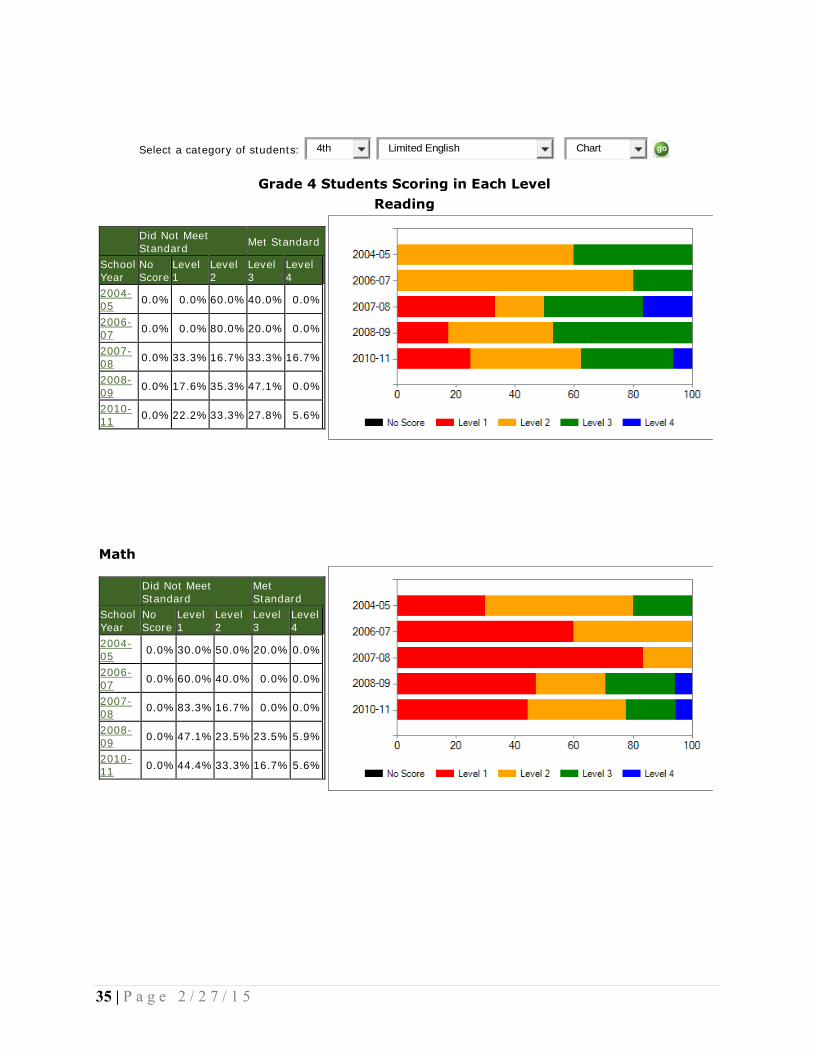
Select a category of students: 4th
All
Chart
Grade 4 Students Scoring in Each Level
Reading
Did Not Meet Standard Met Standard
School Year
No Score
Level 1
Level 2
Level 3
Level 4
1996-97
3.1% 9.2% 39.8% 38.8% 9.2% 1997-98
1.1% 3.3% 38.0% 47.8% 9.8% 1998-99
1.1% 1.1% 44.8% 41.4% 11.5% 1999-00
2.3% 8.1% 37.2% 41.9% 10.5% 2000-01
0.0% 5.1% 25.3% 51.5% 18.2% 2001-02
0.0% 4.8% 21.2% 45.2% 28.8% 2002-03
0.0% 0.0% 23.8% 53.6% 22.6% 2003-04
0.0% 9.3% 17.5% 50.5% 22.7% 2004-05
0.0% 5.4% 15.1% 57.0% 22.6% 2005-06
1.3% 5.1% 12.7% 54.4% 26.6% 2006-07
0.0% 4.1% 24.7% 49.3% 21.9% 2007-08
0.0% 7.8% 18.9% 40.0% 33.3% 2008-09
0.0% 4.1% 26.0% 41.1% 28.8% 2009-10
0.0% 4.9% 21.0% 39.5% 32.1% 2010-11
1.3% 6.5% 15.6% 32.5% 37.7% 2011-12
0.0% 2.3% 11.5% 37.9% 47.1%

30 | P a g e 2 / 2 7 / 1 5
Math
Did Not Meet Standard Met Standard
School Year
No Score
Level 1
Level 2
Level 3
Level 4
1996-97
2.0% 52.0% 34.7% 6.1% 5.1% 1997-98
2.2% 35.9% 41.3% 17.4% 3.3% 1998-99
1.1% 37.5% 36.4% 19.3% 5.7% 1999-00
1.2% 29.4% 40.0% 21.2% 8.2% 2000-01
0.0% 34.0% 33.0% 21.0% 12.0% 2001-02
0.0% 17.3% 26.9% 33.7% 22.1% 2002-03
0.0% 10.7% 27.4% 32.1% 29.8% 2003-04
1.0% 19.8% 21.9% 27.1% 30.2% 2004-05
0.0% 18.3% 29.0% 35.5% 17.2% 2005-06
1.3% 19.2% 15.4% 43.6% 20.5% 2006-07
0.0% 28.8% 20.5% 30.1% 20.5% 2007-08
0.0% 30.0% 23.3% 25.6% 21.1% 2008-09
0.0% 27.4% 27.4% 19.2% 26.0% 2009-10
0.0% 13.6% 29.6% 34.6% 22.2% 2010-11
0.0% 23.4% 13.0% 29.9% 33.8% 2011-12
0.0% 14.0% 14.0% 37.2% 33.7%

31 | P a g e 2 / 2 7 / 1 5
Writing
Did Not Meet Standard Met Standard
School Year
No Score
Level 1
Level 2
Level 3
Level 4
2003-04
0.0% 29.2% 36.5% 30.2% 4.2% 2004-05
0.0% 26.9% 29.0% 30.1% 14.0% 2005-06
0.0% 15.2% 27.8% 41.8% 15.2% 2006-07
0.0% 15.1% 21.9% 45.2% 17.8% 2007-08
2.2% 23.3% 21.1% 41.1% 12.2% 2008-09
1.4% 9.6% 21.9% 38.4% 28.8% 2009-10
0.0% 2.5% 13.9% 46.8% 36.7% 2010-11
0.0% 10.7% 21.3% 36.0% 29.3% 2011-12
1.2% 5.8% 18.6% 38.4% 36.0%

32 | P a g e 2 / 2 7 / 1 5
Select a category of students: 4th
Low Income
Chart
Grade 4 Students Scoring in Each Level
Reading
Did Not Meet Standard Met Standard
School Year
No Score
Level 1
Level 2
Level 3
Level 4
2001-02
0.0% 0.0%
54.5%
45.5% 0.0%
2002-03
0.0% 0.0%
57.1%
42.9% 0.0%
2003-04
0.0% 4.2%
29.2%
50.0%
16.7%
2004-05
0.0% 9.1%
15.9%
54.5%
20.5%
2005-06
1.8% 7.1%
10.7%
57.1%
23.2%
2006-07
0.0% 4.5%
27.3%
56.8%
11.4%
2007-08
0.0% 7.5%
24.5%
43.4%
24.5%
2008-09
0.0% 8.1%
24.3%
51.4%
16.2%
2009-10
0.0% 4.1%
24.5%
46.9%
22.4%
2010-11
1.8% 9.1%
20.0%
29.1%
30.9%
2011-12
0.0% 3.5% 8.8% 49.1
% 36.8
%

33 | P a g e 2 / 2 7 / 1 5
Math
Did Not Meet Standard Met Standard
School Year
No Score
Level 1
Level 2
Level 3
Level 4
2001-02
0.0% 27.3%
54.5%
18.2% 0.0%
2002-03
0.0% 35.7%
42.9%
14.3% 7.1%
2003-04
0.0% 23.4%
31.9%
25.5%
19.1%
2004-05
0.0% 15.9%
29.5%
38.6%
15.9%
2005-06
1.8% 23.6%
16.4%
41.8%
16.4%
2006-07
0.0% 31.8%
25.0%
29.5%
13.6%
2007-08
0.0% 32.1%
28.3%
24.5%
15.1%
2008-09
0.0% 35.1%
29.7%
16.2%
18.9%
2009-10
0.0% 18.4%
28.6%
38.8%
14.3%
2010-11
0.0% 27.3%
14.5%
32.7%
25.5%
2011-12
0.0% 16.1%
17.9%
39.3%
25.0%

34 | P a g e 2 / 2 7 / 1 5
Writing
Did Not Meet Standard Met Standard
School Year
No Score
Level 1
Level 2
Level 3
Level 4
2003-04
0.0% 34.0%
42.6%
21.3% 2.1%
2004-05
0.0% 29.5%
22.7%
38.6% 9.1%
2005-06
0.0% 21.4%
28.6%
35.7%
14.3%
2006-07
0.0% 15.9%
22.7%
52.3% 9.1%
2007-08
1.9% 28.3%
18.9%
32.1%
18.9%
2008-09
0.0% 18.9%
24.3%
27.0%
29.7%
2009-10
0.0% 0.0% 18.8%
50.0%
31.3%
2010-11
0.0% 15.1%
22.6%
32.1%
26.4%
2011-12
0.0% 7.1% 21.4%
35.7%
35.7%
35 | P a g e 2 / 2 7 / 1 5
Select a category of students: 4th
Limited English
Chart
Grade 4 Students Scoring in Each Level
Reading
Did Not Meet Standard Met Standard
School Year
No Score
Level 1
Level 2
Level 3
Level 4
2004-05
0.0% 0.0% 60.0% 40.0% 0.0% 2006-07
0.0% 0.0% 80.0% 20.0% 0.0% 2007-08
0.0% 33.3% 16.7% 33.3% 16.7% 2008-09
0.0% 17.6% 35.3% 47.1% 0.0% 2010-11
0.0% 22.2% 33.3% 27.8% 5.6%
Math
Did Not Meet Standard
Met Standard
School Year
No Score
Level 1
Level 2
Level 3
Level 4
2004-05
0.0% 30.0% 50.0% 20.0% 0.0% 2006-07
0.0% 60.0% 40.0% 0.0% 0.0% 2007-08
0.0% 83.3% 16.7% 0.0% 0.0% 2008-09
0.0% 47.1% 23.5% 23.5% 5.9% 2010-11
0.0% 44.4% 33.3% 16.7% 5.6%

36 | P a g e 2 / 2 7 / 1 5
Writing
Did Not Meet Standard Met Standard
School Year
No Score
Level 1
Level 2
Level 3
Level 4
2004-05
0.0% 60.0% 30.0% 10.0% 0.0% 2005-06
0.0% 60.0% 30.0% 10.0% 0.0% 2006-07
0.0% 30.0% 40.0% 20.0% 10.0% 2007-08
0.0% 33.3% 25.0% 41.7% 0.0% 2008-09
0.0% 23.5% 17.6% 35.3% 23.5% 2010-11
0.0% 16.7% 38.9% 33.3% 5.6%

37 | P a g e 2 / 2 7 / 1 5
Select a category of students: 5th
All
Chart
Grade 5 Students Scoring in Each Level
Reading
Did Not Meet Standard Met Standard
School Year
No Score
Level 1
Level 2
Level 3
Level 4
2005-06
1.0% 2.0% 24.5%
43.9%
28.6%
2006-07
0.0% 3.7% 32.1%
32.1%
32.1%
2007-08
0.0% 12.1%
25.3%
33.0%
29.7%
2008-09
0.0% 3.3% 30.0%
36.7%
30.0%
2009-10
0.0% 5.9% 25.0%
25.0%
41.2%
2010-11
0.0% 1.2% 15.9%
47.6%
35.4%
2011-12
0.0% 2.7% 17.3%
26.7%
46.7%
38 | P a g e 2 / 2 7 / 1 5
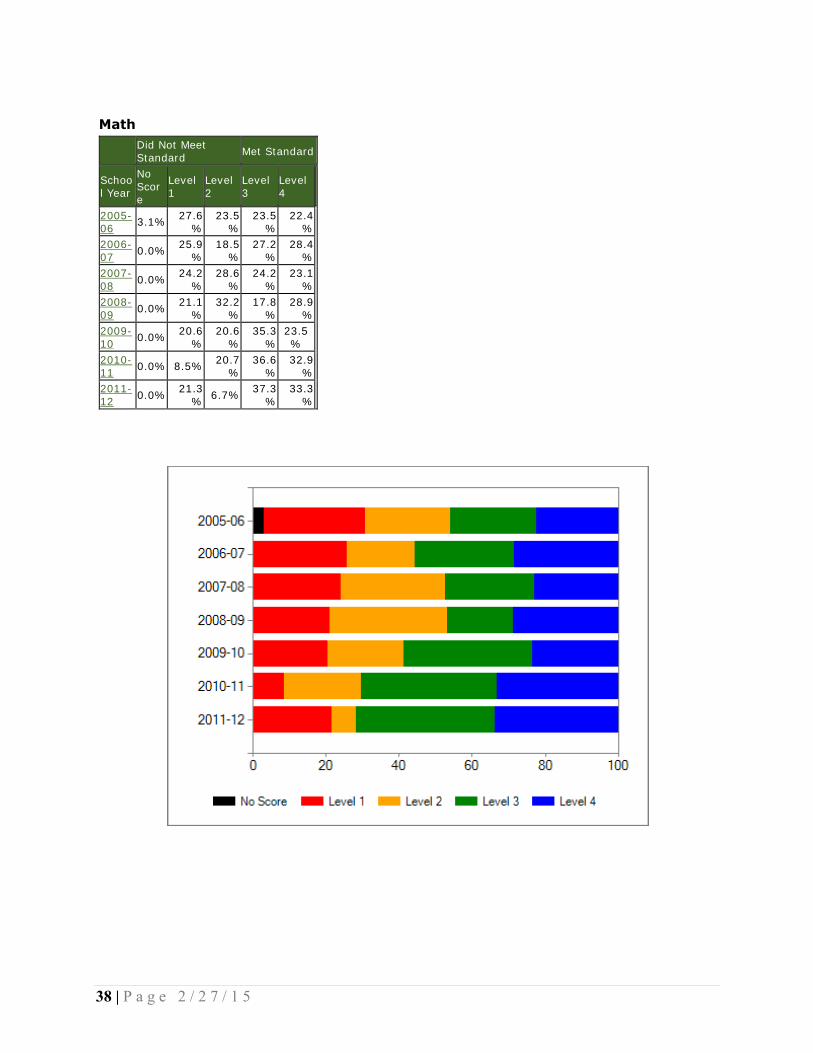
Math
Did Not Meet Standard Met Standard
School Year
No Score
Level 1
Level 2
Level 3
Level 4
2005-06
3.1% 27.6%
23.5%
23.5%
22.4%
2006-07
0.0% 25.9%
18.5%
27.2%
28.4%
2007-08
0.0% 24.2%
28.6%
24.2%
23.1%
2008-09
0.0% 21.1%
32.2%
17.8%
28.9%
2009-10
0.0% 20.6%
20.6%
35.3%
23.5%
2010-11
0.0% 8.5% 20.7%
36.6%
32.9%
2011-12
0.0% 21.3% 6.7% 37.3
% 33.3
%

39 | P a g e 2 / 2 7 / 1 5
Science
Did Not Meet Standard Met Standard
School Year
No Score
Level 1
Level 2
Level 3
Level 4
2003-04
0.0% 29.8%
34.0%
33.0% 3.2%
2004-05
0.0% 24.2%
34.3%
32.3% 9.1%
2005-06
2.0% 24.5%
43.9%
29.6% 0.0%
2006-07
0.0% 25.9%
49.4%
24.7% 0.0%
2007-08
0.0% 24.2%
42.9%
29.7% 3.3%
2008-09
0.0% 17.8%
35.6%
42.2% 4.4%
2009-10
0.0% 19.1%
36.8%
33.8% 8.8%
2010-11
0.0% 10.0%
27.5%
31.3%
30.0%
2011-12
0.0% 20.0%
14.7%
32.0%
32.0%

40 | P a g e 2 / 2 7 / 1 5
Select a category of students: 5th
Limited English
Chart
Grade 5 Students Scoring in Each Level
Reading
Did Not Meet Standard Met Standard
School Year No Score Level 1 Level 2 Level 3 Level 4 2006-07 0.0% 8.3% 66.7% 25.0% 0.0% 2007-08 0.0% 8.3% 83.3% 8.3% 0.0% 2008-09 0.0% 16.7% 50.0% 25.0% 8.3% 2009-10 0.0% 10.0% 60.0% 0.0% 10.0% 2011-12 0.0% 6.7% 40.0% 33.3% 6.7%

41 | P a g e 2 / 2 7 / 1 5
Math
Did Not Meet Standard Met Standard
School Year No Score Level 1 Level 2 Level 3 Level 4 2006-07 0.0% 66.7% 33.3% 0.0% 0.0% 2007-08 0.0% 75.0% 8.3% 16.7% 0.0% 2008-09 0.0% 58.3% 25.0% 16.7% 0.0% 2009-10 0.0% 40.0% 30.0% 20.0% 10.0% 2011-12 0.0% 66.7% 13.3% 13.3% 6.7%

42 | P a g e 2 / 2 7 / 1 5
Science
Did Not Meet Standard
Met Standard
School Year
No Score
Level 1
Level 2
Level 3
Level 4
2006-07
0.0% 66.7% 33.3% 0.0% 0.0% 2007-08
0.0% 58.3% 41.7% 0.0% 0.0% 2008-09
0.0% 50.0% 25.0% 25.0% 0.0% 2009-10
0.0% 40.0% 50.0% 10.0% 0.0% 2011-12
0.0% 73.3% 13.3% 6.7% 0.0%

43 | P a g e 2 / 2 7 / 1 5
Select a category of students: 5th
Low Income
Chart
Grade 5 Students Scoring in Each Level
Reading
Did Not Meet Standard Met Standard
School Year
No Score
Level 1
Level 2
Level 3
Level 4
2005-06
0.0% 2.2%
28.9%
53.3%
15.6%
2006-07
0.0% 5.6%
33.3%
33.3%
27.8%
2007-08
0.0% 9.6%
36.5%
32.7%
21.2%
2008-09
0.0% 3.6%
34.5%
40.0%
21.8%
2009-10
0.0% 7.7%
30.8%
17.9%
38.5%
2010-11
0.0% 2.0%
23.5%
51.0%
23.5%
2011-12
0.0% 3.8%
20.8%
26.4%
41.5%

44 | P a g e 2 / 2 7 / 1 5
Math
Did Not Meet Standard Met Standard
School Year
No Score
Level 1
Level 2
Level 3
Level 4
2005-06
4.4% 28.9%
28.9%
26.7%
11.1%
2006-07
0.0% 33.3%
22.2%
20.4%
24.1%
2007-08
0.0% 28.8%
28.8%
23.1%
19.2%
2008-09
0.0% 27.3%
40.0%
14.5%
18.2%
2009-10
0.0% 23.1%
25.6%
30.8%
20.5%
2010-11
0.0% 13.7%
25.5%
39.2%
21.6%
2011-12
0.0% 22.6% 7.5% 43.4
% 24.5
%

45 | P a g e 2 / 2 7 / 1 5
Science
Did Not Meet Standard Met Standard
School Year
No Score
Level 1
Level 2
Level 3
Level 4
2003-04
0.0% 42.1%
31.6%
26.3% 0.0%
2004-05
0.0% 25.5%
31.9%
34.0% 8.5%
2005-06
2.2% 31.1%
51.1%
15.6% 0.0%
2006-07
0.0% 31.5%
42.6%
25.9% 0.0%
2007-08
0.0% 30.8%
48.1%
19.2% 1.9%
2008-09
0.0% 23.6%
43.6%
30.9% 1.8%
2009-10
0.0% 25.6%
35.9%
30.8% 5.1%
2010-11
0.0% 12.2%
34.7%
26.5%
26.5%
2011-12
0.0% 20.8%
17.0%
35.8%
24.5%
46 | P a g e 2 / 2 7 / 1 5
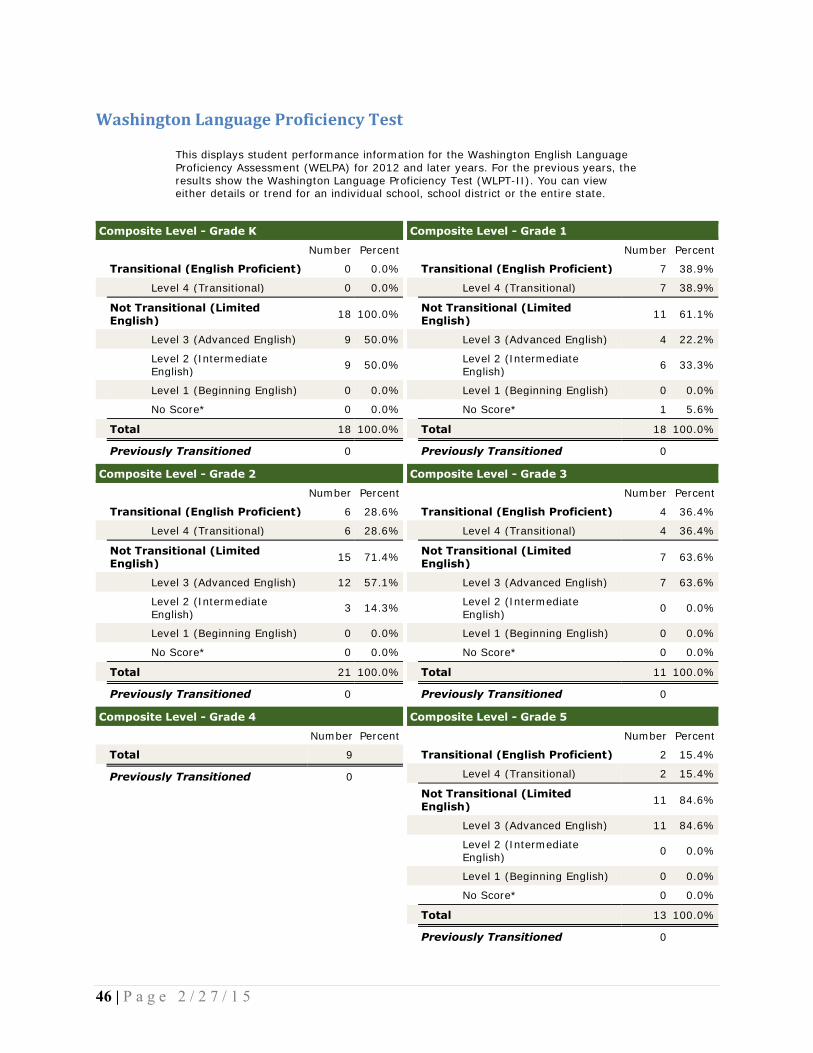
Washington Language Proficiency Test
This displays student performance information for the Washington English Language Proficiency Assessment (WELPA) for 2012 and later years. For the previous years, the results show the Washington Language Proficiency Test (WLPT-II). You can view either details or trend for an individual school, school district or the entire state.
Composite Level - Grade K
Number Percent
Transitional (English Proficient) 0 0.0%
Level 4 (Transitional) 0 0.0%
Not Transitional (Limited English)
18 100.0%
Level 3 (Advanced English) 9 50.0%
Level 2 (Intermediate English) 9 50.0%
Level 1 (Beginning English) 0 0.0%
No Score* 0 0.0%
Total 18 100.0%
Previously Transitioned 0
Composite Level - Grade 1
Number Percent
Transitional (English Proficient) 7 38.9%
Level 4 (Transitional) 7 38.9%
Not Transitional (Limited English)
11 61.1%
Level 3 (Advanced English) 4 22.2%
Level 2 (Intermediate English) 6 33.3%
Level 1 (Beginning English) 0 0.0%
No Score* 1 5.6%
Total 18 100.0%
Previously Transitioned 0
Composite Level - Grade 2
Number Percent
Transitional (English Proficient) 6 28.6%
Level 4 (Transitional) 6 28.6%
Not Transitional (Limited English)
15 71.4%
Level 3 (Advanced English) 12 57.1%
Level 2 (Intermediate English) 3 14.3%
Level 1 (Beginning English) 0 0.0%
No Score* 0 0.0%
Total 21 100.0%
Previously Transitioned 0
Composite Level - Grade 3
Number Percent
Transitional (English Proficient) 4 36.4%
Level 4 (Transitional) 4 36.4%
Not Transitional (Limited English)
7 63.6%
Level 3 (Advanced English) 7 63.6%
Level 2 (Intermediate English) 0 0.0%
Level 1 (Beginning English) 0 0.0%
No Score* 0 0.0%
Total 11 100.0%
Previously Transitioned 0
Composite Level - Grade 4
Number Percent
Total 9
Previously Transitioned 0
Composite Level - Grade 5
Number Percent
Transitional (English Proficient) 2 15.4%
Level 4 (Transitional) 2 15.4%
Not Transitional (Limited English)
11 84.6%
Level 3 (Advanced English) 11 84.6%
Level 2 (Intermediate English) 0 0.0%
Level 1 (Beginning English) 0 0.0%
No Score* 0 0.0%
Total 13 100.0%
Previously Transitioned 0

47 | P a g e 2 / 2 7 / 1 5
Annual Measurable Objective Summary This page presents a summary of your Annual Measurable Objective (AMO) results. To see the data used to compute each proficiency cell, switch “Summary” to “Proficiency Detail” and click “go.”
On/Above Group performs on or above target. N<Required Group has fewer than required.
Below Group performs below target. No Students Group has no students.
Reading Math Reading Math
Student Group
Proficiency Target Met Target Proficiency Target Met Target Met 95% Participation Target
Met 95% Participation Target
All 75.2 77.1 Below 73.6 72.3 On/Above On/Above On/Above American Indian N<Required N<Required N<Required N<Required
Asian 78.3 90.8 Below 91.3 90.8 On/Above On/Above On/Above Pacific Islander N<Required N<Required N<Required N<Required
Black N<Required N<Required N<Required N<Required Hispanic 70.8 70.7 On/Above 66.7 59.7 On/Above On/Above On/Above White 79.4 78.7 On/Above 76.2 74.7 On/Above On/Above On/Above Two or More Races N<Required N<Required N<Required N<Required
Limited English 64.1 46.3 On/Above 40.0 33.6 On/Above On/Above On/Above
Special Education N<Required N<Required On/Above On/Above

48 | P a g e 2 / 2 7 / 1 5
2008-09 2009-10 2010-11 2011-12
Am. Indian 1.2 1.5 0.8 .4
Asian 19.0 17.9 11.4 10.6
Pacific Islander 0.2 0.2 14.3 2.8
Black 6.7 6.1 6.9 5.4
Hispanic 22.3 23.3 22.2 24.6
White 49.4 49.4 49.7 49.0
Two or More Unavailable Unavailable 6.1 7.1
Total Enrollment
Oct 506 Oct 476 Oct 491 Oct 463
May 507 May 492 May 502 May 463
Free/Reduced 56.0 58.1 68.1 67.6
SpEd 15.0 15.9 14.3 13.6
ELL 25.2 22.0 19.3 19.4
Select year: 2011-12 Summary Description
Alpac Elementary Demographic Data

49 | P a g e 2 / 2 7 / 1 5
SMART Goal 1
Subject Area: ELA
School Name: Alpac Elementary
Target Population- based on
demographic, discipline and attendance
data analysis:
All students K-5
Our Reality-based on assessment
data analysis:
Reading State Assessment trend data in grades 3rd-5th has increased an overall average of 6.5% from 2009 to 2012. From 2009 to 2012 third grade has decreased 10.1%, fourth grade has increased 16.3%, and fifth grade has increased 13.3%. The gap on the state assessment in grades 3rd-5th between low income and non-low income is 10% from 2009-2012. The average percent of ELL students meeting standard on the state reading assessment has increased 7% from 46.8% in 2009 to 53.8% in 2012. The average percent of students at benchmark in grades K-2 on the DIBELS end of the year summary report is 67% in 2012.
Our SMART Goal-based on target
population and your reality:
The percentage of Alpac students at grades 3-5 meeting standard in ELA will increase from 76.9% in 2012 to 85.4% by 2016 as measured by the Washington State Assessment.
84.6% of third grade students will meet standard in reading as measured by the state assessment in 2016. 90% of fourth grade students will meet standard in reading as measured by the state assessment in 2016. 86.1% of fifth grade students will meet standard in reading as measured by the state assessment in 2016.
Action Plan
Action Steps Responsibility Timeline Resources Evidence of SMART Goal
Attainment
Sequential- what comes first?
( 3-5 Action Steps)
Who will monitor?
Who will
implement?
Measures of progress
towards evidence
Examples include:
PLC, Building 21, CEE data,
Power Standards
Evidence of Implementation
Evidence of student impact
Systematically and explicitly teach, reinforce, and assess Tier 2 content vocabulary at all grade levels K-5.
All instructional staff
August 2013: Anita Archer in-
service on teaching vocabulary strategies
Review how to select Tier 2 content vocabulary
Anita Archer in-service on teaching vocabulary strategies
Tier 2 vocabulary presentation by a GLAD instructor to
Implementation:
Observe staff using Anita Archer vocabulary strategies
Use GLAD strategies to teach Tier 2 vocabulary

50 | P a g e 2 / 2 7 / 1 5
during staff meeting
October 2013: Analyze fall MAP,
STAR, DIBELS, and MSP data at reading data carousel.
November 2013: Report end of
trimester scores to monitor progress
January 2014: Begin developing
grade level Tier 2 content vocabulary lists for reading and science for Trimester 2
- using currently taught literary and narrative texts
- Harcourt stories
- Other reading materials
February 2014: Analyze winter
STAR, DIBELS, and MAP Data at reading data carousel
Review tier 2 vocabulary strategies for teaching content vocabulary
review how to select Tier 2 vocabulary words
Develop grade level common formative assessments for selected content vocabulary
Develop common grade level
Tier 2 content vocabulary lists for reading, science, math, and social studies
- Using grade level narrative and informational texts, grade level content specific textbooks, and any other materials used to teach reading, math, science, and social studies.
Impact:
Students will increase
comprehension and analysis of complex, narrative, and informational texts as measured by
- Formative/Summative assessments K-5
- DIBELS K-5 - STAR 1-5 - MAP 2-5 - MSP 3-5
Students will show
understanding of Tier 2 content vocabulary in speaking and writing

51 | P a g e 2 / 2 7 / 1 5
- Linguistic, non-linguistic strategies
- GLAD strategies
- Anita Archer vocabulary strategies
March 2014: Report scores for
trimester 2 to monitor progress
Begin developing grade level Tier 2 content vocabulary lists for reading and science for Trimester 3
- using currently taught literary and narrative texts
- Harcourt stories
- Other reading materials
June 2014: Report scores for
Trimester 3 to monitor progress
Discuss Tier 2 content vocabulary strategies used throughout the year and make necessary

52 | P a g e 2 / 2 7 / 1 5
adjustments for 2014-2015 school year
October 2014: Analyze fall MAP,
STAR, DIBELS and MSP data at reading data carousel
Begin developing grade level Tier 2 content vocabulary lists for reading and science for Trimester 1
- using currently taught literary and narrative texts
- Harcourt stories
- Other reading materials
Review Tier 2 content vocabulary teaching strategies at the reading data carousel
Create grade level common formative assessments to assess student understanding of tier 2 content vocabulary in reading and science
November 2014:
53 | P a g e 2 / 2 7 / 1 5
Report end of trimester scores to monitor progress
January 2015: Repeat previous
year’s plan for math and social studies. See timeline below for further explanation
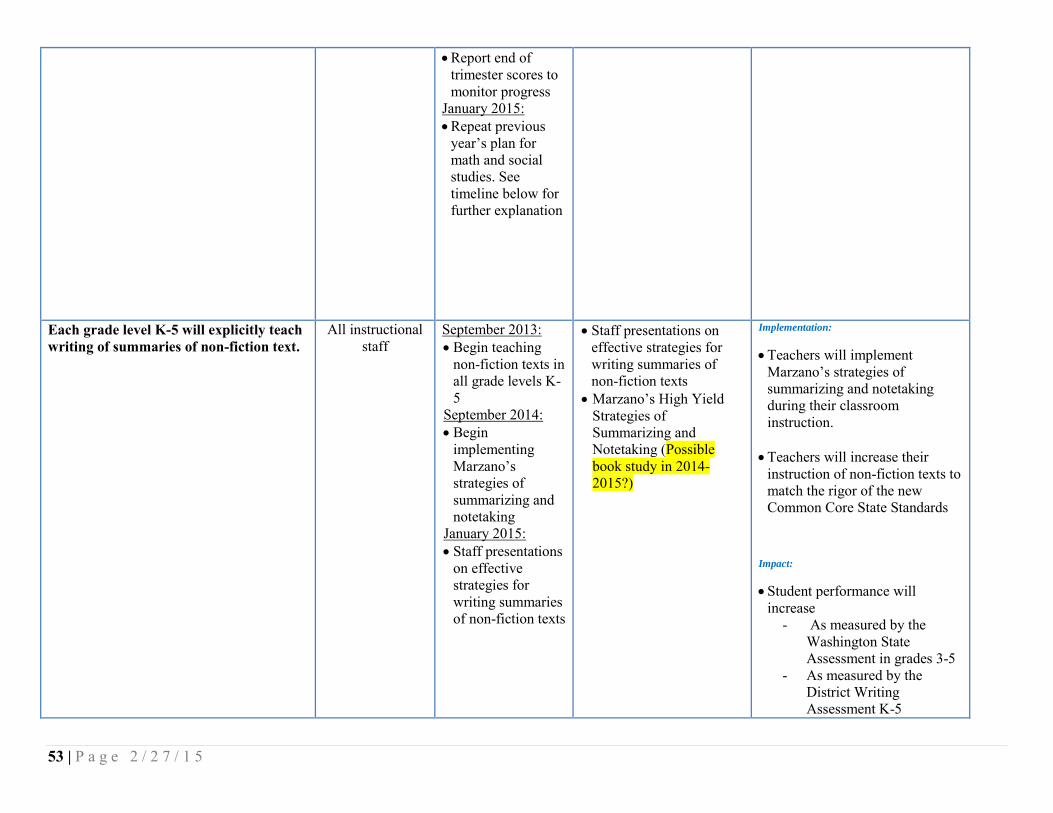
Each grade level K-5 will explicitly teach writing of summaries of non-fiction text.
All instructional staff
September 2013: Begin teaching
non-fiction texts in all grade levels K-5
September 2014: Begin
implementing Marzano’s strategies of summarizing and notetaking
January 2015: Staff presentations
on effective strategies for writing summaries of non-fiction texts
Staff presentations on effective strategies for writing summaries of non-fiction texts
Marzano’s High Yield Strategies of Summarizing and Notetaking (Possible book study in 2014-2015?)
Implementation:
Teachers will implement Marzano’s strategies of summarizing and notetaking during their classroom instruction.
Teachers will increase their instruction of non-fiction texts to match the rigor of the new Common Core State Standards
Impact:
Student performance will increase
- As measured by the Washington State Assessment in grades 3-5
- As measured by the District Writing Assessment K-5
54 | P a g e 2 / 2 7 / 1 5
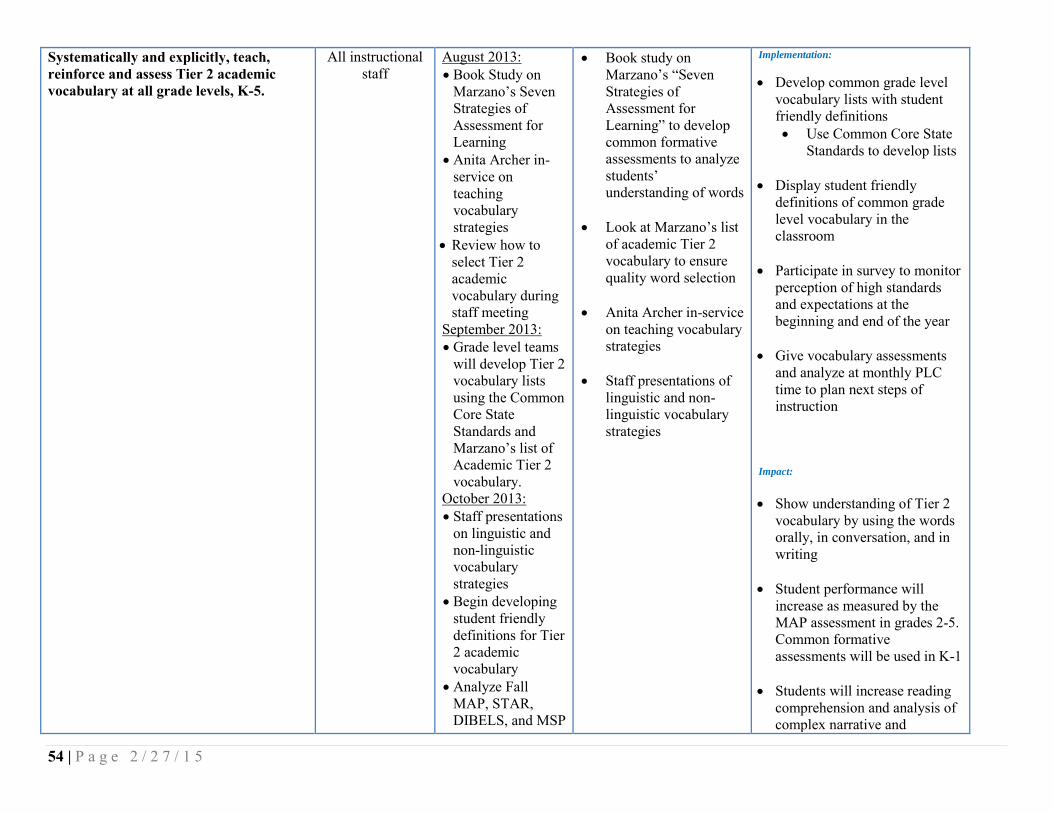
Systematically and explicitly, teach, reinforce and assess Tier 2 academic vocabulary at all grade levels, K-5.
All instructional staff
August 2013: Book Study on
Marzano’s Seven Strategies of Assessment for Learning
Anita Archer in-service on teaching vocabulary strategies
Review how to select Tier 2 academic vocabulary during staff meeting
September 2013: Grade level teams
will develop Tier 2 vocabulary lists using the Common Core State Standards and Marzano’s list of Academic Tier 2 vocabulary.
October 2013: Staff presentations
on linguistic and non-linguistic vocabulary strategies
Begin developing student friendly definitions for Tier 2 academic vocabulary
Analyze Fall MAP, STAR, DIBELS, and MSP
Book study on Marzano’s “Seven Strategies of Assessment for Learning” to develop common formative assessments to analyze students’ understanding of words
Look at Marzano’s list
of academic Tier 2 vocabulary to ensure quality word selection
Anita Archer in-service
on teaching vocabulary strategies
Staff presentations of
linguistic and non-linguistic vocabulary strategies
Implementation:
Develop common grade level vocabulary lists with student friendly definitions Use Common Core State
Standards to develop lists Display student friendly
definitions of common grade level vocabulary in the classroom
Participate in survey to monitor perception of high standards and expectations at the beginning and end of the year
Give vocabulary assessments
and analyze at monthly PLC time to plan next steps of instruction
Impact:
Show understanding of Tier 2
vocabulary by using the words orally, in conversation, and in writing
Student performance will increase as measured by the MAP assessment in grades 2-5. Common formative assessments will be used in K-1
Students will increase reading
comprehension and analysis of complex narrative and
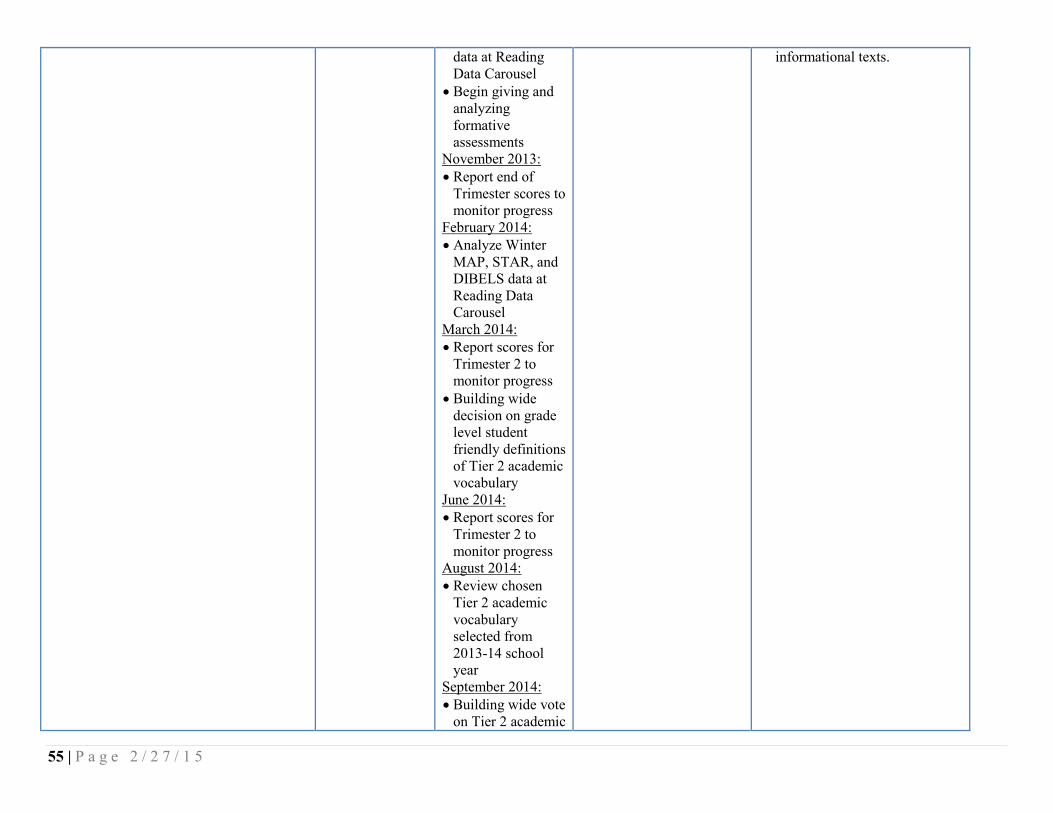
55 | P a g e 2 / 2 7 / 1 5
data at Reading Data Carousel
Begin giving and analyzing formative assessments
November 2013: Report end of
Trimester scores to monitor progress
February 2014: Analyze Winter
MAP, STAR, and DIBELS data at Reading Data Carousel
March 2014: Report scores for
Trimester 2 to monitor progress
Building wide decision on grade level student friendly definitions of Tier 2 academic vocabulary
June 2014: Report scores for
Trimester 2 to monitor progress
August 2014: Review chosen
Tier 2 academic vocabulary selected from 2013-14 school year
September 2014: Building wide vote
on Tier 2 academic
informational texts.

56 | P a g e 2 / 2 7 / 1 5
vocabulary definitions to display
October 2014: Analyze fall MAP,
STAR, DIBELS, and MSP data at reading data carousel
Display grade level Tier 2 academic vocabulary definitions in all classrooms
Alignment to District Improvement Plan Objectives:

57 | P a g e 2 / 2 7 / 1 5
SMART Goal 2
Subject Area: Math
School Name: Alpac Elementary
Target Population- based on
demographic, discipline and attendance
data analysis:
All Students K-5
Our Reality-based on assessment
data analysis:
Math State Assessment trend data in grades 3rd-5th has increased an overall average of 18.3% from 2009 to 2012.
From 2009 to 2012 third grade has increased 14.8%, fourth grade has increased 26.9%, and fifth grade has
increased 13.2%. The average gap on the state assessment in grades 3rd-5th between low income and non-low
income is 13.1% from 2009-2012. The average percent of students at benchmark in grades 1-2 on the Fact
Fluency end of the year summary report for addition is 91.5% and subtraction is 67% in 2012.
Our SMART Goal-based on target
population and your reality:
The percentage of Alpac students at grades 3-5 meeting standard in math will increase from 73.57% in 2012 to
85.57% by 2016 as measured by the Washington State Assessment.
86.2% of third grade students will meet standard in math as measured by the state assessment in 2016. 85.4% of fourth grade students will meet standard in math as measured by the state assessment in 2016. 85.1% of fifth grade students will meet standard in math as measured by the state assessment in 2016.
Action Plan
Action Steps Responsibility Timeline Resources Evidence of SMART Goal
Attainment
Sequential- what comes first?
( 3-5 Action Steps)
Who will monitor?
Who will
implement?
Measures of progress
towards evidence
Examples include:
PLC, Building 21
Evidence of Implementation
Evidence of student impact
Each grade level, K-5, will explicitly and consistently teach number sense in core instruction.
All Math Instructional
Staff
August 2013: Brendan Jeffries
in-service on VOS/VES problem solving strategy. - Decide as a
building to
Grade level and cross – grade level collaboration to review number sense during staff meetings - Share and discuss
number sense strategies used K-
Implementation:
Assess student performance on fact fluency monthly to assist in student goal setting. - Xtramath.org - Timed tests
Grade level teams will
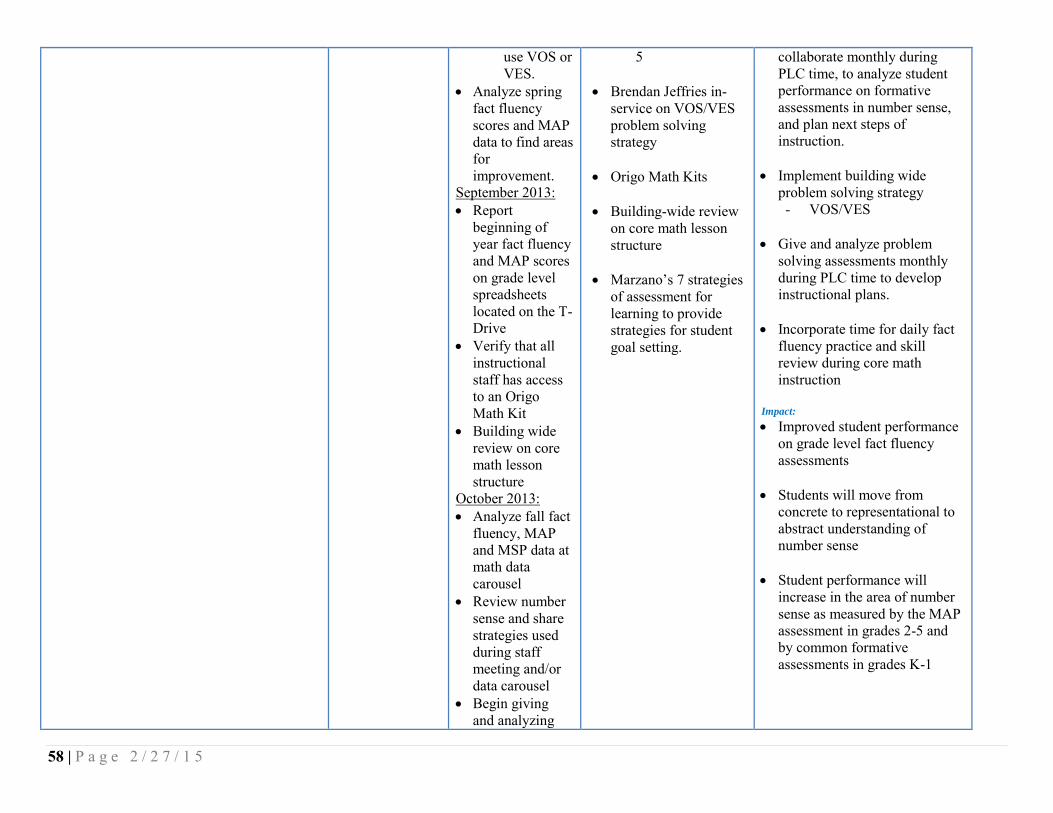
58 | P a g e 2 / 2 7 / 1 5
use VOS or VES.
Analyze spring fact fluency scores and MAP data to find areas for improvement.
September 2013: Report
beginning of year fact fluency and MAP scores on grade level spreadsheets located on the T-Drive
Verify that all instructional staff has access to an Origo Math Kit
Building wide review on core math lesson structure
October 2013: Analyze fall fact
fluency, MAP and MSP data at math data carousel
Review number sense and share strategies used during staff meeting and/or data carousel
Begin giving and analyzing
5
Brendan Jeffries in-service on VOS/VES problem solving strategy
Origo Math Kits Building-wide review
on core math lesson structure
Marzano’s 7 strategies
of assessment for learning to provide strategies for student goal setting.
collaborate monthly during PLC time, to analyze student performance on formative assessments in number sense, and plan next steps of instruction.
Implement building wide problem solving strategy - VOS/VES
Give and analyze problem solving assessments monthly during PLC time to develop instructional plans.
Incorporate time for daily fact fluency practice and skill review during core math instruction
Impact:
Improved student performance on grade level fact fluency assessments
Students will move from
concrete to representational to abstract understanding of number sense
Student performance will
increase in the area of number sense as measured by the MAP assessment in grades 2-5 and by common formative assessments in grades K-1

59 | P a g e 2 / 2 7 / 1 5
monthly fact fluency assessments. - Use the
monthly data for student goal setting.
November 2013: Report end of
trimester fact fluency scores to monitor progress
Share student progress in problem solving using VOS/VES strategy at staff meeting.
January 2014: Review number
sense instructional strategies at a staff meeting.
March 2014: Report fact
fluency scores for Trimester 2 to monitor progress
Analyze winter fact fluency and MAP data at Math Data Carousel
Share student progress in problem solving

60 | P a g e 2 / 2 7 / 1 5
using VOS/VES strategy during staff meeting and/or Math Data Carousel
June 2014: Report fact
fluency scores for trimester 3 to monitor progress
Discuss core math lesson structure and student goal setting performance throughout the year and make necessary adjustments for 2014-2015 school year
Strengthen Tier 2/3 math intervention within core math instruction.
All Math Instructional
Staff
September 2014 Analyze spring
math data (MAP, Fact Fluency, MSP) to build interventions to meet student’s needs, adjust instruction, and build walk-to-math groups.
January 2015 Building wide
review on Tier 2 and Tier 3 intervention within the classroom
Building wide review (from Kessler) on what a Tier 2 and Tier 3 intervention would look like in the classroom - Teach/assess/re-
teach/re-assess
Staff presentations on Tier 2 and/or Tier 3 intervention models within core math instruction (Wilcox, Miller)
Implementation:
Develop common formative/summative assessments during weekly PLC/team times to determine student needs for tier 2 and/or tier 3 intervention within core math instruction - Assessments should be
based on grade level math scope and sequence.
- Formative/summative assessments will be given and used to analyze student progress to determine need for Tier 2 and/or Tier 3 intervention to provide support for a

61 | P a g e 2 / 2 7 / 1 5
(Kessler) February 2015 Staff
presentations on Tier 2/3 intervention models within core math instruction (Wilcox, Miller)
June 2015 Check in with
staff on Tier 2 Tier 3 interventions within classroom instruction. Determine areas of need or to adjust for the 2014-2015 school year.
specific skill(s).
Within core math lesson structure, teachers will teach a new skill, assess that skill, analyze assessment results, and use the results to determine students who need tier 2 instructions on the skill taught. Teachers will then re-teach the skill to those specific students in need (in a small group if necessary) and re-assess that skill after second level of instruction. - If needed data analysis,
re-teaching and re-assessing will be repeated for a Tier 3 level of instruction.
Impact:
Improve students’ scores on common grade level assessments. - Formative/Summative
Assessments K-5 - MSP 3-5 - MAP 2-5
The number of students with
intensive and strategic scores, as measured by the state math assessment, will decrease and the number of students at benchmark will increase.

62 | P a g e 2 / 2 7 / 1 5
Alignment to District Improvement Plan Objectives:

63 | P a g e 2 / 2 7 / 1 5
SMART Goal 3
Subject Area: Perception
School Name: Alpac Elementary
Target Population- based on
demographic, discipline and attendance
data analysis:
All students K-5
Our Reality-based on assessment
data analysis:
In 2012 the CEE Survey results showed that 68% of Alpac staff believed that we have high standards and
expectations.
Our SMART Goal-based on target
population and your reality:
The percentage of Alpac staff who believe that we have high standards and expectations will increase from 72% in 2012 to 84% in 2016 as measured by the CEE survey.
2014: 78% of staff will believe we have high standards and expectations. 2016: 84% of staff will believe we have high standards and expectations.
Action Plan
Action Steps Responsibilit
y Timeline Resources
Evidence of SMART Goal Attainment
Sequential- what comes first?
( 3-5 Action Steps)
Who will
monitor?
Who will
implement?
Measures of
progress towards
evidence
Examples include:
PLC, Building 21
Evidence of Implementation
Evidence of student impact
Learning targets are clearly aligned with standards (Washington State and Common Core State Standards) and are communicated and clearly understood by students.
All instructional
staff
September 2013: Staff survey
on perception data
November 2013: Analyze staff
survey results of perception data and report results at a staff meeting
Staff presentations
CEL5D instructional framework version 4.0 - Purpose - Standards - Learning target and
teaching points Online survey to
monitor staff’s perception of high standards and expectations
Staff collaboration on strategies for student
Implementation:
Teachers will collaborate with grade level teams to develop “I can” statements for target boards in reading and math
Explicit communication of standards to students - Common core state
standards or Washington State Standards clearly posted in student friendly language

64 | P a g e 2 / 2 7 / 1 5
on goal setting strategies and Student Led conferences
June 2014: End of year
staff survey on perception data
August 2014: Analyze and
report survey results from 2013-2014 school year
September 2014: CEE survey
given at a staff meeting
Work in grade level teams to develop “I Can” statements for target boards in reading and math
October 2014: All teachers
display common core state standards in kid friendly language for reading and math
November 2014: Staff
presentations on goal setting
goal setting and reflection at staff meetings
Book study on Marzano’s Seven Strategies of Assessment for Learning Emphasis on
student goal setting and reflection
- Verbal conversations between students and staff
Teachers will develop common grade level rubrics and self reflection tools
Teachers will participate in a survey to monitor perception of high standards and expectations at the beginning and end of the year.
Impact: Students will show their ability
to articulate learning targets in their own words - Verbally to staff - Student goal setting - Student-led conferences
(3-5) Students will articulate their
understanding of the learning targets by using rubrics and self reflection tools

65 | P a g e 2 / 2 7 / 1 5
strategies and student led conferences
March 2015: Staff
presentations on goal setting and reflection
June 2015: Discuss
student goal setting and reflection strategies and student articulation of grade level standards
Alignment to District Improvement Plan Objectives:
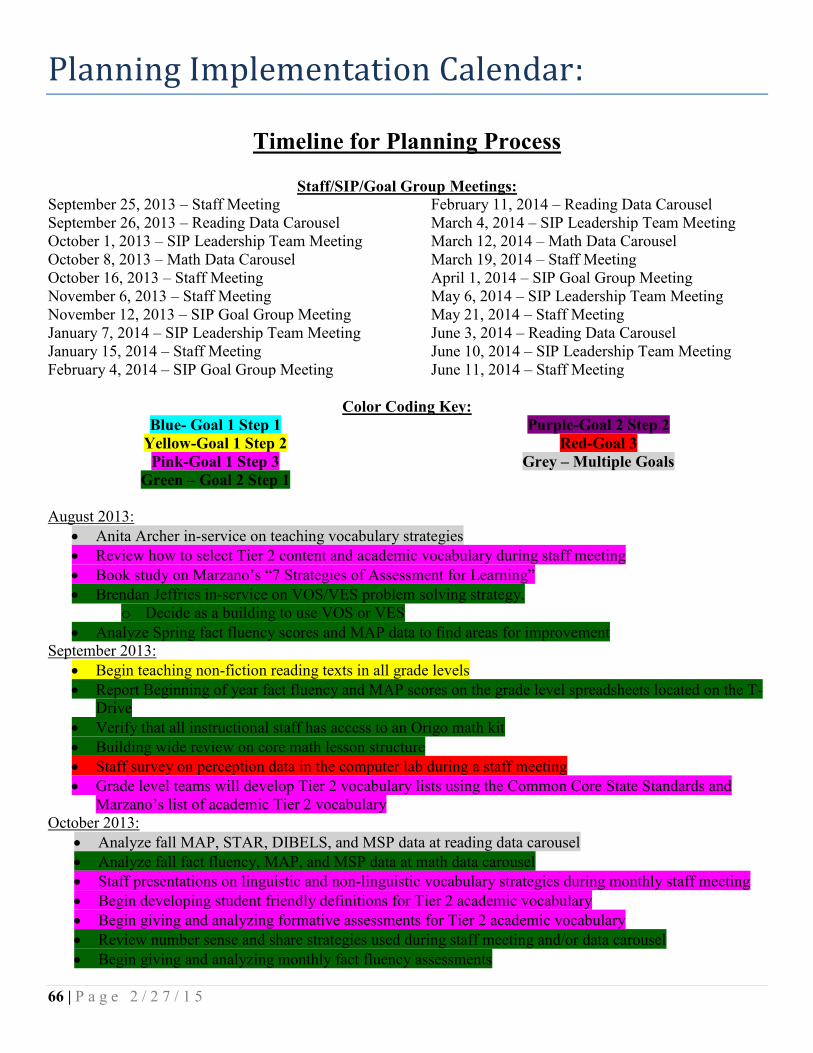
66 | P a g e 2 / 2 7 / 1 5
Planning Implementation Calendar:
Timeline for Planning Process
Staff/SIP/Goal Group Meetings: September 25, 2013 – Staff Meeting September 26, 2013 – Reading Data Carousel October 1, 2013 – SIP Leadership Team Meeting October 8, 2013 – Math Data Carousel October 16, 2013 – Staff Meeting November 6, 2013 – Staff Meeting November 12, 2013 – SIP Goal Group Meeting January 7, 2014 – SIP Leadership Team Meeting January 15, 2014 – Staff Meeting February 4, 2014 – SIP Goal Group Meeting
February 11, 2014 – Reading Data Carousel March 4, 2014 – SIP Leadership Team Meeting March 12, 2014 – Math Data Carousel March 19, 2014 – Staff Meeting April 1, 2014 – SIP Goal Group Meeting May 6, 2014 – SIP Leadership Team Meeting May 21, 2014 – Staff Meeting June 3, 2014 – Reading Data Carousel June 10, 2014 – SIP Leadership Team Meeting June 11, 2014 – Staff Meeting
Color Coding Key:
Blue- Goal 1 Step 1 Yellow-Goal 1 Step 2 Pink-Goal 1 Step 3
Green – Goal 2 Step 1
Purple-Goal 2 Step 2 Red-Goal 3
Grey – Multiple Goals
August 2013:
Anita Archer in-service on teaching vocabulary strategies Review how to select Tier 2 content and academic vocabulary during staff meeting Book study on Marzano’s “7 Strategies of Assessment for Learning” Brendan Jeffries in-service on VOS/VES problem solving strategy.
o Decide as a building to use VOS or VES Analyze Spring fact fluency scores and MAP data to find areas for improvement
September 2013: Begin teaching non-fiction reading texts in all grade levels Report Beginning of year fact fluency and MAP scores on the grade level spreadsheets located on the T-
Drive Verify that all instructional staff has access to an Origo math kit Building wide review on core math lesson structure Staff survey on perception data in the computer lab during a staff meeting Grade level teams will develop Tier 2 vocabulary lists using the Common Core State Standards and
Marzano’s list of academic Tier 2 vocabulary October 2013:
Analyze fall MAP, STAR, DIBELS, and MSP data at reading data carousel Analyze fall fact fluency, MAP, and MSP data at math data carousel Staff presentations on linguistic and non-linguistic vocabulary strategies during monthly staff meeting Begin developing student friendly definitions for Tier 2 academic vocabulary Begin giving and analyzing formative assessments for Tier 2 academic vocabulary Review number sense and share strategies used during staff meeting and/or data carousel Begin giving and analyzing monthly fact fluency assessments

67 | P a g e 2 / 2 7 / 1 5
o use monthly data for student goal setting November 2013:
Report end of trimester scores to monitor progress Report end of trimester fact fluency scores to monitor progress Analyze staff survey results of perception data and report at staff meeting Staff presentations on goal setting strategies and Student Led conferences
January 2014: Begin developing grade level Tier 2 content vocabulary lists for reading and science for trimester 2
during weekly Team Times o Using currently taught literary and narrative texts o Harcourt Stories o Any other reading materials
Review number sense instructional strategies and student progress using VOS/VES strategy at a staff meeting
February 2014: Analyze winter STAR, DIBELS, and MAP at reading data carousel Review Tier 2 vocabulary strategies for teaching content vocabulary at reading data carousel
o Linguistic, Non-Linguistic strategies o GLAD strategies o Anita Archer vocabulary strategies
March 2014: Report scores for Trimester 2 to monitor progress Begin developing grade level Tier 2 content vocabulary lists for reading and science for trimester 3
during weekly Team Times o Using currently taught literary and narrative texts o Harcourt Stories o Any other reading materials
Report fact fluency scores for Trimester 2 to monitor progress Analyze winter MAP and fact fluency data at math data carousel Share student progress in problem solving using VOS/VES strategy during staff meeting and/or data
carousel Building wide decision on grade level student friendly definitions of Tier 2 academic vocabulary
May 2014: Discuss core math lesson structure and student goal setting performance throughout the year and make
necessary adjustments for the 2014-2015 school year June 2014:
Report scores for Trimester 3 to monitor progress Discuss Tier 2 content vocabulary strategies used throughout the year and make necessary adjustments
for the 2014-2015 school year at the Reading Data Carousel Report fact fluency scores for Trimester 3 to monitor progress Analyze spring MAP, STAR, DIBELS data at reading data carousel End of year survey on perception data at monthly staff meeting
August 2014: Analyze and report survey results from 2013-2014 school year Review chosen Tier 2 academic vocabulary selected from 2013-2014 school year
September 2014: Begin implementing Marzano’s strategies of summarizing and notetaking CEE Survey at a staff meeting
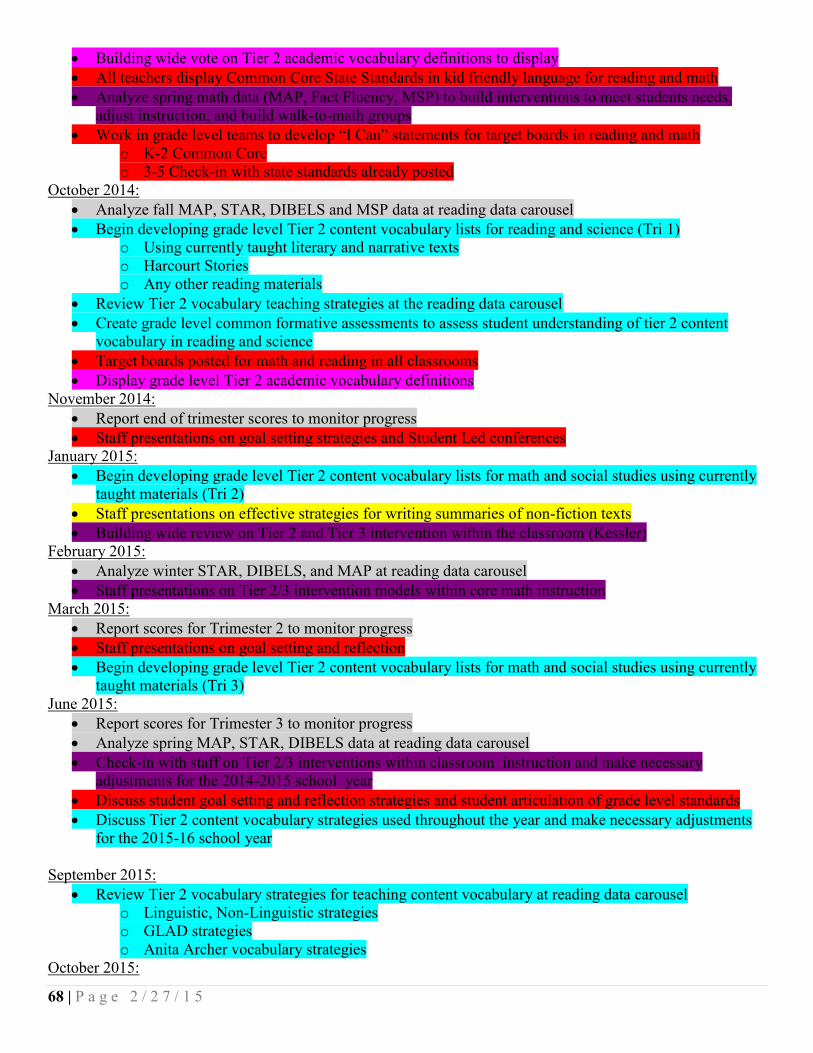
68 | P a g e 2 / 2 7 / 1 5
Building wide vote on Tier 2 academic vocabulary definitions to display All teachers display Common Core State Standards in kid friendly language for reading and math Analyze spring math data (MAP, Fact Fluency, MSP) to build interventions to meet students needs,
adjust instruction, and build walk-to-math groups Work in grade level teams to develop “I Can” statements for target boards in reading and math
o K-2 Common Core o 3-5 Check-in with state standards already posted
October 2014: Analyze fall MAP, STAR, DIBELS and MSP data at reading data carousel Begin developing grade level Tier 2 content vocabulary lists for reading and science (Tri 1)
o Using currently taught literary and narrative texts o Harcourt Stories o Any other reading materials
Review Tier 2 vocabulary teaching strategies at the reading data carousel Create grade level common formative assessments to assess student understanding of tier 2 content
vocabulary in reading and science Target boards posted for math and reading in all classrooms Display grade level Tier 2 academic vocabulary definitions
November 2014: Report end of trimester scores to monitor progress Staff presentations on goal setting strategies and Student Led conferences
January 2015: Begin developing grade level Tier 2 content vocabulary lists for math and social studies using currently
taught materials (Tri 2) Staff presentations on effective strategies for writing summaries of non-fiction texts Building wide review on Tier 2 and Tier 3 intervention within the classroom (Kessler)
February 2015: Analyze winter STAR, DIBELS, and MAP at reading data carousel Staff presentations on Tier 2/3 intervention models within core math instruction
March 2015: Report scores for Trimester 2 to monitor progress Staff presentations on goal setting and reflection Begin developing grade level Tier 2 content vocabulary lists for math and social studies using currently
taught materials (Tri 3) June 2015:
Report scores for Trimester 3 to monitor progress Analyze spring MAP, STAR, DIBELS data at reading data carousel Check-in with staff on Tier 2/3 interventions within classroom instruction and make necessary
adjustments for the 2014-2015 school year Discuss student goal setting and reflection strategies and student articulation of grade level standards Discuss Tier 2 content vocabulary strategies used throughout the year and make necessary adjustments
for the 2015-16 school year
September 2015: Review Tier 2 vocabulary strategies for teaching content vocabulary at reading data carousel
o Linguistic, Non-Linguistic strategies o GLAD strategies o Anita Archer vocabulary strategies
October 2015:

69 | P a g e 2 / 2 7 / 1 5
Begin developing grade level Tier 2 content vocabulary lists for math and social studies using currently taught materials (Tri 1)
Create grade level common formative assessments to assess student understanding of tier 2 content vocabulary in math and social studies
March 2016: Check in with staff on strategies used to Tier 2 content vocabulary in all subjects

70 | P a g e 2 / 2 7 / 1 5
Planning Implementation Calendar
SIP TIMELINE 2012-13 June Aug Sept Oct Nov Dec Jan Feb March April May June
MATH
READING June Aug Sept Oct Nov Dec Jan Feb March April May June
PARENT INVOLVEMENT June Aug Sept Oct Nov Dec Jan Feb March April May June

March 9, 2015 Page 6
PERSONNEL--CERTIFICATED AND CLASSIFIED 1. Certificated and Classified Personnel Report Attached is the personnel report, for certificated and classified
personnel, for the board’s approval. Recommendation: That the board approve the attached
report. 2. Requests for Travel a. Mike Weibel, director of human resources, and Sally Colburn,
Hazelwood Elementary School principal, request permission to travel to Long Beach, California, Thursday to Saturday, March 26-28. The purpose of the trip is for recruiting at Cal State University. Lodging will be at the Best Western hotel, meals will be at local restaurants, and travel will be by airplane. All expenses will be paid with human resources funds. No substitutes will be needed.
b. Mike Weibel; Debbie Leighton, executive director of human resources;
Cindi Blansfield, executive director of high school/post-secondary programs; and Greg Brown, Mt. Baker Middle School principal, request permission to travel to Phoenix, Arizona, Thursday to Friday, April 16-17. The purpose of the trip is for recruiting at Arizona State University and the University of Arizona. Lodging will be at the Holiday Inn, meals will be at local restaurants, and travel will be by airplane. All expenses will be paid with human resources funds. No substitutes will be needed.
c. Michael Newman, deputy superintendent of business and operations,
requests permission to travel to Atlanta, Georgia, Tuesday to Thursday, May 12-14. The purpose of the trip is to attend the Behavioral Studies DISC Level 1 Training Conference. Lodging will be at the Holiday Inn & Suites, meals will be at local restaurants, and travel will be by airplane. All expenses will be paid by district funds. No substitute will be needed.
Recommendation: That the above trips be approved as
requested.

PERSONNEL REPORT - CERTIFICATEDClassification Job Type Building Name Start Date Hours Rate of Pay Comment
Curriculum-NoncurriculumCERTIFICATED 21ST CCLC EXT DAY PROG PIO ADAMS, JESSICA 2/2/2015 42 27.39$ CERTIFICATED 21ST CCLC EXT DAY PROG PIO ANDRES, SARAH 2/2/2015 42 27.39$ CERTIFICATED 21ST CCLC EXT DAY PROG PIO ANDRES, SARAH 2/17/2015 10.5 27.39$ CERTIFICATED 21ST CCLC EXT DAY PROG PIO BURGER, SUSAN 2/2/2015 42 27.39$ CERTIFICATED 21ST CCLC EXT DAY PROG PIO DEGROOT, KAREN 2/17/2015 4 41.90$ CERTIFICATED 21ST CCLC EXT DAY PROG PIO FUREY, ERIKA 2/2/2015 42 34.83$ CERTIFICATED 21ST CCLC EXT DAY PROG PIO KIM, JIE 2/2/2015 42 29.27$ CERTIFICATED 21ST CCLC EXT DAY PROG PIO LUSCHEI, MARY 2/17/2015 10.5 48.77$ CERTIFICATED 21ST CCLC EXT DAY PROG PIO MATTIOLI, STEVEN 2/2/2015 8 44.47$ CERTIFICATED 21ST CCLC EXT DAY PROG PIO ROBLE, MICHELLE 2/2/2015 10.5 41.27$ CERTIFICATED ADAPT BEH PRESENTATION LH AARSTAD, EVANNE 2/19/2015 3 50.93$ CERTIFICATED ADAPT BEH PRESENTATION LH JORDAN, KERI 2/19/2015 3 44.47$ CERTIFICATED ADAPT BEH PRESENTATION AMHS JORGENSON, TYLER 2/19/2015 3 27.75$ CERTIFICATED ADAPT BEH PRESENTATION RAIN KRALIK, GAVIN 2/19/2015 3 45.83$ CERTIFICATED ADAPT BEH PRESENTATION AMHS SOHLSTROM, JULIE 2/19/2015 3 27.73$ CERTIFICATED ARTEAM WORKSHOP ANNEX JOHNSON, SHAWN 2/19/2015 5 36.28$ CERTIFICATED ATLA MINI-IMPROVING AHS OKADA, WENDY 1/30/2015 12 41.14$ CERTIFICATED ATLA MINI-IMPROVING CH ROSHAU, MEGAN 2/6/2015 12 28.84$ CERTIFICATED ATLA MINI-IMPROVING GR WATSON, JAMIE 1/30/2015 12 32.40$ CERTIFICATED ATLA MINI-LEADING DS LYSENE, SARAH 2/25/2015 12 40.06$ CERTIFICATED BOOK STUDY GROUP EH ERICKSON, STACI 1/28/2015 5 48.77$ CERTIFICATED BOOK STUDY GROUP EH GAYMAN, MARY ANNE 1/28/2015 5 63.63$ CERTIFICATED BOOK STUDY GROUP EH HERNDON, JENNIFER 1/28/2015 5 50.93$ CERTIFICATED BOOK STUDY GROUP EH LOUIE, ALISA 1/28/2015 5 36.12$ CERTIFICATED CAMP AUBURN CH MCCAUSLAND, CYNTHIA 5/5/2015 STIPEND $409CERTIFICATED CAMP AUBURN CH SIGNAL, MICHAEL 5/5/2015 STIPEND $409CERTIFICATED CHILD CARE-TRNG LV SHEEHAN, LORI 2/23/2015 4.5 27.02$ CERTIFICATED ELEM. EXT. LRNG PROG GR CARR, KARIN 1/12/2015 40 34.19$ CERTIFICATED ELEM. EXT. LRNG PROG LV LOCKETT, SARAH 1/12/2015 20 30.01$ CERTIFICATED ELEM. EXT. LRNG PROG LV MOORE, ERIKA 1/12/2015 10 41.90$ CERTIFICATED ELEM. EXT. LRNG PROG LV WHITE, BETH 1/12/2015 20 31.35$ CERTIFICATED ELL INST PREP MTB MCCANN, VALLERY 2/9/2015 1.5 38.88$ CERTIFICATED EXT. HOURS-NURSE INTERN ANNEX BENSHOOF, KELLY 2/11/2015 20 32.76$ CERTIFICATED EXT. HOURS-NURSE INTERN ANNEX CHAMP-GIBSON, ERLA 2/11/2015 8 38.67$ CERTIFICATED EXT. LEARN PROGRAM AMHS BAUMSTARK, PATRIA 2/11/2015 30 50.93$ CERTIFICATED HS MUSIC CONSULTANT AMHS CALDWELL, KAREN 2/23/2015 100 20.00$ CERTIFICATED HS ORCHESTRA CONSULTANT AMHS HUO, BEVERLY 2/23/2015 100 20.00$ CERTIFICATED INFO TEXT BRIEF WRITES LLH KNAPP, STEPHANIE 1/1/2015 100 41.90$ CERTIFICATED INVOLUNTARY ROOM CHANGE AJ ELLIOTT, NAOMI 1/30/2015 14 42.54$ CERTIFICATED ITSS TRAININGS PIO DEGROOT, KAREN 10/1/2014 10 41.90$ CERTIFICATED KIM SUTTON 10 BLOCK MATH AJ ARCHER, MELISSA 1/23/2015 5 37.49$ CERTIFICATED KIM SUTTON 10 BLOCK MATH EH BARROW, RACHAEL 1/23/2015 5 27.38$ CERTIFICATED KIM SUTTON 10 BLOCK MATH PIO BURGER, SUSAN 1/23/2015 5 27.39$ CERTIFICATED KIM SUTTON 10 BLOCK MATH PIO CHOCK, RUBY 1/23/2015 5 48.04$ CERTIFICATED KIM SUTTON 10 BLOCK MATH AJ COLBURN, DEANNA 1/23/2015 5 27.02$ CERTIFICATED KIM SUTTON 10 BLOCK MATH HZ CRAIN, LORI 1/23/2015 5 41.90$ CERTIFICATED KIM SUTTON 10 BLOCK MATH EH DRAKE, MICHELLE 1/23/2015 5 30.77$ CERTIFICATED KIM SUTTON 10 BLOCK MATH TP ENZ, KIMBERLY 1/23/2015 5 50.93$ CERTIFICATED KIM SUTTON 10 BLOCK MATH PIO FUREY, ERIKA 1/23/2015 5 34.83$ CERTIFICATED KIM SUTTON 10 BLOCK MATH AJ HUIRAS, TERESA 1/23/2015 5 45.79$ CERTIFICATED KIM SUTTON 10 BLOCK MATH HZ KALETA, AMY 1/23/2015 5 50.93$ CERTIFICATED KIM SUTTON 10 BLOCK MATH IL KLIEWER, KARSTIN 1/23/2015 5 47.81$ CERTIFICATED KIM SUTTON 10 BLOCK MATH IL MICHALEK, TAMMY 1/23/2015 5 34.19$

CERTIFICATED KIM SUTTON 10 BLOCK MATH LV MIRACLE, CYNDIE 1/23/2015 5 50.93$ CERTIFICATED KIM SUTTON 10 BLOCK MATH IL NEUBAUER, MAUREEN 1/23/2015 5 45.79$ CERTIFICATED KIM SUTTON 10 BLOCK MATH HZ SWANSON, DARLENE 1/23/2015 5 50.93$ CERTIFICATED MEASUREMENT/DATA LH JENKINS, SHANA 11/3/2014 2 28.48$ CERTIFICATED MEETING OUTSIDE WAC TIME ANNEX BOCK, CHRISTINA 2/13/2015 18 37.52$ CERTIFICATED MEETING OUTSIDE WAC TIME ANNEX JACOBSMA, AMANDA 2/13/2015 18 37.91$ CERTIFICATED MEETING OUTSIDE WAC TIME ANNEX LASKEY, SAMANTHA 2/13/2015 18 37.91$ CERTIFICATED MEETING OUTSIDE WAC TIME ANNEX RUPP, TERI 2/13/2015 12 43.17$ CERTIFICATED MONTHLY K INSERVICE TP JARMAN, COURTNY 10/1/2014 3 33.46$ CERTIFICATED MONTHLY K INSERVICE TP MISCHKE, EMILY 10/1/2014 3 33.46$ CERTIFICATED PLC PREP/PRESENTATION AMHS DAVIDSON, CARY 1/5/2015 2 45.82$ CERTIFICATED PLC PREP/PRESENTATION AMHS HALL, ERIN 1/5/2015 2 45.83$ CERTIFICATED PLC PREP/PRESENTATION AMHS TAUZER, LESLIE 1/5/2015 2 47.81$ CERTIFICATED PRE-K WEBSITE DEV ANNEX BUDZYNSKI, NICOLE 2/13/2015 50 35.57$ CERTIFICATED PRE-K WEBSITE DEV LH ST MARY, SARAH 2/13/2015 50 34.73$ CERTIFICATED PROJECT GLAD GR ARAMBURU, CARLY 2/17/2015 18 STIPEND $600CERTIFICATED PROJECT GLAD TP BULSON, LAURIE 2/17/2015 18 STIPEND $600CERTIFICATED PROJECT GLAD GR CARNINO, IRINA 2/17/2015 18 STIPEND $600CERTIFICATED PROJECT GLAD CAS CARRIZOSA, CARLA 2/17/2015 18 STIPEND $600CERTIFICATED PROJECT GLAD HZ DUCKWORTH, APRIL 2/17/2015 18 STIPEND $600CERTIFICATED PROJECT GLAD ALP FERRELL, LEON 2/17/2015 18 STIPEND $600CERTIFICATED PROJECT GLAD IL FIELDS, BEVERLY 2/17/2015 18 STIPEND $600CERTIFICATED PROJECT GLAD EH JEWETT, MARICE 2/17/2015 18 STIPEND $600CERTIFICATED PROJECT GLAD GR KIM, DAN-BY 2/17/2015 18 STIPEND $600CERTIFICATED PROJECT GLAD LLH LAMB, PETER 2/17/2015 18 STIPEND $600CERTIFICATED PROJECT GLAD IL MCKEEVER, ALLISON 2/17/2015 18 STIPEND $600CERTIFICATED PROJECT GLAD EH MILLER, KYLEY 2/17/2015 18 STIPEND $600CERTIFICATED PROJECT GLAD GR OLSON, KRISTINA 2/17/2015 18 STIPEND $600CERTIFICATED PROJECT GLAD GR SIMONS, DIANE 2/17/2015 18 STIPEND $600CERTIFICATED PROJECT GLAD AJ TAYLOR, TIFFANY 2/17/2015 18 STIPEND $600CERTIFICATED PROJECT GLAD EH UDD, JESSICA 2/17/2015 18 STIPEND $600CERTIFICATED PROJECT GLAD GR ULLBERG, NECIA 2/17/2015 18 STIPEND $600CERTIFICATED PROJECT GLAD GR UTU, JESSICA 2/17/2015 18 STIPEND $600CERTIFICATED PROJECT GLAD GR WEYGINT, KERI 2/17/2015 18 STIPEND $600CERTIFICATED PROJECT GLAD HZ WINSLOW, LORI 2/17/2015 18 STIPEND $600CERTIFICATED PROJECT GLAD HZ ZABRISKIE, SUZANNE 2/17/2015 18 STIPEND $600CERTIFICATED PSAT PARENT NIGHT AMHS PAULSON, AMANDA 1/22/2015 2 35.21$ CERTIFICATED RUBRIC WORK OLY ENGLANDER, BRANDY 11/3/2014 2 41.90$ CERTIFICATED RUBRIC WORK OLY LENIHAN, LAINE 11/3/2014 2 49.93$ CERTIFICATED SBAC TRAINING IL ANDERSON, AMY 3/5/2015 1.5 31.78$ CERTIFICATED SBAC TRAINING AMHS AUSTIN, STEPHANIE 3/5/2015 1.5 50.93$ CERTIFICATED SBAC TRAINING ALP BECKETT, MARYELLEN 3/5/2015 1.5 50.93$ CERTIFICATED SBAC TRAINING LH BLOSSER, REBEKAH 3/5/2015 1.5 38.51$ CERTIFICATED SBAC TRAINING LLH CAMPBELL, DAVID 3/5/2015 1.5 48.77$ CERTIFICATED SBAC TRAINING HZ CARTER, AMBER 3/5/2015 1.5 43.17$ CERTIFICATED SBAC TRAINING ALP CICERO, TANYA 3/5/2015 1.5 50.93$ CERTIFICATED SBAC TRAINING MTB CLARK, ANNE 3/5/2015 1.5 45.79$ CERTIFICATED SBAC TRAINING CAS DEAVER, MARCUS 3/5/2015 1.5 50.93$ CERTIFICATED SBAC TRAINING IL DEFRANCESCO, ANDREW 3/5/2015 1.5 47.81$ CERTIFICATED SBAC TRAINING GR DISBROW, LAUREL 3/5/2015 1.5 50.93$ CERTIFICATED SBAC TRAINING EH ERICKSON, STACI 3/5/2015 1.5 48.77$ CERTIFICATED SBAC TRAINING HZ FERGUSON, SANDRA 3/5/2015 1.5 45.17$ CERTIFICATED SBAC TRAINING LH FETTIG, MICHAEL 3/5/2015 1.5 50.93$ CERTIFICATED SBAC TRAINING CH GALATI, ELIZABETH 3/5/2015 1.5 38.88$ CERTIFICATED SBAC TRAINING ARHS GALLINATTI, LISA 3/5/2015 1.5 50.93$ CERTIFICATED SBAC TRAINING EH GRAB, ARNIE 3/5/2015 1.5 50.93$

CERTIFICATED SBAC TRAINING TP HAMILTON, GINA 3/5/2015 1.5 50.93$ CERTIFICATED SBAC TRAINING DS HARMANING, LINDA 3/5/2015 1.5 48.77$ CERTIFICATED SBAC TRAINING PIO HOSKIN, DAVID 3/5/2015 1.5 45.79$ CERTIFICATED SBAC TRAINING LV JENNINGS, MELANIE 3/5/2015 1.5 50.93$ CERTIFICATED SBAC TRAINING MTB KEMP, JAMES 3/5/2015 1.5 48.77$ CERTIFICATED SBAC TRAINING WA KILBURG, KRISTY 3/5/2015 1.5 44.47$ CERTIFICATED SBAC TRAINING WAHS LAUSH JR., LARRY 3/5/2015 1.5 50.93$ CERTIFICATED SBAC TRAINING LLH LEAF, VICKIE 3/5/2015 1.5 50.93$ CERTIFICATED SBAC TRAINING ALP LEYDA, BRENDA 3/5/2015 1.5 50.93$ CERTIFICATED SBAC TRAINING OLY MASON, JERI 3/5/2015 1.5 45.79$ CERTIFICATED SBAC TRAINING LV MILLGARD, JANET 3/5/2015 1.5 50.93$ CERTIFICATED SBAC TRAINING WA PETTIT, JULIE 3/5/2015 1.5 30.39$ CERTIFICATED SBAC TRAINING DS PFAB, TIMOTHY 3/5/2015 1.5 48.77$ CERTIFICATED SBAC TRAINING AHS PICATTI-BAKER, MOLLY 3/5/2015 1.5 41.27$ CERTIFICATED SBAC TRAINING CH SIGNAL, MICHAEL 3/5/2015 1.5 37.74$ CERTIFICATED SBAC TRAINING LH SLATT, MELISSA 3/5/2015 1.5 37.00$ CERTIFICATED SBAC TRAINING AJ SPENCER, JR., ARTHUR 3/5/2015 1.5 50.93$ CERTIFICATED SBAC TRAINING CAS THOMSEN, CHRISTINA 3/5/2015 1.5 50.93$ CERTIFICATED SBAC TRAINING AHS WHITE, KENNY 3/5/2015 1.5 50.93$ CERTIFICATED SBAC TRAINING HZ WICKSTROM, ERIN 3/5/2015 1.5 49.93$ CERTIFICATED SBAC TRAINING TP WILLIAMS, CHRISTINA 3/5/2015 1.5 50.93$ CERTIFICATED SBAC TRAINING RAIN WILSON, CHRISTINE 3/5/2015 1.5 47.22$ CERTIFICATED SKILLS USA COMP AHS CUGHAN, RONALD 11/13/2014 35 48.04$ CERTIFICATED SKILLS USA COMP ARHS MEDINA, FRANK 11/13/2014 35 48.77$ CERTIFICATED SKILLS USA COMP ARHS WICKENS, JAMES 11/13/2014 35 50.93$ CERTIFICATED STANDARD IN WRITING OLY KINDEM, SUSAN 9/1/2014 18 50.93$ CERTIFICATED SUPPORT FOR STUDENTS CAS JONASSON, KARLY 9/1/2014 18 29.63$
New HireCERTIFICATED COUNSEOR RAIN SOHAL, BALJINDER 3/16/2015 C4, S8
Resignation

Curriculum-NoncurriculumCLASSIFIED ASSISTANT COACH - BOYS' BASKETBALL AUBURN MOUNTAINVIEW MEDFORD, RYAN 11/10/2014 126 STIPEND - $2,250CLASSIFIED ASSISTANT COACH - BOYS' SWIM AUBURN RIVERSIDE HARDERSEN, KERRY 11/1/2014 198 STIPEND - $3,190CLASSIFIED ASSISTANT COACH - WRESTLING AUBURN MOUNTAINVIEW WORKMAN, JESS 11/10/2014 60 STIPEND - $1,159CLASSIFIED CHILD CARE - OPEN DOOR TRAINING ANNEX DRAY, DIANA 2/21/2015 4 $16.69CLASSIFIED CHILD CARE - OPEN DOOR TRAINING ANNEX FLYNN, SHERI 2/21/2015 2.5 $16.69CLASSIFIED CHILD CARE - OPEN DOOR TRAINING ANNEX MAY, LAEL 2/21/2015 4.5 $16.84CLASSIFIED CHILD CARE - OPEN DOOR TRAINING ANNEX MILLER, TAMMY 2/21/2015 4 $17.53CLASSIFIED COACH - WRESTLING (6TH GRADE) OLYMPIC ROWLAND, JUSTIN 1/5/2015 40 STIPEND - $794CLASSIFIED CONSULTANT - BAND MT BAKER FANSHIER, NAOMI 2/24/2015 33 $20.00CLASSIFIED CONSULTANT - BAND MT BAKER KETRON, SCOTT 2/24/2015 25 $20.00CLASSIFIED CONSULTANT - BAND MT BAKER WAGNER, RYAN 2/24/2015 18 $20.00CLASSIFIED DD3 GRANT COORDINATOR DICK SCOBEE GILBERT, ANN 1/30/2015 180 $34.47CLASSIFIED EARLY LEARNING EXECUTIVE COMMITTEE DEPT OF STUDENT LEARNING RUSSUM, FRANCES 9/3/2014 25 $24.63CLASSIFIED HEAD COACH - VOLLEYBALL MT BAKER ARIAS, ELIS 2/16/2015 150 STIPEND - $4,010CLASSIFIED MOVE OFFICE HEAD START DOWDEN-HUGHES, SHERITH 11/1/2014 2 $23.93CLASSIFIED MOVE OFFICE HEAD START RAY, ROSEANNE 11/1/2014 15 $17.34CLASSIFIED TRAINING - SBAC DEPT OF STUDENT LEARNING BUCKINGHAM, KIMBERLY 3/5/2015 1.5 $15.88CLASSIFIED TRAINING - SBAC DEPT OF STUDENT LEARNING DUDLEY, TONI 3/5/2015 1.5 $16.53CLASSIFIED TRAINING - SBAC DEPT OF STUDENT LEARNING FRERICHS, ROSANNA 3/5/2015 1.5 $16.53CLASSIFIED TRAINING - SBAC DEPT OF STUDENT LEARNING GARIANO, ELETHA 3/5/2015 1.5 $16.93CLASSIFIED TRAINING - SBAC DEPT OF STUDENT LEARNING HARRIS, DONNA 3/5/2015 1.5 $16.93CLASSIFIED TRAINING - SBAC DEPT OF STUDENT LEARNING RUDOLPH, JEANNE 3/5/2015 1.5 $23.44CLASSIFIED TRAINING - SBAC DEPT OF STUDENT LEARNING STARKEL, KELLY 3/5/2015 1.5 $16.53CLASSIFIED TRAINING - SBAC DEPT OF STUDENT LEARNING WHITE, DEBRA 3/5/2015 1.5 $21.27CLASSIFIED TRAINING - WELPA TEST ADMINISTRATION DEPT OF STUDENT LEARNING CURTIN, JESSAMYN 2/4/2015 2 $16.38CLASSIFIED TRAINING - WELPA TEST ADMINISTRATION DEPT OF STUDENT LEARNING ERICKSON, CHRISTINE 2/6/2015 4 $16.53CLASSIFIED TRAINING - WELPA TEST ADMINISTRATION DEPT OF STUDENT LEARNING HOEVET, TRACY 2/4/2015 2 $16.53CLASSIFIED TRAINING - WELPA TEST ADMINISTRATION DEPT OF STUDENT LEARNING JENSEN, LOIS 2/4/2015 2 $16.53CLASSIFIED TRAINING - WELPA TEST ADMINISTRATION DEPT OF STUDENT LEARNING LEMPERT, DEIRDRE 2/4/2015 2 $15.89CLASSIFIED TRAINING - WELPA TEST ADMINISTRATION DEPT OF STUDENT LEARNING MASTERS, JULIE 2/4/2015 2 $16.22CLASSIFIED TRAINING - WELPA TEST ADMINISTRATION DEPT OF STUDENT LEARNING MENDEZ, LETICIA 2/4/2015 2 $16.38CLASSIFIED TRAINING - WELPA TEST ADMINISTRATION DEPT OF STUDENT LEARNING MILLER, SHELBY 2/4/2015 2 $15.89CLASSIFIED TRAINING - WELPA TEST ADMINISTRATION DEPT OF STUDENT LEARNING WICKLUND, PAMELA 2/4/2015 2 $16.22CLASSIFIED TUTOR ANNEX PETERS, DORTHEA 2/11/2015 40 $16.21
New HireCLASSIFIED AA - ATTENDANCE 187 AUBURN RIVERSIDE BARTELT, JEANINE 2/25/2015 6 $15.52 QUALIFIED APPLICANTCLASSIFIED LEAD TECHNICIAN PAC/ART/TAM WELLS, RICHARD 2/19/2015 1200 $19.00 QUALIFIED APPLICANTCLASSIFIED OFFICE ASSISTANT - ENROLLMENT MT BAKER MILLS, CRYSTAL 3/2/2015 6 $15.52 QUALIFIED APPLICANTCLASSIFIED PARA EDUCATOR SPECIAL ED ADAPTIVE BEHAVIOR C/S RAINIER MIDDLE SCHOOL MCLEAN, ANA 2/23/2015 6.5 $16.21 QUALIFIED APPLICANTCLASSIFIED PARA-EDUCATOR SPECIAL ED ADAPTIVE BEHAVIOR AUBURN MOUNTAINVIEW HARTEAU, NICHOLAS 3/2/2015 6.5 $16.21 QUALIFIED APPLICANTCLASSIFIED PARA-EDUCATOR SPECIAL ED ADAPTIVE BEHAVIOR AUBURN MOUNTAINVIEW WILLS, BRIANNE 2/25/2015 6.5 $16.21 QUALIFIED APPLICANTCLASSIFIED PARA-EDUCATOR SPECIAL ED SPECIAL KIDS MT BAKER HALL, SHAWNA 2/25/2015 5.5 $16.21 QUALIFIED APPLICANT
RehireCLASSIFIED ASSISTANT COOK CASCADE/CHINOOK SUDWEEKS, JENNIFER 1/5/2015 3/1 $14.86 REHIRE 2014-15 SCHOOL YEARCLASSIFIED PARA-EDUCATOR ELL/PLAYGROUND ARTHUR JACOBSEN BREWER, KARA 2/23/2015 5/.5 $16.22/$14.90 REHIRE 2014-15 SCHOOL YEAR
ResignationCLASSIFIED ASSISTANT COOK CHILD NUTRITION GREY, JULIA 2/27/2015 PERSONALCLASSIFIED BUS DRIVER TRANSPORTATION FITZGERALD, PAULINE 2/13/2015 PERSONAL
SupervisionCLASSIFIED DISTRICT/NONDISTRICT ATHLETICS/ACTIVITIES AUBURN HIGH WILSON, KADI 2/23/2015 $20.00CLASSIFIED YELL SUMMIT AUBURN MOUNTAINVIEW BRUX, SHAWNA 4/11/2015 10 $20.00CLASSIFIED YELL SUMMIT AUBURN MOUNTAINVIEW ELLIOTT SR., KENNETH 4/11/2015 10 $20.00
PERSONNEL REPORT - CLASSIFIED

CERTIFICATED RESUME
a. Baljinder ‘Bobbi’ Sohal--counselor--Rainier Middle School
Ms. Sohal earned her bachelor degree at Chapman University and her master degree at the University of LaVerne.
Bobbi previously worked for the Omak School District.

March 9, 2015 Page 7
BUILDING PROGRAM 1. Asset Preservation Program Randy Thomas, executive director of maintenance, will present facility
condition reports for Mt. Baker Middle School, Auburn Riverside High School, and Auburn Mountainview High School as required by the OSPI Asset Preservation Program.
Recommendation: That the board approve the facility
assessment for Mt. Baker Middle School, Auburn Mountainview High School, and Auburn Riverside High School.
2. Authorization of Award of Contract – Auburn Riverside High School Ball
Field and Site Improvements Bids for the Auburn Riverside High School Ball Field and Site
Improvements project were opened March 3, 2015. Bids were received from six contractors.
The low responsive base bid was submitted by Terra Dynamics, Inc. of
Algona, Washington, in the amount of $3,609,000.00. A bid tabulation and recommendation from the project architect are attached.
Bob Kenworthy, assistant director of capital projects, will be present
to recommend award of the contract. Recommendation: That the contract for the Auburn
Riverside High School Ball Field and Site Improvements project be awarded to the low responsive bidder, Terra Dynamics, Inc. for their bid of $3,609,000.00.

School Facilities and Organization Generated: Feb 25, 2015 Page 1 of 1
1
YEAR DISTRICT ASSIGNED AREA
ORIGINAL OCCUPANCY DATE
1994 Area 1 9/6/1994
COMPONENTCODEA1010A4010A6010B1020B2010B2020B2050B2070B3010B3020B3060B3080C1010C1020C1030C1040C1070C2010
MAIN BUILDING - MT BAKER MIDDLE SCHOOL, AUBURN SCHOOL DISTRICT
Building Details
BUILDING PROFILE TYPE Middle/Junior High School - Single Story
STATE OF WASHINGTONSUPERINTENDENT OF PUBLIC INSTRUCTION
BUILDING SUMMARY REPORT 2014-2015
NUMBER OF FLOORSBUILDING BOARD ACCEPTANCE DATE 9/1/1994
BUILDING CHARACTERISTICS Has Classrooms, Occupied
CERTIFIED BY BCA No
SCAP REQUIREMENTS Asset Preservation Program (APP)
CONDITION RATING 94.57% Good
Building Inventory
DISTRICT ASSIGNED AREA USE GROSS BUILDINGSQ FT
GROSS INSTRUCTIONAL SQ FT
STATE ASSISTEDSQ FT
ORIGINAL BOARD ACCEPTANCE DATE
Concessions, Gymnasium, Library, 90,358 90,358 0 2/24/1997Building Totals 90,358 90,358 0
Building ComponentsSUB-ASSEMBLY COMPONENT MAINTENANCE
PRIORITYCONDITION
RATINGFoundations Standard Foundation 100.00% ExcellentSlabs on Grade Standard Slabs on Grade 100.00% ExcellentWater and Gas Mitigation Building Subdrainage 100.00% ExcellentSuperstructure Roof Construction 100.00% ExcellentExterior Vertical Enclosures Exterior Walls 100.00% Excellent
Exterior Windows 100.00% ExcellentExterior Doors and Grilles 100.00% ExcellentExterior Louvers and Vents 100.00% Excellent
Exterior Horizontal Enclosures Roofing 90.00% GoodRoof Appurtenances 90.00% GoodHorizontal Openings 90.00% GoodOverhead Exterior Enclosures 90.00% Good
Interior Construction Interior Partitions 100.00% ExcellentInterior Windows 100.00% ExcellentInterior Doors 90.00% GoodInterior Grilles and Gates 90.00% GoodSuspended Ceiling Construction 100.00% Excellent
Interior Finishes Wall Finishes 90.00% Good

School Facilities and Organization Generated: Feb 25, 2015 Page 1 of 1
MAIN BUILDING - MT BAKER MIDDLE SCHOOL, AUBURN SCHOOL DISTRICT
STATE OF WASHINGTONSUPERINTENDENT OF PUBLIC INSTRUCTION
BUILDING SUMMARY REPORT 2014-2015
C2020C2030C2050D2010D2020D2030D3010D3020D3030D3050D3060D4010D4030D5010D5020D5030D5040D6010D6020D6030D6060D7030D7050D8010E1030E1040E1070E1090E2010E2050
Interior Fabrications 90.00% GoodFlooring 90.00% GoodCeiling Finishes 90.00% Good
Plumbing Domestic Water Distribution 90.00% GoodSanitary Drainage 100.00% ExcellentBuilding Support Plumbing Systems 100.00% Excellent
HVAC Facility Fuel Systems 100.00% ExcellentHeating Systems 90.00% GoodCooling Systems 90.00% GoodFacility HVAC Distribution Systems 90.00% GoodVentilation 90.00% Good
Fire Protection Fire Suppression 90.00% GoodFire Protection Specialties 90.00% Good
Electrical Facility Power Generation 90.00% GoodElectrical Services and Distribution 100.00% ExcellentGeneral Purpose Electrical Power 100.00% ExcellentLighting 90.00% Good
Communications Data Communications 100.00% ExcellentVoice Communications 90.00% GoodAudio-Visual Communications 90.00% GoodDistributed Communications and 90.00% Good
Electronic Safety and Security Electronic Surveillance 90.00% GoodDetection and Alarm 90.00% Good
Integrated Automation Integrated Automation Facility 90.00% GoodEquipment Commercial Equipment 90.00% Good
Institutional Equipment 90.00% GoodEntertainment and Recreational 90.00% GoodOther Equipment 90.00% Good
Furnishings Fixed Furnishings 90.00% GoodMovable Furnishings 90.00% Good

School Facilities and Organization Generated: Feb 25, 2015 Page 1 of 1
1
YEAR DISTRICT ASSIGNED AREA
ORIGINAL OCCUPANCY DATE
1995 Area 1 9/6/1995
COMPONENTCODEA1010A6010B1010B1020B2010B2020B2050B2070B3010B3020B3060B3080C1010C1020C1030C1040C1070C2010
MAIN BUILDING - AUBURN RIVERSIDE HIGH SCHOOL, AUBURN SCHOOL DISTRICT
Building Details
BUILDING PROFILE TYPE Administrative
STATE OF WASHINGTONSUPERINTENDENT OF PUBLIC INSTRUCTION
BUILDING SUMMARY REPORT 2014-2015
NUMBER OF FLOORSBUILDING BOARD ACCEPTANCE DATE 12/1/1997
BUILDING CHARACTERISTICS Has Classrooms, Occupied
CERTIFIED BY BCA No
SCAP REQUIREMENTS Asset Preservation Program (APP)
CONDITION RATING 91.84% Good
Building Inventory
DISTRICT ASSIGNED AREA USE GROSS BUILDINGSQ FT
GROSS INSTRUCTIONAL SQ FT
STATE ASSISTEDSQ FT
ORIGINAL BOARD
Library, Classroom, Administrative, 187,038 187,038 0 12/1/1997Building Totals 187,038 187,038 0
Building ComponentsSUB-ASSEMBLY COMPONENT MAINTENANCE
PRIORITYCONDITION
RATINGFoundations Standard Foundation 100.00% ExcellentWater and Gas Mitigation Building Subdrainage 100.00% ExcellentSuperstructure Floor Construction 100.00% Excellent
Roof Construction 100.00% ExcellentExterior Vertical Enclosures Exterior Walls 90.00% Good
Exterior Windows 100.00% ExcellentExterior Doors and Grilles 90.00% GoodExterior Louvers and Vents 100.00% Excellent
Exterior Horizontal Enclosures Roofing 90.00% GoodRoof Appurtenances 90.00% GoodHorizontal Openings 90.00% GoodOverhead Exterior Enclosures 90.00% Good
Interior Construction Interior Partitions 90.00% GoodInterior Windows 90.00% GoodInterior Doors 90.00% GoodInterior Grilles and Gates 90.00% GoodSuspended Ceiling Construction 100.00% Excellent
Interior Finishes Wall Finishes 90.00% Good

School Facilities and Organization Generated: Feb 25, 2015 Page 1 of 1
MAIN BUILDING - AUBURN RIVERSIDE HIGH SCHOOL, AUBURN SCHOOL DISTRICT
STATE OF WASHINGTONSUPERINTENDENT OF PUBLIC INSTRUCTION
BUILDING SUMMARY REPORT 2014-2015
C2020C2030C2050D2010D2020D2030D3010D3020D3030D3050D3060D4010D4030D5020D5030D5040D6010D6020D6030D6060D7010D7030D7050D8010E2010E2050
Interior Fabrications 90.00% GoodFlooring 90.00% GoodCeiling Finishes 90.00% Good
Plumbing Domestic Water Distribution 90.00% GoodSanitary Drainage 100.00% ExcellentBuilding Support Plumbing Systems 100.00% Excellent
HVAC Facility Fuel Systems 100.00% ExcellentHeating Systems 90.00% GoodCooling Systems 90.00% GoodFacility HVAC Distribution Systems 62.00% FairVentilation 90.00% Good
Fire Protection Fire Suppression 100.00% ExcellentFire Protection Specialties 100.00% Excellent
Electrical Electrical Services and Distribution 100.00% ExcellentGeneral Purpose Electrical Power 100.00% ExcellentLighting 90.00% Good
Communications Data Communications 90.00% GoodVoice Communications 90.00% GoodAudio-Visual Communications 90.00% GoodDistributed Communications and 90.00% Good
Electronic Safety and Security Access Control and Intrusion 62.00% FairElectronic Surveillance 62.00% FairDetection and Alarm 90.00% Good
Integrated Automation Integrated Automation Facility 62.00% FairFurnishings Fixed Furnishings 90.00% Good
Movable Furnishings 90.00% Good

School Facilities and Organization Generated: Feb 25, 2015 Page 1 of 1
1
YEAR DISTRICT ASSIGNED AREA
ORIGINAL OCCUPANCY DATE
2005 Area 1 9/6/2005
COMPONENTCODEA1010A6010B1010B1020B2010B2020B2050B2070B3010B3020B3060B3080C1010C1020C1030C1040C1070C2010
MAIN BUILDING - AUBURN MOUNTAINVIEW HIGH SCHOOL, AUBURN SCHOOL DISTRICT
Building Details
BUILDING PROFILE TYPE Administrative
STATE OF WASHINGTONSUPERINTENDENT OF PUBLIC INSTRUCTION
BUILDING SUMMARY REPORT 2014-2015
NUMBER OF FLOORSBUILDING BOARD ACCEPTANCE DATE 12/22/2008
BUILDING CHARACTERISTICS Has Classrooms, Occupied
CERTIFIED BY BCA No
SCAP REQUIREMENTS Asset Preservation Program (APP)
CONDITION RATING 98.56% Excellent
Building Inventory
DISTRICT ASSIGNED AREA USE GROSS BUILDINGSQ FT
GROSS INSTRUCTIONAL SQ FT
STATE ASSISTEDSQ FT
ORIGINAL BOARD ACCEPTANCE DATE
Media Production Center, 187,370 187,370 0 12/22/2008Building Totals 187,370 187,370 0
Building ComponentsSUB-ASSEMBLY COMPONENT MAINTENANCE
PRIORITYCONDITION
RATINGFoundations Standard Foundation 100.00% ExcellentWater and Gas Mitigation Building Subdrainage 100.00% ExcellentSuperstructure Floor Construction 100.00% Excellent
Roof Construction 100.00% ExcellentExterior Vertical Enclosures Exterior Walls 100.00% Excellent
Exterior Windows 100.00% ExcellentExterior Doors and Grilles 100.00% ExcellentExterior Louvers and Vents 100.00% Excellent
Exterior Horizontal Enclosures Roofing 100.00% ExcellentRoof Appurtenances 100.00% ExcellentHorizontal Openings 100.00% ExcellentOverhead Exterior Enclosures 100.00% Excellent
Interior Construction Interior Partitions 100.00% ExcellentInterior Windows 100.00% ExcellentInterior Doors 100.00% ExcellentInterior Grilles and Gates 100.00% ExcellentSuspended Ceiling Construction 100.00% Excellent
Interior Finishes Wall Finishes 100.00% Excellent

School Facilities and Organization Generated: Feb 25, 2015 Page 1 of 1
MAIN BUILDING - AUBURN MOUNTAINVIEW HIGH SCHOOL, AUBURN SCHOOL DISTRICT
STATE OF WASHINGTONSUPERINTENDENT OF PUBLIC INSTRUCTION
BUILDING SUMMARY REPORT 2014-2015
C2020C2030C2050D2010D2020D2030D3010D3020D3030D3050D3060D4010D4030D5020D5030D5040D6010D6020D6030D6060D7010D7030D7050D8010E2010E2050
Interior Fabrications 100.00% ExcellentFlooring 100.00% ExcellentCeiling Finishes 100.00% Excellent
Plumbing Domestic Water Distribution 100.00% ExcellentSanitary Drainage 90.00% GoodBuilding Support Plumbing Systems 100.00% Excellent
HVAC Facility Fuel Systems 100.00% ExcellentHeating Systems 90.00% GoodCooling Systems 90.00% GoodFacility HVAC Distribution Systems 90.00% GoodVentilation 100.00% Excellent
Fire Protection Fire Suppression 100.00% ExcellentFire Protection Specialties 100.00% Excellent
Electrical Electrical Services and Distribution 100.00% ExcellentGeneral Purpose Electrical Power 100.00% ExcellentLighting 100.00% Excellent
Communications Data Communications 100.00% ExcellentVoice Communications 100.00% ExcellentAudio-Visual Communications 100.00% ExcellentDistributed Communications and 100.00% Excellent
Electronic Safety and Security Access Control and Intrusion 100.00% ExcellentElectronic Surveillance 100.00% ExcellentDetection and Alarm 100.00% Excellent
Integrated Automation Integrated Automation Facility 100.00% ExcellentFurnishings Fixed Furnishings 100.00% Excellent
Movable Furnishings 100.00% Excellent


www.nacarchitecture.com
NAC Inc | 2025 First Avenue, Suite 300 | Seattle, Washington 98121-3131 | T: 206.441.4522 | F: 206.441.7917
March 4, 2015 Mr. Bob Kenworthy Capital Project Manager Auburn School District No. 408 915 Fourth Street NW Auburn, WA 98002 RE: Auburn Riverside High School Ballfield and Site Improvements Construction Contract Award Recommendation Dear Bob: We opened six bids on March 3, 2015 for the above referenced project. The low responsive bid was submitted by, Terra Dynamics, Inc, for a base bid amount of $3,609,000.00. No bid alternates were included in the project. Our design team consultant, DA Hogan, has worked with Terra Dynamics on several field construction projects over the last 20 years with positive results and consider Terra Dynamics one of the top quality athletic field builders in the Pacific Northwest. We recommend that Auburn School District award the contract to Terra Dynamics, Inc. in the amount of $3,609,000.00 plus sales tax. Sincerely, Karee Loghry, AIA Senior Associate
Nat iona l ta lent ,
loca l focus

March 9, 2015 Page 8
FINANCE 1. Vouchers Vouchers will be presented. Recommendation: That these vouchers be signed.

3apckp07.p AUBURN SCHOOL DISTRICT NO. 408 9:45 AM 03/05/15
05.14.10.00.00-010020 Check Summary PAGE: 1
The following vouchers, as audited and certified by the Auditing Officer as required by RCW 42.24.080, and those expense reimbursement claims certified as required by RCW 42.24.090, are approved for payment. Those payments have been recorded on this listing which has been made available to the board.
As of March 9, 2015, the board, by a __________________________ vote, approves payments, totaling $1,092,106.09. The payments are further identified in this document.
Total by Payment Type for Cash Account, US Bank of Washington: Warrant Numbers 424127 through 424319, totaling $1,092,106.09
Secretary ________________________ Board Member ________________________
Board Member ________________________ Board Member ________________________
Board Member ________________________ Board Member ________________________
Check Nbr Vendor Name Check Date Check Amount
424127 3 WIRE GROUP INC 03/09/2015 196.28
424128 911 ETC INC 03/09/2015 308.60
424129 A A ASPHALTING INCORPORATED 03/09/2015 7,356.80
424130 ACADEMY SCHOOLS 03/09/2015 9,196.40
424131 ACCURACY TEMPORARY SERVICES IN 03/09/2015 990.38
424132 ADI 03/09/2015 722.66
424133 AGRISHOP INC 03/09/2015 87.85
424134 AGUILAR, LILIAN 03/09/2015 15.75
424135 ALARCON, MIREYA 03/09/2015 23.50
424136 AMERICAN RED CROSS 03/09/2015 353.40
424137 AMERICAN SPRINKLER CORP 03/09/2015 2,555.03
424138 Vendor Continued Check 03/09/2015 0.00
424139 ANIXTER INC 03/09/2015 1,518.23
424140 APOLLO MECHANICAL CONTRACTORS 03/09/2015 2,421.83
424141 APPERSON INC 03/09/2015 211.08
424142 APPLES TO GO 03/09/2015 5,328.00
424143 ARAMARK UNIFORM SERVICES 03/09/2015 27.14
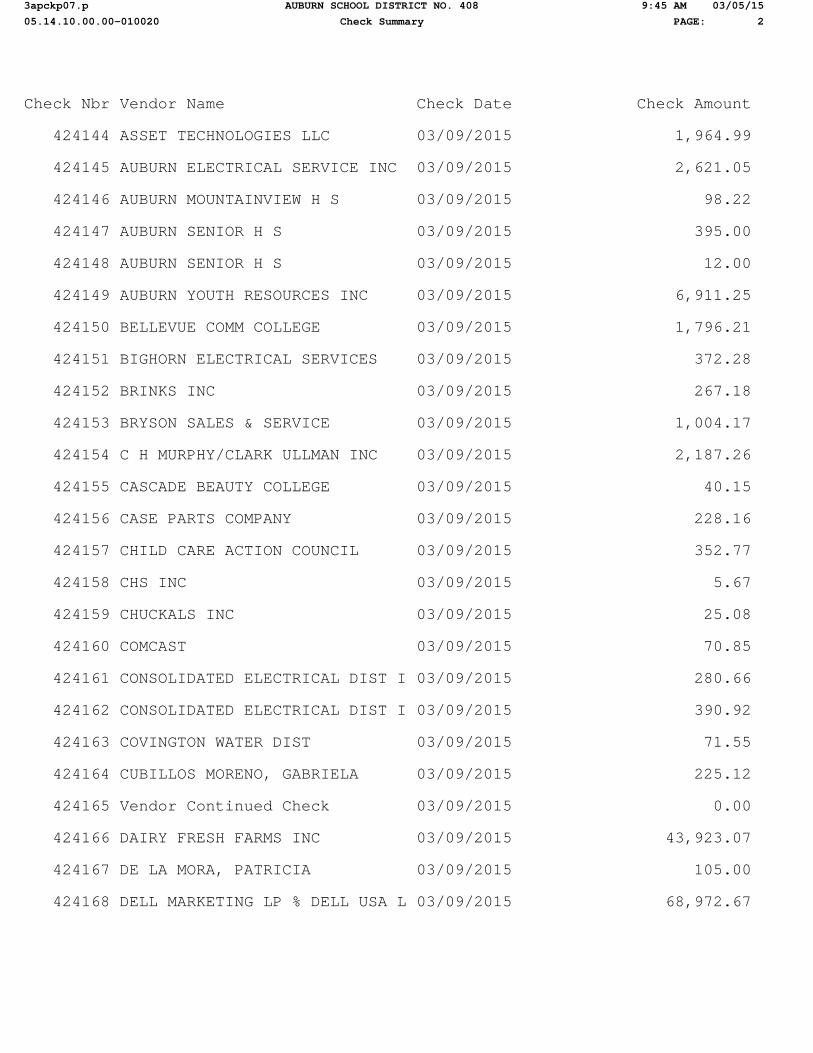
3apckp07.p AUBURN SCHOOL DISTRICT NO. 408 9:45 AM 03/05/15
05.14.10.00.00-010020 Check Summary PAGE: 2
Check Nbr Vendor Name Check Date Check Amount
424144 ASSET TECHNOLOGIES LLC 03/09/2015 1,964.99
424145 AUBURN ELECTRICAL SERVICE INC 03/09/2015 2,621.05
424146 AUBURN MOUNTAINVIEW H S 03/09/2015 98.22
424147 AUBURN SENIOR H S 03/09/2015 395.00
424148 AUBURN SENIOR H S 03/09/2015 12.00
424149 AUBURN YOUTH RESOURCES INC 03/09/2015 6,911.25
424150 BELLEVUE COMM COLLEGE 03/09/2015 1,796.21
424151 BIGHORN ELECTRICAL SERVICES 03/09/2015 372.28
424152 BRINKS INC 03/09/2015 267.18
424153 BRYSON SALES & SERVICE 03/09/2015 1,004.17
424154 C H MURPHY/CLARK ULLMAN INC 03/09/2015 2,187.26
424155 CASCADE BEAUTY COLLEGE 03/09/2015 40.15
424156 CASE PARTS COMPANY 03/09/2015 228.16
424157 CHILD CARE ACTION COUNCIL 03/09/2015 352.77
424158 CHS INC 03/09/2015 5.67
424159 CHUCKALS INC 03/09/2015 25.08
424160 COMCAST 03/09/2015 70.85
424161 CONSOLIDATED ELECTRICAL DIST I 03/09/2015 280.66
424162 CONSOLIDATED ELECTRICAL DIST I 03/09/2015 390.92
424163 COVINGTON WATER DIST 03/09/2015 71.55
424164 CUBILLOS MORENO, GABRIELA 03/09/2015 225.12
424165 Vendor Continued Check 03/09/2015 0.00
424166 DAIRY FRESH FARMS INC 03/09/2015 43,923.07
424167 DE LA MORA, PATRICIA 03/09/2015 105.00
424168 DELL MARKETING LP % DELL USA L 03/09/2015 68,972.67

3apckp07.p AUBURN SCHOOL DISTRICT NO. 408 9:45 AM 03/05/15
05.14.10.00.00-010020 Check Summary PAGE: 3
Check Nbr Vendor Name Check Date Check Amount
424169 DEPT OF RETIREMENT SYSTEMS 03/09/2015 1,901.59
424170 DUFFIELD, WANDA A 03/09/2015 39.50
424171 Vendor Continued Check 03/09/2015 0.00
424172 Vendor Continued Check 03/09/2015 0.00
424173 Vendor Continued Check 03/09/2015 0.00
424174 Vendor Continued Check 03/09/2015 0.00
424175 Vendor Continued Check 03/09/2015 0.00
424176 Vendor Continued Check 03/09/2015 0.00
424177 DYNAMIC LANGUAGE CENTER INC 03/09/2015 3,395.27
424178 EASTBAY INC 03/09/2015 2,831.74
424179 Vendor Continued Check 03/09/2015 0.00
424180 EK BEVERAGE COMPANY 03/09/2015 2,568.10
424181 ELECTROCOM 03/09/2015 342.19
424182 EQUAL OPPORTUNITY SCHOOLS 03/09/2015 10,800.00
424183 ESRI INC 03/09/2015 821.25
424184 ESTATE OF DONNA R SAIKI 03/09/2015 6,642.78
424185 FIRE SYSTEMS WEST INC 03/09/2015 592.94
424186 FOLLETT SCHOOL SOLUTIONS INC 03/09/2015 2,537.72
424187 FORMAL FASHIONS INC 03/09/2015 1,131.84
424188 FULL COMPASS SYSTEMS LTD 03/09/2015 431.87
424189 GOODY MAN DISTRIBUTING INC 03/09/2015 3,086.04
424190 GOPHER SPORT 03/09/2015 697.48
424191 GRAINGER DEPT 810392688 03/09/2015 1,453.36
424192 GREAT FLOORS 03/09/2015 34,268.04
424193 GUARDIAN SECURITY SYSTEMS INC 03/09/2015 40.73

3apckp07.p AUBURN SCHOOL DISTRICT NO. 408 9:45 AM 03/05/15
05.14.10.00.00-010020 Check Summary PAGE: 4
Check Nbr Vendor Name Check Date Check Amount
424194 HAMMOND ASHLEY VIOLINS 03/09/2015 2,266.65
424195 HARTNESS, ADRIANE L 03/09/2015 10,900.00
424196 HIGHLINE COMMUNITY COLLEGE 03/09/2015 65,671.31
424197 HOLM, CYNTHIA 03/09/2015 1,688.40
424198 IMAGE MASTERS INC 03/09/2015 26.28
424199 JENSEN, JACQUELINE LEE 03/09/2015 50.00
424200 JOSTENS 03/09/2015 2,075.03
424201 JTM PROVISIONS CO 03/09/2015 772.20
424202 JW PEPPER & SON INC 03/09/2015 17.50
424203 KING, KALIN C 03/09/2015 1,955.00
424204 LAKEHAVEN UTILITY DISTRICT 03/09/2015 326.00
424205 LAKESHORE LEARNING MATERIALS 03/09/2015 144.74
424206 LEE, WINNIE 03/09/2015 1.50
424207 Vendor Continued Check 03/09/2015 0.00
424208 Vendor Continued Check 03/09/2015 0.00
424209 Vendor Continued Check 03/09/2015 0.00
424210 Vendor Continued Check 03/09/2015 0.00
424211 Vendor Continued Check 03/09/2015 0.00
424212 Vendor Continued Check 03/09/2015 0.00
424213 LOWES HIW INC 03/09/2015 2,363.10
424214 MAXIM STAFFING SOLUTIONS 03/09/2015 8,044.25
424215 MICRO COMPUTER SYSTEMS INC 03/09/2015 11,449.82
424216 MIDAMERICA BOOKS 03/09/2015 474.90
424217 MILES ABA SERVICES 03/09/2015 1,312.50
424218 MINUTEMAN PRESS OF AUBURN 03/09/2015 291.39
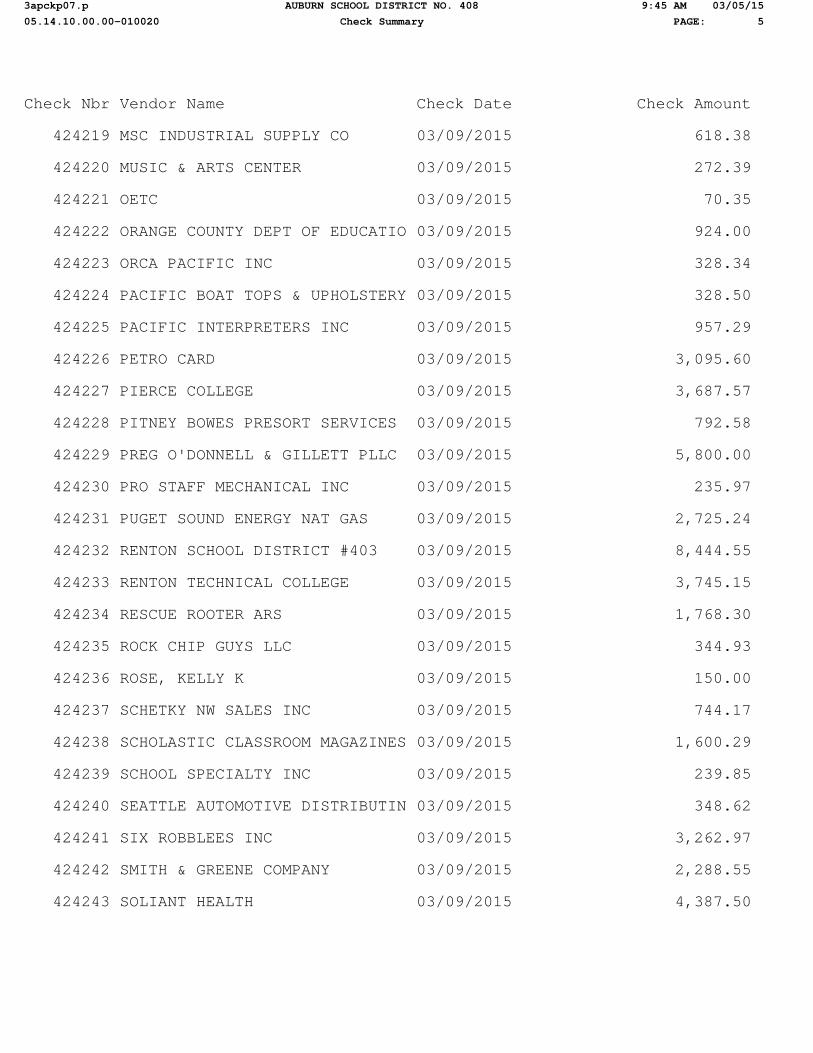
3apckp07.p AUBURN SCHOOL DISTRICT NO. 408 9:45 AM 03/05/15
05.14.10.00.00-010020 Check Summary PAGE: 5
Check Nbr Vendor Name Check Date Check Amount
424219 MSC INDUSTRIAL SUPPLY CO 03/09/2015 618.38
424220 MUSIC & ARTS CENTER 03/09/2015 272.39
424221 OETC 03/09/2015 70.35
424222 ORANGE COUNTY DEPT OF EDUCATIO 03/09/2015 924.00
424223 ORCA PACIFIC INC 03/09/2015 328.34
424224 PACIFIC BOAT TOPS & UPHOLSTERY 03/09/2015 328.50
424225 PACIFIC INTERPRETERS INC 03/09/2015 957.29
424226 PETRO CARD 03/09/2015 3,095.60
424227 PIERCE COLLEGE 03/09/2015 3,687.57
424228 PITNEY BOWES PRESORT SERVICES 03/09/2015 792.58
424229 PREG O'DONNELL & GILLETT PLLC 03/09/2015 5,800.00
424230 PRO STAFF MECHANICAL INC 03/09/2015 235.97
424231 PUGET SOUND ENERGY NAT GAS 03/09/2015 2,725.24
424232 RENTON SCHOOL DISTRICT #403 03/09/2015 8,444.55
424233 RENTON TECHNICAL COLLEGE 03/09/2015 3,745.15
424234 RESCUE ROOTER ARS 03/09/2015 1,768.30
424235 ROCK CHIP GUYS LLC 03/09/2015 344.93
424236 ROSE, KELLY K 03/09/2015 150.00
424237 SCHETKY NW SALES INC 03/09/2015 744.17
424238 SCHOLASTIC CLASSROOM MAGAZINES 03/09/2015 1,600.29
424239 SCHOOL SPECIALTY INC 03/09/2015 239.85
424240 SEATTLE AUTOMOTIVE DISTRIBUTIN 03/09/2015 348.62
424241 SIX ROBBLEES INC 03/09/2015 3,262.97
424242 SMITH & GREENE COMPANY 03/09/2015 2,288.55
424243 SOLIANT HEALTH 03/09/2015 4,387.50
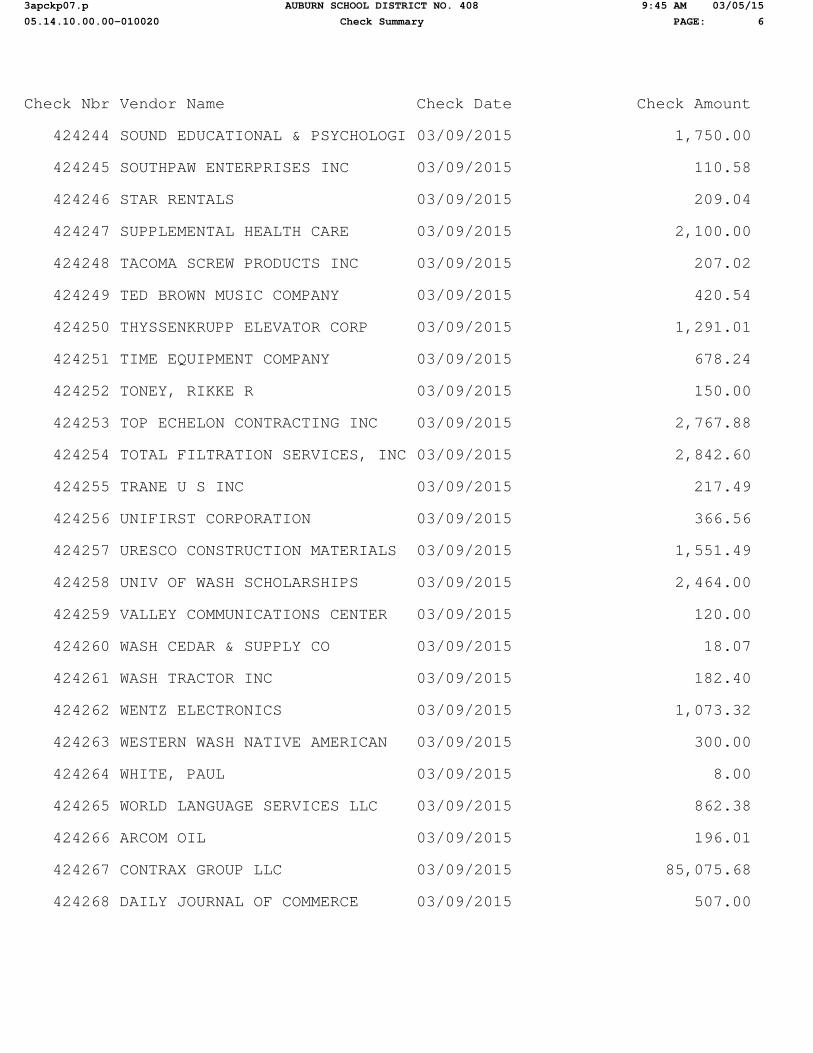
3apckp07.p AUBURN SCHOOL DISTRICT NO. 408 9:45 AM 03/05/15
05.14.10.00.00-010020 Check Summary PAGE: 6
Check Nbr Vendor Name Check Date Check Amount
424244 SOUND EDUCATIONAL & PSYCHOLOGI 03/09/2015 1,750.00
424245 SOUTHPAW ENTERPRISES INC 03/09/2015 110.58
424246 STAR RENTALS 03/09/2015 209.04
424247 SUPPLEMENTAL HEALTH CARE 03/09/2015 2,100.00
424248 TACOMA SCREW PRODUCTS INC 03/09/2015 207.02
424249 TED BROWN MUSIC COMPANY 03/09/2015 420.54
424250 THYSSENKRUPP ELEVATOR CORP 03/09/2015 1,291.01
424251 TIME EQUIPMENT COMPANY 03/09/2015 678.24
424252 TONEY, RIKKE R 03/09/2015 150.00
424253 TOP ECHELON CONTRACTING INC 03/09/2015 2,767.88
424254 TOTAL FILTRATION SERVICES, INC 03/09/2015 2,842.60
424255 TRANE U S INC 03/09/2015 217.49
424256 UNIFIRST CORPORATION 03/09/2015 366.56
424257 URESCO CONSTRUCTION MATERIALS 03/09/2015 1,551.49
424258 UNIV OF WASH SCHOLARSHIPS 03/09/2015 2,464.00
424259 VALLEY COMMUNICATIONS CENTER 03/09/2015 120.00
424260 WASH CEDAR & SUPPLY CO 03/09/2015 18.07
424261 WASH TRACTOR INC 03/09/2015 182.40
424262 WENTZ ELECTRONICS 03/09/2015 1,073.32
424263 WESTERN WASH NATIVE AMERICAN 03/09/2015 300.00
424264 WHITE, PAUL 03/09/2015 8.00
424265 WORLD LANGUAGE SERVICES LLC 03/09/2015 862.38
424266 ARCOM OIL 03/09/2015 196.01
424267 CONTRAX GROUP LLC 03/09/2015 85,075.68
424268 DAILY JOURNAL OF COMMERCE 03/09/2015 507.00

3apckp07.p AUBURN SCHOOL DISTRICT NO. 408 9:45 AM 03/05/15
05.14.10.00.00-010020 Check Summary PAGE: 7
Check Nbr Vendor Name Check Date Check Amount
424269 DELL MARKETING LP % DELL USA L 03/09/2015 2,302.80
424270 HARGIS ENGINEERS INC 03/09/2015 4,602.20
424271 HAYRE MCELROY & ASSOCIATES LLC 03/09/2015 6,489.00
424272 INSLEE BEST DOEZIE & RYDER PS 03/09/2015 7,476.00
424273 JNR SERVICES INC 03/09/2015 1,943.63
424274 KING COUNTY DIRECTORS ASSN 03/09/2015 1,912.97
424275 LUMENAL LIGHTING LLC 03/09/2015 2,655.38
424276 MCKINNEY TRAILERS & CONTAINERS 03/09/2015 284.32
424277 MICRO COMPUTER SYSTEMS INC 03/09/2015 4,935.38
424278 NAC ARCHITECTURE INC 03/09/2015 139,687.42
424279 PBS ENGINEERING & ENVIRONMENTA 03/09/2015 1,210.00
424280 BANK OF NEW YORK MELLON 03/09/2015 54.61
424281 AREA 5 DECA 03/09/2015 1,216.00
424282 BEAUCHAMP, CLAUDETTE 03/09/2015 12.00
424283 BUST A MOVE DJ 03/09/2015 500.00
424284 CAMACHO, MARIELA 03/09/2015 17.00
424285 COSTCO 03/09/2015 2,390.47
424286 DOROBO FUND 03/09/2015 1,437.00
424287 DUGANS INCORPORATED 03/09/2015 377.78
424288 EASTBAY INC 03/09/2015 204.50
424289 EK BEVERAGE COMPANY 03/09/2015 273.50
424290 GAME TIME EVENTS 03/09/2015 100.00
424291 GOSNEY MOTOR PARTS INC 03/09/2015 151.82
424292 GREEN RIVER MUSIC EDUCATORS AS 03/09/2015 190.00
424293 IDEAWORKS NW 03/09/2015 4,632.12

3apckp07.p AUBURN SCHOOL DISTRICT NO. 408 9:45 AM 03/05/15
05.14.10.00.00-010020 Check Summary PAGE: 8
Check Nbr Vendor Name Check Date Check Amount
424294 IMAGE MASTERS INC 03/09/2015 118.26
424295 K D GRAZIE INC 03/09/2015 360.00
424296 KING COUNTY DIRECTORS ASSN 03/09/2015 291.41
424297 KIWANIS INTERNATIONAL FOUNDATI 03/09/2015 173.28
424298 PACIFIC NW BASKETBALL OFFICIAL 03/09/2015 4,872.55
424299 PACIFIC NW THEATRE ASSN INC 03/09/2015 628.86
424300 REGGIE SHOWTIME JONES LLC 03/09/2015 3,000.00
424301 SANDLAND PROMOTIONS 03/09/2015 1,215.45
424302 SEATTLE BOARD GIRLS GYMNASTICS 03/09/2015 229.41
424303 SEATTLE OFFICIALS WOMENS BASKE 03/09/2015 5,440.39
424304 SKILLSUSA WASHINGTON 03/09/2015 120.00
424305 SPECIALTY FROZEN DISTIBUTING 03/09/2015 640.00
424306 TAYLOR PUBLISHING COMPANY 03/09/2015 1,500.00
424307 TIKI PETES HEALTHY TREATS 03/09/2015 333.75
424308 WALMART SAMS CLUB 03/09/2015 637.14
424309 WASH FCCLA 03/09/2015 620.00
424310 WASH INTERSCHOLASTIC ACTIVITIE 03/09/2015 12.50
424311 AUBURN MOUNTAINVIEW H S 03/09/2015 250.00
424312 Vendor Continued Check 03/09/2015 0.00
424313 AUBURN RIVERSIDE H S 03/09/2015 528.00
424314 AUBURN SCHOOL DIST 408 ** 03/09/2015 193.91
424315 AUBURN SENIOR H S 03/09/2015 100.00
424316 AUBURN SENIOR H S 03/09/2015 145.00
424317 CASCADE M S 03/09/2015 50.00
424318 MT BAKER M S 03/09/2015 10.00
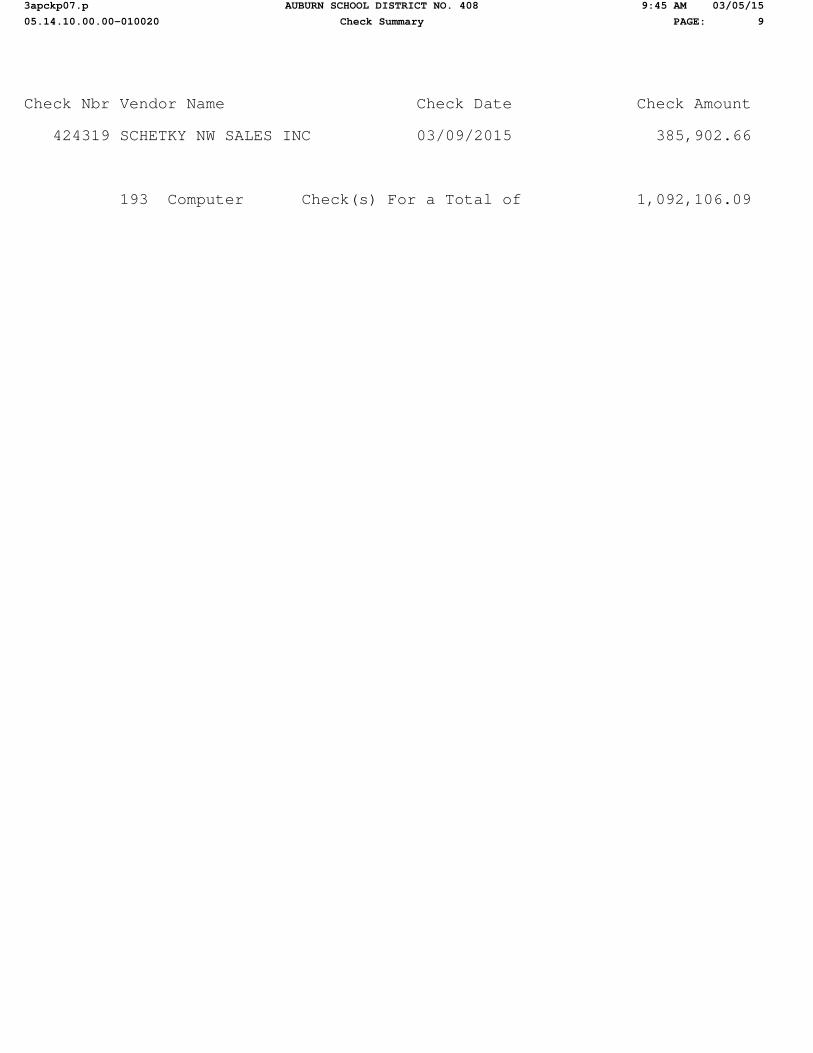
3apckp07.p AUBURN SCHOOL DISTRICT NO. 408 9:45 AM 03/05/15
05.14.10.00.00-010020 Check Summary PAGE: 9
Check Nbr Vendor Name Check Date Check Amount
424319 SCHETKY NW SALES INC 03/09/2015 385,902.66
193 Computer Check(s) For a Total of 1,092,106.09

3apckp07.p AUBURN SCHOOL DISTRICT NO. 408 9:45 AM 03/05/15
05.14.10.00.00-010020 Check Summary PAGE: 10
0 Manual Checks For a Total of 0.00
0 Wire Transfer Checks For a Total of 0.00
0 ACH Checks For a Total of 0.00
193 Computer Checks For a Total of 1,092,106.09
Total For 193 Manual, Wire Tran, ACH & Computer Checks 1,092,106.09
Less 0 Voided Checks For a Total of 0.00
Net Amount 1,092,106.09
F U N D S U M M A R Y
Fund Description Balance Sheet Revenue Expense Total 10 General Fund -97.67 493.25 413,503.35 413,898.9320 Capital Projects 0.00 0.00 259,277.79 259,277.7930 Debt Service Fun 0.00 0.00 54.61 54.6140 ASB Fund 0.00 29.00 31,666.19 31,695.1970 Private Purpose 0.00 0.00 1,276.91 1,276.9190 Transportation V 0.00 0.00 385,902.66 385,902.66
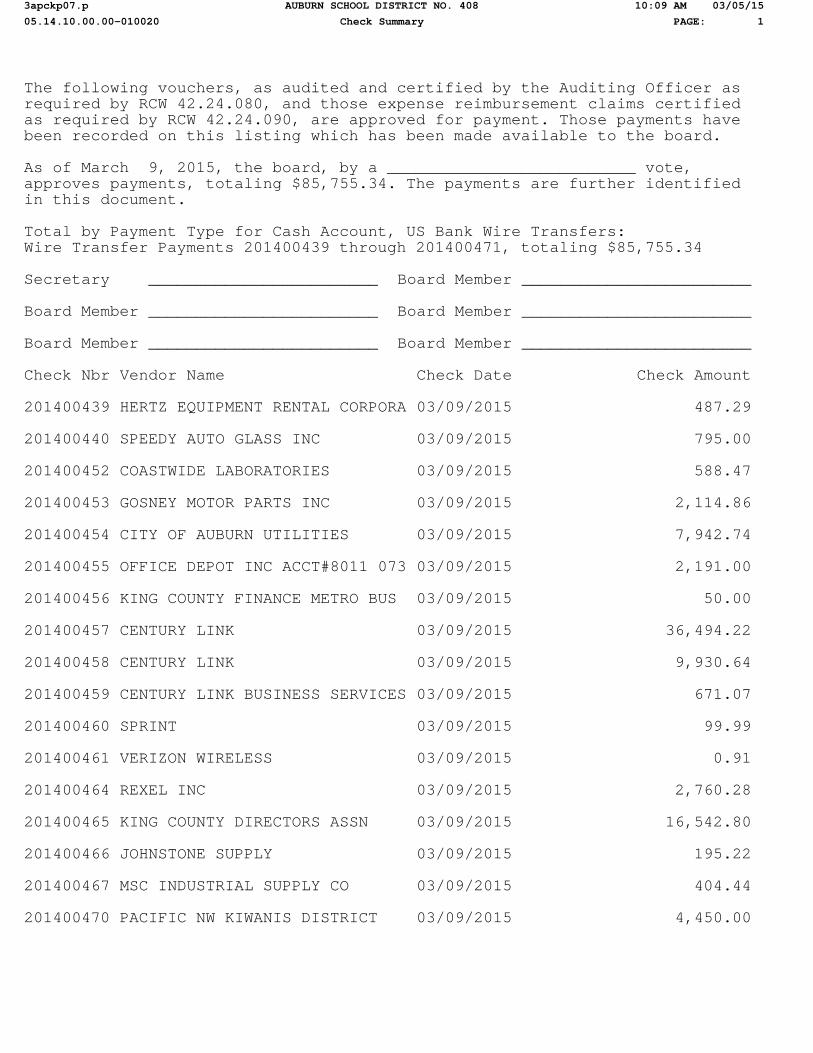
3apckp07.p AUBURN SCHOOL DISTRICT NO. 408 10:09 AM 03/05/15
05.14.10.00.00-010020 Check Summary PAGE: 1
The following vouchers, as audited and certified by the Auditing Officer as required by RCW 42.24.080, and those expense reimbursement claims certified as required by RCW 42.24.090, are approved for payment. Those payments have been recorded on this listing which has been made available to the board.
As of March 9, 2015, the board, by a __________________________ vote, approves payments, totaling $85,755.34. The payments are further identified in this document.
Total by Payment Type for Cash Account, US Bank Wire Transfers: Wire Transfer Payments 201400439 through 201400471, totaling $85,755.34
Secretary ________________________ Board Member ________________________
Board Member ________________________ Board Member ________________________
Board Member ________________________ Board Member ________________________
Check Nbr Vendor Name Check Date Check Amount
201400439 HERTZ EQUIPMENT RENTAL CORPORA 03/09/2015 487.29
201400440 SPEEDY AUTO GLASS INC 03/09/2015 795.00
201400452 COASTWIDE LABORATORIES 03/09/2015 588.47
201400453 GOSNEY MOTOR PARTS INC 03/09/2015 2,114.86
201400454 CITY OF AUBURN UTILITIES 03/09/2015 7,942.74
201400455 OFFICE DEPOT INC ACCT#8011 073 03/09/2015 2,191.00
201400456 KING COUNTY FINANCE METRO BUS 03/09/2015 50.00
201400457 CENTURY LINK 03/09/2015 36,494.22
201400458 CENTURY LINK 03/09/2015 9,930.64
201400459 CENTURY LINK BUSINESS SERVICES 03/09/2015 671.07
201400460 SPRINT 03/09/2015 99.99
201400461 VERIZON WIRELESS 03/09/2015 0.91
201400464 REXEL INC 03/09/2015 2,760.28
201400465 KING COUNTY DIRECTORS ASSN 03/09/2015 16,542.80
201400466 JOHNSTONE SUPPLY 03/09/2015 195.22
201400467 MSC INDUSTRIAL SUPPLY CO 03/09/2015 404.44
201400470 PACIFIC NW KIWANIS DISTRICT 03/09/2015 4,450.00
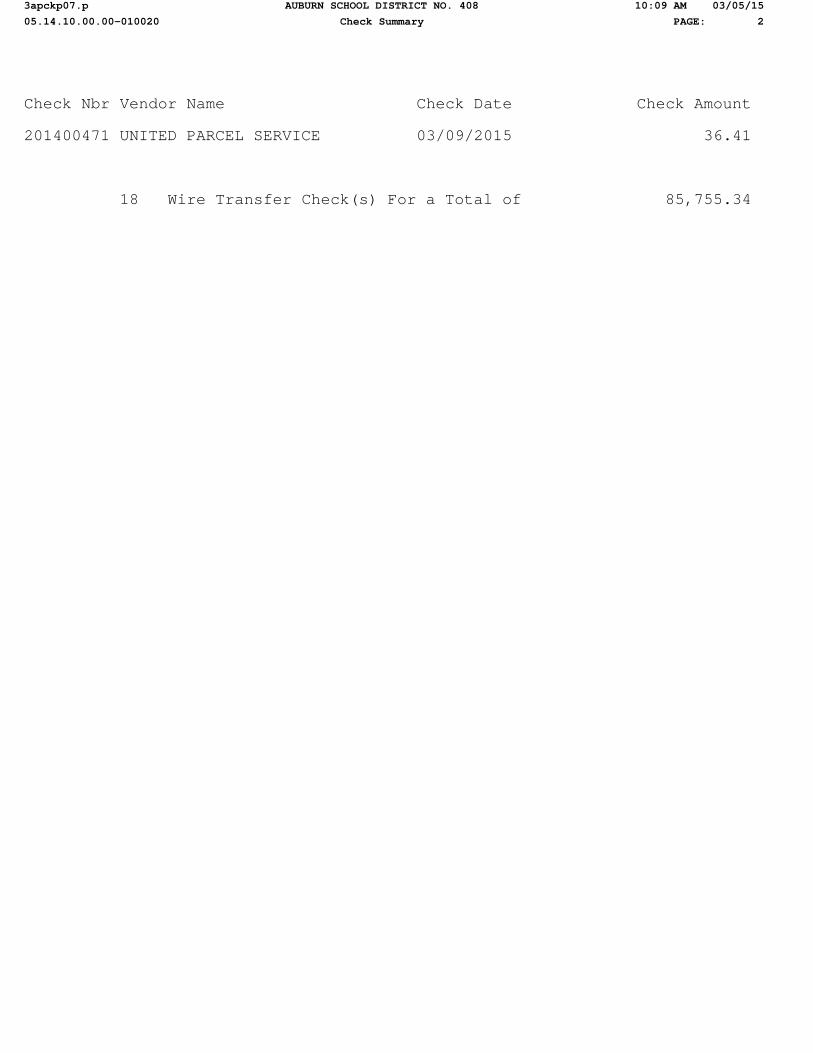
3apckp07.p AUBURN SCHOOL DISTRICT NO. 408 10:09 AM 03/05/15
05.14.10.00.00-010020 Check Summary PAGE: 2
Check Nbr Vendor Name Check Date Check Amount
201400471 UNITED PARCEL SERVICE 03/09/2015 36.41
18 Wire Transfer Check(s) For a Total of 85,755.34

3apckp07.p AUBURN SCHOOL DISTRICT NO. 408 10:09 AM 03/05/15
05.14.10.00.00-010020 Check Summary PAGE: 3
0 Manual Checks For a Total of 0.00
18 Wire Transfer Checks For a Total of 85,755.34
0 ACH Checks For a Total of 0.00
0 Computer Checks For a Total of 0.00
Total For 18 Manual, Wire Tran, ACH & Computer Checks 85,755.34
Less 0 Voided Checks For a Total of 0.00
Net Amount 85,755.34
F U N D S U M M A R Y
Fund Description Balance Sheet Revenue Expense Total 10 General Fund 15,237.46 0.00 66,067.88 81,305.3440 ASB Fund 0.00 0.00 4,450.00 4,450.00

3apckp07.p AUBURN SCHOOL DISTRICT NO. 408 10:15 AM 03/05/15
05.14.10.00.00-010020 Check Summary PAGE: 1
The following vouchers, as audited and certified by the Auditing Officer as required by RCW 42.24.080, and those expense reimbursement claims certified as required by RCW 42.24.090, are approved for payment. Those payments have been recorded on this listing which has been made available to the board.
As of March 9, 2015, the board, by a __________________________ vote, approves payments, totaling $1,996,832.05. The payments are further identified in this document.
Total by Payment Type for Cash Account, AP Direct Dep Settlement Accou: ACH Numbers 141501350 through 141501453, totaling $1,996,832.05
Secretary ________________________ Board Member ________________________
Board Member ________________________ Board Member ________________________
Board Member ________________________ Board Member ________________________
Check Nbr Vendor Name Check Date Check Amount
141501350 ABOVE AND BEYOND LEARNING INC 03/09/2015 378.52
141501351 ACUNA, ANDREA LOUISE 03/09/2015 94.92
141501352 ARNZEN, KAREN E 03/09/2015 16.39
141501353 AUBURN SCHOOL DIST REVOLVING F 03/09/2015 2,154.82
141501354 BARKER, CAROL JEAN 03/09/2015 87.17
141501355 BARNETT, CAROL ANN 03/09/2015 50.34
141501356 BENSHOOF, KELLY ANN 03/09/2015 17.88
141501357 BERG, BARBARA DIANE 03/09/2015 95.91
141501358 BLANSFIELD, CYNTHIA RENEE 03/09/2015 95.45
141501359 BLOOM, JANET M 03/09/2015 50.00
141501360 BOCK, CHRISTINA MARIE 03/09/2015 69.81
141501361 BRENNAN, TRACY L 03/09/2015 500.00
141501362 BROWN, GREGORY S 03/09/2015 65.78
141501363 BUCHANAN, STACEY J 03/09/2015 50.00
141501364 CAMPBELL-AIKENS, JANIS GAIL 03/09/2015 7.98
141501365 CARVER, LINDA ANNE 03/09/2015 50.00
141501366 CASTRO-ACOSTA, ILEANA 03/09/2015 63.49

3apckp07.p AUBURN SCHOOL DISTRICT NO. 408 10:15 AM 03/05/15
05.14.10.00.00-010020 Check Summary PAGE: 2
Check Nbr Vendor Name Check Date Check Amount
141501367 CHASE, JANINE IKUE 03/09/2015 41.67
141501368 CLOUSER, JENNIFER LYNN 03/09/2015 11.62
141501369 COHEN, LAURA 03/09/2015 50.00
141501370 COLBURN, SALLY ANNE 03/09/2015 297.27
141501371 CONNORS, LISA 03/09/2015 325.00
141501372 CUMBERLAND THERAPY SERVICES LL 03/09/2015 5,100.00
141501373 DAHLSTEDT, LISA JAN 03/09/2015 11.10
141501374 DAMIANO, ALEXANDRA JAYLAN 03/09/2015 19.68
141501375 DIEBAG, JAMES J 03/09/2015 33.00
141501376 DRAKE, MICHELLE P 03/09/2015 500.00
141501377 DUBAY, STEVEN RICHARD 03/09/2015 908.00
141501378 EDWARDS, ELIZABETH ANN 03/09/2015 7.75
141501379 FAWVER, RICHARD ALLEN 03/09/2015 42.21
141501380 FOOD SERVICES OF AMERICA 03/09/2015 14.14
141501381 FOOD SERVICES OF AMERICA ** 03/09/2015 9,601.52
141501382 Vendor Continued Check 03/09/2015 0.00
141501383 Vendor Continued Check 03/09/2015 0.00
141501384 FOOD SERVICES OF AMERICA *** 03/09/2015 22,902.03
141501385 FORTE, RHONDA MICHELLE 03/09/2015 150.50
141501386 GALATI, ELIZABETH ANN 03/09/2015 500.00
141501387 GLENISKY, STEPHANIE MICHELLE 03/09/2015 500.00
141501388 HALES, KYM MICHELE 03/09/2015 127.54
141501389 HOLLOMAN, LEONARD E 03/09/2015 103.33
141501390 JONES, RANDAL STEVEN 03/09/2015 54.57
141501391 Vendor Continued Check 03/09/2015 0.00

3apckp07.p AUBURN SCHOOL DISTRICT NO. 408 10:15 AM 03/05/15
05.14.10.00.00-010020 Check Summary PAGE: 3
Check Nbr Vendor Name Check Date Check Amount
141501392 KELEHER, MANDY 03/09/2015 47.61
141501393 KILLIAN, MARCI J 03/09/2015 24.15
141501394 KIM, DAN-BY ARAM 03/09/2015 69.90
141501395 KINKELA, MERILEE 03/09/2015 37.38
141501396 KUKORS, JAAPJE A 03/09/2015 29.34
141501397 LAM, TAN VAN 03/09/2015 17.60
141501398 MANCHIK, CHRISTINA JESSICA 03/09/2015 200.00
141501399 MARRERO BURGOS, ZAYRA ENID 03/09/2015 680.00
141501400 MASON, JERI LYNN 03/09/2015 73.33
141501401 MCCAUSLAND, ANGELA KARON 03/09/2015 10.88
141501402 MCGRAW, JODI LEA 03/09/2015 48.96
141501403 MENTINK, JUSTIN W 03/09/2015 328.90
141501404 MITCHELL, CYNTHIA A 03/09/2015 42.95
141501405 MORGAN, CHELSEY 03/09/2015 79.49
141501406 MORRIS, MICHELE A 03/09/2015 5.00
141501407 MORROW, LUCINA A 03/09/2015 50.00
141501408 MULICK, PATRICK JAMES 03/09/2015 42.38
141501409 MUXEN, ASHLEA RAE 03/09/2015 136.75
141501410 MUXEN, MATTHEW A 03/09/2015 153.00
141501411 ROBINSON, CHRISTINE ELAINE 03/09/2015 87.99
141501412 SAMUELSON, JENNIFER M 03/09/2015 36.97
141501413 SAXON, JAN K 03/09/2015 54.46
141501414 STENSON, RIKKI 03/09/2015 225.00
141501415 SUNBELT STAFFING LLC 03/09/2015 5,625.00
141501416 SWANSON, DARLENE RENEE 03/09/2015 12.02

3apckp07.p AUBURN SCHOOL DISTRICT NO. 408 10:15 AM 03/05/15
05.14.10.00.00-010020 Check Summary PAGE: 4
Check Nbr Vendor Name Check Date Check Amount
141501417 SYLVAN LEARNING CENTER 03/09/2015 3,498.00
141501418 TECHNOLOGY EXPRESS 03/09/2015 920.90
141501419 TURNER, MEGAN DENISE 03/09/2015 56.24
141501420 Vendor Continued Check 03/09/2015 0.00
141501421 US BANK CORP PAYMENT SYSTEMS P 03/09/2015 64,830.67
141501422 Vendor Continued Check 03/09/2015 0.00
141501423 US BANK CORP PAYMENT SYSTEM TR 03/09/2015 8,713.56
141501424 US BANK CTE PCARDS 03/09/2015 6,132.03
141501425 WAGNER, VICKI 03/09/2015 173.00
141501426 WILLIAMSON, DAVID M 03/09/2015 50.00
141501427 LYDIG CONSTRUCTION INC 03/09/2015 1,819,710.51
141501428 US BANK CORP PAYMENT SYSTEMS P 03/09/2015 3,350.85
141501429 AUBURN SENIOR HIGH IMPREST 03/09/2015 765.00
141501430 BALL, KATHERINE A 03/09/2015 89.19
141501431 BARTELT, JEANINE 03/09/2015 10.95
141501432 BOWLER, DONNA LOU VON 03/09/2015 571.76
141501433 BRYANT, VALERIE ELTON 03/09/2015 21.36
141501434 CHAR, JAMES A 03/09/2015 95.56
141501435 CLARK, ROBIN F 03/09/2015 45.96
141501436 CUGHAN, JOSEPH DANIEL 03/09/2015 14.45
141501437 FAGER, ELSA TOPACIO 03/09/2015 152.21
141501438 Vendor Continued Check 03/09/2015 0.00
141501439 FOOD SERVICES OF AMERICA 03/09/2015 2,100.97
141501440 HOGG, ELAINE M 03/09/2015 9.57
141501441 JONES, ROBERT CHARLES 03/09/2015 20.03

3apckp07.p AUBURN SCHOOL DISTRICT NO. 408 10:15 AM 03/05/15
05.14.10.00.00-010020 Check Summary PAGE: 5
Check Nbr Vendor Name Check Date Check Amount
141501442 KNAPP, BARBARA JEAN 03/09/2015 58.23
141501443 MASON, JERI LYNN 03/09/2015 65.81
141501444 PIZZA TIME 03/09/2015 1,229.73
141501445 SAARENAS, ROBYN NEIGEL 03/09/2015 262.74
141501446 SCARLETT, ARDITH ELAINE 03/09/2015 125.00
141501447 Vendor Continued Check 03/09/2015 0.00
141501448 US BANK CORP PAYMENT SYSTEMS P 03/09/2015 19,815.59
141501449 US BANK CORP PAYMENT SYSTEM TR 03/09/2015 9,521.61
141501450 VAN EATON, MICHAEL 03/09/2015 12.32
141501451 WAKEFIELD, REINA MASUDA 03/09/2015 417.68
141501452 WAY, PHILLIP R 03/09/2015 109.35
141501453 WILLSON, JENNIFER L 03/09/2015 612.77
104 ACH Check(s) For a Total of 1,996,832.05

3apckp07.p AUBURN SCHOOL DISTRICT NO. 408 10:15 AM 03/05/15
05.14.10.00.00-010020 Check Summary PAGE: 6
0 Manual Checks For a Total of 0.00
0 Wire Transfer Checks For a Total of 0.00
104 ACH Checks For a Total of 1,996,832.05
0 Computer Checks For a Total of 0.00
Total For 104 Manual, Wire Tran, ACH & Computer Checks 1,996,832.05
Less 0 Voided Checks For a Total of 0.00
Net Amount 1,996,832.05
F U N D S U M M A R Y
Fund Description Balance Sheet Revenue Expense Total 10 General Fund 3,949.60 5.00 133,688.25 137,642.8520 Capital Projects 0.00 0.00 1,823,061.36 1,823,061.3640 ASB Fund -114.53 0.00 36,242.37 36,127.84

3apckp07.p AUBURN SCHOOL DISTRICT NO. 408 10:40 AM 03/05/15
05.14.10.00.00-010020 Check Summary PAGE: 1
The following vouchers, as audited and certified by the Auditing Officer as required by RCW 42.24.080, and those expense reimbursement claims certified as required by RCW 42.24.090, are approved for payment. Those payments have been recorded on this listing which has been made available to the board.
As of March 9, 2015, the board, by a __________________________ vote, approves payments, totaling $1,547.97. The payments are further identified in this document.
Total by Payment Type for Cash Account, AP Direct Dep Settlement Accou: ACH Numbers 141501454 through 141501456, totaling $1,547.97
Secretary ________________________ Board Member ________________________
Board Member ________________________ Board Member ________________________
Board Member ________________________ Board Member ________________________
Check Nbr Vendor Name Check Date Check Amount
141501454 DEPT OF REVENUE STATE OF WASH 03/09/2015 983.55
141501455 DEPT OF REVENUE STATE OF WASH 03/09/2015 277.42
141501456 DEPT OF REVENUE STATE OF WASH 03/09/2015 287.00
3 ACH Check(s) For a Total of 1,547.97

3apckp07.p AUBURN SCHOOL DISTRICT NO. 408 10:40 AM 03/05/15
05.14.10.00.00-010020 Check Summary PAGE: 2
0 Manual Checks For a Total of 0.00
0 Wire Transfer Checks For a Total of 0.00
3 ACH Checks For a Total of 1,547.97
0 Computer Checks For a Total of 0.00
Total For 3 Manual, Wire Tran, ACH & Computer Checks 1,547.97
Less 0 Voided Checks For a Total of 0.00
Net Amount 1,547.97
F U N D S U M M A R Y
Fund Description Balance Sheet Revenue Expense Total 10 General Fund 983.55 0.00 0.00 983.5520 Capital Projects 277.42 0.00 0.00 277.4240 ASB Fund 287.00 0.00 0.00 287.00

March 9, 2015 Page 9
DIRECTORS 1. Approval of Minutes
The minutes of the regular meeting of Monday, February 23, have been forwarded to the board.
Recommendation: That the minutes be approved. 2. Discussion The State Board of Education is having a community forum March 11-12 in
Tacoma. Director Vefik is available to attend the meeting. Would the board like to suggest comments that he could share with the State Board?
3. Executive Session

March 9, 2015 Page 10
INFORMATION
1. The Monday, March 2, enrollment is included in the board background material.

ASD HEADCOUNT SUMMARY DATE: 3/2/15 ELEM
ELEMENTARY PRE SCH K-5 TOTALS SCH TOTALSSCHOOLS Sec No. Sec No. Sec No. Sec No. Sec No. Sec No. Sec No. Sec No. Sec No. Sec No.
ALPAC (ECE) 4.0 33 REG 4.0 95 -- -- 4.0 89 4.5 103 2.5 64 3.0 84 3.0 77 21.0 512 21.0 512 (ECEAP) 2.0 18 SPED -- -- -- -- -- -- -- -- -- -- -- -- -- -- 0.0 0ARTHUR JACOBSEN -- -- REG -- -- 3.0 74 4.0 100 4.0 100 4.0 100 4.0 108 3.0 99 22.0 581 24.0 603 -- -- SPED -- -- * 2 * 1 1.0 5 * 5 * 4 1.0 5 2.0 22CHINOOK (ECE) 2.0 33 REG 3.0 53 -- -- 4.0 69 3.0 59 3.0 66 2.0 53 2.0 46 17.0 346 20.0 378 -- -- SPED 1.0 8 -- -- * 5 1.0 3 * 4 1.0 7 * 5 3.0 32DICK SCOBEE (ECE) 4.0 22 REG 4.0 111 -- -- 4.0 95 3.5 88 3.5 88 3.0 72 2.0 66 20.0 520 20.0 520
-- -- SPED -- -- -- -- -- -- -- -- -- -- -- -- -- -- 0.0 0EVER HTS -- -- REG 5.0 105 -- -- 4.0 96 3.5 82 3.5 95 3.0 80 3.0 82 22.0 540 22.0 540 -- -- SPED -- -- -- -- -- -- -- -- -- -- -- -- -- -- 0.0 0GILDO REY (ECE) 2.0 17 REG 5.0 117 -- -- 5.0 98 4.5 102 3.5 93 4.0 103 2.0 64 24.0 577 24.0 577
-- -- SPED -- -- -- -- -- -- -- -- -- -- -- -- -- -- 0.0 0HAZELWOOD -- -- REG -- -- 4.0 88 4.0 97 4.0 93 3.5 88 4.5 108 4.0 110 24.0 584 24.0 584
-- -- SPED -- -- -- -- -- -- -- -- -- -- -- -- -- -- 0.0 0ILALKO -- -- REG 4.0 108 -- -- 4.0 105 4.0 101 4.0 103 4.0 107 4.0 111 24.0 635 25.0 641 -- -- SPED -- -- -- -- -- -- -- -- -- -- * 1 1.0 5 1.0 6LAKE VIEW (ECE) 2.0 15 REG -- -- 2.0 53 3.0 64 3.0 67 3.0 64 2.0 47 2.0 61 15.0 356 17.0 370 -- -- SPED -- -- 1.0 8 * 1 1.0 2 * 1 * 1 * 1 2.0 14LAKELAND -- -- REG -- -- 5.0 110 4.5 107 5.5 119 5.0 125 4.0 104 4.0 110 28.0 675 28.0 675 -- -- SPED -- -- -- -- -- -- -- -- -- -- -- -- -- -- 0.0 0LEA HILL (HDST) 2.0 38 REG 4.0 79 -- -- 3.0 57 3.0 62 3.0 62 1.5 44 2.5 62 17.0 366 19.0 381 (ECE) 6.0 37 SPED * 1 -- -- 1.0 3 * 3 * 2 * 3 1.0 3 2.0 15PIONEER (HDST) 4.0 75 REG 4.0 101 -- -- 4.0 84 4.0 85 2.5 65 2.5 69 3.0 82 20.0 486 20.0 486 -- -- SPED -- -- -- -- -- -- -- -- -- -- -- -- -- -- 0.0 0TERMINAL PARK (ECEAP) 2.0 18 REG 3.0 66 -- -- 3.0 73 2.5 55 2.5 54 2.0 54 2.0 53 15.0 355 17.0 405
(ECE) 1.0 7 STEP -- -- -- -- -- -- -- -- -- -- 1.0 25 1.0 25 2.0 50 -- -- SPED -- -- -- -- -- -- -- -- -- -- -- -- -- -- 0.0 0
WASHINGTON -- -- REG 4.0 75 -- -- 4.0 91 3.5 75 2.5 60 3.0 75 2.0 58 19.0 434 21.0 457 -- -- SPED * 5 -- -- 1.0 7 * 3 * 4 1.0 3 * 1 2.0 23 Elem
ECE 21.0 164 41.0 924 15.0 335 56.5 1242 55.5 1207 46.0 1143 45.5 1152 42.5 1126 290.0 7017 302.0 7129 SchoolECEAP 4.0 36 12.0 112 302.0 7129 Total
HDST 6.0 113
MIDDLE SCHOOLS Grd 6 Grd 7 Grd 8 SCH TOTALS SR HIGH SCHOOLS Grd 9Grd 10 Grd 11 Grd 12 SCH TOTALSCASCADE REG 209 208 225 642 AUBURN REG 361 312 309 250 1232MID SCHOOL SPED 33 27 37 97 SR HIGH SCHOOL SPED 53 54 41 85 233
total 242 235 262 739 FTRS 9 30 39MT. BAKER REG 276 302 282 860 total 414 366 359 365 1504MID SCHOOL SPED 27 17 25 69 AUBURN REG 357 336 310 324 1327
total 303 319 307 929 MOUNTAINVIEW SPED 17 26 23 22 88OLYMPIC REG 199 217 175 591 HIGH SCHOOL FTRS 21 41 62MID SCHOOL SPED 31 31 44 106 total 374 362 354 387 1477
total 230 248 219 697 REG 438 343 340 310 1431RAINIER REG 267 266 289 822 RIVERSIDE SPED 21 28 36 26 111MID SCHOOL SPED 23 23 29 75 HIGH SCHOOL FTRS 14 39 53
total 290 289 318 897 total 459 371 390 375 1595 WEST AUBURN REG 29 30 57 105 221
TOTALS REG 951 993 971 2915 3262 Mid SPED 2 1 8 8 19BY SPED 114 98 135 347 Schl FTRS 1 1
GRADE all 1065 1091 1106 3262 Total AWG 2 7 7 13 29total 33 38 72 127 270
SR HIGH REG 1185 1021 1016 989 4211 3249 HighTOTALS SPED 93 109 108 141 451 Schl
FTRS 0 0 44 111 155 TotalAWG 2 7 7 13 29 Total
DISTRICT TOTALS - EARLY LEARNING BY GRADE all 1280 1137 1175 1254 4846ECE
Sept. 2014 97 113 35 245 DISTRICT TOTALS BY GRADE GROUP w/ comparisonscurrent 113 164 36 313 K - 5 6-8 9-12 TOTAL
difference 16 51 1 68 proj 10/1/14 6979 3256 4874 15109current 7129 3262 4846 15237
difference 150 6 -28 128
ELEM TOTBY GRADE
State Funded FD Kinder Grade 3Grade 2 Grade 4 Grade 5
AUBURN
K - 5 TOTAL
Headstart ECEAP TOTAL
ExtDay Kindergarten Grade 1
HIGH SCHOOL
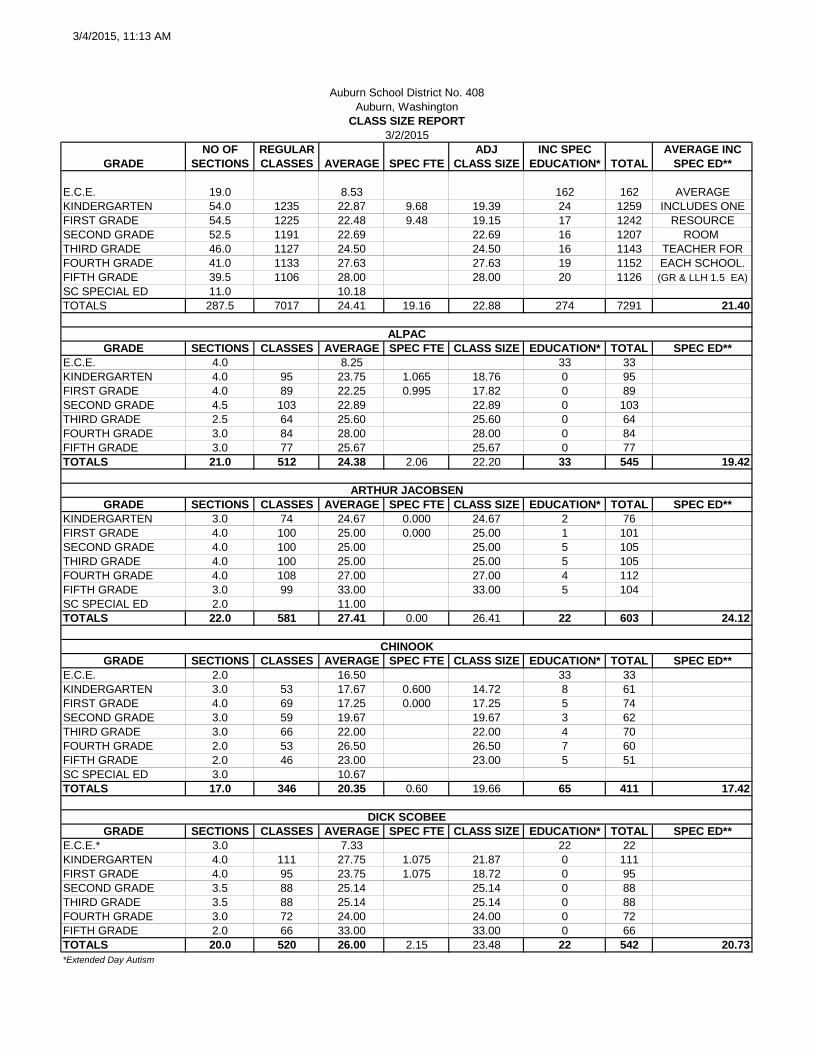
3/4/2015, 11:13 AM
NO OF REGULAR ADJ INC SPEC AVERAGE INCGRADE SECTIONS CLASSES AVERAGE SPEC FTE CLASS SIZE EDUCATION* TOTAL SPEC ED**
E.C.E. 19.0 8.53 162 162 AVERAGEKINDERGARTEN 54.0 1235 22.87 9.68 19.39 24 1259 INCLUDES ONEFIRST GRADE 54.5 1225 22.48 9.48 19.15 17 1242 RESOURCESECOND GRADE 52.5 1191 22.69 22.69 16 1207 ROOM THIRD GRADE 46.0 1127 24.50 24.50 16 1143 TEACHER FORFOURTH GRADE 41.0 1133 27.63 27.63 19 1152 EACH SCHOOL.FIFTH GRADE 39.5 1106 28.00 28.00 20 1126 (GR & LLH 1.5 EA)SC SPECIAL ED 11.0 10.18TOTALS 287.5 7017 24.41 19.16 22.88 274 7291 21.40
GRADE SECTIONS CLASSES AVERAGE SPEC FTE CLASS SIZE EDUCATION* TOTAL SPEC ED**E.C.E. 4.0 8.25 33 33KINDERGARTEN 4.0 95 23.75 1.065 18.76 0 95FIRST GRADE 4.0 89 22.25 0.995 17.82 0 89SECOND GRADE 4.5 103 22.89 22.89 0 103THIRD GRADE 2.5 64 25.60 25.60 0 64FOURTH GRADE 3.0 84 28.00 28.00 0 84FIFTH GRADE 3.0 77 25.67 25.67 0 77TOTALS 21.0 512 24.38 2.06 22.20 33 545 19.42
GRADE SECTIONS CLASSES AVERAGE SPEC FTE CLASS SIZE EDUCATION* TOTAL SPEC ED**KINDERGARTEN 3.0 74 24.67 0.000 24.67 2 76FIRST GRADE 4.0 100 25.00 0.000 25.00 1 101SECOND GRADE 4.0 100 25.00 25.00 5 105THIRD GRADE 4.0 100 25.00 25.00 5 105FOURTH GRADE 4.0 108 27.00 27.00 4 112FIFTH GRADE 3.0 99 33.00 33.00 5 104SC SPECIAL ED 2.0 11.00TOTALS 22.0 581 27.41 0.00 26.41 22 603 24.12
GRADE SECTIONS CLASSES AVERAGE SPEC FTE CLASS SIZE EDUCATION* TOTAL SPEC ED**E.C.E. 2.0 16.50 33 33KINDERGARTEN 3.0 53 17.67 0.600 14.72 8 61FIRST GRADE 4.0 69 17.25 0.000 17.25 5 74SECOND GRADE 3.0 59 19.67 19.67 3 62THIRD GRADE 3.0 66 22.00 22.00 4 70FOURTH GRADE 2.0 53 26.50 26.50 7 60FIFTH GRADE 2.0 46 23.00 23.00 5 51SC SPECIAL ED 3.0 10.67TOTALS 17.0 346 20.35 0.60 19.66 65 411 17.42
GRADE SECTIONS CLASSES AVERAGE SPEC FTE CLASS SIZE EDUCATION* TOTAL SPEC ED**E.C.E.* 3.0 7.33 22 22KINDERGARTEN 4.0 111 27.75 1.075 21.87 0 111FIRST GRADE 4.0 95 23.75 1.075 18.72 0 95SECOND GRADE 3.5 88 25.14 25.14 0 88THIRD GRADE 3.5 88 25.14 25.14 0 88FOURTH GRADE 3.0 72 24.00 24.00 0 72FIFTH GRADE 2.0 66 33.00 33.00 0 66TOTALS 20.0 520 26.00 2.15 23.48 22 542 20.73*Extended Day Autism
3/2/2015
Auburn School District No. 408Auburn, Washington
CLASS SIZE REPORT
ALPAC
ARTHUR JACOBSEN
CHINOOK
DICK SCOBEE

3/4/2015, 11:13 AM
NO OF REGULAR ADJ INC SPEC AVERAGE INCGRADE SECTIONS CLASSES AVERAGE SPEC FTE CLASS SIZE EDUCATION* TOTAL SPEC ED**
GRADE SECTIONS CLASSES AVERAGE SPEC FTE CLASS SIZE EDUCATION* TOTAL SPEC ED**KINDERGARTEN 5.0 105 21.00 0.850 17.95 0 105FIRST GRADE 4.0 96 24.00 0.726 20.31 0 96SECOND GRADE 3.5 82 23.43 23.43 0 82THIRD GRADE 3.5 95 27.14 27.14 0 95FOURTH GRADE 3.0 80 26.67 26.67 0 80FIFTH GRADE 3.0 82 27.33 27.33 0 82TOTALS 22.0 540 24.55 1.58 22.90 0 540 21.97
GRADE SECTIONS CLASSES AVERAGE SPEC FTE CLASS SIZE EDUCATION* TOTAL SPEC ED**E.C.E. 2.0 8.50 17 17KINDERGARTEN 5.0 117 23.40 1.130 19.09 0 117FIRST GRADE 5.0 98 19.60 0.940 16.50 0 98SECOND GRADE 4.5 102 22.67 22.67 0 102THIRD GRADE 3.5 93 26.57 26.57 0 93FOURTH GRADE 4.0 103 25.75 25.75 0 103FIFTH GRADE 2.0 64 32.00 32.00 0 64TOTALS 24.0 577 24.04 2.07 22.13 17 594 20.09
GRADE SECTIONS CLASSES AVERAGE SPEC FTE CLASS SIZE EDUCATION* TOTAL SPEC ED**KINDERGARTEN 4.0 88 22.00 0.500 19.56 0 88FIRST GRADE 4.0 97 24.25 0.400 22.05 0 97SECOND GRADE 4.0 93 23.25 23.25 0 93THIRD GRADE 3.5 88 25.14 25.14 0 88FOURTH GRADE 4.5 108 24.00 24.00 0 108FIFTH GRADE 4.0 110 27.50 27.50 0 110TOTALS 24.0 584 24.33 0.90 23.45 0 584 22.55
GRADE SECTIONS CLASSES AVERAGE SPEC FTE CLASS SIZE EDUCATION* TOTAL SPEC ED**KINDERGARTEN 4.0 108 27.00 0.500 24.00 0 108FIRST GRADE 4.0 105 26.25 0.400 23.86 0 105SECOND GRADE 4.0 101 25.25 25.25 0 101THIRD GRADE 4.0 103 25.75 25.75 0 103FOURTH GRADE 4.0 107 26.75 26.75 1 108FIFTH GRADE 4.0 111 27.75 27.75 5 116SC SPECIAL ED 1.0 0.00TOTALS 24.0 635 26.71 0.90 25.50 6 641 23.83
GRADE SECTIONS CLASSES AVERAGE SPEC FTE CLASS SIZE EDUCATION* TOTAL SPEC ED**E.C.E. 2.0 7.50 15 15KINDERGARTEN 2.0 53 26.50 0.200 24.09 8 61FIRST GRADE 3.0 64 21.33 0.466 18.47 1 65SECOND GRADE 3.0 67 22.33 22.33 2 69THIRD GRADE 3.0 64 21.33 21.33 1 65FOURTH GRADE 2.0 47 23.50 23.50 1 48FIFTH GRADE 2.0 61 30.50 30.50 1 62SC SPECIAL ED 2.0 7.00TOTALS 15.0 356 23.73 0.67 22.72 29 385 18.63
HAZELWOOD
ILALKO
LAKE VIEW
EVERGREEN HEIGHTS
GILDO REY

3/4/2015, 11:13 AM
NO OF REGULAR ADJ INC SPEC AVERAGE INCGRADE SECTIONS CLASSES AVERAGE SPEC FTE CLASS SIZE EDUCATION* TOTAL SPEC ED**
GRADE SECTIONS CLASSES AVERAGE SPEC FTE CLASS SIZE EDUCATION* TOTAL SPEC ED**KINDERGARTEN 5.0 110 22.00 0.186 21.21 0 110FIRST GRADE 4.5 107 23.78 1.303 18.44 0 107SECOND GRADE 5.5 119 21.64 21.64 0 119THIRD GRADE 5.0 125 25.00 25.00 0 125FOURTH GRADE 4.0 104 26.00 26.00 0 104FIFTH GRADE 4.0 110 27.50 27.50 0 110TOTALS 28.0 675 24.11 1.49 22.89 0 675 21.78
GRADE SECTIONS CLASSES AVERAGE SPEC FTE CLASS SIZE EDUCATION* TOTAL SPEC ED**E.C.E.* 5.0 7.40 37 37KINDERGARTEN 4.0 79 19.75 0.796 16.47 1 80FIRST GRADE 3.0 57 19.00 0.796 15.02 3 60SECOND GRADE 3.0 62 20.67 20.67 3 65THIRD GRADE 3.0 62 20.67 20.67 2 64FOURTH GRADE 1.5 44 29.33 29.33 3 47FIFTH GRADE 2.5 62 24.80 24.80 3 65AB SPECIAL ED 1.0 15.00TOTALS 17.0 366 21.53 1.59 19.69 52 418 16.33*Extended Day Autism
GRADE SECTIONS CLASSES AVERAGE SPEC FTE CLASS SIZE EDUCATION* TOTAL SPEC ED**KINDERGARTEN 4.0 101 25.25 0.990 20.24 0 101FIRST GRADE 4.0 84 21.00 0.790 17.54 0 84SECOND GRADE 4.0 85 21.25 21.25 0 85THIRD GRADE 2.5 65 26.00 26.00 0 65FOURTH GRADE 2.5 69 27.60 27.60 0 69FIFTH GRADE 3.0 82 27.33 27.33 0 82TOTALS 20.0 486 24.30 1.78 22.31 0 486 21.33
GRADE SECTIONS CLASSES AVERAGE SPEC FTE CLASS SIZE EDUCATION* TOTAL SPEC ED**E.C.E.* 1.0 5.00 5 5KINDERGARTEN 3.0 66 22.00 0.800 17.37 0 66FIRST GRADE 3.0 73 24.33 0.800 19.21 0 73SECOND GRADE 2.5 55 22.00 22.00 0 55THIRD GRADE 2.5 54 21.60 21.60 0 54FOURTH GR GIFTED 1.0 25 25.00 25.00 0 25FOURTH GRADE 2.0 54 27.00 27.00 0 54FIFTH GR GIFTED 1.0 25 25.00 25.00 0 25FIFTH GRADE 2.0 53 26.50 26.50 0 53TOTALS 17.0 405 24.12 1.60 21.77 5 410 20.92
GRADE SECTIONS CLASSES AVERAGE SPEC FTE CLASS SIZE EDUCATION* TOTAL SPEC ED**KINDERGARTEN 4.0 75 18.75 0.990 15.03 5 80FIRST GRADE 4.0 91 22.75 0.790 19.00 7 98SECOND GRADE 3.5 75 21.43 21.43 3 78THIRD GRADE 2.5 60 24.00 24.00 4 64FOURTH GRADE 3.0 75 25.00 25.00 3 78FIFTH GRADE 2.0 58 29.00 29.00 1 59SC SPECIAL ED 2.0 11.50TOTALS 19.0 434 21.32 1.78 20.89 23 457 19.22
(Each Elementary has 1.0 FTE Resource / Gildo Rey & Lakeland have 1.5 Each)
TERMINAL PARK
WASHINGTON
LAKELAND HILLS
LEA HILL
PIONEER

March 2 2015 ELL CountRow Labels Count of Student Full NameALPAC ELEMENTARY SCHOOL 118ARTHUR JACOBSEN ELEMENTARY 129AUBURN MOUNTAINVIEW H. S. 60AUBURN RIVERSIDE HIGH SCHOOL 68AUBURN SENIOR HIGH SCHOOL 93CASCADE MIDDLE SCHOOL 76CHINOOK ELEMENTARY SCHOOL 98DICK SCOBEE ELEMENTARY SCHOOL 135EVERGREEN HEIGHTS ELEMENTARY 126GILDO REY ELEMENTARY SCHOOL 247HAZELWOOD ELEMENTARY SCHOOL 144ILALKO ELEMENTARY SCHOOL 138LAKE VIEW ELEMENTARY SCHOOL 38LAKELAND HILLS ELEMENTARY 84LEA HILL ELEMENTARY SCHOOL 59MT BAKER MIDDLE SCHOOL 86OLYMPIC MIDDLE SCHOOL 119PIONEER ELEMENTARY SCHOOL 257RAINIER MIDDLE SCHOOL 57TERMINAL PARK ELEMENTARY 98WASHINGTON ELEMENTARY SCHOOL 120WEST AUBURN SENIOR HIGH SCHOOL 19(blank)Grand Total 2369

Regular Education Special Education GRAND
Grade Teacher Boy Girl TOTAL Boy Girl TOTAL TOTAL I PE Girl BoySLC-K Titus, Wendy 0 1 1 2 2
FDK Falk, Emily 12 12 24 0 24 3 4FDK Hartmann, Laura 12 12 24 1 1 25 1 4FDK Young, D/Covey, E 13 12 25 0 25 5 7
37 36 73 2 1 3 76 0 0 9 15
SLC-1 Titus, Wendy 0 1 1 1
1 Colburn, Deanna 10 14 24 1 1 25 4 11 Cox, M/Covey, E 12 13 25 0 25 5 41 Huiras, Teresa 12 13 25 0 25 5 21 Nelson, Michelle 9 16 25 0 25 5 4
43 56 99 1 1 2 101 0 0 19 11
SLC-2 Titus, Wendy 0 4 1 5 5 12 Haechler, Molly 13 11 24 1 1 25 6 22 Larson, Kate 12 12 24 1 1 25 3 12 Taylor, Tiffany 12 12 24 1 1 25 3 12 Trautwein, Debra 12 13 25 0 25 2 3
49 48 97 5 2 8 105 0 0 14 8
SLC-3 Rice, Sara 0 0 0 4 4 4 SLC-3 Titus, Wendy 0 0 0 1 0 1 1
3 Castro, Jennifer 11 13 24 1 1 25 3 13 Gardner, Marianne 8 15 23 1 1 2 25 3 43 Harris, Martin 12 12 24 1 1 2 26 3 43 McGaughey, Debbi 13 11 24 0 24 2 1
44 51 95 8 2 10 105 0 0 11 10
SLC-4 Rice, Sara 0 0 0 1 2 3 3 1SLC-4 Titus, Wendy 0 0 0 1 1 1
4 Garrison, Dave 13 14 27 0 27 1 34 Manchik, Christina 12 14 26 1 1 27 1 34 Mate, Rhonda 12 16 28 0 28 1 1 34 Swensrud, Stacy 10 16 26 26 2 2 0 0 0
47 60 107 2 3 5 112 1 0 6 11
SLC-5 Rice, Sara 0 0 0 0 4 4 4 SLC-5 Titus, Wendy 0 0 0 1 0 1 1
5 Capponi-Glidewell,D 14 15 29 2 1 3 32 1 55 Howell, Chris 16 13 29 2 2 4 33 3 3 25 Kemp, Brian 15 15 30 2 1 3 33 3 1 35 Home school/PT student 0 1 1 1
45 43 88 7 9 16 104 6 1 9 5
K-5 Grand Totals 265 294 559 25 18 44 603 7 1 68 60
ELL
Arthur Jacobsen Elementary3/2/2015
ENTER DATA INTO UNSHADED CELLS ONLY
3/4/2015

3/4/2015 11:03 AM
Regular Education Special Education GRANDGrade Teacher Girl Boy TOTAL Girl Boy TOTAL TOTAL I PE Girl Boy
KDGN Brown, Sarah 13 10 23 0 23 3 2KDGN Escalera Jillyann 12 9 21 1 2 3 24 5 3KDGN Heier, Adrienne 14 9 23 1 1 24 4 2KDGN Scott, Sarah 13 11 24 0 24 3 0
52 39 91 1 3 4 95 0 0 15 7
1 Johnson, Kelli 11 12 23 0 23 3 31 McGarvey, Tanya 12 9 21 0 21 4 31 Howell, Angelica 12 9 21 1 1 22 5 11 Linn, Angela 10 13 23 0 23 2 4
45 43 88 0 1 1 89 0 0 14 11
2 Ekstrom, Stefanie 11 11 22 1 1 23 4 32 Ford, Jennifer 11 10 21 1 2 3 24 3 62 McKenzie, Julie 12 11 23 1 1 24 5 52 Wilcox, Cheryl 10 12 22 1 1 23 3 52 Burtis, Jami 5 4 9 0 9 1 0 0
49 48 97 2 4 6 103 0 0 16 19
3 Bohman, Sandy 11 14 25 1 1 26 1 33 Harlor, Roxanne 11 13 24 1 1 25 1 33 Burtis, Jami 6 7 13 0 13 1 0
0 0 0 28 34 62 0 2 2 64 0 0 3 6
4 Chipps-Freeman, Suzan 14 12 26 1 1 2 28 1 3 34 Cicero, Tanya 14 11 25 2 2 27 1 34 Nickel, Lisa 12 13 25 2 2 4 29 1 3 0 0 0 0
40 36 76 3 5 8 84 0 2 7 6
5 Allen/Leverton 9 15 24 0 24 1 65 Beckett, Mary 11 14 25 2 2 27 2 45 Miller, Tana 10 15 25 1 1 26 1 3
0 0 0 0 0 0
30 44 74 0 3 3 77 0 0 4 13
244 244 488 6 18 24 512 0 0 59 62
I PEECE AM Fulton 2 6 8 8AM Leitzke, Stacy 4 6 10 10 1PM Fulton 4 3 7 7PM Leitzke, Stacy 0 2 6 8 8
0 0 0 12 21 33 33 0 1
ECEAPAM FULTON 4 4 8 1 1 9PM FULTON 4 4 8 1 1 9
8 8 16 0 2 2 18
ECE-5 Total Entity 117 & 640 252 252 504 18 41 59 563 59 62
K-5 Totals
ALPAC ELEMENTARY
ELL

ENTER DATA INTO UNSHADED CELLS ONLY
Regular Education Special Education GRAND ELLGrade Teacher Girl Boy TOTAL Girl Boy TOTAL I PE Girl Boy T
ECE AM BLOUNT 4 4 8 5 3 8 16 PM BLOUNT 4 4 8 2 7 9 17 1
16 7 10 17 33
EDK Bermudez 7 8 15 1 3 4 19 2 5 7EDK Millard 7 9 16 0 2 2 18 2 2 4EDK Nissen-Haney 6 10 16 0 0 0 16 3 5 8EDK Kinney (SLC) 0 1 7 8 8 0
20 27 47 2 12 14 61 7 12 19
1 Hopkins 9 7 16 0 1 1 17 2 1 31 Roshau 7 8 15 1 1 2 17 2 5 71 Stickley 5 10 15 1 1 2 17 3 4 71 Thibodeaux 9 8 17 1 0 1 18 2 3 51 Kinney (SLC) 1 0 1 1 9 1 Snyder (SLC) 0 1 2 3 3 01 Buena Vista (SpEd only) 1 1 1
30 33 63 5 6 11 74 9 13 22
2 Beaubien 11 9 20 0 1 1 21 3 1 42 Bunker 10 9 19 0 0 0 19 3 4 72 Hallowell 10 7 17 0 2 2 19 3 1 42 Snyder (SLC) 0 1 2 3 3 1 1
31 25 56 1 5 6 62 9 7 16
3 Erickson 8 13 21 0 1 1 22 4 2 63 LaFayette 8 13 21 0 1 1 22 1 5 63 Wooding 9 12 21 0 1 1 22 2 3 53 Monroe (SLC) 0 0 1 1 1 03 Snyder (SLC) 0 0 3 3 3 0
25 38 63 0 7 7 70 7 10 17
4 Fitzgerald (Leir) 12 9 21 3 3 6 27 1 3 4 74 Minus 9 12 21 1 4 5 26 1 1 4 54 Monroe (SLC) 0 2 5 7 7 1 1 2
21 21 42 6 12 18 60 5 9 14
5 McCausland 11 10 21 1 1 2 23 2 1 35 Signal 12 8 20 0 3 3 23 1 5 65 Monroe (SLC) 2 2 4 4 12 1 1 1 0 15 Snyder (SLC) 1 0 1 1 10 1 0 0 0
23 18 41 4 6 10 51 4 6 10
K-5 Totals 150 162 312 18 48 66 378 41 57 98
Grand Total 411 4
CHINOOK ELEMENTARY
3/2/2015

Regular Education Special Education GRAND ELL ELLGrade Teacher Boy Girl TOTAL Boy Girl TOTAL TOTAL I PE Boy Girl
K-FD Glenn 14 11 25 1 1 2 27 2 2 5K-FD Jensen 10 15 25 3 3 28 3 6 1K-FD Lindberg 15 12 27 1 1 28 3 4 3K-FD Robinson 14 12 26 2 2 28 3 3 8
53 50 103 7 1 8 111 11 0 15 17
1 Dwyer 10 13 23 1 1 24 3 41 Lysene 9 13 22 2 2 24 2 21 Scholzen 7 15 22 2 2 24 4 31 Tiemann 7 13 20 3 3 23 2 4
33 54 87 8 0 8 95 0 0 11 13
2 Brooks 12 13 25 1 1 26 4 22 Clerget 11 12 23 1 1 24 1 52 Eronemo 12 9 21 3 1 4 25 4 52 Jones 5 7 12 1 1 13 3 1
28 28 81 6 1 7 88 0 0 12 13
3 Jones 5 6 11 1 1 12 0 13 Lavine 14 11 25 1 1 26 6 33 Mattox 13 10 23 1 1 2 25 4 13 Wisener 12 11 23 2 2 25 4 3
44 38 82 5 1 6 88 0 0 14 8
4 Jenkins 12 9 21 2 1 3 24 3 14 Spears 11 10 21 2 1 3 24 6 34 Ziegler 10 11 21 2 1 3 24 3 14 0 0 0
33 30 63 6 3 9 72 0 0 12 5
5 Baehr 16 14 30 1 2 3 33 3 3 65 Ringler 14 16 30 2 1 3 33 3 3 2
0 0 0 0 0 0
30 30 60 3 3 6 66 6 0 6 8
K-5 Totals 221 230 476 35 9 44 520 17 0 70 64
ECEExt Day McCormick 0 4 0 4 4
AP McCormick 0 2 1 3 3AP Mayer 0 7 1 8 8PP Mayer 0 4 3 7 7
0 0 00 0 0 17 5 22 22
Peers McCormick - AM 0 3 3 6 6Peers Mayer - AM 0 4 4 8 8Peers Mayer - PM 0 3 5 8 8
0 0 0 10 12 22 22
K-5 Grand Total 221 230 476 52 14 66 564 17 0 70 64
DICK SCOBEE ELEMENTARY3/2/2015

GRANDGrade Teacher Girl Boy TOTAL Girl Boy TOTAL TOTAL I PE Girl Boy
Full Musial, Diana 8 14 22 1 1 23 1 3Full Miller, Kyle 13 9 22 1 1 23 3 3Full Drake, Michelle 9 14 23 0 23 4 3Full Barrows, Rachel 11 12 23 0 23 4 6Full Udd, Jessica 7 6 13 0 13
48 55 103 2 0 2 105 0 0 12 15
1 Behrend, Deena 12 11 23 1 1 24 4 31 McEntyre, Michelle 13 12 25 0 25 4 41 Jewett, Marice 11 11 22 1 1 23 3 21 McGraw, Deborah 11 11 22 1 1 2 24 4 5
0 0 047 45 92 1 3 4 96 0 0 15 14
2 Louie, Alisa 11 11 22 1 1 2 24 1 42 Logan, Carolyn 13 8 21 3 3 24 5 42 Littell/Robello 10 11 21 1 1 22 3 12 Stenson/Hupperten 7 5 12 0 12
41 35 76 1 5 6 82 0 0 9 9
3 James, Susan 10 15 25 2 1 3 28 X 3 33 Parks, Pam 12 13 25 1 1 2 27 3 33 Akins, Laura 12 12 24 3 1 4 28 X 3 33 Stenson/Hupperten 7 5 12 0 12
0 0 0 41 45 86 6 3 9 95 0 0 9 9
4 Beers, Timothy 15 11 26 1 1 27 3 34 Jones, Jana 14 12 26 0 26 14 Carroll, Leah 16 10 26 1 1 27 3 4
0 0 045 33 78 0 2 2 80 0 0 7 7
5 Cox, John 14 10 24 2 2 4 28 1 55 Morford, Terri 10 13 23 1 1 245 Rasmussen, Karine 16 10 26 2 2 4 30 3 3
0 0 040 33 73 4 5 9 82 0 0 4 8
K-5 Totals 262 246 508 14 18 32 540 0 0 56 62
EVERGREEN HEIGHTS ELEMENTARY3/2/2015
Regular Education Special Education ELL

Regular Education Special Education GRAND ELL ELL
Grade Teacher Girl Boy TOTAL Girl Boy TOTAL TOTAL I PE Girl Boy
K-FD Aramburu, Carly 12 11 23 1 1 23 6 5
K-FD Rolland, Lena 9 12 21 2 2 23 7 5
K-FD Ullberg, Necia 14 10 24 0 24 5 5
K-FD Whipple, Kellie 12 11 22 1 1 24 6 6
K-FD Lewis, Bobbi 13 10 23 0 23 7 7
113 4 117 0 0 31 28
1 Dirks, Ashley 11 9 20 0 0 20 8 6
1 Moter, Alisha 11 6 17 1 2 3 20 6 2
1 Kim, Dan-by 11 7 18 1 1 19 10 4
1 Torres-Pintos, Dara 11 7 18 2 2 20 6 5
1 Weygint, Keri 10 8 18 0 1 1 19 3 3
0 0 0
91 7 98 0 0 33 20
2 Olson, Kristina 11 11 22 1 1 23 7 8
2 Diehl, Brittany 12 11 23 1 1 24 4 7
2 Green, Maureen 6 12 18 1 2 3 21 5 6
2 Hull, Karen 7 4 11 0 11 0 2
2 Ridge, Kyle 10 10 20 1 2 3 23 5 8
94 8 102 0 0 21 31
3 Hull, Karen 6 9 15 0 15 0 1
3 Linville, Dianna 9 15 24 1 1 2 26 5 9
3 Fouquet (MacGurn), Allison 12 11 23 3 3 26 5 5
3 Santman/Barber 14 11 25 1 1 26 5 3
0 0 0
87 6 93 0 0 15 18
4 Bunker, Kimberly 12 12 24 1 1 2 26 6 3
4 Fitzgerald, Michael 12 12 24 1 2 3 27 4 5
4 Myers, Marty 10 14 24 1 0 1 25 3 4
4 Rademacher, Patrice 10 12 22 2 1 3 25 4 5
94 9 103 0 0 17 17
5 Sandland, Tyler 11 16 27 2 3 5 32 4 4
5 Sellers, Kaitlyn 13 16 29 1 2 3 32 3 4 5
5 0 0 0
0 0 0
24 32 56 3 5 8 64 3 0 8 9
K-5 Totals 24 32 535 3 5 42 577 3 0 125 123
ECE 0 0 0
Ext Day 0 0
PP 0 0
AP 0 1 7 8 8 14 Peer Models
PP 0 2 7 9 9
0 0
0 0 0 3 14 17 17
K-5 Grand Total 24 32 535 6 19 59 594 3 0 125 123
Gildo Rey Elementary
3/2/2015

ENTER DATA INTO UNSHADED CELLS ONLY
GRANDGrade Teacher Girl Boy TOTAL Girl Boy TOTAL TOTAL I PE Girl Boy
EDK Davis, Magee 10 12 22 22 2 3EDK Duckworth, April 9 13 22 22 2 7EDK Gordon, Sandra 9 13 22 22 1 4EDK Zabriskie, Suzanne 10 11 21 1 1 22 4 4
overload 26 - dbl 29 38 50 88 0 1 1 88 9 17
1 Boll, Konni 12 13 25 25 2 31 Johnson, Beth 13 12 25 25 4 51 Raphael, Kathy 11 11 22 1 1 23 2 41 Slater, Robin 8 14 22 1 1 2 24 5 8
overload 26 - dbl 29 44 50 94 1 2 3 97 13 20
2 Krause, Karen 13 10 23 23 2 42 Scofield, Carol 13 8 21 2 2 23 4 22 Wharton, Tricia 11 12 23 1 1 24 4 52 Wright, Shelley 12 10 22 1 1 23 3 3
overload 26 - dbl 29 49 40 89 0 4 4 93 13 14
3 Carter, Amber 7 5 12 12 1 03 Crain, Lori 11 12 23 2 2 25 2 43 Ferguson, Sandra 13 11 24 1 1 25 3 53 Swanson, Darlene 13 12 25 1 1 26 3 6
overload 28 - dbl 31 44 40 84 1 3 4 88 9 15
4 Anderson, Mary 10 12 22 2 2 4 26 1 34 Carter, Amber 8 5 13 13 0 04 Cavalieri, Lisa 11 9 20 1 2 3 23 1 24 Celver, Christina 10 10 20 2 1 3 23 1 24 Wickstrom, Scott 10 10 20 1 2 4 23 2 2
overload 28 - dbl 31 49 46 95 6 7 13 108 5 9
5 Donnelly, Holly 12 12 24 2 2 4 28 2 25 Kearney, Karen 10 13 23 4 0 4 27 0 65 Lewis, Jocelyn 12 11 23 1 3 4 27 2 25 Morris, Gary 14 12 26 1 1 2 28 2 4
overload 31 - dbl 33 48 48 96 8 6 14 110 6 14
K-5 Totals 272 274 546 16 23 39 584 55 89
K-5 Grand Total 272 274 546 16 23 39 584 55 89
REVISED HAZELWOOD ELEMENTARY2014- 2015 March 2, 2015
ELLRegular Education Special Education
HZ Enrollment 3-2-15

ILALKO ELEMENTARY 3/2/2015
ENTER DATA INTO UNSHADED CELLS ONLY
Regular Education Special Education GRAND ELLGrade Teacher Girl Boy TOTAL Girl Boy TOTAL TOTAL SLC I PE Girl Boy TotalK‐FD Blau 18 9 27 0 27 2 4 3 7K‐FD Carlson 15 12 27 1 1 28 1 8 1 9K‐FD Fields 14 11 25 1 1 26 1 5 2 7K‐FD Kelly 14 12 26 1 1 27 2 3 5 8
61 44 105 2 1 3 108 0 5 1 20 11 31
1 Austin 10 16 26 26 1 3 4 71 Embery 15 11 26 26 1 4 4 81 Olson 13 12 25 1 1 26 1 5 4 91 Surber 12 13 25 1 1 2 27 2 4 4
50 52 102 2 1 3 105 0 5 0 16 28
2 Colburn 12 14 26 26 1 1 6 72 Neubauer 12 12 24 1 1 25 1 3 42 Price 13 11 24 1 1 25 2 2 42 Tiedeman 14 10 24 1 1 25 4 3 7
51 47 98 1 2 3 101 0 1 0 8 14 22
3 Baruck 12 12 24 2 2 26 2 2 43 Callero 16 9 25 1 1 26 5 1 63 Myka 12 12 24 1 1 25 3 3 63 Nielsen 13 11 24 2 2 26 2 5 7
0 0 0 053 44 97 1 5 6 103 0 0 0 12 11 23
4 Bozlee 11 17 28 0 28 1 5 54 Egbert 12 12 24 2 1 3 27 4 2 64 Hyde 11 13 24 1 1 2 26 1 2 34 Skorniakoff 12 12 24 2 2 26 4 2 64 Davis‐SLC 0 1 1 1 1 1
46 54 100 8 108 0 1 0 10 11 21
5 DeFrancesco 14 12 26 2 2 28 4 45 Dutoit 13 12 25 2 1 3 28 1 2 35 Kliewer 13 13 26 1 1 2 28 1 2 25 Sprenger 11 15 26 1 1 27 3 2 55 Davis‐SLC 0 3 2 5 5
51 52 103 6 7 13 116 1 0 0 4 10 14
K‐5 Totals 312 293 605 12 16 36 641 1 12 1 54 73 139
ECE 0AA 0PA 0
00
0 0 0 0 0 0 0
K‐5 Grand Total 312 293 605 12 16 36 641 1 54 73 139
ELL teacher : Heidi Abbott

ENTER DATA INTO UNSHADED CELLS ONLY
GRANDGrade Teacher Girl Boy TOTAL Girl Boy TOTAL TOTAL I PE Girl Boy
K LOCKETT 12 13 25 1 1 2 27 1 2 3K WHITE 14 12 26 0 26 1 3 4
0 0 0ECE-K MORGAN 0 0 0SPEDK SHEEHAN 0 2 4 6 6SPEDK LATAWIEC 2 2 2
26 25 51 3 7 10 61 1 1 5 7
1 GIDLEY 10 11 21 1 1 22 1 11 MOORE 10 10 20 1 1 21 1 11 FETTIG 8 11 19 1 1 2 21 2
SPED1 SHEEHAN 0 1 1 128 32 60 2 3 5 65 0 0 4 2
2 BORTON 9 10 19 2 1 3 22 1 22 BERRY 8 11 19 1 2 3 22 32 TOMPKINS 9 10 19 1 3 4 23 3
SPED2 LATAWIEC 0 0 2 2 20 0 0
26 31 57 4 8 12 69 0 0 1 8
3 DALE 9 10 19 1 1 2 21 33 HAWS/LEWIS 9 10 19 1 1 2 21 13 MERTENS 9 10 19 1 1 2 21 2
SPED3 LATAWIEC 0 1 1 13 AIKEN * 0 1 1 1
0 0 0 27 30 57 4 4 8 65 0 0 0 6
0 0 0
4 GRECO/GWIN 12 9 21 1 2 3 24 14 MIRACLE 11 8 19 1 3 4 23
SPED4 LATAWIEC 0 1 1 10 0 00 0 0
23 17 40 3 5 8 48 0 0 1 0
0 0 05 CALDWELL 13 15 28 1 2 3 31 1 1 15 ROWE 10 13 23 4 3 7 30 3 2
SPED5 LATAWIEC 0 1 1 123 28 51 6 5 11 62 4 0 3 1
K-5 Totals 153 163 316 22 32 54 370 5 1 14 24
ECE 0 0 0AP MORGAN 0 2 5 7 7PP MORGAN 0 0 8 8 8
0 0 00 0 0 2 13 15 15
K-5 Grand Total 153 163 316 24 45 69 385 1
* homeschool student receiving 210 minutes a week in Resource room & OT.
LAKE VIEW ELEMENTARY3/2/2015
ELLRegular Education Special Education

Regular Education Special Education GRAND ELLGrade Teacher Girl Boy TOTAL Girl Boy TOTAL TOTAL I PE Girl Boy
25 max then 28
K Ext Brown, Kelly 12 9 21 1 1 22 1 3K Ext Lynch, Sarah 11 10 21 1 1 22 2 3K Ext Mattison, Sarah 12 10 22 0 22 2 3K Ext McKeough, Kimberly 11 11 22 0 22 3 3K Ext Potter, Christy 11 11 22 0 22 4 1
57 51 108 0 2 2 110 0 0 12 1325 max then 28
1 Botz, Julie 11 11 22 2 2 24 2 21 Hartley, Heather 11 11 22 1 1 2 24 2 31 Schuman, Susan 5 6 11 0 11 11 Sergis, Melissa 10 13 23 1 1 24 1 11 Wynn, Kimberly/McCarthy Callie 10 13 23 1 1 24 2 2
47 54 101 1 5 6 107 0 0 7 925 max then 28
2 Alexander, Nancy 11 9 20 1 1 21 1 12 King,Marla/Cole, Amy 10 8 18 1 1 2 20 32 Miller, Dianna 11 8 19 1 1 2 21 22 Nelson, Michelle 12 9 21 1 1 22 1 12 Schuman, Susan 7 7 14 0 142 Swanson, Jennifer 10 10 20 1 1 21 1 2
61 51 112 2 5 7 119 0 0 5 727 max
3 Brewer, Ann 12 12 24 1 1 2 26 1 13 Gesell, Ruth 11 12 23 2 2 25 23 Keith, Alaura 15 9 24 0 24 13 Stephanie Knapp/Christa Jeffreys 12 11 23 2 2 25 23 Marcotte, Michael 14 9 23 2 2 25 2 2
64 53 117 1 7 8 125 0 0 4 727 max
4 Knudtsen, Stacie/Bonham, Kelsey 13 12 25 1 1 26 34 Luke, Dorothy 11 13 24 2 1 3 27 14 Peters, Trina 13 11 24 2 2 26 1 14 Richstad, Kevin 13 10 23 1 1 2 25 1 2
50 46 96 3 5 8 104 0 0 2 730 max
5 Arnold, Mindy 13 11 24 1 3 4 28 25 Libadia, Raphael 14 11 25 1 2 3 28 1 35 Maloney, Kelly 14 12 26 1 1 27 1 15 McBane, Julie 14 10 24 3 3 27 1 2
55 44 99 2 9 11 110 0 0 5 6
K-5 Grand Total 334 299 633 9 33 42 675 0 0 35 49
LAKELAND HILLS ELEMENTARY3/2/2015

ENTER DATA INTO UNSHADED CELLS ONLY
Regular Education Special Education GRAND R/EGrade Teacher Girl Boy TOTAL Girl Boy TOTAL TOTAL AB I PE Girl Boy
FD ANDERSON, KELSIE 10 8 18 0 18 1 5 2FD CALDARULO, BRITTAN 9 11 20 0 0 20 2 1FD GERING, TREVOR 10 10 20 1 1 21 2 4FD SEARS, STACEY 8 10 18 1 1 2 20 2 3
Aarstad, Evanne--AB 0 1 1 137 39 76 1 3 4 80 0 0 11 10
1 MANSOUR, NAJWA 5 11 16 5 5 21 1 2 31 PRINCE, LORI 7 9 16 2 2 18 1 2 31 SAY-O'DONNELL, CONNIE 7 6 13 2 3 5 18 1 1
0 0 01 Aarstad, Evanne--AB 0 3 3 3
19 26 45 2 13 15 60 2 0 4 7
2 RAY, ELIZABETH 9 11 20 1 1 2 22 12 SPEAR, JOANN 9 11 20 1 1 21 1 32 STURGIS, KIM 9 10 19 0 19 1
0 0 02 Aarstad, Evanne--AB 0 3 3 3
27 32 59 1 5 6 65 0 0 1 5
3 DANIELS, TREENA 10 8 18 1 1 2 20 1 13 JENKINS, SHANA 13 8 21 0 21 2 23 SWEENEY, DEVAN 11 10 21 0 21 2
0 0 03 JORDAN, K--AB 0 1 1 2 2
34 26 60 2 2 4 64 0 0 5 3
4 BEEKSMA, STEPHANIE 7 11 18 0 18 1 14 GOLIFF, STEPHEN 11 14 25 0 1 1 26 3 2
0 0 04 JORDAN, K--AB 0 3 3 3
18 25 43 0 4 4 47 0 0 4 3
5 BEEKSMA, STEPHANIE 5 3 8 0 85 FETTIG, MICHAEL 13 14 27 1 1 28 1 1 25 FOSS, KIMBERLEY 12 12 24 2 2 26 1 3
0 0 05 JORDAN, K--AB 0 3 3 3
0 0 030 29 51 0 6 6 65 0 0 1 5
K-5 Totals 165 177 334 6 33 39 381 3 0 26 33
ECE I PEER MODELSAM HOUGLUM, ROSEMARY 0 5 2 7 7 5 2PM HOUGLUM, ROSEMARY 0 2 6 8 8 4 4AM DENT, KATIE 0 2 4 6 6 5 1PM DENT, KATIE 0 3 5 8 8 6 2
AM ST. MARY, SARAH 0 1 1 2 2 3 3FD ST. MARY, SARAH 0 2 4 6 6 1
0 0 0 15 22 37 37 0 0 23 12
Peer Models--total 35
K-5 Grand Total 165 177 334 21 55 76 418 3 0 26 33
HEAD START GIRLS BOYSAM 9 10 19 GRANDPM 9 10 19 TOTAL
TOTAL 38 491
Lea Hill Elementary School3/2/2015
ELL

ENTER DATA INTO UNSHADED CELLS ONLY
GRANDGrade Teacher Girl Boy TOTAL Girl Boy TOTAL TOTAL I PE Girl Boy
K Chock, Ruby 13 10 23 2 2 25 8 10K Luschei, Mary 15 10 25 1 1 26 x 10 8K McLaughlin, Melyssa 6 17 23 1 1 24 3 12K Roble, Michelle 14 9 23 1 2 3 26 x 8 6
48 46 94 2 5 7 101 29 36
1 Lee, Laurel 18 5 23 23 10 11 Rutledge, Jordan 9 11 20 20 4 71 Anderegg, Alicia 15 9 24 24 6 41 Hyatt, Shuree 8 6 14 1 2 3 17 4 5
50 31 81 1 2 3 84 24 17
2 Adams, Jessica 12 8 20 2 2 22 6 62 Furey, Erika 9 10 19 1 1 20 3 32 Andres, Sarah 11 6 17 1 2 3 20 11 52 Kim, Jie 11 11 22 1 1 23 6 5
43 35 78 2 5 7 85 26 19
3 O'Reiley, Melissa 11 15 26 26 8 83 Hill, Angela 13 11 24 1 1 25 9 53 Rowe, Dani 8 6 14 14 3 2
32 32 64 1 1 65 20 15
4 Verlander, Melissa 16 8 24 3 1 4 28 X 12 54 Mattox, Linda 12 15 27 1 1 28 X 7 104 Rowe, Dani 7 6 13 13 3 1
35 29 64 4 1 5 69 22 16
5 Mattioli, Steven 14 11 25 3 3 28 7 35 Massimino, Jay 13 11 24 2 1 3 27 6 45 Diebag, Melinda 14 10 24 1 2 3 27 9 6
41 32 73 6 3 9 82 22 13
K-5 Totals 249 205 454 15 16 32 486 143 116
HeadstartPIO AA 4 14 18 18PIO PA 9 10 19 19
Main AM 9 10 19 19Main PM 8 11 19 19
30 45 75 75
K-5 Grand Total 279 250 529 15 16 32 561 0 143 116
PIONEER ELEMENTARY3/2/2015
ELLRegular Education Special Education

Terminal Park Elementary3/2/2015
ENTER DATA INTO UNSHADED CELLS ONLY
Regular Education Special Education GRAND ELLGrade Teacher Girl Boy TOTAL Girl Boy TOTAL TOTAL I PE Girl Boy TotalFDK Cramer 13 8 21 1 1 22 4 4FDK Jarman 14 9 23 0 23 3 3 6FDK Mischke 11 10 21 0 0 21 1 5 6
38 27 65 1 0 1 66 8 8 16
1 Birk 12 12 24 0 0 24 5 4 91 Parce 15 8 23 1 1 24 6 2 81 Williams 16 8 24 0 1 1 25 6 3 9
0 0 043 28 71 0 2 2 73 17 9 26
2 Brooks 10 11 21 1 1 2 23 1 3 42 Brunelle 5 5 10 0 10 02 Harlor 7 13 20 2 2 22 4 4 8
0 0 0 022 29 51 1 3 4 55 5 7 12
3 Brunelle 6 6 12 0 12 2 23 Clough 8 12 20 1 1 21 4 5 93 Grant 10 9 19 2 2 21 2 2 4
0 0 0 024 27 51 1 2 3 54 6 9 15
4 Andersen/Gifted 13 12 25 0 25 04 Enz 9 14 23 1 3 4 27 4 3 74 Harlor 10 13 23 1 3 4 27 3 3 644 0 0 0 0
32 39 71 2 6 8 79 7 6 13
5 Hanson 13 10 23 2 1 3 26 2 3 55 Martin 11 14 25 1 1 2 27 2 25 McIntyre/Gifted 12 13 25 0 25 0
0 0 00 0 0 0
36 37 73 3 2 5 78 2 5 7
K‐5 Totals 195 187 382 8 15 23 405 45 44 89
ECE 0 0PM Vacancy 0 2 3 5 1 1 2
000
0 0 0 2 3 5 5 1 1 2
Peer Models Total 2
K‐5 Grand Total 195 187 382 10 18 28 410 0 45 44 89
ELL Teacher Laurie Bulson
Peer Models

ENTER DATA INTO UNSHADED CELLS ONLY
Regular Education Special Education GRANDGrade Teacher Boy Girl TOTAL Boy Girl TOTAL TOTAL I PE Boy Girl
SLC-K Peterson, Stephanie SLC 0 3 2 5 5 FDK Aguilar, Janie 6 12 18 1 1 19 1 6FDK Garcia, Dede 8 9 17 1 1 18 2 1FDK Lewis, Jessica 5 15 20 0 20 2 4FDK Melanson, Sasia 6 11 17 1 1 18 3 6
25 47 72 4 4 8 80 0
SLC-1 Peterson, Stephanie SLC 4 1 5 5 1SLC-1 Locke, Sara 0 1 1 2 2 1
1 Calhoun, Heidi 11 10 21 1 1 2 23 4 31 Combs, Marie 10 12 22 0 0 22 5 41 Stevens, Jolie 9 14 23 0 23 4 51 Yi, Yumi 6 16 22 1 1 23 1 7
36 52 88 7 3 10 98 0
SLC-2 Peterson, Stephanie SLC 0 1 1 1SLC-2 Locke, Sarah 0 1 1 2 2 2 X 1
2 Boyles, Danielle 11 10 21 1 1 22 4 42 DeJong, Cathy 10 12 22 1 1 23 4 32 Prock, Carrie 12 8 20 1 1 21 5 02 Seng, Kim 5 4 9 9 1
38 34 72 3 3 6 78 2
SLC-3 Locke, Sarah 0 4 4 43 Flanders, Michelle 11 11 22 1 1 23 4 33 Paulson, Susan 9 13 22 2 2 24 4 03 Seng, Kim 5 8 13 0 13 1 0
0 25 32 57 7 0 7 64 0
SLC-4 Locke, Sarah 0 3 3 34 Lafayette, Leslie 11 12 23 1 2 3 26 5 34 Monagin, Kelli 10 11 21 2 2 23 5 14 Smith, Tori 11 15 26 0 26 1 0
32 38 70 3 5 8 78 0
SLC-5 Locke, Sara 0 1 1 15 Anderson, Katie 11 15 26 3 3 29 2 35 Markwell, John 13 13 26 1 2 3 29 2 4
0 0 024 28 52 4 3 7 59 0
K-5 Grand Totals 180 231 411 28 18 46 457 2 61 59
Paige Welander K-2 = .8 FTE SLC - 23 Total ELL 120R.R.- 23
ELL
WASHINGTON ELEMENTARY
3/2/2015
3/4/2015

1sonyr01.p 38-2 CASCADE MIDDLE SCHOOL 03/02/15 Page:1
05.14.10.00.00 Course/Class Count Report 202 2:53 PM
EST NBR NBR ----TOTALS---- --Special Ed--
COURSE DESCRIPTION LGTH SEC AVL REQ TOT FEM MAL TOT FEM MAL
ART610 ART SURVEY 6 SM 1 120 58| 58 21 37 | 2 1 1 |
42 ERIC HOWE Max:30 S2 04 | 29 9 20 | 0 0 0 |
52 ERIC HOWE Max:30 S2 05 | 29 12 17 | 2 1 1 |
Number of Sections: 2 Average Students Per Section: 29.00
ART710 ART SURVEY 7 SM 1 120 51| 51 17 34 | 1 0 1 |
22 ERIC HOWE Max:30 S2 02 | 22 5 17 | 0 0 0 |
62 ERIC HOWE Max:30 S2 06 | 29 12 17 | 1 0 1 |
Number of Sections: 2 Average Students Per Section: 25.50
ART810 ART SURVEY 8 SM 1 60 26| 26 11 15 | 2 2 0 |
32 ERIC HOWE Max:30 S2 03 | 26 11 15 | 2 2 0 |
Number of Sections: 1 Average Students Per Section: 26.00
CTE101 STEM ROBOTICS 1 SM 1 120 46| 46 15 31 | 3 1 2 |
12 MARCUS R. DEAVER Max:30 S2 01 | 23 9 14 | 2 1 1 |
22 MARCUS R. DEAVER Max:30 S2 02 | 23 6 17 | 1 0 1 |
Number of Sections: 2 Average Students Per Section: 23.00
CTE105 STEM CNSTR FND1 SM 1 56 30| 30 11 19 | 0 0 0 |
42 MARCUS R. DEAVER Max:28 S2 04 | 30 11 19 | 0 0 0 |
Number of Sections: 1 Average Students Per Section: 30.00
CTE106 STEM CNSTR FND2 SM 1 112 52| 52 14 38 | 1 0 1 |
52 MARCUS R. DEAVER Max:28 S2 05 | 26 3 23 | 0 0 0 |
62 MARCUS R. DEAVER Max:28 S2 06 | 26 11 15 | 1 0 1 |
Number of Sections: 2 Average Students Per Section: 26.00
ELL602 ELL LAN ART 1B SM 1 30 5| 5 2 3 | 0 0 0 |
12 MARTHA C. ROBAYO WHIT Max:30 S2 01 | 5 2 3 | 0 0 0 |
Number of Sections: 1 Average Students Per Section: 5.00
ELL702 ELL LAN ART 2B SM 1 90 14| 14 6 8 | 0 0 0 |
32 MARTHA C. ROBAYO WHIT Max:30 S2 03 | 3 0 3 | 0 0 0 |
42 MARTHA C. ROBAYO WHIT Max:30 S2 04 | 4 1 3 | 0 0 0 |
62 MARTHA C. ROBAYO WHIT Max:30 S2 06 | 7 5 2 | 0 0 0 |
Number of Sections: 3 Average Students Per Section: 4.67
GEN010 ELL SUPPORT YR 1 100 56| 56 23 33 | 17 7 10 |
71 MARTHA C. ROBAYO WHIT Max:100 YR 07 | 56 23 33 | 17 7 10 |
Number of Sections: 1 Average Students Per Section: 56.00
GEN100 STUDY SKILLS SM 1 3 0| 0 0 0 | 0 0 0 |
12 REBECCA A. RAMIREZ-DI Max:1 S2 01 | 0 0 0 | 0 0 0 |
32 REBECCA A. RAMIREZ-DI Max:2 S2 03 | 0 0 0 | 0 0 0 |
Number of Sections: 2 Average Students Per Section: 0.00
GEN110 LEADERSHIP SM 1 90 0| 0 0 0 | 0 0 0 |
32 ROBERT A. ROBINSON Max:30 S2 03 | 0 0 0 | 0 0 0 |
62 ROBERT A. ROBINSON Max:30 S2 06 | 0 0 0 | 0 0 0 |
Number of Sections: 2 Average Students Per Section: 0.00
GEN710 TEACHERS AIDE 7 SM 1 102 44| 44 35 9 | 2 1 1 |
112 KEVIN P. OLSON Max:1 S2 01 | 1 0 1 | 0 0 0 |
132 PAULETTE T. FONDA Max:1 S2 01 | 1 0 1 | 1 0 1 |
152 DENISE M. BAXTER Max:1 S2 01 | 1 1 0 | 0 0 0 |
162 MARILYN R. MEAD Max:3 S2 01 | 2 1 1 | 0 0 0 |
212 SANDRA L. LUETTGEN Max:1 S2 02 | 1 1 0 | 0 0 0 |
222 JENNY HOMFELDT Max:1 S2 02 | 1 1 0 | 0 0 0 |
232 LEAH C. SANDLIAN Max:3 S2 02 | 3 3 0 | 0 0 0 |
242 KEVIN P. OLSON Max:1 S2 02 | 1 1 0 | 0 0 0 |
252 CHRISTINA W. THOMSEN Max:2 S2 02 | 1 1 0 | 0 0 0 |
262 KANIKA L. WATKINS Max:1 S2 02 | 1 1 0 | 0 0 0 |
272 MARILYN R. MEAD Max:3 S2 02 | 1 0 1 | 0 0 0 |
282 LORI J. SERAME Max:1 S2 02 | 1 1 0 | 0 0 0 |
29 JULIE K. KOVASH Max:1 S2 02 | 1 1 0 | 0 0 0 |
312 LORI J. SERAME Max:1 S2 03 | 1 0 1 | 0 0 0 |

1sonyr01.p 38-2 CASCADE MIDDLE SCHOOL 03/02/15 Page:2
05.14.10.00.00 Course/Class Count Report 202 2:53 PM
EST NBR NBR ----TOTALS---- --Special Ed--
COURSE DESCRIPTION LGTH SEC AVL REQ TOT FEM MAL TOT FEM MAL
32 CORRIE L. AGNEW Max:4 S2 03 | 0 0 0 | 0 0 0 |
342 MARILYN R. MEAD Max:3 S2 03 | 3 3 0 | 0 0 0 |
35 DENISE M. BAXTER Max:1 S2 03 | 1 1 0 | 0 0 0 |
36 KANIKA L. WATKINS Max:1 S2 03 | 1 1 0 | 0 0 0 |
37 TIMOTHY D. REAVIS Max:1 S2 03 | 1 1 0 | 0 0 0 |
38 KARLY N. JONASSON Max:1 S2 03 | 1 1 0 | 0 0 0 |
39 REBECCA A. RAMIREZ-DI Max:1 S2 02 | 1 1 0 | 1 1 0 |
422 KARLY N. JONASSON Max:1 S2 04 | 1 1 0 | 0 0 0 |
432 LORI J. SERAME Max:1 S2 04 | 1 1 0 | 0 0 0 |
442 CORRIE L. AGNEW Max:4 S2 04 | 1 1 0 | 0 0 0 |
452 DANIEL A. MCNEESE Max:2 S2 04 | 2 2 0 | 0 0 0 |
512 SANDRA L. LUETTGEN Max:1 S2 05 | 1 0 1 | 0 0 0 |
522 TIMOTHY D. REAVIS Max:1 S2 05 | 1 0 1 | 0 0 0 |
532 JENNY HOMFELDT Max:1 S2 05 | 1 1 0 | 0 0 0 |
542 KEVIN P. OLSON Max:1 S2 05 | 1 0 1 | 0 0 0 |
572 PAULETTE T. FONDA Max:2 S2 05 | 0 0 0 | 0 0 0 |
58 KENTON C. BARKER Max:1 S2 05 | 1 1 0 | 0 0 0 |
59 JUSTIN W. MENTINK Max:1 S2 05 | 1 1 0 | 0 0 0 |
622 KEVIN P. OLSON Max:1 S2 06 | 1 1 0 | 0 0 0 |
632 MARILYN R. MEAD Max:4 S2 06 | 1 1 0 | 0 0 0 |
64 QUYNH N. TAYLOR Max:1 S2 06 | 1 1 0 | 0 0 0 |
65 MARILYN R. MEAD Max:3 S2 06 | 1 1 0 | 0 0 0 |
66 SANDRA L. LUETTGEN Max:2 S2 06 | 2 1 1 | 0 0 0 |
67 ERIC HOWE Max:1 S2 06 | 1 1 0 | 0 0 0 |
68 LORI J. SERAME Max:1 S2 06 | 1 1 0 | 0 0 0 |
Number of Sections: 39 Average Students Per Section: 1.13
GEN711 OFFICE AIDE 7 SM 1 28 14| 14 11 3 | 0 0 0 |
112 ISAIAH D. JOHNSON Max:4 S2 01 | 3 3 0 | 0 0 0 |
22 ISAIAH D. JOHNSON Max:3 S2 02 | 3 2 1 | 0 0 0 |
412 ISAIAH D. JOHNSON Max:3 S2 04 | 3 2 1 | 0 0 0 |
512 ISAIAH D. JOHNSON Max:4 S2 05 | 5 4 1 | 0 0 0 |
Number of Sections: 4 Average Students Per Section: 3.50
GEN810 TEACHERS AIDE 8 SM 1 173 79| 79 57 22 | 2 2 0 |
122 SANDRA L. LUETTGEN Max:1 S2 01 | 1 1 0 | 0 0 0 |
132 JUSTIN W. MENTINK Max:1 S2 01 | 1 1 0 | 0 0 0 |
14 DANIEL A. MCNEESE Max:2 S2 01 | 2 1 1 | 0 0 0 |
15 QUYNH N. TAYLOR Max:2 S2 01 | 0 0 0 | 0 0 0 |
16 MATHEW R. LUDWIGSON Max:1 S2 01 | 0 0 0 | 0 0 0 |
17 JESSE W. KINKEAD Max:1 S2 01 | 1 1 0 | 0 0 0 |
18 MELISSA K. MESSMER Max:1 S2 01 | 1 1 0 | 0 0 0 |
182 TIMOTHY D. REAVIS Max:1 S2 01 | 1 1 0 | 0 0 0 |
19 QUYNH N. TAYLOR Max:1 S2 01 | 1 1 0 | 0 0 0 |
192 KENTON C. BARKER Max:1 S2 01 | 1 0 1 | 0 0 0 |
221 KENTON C. BARKER Max:2 S2 02 | 1 1 0 | 0 0 0 |
222 CHRISTINA W. THOMSEN Max:1 S2 02 | 1 1 0 | 0 0 0 |
223 MARCUS R. DEAVER Max:4 S2 02 | 3 0 3 | 0 0 0 |
224 QUYNH N. TAYLOR Max:2 S2 02 | 2 1 1 | 0 0 0 |
225 MATHEW R. LUDWIGSON Max:1 S2 02 | 1 0 1 | 0 0 0 |
226 CASEY A. KILLETT Max:2 S2 02 | 1 0 1 | 0 0 0 |
227 JESSE W. KINKEAD Max:2 S2 02 | 1 0 1 | 0 0 0 |
228 AMY J. SLEETH Max:2 S2 02 | 2 2 0 | 0 0 0 |
242 PAULETTE T. FONDA Max:2 S2 02 | 2 2 0 | 0 0 0 |
311 SHAYNA E. BROWN Max:1 S2 03 | 1 1 0 | 0 0 0 |
312 DENISE M. BAXTER Max:1 S2 03 | 0 0 0 | 0 0 0 |
313 MARIE A. DALTON Max:2 S2 03 | 0 0 0 | 0 0 0 |
314 JENNY HOMFELDT Max:2 S2 03 | 0 0 0 | 0 0 0 |

1sonyr01.p 38-2 CASCADE MIDDLE SCHOOL 03/02/15 Page:3
05.14.10.00.00 Course/Class Count Report 202 2:53 PM
EST NBR NBR ----TOTALS---- --Special Ed--
COURSE DESCRIPTION LGTH SEC AVL REQ TOT FEM MAL TOT FEM MAL
315 JOEL R. MACDOUGALL Max:2 S2 03 | 1 1 0 | 0 0 0 |
316 DANIEL A. MCNEESE Max:3 S2 03 | 3 3 0 | 0 0 0 |
317 CASEY A. KILLETT Max:2 S2 03 | 1 0 1 | 0 0 0 |
318 CHARLES R. CHEW JR Max:1 S2 03 | 1 0 1 | 0 0 0 |
319 JENNY HOMFELDT Max:1 S2 03 | 1 1 0 | 0 0 0 |
320 ERIC HOWE Max:1 S2 03 | 1 0 1 | 0 0 0 |
322 PAULETTE T. FONDA Max:2 S2 03 | 2 2 0 | 0 0 0 |
323 MARILYN R. MEAD Max:1 S2 03 | 0 0 0 | 0 0 0 |
324 QUYNH N. TAYLOR Max:2 S2 03 | 2 2 0 | 0 0 0 |
325 CHRISTINA W. THOMSEN Max:1 S2 03 | 1 0 1 | 0 0 0 |
326 DANIEL A. MCNEESE Max:3 S2 03 | 0 0 0 | 0 0 0 |
327 KENTON C. BARKER Max:1 S2 03 | 1 0 1 | 0 0 0 |
328 CORRIE L. AGNEW Max:1 S2 03 | 1 1 0 | 0 0 0 |
329 DENISE M. BAXTER Max:1 S2 03 | 1 1 0 | 0 0 0 |
442 MATHEW R. LUDWIGSON Max:2 S2 04 | 1 0 1 | 0 0 0 |
46 ISAIAH D. JOHNSON Max:4 S2 04 | 4 2 2 | 0 0 0 |
47 JUSTIN W. MENTINK Max:2 S2 04 | 2 2 0 | 1 1 0 |
48 MELISSA K. MESSMER Max:1 S2 04 | 1 1 0 | 0 0 0 |
49 CASEY A. KILLETT Max:1 S2 04 | 1 1 0 | 0 0 0 |
509 DANIEL A. MCNEESE Max:3 S2 05 | 3 2 1 | 0 0 0 |
510 JOEL R. MACDOUGALL Max:1 S2 05 | 1 1 0 | 0 0 0 |
511 REBECCA A. RAMIREZ-DI Max:2 S2 05 | 1 1 0 | 1 1 0 |
512 MARCUS R. DEAVER Max:2 S2 05 | 2 2 0 | 0 0 0 |
513 MATHEW R. LUDWIGSON Max:2 S2 05 | 2 0 2 | 0 0 0 |
514 JUSTIN W. MENTINK Max:1 S2 05 | 1 1 0 | 0 0 0 |
515 CHARLES R. CHEW JR Max:1 S2 05 | 1 1 0 | 0 0 0 |
516 QUYNH N. TAYLOR Max:1 S2 05 | 1 1 0 | 0 0 0 |
518 ERIC HOWE Max:1 S2 05 | 1 1 0 | 0 0 0 |
532 LEAH C. SANDLIAN Max:6 S2 05 | 6 5 1 | 0 0 0 |
610 CORRIE L. AGNEW Max:1 S2 06 | 1 0 1 | 0 0 0 |
611 JUSTIN W. MENTINK Max:2 S2 06 | 2 2 0 | 0 0 0 |
612 KEITH D. RAY Max:4 S2 06 | 3 3 0 | 0 0 0 |
614 KELLI A. TAYLOR Max:1 S2 06 | 0 0 0 | 0 0 0 |
621 CHRISTINA W. THOMSEN Max:1 S2 06 | 1 1 0 | 0 0 0 |
622 MARCUS R. DEAVER Max:1 S2 06 | 1 1 0 | 0 0 0 |
623 MARILYN R. MEAD Max:1 S2 06 | 2 2 0 | 0 0 0 |
624 MELISSA L. NEWMAN Max:1 S2 06 | 1 1 0 | 0 0 0 |
Number of Sections: 60 Average Students Per Section: 1.32
GEN811 OFFICE AIDE 8 SM 1 15 7| 7 5 2 | 0 0 0 |
312 ISAIAH D. JOHNSON Max:3 S2 03 | 3 1 2 | 0 0 0 |
612 ISAIAH D. JOHNSON Max:4 S2 06 | 4 4 0 | 0 0 0 |
Number of Sections: 2 Average Students Per Section: 3.50
HLT802 HEALTH 3 SM 1 60 60| 60 32 28 | 2 0 2 |
11 MATHEW R. LUDWIGSON Max:30 S2 01 | 30 16 14 | 0 0 0 |
21 MATHEW R. LUDWIGSON Max:30 S2 02 | 30 16 14 | 2 0 2 |
Number of Sections: 2 Average Students Per Section: 30.00
HOM610 HOME EC 6 SM 1 120 54| 54 33 21 | 3 1 2 |
42 VALERIE E. BRYANT Max:30 S2 04 | 27 19 8 | 0 0 0 |
52 VALERIE E. BRYANT Max:30 S2 05 | 27 14 13 | 3 1 2 |
Number of Sections: 2 Average Students Per Section: 27.00
HOM710 HOME EC 7 SM 1 120 42| 42 17 25 | 3 0 3 |
12 VALERIE E. BRYANT Max:30 S2 01 | 21 6 15 | 1 0 1 |
32 VALERIE E. BRYANT Max:30 S2 03 | 21 11 10 | 2 0 2 |
Number of Sections: 2 Average Students Per Section: 21.00
LAN112 YEARBOOK 2 SM 1 21 20| 20 10 10 | 0 0 0 |
62 ALETHEA C. DOZIER Max:21 S2 06 | 20 10 10 | 0 0 0 |

1sonyr01.p 38-2 CASCADE MIDDLE SCHOOL 03/02/15 Page:4
05.14.10.00.00 Course/Class Count Report 202 2:53 PM
EST NBR NBR ----TOTALS---- --Special Ed--
COURSE DESCRIPTION LGTH SEC AVL REQ TOT FEM MAL TOT FEM MAL
Number of Sections: 1 Average Students Per Section: 20.00
LAN602 LAN ARTS 6 2 SM 1 240 178| 178 75 103 | 24 9 15 |
11 JULIE K. KOVASH Max:30 S2 01 | 18 9 9 | 3 1 2 |
21 JULIE K. KOVASH Max:30 S2 02 | 21 7 14 | 2 0 2 |
31 JULIE K. KOVASH Max:30 S2 03 | 25 11 14 | 4 2 2 |
41 JULIE K. KOVASH Max:30 S2 04 | 26 13 13 | 4 1 3 |
42 SANDRA L. LUETTGEN Max:30 S2 04 | 20 9 11 | 2 1 1 |
52 SANDRA L. LUETTGEN Max:30 S2 05 | 23 11 12 | 3 3 0 |
61 JULIE K. KOVASH Max:30 S2 06 | 24 8 16 | 5 0 5 |
62 SANDRA L. LUETTGEN Max:30 S2 06 | 21 7 14 | 1 1 0 |
Number of Sections: 8 Average Students Per Section: 22.25
LAN612 HON LA 6 2 SM 1 60 54| 54 33 21 | 0 0 0 |
12 SANDRA L. LUETTGEN Max:30 S2 01 | 26 15 11 | 0 0 0 |
22 SANDRA L. LUETTGEN Max:30 S2 02 | 28 18 10 | 0 0 0 |
Number of Sections: 2 Average Students Per Section: 27.00
LAN652 TITLE READ 6 2 SM 1 75 56| 56 24 32 | 3 3 0 |
11 KARLY N. JONASSON Max:15 S2 01 | 13 7 6 | 0 0 0 |
31 KARLY N. JONASSON Max:15 S2 03 | 8 2 6 | 0 0 0 |
41 KARLY N. JONASSON Max:15 S2 04 | 14 7 7 | 2 2 0 |
51 KARLY N. JONASSON Max:15 S2 05 | 12 7 5 | 1 1 0 |
61 KARLY N. JONASSON Max:15 S2 06 | 9 1 8 | 0 0 0 |
Number of Sections: 5 Average Students Per Section: 11.20
LAN702 LANG ARTS 7 2 SM 1 270 195| 195 83 112 | 17 4 13 |
11 KANIKA L. WATKINS Max:30 S2 01 | 21 9 12 | 2 1 1 |
12 JOEL R. MACDOUGALL Max:30 S2 01 | 28 14 14 | 3 1 2 |
21 KANIKA L. WATKINS Max:30 S2 02 | 18 8 10 | 2 0 2 |
22 JOEL R. MACDOUGALL Max:30 S2 02 | 14 5 9 | 0 0 0 |
31 KANIKA L. WATKINS Max:30 S2 03 | 22 12 10 | 0 0 0 |
42 JOEL R. MACDOUGALL Max:30 S2 04 | 25 10 15 | 5 1 4 |
51 KANIKA L. WATKINS Max:30 S2 05 | 23 12 11 | 1 0 1 |
52 JOEL R. MACDOUGALL Max:30 S2 05 | 23 5 18 | 1 0 1 |
61 KANIKA L. WATKINS Max:30 S2 06 | 21 8 13 | 3 1 2 |
Number of Sections: 9 Average Students Per Section: 21.67
LAN712 HON LA 7 2 SM 1 30 29| 29 18 11 | 0 0 0 |
32 JOEL R. MACDOUGALL Max:30 S2 03 | 29 18 11 | 0 0 0 |
Number of Sections: 1 Average Students Per Section: 29.00
LAN802 LANG ARTS 8 2 SM 1 240 228| 228 101 127 | 26 10 16 |
11 AMY J. SLEETH Max:30 S2 01 | 27 14 13 | 3 2 1 |
12 ALETHEA C. DOZIER Max:30 S2 01 | 27 11 16 | 3 1 2 |
22 ALETHEA C. DOZIER Max:30 S2 02 | 25 12 13 | 6 2 4 |
31 AMY J. SLEETH Max:30 S2 03 | 30 13 17 | 4 1 3 |
32 ALETHEA C. DOZIER Max:30 S2 03 | 29 10 19 | 4 0 4 |
41 AMY J. SLEETH Max:30 S2 04 | 31 15 16 | 2 2 0 |
51 AMY J. SLEETH Max:30 S2 05 | 30 10 20 | 2 1 1 |
61 AMY J. SLEETH Max:30 S2 06 | 29 16 13 | 2 1 1 |
Number of Sections: 8 Average Students Per Section: 28.50
LAN812 HON LA 8 2 SM 1 30 23| 23 14 9 | 0 0 0 |
52 ALETHEA C. DOZIER Max:30 S2 05 | 23 14 9 | 0 0 0 |
Number of Sections: 1 Average Students Per Section: 23.00
LAN852 TITLE READ 8 2 SM 1 30 0| 0 0 0 | 0 0 0 |
12 KARLY N. JONASSON Max:30 S2 01 | 0 0 0 | 0 0 0 |
Number of Sections: 1 Average Students Per Section: 0.00
MAT081 MATH FOUND 1B SM 1 75 66| 66 30 36 | 3 0 3 |
13 PAULETTE T. FONDA Max:15 S2 01 | 13 6 7 | 0 0 0 |
23 PAULETTE T. FONDA Max:15 S2 02 | 12 4 8 | 0 0 0 |
33 PAULETTE T. FONDA Max:15 S2 03 | 13 8 5 | 1 0 1 |

1sonyr01.p 38-2 CASCADE MIDDLE SCHOOL 03/02/15 Page:5
05.14.10.00.00 Course/Class Count Report 202 2:53 PM
EST NBR NBR ----TOTALS---- --Special Ed--
COURSE DESCRIPTION LGTH SEC AVL REQ TOT FEM MAL TOT FEM MAL
53 PAULETTE T. FONDA Max:15 S2 05 | 12 3 9 | 2 0 2 |
63 PAULETTE T. FONDA Max:15 S2 06 | 16 9 7 | 0 0 0 |
Number of Sections: 5 Average Students Per Section: 13.20
MAT102 MATH 102 SM 1 270 205| 205 95 110 | 23 9 14 |
11 DENISE M. BAXTER Max:30 S2 01 | 18 10 8 | 4 2 2 |
12 JENNY HOMFELDT Max:30 S2 01 | 21 8 13 | 2 1 1 |
21 DENISE M. BAXTER Max:30 S2 02 | 20 10 10 | 1 1 0 |
22 JENNY HOMFELDT Max:30 S2 02 | 25 12 13 | 0 0 0 |
31 DENISE M. BAXTER Max:30 S2 03 | 28 13 15 | 3 0 3 |
32 JENNY HOMFELDT Max:30 S2 03 | 28 11 17 | 5 2 3 |
42 JENNY HOMFELDT Max:30 S2 04 | 20 8 12 | 0 0 0 |
51 DENISE M. BAXTER Max:30 S2 05 | 28 15 13 | 3 1 2 |
61 DENISE M. BAXTER Max:30 S2 06 | 17 8 9 | 5 2 3 |
Number of Sections: 9 Average Students Per Section: 22.78
MAT202 MATH 202 SM 1 270 189| 189 82 107 | 15 5 10 |
12 QUYNH N. TAYLOR Max:30 S2 01 | 17 8 9 | 2 0 2 |
21 SHAYNA E. BROWN Max:30 S2 02 | 21 8 13 | 3 1 2 |
22 QUYNH N. TAYLOR Max:30 S2 02 | 18 9 9 | 0 0 0 |
31 SHAYNA E. BROWN Max:30 S2 03 | 20 8 12 | 0 0 0 |
32 QUYNH N. TAYLOR Max:30 S2 03 | 26 14 12 | 2 2 0 |
41 SHAYNA E. BROWN Max:30 S2 04 | 28 10 18 | 5 1 4 |
51 SHAYNA E. BROWN Max:30 S2 05 | 16 4 12 | 3 1 2 |
52 QUYNH N. TAYLOR Max:30 S2 05 | 19 10 9 | 0 0 0 |
53 JENNY HOMFELDT Max:30 S2 05 | 24 11 13 | 0 0 0 |
Number of Sections: 9 Average Students Per Section: 21.00
MAT302 MATH 302 SM 1 239 210| 210 104 106 | 26 10 16 |
11 SANDRA L. HALFORD Max:30 S2 01 | 26 9 17 | 8 3 5 |
12 CHARLES R. CHEW JR Max:30 S2 01 | 27 14 13 | 3 0 3 |
21 SANDRA L. HALFORD Max:30 S2 02 | 23 13 10 | 3 2 1 |
22 CHARLES R. CHEW JR Max:30 S2 02 | 24 9 15 | 4 1 3 |
31 SANDRA L. HALFORD Max:29 S2 03 | 25 16 9 | 5 3 2 |
32 CHARLES R. CHEW JR Max:30 S2 03 | 26 10 16 | 2 1 1 |
41 SANDRA L. HALFORD Max:30 S2 04 | 28 15 13 | 1 0 1 |
63 SHAYNA E. BROWN Max:30 S2 06 | 31 18 13 | 0 0 0 |
Number of Sections: 8 Average Students Per Section: 26.25
MAT402 ALGEBRA 2 SM 1 90 77| 77 35 42 | 0 0 0 |
52 CHARLES R. CHEW JR Max:30 S2 05 | 26 9 17 | 0 0 0 |
62 CHARLES R. CHEW JR Max:30 S2 06 | 29 14 15 | 0 0 0 |
63 QUYNH N. TAYLOR Max:30 S2 06 | 22 12 10 | 0 0 0 |
Number of Sections: 3 Average Students Per Section: 25.67
MAT502 GEOMETRY 2 SM 1 30 24| 24 9 15 | 0 0 0 |
61 SANDRA L. HALFORD Max:30 S2 06 | 24 9 15 | 0 0 0 |
Number of Sections: 1 Average Students Per Section: 24.00
MUS610 MUSIC SURVEY 6 SM 1 58 23| 23 12 11 | 0 0 0 |
62 KELLI A. TAYLOR Max:29 S2 06 | 23 12 11 | 0 0 0 |
Number of Sections: 1 Average Students Per Section: 23.00
MUS613 CHOIR SM 1 200 55| 55 45 10 | 4 2 2 |
52 MELISSA L. NEWMAN Max:50 S2 05 | 28 21 7 | 3 1 2 |
62 MELISSA L. NEWMAN Max:50 S2 06 | 27 24 3 | 1 1 0 |
Number of Sections: 2 Average Students Per Section: 27.50
MUS622 BAND 6 2 SM 1 45 29| 29 13 16 | 2 1 1 |
31 KELLI A. TAYLOR Max:45 S2 03 | 29 13 16 | 2 1 1 |
Number of Sections: 1 Average Students Per Section: 29.00
MUS632 ORCHESTRA 6 2 SM 1 45 19| 19 12 7 | 1 0 1 |
31 DAVID L. STAFFORD Max:45 S2 03 | 19 12 7 | 1 0 1 |

1sonyr01.p 38-2 CASCADE MIDDLE SCHOOL 03/02/15 Page:6
05.14.10.00.00 Course/Class Count Report 202 2:53 PM
EST NBR NBR ----TOTALS---- --Special Ed--
COURSE DESCRIPTION LGTH SEC AVL REQ TOT FEM MAL TOT FEM MAL
Number of Sections: 1 Average Students Per Section: 19.00
MUS722 BAND 7 2 SM 1 45 18| 18 11 7 | 1 1 0 |
41 KELLI A. TAYLOR Max:45 S2 04 | 18 11 7 | 1 1 0 |
Number of Sections: 1 Average Students Per Section: 18.00
MUS822 BAND 8 2 SM 1 45 24| 24 11 13 | 0 0 0 |
21 KELLI A. TAYLOR Max:45 S2 02 | 24 11 13 | 0 0 0 |
Number of Sections: 1 Average Students Per Section: 24.00
MUS832 ORCHESTRA 8 2 SM 1 45 38| 38 25 13 | 2 2 0 |
22 DAVID L. STAFFORD Max:45 S2 02 | 38 25 13 | 2 2 0 |
Number of Sections: 1 Average Students Per Section: 38.00
PHY001 PHYS ED A SM 1 60 32| 32 9 23 | 2 0 2 |
42 DANIEL A. MCNEESE Max:30 S2 04 | 32 9 23 | 2 0 2 |
Number of Sections: 1 Average Students Per Section: 32.00
PHY002 PHYS ED B SM 1 60 31| 31 16 15 | 0 0 0 |
52 DANIEL A. MCNEESE Max:30 S2 05 | 31 16 15 | 0 0 0 |
Number of Sections: 1 Average Students Per Section: 31.00
PHY612 PHYS ED 6B SM 1 140 73| 73 29 44 | 24 9 15 |
11 LEAH C. SANDLIAN Max:30 S2 01 | 19 4 15 | 1 0 1 |
21 LEAH C. SANDLIAN Max:30 S2 02 | 18 8 10 | 3 1 2 |
31 LEAH C. SANDLIAN Max:30 S2 03 | 0 0 0 | 0 0 0 |
53 LEAH C. SANDLIAN Max:20 S2 05 | 19 8 11 | 19 8 11 |
61 LEAH C. SANDLIAN Max:30 S2 06 | 17 9 8 | 1 0 1 |
Number of Sections: 5 Average Students Per Section: 14.60
PHY712 PHYS ED 7B SM 1 168 122| 122 36 86 | 9 1 8 |
11 DANIEL A. MCNEESE Max:30 S2 01 | 27 7 20 | 3 1 2 |
22 DANIEL A. MCNEESE Max:36 S2 02 | 27 10 17 | 1 0 1 |
32 DANIEL A. MCNEESE Max:30 S2 03 | 19 6 13 | 0 0 0 |
52 MATHEW R. LUDWIGSON Max:36 S2 05 | 21 5 16 | 2 0 2 |
62 MATHEW R. LUDWIGSON Max:36 S2 06 | 28 8 20 | 3 0 3 |
Number of Sections: 5 Average Students Per Section: 24.40
PHY812 PHYS ED 8B SM 1 180 153| 153 54 99 | 11 4 7 |
11 KEITH D. RAY Max:30 S2 01 | 23 6 17 | 0 0 0 |
31 KEITH D. RAY Max:30 S2 03 | 18 7 11 | 2 1 1 |
41 KEITH D. RAY Max:30 S2 04 | 27 7 20 | 2 0 2 |
42 MATHEW R. LUDWIGSON Max:30 S2 04 | 27 13 14 | 0 0 0 |
51 KEITH D. RAY Max:30 S2 05 | 29 9 20 | 5 2 3 |
61 KEITH D. RAY Max:30 S2 06 | 29 12 17 | 2 1 1 |
Number of Sections: 6 Average Students Per Section: 25.50
SCI151 BIOLOGY 2 SM 1 30 29| 29 15 14 | 0 0 0 |
11 MELISSA K. MESSMER Max:30 S2 01 | 29 15 14 | 0 0 0 |
Number of Sections: 1 Average Students Per Section: 29.00
SCI501 ACCELR SCIENCE SM 1 60 30| 30 16 14 | 0 0 0 |
42 CASEY A. KILLETT Max:30 S2 04 | 30 16 14 | 0 0 0 |
Number of Sections: 1 Average Students Per Section: 30.00
SCI602 SCIENCE 6 2 SM 1 294 234| 234 108 126 | 25 9 16 |
11 KANDI M. FIELDS Max:30 S2 01 | 23 8 15 | 1 0 1 |
22 CORRIE L. AGNEW Max:30 S2 02 | 21 12 9 | 2 2 0 |
31 KANDI M. FIELDS Max:30 S2 03 | 29 17 12 | 2 2 0 |
32 CORRIE L. AGNEW Max:30 S2 03 | 27 11 16 | 2 2 0 |
41 KANDI M. FIELDS Max:30 S2 04 | 22 15 7 | 1 0 1 |
42 CORRIE L. AGNEW Max:24 S2 04 | 24 8 16 | 8 3 5 |
51 KANDI M. FIELDS Max:30 S2 05 | 25 11 14 | 3 0 3 |
52 CORRIE L. AGNEW Max:30 S2 05 | 24 12 12 | 4 0 4 |
61 KANDI M. FIELDS Max:30 S2 06 | 21 7 14 | 2 0 2 |
62 CORRIE L. AGNEW Max:30 S2 06 | 18 7 11 | 0 0 0 |

1sonyr01.p 38-2 CASCADE MIDDLE SCHOOL 03/02/15 Page:7
05.14.10.00.00 Course/Class Count Report 202 2:53 PM
EST NBR NBR ----TOTALS---- --Special Ed--
COURSE DESCRIPTION LGTH SEC AVL REQ TOT FEM MAL TOT FEM MAL
Number of Sections: 10 Average Students Per Section: 23.40
SCI702 SCIENCE 7 2 SM 1 264 196| 196 86 110 | 19 5 14 |
11 CASEY A. KILLETT Max:30 S2 01 | 20 12 8 | 2 1 1 |
12 JUSTIN W. MENTINK Max:30 S2 01 | 26 12 14 | 0 0 0 |
21 CASEY A. KILLETT Max:24 S2 02 | 17 6 11 | 7 1 6 |
22 JUSTIN W. MENTINK Max:30 S2 02 | 20 7 13 | 0 0 0 |
31 CASEY A. KILLETT Max:30 S2 03 | 19 5 14 | 2 0 2 |
42 JUSTIN W. MENTINK Max:30 S2 04 | 27 15 12 | 2 1 1 |
52 JUSTIN W. MENTINK Max:30 S2 05 | 19 12 7 | 0 0 0 |
61 CASEY A. KILLETT Max:30 S2 06 | 21 9 12 | 3 1 2 |
62 JUSTIN W. MENTINK Max:30 S2 06 | 27 8 19 | 3 1 2 |
Number of Sections: 9 Average Students Per Section: 21.78
SCI802 SCIENCE 8 2 SM 1 270 224| 224 101 123 | 28 11 17 |
12 JESSE W. KINKEAD Max:30 S2 01 | 27 11 16 | 3 2 1 |
21 JESSE W. KINKEAD Max:30 S2 02 | 19 6 13 | 2 0 2 |
22 MELISSA K. MESSMER Max:30 S2 02 | 18 8 10 | 3 2 1 |
31 JESSE W. KINKEAD Max:30 S2 03 | 24 11 13 | 1 1 0 |
41 JESSE W. KINKEAD Max:30 S2 04 | 31 13 18 | 1 0 1 |
42 MELISSA K. MESSMER Max:30 S2 04 | 26 12 14 | 1 0 1 |
52 MELISSA K. MESSMER Max:30 S2 05 | 27 17 10 | 4 0 4 |
61 JESSE W. KINKEAD Max:30 S2 06 | 27 13 14 | 7 4 3 |
62 MELISSA K. MESSMER Max:30 S2 06 | 25 10 15 | 6 2 4 |
Number of Sections: 9 Average Students Per Section: 24.89
SOC250 WORLD CULTURES SM 1 60 25| 25 9 16 | 0 0 0 |
22 VALERIE E. BRYANT Max:30 S2 02 | 25 9 16 | 0 0 0 |
Number of Sections: 1 Average Students Per Section: 25.00
SOC602 SOC STUDIES 6 2 SM 1 240 180| 180 75 105 | 25 9 16 |
11 LORI J. SERAME Max:30 S2 01 | 21 9 12 | 3 0 3 |
21 LORI J. SERAME Max:30 S2 02 | 24 12 12 | 1 1 0 |
31 LORI J. SERAME Max:30 S2 03 | 24 10 14 | 5 0 5 |
41 LORI J. SERAME Max:30 S2 04 | 26 10 16 | 6 2 4 |
42 KEVIN P. OLSON Max:30 S2 04 | 25 9 16 | 2 0 2 |
52 KEVIN P. OLSON Max:30 S2 05 | 26 11 15 | 3 2 1 |
61 LORI J. SERAME Max:30 S2 06 | 16 6 10 | 1 1 0 |
62 KEVIN P. OLSON Max:30 S2 06 | 18 8 10 | 4 3 1 |
Number of Sections: 8 Average Students Per Section: 22.50
SOC612 HON SOC STD 6 2 SM 1 60 54| 54 33 21 | 0 0 0 |
12 KEVIN P. OLSON Max:30 S2 01 | 28 18 10 | 0 0 0 |
22 KEVIN P. OLSON Max:30 S2 02 | 26 15 11 | 0 0 0 |
Number of Sections: 2 Average Students Per Section: 27.00
SOC701 WA ST HISTORY 7 SM 1 270 198| 198 84 114 | 19 5 14 |
11 TIMOTHY D. REAVIS Max:30 S2 01 | 27 11 16 | 4 1 3 |
21 TIMOTHY D. REAVIS Max:30 S2 02 | 15 8 7 | 1 0 1 |
22 KENTON C. BARKER Max:30 S2 02 | 14 4 10 | 2 0 2 |
31 TIMOTHY D. REAVIS Max:30 S2 03 | 25 10 15 | 2 0 2 |
32 KENTON C. BARKER Max:30 S2 03 | 27 8 19 | 1 0 1 |
42 KENTON C. BARKER Max:30 S2 04 | 28 14 14 | 5 2 3 |
51 TIMOTHY D. REAVIS Max:30 S2 05 | 18 9 9 | 0 0 0 |
52 KENTON C. BARKER Max:30 S2 05 | 17 6 11 | 2 1 1 |
61 TIMOTHY D. REAVIS Max:30 S2 06 | 27 14 13 | 2 1 1 |
Number of Sections: 9 Average Students Per Section: 22.00
SOC711 HON WA ST HIST7 SM 1 30 29| 29 18 11 | 0 0 0 |
12 KENTON C. BARKER Max:30 S2 01 | 29 18 11 | 0 0 0 |
Number of Sections: 1 Average Students Per Section: 29.00
SOC802 US HISTORY 8 2 SM 1 270 229| 229 102 127 | 28 11 17 |
12 STEVEN HOMFELDT Max:30 S2 01 | 27 12 15 | 8 3 5 |

1sonyr01.p 38-2 CASCADE MIDDLE SCHOOL 03/02/15 Page:8
05.14.10.00.00 Course/Class Count Report 202 2:53 PM
EST NBR NBR ----TOTALS---- --Special Ed--
COURSE DESCRIPTION LGTH SEC AVL REQ TOT FEM MAL TOT FEM MAL
21 DEAN Y. GODFREY Max:30 S2 02 | 17 8 9 | 4 2 2 |
22 STEVEN HOMFELDT Max:30 S2 02 | 22 11 11 | 4 2 2 |
31 DEAN Y. GODFREY Max:30 S2 03 | 29 14 15 | 3 1 2 |
32 STEVEN HOMFELDT Max:30 S2 03 | 25 10 15 | 2 0 2 |
41 DEAN Y. GODFREY Max:30 S2 04 | 29 13 16 | 0 0 0 |
51 DEAN Y. GODFREY Max:30 S2 05 | 26 14 12 | 3 1 2 |
52 STEVEN HOMFELDT Max:30 S2 05 | 30 14 16 | 1 1 0 |
61 DEAN Y. GODFREY Max:30 S2 06 | 24 6 18 | 3 1 2 |
Number of Sections: 9 Average Students Per Section: 25.44
SOC812 HON US HIST 8 2 SM 1 30 23| 23 14 9 | 0 0 0 |
42 STEVEN HOMFELDT Max:30 S2 04 | 23 14 9 | 0 0 0 |
Number of Sections: 1 Average Students Per Section: 23.00
SPE012 MATH SE 2 SM 1 0 0| 0 0 0 | 0 0 0 |
SPE042 LANG ARTS SE 2 SM 1 105 59| 59 17 42 | 58 17 41 |
22 NORMA F. KING Max:15 S2 02 | 17 4 13 | 16 4 12 |
32 NORMA F. KING Max:15 S2 03 | 10 3 7 | 10 3 7 |
42 NORMA F. KING Max:30 S2 04 | 10 3 7 | 10 3 7 |
52 NORMA F. KING Max:30 S2 05 | 12 5 7 | 12 5 7 |
62 NORMA F. KING Max:15 S2 06 | 10 2 8 | 10 2 8 |
Number of Sections: 5 Average Students Per Section: 11.80
SPE102 STRUC LEARN 2 SM 1 300 122| 122 55 67 | 122 55 67 |
11 AARON S. LEE Max:30 S2 01 | 12 4 8 | 12 4 8 |
12 MARILYN R. MEAD Max:30 S2 01 | 12 7 5 | 12 7 5 |
21 AARON S. LEE Max:30 S2 02 | 12 4 8 | 12 4 8 |
22 MARILYN R. MEAD Max:30 S2 02 | 12 7 5 | 12 7 5 |
31 AARON S. LEE Max:30 S2 03 | 12 4 8 | 12 4 8 |
32 MARILYN R. MEAD Max:30 S2 03 | 13 7 6 | 13 7 6 |
41 AARON S. LEE Max:30 S2 04 | 11 4 7 | 11 4 7 |
42 MARILYN R. MEAD Max:30 S2 04 | 13 7 6 | 13 7 6 |
61 AARON S. LEE Max:30 S2 06 | 12 4 8 | 12 4 8 |
62 MARILYN R. MEAD Max:30 S2 06 | 13 7 6 | 13 7 6 |
Number of Sections: 10 Average Students Per Section: 12.20
SPE632 MATH SE 6 2 SM 1 15 11| 11 4 7 | 11 4 7 |
11 REBECCA A. RAMIREZ-DI Max:15 S2 01 | 11 4 7 | 11 4 7 |
Number of Sections: 1 Average Students Per Section: 11.00
SPE732 MATH SE 7 2 SM 1 45 16| 16 5 11 | 16 5 11 |
32 REBECCA A. RAMIREZ-DI Max:15 S2 03 | 3 1 2 | 3 1 2 |
52 REBECCA A. RAMIREZ-DI Max:30 S2 05 | 13 4 9 | 13 4 9 |
Number of Sections: 2 Average Students Per Section: 8.00
SPE832 MATH SE 8 2 SM 1 45 15| 15 6 9 | 15 6 9 |
42 REBECCA A. RAMIREZ-DI Max:15 S2 04 | 9 4 5 | 9 4 5 |
52 REBECCA A. RAMIREZ-DI Max:15 S2 05 | 0 0 0 | 0 0 0 |
62 REBECCA A. RAMIREZ-DI Max:15 S2 06 | 6 2 4 | 6 2 4 |
Number of Sections: 3 Average Students Per Section: 5.00

1sonyr01.p 38-2 CASCADE MIDDLE SCHOOL 03/02/15 Page:9
05.14.10.00.00 Course/Class Count Report Totals 2:53 PM
TITLE FOR TOTAL
TOTALS GROUP TOTAL FEMALE MALE
GRAND TOTALS 4483 2044 2439
Special Ed 597 222 375
************************ End of report ************************
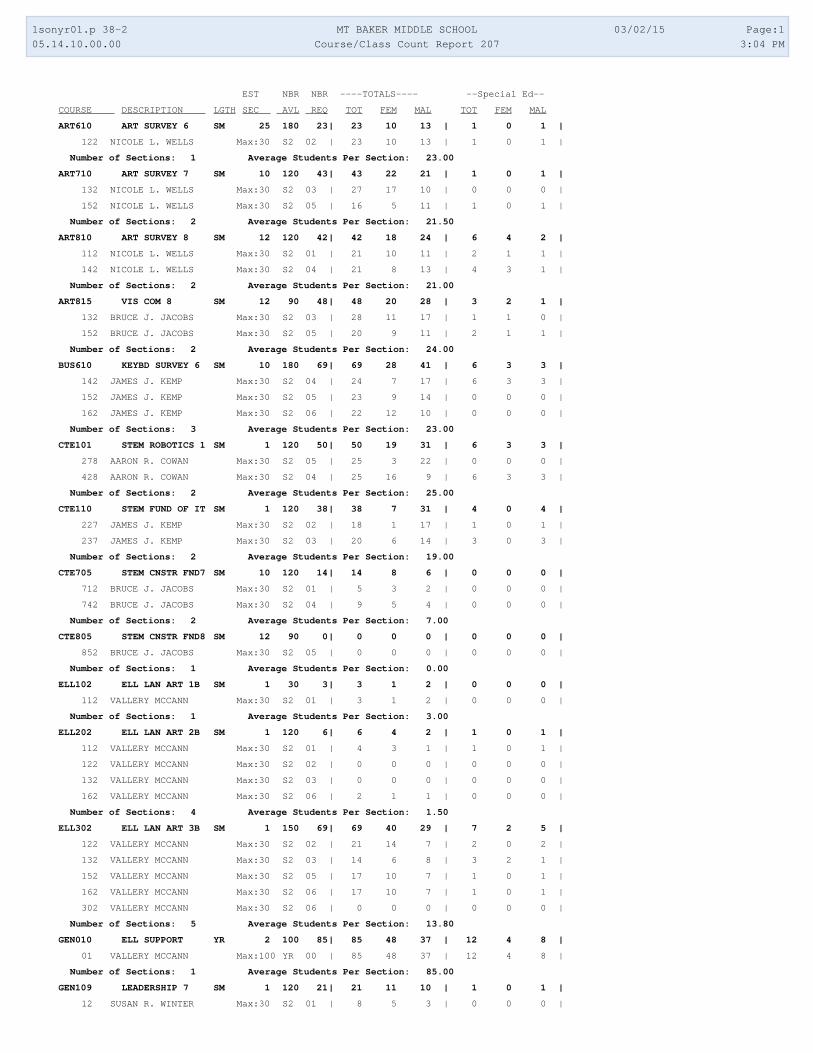
1sonyr01.p 38-2 MT BAKER MIDDLE SCHOOL 03/02/15 Page:1
05.14.10.00.00 Course/Class Count Report 207 3:04 PM
EST NBR NBR ----TOTALS---- --Special Ed--
COURSE DESCRIPTION LGTH SEC AVL REQ TOT FEM MAL TOT FEM MAL
ART610 ART SURVEY 6 SM 25 180 23| 23 10 13 | 1 0 1 |
122 NICOLE L. WELLS Max:30 S2 02 | 23 10 13 | 1 0 1 |
Number of Sections: 1 Average Students Per Section: 23.00
ART710 ART SURVEY 7 SM 10 120 43| 43 22 21 | 1 0 1 |
132 NICOLE L. WELLS Max:30 S2 03 | 27 17 10 | 0 0 0 |
152 NICOLE L. WELLS Max:30 S2 05 | 16 5 11 | 1 0 1 |
Number of Sections: 2 Average Students Per Section: 21.50
ART810 ART SURVEY 8 SM 12 120 42| 42 18 24 | 6 4 2 |
112 NICOLE L. WELLS Max:30 S2 01 | 21 10 11 | 2 1 1 |
142 NICOLE L. WELLS Max:30 S2 04 | 21 8 13 | 4 3 1 |
Number of Sections: 2 Average Students Per Section: 21.00
ART815 VIS COM 8 SM 12 90 48| 48 20 28 | 3 2 1 |
132 BRUCE J. JACOBS Max:30 S2 03 | 28 11 17 | 1 1 0 |
152 BRUCE J. JACOBS Max:30 S2 05 | 20 9 11 | 2 1 1 |
Number of Sections: 2 Average Students Per Section: 24.00
BUS610 KEYBD SURVEY 6 SM 10 180 69| 69 28 41 | 6 3 3 |
142 JAMES J. KEMP Max:30 S2 04 | 24 7 17 | 6 3 3 |
152 JAMES J. KEMP Max:30 S2 05 | 23 9 14 | 0 0 0 |
162 JAMES J. KEMP Max:30 S2 06 | 22 12 10 | 0 0 0 |
Number of Sections: 3 Average Students Per Section: 23.00
CTE101 STEM ROBOTICS 1 SM 1 120 50| 50 19 31 | 6 3 3 |
278 AARON R. COWAN Max:30 S2 05 | 25 3 22 | 0 0 0 |
428 AARON R. COWAN Max:30 S2 04 | 25 16 9 | 6 3 3 |
Number of Sections: 2 Average Students Per Section: 25.00
CTE110 STEM FUND OF IT SM 1 120 38| 38 7 31 | 4 0 4 |
227 JAMES J. KEMP Max:30 S2 02 | 18 1 17 | 1 0 1 |
237 JAMES J. KEMP Max:30 S2 03 | 20 6 14 | 3 0 3 |
Number of Sections: 2 Average Students Per Section: 19.00
CTE705 STEM CNSTR FND7 SM 10 120 14| 14 8 6 | 0 0 0 |
712 BRUCE J. JACOBS Max:30 S2 01 | 5 3 2 | 0 0 0 |
742 BRUCE J. JACOBS Max:30 S2 04 | 9 5 4 | 0 0 0 |
Number of Sections: 2 Average Students Per Section: 7.00
CTE805 STEM CNSTR FND8 SM 12 90 0| 0 0 0 | 0 0 0 |
852 BRUCE J. JACOBS Max:30 S2 05 | 0 0 0 | 0 0 0 |
Number of Sections: 1 Average Students Per Section: 0.00
ELL102 ELL LAN ART 1B SM 1 30 3| 3 1 2 | 0 0 0 |
112 VALLERY MCCANN Max:30 S2 01 | 3 1 2 | 0 0 0 |
Number of Sections: 1 Average Students Per Section: 3.00
ELL202 ELL LAN ART 2B SM 1 120 6| 6 4 2 | 1 0 1 |
112 VALLERY MCCANN Max:30 S2 01 | 4 3 1 | 1 0 1 |
122 VALLERY MCCANN Max:30 S2 02 | 0 0 0 | 0 0 0 |
132 VALLERY MCCANN Max:30 S2 03 | 0 0 0 | 0 0 0 |
162 VALLERY MCCANN Max:30 S2 06 | 2 1 1 | 0 0 0 |
Number of Sections: 4 Average Students Per Section: 1.50
ELL302 ELL LAN ART 3B SM 1 150 69| 69 40 29 | 7 2 5 |
122 VALLERY MCCANN Max:30 S2 02 | 21 14 7 | 2 0 2 |
132 VALLERY MCCANN Max:30 S2 03 | 14 6 8 | 3 2 1 |
152 VALLERY MCCANN Max:30 S2 05 | 17 10 7 | 1 0 1 |
162 VALLERY MCCANN Max:30 S2 06 | 17 10 7 | 1 0 1 |
302 VALLERY MCCANN Max:30 S2 06 | 0 0 0 | 0 0 0 |
Number of Sections: 5 Average Students Per Section: 13.80
GEN010 ELL SUPPORT YR 2 100 85| 85 48 37 | 12 4 8 |
01 VALLERY MCCANN Max:100 YR 00 | 85 48 37 | 12 4 8 |
Number of Sections: 1 Average Students Per Section: 85.00
GEN109 LEADERSHIP 7 SM 1 120 21| 21 11 10 | 1 0 1 |
12 SUSAN R. WINTER Max:30 S2 01 | 8 5 3 | 0 0 0 |

1sonyr01.p 38-2 MT BAKER MIDDLE SCHOOL 03/02/15 Page:2
05.14.10.00.00 Course/Class Count Report 207 3:04 PM
EST NBR NBR ----TOTALS---- --Special Ed--
COURSE DESCRIPTION LGTH SEC AVL REQ TOT FEM MAL TOT FEM MAL
62 SUSAN R. WINTER Max:30 S2 06 | 13 6 7 | 1 0 1 |
Number of Sections: 2 Average Students Per Section: 10.50
GEN110 LEADERSHIP 6 SM 1 60 20| 20 7 13 | 3 0 3 |
32 SHARON J. LINDGREN Max:30 S2 03 | 20 7 13 | 3 0 3 |
Number of Sections: 1 Average Students Per Section: 20.00
GEN111 LEADERSHIP 7/8 SM 21 60 22| 22 15 7 | 2 1 1 |
112 ANN B. DURHAM Max:30 S2 06 | 22 15 7 | 2 1 1 |
Number of Sections: 1 Average Students Per Section: 22.00
GEN113 LEADERSHP 6/7/8 SM 10 60 21| 21 7 14 | 0 0 0 |
162 SHARON J. LINDGREN Max:30 S2 06 | 21 7 14 | 0 0 0 |
Number of Sections: 1 Average Students Per Section: 21.00
GEN303 @ARHS GEOMETRY SM 1 60 1| 1 1 0 | 0 0 0 |
21 <None> Max:30 S2 01 | 1 1 0 | 0 0 0 |
Number of Sections: 1 Average Students Per Section: 1.00
GEN350 RELEASE TIME SM 1 60 1| 1 1 0 | 0 0 0 |
21 <None> Max:30 S2 02 | 1 1 0 | 0 0 0 |
Number of Sections: 1 Average Students Per Section: 1.00
GEN710 TEACHERS AIDE 7 SM 1 615 14| 14 11 3 | 1 0 1 |
161 MICALA H. ROOT Max:30 S2 06 | 1 1 0 | 0 0 0 |
222 MICALA H. ROOT Max:25 S2 02 | 1 1 0 | 0 0 0 |
223 KATHY LANTZ Max:25 S2 03 | 1 1 0 | 0 0 0 |
252 PENNI J. SWANSON Max:25 S2 05 | 1 1 0 | 0 0 0 |
266 SUSAN M. BUHR Max:25 S2 06 | 1 1 0 | 0 0 0 |
722 JACQUELIN S. UTU Max:30 S2 01 | 1 1 0 | 0 0 0 |
723 MARCIA L. DARRAH Max:25 S2 03 | 1 0 1 | 1 0 1 |
726 SHARON J. LINDGREN Max:30 S2 06 | 1 1 0 | 0 0 0 |
732 SALLY J. KOENIG Max:25 S2 03 | 1 1 0 | 0 0 0 |
733 JACQUELIN S. UTU Max:25 S2 03 | 1 1 0 | 0 0 0 |
742 BENJAMIN FIGUEROA Max:25 S2 04 | 1 0 1 | 0 0 0 |
752 SUSAN D. MILLANG Max:25 S2 05 | 1 1 0 | 0 0 0 |
762 MICALA H. ROOT Max:25 S2 06 | 0 0 0 | 0 0 0 |
764 JACQUELIN S. UTU Max:25 S2 04 | 1 0 1 | 0 0 0 |
766 JACQUELIN S. UTU Max:25 S2 06 | 1 1 0 | 0 0 0 |
Number of Sections: 15 Average Students Per Section: 0.93
GEN810 TEACHERS AIDE 8 SM 3 2109 39| 39 22 17 | 3 2 1 |
099 VICKI L. ARMSTRONG Max:30 S2 01 | 1 1 0 | 0 0 0 |
101 NICHOLAS W. JOHNSON Max:30 S2 02 | 1 0 1 | 0 0 0 |
102 ANDREA L. ACUNA Max:30 S2 03 | 1 1 0 | 0 0 0 |
109 REBECCA A. MARCOTTE Max:30 S2 02 | 1 1 0 | 0 0 0 |
111 SHARON J. LINDGREN Max:30 S2 01 | 1 1 0 | 0 0 0 |
112 ERIN B. CARNAHAN Max:30 S2 03 | 0 0 0 | 0 0 0 |
113 CHRISTINE A. THORINGT Max:30 S2 06 | 1 0 1 | 0 0 0 |
115 JEREMIAH D. CARTER Max:30 S2 05 | 2 0 2 | 0 0 0 |
116 STACEY K. ROGERS Max:30 S2 06 | 1 1 0 | 0 0 0 |
117 SUSAN D. MILLANG Max:30 S2 06 | 1 0 1 | 0 0 0 |
118 CHRISTINE A. THORINGT Max:30 S2 02 | 1 1 0 | 0 0 0 |
121 JEREMIAH D. CARTER Max:30 S2 05 | 0 0 0 | 0 0 0 |
122 ERIN B. CARNAHAN Max:30 S2 02 | 1 1 0 | 0 0 0 |
123 ANN B. DURHAM Max:30 S2 01 | 1 1 0 | 0 0 0 |
124 DEBORAH M. CALKINS Max:30 S2 05 | 1 1 0 | 1 1 0 |
125 JAMES A. CHAR Max:30 S2 05 | 1 1 0 | 0 0 0 |
126 VALLERY MCCANN Max:30 S2 06 | 1 0 1 | 0 0 0 |
127 VALLERY MCCANN Max:30 S2 02 | 2 1 1 | 0 0 0 |
129 DIXIE L. TOY Max:30 S2 03 | 0 0 0 | 0 0 0 |
130 MARGERY A. DAVIS Max:30 S2 02 | 1 0 1 | 0 0 0 |
131 MARCIA L. DARRAH Max:30 S2 01 | 1 0 1 | 1 0 1 |

1sonyr01.p 38-2 MT BAKER MIDDLE SCHOOL 03/02/15 Page:3
05.14.10.00.00 Course/Class Count Report 207 3:04 PM
EST NBR NBR ----TOTALS---- --Special Ed--
COURSE DESCRIPTION LGTH SEC AVL REQ TOT FEM MAL TOT FEM MAL
135 SHARI M. NELSON Max:30 S2 01 | 1 1 0 | 0 0 0 |
152 KENNETH D. PERMAN Max:30 S2 05 | 1 0 1 | 0 0 0 |
231 SUSAN D. MILLANG Max:30 S2 03 | 1 0 1 | 0 0 0 |
240 CORRIE A. CARSTENS Max:30 S2 06 | 1 1 0 | 0 0 0 |
242 DENA L. WALKER Max:30 S2 04 | 0 0 0 | 0 0 0 |
262 DENA L. WALKER Max:30 S2 06 | 2 2 0 | 0 0 0 |
302 REBECCA A. MARCOTTE Max:30 S2 06 | 1 1 0 | 0 0 0 |
312 LINDSEY C. KEATON Max:30 S2 01 | 0 0 0 | 0 0 0 |
317 LINDSEY C. KEATON Max:30 S2 03 | 1 1 0 | 0 0 0 |
33 NICOLE L. WELLS Max:30 S2 03 | 1 1 0 | 0 0 0 |
412 ARLEEN J. BURKHALTER Max:30 S2 01 | 1 1 0 | 0 0 0 |
452 DEBORAH M. CALKINS Max:30 S2 03 | 1 1 0 | 1 1 0 |
552 DENNIS LUBASH Max:30 S2 05 | 1 0 1 | 0 0 0 |
612 JAMES A. CHAR Max:3 S2 01 | 1 0 1 | 0 0 0 |
622 ANNE S. CLARK Max:3 S2 02 | 0 0 0 | 0 0 0 |
626 ANNE S. CLARK Max:3 S2 06 | 1 0 1 | 0 0 0 |
662 JAMES J. KEMP Max:30 S2 06 | 1 0 1 | 0 0 0 |
712 MELINDA A. WHARTON Max:30 S2 01 | 2 1 1 | 0 0 0 |
802 DIXIE L. TOY Max:30 S2 01 | 1 1 0 | 0 0 0 |
862 MATTHEW L. KING Max:30 S2 06 | 1 0 1 | 0 0 0 |
Number of Sections: 41 Average Students Per Section: 0.95
GEN811 OFFICE AIDE 8 SM 3 385 25| 25 15 10 | 1 0 1 |
21 STEVEN C. LEWIS Max:30 S2 01 | 3 2 1 | 0 0 0 |
22 STEVEN C. LEWIS Max:30 S2 02 | 2 2 0 | 0 0 0 |
23 STEVEN C. LEWIS Max:30 S2 03 | 4 1 3 | 0 0 0 |
24 STEVEN C. LEWIS Max:30 S2 04 | 8 4 4 | 1 0 1 |
25 STEVEN C. LEWIS Max:30 S2 05 | 5 4 1 | 0 0 0 |
26 STEVEN C. LEWIS Max:30 S2 06 | 2 2 0 | 0 0 0 |
332 STEVEN C. LEWIS Max:25 S2 03 | 1 0 1 | 0 0 0 |
Number of Sections: 7 Average Students Per Section: 3.57
HLT601 HEALTH 6 SM 1 120 30| 30 17 13 | 2 1 1 |
612 CARMELLA A. DUCA Max:30 S2 01 | 22 12 10 | 2 1 1 |
632 CARMELLA A. DUCA Max:30 S2 03 | 8 5 3 | 0 0 0 |
Number of Sections: 2 Average Students Per Section: 15.00
HLT701 HEALTH 7 SM 10 60 13| 13 5 8 | 0 0 0 |
742 CARMELLA A. DUCA Max:30 S2 04 | 13 5 8 | 0 0 0 |
Number of Sections: 1 Average Students Per Section: 13.00
HLT801 HEALTH 8 1 SM 11 120 40| 40 17 23 | 0 0 0 |
822 CARMELLA A. DUCA Max:30 S2 02 | 23 13 10 | 0 0 0 |
862 CARMELLA A. DUCA Max:30 S2 06 | 17 4 13 | 0 0 0 |
Number of Sections: 2 Average Students Per Section: 20.00
HOM610 HOME EC 6 SM 10 30 22| 22 4 18 | 0 0 0 |
12 ANDREA L. ACUNA Max:15 S2 01 | 22 4 18 | 0 0 0 |
Number of Sections: 1 Average Students Per Section: 22.00
HOM710 HOME EC 7 SM 1 30 11| 11 6 5 | 0 0 0 |
112 ANDREA L. ACUNA Max:15 S2 01 | 11 6 5 | 0 0 0 |
Number of Sections: 1 Average Students Per Section: 11.00
HOM810 HOME EC 8 SM 1 90 46| 46 20 26 | 4 0 4 |
122 ANDREA L. ACUNA Max:15 S2 02 | 17 11 6 | 1 0 1 |
132 ANDREA L. ACUNA Max:15 S2 03 | 29 9 20 | 3 0 3 |
Number of Sections: 2 Average Students Per Section: 23.00
IND610 TECH SURVEY 6 SM 1 60 17| 17 3 14 | 2 0 2 |
62 BRUCE J. JACOBS Max:30 S2 06 | 17 3 14 | 2 0 2 |
Number of Sections: 1 Average Students Per Section: 17.00
LAN151 SPORTS MEDIA SM 1 120 46| 46 17 29 | 2 0 2 |
142 SALLY J. KOENIG Max:30 S2 04 | 25 12 13 | 1 0 1 |

1sonyr01.p 38-2 MT BAKER MIDDLE SCHOOL 03/02/15 Page:4
05.14.10.00.00 Course/Class Count Report 207 3:04 PM
EST NBR NBR ----TOTALS---- --Special Ed--
COURSE DESCRIPTION LGTH SEC AVL REQ TOT FEM MAL TOT FEM MAL
152 SALLY J. KOENIG Max:30 S2 05 | 21 5 16 | 1 0 1 |
Number of Sections: 2 Average Students Per Section: 23.00
LAN520 MEDIA 7 8 SM 22 0 0| 0 0 0 | 0 0 0 |
LAN560 DRAMA 6 7 SM 20 60 29| 29 23 6 | 3 2 1 |
152 JAMES A. CHAR Max:30 S2 05 | 29 23 6 | 3 2 1 |
Number of Sections: 1 Average Students Per Section: 29.00
LAN562 DRAMA 7 8 SM 22 60 29| 29 12 17 | 0 0 0 |
162 JAMES A. CHAR Max:30 S2 06 | 29 12 17 | 0 0 0 |
Number of Sections: 1 Average Students Per Section: 29.00
LAN602 LAN ARTS 6 2 SM 9 270 200| 200 85 115 | 10 1 9 |
122 DENA L. WALKER Max:30 S2 02 | 20 6 14 | 4 0 4 |
132 DENA L. WALKER Max:30 S2 03 | 16 7 9 | 0 0 0 |
142 DENA L. WALKER Max:30 S2 04 | 28 15 13 | 1 0 1 |
212 KATHY LANTZ Max:30 S2 01 | 24 8 16 | 1 0 1 |
222 KATHY LANTZ Max:30 S2 02 | 17 8 9 | 1 0 1 |
242 KATHY LANTZ Max:30 S2 04 | 29 15 14 | 2 1 1 |
252 KATHY LANTZ Max:30 S2 05 | 22 9 13 | 0 0 0 |
432 KEEGAN L. RYAN Max:30 S2 03 | 18 8 10 | 0 0 0 |
442 KEEGAN L. RYAN Max:30 S2 04 | 26 9 17 | 1 0 1 |
Number of Sections: 9 Average Students Per Section: 22.22
LAN612 HON LA 6 2 SM 2 90 85| 85 47 38 | 0 0 0 |
162 DENA L. WALKER Max:30 S2 06 | 28 15 13 | 0 0 0 |
222 CAROLYN M. HUBBELL Max:30 S2 02 | 28 15 13 | 0 0 0 |
632 KATHY LANTZ Max:30 S2 03 | 29 17 12 | 0 0 0 |
Number of Sections: 3 Average Students Per Section: 28.33
LAN652 TITLE READ 6 2 SM 2 30 6| 6 2 4 | 1 0 1 |
112 KIMBERLY F. DETWILER Max:30 S2 06 | 6 2 4 | 1 0 1 |
Number of Sections: 1 Average Students Per Section: 6.00
LAN702 LANG ARTS 7 2 SM 9 300 248| 248 123 125 | 3 0 3 |
042 CORRIE A. CARSTENS Max:30 S2 04 | 27 13 14 | 1 0 1 |
112 ANN B. DURHAM Max:30 S2 01 | 16 5 11 | 0 0 0 |
132 ANN B. DURHAM Max:30 S2 03 | 30 19 11 | 1 0 1 |
232 CAROLYN M. HUBBELL Max:30 S2 03 | 27 15 12 | 0 0 0 |
242 CAROLYN M. HUBBELL Max:30 S2 04 | 29 17 12 | 1 0 1 |
252 CAROLYN M. HUBBELL Max:30 S2 05 | 23 9 14 | 0 0 0 |
262 CAROLYN M. HUBBELL Max:30 S2 06 | 29 12 17 | 0 0 0 |
412 KEEGAN L. RYAN Max:30 S2 01 | 18 10 8 | 0 0 0 |
452 KEEGAN L. RYAN Max:30 S2 05 | 23 11 12 | 0 0 0 |
462 KEEGAN L. RYAN Max:30 S2 06 | 26 12 14 | 0 0 0 |
Number of Sections: 10 Average Students Per Section: 24.80
LAN712 HON LA 7 2 SM 2 60 57| 57 35 22 | 1 0 1 |
142 ANN B. DURHAM Max:30 S2 04 | 27 16 11 | 0 0 0 |
152 ANN B. DURHAM Max:30 S2 05 | 30 19 11 | 1 0 1 |
Number of Sections: 2 Average Students Per Section: 28.50
LAN751 TITLE READ 7 1 SM 1 180 6| 6 2 4 | 1 1 0 |
122 KIMBERLY F. DETWILER Max:30 S2 02 | 2 0 2 | 0 0 0 |
142 KIMBERLY F. DETWILER Max:30 S2 04 | 4 2 2 | 1 1 0 |
Number of Sections: 2 Average Students Per Section: 3.00
LAN752 TITLE READ 7 2 SM 1 60 4| 4 3 1 | 0 0 0 |
132 KIMBERLY F. DETWILER Max:30 S2 03 | 4 3 1 | 0 0 0 |
152 KIMBERLY F. DETWILER Max:30 S2 05 | 0 0 0 | 0 0 0 |
Number of Sections: 2 Average Students Per Section: 2.00
LAN802 LANG ARTS 8 2 SM 11 270 234| 234 118 116 | 11 7 4 |
232 PETER D. WARRING Max:30 S2 03 | 27 13 14 | 1 0 1 |
242 PETER D. WARRING Max:30 S2 04 | 28 13 15 | 0 0 0 |
252 PETER D. WARRING Max:30 S2 05 | 23 13 10 | 3 1 2 |

1sonyr01.p 38-2 MT BAKER MIDDLE SCHOOL 03/02/15 Page:5
05.14.10.00.00 Course/Class Count Report 207 3:04 PM
EST NBR NBR ----TOTALS---- --Special Ed--
COURSE DESCRIPTION LGTH SEC AVL REQ TOT FEM MAL TOT FEM MAL
262 PETER D. WARRING Max:30 S2 06 | 26 12 14 | 1 1 0 |
312 LINDSEY C. KEATON Max:30 S2 01 | 29 18 11 | 2 2 0 |
322 LINDSEY C. KEATON Max:30 S2 02 | 22 9 13 | 1 1 0 |
332 LINDSEY C. KEATON Max:30 S2 03 | 27 15 12 | 2 1 1 |
342 LINDSEY C. KEATON Max:30 S2 04 | 29 13 16 | 1 1 0 |
352 LINDSEY C. KEATON Max:30 S2 05 | 23 12 11 | 0 0 0 |
Number of Sections: 9 Average Students Per Section: 26.00
LAN812 HON LA 8 2 SM 3 60 57| 57 33 24 | 0 0 0 |
152 CORRIE A. CARSTENS Max:30 S2 05 | 28 16 12 | 0 0 0 |
162 CORRIE A. CARSTENS Max:30 S2 06 | 29 17 12 | 0 0 0 |
Number of Sections: 2 Average Students Per Section: 28.50
LAN817 JOURNALISM 8 2 SM 1 30 29| 29 18 11 | 0 0 0 |
812 PETER D. WARRING Max:30 S2 01 | 29 18 11 | 0 0 0 |
Number of Sections: 1 Average Students Per Section: 29.00
MAT071 TITLE MATH 1B SM 1 15 8| 8 6 2 | 0 0 0 |
132 KIMBERLY F. DETWILER Max:15 S2 03 | 8 6 2 | 0 0 0 |
Number of Sections: 1 Average Students Per Section: 8.00
MAT073 TITLE MATH 2B SM 1 45 27| 27 15 12 | 1 0 1 |
122 KIMBERLY F. DETWILER Max:15 S2 02 | 12 7 5 | 0 0 0 |
152 KIMBERLY F. DETWILER Max:30 S2 05 | 15 8 7 | 1 0 1 |
Number of Sections: 2 Average Students Per Section: 13.50
MAT075 TITLE MATH 3B SM 1 105 21| 21 11 10 | 2 1 1 |
142 KIMBERLY F. DETWILER Max:15 S2 04 | 14 8 6 | 1 1 0 |
162 KIMBERLY F. DETWILER Max:30 S2 06 | 7 3 4 | 1 0 1 |
Number of Sections: 2 Average Students Per Section: 10.50
MAT102 MATH 102 SM 9 280 244| 244 118 126 | 7 1 6 |
112 DENNIS LUBASH Max:28 S2 01 | 23 9 14 | 1 0 1 |
122 DENNIS LUBASH Max:28 S2 02 | 24 14 10 | 0 0 0 |
142 DENNIS LUBASH Max:28 S2 04 | 25 16 9 | 0 0 0 |
152 DENNIS LUBASH Max:28 S2 05 | 26 11 15 | 2 0 2 |
162 DENNIS LUBASH Max:28 S2 06 | 23 11 12 | 1 1 0 |
212 DIXIE L. TOY Max:28 S2 01 | 24 12 12 | 0 0 0 |
232 DIXIE L. TOY Max:28 S2 03 | 25 7 18 | 2 0 2 |
242 DIXIE L. TOY Max:28 S2 04 | 27 15 12 | 0 0 0 |
252 DIXIE L. TOY Max:28 S2 05 | 24 13 11 | 0 0 0 |
262 DIXIE L. TOY Max:28 S2 06 | 23 10 13 | 1 0 1 |
Number of Sections: 10 Average Students Per Section: 24.40
MAT202 MATH 202 SM 10 308 298| 298 145 153 | 4 0 4 |
112 REBECCA A. MARCOTTE Max:28 S2 01 | 23 16 7 | 1 0 1 |
212 JENNIFER K. KEMP Max:28 S2 01 | 26 13 13 | 0 0 0 |
222 JENNIFER K. KEMP Max:28 S2 02 | 29 16 13 | 0 0 0 |
242 JENNIFER K. KEMP Max:28 S2 04 | 30 14 16 | 0 0 0 |
252 JENNIFER K. KEMP Max:28 S2 05 | 26 13 13 | 0 0 0 |
312 SUSAN D. MILLANG Max:28 S2 01 | 27 13 14 | 0 0 0 |
332 SUSAN D. MILLANG Max:28 S2 03 | 28 14 14 | 0 0 0 |
342 SUSAN D. MILLANG Max:28 S2 04 | 27 15 12 | 0 0 0 |
352 SUSAN D. MILLANG Max:28 S2 05 | 29 14 15 | 0 0 0 |
362 SUSAN D. MILLANG Max:28 S2 06 | 30 10 20 | 3 0 3 |
662 JENNIFER K. KEMP Max:28 S2 06 | 23 7 16 | 0 0 0 |
Number of Sections: 11 Average Students Per Section: 27.09
MAT302 MATH 302 SM 12 224 185| 185 94 91 | 5 3 2 |
142 JEREMIAH D. CARTER Max:28 S2 04 | 26 15 11 | 0 0 0 |
152 JEREMIAH D. CARTER Max:28 S2 05 | 23 9 14 | 0 0 0 |
162 JEREMIAH D. CARTER Max:28 S2 06 | 21 14 7 | 0 0 0 |
322 REBECCA A. MARCOTTE Max:28 S2 02 | 20 9 11 | 1 0 1 |
342 REBECCA A. MARCOTTE Max:28 S2 04 | 29 13 16 | 0 0 0 |

1sonyr01.p 38-2 MT BAKER MIDDLE SCHOOL 03/02/15 Page:6
05.14.10.00.00 Course/Class Count Report 207 3:04 PM
EST NBR NBR ----TOTALS---- --Special Ed--
COURSE DESCRIPTION LGTH SEC AVL REQ TOT FEM MAL TOT FEM MAL
352 REBECCA A. MARCOTTE Max:28 S2 05 | 24 7 17 | 1 1 0 |
362 REBECCA A. MARCOTTE Max:28 S2 06 | 21 13 8 | 3 2 1 |
462 DAVID W. KNIGHTON Max:28 S2 06 | 21 14 7 | 0 0 0 |
Number of Sections: 8 Average Students Per Section: 23.13
MAT402 ALGEBRA 2 SM 3 120 113| 113 67 46 | 1 0 1 |
742 DAVID W. KNIGHTON Max:30 S2 04 | 28 18 10 | 1 0 1 |
812 DAVID W. KNIGHTON Max:30 S2 01 | 27 17 10 | 0 0 0 |
822 DAVID W. KNIGHTON Max:30 S2 02 | 32 14 18 | 0 0 0 |
852 DAVID W. KNIGHTON Max:30 S2 05 | 26 18 8 | 0 0 0 |
Number of Sections: 4 Average Students Per Section: 28.25
MAT502 GEOMETRY 2 SM 1 60 32| 32 13 19 | 0 0 0 |
112 JEREMIAH D. CARTER Max:30 S2 01 | 18 9 9 | 0 0 0 |
122 JEREMIAH D. CARTER Max:30 S2 02 | 14 4 10 | 0 0 0 |
Number of Sections: 2 Average Students Per Section: 16.00
MAT602 ADV ALG/TRIG 2 SM 1 30 6| 6 2 4 | 0 0 0 |
112 JEREMIAH D. CARTER Max:30 S2 01 | 6 2 4 | 0 0 0 |
Number of Sections: 1 Average Students Per Section: 6.00
MUS610 MUSIC SURVEY 6 SM 10 60 21| 21 8 13 | 3 0 3 |
142 R K. PAUSTIAN Max:30 S2 04 | 21 8 13 | 3 0 3 |
Number of Sections: 1 Average Students Per Section: 21.00
MUS612 CHOIR 6 2 SM 1 50 51| 51 35 16 | 0 0 0 |
12 JAMES A. CHAR Max:50 S2 01 | 51 35 16 | 0 0 0 |
Number of Sections: 1 Average Students Per Section: 51.00
MUS622 BAND 6 2 SM 1 50 38| 38 11 27 | 0 0 0 |
22 R K. PAUSTIAN Max:50 S2 02 | 38 11 27 | 0 0 0 |
Number of Sections: 1 Average Students Per Section: 38.00
MUS632 ORCHESTRA 6 2 SM 2 50 40| 40 24 16 | 2 1 1 |
32 MELINDA A. WHARTON Max:50 S2 03 | 40 24 16 | 2 1 1 |
Number of Sections: 1 Average Students Per Section: 40.00
MUS712 CHOIR 7 2 SM 2 50 53| 53 39 14 | 0 0 0 |
22 JAMES A. CHAR Max:50 S2 02 | 53 39 14 | 0 0 0 |
Number of Sections: 1 Average Students Per Section: 53.00
MUS722 BAND 7 2 SM 1 50 33| 33 15 18 | 0 0 0 |
32 R K. PAUSTIAN Max:50 S2 03 | 33 15 18 | 0 0 0 |
Number of Sections: 1 Average Students Per Section: 33.00
MUS732 ORCHESTRA 7 2 SM 1 100 57| 57 38 19 | 0 0 0 |
22 MELINDA A. WHARTON Max:50 S2 02 | 27 15 12 | 0 0 0 |
62 MELINDA A. WHARTON Max:50 S2 06 | 30 23 7 | 0 0 0 |
Number of Sections: 2 Average Students Per Section: 28.50
MUS812 CHOIR 8 2 SM 2 50 49| 49 38 11 | 3 2 1 |
32 JAMES A. CHAR Max:50 S2 03 | 49 38 11 | 3 2 1 |
Number of Sections: 1 Average Students Per Section: 49.00
MUS822 BAND 8 2 SM 1 50 38| 38 11 27 | 0 0 0 |
62 R K. PAUSTIAN Max:50 S2 06 | 38 11 27 | 0 0 0 |
Number of Sections: 1 Average Students Per Section: 38.00
MUS832 ORCHESTRA 8 2 SM 2 50 35| 35 24 11 | 2 1 1 |
42 MELINDA A. WHARTON Max:50 S2 04 | 35 24 11 | 2 1 1 |
Number of Sections: 1 Average Students Per Section: 35.00
PHY611 PHYS ED 6A SM 9 360 129| 129 66 63 | 8 2 6 |
122 ARLEEN J. BURKHALTER Max:36 S2 02 | 15 8 7 | 1 0 1 |
152 ARLEEN J. BURKHALTER Max:36 S2 05 | 25 15 10 | 0 0 0 |
212 MATTHEW L. KING Max:36 S2 01 | 35 19 16 | 5 2 3 |
332 KENNETH D. PERMAN Max:36 S2 03 | 24 13 11 | 0 0 0 |
362 KENNETH D. PERMAN Max:36 S2 06 | 30 11 19 | 2 0 2 |
Number of Sections: 5 Average Students Per Section: 25.80
PHY711 PHYS ED 7A SM 9 360 157| 157 79 78 | 4 1 3 |

1sonyr01.p 38-2 MT BAKER MIDDLE SCHOOL 03/02/15 Page:7
05.14.10.00.00 Course/Class Count Report 207 3:04 PM
EST NBR NBR ----TOTALS---- --Special Ed--
COURSE DESCRIPTION LGTH SEC AVL REQ TOT FEM MAL TOT FEM MAL
132 ARLEEN J. BURKHALTER Max:36 S2 03 | 35 19 16 | 4 1 3 |
222 MATTHEW L. KING Max:36 S2 02 | 30 11 19 | 0 0 0 |
252 MATTHEW L. KING Max:36 S2 05 | 32 20 12 | 0 0 0 |
262 MATTHEW L. KING Max:36 S2 06 | 38 25 13 | 0 0 0 |
312 KENNETH D. PERMAN Max:36 S2 01 | 22 4 18 | 0 0 0 |
Number of Sections: 5 Average Students Per Section: 31.40
PHY811 PHYS ED 8A SM 11 360 130| 130 59 71 | 8 2 6 |
112 ARLEEN J. BURKHALTER Max:36 S2 01 | 31 16 15 | 1 0 1 |
162 ARLEEN J. BURKHALTER Max:36 S2 06 | 28 13 15 | 3 1 2 |
232 MATTHEW L. KING Max:36 S2 03 | 24 6 18 | 0 0 0 |
322 KENNETH D. PERMAN Max:36 S2 02 | 25 13 12 | 2 1 1 |
352 KENNETH D. PERMAN Max:36 S2 05 | 22 11 11 | 2 0 2 |
Number of Sections: 5 Average Students Per Section: 26.00
SCI151 BIOLOGY 2 SM 1 30 32| 32 22 10 | 0 0 0 |
51 STACEY K. ROGERS Max:30 S2 02 | 32 22 10 | 0 0 0 |
Number of Sections: 1 Average Students Per Section: 32.00
SCI210 FORENSICS SM 1 120 31| 31 9 22 | 2 0 2 |
622 NICHOLAS W. JOHNSON Max:30 S2 02 | 6 0 6 | 0 0 0 |
722 NICHOLAS W. JOHNSON Max:30 S2 02 | 25 9 16 | 2 0 2 |
Number of Sections: 2 Average Students Per Section: 15.50
SCI602 SCIENCE 6 2 SM 10 330 303| 303 140 163 | 26 8 18 |
112 SUSAN M. BUHR Max:30 S2 01 | 30 10 20 | 5 1 4 |
122 SUSAN M. BUHR Max:30 S2 02 | 26 12 14 | 1 0 1 |
132 SUSAN M. BUHR Max:30 S2 03 | 26 13 13 | 3 1 2 |
152 SUSAN M. BUHR Max:30 S2 05 | 28 11 17 | 2 0 2 |
162 SUSAN M. BUHR Max:30 S2 06 | 25 16 9 | 1 1 0 |
212 MICALA H. ROOT Max:30 S2 01 | 30 15 15 | 6 3 3 |
222 MICALA H. ROOT Max:30 S2 02 | 24 13 11 | 1 0 1 |
242 MICALA H. ROOT Max:30 S2 04 | 32 12 20 | 3 1 2 |
252 MICALA H. ROOT Max:30 S2 05 | 30 13 17 | 0 0 0 |
262 MICALA H. ROOT Max:30 S2 06 | 25 15 10 | 0 0 0 |
312 JODI L. MCGRAW Max:30 S2 01 | 27 10 17 | 4 1 3 |
Number of Sections: 11 Average Students Per Section: 27.55
SCI702 SCIENCE 7 2 SM 10 330 318| 318 160 158 | 17 2 15 |
112 STACEY K. ROGERS Max:30 S2 01 | 29 15 14 | 2 0 2 |
132 STACEY K. ROGERS Max:30 S2 03 | 31 15 16 | 2 0 2 |
142 STACEY K. ROGERS Max:30 S2 04 | 30 15 15 | 3 0 3 |
152 STACEY K. ROGERS Max:30 S2 05 | 30 17 13 | 0 0 0 |
212 MARGERY A. DAVIS Max:30 S2 01 | 26 14 12 | 1 0 1 |
222 MARGERY A. DAVIS Max:30 S2 02 | 28 12 16 | 3 0 3 |
262 MARGERY A. DAVIS Max:30 S2 06 | 25 11 14 | 0 0 0 |
322 JODI L. MCGRAW Max:30 S2 02 | 27 11 16 | 1 0 1 |
332 JODI L. MCGRAW Max:30 S2 03 | 31 17 14 | 1 1 0 |
342 JODI L. MCGRAW Max:30 S2 04 | 30 15 15 | 4 1 3 |
362 JODI L. MCGRAW Max:30 S2 06 | 31 18 13 | 0 0 0 |
Number of Sections: 11 Average Students Per Section: 28.91
SCI802 SCIENCE 8 2 SM 12 270 273| 273 135 138 | 25 13 12 |
112 AARON R. COWAN Max:30 S2 01 | 30 14 16 | 1 0 1 |
122 AARON R. COWAN Max:30 S2 02 | 29 12 17 | 2 0 2 |
132 AARON R. COWAN Max:30 S2 03 | 32 16 16 | 4 3 1 |
212 NICHOLAS W. JOHNSON Max:30 S2 01 | 30 13 17 | 1 1 0 |
232 NICHOLAS W. JOHNSON Max:30 S2 03 | 29 15 14 | 0 0 0 |
242 NICHOLAS W. JOHNSON Max:30 S2 04 | 32 16 16 | 5 3 2 |
252 NICHOLAS W. JOHNSON Max:30 S2 05 | 31 16 15 | 4 4 0 |
342 MARGERY A. DAVIS Max:30 S2 04 | 31 14 17 | 5 0 5 |
352 MARGERY A. DAVIS Max:30 S2 05 | 29 19 10 | 3 2 1 |

1sonyr01.p 38-2 MT BAKER MIDDLE SCHOOL 03/02/15 Page:8
05.14.10.00.00 Course/Class Count Report 207 3:04 PM
EST NBR NBR ----TOTALS---- --Special Ed--
COURSE DESCRIPTION LGTH SEC AVL REQ TOT FEM MAL TOT FEM MAL
Number of Sections: 9 Average Students Per Section: 30.33
SOC602 SOC STUDIES 6 2 SM 8 270 215| 215 92 123 | 24 7 17 |
122 JASON W. BROWN Max:30 S2 02 | 29 12 17 | 1 1 0 |
132 JASON W. BROWN Max:30 S2 03 | 24 8 16 | 0 0 0 |
142 JASON W. BROWN Max:30 S2 04 | 31 14 17 | 8 3 5 |
152 JASON W. BROWN Max:30 S2 05 | 29 12 17 | 3 0 3 |
162 JASON W. BROWN Max:30 S2 06 | 30 15 15 | 5 2 3 |
232 SUSAN R. WINTER Max:30 S2 03 | 23 10 13 | 1 1 0 |
332 MICHAEL E. DECKER Max:30 S2 03 | 23 9 14 | 3 0 3 |
362 MICHAEL E. DECKER Max:30 S2 06 | 26 12 14 | 3 0 3 |
Number of Sections: 8 Average Students Per Section: 26.88
SOC612 HON SOC STD 6 2 SM 2 90 85| 85 47 38 | 0 0 0 |
542 MICHAEL E. DECKER Max:30 S2 04 | 31 16 15 | 0 0 0 |
622 SUSAN R. WINTER Max:30 S2 02 | 23 16 7 | 0 0 0 |
652 SUSAN R. WINTER Max:30 S2 05 | 31 15 16 | 0 0 0 |
Number of Sections: 3 Average Students Per Section: 28.33
SOC701 WA ST HISTORY 7 SM 8 270 260| 260 124 136 | 15 1 14 |
112 SHARON J. LINDGREN Max:30 S2 01 | 28 14 14 | 0 0 0 |
142 SHARON J. LINDGREN Max:30 S2 04 | 31 12 19 | 5 0 5 |
152 SHARON J. LINDGREN Max:30 S2 05 | 25 16 9 | 0 0 0 |
212 PENNI J. SWANSON Max:30 S2 01 | 27 13 14 | 0 0 0 |
222 PENNI J. SWANSON Max:30 S2 02 | 29 13 16 | 5 0 5 |
242 PENNI J. SWANSON Max:30 S2 04 | 31 12 19 | 2 1 1 |
252 PENNI J. SWANSON Max:30 S2 05 | 29 17 12 | 0 0 0 |
262 PENNI J. SWANSON Max:30 S2 06 | 31 16 15 | 1 0 1 |
432 SALLY J. KOENIG Max:30 S2 03 | 29 11 18 | 2 0 2 |
Number of Sections: 9 Average Students Per Section: 28.89
SOC711 HON WA ST HIST7 SM 2 60 57| 57 35 22 | 1 0 1 |
311 SALLY J. KOENIG Max:30 S2 01 | 29 16 13 | 0 0 0 |
321 SALLY J. KOENIG Max:30 S2 02 | 28 19 9 | 1 0 1 |
Number of Sections: 2 Average Students Per Section: 28.50
SOC802 US HISTORY 8 2 SM 11 300 245| 245 123 122 | 24 13 11 |
111 ERIN B. CARNAHAN Max:30 S2 01 | 24 14 10 | 1 1 0 |
122 ERIN B. CARNAHAN Max:30 S2 02 | 23 13 10 | 3 2 1 |
152 ERIN B. CARNAHAN Max:30 S2 05 | 26 13 13 | 6 2 4 |
162 ERIN B. CARNAHAN Max:30 S2 06 | 27 16 11 | 4 3 1 |
212 CHRISTINE A. THORINGT Max:30 S2 01 | 26 12 14 | 2 0 2 |
222 CHRISTINE A. THORINGT Max:30 S2 02 | 21 10 11 | 0 0 0 |
232 CHRISTINE A. THORINGT Max:30 S2 03 | 25 8 17 | 0 0 0 |
262 CHRISTINE A. THORINGT Max:30 S2 06 | 27 16 11 | 6 4 2 |
312 MICHAEL E. DECKER Max:30 S2 01 | 25 11 14 | 1 1 0 |
322 MICHAEL E. DECKER Max:30 S2 02 | 21 10 11 | 1 0 1 |
Number of Sections: 10 Average Students Per Section: 24.50
SOC812 HON US HIST 8 2 SM 2 60 59| 59 34 25 | 0 0 0 |
132 ERIN B. CARNAHAN Max:30 S2 03 | 27 19 8 | 0 0 0 |
262 CHRISTINE A. THORINGT Max:30 S2 04 | 32 15 17 | 0 0 0 |
Number of Sections: 2 Average Students Per Section: 29.50
SPE208 LAN ART SE 78 2 SM 1 120 12| 12 0 12 | 12 0 12 |
32 MARCIA L. DARRAH Max:30 S2 03 | 0 0 0 | 0 0 0 |
52 MARCIA L. DARRAH Max:30 S2 05 | 12 0 12 | 12 0 12 |
Number of Sections: 2 Average Students Per Section: 6.00
SPE212 READING SE 78 2 SM 2 14 13| 13 2 11 | 13 2 11 |
212 DEBORAH M. CALKINS Max:14 S2 01 | 13 2 11 | 13 2 11 |
Number of Sections: 1 Average Students Per Section: 13.00
SPE232 MATH SE 6 7 2 SM 1 60 18| 18 7 11 | 18 7 11 |
32 MARCIA L. DARRAH Max:30 S2 03 | 9 3 6 | 9 3 6 |

1sonyr01.p 38-2 MT BAKER MIDDLE SCHOOL 03/02/15 Page:9
05.14.10.00.00 Course/Class Count Report 207 3:04 PM
EST NBR NBR ----TOTALS---- --Special Ed--
COURSE DESCRIPTION LGTH SEC AVL REQ TOT FEM MAL TOT FEM MAL
62 MARCIA L. DARRAH Max:30 S2 06 | 9 4 5 | 9 4 5 |
Number of Sections: 2 Average Students Per Section: 9.00
SPE234 MATH SE 7 8 2 SM 1 14 12| 12 2 10 | 12 2 10 |
222 DEBORAH M. CALKINS Max:14 S2 06 | 12 2 10 | 12 2 10 |
Number of Sections: 1 Average Students Per Section: 12.00
SPE602 LAN ARTS SE 2 SM 1 14 18| 18 9 9 | 17 9 8 |
122 MARCIA L. DARRAH Max:14 S2 02 | 18 9 9 | 17 9 8 |
Number of Sections: 1 Average Students Per Section: 18.00
SPE612 READING SE 6 2 SM 1 30 19| 19 9 10 | 19 9 10 |
11 DEBORAH M. CALKINS Max:30 S2 05 | 19 9 10 | 19 9 10 |
Number of Sections: 1 Average Students Per Section: 19.00
SPE802 LAN ARTS SE 8 2 SM 1 14 14| 14 7 7 | 14 7 7 |
112 MARCIA L. DARRAH Max:14 S2 01 | 14 7 7 | 14 7 7 |
Number of Sections: 1 Average Students Per Section: 14.00
SPE811 READING SE 8 1 SM 1 90 0| 0 0 0 | 0 0 0 |
222 DEBORAH M. CALKINS Max:30 S2 06 | 0 0 0 | 0 0 0 |
Number of Sections: 1 Average Students Per Section: 0.00
SPE812 READING SE 8 2 SM 1 30 13| 13 5 8 | 13 5 8 |
232 DEBORAH M. CALKINS Max:30 S2 03 | 13 5 8 | 13 5 8 |
Number of Sections: 1 Average Students Per Section: 13.00
SPE831 MATH SE 8 1 SM 1 90 0| 0 0 0 | 0 0 0 |
222 DEBORAH M. CALKINS Max:30 S2 06 | 0 0 0 | 0 0 0 |
Number of Sections: 1 Average Students Per Section: 0.00
SPE832 MATH SE 8 2 SM 1 60 20| 20 10 10 | 20 10 10 |
21 DEBORAH M. CALKINS Max:30 S2 02 | 15 9 6 | 15 9 6 |
222 DEBORAH M. CALKINS Max:30 S2 06 | 5 1 4 | 5 1 4 |
Number of Sections: 2 Average Students Per Section: 10.00

1sonyr01.p 38-2 MT BAKER MIDDLE SCHOOL 03/02/15 Page:10
05.14.10.00.00 Course/Class Count Report Totals 3:04 PM
TITLE FOR TOTAL
TOTALS GROUP TOTAL FEMALE MALE
GRAND TOTALS 5645 2795 2850
Special Ed 420 142 278
************************ End of report ************************

1sonyr01.p 38-2 OLYMPIC MIDDLE SCHOOL 03/02/15 Page:1
05.14.10.00.00 Course/Class Count Report 203 3:00 PM
EST NBR NBR ----TOTALS---- --Special Ed--
COURSE DESCRIPTION LGTH SEC AVL REQ TOT FEM MAL TOT FEM MAL
CTE101 STEM ROBOTICS 1 SM 1 300 116| 116 54 62 | 7 2 5 |
12 RICHARD E. TAYLOR Max:30 S2 01 | 18 11 7 | 2 0 2 |
32 RICHARD E. TAYLOR Max:30 S2 03 | 30 14 16 | 2 1 1 |
42 RICHARD E. TAYLOR Max:30 S2 04 | 25 13 12 | 1 0 1 |
52 RICHARD E. TAYLOR Max:30 S2 05 | 29 12 17 | 1 1 0 |
62 RICHARD E. TAYLOR Max:30 S2 06 | 14 4 10 | 1 0 1 |
Number of Sections: 5 Average Students Per Section: 23.20
CTE110 STEM FUND OF IT SM 1 300 126| 126 48 78 | 8 3 5 |
12 KIMBERLY A. STROBEL Max:30 S2 01 | 14 7 7 | 1 0 1 |
32 KIMBERLY A. STROBEL Max:30 S2 03 | 30 7 23 | 0 0 0 |
42 KIMBERLY A. STROBEL Max:30 S2 04 | 28 9 19 | 2 1 1 |
52 KIMBERLY A. STROBEL Max:30 S2 05 | 30 15 15 | 2 1 1 |
62 KIMBERLY A. STROBEL Max:30 S2 06 | 24 10 14 | 3 1 2 |
Number of Sections: 5 Average Students Per Section: 25.20
ELL102 ELL LAN ART 1B SM 1 30 10| 10 6 4 | 0 0 0 |
11 NATALYA A. SHEMCHUK Max:30 S2 01 | 10 6 4 | 0 0 0 |
Number of Sections: 1 Average Students Per Section: 10.00
ELL202 ELL LAN ART 2B SM 1 30 7| 7 3 4 | 0 0 0 |
11 NATALYA A. SHEMCHUK Max:30 S2 01 | 7 3 4 | 0 0 0 |
Number of Sections: 1 Average Students Per Section: 7.00
ELL302 ELL LAN ART 3B SM 1 60 26| 26 10 16 | 1 1 0 |
31 NATALYA A. SHEMCHUK Max:30 S2 03 | 13 6 7 | 1 1 0 |
61 NATALYA A. SHEMCHUK Max:30 S2 06 | 13 4 9 | 0 0 0 |
Number of Sections: 2 Average Students Per Section: 13.00
FOR102 SPANISH 2 SM 1 150 107| 107 46 61 | 6 2 4 |
11 MOSS L. WHITE Max:30 S2 01 | 24 9 15 | 1 0 1 |
21 MOSS L. WHITE Max:30 S2 02 | 19 5 14 | 1 0 1 |
31 MOSS L. WHITE Max:30 S2 03 | 22 10 12 | 3 1 2 |
41 MOSS L. WHITE Max:30 S2 04 | 19 6 13 | 1 1 0 |
61 MOSS L. WHITE Max:30 S2 06 | 23 16 7 | 0 0 0 |
Number of Sections: 5 Average Students Per Section: 21.40
GEN010 ELL SUPPORT YR 1 100 33| 33 16 17 | 24 11 13 |
10 NATALYA A. SHEMCHUK Max:100 YR 07 | 33 16 17 | 24 11 13 |
Number of Sections: 1 Average Students Per Section: 33.00
GEN020 LAN SUPPORT YR 1 100 6| 6 2 4 | 6 2 4 |
71 MICHELLE M. COBURN Max:100 YR 07 | 6 2 4 | 6 2 4 |
Number of Sections: 1 Average Students Per Section: 6.00
GEN101 STUDY SKILLS 2 SM 1 120 43| 43 19 24 | 13 5 8 |
11 DAVID J. WILSON Max:30 S2 01 | 15 6 9 | 2 1 1 |
31 DAVID J. WILSON Max:30 S2 03 | 6 2 4 | 5 2 3 |
51 DAVID J. WILSON Max:30 S2 05 | 14 6 8 | 5 2 3 |
61 DAVID J. WILSON Max:30 S2 06 | 8 5 3 | 1 0 1 |
Number of Sections: 4 Average Students Per Section: 10.75
GEN111 LEADERSHIP 2 SM 1 30 20| 20 10 10 | 0 0 0 |
41 ORLYN M. CARNEY Max:30 S2 04 | 20 10 10 | 0 0 0 |
Number of Sections: 1 Average Students Per Section: 20.00
GEN303 AT MTB TRIG SM 1 30 3| 3 1 2 | 0 0 0 |
11 <None> Max:30 S2 01 | 3 1 2 | 0 0 0 |
Number of Sections: 1 Average Students Per Section: 3.00
GEN611 OFFICE AIDE 6 SM 1 33 3| 3 2 1 | 0 0 0 |
11 JANINE I. CHASE Max:2 S2 01 | 2 1 1 | 0 0 0 |
31 JANINE I. CHASE Max:1 S2 03 | 1 1 0 | 0 0 0 |
Number of Sections: 2 Average Students Per Section: 1.50
GEN710 TEACHERS AIDE 7 SM 1 29 14| 14 13 1 | 0 0 0 |
12 LAURA V. HOGENSON Max:1 S2 01 | 1 1 0 | 0 0 0 |
13 MOSS L. WHITE Max:1 S2 01 | 1 1 0 | 0 0 0 |

1sonyr01.p 38-2 OLYMPIC MIDDLE SCHOOL 03/02/15 Page:2
05.14.10.00.00 Course/Class Count Report 203 3:00 PM
EST NBR NBR ----TOTALS---- --Special Ed--
COURSE DESCRIPTION LGTH SEC AVL REQ TOT FEM MAL TOT FEM MAL
20 KATHERINE A. BALL Max:0 S2 02 | 1 1 0 | 0 0 0 |
24 LAURA C. ROGERS Max:1 S2 02 | 1 1 0 | 0 0 0 |
25 LISA C. CLARK Max:1 S2 02 | 0 0 0 | 0 0 0 |
26 DEBORAH CHOI Max:1 S2 02 | 1 1 0 | 0 0 0 |
32 CHRISTY A. PRICE Max:1 S2 03 | 1 1 0 | 0 0 0 |
33 KATHERINE A. BALL Max:1 S2 03 | 0 0 0 | 0 0 0 |
34 LAINE M. LENIHAN Max:1 S2 03 | 1 1 0 | 0 0 0 |
44 MOSS L. WHITE Max:1 S2 04 | 1 1 0 | 0 0 0 |
47 LAINE M. LENIHAN Max:1 S2 04 | 0 0 0 | 0 0 0 |
54 KARRI E. MILLICAN Max:1 S2 01 | 1 1 0 | 0 0 0 |
55 KATHERINE A. BALL Max:1 S2 05 | 1 1 0 | 0 0 0 |
56 BRANDY F. ENGLANDER Max:1 S2 05 | 1 1 0 | 0 0 0 |
57 JOANNA L. GUEST Max:1 S2 05 | 1 1 0 | 0 0 0 |
61 KARRI E. MILLICAN Max:1 S2 06 | 1 0 1 | 0 0 0 |
62 MOLLY RICHARDSON Max:1 S2 06 | 1 1 0 | 0 0 0 |
Number of Sections: 17 Average Students Per Section: 0.82
GEN711 OFFICE AIDE 7 SM 1 3 2| 2 1 1 | 0 0 0 |
41 JANINE I. CHASE Max:1 S2 04 | 1 0 1 | 0 0 0 |
51 JANINE I. CHASE Max:1 S2 05 | 1 1 0 | 0 0 0 |
Number of Sections: 2 Average Students Per Section: 1.00
GEN810 TEACHER AIDE 8A SM 1 30 13| 13 5 8 | 3 1 2 |
068 ORLYN M. CARNEY Max:1 S2 05 | 1 0 1 | 0 0 0 |
11 BRANDY F. ENGLANDER Max:1 S2 01 | 1 0 1 | 0 0 0 |
12 LAINE M. LENIHAN Max:1 S2 01 | 0 0 0 | 0 0 0 |
13 RICHARD E. TAYLOR Max:1 S2 01 | 1 0 1 | 1 0 1 |
21 MOSS L. WHITE Max:1 S2 02 | 1 1 0 | 0 0 0 |
4 LAINE M. LENIHAN Max:1 S2 04 | 1 1 0 | 0 0 0 |
40 JOANNA L. GUEST Max:1 S2 04 | 1 1 0 | 0 0 0 |
400 CHRISTY A. PRICE Max:1 S2 04 | 1 0 1 | 1 0 1 |
46 TROY A. REICHERTER Max:1 S2 04 | 1 0 1 | 0 0 0 |
47 LAINE M. LENIHAN Max:1 S2 04 | 1 1 0 | 0 0 0 |
48 RICHARD E. TAYLOR Max:1 S2 04 | 1 0 1 | 0 0 0 |
49 LYNDA A. STONACK Max:1 S2 04 | 0 0 0 | 0 0 0 |
52 SCOTT E. MILLICAN Max:1 S2 05 | 1 0 1 | 0 0 0 |
67 SHELLEY S. WARNER Max:1 S2 03 | 1 1 0 | 1 1 0 |
68 JENNIFER L. WILLSON Max:1 S2 06 | 1 0 1 | 0 0 0 |
Number of Sections: 15 Average Students Per Section: 0.87
GEN811 OFFICE AIDE 8 SM 1 4 4| 4 3 1 | 0 0 0 |
21 JANINE I. CHASE Max:1 S2 02 | 1 1 0 | 0 0 0 |
61 JANINE I. CHASE Max:3 S2 06 | 3 2 1 | 0 0 0 |
Number of Sections: 2 Average Students Per Section: 2.00
LAN112 YEARBOOK 2 SM 1 30 14| 14 5 9 | 0 0 0 |
51 ROBYN R. KNUDTSON Max:30 S2 05 | 14 5 9 | 0 0 0 |
Number of Sections: 1 Average Students Per Section: 14.00
LAN130 READING 1 B SM 1 0 0| 0 0 0 | 0 0 0 |
LAN602 LAN ARTS 6 2 SM 1 270 182| 182 83 99 | 22 12 10 |
41B THOMAS E. WILLIAMS Max:30 S2 04 | 21 12 9 | 4 2 2 |
42B KATHERINE A. BALL Max:30 S2 04 | 25 8 17 | 7 3 4 |
43B MARGARET MORGAN Max:30 S2 04 | 18 11 7 | 3 2 1 |
44B MASON RINEY Max:30 S2 04 | 21 11 10 | 4 3 1 |
51B THOMAS E. WILLIAMS Max:30 S2 05 | 21 10 11 | 1 1 0 |
52B KATHERINE A. BALL Max:30 S2 05 | 20 9 11 | 0 0 0 |
53B MARGARET MORGAN Max:30 S2 05 | 19 10 9 | 0 0 0 |
54B MASON RINEY Max:30 S2 05 | 20 6 14 | 2 1 1 |
55b JENNIFER L. WILLSON Max:30 S2 05 | 17 6 11 | 1 0 1 |

1sonyr01.p 38-2 OLYMPIC MIDDLE SCHOOL 03/02/15 Page:3
05.14.10.00.00 Course/Class Count Report 203 3:00 PM
EST NBR NBR ----TOTALS---- --Special Ed--
COURSE DESCRIPTION LGTH SEC AVL REQ TOT FEM MAL TOT FEM MAL
Number of Sections: 9 Average Students Per Section: 20.22
LAN612 HON LA 6 2 SM 1 60 38| 38 23 15 | 0 0 0 |
21 SUSAN J. KINDEM Max:30 S2 02 | 10 3 7 | 0 0 0 |
41 SUSAN J. KINDEM Max:30 S2 04 | 28 20 8 | 0 0 0 |
Number of Sections: 2 Average Students Per Section: 19.00
LAN702 LANG ARTS 7 2 SM 1 150 123| 123 57 66 | 20 11 9 |
21 MASON RINEY Max:30 S2 02 | 21 10 11 | 3 1 2 |
22 KATHERINE A. BALL Max:30 S2 02 | 18 9 9 | 1 0 1 |
31 MASON RINEY Max:30 S2 03 | 26 12 14 | 4 3 1 |
32 KATHERINE A. BALL Max:30 S2 03 | 29 14 15 | 1 0 1 |
41 LISA C. CLARK Max:30 S2 04 | 29 12 17 | 11 7 4 |
Number of Sections: 5 Average Students Per Section: 24.60
LAN704 LANG ARTS 7 2 B SM 1 60 57| 57 26 31 | 4 2 2 |
11 LISA C. CLARK Max:30 S2 01 | 28 11 17 | 4 2 2 |
21 LISA C. CLARK Max:30 S2 02 | 29 15 14 | 0 0 0 |
Number of Sections: 2 Average Students Per Section: 28.50
LAN712 HON LA 7 2 SM 1 90 62| 62 33 29 | 1 0 1 |
21 SUSAN J. KINDEM Max:30 S2 02 | 11 2 9 | 0 0 0 |
51 SUSAN J. KINDEM Max:30 S2 05 | 30 18 12 | 1 0 1 |
61 SUSAN J. KINDEM Max:30 S2 06 | 21 13 8 | 0 0 0 |
Number of Sections: 3 Average Students Per Section: 20.67
LAN752 TITLE READ 7 2 SM 1 90 23| 23 9 14 | 0 0 0 |
31 LINDA D. JENSEN Max:30 S2 03 | 10 4 6 | 0 0 0 |
61 LINDA D. JENSEN Max:30 S2 06 | 13 5 8 | 0 0 0 |
Number of Sections: 2 Average Students Per Section: 11.50
LAN802 LANG ARTS 8 2 SM 1 120 104| 104 43 61 | 27 8 19 |
21 THOMAS E. WILLIAMS Max:30 S2 02 | 26 11 15 | 5 2 3 |
31 THOMAS E. WILLIAMS Max:30 S2 03 | 20 9 11 | 4 2 2 |
41 ROBYN R. KNUDTSON Max:30 S2 04 | 29 15 14 | 9 3 6 |
51 LISA C. CLARK Max:30 S2 05 | 29 8 21 | 9 1 8 |
Number of Sections: 4 Average Students Per Section: 26.00
LAN804 LANG ARTS 8 2 B SM 1 60 59| 59 31 28 | 4 1 3 |
11 ROBYN R. KNUDTSON Max:30 S2 01 | 30 13 17 | 2 0 2 |
21 ROBYN R. KNUDTSON Max:30 S2 02 | 29 18 11 | 2 1 1 |
Number of Sections: 2 Average Students Per Section: 29.50
LAN812 HON LA 8 2 SM 1 60 43| 43 15 28 | 1 1 0 |
21 MARGARET MORGAN Max:30 S2 02 | 22 8 14 | 1 1 0 |
31 MARGARET MORGAN Max:30 S2 03 | 21 7 14 | 0 0 0 |
Number of Sections: 2 Average Students Per Section: 21.50
LAN852 TITLE READ 8 2 SM 1 90 17| 17 6 11 | 0 0 0 |
31 LINDA D. JENSEN Max:30 S2 03 | 7 3 4 | 0 0 0 |
61 LINDA D. JENSEN Max:30 S2 06 | 10 3 7 | 0 0 0 |
Number of Sections: 2 Average Students Per Section: 8.50
MAT102 MATH 102 SM 1 240 187| 187 91 96 | 23 12 11 |
11 MARK M. BUTLER Max:30 S2 01 | 21 13 8 | 0 0 0 |
41B MARK M. BUTLER Max:30 S2 04 | 26 12 14 | 2 1 1 |
43B JOANNA L. GUEST Max:30 S2 04 | 28 12 16 | 1 0 1 |
44B PAUL R. COOPER III Max:30 S2 04 | 27 12 15 | 2 1 1 |
51B MARK M. BUTLER Max:30 S2 05 | 21 8 13 | 5 3 2 |
52B LAURA V. HOGENSON Max:30 S2 05 | 18 7 11 | 2 1 1 |
53B JOANNA L. GUEST Max:30 S2 05 | 23 16 7 | 6 2 4 |
54B PAUL R. COOPER III Max:30 S2 05 | 23 11 12 | 5 4 1 |
Number of Sections: 8 Average Students Per Section: 23.38
MAT202 MATH 202 SM 1 150 148| 148 69 79 | 22 12 10 |
12 LAURA V. HOGENSON Max:30 S2 01 | 30 15 15 | 2 1 1 |
13 JOANNA L. GUEST Max:30 S2 01 | 31 16 15 | 4 1 3 |

1sonyr01.p 38-2 OLYMPIC MIDDLE SCHOOL 03/02/15 Page:4
05.14.10.00.00 Course/Class Count Report 203 3:00 PM
EST NBR NBR ----TOTALS---- --Special Ed--
COURSE DESCRIPTION LGTH SEC AVL REQ TOT FEM MAL TOT FEM MAL
21 MARK M. BUTLER Max:30 S2 02 | 30 13 17 | 5 4 1 |
22 LAURA V. HOGENSON Max:30 S2 02 | 29 14 15 | 6 3 3 |
23 JOANNA L. GUEST Max:30 S2 02 | 28 11 17 | 5 3 2 |
Number of Sections: 5 Average Students Per Section: 29.60
MAT204 MATH 202B SM 1 90 73| 73 30 43 | 3 1 2 |
11 DEBORAH CHOI Max:30 S2 01 | 29 15 14 | 0 0 0 |
21 DEBORAH CHOI Max:30 S2 02 | 27 10 17 | 3 1 2 |
41 LAURA V. HOGENSON Max:30 S2 04 | 17 5 12 | 0 0 0 |
Number of Sections: 3 Average Students Per Section: 24.33
MAT302 MATH 302 SM 1 120 114| 114 50 64 | 28 9 19 |
11 PAUL R. COOPER III Max:30 S2 01 | 31 8 23 | 7 2 5 |
21 PAUL R. COOPER III Max:30 S2 02 | 29 16 13 | 10 4 6 |
31 BRANDY F. ENGLANDER Max:30 S2 03 | 24 12 12 | 2 1 1 |
41 NICHOLAS P. ZUCATI Max:30 S2 04 | 30 14 16 | 9 2 7 |
Number of Sections: 4 Average Students Per Section: 28.50
MAT304 MATH 302B SM 1 60 59| 59 31 28 | 4 1 3 |
11 CHRISTY A. PRICE Max:30 S2 01 | 29 18 11 | 2 1 1 |
21 CHRISTY A. PRICE Max:30 S2 02 | 30 13 17 | 2 0 2 |
Number of Sections: 2 Average Students Per Section: 29.50
MAT402 ALGEBRA 2 SM 1 60 55| 55 31 24 | 0 0 0 |
41 CHRISTY A. PRICE Max:30 S2 04 | 30 15 15 | 0 0 0 |
61 CHRISTY A. PRICE Max:30 S2 06 | 25 16 9 | 0 0 0 |
Number of Sections: 2 Average Students Per Section: 27.50
MAT502 GEOMETRY 2 SM 1 35 31| 31 8 23 | 0 0 0 |
61 NICHOLAS P. ZUCATI Max:35 S2 06 | 31 8 23 | 0 0 0 |
Number of Sections: 1 Average Students Per Section: 31.00
MUS402 BAND 6 7 2 SM 1 150 100| 100 42 58 | 13 8 5 |
21 ORLYN M. CARNEY Max:0 S2 02 | 0 0 0 | 0 0 0 |
31 ORLYN M. CARNEY Max:50 S2 03 | 35 11 24 | 5 3 2 |
51 ORLYN M. CARNEY Max:50 S2 05 | 38 17 21 | 1 0 1 |
61 ORLYN M. CARNEY Max:50 S2 06 | 27 14 13 | 7 5 2 |
Number of Sections: 4 Average Students Per Section: 25.00
MUS411 CHOIR 6 7 8 2 SM 1 60 40| 40 33 7 | 4 4 0 |
11 MELISSA L. NEWMAN Max:30 S2 01 | 22 19 3 | 4 4 0 |
21 MELISSA L. NEWMAN Max:30 S2 02 | 18 14 4 | 0 0 0 |
Number of Sections: 2 Average Students Per Section: 20.00
MUS632 ORCHESTRA 6 2 SM 1 50 27| 27 19 8 | 1 1 0 |
11 ELSA T. FAGER Max:50 S2 01 | 27 19 8 | 1 1 0 |
Number of Sections: 1 Average Students Per Section: 27.00
MUS832 ORCHESTRA 8 2 SM 1 50 48| 48 33 15 | 1 0 1 |
21 ELSA T. FAGER Max:50 S2 02 | 48 33 15 | 1 0 1 |
Number of Sections: 1 Average Students Per Section: 48.00
PHY611 PHYS ED 6A SM 1 396 104| 104 53 51 | 6 4 2 |
12 DEBORAH G. EYMANN Max:36 S2 01 | 18 8 10 | 1 1 0 |
14 PHILLIP R. WAY Max:36 S2 01 | 21 7 14 | 3 1 2 |
22 MATTHEW A. MUXEN Max:36 S2 02 | 22 13 9 | 0 0 0 |
24 PHILLIP R. WAY Max:36 S2 02 | 23 13 10 | 1 1 0 |
32H DEBORAH G. EYMANN Max:36 S2 03 | 20 12 8 | 1 1 0 |
Number of Sections: 5 Average Students Per Section: 20.80
PHY612 PHYS ED 6B SM 1 36 21| 21 11 10 | 15 7 8 |
61s DEBORAH G. EYMANN Max:36 S2 06 | 21 11 10 | 15 7 8 |
Number of Sections: 1 Average Students Per Section: 21.00
PHY712 PHYS ED 7B SM 1 216 177| 177 69 108 | 22 7 15 |
11 MATTHEW A. MUXEN Max:36 S2 01 | 28 12 16 | 3 2 1 |
41 PHILLIP R. WAY Max:36 S2 04 | 31 13 18 | 3 1 2 |
42 DEBORAH G. EYMANN Max:36 S2 04 | 33 10 23 | 2 0 2 |

1sonyr01.p 38-2 OLYMPIC MIDDLE SCHOOL 03/02/15 Page:5
05.14.10.00.00 Course/Class Count Report 203 3:00 PM
EST NBR NBR ----TOTALS---- --Special Ed--
COURSE DESCRIPTION LGTH SEC AVL REQ TOT FEM MAL TOT FEM MAL
51 DEBORAH G. EYMANN Max:36 S2 05 | 31 13 18 | 4 2 2 |
52 PHILLIP R. WAY Max:36 S2 05 | 32 14 18 | 3 0 3 |
61 PHILLIP R. WAY Max:36 S2 06 | 22 7 15 | 7 2 5 |
Number of Sections: 6 Average Students Per Section: 29.50
PHY812 PHYS ED 8B SM 1 108 82| 82 29 53 | 8 1 7 |
31 MATTHEW A. MUXEN Max:36 S2 03 | 26 4 22 | 1 0 1 |
51 MATTHEW A. MUXEN Max:36 S2 05 | 30 11 19 | 1 0 1 |
62 MATTHEW A. MUXEN Max:36 S2 06 | 26 14 12 | 6 1 5 |
Number of Sections: 3 Average Students Per Section: 27.33
SCI151 BIOLOGY 2 SM 1 60 33| 33 14 19 | 0 0 0 |
11 LAINE M. LENIHAN Max:30 S2 01 | 30 13 17 | 0 0 0 |
61 LAURA C. ROGERS Max:30 S2 06 | 3 1 2 | 0 0 0 |
Number of Sections: 2 Average Students Per Section: 16.50
SCI602 SCIENCE 6 2 SM 1 270 213| 213 101 112 | 18 9 9 |
11 LAURA C. ROGERS Max:30 S2 01 | 25 9 16 | 3 2 1 |
12 BRANDY F. ENGLANDER Max:30 S2 01 | 23 7 16 | 2 0 2 |
21 LAURA C. ROGERS Max:30 S2 02 | 27 10 17 | 0 0 0 |
22 BRANDY F. ENGLANDER Max:30 S2 02 | 28 12 16 | 3 2 1 |
23 RANDI SUE DECKER Max:30 S2 02 | 29 14 15 | 2 1 1 |
31 RANDI SUE DECKER Max:30 S2 03 | 22 13 9 | 3 1 2 |
32 LAURA C. ROGERS Max:30 S2 03 | 27 16 11 | 5 3 2 |
51 RANDI SUE DECKER Max:30 S2 05 | 22 14 8 | 0 0 0 |
61 LAURA C. ROGERS Max:30 S2 06 | 10 6 4 | 0 0 0 |
Number of Sections: 9 Average Students Per Section: 23.67
SCI702 SCIENCE 7 2 SM 1 240 226| 226 111 115 | 16 9 7 |
31 DANIEL V. NOMURA Max:30 S2 03 | 29 16 13 | 0 0 0 |
41 BRANDY F. ENGLANDER Max:30 S2 04 | 30 18 12 | 2 0 2 |
42 RANDI SUE DECKER Max:30 S2 04 | 28 12 16 | 1 0 1 |
51 BRANDY F. ENGLANDER Max:30 S2 05 | 30 16 14 | 4 3 1 |
53 LAURA C. ROGERS Max:30 S2 05 | 32 14 18 | 5 4 1 |
61 RANDI SUE DECKER Max:30 S2 06 | 28 13 15 | 1 0 1 |
62 DANIEL V. NOMURA Max:30 S2 06 | 24 12 12 | 2 1 1 |
63 LAINE M. LENIHAN Max:30 S2 06 | 25 10 15 | 1 1 0 |
Number of Sections: 8 Average Students Per Section: 28.25
SCI802 SCIENCE 8 2 SM 1 180 162| 162 73 89 | 26 8 18 |
11 DANIEL V. NOMURA Max:30 S2 01 | 30 10 20 | 5 0 5 |
32 LAINE M. LENIHAN Max:30 S2 03 | 16 8 8 | 1 0 1 |
41 DANIEL V. NOMURA Max:30 S2 04 | 29 14 15 | 5 2 3 |
42 LAINE M. LENIHAN Max:30 S2 04 | 29 14 15 | 3 0 3 |
51 DANIEL V. NOMURA Max:30 S2 05 | 28 15 13 | 6 4 2 |
52 LAINE M. LENIHAN Max:30 S2 05 | 30 12 18 | 6 2 4 |
Number of Sections: 6 Average Students Per Section: 27.00
SOC601 SOC STUDIES 6 1 SM 1 240 84| 84 33 51 | 6 3 3 |
12 KARRI E. MILLICAN Max:30 S2 01 | 16 7 9 | 1 1 0 |
14 TROY A. REICHERTER Max:30 S2 01 | 21 8 13 | 1 1 0 |
22 KARRI E. MILLICAN Max:30 S2 02 | 25 9 16 | 2 0 2 |
24 TROY A. REICHERTER Max:30 S2 02 | 22 9 13 | 2 1 1 |
Number of Sections: 4 Average Students Per Section: 21.00
SOC611 HON SOC STD 6 1 SM 1 60 21| 21 16 5 | 0 0 0 |
32 SUSAN J. KINDEM Max:30 S2 03 | 21 16 5 | 0 0 0 |
Number of Sections: 1 Average Students Per Section: 21.00
SOC701 WA STATE HIST 7 SM 1 240 241| 241 115 126 | 25 13 12 |
11 SCOTT E. MILLICAN Max:30 S2 01 | 31 14 17 | 2 1 1 |
12 TRACY M. SHERIN Max:30 S2 01 | 29 10 19 | 4 1 3 |
31 KARRI E. MILLICAN Max:30 S2 03 | 29 15 14 | 2 1 1 |
32 TROY A. REICHERTER Max:30 S2 03 | 30 16 14 | 3 1 2 |

1sonyr01.p 38-2 OLYMPIC MIDDLE SCHOOL 03/02/15 Page:6
05.14.10.00.00 Course/Class Count Report 203 3:00 PM
EST NBR NBR ----TOTALS---- --Special Ed--
COURSE DESCRIPTION LGTH SEC AVL REQ TOT FEM MAL TOT FEM MAL
41 KARRI E. MILLICAN Max:30 S2 04 | 31 14 17 | 4 3 1 |
42 TROY A. REICHERTER Max:30 S2 04 | 31 15 16 | 4 3 1 |
61 KARRI E. MILLICAN Max:30 S2 06 | 31 20 11 | 3 2 1 |
62 TROY A. REICHERTER Max:30 S2 06 | 29 11 18 | 3 1 2 |
Number of Sections: 8 Average Students Per Section: 30.13
SOC802 US HISTORY 8 2 SM 1 240 199| 199 86 113 | 29 9 20 |
21 SCOTT E. MILLICAN Max:30 S2 02 | 19 4 15 | 0 0 0 |
22 TRACY M. SHERIN Max:30 S2 02 | 22 7 15 | 2 0 2 |
31 SCOTT E. MILLICAN Max:30 S2 03 | 16 6 10 | 2 0 2 |
32 TRACY M. SHERIN Max:30 S2 03 | 18 8 10 | 3 1 2 |
51 SCOTT E. MILLICAN Max:30 S2 05 | 31 18 13 | 4 1 3 |
52 TRACY M. SHERIN Max:30 S2 05 | 32 17 15 | 5 2 3 |
61 SCOTT E. MILLICAN Max:30 S2 06 | 31 13 18 | 8 3 5 |
62 TRACY M. SHERIN Max:30 S2 06 | 30 13 17 | 5 2 3 |
Number of Sections: 8 Average Students Per Section: 24.88
SPE012 MATH SE 2 SM 1 42 34| 34 15 19 | 33 15 18 |
11 MOLLY RICHARDSON Max:14 S2 01 | 13 7 6 | 13 7 6 |
21 MOLLY RICHARDSON Max:14 S2 02 | 9 1 8 | 8 1 7 |
31 MOLLY RICHARDSON Max:14 S2 03 | 12 7 5 | 12 7 5 |
Number of Sections: 3 Average Students Per Section: 11.33
SPE042 LANG ARTS SE 2 SM 1 222 62| 62 28 34 | 62 28 34 |
11 JUDY DENNIS Max:30 S2 01 | 7 2 5 | 7 2 5 |
12 MICHELLE M. COBURN Max:30 S2 01 | 7 7 0 | 7 7 0 |
21 JUDY DENNIS Max:21 S2 02 | 9 6 3 | 9 6 3 |
22 MICHELLE M. COBURN Max:21 S2 02 | 5 3 2 | 5 3 2 |
31 JUDY DENNIS Max:30 S2 03 | 6 1 5 | 6 1 5 |
32 MICHELLE M. COBURN Max:30 S2 03 | 8 3 5 | 8 3 5 |
61 JUDY DENNIS Max:30 S2 06 | 9 2 7 | 9 2 7 |
62 MICHELLE M. COBURN Max:30 S2 06 | 11 4 7 | 11 4 7 |
Number of Sections: 8 Average Students Per Section: 7.75
SPE102 STRUC LEARN 2 SM 1 450 124| 124 40 84 | 119 40 79 |
11A SHELLEY S. WARNER Max:30 S2 01 | 8 2 6 | 8 2 6 |
12B GLORIA J. SMITH-DORSE Max:30 S2 01 | 4 1 3 | 4 1 3 |
13C MATTHEW J. ROY Max:30 S2 01 | 9 2 7 | 8 2 6 |
21A SHELLEY S. WARNER Max:30 S2 02 | 11 5 6 | 11 5 6 |
22B GLORIA J. SMITH-DORSE Max:30 S2 02 | 7 2 5 | 7 2 5 |
23C MATTHEW J. ROY Max:30 S2 02 | 9 2 7 | 8 2 6 |
31A SHELLEY S. WARNER Max:30 S2 03 | 11 5 6 | 11 5 6 |
32B GLORIA J. SMITH-DORSE Max:30 S2 03 | 5 1 4 | 5 1 4 |
33C MATTHEW J. ROY Max:30 S2 03 | 8 2 6 | 7 2 5 |
41A SHELLEY S. WARNER Max:30 S2 04 | 11 5 6 | 11 5 6 |
42B GLORIA J. SMITH-DORSE Max:30 S2 04 | 5 2 3 | 5 2 3 |
43C MATTHEW J. ROY Max:30 S2 04 | 9 2 7 | 8 2 6 |
51A SHELLEY S. WARNER Max:30 S2 05 | 11 5 6 | 11 5 6 |
52B GLORIA J. SMITH-DORSE Max:30 S2 05 | 7 2 5 | 7 2 5 |
53C MATTHEW J. ROY Max:30 S2 05 | 9 2 7 | 8 2 6 |
Number of Sections: 15 Average Students Per Section: 8.27
SPE122 ADAPTVE BEHAV 2 SM 1 80 1| 1 0 1 | 1 0 1 |
22 MOLLY RICHARDSON Max:30 S2 07 | 1 0 1 | 1 0 1 |
31 MOLLY RICHARDSON Max:30 S2 03 | 0 0 0 | 0 0 0 |
41 MOLLY RICHARDSON Max:20 S2 04 | 0 0 0 | 0 0 0 |
Number of Sections: 3 Average Students Per Section: 0.33

1sonyr01.p 38-2 OLYMPIC MIDDLE SCHOOL 03/02/15 Page:7
05.14.10.00.00 Course/Class Count Report Totals 3:00 PM
TITLE FOR TOTAL
TOTALS GROUP TOTAL FEMALE MALE
GRAND TOTALS 3921 1801 2120
Special Ed 632 263 369
************************ End of report ************************

1sonyr01.p 38-2 RAINIER MIDDLE SCHOOL 03/02/15 Page:1
05.14.10.00.00 Course/Class Count Report 206 3:02 PM
EST NBR NBR ----TOTALS---- ---spec ed----
COURSE DESCRIPTION LGTH SEC AVL REQ TOT FEM MAL TOT FEM MAL
ART110 ART SM 1 180 53| 53 31 22 | 2 2 0 |
154 TRACY L. LASHER Max:30 S2 01 | 0 0 0 | 0 0 0 |
32 LUIS C. CHAVEZ Max:30 S2 03 | 28 18 10 | 1 1 0 |
62 LUIS C. CHAVEZ Max:30 S2 06 | 25 13 12 | 1 1 0 |
Number of Sections: 3 Average Students Per Section: 17.67
ART210 ADVANCED ART SM 1 61 24| 24 16 8 | 0 0 0 |
32 LUIS C. CHAVEZ Max:1 S2 03 | 1 1 0 | 0 0 0 |
52 LUIS C. CHAVEZ Max:30 S2 05 | 23 15 8 | 0 0 0 |
Number of Sections: 2 Average Students Per Section: 12.00
ART610 ART SURVEY 6 TM 3 240 93| 93 47 46 | 8 1 7 |
13 LUIS C. CHAVEZ Max:30 Q3 01 | 21 10 11 | 2 0 2 |
14 LUIS C. CHAVEZ Max:30 Q4 01 | 14 7 7 | 1 0 1 |
23 LUIS C. CHAVEZ Max:30 Q3 02 | 30 14 16 | 3 0 3 |
24 LUIS C. CHAVEZ Max:30 Q4 02 | 28 16 12 | 2 1 1 |
Number of Sections: 4 Average Students Per Section: 23.25
BUS610 COMPUTER APPS 6 TM 6 120 0| 0 0 0 | 0 0 0 |
CTE101 STEM ROBOTICS 1 SM 1 300 94| 94 46 48 | 10 1 9 |
12 BRIAN A. CONNOLLY Max:30 S2 01 | 26 17 9 | 3 0 3 |
22 BRIAN A. CONNOLLY Max:30 S2 02 | 15 4 11 | 4 1 3 |
32 BRIAN A. CONNOLLY Max:30 S2 03 | 18 10 8 | 2 0 2 |
52 BRIAN A. CONNOLLY Max:30 S2 05 | 19 7 12 | 0 0 0 |
62 BRIAN A. CONNOLLY Max:30 S2 06 | 16 8 8 | 1 0 1 |
Number of Sections: 5 Average Students Per Section: 18.80
CTE105 STEM CNSTR FND1 SM 1 180 71| 71 42 29 | 7 5 2 |
12 SCOTT D. DAVIDSON Max:30 S2 01 | 31 20 11 | 2 1 1 |
52 SCOTT D. DAVIDSON Max:30 S2 05 | 20 11 9 | 4 3 1 |
62 SCOTT D. DAVIDSON Max:30 S2 06 | 20 11 9 | 1 1 0 |
Number of Sections: 3 Average Students Per Section: 23.67
CTE111 STEM FUND OF IT TM 1 120 91| 91 43 48 | 7 1 6 |
13 ALVIN B. GIFFORD Max:30 Q3 01 | 17 6 11 | 1 0 1 |
14 ALVIN B. GIFFORD Max:30 Q4 01 | 18 4 14 | 2 0 2 |
23 ALVIN B. GIFFORD Max:30 Q3 02 | 27 20 7 | 1 1 0 |
24 ALVIN B. GIFFORD Max:30 Q4 02 | 29 13 16 | 3 0 3 |
Number of Sections: 4 Average Students Per Section: 22.75
CTE115 STEM COMPTR SCI SM 1 180 68| 68 18 50 | 7 3 4 |
42 ALVIN B. GIFFORD Max:30 S2 04 | 27 5 22 | 3 1 2 |
52 ALVIN B. GIFFORD Max:30 S2 05 | 29 7 22 | 4 2 2 |
62 ALVIN B. GIFFORD Max:30 S2 06 | 12 6 6 | 0 0 0 |
Number of Sections: 3 Average Students Per Section: 22.67
ELL102 ELL LAN ART 1B SM 1 150 7| 7 4 3 | 0 0 0 |
11 HARRIETT M. DALOS Max:30 S2 01 | 7 4 3 | 0 0 0 |
21 HARRIETT M. DALOS Max:30 S2 02 | 0 0 0 | 0 0 0 |
41 HARRIETT M. DALOS Max:30 S2 04 | 0 0 0 | 0 0 0 |
51 HARRIETT M. DALOS Max:30 S2 05 | 0 0 0 | 0 0 0 |
61 HARRIETT M. DALOS Max:30 S2 06 | 0 0 0 | 0 0 0 |
Number of Sections: 5 Average Students Per Section: 1.40
ELL202 ELL LAN ART 2B SM 1 30 6| 6 1 5 | 0 0 0 |
21 HARRIETT M. DALOS Max:30 S2 02 | 6 1 5 | 0 0 0 |
Number of Sections: 1 Average Students Per Section: 6.00
ELL302 ELL LAN ART 3B SM 1 120 32| 32 10 22 | 1 0 1 |
41 HARRIETT M. DALOS Max:30 S2 04 | 20 4 16 | 1 0 1 |
51 HARRIETT M. DALOS Max:30 S2 05 | 4 2 2 | 0 0 0 |
61 HARRIETT M. DALOS Max:30 S2 06 | 8 4 4 | 0 0 0 |
Number of Sections: 3 Average Students Per Section: 10.67
GEN100 STUDY SKILLS TM 1 95 16| 16 8 8 | 1 0 1 |
23 DAVID-MICHAEL D. COX Max:20 Q3 02 | 11 4 7 | 1 0 1 |

1sonyr01.p 38-2 RAINIER MIDDLE SCHOOL 03/02/15 Page:2
05.14.10.00.00 Course/Class Count Report 206 3:02 PM
EST NBR NBR ----TOTALS---- ---spec ed----
COURSE DESCRIPTION LGTH SEC AVL REQ TOT FEM MAL TOT FEM MAL
24 DAVID-MICHAEL D. COX Max:25 Q4 02 | 5 4 1 | 0 0 0 |
Number of Sections: 2 Average Students Per Section: 8.00
GEN110 LEADERSHIP SM 2 60 17| 17 14 3 | 0 0 0 |
62 CINDY A. PRIDEMORE Max:30 S2 06 | 17 14 3 | 0 0 0 |
Number of Sections: 1 Average Students Per Section: 17.00
GEN122 PEER MENTORING SM 2 60 25| 25 19 6 | 0 0 0 |
12 DEBORAH L. ALLISON Max:30 S2 01 | 25 19 6 | 0 0 0 |
Number of Sections: 1 Average Students Per Section: 25.00
GEN610 TEACHERS AIDE 6 TM 2 13 1| 1 1 0 | 0 0 0 |
13 LISA J. WILSON Max:2 Q3 01 | 1 1 0 | 0 0 0 |
Number of Sections: 1 Average Students Per Section: 1.00
GEN710 TEACHR AIDE 7 1 SM 1 21 2| 2 1 1 | 1 0 1 |
1 SONYA A. REMPFER Max:5 S2 01 | 1 1 0 | 0 0 0 |
12 BETH L. GREEN Max:0 S2 01 | 1 0 1 | 1 0 1 |
Number of Sections: 2 Average Students Per Section: 1.00
GEN720 TEACHR AIDE 7 2 SM 1 120 3| 3 2 1 | 0 0 0 |
05 MICHELE L. ROCK Max:30 S2 05 | 1 1 0 | 0 0 0 |
41 DAVID-MICHAEL D. COX Max:30 S2 04 | 0 0 0 | 0 0 0 |
523 JENNIFER D. MUSCOLO Max:30 S2 03 | 1 0 1 | 0 0 0 |
625 PAUL A. PRATHER Max:30 S2 05 | 1 1 0 | 0 0 0 |
Number of Sections: 4 Average Students Per Section: 0.75
GEN810 TEACHR AIDE 8 1 SM 2 149 3| 3 3 0 | 0 0 0 |
1 BRIAN A. CONNOLLY Max:5 S2 03 | 1 1 0 | 0 0 0 |
13 CHRISTINE A. LUDWIGSO Max:5 S2 02 | 0 0 0 | 0 0 0 |
2 DAWN L. RASMUSSEN Max:5 S2 03 | 1 1 0 | 0 0 0 |
3 CHARLES G. THOMAS Max:5 S2 02 | 0 0 0 | 0 0 0 |
4 BRENDA M. LEWIS Max:5 S2 01 | 0 0 0 | 0 0 0 |
5 KIRK R. JONASSON Max:5 S2 05 | 1 1 0 | 0 0 0 |
Number of Sections: 6 Average Students Per Section: 0.50
GEN820 TEACHR AIDE 8 2 SM 1 1815 70| 70 56 14 | 0 0 0 |
01 KIRK R. JONASSON Max:30 S2 01 | 1 1 0 | 0 0 0 |
02 TRACY L. LASHER Max:30 S2 02 | 1 0 1 | 0 0 0 |
03 MICHELE L. ROCK Max:5 S2 06 | 2 2 0 | 0 0 0 |
04 PAUL C. FURTH Max:5 S2 05 | 1 1 0 | 0 0 0 |
05 BRENDA M. LEWIS Max:5 S2 03 | 1 1 0 | 0 0 0 |
06 TRACY L. LASHER Max:30 S2 06 | 1 1 0 | 0 0 0 |
07 BRENDA M. LEWIS Max:5 S2 06 | 1 1 0 | 0 0 0 |
08 CHARLES G. THOMAS Max:5 S2 04 | 1 0 1 | 0 0 0 |
09 JONI L. FLORY Max:5 S2 06 | 1 1 0 | 0 0 0 |
10 ERIKA S. ASTLE Max:5 S2 02 | 1 1 0 | 0 0 0 |
11 RYAN M. DUNHAM Max:5 S2 05 | 1 1 0 | 0 0 0 |
111 ERIKA S. ASTLE Max:30 S2 01 | 1 1 0 | 0 0 0 |
112 JONI L. FLORY Max:30 S2 01 | 1 1 0 | 0 0 0 |
113 BRENDA M. LEWIS Max:30 S2 01 | 1 1 0 | 0 0 0 |
114 JAY R. MCGUFFIN Max:30 S2 01 | 1 1 0 | 0 0 0 |
115 SCOTT D. DAVIDSON Max:30 S2 01 | 1 1 0 | 0 0 0 |
12 BRENDA M. LEWIS Max:30 S2 01 | 0 0 0 | 0 0 0 |
122 DEBORAH L. ALLISON Max:30 S2 01 | 1 1 0 | 0 0 0 |
123 JANET M. BLOOM Max:30 S2 01 | 1 0 1 | 0 0 0 |
125 BRIAN A. CONNOLLY Max:30 S2 01 | 1 1 0 | 0 0 0 |
13 BRENDA M. LEWIS Max:5 S2 04 | 1 1 0 | 0 0 0 |
133 CHARLES G. THOMAS Max:30 S2 01 | 1 1 0 | 0 0 0 |
134 JANET M. BLOOM Max:30 S2 04 | 1 0 1 | 0 0 0 |
14 CHERYL SNYDER Max:5 S2 01 | 1 1 0 | 0 0 0 |
143 STACEY J. BUCHANAN Max:30 S2 01 | 1 0 1 | 0 0 0 |
145 JEANEE MAUCOTEL Max:30 S2 01 | 1 1 0 | 0 0 0 |

1sonyr01.p 38-2 RAINIER MIDDLE SCHOOL 03/02/15 Page:3
05.14.10.00.00 Course/Class Count Report 206 3:02 PM
EST NBR NBR ----TOTALS---- ---spec ed----
COURSE DESCRIPTION LGTH SEC AVL REQ TOT FEM MAL TOT FEM MAL
146 TRACY L. LASHER Max:30 S2 01 | 1 1 0 | 0 0 0 |
15 MICHAEL D. ESPINOSA I Max:5 S2 01 | 1 1 0 | 0 0 0 |
16 DEBORAH L. ALLISON Max:5 S2 05 | 1 1 0 | 0 0 0 |
17 JAMES J. DIEBAG Max:5 S2 04 | 1 1 0 | 0 0 0 |
18 TRACY L. LASHER Max:5 S2 05 | 1 1 0 | 0 0 0 |
19 KRISTIN J. TODD Max:5 S2 06 | 1 1 0 | 0 0 0 |
20 CHRISTINE L. WILSON Max:5 S2 05 | 1 0 1 | 0 0 0 |
21 BRIAN A. CONNOLLY Max:5 S2 06 | 1 0 1 | 0 0 0 |
211 BRENDA M. LEWIS Max:30 S2 02 | 1 1 0 | 0 0 0 |
22 CHARLES G. THOMAS Max:30 S2 05 | 1 0 1 | 0 0 0 |
222 ERIKA S. ASTLE Max:30 S2 02 | 1 1 0 | 0 0 0 |
223 JONI L. FLORY Max:30 S2 02 | 1 1 0 | 0 0 0 |
23 DANIEL E. DIEFENDORF Max:5 S2 02 | 1 1 0 | 0 0 0 |
234 STACEY J. BUCHANAN Max:30 S2 02 | 0 0 0 | 0 0 0 |
24 PAUL C. FURTH Max:5 S2 05 | 0 0 0 | 0 0 0 |
246 STACEY J. BUCHANAN Max:30 S2 02 | 1 0 1 | 0 0 0 |
25 CHRISTINE A. LUDWIGSO Max:5 S2 05 | 1 1 0 | 0 0 0 |
26 PAUL C. FURTH Max:5 S2 01 | 1 1 0 | 0 0 0 |
32 BRENDA M. LEWIS Max:30 S2 03 | 0 0 0 | 0 0 0 |
323 STACEY J. BUCHANAN Max:30 S2 03 | 1 0 1 | 0 0 0 |
334 CHERYL SNYDER Max:30 S2 03 | 1 1 0 | 0 0 0 |
41 JENNIFER D. MUSCOLO Max:30 S2 04 | 1 1 0 | 0 0 0 |
411 ROBIN K. LIGHT Max:30 S2 04 | 1 1 0 | 0 0 0 |
413 BRENDA M. LEWIS Max:30 S2 04 | 1 1 0 | 0 0 0 |
42 DEBORAH L. ALLISON Max:30 S2 04 | 1 1 0 | 0 0 0 |
423 STACEY J. BUCHANAN Max:30 S2 04 | 1 1 0 | 0 0 0 |
424 <None> Max:30 S2 00 | 0 0 0 | 0 0 0 |
511 KIRK R. JONASSON Max:30 S2 05 | 1 1 0 | 0 0 0 |
512 BRIAN A. CONNOLLY Max:30 S2 05 | 0 0 0 | 0 0 0 |
514 JULIE D. MORGAN Max:30 S2 05 | 1 0 1 | 0 0 0 |
515 CINDY A. PRIDEMORE Max:30 S2 05 | 1 1 0 | 0 0 0 |
516 DEBORAH L. ALLISON Max:30 S2 05 | 1 1 0 | 0 0 0 |
52 CHRISTINA N. GULLARD Max:30 S2 05 | 1 1 0 | 0 0 0 |
523 STACEY J. BUCHANAN Max:30 S2 05 | 1 0 1 | 0 0 0 |
544 JENNIFER D. MUSCOLO Max:30 S2 05 | 1 1 0 | 0 0 0 |
545 BRIAN A. CONNOLLY Max:30 S2 05 | 0 0 0 | 0 0 0 |
55 JONI L. FLORY Max:30 S2 05 | 1 1 0 | 0 0 0 |
552 ALVIN B. GIFFORD Max:30 S2 05 | 1 0 1 | 0 0 0 |
56 ERIKA S. ASTLE Max:30 S2 05 | 1 1 0 | 0 0 0 |
612 KELLY A. PORTMANN Max:30 S2 06 | 1 1 0 | 0 0 0 |
613 JAY R. MCGUFFIN Max:30 S2 06 | 1 1 0 | 0 0 0 |
615 DEBORAH L. ALLISON Max:30 S2 06 | 1 1 0 | 0 0 0 |
62 JAY R. MCGUFFIN Max:30 S2 06 | 1 1 0 | 0 0 0 |
622 CHRISTINE L. WILSON Max:30 S2 06 | 1 1 0 | 0 0 0 |
623 STACEY J. BUCHANAN Max:30 S2 06 | 1 1 0 | 0 0 0 |
634 JANET M. BLOOM Max:30 S2 06 | 1 1 0 | 0 0 0 |
651 KENNETH R. WARD Max:30 S2 06 | 1 1 0 | 0 0 0 |
655 PAUL A. PRATHER Max:30 S2 06 | 1 1 0 | 0 0 0 |
656 RYAN M. DUNHAM Max:30 S2 06 | 1 0 1 | 0 0 0 |
657 ROBIN K. LIGHT Max:30 S2 06 | 1 1 0 | 0 0 0 |
Number of Sections: 76 Average Students Per Section: 0.92
HLT602 HEALTH 1 TM 6 240 97| 97 46 51 | 3 0 3 |
13 KATHY A. CARNINO Max:30 Q3 01 | 18 8 10 | 2 0 2 |
14 KATHY A. CARNINO Max:30 Q4 01 | 24 9 15 | 0 0 0 |
23 SONYA A. REMPFER Max:30 Q3 02 | 25 12 13 | 1 0 1 |
24 SONYA A. REMPFER Max:30 Q4 02 | 30 17 13 | 0 0 0 |

1sonyr01.p 38-2 RAINIER MIDDLE SCHOOL 03/02/15 Page:4
05.14.10.00.00 Course/Class Count Report 206 3:02 PM
EST NBR NBR ----TOTALS---- ---spec ed----
COURSE DESCRIPTION LGTH SEC AVL REQ TOT FEM MAL TOT FEM MAL
Number of Sections: 4 Average Students Per Section: 24.25
HOM110 HOME & FAMILY SM 1 180 69| 69 36 33 | 3 1 2 |
22 CINDY A. PRIDEMORE Max:30 S2 02 | 26 14 12 | 2 1 1 |
32 CINDY A. PRIDEMORE Max:30 S2 03 | 20 10 10 | 0 0 0 |
52 CINDY A. PRIDEMORE Max:30 S2 05 | 23 12 11 | 1 0 1 |
Number of Sections: 3 Average Students Per Section: 23.00
HOM610 HOME EC 6 TM 3 120 44| 44 27 17 | 4 0 4 |
13 CINDY A. PRIDEMORE Max:30 Q3 01 | 21 12 9 | 1 0 1 |
14 CINDY A. PRIDEMORE Max:30 Q4 01 | 23 15 8 | 3 0 3 |
Number of Sections: 2 Average Students Per Section: 22.00
IND610 TECH SURVEY TM 3 120 55| 55 28 27 | 1 0 1 |
23 SCOTT D. DAVIDSON Max:30 Q3 02 | 28 14 14 | 1 0 1 |
24 SCOTT D. DAVIDSON Max:30 Q4 02 | 27 14 13 | 0 0 0 |
Number of Sections: 2 Average Students Per Section: 27.50
LAN110 DRAMA SM 1 180 38| 38 13 25 | 2 0 2 |
12 DAVID-MICHAEL D. COX Max:30 S2 01 | 0 0 0 | 0 0 0 |
32 DAVID-MICHAEL D. COX Max:30 S2 03 | 14 5 9 | 0 0 0 |
52 DAVID-MICHAEL D. COX Max:30 S2 05 | 24 8 16 | 2 0 2 |
Number of Sections: 3 Average Students Per Section: 12.67
LAN112 YEARBOOK 2 SM 1 30 21| 21 21 0 | 1 1 0 |
41 SCOTT D. DAVIDSON Max:30 S2 04 | 21 21 0 | 1 1 0 |
Number of Sections: 1 Average Students Per Section: 21.00
LAN210 ADVANCED DRAMA SM 1 60 13| 13 6 7 | 1 0 1 |
42 DAVID-MICHAEL D. COX Max:30 S2 04 | 13 6 7 | 1 0 1 |
Number of Sections: 1 Average Students Per Section: 13.00
LAN602 LAN ARTS 6 2 SM 1 240 211| 211 92 119 | 10 3 7 |
11 LISA J. WILSON Max:30 S2 01 | 29 12 17 | 2 0 2 |
21 KELLY A. PORTMANN Max:30 S2 02 | 31 10 21 | 2 0 2 |
31 LISA J. WILSON Max:30 S2 03 | 29 12 17 | 1 0 1 |
41 KELLY A. PORTMANN Max:30 S2 04 | 24 12 12 | 0 0 0 |
42 LISA J. WILSON Max:30 S2 04 | 24 13 11 | 0 0 0 |
51 LISA J. WILSON Max:30 S2 05 | 29 14 15 | 3 1 2 |
61 KELLY A. PORTMANN Max:30 S2 06 | 21 8 13 | 2 2 0 |
62 LISA J. WILSON Max:30 S2 06 | 24 11 13 | 0 0 0 |
Number of Sections: 8 Average Students Per Section: 26.38
LAN612 HON LA 6 2 SM 2 60 66| 66 40 26 | 0 0 0 |
31 KELLY A. PORTMANN Max:30 S2 03 | 33 21 12 | 0 0 0 |
51 KELLY A. PORTMANN Max:30 S2 05 | 33 19 14 | 0 0 0 |
Number of Sections: 2 Average Students Per Section: 33.00
LAN652 TITLE READ 6 2 SM 1 90 17| 17 6 11 | 6 4 2 |
32 BENJAMIN S. TALBERT Max:30 S2 02 | 10 3 7 | 5 3 2 |
42 BENJAMIN S. TALBERT Max:30 S2 04 | 7 3 4 | 1 1 0 |
Number of Sections: 2 Average Students Per Section: 8.50
LAN660 DRAMA 6 TM 3 120 16| 16 4 12 | 1 0 1 |
13 DAVID-MICHAEL D. COX Max:30 Q3 01 | 11 2 9 | 1 0 1 |
14 DAVID-MICHAEL D. COX Max:30 Q4 01 | 5 2 3 | 0 0 0 |
Number of Sections: 2 Average Students Per Section: 8.00
LAN702 LANG ARTS 7 2 SM 1 240 219| 219 104 115 | 13 3 10 |
11 MICHAEL D. ESPINOSA I Max:30 S2 01 | 29 14 15 | 2 0 2 |
21 CHERYL SNYDER Max:30 S2 02 | 25 8 17 | 1 0 1 |
31 CHERYL SNYDER Max:30 S2 03 | 25 15 10 | 2 2 0 |
41 MICHAEL D. ESPINOSA I Max:30 S2 04 | 30 17 13 | 2 1 1 |
42 CHERYL SNYDER Max:30 S2 04 | 30 15 15 | 2 0 2 |
51 MICHAEL D. ESPINOSA I Max:30 S2 05 | 28 13 15 | 2 0 2 |
61 CHERYL SNYDER Max:30 S2 06 | 23 10 13 | 1 0 1 |
62 MICHAEL D. ESPINOSA I Max:30 S2 06 | 29 12 17 | 1 0 1 |

1sonyr01.p 38-2 RAINIER MIDDLE SCHOOL 03/02/15 Page:5
05.14.10.00.00 Course/Class Count Report 206 3:02 PM
EST NBR NBR ----TOTALS---- ---spec ed----
COURSE DESCRIPTION LGTH SEC AVL REQ TOT FEM MAL TOT FEM MAL
Number of Sections: 8 Average Students Per Section: 27.38
LAN712 HON LA 7 2 SM 1 60 58| 58 33 25 | 0 0 0 |
11 CHERYL SNYDER Max:30 S2 01 | 36 23 13 | 0 0 0 |
21 MICHAEL D. ESPINOSA I Max:30 S2 02 | 22 10 12 | 0 0 0 |
Number of Sections: 2 Average Students Per Section: 29.00
LAN752 TITLE READ 7 2 SM 1 75 3| 3 1 2 | 1 0 1 |
21 BENJAMIN S. TALBERT Max:30 S2 02 | 0 0 0 | 0 0 0 |
51 BENJAMIN S. TALBERT Max:30 S2 05 | 0 0 0 | 0 0 0 |
61 BENJAMIN S. TALBERT Max:15 S2 00 | 3 1 2 | 1 0 1 |
Number of Sections: 3 Average Students Per Section: 1.00
LAN802 LANG ARTS 8 2 SM 1 240 245| 245 127 118 | 22 9 13 |
11 ERIKA S. ASTLE Max:30 S2 01 | 31 15 16 | 4 2 2 |
21 ERIKA S. ASTLE Max:30 S2 02 | 30 13 17 | 2 0 2 |
22 JONI L. FLORY Max:30 S2 02 | 29 19 10 | 2 1 1 |
31 ERIKA S. ASTLE Max:30 S2 03 | 33 21 12 | 1 1 0 |
41 ERIKA S. ASTLE Max:30 S2 04 | 31 15 16 | 4 2 2 |
42 JONI L. FLORY Max:30 S2 04 | 29 15 14 | 2 1 1 |
51 JONI L. FLORY Max:30 S2 05 | 28 14 14 | 1 1 0 |
61 JONI L. FLORY Max:30 S2 06 | 34 15 19 | 6 1 5 |
Number of Sections: 8 Average Students Per Section: 30.63
LAN812 HON LA 8 2 SM 4 60 66| 66 46 20 | 0 0 0 |
11 JONI L. FLORY Max:30 S2 01 | 31 20 11 | 0 0 0 |
51 ERIKA S. ASTLE Max:30 S2 05 | 35 26 9 | 0 0 0 |
Number of Sections: 2 Average Students Per Section: 33.00
LAN842 LAN CLINC 8 2 SM 1 180 92| 92 31 61 | 9 1 8 |
11 SHEILA R. MCCORD Max:30 S2 01 | 17 6 11 | 2 0 2 |
21 BENJAMIN S. TALBERT Max:30 S2 02 | 9 2 7 | 1 0 1 |
31 TRACY L. BRENNAN Max:30 S2 03 | 16 5 11 | 3 0 3 |
41 TRACY L. BRENNAN Max:30 S2 04 | 11 3 8 | 1 0 1 |
51 SHEILA R. MCCORD Max:30 S2 05 | 18 7 11 | 1 1 0 |
62 SHEILA R. MCCORD Max:30 S2 06 | 21 8 13 | 1 0 1 |
Number of Sections: 6 Average Students Per Section: 15.33
LAN852 TITLE READ 8 2 SM 1 60 8| 8 2 6 | 2 0 2 |
22 BENJAMIN S. TALBERT Max:30 S2 02 | 8 2 6 | 2 0 2 |
52 BENJAMIN S. TALBERT Max:30 S2 05 | 0 0 0 | 0 0 0 |
Number of Sections: 2 Average Students Per Section: 4.00
MAT072 TITLE MATH 2A SM 1 195 6| 6 4 2 | 1 1 0 |
12 BENJAMIN S. TALBERT Max:30 S2 01 | 4 3 1 | 1 1 0 |
42 BENJAMIN S. TALBERT Max:30 S2 04 | 2 1 1 | 0 0 0 |
62 BENJAMIN S. TALBERT Max:30 S2 06 | 0 0 0 | 0 0 0 |
Number of Sections: 3 Average Students Per Section: 2.00
MAT073 TITLE MATH 2B SM 1 180 18| 18 10 8 | 4 2 2 |
12 BENJAMIN S. TALBERT Max:30 S2 01 | 5 2 3 | 3 1 2 |
42 BENJAMIN S. TALBERT Max:30 S2 04 | 5 2 3 | 0 0 0 |
62 BENJAMIN S. TALBERT Max:30 S2 06 | 8 6 2 | 1 1 0 |
Number of Sections: 3 Average Students Per Section: 6.00
MAT081 MATH FOUND 1B SM 1 150 54| 54 25 29 | 6 4 2 |
11 TRACY L. LASHER Max:30 S2 01 | 11 3 8 | 2 1 1 |
21 TRACY L. LASHER Max:30 S2 02 | 9 6 3 | 0 0 0 |
31 TRACY L. LASHER Max:30 S2 03 | 13 6 7 | 2 2 0 |
51 TRACY L. LASHER Max:30 S2 05 | 11 4 7 | 1 0 1 |
61 TRACY L. LASHER Max:30 S2 06 | 10 6 4 | 1 1 0 |
Number of Sections: 5 Average Students Per Section: 10.80
MAT102 MATH 102 SM 5 240 200| 200 97 103 | 10 4 6 |
11 CHARLES G. THOMAS Max:30 S2 01 | 28 16 12 | 2 2 0 |
12 JACOB LUONG Max:30 S2 01 | 28 9 19 | 3 1 2 |

1sonyr01.p 38-2 RAINIER MIDDLE SCHOOL 03/02/15 Page:6
05.14.10.00.00 Course/Class Count Report 206 3:02 PM
EST NBR NBR ----TOTALS---- ---spec ed----
COURSE DESCRIPTION LGTH SEC AVL REQ TOT FEM MAL TOT FEM MAL
21 CHARLES G. THOMAS Max:30 S2 02 | 30 14 16 | 0 0 0 |
31 CHARLES G. THOMAS Max:30 S2 03 | 30 16 14 | 1 0 1 |
32 CHRISTINA N. GULLARD Max:30 S2 03 | 28 13 15 | 3 0 3 |
41 CHARLES G. THOMAS Max:30 S2 04 | 22 10 12 | 1 1 0 |
51 CHARLES G. THOMAS Max:30 S2 05 | 18 10 8 | 0 0 0 |
52 CHRISTINA N. GULLARD Max:30 S2 05 | 16 9 7 | 0 0 0 |
Number of Sections: 8 Average Students Per Section: 25.00
MAT202 MATH 202 SM 9 300 262| 262 127 135 | 9 1 8 |
11 JAY R. MCGUFFIN Max:30 S2 01 | 30 13 17 | 2 0 2 |
21 MICHELE L. ROCK Max:30 S2 02 | 25 11 14 | 0 0 0 |
22 JAY R. MCGUFFIN Max:30 S2 02 | 19 12 7 | 0 0 0 |
31 MICHELE L. ROCK Max:30 S2 03 | 27 15 12 | 2 0 2 |
41 CHRISTINA N. GULLARD Max:30 S2 04 | 28 11 17 | 0 0 0 |
42 MICHELE L. ROCK Max:30 S2 04 | 28 11 17 | 1 0 1 |
51 JAY R. MCGUFFIN Max:30 S2 05 | 27 15 12 | 2 1 1 |
52 MICHELE L. ROCK Max:30 S2 05 | 25 13 12 | 1 0 1 |
61 CHRISTINA N. GULLARD Max:30 S2 06 | 28 14 14 | 0 0 0 |
62 MICHELE L. ROCK Max:30 S2 06 | 25 12 13 | 1 0 1 |
Number of Sections: 10 Average Students Per Section: 26.20
MAT302 MATH 302 SM 6 210 205| 205 102 103 | 18 7 11 |
11 BRENDA M. LEWIS Max:30 S2 01 | 31 10 21 | 3 0 3 |
21 JACOB LUONG Max:30 S2 02 | 26 14 12 | 4 2 2 |
22 BRENDA M. LEWIS Max:30 S2 02 | 31 13 18 | 3 1 2 |
31 JACOB LUONG Max:30 S2 03 | 28 13 15 | 1 1 0 |
32 BRENDA M. LEWIS Max:30 S2 03 | 29 16 13 | 1 0 1 |
41 BRENDA M. LEWIS Max:30 S2 04 | 29 14 15 | 3 1 2 |
61 BRENDA M. LEWIS Max:30 S2 06 | 31 22 9 | 3 2 1 |
Number of Sections: 7 Average Students Per Section: 29.29
MAT402 ALGEBRA 2 SM 5 150 132| 132 76 56 | 0 0 0 |
11 KIRK R. JONASSON Max:30 S2 01 | 29 11 18 | 0 0 0 |
31 KIRK R. JONASSON Max:30 S2 03 | 24 18 6 | 0 0 0 |
41 KIRK R. JONASSON Max:30 S2 04 | 25 17 8 | 0 0 0 |
51 JACOB LUONG Max:30 S2 05 | 30 17 13 | 0 0 0 |
61 JACOB LUONG Max:30 S2 06 | 24 13 11 | 0 0 0 |
Number of Sections: 5 Average Students Per Section: 26.40
MAT502 GEOMETRY 2 SM 2 60 55| 55 36 19 | 0 0 0 |
21 KIRK R. JONASSON Max:30 S2 02 | 30 23 7 | 0 0 0 |
61 KIRK R. JONASSON Max:30 S2 06 | 25 13 12 | 0 0 0 |
Number of Sections: 2 Average Students Per Section: 27.50
MAT602 ADV ALG/TRIG 2 SM 1 30 3| 3 1 2 | 0 0 0 |
00 KIRK R. JONASSON Max:30 S2 06 | 3 1 2 | 0 0 0 |
Number of Sections: 1 Average Students Per Section: 3.00
MUS622 BAND 2 SM 2 110 44| 44 21 23 | 3 1 2 |
11 J S. ALLEN Max:30 S2 01 | 3 1 2 | 1 0 1 |
61 J S. ALLEN Max:80 S2 06 | 41 20 21 | 2 1 1 |
Number of Sections: 2 Average Students Per Section: 22.00
MUS631 ORCHESTRA 1 SM 1 60 2| 2 2 0 | 0 0 0 |
11 JEANEE MAUCOTEL Max:60 S2 01 | 2 2 0 | 0 0 0 |
Number of Sections: 1 Average Students Per Section: 2.00
MUS722 BAND 7 2 SM 2 75 49| 49 26 23 | 0 0 0 |
21 J S. ALLEN Max:75 S2 02 | 49 26 23 | 0 0 0 |
Number of Sections: 1 Average Students Per Section: 49.00
MUS732 ORCHESTRA 7 2 SM 1 50 39| 39 26 13 | 4 1 3 |
21 JEANEE MAUCOTEL Max:50 S2 02 | 39 26 13 | 4 1 3 |
Number of Sections: 1 Average Students Per Section: 39.00
MUS822 BAND 8 2 SM 2 75 38| 38 20 18 | 1 0 1 |

1sonyr01.p 38-2 RAINIER MIDDLE SCHOOL 03/02/15 Page:7
05.14.10.00.00 Course/Class Count Report 206 3:02 PM
EST NBR NBR ----TOTALS---- ---spec ed----
COURSE DESCRIPTION LGTH SEC AVL REQ TOT FEM MAL TOT FEM MAL
31 J S. ALLEN Max:75 S2 03 | 38 20 18 | 1 0 1 |
Number of Sections: 1 Average Students Per Section: 38.00
MUS832 ORCHESTRA 8 2 SM 1 50 26| 26 20 6 | 2 2 0 |
31 JEANEE MAUCOTEL Max:50 S2 03 | 26 20 6 | 2 2 0 |
Number of Sections: 1 Average Students Per Section: 26.00
PHY612 PHYS ED 6B SM 2 216 189| 189 90 99 | 10 2 8 |
11 SONYA A. REMPFER Max:36 S2 01 | 35 20 15 | 1 0 1 |
21 KATHY A. CARNINO Max:36 S2 02 | 30 15 15 | 1 1 0 |
31 KATHY A. CARNINO Max:36 S2 03 | 33 12 21 | 0 0 0 |
41 RULON D. HERREN Max:36 S2 04 | 31 18 13 | 2 1 1 |
51 SONYA A. REMPFER Max:36 S2 05 | 30 8 22 | 3 0 3 |
61 RULON D. HERREN Max:36 S2 06 | 30 17 13 | 3 0 3 |
Number of Sections: 6 Average Students Per Section: 31.50
PHY712 PHYS ED 7B SM 1 216 162| 162 69 93 | 7 0 7 |
11 PAUL A. PRATHER Max:36 S2 01 | 36 18 18 | 1 0 1 |
21 PAUL A. PRATHER Max:36 S2 02 | 23 13 10 | 0 0 0 |
31 RULON D. HERREN Max:36 S2 03 | 33 12 21 | 1 0 1 |
41 KATHY A. CARNINO Max:36 S2 04 | 28 12 16 | 2 0 2 |
51 PAUL A. PRATHER Max:36 S2 05 | 16 7 9 | 1 0 1 |
61 PAUL A. PRATHER Max:36 S2 06 | 26 7 19 | 2 0 2 |
Number of Sections: 6 Average Students Per Section: 27.00
PHY812 PHYS ED 8B SM 1 216 176| 176 86 90 | 11 3 8 |
11 RULON D. HERREN Max:36 S2 01 | 33 18 15 | 4 2 2 |
21 RULON D. HERREN Max:36 S2 02 | 29 13 16 | 1 0 1 |
31 SONYA A. REMPFER Max:36 S2 03 | 21 5 16 | 0 0 0 |
41 PAUL A. PRATHER Max:36 S2 04 | 30 14 16 | 3 0 3 |
51 KATHY A. CARNINO Max:36 S2 05 | 27 13 14 | 0 0 0 |
61 SONYA A. REMPFER Max:36 S2 06 | 36 23 13 | 3 1 2 |
Number of Sections: 6 Average Students Per Section: 29.33
SCI151 BIOLOGY 2 SM 2 60 63| 63 35 28 | 0 0 0 |
31 DEBORAH L. ALLISON Max:30 S2 03 | 31 17 14 | 0 0 0 |
41 DEBORAH L. ALLISON Max:30 S2 04 | 32 18 14 | 0 0 0 |
Number of Sections: 2 Average Students Per Section: 31.50
SCI204 GEOLOGY SM 2 60 30| 30 12 18 | 0 0 0 |
42 DANIEL E. DIEFENDORF Max:30 S2 04 | 30 12 18 | 0 0 0 |
Number of Sections: 1 Average Students Per Section: 30.00
SCI205 SCIENCE LINKS SM 2 60 31| 31 20 11 | 0 0 0 |
42 JAMES J. DIEBAG Max:30 S2 04 | 31 20 11 | 0 0 0 |
Number of Sections: 1 Average Students Per Section: 31.00
SCI602 SCIENCE 6 2 SM 1 300 278| 278 131 147 | 14 4 10 |
11 THOMAS E. OLSON Max:30 S2 01 | 31 15 16 | 0 0 0 |
31 KRISTIN J. TODD Max:30 S2 03 | 29 14 15 | 2 0 2 |
32 THOMAS E. OLSON Max:30 S2 03 | 30 15 15 | 1 1 0 |
41 KRISTIN J. TODD Max:30 S2 04 | 27 11 16 | 0 0 0 |
42 THOMAS E. OLSON Max:30 S2 04 | 30 13 17 | 4 1 3 |
51 DEBORAH L. ALLISON Max:30 S2 05 | 28 16 12 | 1 1 0 |
52 KRISTIN J. TODD Max:30 S2 05 | 24 10 14 | 1 1 0 |
53 THOMAS E. OLSON Max:30 S2 05 | 25 13 12 | 0 0 0 |
61 DEBORAH L. ALLISON Max:30 S2 06 | 27 11 16 | 1 0 1 |
62 THOMAS E. OLSON Max:30 S2 06 | 27 13 14 | 4 0 4 |
Number of Sections: 10 Average Students Per Section: 27.80
SCI702 SCIENCE 7 2 SM 1 270 240| 240 118 122 | 19 5 14 |
11 JAMES J. DIEBAG Max:30 S2 01 | 30 16 14 | 4 3 1 |
12 KRISTIN J. TODD Max:30 S2 01 | 29 11 18 | 2 1 1 |
21 JAMES J. DIEBAG Max:30 S2 02 | 23 13 10 | 1 0 1 |
31 JAY R. MCGUFFIN Max:30 S2 03 | 25 13 12 | 1 0 1 |

1sonyr01.p 38-2 RAINIER MIDDLE SCHOOL 03/02/15 Page:8
05.14.10.00.00 Course/Class Count Report 206 3:02 PM
EST NBR NBR ----TOTALS---- ---spec ed----
COURSE DESCRIPTION LGTH SEC AVL REQ TOT FEM MAL TOT FEM MAL
32 JAMES J. DIEBAG Max:30 S2 03 | 27 11 16 | 4 1 3 |
41 JENNIFER D. MUSCOLO Max:30 S2 04 | 27 15 12 | 4 0 4 |
51 JAMES J. DIEBAG Max:30 S2 05 | 28 15 13 | 2 0 2 |
61 KRISTIN J. TODD Max:30 S2 06 | 25 13 12 | 1 0 1 |
62 JAY R. MCGUFFIN Max:30 S2 06 | 26 11 15 | 0 0 0 |
Number of Sections: 9 Average Students Per Section: 26.67
SCI802 SCIENCE 8 2 SM 1 240 229| 229 126 103 | 23 9 14 |
11 JENNIFER D. MUSCOLO Max:30 S2 01 | 30 14 16 | 3 2 1 |
21 JENNIFER D. MUSCOLO Max:30 S2 02 | 30 20 10 | 1 1 0 |
22 DANIEL E. DIEFENDORF Max:30 S2 02 | 30 15 15 | 3 0 3 |
31 DANIEL E. DIEFENDORF Max:30 S2 03 | 25 16 9 | 2 1 1 |
32 JENNIFER D. MUSCOLO Max:30 S2 03 | 24 11 13 | 3 2 1 |
51 DANIEL E. DIEFENDORF Max:30 S2 05 | 32 17 15 | 5 0 5 |
52 JENNIFER D. MUSCOLO Max:30 S2 05 | 27 17 10 | 1 0 1 |
62 DANIEL E. DIEFENDORF Max:30 S2 06 | 31 16 15 | 5 3 2 |
Number of Sections: 8 Average Students Per Section: 28.63
SOC602 SOC STUDIES 6 2 SM 1 300 269| 269 128 141 | 13 2 11 |
11 JULIE D. MORGAN Max:30 S2 01 | 31 18 13 | 2 1 1 |
21 DAWN L. RASMUSSEN Max:30 S2 02 | 30 13 17 | 2 1 1 |
31 DAWN L. RASMUSSEN Max:30 S2 03 | 31 11 20 | 2 0 2 |
32 JULIE D. MORGAN Max:30 S2 03 | 30 14 16 | 2 0 2 |
41 DAWN L. RASMUSSEN Max:30 S2 04 | 22 11 11 | 4 0 4 |
42 JULIE D. MORGAN Max:30 S2 04 | 18 7 11 | 0 0 0 |
51 DAWN L. RASMUSSEN Max:30 S2 05 | 26 12 14 | 0 0 0 |
52 JULIE D. MORGAN Max:30 S2 05 | 26 14 12 | 0 0 0 |
61 DAWN L. RASMUSSEN Max:30 S2 06 | 26 16 10 | 0 0 0 |
62 JULIE D. MORGAN Max:30 S2 06 | 29 12 17 | 1 0 1 |
Number of Sections: 10 Average Students Per Section: 26.90
SOC701 WA STATE HIST 7 SM 1 300 287| 287 138 149 | 22 5 17 |
11 ROBIN K. LIGHT Max:30 S2 01 | 30 12 18 | 4 1 3 |
21 CHRISTINE A. LUDWIGSO Max:30 S2 02 | 23 8 15 | 1 0 1 |
22 ROBIN K. LIGHT Max:30 S2 02 | 25 9 16 | 1 0 1 |
31 CHRISTINE A. LUDWIGSO Max:30 S2 03 | 30 16 14 | 3 1 2 |
41 CHRISTINE A. LUDWIGSO Max:30 S2 04 | 29 17 12 | 0 0 0 |
42 ROBIN K. LIGHT Max:30 S2 04 | 29 16 13 | 1 0 1 |
51 ROBIN K. LIGHT Max:30 S2 05 | 29 15 14 | 2 1 1 |
52 CHRISTINE A. LUDWIGSO Max:30 S2 05 | 31 16 15 | 1 0 1 |
61 ROBIN K. LIGHT Max:30 S2 06 | 29 15 14 | 3 1 2 |
62 CHRISTINE A. LUDWIGSO Max:30 S2 06 | 32 14 18 | 6 1 5 |
Number of Sections: 10 Average Students Per Section: 28.70
SOC802 US HISTORY 8 2 SM 1 300 309| 309 168 141 | 27 9 18 |
11 RYAN M. DUNHAM Max:30 S2 01 | 32 19 13 | 4 1 3 |
12 PAUL C. FURTH Max:30 S2 01 | 31 13 18 | 3 1 2 |
21 RYAN M. DUNHAM Max:30 S2 02 | 32 22 10 | 1 0 1 |
31 PAUL C. FURTH Max:30 S2 03 | 32 16 16 | 3 0 3 |
41 PAUL C. FURTH Max:30 S2 04 | 30 19 11 | 3 2 1 |
42 RYAN M. DUNHAM Max:30 S2 04 | 31 17 14 | 4 2 2 |
51 PAUL C. FURTH Max:30 S2 05 | 31 17 14 | 5 1 4 |
52 RYAN M. DUNHAM Max:30 S2 05 | 27 14 13 | 3 2 1 |
61 PAUL C. FURTH Max:30 S2 06 | 30 13 17 | 1 0 1 |
62 RYAN M. DUNHAM Max:30 S2 06 | 33 18 15 | 0 0 0 |
Number of Sections: 10 Average Students Per Section: 30.90
SPE012 MATH SE 2 SM 3 180 38| 38 12 26 | 38 12 26 |
21 JOHN W. WOODY SR Max:30 S2 02 | 7 4 3 | 7 4 3 |
31 JOHN W. WOODY SR Max:30 S2 03 | 9 1 8 | 9 1 8 |
41 JOHN W. WOODY SR Max:30 S2 04 | 8 3 5 | 8 3 5 |
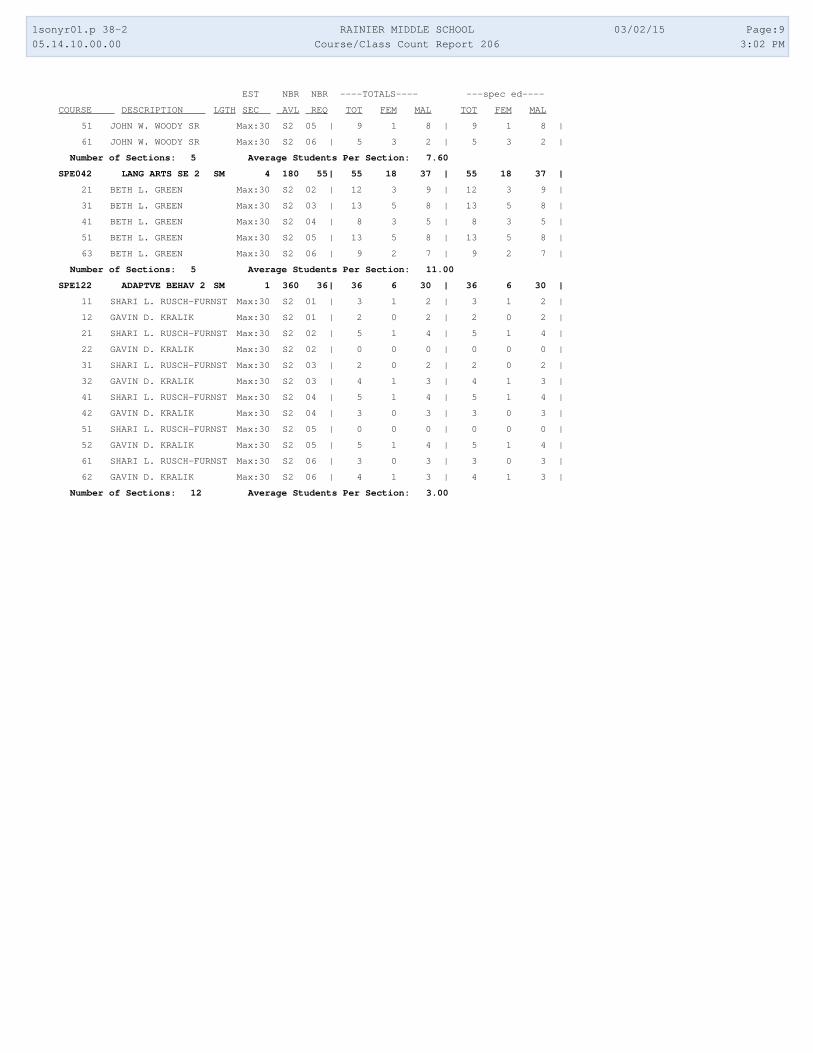
1sonyr01.p 38-2 RAINIER MIDDLE SCHOOL 03/02/15 Page:9
05.14.10.00.00 Course/Class Count Report 206 3:02 PM
EST NBR NBR ----TOTALS---- ---spec ed----
COURSE DESCRIPTION LGTH SEC AVL REQ TOT FEM MAL TOT FEM MAL
51 JOHN W. WOODY SR Max:30 S2 05 | 9 1 8 | 9 1 8 |
61 JOHN W. WOODY SR Max:30 S2 06 | 5 3 2 | 5 3 2 |
Number of Sections: 5 Average Students Per Section: 7.60
SPE042 LANG ARTS SE 2 SM 4 180 55| 55 18 37 | 55 18 37 |
21 BETH L. GREEN Max:30 S2 02 | 12 3 9 | 12 3 9 |
31 BETH L. GREEN Max:30 S2 03 | 13 5 8 | 13 5 8 |
41 BETH L. GREEN Max:30 S2 04 | 8 3 5 | 8 3 5 |
51 BETH L. GREEN Max:30 S2 05 | 13 5 8 | 13 5 8 |
63 BETH L. GREEN Max:30 S2 06 | 9 2 7 | 9 2 7 |
Number of Sections: 5 Average Students Per Section: 11.00
SPE122 ADAPTVE BEHAV 2 SM 1 360 36| 36 6 30 | 36 6 30 |
11 SHARI L. RUSCH-FURNST Max:30 S2 01 | 3 1 2 | 3 1 2 |
12 GAVIN D. KRALIK Max:30 S2 01 | 2 0 2 | 2 0 2 |
21 SHARI L. RUSCH-FURNST Max:30 S2 02 | 5 1 4 | 5 1 4 |
22 GAVIN D. KRALIK Max:30 S2 02 | 0 0 0 | 0 0 0 |
31 SHARI L. RUSCH-FURNST Max:30 S2 03 | 2 0 2 | 2 0 2 |
32 GAVIN D. KRALIK Max:30 S2 03 | 4 1 3 | 4 1 3 |
41 SHARI L. RUSCH-FURNST Max:30 S2 04 | 5 1 4 | 5 1 4 |
42 GAVIN D. KRALIK Max:30 S2 04 | 3 0 3 | 3 0 3 |
51 SHARI L. RUSCH-FURNST Max:30 S2 05 | 0 0 0 | 0 0 0 |
52 GAVIN D. KRALIK Max:30 S2 05 | 5 1 4 | 5 1 4 |
61 SHARI L. RUSCH-FURNST Max:30 S2 06 | 3 0 3 | 3 0 3 |
62 GAVIN D. KRALIK Max:30 S2 06 | 4 1 3 | 4 1 3 |
Number of Sections: 12 Average Students Per Section: 3.00

1sonyr01.p 38-2 RAINIER MIDDLE SCHOOL 03/02/15 Page:10
05.14.10.00.00 Course/Class Count Report Totals 3:02 PM
TITLE FOR TOTAL
TOTALS GROUP TOTAL FEMALE MALE
GRAND TOTALS 5539 2775 2764
spec ed 456 133 323
************************ End of report ************************

1sonyr01.p 38-2 AUBURN SENIOR HIGH SCHOOL 03/02/15 Page:1
05.14.10.00.00 Course/Class Count Report 401 3:05 PM
EST NBR NBR ----TOTALS---- --Special Ed--
COURSE DESCRIPTION LGTH SEC AVL REQ TOT FEM MAL TOT FEM MAL
ART109 PAINTING SM 4 120 61| 61 31 30 | 12 9 3 |
12 KENNY L. WHITE Max:30 S2 02 | 30 15 15 | 5 3 2 |
13 KENNY L. WHITE Max:30 S2 03 | 31 16 15 | 7 6 1 |
Number of Sections: 2 Average Students Per Section: 30.50
ART110 CERAMICS SM 1 156 69| 69 40 29 | 9 6 3 |
14 KENNY L. WHITE Max:13 S2 04 | 15 9 6 | 4 3 1 |
15 KENNY L. WHITE Max:26 S2 05 | 27 18 9 | 3 2 1 |
16 KENNY L. WHITE Max:27 S2 06 | 27 13 14 | 2 1 1 |
Number of Sections: 3 Average Students Per Section: 23.00
ART111 ADV CERAMICS SM 1 23 24| 24 17 7 | 2 2 0 |
04 KENNY L. WHITE Max:17 S2 04 | 18 13 5 | 1 1 0 |
05 KENNY L. WHITE Max:3 S2 05 | 3 1 2 | 1 1 0 |
06 KENNY L. WHITE Max:3 S2 06 | 3 3 0 | 0 0 0 |
Number of Sections: 3 Average Students Per Section: 8.00
ART115 TECH THEATRE 2 SM 1 30 29| 29 14 15 | 6 1 5 |
06 WARREN D. KERR Max:30 S2 06 | 29 14 15 | 6 1 5 |
Number of Sections: 1 Average Students Per Section: 29.00
ART117 INTR CHLD THEA2 SM 1 3 2| 2 0 2 | 1 0 1 |
05 WARREN D. KERR Max:3 S2 05 | 2 0 2 | 1 0 1 |
Number of Sections: 1 Average Students Per Section: 2.00
ART122 ACTING 2 SM 1 26 12| 12 10 2 | 2 0 2 |
05 WARREN D. KERR Max:26 S2 05 | 12 10 2 | 2 0 2 |
Number of Sections: 1 Average Students Per Section: 12.00
ART124 ACTING 4 SM 1 4 2| 2 0 2 | 0 0 0 |
05 WARREN D. KERR Max:4 S2 05 | 2 0 2 | 0 0 0 |
Number of Sections: 1 Average Students Per Section: 2.00
ART126 ACTING 6 SM 1 1 1| 1 1 0 | 0 0 0 |
05 WARREN D. KERR Max:1 S2 05 | 1 1 0 | 0 0 0 |
Number of Sections: 1 Average Students Per Section: 1.00
ART128 ACTING 8 SM 1 1 1| 1 0 1 | 0 0 0 |
05 WARREN D. KERR Max:1 S2 05 | 1 0 1 | 0 0 0 |
Number of Sections: 1 Average Students Per Section: 1.00
CTE002 HORT SCIENCE 2 SM 2 60 57| 57 22 35 | 11 4 7 |
05 RONDA D. KURKA Max:30 S2 05 | 28 10 18 | 3 1 2 |
06 RONDA D. KURKA Max:30 S2 06 | 29 12 17 | 8 3 5 |
Number of Sections: 2 Average Students Per Section: 28.50
CTE012 BIOLOGY 2 SM 1 90 74| 74 26 48 | 6 1 5 |
21 RONDA D. KURKA Max:30 S2 01 | 26 9 17 | 2 1 1 |
22 RONDA D. KURKA Max:30 S2 02 | 25 10 15 | 1 0 1 |
23 RONDA D. KURKA Max:30 S2 03 | 23 7 16 | 3 0 3 |
Number of Sections: 3 Average Students Per Section: 24.67
CTE118 MATH BUS PRFIN2 SM 2 30 24| 24 18 6 | 0 0 0 |
01 REBECCA L. KEEFE Max:30 S2 01 | 24 18 6 | 0 0 0 |
Number of Sections: 1 Average Students Per Section: 24.00
CTE135 DIGITOOLS SM 1 60 58| 58 19 39 | 17 3 14 |
02 REBECCA L. KEEFE Max:30 S2 02 | 28 7 21 | 9 1 8 |
03 REBECCA L. KEEFE Max:30 S2 03 | 30 12 18 | 8 2 6 |
Number of Sections: 2 Average Students Per Section: 29.00
CTE170 MARKETG/DECA 1 SM 3 27 2| 2 1 1 | 1 1 0 |
03 LORI D. JACOBS Max:2 S2 03 | 2 1 1 | 1 1 0 |
Number of Sections: 1 Average Students Per Section: 2.00
CTE171 MARKETG/DECA 2 SM 3 30 26| 26 17 9 | 3 2 1 |
06 LORI D. JACOBS Max:30 S2 06 | 26 17 9 | 3 2 1 |
Number of Sections: 1 Average Students Per Section: 26.00
CTE176 MKT PMGMT DECA4 SM 1 17 17| 17 13 4 | 0 0 0 |
01 LORI D. JACOBS Max:17 S2 01 | 17 13 4 | 0 0 0 |

1sonyr01.p 38-2 AUBURN SENIOR HIGH SCHOOL 03/02/15 Page:2
05.14.10.00.00 Course/Class Count Report 401 3:05 PM
EST NBR NBR ----TOTALS---- --Special Ed--
COURSE DESCRIPTION LGTH SEC AVL REQ TOT FEM MAL TOT FEM MAL
Number of Sections: 1 Average Students Per Section: 17.00
CTE178 SPTS & ENT MGMT SM 1 8 0| 0 0 0 | 0 0 0 |
01 LORI D. JACOBS Max:8 S2 06 | 0 0 0 | 0 0 0 |
Number of Sections: 1 Average Students Per Section: 0.00
CTE181 MKT BUS ADMIN 2 SM 1 5 2| 2 2 0 | 0 0 0 |
01 LORI D. JACOBS Max:5 S2 01 | 2 2 0 | 0 0 0 |
Number of Sections: 1 Average Students Per Section: 2.00
CTE183 STORE RETL OP 2 SM 1 28 31| 31 20 11 | 5 4 1 |
04 LORI D. JACOBS Max:28 S2 04 | 31 20 11 | 5 4 1 |
Number of Sections: 1 Average Students Per Section: 31.00
CTE185 STOR OP SM BSN2 SM 1 5 0| 0 0 0 | 0 0 0 |
04 LORI D. JACOBS Max:5 S2 04 | 0 0 0 | 0 0 0 |
Number of Sections: 1 Average Students Per Section: 0.00
CTE188 BSN MKT FN DECA SM 1 120 50| 50 23 27 | 3 0 3 |
12 LORI D. JACOBS Max:30 S2 02 | 30 15 15 | 1 0 1 |
13 LORI D. JACOBS Max:30 S2 03 | 20 8 12 | 2 0 2 |
Number of Sections: 2 Average Students Per Section: 25.00
CTE202 TEACHING ACAD 2 SM 2 30 5| 5 4 1 | 1 1 0 |
06 LINDA K. MORRIS Max:30 S2 06 | 5 4 1 | 1 1 0 |
Number of Sections: 1 Average Students Per Section: 5.00
CTE211 CAREER W/CHILD1 SM 2 35 0| 0 0 0 | 0 0 0 |
06 LINDA K. MORRIS Max:10 S2 06 | 0 0 0 | 0 0 0 |
Number of Sections: 1 Average Students Per Section: 0.00
CTE212 CAREER W/CHILD2 SM 2 26 26| 26 26 0 | 5 5 0 |
13 LINDA K. MORRIS Max:26 S2 03 | 26 26 0 | 5 5 0 |
Number of Sections: 1 Average Students Per Section: 26.00
CTE214 CAREER W/CHILD4 SM 1 6 3| 3 3 0 | 0 0 0 |
03 LINDA K. MORRIS Max:5 S2 03 | 3 3 0 | 0 0 0 |
IND LINDA K. MORRIS Max:1 S2 02 | 0 0 0 | 0 0 0 |
Number of Sections: 2 Average Students Per Section: 1.50
CTE225 FSHN APP DESGN1 SM 2 52 49| 49 48 1 | 7 7 0 |
02 LINDA K. MORRIS Max:26 S2 02 | 24 23 1 | 5 5 0 |
05 LINDA K. MORRIS Max:26 S2 05 | 25 25 0 | 2 2 0 |
Number of Sections: 2 Average Students Per Section: 24.50
CTE226 FSHN APP DESGN2 SM 1 8 6| 6 5 1 | 0 0 0 |
02 LINDA K. MORRIS Max:4 S2 02 | 1 1 0 | 0 0 0 |
05 LINDA K. MORRIS Max:4 S2 05 | 5 4 1 | 0 0 0 |
Number of Sections: 2 Average Students Per Section: 3.00
CTE245 INTERIOR DESIGN SM 1 60 29| 29 27 2 | 3 3 0 |
11 LINDA K. MORRIS Max:30 S2 01 | 29 27 2 | 3 3 0 |
Number of Sections: 1 Average Students Per Section: 29.00
CTE250 NUTRTN WELLNESS SM 1 60 30| 30 19 11 | 8 5 3 |
11 CINDY L. PRATT Max:30 S2 01 | 30 19 11 | 8 5 3 |
Number of Sections: 1 Average Students Per Section: 30.00
CTE266 COSMETOLOGY 2 SM 1 5 0| 0 0 0 | 0 0 0 |
01 REBECCA L. KEEFE Max:5 S2 03 | 0 0 0 | 0 0 0 |
Number of Sections: 1 Average Students Per Section: 0.00
CTE303 HEALTH CTE SM 12 240 116| 116 54 62 | 14 8 6 |
12 CINDY L. PRATT Max:30 S2 02 | 29 12 17 | 1 1 0 |
14 CINDY L. PRATT Max:30 S2 04 | 28 11 17 | 2 0 2 |
15 CINDY L. PRATT Max:30 S2 05 | 29 16 13 | 6 5 1 |
16 CINDY L. PRATT Max:30 S2 06 | 30 15 15 | 5 2 3 |
Number of Sections: 4 Average Students Per Section: 29.00
CTE304 PREVENTIVE MED SM 2 60 29| 29 18 11 | 3 2 1 |
15 KRISTA R. PARSONS Max:30 S2 05 | 29 18 11 | 3 2 1 |

1sonyr01.p 38-2 AUBURN SENIOR HIGH SCHOOL 03/02/15 Page:3
05.14.10.00.00 Course/Class Count Report 401 3:05 PM
EST NBR NBR ----TOTALS---- --Special Ed--
COURSE DESCRIPTION LGTH SEC AVL REQ TOT FEM MAL TOT FEM MAL
Number of Sections: 1 Average Students Per Section: 29.00
CTE306 ANATOMY/PHYS 2 SM 3 60 37| 37 28 9 | 0 0 0 |
02 KRISTA R. PARSONS Max:30 S2 02 | 19 14 5 | 0 0 0 |
03 KRISTA R. PARSONS Max:30 S2 03 | 18 14 4 | 0 0 0 |
Number of Sections: 2 Average Students Per Section: 18.50
CTE308 SPORTS MED 2 SM 1 19 14| 14 10 4 | 0 0 0 |
06 KRISTA R. PARSONS Max:19 S2 06 | 14 10 4 | 0 0 0 |
Number of Sections: 1 Average Students Per Section: 14.00
CTE312 ADVSPORTS MED 2 SM 3 11 10| 10 8 2 | 0 0 0 |
06 KRISTA R. PARSONS Max:11 S2 06 | 10 8 2 | 0 0 0 |
Number of Sections: 1 Average Students Per Section: 10.00
CTE332 CULINARY ARTS SM 4 127 132| 132 63 69 | 40 17 23 |
01 MARCI J. KILLIAN Max:26 S2 01 | 28 17 11 | 7 5 2 |
02 MARCI J. KILLIAN Max:26 S2 02 | 25 9 16 | 8 3 5 |
03 MARCI J. KILLIAN Max:25 S2 03 | 25 15 10 | 7 4 3 |
04 MARCI J. KILLIAN Max:20 S2 04 | 22 11 11 | 6 4 2 |
05 MARCI J. KILLIAN Max:30 S2 05 | 32 11 21 | 12 1 11 |
Number of Sections: 5 Average Students Per Section: 26.40
CTE334 ADV CULNY ART 2 SM 3 13 12| 12 5 7 | 4 2 2 |
01 MARCI J. KILLIAN Max:3 S2 01 | 2 1 1 | 1 1 0 |
02 MARCI J. KILLIAN Max:6 S2 02 | 6 2 4 | 2 1 1 |
03 MARCI J. KILLIAN Max:4 S2 03 | 4 2 2 | 1 0 1 |
Number of Sections: 3 Average Students Per Section: 4.00
CTE351 JEWL METLSCULP1 SM 6 214 80| 80 37 43 | 5 1 4 |
11 CHRISTOPHER G. TELFOR Max:26 S2 01 | 26 9 17 | 2 0 2 |
14 CHRISTOPHER G. TELFOR Max:27 S2 04 | 27 14 13 | 1 1 0 |
15 CHRISTOPHER G. TELFOR Max:27 S2 05 | 27 14 13 | 2 0 2 |
Number of Sections: 3 Average Students Per Section: 26.67
CTE352 JEWL METLSCULP2 SM 2 52 41| 41 13 28 | 8 3 5 |
02 CHRISTOPHER G. TELFOR Max:26 S2 02 | 20 8 12 | 5 1 4 |
06 CHRISTOPHER G. TELFOR Max:26 S2 06 | 21 5 16 | 3 2 1 |
Number of Sections: 2 Average Students Per Section: 20.50
CTE355 JEWL METLSCULCS SM 4 10 5| 5 1 4 | 1 1 0 |
05 CHRISTOPHER G. TELFOR Max:1 S2 05 | 1 0 1 | 0 0 0 |
06 CHRISTOPHER G. TELFOR Max:1 S2 06 | 0 0 0 | 0 0 0 |
07 CHRISTOPHER G. TELFOR Max:1 S2 02 | 3 1 2 | 1 1 0 |
11 CHRISTOPHER G. TELFOR Max:2 S2 01 | 0 0 0 | 0 0 0 |
16 CHRISTOPHER G. TELFOR Max:2 S2 06 | 1 0 1 | 0 0 0 |
Number of Sections: 5 Average Students Per Section: 1.00
CTE361 VIS COM 1 SM 4 120 49| 49 24 25 | 2 0 2 |
11 THOMAS J. KAUP Max:24 S2 01 | 24 11 13 | 2 0 2 |
12 THOMAS J. KAUP Max:24 S2 02 | 25 13 12 | 0 0 0 |
Number of Sections: 2 Average Students Per Section: 24.50
CTE362 VIS COM 2 SM 2 24 16| 16 2 14 | 0 0 0 |
06 THOMAS J. KAUP Max:24 S2 06 | 16 2 14 | 0 0 0 |
Number of Sections: 1 Average Students Per Section: 16.00
CTE371 DRAWING 1 SM 4 148 57| 57 22 35 | 9 3 6 |
13 DIANE J. SARR Max:28 S2 03 | 27 11 16 | 5 3 2 |
15 DIANE J. SARR Max:30 S2 05 | 30 11 19 | 4 0 4 |
Number of Sections: 2 Average Students Per Section: 28.50
CTE372 DRAWING 2 SM 1 30 24| 24 15 9 | 5 2 3 |
04 DIANE J. SARR Max:30 S2 04 | 24 15 9 | 5 2 3 |
Number of Sections: 1 Average Students Per Section: 24.00
CTE374 AP STUDIO ART 2 SM 1 30 8| 8 4 4 | 1 1 0 |
01 DIANE J. SARR Max:30 S2 01 | 8 4 4 | 1 1 0 |
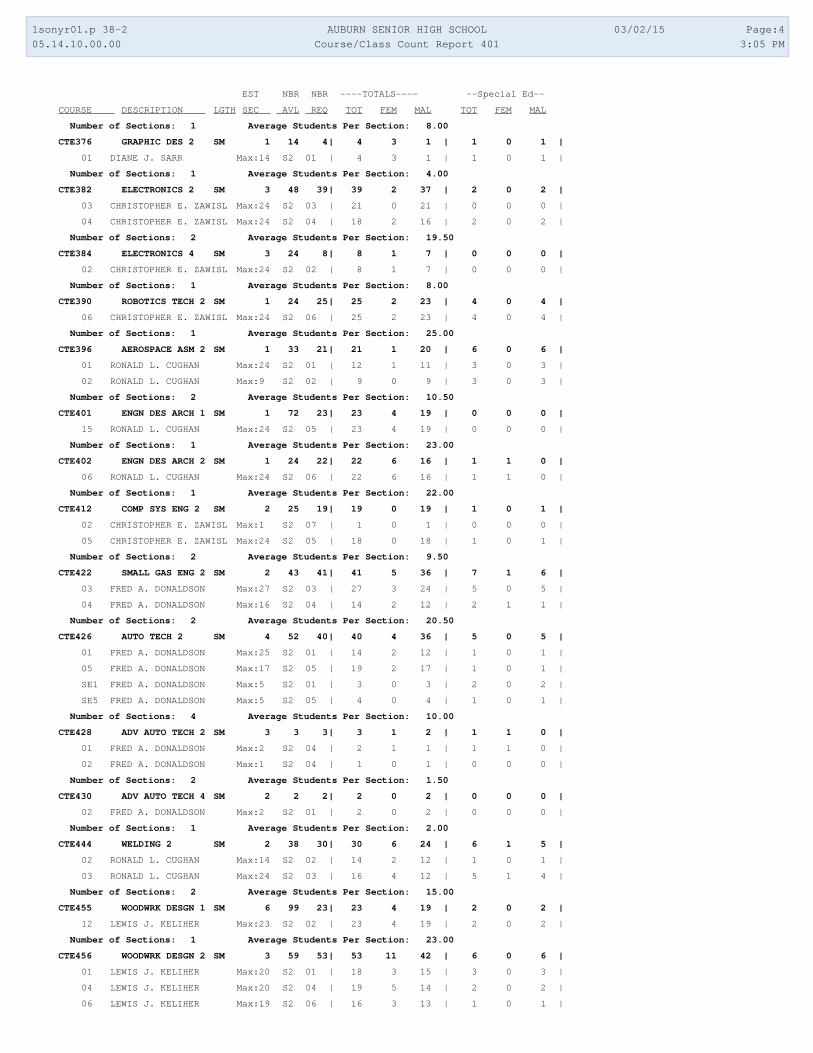
1sonyr01.p 38-2 AUBURN SENIOR HIGH SCHOOL 03/02/15 Page:4
05.14.10.00.00 Course/Class Count Report 401 3:05 PM
EST NBR NBR ----TOTALS---- --Special Ed--
COURSE DESCRIPTION LGTH SEC AVL REQ TOT FEM MAL TOT FEM MAL
Number of Sections: 1 Average Students Per Section: 8.00
CTE376 GRAPHIC DES 2 SM 1 14 4| 4 3 1 | 1 0 1 |
01 DIANE J. SARR Max:14 S2 01 | 4 3 1 | 1 0 1 |
Number of Sections: 1 Average Students Per Section: 4.00
CTE382 ELECTRONICS 2 SM 3 48 39| 39 2 37 | 2 0 2 |
03 CHRISTOPHER E. ZAWISL Max:24 S2 03 | 21 0 21 | 0 0 0 |
04 CHRISTOPHER E. ZAWISL Max:24 S2 04 | 18 2 16 | 2 0 2 |
Number of Sections: 2 Average Students Per Section: 19.50
CTE384 ELECTRONICS 4 SM 3 24 8| 8 1 7 | 0 0 0 |
02 CHRISTOPHER E. ZAWISL Max:24 S2 02 | 8 1 7 | 0 0 0 |
Number of Sections: 1 Average Students Per Section: 8.00
CTE390 ROBOTICS TECH 2 SM 1 24 25| 25 2 23 | 4 0 4 |
06 CHRISTOPHER E. ZAWISL Max:24 S2 06 | 25 2 23 | 4 0 4 |
Number of Sections: 1 Average Students Per Section: 25.00
CTE396 AEROSPACE ASM 2 SM 1 33 21| 21 1 20 | 6 0 6 |
01 RONALD L. CUGHAN Max:24 S2 01 | 12 1 11 | 3 0 3 |
02 RONALD L. CUGHAN Max:9 S2 02 | 9 0 9 | 3 0 3 |
Number of Sections: 2 Average Students Per Section: 10.50
CTE401 ENGN DES ARCH 1 SM 1 72 23| 23 4 19 | 0 0 0 |
15 RONALD L. CUGHAN Max:24 S2 05 | 23 4 19 | 0 0 0 |
Number of Sections: 1 Average Students Per Section: 23.00
CTE402 ENGN DES ARCH 2 SM 1 24 22| 22 6 16 | 1 1 0 |
06 RONALD L. CUGHAN Max:24 S2 06 | 22 6 16 | 1 1 0 |
Number of Sections: 1 Average Students Per Section: 22.00
CTE412 COMP SYS ENG 2 SM 2 25 19| 19 0 19 | 1 0 1 |
02 CHRISTOPHER E. ZAWISL Max:1 S2 07 | 1 0 1 | 0 0 0 |
05 CHRISTOPHER E. ZAWISL Max:24 S2 05 | 18 0 18 | 1 0 1 |
Number of Sections: 2 Average Students Per Section: 9.50
CTE422 SMALL GAS ENG 2 SM 2 43 41| 41 5 36 | 7 1 6 |
03 FRED A. DONALDSON Max:27 S2 03 | 27 3 24 | 5 0 5 |
04 FRED A. DONALDSON Max:16 S2 04 | 14 2 12 | 2 1 1 |
Number of Sections: 2 Average Students Per Section: 20.50
CTE426 AUTO TECH 2 SM 4 52 40| 40 4 36 | 5 0 5 |
01 FRED A. DONALDSON Max:25 S2 01 | 14 2 12 | 1 0 1 |
05 FRED A. DONALDSON Max:17 S2 05 | 19 2 17 | 1 0 1 |
SE1 FRED A. DONALDSON Max:5 S2 01 | 3 0 3 | 2 0 2 |
SE5 FRED A. DONALDSON Max:5 S2 05 | 4 0 4 | 1 0 1 |
Number of Sections: 4 Average Students Per Section: 10.00
CTE428 ADV AUTO TECH 2 SM 3 3 3| 3 1 2 | 1 1 0 |
01 FRED A. DONALDSON Max:2 S2 04 | 2 1 1 | 1 1 0 |
02 FRED A. DONALDSON Max:1 S2 04 | 1 0 1 | 0 0 0 |
Number of Sections: 2 Average Students Per Section: 1.50
CTE430 ADV AUTO TECH 4 SM 2 2 2| 2 0 2 | 0 0 0 |
02 FRED A. DONALDSON Max:2 S2 01 | 2 0 2 | 0 0 0 |
Number of Sections: 1 Average Students Per Section: 2.00
CTE444 WELDING 2 SM 2 38 30| 30 6 24 | 6 1 5 |
02 RONALD L. CUGHAN Max:14 S2 02 | 14 2 12 | 1 0 1 |
03 RONALD L. CUGHAN Max:24 S2 03 | 16 4 12 | 5 1 4 |
Number of Sections: 2 Average Students Per Section: 15.00
CTE455 WOODWRK DESGN 1 SM 6 99 23| 23 4 19 | 2 0 2 |
12 LEWIS J. KELIHER Max:23 S2 02 | 23 4 19 | 2 0 2 |
Number of Sections: 1 Average Students Per Section: 23.00
CTE456 WOODWRK DESGN 2 SM 3 59 53| 53 11 42 | 6 0 6 |
01 LEWIS J. KELIHER Max:20 S2 01 | 18 3 15 | 3 0 3 |
04 LEWIS J. KELIHER Max:20 S2 04 | 19 5 14 | 2 0 2 |
06 LEWIS J. KELIHER Max:19 S2 06 | 16 3 13 | 1 0 1 |

1sonyr01.p 38-2 AUBURN SENIOR HIGH SCHOOL 03/02/15 Page:5
05.14.10.00.00 Course/Class Count Report 401 3:05 PM
EST NBR NBR ----TOTALS---- --Special Ed--
COURSE DESCRIPTION LGTH SEC AVL REQ TOT FEM MAL TOT FEM MAL
Number of Sections: 3 Average Students Per Section: 17.67
CTE458 WOODWRK DESGN 4 SM 1 34 35| 35 10 25 | 6 1 5 |
01 LEWIS J. KELIHER Max:2 S2 01 | 2 1 1 | 0 0 0 |
02 LEWIS J. KELIHER Max:1 S2 02 | 3 2 1 | 0 0 0 |
04 LEWIS J. KELIHER Max:4 S2 04 | 4 1 3 | 1 0 1 |
05 LEWIS J. KELIHER Max:23 S2 05 | 21 5 16 | 5 1 4 |
06 LEWIS J. KELIHER Max:4 S2 06 | 5 1 4 | 0 0 0 |
Number of Sections: 5 Average Students Per Section: 7.00
CTE462 WOODWRK DESGN 6 SM 5 19 18| 18 3 15 | 0 0 0 |
01 LEWIS J. KELIHER Max:4 S2 01 | 3 1 2 | 0 0 0 |
04 LEWIS J. KELIHER Max:5 S2 04 | 5 1 4 | 0 0 0 |
05 LEWIS J. KELIHER Max:5 S2 05 | 5 0 5 | 0 0 0 |
06 LEWIS J. KELIHER Max:5 S2 06 | 5 1 4 | 0 0 0 |
Number of Sections: 4 Average Students Per Section: 4.50
CTE466 YEARBOOK 2 SM 1 24 18| 18 9 9 | 0 0 0 |
04 THOMAS J. KAUP Max:24 S2 04 | 18 9 9 | 0 0 0 |
Number of Sections: 1 Average Students Per Section: 18.00
CTE470 WBL GENERIC SM 1 200 0| 0 0 0 | 0 0 0 |
14 REBECCA L. KEEFE Max:100 S2 07 | 0 0 0 | 0 0 0 |
Number of Sections: 1 Average Students Per Section: 0.00
CTE472 WBL AUTOMOTIVE SM 1 20 0| 0 0 0 | 0 0 0 |
02 REBECCA L. KEEFE Max:10 S2 07 | 0 0 0 | 0 0 0 |
Number of Sections: 1 Average Students Per Section: 0.00
CTE473 WBL BUS ED SM 1 60 1| 1 1 0 | 0 0 0 |
02 REBECCA L. KEEFE Max:30 S2 07 | 1 1 0 | 0 0 0 |
Number of Sections: 1 Average Students Per Section: 1.00
CTE477 WBL CULNY ARTS SM 1 60 3| 3 3 0 | 0 0 0 |
02 REBECCA L. KEEFE Max:30 S2 07 | 3 3 0 | 0 0 0 |
Number of Sections: 1 Average Students Per Section: 3.00
CTE480 WBL FAM CONS SC SM 1 60 4| 4 3 1 | 0 0 0 |
02 REBECCA L. KEEFE Max:30 S2 07 | 4 3 1 | 0 0 0 |
Number of Sections: 1 Average Students Per Section: 4.00
CTE484 WBL MARKETING SM 1 60 2| 2 2 0 | 0 0 0 |
14 REBECCA L. KEEFE Max:30 S2 07 | 2 2 0 | 0 0 0 |
Number of Sections: 1 Average Students Per Section: 2.00
CTE485 WBL METALS MFG SM 1 60 0| 0 0 0 | 0 0 0 |
14 REBECCA L. KEEFE Max:30 S2 07 | 0 0 0 | 0 0 0 |
Number of Sections: 1 Average Students Per Section: 0.00
CTE487 WBL SPORTS MED SM 1 10 0| 0 0 0 | 0 0 0 |
02 REBECCA L. KEEFE Max:5 S2 07 | 0 0 0 | 0 0 0 |
Number of Sections: 1 Average Students Per Section: 0.00
CTE490 WBL CAR CHOICES SM 1 60 10| 10 7 3 | 0 0 0 |
02 REBECCA L. KEEFE Max:30 S2 07 | 10 7 3 | 0 0 0 |
Number of Sections: 1 Average Students Per Section: 10.00
CTE515 NEWSPAPER 2 SM 1 10 12| 12 7 5 | 0 0 0 |
05 THOMAS J. KAUP Max:10 S2 05 | 12 7 5 | 0 0 0 |
Number of Sections: 1 Average Students Per Section: 12.00
ELL121 ELL STDY SKILL2 SM 1 30 25| 25 13 12 | 2 1 1 |
06 NECIA L. HANSEN Max:30 S2 06 | 25 13 12 | 2 1 1 |
Number of Sections: 1 Average Students Per Section: 25.00
ELL202 ELL LAN ART 2B SM 1 50 18| 18 9 9 | 0 0 0 |
02 NECIA L. HANSEN Max:30 S2 02 | 9 6 3 | 0 0 0 |
05 NECIA L. HANSEN Max:20 S2 05 | 9 3 6 | 0 0 0 |
Number of Sections: 2 Average Students Per Section: 9.00
ELL302 ELL LAN ART 3B SM 1 40 24| 24 8 16 | 0 0 0 |
03 NECIA L. HANSEN Max:30 S2 03 | 15 7 8 | 0 0 0 |

1sonyr01.p 38-2 AUBURN SENIOR HIGH SCHOOL 03/02/15 Page:6
05.14.10.00.00 Course/Class Count Report 401 3:05 PM
EST NBR NBR ----TOTALS---- --Special Ed--
COURSE DESCRIPTION LGTH SEC AVL REQ TOT FEM MAL TOT FEM MAL
04 LEE A. CLOW Max:10 S2 04 | 9 1 8 | 0 0 0 |
Number of Sections: 2 Average Students Per Section: 12.00
FOR202 FRENCH 2 SM 4 90 81| 81 52 29 | 1 1 0 |
01 GREGORY S. ISHAM Max:30 S2 01 | 30 21 9 | 0 0 0 |
05 CARMEN Z. REINHARDT Max:30 S2 05 | 22 13 9 | 1 1 0 |
06 CARMEN Z. REINHARDT Max:30 S2 06 | 29 18 11 | 0 0 0 |
Number of Sections: 3 Average Students Per Section: 27.00
FOR204 FRENCH 4 SM 2 90 65| 65 29 36 | 2 1 1 |
02 GREGORY S. ISHAM Max:30 S2 02 | 23 10 13 | 2 1 1 |
03 GREGORY S. ISHAM Max:30 S2 03 | 25 12 13 | 0 0 0 |
05 GREGORY S. ISHAM Max:30 S2 05 | 17 7 10 | 0 0 0 |
Number of Sections: 3 Average Students Per Section: 21.67
FOR206 FRENCH 6 SM 1 10 1| 1 1 0 | 0 0 0 |
04 GREGORY S. ISHAM Max:10 S2 04 | 1 1 0 | 0 0 0 |
Number of Sections: 1 Average Students Per Section: 1.00
FOR210 AP FRENCH 2 SM 1 25 7| 7 2 5 | 0 0 0 |
04 GREGORY S. ISHAM Max:25 S2 04 | 7 2 5 | 0 0 0 |
Number of Sections: 1 Average Students Per Section: 7.00
FOR452 CHINESE 2 SM 1 30 11| 11 2 9 | 0 0 0 |
01 LEE A. CLOW Max:30 S2 01 | 11 2 9 | 0 0 0 |
Number of Sections: 1 Average Students Per Section: 11.00
FOR602 SPANISH 2 SM 5 180 128| 128 81 47 | 2 0 2 |
01 BRIAN M. KELLER Max:30 S2 01 | 20 11 9 | 0 0 0 |
02 BRIAN M. KELLER Max:30 S2 02 | 15 9 6 | 0 0 0 |
03 AMBER A. DAVIS Max:30 S2 03 | 19 10 9 | 0 0 0 |
04 AMBER A. DAVIS Max:30 S2 04 | 26 19 7 | 1 0 1 |
05 AMBER A. DAVIS Max:30 S2 05 | 20 14 6 | 0 0 0 |
06 AMBER A. DAVIS Max:30 S2 06 | 28 18 10 | 1 0 1 |
Number of Sections: 6 Average Students Per Section: 21.33
FOR604 SPANISH 4 SM 4 120 98| 98 46 52 | 1 1 0 |
01 CARMEN Z. REINHARDT Max:30 S2 01 | 18 12 6 | 0 0 0 |
02 CARMEN Z. REINHARDT Max:30 S2 02 | 20 10 10 | 0 0 0 |
03 BRIAN M. KELLER Max:30 S2 03 | 30 11 19 | 1 1 0 |
06 BRIAN M. KELLER Max:30 S2 06 | 30 13 17 | 0 0 0 |
Number of Sections: 4 Average Students Per Section: 24.50
FOR606 SPANISH 6 SM 2 30 11| 11 5 6 | 0 0 0 |
01 AMBER A. DAVIS Max:30 S2 01 | 11 5 6 | 0 0 0 |
Number of Sections: 1 Average Students Per Section: 11.00
FOR610 AP SPANISH 2 SM 1 30 6| 6 4 2 | 0 0 0 |
03 CARMEN Z. REINHARDT Max:30 S2 03 | 6 4 2 | 0 0 0 |
Number of Sections: 1 Average Students Per Section: 6.00
GEN101 ORIENTATION SM 11 60 31| 31 14 17 | 4 2 2 |
14 REBECCA L. KEEFE Max:30 S2 04 | 31 14 17 | 4 2 2 |
Number of Sections: 1 Average Students Per Section: 31.00
GEN200 ADVISORY 9-12 YR 1 991 49| 49 20 29 | 18 6 12 |
01 NECIA L. HANSEN Max:70 YR 09 | 49 20 29 | 18 6 12 |
04 MARCELA FIGUEROA Max:25 YR 09 | 0 0 0 | 0 0 0 |
05 KYLE B. JONES Max:30 YR 09 | 0 0 0 | 0 0 0 |
06 TERESA A. MCLUEN Max:25 YR 09 | 0 0 0 | 0 0 0 |
07 ANGELA D. STUBBLEFIEL Max:25 YR 09 | 0 0 0 | 0 0 0 |
08 BRANDI N. COLE Max:25 YR 09 | 0 0 0 | 0 0 0 |
09 JUDITH E. LUTTON Max:30 YR 09 | 0 0 0 | 0 0 0 |
10 DANIEL B. BORDEN Max:25 YR 09 | 0 0 0 | 0 0 0 |
11 MICHAELA M. HERRERA Max:25 YR 09 | 0 0 0 | 0 0 0 |
12 LESLIE L. KIILSGAARD Max:25 YR 09 | 0 0 0 | 0 0 0 |
13 JERRY T. FREEMAN JR Max:15 YR 09 | 0 0 0 | 0 0 0 |

1sonyr01.p 38-2 AUBURN SENIOR HIGH SCHOOL 03/02/15 Page:7
05.14.10.00.00 Course/Class Count Report 401 3:05 PM
EST NBR NBR ----TOTALS---- --Special Ed--
COURSE DESCRIPTION LGTH SEC AVL REQ TOT FEM MAL TOT FEM MAL
15 ALETA L. JOHNSON Max:30 YR 09 | 0 0 0 | 0 0 0 |
16 LISA M. WOODY Max:10 YR 09 | 0 0 0 | 0 0 0 |
17 KYM M. HALES Max:15 YR 09 | 0 0 0 | 0 0 0 |
18 JAYNE CRIDDLE Max:16 YR 09 | 0 0 0 | 0 0 0 |
Number of Sections: 15 Average Students Per Section: 3.27
GEN215 ADVISORY 2015 YR 1 450 0| 0 0 0 | 0 0 0 |
02 JAMES P. CLEARY Max:30 YR 09 | 0 0 0 | 0 0 0 |
03 AMBER A. DAVIS Max:30 YR 09 | 0 0 0 | 0 0 0 |
04 FRED A. DONALDSON Max:30 YR 09 | 0 0 0 | 0 0 0 |
05 JENNIFER D. COOKE Max:30 YR 09 | 0 0 0 | 0 0 0 |
06 MICHAEL A. GRENZ Max:30 YR 09 | 0 0 0 | 0 0 0 |
07 RYAN A. HANSEN Max:30 YR 09 | 0 0 0 | 0 0 0 |
08 DYANN SEIDL Max:30 YR 09 | 0 0 0 | 0 0 0 |
09 ERICA L. HINSON Max:30 YR 09 | 0 0 0 | 0 0 0 |
12 LORI D. JACOBS Max:30 YR 09 | 0 0 0 | 0 0 0 |
14 AIMEE B. OPINCARNE Max:30 YR 09 | 0 0 0 | 0 0 0 |
15 CINDY L. PRATT Max:30 YR 09 | 0 0 0 | 0 0 0 |
16 ABRAHAM P. VANDERPUY Max:30 YR 09 | 0 0 0 | 0 0 0 |
17 CRYSTAL A. WISNESS Max:30 YR 09 | 0 0 0 | 0 0 0 |
18 JOHN H. YORKE Max:30 YR 09 | 0 0 0 | 0 0 0 |
19 WHITNEY R. BAILEY Max:30 YR 09 | 0 0 0 | 0 0 0 |
Number of Sections: 15 Average Students Per Section: 0.00
GEN216 ADVISORY 2016 YR 1 540 0| 0 0 0 | 0 0 0 |
01 ADAM L. LADAGE Max:30 YR 09 | 0 0 0 | 0 0 0 |
02 SUSAN M. BOWERS Max:30 YR 09 | 0 0 0 | 0 0 0 |
03 ANTHONY E. CALLERO Max:30 YR 09 | 0 0 0 | 0 0 0 |
04 JASON L. CAPPS Max:30 YR 09 | 0 0 0 | 0 0 0 |
05 RONALD L. CUGHAN Max:30 YR 09 | 0 0 0 | 0 0 0 |
06 GORDON A. ELLIOTT Max:30 YR 09 | 0 0 0 | 0 0 0 |
07 JANICE M. ERIE Max:30 YR 09 | 0 0 0 | 0 0 0 |
08 CHARLES M. FITZGERALD Max:30 YR 09 | 0 0 0 | 0 0 0 |
09 ANNA M. MARSHALL Max:30 YR 09 | 0 0 0 | 0 0 0 |
10 GREGORY S. ISHAM Max:30 YR 09 | 0 0 0 | 0 0 0 |
12 LEWIS J. KELIHER Max:30 YR 09 | 0 0 0 | 0 0 0 |
13 BRIAN M. KELLER Max:30 YR 09 | 0 0 0 | 0 0 0 |
14 PATRICK W. MARTIN Max:30 YR 09 | 0 0 0 | 0 0 0 |
15 SCOTT J. MCLAUGHLIN Max:30 YR 09 | 0 0 0 | 0 0 0 |
16 BRUCE J. MORRIS Max:30 YR 09 | 0 0 0 | 0 0 0 |
17 NUKA NURZHANOV Max:30 YR 09 | 0 0 0 | 0 0 0 |
18 DONNA L. BOWLER Max:30 YR 09 | 0 0 0 | 0 0 0 |
19 ROBIN J. PRATT Max:30 YR 09 | 0 0 0 | 0 0 0 |
Number of Sections: 18 Average Students Per Section: 0.00
GEN217 ADVISORY 2017 YR 1 540 0| 0 0 0 | 0 0 0 |
01 ABIJAH G. ALASTRA Max:30 YR 09 | 0 0 0 | 0 0 0 |
02 EDWARD M. BENDER Max:30 YR 09 | 0 0 0 | 0 0 0 |
03 ROBERT C. JONES Max:30 YR 09 | 0 0 0 | 0 0 0 |
05 ELSBETH C. COCKCROFT Max:30 YR 09 | 0 0 0 | 0 0 0 |
06 KANDY R. GILBERT Max:30 YR 09 | 0 0 0 | 0 0 0 |
07 ERIK G. GUNDERSON Max:30 YR 09 | 0 0 0 | 0 0 0 |
08 THOMAS J. KAUP Max:30 YR 09 | 0 0 0 | 0 0 0 |
09 WARREN D. KERR Max:30 YR 09 | 0 0 0 | 0 0 0 |
10 PHILIP N. SMETHERAM Max:30 YR 09 | 0 0 0 | 0 0 0 |
11 APRIL M. ASFOUR Max:30 YR 09 | 0 0 0 | 0 0 0 |
12 ERIC R. MOHLER Max:30 YR 09 | 0 0 0 | 0 0 0 |
13 VICKI H. MUNOZ Max:30 YR 09 | 0 0 0 | 0 0 0 |
14 REBECCA L. KEEFE Max:30 YR 09 | 0 0 0 | 0 0 0 |

1sonyr01.p 38-2 AUBURN SENIOR HIGH SCHOOL 03/02/15 Page:8
05.14.10.00.00 Course/Class Count Report 401 3:05 PM
EST NBR NBR ----TOTALS---- --Special Ed--
COURSE DESCRIPTION LGTH SEC AVL REQ TOT FEM MAL TOT FEM MAL
15 BESS E. OWENS Max:30 YR 09 | 0 0 0 | 0 0 0 |
16 KJEL P. KIILSGAARD Max:30 YR 09 | 0 0 0 | 0 0 0 |
17 CHRISTOPHER G. TELFOR Max:30 YR 09 | 0 0 0 | 0 0 0 |
18 KENNY L. WHITE Max:30 YR 09 | 0 0 0 | 0 0 0 |
19 CHRISTOPHER E. ZAWISL Max:30 YR 09 | 0 0 0 | 0 0 0 |
Number of Sections: 18 Average Students Per Section: 0.00
GEN301 STUDY SKILLS SM 1 151 41| 41 15 26 | 5 0 5 |
02 ROBIN J. PRATT Max:15 S2 02 | 14 7 7 | 2 0 2 |
03 ROBIN J. PRATT Max:15 S2 03 | 13 3 10 | 2 0 2 |
04 ROBIN J. PRATT Max:30 S2 04 | 4 0 4 | 1 0 1 |
06 ROBIN J. PRATT Max:1 S2 06 | 0 0 0 | 0 0 0 |
AP6 EDWARD M. BENDER Max:30 S2 06 | 10 5 5 | 0 0 0 |
Number of Sections: 5 Average Students Per Section: 8.20
GEN508 ATTEND AIDE SM 3 8 28| 28 14 14 | 5 3 2 |
01 DOUGLAS B. BURT Max:1 S2 01 | 3 3 0 | 1 1 0 |
02 DOUGLAS B. BURT Max:1 S2 02 | 4 0 4 | 1 0 1 |
03 DOUGLAS B. BURT Max:1 S2 03 | 4 2 2 | 0 0 0 |
04 DOUGLAS B. BURT Max:1 S2 04 | 5 3 2 | 0 0 0 |
05 DOUGLAS B. BURT Max:1 S2 05 | 2 1 1 | 1 1 0 |
06 DOUGLAS B. BURT Max:1 S2 06 | 3 1 2 | 2 1 1 |
07 DOUGLAS B. BURT Max:1 S2 07 | 4 3 1 | 0 0 0 |
09 DOUGLAS B. BURT Max:1 S2 08 | 3 1 2 | 0 0 0 |
Number of Sections: 8 Average Students Per Section: 3.50
GEN512 GUID OFF AIDE SM 6 7 6| 6 4 2 | 0 0 0 |
01 MICHAELA M. HERRERA Max:1 S2 01 | 1 1 0 | 0 0 0 |
02 MICHAELA M. HERRERA Max:1 S2 02 | 1 1 0 | 0 0 0 |
03 MICHAELA M. HERRERA Max:1 S2 03 | 1 0 1 | 0 0 0 |
04 MICHAELA M. HERRERA Max:1 S2 04 | 1 1 0 | 0 0 0 |
05 MICHAELA M. HERRERA Max:1 S2 05 | 1 0 1 | 0 0 0 |
06 MICHAELA M. HERRERA Max:1 S2 06 | 1 1 0 | 0 0 0 |
09 MICHAELA M. HERRERA Max:1 S2 08 | 0 0 0 | 0 0 0 |
Number of Sections: 7 Average Students Per Section: 0.86
GEN607 PEER TUTOR SM 10 44 40| 40 29 11 | 2 1 1 |
01 JASON L. CAPPS Max:1 S2 05 | 1 0 1 | 0 0 0 |
02 CHARLES W. TOZER JR Max:1 S2 02 | 1 1 0 | 0 0 0 |
03 KRISTA R. PARSONS Max:1 S2 05 | 1 1 0 | 0 0 0 |
03A EDWARD M. BENDER Max:1 S2 03 | 1 1 0 | 0 0 0 |
04 ANTHONY E. CALLERO Max:1 S2 04 | 1 1 0 | 0 0 0 |
05 FRED A. DONALDSON Max:1 S2 05 | 1 0 1 | 0 0 0 |
05A ERICKA A. CONNELLY Max:1 S2 05 | 1 1 0 | 0 0 0 |
06 MICHAEL A. GRENZ Max:1 S2 06 | 1 0 1 | 0 0 0 |
07 BRANDI N. COLE Max:1 S2 05 | 1 1 0 | 1 1 0 |
08 BRANDI N. COLE Max:1 S2 05 | 1 0 1 | 1 0 1 |
10 JASON L. CAPPS Max:1 S2 04 | 1 1 0 | 0 0 0 |
11 MICHAEL A. GRENZ Max:1 S2 03 | 1 0 1 | 0 0 0 |
12 JOHN H. YORKE Max:1 S2 03 | 1 1 0 | 0 0 0 |
13 PHILIP N. SMETHERAM Max:1 S2 03 | 1 0 1 | 0 0 0 |
14 PHILIP N. SMETHERAM Max:1 S2 04 | 1 1 0 | 0 0 0 |
15 JESSICA L. HANSEN Max:1 S2 04 | 1 1 0 | 0 0 0 |
16 ERICKA A. CONNELLY Max:1 S2 03 | 1 0 1 | 0 0 0 |
17 MICHAEL A. GRENZ Max:1 S2 02 | 1 1 0 | 0 0 0 |
18 JON W. PRICE Max:1 S2 04 | 1 1 0 | 0 0 0 |
19 KEITH B. RODMAN Max:1 S2 04 | 1 1 0 | 0 0 0 |
20 BRIAN M. KELLER Max:1 S2 01 | 1 1 0 | 0 0 0 |
21 SCOTT J. MCLAUGHLIN Max:1 S2 06 | 1 0 1 | 0 0 0 |
22 GREGORY S. ISHAM Max:1 S2 03 | 1 1 0 | 0 0 0 |

1sonyr01.p 38-2 AUBURN SENIOR HIGH SCHOOL 03/02/15 Page:9
05.14.10.00.00 Course/Class Count Report 401 3:05 PM
EST NBR NBR ----TOTALS---- --Special Ed--
COURSE DESCRIPTION LGTH SEC AVL REQ TOT FEM MAL TOT FEM MAL
23 KENNY L. WHITE Max:1 S2 03 | 1 1 0 | 0 0 0 |
24 JOHN H. YORKE Max:1 S2 02 | 1 0 1 | 0 0 0 |
25 JESSICA L. HANSEN Max:1 S2 06 | 1 1 0 | 0 0 0 |
26 JESSICA L. HANSEN Max:1 S2 02 | 1 1 0 | 0 0 0 |
27 ERICA L. HINSON Max:1 S2 03 | 1 0 1 | 0 0 0 |
28 JOHN H. YORKE Max:1 S2 04 | 1 1 0 | 0 0 0 |
29 JOHN H. YORKE Max:1 S2 04 | 1 1 0 | 0 0 0 |
31 JANICE M. ERIE Max:1 S2 04 | 1 1 0 | 0 0 0 |
32 JERRY T. FREEMAN JR Max:1 S2 02 | 1 1 0 | 0 0 0 |
33 CRYSTAL A. WISNESS Max:1 S2 02 | 1 1 0 | 0 0 0 |
34 GORDON A. ELLIOTT Max:1 S2 04 | 1 0 1 | 0 0 0 |
35 DONNA L. BOWLER Max:1 S2 04 | 1 1 0 | 0 0 0 |
36 JONATHAN G. MOREHEAD Max:1 S2 05 | 1 1 0 | 0 0 0 |
37 KEITH B. RODMAN Max:1 S2 02 | 1 1 0 | 0 0 0 |
38 LINDA K. MORRIS Max:2 S2 06 | 2 2 0 | 0 0 0 |
PE KJEL P. KIILSGAARD Max:2 S2 05 | 0 0 0 | 0 0 0 |
PE2 KJEL P. KIILSGAARD Max:2 S2 02 | 1 1 0 | 0 0 0 |
Number of Sections: 40 Average Students Per Section: 1.00
GEN700 RELEASE TIME SM 1 450 219| 219 106 113 | 85 38 47 |
01B RICHARD A. ZIMMERMAN Max:50 S2 01 | 40 18 22 | 19 8 11 |
02B RICHARD A. ZIMMERMAN Max:30 S2 02 | 28 15 13 | 16 8 8 |
03B RICHARD A. ZIMMERMAN Max:30 S2 03 | 19 11 8 | 3 1 2 |
04B RICHARD A. ZIMMERMAN Max:30 S2 04 | 21 11 10 | 7 4 3 |
05B RICHARD A. ZIMMERMAN Max:30 S2 05 | 33 16 17 | 11 6 5 |
06B RICHARD A. ZIMMERMAN Max:60 S2 06 | 78 35 43 | 29 11 18 |
Number of Sections: 6 Average Students Per Section: 36.50
GEN701 REL-SEMINARY YR 1 101 19| 19 8 11 | 0 0 0 |
01 RICHARD A. ZIMMERMAN Max:1 YR 01 | 4 2 2 | 0 0 0 |
03 RICHARD A. ZIMMERMAN Max:10 YR 08 | 2 1 1 | 0 0 0 |
04 RICHARD A. ZIMMERMAN Max:30 YR 04 | 5 2 3 | 0 0 0 |
05 RICHARD A. ZIMMERMAN Max:30 YR 05 | 8 3 5 | 0 0 0 |
Number of Sections: 4 Average Students Per Section: 4.75
GEN708 APEX SM 2 244 142| 142 62 80 | 8 2 6 |
11 WARREN D. KERR Max:30 S2 01 | 23 9 14 | 4 2 2 |
12 WARREN D. KERR Max:30 S2 02 | 30 12 18 | 1 0 1 |
13 WARREN D. KERR Max:30 S2 04 | 30 11 19 | 1 0 1 |
15 CRYSTAL A. WISNESS Max:30 S2 05 | 28 12 16 | 0 0 0 |
16 CRYSTAL A. WISNESS Max:30 S2 06 | 29 17 12 | 2 0 2 |
IS2 CRYSTAL A. WISNESS Max:2 S2 07 | 2 1 1 | 0 0 0 |
Number of Sections: 6 Average Students Per Section: 23.67
GEN710 RUNNING START SM 12 1400 341| 341 230 111 | 0 0 0 |
01B DANIEL B. BORDEN Max:100 S2 01 | 47 32 15 | 0 0 0 |
02B DANIEL B. BORDEN Max:100 S2 02 | 59 38 21 | 0 0 0 |
03B DANIEL B. BORDEN Max:100 S2 03 | 59 39 20 | 0 0 0 |
04B DANIEL B. BORDEN Max:100 S2 04 | 59 39 20 | 0 0 0 |
05B DANIEL B. BORDEN Max:100 S2 05 | 59 41 18 | 0 0 0 |
06B DANIEL B. BORDEN Max:100 S2 06 | 58 41 17 | 0 0 0 |
07B DANIEL B. BORDEN Max:100 S2 07 | 0 0 0 | 0 0 0 |
Number of Sections: 7 Average Students Per Section: 48.71
GEN806 ADV LEADERSHIP SM 2 60 22| 22 12 10 | 3 1 2 |
14 MYCAH C. BIRGE Max:30 S2 04 | 22 12 10 | 3 1 2 |
Number of Sections: 1 Average Students Per Section: 22.00
GEN811 MS STUDENT YR 1 180 0| 0 0 0 | 0 0 0 |
06 RICHARD A. ZIMMERMAN Max:30 YR 06 | 0 0 0 | 0 0 0 |
1 RICHARD A. ZIMMERMAN Max:30 YR 01 | 0 0 0 | 0 0 0 |
2 RICHARD A. ZIMMERMAN Max:30 YR 02 | 0 0 0 | 0 0 0 |

1sonyr01.p 38-2 AUBURN SENIOR HIGH SCHOOL 03/02/15 Page:10
05.14.10.00.00 Course/Class Count Report 401 3:05 PM
EST NBR NBR ----TOTALS---- --Special Ed--
COURSE DESCRIPTION LGTH SEC AVL REQ TOT FEM MAL TOT FEM MAL
3 RICHARD A. ZIMMERMAN Max:30 YR 03 | 0 0 0 | 0 0 0 |
4 RICHARD A. ZIMMERMAN Max:30 YR 04 | 0 0 0 | 0 0 0 |
5 RICHARD A. ZIMMERMAN Max:30 YR 05 | 0 0 0 | 0 0 0 |
Number of Sections: 6 Average Students Per Section: 0.00
GEN813 in AMHS course SM 1 60 0| 0 0 0 | 0 0 0 |
32 <None> Max:30 S2 03 | 0 0 0 | 0 0 0 |
Number of Sections: 1 Average Students Per Section: 0.00
GEN821 AMHS STUDENT YR 3 181 36| 36 4 32 | 4 0 4 |
01 <None> Max:30 YR 01 | 4 0 4 | 0 0 0 |
02 <None> Max:30 YR 02 | 4 0 4 | 0 0 0 |
03 <None> Max:30 YR 03 | 9 1 8 | 1 0 1 |
04 <None> Max:30 YR 04 | 9 1 8 | 1 0 1 |
05 <None> Max:30 YR 05 | 5 1 4 | 1 0 1 |
06 <None> Max:30 YR 06 | 5 1 4 | 1 0 1 |
07 <None> Max:1 YR 07 | 0 0 0 | 0 0 0 |
Number of Sections: 7 Average Students Per Section: 5.14
GEN822 ARHS STUDENT YR 1 180 36| 36 0 36 | 4 0 4 |
01 <None> Max:30 YR 01 | 5 0 5 | 0 0 0 |
02 <None> Max:30 YR 02 | 5 0 5 | 0 0 0 |
03 <None> Max:30 YR 03 | 9 0 9 | 1 0 1 |
04 <None> Max:30 YR 04 | 9 0 9 | 1 0 1 |
05 <None> Max:30 YR 05 | 4 0 4 | 1 0 1 |
06 <None> Max:30 YR 06 | 4 0 4 | 1 0 1 |
Number of Sections: 6 Average Students Per Section: 6.00
GEN823 WAHS STUDENT YR 1 210 42| 42 30 12 | 8 4 4 |
01 <None> Max:30 YR 01 | 5 3 2 | 1 0 1 |
02 <None> Max:30 YR 02 | 6 4 2 | 1 0 1 |
03 <None> Max:30 YR 03 | 9 6 3 | 2 1 1 |
04 <None> Max:30 YR 04 | 9 6 3 | 2 1 1 |
05 <None> Max:30 YR 05 | 6 5 1 | 1 1 0 |
06 <None> Max:30 YR 06 | 7 6 1 | 1 1 0 |
07 <None> Max:30 YR 07 | 0 0 0 | 0 0 0 |
Number of Sections: 7 Average Students Per Section: 6.00
GEN825 HOME SCHOOL YR 1 180 16| 16 13 3 | 0 0 0 |
01 <None> Max:30 YR 01 | 12 9 3 | 0 0 0 |
02 <None> Max:30 YR 02 | 1 1 0 | 0 0 0 |
03 <None> Max:30 YR 03 | 1 1 0 | 0 0 0 |
04 <None> Max:30 YR 04 | 1 1 0 | 0 0 0 |
05 <None> Max:30 YR 05 | 0 0 0 | 0 0 0 |
06 <None> Max:30 YR 06 | 1 1 0 | 0 0 0 |
Number of Sections: 6 Average Students Per Section: 2.67
GEN840 AMHS JROTC SM 1 120 10| 10 3 7 | 1 0 1 |
16 <None> Max:30 S2 01 | 6 1 5 | 0 0 0 |
66 <None> Max:30 S2 06 | 4 2 2 | 1 0 1 |
Number of Sections: 2 Average Students Per Section: 5.00
HLT111 HEALTH SM 1 90 88| 88 48 40 | 8 2 6 |
01 MYCAH C. BIRGE Max:30 S2 01 | 29 17 12 | 1 0 1 |
02 MYCAH C. BIRGE Max:30 S2 02 | 28 11 17 | 5 2 3 |
03 MYCAH C. BIRGE Max:30 S2 03 | 31 20 11 | 2 0 2 |
Number of Sections: 3 Average Students Per Section: 29.33
LAN102 LA 9 INTERVEN 2 SM 1 70 67| 67 21 46 | 0 0 0 |
RL3 MARIA L. VASILIOU Max:20 S2 03 | 13 3 10 | 0 0 0 |
RL4 ANTHONY E. CALLERO Max:25 S2 04 | 27 10 17 | 0 0 0 |
RL5 ANTHONY E. CALLERO Max:25 S2 05 | 27 8 19 | 0 0 0 |
Number of Sections: 3 Average Students Per Section: 22.33
LAN121 LA 9 2 SM 10 366 306| 306 136 170 | 9 5 4 |

1sonyr01.p 38-2 AUBURN SENIOR HIGH SCHOOL 03/02/15 Page:11
05.14.10.00.00 Course/Class Count Report 401 3:05 PM
EST NBR NBR ----TOTALS---- --Special Ed--
COURSE DESCRIPTION LGTH SEC AVL REQ TOT FEM MAL TOT FEM MAL
01C ANTHONY E. CALLERO Max:22 S2 01 | 18 7 11 | 0 0 0 |
01H HANNAH L. HARDERSEN Max:30 S2 01 | 26 8 18 | 2 0 2 |
01V MARIA L. VASILIOU Max:30 S2 01 | 25 11 14 | 0 0 0 |
02C ANTHONY E. CALLERO Max:22 S2 02 | 18 6 12 | 0 0 0 |
02H HANNAH L. HARDERSEN Max:30 S2 02 | 20 9 11 | 0 0 0 |
02V MARIA L. VASILIOU Max:30 S2 02 | 20 12 8 | 0 0 0 |
03C ANTHONY E. CALLERO Max:22 S2 03 | 19 5 14 | 0 0 0 |
03H HANNAH L. HARDERSEN Max:30 S2 03 | 28 18 10 | 1 1 0 |
04M ANNA M. MARSHALL Max:30 S2 04 | 25 11 14 | 1 1 0 |
04V MARIA L. VASILIOU Max:30 S2 04 | 29 12 17 | 2 1 1 |
05A APRIL M. ASFOUR Max:30 S2 05 | 21 9 12 | 1 0 1 |
05V MARIA L. VASILIOU Max:30 S2 05 | 27 13 14 | 0 0 0 |
06A APRIL M. ASFOUR Max:30 S2 06 | 30 15 15 | 2 2 0 |
Number of Sections: 13 Average Students Per Section: 23.54
LAN131 LA 9 HONORS 2 SM 2 90 70| 70 43 27 | 0 0 0 |
03 ANNA M. MARSHALL Max:30 S2 03 | 26 16 10 | 0 0 0 |
04 JANICE M. ERIE Max:30 S2 04 | 30 16 14 | 0 0 0 |
05 JANICE M. ERIE Max:30 S2 05 | 14 11 3 | 0 0 0 |
Number of Sections: 3 Average Students Per Section: 23.33
LAN221 LA 10 2 SM 8 240 215| 215 96 119 | 6 2 4 |
01 ABIJAH G. ALASTRA Max:30 S2 01 | 28 14 14 | 0 0 0 |
02A ABIJAH G. ALASTRA Max:30 S2 02 | 25 10 15 | 1 0 1 |
02C JAMES P. CLEARY Max:30 S2 02 | 26 12 14 | 1 1 0 |
03A ABIJAH G. ALASTRA Max:30 S2 03 | 29 13 16 | 1 1 0 |
03C JAMES P. CLEARY Max:30 S2 03 | 28 15 13 | 0 0 0 |
04 JAMES P. CLEARY Max:30 S2 04 | 29 15 14 | 2 0 2 |
05C JAMES P. CLEARY Max:30 S2 05 | 24 7 17 | 1 0 1 |
06 JANICE M. ERIE Max:30 S2 06 | 26 10 16 | 0 0 0 |
Number of Sections: 8 Average Students Per Section: 26.88
LAN231 LA 10 HONORS 2 SM 4 120 100| 100 72 28 | 1 1 0 |
01 APRIL M. ASFOUR Max:30 S2 01 | 24 20 4 | 0 0 0 |
02 APRIL M. ASFOUR Max:30 S2 02 | 23 15 8 | 0 0 0 |
03 APRIL M. ASFOUR Max:30 S2 03 | 27 16 11 | 1 1 0 |
06 HANNAH L. HARDERSEN Max:30 S2 06 | 26 21 5 | 0 0 0 |
Number of Sections: 4 Average Students Per Section: 25.00
LAN302 LA INTERVEN 2 SM 1 20 13| 13 5 8 | 0 0 0 |
COE ABIJAH G. ALASTRA Max:20 S2 04 | 13 5 8 | 0 0 0 |
Number of Sections: 1 Average Students Per Section: 13.00
LAN321 AMER LIT 2 SM 7 216 196| 196 87 109 | 6 3 3 |
01M ANNA M. MARSHALL Max:27 S2 01 | 27 9 18 | 1 0 1 |
02 ANNA M. MARSHALL Max:27 S2 02 | 26 12 14 | 0 0 0 |
03B DONNA L. BOWLER Max:27 S2 03 | 25 12 13 | 0 0 0 |
04 DONNA L. BOWLER Max:27 S2 04 | 25 14 11 | 1 1 0 |
05B DONNA L. BOWLER Max:27 S2 05 | 23 12 11 | 1 1 0 |
05C ERICKA A. CONNELLY Max:27 S2 05 | 26 9 17 | 0 0 0 |
06C ERICKA A. CONNELLY Max:27 S2 06 | 22 10 12 | 1 1 0 |
06S STEPHANIE M. SCHLEICH Max:27 S2 06 | 22 9 13 | 2 0 2 |
Number of Sections: 8 Average Students Per Section: 24.50
LAN331 AP LAN/COMP 2 SM 3 120 76| 76 37 39 | 0 0 0 |
02 SHERYL L. HARMON Max:30 S2 02 | 17 9 8 | 0 0 0 |
03 SHERYL L. HARMON Max:30 S2 03 | 16 6 10 | 0 0 0 |
04 STEPHANIE M. SCHLEICH Max:30 S2 04 | 23 14 9 | 0 0 0 |
05 STEPHANIE M. SCHLEICH Max:30 S2 05 | 20 8 12 | 0 0 0 |
Number of Sections: 4 Average Students Per Section: 19.00
LAN416 CREATIVE WRIT SM 2 50 16| 16 7 9 | 0 0 0 |
11 SHERYL L. HARMON Max:25 S2 01 | 16 7 9 | 0 0 0 |

1sonyr01.p 38-2 AUBURN SENIOR HIGH SCHOOL 03/02/15 Page:12
05.14.10.00.00 Course/Class Count Report 401 3:05 PM
EST NBR NBR ----TOTALS---- --Special Ed--
COURSE DESCRIPTION LGTH SEC AVL REQ TOT FEM MAL TOT FEM MAL
Number of Sections: 1 Average Students Per Section: 16.00
LAN417 COLLEGE WRITING SM 2 50 9| 9 5 4 | 0 0 0 |
16 ANNA M. MARSHALL Max:25 S2 06 | 9 5 4 | 0 0 0 |
Number of Sections: 1 Average Students Per Section: 9.00
LAN422 HUMANITIES 2 SM 3 90 93| 93 40 53 | 2 1 1 |
01 ERICKA A. CONNELLY Max:30 S2 01 | 31 12 19 | 0 0 0 |
03 ERICKA A. CONNELLY Max:30 S2 03 | 31 14 17 | 0 0 0 |
04 ERICKA A. CONNELLY Max:30 S2 04 | 31 14 17 | 2 1 1 |
Number of Sections: 3 Average Students Per Section: 31.00
LAN431 AP LIT/COMP 2 SM 3 90 66| 66 41 25 | 0 0 0 |
01 JANICE M. ERIE Max:30 S2 01 | 15 10 5 | 0 0 0 |
02 JANICE M. ERIE Max:30 S2 02 | 27 14 13 | 0 0 0 |
06 DONNA L. BOWLER Max:30 S2 06 | 24 17 7 | 0 0 0 |
Number of Sections: 3 Average Students Per Section: 22.00
LAN509 CHILD THEATRE 2 SM 1 30 0| 0 0 0 | 0 0 0 |
11 WARREN D. KERR Max:30 S2 05 | 0 0 0 | 0 0 0 |
Number of Sections: 1 Average Students Per Section: 0.00
LAN513 JOURNALISTIC WR SM 1 40 21| 21 11 10 | 0 0 0 |
15 THOMAS J. KAUP Max:20 S2 05 | 21 11 10 | 0 0 0 |
Number of Sections: 1 Average Students Per Section: 21.00
LAN517 DEBATE SM 2 38 20| 20 10 10 | 0 0 0 |
12 DONNA L. BOWLER Max:25 S2 02 | 20 10 10 | 0 0 0 |
Number of Sections: 1 Average Students Per Section: 20.00
LAN518 DEBATE SM 1 12 0| 0 0 0 | 0 0 0 |
LAN532 WRITING LAB SM 4 100 31| 31 6 25 | 0 0 0 |
16A ABIJAH G. ALASTRA Max:25 S2 06 | 15 2 13 | 0 0 0 |
16C JAMES P. CLEARY Max:25 S2 06 | 16 4 12 | 0 0 0 |
Number of Sections: 2 Average Students Per Section: 15.50
MAT108 COE MATH INTERV SM 1 30 9| 9 4 5 | 0 0 0 |
12 SUSAN M. BOWERS Max:15 S2 02 | 9 4 5 | 0 0 0 |
Number of Sections: 1 Average Students Per Section: 9.00
MAT121 ALGEBRA 2 SM 13 416 351| 351 148 203 | 18 7 11 |
01B SUSAN M. BOWERS Max:25 S2 01 | 22 11 11 | 0 0 0 |
01C JASON L. CAPPS Max:22 S2 01 | 19 6 13 | 0 0 0 |
01M ERIC R. MOHLER Max:30 S2 01 | 25 9 16 | 5 2 3 |
02C JASON L. CAPPS Max:22 S2 02 | 18 5 13 | 0 0 0 |
02M ERIC R. MOHLER Max:30 S2 02 | 25 10 15 | 2 1 1 |
03C JASON L. CAPPS Max:22 S2 03 | 18 7 11 | 0 0 0 |
03J JENNIFER D. COOKE Max:25 S2 03 | 18 10 8 | 5 4 1 |
03M JONATHAN G. MOREHEAD Max:30 S2 03 | 26 8 18 | 0 0 0 |
04C JENNIFER D. COOKE Max:30 S2 04 | 24 14 10 | 0 0 0 |
04M JONATHAN G. MOREHEAD Max:30 S2 04 | 29 18 11 | 1 0 1 |
05C JENNIFER D. COOKE Max:30 S2 05 | 24 12 12 | 2 0 2 |
05M JONATHAN G. MOREHEAD Max:30 S2 05 | 25 7 18 | 1 0 1 |
06C JONATHAN G. MOREHEAD Max:30 S2 06 | 28 11 17 | 1 0 1 |
06M ERIC R. MOHLER Max:30 S2 06 | 26 11 15 | 0 0 0 |
07 SCOTT J. MCLAUGHLIN Max:30 S2 06 | 24 9 15 | 1 0 1 |
Number of Sections: 15 Average Students Per Section: 23.40
MAT210 GEOMETRY 1 SM 13 355 28| 28 17 11 | 1 0 1 |
12 KEITH B. RODMAN Max:25 S2 02 | 28 17 11 | 1 0 1 |
Number of Sections: 1 Average Students Per Section: 28.00
MAT211 GEOMETRY 2 SM 13 355 288| 288 157 131 | 4 1 3 |
01R KEITH B. RODMAN Max:30 S2 01 | 20 11 9 | 0 0 0 |
01S DYANN SEIDL Max:30 S2 01 | 20 11 9 | 0 0 0 |
02S DYANN SEIDL Max:30 S2 02 | 25 14 11 | 1 0 1 |
03A TERESA M. ANDERSON Max:30 S2 03 | 30 17 13 | 0 0 0 |

1sonyr01.p 38-2 AUBURN SENIOR HIGH SCHOOL 03/02/15 Page:13
05.14.10.00.00 Course/Class Count Report 401 3:05 PM
EST NBR NBR ----TOTALS---- --Special Ed--
COURSE DESCRIPTION LGTH SEC AVL REQ TOT FEM MAL TOT FEM MAL
03R KEITH B. RODMAN Max:30 S2 03 | 26 15 11 | 1 0 1 |
04B SUSAN M. BOWERS Max:30 S2 04 | 31 14 17 | 0 0 0 |
04R KEITH B. RODMAN Max:30 S2 04 | 29 16 13 | 0 0 0 |
05B SUSAN M. BOWERS Max:30 S2 05 | 26 17 9 | 0 0 0 |
05S DYANN SEIDL Max:30 S2 05 | 24 13 11 | 0 0 0 |
06A TERESA M. ANDERSON Max:30 S2 06 | 30 15 15 | 1 1 0 |
06S DYANN SEIDL Max:30 S2 06 | 27 14 13 | 1 0 1 |
Number of Sections: 11 Average Students Per Section: 26.18
MAT311 ADV ALG/TRIG 2 SM 9 300 247| 247 119 128 | 3 1 2 |
01C JENNIFER D. COOKE Max:30 S2 01 | 15 7 8 | 1 0 1 |
02C JENNIFER D. COOKE Max:30 S2 02 | 25 12 13 | 0 0 0 |
02M SCOTT J. MCLAUGHLIN Max:30 S2 02 | 26 11 15 | 0 0 0 |
03B SUSAN M. BOWERS Max:30 S2 03 | 25 12 13 | 0 0 0 |
03M SCOTT J. MCLAUGHLIN Max:30 S2 03 | 29 12 17 | 1 0 1 |
04D DYANN SEIDL Max:30 S2 04 | 22 12 10 | 0 0 0 |
04M SCOTT J. MCLAUGHLIN Max:30 S2 04 | 30 17 13 | 0 0 0 |
05R KEITH B. RODMAN Max:30 S2 05 | 24 15 9 | 0 0 0 |
06B SUSAN M. BOWERS Max:30 S2 06 | 25 12 13 | 0 0 0 |
06R KEITH B. RODMAN Max:30 S2 06 | 26 9 17 | 1 1 0 |
Number of Sections: 10 Average Students Per Section: 24.70
MAT411 BYND ADV ALG 2 SM 2 30 30| 30 15 15 | 0 0 0 |
01 JONATHAN G. MOREHEAD Max:30 S2 01 | 30 15 15 | 0 0 0 |
Number of Sections: 1 Average Students Per Section: 30.00
MAT413 PRE CALCULUS 2 SM 4 120 107| 107 50 57 | 0 0 0 |
01 TERESA M. ANDERSON Max:30 S2 01 | 27 12 15 | 0 0 0 |
02 TERESA M. ANDERSON Max:30 S2 02 | 26 11 15 | 0 0 0 |
05 TERESA M. ANDERSON Max:30 S2 05 | 27 15 12 | 0 0 0 |
06 JASON L. CAPPS Max:30 S2 06 | 27 12 15 | 0 0 0 |
Number of Sections: 4 Average Students Per Section: 26.75
MAT415 AP CALCULUS 2 SM 2 60 38| 38 19 19 | 0 0 0 |
03 ERIC R. MOHLER Max:30 S2 03 | 21 13 8 | 0 0 0 |
05 ERIC R. MOHLER Max:30 S2 05 | 17 6 11 | 0 0 0 |
Number of Sections: 2 Average Students Per Section: 19.00
MAT417 AP STATS 2 SM 1 30 9| 9 3 6 | 0 0 0 |
06 JENNIFER D. COOKE Max:30 S2 06 | 9 3 6 | 0 0 0 |
Number of Sections: 1 Average Students Per Section: 9.00
MAT418 AP CALC BC 1 SM 1 30 11| 11 6 5 | 0 0 0 |
01 ERIC R. MOHLER Max:30 S2 08 | 11 6 5 | 0 0 0 |
Number of Sections: 1 Average Students Per Section: 11.00
MAT421 AP COMPTR SCI 2 SM 1 30 18| 18 4 14 | 0 0 0 |
01 SCOTT J. MCLAUGHLIN Max:30 S2 01 | 18 4 14 | 0 0 0 |
Number of Sections: 1 Average Students Per Section: 18.00
MUS116 WIND ENSEMBLE SM 1 55 46| 46 23 23 | 0 0 0 |
05 ANTHONY D. PAUSTIAN Max:55 S2 05 | 46 23 23 | 0 0 0 |
Number of Sections: 1 Average Students Per Section: 46.00
MUS121 PERCUSSION SM 1 30 6| 6 0 6 | 0 0 0 |
03 ANTHONY D. PAUSTIAN Max:30 S2 03 | 6 0 6 | 0 0 0 |
Number of Sections: 1 Average Students Per Section: 6.00
MUS123 ADV PERCUSSION SM 1 30 7| 7 2 5 | 0 0 0 |
04 ANTHONY D. PAUSTIAN Max:30 S2 04 | 7 2 5 | 0 0 0 |
Number of Sections: 1 Average Students Per Section: 7.00
MUS131 JAZZ ENSEMBLE SM 1 30 16| 16 6 10 | 0 0 0 |
00 ANTHONY D. PAUSTIAN Max:30 S2 08 | 16 6 10 | 0 0 0 |
Number of Sections: 1 Average Students Per Section: 16.00
MUS201 CHOIR ENSMBLE SM 1 19 14| 14 14 0 | 2 2 0 |
01 KANDY R. GILBERT Max:19 S2 02 | 14 14 0 | 2 2 0 |

1sonyr01.p 38-2 AUBURN SENIOR HIGH SCHOOL 03/02/15 Page:14
05.14.10.00.00 Course/Class Count Report 401 3:05 PM
EST NBR NBR ----TOTALS---- --Special Ed--
COURSE DESCRIPTION LGTH SEC AVL REQ TOT FEM MAL TOT FEM MAL
Number of Sections: 1 Average Students Per Section: 14.00
MUS211 CHOIR-CONCERT SM 1 40 28| 28 21 7 | 5 4 1 |
01 KANDY R. GILBERT Max:40 S2 01 | 28 21 7 | 5 4 1 |
Number of Sections: 1 Average Students Per Section: 28.00
MUS216 CHOIR-SHOW SM 1 16 13| 13 6 7 | 2 1 1 |
04 KANDY R. GILBERT Max:16 S2 04 | 13 6 7 | 2 1 1 |
Number of Sections: 1 Average Students Per Section: 13.00
MUS221 CHOIR-CHAMBER SM 2 60 49| 49 34 15 | 3 2 1 |
01 KANDY R. GILBERT Max:60 S2 03 | 49 34 15 | 3 2 1 |
Number of Sections: 1 Average Students Per Section: 49.00
MUS231 CHOIR-JAZZ EN SM 3 23 21| 21 13 8 | 2 0 2 |
01 KANDY R. GILBERT Max:23 S2 08 | 21 13 8 | 2 0 2 |
Number of Sections: 1 Average Students Per Section: 21.00
MUS301 ORCHESTRA SM 1 40 14| 14 6 8 | 1 0 1 |
05 JEANEE MAUCOTEL Max:40 S2 05 | 14 6 8 | 1 0 1 |
Number of Sections: 1 Average Students Per Section: 14.00
MUS303 ORCHEST-CHMBR SM 1 40 20| 20 11 9 | 2 2 0 |
06 JEANEE MAUCOTEL Max:40 S2 06 | 20 11 9 | 2 2 0 |
Number of Sections: 1 Average Students Per Section: 20.00
MUS401 GUITAR SM 1 34 15| 15 4 11 | 1 1 0 |
12 ANTHONY D. PAUSTIAN Max:17 S2 02 | 15 4 11 | 1 1 0 |
Number of Sections: 1 Average Students Per Section: 15.00
PHY101 INTRO PE SM 10 374 169| 169 81 88 | 55 16 39 |
12 JESSICA L. HANSEN Max:36 S2 02 | 30 17 13 | 2 1 1 |
13 RYAN A. HANSEN Max:36 S2 03 | 28 19 9 | 2 1 1 |
14 KJEL P. KIILSGAARD Max:36 S2 04 | 35 19 16 | 1 1 0 |
15 ERICA L. HINSON Max:36 S2 05 | 30 15 15 | 4 2 2 |
A3 KJEL P. KIILSGAARD Max:15 S2 02 | 20 7 13 | 20 7 13 |
A4 KJEL P. KIILSGAARD Max:15 S2 05 | 17 3 14 | 17 3 14 |
SLC JAVID K. SHOEMAKER Max:15 S2 04 | 9 1 8 | 9 1 8 |
Number of Sections: 7 Average Students Per Section: 24.14
PHY204 AEROBIC/WALK SM 2 72 75| 75 65 10 | 9 6 3 |
02 ERICA L. HINSON Max:36 S2 02 | 38 32 6 | 3 2 1 |
06 MYCAH C. BIRGE Max:36 S2 06 | 37 33 4 | 6 4 2 |
Number of Sections: 2 Average Students Per Section: 37.50
PHY206 AEROBICS SM 1 36 37| 37 37 0 | 6 6 0 |
05 JESSICA L. HANSEN Max:36 S2 05 | 37 37 0 | 6 6 0 |
Number of Sections: 1 Average Students Per Section: 37.00
PHY208 BASKETBALL SM 1 36 33| 33 4 29 | 4 1 3 |
01 RYAN A. HANSEN Max:36 S2 01 | 33 4 29 | 4 1 3 |
Number of Sections: 1 Average Students Per Section: 33.00
PHY218 HOCKEY/SOC SM 2 36 34| 34 5 29 | 8 2 6 |
01 ERICA L. HINSON Max:36 S2 01 | 34 5 29 | 8 2 6 |
Number of Sections: 1 Average Students Per Section: 34.00
PHY224 VOLLEYBALL SM 3 108 111| 111 67 44 | 14 8 6 |
01 KJEL P. KIILSGAARD Max:36 S2 01 | 37 27 10 | 2 1 1 |
03 ERICA L. HINSON Max:36 S2 03 | 37 18 19 | 5 2 3 |
04 JESSICA L. HANSEN Max:36 S2 04 | 37 22 15 | 7 5 2 |
Number of Sections: 3 Average Students Per Section: 37.00
PHY230 BEG WT TRNG SM 5 180 179| 179 42 137 | 19 2 17 |
01 JESSICA L. HANSEN Max:36 S2 01 | 37 10 27 | 5 1 4 |
03 KJEL P. KIILSGAARD Max:36 S2 03 | 36 8 28 | 2 0 2 |
04 RYAN A. HANSEN Max:36 S2 04 | 36 9 27 | 3 0 3 |
05 RYAN A. HANSEN Max:36 S2 05 | 36 4 32 | 7 0 7 |
99 RYAN A. HANSEN Max:36 S2 08 | 34 11 23 | 2 1 1 |

1sonyr01.p 38-2 AUBURN SENIOR HIGH SCHOOL 03/02/15 Page:15
05.14.10.00.00 Course/Class Count Report 401 3:05 PM
EST NBR NBR ----TOTALS---- --Special Ed--
COURSE DESCRIPTION LGTH SEC AVL REQ TOT FEM MAL TOT FEM MAL
Number of Sections: 5 Average Students Per Section: 35.80
PHY304 ADV VLYBALL SM 2 36 37| 37 26 11 | 1 0 1 |
06 JESSICA L. HANSEN Max:36 S2 06 | 37 26 11 | 1 0 1 |
Number of Sections: 1 Average Students Per Section: 37.00
PHY306 ADV WT TRNG SM 2 36 36| 36 1 35 | 4 0 4 |
06 ERICA L. HINSON Max:36 S2 06 | 36 1 35 | 4 0 4 |
Number of Sections: 1 Average Students Per Section: 36.00
SCI101 SCIENCE LINKS SM 9 330 151| 151 66 85 | 16 7 9 |
11 AIMEE B. OPINCARNE Max:30 S2 01 | 27 13 14 | 2 1 1 |
12 AIMEE B. OPINCARNE Max:30 S2 02 | 18 8 10 | 2 2 0 |
13 AIMEE B. OPINCARNE Max:30 S2 03 | 19 12 7 | 2 1 1 |
14 BRUCE J. MORRIS Max:30 S2 04 | 30 13 17 | 3 1 2 |
15 BRUCE J. MORRIS Max:30 S2 05 | 26 8 18 | 2 1 1 |
16 BRUCE J. MORRIS Max:30 S2 06 | 31 12 19 | 5 1 4 |
Number of Sections: 6 Average Students Per Section: 25.17
SCI199 COE BIOLOGY 2 SM 1 60 29| 29 14 15 | 1 0 1 |
05 BESS E. OWENS Max:30 S2 05 | 29 14 15 | 1 0 1 |
Number of Sections: 1 Average Students Per Section: 29.00
SCI203 BIOLOGY 2 SM 14 330 316| 316 160 156 | 39 16 23 |
01 WHITNEY R. BAILEY Max:30 S2 01 | 30 14 16 | 5 2 3 |
03 WHITNEY R. BAILEY Max:30 S2 03 | 28 12 16 | 3 0 3 |
05 WHITNEY R. BAILEY Max:30 S2 05 | 28 17 11 | 6 4 2 |
06 WHITNEY R. BAILEY Max:30 S2 06 | 28 15 13 | 7 3 4 |
24 AIMEE B. OPINCARNE Max:30 S2 04 | 31 14 17 | 2 1 1 |
32 BESS E. OWENS Max:30 S2 02 | 30 14 16 | 4 2 2 |
33 BESS E. OWENS Max:30 S2 03 | 23 15 8 | 2 1 1 |
34 BESS E. OWENS Max:30 S2 04 | 30 17 13 | 1 0 1 |
36 BESS E. OWENS Max:30 S2 06 | 27 12 15 | 2 0 2 |
42 ERIC D. WAKEFIELD Max:30 S2 02 | 31 14 17 | 3 0 3 |
45 ERIC D. WAKEFIELD Max:30 S2 05 | 30 16 14 | 4 3 1 |
Number of Sections: 11 Average Students Per Section: 28.73
SCI300 CHEMISTRY 1 SM 8 270 9| 9 3 6 | 0 0 0 |
21 ELSBETH C. COCKCROFT Max:30 S2 01 | 9 3 6 | 0 0 0 |
Number of Sections: 1 Average Students Per Section: 9.00
SCI301 CHEMISTRY 2 SM 8 240 175| 175 93 82 | 1 0 1 |
01 DENISE L. CARROLL Max:30 S2 01 | 28 15 13 | 0 0 0 |
02 DENISE L. CARROLL Max:30 S2 02 | 20 8 12 | 0 0 0 |
03 DENISE L. CARROLL Max:30 S2 03 | 23 10 13 | 0 0 0 |
04 DENISE L. CARROLL Max:30 S2 04 | 30 13 17 | 0 0 0 |
05 DENISE L. CARROLL Max:30 S2 05 | 25 12 13 | 0 0 0 |
15 ELSBETH C. COCKCROFT Max:30 S2 05 | 27 19 8 | 0 0 0 |
16 ELSBETH C. COCKCROFT Max:30 S2 06 | 22 16 6 | 1 0 1 |
Number of Sections: 7 Average Students Per Section: 25.00
SCI303 ADV CHEM 2 SM 1 60 30| 30 12 18 | 0 0 0 |
02 ELSBETH C. COCKCROFT Max:30 S2 02 | 15 5 10 | 0 0 0 |
03 ELSBETH C. COCKCROFT Max:30 S2 03 | 15 7 8 | 0 0 0 |
Number of Sections: 2 Average Students Per Section: 15.00
SCI401 PHYSICS 2 SM 3 90 56| 56 23 33 | 0 0 0 |
01 ERIC D. WAKEFIELD Max:30 S2 01 | 15 8 7 | 0 0 0 |
04 ERIC D. WAKEFIELD Max:30 S2 04 | 29 10 19 | 0 0 0 |
06 ERIC D. WAKEFIELD Max:30 S2 06 | 12 5 7 | 0 0 0 |
Number of Sections: 3 Average Students Per Section: 18.67
SCI502 MARINE BIOLOGY SM 1 30 31| 31 20 11 | 1 1 0 |
04 WHITNEY R. BAILEY Max:30 S2 04 | 31 20 11 | 1 1 0 |
Number of Sections: 1 Average Students Per Section: 31.00
SLC102 PRE MATH B SM 2 17 17| 17 4 13 | 17 4 13 |
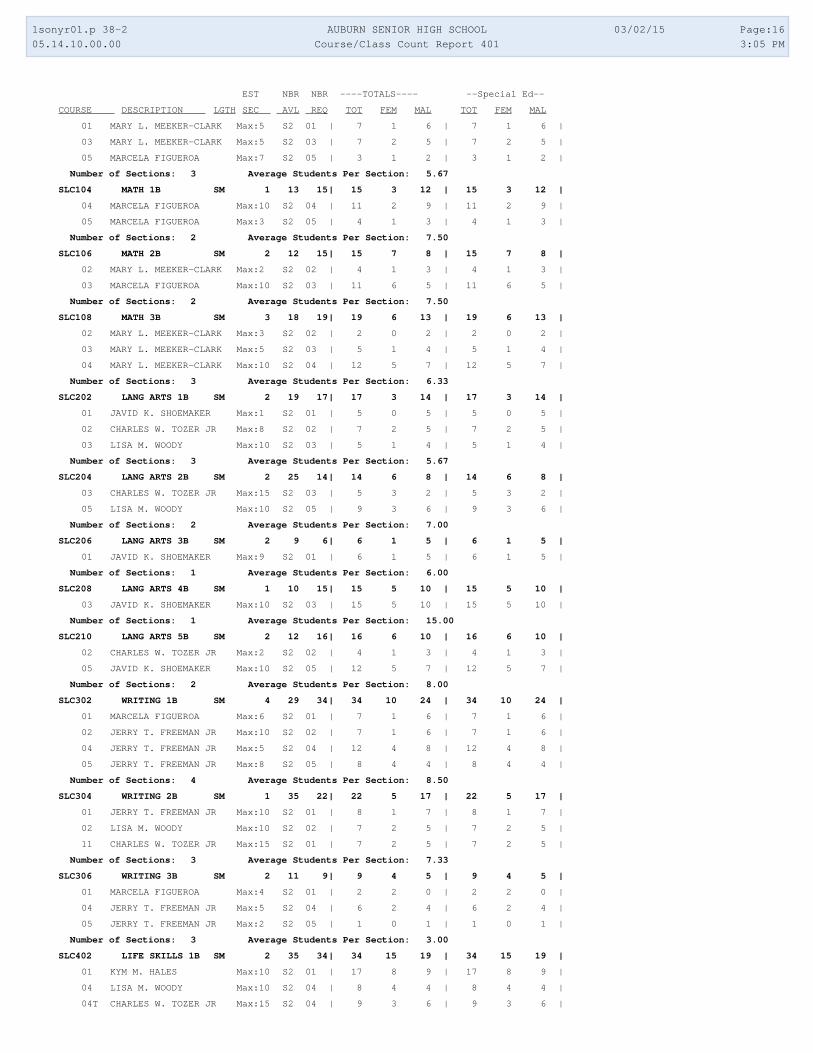
1sonyr01.p 38-2 AUBURN SENIOR HIGH SCHOOL 03/02/15 Page:16
05.14.10.00.00 Course/Class Count Report 401 3:05 PM
EST NBR NBR ----TOTALS---- --Special Ed--
COURSE DESCRIPTION LGTH SEC AVL REQ TOT FEM MAL TOT FEM MAL
01 MARY L. MEEKER-CLARK Max:5 S2 01 | 7 1 6 | 7 1 6 |
03 MARY L. MEEKER-CLARK Max:5 S2 03 | 7 2 5 | 7 2 5 |
05 MARCELA FIGUEROA Max:7 S2 05 | 3 1 2 | 3 1 2 |
Number of Sections: 3 Average Students Per Section: 5.67
SLC104 MATH 1B SM 1 13 15| 15 3 12 | 15 3 12 |
04 MARCELA FIGUEROA Max:10 S2 04 | 11 2 9 | 11 2 9 |
05 MARCELA FIGUEROA Max:3 S2 05 | 4 1 3 | 4 1 3 |
Number of Sections: 2 Average Students Per Section: 7.50
SLC106 MATH 2B SM 2 12 15| 15 7 8 | 15 7 8 |
02 MARY L. MEEKER-CLARK Max:2 S2 02 | 4 1 3 | 4 1 3 |
03 MARCELA FIGUEROA Max:10 S2 03 | 11 6 5 | 11 6 5 |
Number of Sections: 2 Average Students Per Section: 7.50
SLC108 MATH 3B SM 3 18 19| 19 6 13 | 19 6 13 |
02 MARY L. MEEKER-CLARK Max:3 S2 02 | 2 0 2 | 2 0 2 |
03 MARY L. MEEKER-CLARK Max:5 S2 03 | 5 1 4 | 5 1 4 |
04 MARY L. MEEKER-CLARK Max:10 S2 04 | 12 5 7 | 12 5 7 |
Number of Sections: 3 Average Students Per Section: 6.33
SLC202 LANG ARTS 1B SM 2 19 17| 17 3 14 | 17 3 14 |
01 JAVID K. SHOEMAKER Max:1 S2 01 | 5 0 5 | 5 0 5 |
02 CHARLES W. TOZER JR Max:8 S2 02 | 7 2 5 | 7 2 5 |
03 LISA M. WOODY Max:10 S2 03 | 5 1 4 | 5 1 4 |
Number of Sections: 3 Average Students Per Section: 5.67
SLC204 LANG ARTS 2B SM 2 25 14| 14 6 8 | 14 6 8 |
03 CHARLES W. TOZER JR Max:15 S2 03 | 5 3 2 | 5 3 2 |
05 LISA M. WOODY Max:10 S2 05 | 9 3 6 | 9 3 6 |
Number of Sections: 2 Average Students Per Section: 7.00
SLC206 LANG ARTS 3B SM 2 9 6| 6 1 5 | 6 1 5 |
01 JAVID K. SHOEMAKER Max:9 S2 01 | 6 1 5 | 6 1 5 |
Number of Sections: 1 Average Students Per Section: 6.00
SLC208 LANG ARTS 4B SM 1 10 15| 15 5 10 | 15 5 10 |
03 JAVID K. SHOEMAKER Max:10 S2 03 | 15 5 10 | 15 5 10 |
Number of Sections: 1 Average Students Per Section: 15.00
SLC210 LANG ARTS 5B SM 2 12 16| 16 6 10 | 16 6 10 |
02 CHARLES W. TOZER JR Max:2 S2 02 | 4 1 3 | 4 1 3 |
05 JAVID K. SHOEMAKER Max:10 S2 05 | 12 5 7 | 12 5 7 |
Number of Sections: 2 Average Students Per Section: 8.00
SLC302 WRITING 1B SM 4 29 34| 34 10 24 | 34 10 24 |
01 MARCELA FIGUEROA Max:6 S2 01 | 7 1 6 | 7 1 6 |
02 JERRY T. FREEMAN JR Max:10 S2 02 | 7 1 6 | 7 1 6 |
04 JERRY T. FREEMAN JR Max:5 S2 04 | 12 4 8 | 12 4 8 |
05 JERRY T. FREEMAN JR Max:8 S2 05 | 8 4 4 | 8 4 4 |
Number of Sections: 4 Average Students Per Section: 8.50
SLC304 WRITING 2B SM 1 35 22| 22 5 17 | 22 5 17 |
01 JERRY T. FREEMAN JR Max:10 S2 01 | 8 1 7 | 8 1 7 |
02 LISA M. WOODY Max:10 S2 02 | 7 2 5 | 7 2 5 |
11 CHARLES W. TOZER JR Max:15 S2 01 | 7 2 5 | 7 2 5 |
Number of Sections: 3 Average Students Per Section: 7.33
SLC306 WRITING 3B SM 2 11 9| 9 4 5 | 9 4 5 |
01 MARCELA FIGUEROA Max:4 S2 01 | 2 2 0 | 2 2 0 |
04 JERRY T. FREEMAN JR Max:5 S2 04 | 6 2 4 | 6 2 4 |
05 JERRY T. FREEMAN JR Max:2 S2 05 | 1 0 1 | 1 0 1 |
Number of Sections: 3 Average Students Per Section: 3.00
SLC402 LIFE SKILLS 1B SM 2 35 34| 34 15 19 | 34 15 19 |
01 KYM M. HALES Max:10 S2 01 | 17 8 9 | 17 8 9 |
04 LISA M. WOODY Max:10 S2 04 | 8 4 4 | 8 4 4 |
04T CHARLES W. TOZER JR Max:15 S2 04 | 9 3 6 | 9 3 6 |

1sonyr01.p 38-2 AUBURN SENIOR HIGH SCHOOL 03/02/15 Page:17
05.14.10.00.00 Course/Class Count Report 401 3:05 PM
EST NBR NBR ----TOTALS---- --Special Ed--
COURSE DESCRIPTION LGTH SEC AVL REQ TOT FEM MAL TOT FEM MAL
Number of Sections: 3 Average Students Per Section: 11.33
SLC404 LIFE SKILLS 2B SM 2 13 16| 16 4 12 | 16 4 12 |
03 KYM M. HALES Max:3 S2 03 | 8 0 8 | 8 0 8 |
05 KYM M. HALES Max:10 S2 05 | 8 4 4 | 8 4 4 |
Number of Sections: 2 Average Students Per Section: 8.00
SLC406 LIFE SKILLS 3B SM 3 21 19| 19 5 14 | 19 5 14 |
1 CHARLES W. TOZER JR Max:4 S2 01 | 1 0 1 | 1 0 1 |
2H KYM M. HALES Max:10 S2 02 | 12 5 7 | 12 5 7 |
3 KYM M. HALES Max:7 S2 03 | 6 0 6 | 6 0 6 |
Number of Sections: 3 Average Students Per Section: 6.33
SLCHOM SLC HOMEROOM SM 9 210 63| 63 21 42 | 63 21 42 |
12 MARCELA FIGUEROA Max:15 S2 06 | 10 1 9 | 10 1 9 |
22 KYM M. HALES Max:15 S2 06 | 11 5 6 | 11 5 6 |
32 LISA M. WOODY Max:15 S2 06 | 7 1 6 | 7 1 6 |
42 JAVID K. SHOEMAKER Max:15 S2 06 | 11 4 7 | 11 4 7 |
52 MARY L. MEEKER-CLARK Max:15 S2 06 | 5 3 2 | 5 3 2 |
62 JERRY T. FREEMAN JR Max:15 S2 06 | 9 4 5 | 9 4 5 |
64 CHARLES W. TOZER JR Max:15 S2 06 | 10 3 7 | 10 3 7 |
Number of Sections: 7 Average Students Per Section: 9.00
SOC101 WORLD STUDIES SM 10 381 200| 200 87 113 | 18 4 14 |
11P JON W. PRICE Max:30 S2 01 | 27 11 16 | 3 2 1 |
11V ABRAHAM P. VANDERPUY Max:22 S2 01 | 18 5 13 | 0 0 0 |
12P JON W. PRICE Max:30 S2 02 | 22 11 11 | 3 0 3 |
12V ABRAHAM P. VANDERPUY Max:22 S2 02 | 19 7 12 | 0 0 0 |
13V ABRAHAM P. VANDERPUY Max:22 S2 03 | 18 6 12 | 0 0 0 |
14P JON W. PRICE Max:30 S2 04 | 27 14 13 | 3 0 3 |
15P JON W. PRICE Max:30 S2 05 | 25 12 13 | 4 1 3 |
16V ABRAHAM P. VANDERPUY Max:30 S2 06 | 30 13 17 | 5 1 4 |
ELL NECIA L. HANSEN Max:15 S2 04 | 14 8 6 | 0 0 0 |
Number of Sections: 9 Average Students Per Section: 22.22
SOC150 WORLD GEOGRAPHY SM 2 30 14| 14 5 9 | 1 0 1 |
01 PATRICK W. MARTIN Max:30 S2 01 | 14 5 9 | 1 0 1 |
Number of Sections: 1 Average Students Per Section: 14.00
SOC191 AP HUMN GEOGR 2 SM 2 60 57| 57 29 28 | 0 0 0 |
05 MICHAEL A. GRENZ Max:30 S2 05 | 28 10 18 | 0 0 0 |
06 MICHAEL A. GRENZ Max:30 S2 06 | 29 19 10 | 0 0 0 |
Number of Sections: 2 Average Students Per Section: 28.50
SOC203 US HISTORY 2 SM 11 90 71| 71 30 41 | 12 3 9 |
03B EDWARD M. BENDER Max:30 S2 03 | 23 9 14 | 3 1 2 |
04S PHILIP N. SMETHERAM Max:30 S2 04 | 28 11 17 | 7 1 6 |
05S PHILIP N. SMETHERAM Max:30 S2 05 | 20 10 10 | 2 1 1 |
Number of Sections: 3 Average Students Per Section: 23.67
SOC205 AP EUROPEAN 2 SM 4 90 80| 80 56 24 | 0 0 0 |
11G MICHAEL A. GRENZ Max:30 S2 01 | 22 18 4 | 0 0 0 |
12G MICHAEL A. GRENZ Max:30 S2 02 | 30 20 10 | 0 0 0 |
13G MICHAEL A. GRENZ Max:30 S2 03 | 28 18 10 | 0 0 0 |
Number of Sections: 3 Average Students Per Section: 26.67
SOC300 CIVICS SM 9 300 119| 119 45 74 | 20 4 16 |
11E GORDON A. ELLIOTT Max:30 S2 01 | 23 9 14 | 3 1 2 |
13Y JOHN H. YORKE Max:30 S2 03 | 29 9 20 | 8 1 7 |
14E GORDON A. ELLIOTT Max:30 S2 04 | 27 13 14 | 3 2 1 |
15Y JOHN H. YORKE Max:30 S2 05 | 16 6 10 | 2 0 2 |
16P JON W. PRICE Max:30 S2 06 | 24 8 16 | 4 0 4 |
Number of Sections: 5 Average Students Per Section: 23.80
SOC302 AP US HISTORY 2 SM 4 90 76| 76 38 38 | 0 0 0 |
11 EDWARD M. BENDER Max:30 S2 01 | 23 13 10 | 0 0 0 |

1sonyr01.p 38-2 AUBURN SENIOR HIGH SCHOOL 03/02/15 Page:18
05.14.10.00.00 Course/Class Count Report 401 3:05 PM
EST NBR NBR ----TOTALS---- --Special Ed--
COURSE DESCRIPTION LGTH SEC AVL REQ TOT FEM MAL TOT FEM MAL
12 EDWARD M. BENDER Max:30 S2 02 | 24 11 13 | 0 0 0 |
14 EDWARD M. BENDER Max:30 S2 04 | 29 14 15 | 0 0 0 |
Number of Sections: 3 Average Students Per Section: 25.33
SOC400 GLOBAL ISSUES SM 7 540 195| 195 83 112 | 30 10 20 |
111 JOHN H. YORKE Max:30 S2 01 | 27 10 17 | 4 2 2 |
112 JOHN H. YORKE Max:30 S2 02 | 21 10 11 | 1 0 1 |
113 PHILIP N. SMETHERAM Max:30 S2 03 | 17 7 10 | 4 1 3 |
114 JOHN H. YORKE Max:30 S2 04 | 30 10 20 | 5 3 2 |
116 PHILIP N. SMETHERAM Max:30 S2 06 | 26 15 11 | 4 2 2 |
212 PHILIP N. SMETHERAM Max:30 S2 02 | 21 7 14 | 3 0 3 |
213 PATRICK W. MARTIN Max:30 S2 03 | 14 7 7 | 1 0 1 |
214 PATRICK W. MARTIN Max:30 S2 04 | 24 13 11 | 6 1 5 |
215 PATRICK W. MARTIN Max:30 S2 05 | 15 4 11 | 2 1 1 |
Number of Sections: 9 Average Students Per Section: 21.67
SOC402 AP US POL&GOV 2 SM 3 90 77| 77 43 34 | 1 1 0 |
02 GORDON A. ELLIOTT Max:30 S2 02 | 28 16 12 | 1 1 0 |
03 GORDON A. ELLIOTT Max:30 S2 03 | 22 10 12 | 0 0 0 |
05 GORDON A. ELLIOTT Max:30 S2 05 | 27 17 10 | 0 0 0 |
Number of Sections: 3 Average Students Per Section: 25.67
SOC501 PSYCHOLOGY 2 SM 2 60 60| 60 35 25 | 7 2 5 |
01 CRYSTAL A. WISNESS Max:30 S2 01 | 30 22 8 | 3 2 1 |
02 CRYSTAL A. WISNESS Max:30 S2 02 | 30 13 17 | 4 0 4 |
Number of Sections: 2 Average Students Per Section: 30.00
SOC503 AP PSYCH 2 SM 1 30 19| 19 12 7 | 1 1 0 |
03 CRYSTAL A. WISNESS Max:30 S2 03 | 19 12 7 | 1 1 0 |
Number of Sections: 1 Average Students Per Section: 19.00
SOC508 WASH STATE HIST SM 2 90 30| 30 14 16 | 6 1 5 |
16 PATRICK W. MARTIN Max:30 S2 06 | 30 14 16 | 6 1 5 |
Number of Sections: 1 Average Students Per Section: 30.00
SPE116 READING LAB SM 2 14 14| 14 7 7 | 14 7 7 |
05 TERESA A. MCLUEN Max:14 S2 05 | 14 7 7 | 14 7 7 |
Number of Sections: 1 Average Students Per Section: 14.00
SPE202 LANG ARTS 1 SM 1 14 10| 10 4 6 | 9 4 5 |
02 TERESA A. MCLUEN Max:14 S2 02 | 10 4 6 | 9 4 5 |
Number of Sections: 1 Average Students Per Section: 10.00
SPE206 LANG ARTS 3 SM 1 14 12| 12 2 10 | 12 2 10 |
04 JAYNE CRIDDLE Max:14 S2 04 | 12 2 10 | 12 2 10 |
Number of Sections: 1 Average Students Per Section: 12.00
SPE208 LANG ARTS 4 SM 1 28 22| 22 8 14 | 22 8 14 |
01 JAYNE CRIDDLE Max:14 S2 01 | 9 4 5 | 9 4 5 |
04 TERESA A. MCLUEN Max:14 S2 04 | 13 4 9 | 13 4 9 |
Number of Sections: 2 Average Students Per Section: 11.00
SPE210 LANG ARTS 5 SM 1 28 25| 25 8 17 | 25 8 17 |
03 TERESA A. MCLUEN Max:14 S2 03 | 14 3 11 | 14 3 11 |
06 JAYNE CRIDDLE Max:14 S2 06 | 11 5 6 | 11 5 6 |
Number of Sections: 2 Average Students Per Section: 12.50
SPE218 READ/WR LAN 4 SM 2 14 12| 12 6 6 | 12 6 6 |
02 JAYNE CRIDDLE Max:14 S2 02 | 12 6 6 | 12 6 6 |
Number of Sections: 1 Average Students Per Section: 12.00
SPE220 READ/WR LAN 5 SM 1 28 26| 26 8 18 | 24 8 16 |
01 TERESA A. MCLUEN Max:14 S2 01 | 13 4 9 | 11 4 7 |
03 JAYNE CRIDDLE Max:14 S2 03 | 13 4 9 | 13 4 9 |
Number of Sections: 2 Average Students Per Section: 13.00
SPE304 MATH 2 SM 2 28 18| 18 9 9 | 18 9 9 |
02 BRANDI N. COLE Max:14 S2 02 | 13 5 8 | 13 5 8 |
06 ANGELA D. STUBBLEFIEL Max:14 S2 06 | 5 4 1 | 5 4 1 |

1sonyr01.p 38-2 AUBURN SENIOR HIGH SCHOOL 03/02/15 Page:19
05.14.10.00.00 Course/Class Count Report 401 3:05 PM
EST NBR NBR ----TOTALS---- --Special Ed--
COURSE DESCRIPTION LGTH SEC AVL REQ TOT FEM MAL TOT FEM MAL
Number of Sections: 2 Average Students Per Section: 9.00
SPE306 MATH 3 SM 3 42 36| 36 13 23 | 35 13 22 |
01 ANGELA D. STUBBLEFIEL Max:14 S2 01 | 9 3 6 | 9 3 6 |
05 BRANDI N. COLE Max:14 S2 05 | 13 3 10 | 13 3 10 |
06 BRANDI N. COLE Max:14 S2 06 | 14 7 7 | 13 7 6 |
Number of Sections: 3 Average Students Per Section: 12.00
SPE308 MATH 4 SM 3 56 49| 49 17 32 | 47 17 30 |
02 ANGELA D. STUBBLEFIEL Max:14 S2 02 | 12 6 6 | 12 6 6 |
03 BRANDI N. COLE Max:14 S2 03 | 14 7 7 | 13 7 6 |
04 ANGELA D. STUBBLEFIEL Max:14 S2 04 | 11 2 9 | 10 2 8 |
05 ANGELA D. STUBBLEFIEL Max:14 S2 05 | 12 2 10 | 12 2 10 |
Number of Sections: 4 Average Students Per Section: 12.25
SPE321 PRE ALGEBRA 2 SM 1 14 14| 14 5 9 | 14 5 9 |
01 BRANDI N. COLE Max:14 S2 01 | 14 5 9 | 14 5 9 |
Number of Sections: 1 Average Students Per Section: 14.00
SPE601 COMM LAB SM 1 122 28| 28 11 17 | 26 10 16 |
01 KAREN SHU-MINUTOLI Max:30 S2 01 | 13 6 7 | 12 5 7 |
04 KAREN SHU-MINUTOLI Max:30 S2 04 | 10 4 6 | 9 4 5 |
06 KAREN SHU-MINUTOLI Max:2 S2 06 | 0 0 0 | 0 0 0 |
07 KAREN SHU-MINUTOLI Max:30 S2 07 | 5 1 4 | 5 1 4 |
08 KAREN SHU-MINUTOLI Max:30 S2 08 | 0 0 0 | 0 0 0 |
Number of Sections: 5 Average Students Per Section: 5.60
TAP101 TRANSITNL PRG B SM 7 186 53| 53 31 22 | 47 25 22 |
01 ELAINE M. HOGG Max:31 S2 01 | 4 3 1 | 4 3 1 |
02 ELAINE M. HOGG Max:31 S2 02 | 4 3 1 | 4 3 1 |
03 ELAINE M. HOGG Max:31 S2 03 | 15 9 6 | 14 8 6 |
04 ELAINE M. HOGG Max:31 S2 04 | 15 8 7 | 13 6 7 |
05 ELAINE M. HOGG Max:31 S2 05 | 14 7 7 | 12 5 7 |
06 ELAINE M. HOGG Max:31 S2 06 | 1 1 0 | 0 0 0 |
Number of Sections: 6 Average Students Per Section: 8.83

1sonyr01.p 38-2 AUBURN SENIOR HIGH SCHOOL 03/02/15 Page:20
05.14.10.00.00 Course/Class Count Report Totals 3:05 PM
TITLE FOR TOTAL
TOTALS GROUP TOTAL FEMALE MALE
GRAND TOTALS 9257 4398 4859
Special Ed 1383 513 870
************************ End of report ************************

1sonyr01.p 38-2 AUBURN MOUNTAINVIEW H. S. 03/02/15 Page:1
05.14.10.00.00 Course/Class Count Report 405 3:08 PM
EST NBR NBR ----TOTALS---- --Special Ed--
COURSE DESCRIPTION LGTH SEC AVL REQ TOT FEM MAL TOT FEM MAL
ART110 CERAMICS SM 3 90 30| 30 17 13 | 3 2 1 |
16 AMY L. MILLS GOLDBERG Max:30 S2 01 | 30 17 13 | 3 2 1 |
Number of Sections: 1 Average Students Per Section: 30.00
ART111 ADV CERAMICS SM 1 30 30| 30 19 11 | 4 3 1 |
26 AMY L. MILLS GOLDBERG Max:30 S2 02 | 30 19 11 | 4 3 1 |
Number of Sections: 1 Average Students Per Section: 30.00
ART114 TECH THEATRE 1 SM 2 60 30| 30 12 18 | 3 0 3 |
66 PAUL H. FOUHY Max:30 S2 06 | 30 12 18 | 3 0 3 |
Number of Sections: 1 Average Students Per Section: 30.00
ART122 ACTING 2 SM 1 25 22| 22 10 12 | 3 0 3 |
56 PAUL H. FOUHY Max:25 S2 05 | 22 10 12 | 3 0 3 |
Number of Sections: 1 Average Students Per Section: 22.00
ART124 ACTING 4 SM 1 4 4| 4 1 3 | 0 0 0 |
56 PAUL H. FOUHY Max:4 S2 05 | 4 1 3 | 0 0 0 |
Number of Sections: 1 Average Students Per Section: 4.00
ART126 ACTING 6 SM 1 1 1| 1 1 0 | 0 0 0 |
56 PAUL H. FOUHY Max:1 S2 05 | 1 1 0 | 0 0 0 |
Number of Sections: 1 Average Students Per Section: 1.00
ART381 AP STUDIO ART 2 SM 1 30 11| 11 10 1 | 2 1 1 |
31 AMY L. MILLS GOLDBERG Max:30 S2 03 | 11 10 1 | 2 1 1 |
Number of Sections: 1 Average Students Per Section: 11.00
CTE002 HORT SCIENCE 2 SM 2 60 51| 51 26 25 | 8 1 7 |
51 REGINA K. GRUBB Max:30 S2 05 | 30 16 14 | 4 1 3 |
61 REGINA K. GRUBB Max:30 S2 06 | 21 10 11 | 4 0 4 |
Number of Sections: 2 Average Students Per Section: 25.50
CTE004 ENVIRON HORT 2 SM 1 60 59| 59 25 34 | 6 3 3 |
46 REGINA K. GRUBB Max:30 S2 04 | 30 17 13 | 3 1 2 |
76 REGINA K. GRUBB Max:30 S2 07 | 29 8 21 | 3 2 1 |
Number of Sections: 2 Average Students Per Section: 29.50
CTE008 FLORAL DES MKT2 SM 1 0 0| 0 0 0 | 0 0 0 |
46 REGINA K. GRUBB Max:0 S2 04 | 0 0 0 | 0 0 0 |
Number of Sections: 1 Average Students Per Section: 0.00
CTE102 ACCOUNTING 2 SM 1 30 27| 27 16 11 | 0 0 0 |
21 PATRICIA E. ECKELMAN Max:30 S2 02 | 27 16 11 | 0 0 0 |
Number of Sections: 1 Average Students Per Section: 27.00
CTE118 MATH BUS PRFIN2 SM 2 30 25| 25 13 12 | 1 1 0 |
31 PATRICIA E. ECKELMAN Max:30 S2 03 | 25 13 12 | 1 1 0 |
Number of Sections: 1 Average Students Per Section: 25.00
CTE142 MOS 2 SM 1 120 87| 87 44 43 | 3 0 3 |
16 PATRICIA E. ECKELMAN Max:30 S2 01 | 30 19 11 | 1 0 1 |
46 PATRICIA E. ECKELMAN Max:30 S2 04 | 28 11 17 | 1 0 1 |
56 PATRICIA E. ECKELMAN Max:30 S2 05 | 29 14 15 | 1 0 1 |
Number of Sections: 3 Average Students Per Section: 29.00
CTE171 MARKETG/DECA 2 SM 3 73 74| 74 37 37 | 4 3 1 |
11 DEREK E. ENZ Max:13 S2 01 | 13 4 9 | 2 1 1 |
36 DEREK E. ENZ Max:30 S2 03 | 31 20 11 | 1 1 0 |
51 DEREK E. ENZ Max:30 S2 05 | 30 13 17 | 1 1 0 |
Number of Sections: 3 Average Students Per Section: 24.67
CTE176 MKT PMGMT DECA4 SM 1 30 30| 30 13 17 | 0 0 0 |
61 DEREK E. ENZ Max:30 S2 06 | 30 13 17 | 0 0 0 |
Number of Sections: 1 Average Students Per Section: 30.00
CTE181 MKT BUS ADMIN 2 SM 1 17 11| 11 3 8 | 0 0 0 |
11 DEREK E. ENZ Max:17 S2 01 | 11 3 8 | 0 0 0 |
Number of Sections: 1 Average Students Per Section: 11.00
CTE183 STORE RETL OP 2 SM 1 31 31| 31 14 17 | 2 0 2 |
37 DEREK E. ENZ Max:6 S2 03 | 6 2 4 | 0 0 0 |

1sonyr01.p 38-2 AUBURN MOUNTAINVIEW H. S. 03/02/15 Page:2
05.14.10.00.00 Course/Class Count Report 405 3:08 PM
EST NBR NBR ----TOTALS---- --Special Ed--
COURSE DESCRIPTION LGTH SEC AVL REQ TOT FEM MAL TOT FEM MAL
41 DEREK E. ENZ Max:25 S2 04 | 25 12 13 | 2 0 2 |
Number of Sections: 2 Average Students Per Section: 15.50
CTE185 STOR OP SM BSN2 SM 1 8 9| 9 6 3 | 0 0 0 |
41 DEREK E. ENZ Max:5 S2 04 | 7 5 2 | 0 0 0 |
51 DEREK E. ENZ Max:3 S2 05 | 2 1 1 | 0 0 0 |
Number of Sections: 2 Average Students Per Section: 4.50
CTE187 MARKTNG ENTRE 2 SM 1 0 0| 0 0 0 | 0 0 0 |
11 DEREK E. ENZ Max:0 S2 01 | 0 0 0 | 0 0 0 |
Number of Sections: 1 Average Students Per Section: 0.00
CTE188 BSN MKT FN DECA SM 1 85 20| 20 9 11 | 1 0 1 |
37 JANA D. THOMAS Max:25 S2 03 | 20 9 11 | 1 0 1 |
Number of Sections: 1 Average Students Per Section: 20.00
CTE211 CAREER W/CHILD1 SM 2 60 28| 28 25 3 | 1 1 0 |
26 VIVIAN G. BAGLIEN Max:30 S2 02 | 28 25 3 | 1 1 0 |
Number of Sections: 1 Average Students Per Section: 28.00
CTE240 INDEP LIVING SM 1 60 22| 22 12 10 | 6 2 4 |
16 VIVIAN G. BAGLIEN Max:30 S2 01 | 22 12 10 | 6 2 4 |
Number of Sections: 1 Average Students Per Section: 22.00
CTE245 INTERIOR DESIGN SM 1 30 21| 21 17 4 | 3 2 1 |
36 VIVIAN G. BAGLIEN Max:30 S2 03 | 21 17 4 | 3 2 1 |
Number of Sections: 1 Average Students Per Section: 21.00
CTE250 NUTRTN WELLNESS SM 2 60 30| 30 22 8 | 2 2 0 |
66 VIVIAN G. BAGLIEN Max:30 S2 06 | 30 22 8 | 2 2 0 |
Number of Sections: 1 Average Students Per Section: 30.00
CTE266 COSMETOLOGY 2 SM 1 5 1| 1 1 0 | 1 1 0 |
36 VIVIAN G. BAGLIEN Max:5 S2 03 | 1 1 0 | 1 1 0 |
Number of Sections: 1 Average Students Per Section: 1.00
CTE304 PREVENTIVE MED SM 4 90 59| 59 37 22 | 5 2 3 |
36 STEVEN I. CALHOUN Max:30 S2 03 | 30 21 9 | 4 2 2 |
46 STEVEN I. CALHOUN Max:30 S2 04 | 29 16 13 | 1 0 1 |
Number of Sections: 2 Average Students Per Section: 29.50
CTE306 ANATOMY/PHYS 2 SM 2 60 57| 57 42 15 | 1 1 0 |
11 STEVEN I. CALHOUN Max:30 S2 01 | 27 19 8 | 1 1 0 |
21 STEVEN I. CALHOUN Max:30 S2 02 | 30 23 7 | 0 0 0 |
Number of Sections: 2 Average Students Per Section: 28.50
CTE308 SPORTS MED 2 SM 1 23 23| 23 20 3 | 0 0 0 |
61 STEVEN I. CALHOUN Max:23 S2 06 | 23 20 3 | 0 0 0 |
Number of Sections: 1 Average Students Per Section: 23.00
CTE312 ADVSPORTS MED 2 SM 2 7 11| 11 9 2 | 0 0 0 |
61 STEVEN I. CALHOUN Max:7 S2 06 | 11 9 2 | 0 0 0 |
Number of Sections: 1 Average Students Per Section: 11.00
CTE331 CULINARY ARTS SM 14 284 105| 105 47 58 | 20 10 10 |
16 ROBERTA J. LOCKE Max:30 S2 01 | 30 10 20 | 7 2 5 |
26 ROBERTA J. LOCKE Max:30 S2 02 | 27 15 12 | 6 3 3 |
36 ROBERTA J. LOCKE Max:30 S2 03 | 29 13 16 | 5 4 1 |
96 ROBERTA J. LOCKE Max:30 S2 09 | 19 9 10 | 2 1 1 |
Number of Sections: 4 Average Students Per Section: 26.25
CTE332 CULINARY ARTS SM 3 45 41| 41 19 22 | 1 0 1 |
46 ROBERTA J. LOCKE Max:25 S2 04 | 24 13 11 | 1 0 1 |
56 ROBERTA J. LOCKE Max:20 S2 05 | 17 6 11 | 0 0 0 |
Number of Sections: 2 Average Students Per Section: 20.50
CTE334 ADV CULNY ART 2 SM 3 11 10| 10 3 7 | 0 0 0 |
41 ROBERTA J. LOCKE Max:5 S2 04 | 4 1 3 | 0 0 0 |
51 ROBERTA J. LOCKE Max:6 S2 05 | 6 2 4 | 0 0 0 |
Number of Sections: 2 Average Students Per Section: 5.00
CTE336 CULNY ARTS CS 2 SM 1 0 0| 0 0 0 | 0 0 0 |

1sonyr01.p 38-2 AUBURN MOUNTAINVIEW H. S. 03/02/15 Page:3
05.14.10.00.00 Course/Class Count Report 405 3:08 PM
EST NBR NBR ----TOTALS---- --Special Ed--
COURSE DESCRIPTION LGTH SEC AVL REQ TOT FEM MAL TOT FEM MAL
41 ROBERTA J. LOCKE Max:0 S2 04 | 0 0 0 | 0 0 0 |
Number of Sections: 1 Average Students Per Section: 0.00
CTE351 JEWL METLSCULP1 SM 7 187 54| 54 30 24 | 5 2 3 |
56 BARBARA E. KNUTH Max:28 S2 05 | 27 16 11 | 3 1 2 |
66 BARBARA E. KNUTH Max:28 S2 06 | 27 14 13 | 2 1 1 |
Number of Sections: 2 Average Students Per Section: 27.00
CTE352 JEWL METLSCULP2 SM 4 83 55| 55 22 33 | 3 2 1 |
26 DORIN J. MEINHART Max:26 S2 02 | 21 5 16 | 1 0 1 |
36 BARBARA E. KNUTH Max:22 S2 03 | 8 6 2 | 0 0 0 |
46 BARBARA E. KNUTH Max:28 S2 04 | 26 11 15 | 2 2 0 |
Number of Sections: 3 Average Students Per Section: 18.33
CTE353 JEWL METLSCULP3 SM 2 7 6| 6 1 5 | 2 0 2 |
26 DORIN J. MEINHART Max:2 S2 02 | 2 0 2 | 1 0 1 |
36 BARBARA E. KNUTH Max:4 S2 03 | 4 1 3 | 1 0 1 |
Number of Sections: 2 Average Students Per Section: 3.00
CTE354 JEWL METLSCULP4 SM 1 2 1| 1 0 1 | 0 0 0 |
36 BARBARA E. KNUTH Max:2 S2 03 | 1 0 1 | 0 0 0 |
Number of Sections: 1 Average Students Per Section: 1.00
CTE361 VIS COM 1 SM 5 120 58| 58 25 33 | 4 0 4 |
26 CARY W. DAVIDSON Max:30 S2 02 | 28 13 15 | 3 0 3 |
56 CARY W. DAVIDSON Max:30 S2 05 | 30 12 18 | 1 0 1 |
Number of Sections: 2 Average Students Per Section: 29.00
CTE362 VIS COM 2 SM 2 30 18| 18 5 13 | 1 0 1 |
36 CARY W. DAVIDSON Max:30 S2 03 | 18 5 13 | 1 0 1 |
Number of Sections: 1 Average Students Per Section: 18.00
CTE366 VIS COM CS 2 SM 1 1 1| 1 0 1 | 0 0 0 |
36 CARY W. DAVIDSON Max:1 S2 03 | 1 0 1 | 0 0 0 |
Number of Sections: 1 Average Students Per Section: 1.00
CTE368 DIGITAL PHOTO 1 SM 2 90 28| 28 19 9 | 1 0 1 |
66 CARY W. DAVIDSON Max:30 S2 06 | 28 19 9 | 1 0 1 |
Number of Sections: 1 Average Students Per Section: 28.00
CTE371 DRAWING 1 SM 5 119 30| 30 14 16 | 1 0 1 |
36 LONNIE J. CHAVEZ Max:30 S2 03 | 30 14 16 | 1 0 1 |
Number of Sections: 1 Average Students Per Section: 30.00
CTE372 DRAWING 2 SM 2 59 51| 51 36 15 | 5 3 2 |
46 LONNIE J. CHAVEZ Max:30 S2 04 | 23 16 7 | 4 3 1 |
56 LONNIE J. CHAVEZ Max:29 S2 05 | 28 20 8 | 1 0 1 |
Number of Sections: 2 Average Students Per Section: 25.50
CTE376 GRAPHIC DES 2 SM 1 27 17| 17 10 7 | 2 2 0 |
61 LONNIE J. CHAVEZ Max:27 S2 06 | 17 10 7 | 2 2 0 |
Number of Sections: 1 Average Students Per Section: 17.00
CTE378 GRAPHC DES CS 2 SM 1 4 3| 3 2 1 | 0 0 0 |
51 LONNIE J. CHAVEZ Max:1 S2 05 | 0 0 0 | 0 0 0 |
61 LONNIE J. CHAVEZ Max:3 S2 06 | 3 2 1 | 0 0 0 |
Number of Sections: 2 Average Students Per Section: 1.50
CTE382 ELECTRONICS 2 SM 2 43 41| 41 2 39 | 2 0 2 |
26 ROBERT C. MORITZ Max:23 S2 02 | 22 0 22 | 0 0 0 |
36 ROBERT C. MORITZ Max:20 S2 03 | 19 2 17 | 2 0 2 |
Number of Sections: 2 Average Students Per Section: 20.50
CTE384 ELECTRONICS 4 SM 1 4 3| 3 0 3 | 0 0 0 |
36 ROBERT C. MORITZ Max:4 S2 03 | 3 0 3 | 0 0 0 |
Number of Sections: 1 Average Students Per Section: 3.00
CTE388 ELECTRONIC 2 CS SM 1 2 2| 2 0 2 | 0 0 0 |
26 ROBERT C. MORITZ Max:1 S2 02 | 1 0 1 | 0 0 0 |
56 ROBERT C. MORITZ Max:1 S2 05 | 1 0 1 | 0 0 0 |

1sonyr01.p 38-2 AUBURN MOUNTAINVIEW H. S. 03/02/15 Page:4
05.14.10.00.00 Course/Class Count Report 405 3:08 PM
EST NBR NBR ----TOTALS---- --Special Ed--
COURSE DESCRIPTION LGTH SEC AVL REQ TOT FEM MAL TOT FEM MAL
Number of Sections: 2 Average Students Per Section: 1.00
CTE390 ROBOTICS TECH 2 SM 2 24 19| 19 1 18 | 2 1 1 |
61 TIMOTHY M. SCOTT Max:24 S2 06 | 19 1 18 | 2 1 1 |
Number of Sections: 1 Average Students Per Section: 19.00
CTE392 WEB PUBLISH 2 SM 1 24 24| 24 9 15 | 0 0 0 |
66 ROBERT C. MORITZ Max:24 S2 06 | 24 9 15 | 0 0 0 |
Number of Sections: 1 Average Students Per Section: 24.00
CTE394 WEB PUBLISH 4 SM 1 0 0| 0 0 0 | 0 0 0 |
66 ROBERT C. MORITZ Max:0 S2 06 | 0 0 0 | 0 0 0 |
Number of Sections: 1 Average Students Per Section: 0.00
CTE402 ENGN DES ARCH 2 SM 2 42 39| 39 5 34 | 7 1 6 |
16 TIMOTHY M. SCOTT Max:19 S2 01 | 17 3 14 | 4 1 3 |
26 TIMOTHY M. SCOTT Max:22 S2 02 | 22 2 20 | 3 0 3 |
Number of Sections: 2 Average Students Per Section: 19.50
CTE405 ENGN DES ARCH 3 SM 1 8 1| 1 0 1 | 0 0 0 |
16 TIMOTHY M. SCOTT Max:1 S2 01 | 1 0 1 | 0 0 0 |
Number of Sections: 1 Average Students Per Section: 1.00
CTE406 ENGN DES ARCH 4 SM 1 6 6| 6 0 6 | 1 0 1 |
16 TIMOTHY M. SCOTT Max:4 S2 01 | 4 0 4 | 0 0 0 |
26 TIMOTHY M. SCOTT Max:2 S2 02 | 2 0 2 | 1 0 1 |
Number of Sections: 2 Average Students Per Section: 3.00
CTE412 COMP SYS ENG 2 SM 2 45 26| 26 3 23 | 1 1 0 |
41 ROBERT C. MORITZ Max:24 S2 04 | 13 2 11 | 0 0 0 |
51 ROBERT C. MORITZ Max:21 S2 05 | 13 1 12 | 1 1 0 |
Number of Sections: 2 Average Students Per Section: 13.00
CTE414 COMP SYS ENG 4 SM 1 2 2| 2 0 2 | 0 0 0 |
51 ROBERT C. MORITZ Max:2 S2 05 | 2 0 2 | 0 0 0 |
Number of Sections: 1 Average Students Per Section: 2.00
CTE456 WOODWRK DESGN 2 SM 2 48 42| 42 8 34 | 3 0 3 |
36 TIMOTHY M. SCOTT Max:26 S2 03 | 20 1 19 | 3 0 3 |
46 TIMOTHY M. SCOTT Max:22 S2 04 | 22 7 15 | 0 0 0 |
Number of Sections: 2 Average Students Per Section: 21.00
CTE458 WOODWRK DESGN 4 SM 1 6 6| 6 1 5 | 2 0 2 |
46 TIMOTHY M. SCOTT Max:6 S2 04 | 6 1 5 | 2 0 2 |
Number of Sections: 1 Average Students Per Section: 6.00
CTE462 WOODWRK DESGN 6 SM 1 2 2| 2 0 2 | 0 0 0 |
36 TIMOTHY M. SCOTT Max:2 S2 03 | 2 0 2 | 0 0 0 |
46 TIMOTHY M. SCOTT Max:0 S2 04 | 0 0 0 | 0 0 0 |
Number of Sections: 2 Average Students Per Section: 1.00
CTE470 WBL GENERIC SM 1 0 0| 0 0 0 | 0 0 0 |
76 VIVIAN G. BAGLIEN Max:0 S2 07 | 0 0 0 | 0 0 0 |
Number of Sections: 1 Average Students Per Section: 0.00
CTE472 WBL AUTOMOTIVE SM 1 0 0| 0 0 0 | 0 0 0 |
72 VIVIAN G. BAGLIEN Max:0 S2 07 | 0 0 0 | 0 0 0 |
Number of Sections: 1 Average Students Per Section: 0.00
CTE473 WBL BUS ED SM 1 60 5| 5 3 2 | 0 0 0 |
71 VIVIAN G. BAGLIEN Max:30 S2 07 | 5 3 2 | 0 0 0 |
Number of Sections: 1 Average Students Per Section: 5.00
CTE477 WBL CULNY ARTS SM 1 60 5| 5 5 0 | 0 0 0 |
76 VIVIAN G. BAGLIEN Max:30 S2 07 | 5 5 0 | 0 0 0 |
Number of Sections: 1 Average Students Per Section: 5.00
CTE478 WBL DRAFT ENGIN SM 1 0 0| 0 0 0 | 0 0 0 |
76 VIVIAN G. BAGLIEN Max:0 S2 07 | 0 0 0 | 0 0 0 |
Number of Sections: 1 Average Students Per Section: 0.00
CTE479 WBL ELECTRONICS SM 1 0 0| 0 0 0 | 0 0 0 |
02 VIVIAN G. BAGLIEN Max:0 S2 07 | 0 0 0 | 0 0 0 |

1sonyr01.p 38-2 AUBURN MOUNTAINVIEW H. S. 03/02/15 Page:5
05.14.10.00.00 Course/Class Count Report 405 3:08 PM
EST NBR NBR ----TOTALS---- --Special Ed--
COURSE DESCRIPTION LGTH SEC AVL REQ TOT FEM MAL TOT FEM MAL
Number of Sections: 1 Average Students Per Section: 0.00
CTE480 WBL FAM CONS SC SM 1 60 6| 6 4 2 | 0 0 0 |
76 VIVIAN G. BAGLIEN Max:30 S2 07 | 6 4 2 | 0 0 0 |
Number of Sections: 1 Average Students Per Section: 6.00
CTE481 WBL GPH DES PRO SM 1 60 1| 1 1 0 | 0 0 0 |
76 VIVIAN G. BAGLIEN Max:30 S2 08 | 1 1 0 | 0 0 0 |
Number of Sections: 1 Average Students Per Section: 1.00
CTE483 WBL JEWELRY MFG SM 1 60 4| 4 2 2 | 1 1 0 |
76 VIVIAN G. BAGLIEN Max:30 S2 07 | 4 2 2 | 1 1 0 |
Number of Sections: 1 Average Students Per Section: 4.00
CTE484 WBL MARKETING SM 1 60 2| 2 1 1 | 0 0 0 |
76 VIVIAN G. BAGLIEN Max:30 S2 07 | 2 1 1 | 0 0 0 |
Number of Sections: 1 Average Students Per Section: 2.00
CTE487 WBL SPORTS MED SM 1 30 0| 0 0 0 | 0 0 0 |
76 VIVIAN G. BAGLIEN Max:30 S2 07 | 0 0 0 | 0 0 0 |
Number of Sections: 1 Average Students Per Section: 0.00
CTE488 WBL VIS COM SM 1 60 1| 1 0 1 | 0 0 0 |
76 VIVIAN G. BAGLIEN Max:30 S2 07 | 1 0 1 | 0 0 0 |
Number of Sections: 1 Average Students Per Section: 1.00
CTE521 JROTC 1 SM 9 300 101| 101 21 80 | 14 4 10 |
16 JASON K. SHRADER Max:30 S2 01 | 27 4 23 | 3 0 3 |
26 JASON K. SHRADER Max:30 S2 02 | 15 1 14 | 1 0 1 |
36 JASON K. SHRADER Max:30 S2 03 | 14 4 10 | 2 1 1 |
56 JASON K. SHRADER Max:30 S2 05 | 22 5 17 | 5 2 3 |
66 JASON K. SHRADER Max:30 S2 06 | 23 7 16 | 3 1 2 |
Number of Sections: 5 Average Students Per Section: 20.20
ELL102 ELL LAN ART 1B SM 1 15 8| 8 2 6 | 0 0 0 |
31 LINDA C. SULLIVAN Max:15 S2 03 | 8 2 6 | 0 0 0 |
Number of Sections: 1 Average Students Per Section: 8.00
ELL121 ELL STDY SKILL2 SM 1 30 15| 15 6 9 | 0 0 0 |
61 LINDA C. SULLIVAN Max:30 S2 06 | 15 6 9 | 0 0 0 |
Number of Sections: 1 Average Students Per Section: 15.00
ELL302 ELL LAN ART 3B SM 1 30 19| 19 8 11 | 0 0 0 |
11 LINDA C. SULLIVAN Max:30 S2 01 | 19 8 11 | 0 0 0 |
Number of Sections: 1 Average Students Per Section: 19.00
ELL810 ELL SUPPORT YR 1 60 31| 31 14 17 | 4 2 2 |
71 LINDA C. SULLIVAN Max:60 YR 07 | 31 14 17 | 4 2 2 |
Number of Sections: 1 Average Students Per Section: 31.00
FOR202 FRENCH 2 SM 4 60 58| 58 39 19 | 3 1 2 |
31 KYE S. CEZENNE Max:30 S2 03 | 30 24 6 | 0 0 0 |
51 KYE S. CEZENNE Max:30 S2 05 | 28 15 13 | 3 1 2 |
Number of Sections: 2 Average Students Per Section: 29.00
FOR204 FRENCH 4 SM 2 90 58| 58 30 28 | 1 0 1 |
11 KYE S. CEZENNE Max:30 S2 01 | 25 11 14 | 0 0 0 |
51 LINDA C. SULLIVAN Max:30 S2 05 | 9 6 3 | 1 0 1 |
61 KYE S. CEZENNE Max:30 S2 06 | 24 13 11 | 0 0 0 |
Number of Sections: 3 Average Students Per Section: 19.33
FOR213 UW FRENCH 2 SM 1 30 18| 18 8 10 | 0 0 0 |
41 KYE S. CEZENNE Max:30 S2 04 | 18 8 10 | 0 0 0 |
Number of Sections: 1 Average Students Per Section: 18.00
FOR402 JAPANESE 2 SM 2 60 47| 47 24 23 | 2 2 0 |
31 JESSICA C. LEE Max:30 S2 03 | 23 13 10 | 2 2 0 |
61 JESSICA C. LEE Max:30 S2 06 | 24 11 13 | 0 0 0 |
Number of Sections: 2 Average Students Per Section: 23.50
FOR404 JAPANESE 4 SM 1 60 34| 34 12 22 | 3 2 1 |
21 JESSICA C. LEE Max:30 S2 02 | 19 8 11 | 1 1 0 |

1sonyr01.p 38-2 AUBURN MOUNTAINVIEW H. S. 03/02/15 Page:6
05.14.10.00.00 Course/Class Count Report 405 3:08 PM
EST NBR NBR ----TOTALS---- --Special Ed--
COURSE DESCRIPTION LGTH SEC AVL REQ TOT FEM MAL TOT FEM MAL
51 JESSICA C. LEE Max:30 S2 05 | 15 4 11 | 2 1 1 |
Number of Sections: 2 Average Students Per Section: 17.00
FOR406 JAPANESE 6 SM 1 28 11| 11 8 3 | 0 0 0 |
41 JESSICA C. LEE Max:28 S2 04 | 11 8 3 | 0 0 0 |
Number of Sections: 1 Average Students Per Section: 11.00
FOR408 JAPANESE 8 SM 1 2 2| 2 0 2 | 0 0 0 |
41 JESSICA C. LEE Max:2 S2 04 | 2 0 2 | 0 0 0 |
Number of Sections: 1 Average Students Per Section: 2.00
FOR421 UW JAPANESE 2 SM 1 0 0| 0 0 0 | 0 0 0 |
41 JESSICA C. LEE Max:0 S2 04 | 0 0 0 | 0 0 0 |
Number of Sections: 1 Average Students Per Section: 0.00
FOR502 LATIN 2 SM 1 30 21| 21 13 8 | 0 0 0 |
21 RAY S. DALLY Max:30 S2 02 | 21 13 8 | 0 0 0 |
Number of Sections: 1 Average Students Per Section: 21.00
FOR504 LATIN 4 SM 1 13 10| 10 5 5 | 1 0 1 |
11 RAY S. DALLY Max:13 S2 01 | 10 5 5 | 1 0 1 |
Number of Sections: 1 Average Students Per Section: 10.00
FOR506 LATIN 6 SM 1 17 15| 15 4 11 | 0 0 0 |
11 RAY S. DALLY Max:17 S2 01 | 15 4 11 | 0 0 0 |
Number of Sections: 1 Average Students Per Section: 15.00
FOR602 SPANISH 2 SM 8 180 152| 152 70 82 | 5 2 3 |
11 NORMA I. VEGA COLON Max:30 S2 01 | 25 12 13 | 0 0 0 |
31 NORMA I. VEGA COLON Max:30 S2 03 | 30 9 21 | 1 0 1 |
41 DORIN J. MEINHART Max:30 S2 04 | 21 10 11 | 3 1 2 |
42 NORMA I. VEGA COLON Max:30 S2 04 | 18 9 9 | 1 1 0 |
51 DORIN J. MEINHART Max:30 S2 05 | 30 15 15 | 0 0 0 |
61 DORIN J. MEINHART Max:30 S2 06 | 28 15 13 | 0 0 0 |
Number of Sections: 6 Average Students Per Section: 25.33
FOR604 SPANISH 4 SM 5 150 125| 125 61 64 | 1 0 1 |
21 NORMA I. VEGA COLON Max:30 S2 02 | 22 14 8 | 0 0 0 |
31 DUSTIN P. HEDGER Max:30 S2 03 | 28 16 12 | 1 0 1 |
41 DUSTIN P. HEDGER Max:30 S2 04 | 24 15 9 | 0 0 0 |
51 DUSTIN P. HEDGER Max:30 S2 05 | 27 12 15 | 0 0 0 |
61 NORMA I. VEGA COLON Max:30 S2 06 | 24 4 20 | 0 0 0 |
Number of Sections: 5 Average Students Per Section: 25.00
FOR606 SPANISH 6 SM 2 60 35| 35 19 16 | 0 0 0 |
11 DUSTIN P. HEDGER Max:30 S2 01 | 17 8 9 | 0 0 0 |
21 DUSTIN P. HEDGER Max:30 S2 02 | 18 11 7 | 0 0 0 |
Number of Sections: 2 Average Students Per Section: 17.50
GEN101 ORIENTATION SM 12 290 150| 150 73 77 | 8 2 6 |
16 DEREK V. PYLE Max:30 S2 01 | 26 11 15 | 2 1 1 |
17 JESSICA C. LEE Max:30 S2 01 | 27 13 14 | 1 0 1 |
18 LONNIE J. CHAVEZ Max:30 S2 01 | 25 10 15 | 2 0 2 |
19 CARY W. DAVIDSON Max:30 S2 01 | 27 17 10 | 2 1 1 |
LD2 JARED D. GERVAIS Max:50 S2 02 | 45 22 23 | 1 0 1 |
Number of Sections: 5 Average Students Per Section: 30.00
GEN200 ADVISORY 9-12 YR 85 2520 378| 378 180 198 | 21 11 10 |
01 KAREN M. AINSWORTH Max:30 YR 08 | 10 7 3 | 1 0 1 |
02 TORI T. AMMONS Max:30 YR 08 | 9 5 4 | 1 1 0 |
03 ERIC D. ARNOLD Max:30 YR 08 | 3 0 3 | 0 0 0 |
05 VIVIAN G. BAGLIEN Max:30 YR 08 | 6 5 1 | 0 0 0 |
06 LINDA C. SULLIVAN Max:30 YR 08 | 5 3 2 | 0 0 0 |
07 PATRIA R. BAUMSTARK Max:30 YR 08 | 4 4 0 | 0 0 0 |
08 STEVEN R. DUBAY Max:30 YR 08 | 1 0 1 | 0 0 0 |
09 LEIMOMI M. BOWLES Max:30 YR 08 | 4 2 2 | 0 0 0 |
10 KRISTINE A. BROWN Max:30 YR 08 | 5 2 3 | 1 1 0 |

1sonyr01.p 38-2 AUBURN MOUNTAINVIEW H. S. 03/02/15 Page:7
05.14.10.00.00 Course/Class Count Report 405 3:08 PM
EST NBR NBR ----TOTALS---- --Special Ed--
COURSE DESCRIPTION LGTH SEC AVL REQ TOT FEM MAL TOT FEM MAL
11 JENNIE M. BUETOW Max:30 YR 08 | 6 3 3 | 0 0 0 |
12 STEVEN I. CALHOUN Max:30 YR 08 | 5 4 1 | 0 0 0 |
13 CHRISTOPHER J. CARR Max:30 YR 08 | 2 1 1 | 0 0 0 |
14 KYE S. CEZENNE Max:30 YR 08 | 4 2 2 | 0 0 0 |
15 LONNIE J. CHAVEZ Max:30 YR 08 | 7 5 2 | 0 0 0 |
16 JANET H. CHU Max:30 YR 08 | 5 2 3 | 0 0 0 |
17 JENNIFER M. CLASSEN Max:30 YR 08 | 2 1 1 | 0 0 0 |
18 KENNETH N. COLBURN Max:30 YR 08 | 3 1 2 | 0 0 0 |
19 BRADLEY J. COMSTOCK Max:30 YR 08 | 6 0 6 | 5 0 5 |
20 RAY S. DALLY Max:30 YR 08 | 5 3 2 | 0 0 0 |
21 CARY W. DAVIDSON Max:30 YR 08 | 5 1 4 | 0 0 0 |
22 DUSTIN DEPIANO Max:30 YR 08 | 11 9 2 | 0 0 0 |
23 PATRICIA E. ECKELMAN Max:30 YR 08 | 7 6 1 | 0 0 0 |
24 DEREK E. ENZ Max:30 YR 08 | 9 4 5 | 0 0 0 |
25 ERIN L. HALL Max:30 YR 08 | 4 1 3 | 0 0 0 |
26 ROBERT C. MORITZ Max:30 YR 08 | 3 0 3 | 0 0 0 |
27 CORY M. RUTLEDGE Max:30 YR 08 | 4 2 2 | 0 0 0 |
28 PAUL H. FOUHY Max:30 YR 08 | 28 14 14 | 3 2 1 |
29 ADAM C. FRANCE Max:30 YR 08 | 4 2 2 | 0 0 0 |
30 KAREN F. CALDWELL Max:30 YR 08 | 9 2 7 | 1 1 0 |
31 JARED D. GERVAIS Max:30 YR 08 | 3 1 2 | 1 0 1 |
32 KIMBERLY M. STENSON Max:30 YR 08 | 1 1 0 | 0 0 0 |
33 STEPHANIE M. GLENISKY Max:30 YR 08 | 9 6 3 | 1 0 1 |
34 KIRSTEN A. GRAVNING Max:30 YR 08 | 13 10 3 | 0 0 0 |
35 <None> Max:30 YR 08 | 0 0 0 | 0 0 0 |
36 REGINA K. GRUBB Max:30 YR 08 | 2 1 1 | 0 0 0 |
37 EVELYN I. HAMMER Max:30 YR 08 | 8 4 4 | 0 0 0 |
38 ROBIN K. HAMMER Max:30 YR 08 | 4 1 3 | 0 0 0 |
39 THERESA A. HAYNES Max:30 YR 08 | 3 0 3 | 0 0 0 |
40 DUSTIN P. HEDGER Max:30 YR 08 | 5 1 4 | 0 0 0 |
42 JAYME L. HOSTETTER Max:30 YR 08 | 5 3 2 | 0 0 0 |
43 <None> Max:30 YR 08 | 0 0 0 | 0 0 0 |
44 STEPHANIE E. KEAGLE Max:30 YR 08 | 6 3 3 | 0 0 0 |
45 DEBRA J. LANDIS Max:30 YR 08 | 8 3 5 | 0 0 0 |
46 JESSICA C. LEE Max:30 YR 08 | 12 5 7 | 0 0 0 |
47 NATHAN R. LEMANSKI Max:30 YR 08 | 5 2 3 | 0 0 0 |
48 ROBERTA J. LOCKE Max:30 YR 08 | 5 3 2 | 1 1 0 |
49 KAY M. LORRAIN Max:30 YR 08 | 4 2 2 | 0 0 0 |
50 BRIAN E. LOVEJOY Max:30 YR 08 | 6 3 3 | 0 0 0 |
51 <None> Max:30 YR 08 | 0 0 0 | 0 0 0 |
52 DORIN J. MEINHART Max:30 YR 08 | 5 3 2 | 1 1 0 |
53 DANIEL C. MICKELSON Max:30 YR 08 | 3 1 2 | 0 0 0 |
54 AMY L. MILLS GOLDBERG Max:30 YR 08 | 3 2 1 | 0 0 0 |
56 KEVIN T. NISHIMOTO Max:30 YR 08 | 9 3 6 | 0 0 0 |
57 LEAHMARIE O'BRIEN Max:30 YR 08 | 3 2 1 | 1 1 0 |
58 NORENE L. OSBORNE Max:30 YR 08 | 3 0 3 | 0 0 0 |
59 AMANDA L. PAULSON Max:30 YR 08 | 9 5 4 | 0 0 0 |
60 DAVID A. PRESTON Max:30 YR 08 | 4 2 2 | 0 0 0 |
61 <None> Max:30 YR 08 | 0 0 0 | 0 0 0 |
62 DEREK V. PYLE Max:30 YR 08 | 3 1 2 | 0 0 0 |
63 KENT D. RODSETH Max:30 YR 08 | 4 0 4 | 0 0 0 |
64 WAYNE D. RUMBAUGH Max:30 YR 08 | 4 2 2 | 0 0 0 |
65 TIMOTHY M. SCOTT Max:30 YR 08 | 6 1 5 | 0 0 0 |
66 JASON K. SHRADER Max:30 YR 08 | 3 1 2 | 1 1 0 |
67 KARL F. STEFFIN Max:30 YR 08 | 10 5 5 | 0 0 0 |
68 JULIANNE R. STRICHERZ Max:30 YR 08 | 0 0 0 | 0 0 0 |

1sonyr01.p 38-2 AUBURN MOUNTAINVIEW H. S. 03/02/15 Page:8
05.14.10.00.00 Course/Class Count Report 405 3:08 PM
EST NBR NBR ----TOTALS---- --Special Ed--
COURSE DESCRIPTION LGTH SEC AVL REQ TOT FEM MAL TOT FEM MAL
69 <None> Max:30 YR 08 | 0 0 0 | 0 0 0 |
70 LESLIE J. TAUZER Max:30 YR 08 | 8 4 4 | 0 0 0 |
71 JANA D. THOMAS Max:30 YR 08 | 7 4 3 | 0 0 0 |
72 ALICIA J. THOMPSON Max:30 YR 08 | 3 2 1 | 1 1 0 |
73 KADY M. VANDERHOOF Max:30 YR 08 | 3 0 3 | 0 0 0 |
74 NORMA I. VEGA COLON Max:30 YR 08 | 4 2 2 | 1 1 0 |
75 GLEN W. WALKER Max:30 YR 08 | 9 0 9 | 1 0 1 |
76 <None> Max:30 YR 00 | 0 0 0 | 0 0 0 |
77 <None> Max:30 YR 00 | 0 0 0 | 0 0 0 |
78 <None> Max:30 YR 00 | 0 0 0 | 0 0 0 |
79 <None> Max:30 YR 00 | 0 0 0 | 0 0 0 |
80 <None> Max:30 YR 00 | 0 0 0 | 0 0 0 |
81 <None> Max:30 YR 00 | 0 0 0 | 0 0 0 |
82 <None> Max:30 YR 00 | 0 0 0 | 0 0 0 |
83 <None> Max:30 YR 00 | 0 0 0 | 0 0 0 |
84 <None> Max:30 YR 00 | 0 0 0 | 0 0 0 |
85 <None> Max:30 YR 00 | 0 0 0 | 0 0 0 |
Number of Sections: 82 Average Students Per Section: 4.61
GEN300 STUDY SKILLS SM 1 241 69| 69 33 36 | 6 2 4 |
16 BRADLEY J. COMSTOCK Max:14 S2 01 | 1 1 0 | 1 1 0 |
26 BRADLEY J. COMSTOCK Max:1 S2 02 | 1 0 1 | 1 0 1 |
27 TELIA S. PETERSON Max:1 S2 02 | 1 1 0 | 1 1 0 |
56 ERIN L. HALL Max:20 S2 05 | 20 9 11 | 1 0 1 |
86 HEIDI K. BENDT Max:20 S2 08 | 14 6 8 | 1 0 1 |
87 JARED D. GERVAIS Max:20 S2 08 | 17 9 8 | 0 0 0 |
88 BRIAN E. LOVEJOY Max:20 S2 08 | 14 7 7 | 0 0 0 |
AB1 JULIE A. SOHLSTROM Max:14 S2 01 | 1 0 1 | 1 0 1 |
AB7 TYLER H. JORGENSEN Max:14 S2 06 | 0 0 0 | 0 0 0 |
Number of Sections: 9 Average Students Per Section: 7.67
GEN400 AMHS CORE SM 1 2800 346| 346 136 210 | 44 19 25 |
02 TORI T. AMMONS Max:22 S2 08 | 8 3 5 | 0 0 0 |
04 ERIC D. ARNOLD Max:22 S2 08 | 15 8 7 | 0 0 0 |
06 VIVIAN G. BAGLIEN Max:22 S2 08 | 2 1 1 | 0 0 0 |
08 LINDA C. SULLIVAN Max:22 S2 08 | 0 0 0 | 0 0 0 |
10 PATRIA R. BAUMSTARK Max:22 S2 08 | 16 4 12 | 0 0 0 |
104 KENT D. RODSETH Max:22 S2 08 | 0 0 0 | 0 0 0 |
106 WAYNE D. RUMBAUGH Max:22 S2 08 | 5 2 3 | 0 0 0 |
109 TYLER H. JORGENSEN Max:22 S2 08 | 0 0 0 | 0 0 0 |
111 ELENA STRIZHEUS Max:15 S2 08 | 9 2 7 | 1 0 1 |
113 VIKTORIYA CHMIL Max:15 S2 08 | 8 0 8 | 1 0 1 |
114 KIRSTEN A. GRAVNING Max:15 S2 08 | 7 3 4 | 1 0 1 |
115 DEREK V. PYLE Max:22 S2 08 | 0 0 0 | 0 0 0 |
12 JULIE A. SOHLSTROM Max:11 S2 08 | 0 0 0 | 0 0 0 |
122 TIMOTHY M. SCOTT Max:22 S2 08 | 2 0 2 | 1 0 1 |
126 KARL F. STEFFIN Max:22 S2 08 | 13 5 8 | 0 0 0 |
130 CORY M. RUTLEDGE Max:22 S2 08 | 6 2 4 | 1 1 0 |
132 LESLIE J. TAUZER Max:22 S2 08 | 2 2 0 | 0 0 0 |
134 JANA D. THOMAS Max:22 S2 08 | 0 0 0 | 0 0 0 |
136 ALICIA J. THOMPSON Max:22 S2 08 | 3 1 2 | 0 0 0 |
138 NORMA I. VEGA COLON Max:22 S2 08 | 0 0 0 | 0 0 0 |
140 GLEN W. WALKER Max:22 S2 08 | 0 0 0 | 0 0 0 |
142 JENNIFER M. CLASSEN Max:22 S2 08 | 7 0 7 | 0 0 0 |
144 DUSTIN DEPIANO Max:22 S2 08 | 11 6 5 | 0 0 0 |
146 DANIEL C. MICKELSON Max:22 S2 08 | 13 5 8 | 1 0 1 |
147 KADY M. VANDERHOOF Max:22 S2 08 | 9 1 8 | 1 0 1 |
16 LEIMOMI M. BOWLES Max:5 S2 08 | 1 0 1 | 0 0 0 |

1sonyr01.p 38-2 AUBURN MOUNTAINVIEW H. S. 03/02/15 Page:9
05.14.10.00.00 Course/Class Count Report 405 3:08 PM
EST NBR NBR ----TOTALS---- --Special Ed--
COURSE DESCRIPTION LGTH SEC AVL REQ TOT FEM MAL TOT FEM MAL
18 RAY S. DALLY Max:22 S2 08 | 22 14 8 | 4 2 2 |
20 JENNIE M. BUETOW Max:22 S2 08 | 13 5 8 | 3 2 1 |
22 STEVEN I. CALHOUN Max:22 S2 08 | 0 0 0 | 0 0 0 |
24 KYE S. CEZENNE Max:22 S2 08 | 3 0 3 | 0 0 0 |
26 LONNIE J. CHAVEZ Max:22 S2 08 | 5 1 4 | 1 1 0 |
28 JANET H. CHU Max:22 S2 08 | 0 0 0 | 0 0 0 |
30 KENNETH N. COLBURN Max:22 S2 08 | 9 4 5 | 2 1 1 |
34 BRADLEY J. COMSTOCK Max:11 S2 08 | 3 2 1 | 3 2 1 |
36 ERIN L. HALL Max:22 S2 08 | 1 0 1 | 0 0 0 |
38 CARY W. DAVIDSON Max:22 S2 08 | 2 1 1 | 0 0 0 |
40 DORIN J. MEINHART Max:5 S2 08 | 0 0 0 | 0 0 0 |
42 PATRICIA E. ECKELMAN Max:22 S2 08 | 5 1 4 | 1 1 0 |
44 KIMBERLY M. STENSON Max:15 S2 08 | 12 6 6 | 0 0 0 |
48 JASON K. SHRADER Max:22 S2 08 | 1 0 1 | 1 0 1 |
50 PAUL H. FOUHY Max:22 S2 08 | 3 2 1 | 0 0 0 |
52 ADAM C. FRANCE Max:22 S2 08 | 7 4 3 | 1 0 1 |
54 KAREN F. CALDWELL Max:22 S2 08 | 0 0 0 | 0 0 0 |
56 TELIA S. PETERSON Max:11 S2 08 | 5 3 2 | 5 3 2 |
58 KAMARIA J. SMITH Max:22 S2 08 | 5 3 2 | 5 3 2 |
62 ROBERT C. MORITZ Max:22 S2 08 | 2 0 2 | 1 0 1 |
64 EVELYN I. HAMMER Max:22 S2 08 | 2 0 2 | 1 0 1 |
66 ROBIN K. HAMMER Max:22 S2 08 | 0 0 0 | 0 0 0 |
68 THERESA A. HAYNES Max:20 S2 08 | 6 3 3 | 0 0 0 |
70 DUSTIN P. HEDGER Max:20 S2 08 | 4 3 1 | 0 0 0 |
72 STEPHANIE E. KEAGLE Max:22 S2 08 | 0 0 0 | 0 0 0 |
74 JAYME L. HOSTETTER Max:22 S2 08 | 8 3 5 | 0 0 0 |
76 KRISTINE A. BROWN Max:22 S2 08 | 6 3 3 | 0 0 0 |
77 JOSEPH J. RUSH Max:22 S2 08 | 1 0 1 | 0 0 0 |
78 JESSICA C. LEE Max:22 S2 08 | 0 0 0 | 0 0 0 |
80 NATHAN R. LEMANSKI Max:22 S2 08 | 10 4 6 | 2 1 1 |
82 ROBERTA J. LOCKE Max:22 S2 08 | 0 0 0 | 0 0 0 |
84 BARBARA E. KNUTH Max:22 S2 08 | 0 0 0 | 0 0 0 |
90 AMY L. MILLS GOLDBERG Max:22 S2 08 | 3 2 1 | 1 1 0 |
92 RICKY R. GANT Max:22 S2 08 | 20 7 13 | 2 0 2 |
94 LEAHMARIE O'BRIEN Max:22 S2 08 | 7 1 6 | 0 0 0 |
96 NORENE L. OSBORNE Max:22 S2 08 | 4 2 2 | 0 0 0 |
98 DAVID A. PRESTON Max:22 S2 08 | 8 5 3 | 1 0 1 |
APX KAREN M. AINSWORTH Max:30 S2 08 | 28 12 16 | 3 1 2 |
SCL KAY M. LORRAIN Max:22 S2 08 | 4 0 4 | 0 0 0 |
Number of Sections: 65 Average Students Per Section: 5.32
GEN501 ADM OFF AIDE SM 3 11 9| 9 3 6 | 0 0 0 |
16 TERRI A. HERREN Max:1 S2 01 | 1 0 1 | 0 0 0 |
26 TERRI A. HERREN Max:1 S2 02 | 1 1 0 | 0 0 0 |
36 TERRI A. HERREN Max:2 S2 03 | 1 0 1 | 0 0 0 |
46 TERRI A. HERREN Max:2 S2 04 | 2 0 2 | 0 0 0 |
56 TERRI A. HERREN Max:2 S2 05 | 2 2 0 | 0 0 0 |
66 TERRI A. HERREN Max:1 S2 06 | 1 0 1 | 0 0 0 |
76 TERRI A. HERREN Max:1 S2 07 | 0 0 0 | 0 0 0 |
96 TERRI A. HERREN Max:1 S2 09 | 1 0 1 | 0 0 0 |
Number of Sections: 8 Average Students Per Section: 1.13
GEN503 ASB AIDE SM 2 10 2| 2 1 1 | 0 0 0 |
66 CHRISTOPHER J. CARR Max:1 S2 06 | 1 0 1 | 0 0 0 |
76 JANA D. THOMAS Max:1 S2 07 | 1 1 0 | 0 0 0 |
Number of Sections: 2 Average Students Per Section: 1.00
GEN508 ATTEND AIDE SM 5 17 14| 14 8 6 | 2 1 1 |
16 THOMAS A. OSTRANDER Max:2 S2 01 | 2 1 1 | 0 0 0 |

1sonyr01.p 38-2 AUBURN MOUNTAINVIEW H. S. 03/02/15 Page:10
05.14.10.00.00 Course/Class Count Report 405 3:08 PM
EST NBR NBR ----TOTALS---- --Special Ed--
COURSE DESCRIPTION LGTH SEC AVL REQ TOT FEM MAL TOT FEM MAL
26 THOMAS A. OSTRANDER Max:2 S2 02 | 2 2 0 | 0 0 0 |
36 THOMAS A. OSTRANDER Max:2 S2 03 | 2 1 1 | 0 0 0 |
46 THOMAS A. OSTRANDER Max:3 S2 04 | 3 1 2 | 1 0 1 |
56 THOMAS A. OSTRANDER Max:2 S2 05 | 2 0 2 | 0 0 0 |
66 THOMAS A. OSTRANDER Max:2 S2 06 | 2 2 0 | 1 1 0 |
76 THOMAS A. OSTRANDER Max:2 S2 07 | 1 1 0 | 0 0 0 |
96 THOMAS A. OSTRANDER Max:2 S2 09 | 0 0 0 | 0 0 0 |
Number of Sections: 8 Average Students Per Section: 1.75
GEN510 CAREER AIDE SM 1 3 3| 3 2 1 | 0 0 0 |
16 AMANDA L. PAULSON Max:0 S2 01 | 0 0 0 | 0 0 0 |
26 AMANDA L. PAULSON Max:1 S2 02 | 1 1 0 | 0 0 0 |
36 AMANDA L. PAULSON Max:0 S2 03 | 0 0 0 | 0 0 0 |
46 AMANDA L. PAULSON Max:0 S2 04 | 0 0 0 | 0 0 0 |
56 AMANDA L. PAULSON Max:2 S2 05 | 2 1 1 | 0 0 0 |
66 AMANDA L. PAULSON Max:0 S2 06 | 0 0 0 | 0 0 0 |
Number of Sections: 6 Average Students Per Section: 0.50
GEN511 GUID OFF AIDE SM 10 23 1| 1 1 0 | 0 0 0 |
76 KAREN M. AINSWORTH Max:2 S2 07 | 1 1 0 | 0 0 0 |
Number of Sections: 1 Average Students Per Section: 1.00
GEN512 GUID OFF AIDE SM 7 16 16| 16 11 5 | 0 0 0 |
16 KAREN M. AINSWORTH Max:2 S2 01 | 2 2 0 | 0 0 0 |
26 KAREN M. AINSWORTH Max:2 S2 02 | 2 2 0 | 0 0 0 |
36 KAREN M. AINSWORTH Max:3 S2 03 | 3 2 1 | 0 0 0 |
46 KAREN M. AINSWORTH Max:3 S2 04 | 3 2 1 | 0 0 0 |
56 KAREN M. AINSWORTH Max:2 S2 05 | 2 0 2 | 0 0 0 |
66 KAREN M. AINSWORTH Max:2 S2 06 | 2 2 0 | 0 0 0 |
96 KAREN M. AINSWORTH Max:2 S2 09 | 2 1 1 | 0 0 0 |
Number of Sections: 7 Average Students Per Section: 2.29
GEN514 LIBRARY AIDE SM 1 5 5| 5 3 2 | 2 1 1 |
16 STEPHANIE R. AUSTIN Max:0 S2 01 | 0 0 0 | 0 0 0 |
26 STEPHANIE R. AUSTIN Max:1 S2 02 | 1 0 1 | 1 0 1 |
36 STEPHANIE R. AUSTIN Max:0 S2 03 | 0 0 0 | 0 0 0 |
46 STEPHANIE R. AUSTIN Max:1 S2 04 | 1 1 0 | 0 0 0 |
56 STEPHANIE R. AUSTIN Max:0 S2 05 | 0 0 0 | 0 0 0 |
66 STEPHANIE R. AUSTIN Max:2 S2 06 | 2 2 0 | 1 1 0 |
96 STEPHANIE R. AUSTIN Max:1 S2 09 | 1 0 1 | 0 0 0 |
Number of Sections: 7 Average Students Per Section: 0.71
GEN600 TEACHER AIDE SM 3 60 1| 1 1 0 | 0 0 0 |
6F6 PAUL H. FOUHY Max:1 S2 06 | 1 1 0 | 0 0 0 |
6G2 KIRSTEN A. GRAVNING Max:1 S2 06 | 0 0 0 | 0 0 0 |
Number of Sections: 2 Average Students Per Section: 0.50
GEN601 TEACHER AIDE SM 2 56 41| 41 28 13 | 3 0 3 |
12 KAY M. LORRAIN Max:1 S2 01 | 1 0 1 | 1 0 1 |
16 TORI T. AMMONS Max:1 S2 01 | 1 0 1 | 1 0 1 |
17 JAYME L. HOSTETTER Max:1 S2 01 | 1 1 0 | 0 0 0 |
18 EVELYN I. HAMMER Max:1 S2 01 | 1 1 0 | 0 0 0 |
19 PAUL H. FOUHY Max:1 S2 01 | 1 1 0 | 0 0 0 |
1C KYE S. CEZENNE Max:1 S2 01 | 1 1 0 | 0 0 0 |
1S LINDA C. SULLIVAN Max:1 S2 01 | 1 1 0 | 0 0 0 |
20 JESSICA C. LEE Max:2 S2 02 | 0 0 0 | 0 0 0 |
21 NORMA I. VEGA COLON Max:1 S2 02 | 0 0 0 | 0 0 0 |
22 JENNIE M. BUETOW Max:1 S2 02 | 1 1 0 | 0 0 0 |
23 LINDA C. SULLIVAN Max:1 S2 02 | 1 1 0 | 0 0 0 |
27 LEIMOMI M. BOWLES Max:1 S2 02 | 1 1 0 | 0 0 0 |
28 STEVEN I. CALHOUN Max:1 S2 02 | 1 1 0 | 0 0 0 |
2B JENNIE M. BUETOW Max:1 S2 01 | 1 1 0 | 0 0 0 |

1sonyr01.p 38-2 AUBURN MOUNTAINVIEW H. S. 03/02/15 Page:11
05.14.10.00.00 Course/Class Count Report 405 3:08 PM
EST NBR NBR ----TOTALS---- --Special Ed--
COURSE DESCRIPTION LGTH SEC AVL REQ TOT FEM MAL TOT FEM MAL
2D DUSTIN DEPIANO Max:1 S2 02 | 1 1 0 | 0 0 0 |
2G KIRSTEN A. GRAVNING Max:2 S2 02 | 2 2 0 | 0 0 0 |
2L LONNIE J. CHAVEZ Max:1 S2 02 | 1 1 0 | 0 0 0 |
2M ROBERT C. MORITZ Max:1 S2 02 | 1 0 1 | 0 0 0 |
2T LESLIE J. TAUZER Max:1 S2 02 | 1 0 1 | 0 0 0 |
31 DEREK E. ENZ Max:1 S2 03 | 1 1 0 | 0 0 0 |
32 KENT D. RODSETH Max:2 S2 03 | 2 0 2 | 0 0 0 |
33 DUSTIN P. HEDGER Max:1 S2 03 | 1 1 0 | 0 0 0 |
34 HEIDI K. BENDT Max:1 S2 03 | 0 0 0 | 0 0 0 |
35 LINDA C. SULLIVAN Max:1 S2 03 | 0 0 0 | 0 0 0 |
41 JAYME L. HOSTETTER Max:1 S2 04 | 1 0 1 | 0 0 0 |
42 KIRSTEN A. GRAVNING Max:1 S2 04 | 1 0 1 | 0 0 0 |
43 DEREK E. ENZ Max:1 S2 04 | 0 0 0 | 0 0 0 |
44 VIKTORIYA CHMIL Max:1 S2 04 | 1 0 1 | 0 0 0 |
45 JENNIE M. BUETOW Max:1 S2 04 | 1 1 0 | 0 0 0 |
47 TORI T. AMMONS Max:1 S2 04 | 0 0 0 | 0 0 0 |
4H ERIN L. HALL Max:1 S2 04 | 1 0 1 | 0 0 0 |
51 EVELYN I. HAMMER Max:1 S2 06 | 0 0 0 | 0 0 0 |
52 STEVEN I. CALHOUN Max:1 S2 05 | 1 1 0 | 0 0 0 |
53 PAUL H. FOUHY Max:1 S2 05 | 0 0 0 | 0 0 0 |
54 KARL F. STEFFIN Max:1 S2 05 | 0 0 0 | 0 0 0 |
55 KIRSTEN A. GRAVNING Max:1 S2 05 | 0 0 0 | 0 0 0 |
56 DEREK E. ENZ Max:1 S2 05 | 1 1 0 | 0 0 0 |
57 TORI T. AMMONS Max:1 S2 05 | 0 0 0 | 0 0 0 |
58 PAUL H. FOUHY Max:1 S2 05 | 1 1 0 | 0 0 0 |
5B HEIDI K. BENDT Max:1 S2 05 | 1 1 0 | 0 0 0 |
5G REGINA K. GRUBB Max:1 S2 05 | 1 0 1 | 0 0 0 |
5H ERIN L. HALL Max:1 S2 05 | 0 0 0 | 0 0 0 |
5L JESSICA C. LEE Max:1 S2 05 | 1 1 0 | 0 0 0 |
5V NORMA I. VEGA COLON Max:1 S2 05 | 0 0 0 | 0 0 0 |
64 GLEN W. WALKER Max:1 S2 06 | 1 1 0 | 0 0 0 |
65 PAUL H. FOUHY Max:1 S2 06 | 1 1 0 | 0 0 0 |
66 NORMA I. VEGA COLON Max:1 S2 06 | 1 1 0 | 0 0 0 |
66W GLEN W. WALKER Max:1 S2 06 | 1 0 1 | 1 0 1 |
67 DUSTIN DEPIANO Max:1 S2 06 | 1 1 0 | 0 0 0 |
68 BRIAN E. LOVEJOY Max:1 S2 06 | 1 1 0 | 0 0 0 |
6E DEREK E. ENZ Max:1 S2 06 | 1 1 0 | 0 0 0 |
6F PAUL H. FOUHY Max:1 S2 06 | 1 0 1 | 0 0 0 |
Number of Sections: 52 Average Students Per Section: 0.79
GEN700 RELEASE TIME SM 5 720 274| 274 93 181 | 23 11 12 |
16 TERRI A. HERREN Max:60 S2 01 | 41 16 25 | 3 1 2 |
26 TERRI A. HERREN Max:60 S2 02 | 48 14 34 | 3 1 2 |
36 TERRI A. HERREN Max:60 S2 03 | 48 15 33 | 4 2 2 |
46 TERRI A. HERREN Max:60 S2 04 | 46 12 34 | 4 2 2 |
56 TERRI A. HERREN Max:60 S2 05 | 41 12 29 | 6 3 3 |
66 TERRI A. HERREN Max:60 S2 06 | 50 24 26 | 3 2 1 |
Number of Sections: 6 Average Students Per Section: 45.67
GEN701 REL-SEMINARY YR 2 120 26| 26 12 14 | 0 0 0 |
11 TERRI A. HERREN Max:30 YR 01 | 19 8 11 | 0 0 0 |
41 TERRI A. HERREN Max:30 YR 04 | 0 0 0 | 0 0 0 |
61 TERRI A. HERREN Max:30 YR 06 | 7 4 3 | 0 0 0 |
91 TERRI A. HERREN Max:30 YR 09 | 0 0 0 | 0 0 0 |
Number of Sections: 4 Average Students Per Section: 6.50
GEN705 COACH MONITOR YR 1 500 178| 178 0 178 | 7 0 7 |
BB GLEN W. WALKER Max:50 YR 07 | 45 0 45 | 2 0 2 |
FB JARED D. GERVAIS Max:150 YR 00 | 109 0 109 | 5 0 5 |

1sonyr01.p 38-2 AUBURN MOUNTAINVIEW H. S. 03/02/15 Page:12
05.14.10.00.00 Course/Class Count Report 405 3:08 PM
EST NBR NBR ----TOTALS---- --Special Ed--
COURSE DESCRIPTION LGTH SEC AVL REQ TOT FEM MAL TOT FEM MAL
SOC <None> Max:50 YR 07 | 0 0 0 | 0 0 0 |
SOF ALICIA J. THOMPSON Max:50 YR 07 | 0 0 0 | 0 0 0 |
TEN KAY M. LORRAIN Max:50 YR 07 | 0 0 0 | 0 0 0 |
TJV KAY M. LORRAIN Max:50 YR 00 | 16 0 16 | 0 0 0 |
TNB DUSTIN P. HEDGER Max:50 YR 00 | 8 0 8 | 0 0 0 |
VB TELIA S. PETERSON Max:50 YR 00 | 0 0 0 | 0 0 0 |
Number of Sections: 8 Average Students Per Section: 22.25
GEN706 C L MONITORING YR 1 160 0| 0 0 0 | 0 0 0 |
71 <None> Max:35 YR 07 | 0 0 0 | 0 0 0 |
72 <None> Max:35 YR 07 | 0 0 0 | 0 0 0 |
73 <None> Max:30 YR 07 | 0 0 0 | 0 0 0 |
Number of Sections: 3 Average Students Per Section: 0.00
GEN708 APEX SM 1 85 9| 9 2 7 | 2 0 2 |
36 DEREK V. PYLE Max:30 S2 03 | 9 2 7 | 2 0 2 |
Number of Sections: 1 Average Students Per Section: 9.00
GEN710 RUNNING START SM 24 1600 703| 703 430 273 | 5 5 0 |
16 KAREN M. AINSWORTH Max:130 S2 01 | 111 69 42 | 0 0 0 |
26 KAREN M. AINSWORTH Max:140 S2 02 | 134 85 49 | 1 1 0 |
36 KAREN M. AINSWORTH Max:130 S2 03 | 125 77 48 | 1 1 0 |
46 KAREN M. AINSWORTH Max:130 S2 04 | 119 71 48 | 1 1 0 |
56 KAREN M. AINSWORTH Max:120 S2 05 | 112 67 45 | 1 1 0 |
66 KAREN M. AINSWORTH Max:120 S2 06 | 102 61 41 | 1 1 0 |
Number of Sections: 6 Average Students Per Section: 117.1
GEN805 LEADERSHIP SM 2 60 29| 29 14 15 | 4 2 2 |
16 JANA D. THOMAS Max:30 S2 01 | 29 14 15 | 4 2 2 |
Number of Sections: 1 Average Students Per Section: 29.00
GEN806 ADV LEADERSHIP SM 1 60 20| 20 11 9 | 0 0 0 |
26 JANA D. THOMAS Max:30 S2 02 | 20 11 9 | 0 0 0 |
Number of Sections: 1 Average Students Per Section: 20.00
GEN809 SERV LEARN SM 1 30 28| 28 24 4 | 0 0 0 |
66 JENNIE M. BUETOW Max:30 S2 06 | 28 24 4 | 0 0 0 |
Number of Sections: 1 Average Students Per Section: 28.00
GEN814 AHS AUTO TECH YR 1 40 8| 8 1 7 | 1 0 1 |
11 STEVEN R. DUBAY Max:10 YR 01 | 4 1 3 | 1 0 1 |
51 STEVEN R. DUBAY Max:30 YR 05 | 4 0 4 | 0 0 0 |
Number of Sections: 2 Average Students Per Section: 4.00
GEN815 AHS ADV AUTOTEC YR 1 30 0| 0 0 0 | 0 0 0 |
04 STEVEN R. DUBAY Max:30 YR 04 | 0 0 0 | 0 0 0 |
Number of Sections: 1 Average Students Per Section: 0.00
GEN816 AHS WELDING YR 2 8 2| 2 0 2 | 0 0 0 |
11 STEVEN R. DUBAY Max:2 YR 01 | 1 0 1 | 0 0 0 |
21 STEVEN R. DUBAY Max:2 YR 02 | 1 0 1 | 0 0 0 |
31 STEVEN R. DUBAY Max:4 YR 03 | 0 0 0 | 0 0 0 |
Number of Sections: 3 Average Students Per Section: 0.67
GEN817 AHS MACH TRNG YR 1 30 0| 0 0 0 | 0 0 0 |
01 STEVEN R. DUBAY Max:30 YR 01 | 0 0 0 | 0 0 0 |
Number of Sections: 1 Average Students Per Section: 0.00
GEN820 AHS STUDENT YR 1 60 7| 7 2 5 | 1 0 1 |
11 STEVEN R. DUBAY Max:30 YR 01 | 4 2 2 | 1 0 1 |
61 STEVEN R. DUBAY Max:30 YR 06 | 3 0 3 | 0 0 0 |
Number of Sections: 2 Average Students Per Section: 3.50
GEN822 ARHS STUDENT YR 1 60 9| 9 1 8 | 1 0 1 |
11 STEVEN R. DUBAY Max:30 YR 01 | 0 0 0 | 0 0 0 |
61 STEVEN R. DUBAY Max:30 YR 06 | 9 1 8 | 1 0 1 |
Number of Sections: 2 Average Students Per Section: 4.50
GEN823 WAHS STUDENT YR 1 10 3| 3 0 3 | 0 0 0 |

1sonyr01.p 38-2 AUBURN MOUNTAINVIEW H. S. 03/02/15 Page:13
05.14.10.00.00 Course/Class Count Report 405 3:08 PM
EST NBR NBR ----TOTALS---- --Special Ed--
COURSE DESCRIPTION LGTH SEC AVL REQ TOT FEM MAL TOT FEM MAL
11 MONTE F. ECKELMAN Max:10 YR 01 | 3 0 3 | 0 0 0 |
Number of Sections: 1 Average Students Per Section: 3.00
GEN825 HOME SCHOOL YR 1 180 45| 45 19 26 | 1 1 0 |
11 TERRI A. HERREN Max:30 YR 01 | 21 10 11 | 0 0 0 |
21 TERRI A. HERREN Max:30 YR 02 | 4 2 2 | 0 0 0 |
31 TERRI A. HERREN Max:30 YR 03 | 4 2 2 | 0 0 0 |
41 TERRI A. HERREN Max:30 YR 04 | 3 1 2 | 0 0 0 |
51 TERRI A. HERREN Max:30 YR 05 | 3 1 2 | 0 0 0 |
61 TERRI A. HERREN Max:30 YR 06 | 10 3 7 | 1 1 0 |
Number of Sections: 6 Average Students Per Section: 7.50
GEN826 OUT OF DIST STU SM 1 8 0| 0 0 0 | 0 0 0 |
16 <None> Max:2 S2 01 | 0 0 0 | 0 0 0 |
66 <None> Max:2 S2 06 | 0 0 0 | 0 0 0 |
Number of Sections: 2 Average Students Per Section: 0.00
GEN827 AHS SM GAS ENG SM 1 2 0| 0 0 0 | 0 0 0 |
36 STEVEN R. DUBAY Max:1 S2 03 | 0 0 0 | 0 0 0 |
Number of Sections: 1 Average Students Per Section: 0.00
GEN832 AHS SWIMMING SM 1 17 1| 1 1 0 | 0 0 0 |
96 STEVEN R. DUBAY Max:8 S2 09 | 1 1 0 | 0 0 0 |
Number of Sections: 1 Average Students Per Section: 1.00
HLT100 HEALTH SM 12 330 147| 147 77 70 | 5 3 2 |
16 THERESA A. HAYNES Max:30 S2 01 | 30 16 14 | 0 0 0 |
36 THERESA A. HAYNES Max:30 S2 03 | 26 13 13 | 3 1 2 |
46 THERESA A. HAYNES Max:30 S2 04 | 31 17 14 | 0 0 0 |
56 THERESA A. HAYNES Max:30 S2 05 | 30 15 15 | 2 2 0 |
66 THERESA A. HAYNES Max:30 S2 06 | 30 16 14 | 0 0 0 |
Number of Sections: 5 Average Students Per Section: 29.40
LAN102 LA 9 INTERVEN 2 SM 1 18 14| 14 6 8 | 1 0 1 |
LD6 HEIDI K. BENDT Max:18 S2 06 | 14 6 8 | 1 0 1 |
Number of Sections: 1 Average Students Per Section: 14.00
LAN118 THEATRE HIST SM 1 30 29| 29 7 22 | 1 0 1 |
36 PAUL H. FOUHY Max:30 S2 03 | 29 7 22 | 1 0 1 |
Number of Sections: 1 Average Students Per Section: 29.00
LAN121 LA 9 2 SM 8 230 217| 217 99 118 | 4 1 3 |
22 KIMBERLY M. STENSON Max:30 S2 02 | 28 10 18 | 0 0 0 |
32 KIMBERLY M. STENSON Max:30 S2 03 | 30 16 14 | 2 0 2 |
41 KIMBERLY M. STENSON Max:30 S2 04 | 30 11 19 | 0 0 0 |
51 KIMBERLY M. STENSON Max:30 S2 05 | 30 17 13 | 0 0 0 |
61 ADAM C. FRANCE Max:30 S2 06 | 27 10 17 | 1 1 0 |
62 KIMBERLY M. STENSON Max:30 S2 06 | 27 13 14 | 0 0 0 |
LD1 HEIDI K. BENDT Max:50 S2 01 | 45 22 23 | 1 0 1 |
Number of Sections: 7 Average Students Per Section: 31.00
LAN131 LA 9 HONORS 2 SM 5 150 135| 135 92 43 | 0 0 0 |
11 JANET H. CHU Max:30 S2 01 | 24 16 8 | 0 0 0 |
21 JANET H. CHU Max:30 S2 02 | 30 23 7 | 0 0 0 |
22 NATHAN R. LEMANSKI Max:30 S2 02 | 30 18 12 | 0 0 0 |
31 NATHAN R. LEMANSKI Max:30 S2 03 | 26 18 8 | 0 0 0 |
61 NATHAN R. LEMANSKI Max:30 S2 06 | 25 17 8 | 0 0 0 |
Number of Sections: 5 Average Students Per Section: 27.00
LAN221 LA 10 2 SM 9 210 186| 186 74 112 | 9 4 5 |
11 KADY M. VANDERHOOF Max:30 S2 01 | 28 11 17 | 0 0 0 |
21 KADY M. VANDERHOOF Max:30 S2 02 | 23 9 14 | 2 1 1 |
31 KADY M. VANDERHOOF Max:30 S2 03 | 23 10 13 | 0 0 0 |
41 NATHAN R. LEMANSKI Max:30 S2 04 | 28 12 16 | 2 1 1 |
42 KRISTINE A. BROWN Max:30 S2 04 | 25 10 15 | 2 1 1 |
51 NATHAN R. LEMANSKI Max:30 S2 05 | 29 12 17 | 3 1 2 |

1sonyr01.p 38-2 AUBURN MOUNTAINVIEW H. S. 03/02/15 Page:14
05.14.10.00.00 Course/Class Count Report 405 3:08 PM
EST NBR NBR ----TOTALS---- --Special Ed--
COURSE DESCRIPTION LGTH SEC AVL REQ TOT FEM MAL TOT FEM MAL
61 KADY M. VANDERHOOF Max:30 S2 06 | 30 10 20 | 0 0 0 |
Number of Sections: 7 Average Students Per Section: 26.57
LAN231 LA 10 HONORS 2 SM 5 150 148| 148 92 56 | 1 0 1 |
11 EVELYN I. HAMMER Max:30 S2 01 | 30 22 8 | 0 0 0 |
21 EVELYN I. HAMMER Max:30 S2 02 | 29 15 14 | 0 0 0 |
41 ELENA STRIZHEUS Max:30 S2 04 | 29 17 12 | 0 0 0 |
51 ELENA STRIZHEUS Max:30 S2 05 | 30 16 14 | 1 0 1 |
52 EVELYN I. HAMMER Max:30 S2 05 | 30 22 8 | 0 0 0 |
Number of Sections: 5 Average Students Per Section: 29.60
LAN302 LA INTERVEN 2 SM 1 20 6| 6 1 5 | 0 0 0 |
36 EVELYN I. HAMMER Max:20 S2 03 | 6 1 5 | 0 0 0 |
Number of Sections: 1 Average Students Per Section: 6.00
LAN321 AMER LIT 2 SM 9 213 192| 192 73 119 | 8 2 6 |
11 ELENA STRIZHEUS Max:27 S2 01 | 22 8 14 | 0 0 0 |
12 ADAM C. FRANCE Max:27 S2 01 | 17 7 10 | 1 1 0 |
21 ADAM C. FRANCE Max:27 S2 02 | 27 10 17 | 0 0 0 |
31 ELENA STRIZHEUS Max:27 S2 03 | 24 12 12 | 0 0 0 |
41 ADAM C. FRANCE Max:27 S2 04 | 26 6 20 | 1 0 1 |
51 ADAM C. FRANCE Max:27 S2 05 | 26 10 16 | 1 0 1 |
61 ELENA STRIZHEUS Max:27 S2 06 | 26 13 13 | 3 1 2 |
B12 PAUL H. FOUHY Max:24 S2 01 | 24 7 17 | 2 0 2 |
Number of Sections: 8 Average Students Per Section: 24.00
LAN331 AP LAN/COMP 2 SM 5 90 72| 72 43 29 | 0 0 0 |
31 KRISTINE A. BROWN Max:30 S2 03 | 29 13 16 | 0 0 0 |
51 KRISTINE A. BROWN Max:30 S2 05 | 28 20 8 | 0 0 0 |
61 KRISTINE A. BROWN Max:30 S2 06 | 15 10 5 | 0 0 0 |
Number of Sections: 3 Average Students Per Section: 24.00
LAN410 COMMUN ARTS SM 2 60 29| 29 11 18 | 2 0 2 |
26 PAUL H. FOUHY Max:30 S2 02 | 29 11 18 | 2 0 2 |
Number of Sections: 1 Average Students Per Section: 29.00
LAN412 SOC OF FUTURE SM 1 120 50| 50 19 31 | 0 0 0 |
36 STEPHANIE E. KEAGLE Max:30 S2 03 | 25 11 14 | 0 0 0 |
56 STEPHANIE E. KEAGLE Max:30 S2 05 | 25 8 17 | 0 0 0 |
Number of Sections: 2 Average Students Per Section: 25.00
LAN413 INDIV LIT 1 SM 2 31 14| 14 8 6 | 1 1 0 |
36 ROBIN K. HAMMER Max:30 S2 03 | 13 8 5 | 1 1 0 |
56 STEPHANIE E. KEAGLE Max:1 S2 05 | 1 0 1 | 0 0 0 |
Number of Sections: 2 Average Students Per Section: 7.00
LAN416 CREATIVE WRIT SM 2 50 46| 46 23 23 | 0 0 0 |
16 STEPHANIE E. KEAGLE Max:25 S2 01 | 22 13 9 | 0 0 0 |
26 STEPHANIE E. KEAGLE Max:25 S2 02 | 24 10 14 | 0 0 0 |
Number of Sections: 2 Average Students Per Section: 23.00
LAN418 POETRY SM 4 60 30| 30 13 17 | 0 0 0 |
66 EVELYN I. HAMMER Max:30 S2 06 | 30 13 17 | 0 0 0 |
Number of Sections: 1 Average Students Per Section: 30.00
LAN431 AP LIT/COMP 2 SM 4 120 95| 95 50 45 | 1 1 0 |
11 ROBIN K. HAMMER Max:30 S2 01 | 22 14 8 | 0 0 0 |
21 ROBIN K. HAMMER Max:30 S2 02 | 24 18 6 | 1 1 0 |
31 JANET H. CHU Max:30 S2 03 | 24 10 14 | 0 0 0 |
41 JANET H. CHU Max:30 S2 04 | 25 8 17 | 0 0 0 |
Number of Sections: 4 Average Students Per Section: 23.75
LAN512 YEARBOOK 2 SM 1 30 22| 22 13 9 | 1 0 1 |
61 STEPHANIE E. KEAGLE Max:30 S2 06 | 22 13 9 | 1 0 1 |
Number of Sections: 1 Average Students Per Section: 22.00
LAN515 NEWSPAPER 2 SM 1 30 30| 30 17 13 | 0 0 0 |
46 KADY M. VANDERHOOF Max:30 S2 04 | 30 17 13 | 0 0 0 |

1sonyr01.p 38-2 AUBURN MOUNTAINVIEW H. S. 03/02/15 Page:15
05.14.10.00.00 Course/Class Count Report 405 3:08 PM
EST NBR NBR ----TOTALS---- --Special Ed--
COURSE DESCRIPTION LGTH SEC AVL REQ TOT FEM MAL TOT FEM MAL
Number of Sections: 1 Average Students Per Section: 30.00
MAT101 MATH INTERVTN 2 SM 2 54 42| 42 18 24 | 5 4 1 |
G11 DANIEL C. MICKELSON Max:24 S2 07 | 20 10 10 | 1 1 0 |
L10 LEAHMARIE O'BRIEN Max:15 S2 03 | 11 5 6 | 2 2 0 |
LP9 LEAHMARIE O'BRIEN Max:15 S2 04 | 11 3 8 | 2 1 1 |
Number of Sections: 3 Average Students Per Section: 14.00
MAT111 FOUND ALG/GEO 2 SM 2 91 78| 78 33 45 | 5 1 4 |
21 RICKY R. GANT Max:20 S2 02 | 13 6 7 | 2 0 2 |
51 RICKY R. GANT Max:21 S2 05 | 20 5 15 | 2 1 1 |
LD3 BRIAN E. LOVEJOY Max:50 S2 03 | 45 22 23 | 1 0 1 |
Number of Sections: 3 Average Students Per Section: 26.00
MAT113 FOUND ALG/GEO 4 SM 1 0 0| 0 0 0 | 0 0 0 |
21 ALICIA J. THOMPSON Max:0 S2 02 | 0 0 0 | 0 0 0 |
Number of Sections: 1 Average Students Per Section: 0.00
MAT120 ALGEBRA 1 SM 8 215 9| 9 3 6 | 1 0 1 |
F21 JENNIFER M. CLASSEN Max:20 S2 02 | 9 3 6 | 1 0 1 |
Number of Sections: 1 Average Students Per Section: 9.00
MAT121 ALGEBRA 2 SM 9 242 185| 185 99 86 | 8 5 3 |
21 LESLIE J. TAUZER Max:30 S2 02 | 30 20 10 | 2 1 1 |
31 VIKTORIYA CHMIL Max:23 S2 03 | 23 12 11 | 0 0 0 |
32 DAVID A. PRESTON Max:23 S2 03 | 21 13 8 | 0 0 0 |
33 JENNIFER M. CLASSEN Max:20 S2 03 | 11 2 9 | 0 0 0 |
41 VIKTORIYA CHMIL Max:30 S2 04 | 30 15 15 | 1 1 0 |
51 DAVID A. PRESTON Max:30 S2 05 | 30 15 15 | 1 0 1 |
61 DAVID A. PRESTON Max:30 S2 06 | 25 15 10 | 0 0 0 |
FD4 ALICIA J. THOMPSON Max:16 S2 02 | 15 7 8 | 4 3 1 |
Number of Sections: 8 Average Students Per Section: 23.13
MAT123 ADV HS MATH 2 SM 1 60 30| 30 13 17 | 0 0 0 |
21 LEAHMARIE O'BRIEN Max:20 S2 02 | 9 4 5 | 0 0 0 |
51 LEAHMARIE O'BRIEN Max:20 S2 05 | 12 8 4 | 0 0 0 |
61 LEAHMARIE O'BRIEN Max:20 S2 06 | 9 1 8 | 0 0 0 |
Number of Sections: 3 Average Students Per Section: 10.00
MAT210 GEOMETRY 1 SM 13 360 45| 45 20 25 | 2 0 2 |
F21 JULIANNE R. STRICHERZ Max:20 S2 02 | 16 5 11 | 1 0 1 |
F31 JULIANNE R. STRICHERZ Max:20 S2 03 | 14 7 7 | 1 0 1 |
F41 DANIEL C. MICKELSON Max:20 S2 04 | 15 8 7 | 0 0 0 |
Number of Sections: 3 Average Students Per Section: 15.00
MAT211 GEOMETRY 2 SM 15 357 256| 256 127 129 | 8 2 6 |
11 DANIEL C. MICKELSON Max:30 S2 01 | 27 11 16 | 2 1 1 |
21 DANIEL C. MICKELSON Max:29 S2 02 | 29 12 17 | 2 0 2 |
22 WAYNE D. RUMBAUGH Max:30 S2 02 | 23 13 10 | 0 0 0 |
31 DANIEL C. MICKELSON Max:29 S2 03 | 26 16 10 | 3 1 2 |
32 RICKY R. GANT Max:30 S2 03 | 19 7 12 | 0 0 0 |
41 JENNIFER M. CLASSEN Max:28 S2 04 | 23 12 11 | 0 0 0 |
42 RICKY R. GANT Max:30 S2 04 | 30 17 13 | 0 0 0 |
51 JENNIFER M. CLASSEN Max:30 S2 05 | 28 14 14 | 0 0 0 |
61 VIKTORIYA CHMIL Max:30 S2 06 | 29 14 15 | 1 0 1 |
62 RICKY R. GANT Max:30 S2 06 | 22 11 11 | 0 0 0 |
Number of Sections: 10 Average Students Per Section: 25.60
MAT311 ADV ALG/TRIG 2 SM 12 270 278| 278 146 132 | 5 2 3 |
11 KIRSTEN A. GRAVNING Max:30 S2 01 | 31 15 16 | 1 0 1 |
12 ALICIA J. THOMPSON Max:30 S2 01 | 31 24 7 | 0 0 0 |
13 VIKTORIYA CHMIL Max:30 S2 01 | 29 16 13 | 0 0 0 |
31 ALICIA J. THOMPSON Max:30 S2 03 | 30 14 16 | 0 0 0 |
41 KIRSTEN A. GRAVNING Max:30 S2 04 | 32 14 18 | 0 0 0 |
42 JULIANNE R. STRICHERZ Max:30 S2 04 | 30 23 7 | 0 0 0 |

1sonyr01.p 38-2 AUBURN MOUNTAINVIEW H. S. 03/02/15 Page:16
05.14.10.00.00 Course/Class Count Report 405 3:08 PM
EST NBR NBR ----TOTALS---- --Special Ed--
COURSE DESCRIPTION LGTH SEC AVL REQ TOT FEM MAL TOT FEM MAL
51 JULIANNE R. STRICHERZ Max:30 S2 05 | 29 11 18 | 0 0 0 |
52 VIKTORIYA CHMIL Max:30 S2 05 | 31 15 16 | 0 0 0 |
61 DANIEL C. MICKELSON Max:30 S2 06 | 35 14 21 | 4 2 2 |
Number of Sections: 9 Average Students Per Section: 30.89
MAT411 BYND ADV ALG 2 SM 2 30 28| 28 10 18 | 0 0 0 |
11 JULIANNE R. STRICHERZ Max:30 S2 01 | 28 10 18 | 0 0 0 |
Number of Sections: 1 Average Students Per Section: 28.00
MAT413 PRE CALCULUS 2 SM 8 150 133| 133 69 64 | 0 0 0 |
11 DAVID A. PRESTON Max:30 S2 01 | 23 10 13 | 0 0 0 |
21 DAVID A. PRESTON Max:30 S2 02 | 24 10 14 | 0 0 0 |
31 LESLIE J. TAUZER Max:30 S2 03 | 28 19 9 | 0 0 0 |
41 LESLIE J. TAUZER Max:30 S2 04 | 29 15 14 | 0 0 0 |
61 LESLIE J. TAUZER Max:30 S2 06 | 29 15 14 | 0 0 0 |
Number of Sections: 5 Average Students Per Section: 26.60
MAT415 AP CALCULUS 2 SM 3 60 36| 36 15 21 | 0 0 0 |
51 KIRSTEN A. GRAVNING Max:30 S2 05 | 16 8 8 | 0 0 0 |
61 KIRSTEN A. GRAVNING Max:30 S2 06 | 20 7 13 | 0 0 0 |
Number of Sections: 2 Average Students Per Section: 18.00
MAT417 AP STATS 2 SM 1 60 50| 50 27 23 | 0 0 0 |
41 BRIAN E. LOVEJOY Max:30 S2 04 | 27 17 10 | 0 0 0 |
61 BRIAN E. LOVEJOY Max:30 S2 06 | 23 10 13 | 0 0 0 |
Number of Sections: 2 Average Students Per Section: 25.00
MAT419 AP CALC BC 2 SM 1 30 25| 25 7 18 | 0 0 0 |
21 KIRSTEN A. GRAVNING Max:30 S2 02 | 25 7 18 | 0 0 0 |
Number of Sections: 1 Average Students Per Section: 25.00
MAT421 AP COMPTR SCI 2 SM 1 24 24| 24 11 13 | 0 0 0 |
91 KIRSTEN A. GRAVNING Max:24 S2 09 | 24 11 13 | 0 0 0 |
Number of Sections: 1 Average Students Per Section: 24.00
MAT430 COMPUTER SCI 1 SM 1 66 23| 23 8 15 | 1 0 1 |
66 JENNIFER M. CLASSEN Max:30 S2 06 | 23 8 15 | 1 0 1 |
Number of Sections: 1 Average Students Per Section: 23.00
MAT431 COMPUTER SCI 2 SM 1 9 9| 9 1 8 | 0 0 0 |
66 JENNIFER M. CLASSEN Max:3 S2 06 | 3 1 2 | 0 0 0 |
91 KIRSTEN A. GRAVNING Max:6 S2 09 | 6 0 6 | 0 0 0 |
Number of Sections: 2 Average Students Per Section: 4.50
MUS106 CONCERT BAND SM 1 30 24| 24 7 17 | 0 0 0 |
21 DEREK V. PYLE Max:30 S2 02 | 24 7 17 | 0 0 0 |
Number of Sections: 1 Average Students Per Section: 24.00
MUS116 WIND ENSEMBLE SM 1 40 32| 32 15 17 | 3 0 3 |
41 DEREK V. PYLE Max:40 S2 04 | 32 15 17 | 3 0 3 |
Number of Sections: 1 Average Students Per Section: 32.00
MUS131 JAZZ ENSEMBLE SM 1 40 19| 19 6 13 | 0 0 0 |
91 DEREK V. PYLE Max:40 S2 00 | 19 6 13 | 0 0 0 |
Number of Sections: 1 Average Students Per Section: 19.00
MUS211 CHOIR-CONCERT SM 1 40 16| 16 13 3 | 1 1 0 |
36 KAREN F. CALDWELL Max:40 S2 03 | 16 13 3 | 1 1 0 |
Number of Sections: 1 Average Students Per Section: 16.00
MUS221 CHOIR-CHAMBER SM 1 40 33| 33 20 13 | 2 1 1 |
26 KAREN F. CALDWELL Max:40 S2 02 | 33 20 13 | 2 1 1 |
Number of Sections: 1 Average Students Per Section: 33.00
MUS226 ADV CHORUS SM 1 40 31| 31 20 11 | 0 0 0 |
16 KAREN F. CALDWELL Max:40 S2 01 | 31 20 11 | 0 0 0 |
Number of Sections: 1 Average Students Per Section: 31.00
MUS301 ORCHESTRA SM 1 40 15| 15 11 4 | 1 1 0 |
51 DAVID L. STAFFORD Max:40 S2 05 | 15 11 4 | 1 1 0 |

1sonyr01.p 38-2 AUBURN MOUNTAINVIEW H. S. 03/02/15 Page:17
05.14.10.00.00 Course/Class Count Report 405 3:08 PM
EST NBR NBR ----TOTALS---- --Special Ed--
COURSE DESCRIPTION LGTH SEC AVL REQ TOT FEM MAL TOT FEM MAL
Number of Sections: 1 Average Students Per Section: 15.00
MUS303 ORCHEST-CHMBR SM 1 40 19| 19 12 7 | 0 0 0 |
41 DAVID L. STAFFORD Max:40 S2 04 | 19 12 7 | 0 0 0 |
Number of Sections: 1 Average Students Per Section: 19.00
MUS401 GUITAR SM 3 109 35| 35 15 20 | 1 0 1 |
56 KAREN F. CALDWELL Max:38 S2 05 | 35 15 20 | 1 0 1 |
Number of Sections: 1 Average Students Per Section: 35.00
MUS402 ADV GUITAR SM 1 35 34| 34 11 23 | 2 0 2 |
66 KAREN F. CALDWELL Max:35 S2 06 | 34 11 23 | 2 0 2 |
Number of Sections: 1 Average Students Per Section: 34.00
PHY101 INTRO PE SM 5 216 103| 103 52 51 | 5 2 3 |
16 KAY M. LORRAIN Max:36 S2 01 | 34 16 18 | 2 1 1 |
46 KAY M. LORRAIN Max:36 S2 04 | 34 19 15 | 1 1 0 |
66 KENT D. RODSETH Max:36 S2 06 | 35 17 18 | 2 0 2 |
Number of Sections: 3 Average Students Per Section: 34.33
PHY203 AEROBIC/WALK SM 1 108 69| 69 52 17 | 5 2 3 |
36 KAY M. LORRAIN Max:36 S2 03 | 33 23 10 | 1 0 1 |
46 LEIMOMI M. BOWLES Max:36 S2 04 | 36 29 7 | 4 2 2 |
Number of Sections: 2 Average Students Per Section: 34.50
PHY208 BASKETBALL SM 2 144 62| 62 10 52 | 4 1 3 |
26 GLEN W. WALKER Max:36 S2 02 | 35 7 28 | 1 1 0 |
36 GLEN W. WALKER Max:36 S2 03 | 27 3 24 | 3 0 3 |
Number of Sections: 2 Average Students Per Section: 31.00
PHY215 GOLF SM 1 36 35| 35 14 21 | 3 1 2 |
46 GLEN W. WALKER Max:36 S2 04 | 35 14 21 | 3 1 2 |
Number of Sections: 1 Average Students Per Section: 35.00
PHY220 RACQT SPORTS SM 3 144 72| 72 44 28 | 4 1 3 |
56 KAY M. LORRAIN Max:36 S2 05 | 36 24 12 | 1 1 0 |
66 KAY M. LORRAIN Max:36 S2 06 | 36 20 16 | 3 0 3 |
Number of Sections: 2 Average Students Per Section: 36.00
PHY224 VOLLEYBALL SM 2 72 66| 66 41 25 | 3 3 0 |
26 LEIMOMI M. BOWLES Max:36 S2 02 | 34 21 13 | 1 1 0 |
36 LEIMOMI M. BOWLES Max:36 S2 03 | 32 20 12 | 2 2 0 |
Number of Sections: 2 Average Students Per Section: 33.00
PHY230 BEG WT TRNG SM 4 144 145| 145 36 109 | 4 0 4 |
16 GLEN W. WALKER Max:36 S2 01 | 37 10 27 | 4 0 4 |
26 KENT D. RODSETH Max:36 S2 02 | 36 13 23 | 0 0 0 |
46 KENT D. RODSETH Max:36 S2 04 | 35 3 32 | 0 0 0 |
56 KENT D. RODSETH Max:36 S2 05 | 37 10 27 | 0 0 0 |
Number of Sections: 4 Average Students Per Section: 36.25
PHY304 ADV VLYBALL SM 2 72 68| 68 26 42 | 3 1 2 |
56 LEIMOMI M. BOWLES Max:36 S2 05 | 34 16 18 | 1 1 0 |
66 LEIMOMI M. BOWLES Max:36 S2 06 | 34 10 24 | 2 0 2 |
Number of Sections: 2 Average Students Per Section: 34.00
PHY306 ADV WT TRNG SM 4 144 72| 72 11 61 | 4 0 4 |
36 KENT D. RODSETH Max:36 S2 03 | 36 4 32 | 1 0 1 |
66 GLEN W. WALKER Max:36 S2 06 | 36 7 29 | 3 0 3 |
Number of Sections: 2 Average Students Per Section: 36.00
PHY998 PE WAIVER .5 SM 1 0 0| 0 0 0 | 0 0 0 |
2X GLEN W. WALKER Max:0 S2 00 | 0 0 0 | 0 0 0 |
Number of Sections: 1 Average Students Per Section: 0.00
PHY999 PE WAIVER 1.0 SM 1 30 0| 0 0 0 | 0 0 0 |
2X GLEN W. WALKER Max:30 S2 00 | 0 0 0 | 0 0 0 |
Number of Sections: 1 Average Students Per Section: 0.00
SCI101 SCIENCE LINKS SM 7 203 93| 93 54 39 | 5 3 2 |
46 KENNETH N. COLBURN Max:30 S2 04 | 30 16 14 | 3 2 1 |

1sonyr01.p 38-2 AUBURN MOUNTAINVIEW H. S. 03/02/15 Page:18
05.14.10.00.00 Course/Class Count Report 405 3:08 PM
EST NBR NBR ----TOTALS---- --Special Ed--
COURSE DESCRIPTION LGTH SEC AVL REQ TOT FEM MAL TOT FEM MAL
56 KENNETH N. COLBURN Max:30 S2 05 | 32 22 10 | 0 0 0 |
66 KENNETH N. COLBURN Max:30 S2 06 | 31 16 15 | 2 1 1 |
Number of Sections: 3 Average Students Per Section: 31.00
SCI203 BIOLOGY 2 SM 13 360 327| 327 165 162 | 21 10 11 |
11 KENNETH N. COLBURN Max:30 S2 01 | 27 9 18 | 1 0 1 |
12 PATRIA R. BAUMSTARK Max:30 S2 01 | 23 14 9 | 0 0 0 |
21 JENNIE M. BUETOW Max:30 S2 02 | 27 15 12 | 2 1 1 |
22 KENNETH N. COLBURN Max:30 S2 02 | 26 13 13 | 4 1 3 |
23 PATRIA R. BAUMSTARK Max:30 S2 02 | 23 12 11 | 0 0 0 |
31 JENNIE M. BUETOW Max:30 S2 03 | 30 15 15 | 3 2 1 |
32 KENNETH N. COLBURN Max:30 S2 03 | 29 12 17 | 4 2 2 |
41 PATRIA R. BAUMSTARK Max:30 S2 04 | 28 12 16 | 0 0 0 |
42 RAY S. DALLY Max:30 S2 04 | 28 17 11 | 2 1 1 |
51 PATRIA R. BAUMSTARK Max:30 S2 05 | 31 17 14 | 3 2 1 |
52 RAY S. DALLY Max:30 S2 05 | 29 14 15 | 0 0 0 |
62 RAY S. DALLY Max:30 S2 06 | 26 15 11 | 2 1 1 |
Number of Sections: 12 Average Students Per Section: 27.25
SCI205 AP BIOLOGY 2 SM 1 1 1| 1 1 0 | 0 0 0 |
11 JENNIE M. BUETOW Max:1 S2 01 | 1 1 0 | 0 0 0 |
Number of Sections: 1 Average Students Per Section: 1.00
SCI209 AP ENVIRN SCI 2 SM 2 31 12| 12 3 9 | 0 0 0 |
11 JENNIE M. BUETOW Max:30 S2 01 | 12 3 9 | 0 0 0 |
IS1 JENNIE M. BUETOW Max:1 S2 01 | 0 0 0 | 0 0 0 |
Number of Sections: 2 Average Students Per Section: 6.00
SCI301 CHEMISTRY 2 SM 8 240 228| 228 115 113 | 3 0 3 |
11 JAYME L. HOSTETTER Max:30 S2 01 | 21 9 12 | 0 0 0 |
21 JAYME L. HOSTETTER Max:30 S2 02 | 30 14 16 | 0 0 0 |
31 KARL F. STEFFIN Max:30 S2 03 | 29 15 14 | 2 0 2 |
41 JARED D. GERVAIS Max:30 S2 04 | 30 21 9 | 0 0 0 |
51 JARED D. GERVAIS Max:30 S2 05 | 31 13 18 | 1 0 1 |
52 JAYME L. HOSTETTER Max:30 S2 05 | 30 17 13 | 0 0 0 |
61 KARL F. STEFFIN Max:30 S2 06 | 28 13 15 | 0 0 0 |
62 JAYME L. HOSTETTER Max:30 S2 06 | 29 13 16 | 0 0 0 |
Number of Sections: 8 Average Students Per Section: 28.50
SCI307 UW CHEMISTRY 2 SM 3 30 0| 0 0 0 | 0 0 0 |
31 JAYME L. HOSTETTER Max:30 S2 03 | 0 0 0 | 0 0 0 |
Number of Sections: 1 Average Students Per Section: 0.00
SCI401 PHYSICS 2 SM 3 60 43| 43 19 24 | 0 0 0 |
11 KARL F. STEFFIN Max:30 S2 01 | 15 7 8 | 0 0 0 |
51 KARL F. STEFFIN Max:30 S2 05 | 28 12 16 | 0 0 0 |
Number of Sections: 2 Average Students Per Section: 21.50
SCI502 MARINE BIOLOGY SM 2 30 14| 14 10 4 | 0 0 0 |
66 PATRIA R. BAUMSTARK Max:30 S2 06 | 14 10 4 | 0 0 0 |
Number of Sections: 1 Average Students Per Section: 14.00
SCI503 ENVIRON BIOLOGY SM 5 60 30| 30 12 18 | 6 4 2 |
46 JENNIE M. BUETOW Max:30 S2 04 | 30 12 18 | 6 4 2 |
Number of Sections: 1 Average Students Per Section: 30.00
SCI513 UW ASTRONOMY 1 SM 1 30 14| 14 6 8 | 0 0 0 |
46 KARL F. STEFFIN Max:30 S2 04 | 14 6 8 | 0 0 0 |
Number of Sections: 1 Average Students Per Section: 14.00
SCI521 AP PHYSICS B 2 SM 1 30 24| 24 7 17 | 0 0 0 |
51 LESLIE J. TAUZER Max:30 S2 05 | 24 7 17 | 0 0 0 |
Number of Sections: 1 Average Students Per Section: 24.00
SCIBIO BIOLOGY EOC COE SM 1 102 33| 33 21 12 | 1 1 0 |
36 JAYME L. HOSTETTER Max:30 S2 03 | 6 3 3 | 0 0 0 |
96 JAYME L. HOSTETTER Max:27 S2 09 | 27 18 9 | 1 1 0 |

1sonyr01.p 38-2 AUBURN MOUNTAINVIEW H. S. 03/02/15 Page:19
05.14.10.00.00 Course/Class Count Report 405 3:08 PM
EST NBR NBR ----TOTALS---- --Special Ed--
COURSE DESCRIPTION LGTH SEC AVL REQ TOT FEM MAL TOT FEM MAL
Number of Sections: 2 Average Students Per Section: 16.50
SOC100 WORLD STU BASIC SM 1 56 33| 33 15 18 | 9 1 8 |
46 ERIN L. HALL Max:24 S2 04 | 20 8 12 | 8 1 7 |
L46 HEIDI K. BENDT Max:14 S2 04 | 13 7 6 | 1 0 1 |
Number of Sections: 2 Average Students Per Section: 16.50
SOC101 WORLD STUDIES SM 10 240 103| 103 58 45 | 2 2 0 |
16 ERIN L. HALL Max:30 S2 01 | 30 18 12 | 2 2 0 |
26 ERIN L. HALL Max:30 S2 02 | 26 17 9 | 0 0 0 |
27 NORENE L. OSBORNE Max:30 S2 02 | 17 8 9 | 0 0 0 |
56 CORY M. RUTLEDGE Max:30 S2 05 | 30 15 15 | 0 0 0 |
Number of Sections: 4 Average Students Per Section: 25.75
SOC191 AP HUMN GEOGR 2 SM 4 90 90| 90 58 32 | 0 0 0 |
11 DUSTIN DEPIANO Max:30 S2 01 | 29 19 10 | 0 0 0 |
41 DUSTIN DEPIANO Max:30 S2 04 | 30 17 13 | 0 0 0 |
51 DUSTIN DEPIANO Max:30 S2 05 | 31 22 9 | 0 0 0 |
Number of Sections: 3 Average Students Per Section: 30.00
SOC201 US HIST BASIC 2 SM 1 24 24| 24 7 17 | 7 4 3 |
21 CORY M. RUTLEDGE Max:24 S2 02 | 24 7 17 | 7 4 3 |
Number of Sections: 1 Average Students Per Section: 24.00
SOC203 US HISTORY 2 SM 11 30 30| 30 11 19 | 0 0 0 |
41 CORY M. RUTLEDGE Max:30 S2 04 | 30 11 19 | 0 0 0 |
Number of Sections: 1 Average Students Per Section: 30.00
SOC205 AP EUROPEAN 2 SM 3 90 88| 88 45 43 | 1 0 1 |
21 ERIC D. ARNOLD Max:30 S2 02 | 27 16 11 | 0 0 0 |
31 ERIC D. ARNOLD Max:30 S2 03 | 30 15 15 | 0 0 0 |
41 ERIC D. ARNOLD Max:30 S2 04 | 31 14 17 | 1 0 1 |
Number of Sections: 3 Average Students Per Section: 29.33
SOC300 CIVICS SM 10 99 21| 21 10 11 | 1 0 1 |
36 DUSTIN DEPIANO Max:30 S2 03 | 21 10 11 | 1 0 1 |
Number of Sections: 1 Average Students Per Section: 21.00
SOC302 AP US HISTORY 2 SM 3 60 32| 32 20 12 | 0 0 0 |
01 ERIC D. ARNOLD Max:30 S2 09 | 13 10 3 | 0 0 0 |
11 ERIC D. ARNOLD Max:30 S2 01 | 19 10 9 | 0 0 0 |
Number of Sections: 2 Average Students Per Section: 16.00
SOC400 GLOBAL ISSUES SM 6 790 352| 352 148 204 | 34 13 21 |
17 CORY M. RUTLEDGE Max:30 S2 01 | 28 11 17 | 1 0 1 |
18 WAYNE D. RUMBAUGH Max:30 S2 01 | 20 7 13 | 3 2 1 |
26 CHRISTOPHER J. CARR Max:23 S2 02 | 22 9 13 | 0 0 0 |
27 JOSEPH J. RUSH Max:30 S2 02 | 29 11 18 | 1 0 1 |
28 DUSTIN DEPIANO Max:30 S2 02 | 32 11 21 | 3 0 3 |
36 ERIN L. HALL Max:30 S2 03 | 30 13 17 | 3 1 2 |
37 WAYNE D. RUMBAUGH Max:30 S2 03 | 24 10 14 | 0 0 0 |
47 WAYNE D. RUMBAUGH Max:30 S2 04 | 30 12 18 | 2 0 2 |
56 JOSEPH J. RUSH Max:30 S2 05 | 30 13 17 | 2 0 2 |
57 WAYNE D. RUMBAUGH Max:30 S2 05 | 29 11 18 | 0 0 0 |
66 JOSEPH J. RUSH Max:30 S2 06 | 29 15 14 | 3 2 1 |
68 CORY M. RUTLEDGE Max:30 S2 06 | 30 17 13 | 1 1 0 |
AB2 CHRISTOPHER J. CARR Max:14 S2 02 | 3 0 3 | 3 0 3 |
B16 TORI T. AMMONS Max:25 S2 01 | 16 8 8 | 12 7 5 |
Number of Sections: 14 Average Students Per Section: 25.14
SOC402 AP US POL&GOV 2 SM 2 120 105| 105 57 48 | 1 1 0 |
11 NORENE L. OSBORNE Max:30 S2 01 | 29 15 14 | 0 0 0 |
31 NORENE L. OSBORNE Max:30 S2 03 | 21 11 10 | 0 0 0 |
41 TORI T. AMMONS Max:30 S2 04 | 22 11 11 | 1 1 0 |
51 TORI T. AMMONS Max:30 S2 05 | 33 20 13 | 0 0 0 |

1sonyr01.p 38-2 AUBURN MOUNTAINVIEW H. S. 03/02/15 Page:20
05.14.10.00.00 Course/Class Count Report 405 3:08 PM
EST NBR NBR ----TOTALS---- --Special Ed--
COURSE DESCRIPTION LGTH SEC AVL REQ TOT FEM MAL TOT FEM MAL
Number of Sections: 4 Average Students Per Section: 26.25
SOC500 PSYCHOLOGY 1 SM 1 60 25| 25 11 14 | 2 0 2 |
16 JOSEPH J. RUSH Max:30 S2 01 | 25 11 14 | 2 0 2 |
Number of Sections: 1 Average Students Per Section: 25.00
SOC503 AP PSYCH 2 SM 2 30 19| 19 13 6 | 0 0 0 |
31 JOSEPH J. RUSH Max:30 S2 03 | 19 13 6 | 0 0 0 |
Number of Sections: 1 Average Students Per Section: 19.00
SOC504 SOCIOLOGY 1 SM 2 60 27| 27 15 12 | 1 0 1 |
66 TORI T. AMMONS Max:30 S2 06 | 27 15 12 | 1 0 1 |
Number of Sections: 1 Average Students Per Section: 27.00
SOC508 WASH STATE HIST SM 1 60 23| 23 11 12 | 3 0 3 |
36 TORI T. AMMONS Max:30 S2 03 | 23 11 12 | 3 0 3 |
AB2 CHRISTOPHER J. CARR Max:0 S2 02 | 0 0 0 | 0 0 0 |
Number of Sections: 2 Average Students Per Section: 11.50
SPE212 READ/WR LAN 1 SM 2 28 15| 15 8 7 | 15 8 7 |
21 KAMARIA J. SMITH Max:14 S2 02 | 9 6 3 | 9 6 3 |
61 KAMARIA J. SMITH Max:14 S2 06 | 6 2 4 | 6 2 4 |
Number of Sections: 2 Average Students Per Section: 7.50
SPE214 READ/WR LAN 2 SM 1 32 17| 17 8 9 | 17 8 9 |
11 TELIA S. PETERSON Max:14 S2 01 | 5 3 2 | 5 3 2 |
51 KAMARIA J. SMITH Max:18 S2 05 | 12 5 7 | 12 5 7 |
Number of Sections: 2 Average Students Per Section: 8.50
SPE216 READ/WR LAN 3 SM 2 42 17| 17 2 15 | 17 2 15 |
31 TELIA S. PETERSON Max:14 S2 03 | 12 2 10 | 12 2 10 |
41 BRADLEY J. COMSTOCK Max:14 S2 04 | 5 0 5 | 5 0 5 |
AB JULIE A. SOHLSTROM Max:14 S2 03 | 0 0 0 | 0 0 0 |
Number of Sections: 3 Average Students Per Section: 5.67
SPE218 READ/WR LAN 4 SM 1 14 11| 11 5 6 | 11 5 6 |
41 KAMARIA J. SMITH Max:14 S2 04 | 11 5 6 | 11 5 6 |
Number of Sections: 1 Average Students Per Section: 11.00
SPE302 MATH 1 SM 1 14 10| 10 2 8 | 10 2 8 |
51 TELIA S. PETERSON Max:14 S2 05 | 10 2 8 | 10 2 8 |
Number of Sections: 1 Average Students Per Section: 10.00
SPE304 MATH 2 SM 2 28 10| 10 7 3 | 10 7 3 |
11 BRADLEY J. COMSTOCK Max:14 S2 01 | 0 0 0 | 0 0 0 |
61 BRADLEY J. COMSTOCK Max:14 S2 06 | 10 7 3 | 10 7 3 |
Number of Sections: 2 Average Students Per Section: 5.00
SPE306 MATH 3 SM 1 28 17| 17 3 14 | 17 3 14 |
21 TELIA S. PETERSON Max:14 S2 02 | 9 2 7 | 9 2 7 |
61 TELIA S. PETERSON Max:14 S2 06 | 8 1 7 | 8 1 7 |
Number of Sections: 2 Average Students Per Section: 8.50
SPE308 MATH 4 SM 1 28 13| 13 6 7 | 13 6 7 |
31 BRADLEY J. COMSTOCK Max:14 S2 03 | 2 1 1 | 2 1 1 |
51 BRADLEY J. COMSTOCK Max:14 S2 05 | 11 5 6 | 11 5 6 |
Number of Sections: 2 Average Students Per Section: 6.50
SPE401 SOCIAL SKILLS 2 SM 1 56 13| 13 3 10 | 10 3 7 |
AB1 TYLER H. JORGENSEN Max:14 S2 01 | 5 2 3 | 4 2 2 |
AB3 TYLER H. JORGENSEN Max:14 S2 03 | 0 0 0 | 0 0 0 |
AB4 JULIE A. SOHLSTROM Max:14 S2 04 | 4 0 4 | 3 0 3 |
AB6 JULIE A. SOHLSTROM Max:14 S2 06 | 4 1 3 | 3 1 2 |
Number of Sections: 4 Average Students Per Section: 3.25
SPE601 COMM LAB SM 2 10 2| 2 0 2 | 2 0 2 |
46 JILLIAN CANO Max:10 S2 04 | 2 0 2 | 2 0 2 |
76 JILLIAN CANO Max:0 S2 07 | 0 0 0 | 0 0 0 |
96 JILLIAN CANO Max:0 S2 09 | 0 0 0 | 0 0 0 |

1sonyr01.p 38-2 AUBURN MOUNTAINVIEW H. S. 03/02/15 Page:21
05.14.10.00.00 Course/Class Count Report 405 3:08 PM
EST NBR NBR ----TOTALS---- --Special Ed--
COURSE DESCRIPTION LGTH SEC AVL REQ TOT FEM MAL TOT FEM MAL
Number of Sections: 3 Average Students Per Section: 0.67

1sonyr01.p 38-2 AUBURN MOUNTAINVIEW H. S. 03/02/15 Page:22
05.14.10.00.00 Course/Class Count Report Totals 3:08 PM
TITLE FOR TOTAL
TOTALS GROUP TOTAL FEMALE MALE
GRAND TOTALS 10235 4850 5385
Special Ed 621 239 382
************************ End of report ************************

1sonyr01.p 38-2 AUBURN RIVERSIDE HIGH SCHOOL 03/02/15 Page:1
05.14.10.00.00 Course/Class Count Report 408 3:09 PM
EST NBR NBR ----TOTALS---- --Special Ed--
COURSE DESCRIPTION LGTH SEC AVL REQ TOT FEM MAL TOT FEM MAL
ART104 ADV ART 2 SM 1 13 12| 12 11 1 | 3 3 0 |
16 CHRISTIAN M. MILLER Max:13 S2 01 | 12 11 1 | 3 3 0 |
Number of Sections: 1 Average Students Per Section: 12.00
ART107 2-D ART SM 2 30 30| 30 16 14 | 2 1 1 |
16 PAUL M. LEWIS Max:30 S2 01 | 30 16 14 | 2 1 1 |
Number of Sections: 1 Average Students Per Section: 30.00
ART110 CERAMICS SM 4 150 87| 87 45 42 | 9 2 7 |
36 PAUL M. LEWIS Max:20 S2 03 | 18 6 12 | 2 1 1 |
46 PAUL M. LEWIS Max:23 S2 04 | 23 13 10 | 2 0 2 |
56 PAUL M. LEWIS Max:22 S2 05 | 21 9 12 | 3 1 2 |
66 PAUL M. LEWIS Max:25 S2 06 | 25 17 8 | 2 0 2 |
Number of Sections: 4 Average Students Per Section: 21.75
ART111 ADV CERAMICS SM 7 29 24| 24 19 5 | 0 0 0 |
36 PAUL M. LEWIS Max:9 S2 03 | 9 6 3 | 0 0 0 |
46 PAUL M. LEWIS Max:7 S2 04 | 6 5 1 | 0 0 0 |
56 PAUL M. LEWIS Max:8 S2 05 | 4 3 1 | 0 0 0 |
66 PAUL M. LEWIS Max:5 S2 06 | 5 5 0 | 0 0 0 |
Number of Sections: 4 Average Students Per Section: 6.00
ART122 ACTING 2 SM 1 32 20| 20 13 7 | 2 0 2 |
36 KATHRYN A. NUTTMAN Max:32 S2 03 | 20 13 7 | 2 0 2 |
Number of Sections: 1 Average Students Per Section: 20.00
ART124 ACTING 4 SM 2 2 0| 0 0 0 | 0 0 0 |
36 KATHRYN A. NUTTMAN Max:2 S2 03 | 0 0 0 | 0 0 0 |
Number of Sections: 1 Average Students Per Section: 0.00
CTE118 MATH BUS PRFIN2 SM 1 30 29| 29 18 11 | 3 1 2 |
66 ANGELA K. MCCAUSLAND Max:30 S2 06 | 29 18 11 | 3 1 2 |
Number of Sections: 1 Average Students Per Section: 29.00
CTE171 MARKETG/DECA 2 SM 1 30 12| 12 8 4 | 0 0 0 |
36 DOUGLAS J. AUBERT Max:30 S2 03 | 12 8 4 | 0 0 0 |
Number of Sections: 1 Average Students Per Section: 12.00
CTE176 MKT PMGMT DECA4 SM 2 21 6| 6 6 0 | 0 0 0 |
26 DOUGLAS J. AUBERT Max:1 S2 02 | 1 1 0 | 0 0 0 |
36 DOUGLAS J. AUBERT Max:20 S2 03 | 5 5 0 | 0 0 0 |
Number of Sections: 2 Average Students Per Section: 3.00
CTE178 SPTS & ENT MGMT SM 1 4 3| 3 0 3 | 0 0 0 |
36 DOUGLAS J. AUBERT Max:4 S2 03 | 3 0 3 | 0 0 0 |
Number of Sections: 1 Average Students Per Section: 3.00
CTE181 MKT BUS ADMIN 2 SM 1 7 4| 4 2 2 | 0 0 0 |
36 DOUGLAS J. AUBERT Max:2 S2 03 | 1 0 1 | 0 0 0 |
46 DOUGLAS J. AUBERT Max:5 S2 04 | 3 2 1 | 0 0 0 |
Number of Sections: 2 Average Students Per Section: 2.00
CTE183 STORE RETL OP 2 SM 1 21 14| 14 8 6 | 0 0 0 |
46 DOUGLAS J. AUBERT Max:21 S2 04 | 14 8 6 | 0 0 0 |
Number of Sections: 1 Average Students Per Section: 14.00
CTE185 STOR OP SM BSN2 SM 2 10 5| 5 2 3 | 0 0 0 |
46 DOUGLAS J. AUBERT Max:10 S2 04 | 5 2 3 | 0 0 0 |
Number of Sections: 1 Average Students Per Section: 5.00
CTE187 MARKTNG ENTRE 2 SM 1 6 0| 0 0 0 | 0 0 0 |
36 DOUGLAS J. AUBERT Max:6 S2 03 | 0 0 0 | 0 0 0 |
Number of Sections: 1 Average Students Per Section: 0.00
CTE188 BSN MKT FN DECA SM 1 60 20| 20 10 10 | 1 0 1 |
26 DOUGLAS J. AUBERT Max:30 S2 02 | 20 10 10 | 1 0 1 |
Number of Sections: 1 Average Students Per Section: 20.00
CTE211 CAREER W/CHILD1 SM 2 34 4| 4 3 1 | 1 1 0 |
26 KELLY A. JENSEN Max:4 S2 02 | 4 3 1 | 1 1 0 |

1sonyr01.p 38-2 AUBURN RIVERSIDE HIGH SCHOOL 03/02/15 Page:2
05.14.10.00.00 Course/Class Count Report 408 3:09 PM
EST NBR NBR ----TOTALS---- --Special Ed--
COURSE DESCRIPTION LGTH SEC AVL REQ TOT FEM MAL TOT FEM MAL
Number of Sections: 1 Average Students Per Section: 4.00
CTE212 CAREER W/CHILD2 SM 7 25 16| 16 16 0 | 1 1 0 |
26 KELLY A. JENSEN Max:25 S2 02 | 16 16 0 | 1 1 0 |
Number of Sections: 1 Average Students Per Section: 16.00
CTE214 CAREER W/CHILD4 SM 1 6 3| 3 2 1 | 1 0 1 |
26 KELLY A. JENSEN Max:6 S2 02 | 3 2 1 | 1 0 1 |
Number of Sections: 1 Average Students Per Section: 3.00
CTE240 INDEP LIVING SM 2 60 29| 29 15 14 | 7 3 4 |
46 KELLY A. JENSEN Max:30 S2 04 | 29 15 14 | 7 3 4 |
Number of Sections: 1 Average Students Per Section: 29.00
CTE245 INTERIOR DESIGN SM 1 30 23| 23 19 4 | 1 1 0 |
36 KELLY A. JENSEN Max:30 S2 03 | 23 19 4 | 1 1 0 |
Number of Sections: 1 Average Students Per Section: 23.00
CTE250 NUTRTN WELLNESS SM 3 72 22| 22 12 10 | 2 0 2 |
66 KELLY A. JENSEN Max:24 S2 06 | 22 12 10 | 2 0 2 |
Number of Sections: 1 Average Students Per Section: 22.00
CTE266 COSMETOLOGY 2 SM 1 2 0| 0 0 0 | 0 0 0 |
36 JAMES C. WICKENS Max:2 S2 03 | 0 0 0 | 0 0 0 |
Number of Sections: 1 Average Students Per Section: 0.00
CTE282 AM SIGN LANG 2 SM 3 60 56| 56 41 15 | 4 2 2 |
56 CINDY L. ANDERSON Max:30 S2 05 | 29 21 8 | 3 1 2 |
66 CINDY L. ANDERSON Max:30 S2 06 | 27 20 7 | 1 1 0 |
Number of Sections: 2 Average Students Per Section: 28.00
CTE284 AM SIGN LANG 4 SM 2 60 42| 42 34 8 | 2 1 1 |
16 CINDY L. ANDERSON Max:30 S2 01 | 25 19 6 | 1 0 1 |
26 CINDY L. ANDERSON Max:30 S2 02 | 17 15 2 | 1 1 0 |
Number of Sections: 2 Average Students Per Section: 21.00
CTE286 AM SIGN LANG 6 SM 1 30 24| 24 18 6 | 0 0 0 |
46 CINDY L. ANDERSON Max:30 S2 04 | 24 18 6 | 0 0 0 |
Number of Sections: 1 Average Students Per Section: 24.00
CTE304 PREVENTIVE MED SM 2 90 60| 60 34 26 | 3 1 2 |
16 CHRISTOPHER T. TUCKER Max:30 S2 01 | 30 16 14 | 2 0 2 |
56 CHRISTOPHER T. TUCKER Max:30 S2 05 | 30 18 12 | 1 1 0 |
Number of Sections: 2 Average Students Per Section: 30.00
CTE306 ANATOMY/PHYS 2 SM 3 60 51| 51 41 10 | 0 0 0 |
36 CHRISTOPHER T. TUCKER Max:30 S2 03 | 23 18 5 | 0 0 0 |
46 CHRISTOPHER T. TUCKER Max:30 S2 04 | 28 23 5 | 0 0 0 |
Number of Sections: 2 Average Students Per Section: 25.50
CTE308 SPORTS MED 2 SM 1 28 27| 27 21 6 | 0 0 0 |
66 CHRISTOPHER T. TUCKER Max:28 S2 06 | 27 21 6 | 0 0 0 |
Number of Sections: 1 Average Students Per Section: 27.00
CTE312 ADVSPORTS MED 2 SM 1 8 8| 8 6 2 | 0 0 0 |
66 CHRISTOPHER T. TUCKER Max:8 S2 06 | 8 6 2 | 0 0 0 |
Number of Sections: 1 Average Students Per Section: 8.00
CTE331 CULINARY ARTS SM 9 113 8| 8 3 5 | 6 1 5 |
56 WAYNE M. SHELTON Max:8 S2 05 | 8 3 5 | 6 1 5 |
Number of Sections: 1 Average Students Per Section: 8.00
CTE332 CULINARY ARTS SM 3 99 101| 101 56 45 | 18 9 9 |
16 WAYNE M. SHELTON Max:24 S2 01 | 25 12 13 | 5 2 3 |
26 WAYNE M. SHELTON Max:24 S2 02 | 24 15 9 | 4 2 2 |
36 WAYNE M. SHELTON Max:24 S2 03 | 22 13 9 | 6 4 2 |
46 WAYNE M. SHELTON Max:26 S2 04 | 26 12 14 | 3 1 2 |
96 WAYNE M. SHELTON Max:1 S2 09 | 4 4 0 | 0 0 0 |
Number of Sections: 5 Average Students Per Section: 20.20
CTE334 ADV CULNY ART 2 SM 3 10 6| 6 3 3 | 0 0 0 |
16 WAYNE M. SHELTON Max:5 S2 01 | 3 1 2 | 0 0 0 |

1sonyr01.p 38-2 AUBURN RIVERSIDE HIGH SCHOOL 03/02/15 Page:3
05.14.10.00.00 Course/Class Count Report 408 3:09 PM
EST NBR NBR ----TOTALS---- --Special Ed--
COURSE DESCRIPTION LGTH SEC AVL REQ TOT FEM MAL TOT FEM MAL
36 WAYNE M. SHELTON Max:5 S2 03 | 3 2 1 | 0 0 0 |
Number of Sections: 2 Average Students Per Section: 3.00
CTE336 CULNY ARTS CS 2 SM 5 4 4| 4 2 2 | 0 0 0 |
16 WAYNE M. SHELTON Max:1 S2 01 | 1 1 0 | 0 0 0 |
26 WAYNE M. SHELTON Max:1 S2 02 | 1 1 0 | 0 0 0 |
36 WAYNE M. SHELTON Max:1 S2 03 | 1 0 1 | 0 0 0 |
46 WAYNE M. SHELTON Max:1 S2 04 | 1 0 1 | 0 0 0 |
Number of Sections: 4 Average Students Per Section: 1.00
CTE351 JEWL METLSCULP1 SM 7 140 53| 53 31 22 | 7 4 3 |
56 WENDY S. WOLDENBERG Max:28 S2 05 | 27 13 14 | 6 4 2 |
66 WENDY S. WOLDENBERG Max:28 S2 06 | 26 18 8 | 1 0 1 |
Number of Sections: 2 Average Students Per Section: 26.50
CTE352 JEWL METLSCULP2 SM 6 103 61| 61 28 33 | 2 1 1 |
26 WENDY S. WOLDENBERG Max:20 S2 02 | 19 9 10 | 2 1 1 |
36 WENDY S. WOLDENBERG Max:22 S2 03 | 20 8 12 | 0 0 0 |
46 WENDY S. WOLDENBERG Max:23 S2 04 | 22 11 11 | 0 0 0 |
Number of Sections: 3 Average Students Per Section: 20.33
CTE353 JEWL METLSCULP3 SM 3 30 15| 15 11 4 | 0 0 0 |
26 WENDY S. WOLDENBERG Max:5 S2 02 | 4 3 1 | 0 0 0 |
36 WENDY S. WOLDENBERG Max:6 S2 03 | 6 4 2 | 0 0 0 |
46 WENDY S. WOLDENBERG Max:5 S2 04 | 5 4 1 | 0 0 0 |
Number of Sections: 3 Average Students Per Section: 5.00
CTE354 JEWL METLSCULP4 SM 4 6 8| 8 5 3 | 1 1 0 |
26 WENDY S. WOLDENBERG Max:3 S2 02 | 5 2 3 | 1 1 0 |
36 WENDY S. WOLDENBERG Max:2 S2 03 | 2 2 0 | 0 0 0 |
46 WENDY S. WOLDENBERG Max:1 S2 04 | 1 1 0 | 0 0 0 |
Number of Sections: 3 Average Students Per Section: 2.67
CTE355 JEWL METLSCULCS SM 2 4 1| 1 1 0 | 1 1 0 |
26 WENDY S. WOLDENBERG Max:2 S2 02 | 0 0 0 | 0 0 0 |
66 WENDY S. WOLDENBERG Max:1 S2 06 | 1 1 0 | 1 1 0 |
Number of Sections: 2 Average Students Per Section: 0.50
CTE361 VIS COM 1 SM 3 63 17| 17 10 7 | 1 0 1 |
26 GINA M. SANDLAND Max:15 S2 02 | 17 10 7 | 1 0 1 |
Number of Sections: 1 Average Students Per Section: 17.00
CTE362 VIS COM 2 SM 2 36 19| 19 8 11 | 2 0 2 |
16 GINA M. SANDLAND Max:24 S2 01 | 12 3 9 | 2 0 2 |
26 GINA M. SANDLAND Max:12 S2 02 | 7 5 2 | 0 0 0 |
Number of Sections: 2 Average Students Per Section: 9.50
CTE366 VIS COM CS 2 SM 1 4 3| 3 2 1 | 0 0 0 |
16 GINA M. SANDLAND Max:0 S2 01 | 2 1 1 | 0 0 0 |
36 GINA M. SANDLAND Max:1 S2 03 | 1 1 0 | 0 0 0 |
46 GINA M. SANDLAND Max:3 S2 04 | 0 0 0 | 0 0 0 |
Number of Sections: 3 Average Students Per Section: 1.00
CTE368 DIGITAL PHOTO 1 SM 4 94 37| 37 21 16 | 4 3 1 |
56 GINA M. SANDLAND Max:24 S2 05 | 19 10 9 | 2 1 1 |
66 GINA M. SANDLAND Max:22 S2 06 | 18 11 7 | 2 2 0 |
Number of Sections: 2 Average Students Per Section: 18.50
CTE369 DIGITAL PHOTO 2 SM 1 3 3| 3 3 0 | 0 0 0 |
00 GINA M. SANDLAND Max:2 S2 06 | 2 2 0 | 0 0 0 |
56 GINA M. SANDLAND Max:1 S2 05 | 1 1 0 | 0 0 0 |
Number of Sections: 2 Average Students Per Section: 1.50
CTE371 DRAWING 1 SM 4 129 45| 45 26 19 | 4 2 2 |
16 CHRISTIAN M. MILLER Max:17 S2 01 | 17 13 4 | 1 1 0 |
56 CHRISTIAN M. MILLER Max:28 S2 05 | 28 13 15 | 3 1 2 |
Number of Sections: 2 Average Students Per Section: 22.50
CTE372 DRAWING 2 SM 3 66 56| 56 24 32 | 11 1 10 |

1sonyr01.p 38-2 AUBURN RIVERSIDE HIGH SCHOOL 03/02/15 Page:4
05.14.10.00.00 Course/Class Count Report 408 3:09 PM
EST NBR NBR ----TOTALS---- --Special Ed--
COURSE DESCRIPTION LGTH SEC AVL REQ TOT FEM MAL TOT FEM MAL
26 CHRISTIAN M. MILLER Max:28 S2 02 | 28 11 17 | 5 1 4 |
46 CHRISTIAN M. MILLER Max:28 S2 04 | 28 13 15 | 6 0 6 |
Number of Sections: 2 Average Students Per Section: 28.00
CTE374 AP STUDIO ART 2 SM 1 30 18| 18 14 4 | 0 0 0 |
66 CHRISTIAN M. MILLER Max:30 S2 06 | 18 14 4 | 0 0 0 |
Number of Sections: 1 Average Students Per Section: 18.00
CTE376 GRAPHIC DES 2 SM 1 15 4| 4 1 3 | 0 0 0 |
46 GINA M. SANDLAND Max:15 S2 04 | 4 1 3 | 0 0 0 |
Number of Sections: 1 Average Students Per Section: 4.00
CTE378 GRAPHC DES CS 2 SM 1 5 0| 0 0 0 | 0 0 0 |
46 GINA M. SANDLAND Max:5 S2 04 | 0 0 0 | 0 0 0 |
Number of Sections: 1 Average Students Per Section: 0.00
CTE381 ELECTRONICS 1 SM 4 74 1| 1 0 1 | 0 0 0 |
26A FRANK MEDINA Max:1 S2 02 | 1 0 1 | 0 0 0 |
36A FRANK MEDINA Max:1 S2 03 | 0 0 0 | 0 0 0 |
Number of Sections: 2 Average Students Per Section: 0.50
CTE382 ELECTRONICS 2 SM 4 72 63| 63 6 57 | 13 1 12 |
26 FRANK MEDINA Max:24 S2 02 | 21 2 19 | 2 0 2 |
36 FRANK MEDINA Max:24 S2 03 | 21 4 17 | 6 1 5 |
46 FRANK MEDINA Max:24 S2 04 | 21 0 21 | 5 0 5 |
Number of Sections: 3 Average Students Per Section: 21.00
CTE384 ELECTRONICS 4 SM 12 24 15| 15 0 15 | 6 0 6 |
16 FRANK MEDINA Max:24 S2 01 | 15 0 15 | 6 0 6 |
Number of Sections: 1 Average Students Per Section: 15.00
CTE390 ROBOTICS TECH 2 SM 1 24 17| 17 1 16 | 2 0 2 |
16 GEORGE W. SUMNER Max:24 S2 01 | 17 1 16 | 2 0 2 |
Number of Sections: 1 Average Students Per Section: 17.00
CTE401 ENGN DES ARCH 1 SM 4 50 11| 11 5 6 | 0 0 0 |
26 GEORGE W. SUMNER Max:1 S2 02 | 10 5 5 | 0 0 0 |
36 GEORGE W. SUMNER Max:1 S2 03 | 1 0 1 | 0 0 0 |
Number of Sections: 2 Average Students Per Section: 5.50
CTE402 ENGN DES ARCH 2 SM 3 44 34| 34 13 21 | 3 0 3 |
26 GEORGE W. SUMNER Max:23 S2 02 | 14 8 6 | 1 0 1 |
36 GEORGE W. SUMNER Max:21 S2 03 | 20 5 15 | 2 0 2 |
Number of Sections: 2 Average Students Per Section: 17.00
CTE406 ENGN DES ARCH 4 SM 2 16 13| 13 1 12 | 1 0 1 |
46 GEORGE W. SUMNER Max:16 S2 04 | 13 1 12 | 1 0 1 |
Number of Sections: 1 Average Students Per Section: 13.00
CTE408 DRFT ENG TECH 4 SM 3 7 5| 5 0 5 | 0 0 0 |
46 GEORGE W. SUMNER Max:7 S2 04 | 5 0 5 | 0 0 0 |
Number of Sections: 1 Average Students Per Section: 5.00
CTE410 ENGN DESARC CS2 SM 2 4 4| 4 1 3 | 1 0 1 |
36 GEORGE W. SUMNER Max:2 S2 03 | 2 1 1 | 1 0 1 |
46 GEORGE W. SUMNER Max:2 S2 04 | 2 0 2 | 0 0 0 |
Number of Sections: 2 Average Students Per Section: 2.00
CTE412 COMP SYS ENG 2 SM 2 20 18| 18 1 17 | 3 0 3 |
66 FRANK MEDINA Max:20 S2 06 | 18 1 17 | 3 0 3 |
Number of Sections: 1 Average Students Per Section: 18.00
CTE414 COMP SYS ENG 4 SM 2 4 4| 4 0 4 | 0 0 0 |
66 FRANK MEDINA Max:4 S2 06 | 4 0 4 | 0 0 0 |
Number of Sections: 1 Average Students Per Section: 4.00
CTE451 ADV POWR/ENERGY SM 2 24 14| 14 0 14 | 4 0 4 |
56 GEORGE W. SUMNER Max:24 S2 05 | 14 0 14 | 4 0 4 |
Number of Sections: 1 Average Students Per Section: 14.00
CTE455 WOODWRK DESGN 1 SM 6 101 29| 29 6 23 | 1 0 1 |
36 JAMES C. WICKENS Max:14 S2 03 | 15 5 10 | 0 0 0 |

1sonyr01.p 38-2 AUBURN RIVERSIDE HIGH SCHOOL 03/02/15 Page:5
05.14.10.00.00 Course/Class Count Report 408 3:09 PM
EST NBR NBR ----TOTALS---- --Special Ed--
COURSE DESCRIPTION LGTH SEC AVL REQ TOT FEM MAL TOT FEM MAL
46 JAMES C. WICKENS Max:14 S2 04 | 14 1 13 | 1 0 1 |
Number of Sections: 2 Average Students Per Section: 14.50
CTE456 WOODWRK DESGN 2 SM 4 60 40| 40 6 34 | 3 0 3 |
26 JAMES C. WICKENS Max:15 S2 02 | 16 3 13 | 1 0 1 |
36 JAMES C. WICKENS Max:13 S2 03 | 10 2 8 | 2 0 2 |
46 JAMES C. WICKENS Max:13 S2 04 | 14 1 13 | 0 0 0 |
Number of Sections: 3 Average Students Per Section: 13.33
CTE457 WOODWRK DESGN 3 SM 2 40 15| 15 0 15 | 6 0 6 |
16 JAMES C. WICKENS Max:3 S2 01 | 2 0 2 | 1 0 1 |
26 JAMES C. WICKENS Max:12 S2 02 | 11 0 11 | 5 0 5 |
46 JAMES C. WICKENS Max:2 S2 04 | 2 0 2 | 0 0 0 |
Number of Sections: 3 Average Students Per Section: 5.00
CTE458 WOODWRK DESGN 4 SM 2 24 23| 23 1 22 | 5 0 5 |
16 JAMES C. WICKENS Max:21 S2 01 | 20 1 19 | 4 0 4 |
36 JAMES C. WICKENS Max:3 S2 03 | 3 0 3 | 1 0 1 |
Number of Sections: 2 Average Students Per Section: 11.50
CTE462 WOODWRK DESGN 6 SM 1 9 5| 5 0 5 | 2 0 2 |
16 JAMES C. WICKENS Max:9 S2 01 | 5 0 5 | 2 0 2 |
Number of Sections: 1 Average Students Per Section: 5.00
CTE466 YEARBOOK 2 SM 1 30 19| 19 16 3 | 0 0 0 |
46 GINA M. SANDLAND Max:30 S2 04 | 19 16 3 | 0 0 0 |
Number of Sections: 1 Average Students Per Section: 19.00
CTE470 WBL GENERIC SM 1 126 0| 0 0 0 | 0 0 0 |
66 JAMES C. WICKENS Max:30 S2 06 | 0 0 0 | 0 0 0 |
76 JAMES C. WICKENS Max:10 S2 07 | 0 0 0 | 0 0 0 |
Number of Sections: 2 Average Students Per Section: 0.00
CTE471 WBL AMER SIGN SM 1 62 0| 0 0 0 | 0 0 0 |
66 JAMES C. WICKENS Max:1 S2 06 | 0 0 0 | 0 0 0 |
76 JAMES C. WICKENS Max:30 S2 07 | 0 0 0 | 0 0 0 |
Number of Sections: 2 Average Students Per Section: 0.00
CTE473 WBL BUS ED SM 1 60 2| 2 1 1 | 0 0 0 |
76 JAMES C. WICKENS Max:30 S2 07 | 2 1 1 | 0 0 0 |
Number of Sections: 1 Average Students Per Section: 2.00
CTE475 WBL COMP TECH SM 1 60 0| 0 0 0 | 0 0 0 |
76 JAMES C. WICKENS Max:30 S2 07 | 0 0 0 | 0 0 0 |
Number of Sections: 1 Average Students Per Section: 0.00
CTE476 WBL CONSTR MANU SM 1 60 5| 5 0 5 | 1 0 1 |
76 JAMES C. WICKENS Max:30 S2 07 | 5 0 5 | 1 0 1 |
Number of Sections: 1 Average Students Per Section: 5.00
CTE477 WBL CULNY ARTS SM 1 60 6| 6 2 4 | 0 0 0 |
76 JAMES C. WICKENS Max:30 S2 07 | 6 2 4 | 0 0 0 |
Number of Sections: 1 Average Students Per Section: 6.00
CTE478 WBL DRAFT ENGIN SM 1 120 0| 0 0 0 | 0 0 0 |
66 JAMES C. WICKENS Max:30 S2 06 | 0 0 0 | 0 0 0 |
76 JAMES C. WICKENS Max:30 S2 07 | 0 0 0 | 0 0 0 |
Number of Sections: 2 Average Students Per Section: 0.00
CTE479 WBL ELECTRONICS SM 1 60 0| 0 0 0 | 0 0 0 |
76 JAMES C. WICKENS Max:30 S2 07 | 0 0 0 | 0 0 0 |
Number of Sections: 1 Average Students Per Section: 0.00
CTE480 WBL FAM CONS SC SM 1 60 10| 10 7 3 | 1 0 1 |
76 JAMES C. WICKENS Max:30 S2 07 | 10 7 3 | 1 0 1 |
Number of Sections: 1 Average Students Per Section: 10.00
CTE481 WBL GPH DES PRO SM 1 60 1| 1 1 0 | 0 0 0 |
76 JAMES C. WICKENS Max:30 S2 07 | 1 1 0 | 0 0 0 |
Number of Sections: 1 Average Students Per Section: 1.00
CTE483 WBL JEWELRY MFG SM 1 62 1| 1 0 1 | 0 0 0 |

1sonyr01.p 38-2 AUBURN RIVERSIDE HIGH SCHOOL 03/02/15 Page:6
05.14.10.00.00 Course/Class Count Report 408 3:09 PM
EST NBR NBR ----TOTALS---- --Special Ed--
COURSE DESCRIPTION LGTH SEC AVL REQ TOT FEM MAL TOT FEM MAL
66 JAMES C. WICKENS Max:1 S2 06 | 0 0 0 | 0 0 0 |
76 JAMES C. WICKENS Max:30 S2 07 | 1 0 1 | 0 0 0 |
Number of Sections: 2 Average Students Per Section: 0.50
CTE484 WBL MARKETING SM 1 60 5| 5 2 3 | 0 0 0 |
76 JAMES C. WICKENS Max:30 S2 07 | 5 2 3 | 0 0 0 |
Number of Sections: 1 Average Students Per Section: 5.00
CTE487 WBL SPORTS MED SM 2 14 1| 1 0 1 | 0 0 0 |
66 JAMES C. WICKENS Max:1 S2 06 | 0 0 0 | 0 0 0 |
76 JAMES C. WICKENS Max:10 S2 07 | 1 0 1 | 0 0 0 |
Number of Sections: 2 Average Students Per Section: 0.50
CTE488 WBL VIS COM SM 1 60 6| 6 4 2 | 0 0 0 |
76 JAMES C. WICKENS Max:30 S2 07 | 6 4 2 | 0 0 0 |
Number of Sections: 1 Average Students Per Section: 6.00
CTE515 NEWSPAPER 2 SM 1 20 12| 12 9 3 | 1 0 1 |
46 PATRICK J. SWENSON Max:20 S2 04 | 11 8 3 | 1 0 1 |
96 PATRICK J. SWENSON Max:0 S2 09 | 1 1 0 | 0 0 0 |
Number of Sections: 2 Average Students Per Section: 6.00
ELL102 ELL LAN ART 1B SM 3 10 6| 6 0 6 | 0 0 0 |
36 CLEROBONG C. CHEAN Max:10 S2 03 | 6 0 6 | 0 0 0 |
Number of Sections: 1 Average Students Per Section: 6.00
ELL121 ELL STDY SKILL2 SM 1 30 20| 20 8 12 | 1 0 1 |
56 CLEROBONG C. CHEAN Max:20 S2 05 | 11 5 6 | 0 0 0 |
66 CLEROBONG C. CHEAN Max:10 S2 06 | 9 3 6 | 1 0 1 |
Number of Sections: 2 Average Students Per Section: 10.00
ELL202 ELL LAN ART 2B SM 1 12 13| 13 6 7 | 0 0 0 |
16 CLEROBONG C. CHEAN Max:12 S2 01 | 13 6 7 | 0 0 0 |
Number of Sections: 1 Average Students Per Section: 13.00
ELL302 ELL LAN ART 3B SM 1 15 10| 10 7 3 | 0 0 0 |
46 CLEROBONG C. CHEAN Max:15 S2 04 | 10 7 3 | 0 0 0 |
Number of Sections: 1 Average Students Per Section: 10.00
ELL810 ELL SUPPORT YR 1 37 26| 26 8 18 | 4 0 4 |
71 CLEROBONG C. CHEAN Max:37 YR 07 | 26 8 18 | 4 0 4 |
Number of Sections: 1 Average Students Per Section: 26.00
FOR202 FRENCH 2 SM 3 90 68| 68 41 27 | 0 0 0 |
16 KIMBERLEE I. POLLEY Max:30 S2 01 | 25 14 11 | 0 0 0 |
26 KIMBERLEE I. POLLEY Max:30 S2 02 | 22 11 11 | 0 0 0 |
36 KIMBERLEE I. POLLEY Max:30 S2 03 | 21 16 5 | 0 0 0 |
Number of Sections: 3 Average Students Per Section: 22.67
FOR204 FRENCH 4 SM 3 60 45| 45 29 16 | 0 0 0 |
16 KAISA SWENDDAL-WHITE Max:30 S2 01 | 24 14 10 | 0 0 0 |
26 KAISA SWENDDAL-WHITE Max:30 S2 02 | 21 15 6 | 0 0 0 |
Number of Sections: 2 Average Students Per Section: 22.50
FOR206 FRENCH 6 SM 1 36 30| 30 26 4 | 0 0 0 |
46 KIMBERLEE I. POLLEY Max:18 S2 04 | 15 12 3 | 0 0 0 |
56 KIMBERLEE I. POLLEY Max:18 S2 05 | 15 14 1 | 0 0 0 |
Number of Sections: 2 Average Students Per Section: 15.00
FOR208 FRENCH 8 SM 1 10 8| 8 7 1 | 0 0 0 |
46 KIMBERLEE I. POLLEY Max:5 S2 04 | 5 5 0 | 0 0 0 |
56 KIMBERLEE I. POLLEY Max:5 S2 05 | 3 2 1 | 0 0 0 |
Number of Sections: 2 Average Students Per Section: 4.00
FOR302 GERMAN 2 SM 2 60 50| 50 16 34 | 2 0 2 |
56 STACY A. BARDSLEY Max:30 S2 05 | 23 7 16 | 1 0 1 |
66 STACY A. BARDSLEY Max:30 S2 06 | 27 9 18 | 1 0 1 |
Number of Sections: 2 Average Students Per Section: 25.00
FOR304 GERMAN 4 SM 2 30 20| 20 4 16 | 0 0 0 |
16 STACY A. BARDSLEY Max:30 S2 01 | 20 4 16 | 0 0 0 |

1sonyr01.p 38-2 AUBURN RIVERSIDE HIGH SCHOOL 03/02/15 Page:7
05.14.10.00.00 Course/Class Count Report 408 3:09 PM
EST NBR NBR ----TOTALS---- --Special Ed--
COURSE DESCRIPTION LGTH SEC AVL REQ TOT FEM MAL TOT FEM MAL
Number of Sections: 1 Average Students Per Section: 20.00
FOR306 GERMAN 6 SM 1 36 28| 28 9 19 | 1 0 1 |
36 STACY A. BARDSLEY Max:18 S2 03 | 10 2 8 | 0 0 0 |
46 STACY A. BARDSLEY Max:18 S2 04 | 18 7 11 | 1 0 1 |
Number of Sections: 2 Average Students Per Section: 14.00
FOR310 AP GERMAN 2 SM 1 5 3| 3 0 3 | 0 0 0 |
46 STACY A. BARDSLEY Max:5 S2 04 | 3 0 3 | 0 0 0 |
Number of Sections: 1 Average Students Per Section: 3.00
FOR402 JAPANESE 2 SM 2 30 26| 26 14 12 | 1 0 1 |
16 AKIKO N. NEWCOMB Max:30 S2 01 | 26 14 12 | 1 0 1 |
Number of Sections: 1 Average Students Per Section: 26.00
FOR404 JAPANESE 4 SM 1 30 24| 24 7 17 | 1 0 1 |
26 AKIKO N. NEWCOMB Max:30 S2 02 | 24 7 17 | 1 0 1 |
Number of Sections: 1 Average Students Per Section: 24.00
FOR406 JAPANESE 6 SM 1 22 11| 11 0 11 | 1 0 1 |
36 AKIKO N. NEWCOMB Max:22 S2 03 | 11 0 11 | 1 0 1 |
Number of Sections: 1 Average Students Per Section: 11.00
FOR408 JAPANESE 8 SM 2 8 4| 4 3 1 | 0 0 0 |
36 AKIKO N. NEWCOMB Max:8 S2 03 | 4 3 1 | 0 0 0 |
Number of Sections: 1 Average Students Per Section: 4.00
FOR602 SPANISH 2 SM 6 210 182| 182 84 98 | 6 3 3 |
17 CAROL A. BARNETT Max:30 S2 01 | 29 14 15 | 1 1 0 |
26 CAROL A. BARNETT Max:30 S2 02 | 29 14 15 | 2 0 2 |
36 BRYCE J. STRAND Max:30 S2 03 | 12 6 6 | 0 0 0 |
37 JUAN F. NUNEZ Max:30 S2 03 | 30 18 12 | 1 1 0 |
46 BRYCE J. STRAND Max:30 S2 04 | 26 8 18 | 0 0 0 |
56 JUAN F. NUNEZ Max:30 S2 05 | 27 13 14 | 1 1 0 |
67 JUAN F. NUNEZ Max:30 S2 06 | 29 11 18 | 1 0 1 |
Number of Sections: 7 Average Students Per Section: 26.00
FOR604 SPANISH 4 SM 7 150 126| 126 63 63 | 2 2 0 |
16 BRYCE J. STRAND Max:30 S2 01 | 21 13 8 | 1 1 0 |
36 CAROL A. BARNETT Max:30 S2 03 | 30 19 11 | 0 0 0 |
37 KAISA SWENDDAL-WHITE Max:30 S2 03 | 22 7 15 | 0 0 0 |
56 KAISA SWENDDAL-WHITE Max:30 S2 05 | 28 14 14 | 1 1 0 |
66 BRYCE J. STRAND Max:30 S2 06 | 25 10 15 | 0 0 0 |
Number of Sections: 5 Average Students Per Section: 25.20
FOR606 SPANISH 6 SM 3 90 79| 79 41 38 | 0 0 0 |
26 JUAN F. NUNEZ Max:30 S2 02 | 29 13 16 | 0 0 0 |
56 CAROL A. BARNETT Max:30 S2 05 | 26 14 12 | 0 0 0 |
66 CAROL A. BARNETT Max:30 S2 06 | 24 14 10 | 0 0 0 |
Number of Sections: 3 Average Students Per Section: 26.33
FOR610 AP SPANISH 2 SM 1 30 13| 13 7 6 | 3 0 3 |
46 JUAN F. NUNEZ Max:30 S2 04 | 13 7 6 | 3 0 3 |
Number of Sections: 1 Average Students Per Section: 13.00
FOR621 UW SPANSH 103B SM 1 30 21| 21 17 4 | 0 0 0 |
46 KAISA SWENDDAL-WHITE Max:30 S2 04 | 21 17 4 | 0 0 0 |
Number of Sections: 1 Average Students Per Section: 21.00
GEN101 ORIENTATION SM 10 270 69| 69 47 22 | 2 0 2 |
26 DAVID R. GOETHALS Max:30 S2 02 | 20 12 8 | 2 0 2 |
27 PAUL M. LEWIS Max:30 S2 02 | 21 15 6 | 0 0 0 |
36 DAVID R. GOETHALS Max:30 S2 03 | 28 20 8 | 0 0 0 |
Number of Sections: 3 Average Students Per Section: 23.00
GEN126 STUDY SKILLS SM 1 55 54| 54 16 38 | 3 0 3 |
96 SCOTT A. HUSAR Max:55 S2 09 | 54 16 38 | 3 0 3 |
Number of Sections: 1 Average Students Per Section: 54.00
GEN200 ADVISORY 9-12 YR 1 840 374| 374 215 159 | 25 7 18 |

1sonyr01.p 38-2 AUBURN RIVERSIDE HIGH SCHOOL 03/02/15 Page:8
05.14.10.00.00 Course/Class Count Report 408 3:09 PM
EST NBR NBR ----TOTALS---- --Special Ed--
COURSE DESCRIPTION LGTH SEC AVL REQ TOT FEM MAL TOT FEM MAL
001 STACY A. BARDSLEY Max:30 YR 10 | 12 3 9 | 1 0 1 |
002 CLEROBONG C. CHEAN Max:30 YR 10 | 5 2 3 | 0 0 0 |
004 CRYSTAL L. CONANT Max:30 YR 10 | 14 9 5 | 0 0 0 |
005 LISA M. GALLINATTI Max:30 YR 10 | 38 28 10 | 0 0 0 |
006 MARK S. DAVIS Max:30 YR 10 | 13 9 4 | 0 0 0 |
008 BRUCE D. DIEHL Max:30 YR 10 | 12 7 5 | 1 1 0 |
010 THOMAS S. EARL Max:30 YR 10 | 11 7 4 | 0 0 0 |
011 MEGAN ELLIS SUMNER Max:30 YR 10 | 13 10 3 | 1 0 1 |
013 JENNIFER W. GARCIA Max:30 YR 10 | 13 5 8 | 2 0 2 |
014 ELAINE M. HETTERLY Max:30 YR 10 | 10 2 8 | 8 2 6 |
015 SCOTT A. HUSAR Max:30 YR 10 | 13 11 2 | 0 0 0 |
016 CRYSTAL L. JILBERT Max:30 YR 10 | 14 10 4 | 0 0 0 |
018 PATRICK M. MCKEEHAN I Max:30 YR 10 | 14 9 5 | 0 0 0 |
020 ANGELA K. MCCAUSLAND Max:30 YR 10 | 13 4 9 | 3 0 3 |
023 ROBERT L. MORGAN Max:30 YR 10 | 12 6 6 | 3 1 2 |
025 PHILIP J. MYKA Max:30 YR 10 | 13 10 3 | 0 0 0 |
029 KARYN L. WILLIAMSON Max:30 YR 10 | 14 9 5 | 1 0 1 |
031 GERI A. ROHLFF Max:30 YR 10 | 15 7 8 | 0 0 0 |
032 ROBYN N. SAARENAS Max:30 YR 10 | 13 1 12 | 0 0 0 |
033 GINA M. SANDLAND Max:30 YR 10 | 13 7 6 | 1 0 1 |
035 JUDITH J. SHAW Max:30 YR 10 | 13 10 3 | 1 1 0 |
037 BRYCE J. STRAND Max:30 YR 10 | 11 10 1 | 1 1 0 |
038 GEORGE W. SUMNER Max:30 YR 10 | 12 5 7 | 0 0 0 |
042 CHRISTOPHER T. TUCKER Max:30 YR 10 | 13 11 2 | 1 0 1 |
043 MICHAEL VAN EATON Max:30 YR 10 | 12 3 9 | 0 0 0 |
044 MEGHAN E. WAGNER Max:30 YR 10 | 12 8 4 | 0 0 0 |
045 JAMES C. WICKENS Max:30 YR 10 | 13 5 8 | 1 1 0 |
049 ERNEST E. ZEIGER Max:30 YR 10 | 13 7 6 | 0 0 0 |
Number of Sections: 28 Average Students Per Section: 13.36
GEN300 STUDY SKILLS SM 13 116 103| 103 46 57 | 18 5 13 |
16 RALPH L. CUBIT Max:5 S2 01 | 6 3 3 | 2 0 2 |
19 SHAWN P. KILGALLON Max:0 S2 01 | 36 15 21 | 2 1 1 |
26 SHAWN A. MARTINSON Max:24 S2 02 | 23 11 12 | 2 0 2 |
26B GERI A. ROHLFF Max:1 S2 02 | 1 1 0 | 0 0 0 |
27 RALPH L. CUBIT Max:5 S2 02 | 6 2 4 | 3 1 2 |
36 RALPH L. CUBIT Max:5 S2 03 | 5 1 4 | 1 0 1 |
37 STACY A. BARDSLEY Max:10 S2 03 | 10 6 4 | 3 0 3 |
46 RALPH L. CUBIT Max:5 S2 04 | 6 2 4 | 1 1 0 |
47 STACY A. BARDSLEY Max:4 S2 04 | 8 4 4 | 2 1 1 |
56B ELAINE M. HETTERLY Max:2 S2 05 | 2 1 1 | 2 1 1 |
Number of Sections: 10 Average Students Per Section: 10.30
GEN301 STUDY SKILLS SM 3 25 25| 25 11 14 | 4 1 3 |
36D GERI A. ROHLFF Max:1 S2 03 | 1 1 0 | 0 0 0 |
66 GERI A. ROHLFF Max:24 S2 06 | 24 10 14 | 4 1 3 |
Number of Sections: 2 Average Students Per Section: 12.50
GEN500 ADM OFF AIDE SM 1 15 3| 3 0 3 | 1 0 1 |
16 NOLA R. WILSON Max:1 S2 01 | 1 0 1 | 0 0 0 |
26 NOLA R. WILSON Max:1 S2 02 | 0 0 0 | 0 0 0 |
36 NOLA R. WILSON Max:1 S2 03 | 0 0 0 | 0 0 0 |
46 NOLA R. WILSON Max:1 S2 04 | 1 0 1 | 1 0 1 |
56 NOLA R. WILSON Max:1 S2 05 | 0 0 0 | 0 0 0 |
66 NOLA R. WILSON Max:1 S2 06 | 1 0 1 | 0 0 0 |
96 NOLA R. WILSON Max:0 S2 09 | 0 0 0 | 0 0 0 |
Number of Sections: 7 Average Students Per Section: 0.43
GEN501 ADM OFF AIDE SM 1 2 0| 0 0 0 | 0 0 0 |
16 NOLA R. WILSON Max:2 S2 01 | 0 0 0 | 0 0 0 |

1sonyr01.p 38-2 AUBURN RIVERSIDE HIGH SCHOOL 03/02/15 Page:9
05.14.10.00.00 Course/Class Count Report 408 3:09 PM
EST NBR NBR ----TOTALS---- --Special Ed--
COURSE DESCRIPTION LGTH SEC AVL REQ TOT FEM MAL TOT FEM MAL
76 NOLA R. WILSON Max:0 S2 07 | 0 0 0 | 0 0 0 |
Number of Sections: 2 Average Students Per Section: 0.00
GEN504 ASB AIDE SM 1 9 3| 3 3 0 | 0 0 0 |
16 MERI M. BENEDICT Max:2 S2 01 | 1 1 0 | 0 0 0 |
26 MERI M. BENEDICT Max:2 S2 02 | 1 1 0 | 0 0 0 |
36 MERI M. BENEDICT Max:1 S2 03 | 0 0 0 | 0 0 0 |
46 MERI M. BENEDICT Max:1 S2 04 | 0 0 0 | 0 0 0 |
56 MERI M. BENEDICT Max:1 S2 05 | 0 0 0 | 0 0 0 |
66 MERI M. BENEDICT Max:2 S2 06 | 1 1 0 | 0 0 0 |
Number of Sections: 6 Average Students Per Section: 0.50
GEN507 ATTEND AIDE SM 6 33 2| 2 1 1 | 0 0 0 |
96 JON D. AARSTAD Max:0 S2 09 | 2 1 1 | 0 0 0 |
Number of Sections: 1 Average Students Per Section: 2.00
GEN508 ATTEND AIDE SM 2 24 23| 23 21 2 | 4 3 1 |
16 JON D. AARSTAD Max:4 S2 01 | 4 4 0 | 1 1 0 |
26 JON D. AARSTAD Max:4 S2 02 | 4 3 1 | 1 0 1 |
36 JON D. AARSTAD Max:4 S2 03 | 3 2 1 | 0 0 0 |
46 JON D. AARSTAD Max:4 S2 04 | 4 4 0 | 1 1 0 |
56 JON D. AARSTAD Max:4 S2 05 | 4 4 0 | 1 1 0 |
66 JON D. AARSTAD Max:4 S2 06 | 4 4 0 | 0 0 0 |
76 JON D. AARSTAD Max:0 S2 07 | 0 0 0 | 0 0 0 |
Number of Sections: 7 Average Students Per Section: 3.29
GEN510 CAREER AIDE SM 3 5 11| 11 4 7 | 1 1 0 |
16 STEVEN H. MEAD Max:1 S2 01 | 2 1 1 | 0 0 0 |
26 STEVEN H. MEAD Max:1 S2 02 | 2 0 2 | 0 0 0 |
36 STEVEN H. MEAD Max:1 S2 03 | 1 0 1 | 0 0 0 |
46 STEVEN H. MEAD Max:0 S2 04 | 1 1 0 | 0 0 0 |
56 STEVEN H. MEAD Max:1 S2 05 | 4 1 3 | 0 0 0 |
66 STEVEN H. MEAD Max:1 S2 06 | 1 1 0 | 1 1 0 |
Number of Sections: 6 Average Students Per Section: 1.83
GEN512 GUID OFF AIDE SM 1 18 20| 20 14 6 | 1 0 1 |
16 DANIEL J. POLLEY Max:2 S2 01 | 3 3 0 | 0 0 0 |
26 DANIEL J. POLLEY Max:3 S2 02 | 3 2 1 | 0 0 0 |
36 DANIEL J. POLLEY Max:2 S2 03 | 3 2 1 | 0 0 0 |
46 DANIEL J. POLLEY Max:3 S2 04 | 4 3 1 | 0 0 0 |
56 DANIEL J. POLLEY Max:4 S2 05 | 3 2 1 | 0 0 0 |
66 DANIEL J. POLLEY Max:4 S2 06 | 3 2 1 | 0 0 0 |
76 DANIEL J. POLLEY Max:0 S2 07 | 0 0 0 | 0 0 0 |
96 DANIEL J. POLLEY Max:0 S2 09 | 1 0 1 | 1 0 1 |
Number of Sections: 8 Average Students Per Section: 2.50
GEN514 LIBRARY AIDE SM 2 15 14| 14 5 9 | 4 1 3 |
16 LISA M. GALLINATTI Max:2 S2 01 | 2 0 2 | 1 0 1 |
26 LISA M. GALLINATTI Max:2 S2 02 | 2 1 1 | 2 1 1 |
36 LISA M. GALLINATTI Max:2 S2 03 | 2 0 2 | 0 0 0 |
46 LISA M. GALLINATTI Max:2 S2 04 | 2 2 0 | 0 0 0 |
56 LISA M. GALLINATTI Max:2 S2 05 | 2 0 2 | 0 0 0 |
66 LISA M. GALLINATTI Max:2 S2 06 | 3 2 1 | 1 0 1 |
76 LISA M. GALLINATTI Max:1 S2 07 | 0 0 0 | 0 0 0 |
96 LISA M. GALLINATTI Max:2 S2 09 | 1 0 1 | 0 0 0 |
Number of Sections: 8 Average Students Per Section: 1.75
GEN600 TEACHER AIDE SM 2 500 27| 27 16 11 | 1 1 0 |
11G FRANK MEDINA Max:1 S2 01 | 0 0 0 | 0 0 0 |
16 SHAWNA R. LEONARD Max:35 S2 01 | 0 0 0 | 0 0 0 |
16B JULIE A. MOBERG Max:1 S2 01 | 1 1 0 | 0 0 0 |
16C CRYSTAL L. CONANT Max:1 S2 01 | 1 1 0 | 0 0 0 |
16G CINDY L. ANDERSON Max:1 S2 01 | 1 1 0 | 0 0 0 |

1sonyr01.p 38-2 AUBURN RIVERSIDE HIGH SCHOOL 03/02/15 Page:10
05.14.10.00.00 Course/Class Count Report 408 3:09 PM
EST NBR NBR ----TOTALS---- --Special Ed--
COURSE DESCRIPTION LGTH SEC AVL REQ TOT FEM MAL TOT FEM MAL
16H ROBYN N. SAARENAS Max:1 S2 01 | 1 0 1 | 0 0 0 |
26 SHAWNA R. LEONARD Max:35 S2 02 | 0 0 0 | 0 0 0 |
26A GEORGE W. SUMNER Max:1 S2 02 | 0 0 0 | 0 0 0 |
26B CINDY L. ANDERSON Max:1 S2 02 | 1 0 1 | 0 0 0 |
26C ROBYN N. SAARENAS Max:1 S2 02 | 0 0 0 | 0 0 0 |
26D CHRISTOPHER T. TUCKER Max:1 S2 02 | 1 1 0 | 0 0 0 |
26E ROBERT L. MORGAN Max:1 S2 02 | 1 0 1 | 0 0 0 |
26F CHRISTIAN M. MILLER Max:1 S2 02 | 1 1 0 | 0 0 0 |
26G FRANK MEDINA Max:1 S2 02 | 1 0 1 | 0 0 0 |
26H SCOTT A. HUSAR Max:1 S2 02 | 1 0 1 | 0 0 0 |
26I SHAWN A. MARTINSON Max:1 S2 02 | 1 1 0 | 0 0 0 |
36 SHAWNA R. LEONARD Max:35 S2 03 | 0 0 0 | 0 0 0 |
36A STACY A. BARDSLEY Max:1 S2 03 | 0 0 0 | 0 0 0 |
36B SCOTT J. ROWE Max:1 S2 03 | 1 1 0 | 0 0 0 |
36C ANGELA K. MCCAUSLAND Max:1 S2 03 | 1 1 0 | 1 1 0 |
36D CRYSTAL L. JILBERT Max:1 S2 03 | 0 0 0 | 0 0 0 |
36G WENDY S. WOLDENBERG Max:1 S2 03 | 1 0 1 | 0 0 0 |
36L GINA M. SANDLAND Max:1 S2 03 | 1 0 1 | 0 0 0 |
36M CRYSTAL L. CONANT Max:1 S2 03 | 0 0 0 | 0 0 0 |
36N CHRISTINE S. AREND Max:1 S2 03 | 1 1 0 | 0 0 0 |
46 SHAWNA R. LEONARD Max:35 S2 04 | 0 0 0 | 0 0 0 |
46A CHRISTOPHER T. TUCKER Max:1 S2 04 | 1 1 0 | 0 0 0 |
46B KELLY A. JENSEN Max:1 S2 04 | 1 1 0 | 0 0 0 |
46C SHAWN A. MARTINSON Max:1 S2 04 | 1 1 0 | 0 0 0 |
46G CRYSTAL L. CONANT Max:1 S2 04 | 1 1 0 | 0 0 0 |
46H ANGELA K. MCCAUSLAND Max:1 S2 04 | 1 0 1 | 0 0 0 |
56 SHAWNA R. LEONARD Max:35 S2 05 | 0 0 0 | 0 0 0 |
56G GEORGE W. SUMNER Max:1 S2 05 | 0 0 0 | 0 0 0 |
61G ELAINE M. HETTERLY Max:1 S2 06 | 0 0 0 | 0 0 0 |
61J BRUCE D. DIEHL Max:1 S2 06 | 1 0 1 | 0 0 0 |
61L ROBYN N. SAARENAS Max:1 S2 06 | 1 1 0 | 0 0 0 |
61P THOMAS S. EARL Max:1 S2 06 | 1 1 0 | 0 0 0 |
66 SHAWNA R. LEONARD Max:35 S2 06 | 0 0 0 | 0 0 0 |
66A STACY A. BARDSLEY Max:1 S2 06 | 1 0 1 | 0 0 0 |
66B CRYSTAL L. JILBERT Max:1 S2 06 | 0 0 0 | 0 0 0 |
66C CHRISTIAN M. MILLER Max:1 S2 06 | 0 0 0 | 0 0 0 |
66D KYLE B. JONES Max:1 S2 06 | 1 0 1 | 0 0 0 |
66M ARTHUR BENARD III Max:1 S2 06 | 1 1 0 | 0 0 0 |
Number of Sections: 43 Average Students Per Section: 0.63
GEN601 TEACHER AIDE SM 1 234 23| 23 14 9 | 2 1 1 |
15 ANGELA K. MCCAUSLAND Max:1 S2 01 | 1 1 0 | 0 0 0 |
16 SHAWNA R. LEONARD Max:35 S2 01 | 0 0 0 | 0 0 0 |
16A MICHAEL T. HUYLAR Max:1 S2 01 | 1 1 0 | 1 1 0 |
16E GINA M. SANDLAND Max:1 S2 01 | 1 1 0 | 0 0 0 |
26 SHAWNA R. LEONARD Max:35 S2 02 | 0 0 0 | 0 0 0 |
26A EDWARD K. ROSIN Max:1 S2 02 | 1 1 0 | 0 0 0 |
26D FRANK MEDINA Max:1 S2 02 | 1 0 1 | 0 0 0 |
26w JULIE A. MOBERG Max:1 S2 02 | 1 1 0 | 0 0 0 |
35 CRYSTAL L. CONANT Max:1 S2 03 | 1 1 0 | 0 0 0 |
36 SHAWNA R. LEONARD Max:35 S2 03 | 0 0 0 | 0 0 0 |
36A KATHRYN A. NUTTMAN Max:1 S2 03 | 1 1 0 | 0 0 0 |
36B SCOTT A. HUSAR Max:1 S2 03 | 1 1 0 | 0 0 0 |
36C ERNEST E. ZEIGER Max:1 S2 03 | 1 0 1 | 0 0 0 |
36D ROBYN N. SAARENAS Max:1 S2 03 | 1 1 0 | 0 0 0 |
36H GEORGE W. SUMNER Max:1 S2 03 | 0 0 0 | 0 0 0 |
45 WENDY S. WOLDENBERG Max:1 S2 04 | 1 0 1 | 0 0 0 |

1sonyr01.p 38-2 AUBURN RIVERSIDE HIGH SCHOOL 03/02/15 Page:11
05.14.10.00.00 Course/Class Count Report 408 3:09 PM
EST NBR NBR ----TOTALS---- --Special Ed--
COURSE DESCRIPTION LGTH SEC AVL REQ TOT FEM MAL TOT FEM MAL
46 SHAWNA R. LEONARD Max:35 S2 04 | 0 0 0 | 0 0 0 |
46A DAMIAH C. SALOY Max:1 S2 04 | 1 0 1 | 0 0 0 |
46B BRYCE J. STRAND Max:1 S2 04 | 1 1 0 | 0 0 0 |
46P KATHRYN A. NUTTMAN Max:1 S2 04 | 1 1 0 | 0 0 0 |
46W CHRISTINE S. AREND Max:1 S2 04 | 1 0 1 | 0 0 0 |
56 SHAWNA R. LEONARD Max:35 S2 05 | 0 0 0 | 0 0 0 |
56A STACY A. BARDSLEY Max:1 S2 05 | 1 0 1 | 0 0 0 |
56B ARTHUR BENARD III Max:1 S2 05 | 1 0 1 | 0 0 0 |
56D KELLY A. JENSEN Max:1 S2 05 | 1 0 1 | 1 0 1 |
66 SHAWNA R. LEONARD Max:35 S2 06 | 0 0 0 | 0 0 0 |
66A JULIE A. MOBERG Max:1 S2 06 | 1 1 0 | 0 0 0 |
66N PHILIP J. MYKA Max:1 S2 06 | 1 1 0 | 0 0 0 |
66X JANALYN R. MCKEEHAN Max:1 S2 06 | 1 1 0 | 0 0 0 |
69 NOE M. YZAGUIRRE Max:1 S2 06 | 1 0 1 | 0 0 0 |
Number of Sections: 30 Average Students Per Section: 0.77
GEN700 RELEASE TIME SM 2 292 81| 81 52 29 | 11 5 6 |
16 DAVID L. HALFORD JR Max:30 S2 01 | 23 17 6 | 3 1 2 |
26 DAVID L. HALFORD JR Max:10 S2 02 | 11 7 4 | 1 0 1 |
36 DAVID L. HALFORD JR Max:39 S2 03 | 9 6 3 | 1 1 0 |
46 DAVID L. HALFORD JR Max:10 S2 04 | 10 6 4 | 2 1 1 |
56 DAVID L. HALFORD JR Max:30 S2 05 | 9 5 4 | 2 1 1 |
66 DAVID L. HALFORD JR Max:30 S2 06 | 19 11 8 | 2 1 1 |
Number of Sections: 6 Average Students Per Section: 13.50
GEN701 REL-SEMINARY YR 1 20 11| 11 4 7 | 0 0 0 |
11 SHAWNA R. LEONARD Max:10 YR 01 | 6 2 4 | 0 0 0 |
61 SHAWNA R. LEONARD Max:10 YR 06 | 5 2 3 | 0 0 0 |
Number of Sections: 2 Average Students Per Section: 5.50
GEN706 C L MONITORING YR 1 147 106| 106 28 78 | 104 27 77 |
71 RALPH L. CUBIT Max:34 YR 07 | 6 2 4 | 5 2 3 |
72 ELAINE M. HETTERLY Max:34 YR 07 | 29 14 15 | 29 14 15 |
73 ANGELA K. MCCAUSLAND Max:25 YR 07 | 25 4 21 | 25 4 21 |
74 PATRICIA A. BACHELDER Max:20 YR 07 | 15 4 11 | 15 4 11 |
75 KYLE B. JONES Max:34 YR 07 | 31 4 27 | 30 3 27 |
Number of Sections: 5 Average Students Per Section: 21.20
GEN710 RUNNING START SM 10 957 539| 539 404 135 | 0 0 0 |
16 DANIEL J. POLLEY Max:75 S2 01 | 87 63 24 | 0 0 0 |
26 DANIEL J. POLLEY Max:80 S2 02 | 93 69 24 | 0 0 0 |
36 DANIEL J. POLLEY Max:79 S2 03 | 93 71 22 | 0 0 0 |
46 DANIEL J. POLLEY Max:85 S2 04 | 92 68 24 | 0 0 0 |
56 DANIEL J. POLLEY Max:80 S2 05 | 83 63 20 | 0 0 0 |
66 DANIEL J. POLLEY Max:77 S2 06 | 91 70 21 | 0 0 0 |
Number of Sections: 6 Average Students Per Section: 89.83
GEN740 RS-PART TIME SM 1 80 34| 34 27 7 | 0 0 0 |
96 DANIEL J. POLLEY Max:80 S2 09 | 34 27 7 | 0 0 0 |
Number of Sections: 1 Average Students Per Section: 34.00
GEN741 RS-FULL TIME SM 1 80 53| 53 39 14 | 0 0 0 |
96 DANIEL J. POLLEY Max:80 S2 09 | 53 39 14 | 0 0 0 |
Number of Sections: 1 Average Students Per Section: 53.00
GEN805 LEADERSHIP SM 2 30 22| 22 11 11 | 3 0 3 |
26 MERI M. BENEDICT Max:30 S2 02 | 22 11 11 | 3 0 3 |
Number of Sections: 1 Average Students Per Section: 22.00
GEN806 ADV LEADERSHIP SM 1 60 33| 33 26 7 | 0 0 0 |
96 MERI M. BENEDICT Max:30 S2 09 | 33 26 7 | 0 0 0 |
Number of Sections: 1 Average Students Per Section: 33.00
GEN814 AHS AUTO TECH YR 1 18 8| 8 0 8 | 0 0 0 |
11 SHAWNA R. LEONARD Max:10 YR 01 | 3 0 3 | 0 0 0 |

1sonyr01.p 38-2 AUBURN RIVERSIDE HIGH SCHOOL 03/02/15 Page:12
05.14.10.00.00 Course/Class Count Report 408 3:09 PM
EST NBR NBR ----TOTALS---- --Special Ed--
COURSE DESCRIPTION LGTH SEC AVL REQ TOT FEM MAL TOT FEM MAL
51 SHAWNA R. LEONARD Max:8 YR 05 | 5 0 5 | 0 0 0 |
Number of Sections: 2 Average Students Per Section: 4.00
GEN815 AHS ADV AUTOTEC YR 1 1 0| 0 0 0 | 0 0 0 |
41 SHAWNA R. LEONARD Max:1 YR 04 | 0 0 0 | 0 0 0 |
Number of Sections: 1 Average Students Per Section: 0.00
GEN816 AHS WELDING YR 1 1 0| 0 0 0 | 0 0 0 |
11 SHAWNA R. LEONARD Max:1 YR 01 | 0 0 0 | 0 0 0 |
Number of Sections: 1 Average Students Per Section: 0.00
GEN817 AHS MACH TRNG YR 1 15 1| 1 0 1 | 1 0 1 |
11 SHAWNA R. LEONARD Max:15 YR 01 | 1 0 1 | 1 0 1 |
Number of Sections: 1 Average Students Per Section: 1.00
GEN825 HOME SCHOOL YR 1 0 0| 0 0 0 | 0 0 0 |
GEN830 EARLY GRAD SM 1 0 0| 0 0 0 | 0 0 0 |
GEN834 AFTR SCHL PRG 1 SM 1 93 32| 32 14 18 | 2 1 1 |
73 GERI A. ROHLFF Max:30 S2 07 | 32 14 18 | 2 1 1 |
Number of Sections: 1 Average Students Per Section: 32.00
GEN840 AMHS JROTC SM 1 50 10| 10 1 9 | 1 0 1 |
16 SHAWNA R. LEONARD Max:20 S2 01 | 10 1 9 | 1 0 1 |
Number of Sections: 1 Average Students Per Section: 10.00
GEN843 WAHS INT GAMING SM 1 62 1| 1 0 1 | 0 0 0 |
16A DANIEL J. POLLEY Max:1 S2 01 | 1 0 1 | 0 0 0 |
Number of Sections: 1 Average Students Per Section: 1.00
HLT100 HEALTH SM 12 414 203| 203 102 101 | 12 2 10 |
16 MERI M. BENEDICT Max:30 S2 01 | 31 17 14 | 0 0 0 |
17 MARCUS A. EVANS Max:30 S2 01 | 30 15 15 | 2 1 1 |
36 MARCUS A. EVANS Max:30 S2 03 | 29 13 16 | 2 1 1 |
46 MARCUS A. EVANS Max:30 S2 04 | 31 21 10 | 2 0 2 |
56 MARCUS A. EVANS Max:30 S2 05 | 30 8 22 | 2 0 2 |
57 KELLY A. JENSEN Max:24 S2 05 | 24 17 7 | 1 0 1 |
66 MARCUS A. EVANS Max:30 S2 06 | 28 11 17 | 3 0 3 |
Number of Sections: 7 Average Students Per Section: 29.00
LAN121 LA 9 2 SM 9 240 295| 295 144 151 | 5 0 5 |
16 JENNIFER W. GARCIA Max:30 S2 01 | 30 17 13 | 0 0 0 |
19 NOE M. YZAGUIRRE Max:0 S2 01 | 54 16 38 | 3 0 3 |
36 JENNIFER M. CZARNOWSK Max:30 S2 03 | 30 13 17 | 0 0 0 |
46 JENNIFER M. CZARNOWSK Max:30 S2 04 | 30 17 13 | 1 0 1 |
47 KATHRYN A. NUTTMAN Max:30 S2 04 | 30 15 15 | 0 0 0 |
56 NOE M. YZAGUIRRE Max:30 S2 05 | 31 20 11 | 0 0 0 |
57 JENNIFER W. GARCIA Max:30 S2 05 | 30 12 18 | 0 0 0 |
66 NOE M. YZAGUIRRE Max:30 S2 06 | 30 14 16 | 1 0 1 |
67 JENNIFER W. GARCIA Max:30 S2 06 | 30 20 10 | 0 0 0 |
Number of Sections: 9 Average Students Per Section: 32.78
LAN131 LA 9 HONORS 2 SM 4 150 137| 137 88 49 | 0 0 0 |
16 KARYN L. WILLIAMSON Max:30 S2 01 | 27 19 8 | 0 0 0 |
26 KARYN L. WILLIAMSON Max:30 S2 02 | 30 17 13 | 0 0 0 |
36 KARYN L. WILLIAMSON Max:30 S2 03 | 23 14 9 | 0 0 0 |
56 JENNIFER M. CZARNOWSK Max:30 S2 05 | 27 18 9 | 0 0 0 |
66 JENNIFER M. CZARNOWSK Max:30 S2 06 | 30 20 10 | 0 0 0 |
Number of Sections: 5 Average Students Per Section: 27.40
LAN211 LA 10 BASIC 2 SM 1 20 15| 15 8 7 | 3 2 1 |
26 SHAWN P. KILGALLON Max:20 S2 02 | 15 8 7 | 3 2 1 |
Number of Sections: 1 Average Students Per Section: 15.00
LAN221 LA 10 2 SM 10 243 214| 214 102 112 | 6 2 4 |
16 KATHRYN A. NUTTMAN Max:27 S2 01 | 25 12 13 | 0 0 0 |
26 KATHRYN A. NUTTMAN Max:27 S2 02 | 26 15 11 | 0 0 0 |
36 ANGELA O. RIGLEY BERG Max:27 S2 03 | 19 8 11 | 1 0 1 |

1sonyr01.p 38-2 AUBURN RIVERSIDE HIGH SCHOOL 03/02/15 Page:13
05.14.10.00.00 Course/Class Count Report 408 3:09 PM
EST NBR NBR ----TOTALS---- --Special Ed--
COURSE DESCRIPTION LGTH SEC AVL REQ TOT FEM MAL TOT FEM MAL
37 GLENN M. DICKSON Max:27 S2 03 | 23 11 12 | 2 1 1 |
46 KARYN L. WILLIAMSON Max:27 S2 04 | 25 9 16 | 1 0 1 |
47 GLENN M. DICKSON Max:27 S2 04 | 25 10 15 | 0 0 0 |
56 ANGELA O. RIGLEY BERG Max:27 S2 05 | 22 10 12 | 0 0 0 |
57 GLENN M. DICKSON Max:27 S2 05 | 23 14 9 | 1 1 0 |
66 KATHRYN A. NUTTMAN Max:27 S2 06 | 26 13 13 | 1 0 1 |
Number of Sections: 9 Average Students Per Section: 23.78
LAN231 LA 10 HONORS 2 SM 5 120 111| 111 81 30 | 0 0 0 |
26 ANGELA O. RIGLEY BERG Max:30 S2 02 | 31 21 10 | 0 0 0 |
36 SHAWN P. KILGALLON Max:30 S2 03 | 24 17 7 | 0 0 0 |
46 SHAWN P. KILGALLON Max:30 S2 04 | 31 25 6 | 0 0 0 |
66 ANGELA O. RIGLEY BERG Max:30 S2 06 | 25 18 7 | 0 0 0 |
Number of Sections: 4 Average Students Per Section: 27.75
LAN302 LA INTERVEN 2 SM 1 30 11| 11 4 7 | 0 0 0 |
36 CRYSTAL L. CONANT Max:30 S2 03 | 11 4 7 | 0 0 0 |
Number of Sections: 1 Average Students Per Section: 11.00
LAN311 AM LIT BASIC 2 SM 1 20 20| 20 4 16 | 4 1 3 |
36 TIMOTHY A. WRIGHT Max:20 S2 03 | 20 4 16 | 4 1 3 |
Number of Sections: 1 Average Students Per Section: 20.00
LAN321 AMER LIT 2 SM 9 270 213| 213 71 142 | 11 7 4 |
16 SUSAN L. NEU Max:30 S2 01 | 28 11 17 | 1 1 0 |
17 GLENN M. DICKSON Max:30 S2 01 | 30 8 22 | 1 1 0 |
26 SUSAN L. NEU Max:30 S2 02 | 24 11 13 | 0 0 0 |
27 CRYSTAL L. CONANT Max:30 S2 02 | 24 9 15 | 1 0 1 |
46 CRYSTAL L. CONANT Max:30 S2 04 | 30 6 24 | 2 1 1 |
56 CRYSTAL L. CONANT Max:30 S2 05 | 20 7 13 | 2 1 1 |
57 SHAWN P. KILGALLON Max:30 S2 05 | 15 5 10 | 2 1 1 |
66 SHAWN P. KILGALLON Max:30 S2 06 | 24 9 15 | 1 1 0 |
67 GLENN M. DICKSON Max:30 S2 06 | 18 5 13 | 1 1 0 |
Number of Sections: 9 Average Students Per Section: 23.67
LAN331 AP LAN/COMP 2 SM 5 120 86| 86 59 27 | 0 0 0 |
16 TIMOTHY A. WRIGHT Max:30 S2 01 | 23 15 8 | 0 0 0 |
26 TIMOTHY A. WRIGHT Max:30 S2 02 | 23 17 6 | 0 0 0 |
36 SUSAN L. NEU Max:30 S2 03 | 18 12 6 | 0 0 0 |
46 SUSAN L. NEU Max:30 S2 04 | 22 15 7 | 0 0 0 |
Number of Sections: 4 Average Students Per Section: 21.50
LAN410 COMMUN ARTS SM 2 60 30| 30 19 11 | 1 0 1 |
16 ANGELA O. RIGLEY BERG Max:30 S2 01 | 30 19 11 | 1 0 1 |
Number of Sections: 1 Average Students Per Section: 30.00
LAN412 SOC OF FUTURE SM 3 90 28| 28 11 17 | 0 0 0 |
36 PATRICK J. SWENSON Max:30 S2 03 | 28 11 17 | 0 0 0 |
Number of Sections: 1 Average Students Per Section: 28.00
LAN413 INDIV LIT 1 SM 6 73 38| 38 16 22 | 2 0 2 |
26 GERI A. ROHLFF Max:14 S2 02 | 13 4 9 | 2 0 2 |
36 GERI A. ROHLFF Max:14 S2 03 | 11 4 7 | 0 0 0 |
46 GERI A. ROHLFF Max:14 S2 04 | 14 8 6 | 0 0 0 |
Number of Sections: 3 Average Students Per Section: 12.67
LAN414 INDIV LIT 2 SM 3 48 35| 35 19 16 | 3 1 2 |
26 GERI A. ROHLFF Max:16 S2 02 | 10 5 5 | 1 0 1 |
36 GERI A. ROHLFF Max:16 S2 03 | 9 5 4 | 2 1 1 |
46 GERI A. ROHLFF Max:16 S2 04 | 16 9 7 | 0 0 0 |
Number of Sections: 3 Average Students Per Section: 11.67
LAN415 SPORTS LIT SM 3 60 27| 27 11 16 | 0 0 0 |
16 CRYSTAL L. CONANT Max:30 S2 01 | 27 11 16 | 0 0 0 |
Number of Sections: 1 Average Students Per Section: 27.00
LAN416 CREATIVE WRIT SM 4 115 61| 61 40 21 | 2 0 2 |

1sonyr01.p 38-2 AUBURN RIVERSIDE HIGH SCHOOL 03/02/15 Page:14
05.14.10.00.00 Course/Class Count Report 408 3:09 PM
EST NBR NBR ----TOTALS---- --Special Ed--
COURSE DESCRIPTION LGTH SEC AVL REQ TOT FEM MAL TOT FEM MAL
26 JENNIFER W. GARCIA Max:25 S2 02 | 15 8 7 | 2 0 2 |
46 JENNIFER W. GARCIA Max:25 S2 04 | 15 8 7 | 0 0 0 |
47 PATRICK J. SWENSON Max:15 S2 04 | 9 8 1 | 0 0 0 |
57 PATRICK J. SWENSON Max:25 S2 05 | 22 16 6 | 0 0 0 |
Number of Sections: 4 Average Students Per Section: 15.25
LAN417 COLLEGE WRITING SM 9 200 40| 40 23 17 | 0 0 0 |
16 GERI A. ROHLFF Max:25 S2 01 | 16 11 5 | 0 0 0 |
56 TIMOTHY A. WRIGHT Max:25 S2 05 | 11 8 3 | 0 0 0 |
66 TIMOTHY A. WRIGHT Max:25 S2 06 | 13 4 9 | 0 0 0 |
Number of Sections: 3 Average Students Per Section: 13.33
LAN431 AP LIT/COMP 2 SM 2 60 38| 38 27 11 | 0 0 0 |
16 PATRICK J. SWENSON Max:30 S2 01 | 16 15 1 | 0 0 0 |
26 PATRICK J. SWENSON Max:30 S2 02 | 22 12 10 | 0 0 0 |
Number of Sections: 2 Average Students Per Section: 19.00
LAN515 NEWSPAPER 2 SM 1 0 0| 0 0 0 | 0 0 0 |
MAT101 MATH INTERVTN 2 SM 1 0 23| 23 15 8 | 0 0 0 |
36 JERRY N. JAZBEC Max:0 S2 03 | 1 1 0 | 0 0 0 |
46 MICHAEL T. HUYLAR Max:0 S2 04 | 22 14 8 | 0 0 0 |
Number of Sections: 2 Average Students Per Section: 11.50
MAT120 ALGEBRA 1 SM 11 313 55| 55 25 30 | 4 0 4 |
56 JERRY N. JAZBEC Max:30 S2 05 | 30 16 14 | 2 0 2 |
66 JERRY N. JAZBEC Max:30 S2 06 | 25 9 16 | 2 0 2 |
Number of Sections: 2 Average Students Per Section: 27.50
MAT121 ALGEBRA 2 SM 13 265 303| 303 166 137 | 19 5 14 |
16 ROBERT L. MORGAN Max:27 S2 01 | 29 17 12 | 2 0 2 |
17 KEVIN L. OLSON Max:27 S2 01 | 29 21 8 | 1 1 0 |
26 ROBERT L. MORGAN Max:27 S2 02 | 28 20 8 | 2 1 1 |
29 SCOTT A. HUSAR Max:0 S2 02 | 54 16 38 | 3 0 3 |
36 KEVIN L. OLSON Max:27 S2 03 | 28 15 13 | 2 1 1 |
39 MICHAEL T. HUYLAR Max:0 S2 03 | 22 14 8 | 0 0 0 |
46 ROBERT L. MORGAN Max:27 S2 04 | 28 14 14 | 1 0 1 |
47 KEVIN L. OLSON Max:27 S2 04 | 28 16 12 | 2 0 2 |
48 SCOTT J. ROWE Max:27 S2 04 | 29 14 15 | 2 1 1 |
66 MICHAEL T. HUYLAR Max:27 S2 06 | 28 19 9 | 4 1 3 |
Number of Sections: 10 Average Students Per Section: 30.30
MAT122 ADV HS MATH 1 SM 1 50 13| 13 9 4 | 0 0 0 |
56 MICHAEL T. HUYLAR Max:25 S2 05 | 13 9 4 | 0 0 0 |
Number of Sections: 1 Average Students Per Section: 13.00
MAT210 GEOMETRY 1 SM 14 475 75| 75 27 48 | 9 2 7 |
26 THOMAS S. EARL Max:30 S2 02 | 20 7 13 | 2 0 2 |
36 ROBERT L. MORGAN Max:30 S2 03 | 23 10 13 | 4 1 3 |
37 JERRY N. JAZBEC Max:25 S2 03 | 9 3 6 | 1 0 1 |
66 THOMAS S. EARL Max:30 S2 06 | 23 7 16 | 2 1 1 |
Number of Sections: 4 Average Students Per Section: 18.75
MAT211 GEOMETRY 2 SM 14 360 277| 277 154 123 | 8 1 7 |
16 THOMAS S. EARL Max:30 S2 01 | 27 17 10 | 1 0 1 |
17 MICHELLE R. EDWARDS Max:30 S2 01 | 29 20 9 | 0 0 0 |
26 THOMAS S. EARL Max:0 S2 02 | 0 0 0 | 0 0 0 |
27 MICHELLE R. EDWARDS Max:30 S2 02 | 31 20 11 | 1 0 1 |
37 MICHELLE R. EDWARDS Max:30 S2 03 | 30 14 16 | 1 0 1 |
47 EDWARD K. ROSIN Max:30 S2 04 | 27 13 14 | 1 0 1 |
48 ROBYN N. SAARENAS Max:30 S2 04 | 30 15 15 | 1 1 0 |
56 ROBYN N. SAARENAS Max:30 S2 05 | 29 11 18 | 0 0 0 |
57 EDWARD K. ROSIN Max:30 S2 05 | 29 19 10 | 1 0 1 |
67 EDWARD K. ROSIN Max:30 S2 06 | 24 12 12 | 2 0 2 |
68 ROBYN N. SAARENAS Max:30 S2 06 | 21 13 8 | 0 0 0 |

1sonyr01.p 38-2 AUBURN RIVERSIDE HIGH SCHOOL 03/02/15 Page:15
05.14.10.00.00 Course/Class Count Report 408 3:09 PM
EST NBR NBR ----TOTALS---- --Special Ed--
COURSE DESCRIPTION LGTH SEC AVL REQ TOT FEM MAL TOT FEM MAL
Number of Sections: 11 Average Students Per Section: 25.18
MAT311 ADV ALG/TRIG 2 SM 11 330 268| 268 136 132 | 5 1 4 |
17 MICHAEL T. HUYLAR Max:30 S2 01 | 26 17 9 | 1 0 1 |
26 EDWARD K. ROSIN Max:30 S2 02 | 28 13 15 | 0 0 0 |
27 MICHAEL T. HUYLAR Max:30 S2 02 | 29 17 12 | 0 0 0 |
36 ERNEST E. ZEIGER Max:30 S2 03 | 25 14 11 | 0 0 0 |
37 EDWARD K. ROSIN Max:30 S2 03 | 24 13 11 | 0 0 0 |
56 KEVIN L. OLSON Max:30 S2 05 | 18 6 12 | 1 0 1 |
57 ROBERT L. MORGAN Max:30 S2 05 | 21 13 8 | 0 0 0 |
58 MICHELLE R. EDWARDS Max:30 S2 05 | 23 10 13 | 1 0 1 |
66 KEVIN L. OLSON Max:30 S2 06 | 28 14 14 | 1 1 0 |
67 ROBERT L. MORGAN Max:30 S2 06 | 23 7 16 | 1 0 1 |
68 MICHELLE R. EDWARDS Max:30 S2 06 | 23 12 11 | 0 0 0 |
Number of Sections: 11 Average Students Per Section: 24.36
MAT411 BYND ADV ALG 2 SM 2 60 53| 53 37 16 | 0 0 0 |
26 SCOTT J. ROWE Max:30 S2 02 | 30 19 11 | 0 0 0 |
36 SCOTT J. ROWE Max:30 S2 03 | 23 18 5 | 0 0 0 |
Number of Sections: 2 Average Students Per Section: 26.50
MAT413 PRE CALCULUS 2 SM 8 180 150| 150 75 75 | 0 0 0 |
16 SCOTT J. ROWE Max:30 S2 01 | 26 15 11 | 0 0 0 |
17 JERRY N. JAZBEC Max:30 S2 01 | 21 12 9 | 0 0 0 |
26 JERRY N. JAZBEC Max:30 S2 02 | 26 10 16 | 0 0 0 |
46 THOMAS S. EARL Max:30 S2 04 | 27 12 15 | 0 0 0 |
56 THOMAS S. EARL Max:30 S2 05 | 23 10 13 | 0 0 0 |
66 SCOTT J. ROWE Max:30 S2 06 | 27 16 11 | 0 0 0 |
Number of Sections: 6 Average Students Per Section: 25.00
MAT415 AP CALCULUS 2 SM 4 90 61| 61 33 28 | 0 0 0 |
16 ERNEST E. ZEIGER Max:30 S2 01 | 19 14 5 | 0 0 0 |
26 ERNEST E. ZEIGER Max:30 S2 02 | 24 10 14 | 0 0 0 |
36 ROBYN N. SAARENAS Max:30 S2 03 | 18 9 9 | 0 0 0 |
Number of Sections: 3 Average Students Per Section: 20.33
MAT417 AP STATS 2 SM 2 44 37| 37 23 14 | 0 0 0 |
56 SCOTT A. HUSAR Max:22 S2 05 | 15 9 6 | 0 0 0 |
66 SCOTT A. HUSAR Max:22 S2 06 | 22 14 8 | 0 0 0 |
Number of Sections: 2 Average Students Per Section: 18.50
MAT421 AP COMPTR SCI 2 SM 1 30 19| 19 4 15 | 1 0 1 |
16 ROBYN N. SAARENAS Max:30 S2 01 | 19 4 15 | 1 0 1 |
Number of Sections: 1 Average Students Per Section: 19.00
MAT431 COMPUTER SCI 2 SM 1 30 9| 9 0 9 | 0 0 0 |
26 ROBYN N. SAARENAS Max:30 S2 02 | 9 0 9 | 0 0 0 |
Number of Sections: 1 Average Students Per Section: 9.00
MUS106 CONCERT BAND SM 1 34 25| 25 8 17 | 2 0 2 |
46 MEGHAN E. WAGNER Max:34 S2 04 | 25 8 17 | 2 0 2 |
Number of Sections: 1 Average Students Per Section: 25.00
MUS116 WIND ENSEMBLE SM 2 40 38| 38 21 17 | 0 0 0 |
56 MEGHAN E. WAGNER Max:40 S2 05 | 38 21 17 | 0 0 0 |
Number of Sections: 1 Average Students Per Section: 38.00
MUS121 PERCUSSION SM 1 25 20| 20 6 14 | 1 0 1 |
26 MEGHAN E. WAGNER Max:25 S2 02 | 20 6 14 | 1 0 1 |
Number of Sections: 1 Average Students Per Section: 20.00
MUS126 SYMPHONC BAND SM 1 40 38| 38 21 17 | 0 0 0 |
36 MEGHAN E. WAGNER Max:40 S2 03 | 38 21 17 | 0 0 0 |
Number of Sections: 1 Average Students Per Section: 38.00
MUS131 JAZZ ENSEMBLE SM 1 40 33| 33 10 23 | 0 0 0 |
96 MEGHAN E. WAGNER Max:40 S2 09 | 33 10 23 | 0 0 0 |

1sonyr01.p 38-2 AUBURN RIVERSIDE HIGH SCHOOL 03/02/15 Page:16
05.14.10.00.00 Course/Class Count Report 408 3:09 PM
EST NBR NBR ----TOTALS---- --Special Ed--
COURSE DESCRIPTION LGTH SEC AVL REQ TOT FEM MAL TOT FEM MAL
Number of Sections: 1 Average Students Per Section: 33.00
MUS206 CHORUS SM 1 45 45| 45 36 9 | 3 3 0 |
26 JONATHAN M. STENSON Max:45 S2 02 | 45 36 9 | 3 3 0 |
Number of Sections: 1 Average Students Per Section: 45.00
MUS211 CHOIR-CONCERT SM 2 50 40| 40 23 17 | 1 0 1 |
36 JONATHAN M. STENSON Max:50 S2 03 | 40 23 17 | 1 0 1 |
Number of Sections: 1 Average Students Per Section: 40.00
MUS226 ADV CHORUS SM 1 40 26| 26 26 0 | 0 0 0 |
16 JONATHAN M. STENSON Max:40 S2 01 | 26 26 0 | 0 0 0 |
Number of Sections: 1 Average Students Per Section: 26.00
MUS231 CHOIR-JAZZ EN SM 1 40 17| 17 8 9 | 0 0 0 |
96 JONATHAN M. STENSON Max:40 S2 09 | 17 8 9 | 0 0 0 |
Number of Sections: 1 Average Students Per Section: 17.00
MUS301 ORCHESTRA SM 1 40 24| 24 15 9 | 1 0 1 |
66 ELSA T. FAGER Max:40 S2 06 | 24 15 9 | 1 0 1 |
Number of Sections: 1 Average Students Per Section: 24.00
MUS303 ORCHEST-CHMBR SM 1 40 40| 40 21 19 | 0 0 0 |
56 ELSA T. FAGER Max:40 S2 05 | 40 21 19 | 0 0 0 |
Number of Sections: 1 Average Students Per Section: 40.00
PHY200 COED PE SM 2 252 119| 119 54 65 | 5 2 3 |
16 JULIE A. MOBERG Max:36 S2 01 | 30 15 15 | 2 1 1 |
26 CHRISTINE S. AREND Max:36 S2 02 | 30 18 12 | 2 1 1 |
36 CHRISTINE S. AREND Max:36 S2 03 | 23 11 12 | 0 0 0 |
66 CHRISTINE S. AREND Max:36 S2 06 | 36 10 26 | 1 0 1 |
Number of Sections: 4 Average Students Per Section: 29.75
PHY203 AEROBIC/WALK SM 3 108 0| 0 0 0 | 0 0 0 |
PHY204 AEROBIC/WALK SM 1 144 139| 139 107 32 | 16 6 10 |
36 JULIE A. MOBERG Max:36 S2 03 | 33 26 7 | 3 0 3 |
46 ARTHUR BENARD III Max:36 S2 04 | 36 28 8 | 4 2 2 |
56 JULIE A. MOBERG Max:36 S2 05 | 34 26 8 | 4 2 2 |
66 JULIE A. MOBERG Max:36 S2 06 | 36 27 9 | 5 2 3 |
Number of Sections: 4 Average Students Per Section: 34.75
PHY208 BASKETBALL SM 4 36 18| 18 0 18 | 4 0 4 |
16 ARTHUR BENARD III Max:36 S2 01 | 18 0 18 | 4 0 4 |
Number of Sections: 1 Average Students Per Section: 18.00
PHY211 CONDITIONING SM 2 72 0| 0 0 0 | 0 0 0 |
PHY212 CONDITIONING SM 1 36 32| 32 19 13 | 2 1 1 |
26 JULIE A. MOBERG Max:36 S2 02 | 32 19 13 | 2 1 1 |
Number of Sections: 1 Average Students Per Section: 32.00
PHY213 FIELD SPORTS SM 2 36 0| 0 0 0 | 0 0 0 |
PHY214 FIELD SPORTS SM 1 72 65| 65 6 59 | 6 1 5 |
26 ARTHUR BENARD III Max:36 S2 02 | 30 4 26 | 4 1 3 |
36 ARTHUR BENARD III Max:36 S2 03 | 35 2 33 | 2 0 2 |
Number of Sections: 2 Average Students Per Section: 32.50
PHY219 RACQT SPORTS SM 2 36 0| 0 0 0 | 0 0 0 |
PHY220 RACQT SPORTS SM 1 36 33| 33 10 23 | 3 1 2 |
56 ARTHUR BENARD III Max:36 S2 05 | 33 10 23 | 3 1 2 |
Number of Sections: 1 Average Students Per Section: 33.00
PHY224 VOLLEYBALL SM 1 36 36| 36 25 11 | 3 2 1 |
46 CHRISTINE S. AREND Max:36 S2 04 | 36 25 11 | 3 2 1 |
Number of Sections: 1 Average Students Per Section: 36.00
PHY229 BEG WT TRNG SM 9 66 0| 0 0 0 | 0 0 0 |
PHY230 BEG WT TRNG SM 4 76 73| 73 15 58 | 7 1 6 |
46 DAVID R. GOETHALS Max:24 S2 04 | 25 7 18 | 2 1 1 |
56 DAVID R. GOETHALS Max:25 S2 05 | 23 6 17 | 2 0 2 |
66 DAVID R. GOETHALS Max:27 S2 06 | 25 2 23 | 3 0 3 |

1sonyr01.p 38-2 AUBURN RIVERSIDE HIGH SCHOOL 03/02/15 Page:17
05.14.10.00.00 Course/Class Count Report 408 3:09 PM
EST NBR NBR ----TOTALS---- --Special Ed--
COURSE DESCRIPTION LGTH SEC AVL REQ TOT FEM MAL TOT FEM MAL
Number of Sections: 3 Average Students Per Section: 24.33
PHY301 ADV BSKETBALL SM 1 36 36| 36 3 33 | 2 0 2 |
66 ARTHUR BENARD III Max:36 S2 06 | 36 3 33 | 2 0 2 |
Number of Sections: 1 Average Students Per Section: 36.00
PHY303 ADV VLYBALL SM 1 36 35| 35 22 13 | 0 0 0 |
56 CHRISTINE S. AREND Max:36 S2 05 | 35 22 13 | 0 0 0 |
Number of Sections: 1 Average Students Per Section: 35.00
PHY306 ADV WT TRNG SM 4 24 53| 53 6 47 | 6 0 6 |
19 DAVID R. GOETHALS Max:0 S2 01 | 23 0 23 | 3 0 3 |
46 DAVID R. GOETHALS Max:8 S2 04 | 11 2 9 | 0 0 0 |
56 DAVID R. GOETHALS Max:8 S2 05 | 10 2 8 | 2 0 2 |
66 DAVID R. GOETHALS Max:8 S2 06 | 9 2 7 | 1 0 1 |
Number of Sections: 4 Average Students Per Section: 13.25
SCI101 SCIENCE LINKS SM 9 240 146| 146 72 74 | 11 2 9 |
26 MICHAEL VAN EATON Max:30 S2 02 | 31 12 19 | 2 0 2 |
36 EDMUND M. VALENTIN Max:30 S2 03 | 31 17 14 | 2 0 2 |
46 DAWN K. CARLO Max:30 S2 04 | 31 17 14 | 1 0 1 |
56 EDMUND M. VALENTIN Max:30 S2 05 | 31 10 21 | 2 0 2 |
66 EDMUND M. VALENTIN Max:30 S2 06 | 22 16 6 | 4 2 2 |
Number of Sections: 5 Average Students Per Section: 29.20
SCI203 BIOLOGY 2 SM 17 510 463| 463 243 220 | 33 10 23 |
16 PHILIP J. MYKA Max:30 S2 01 | 30 17 13 | 2 0 2 |
17 CORIN G. MALONE Max:30 S2 01 | 29 18 11 | 1 1 0 |
26 CORIN G. MALONE Max:30 S2 02 | 30 18 12 | 2 0 2 |
28 ANGELA M. DESJARDINS Max:30 S2 02 | 29 16 13 | 1 0 1 |
36 ANGELA M. DESJARDINS Max:30 S2 03 | 26 16 10 | 5 2 3 |
38 JUDITH J. SHAW Max:30 S2 03 | 21 11 10 | 1 1 0 |
46 PHILIP J. MYKA Max:30 S2 04 | 30 17 13 | 1 1 0 |
47 ANGELA M. DESJARDINS Max:30 S2 04 | 30 17 13 | 1 0 1 |
48 JUDITH J. SHAW Max:30 S2 04 | 28 12 16 | 0 0 0 |
56 CORIN G. MALONE Max:30 S2 05 | 29 10 19 | 4 0 4 |
57 JUDITH J. SHAW Max:30 S2 05 | 27 15 12 | 1 1 0 |
58 DAWN K. CARLO Max:30 S2 05 | 19 10 9 | 3 1 2 |
59 PHILIP J. MYKA Max:30 S2 05 | 30 16 14 | 2 0 2 |
66 ANGELA M. DESJARDINS Max:30 S2 06 | 30 10 20 | 1 1 0 |
67 JUDITH J. SHAW Max:30 S2 06 | 22 12 10 | 0 0 0 |
68 DAWN K. CARLO Max:30 S2 06 | 26 13 13 | 5 1 4 |
69 CORIN G. MALONE Max:30 S2 06 | 27 15 12 | 3 1 2 |
Number of Sections: 17 Average Students Per Section: 27.24
SCI205 AP BIOLOGY 2 SM 1 30 8| 8 6 2 | 0 0 0 |
16 JUDITH J. SHAW Max:30 S2 01 | 8 6 2 | 0 0 0 |
Number of Sections: 1 Average Students Per Section: 8.00
SCI301 CHEMISTRY 2 SM 8 240 227| 227 124 103 | 1 0 1 |
16 EDMUND M. VALENTIN Max:30 S2 01 | 30 16 14 | 0 0 0 |
26 EDMUND M. VALENTIN Max:30 S2 02 | 30 17 13 | 1 0 1 |
36 MICHAEL VAN EATON Max:30 S2 03 | 26 9 17 | 0 0 0 |
38 MARK S. DAVIS Max:30 S2 03 | 30 16 14 | 0 0 0 |
46 MARK S. DAVIS Max:30 S2 04 | 29 17 12 | 0 0 0 |
47 MICHAEL VAN EATON Max:30 S2 04 | 30 16 14 | 0 0 0 |
56 MICHAEL VAN EATON Max:30 S2 05 | 25 13 12 | 0 0 0 |
66 MICHAEL VAN EATON Max:30 S2 06 | 27 20 7 | 0 0 0 |
Number of Sections: 8 Average Students Per Section: 28.38
SCI305 AP CHEMISTRY 2 SM 2 60 36| 36 15 21 | 0 0 0 |
16 MARK S. DAVIS Max:30 S2 01 | 21 8 13 | 0 0 0 |
26 MARK S. DAVIS Max:30 S2 02 | 15 7 8 | 0 0 0 |

1sonyr01.p 38-2 AUBURN RIVERSIDE HIGH SCHOOL 03/02/15 Page:18
05.14.10.00.00 Course/Class Count Report 408 3:09 PM
EST NBR NBR ----TOTALS---- --Special Ed--
COURSE DESCRIPTION LGTH SEC AVL REQ TOT FEM MAL TOT FEM MAL
Number of Sections: 2 Average Students Per Section: 18.00
SCI401 PHYSICS 2 SM 2 60 34| 34 10 24 | 0 0 0 |
56 ERNEST E. ZEIGER Max:30 S2 05 | 10 4 6 | 0 0 0 |
66 ERNEST E. ZEIGER Max:30 S2 06 | 24 6 18 | 0 0 0 |
Number of Sections: 2 Average Students Per Section: 17.00
SCI502 MARINE BIOLOGY SM 3 90 43| 43 21 22 | 2 0 2 |
26 PHILIP J. MYKA Max:30 S2 02 | 21 12 9 | 1 0 1 |
36 PHILIP J. MYKA Max:30 S2 03 | 22 9 13 | 1 0 1 |
Number of Sections: 2 Average Students Per Section: 21.50
SCI503 ENVIRON BIOLOGY SM 1 30 18| 18 6 12 | 4 1 3 |
46 CORIN G. MALONE Max:30 S2 04 | 18 6 12 | 4 1 3 |
Number of Sections: 1 Average Students Per Section: 18.00
SCI505 ASTRONOMY SM 2 90 53| 53 23 30 | 5 1 4 |
56 MARK S. DAVIS Max:30 S2 05 | 26 10 16 | 2 0 2 |
66 MARK S. DAVIS Max:30 S2 06 | 27 13 14 | 3 1 2 |
Number of Sections: 2 Average Students Per Section: 26.50
SCI521 AP PHYSICS B 2 SM 1 34 24| 24 6 18 | 0 0 0 |
16 MICHAEL VAN EATON Max:34 S2 01 | 24 6 18 | 0 0 0 |
Number of Sections: 1 Average Students Per Section: 24.00
SOC101 WORLD STUDIES SM 10 300 228| 228 115 113 | 14 0 14 |
16 SHAWN A. MARTINSON Max:30 S2 01 | 32 22 10 | 0 0 0 |
36 SHAWN A. MARTINSON Max:30 S2 03 | 30 15 15 | 3 0 3 |
38 BRYANT D. THOMAS Max:0 S2 03 | 54 16 38 | 3 0 3 |
56 SHAWN A. MARTINSON Max:30 S2 05 | 30 18 12 | 2 0 2 |
57 BRYANT D. THOMAS Max:30 S2 05 | 31 16 15 | 5 0 5 |
66 SHAWN A. MARTINSON Max:30 S2 06 | 24 14 10 | 0 0 0 |
67 BRYANT D. THOMAS Max:30 S2 06 | 27 14 13 | 1 0 1 |
Number of Sections: 7 Average Students Per Section: 32.57
SOC191 AP HUMN GEOGR 2 SM 4 150 130| 130 70 60 | 0 0 0 |
26 JANALYN R. MCKEEHAN Max:30 S2 02 | 29 14 15 | 0 0 0 |
36 JANALYN R. MCKEEHAN Max:30 S2 03 | 22 11 11 | 0 0 0 |
46 JANALYN R. MCKEEHAN Max:30 S2 04 | 30 17 13 | 0 0 0 |
56 JANALYN R. MCKEEHAN Max:30 S2 05 | 23 15 8 | 0 0 0 |
66 JANALYN R. MCKEEHAN Max:30 S2 06 | 26 13 13 | 0 0 0 |
Number of Sections: 5 Average Students Per Section: 26.00
SOC201 US HIST BASIC 2 SM 1 20 14| 14 5 9 | 7 2 5 |
16 ANDREW D. MONSEN Max:20 S2 01 | 14 5 9 | 7 2 5 |
Number of Sections: 1 Average Students Per Section: 14.00
SOC203 US HISTORY 2 SM 12 360 312| 312 147 165 | 27 8 19 |
16 BRUCE D. DIEHL Max:30 S2 01 | 27 11 16 | 2 1 1 |
17 MEGAN ELLIS SUMNER Max:30 S2 01 | 29 18 11 | 0 0 0 |
18 CHAD M. GUISINGER Max:30 S2 01 | 30 17 13 | 2 1 1 |
26 BRUCE D. DIEHL Max:30 S2 02 | 30 13 17 | 1 0 1 |
27 PATRICK M. MCKEEHAN I Max:30 S2 02 | 29 15 14 | 1 1 0 |
28 CHAD M. GUISINGER Max:30 S2 02 | 27 8 19 | 4 0 4 |
36 PATRICK M. MCKEEHAN I Max:30 S2 03 | 29 14 15 | 4 0 4 |
37 BRUCE D. DIEHL Max:30 S2 03 | 23 11 12 | 3 3 0 |
46 PATRICK M. MCKEEHAN I Max:30 S2 04 | 29 13 16 | 3 1 2 |
56 BRYCE J. STRAND Max:30 S2 05 | 30 12 18 | 3 0 3 |
66 CHAD M. GUISINGER Max:30 S2 06 | 29 15 14 | 4 1 3 |
Number of Sections: 11 Average Students Per Section: 28.36
SOC205 AP EUROPEAN 2 SM 4 120 96| 96 66 30 | 0 0 0 |
36 MEGAN ELLIS SUMNER Max:30 S2 03 | 15 13 2 | 0 0 0 |
46 MEGAN ELLIS SUMNER Max:30 S2 04 | 30 16 14 | 0 0 0 |
56 MEGAN ELLIS SUMNER Max:30 S2 05 | 22 18 4 | 0 0 0 |
66 MEGAN ELLIS SUMNER Max:30 S2 06 | 29 19 10 | 0 0 0 |

1sonyr01.p 38-2 AUBURN RIVERSIDE HIGH SCHOOL 03/02/15 Page:19
05.14.10.00.00 Course/Class Count Report 408 3:09 PM
EST NBR NBR ----TOTALS---- --Special Ed--
COURSE DESCRIPTION LGTH SEC AVL REQ TOT FEM MAL TOT FEM MAL
Number of Sections: 4 Average Students Per Section: 24.00
SOC300 CIVICS SM 9 330 138| 138 63 75 | 23 6 17 |
26 CHERYL C. MOYD Max:30 S2 02 | 26 13 13 | 5 3 2 |
36 CHERYL C. MOYD Max:30 S2 03 | 23 14 9 | 2 1 1 |
46 CHAD M. GUISINGER Max:30 S2 04 | 30 12 18 | 5 1 4 |
56 CHAD M. GUISINGER Max:30 S2 05 | 29 12 17 | 6 1 5 |
66 ANDREW D. MONSEN Max:30 S2 06 | 30 12 18 | 5 0 5 |
Number of Sections: 5 Average Students Per Section: 27.60
SOC302 AP US HISTORY 2 SM 3 120 43| 43 26 17 | 0 0 0 |
16 CHERYL C. MOYD Max:30 S2 01 | 18 13 5 | 0 0 0 |
46 BRUCE D. DIEHL Max:30 S2 04 | 8 4 4 | 0 0 0 |
56 BRUCE D. DIEHL Max:30 S2 05 | 17 9 8 | 0 0 0 |
Number of Sections: 3 Average Students Per Section: 14.33
SOC400 GLOBAL ISSUES SM 8 210 93| 93 41 52 | 8 1 7 |
46 CRYSTAL L. JILBERT Max:30 S2 04 | 32 12 20 | 0 0 0 |
56 CRYSTAL L. JILBERT Max:30 S2 05 | 31 12 19 | 5 1 4 |
66 CRYSTAL L. JILBERT Max:30 S2 06 | 30 17 13 | 3 0 3 |
Number of Sections: 3 Average Students Per Section: 31.00
SOC402 AP US POL&GOV 2 SM 5 120 89| 89 52 37 | 0 0 0 |
16 PATRICK M. MCKEEHAN I Max:30 S2 01 | 18 12 6 | 0 0 0 |
26 ANDREW D. MONSEN Max:30 S2 02 | 21 15 6 | 0 0 0 |
36 ANDREW D. MONSEN Max:30 S2 03 | 27 18 9 | 0 0 0 |
46 ANDREW D. MONSEN Max:30 S2 04 | 23 7 16 | 0 0 0 |
Number of Sections: 4 Average Students Per Section: 22.25
SOC411 AP CMP GOV&POL2 SM 1 32 24| 24 11 13 | 0 0 0 |
56 PATRICK M. MCKEEHAN I Max:32 S2 05 | 24 11 13 | 0 0 0 |
Number of Sections: 1 Average Students Per Section: 24.00
SOC501 PSYCHOLOGY 2 SM 3 60 46| 46 29 17 | 2 1 1 |
56 CHERYL C. MOYD Max:30 S2 05 | 18 13 5 | 1 1 0 |
66 CHERYL C. MOYD Max:30 S2 06 | 28 16 12 | 1 0 1 |
Number of Sections: 2 Average Students Per Section: 23.00
SOC503 AP PSYCH 2 SM 11 30 17| 17 15 2 | 0 0 0 |
36 CRYSTAL L. JILBERT Max:30 S2 03 | 17 15 2 | 0 0 0 |
Number of Sections: 1 Average Students Per Section: 17.00
SOC504 SOCIOLOGY 1 SM 2 33 31| 31 20 11 | 0 0 0 |
56 ANDREW D. MONSEN Max:33 S2 05 | 31 20 11 | 0 0 0 |
Number of Sections: 1 Average Students Per Section: 31.00
SOC508 WASH STATE HIST SM 1 90 12| 12 4 8 | 3 1 2 |
46 SHAWN A. MARTINSON Max:30 S2 04 | 12 4 8 | 3 1 2 |
Number of Sections: 1 Average Students Per Section: 12.00
SPE116 READING LAB SM 1 11 6| 6 0 6 | 6 0 6 |
26 ANGELA K. MCCAUSLAND Max:1 S2 02 | 0 0 0 | 0 0 0 |
36 ELAINE M. HETTERLY Max:10 S2 03 | 6 0 6 | 6 0 6 |
Number of Sections: 2 Average Students Per Section: 3.00
SPE212 READ/WR LAN 1 SM 1 4 6| 6 3 3 | 6 3 3 |
46 ELAINE M. HETTERLY Max:2 S2 04 | 4 2 2 | 4 2 2 |
56 ELAINE M. HETTERLY Max:2 S2 05 | 2 1 1 | 2 1 1 |
Number of Sections: 2 Average Students Per Section: 3.00
SPE214 READ/WR LAN 2 SM 1 12 11| 11 2 9 | 11 2 9 |
46 ELAINE M. HETTERLY Max:6 S2 04 | 7 2 5 | 7 2 5 |
56 ELAINE M. HETTERLY Max:6 S2 05 | 4 0 4 | 4 0 4 |
Number of Sections: 2 Average Students Per Section: 5.50
SPE216 READ/WR LAN 3 SM 2 28 18| 18 5 13 | 18 5 13 |
16 ANGELA K. MCCAUSLAND Max:14 S2 01 | 8 1 7 | 8 1 7 |
26 ANGELA K. MCCAUSLAND Max:14 S2 02 | 10 4 6 | 10 4 6 |

1sonyr01.p 38-2 AUBURN RIVERSIDE HIGH SCHOOL 03/02/15 Page:20
05.14.10.00.00 Course/Class Count Report 408 3:09 PM
EST NBR NBR ----TOTALS---- --Special Ed--
COURSE DESCRIPTION LGTH SEC AVL REQ TOT FEM MAL TOT FEM MAL
Number of Sections: 2 Average Students Per Section: 9.00
SPE218 READ/WR LAN 4 SM 3 40 35| 35 7 28 | 35 7 28 |
16 ELAINE M. HETTERLY Max:12 S2 01 | 10 4 6 | 10 4 6 |
36 ANGELA K. MCCAUSLAND Max:14 S2 03 | 12 1 11 | 12 1 11 |
46 ANGELA K. MCCAUSLAND Max:14 S2 04 | 13 2 11 | 13 2 11 |
Number of Sections: 3 Average Students Per Section: 11.67
SPE251 MATH INTERVN 2 SM 2 24 15| 15 4 11 | 15 4 11 |
46 KYLE B. JONES Max:12 S2 04 | 6 2 4 | 6 2 4 |
66 KYLE B. JONES Max:12 S2 06 | 9 2 7 | 9 2 7 |
Number of Sections: 2 Average Students Per Section: 7.50
SPE302 MATH 1 SM 3 5 6| 6 2 4 | 6 2 4 |
56 RALPH L. CUBIT Max:5 S2 05 | 6 2 4 | 6 2 4 |
Number of Sections: 1 Average Students Per Section: 6.00
SPE304 MATH 2 SM 2 10 5| 5 2 3 | 5 2 3 |
66 ELAINE M. HETTERLY Max:5 S2 06 | 5 2 3 | 5 2 3 |
Number of Sections: 1 Average Students Per Section: 5.00
SPE306 MATH 3 SM 1 10 7| 7 3 4 | 7 3 4 |
66 ELAINE M. HETTERLY Max:10 S2 06 | 7 3 4 | 7 3 4 |
Number of Sections: 1 Average Students Per Section: 7.00
SPE308 MATH 4 SM 4 15 11| 11 2 9 | 11 2 9 |
16 KYLE B. JONES Max:15 S2 01 | 11 2 9 | 11 2 9 |
Number of Sections: 1 Average Students Per Section: 11.00
SPE321 PRE ALGEBRA 2 SM 2 28 24| 24 9 15 | 24 9 15 |
26 KYLE B. JONES Max:14 S2 02 | 10 3 7 | 10 3 7 |
36 KYLE B. JONES Max:14 S2 03 | 14 6 8 | 14 6 8 |
Number of Sections: 2 Average Students Per Section: 12.00
SPE601 COMM LAB SM 1 29 9| 9 3 6 | 9 3 6 |
46 ALEXANDRA J. DAMIANO Max:9 S2 04 | 3 1 2 | 3 1 2 |
56 ALEXANDRA J. DAMIANO Max:9 S2 05 | 3 1 2 | 3 1 2 |
66 ALEXANDRA J. DAMIANO Max:9 S2 06 | 3 1 2 | 3 1 2 |
76 ALEXANDRA J. DAMIANO Max:0 S2 07 | 0 0 0 | 0 0 0 |
86 ALEXANDRA J. DAMIANO Max:1 S2 08 | 0 0 0 | 0 0 0 |
Number of Sections: 5 Average Students Per Section: 1.80

1sonyr01.p 38-2 AUBURN RIVERSIDE HIGH SCHOOL 03/02/15 Page:21
05.14.10.00.00 Course/Class Count Report Totals 3:09 PM
TITLE FOR TOTAL
TOTALS GROUP TOTAL FEMALE MALE
GRAND TOTALS 10372 5395 4977
Special Ed 812 215 597
************************ End of report ************************

1sonyr01.p 38-2 WEST AUBURN SENIOR HIGH SCHOOL 03/02/15 Page:1
05.14.10.00.00 Course/Class Count Report 504 3:12 PM
EST NBR NBR ----TOTALS---- --Special Ed--
COURSE DESCRIPTION LGTH SEC AVL REQ TOT FEM MAL TOT FEM MAL
ART102 DRAWING 2 SM 1 25 15| 15 6 9 | 3 0 3 |
05 KENNETH G. WATSON Max:25 S2 05 | 15 6 9 | 3 0 3 |
Number of Sections: 1 Average Students Per Section: 15.00
ART104 ADV ART 2 SM 1 0 0| 0 0 0 | 0 0 0 |
ART110 CERAMICS SM 1 80 21| 21 8 13 | 6 2 4 |
26 KENNETH G. WATSON Max:25 S2 06 | 21 8 13 | 6 2 4 |
Number of Sections: 1 Average Students Per Section: 21.00
ART201 IND ARTS 2 SM 1 20 13| 13 2 11 | 2 0 2 |
22 DON A. WILSON Max:20 S2 01 | 13 2 11 | 2 0 2 |
Number of Sections: 1 Average Students Per Section: 13.00
ART352 JEWELRY 2 SM 1 20 17| 17 6 11 | 2 1 1 |
26 DON A. WILSON Max:20 S2 06 | 17 6 11 | 2 1 1 |
S2 <None> Max:0 S2 00 | 0 0 0 | 0 0 0 |
Number of Sections: 2 Average Students Per Section: 8.50
ART800 ART IND STUDY SM 1 180 11| 11 8 3 | 1 1 0 |
11 CATHERINE M. PETER Max:15 S2 00 | 0 0 0 | 0 0 0 |
12 CATHERINE M. PETER Max:15 S2 00 | 0 0 0 | 0 0 0 |
33 WENDY L. OKADA Max:15 S2 00 | 0 0 0 | 0 0 0 |
44 WENDY L. OKADA Max:15 S2 00 | 0 0 0 | 0 0 0 |
71 BROOKE BROUSSARD Max:25 S2 06 | 11 8 3 | 1 1 0 |
S2 <None> Max:0 S2 00 | 0 0 0 | 0 0 0 |
Number of Sections: 6 Average Students Per Section: 1.83
ART900 ART XFER CREDIT SM 2 0 0| 0 0 0 | 0 0 0 |
S2 <None> Max:0 S2 00 | 0 0 0 | 0 0 0 |
Number of Sections: 1 Average Students Per Section: 0.00
CTE101 ACCOUNTING 1 SM 1 70 11| 11 8 3 | 1 1 0 |
21 STEVEN J. PAYNE Max:15 S2 01 | 0 0 0 | 0 0 0 |
22 STEVEN J. PAYNE Max:15 S2 02 | 11 8 3 | 1 1 0 |
S2 <None> Max:0 S2 00 | 0 0 0 | 0 0 0 |
Number of Sections: 3 Average Students Per Section: 3.67
CTE102 ACCOUNTING 2 SM 1 75 4| 4 2 2 | 0 0 0 |
02 STEVEN J. PAYNE Max:25 S2 02 | 4 2 2 | 0 0 0 |
21 STEVEN J. PAYNE Max:20 S2 01 | 0 0 0 | 0 0 0 |
S2 <None> Max:0 S2 00 | 0 0 0 | 0 0 0 |
Number of Sections: 3 Average Students Per Section: 1.33
CTE103 ACCOUNTING 3 SM 1 65 0| 0 0 0 | 0 0 0 |
22 STEVEN J. PAYNE Max:20 S2 02 | 0 0 0 | 0 0 0 |
23 STEVEN J. PAYNE Max:25 S2 03 | 0 0 0 | 0 0 0 |
S2 <None> Max:0 S2 00 | 0 0 0 | 0 0 0 |
Number of Sections: 3 Average Students Per Section: 0.00
CTE104 ACCOUNTING 4 SM 1 50 0| 0 0 0 | 0 0 0 |
23 STEVEN J. PAYNE Max:25 S2 03 | 0 0 0 | 0 0 0 |
24 STEVEN J. PAYNE Max:5 S2 04 | 0 0 0 | 0 0 0 |
Number of Sections: 2 Average Students Per Section: 0.00
CTE112 BUS ENGLISH 2 SM 1 0 0| 0 0 0 | 0 0 0 |
CTE115 BUS MATH SM 1 0 0| 0 0 0 | 0 0 0 |
CTE117 MATH BUS PRFIN1 SM 1 95 0| 0 0 0 | 0 0 0 |
07 STEVEN J. PAYNE Max:25 S2 01 | 0 0 0 | 0 0 0 |
Number of Sections: 1 Average Students Per Section: 0.00
CTE118 MATH BUS PRFIN2 SM 1 70 20| 20 9 11 | 2 0 2 |
22 STEVEN J. PAYNE Max:20 S2 02 | 0 0 0 | 0 0 0 |
25 STEVEN J. PAYNE Max:25 S2 05 | 10 6 4 | 1 0 1 |
27 STEVEN J. PAYNE Max:25 S2 01 | 10 3 7 | 1 0 1 |
Number of Sections: 3 Average Students Per Section: 6.67
CTE120 BUS PERS FIN SM 1 50 0| 0 0 0 | 0 0 0 |
22 STEVEN J. PAYNE Max:25 S2 02 | 0 0 0 | 0 0 0 |

1sonyr01.p 38-2 WEST AUBURN SENIOR HIGH SCHOOL 03/02/15 Page:2
05.14.10.00.00 Course/Class Count Report 504 3:12 PM
EST NBR NBR ----TOTALS---- --Special Ed--
COURSE DESCRIPTION LGTH SEC AVL REQ TOT FEM MAL TOT FEM MAL
S2 <None> Max:0 S2 00 | 0 0 0 | 0 0 0 |
Number of Sections: 2 Average Students Per Section: 0.00
CTE125 CAREER CHOICES SM 1 0 0| 0 0 0 | 0 0 0 |
CTE135 DIGITOOLS SM 1 0 0| 0 0 0 | 0 0 0 |
CTE141 MOS 1 SM 1 25 0| 0 0 0 | 0 0 0 |
CTE142 MOS 2 SM 1 25 10| 10 5 5 | 3 1 2 |
06 STEVEN J. PAYNE Max:25 S2 06 | 10 5 5 | 3 1 2 |
Number of Sections: 1 Average Students Per Section: 10.00
CTE150 GAMNG INTMEDIA1 SM 1 300 28| 28 6 22 | 3 0 3 |
21 MARK A. BOWMAN Max:25 S2 01 | 9 1 8 | 1 0 1 |
22 MARK A. BOWMAN Max:25 S2 02 | 0 0 0 | 0 0 0 |
24 MARK A. BOWMAN Max:25 S2 04 | 8 3 5 | 0 0 0 |
25 MARK A. BOWMAN Max:25 S2 05 | 2 0 2 | 0 0 0 |
26 MARK A. BOWMAN Max:25 S2 06 | 9 2 7 | 2 0 2 |
Number of Sections: 5 Average Students Per Section: 5.60
CTE151 GAMNG INTMEDIA2 SM 1 275 10| 10 4 6 | 1 0 1 |
21 MARK A. BOWMAN Max:25 S2 01 | 4 2 2 | 0 0 0 |
22 MARK A. BOWMAN Max:25 S2 02 | 0 0 0 | 0 0 0 |
24 MARK A. BOWMAN Max:25 S2 04 | 1 0 1 | 1 0 1 |
25 MARK A. BOWMAN Max:25 S2 05 | 3 1 2 | 0 0 0 |
26 MARK A. BOWMAN Max:25 S2 06 | 2 1 1 | 0 0 0 |
Number of Sections: 5 Average Students Per Section: 2.00
CTE232 FOOD NUTR&SCI 2 SM 1 0 0| 0 0 0 | 0 0 0 |
CTE250 NUTRTN WELLNESS SM 1 50 19| 19 13 6 | 4 2 2 |
26 NOREEN A. KEBBA Max:25 S2 06 | 19 13 6 | 4 2 2 |
S2 <None> Max:0 S2 00 | 0 0 0 | 0 0 0 |
Number of Sections: 2 Average Students Per Section: 9.50
CTE303 HEALTH CTE SM 1 225 48| 48 24 24 | 7 3 4 |
21 NOREEN A. KEBBA Max:25 S2 01 | 0 0 0 | 0 0 0 |
22 NOREEN A. KEBBA Max:25 S2 02 | 14 5 9 | 3 1 2 |
24 NOREEN A. KEBBA Max:25 S2 04 | 21 14 7 | 2 1 1 |
25 NOREEN A. KEBBA Max:25 S2 05 | 13 5 8 | 2 1 1 |
26 NOREEN A. KEBBA Max:25 S2 06 | 0 0 0 | 0 0 0 |
S2 <None> Max:0 S2 00 | 0 0 0 | 0 0 0 |
Number of Sections: 6 Average Students Per Section: 8.00
CTE304 PREVENTIVE MED SM 1 0 0| 0 0 0 | 0 0 0 |
CTE465 YEARBOOK 1 SM 1 55 0| 0 0 0 | 0 0 0 |
26 STEVEN J. PAYNE Max:30 S2 01 | 0 0 0 | 0 0 0 |
S2 <None> Max:0 S2 00 | 0 0 0 | 0 0 0 |
Number of Sections: 2 Average Students Per Section: 0.00
CTE466 YEARBOOK 2 SM 1 40 9| 9 9 0 | 1 1 0 |
26 STEVEN J. PAYNE Max:20 S2 01 | 9 9 0 | 1 1 0 |
S2 <None> Max:0 S2 00 | 0 0 0 | 0 0 0 |
Number of Sections: 2 Average Students Per Section: 4.50
CTE470 WBL GENERIC SM 1 0 0| 0 0 0 | 0 0 0 |
CTE473 WBL BUS ED SM 1 0 0| 0 0 0 | 0 0 0 |
CTE477 WBL CULNY ARTS SM 1 0 0| 0 0 0 | 0 0 0 |
CTE480 WBL FAM CONS SC SM 1 0 0| 0 0 0 | 0 0 0 |
CTE484 WBL MARKETING SM 1 0 0| 0 0 0 | 0 0 0 |
CTE490 WBL CAR CHOICES SM 1 0 0| 0 0 0 | 0 0 0 |
CTE515 NEWSPAPER 2 SM 1 0 0| 0 0 0 | 0 0 0 |
FOR201 FRENCH 1 SM 1 0 0| 0 0 0 | 0 0 0 |
FOR401 JAPANESE 1 SM 1 0 0| 0 0 0 | 0 0 0 |
FOR900 FOR LANG XFER SM 1 0 0| 0 0 0 | 0 0 0 |
S2 <None> Max:0 S2 00 | 0 0 0 | 0 0 0 |

1sonyr01.p 38-2 WEST AUBURN SENIOR HIGH SCHOOL 03/02/15 Page:3
05.14.10.00.00 Course/Class Count Report 504 3:12 PM
EST NBR NBR ----TOTALS---- --Special Ed--
COURSE DESCRIPTION LGTH SEC AVL REQ TOT FEM MAL TOT FEM MAL
Number of Sections: 1 Average Students Per Section: 0.00
GEN200 ADVISORY 9-12 YR 1 571 231| 231 117 114 | 16 8 8 |
01 WILLIAM E. BONNELL Max:20 YR 10 | 11 3 8 | 2 0 2 |
02 NOREEN A. KEBBA Max:20 YR 10 | 11 7 4 | 1 1 0 |
03 LARRY D. LAUSH JR Max:17 YR 10 | 0 0 0 | 0 0 0 |
04 THOMAS J. PARSONS Max:20 YR 10 | 11 2 9 | 3 0 3 |
05 STEVEN J. PAYNE Max:20 YR 10 | 10 5 5 | 1 1 0 |
06 MARK A. BOWMAN Max:25 YR 10 | 11 4 7 | 1 1 0 |
07 LAUREN B. CRATER Max:25 YR 10 | 0 0 0 | 0 0 0 |
08 DORNFORD W. STOLIKER Max:20 YR 10 | 11 7 4 | 1 1 0 |
09 SANDRA L. VANNICE Max:20 YR 10 | 10 4 6 | 0 0 0 |
10 KENNETH G. WATSON Max:20 YR 10 | 9 4 5 | 1 0 1 |
11 DON A. WILSON Max:20 YR 10 | 12 2 10 | 0 0 0 |
12 DEREK S. LUDWIGSON Max:25 YR 10 | 14 6 8 | 1 0 1 |
13 FRANCINE A. SULLIVAN Max:17 YR 10 | 1 1 0 | 0 0 0 |
14 LEONARD E. HOLLOMAN Max:17 YR 10 | 5 1 4 | 0 0 0 |
15 ANNA A. JOHNSON Max:25 YR 10 | 14 8 6 | 1 1 0 |
16 EDNA GONZALEZ-HUFF Max:75 YR 10 | 1 1 0 | 0 0 0 |
50 WENDY L. OKADA Max:20 YR 10 | 14 10 4 | 1 1 0 |
51 WENDY L. OKADA Max:20 YR 10 | 14 8 6 | 0 0 0 |
54 CATHERINE M. PETER Max:50 YR 10 | 14 7 7 | 0 0 0 |
55 CATHERINE M. PETER Max:20 YR 10 | 14 9 5 | 1 0 1 |
70 BROOKE BROUSSARD Max:25 YR 10 | 11 8 3 | 1 1 0 |
84 MICHAEL H. BOSCH Max:50 YR 10 | 33 20 13 | 1 1 0 |
Number of Sections: 22 Average Students Per Section: 10.50
GEN301 STUDY SKILLS SM 1 0 0| 0 0 0 | 0 0 0 |
GEN500 ADM OFF AIDE SM 2 0 0| 0 0 0 | 0 0 0 |
GEN501 ADM OFF AIDE SM 2 0 0| 0 0 0 | 0 0 0 |
GEN513 LIBRARY AIDE SM 1 0 0| 0 0 0 | 0 0 0 |
GEN600 TEACHER AIDE SM 1 45 1| 1 1 0 | 0 0 0 |
21 NOREEN A. KEBBA Max:30 S2 01 | 0 0 0 | 0 0 0 |
22 STEVEN J. PAYNE Max:5 S2 02 | 1 1 0 | 0 0 0 |
Number of Sections: 2 Average Students Per Section: 0.50
GEN710 RUNNING START SM 1 160 14| 14 8 6 | 0 0 0 |
21 FRANCINE A. SULLIVAN Max:10 S2 01 | 2 1 1 | 0 0 0 |
22 FRANCINE A. SULLIVAN Max:10 S2 02 | 2 1 1 | 0 0 0 |
23 FRANCINE A. SULLIVAN Max:10 S2 03 | 2 1 1 | 0 0 0 |
24 FRANCINE A. SULLIVAN Max:10 S2 04 | 2 1 1 | 0 0 0 |
25 FRANCINE A. SULLIVAN Max:10 S2 05 | 2 1 1 | 0 0 0 |
26 FRANCINE A. SULLIVAN Max:10 S2 06 | 2 1 1 | 0 0 0 |
27 FRANCINE A. SULLIVAN Max:10 S2 07 | 1 1 0 | 0 0 0 |
28 FRANCINE A. SULLIVAN Max:10 S2 08 | 1 1 0 | 0 0 0 |
Number of Sections: 8 Average Students Per Section: 1.75
GEN800 INDEP STUDY SM 1 50 0| 0 0 0 | 0 0 0 |
71 BROOKE BROUSSARD Max:25 S2 04 | 0 0 0 | 0 0 0 |
S2 <None> Max:0 S2 00 | 0 0 0 | 0 0 0 |
Number of Sections: 2 Average Students Per Section: 0.00
GEN801 WSLP SM 1 2035 252| 252 160 92 | 10 8 2 |
23 MICHAEL H. BOSCH Max:25 S2 03 | 0 0 0 | 0 0 0 |
24 MICHAEL H. BOSCH Max:25 S2 04 | 0 0 0 | 0 0 0 |
25 THOMAS J. PARSONS Max:30 S2 05 | 0 0 0 | 0 0 0 |
26 MICHAEL H. BOSCH Max:25 S2 06 | 0 0 0 | 0 0 0 |
37 DORNFORD W. STOLIKER Max:30 S2 06 | 0 0 0 | 0 0 0 |
46 DORNFORD W. STOLIKER Max:25 S2 05 | 0 0 0 | 0 0 0 |
60 WENDY L. OKADA Max:20 S2 08 | 14 10 4 | 1 1 0 |
61 WENDY L. OKADA Max:20 S2 09 | 14 8 6 | 0 0 0 |

1sonyr01.p 38-2 WEST AUBURN SENIOR HIGH SCHOOL 03/02/15 Page:4
05.14.10.00.00 Course/Class Count Report 504 3:12 PM
EST NBR NBR ----TOTALS---- --Special Ed--
COURSE DESCRIPTION LGTH SEC AVL REQ TOT FEM MAL TOT FEM MAL
64 CATHERINE M. PETER Max:20 S2 02 | 14 7 7 | 0 0 0 |
65 CATHERINE M. PETER Max:20 S2 05 | 14 9 5 | 1 0 1 |
66 CATHERINE M. PETER Max:20 S2 03 | 14 7 7 | 0 0 0 |
67 CATHERINE M. PETER Max:20 S2 06 | 14 9 5 | 1 0 1 |
75 MICHAEL H. BOSCH Max:30 S2 03 | 6 3 3 | 1 1 0 |
76 MICHAEL H. BOSCH Max:30 S2 03 | 9 5 4 | 1 1 0 |
77 MICHAEL H. BOSCH Max:30 S2 03 | 8 4 4 | 1 1 0 |
78 MICHAEL H. BOSCH Max:30 S2 03 | 7 4 3 | 1 1 0 |
79 MICHAEL H. BOSCH Max:30 S2 03 | 9 5 4 | 1 1 0 |
80 MICHAEL H. BOSCH Max:30 S2 04 | 7 3 4 | 0 0 0 |
81 MICHAEL H. BOSCH Max:30 S2 04 | 9 6 3 | 0 0 0 |
82 MICHAEL H. BOSCH Max:30 S2 04 | 12 6 6 | 0 0 0 |
83 MICHAEL H. BOSCH Max:30 S2 04 | 10 7 3 | 0 0 0 |
84 MICHAEL H. BOSCH Max:30 S2 04 | 11 7 4 | 0 0 0 |
85 MICHAEL H. BOSCH Max:30 S2 06 | 0 0 0 | 0 0 0 |
86 MICHAEL H. BOSCH Max:30 S2 06 | 4 3 1 | 0 0 0 |
87 MICHAEL H. BOSCH Max:30 S2 06 | 1 0 1 | 0 0 0 |
88 MICHAEL H. BOSCH Max:30 S2 06 | 5 4 1 | 0 0 0 |
89 MICHAEL H. BOSCH Max:30 S2 06 | 2 1 1 | 0 0 0 |
90 THOMAS J. PARSONS Max:30 S2 05 | 5 3 2 | 0 0 0 |
91 THOMAS J. PARSONS Max:30 S2 05 | 9 7 2 | 0 0 0 |
92 THOMAS J. PARSONS Max:30 S2 05 | 7 5 2 | 1 1 0 |
93 THOMAS J. PARSONS Max:30 S2 05 | 11 9 2 | 0 0 0 |
94 THOMAS J. PARSONS Max:30 S2 05 | 8 7 1 | 1 1 0 |
95 DORNFORD W. STOLIKER Max:30 S2 06 | 3 2 1 | 0 0 0 |
96 DORNFORD W. STOLIKER Max:30 S2 06 | 8 6 2 | 0 0 0 |
97 DORNFORD W. STOLIKER Max:30 S2 06 | 4 3 1 | 0 0 0 |
98 DORNFORD W. STOLIKER Max:30 S2 06 | 9 7 2 | 0 0 0 |
99 DORNFORD W. STOLIKER Max:30 S2 06 | 4 3 1 | 0 0 0 |
Number of Sections: 37 Average Students Per Section: 6.81
GEN803 WSLP-AWG SM 1 75 33| 33 16 17 | 4 2 2 |
01 EDNA GONZALEZ-HUFF Max:50 S2 01 | 33 16 17 | 4 2 2 |
Number of Sections: 1 Average Students Per Section: 33.00
GEN804 PERSONAL GROWTH SM 1 685 103| 103 39 64 | 19 7 12 |
31 KENNETH G. WATSON Max:25 S2 03 | 0 0 0 | 0 0 0 |
32 NOREEN A. KEBBA Max:25 S2 03 | 8 2 6 | 1 0 1 |
33 LARRY D. LAUSH JR Max:25 S2 03 | 11 4 7 | 1 1 0 |
34 THOMAS J. PARSONS Max:25 S2 03 | 11 5 6 | 2 0 2 |
35 STEVEN J. PAYNE Max:25 S2 03 | 5 1 4 | 0 0 0 |
36 MARK A. BOWMAN Max:25 S2 03 | 10 2 8 | 5 0 5 |
37 LAUREN B. CRATER Max:25 S2 03 | 5 3 2 | 2 1 1 |
38 DORNFORD W. STOLIKER Max:25 S2 03 | 15 7 8 | 2 1 1 |
39 SANDRA L. VANNICE Max:25 S2 03 | 0 0 0 | 0 0 0 |
40 KENNETH G. WATSON Max:25 S2 03 | 12 5 7 | 0 0 0 |
41 DON A. WILSON Max:25 S2 03 | 14 7 7 | 2 1 1 |
42 WILLIAM E. BONNELL Max:30 S2 03 | 12 3 9 | 4 3 1 |
94 MICHAEL H. BOSCH Max:25 S2 03 | 0 0 0 | 0 0 0 |
S2 <None> Max:0 S2 00 | 0 0 0 | 0 0 0 |
Number of Sections: 14 Average Students Per Section: 7.36
GEN805 LEADERSHIP SM 1 0 0| 0 0 0 | 0 0 0 |
S2 <None> Max:0 S2 00 | 0 0 0 | 0 0 0 |
V2 <None> Max:0 S2 00 | 0 0 0 | 0 0 0 |
Number of Sections: 2 Average Students Per Section: 0.00
GEN813 in AMHS course SM 1 120 5| 5 0 5 | 0 0 0 |
24 <None> Max:30 S2 06 | 3 0 3 | 0 0 0 |
25 <None> Max:30 S2 05 | 2 0 2 | 0 0 0 |

1sonyr01.p 38-2 WEST AUBURN SENIOR HIGH SCHOOL 03/02/15 Page:5
05.14.10.00.00 Course/Class Count Report 504 3:12 PM
EST NBR NBR ----TOTALS---- --Special Ed--
COURSE DESCRIPTION LGTH SEC AVL REQ TOT FEM MAL TOT FEM MAL
Number of Sections: 2 Average Students Per Section: 2.50
GEN814 AHS AUTO TECH YR 1 30 2| 2 2 0 | 0 0 0 |
01 LEONARD E. HOLLOMAN Max:5 YR 01 | 1 1 0 | 0 0 0 |
02 LEONARD E. HOLLOMAN Max:5 YR 02 | 1 1 0 | 0 0 0 |
03 LEONARD E. HOLLOMAN Max:5 YR 03 | 0 0 0 | 0 0 0 |
04 LEONARD E. HOLLOMAN Max:5 YR 04 | 0 0 0 | 0 0 0 |
05 LEONARD E. HOLLOMAN Max:5 YR 05 | 0 0 0 | 0 0 0 |
06 LEONARD E. HOLLOMAN Max:5 YR 06 | 0 0 0 | 0 0 0 |
Number of Sections: 6 Average Students Per Section: 0.33
GEN816 AHS WELDING YR 1 1 0| 0 0 0 | 0 0 0 |
01 <None> Max:1 YR 01 | 0 0 0 | 0 0 0 |
Number of Sections: 1 Average Students Per Section: 0.00
GEN817 AHS MACH TRNG YR 1 2 0| 0 0 0 | 0 0 0 |
01 <None> Max:1 YR 01 | 0 0 0 | 0 0 0 |
02 <None> Max:1 YR 02 | 0 0 0 | 0 0 0 |
Number of Sections: 2 Average Students Per Section: 0.00
GEN820 AHS STUDENT YR 1 30 6| 6 2 4 | 2 0 2 |
01 <None> Max:5 YR 01 | 1 1 0 | 0 0 0 |
02 <None> Max:5 YR 02 | 0 0 0 | 0 0 0 |
03 <None> Max:5 YR 03 | 0 0 0 | 0 0 0 |
04 <None> Max:5 YR 04 | 0 0 0 | 0 0 0 |
05 <None> Max:5 YR 05 | 3 1 2 | 1 0 1 |
06 <None> Max:5 YR 06 | 2 0 2 | 1 0 1 |
Number of Sections: 6 Average Students Per Section: 1.00
GEN821 AMHS STUDENT YR 1 35 0| 0 0 0 | 0 0 0 |
01 LEONARD E. HOLLOMAN Max:5 YR 01 | 0 0 0 | 0 0 0 |
02 LEONARD E. HOLLOMAN Max:5 YR 02 | 0 0 0 | 0 0 0 |
03 LEONARD E. HOLLOMAN Max:5 YR 03 | 0 0 0 | 0 0 0 |
04 LEONARD E. HOLLOMAN Max:5 YR 04 | 0 0 0 | 0 0 0 |
05 LEONARD E. HOLLOMAN Max:5 YR 05 | 0 0 0 | 0 0 0 |
06 LEONARD E. HOLLOMAN Max:5 YR 06 | 0 0 0 | 0 0 0 |
09 <None> Max:5 YR 09 | 0 0 0 | 0 0 0 |
Number of Sections: 7 Average Students Per Section: 0.00
GEN822 ARHS STUDENT YR 1 30 7| 7 0 7 | 0 0 0 |
01 <None> Max:5 YR 01 | 0 0 0 | 0 0 0 |
02 <None> Max:5 YR 02 | 1 0 1 | 0 0 0 |
03 <None> Max:5 YR 03 | 1 0 1 | 0 0 0 |
04 <None> Max:5 YR 04 | 1 0 1 | 0 0 0 |
05 <None> Max:5 YR 05 | 2 0 2 | 0 0 0 |
06 <None> Max:5 YR 06 | 2 0 2 | 0 0 0 |
Number of Sections: 6 Average Students Per Section: 1.17
GEN823 WAHS STUDENT YR 1 35 0| 0 0 0 | 0 0 0 |
00 <None> Max:5 YR 00 | 0 0 0 | 0 0 0 |
01 <None> Max:5 YR 01 | 0 0 0 | 0 0 0 |
02 <None> Max:5 YR 02 | 0 0 0 | 0 0 0 |
03 <None> Max:5 YR 03 | 0 0 0 | 0 0 0 |
04 <None> Max:5 YR 04 | 0 0 0 | 0 0 0 |
05 <None> Max:5 YR 05 | 0 0 0 | 0 0 0 |
06 <None> Max:5 YR 06 | 0 0 0 | 0 0 0 |
Number of Sections: 7 Average Students Per Section: 0.00
GEN830 EARLY GRAD SM 1 300 0| 0 0 0 | 0 0 0 |
21 LEONARD E. HOLLOMAN Max:50 S2 01 | 0 0 0 | 0 0 0 |
22 LEONARD E. HOLLOMAN Max:50 S2 02 | 0 0 0 | 0 0 0 |
23 LEONARD E. HOLLOMAN Max:50 S2 03 | 0 0 0 | 0 0 0 |
24 LEONARD E. HOLLOMAN Max:50 S2 04 | 0 0 0 | 0 0 0 |
25 LEONARD E. HOLLOMAN Max:50 S2 05 | 0 0 0 | 0 0 0 |

1sonyr01.p 38-2 WEST AUBURN SENIOR HIGH SCHOOL 03/02/15 Page:6
05.14.10.00.00 Course/Class Count Report 504 3:12 PM
EST NBR NBR ----TOTALS---- --Special Ed--
COURSE DESCRIPTION LGTH SEC AVL REQ TOT FEM MAL TOT FEM MAL
26 LEONARD E. HOLLOMAN Max:50 S2 06 | 0 0 0 | 0 0 0 |
Number of Sections: 6 Average Students Per Section: 0.00
GEN840 AMHS JROTC SM 1 100 0| 0 0 0 | 0 0 0 |
21 LEONARD E. HOLLOMAN Max:25 S2 06 | 0 0 0 | 0 0 0 |
25 LEONARD E. HOLLOMAN Max:25 S2 05 | 0 0 0 | 0 0 0 |
Number of Sections: 2 Average Students Per Section: 0.00
GEN888 SEAT COUNT YR 1 0 0| 0 0 0 | 0 0 0 |
GEN900 GEN XFER SM 1 0 0| 0 0 0 | 0 0 0 |
S2 <None> Max:0 S2 00 | 0 0 0 | 0 0 0 |
V2 <None> Max:0 S2 00 | 0 0 0 | 0 0 0 |
X2 <None> Max:0 S2 00 | 0 0 0 | 0 0 0 |
Number of Sections: 3 Average Students Per Section: 0.00
HLT100 HEALTH SM 1 0 0| 0 0 0 | 0 0 0 |
S2 <None> Max:0 S2 00 | 0 0 0 | 0 0 0 |
Number of Sections: 1 Average Students Per Section: 0.00
HLT902 HEALTH XFER SM 1 0 0| 0 0 0 | 0 0 0 |
S2 <None> Max:0 S2 00 | 0 0 0 | 0 0 0 |
Number of Sections: 1 Average Students Per Section: 0.00
HLT911 HEALTH RUNSTART SM 1 0 0| 0 0 0 | 0 0 0 |
S2 <None> Max:0 S2 00 | 0 0 0 | 0 0 0 |
Number of Sections: 1 Average Students Per Section: 0.00
LAN101 LA 9 INTERVEN 1 SM 1 0 0| 0 0 0 | 0 0 0 |
LAN102 LA 9 INTERVEN 2 SM 1 0 0| 0 0 0 | 0 0 0 |
LAN120 LA 9 1 SM 1 50 0| 0 0 0 | 0 0 0 |
LAN121 LA 9 2 SM 1 75 28| 28 14 14 | 2 1 1 |
21 MICHAEL H. BOSCH Max:25 S2 01 | 0 0 0 | 0 0 0 |
23 ANNA A. JOHNSON Max:25 S2 03 | 14 8 6 | 1 1 0 |
24 ANNA A. JOHNSON Max:25 S2 04 | 14 6 8 | 1 0 1 |
Number of Sections: 3 Average Students Per Section: 9.33
LAN210 LA 10 BASIC 1 SM 1 0 0| 0 0 0 | 0 0 0 |
LAN220 LA 10 1 SM 1 105 0| 0 0 0 | 0 0 0 |
S2 <None> Max:0 S2 00 | 0 0 0 | 0 0 0 |
Number of Sections: 1 Average Students Per Section: 0.00
LAN221 LA 10 2 SM 1 125 12| 12 4 8 | 2 0 2 |
22 WILLIAM E. BONNELL Max:25 S2 02 | 12 4 8 | 2 0 2 |
25 ANNA A. JOHNSON Max:25 S2 05 | 0 0 0 | 0 0 0 |
26 ANNA A. JOHNSON Max:25 S2 06 | 0 0 0 | 0 0 0 |
S2 <None> Max:0 S2 00 | 0 0 0 | 0 0 0 |
Number of Sections: 4 Average Students Per Section: 3.00
LAN301 LA INTERVEN 1 SM 1 25 0| 0 0 0 | 0 0 0 |
S2 <None> Max:0 S2 02 | 0 0 0 | 0 0 0 |
Number of Sections: 1 Average Students Per Section: 0.00
LAN302 LA INTERVEN 2 SM 1 70 16| 16 6 10 | 2 0 2 |
02 MICHAEL H. BOSCH Max:15 S2 07 | 0 0 0 | 0 0 0 |
25 MICHAEL H. BOSCH Max:15 S2 05 | 7 2 5 | 2 0 2 |
27 MICHAEL H. BOSCH Max:15 S2 07 | 9 4 5 | 0 0 0 |
S2 <None> Max:0 S2 00 | 0 0 0 | 0 0 0 |
Number of Sections: 4 Average Students Per Section: 4.00
LAN320 AMER LIT 1 SM 1 75 0| 0 0 0 | 0 0 0 |
S2 <None> Max:0 S2 00 | 0 0 0 | 0 0 0 |
Number of Sections: 1 Average Students Per Section: 0.00
LAN321 AMER LIT 2 SM 1 75 15| 15 3 12 | 1 0 1 |
04 ANNA A. JOHNSON Max:25 S2 04 | 0 0 0 | 0 0 0 |
21 WILLIAM E. BONNELL Max:25 S2 01 | 15 3 12 | 1 0 1 |
S2 <None> Max:0 S2 00 | 0 0 0 | 0 0 0 |

1sonyr01.p 38-2 WEST AUBURN SENIOR HIGH SCHOOL 03/02/15 Page:7
05.14.10.00.00 Course/Class Count Report 504 3:12 PM
EST NBR NBR ----TOTALS---- --Special Ed--
COURSE DESCRIPTION LGTH SEC AVL REQ TOT FEM MAL TOT FEM MAL
Number of Sections: 3 Average Students Per Section: 5.00
LAN413 INDIV LIT 1 SM 1 0 0| 0 0 0 | 0 0 0 |
S2 <None> Max:0 S2 00 | 0 0 0 | 0 0 0 |
Number of Sections: 1 Average Students Per Section: 0.00
LAN416 CREATIVE WRIT SM 1 25 0| 0 0 0 | 0 0 0 |
25 MICHAEL H. BOSCH Max:0 S2 05 | 0 0 0 | 0 0 0 |
S2 <None> Max:0 S2 00 | 0 0 0 | 0 0 0 |
Number of Sections: 2 Average Students Per Section: 0.00
LAN417 COLLEGE WRITING SM 1 0 0| 0 0 0 | 0 0 0 |
S2 <None> Max:0 S2 00 | 0 0 0 | 0 0 0 |
Number of Sections: 1 Average Students Per Section: 0.00
LAN418 POETRY SM 1 0 0| 0 0 0 | 0 0 0 |
S2 <None> Max:0 S2 00 | 0 0 0 | 0 0 0 |
Number of Sections: 1 Average Students Per Section: 0.00
LAN421 HUMANITIES 1 SM 1 50 0| 0 0 0 | 0 0 0 |
S2 <None> Max:0 S2 00 | 0 0 0 | 0 0 0 |
Number of Sections: 1 Average Students Per Section: 0.00
LAN422 HUMANITIES 2 SM 1 25 0| 0 0 0 | 0 0 0 |
02 MICHAEL H. BOSCH Max:25 S2 02 | 0 0 0 | 0 0 0 |
S2 <None> Max:0 S2 00 | 0 0 0 | 0 0 0 |
Number of Sections: 2 Average Students Per Section: 0.00
LAN423 READING LAB 1 SM 2 30 0| 0 0 0 | 0 0 0 |
S2 <None> Max:0 S2 00 | 0 0 0 | 0 0 0 |
Number of Sections: 1 Average Students Per Section: 0.00
LAN424 READING LAB 2 SM 1 45 0| 0 0 0 | 0 0 0 |
25 MICHAEL H. BOSCH Max:15 S2 05 | 0 0 0 | 0 0 0 |
S2 <None> Max:0 S2 00 | 0 0 0 | 0 0 0 |
Number of Sections: 2 Average Students Per Section: 0.00
LAN513 JOURNALISTIC WR SM 1 0 0| 0 0 0 | 0 0 0 |
LAN532 WRITING LAB SM 1 40 0| 0 0 0 | 0 0 0 |
25 MICHAEL H. BOSCH Max:15 S2 05 | 0 0 0 | 0 0 0 |
S2 <None> Max:0 S2 00 | 0 0 0 | 0 0 0 |
V2 <None> Max:0 S2 00 | 0 0 0 | 0 0 0 |
Number of Sections: 3 Average Students Per Section: 0.00
LAN800 LAN IND STDY SM 1 236 11| 11 8 3 | 1 1 0 |
03 ANNA A. JOHNSON Max:25 S2 01 | 0 0 0 | 0 0 0 |
04 ANNA A. JOHNSON Max:25 S2 02 | 0 0 0 | 0 0 0 |
05 KENNETH G. WATSON Max:3 S2 05 | 0 0 0 | 0 0 0 |
26 MICHAEL H. BOSCH Max:20 S2 06 | 0 0 0 | 0 0 0 |
71 BROOKE BROUSSARD Max:25 S2 03 | 11 8 3 | 1 1 0 |
S2 <None> Max:0 S2 00 | 0 0 0 | 0 0 0 |
V2 <None> Max:0 S2 00 | 0 0 0 | 0 0 0 |
Number of Sections: 7 Average Students Per Section: 1.57
LAN801 WSLP SM 1 123 0| 0 0 0 | 0 0 0 |
64 CATHERINE M. PETER Max:20 S2 02 | 0 0 0 | 0 0 0 |
65 CATHERINE M. PETER Max:20 S2 05 | 0 0 0 | 0 0 0 |
94 MICHAEL H. BOSCH Max:18 S2 04 | 0 0 0 | 0 0 0 |
Number of Sections: 3 Average Students Per Section: 0.00
LAN900 LAN XFER SM 1 0 0| 0 0 0 | 0 0 0 |
S2 <None> Max:0 S2 00 | 0 0 0 | 0 0 0 |
V2 <None> Max:0 S2 00 | 0 0 0 | 0 0 0 |
X2 <None> Max:0 S2 00 | 0 0 0 | 0 0 0 |
Number of Sections: 3 Average Students Per Section: 0.00
LANONL LAN ONLINE SM 1 490 38| 38 12 26 | 1 1 0 |
25 WILLIAM E. BONNELL Max:25 S2 05 | 17 6 11 | 0 0 0 |
26 WILLIAM E. BONNELL Max:25 S2 06 | 21 6 15 | 1 1 0 |

1sonyr01.p 38-2 WEST AUBURN SENIOR HIGH SCHOOL 03/02/15 Page:8
05.14.10.00.00 Course/Class Count Report 504 3:12 PM
EST NBR NBR ----TOTALS---- --Special Ed--
COURSE DESCRIPTION LGTH SEC AVL REQ TOT FEM MAL TOT FEM MAL
33 MICHAEL H. BOSCH Max:15 S2 03 | 0 0 0 | 0 0 0 |
44 MICHAEL H. BOSCH Max:15 S2 04 | 0 0 0 | 0 0 0 |
Number of Sections: 4 Average Students Per Section: 9.50
MAT105 SEG WASL MATH 1 SM 1 0 0| 0 0 0 | 0 0 0 |
MAT106 SEG WASL MATH 2 SM 1 0 0| 0 0 0 | 0 0 0 |
MAT110 FOUND ALG/GEO 1 SM 1 429 0| 0 0 0 | 0 0 0 |
21 LARRY D. LAUSH JR Max:25 S2 01 | 0 0 0 | 0 0 0 |
24 LARRY D. LAUSH JR Max:25 S2 04 | 0 0 0 | 0 0 0 |
42 DORNFORD W. STOLIKER Max:25 S2 02 | 0 0 0 | 0 0 0 |
45 DORNFORD W. STOLIKER Max:25 S2 05 | 0 0 0 | 0 0 0 |
46 DORNFORD W. STOLIKER Max:25 S2 06 | 0 0 0 | 0 0 0 |
64 CATHERINE M. PETER Max:13 S2 02 | 0 0 0 | 0 0 0 |
65 CATHERINE M. PETER Max:13 S2 05 | 0 0 0 | 0 0 0 |
66 KATHLEEN L. LEE Max:13 S2 03 | 0 0 0 | 0 0 0 |
67 CATHERINE M. PETER Max:13 S2 06 | 0 0 0 | 0 0 0 |
71 BROOKE BROUSSARD Max:25 S2 04 | 0 0 0 | 0 0 0 |
S2 <None> Max:0 S2 00 | 0 0 0 | 0 0 0 |
Number of Sections: 11 Average Students Per Section: 0.00
MAT111 FOUND ALG/GEO 2 SM 1 379 25| 25 11 14 | 2 1 1 |
01 LARRY D. LAUSH JR Max:25 S2 01 | 0 0 0 | 0 0 0 |
21 DEREK S. LUDWIGSON Max:25 S2 01 | 14 6 8 | 1 0 1 |
22 DEREK S. LUDWIGSON Max:25 S2 02 | 11 5 6 | 1 1 0 |
42 DORNFORD W. STOLIKER Max:25 S2 02 | 0 0 0 | 0 0 0 |
45 DORNFORD W. STOLIKER Max:25 S2 05 | 0 0 0 | 0 0 0 |
46 DORNFORD W. STOLIKER Max:25 S2 06 | 0 0 0 | 0 0 0 |
64 CATHERINE M. PETER Max:13 S2 02 | 0 0 0 | 0 0 0 |
65 CATHERINE M. PETER Max:13 S2 05 | 0 0 0 | 0 0 0 |
66 CATHERINE M. PETER Max:13 S2 03 | 0 0 0 | 0 0 0 |
67 CATHERINE M. PETER Max:13 S2 06 | 0 0 0 | 0 0 0 |
71 BROOKE BROUSSARD Max:25 S2 04 | 0 0 0 | 0 0 0 |
S2 <None> Max:0 S2 00 | 0 0 0 | 0 0 0 |
Number of Sections: 12 Average Students Per Section: 2.08
MAT112 FOUND ALG/GEO 3 SM 1 404 0| 0 0 0 | 0 0 0 |
21 LARRY D. LAUSH JR Max:25 S2 01 | 0 0 0 | 0 0 0 |
24 LARRY D. LAUSH JR Max:25 S2 04 | 0 0 0 | 0 0 0 |
42 DORNFORD W. STOLIKER Max:25 S2 02 | 0 0 0 | 0 0 0 |
45 DORNFORD W. STOLIKER Max:25 S2 05 | 0 0 0 | 0 0 0 |
46 DORNFORD W. STOLIKER Max:25 S2 06 | 0 0 0 | 0 0 0 |
64 CATHERINE M. PETER Max:13 S2 02 | 0 0 0 | 0 0 0 |
65 CATHERINE M. PETER Max:13 S2 05 | 0 0 0 | 0 0 0 |
66 CATHERINE M. PETER Max:13 S2 03 | 0 0 0 | 0 0 0 |
67 CATHERINE M. PETER Max:13 S2 06 | 0 0 0 | 0 0 0 |
71 BROOKE BROUSSARD Max:25 S2 04 | 0 0 0 | 0 0 0 |
S2 <None> Max:0 S2 00 | 0 0 0 | 0 0 0 |
Number of Sections: 11 Average Students Per Section: 0.00
MAT113 FOUND ALG/GEO 4 SM 1 454 0| 0 0 0 | 0 0 0 |
21 LARRY D. LAUSH JR Max:25 S2 01 | 0 0 0 | 0 0 0 |
25 LARRY D. LAUSH JR Max:25 S2 05 | 0 0 0 | 0 0 0 |
26 LARRY D. LAUSH JR Max:25 S2 06 | 0 0 0 | 0 0 0 |
42 DORNFORD W. STOLIKER Max:25 S2 02 | 0 0 0 | 0 0 0 |
45 DORNFORD W. STOLIKER Max:25 S2 05 | 0 0 0 | 0 0 0 |
46 DORNFORD W. STOLIKER Max:25 S2 06 | 0 0 0 | 0 0 0 |
64 CATHERINE M. PETER Max:13 S2 02 | 0 0 0 | 0 0 0 |
65 CATHERINE M. PETER Max:13 S2 05 | 0 0 0 | 0 0 0 |
66 CATHERINE M. PETER Max:13 S2 03 | 0 0 0 | 0 0 0 |
67 CATHERINE M. PETER Max:13 S2 06 | 0 0 0 | 0 0 0 |

1sonyr01.p 38-2 WEST AUBURN SENIOR HIGH SCHOOL 03/02/15 Page:9
05.14.10.00.00 Course/Class Count Report 504 3:12 PM
EST NBR NBR ----TOTALS---- --Special Ed--
COURSE DESCRIPTION LGTH SEC AVL REQ TOT FEM MAL TOT FEM MAL
71 BROOKE BROUSSARD Max:25 S2 04 | 0 0 0 | 0 0 0 |
S2 <None> Max:0 S2 00 | 0 0 0 | 0 0 0 |
Number of Sections: 12 Average Students Per Section: 0.00
MAT120 ALGEBRA 1 SM 1 479 0| 0 0 0 | 0 0 0 |
21 LARRY D. LAUSH JR Max:25 S2 01 | 0 0 0 | 0 0 0 |
24 LARRY D. LAUSH JR Max:25 S2 04 | 0 0 0 | 0 0 0 |
41 DORNFORD W. STOLIKER Max:25 S2 01 | 0 0 0 | 0 0 0 |
42 DORNFORD W. STOLIKER Max:25 S2 02 | 0 0 0 | 0 0 0 |
45 DORNFORD W. STOLIKER Max:25 S2 05 | 0 0 0 | 0 0 0 |
46 DORNFORD W. STOLIKER Max:25 S2 06 | 0 0 0 | 0 0 0 |
64 CATHERINE M. PETER Max:13 S2 02 | 0 0 0 | 0 0 0 |
65 CATHERINE M. PETER Max:13 S2 05 | 0 0 0 | 0 0 0 |
66 CATHERINE M. PETER Max:13 S2 03 | 0 0 0 | 0 0 0 |
67 CATHERINE M. PETER Max:13 S2 06 | 0 0 0 | 0 0 0 |
71 BROOKE BROUSSARD Max:25 S2 04 | 0 0 0 | 0 0 0 |
S2 <None> Max:0 S2 00 | 0 0 0 | 0 0 0 |
Number of Sections: 12 Average Students Per Section: 0.00
MAT121 ALGEBRA 2 SM 1 504 46| 46 17 29 | 5 3 2 |
21 LARRY D. LAUSH JR Max:25 S2 01 | 0 0 0 | 0 0 0 |
23 DEREK S. LUDWIGSON Max:25 S2 03 | 14 6 8 | 1 0 1 |
24 DEREK S. LUDWIGSON Max:25 S2 04 | 11 5 6 | 1 1 0 |
31 DORNFORD W. STOLIKER Max:25 S2 01 | 0 0 0 | 0 0 0 |
32 DORNFORD W. STOLIKER Max:25 S2 02 | 21 6 15 | 3 2 1 |
41 DORNFORD W. STOLIKER Max:25 S2 01 | 0 0 0 | 0 0 0 |
42 JONATHAN G. MOREHEAD Max:25 S2 02 | 0 0 0 | 0 0 0 |
45 DORNFORD W. STOLIKER Max:25 S2 05 | 0 0 0 | 0 0 0 |
46 DORNFORD W. STOLIKER Max:25 S2 06 | 0 0 0 | 0 0 0 |
64 CATHERINE M. PETER Max:13 S2 02 | 0 0 0 | 0 0 0 |
65 CATHERINE M. PETER Max:13 S2 05 | 0 0 0 | 0 0 0 |
66 CATHERINE M. PETER Max:13 S2 03 | 0 0 0 | 0 0 0 |
67 CATHERINE M. PETER Max:13 S2 06 | 0 0 0 | 0 0 0 |
71 BROOKE BROUSSARD Max:25 S2 04 | 0 0 0 | 0 0 0 |
S2 <None> Max:0 S2 00 | 0 0 0 | 0 0 0 |
Number of Sections: 15 Average Students Per Section: 3.07
MAT122 ADV HS MATH 1 SM 1 110 13| 13 8 5 | 1 1 0 |
26 LARRY D. LAUSH JR Max:25 S2 06 | 13 8 5 | 1 1 0 |
Number of Sections: 1 Average Students Per Section: 13.00
MAT123 ADV HS MATH 2 SM 1 60 0| 0 0 0 | 0 0 0 |
26 LARRY D. LAUSH JR Max:30 S2 06 | 0 0 0 | 0 0 0 |
Number of Sections: 1 Average Students Per Section: 0.00
MAT210 GEOMETRY 1 SM 1 454 0| 0 0 0 | 0 0 0 |
21 LARRY D. LAUSH JR Max:25 S2 01 | 0 0 0 | 0 0 0 |
24 LARRY D. LAUSH JR Max:25 S2 04 | 0 0 0 | 0 0 0 |
25 LARRY D. LAUSH JR Max:25 S2 05 | 0 0 0 | 0 0 0 |
42 DORNFORD W. STOLIKER Max:25 S2 02 | 0 0 0 | 0 0 0 |
45 DORNFORD W. STOLIKER Max:25 S2 05 | 0 0 0 | 0 0 0 |
46 DORNFORD W. STOLIKER Max:25 S2 06 | 0 0 0 | 0 0 0 |
64 CATHERINE M. PETER Max:13 S2 02 | 0 0 0 | 0 0 0 |
65 CATHERINE M. PETER Max:13 S2 05 | 0 0 0 | 0 0 0 |
66 CATHERINE M. PETER Max:13 S2 03 | 0 0 0 | 0 0 0 |
67 CATHERINE M. PETER Max:13 S2 06 | 0 0 0 | 0 0 0 |
71 BROOKE BROUSSARD Max:25 S2 04 | 0 0 0 | 0 0 0 |
S2 <None> Max:0 S2 00 | 0 0 0 | 0 0 0 |
Number of Sections: 12 Average Students Per Section: 0.00
MAT211 GEOMETRY 2 SM 1 454 9| 9 5 4 | 0 0 0 |
21 LARRY D. LAUSH JR Max:25 S2 01 | 0 0 0 | 0 0 0 |

1sonyr01.p 38-2 WEST AUBURN SENIOR HIGH SCHOOL 03/02/15 Page:10
05.14.10.00.00 Course/Class Count Report 504 3:12 PM
EST NBR NBR ----TOTALS---- --Special Ed--
COURSE DESCRIPTION LGTH SEC AVL REQ TOT FEM MAL TOT FEM MAL
24 LARRY D. LAUSH JR Max:25 S2 04 | 0 0 0 | 0 0 0 |
25 LARRY D. LAUSH JR Max:25 S2 05 | 9 5 4 | 0 0 0 |
42 DORNFORD W. STOLIKER Max:25 S2 02 | 0 0 0 | 0 0 0 |
45 DORNFORD W. STOLIKER Max:25 S2 05 | 0 0 0 | 0 0 0 |
46 DORNFORD W. STOLIKER Max:25 S2 06 | 0 0 0 | 0 0 0 |
64 CATHERINE M. PETER Max:13 S2 02 | 0 0 0 | 0 0 0 |
65 CATHERINE M. PETER Max:13 S2 05 | 0 0 0 | 0 0 0 |
66 CATHERINE M. PETER Max:13 S2 03 | 0 0 0 | 0 0 0 |
67 CATHERINE M. PETER Max:13 S2 06 | 0 0 0 | 0 0 0 |
71 BROOKE BROUSSARD Max:25 S2 04 | 0 0 0 | 0 0 0 |
S2 <None> Max:0 S2 00 | 0 0 0 | 0 0 0 |
Number of Sections: 12 Average Students Per Section: 0.75
MAT310 ADV ALG/TRIG 1 SM 1 404 0| 0 0 0 | 0 0 0 |
21 LARRY D. LAUSH JR Max:25 S2 01 | 0 0 0 | 0 0 0 |
24 LARRY D. LAUSH JR Max:25 S2 04 | 0 0 0 | 0 0 0 |
42 DORNFORD W. STOLIKER Max:25 S2 02 | 0 0 0 | 0 0 0 |
45 DORNFORD W. STOLIKER Max:25 S2 05 | 0 0 0 | 0 0 0 |
46 DORNFORD W. STOLIKER Max:25 S2 06 | 0 0 0 | 0 0 0 |
64 CATHERINE M. PETER Max:13 S2 02 | 0 0 0 | 0 0 0 |
65 CATHERINE M. PETER Max:13 S2 05 | 0 0 0 | 0 0 0 |
66 CATHERINE M. PETER Max:13 S2 03 | 0 0 0 | 0 0 0 |
67 CATHERINE M. PETER Max:13 S2 06 | 0 0 0 | 0 0 0 |
71 BROOKE BROUSSARD Max:25 S2 04 | 0 0 0 | 0 0 0 |
S2 <None> Max:0 S2 00 | 0 0 0 | 0 0 0 |
Number of Sections: 11 Average Students Per Section: 0.00
MAT311 ADV ALG/TRIG 2 SM 1 404 0| 0 0 0 | 0 0 0 |
21 LARRY D. LAUSH JR Max:25 S2 01 | 0 0 0 | 0 0 0 |
24 LARRY D. LAUSH JR Max:25 S2 04 | 0 0 0 | 0 0 0 |
42 DORNFORD W. STOLIKER Max:25 S2 02 | 0 0 0 | 0 0 0 |
45 DORNFORD W. STOLIKER Max:25 S2 05 | 0 0 0 | 0 0 0 |
46 DORNFORD W. STOLIKER Max:25 S2 06 | 0 0 0 | 0 0 0 |
64 CATHERINE M. PETER Max:13 S2 02 | 0 0 0 | 0 0 0 |
65 CATHERINE M. PETER Max:13 S2 05 | 0 0 0 | 0 0 0 |
66 CATHERINE M. PETER Max:13 S2 03 | 0 0 0 | 0 0 0 |
67 CATHERINE M. PETER Max:13 S2 06 | 0 0 0 | 0 0 0 |
71 BROOKE BROUSSARD Max:25 S2 04 | 0 0 0 | 0 0 0 |
S2 <None> Max:0 S2 00 | 0 0 0 | 0 0 0 |
Number of Sections: 11 Average Students Per Section: 0.00
MAT412 PRE CALCULUS 1 SM 1 0 0| 0 0 0 | 0 0 0 |
S2 <None> Max:0 S2 00 | 0 0 0 | 0 0 0 |
Number of Sections: 1 Average Students Per Section: 0.00
MAT800 MATH IND STDY SM 1 245 11| 11 8 3 | 1 1 0 |
21 LARRY D. LAUSH JR Max:25 S2 01 | 0 0 0 | 0 0 0 |
22 LARRY D. LAUSH JR Max:25 S2 02 | 0 0 0 | 0 0 0 |
25 LARRY D. LAUSH JR Max:25 S2 05 | 0 0 0 | 0 0 0 |
26 LARRY D. LAUSH JR Max:25 S2 06 | 0 0 0 | 0 0 0 |
71 BROOKE BROUSSARD Max:25 S2 04 | 11 8 3 | 1 1 0 |
S2 <None> Max:0 S2 00 | 0 0 0 | 0 0 0 |
V2 <None> Max:0 S2 00 | 0 0 0 | 0 0 0 |
Number of Sections: 7 Average Students Per Section: 1.57
MAT801 WSLP SM 1 130 0| 0 0 0 | 0 0 0 |
64 CATHERINE M. PETER Max:20 S2 03 | 0 0 0 | 0 0 0 |
65 CATHERINE M. PETER Max:20 S2 06 | 0 0 0 | 0 0 0 |
91 LARRY D. LAUSH JR Max:25 S2 04 | 0 0 0 | 0 0 0 |
Number of Sections: 3 Average Students Per Section: 0.00
MAT900 MATH XFER SM 1 30 0| 0 0 0 | 0 0 0 |

1sonyr01.p 38-2 WEST AUBURN SENIOR HIGH SCHOOL 03/02/15 Page:11
05.14.10.00.00 Course/Class Count Report 504 3:12 PM
EST NBR NBR ----TOTALS---- --Special Ed--
COURSE DESCRIPTION LGTH SEC AVL REQ TOT FEM MAL TOT FEM MAL
S2 <None> Max:0 S2 00 | 0 0 0 | 0 0 0 |
V2 <None> Max:0 S2 00 | 0 0 0 | 0 0 0 |
Number of Sections: 2 Average Students Per Section: 0.00
MATONL MATH ONLINE SM 1 600 61| 61 25 36 | 5 2 3 |
13 LARRY D. LAUSH JR Max:10 S2 01 | 1 0 1 | 0 0 0 |
14 LARRY D. LAUSH JR Max:30 S2 02 | 1 0 1 | 0 0 0 |
21 LARRY D. LAUSH JR Max:30 S2 01 | 13 6 7 | 2 0 2 |
22 LARRY D. LAUSH JR Max:25 S2 02 | 16 6 10 | 0 0 0 |
24 DORNFORD W. STOLIKER Max:25 S2 04 | 13 7 6 | 2 1 1 |
25 DORNFORD W. STOLIKER Max:25 S2 05 | 13 6 7 | 1 1 0 |
26 LARRY D. LAUSH JR Max:20 S2 06 | 0 0 0 | 0 0 0 |
27 WENDY L. OKADA Max:30 S2 07 | 0 0 0 | 0 0 0 |
36 DORNFORD W. STOLIKER Max:25 S2 06 | 4 0 4 | 0 0 0 |
Number of Sections: 9 Average Students Per Section: 6.78
MUS800 MUSIC IND STUDY SM 1 0 0| 0 0 0 | 0 0 0 |
MUS900 MUSIC XFER SM 1 0 0| 0 0 0 | 0 0 0 |
S2 <None> Max:0 S2 00 | 0 0 0 | 0 0 0 |
Number of Sections: 1 Average Students Per Section: 0.00
PHY200 COED PE SM 1 50 0| 0 0 0 | 0 0 0 |
S2 <None> Max:0 S2 00 | 0 0 0 | 0 0 0 |
Number of Sections: 1 Average Students Per Section: 0.00
PHY201 COED PE SM 1 50 37| 37 15 22 | 6 2 4 |
05 DON A. WILSON Max:25 S2 05 | 20 8 12 | 4 1 3 |
24 DON A. WILSON Max:25 S2 04 | 17 7 10 | 2 1 1 |
S2 <None> Max:0 S2 00 | 0 0 0 | 0 0 0 |
Number of Sections: 3 Average Students Per Section: 12.33
PHY206 AEROBICS SM 1 0 0| 0 0 0 | 0 0 0 |
PHY207 BASKETBALL SM 1 0 0| 0 0 0 | 0 0 0 |
PHY211 CONDITIONING SM 1 0 0| 0 0 0 | 0 0 0 |
PHY223 VOLLEYBALL SM 1 0 0| 0 0 0 | 0 0 0 |
PHY800 PE IND STUDY SM 1 50 11| 11 8 3 | 1 1 0 |
71 BROOKE BROUSSARD Max:25 S2 07 | 11 8 3 | 1 1 0 |
Number of Sections: 1 Average Students Per Section: 11.00
PHY900 PE XFER SM 1 30 0| 0 0 0 | 0 0 0 |
S2 <None> Max:0 S2 00 | 0 0 0 | 0 0 0 |
V2 <None> Max:0 S2 00 | 0 0 0 | 0 0 0 |
Number of Sections: 2 Average Students Per Section: 0.00
SCI101 SCIENCE LINKS SM 1 50 0| 0 0 0 | 0 0 0 |
S2 <None> Max:0 S2 00 | 0 0 0 | 0 0 0 |
V2 <None> Max:0 S2 00 | 0 0 0 | 0 0 0 |
Number of Sections: 2 Average Students Per Section: 0.00
SCI199 COE BIOLOGY 2 SM 1 15 2| 2 2 0 | 0 0 0 |
23 SANDRA L. VANNICE Max:15 S2 03 | 2 2 0 | 0 0 0 |
Number of Sections: 1 Average Students Per Section: 2.00
SCI200 BIOLOGY BASIC 1 SM 1 0 0| 0 0 0 | 0 0 0 |
SCI201 BIOLOGY BASIC 2 SM 1 0 0| 0 0 0 | 0 0 0 |
SCI202 BIOLOGY 1 SM 1 75 0| 0 0 0 | 0 0 0 |
S2 <None> Max:0 S2 00 | 0 0 0 | 0 0 0 |
Number of Sections: 1 Average Students Per Section: 0.00
SCI203 BIOLOGY 2 SM 1 75 18| 18 9 9 | 1 0 1 |
05 SANDRA L. VANNICE Max:25 S2 05 | 0 0 0 | 0 0 0 |
06 SANDRA L. VANNICE Max:25 S2 06 | 14 6 8 | 1 0 1 |
27 SANDRA L. VANNICE Max:25 S2 07 | 4 3 1 | 0 0 0 |
Number of Sections: 3 Average Students Per Section: 6.00
SCI510 HORTICULTURE SM 1 0 0| 0 0 0 | 0 0 0 |

1sonyr01.p 38-2 WEST AUBURN SENIOR HIGH SCHOOL 03/02/15 Page:12
05.14.10.00.00 Course/Class Count Report 504 3:12 PM
EST NBR NBR ----TOTALS---- --Special Ed--
COURSE DESCRIPTION LGTH SEC AVL REQ TOT FEM MAL TOT FEM MAL
SCI515 EARTH SCIENCE SM 1 75 36| 36 13 23 | 7 4 3 |
21 SANDRA L. VANNICE Max:25 S2 05 | 18 8 10 | 4 4 0 |
24 SANDRA L. VANNICE Max:25 S2 04 | 18 5 13 | 3 0 3 |
27 SANDRA L. VANNICE Max:25 S2 07 | 0 0 0 | 0 0 0 |
S2 <None> Max:0 S2 00 | 0 0 0 | 0 0 0 |
Number of Sections: 4 Average Students Per Section: 9.00
SCI800 SCI IND STUDY SM 1 35 0| 0 0 0 | 0 0 0 |
45 DORNFORD W. STOLIKER Max:10 S2 05 | 0 0 0 | 0 0 0 |
S2 <None> Max:0 S2 00 | 0 0 0 | 0 0 0 |
Number of Sections: 2 Average Students Per Section: 0.00
SCI801 WSLP SM 1 50 0| 0 0 0 | 0 0 0 |
92 DORNFORD W. STOLIKER Max:25 S2 02 | 0 0 0 | 0 0 0 |
Number of Sections: 1 Average Students Per Section: 0.00
SCI900 SCIENCE-LAB XFR SM 1 30 0| 0 0 0 | 0 0 0 |
S2 <None> Max:0 S2 00 | 0 0 0 | 0 0 0 |
Number of Sections: 1 Average Students Per Section: 0.00
SCI911 SCI-LAB RUN ST SM 1 0 0| 0 0 0 | 0 0 0 |
S2 <None> Max:0 S2 00 | 0 0 0 | 0 0 0 |
Number of Sections: 1 Average Students Per Section: 0.00
SCIONL SCIENCE ONLINE SM 1 300 6| 6 4 2 | 4 3 1 |
23 MICHAEL H. BOSCH Max:15 S2 03 | 0 0 0 | 0 0 0 |
26 DORNFORD W. STOLIKER Max:30 S2 06 | 5 3 2 | 3 2 1 |
27 SANDRA L. VANNICE Max:5 S2 07 | 1 1 0 | 1 1 0 |
Number of Sections: 3 Average Students Per Section: 2.00
SOC101 WORLD STUDIES SM 1 180 8| 8 3 5 | 0 0 0 |
22 KENNETH G. WATSON Max:25 S2 02 | 8 3 5 | 0 0 0 |
25 THOMAS J. PARSONS Max:25 S2 05 | 0 0 0 | 0 0 0 |
S2 <None> Max:0 S2 00 | 0 0 0 | 0 0 0 |
Number of Sections: 3 Average Students Per Section: 2.67
SOC150 WORLD GEOGRAPHY SM 1 100 47| 47 22 25 | 7 4 3 |
11 ANNA A. JOHNSON Max:25 S2 01 | 14 8 6 | 1 1 0 |
22 ANNA A. JOHNSON Max:25 S2 02 | 14 6 8 | 1 0 1 |
24 KENNETH G. WATSON Max:25 S2 04 | 19 8 11 | 5 3 2 |
Number of Sections: 3 Average Students Per Section: 15.67
SOC202 US HISTORY 1 SM 1 150 0| 0 0 0 | 0 0 0 |
25 THOMAS J. PARSONS Max:20 S2 05 | 0 0 0 | 0 0 0 |
S2 <None> Max:0 S2 00 | 0 0 0 | 0 0 0 |
Number of Sections: 2 Average Students Per Section: 0.00
SOC203 US HISTORY 2 SM 1 185 31| 31 12 19 | 6 3 3 |
01 THOMAS J. PARSONS Max:25 S2 01 | 16 7 9 | 3 2 1 |
04 THOMAS J. PARSONS Max:25 S2 04 | 15 5 10 | 3 1 2 |
25 THOMAS J. PARSONS Max:25 S2 05 | 0 0 0 | 0 0 0 |
S2 <None> Max:0 S2 00 | 0 0 0 | 0 0 0 |
Number of Sections: 4 Average Students Per Section: 7.75
SOC300 CIVICS SM 1 75 8| 8 4 4 | 0 0 0 |
22 THOMAS J. PARSONS Max:25 S2 02 | 8 4 4 | 0 0 0 |
25 THOMAS J. PARSONS Max:25 S2 05 | 0 0 0 | 0 0 0 |
S2 <None> Max:0 S2 00 | 0 0 0 | 0 0 0 |
Z2 <None> Max:0 S2 00 | 0 0 0 | 0 0 0 |
Number of Sections: 4 Average Students Per Section: 2.00
SOC400 GLOBAL ISSUES SM 1 155 0| 0 0 0 | 0 0 0 |
24 KENNETH G. WATSON Max:25 S2 04 | 0 0 0 | 0 0 0 |
25 THOMAS J. PARSONS Max:25 S2 05 | 0 0 0 | 0 0 0 |
26 KENNETH G. WATSON Max:25 S2 06 | 0 0 0 | 0 0 0 |
S2 <None> Max:0 S2 00 | 0 0 0 | 0 0 0 |
V2 <None> Max:0 S2 00 | 0 0 0 | 0 0 0 |

1sonyr01.p 38-2 WEST AUBURN SENIOR HIGH SCHOOL 03/02/15 Page:13
05.14.10.00.00 Course/Class Count Report 504 3:12 PM
EST NBR NBR ----TOTALS---- --Special Ed--
COURSE DESCRIPTION LGTH SEC AVL REQ TOT FEM MAL TOT FEM MAL
Z2 <None> Max:0 S2 00 | 0 0 0 | 0 0 0 |
Number of Sections: 6 Average Students Per Section: 0.00
SOC500 PSYCHOLOGY 1 SM 1 25 0| 0 0 0 | 0 0 0 |
S2 <None> Max:0 S2 00 | 0 0 0 | 0 0 0 |
Number of Sections: 1 Average Students Per Section: 0.00
SOC501 PSYCHOLOGY 2 SM 1 25 0| 0 0 0 | 0 0 0 |
07 MICHAEL H. BOSCH Max:25 S2 07 | 0 0 0 | 0 0 0 |
S2 <None> Max:0 S2 00 | 0 0 0 | 0 0 0 |
Number of Sections: 2 Average Students Per Section: 0.00
SOC508 WASH STATE HIST SM 1 50 0| 0 0 0 | 0 0 0 |
25 THOMAS J. PARSONS Max:25 S2 05 | 0 0 0 | 0 0 0 |
S2 <None> Max:0 S2 00 | 0 0 0 | 0 0 0 |
Number of Sections: 2 Average Students Per Section: 0.00
SOC800 SOC IND STDY SM 1 50 11| 11 8 3 | 1 1 0 |
71 BROOKE BROUSSARD Max:25 S2 05 | 11 8 3 | 1 1 0 |
S2 <None> Max:0 S2 00 | 0 0 0 | 0 0 0 |
Number of Sections: 2 Average Students Per Section: 5.50
SOC820 WSH REQ MET SM 1 0 0| 0 0 0 | 0 0 0 |
S2 <None> Max:0 S2 00 | 0 0 0 | 0 0 0 |
Number of Sections: 1 Average Students Per Section: 0.00
SOC900 SOC XFER SM 1 30 0| 0 0 0 | 0 0 0 |
S2 <None> Max:0 S2 00 | 0 0 0 | 0 0 0 |
V2 <None> Max:0 S2 00 | 0 0 0 | 0 0 0 |
Number of Sections: 2 Average Students Per Section: 0.00
SOCONL SOC STU ONLINE SM 1 525 10| 10 7 3 | 3 2 1 |
02 THOMAS J. PARSONS Max:30 S2 01 | 0 0 0 | 0 0 0 |
12 KENNETH G. WATSON Max:10 S2 02 | 1 0 1 | 1 0 1 |
21 THOMAS J. PARSONS Max:30 S2 01 | 0 0 0 | 0 0 0 |
22 THOMAS J. PARSONS Max:15 S2 02 | 0 0 0 | 0 0 0 |
25 THOMAS J. PARSONS Max:15 S2 05 | 8 6 2 | 2 2 0 |
42 THOMAS J. PARSONS Max:10 S2 04 | 1 1 0 | 0 0 0 |
Number of Sections: 6 Average Students Per Section: 1.67
SPE200 ADVISORY YR 1 14 12| 12 4 8 | 11 4 7 |
01 LAUREN B. CRATER Max:14 YR 10 | 12 4 8 | 11 4 7 |
Number of Sections: 1 Average Students Per Section: 12.00
SPE201 LANG ARTS 1 SM 1 231 0| 0 0 0 | 0 0 0 |
21 LAUREN B. CRATER Max:30 S2 01 | 0 0 0 | 0 0 0 |
24 LAUREN B. CRATER Max:30 S2 04 | 0 0 0 | 0 0 0 |
25 LAUREN B. CRATER Max:14 S2 05 | 0 0 0 | 0 0 0 |
26 LAUREN B. CRATER Max:14 S2 06 | 0 0 0 | 0 0 0 |
Number of Sections: 4 Average Students Per Section: 0.00
SPE202 LANG ARTS 1 SM 1 171 0| 0 0 0 | 0 0 0 |
21 LAUREN B. CRATER Max:30 S2 01 | 0 0 0 | 0 0 0 |
24 LAUREN B. CRATER Max:30 S2 04 | 0 0 0 | 0 0 0 |
25 LAUREN B. CRATER Max:14 S2 05 | 0 0 0 | 0 0 0 |
26 LAUREN B. CRATER Max:14 S2 06 | 0 0 0 | 0 0 0 |
Number of Sections: 4 Average Students Per Section: 0.00
SPE203 LANG ARTS 2 SM 1 171 0| 0 0 0 | 0 0 0 |
21 LAUREN B. CRATER Max:30 S2 01 | 0 0 0 | 0 0 0 |
24 LAUREN B. CRATER Max:30 S2 04 | 0 0 0 | 0 0 0 |
25 LAUREN B. CRATER Max:14 S2 05 | 0 0 0 | 0 0 0 |
26 LAUREN B. CRATER Max:14 S2 06 | 0 0 0 | 0 0 0 |
Number of Sections: 4 Average Students Per Section: 0.00
SPE204 LANG ARTS 2 SM 1 171 4| 4 1 3 | 4 1 3 |
21 LAUREN B. CRATER Max:30 S2 01 | 0 0 0 | 0 0 0 |
24 LAUREN B. CRATER Max:30 S2 04 | 0 0 0 | 0 0 0 |

1sonyr01.p 38-2 WEST AUBURN SENIOR HIGH SCHOOL 03/02/15 Page:14
05.14.10.00.00 Course/Class Count Report 504 3:12 PM
EST NBR NBR ----TOTALS---- --Special Ed--
COURSE DESCRIPTION LGTH SEC AVL REQ TOT FEM MAL TOT FEM MAL
25 LAUREN B. CRATER Max:14 S2 05 | 4 1 3 | 4 1 3 |
26 LAUREN B. CRATER Max:14 S2 06 | 0 0 0 | 0 0 0 |
Number of Sections: 4 Average Students Per Section: 1.00
SPE205 LANG ARTS 3 SM 1 171 11| 11 5 6 | 9 5 4 |
21 LAUREN B. CRATER Max:30 S2 01 | 11 5 6 | 9 5 4 |
24 LAUREN B. CRATER Max:30 S2 04 | 0 0 0 | 0 0 0 |
25 LAUREN B. CRATER Max:14 S2 05 | 0 0 0 | 0 0 0 |
26 LAUREN B. CRATER Max:14 S2 06 | 0 0 0 | 0 0 0 |
Number of Sections: 4 Average Students Per Section: 2.75
SPE206 LANG ARTS 3 SM 1 171 0| 0 0 0 | 0 0 0 |
21 LAUREN B. CRATER Max:30 S2 01 | 0 0 0 | 0 0 0 |
24 LAUREN B. CRATER Max:30 S2 04 | 0 0 0 | 0 0 0 |
25 LAUREN B. CRATER Max:14 S2 05 | 0 0 0 | 0 0 0 |
26 LAUREN B. CRATER Max:14 S2 06 | 0 0 0 | 0 0 0 |
Number of Sections: 4 Average Students Per Section: 0.00
SPE207 LANG ARTS 4 SM 1 171 0| 0 0 0 | 0 0 0 |
21 LAUREN B. CRATER Max:30 S2 01 | 0 0 0 | 0 0 0 |
24 LAUREN B. CRATER Max:30 S2 04 | 0 0 0 | 0 0 0 |
25 LAUREN B. CRATER Max:14 S2 05 | 0 0 0 | 0 0 0 |
26 LAUREN B. CRATER Max:14 S2 06 | 0 0 0 | 0 0 0 |
Number of Sections: 4 Average Students Per Section: 0.00
SPE208 LANG ARTS 4 SM 1 201 0| 0 0 0 | 0 0 0 |
21 LAUREN B. CRATER Max:30 S2 01 | 0 0 0 | 0 0 0 |
24 LAUREN B. CRATER Max:30 S2 04 | 0 0 0 | 0 0 0 |
25 LAUREN B. CRATER Max:14 S2 05 | 0 0 0 | 0 0 0 |
26 LAUREN B. CRATER Max:14 S2 06 | 0 0 0 | 0 0 0 |
Number of Sections: 4 Average Students Per Section: 0.00
SPE209 LANG ARTS 5 SM 1 171 0| 0 0 0 | 0 0 0 |
21 LAUREN B. CRATER Max:30 S2 01 | 0 0 0 | 0 0 0 |
24 LAUREN B. CRATER Max:30 S2 04 | 0 0 0 | 0 0 0 |
25 LAUREN B. CRATER Max:14 S2 05 | 0 0 0 | 0 0 0 |
26 LAUREN B. CRATER Max:14 S2 06 | 0 0 0 | 0 0 0 |
Number of Sections: 4 Average Students Per Section: 0.00
SPE210 LANG ARTS 5 SM 1 171 0| 0 0 0 | 0 0 0 |
21 LAUREN B. CRATER Max:30 S2 01 | 0 0 0 | 0 0 0 |
24 LAUREN B. CRATER Max:30 S2 04 | 0 0 0 | 0 0 0 |
25 LAUREN B. CRATER Max:14 S2 05 | 0 0 0 | 0 0 0 |
26 LAUREN B. CRATER Max:14 S2 06 | 0 0 0 | 0 0 0 |
Number of Sections: 4 Average Students Per Section: 0.00
SPE301 MATH 1 SM 1 175 0| 0 0 0 | 0 0 0 |
22 LAUREN B. CRATER Max:30 S2 02 | 0 0 0 | 0 0 0 |
24 LAUREN B. CRATER Max:30 S2 04 | 0 0 0 | 0 0 0 |
Number of Sections: 2 Average Students Per Section: 0.00
SPE302 MATH 1 SM 1 145 0| 0 0 0 | 0 0 0 |
22 LAUREN B. CRATER Max:30 S2 02 | 0 0 0 | 0 0 0 |
24 LAUREN B. CRATER Max:30 S2 04 | 0 0 0 | 0 0 0 |
Number of Sections: 2 Average Students Per Section: 0.00
SPE303 MATH 2 SM 1 145 17| 17 9 8 | 15 8 7 |
22 LAUREN B. CRATER Max:30 S2 02 | 12 6 6 | 11 6 5 |
24 LAUREN B. CRATER Max:30 S2 04 | 5 3 2 | 4 2 2 |
Number of Sections: 2 Average Students Per Section: 8.50
SPE304 MATH 2 SM 1 115 0| 0 0 0 | 0 0 0 |
22 LAUREN B. CRATER Max:30 S2 02 | 0 0 0 | 0 0 0 |
24 LAUREN B. CRATER Max:30 S2 04 | 0 0 0 | 0 0 0 |
Number of Sections: 2 Average Students Per Section: 0.00
SPE305 MATH 3 SM 1 145 1| 1 0 1 | 1 0 1 |

1sonyr01.p 38-2 WEST AUBURN SENIOR HIGH SCHOOL 03/02/15 Page:15
05.14.10.00.00 Course/Class Count Report 504 3:12 PM
EST NBR NBR ----TOTALS---- --Special Ed--
COURSE DESCRIPTION LGTH SEC AVL REQ TOT FEM MAL TOT FEM MAL
22 LAUREN B. CRATER Max:30 S2 02 | 1 0 1 | 1 0 1 |
24 LAUREN B. CRATER Max:30 S2 04 | 0 0 0 | 0 0 0 |
Number of Sections: 2 Average Students Per Section: 0.50
SPE306 MATH 3 SM 1 115 0| 0 0 0 | 0 0 0 |
22 LAUREN B. CRATER Max:30 S2 02 | 0 0 0 | 0 0 0 |
24 LAUREN B. CRATER Max:30 S2 04 | 0 0 0 | 0 0 0 |
Number of Sections: 2 Average Students Per Section: 0.00
SPE307 MATH 4 SM 1 145 0| 0 0 0 | 0 0 0 |
22 LAUREN B. CRATER Max:30 S2 02 | 0 0 0 | 0 0 0 |
24 LAUREN B. CRATER Max:30 S2 04 | 0 0 0 | 0 0 0 |
Number of Sections: 2 Average Students Per Section: 0.00
SPE308 MATH 4 SM 1 115 0| 0 0 0 | 0 0 0 |
22 LAUREN B. CRATER Max:30 S2 02 | 0 0 0 | 0 0 0 |
24 LAUREN B. CRATER Max:30 S2 04 | 0 0 0 | 0 0 0 |
Number of Sections: 2 Average Students Per Section: 0.00
SPE400 SOCIAL SKILLS 1 SM 1 30 0| 0 0 0 | 0 0 0 |
62 LAUREN B. CRATER Max:15 S2 06 | 0 0 0 | 0 0 0 |
Number of Sections: 1 Average Students Per Section: 0.00
SPE401 SOCIAL SKILLS 2 SM 1 30 0| 0 0 0 | 0 0 0 |
62 LAUREN B. CRATER Max:15 S2 06 | 0 0 0 | 0 0 0 |
Number of Sections: 1 Average Students Per Section: 0.00
SPE601 COMM LAB SM 1 30 2| 2 1 1 | 2 1 1 |
11 KAREN SHU-MINUTOLI Max:30 S2 01 | 2 1 1 | 2 1 1 |
Number of Sections: 1 Average Students Per Section: 2.00

1sonyr01.p 38-2 WEST AUBURN SENIOR HIGH SCHOOL 03/02/15 Page:16
05.14.10.00.00 Course/Class Count Report Totals 3:12 PM
TITLE FOR TOTAL
TOTALS GROUP TOTAL FEMALE MALE
GRAND TOTALS 1447 703 744
Special Ed 188 87 101
************************ End of report ************************

West Auburn High SchoolEnrollment Count-- March 2, 2015
Gra
de
Zero
ed o
ut/ru
nnin
g st
art/r
elea
se s
ched
ule/
early
gra
d/ho
me-
hosp
ital
Virt
ual
Lear
ning
Cen
ter
Sped
Oth
er
Sped
in V
CEC
Sped
in L
earn
ing
Cen
ter
Sped
(the
se st
uden
ts a
re in
day
pro
gram
)
VC
EC
Day
Pro
gram
Gra
duat
ion
Alli
ance
Sub
Tota
l
Gra
nd T
otal
9 0 3 2 0 0 0 2 1 23 2 33 3310 0 4 11 1 0 0 1 1 13 7 38 3811 0 5 12 1 0 0 8 4 35 7 72 7212 5 19 29 3 1 2 12 4 44 13 132 127
5 31 54 5 1 2 23 10 115 29 275 270
WAHS counting students shared with another schoolShared with ARHS - Pele, Pele (1st period); Adams, Royal (5th & 6th)
Shared with AMHS - Serda-Monje, Cristian (5th & 6th - period); Alex Davis (5th & 6th period); Kurpius, Austin (6th)
Shared with AHS - Logan, Jodie (5th & 6th); Gillespie, Donovan (5th & 6th); Dempster, Reiley (1st); Geyer, Rachel (5th); Davee, Kyla (1st & 2nd)
Running Start--Full TimeKatherine Saelee
GA - Melissa Alvarez shared with AHS (1st & 2nd) (.60 FTE GA)
GA - Nick Hembree shared with SPED school (1.0 FTE GA)
GA - Samuel Huniu shared with ARHS (2 periods) (.60 FTE)
GA - Diana Ramirez shared SPED with WAHS (1st & 2nd) (.60 FTE GA)
Other:.20 Gonzales, Sara
.80 Gonzalez-Aumoeualogo, Jesse
.80 Morey, Ayriana
.60 Mott-Wilson, Tyree
.20 Partridge, Gary
Release Schedules:
Hogan, Rakeem
Jama, Abdullahi
Mounts, Dillon
Valenzuela, Jose
3/2/2015


1 Auburn Senior High School2013‐ 14 Yearly Mobility ReportTRANSFERS OUT CODE FROM AUBURN HIGH TO:
Category Sep Oct Nov Dec Jan Feb Mar Apr May Jun Category Sep Oct Nov Dec Jan Feb Mar Apr May June"T1" Codes: Transfer From: Out of District 12 6 9 14 13 7 Out of District 63 18 22 6 7 9Out of Country (T8) 1 Out of State 25 3 5 3 3 3Insight/On‐line 2 1 4 Out of Country 11 1 1 1Job Corps (K‐12) Muckleshoot Tribal 6 1 1 1Juvenile Detention On‐Line Schools 4 2WA Youth AcademyMuckleshoot Tribal 1 1 2 1 3 2Graduation Alliance 2 1 2 2"D" Codes Dropouts: Returning Student 23 15 4 4 6 3D20‐Non‐attendance 8 8 6 7D1‐D7 and U Codes 2 3 2 5 2 Shared: U2 ‐ No Show 25 2 2GED/HS Completion 1 1 AMHS 14 2Job Corps (non K‐12) ARHS 11 0 1WAHS ‐ Unconfirmed 1 WAHS 0 1 4"TR" Codes In‐District: In District TransferWest Auburn 2 4 3 5 3 West Auburn 3 1Auburn Mountainview 2 3 4 Auburn Mt. View 4 3 3Auburn Riverside 2 1 2 5 Auburn Riverside 1 3 5 2IEP Online registration 1W/D as Shared Student 11 14 8 4 Tap Program"T2" and "T3" Codes: Others:Private School 1 Private School 13 1Home School 1 1 1 2 Home School 3 1 1"G" Codes: 1Late GradsNet Decrease 59 35 28 0 32 59 29 Net Increase 173 46 41 0 14 31 23Totals:Transfer's In = 173 46 41 14 31 23Transfer's Out = ‐ ‐59 ‐35 ‐28 ‐32 ‐59 ‐29Net Enrollment = 114 11 13 ‐18 ‐28 ‐6

AUBURN MOUNTAINVIEW HIGH SCHOOL2014‐2015 MOBILITY REPORT
TRANSFERS OUT CODE OF AMHS TO: TRANSFERS IN CODE TO AMHS FROM:Category Sep Oct Nov Dec Jan Feb Mar Apr May Jun Category Sep Oct Nov Dec Jan Feb Mar Apr May June"T1" Codes: Transfer From: Out of District 5 11 4 8 12 10 Out of District 10 4 3 1 4 2Out of Country (T8) 1 Out of District‐Kent Dist 7 1 1 5 3Insight/On‐line 1 Out of State 1 1 3 1 3Job Corps (K‐12) Out of Country 1 1 2 1Juvenile Detention Muckleshoot TribalMuckleshoot Tribal 1 On‐Line Schools 1"D" Codes Dropouts: Returning Student 8 1 2 4 1D20‐Non‐attendance 2 4 3 3 3D1‐D7 and U Codes 2 2 1 1 2 Shared: U2 ‐ No Show 1 AHS 4 2GED/HS Completion ARHS 2 1Job Corps (non K‐12) WAHS 1 1WAHS ‐ Unconfirmed "TR" Codes In‐District: In District TransferWest Auburn 1 3 3 1 2 3 West Auburn 1Auburn High School 2 6 3 Auburn High School 4 3Auburn Riverside 1 1 Auburn RiversideW/D as Shared Student 4 2 5 Tap Program"T2" and "T3" Codes: Others:Private School Private SchoolHome School 3 5 1 Home School 1 1"T4" Code: foreignxchng 1"G" Codes: IEP Program Placement 1 1Late GradsIEP Program Placement 1 1Net Decrease 18 26 13 13 25 31 0 0 0 0 Net Increase 40 10 8 4 26 7 0 0 0 0
Totals:Transfer's In = Transfer's Out = ‐Net Enrollment = 0 0 0 0 0 0 0 0 0 0

AUBURN RIVERSIDE HIGH SCHOOL2014‐15 MOBILITY REPORT
TRANSFERS‐OUT: TRANSFERS‐IN:Category Sept Oct Nov Dec Jan Feb Mar Apr May Jun Category Sept Oct Nov Dec Jan Feb Mar Apr May Jun"T1" Codes: Transfer From: Out of District 10 10 4 5 19 5 Out of District 11 6 2 6 12 2Out of Country (T8) 1 1 Out of State 2 4 2Insight/On‐line 1 2 5 Out of Country 1 3Job Corps (K‐12) Muckleshoot TribalJuvenile Detention On‐Line Schools Muckleshoot Tribal"D" Codes Dropouts: Returning Student 3 2 1 1 1D20‐Non‐attendance 5 3 1 1 2D1‐D7 and U Codes 4 1 1 1 Shared: GED/HS Completion 1 1 1 AHS 2 1 2 1Job Corps (non K‐12) AMHS 1WAHS ‐ Unconfirmed WAHS"TR" Codes In‐District: In District Transfer:AHS 5 3 3 2 AHS 4AMHS AMHSWAHS 1 1 2 2 4 1 WAHSW/D as Shared Student"T2" and "T3" Codes: Others:Private School Private SchoolHome School 4 1 2 1 Home School"G" Codes:Late Grads 1 1Net Decrease 22 20 19 10 29 19 Net Increase 19 9 5 9 21 7
TOTALS:Transfer's In = 19 9 5 9 21 7Transfer's Out = 22 20 19 10 29 19Net Enrollment = ‐3 ‐11 ‐14 ‐1 ‐8 ‐12

WEST AUBURN HIGH SCHOOL2014‐2015 MOBILITY REPORT
TRANSFERS OUT CODE OF WEST AUBURN HIGH TO: TRANSFERS IN CODE TO WEST AUBURN HIGH FROM:Category Sep Oct Nov Dec Jan Feb Mar Apr May Jun Category Sep Oct Nov Dec Jan Feb Mar Apr May June"T1" Codes: Transfer From: Out of District 1 3 1 1 1 6 2 Out of District 16 24 4 7 2 9 5Out of Country (T8) Out of State 1 2Insight/On‐line Out of CountryJob Corps (K‐12) Muckleshoot TribalJuvenile Detention On‐Line Schools Muckleshoot Tribal"D" Codes Dropouts: Returning Student 21 42 7 6 7 6 3D20‐Non‐attendance 1 11 16 13 8 5D1‐D7 and U Codes 3 52 18 14 2 20 11 Shared: U2 ‐ No Show 38 AHSGED/HS Completion AMHSJob Corps (non K‐12) ARHS"TR" Codes In‐District: In District TransferOther 1 2 Auburn High 8 14 2 8 7 7Auburn High School 1 1 1 Auburn Mt. View 2 6 4 2 2 5Auburn Mountainview 1 Auburn Riverside 4 10 2 4 1 4 4Auburn RiversideW/D as Shared Student Auburn Will Graduate 7 15 9 7 12 6 7"T2" and "T3" Codes: Others:Private School Private SchoolHome School Home School"G" Codes: G1 Enumclaw High SchoolLate Grads G3 Kent 1GG (AWG Grad) 1 1 1 Cascade Middle Sc 4 4Net Decrease 44 60 30 32 16 37 18 0 0 Olympic Middle Sc 6 6
Mt Baker Middle Sc 7 7Rainer Middle School 1 1
Totals: Net Increase 76 130 30 34 22 34 32 0 0Transfer's In = 74 130 30 34 22 34 32Transfer's Out = ‐ 44 60 30 32 16 37 18Net Enrollment = 30 70 0 2 6 ‐3 14