agf management limited management’s discussion and analysis of financial · 2019-09-30 · agf...
TRANSCRIPT
AGF Management Limited MANAGEMENT’S DISCUSSION AND ANALYSIS OF FINANCIAL CONDITION AND RESULTS OF OPERATIONS For the three and nine months ended August 31, 2014 and 2013

AGF Management Limited – 2 – Third Quarter Report 2014
AGF MANAGEMENT LIMITED Third Quarter Report to Shareholders for the three and nine months ended August 31, 2014
AGF MANAGEMENT LIMITED REPORTS THIRD QUARTER FINANCIAL RESULTS Earnings per share rise 54.5% as assets under management increase
Toronto | September 24, 2014
AGF Management Limited (AGF or the Company) today announced financial results for the third quarter ended August 31, 2014, reporting diluted earnings per share (EPS) from continuing operations of $0.17, compared to $0.11 for the three months ended August 31, 2013.
“We executed on our key priorities throughout the third quarter and saw continued improvement in our investment management performance and progress with our alternative asset management platform,” said Blake C. Goldring, Chairman and Chief Executive Officer, AGF. “Our capital position remains strong and we are committed to investing in the growth of our business.”
Kevin McCreadie joined AGF as President and Chief Investment Officer (CIO) during the quarter. Mr. McCreadie will provide direction and leadership to AGF’s investment management teams and lead the firm’s global institutional business. He brings more than 30 years of investment management experience to AGF. Prior to joining AGF, Mr. McCreadie was President and CIO of PNC Capital Advisors, LLC, a division of PNC Financial Group, one of the largest U.S. diversified financial services organizations.
During the quarter, AGF’s alternative asset management platform completed a successful final close of a midstream energy infrastructure fund with commitments of $210.0 million, of which AGF has committed $50.0 million.
Total assets under management (AUM) were $37.0 billion as at August 31, 2014, compared to $36.4 billion as at August 31, 2013. Total retail fund AUM increased 5.2% to $19.9 billion as at August 31, 2014, compared to $18.9 billion in the third quarter of 2013. The trend of lower retail outflows continued into the third quarter of 2014 with 19 consecutive months of improvements. Institutional and sub-advisory AUM were $12.4 billion as at August 31, 2014, compared to $13.8 billion as at August 31, 2013. High-net-worth AUM increased to $4.4 billion, compared to $3.7 billion for the corresponding period in 2013. Alternative asset management platform AUM was $0.2 billion as at August 31, 2014.
During the third quarter of 2014, revenue from continuing operations was $116.9 million, compared to $117.7 million for the three months ended August 31, 2013. Earnings before interest, taxes, depreciation and amortization (EBITDA) from continuing operations was $38.5 million, compared to $38.6 million in the third quarter of 2013. For the three months ended August 31, 2014, net income from continuing operations was $14.8 million compared to $10.1 million for the three months ended August 31, 2013.
For the three months ended August 31, 2014, AGF declared a 27 cent per share dividend on Class A Voting common shares and Class B Non-Voting shares, payable October 17, 2014 to shareholders on record as at October 9, 2014.

AGF Management Limited – 3 – Third Quarter Report 2014
CAUTION REGARDING FORWARD-LOOKING STATEMENTS This Management’s Discussion and Analysis (MD&A) includes forward-looking statements about the Company, including its business operations, strategy and expected financial performance and condition. Forward-looking statements include statements that are predictive in nature, depend upon or refer to future events or conditions, or include words such as ‘expects,’ ‘anticipates,’ ‘intends,’ ‘plans,’ ‘believes’ or negative versions thereof and similar expressions, or future or conditional verbs such as ‘may,’ ‘will,’ ‘should,’ ‘would’ and ‘could.’ In addition, any statement that may be made concerning future financial performance (including revenues, earnings or growth rates), ongoing business strategies or prospects, and possible future action on our part, is also a forward-looking statement. Forward-looking statements are based on certain factors and assumptions, including expected growth, results of operations, business prospects, business performance and opportunities. While we consider these factors and assumptions to be reasonable based on information currently available, they may prove to be incorrect. Forward-looking statements are based on current expectations and projections about future events and are inherently subject to, among other things, risks, uncertainties and assumptions about our operations, economic factors and the financial services industry generally. They are not guarantees of future performance, and actual events and results could differ materially from those expressed or implied by forward-looking statements made by us due to, but not limited to, important risk factors such as level of assets under our management, volume of sales and redemptions of our investment products, performance of our investment funds and of our investment managers and advisors, pipeline, competitive fee levels for investment management products and administration, and competitive dealer compensation levels and cost efficiency in our investment management operations, as well as interest and foreign-exchange rates, taxation, changes in government regulations, unexpected judicial or regulatory proceedings, and our ability to complete strategic transactions and integrate acquisitions. We caution that the foregoing list is not exhaustive. The reader is cautioned to consider these and other factors carefully and not place undue reliance on forward-looking statements. Other than specifically required by applicable laws, we are under no obligation (and expressly disclaim any such obligation) to update or alter the forward-looking statements, whether as a result of new information, future events or otherwise. For a more complete discussion of the risk factors that may impact actual results, please refer to the ‘Risk Factors and Management of Risk’ section of the 2013 Annual MD&A.

AGF Management Limited – 4 – Third Quarter Report 2014
Dear fellow shareholders,
During the three months ended August 31, 2014, U.S. equity markets reached record highs despite the U.S. Federal Reserve Board reducing its quantitative easing program in June to a monthly pace of US$35 billion. Labour markets continued to improve while manufacturing activity reached its highest level in over three years.
European equities underperformed as weak industrial production data and increased geopolitical tensions, particularly in the Ukraine, weighed on regional equity markets.
Emerging markets outperformed developed markets; however, performance varied across region and country. Latin America strongly outperformed and Asian equities posted solid gains. The Europe, Middle East, and Africa (EMEA) region posted a modest decline. Lower bond yields continued to benefit global government bond returns, particularly longer duration securities, during the quarter.
At AGF, we remain focused on our three key priorities: investment performance, innovation and organic growth. During the quarter we made progress on each of these priorities.
On June 17, 2014, Kevin McCreadie joined AGF as President and Chief Investment Officer (CIO). Kevin brings over 30 years of investment management experience. He joins us from PNC Financial Services Group, one of the largest U.S. diversified financial services organizations, where he was President and CIO of PNC Capital Advisors, LLC, leading the firm’s institutional effort and overseeing over $58 billion in AUM. Kevin will provide direction and leadership to AGF’s investment management team and lead the firm’s global institutional business. Under Kevin’s guidance, the investment management team will continue to focus on delivering superior investment performance. This will be achieved by managing talent, investment process and risk. At the end of the third quarter, 46% of assets under management (AUM) were above median on a one-year basis, up from 20% one year ago.
Innovation continues to be a priority for AGF. Over the last three years we have launched several new innovative fund products that meet investors’ evolving needs including AGF Floating Rate Income Fund, AGF Focus Funds and AGF U.S. AlphaSector Class. Demand for these products remains strong, as assets topped $1.0 billion as at August 31, 2014. Re-engaging with advisors with new and innovative products has helped the overall performance of our business. Retail AUM levels were up 5.2% year over year and redemption levels continued to decline with 19 consecutive months of improvements.
During the year, we established InstarAGF Asset Management Inc. (InstarAGF) to develop an alternative asset management platform offering new products to support our retail, institutional and high-net-worth channels. We anticipate strong growth in this area as investors continue to turn to real assets as they seek yield and returns uncorrelated with traditional asset classes. During the quarter, we completed a successful final close of a midstream energy infrastructure fund with commitments of $210.0 million, of which AGF has committed $50.0 million. In addition, InstarAGF is targeting the launch of its Essential Infrastructure Fund by the end of 2014. The Fund will invest in utilities, civil, social and power infrastructure assets, including renewable energy.
Total AUM increased to $37.0 billion, compared to $36.4 billion at August 31, 2013, while retail net redemptions improved 3.7% over the third quarter of 2013.
Financially, AGF’s earnings before interest, taxes, depreciation and amortization (EBITDA) from continuing operations were $38.5 million, compared to $38.6 million in the third quarter of 2013. EBITDA margin was 32.9%, compared to 32.8% in 2013. Diluted earnings per share (EPS) from continuing operations for the three months ended August 31, 2014 increased to $0.17, compared to $0.11 in the third quarter of 2013. Our balance sheet remains strong with $278.1 million in cash and investments as at August 31, 2014 and a modest debt-to-equity ratio of 32.8%.
In closing, I would like to express my sincere thanks to all of our stakeholders for their continued support and confidence. We remain focused on our strategic priorities and the continued expansion of our business throughout 2014 and beyond.
Sincerely,
Blake C. Goldring, M.S.M., CFA Chairman and Chief Executive Officer September 24, 2014

AGF Management Limited – 5 – Third Quarter Report 2014
Management’s Discussion and Analysis of Financial Condition and Results of Operations This Management’s Discussion and Analysis (MD&A) is as of September 23, 2014, and presents an analysis of the financial condition of AGF and its subsidiaries for the three- and nine-month period ended August 31, 2014, compared to the three- and nine-month period ended August 31, 2013. The MD&A should be read in conjunction with our unaudited Condensed Consolidated Interim Financial Statements for the three and nine months ended August 31, 2014 and our 2013 Annual Report. The financial statements for the three and nine months ended August 31, 2014, including required comparative information, have been prepared in accordance with International Financial Reporting Standards (IFRS) as issued by the International Accounting Standards Board (IASB) applicable to the preparation of interim financial statements, including International Accounting Standard 34 (IAS 34), Interim Financial Reporting, unless otherwise noted.
We also utilize non-IFRS financial measures to assess our overall performance. Details of non-IFRS measures used are outlined in the ‘Key Performance Indicators, Additional IFRS and Non-IFRS Measures’ section, which provides calculations of the non-IFRS measures.
All dollar amounts are in Canadian dollars unless otherwise indicated. Throughout this discussion, percentage changes are calculated based on numbers rounded to the decimals that appear in this MD&A. Results, except per share information, are presented in millions of dollars. Certain totals, subtotals and percentages may not reconcile due to rounding.
There have been no material changes to the information discussed in the following sections of the 2013 Annual MD&A: ‘Contractual Obligations,’ ‘Intercompany and Related Party Transactions’ and ‘Government Regulations.’
Our Business AGF Management Limited, with $37.0 billion in assets under management (AUM) as at August 31, 2014, is one of the largest independent Canadian-based investment management firms, with operations and investments in Canada, the United States, the United Kingdom, Ireland and Asia.
The origin of our Company dates back to 1957 with the introduction of the American Growth Fund, the first mutual fund available to Canadians seeking to invest in the United States. As of August 31, 2014, our products and services include a diverse lineup of investment solutions for retail, institutional and high-net-worth clients. Our multi-disciplined investment management teams have expertise across the balanced, fixed income, equity and specialty asset categories and are located in Toronto, Dublin and Singapore.
Our retail business delivers a wide range of products across a number of investment strategies including AGF mutual funds, the AGF Elements portfolios and the Harmony Private Investment Program. Our products are delivered through multiple channels, including advisors, financial planners, banks, life insurance companies and brokers. We have sales organizations located across Canada serving regional advisors and their clients, while our strategic accounts team serves our corporate distribution partners.
Our institutional business offers a variety of investment mandates through pooled funds and segregated accounts. Our global institutional business provides investment management services for a variety of clients including institutions, pension funds, foundations, sovereign wealth funds and endowments. We offer a diverse range of investment strategies and have sales and client service offices in Toronto, London (Ontario), Boston, Dublin, London (England), Hong Kong and Beijing.
Our high-net-worth business delivers investment management and counselling services in local markets. It includes the operations of Cypress Capital Management Limited in Vancouver; Highstreet Asset Management (Highstreet) in London, Ontario; and Doherty & Associates in Ottawa and Montreal.
We hold a 50.1% interest in InstarAGF Asset Management Inc. (InstarAGF), a joint venture with Instar Group Inc. (Instar), to develop an alternative asset management platform offering new alternative investment products to support our retail, institutional and high-net-worth channels. InstarAGF holds a 37.0% interest in Stream Asset Financial Management LP, manager of a midstream oil and gas infrastructure fund. In addition, InstarAGF plans to launch its Essential Infrastructure Fund by the end of 2014. The fund will invest in utilities, civil, social and power infrastructure assets, including renewable energy.
We hold a 31.6% interest in Smith & Williamson Holdings Limited (S&WHL), a leading independent private client investment management, financial advisory and accounting group based in the UK. S&WHL is one of the top 10 largest firms of accountants in the UK and its investment management business has over £15.5 billion of funds under management and advice as at August 31, 2014.
For the purposes of this discussion, the operations of AGF and our subsidiary companies are referred to as ‘we,’ ‘us,’ ‘our,’ ‘the firm,’ or ‘the Company.’

Management’s Discussion and Analysis of Financial Condition and Results of Operations
AGF Management Limited – 6 – Third Quarter Report 2014
Key Performance Drivers AUM levels are critical to our business. The primary sources of revenue for AGF are management and advisory fees. These fees are calculated based on a specific percentage of the average AUM. The amount of management and advisory fees depends on the level and composition of AUM, which in turn is dependent upon investment performance and net sales. These fees are generated from our mutual fund, institutional and sub-advisory accounts and high-net-worth relationships. AUM will fluctuate in value as a result of sales and redemptions, investment performance and acquisitions.
Investment performance, which represents market appreciation (depreciation) of fund portfolios and is shown net of management fees received, is a key driver of the level of AUM and is central to the value proposition that we offer advisors and unitholders. Growth in AUM resulting from investment performance increases the wealth of our unitholders and, in turn, increases revenues for the firm.
Gross sales and redemptions are monitored separately and the sum of these two amounts comprises net sales (redemptions). Net sales (redemptions) also impact AUM levels. Net sales increase AUM and, in turn, increase revenues for the firm. Net redemptions decrease AUM and, in turn, reduce revenues for the firm. The reduction in revenue may be offset by an increase in deferred sales charge (DSC) revenue.
Acquisitions will also affect the level of AGF’s AUM. AGF may consider strategic acquisitions that could supplement existing investment capabilities and fund new product growth.
AGF uses several key performance indicators (KPIs) to measure the success of our business strategies. Refer to the ‘Key Performance Indicators, Additional IFRS and Non-IFRS Measures’ section of this MD&A.
Our Strategy AGF is a firm focused exclusively on investment management. The Company believes that superior investment performance and product innovation are key to its success. It also believes strongly in diversification, both in terms of investment styles and product solutions offered to clients, and in the client segments in which it operates. Finally, AGF is a global firm, with investment research capabilities and institutional sales offices in Canada and abroad.
Measuring long-term shareholder growth, we look to the following KPIs:
• AUM growth • Revenue growth driven by new sales, investment performance and client retention • Earnings before interest, taxes, depreciation, amortization and non-controlling interest (EBITDA) growth • Pre-tax margins
Year-over-year improvement in these measures is expected to result in improved cash flows as well as improved return on equity. Our objective is the return of a fair share of the annual cash flow to shareholders in the form of dividends and through share buybacks, with the remaining cash flow being invested in a manner intended to support future growth.
Our strategy also recognizes that our business will experience cycles related to the global stock markets, credit availability, employment levels and other economic factors. We believe that a successful strategy is founded on the ability of our operations to effectively operate through economic downturns and upturns by controlling cost and maintaining an effective operating infrastructure.
Update on Our Priorities and Progress As outlined in our 2013 Annual Report, our key priorities are:
• Investment performance • Offering our retail advisors and clients innovative product solutions • International expansion and organic growth
Our focus remains on these priorities and we continue to see progress.

Management’s Discussion and Analysis of Financial Condition and Results of Operations
AGF Management Limited – 7 – Third Quarter Report 2014
Investment Performance We are focused on improving our investment performance. We are doing this through supporting our most promising investment platforms while ensuring we have the talent to achieve our stated goal. To date we have achieved the following:
• On May 13, 2014, we announced the appointment of Kevin McCreadie as President and Chief Investment Officer (CIO), an experienced investment management executive with over 30 years of experience.
• We have substantially completed the build-out of our North American team, with the strengthening of our research team and the hiring of respected Canadian growth manager Peter Imhof.
• In 2013, we refined our investment process and improved the research capabilities at Highstreet and Dublin, resulting in improved performance in the related mandates.
• We are in the process of implementing a new risk management tool to enhance our existing capabilities. • For the one-year period ended August 31, 2014, 46% of AUM is above median, compared to 20% a year ago.
Offering Our Retail Advisors and Clients Innovative Product Solutions Our strategy is to provide our advisors and clients a product platform that offers innovative solutions around specific needs, resulting in organic AUM growth. During the past two years we have had significant success and we expect to continue to deliver in this area:
• During the second quarter of 2014, we merged certain funds to simplify and streamline our product offering. Also, we improved pricing flexibility by reducing fees on select funds sold through our fee-based series.
• During the past 24 months, we have addressed investor needs related to rising rates and market volatility with the launch of several new funds: • AGF U.S. AlphaSector Class has generated approximately $200.0 million in net inflows since August 2013, • AGF Floating Rate Income Fund has had net inflows of over $370.0 million since its launch, and • AGF Focus Funds have brought in over $200.0 million in net inflows since their launch.
• The trend of reduced redemption rates and improving net outflows continued into the third quarter of 2014 with 19 consecutive months of improvements over the prior year.
International Expansion and Organic Growth Our strategy is to leverage our world class global equity capabilities and distribute our products through structures and platforms that work within their local markets. We have begun to lay the foundation to achieve our goal and are encouraged by the results to date:
• During the first quarter of 2014, we launched our Undertakings for Collective Investment in Transferable Securities (UCITS) platform. The platform, with AUM of $650.0 million, offers AGF’s emerging markets and global strategy mandates and can be marketed throughout the European Union and Asia.
• We had additional AUM flows of $500.0 million into these mandates through a segregated account from a UK-based client.
• During the nine months ended August 31, 2014, we established InstarAGF, a joint venture with Instar, to develop an alternative asset management platform offering new products to support our retail, institutional and high-net-worth channels. AGF has agreed to commit a total of $150.0 million to be invested in the platform over the next two to three years. As part of this, during the quarter, InstarAGF achieved the final close of Stream Asset Financial LP (Stream), a midstream oil and gas infrastructure fund, with equity commitments of approximately $210.0 million, including AGF’s commitment of $50.0 million. In addition, InstarAGF is targeting the launch of its Essential Infrastructure Fund by the end of 2014. The fund will invest in utilities, civil, social and power infrastructure assets, including renewable energy.
Summary of Key Financial and Operational Results for the Third Quarter of 2014: • Total AUM was $37.0 billion at August 31, 2014, as compared to $36.4 billion at August 31, 2013. • Retail AUM increased 5.2% to $19.9 billion, as compared to $18.9 billion at August 31, 2013. • Retail fund net outflows improved 3.7% to $0.4 billion for the three months ended August 31, 2014, compared to net
redemptions of $0.5 billion for the three months ended August 31, 2013. • Institutional AUM was $12.4 billion, compared to $13.8 billion at August 31, 2013. • The final close of Stream garnered fee-earning committed capital of $210.0 million at August 31, 2014. AGF's portion
of this AUM is $50.0 million, of which $16.6 million was funded as at August 31, 2014. InstarAGF holds a 37.0% interest in the manager of Stream.

Management’s Discussion and Analysis of Financial Condition and Results of Operations
AGF Management Limited – 8 – Third Quarter Report 2014
• High-net-worth AUM increased 21.6% to $4.4 billion, compared to $3.7 billion at August 31, 2013. • We delivered value directly to our shareholders through dividend payments. During the third quarter of 2014, we paid
dividends of $0.27 per share (2013 – $0.27 per share). Dividends paid, including dividends reinvested, on Class A Voting common shares and Class B Non-Voting shares were $23.2 million in the third quarter of 2014, compared to $23.5 million in the third quarter of 2013.
• Revenue from continuing operations was $116.9 million, compared to $117.7 million in the same period of 2013, reflecting lower institutional AUM levels.
• EBITDA from continuing operations was $38.5 million in the third quarter of 2014, compared to $38.6 million in the same period of 2013. EBITDA margin was 32.9% compared to 32.8% in the third quarter of 2013.
• Diluted earnings per share (EPS) from continuing operations for the three months ended August 31, 2014 increased to $0.17, compared to $0.11 per share in 2013.
• Our balance sheet remains strong with $278.1 million in cash and short-term investments and a modest long-term debt-to-equity level of 32.8%.
• For the one-year period ended August 31, 2014, 46% of ranked AUM performed above median, compared to 20% at August 31, 2013.
Assets Under Management The following table illustrates the composition of the changes in total AUM during the three and nine months ended August 31, 2014 and 2013:
(in millions of Canadian dollars) % change
Retail fund AUM (including retail pooled funds), beginning of period $ 19,723 $ 19,476 1.3%
Gross sales 369 493 (25.2%)Redemptions (810) (951) (14.8%)Net redemptions (441) (458) (3.7%)
Market appreciation (depreciation) of fund portfolios 623 (100) n/m
Retail fund AUM (including retail pooled funds), end of period $ 19,905 $ 18,918 5.2%
Average daily retail fund AUM for the period $ 19,842 $ 19,042 4.2%
Inst itut ional and sub-advisory accounts AUM, beginning of period $ 11,950 $ 14,402 (17.0%)
Net change in institut ional and sub-advisory accounts , including market performance 460 (573) n/m
Inst itut ional and sub-advisory accounts AUM, end of period $ 12,410 $ 13,829 (10.3%)
High-net-worth AUM $ 4,448 $ 3,658 21.6%
AUM, end of period $ 36,763 $ 36,405 1.0%
Alternative asset management platform AUM1$ 210 $ – n/m
Total AUM, including alternative asset management platform, end of period $ 36,973 $ 36,405 1.6%
2014 2013Three months ended August 31,
1 Represents fee-earning committed capital from AGF and external investors held through joint ventures. AGF's portion of this commitment is $50.0 million, of
which $16.6 million has been funded as at August 31, 2014. InstarAGF holds a 37.0% interest in the manager of the fund.

Management’s Discussion and Analysis of Financial Condition and Results of Operations
AGF Management Limited – 9 – Third Quarter Report 2014
(in millions of Canadian dollars) 2014 2013 % change
Retail fund AUM (including retail pooled funds), beginning of period $ 19,591 $ 20,096 (2.5%)
Gross sales 1,394 1,550 (10.1%)Redemptions (2,944) (3,340) (11.9%)Net redemptions (1,550) (1,790) (13.4%)
Market appreciation of fund portfolios 1,864 612 204.6%
Retail fund AUM (including retail pooled funds), end of period $ 19,905 $ 18,918 5.2%
Average daily retail fund AUM for the period $ 19,789 $ 19,623 0.8%
Inst itut ional and sub-advisory accounts AUM, beginning of period $ 10,877 $ 15,677 (30.6%)
Net change in institut ional and sub-advisory accounts , including market performance 1,533 (1,848) n/m
Inst itut ional and sub-advisory accounts AUM, end of period $ 12,410 $ 13,829 (10.3%)
High-net-worth AUM $ 4,448 $ 3,658 21.6%
AUM, end of period $ 36,763 $ 36,405 1.0%
Alternative asset management platform AUM1$ 210 $ – n/m
Total AUM, including alternative asset management platform, end of period $ 36,973 $ 36,405 1.6%
Nine months ended August 31,
1 Represents fee-earning committed capital from AGF and external investors held through joint ventures. AGF's portion of this commitment is $50.0 million, of
which $16.6 million has been funded as at August 31, 2014. InstarAGF holds a 37.0% interest in the manager of the fund.
Retail fund AUM increased by 5.2% to $19.9 billion, compared to $18.9 billion as at August 31, 2013. Retail fund net redemptions, including retail pooled funds, improved 3.7% to $0.4 billion from $0.5 billion for the three months ended August 31, 2014, compared to the same period in the prior year. The average daily retail fund AUM for the three months ended August 31, 2014 increased to $19.8 billion, compared to $19.0 billion in the corresponding period in 2013. Our institutional and sub-advisory accounts AUM decreased to $12.4 billion as at August 31, 2014, compared to $13.8 billion as at August 31, 2013. The decline in institutional AUM was primarily due to client redemptions. Alternative investment AUM was $0.2 billion as at August 31, 2014. Our high-net-worth AUM increased 21.6% to $4.4 billion at August 31, 2014, compared to $3.7 billion at August 31, 2013. Overall, total AUM increased to $37.0 billion, compared to $36.4 billion as at August 31, 2013.
Institutional Pipeline The following represents forward-looking information. We define the institutional pipeline as client commitments to fund or redeem a portion or all of their account. As at August 31, 2014, AGF had a net pipeline of $109.0 million in redemptions. Commitments are not necessarily contractual obligations. Actual amounts funded or redeemed may vary.

Management’s Discussion and Analysis of Financial Condition and Results of Operations
AGF Management Limited – 10 – Third Quarter Report 2014
Consolidated Operating Results The table below summarizes our consolidated operating results for the three and nine months ended August 31, 2014 and 2013:
($ millions, except per share data) 2014 2013 % change 2014 2013 % change
RevenueManagement and advisory fees $ 109.6 $ 108.9 0.6% $ 328.0 $ 337.3 (2.8%) Deferred sales charges 2.7 4.1 (34.1%) 10.0 13.1 (23.7%) Share of profit of associates and joint ventures 2.8 2.0 40.0% 9.5 6.7 41.8% Fair value adjustments and other income 1.8 2.7 (33.3%) 5.3 10.0 (47.0%)
116.9 117.7 (0.7%) 352.8 367.1 (3.9%)
ExpensesSelling, general and adminis trative 43.8 47.2 (7.2%) 130.9 139.2 (6.0%) Trailing commissions 33.0 30.7 7.5% 96.9 93.9 3.2% Investment advisory fees 1.6 1.2 33.3% 4.5 4.0 12.5%
78.4 79.1 (0.9%) 232.3 237.1 (2.0%)
EBITDA1 38.5 38.6 (0.3%) 120.5 130.0 (7.3%) Amortization, derecognition and depreciation 16.1 21.7 (25.8%) 49.3 65.1 (24.3%) Interest expense 2.8 2.8 0.0% 8.8 8.6 2.3%
Income from continuing operat ions before taxes 19.6 14.1 39.0% 62.4 56.3 10.8%
Income taxes 4.8 4.0 20.0% 15.9 41.0 (61.2%) Net income from continuing operations, net of taxes 14.8 10.1 46.5% 46.5 15.3 203.9%
Net income from discontinued operations, net of taxes – – n/m 2.8 – n/m
Net income attributable to equity owners of the Company $ 14.8 $ 10.1 46.5% $ 49.3 $ 15.3 222.2%
Diluted earnings per shareFrom continuing operations $ 0.17 $ 0.11 54.5% $ 0.54 $ 0.17 217.6% From discontinued operat ions – – n/m 0.03 – n/m
Diluted earnings per share $ 0.17 $ 0.11 54.5% $ 0.57 $ 0.17 235.3%
Three months ended August 31, N ine months ended August 31,
1 For the definition of EBITDA, see the ‘Key Performance Indicators, Additional IFRS and Non-IFRS Measures’ section. The items required to reconcile EBITDA to net income from continuing operations, a defined term under IFRS, are detailed above.
Revenue For the three and nine months ended August 31, 2014, revenue decreased by 0.7% and 3.9% over the previous year, with changes in the categories as follows:
Management and Advisory Fees Management and advisory fees are directly related to our AUM levels. During the three months ended August 31, 2014, a 4.2% increase in average daily retail fund AUM offset by a decrease in institutional and sub-advisory accounts AUM contributed to a 0.6% increase in management and advisory fees revenue compared to the three months ended August 31, 2013. During the nine months ended August 31, 2014, a decrease in institutional and sub-advisory accounts AUM at August 31, 2014, slightly offset by a 0.8% increase in average daily retail fund AUM, contributed to a 2.8% decrease in management and advisory fees revenue compared to the same period in 2013.

Management’s Discussion and Analysis of Financial Condition and Results of Operations
AGF Management Limited – 11 – Third Quarter Report 2014
Deferred Sales Charges (DSC) We receive deferred sales charges upon redemption of securities sold on the contingent DSC or low-load commission basis for which we finance the selling commissions paid to the dealer. The DSC ranges from 1.5% to 5.5%, depending on the commission option of the original subscription price of the funds purchased if the funds are redeemed within the first two years, and declines to zero after three or seven years. DSC revenue fluctuates based on the level of redemptions, the age of the assets being redeemed and the proportion of redemptions composed of back-end assets. DSC revenues decreased by 34.1% and 23.7% for the three and nine months ended August 31, 2014 as compared to 2013, reflecting lower redemption levels and redemption of a larger proportion of older, lower-yielding DSC assets.
Share of Profit of Associates and Joint Ventures Share of profit of associates and joint ventures increased to $2.8 million and $9.5 million for the three and nine months ended August 31, 2014, respectively, compared to $2.0 million and $6.7 million during the same period in 2013, reflecting the growth in S&WHL’s business, and includes earnings from our alternative asset management platform through InstarAGF. A breakdown is as follows:
($ millions) 2013
Share of profit of S&WHL $ 2.2 $ 2.0 Share of profit of alternative asset management plat form 0.6 –
$ 2.8 $ 2.0
Three months ended August 31,2014
($ millions) 2013
Share of profit of S&WHL $ 8.6 $ 6.7 Share of profit of alternative asset management plat form 0.9 –
$ 9.5 $ 6.7
2014Nine months ended August 31,
Fair Value Adjustments and Other Income The following table illustrates the fair value adjustments and other income for the three and nine months ended August 31, 2014 and 2013:
($ millions) 2014 2013
Fair value adjustment related to investment in AGF mutual funds $ 0.6 $ 1.4 Fair value adjustment related to acquisition consideration payable – (0.3)Interest income 1.3 1.3 Other – 0.3
$ 1.9 $ 2.7
Three months ended August 31,
($ millions) 2014 2013
Fair value adjustment related to investment in AGF mutual funds $ 0.8 $ 2.1 Fair value adjustment related to acquisition consideration payable 0.4 (1.1)Fair value adjustment related to put agreement with non-controlling shareholders – 0.7 Interest income 3.7 4.6 Other 0.4 3.7
$ 5.3 $ 10.0
Nine months ended August 31,
During the nine months ended August 31, 2013, the Company recognized $3.7 million of one-time other income.

Management’s Discussion and Analysis of Financial Condition and Results of Operations
AGF Management Limited – 12 – Third Quarter Report 2014
Expenses For the three and nine months ended August 31, 2014, expenses decreased 0.9% and 2.0% as compared to 2013. Changes in specific categories are described in the discussion that follows: Selling, General and Administrative Expenses Selling, general and administrative (SG&A) expenses decreased by $3.4 million and $8.3 million, for the three and nine months ended August 31, 2014, compared to the same period in 2013. A breakdown of the decrease is as follows:
(in millions of Canadian dollars)
Increase (decrease) in salaries and benef its expenses $ (0.1) $ 2.8 Decrease in stock-based compensation expenses (1.8) (6.7)Increase (decrease) in fund absorpt ion expenses and other fund costs 0.6 (1.2)Decrease in other expenses (2.1) (3.2)
$ (3.4) $ (8.3)
Nine months ended August 31, 2014
Three months ended August 31, 2014
The following explains expense changes in the three and nine months ended August 31, 2014, compared to the same period in
the prior year: • Salaries and benefits expenses decreased $0.1 million and increased $2.8 million for the three and nine months
ended August 31, 2014, compared to the prior year. The increase for the nine months ended August 31, 2014 reflects higher performance-based compensation.
• Stock-based compensation decreased $1.8 million and $6.7 million for the three and nine months ended August 31, 2014, compared to the same period in 2013, related to a decrease in the Class B Non-Voting share price prior to the establishment of the employee benefit trust and the related change in accounting as Restricted Share Units are no longer marked to market. For additional information see Note 3.3 of the condensed consolidated interim financial statements.
• Absorption expenses increased $0.6 million and decreased $1.2 million for the three and nine months ended August 31, 2014. The increase for the three months ended August 31, 2014 reflects higher absorption and fund accounting expenses. The decrease for the nine months ended August 31, 2014 is a result of an amendment on certain funds to replace management expense ratio (MER) reductions with a management fee waiver, which is accounted for as an offset to revenue.
• Other expenses decreased $2.1 million and $3.2 million for the three and nine months ended August 31, 2014, due to timing of certain professional services combined with lower harmonized sales tax provisions.
Trailing Commissions Trailing commissions paid to distributors depend on total AUM, the proportion of mutual fund AUM sold on a front-end versus back-end commission basis and the proportion of equity fund AUM versus fixed-income fund AUM. Annualized trailing commissions as a percentage of average daily retail fund AUM increased to 0.67% and 0.65% for the three and nine months ended August 31, 2014, compared to 0.65% and 0.64% in 2013, reflecting an increase in rates associated with mature assets.
Investment Advisory Fees External investment advisory fees increased 33.3% and 12.5% for the three and nine months ended August 31, 2014, as compared to 2013, reflecting the addition of certain externally managed funds combined with higher AUM levels.
EBITDA, EBITDA Margin and EBITDA per Share EBITDA from continuing operations was $38.5 million and $120.5 million for the three and nine months ended August 31, 2014, a 0.3% and 7.3% decrease from $38.6 million and $130.0 million for the same period of 2013. EBITDA margin was 32.9% and 34.2% for the three and nine months ended August 31, 2014, compared to 32.8% and 35.4% in the corresponding periods in 2013. Diluted EBITDA per share from continuing operations for the three and nine months ended August 31, 2014 was $0.45 and $1.39, compared to $0.44 and $1.46 for the three and nine months ended August 31, 2013.
Amortization and Interest Expense The category represents amortization of deferred selling commissions, customer contracts, other intangible assets, property, equipment, and computer software and interest expense. Deferred selling commissions amortization represents the most significant category of amortization. We internally finance all selling commissions paid. These selling commissions are capitalized and amortized on a straight-line basis over a period that corresponds with their applicable DSC schedule.

Management’s Discussion and Analysis of Financial Condition and Results of Operations
AGF Management Limited – 13 – Third Quarter Report 2014
Unamortized deferred selling commissions related to units redeemed prior to the end of the schedule are immediately expensed. Amortization and derecognition expense related to deferred selling commissions was $12.7 million and $37.5 million for the three and nine months ended August 31, 2014, compared to $15.5 million and $45.2 million for the same periods of 2013. During the three and nine months ended August 31, 2014, we paid $7.8 million and $29.8 million in selling commissions, compared to $7.9 million and $28.7 million in the same period of 2013, reflecting stable sales. As at August 31, 2014, the unamortized balance of deferred selling commissions financed was $107.2 million (November 30, 2013 – $114.8 million).
Customer contracts amortization and derecognition decreased $0.7 million and $2.6 million for the three and nine months ended August 31, 2014, as a result of fewer redemptions and a lower net book value. Customer contracts are immediately expensed upon redemption of the AUM. Interest expense increased as a result of higher interest rates.
Other intangibles amortization and derecognition decreased $1.7 million and $4.9 million for the three and nine months ended August 31, 2014.
Pre-tax Profit Margin Pre-tax profit margin increased to 16.8% and 17.7% for the three and nine months ended August 31, 2014, compared to 12.0% and 15.3% margin in the corresponding periods in 2013.
Income Tax Expense Income tax expense related to continuing operations for the three and nine months ended August 31, 2014 was $4.8 million and $15.9 million, compared to $4.0 million and $41.0 million in the corresponding period in 2013. The estimated effective tax rate for the nine months ended August 31, 2014 was 25.5% (2013 – 72.9%). Excluding the tax contingencies recorded for the Canada Revenue Agency (CRA) transfer pricing audit, the estimated effective tax rate related to continuing operations for the first nine months of fiscal 2014 was 23.3% (2013 – 25.5%).
The Company believes that it has adequately provided for income taxes based on all of the information that is currently available. The calculation of income taxes in many cases, however, requires significant judgement in interpreting tax rules and regulations. The Company’s tax filings are subject to audits, which could materially change the amount of the current and deferred income tax assets and liabilities, and could, in certain circumstances, result in the assessment of interest and penalties.
In November 2013, the Company received a notice of reassessment (NOR) from the CRA relating to the transfer pricing and allocation of income between one of the Company’s Canadian legal entities and a foreign subsidiary, which would increase the Company’s taxes payable from its original tax filings by $10.0 million, $10.5 million and $15.4 million (before the application of any interest and penalties of $21.6 million) for its 2005, 2006 and 2007 fiscal years, respectively. Subsequent to the quarter end, the Company received a proposal letter from the CRA for its 2008 fiscal year in relation to the same matter, which would increase the Company’s taxes payable from its original tax filing by approximately $13.6 million (before the application of any interest and penalties). The basis of the 2008 proposal letter is consistent with the 2005, 2006 and 2007 reassessments on this matter. The amount of tax provision recorded on the consolidated interim statement of financial position has already reflected management’s best estimate on the resolution of this matter and hence no additional change to the tax provision is expected in respect of the 2008 proposal letter.
The Company strongly disagrees with the CRA’s position and filed an objection to the NOR for 2005, 2006 and 2007 in February 2014. The Company will respond to the proposal letter for 2008 received following the quarter and will object to the forthcoming reassessment with which it does not agree. In connection with the filing of an objection to the NOR for the 2005, 2006 and 2007 fiscal years, the Company was required to pay, and has paid, approximately $39.5 million (including interest and penalties) during the nine months ended August 31, 2014, even though the ultimate outcome may differ from this amount.
In consultation with its external advisors, the Company believes that its tax filing positions continue to be reasonable based on its transfer pricing methodology and the Company is contesting the CRA’s position and any related transfer pricing penalty. The Company believes it is likely that the CRA will reassess its taxes for subsequent years on a similar basis and that these may result in future cash payments on receipt of the reassessments. Upon receipt of the 2008 reassessment, when the Company objects to this reassessment, it will be required to pay 50% of the federal amount reassessed even though the ultimate outcome may differ from the amount reassessed. The amount of tax provision recorded on the consolidated interim statement of financial position reflects management’s best estimate of the final payment to be made on the ultimate resolution of this matter and includes any related estimated interest and penalties for the 2005 to 2014 fiscal years. The final result of the audit and appeals process may vary and may be materially different compared to the estimates and assumptions used by management in determining the Company’s consolidated income tax provision and in valuing its income tax assets and liabilities.
Further to the Company’s objection to the NOR, the Company is also seeking Competent Authority relief from double taxation under the applicable tax treaty.

Management’s Discussion and Analysis of Financial Condition and Results of Operations
AGF Management Limited – 14 – Third Quarter Report 2014
The Company has been accepted by the CRA into a Bilateral Advance Pricing Arrangement (BAPA) between Canada and the relevant tax authorities to establish the appropriate transfer pricing methodologies for the tax years 2009 through 2016.
Net Income The impact of the above revenue and expense items resulted in a net income from continuing operations of $14.8 million and $46.5 million for the three and nine months ended August 31, 2014, as compared to net income from continuing operations of $10.1 million and $15.3 million in the corresponding periods in 2013.
Earnings per Share Diluted earnings per share from continuing operations were $0.17 and $0.54 for the three and nine months ended August 31, 2014, as compared to earnings of $0.11 and $0.17 in the corresponding periods of 2013. Adjusted for one-time items for the three and nine months ended August 31, 2013, the adjusted diluted earnings per share from continuing operations were $0.11 and $0.42.
Discontinued Operations On August 1, 2012, the Company completed its sale of 100% of the shares of AGF Trust Company (AGF Trust) for cash consideration corresponding to the net book value of AGF Trust at closing of $246.3 million. The agreement included a contingent consideration to a maximum of $20.0 million over five years if the credit performance of AGF Trust’s loan portfolio met certain thresholds. In May 2014, the Company finalized an early settlement of the contingent consideration receivable with the purchaser and revised the consideration receivable to $10.0 million (November 30, 2013 – $6.1 million), which was included in accounts receivable on the consolidated interim statement of financial position. As a result, during the nine months ended August 31, 2014, the Company realized a gain on discontinued operations of $3.9 million, or $2.8 million after tax (2013 – nil). The amount receivable was settled on June 4, 2014.
One-time Adjustments The table below summarizes the one-time adjustments for the three and nine months ended August 31, 2014 and 2013:
($ millions, except per share data) 2014 2013 % change 2014 2013 % change
EBITDA from continuing operations $ 38.5 $ 38.6 (0.3%) $ 120.5 $ 130.0 (7.3%)
Add:Other income – – n/m – (3.7) n/m
Adjusted EBITDA from continuing operations $ 38.5 $ 38.6 (0.3%) $ 120.5 $ 126.3 (4.6%)
Net income from continuing operations $ 14.8 $ 10.1 46.5% $ 46.5 $ 15.3 203.9%
Add:Adjustments to EBITDA from above – – n/m – (3.7) n/mOne-t ime true-up tax provision for the CRA transfer pricing audit – – n/m – 25.0 n/mTax impact on the adjustments to EBITDA above – – n/m – 1.0 n/m
Adjusted net income from continuing operations $ 14.8 $ 10.1 46.5% $ 46.5 $ 37.6 23.7%
Adjusted diluted EPS from continuing operations $ 0.17 $ 0.11 54.5% $ 0.54 $ 0.42 28.6%
Three months ended August 31, Nine months ended August 31,

Management’s Discussion and Analysis of Financial Condition and Results of Operations
AGF Management Limited – 15 – Third Quarter Report 2014
Liquidity and Capital Resources Free cash flow, as defined on page 17, generated from continuing operating activities was $23.2 million and $58.6 million for the three and nine months ended August 31, 2014, compared to $25.4 million and $77.5 million in the prior year. The primary uses of cash for the three and nine months ended August 31, 2014 were as follows:
• During the nine months ended August 31, 2014, we repurchased a total of 1,762,200 (2013 – 2,381,965) shares for $22.1 million (2013 – $26.9 million).
• We paid $22.5 million and $67.7 million in dividends for the three and nine months ended August 31, 2014, compared to $22.9 million and $69.8 million in 2013.
• We received a return of capital of $10.9 million and invested $27.5 million in the alternative asset management platform during the three and nine months ended August 31, 2014.
• We paid $39.5 million to the CRA in relation to the NOR received during the nine months ended August 31, 2014. Our free cash flow may be influenced in the short term as we seed initiatives. We believe that our free cash flow and
capital position provide sufficient resources to sustain our dividend for the foreseeable future assuming no significant adverse changes in the markets in which we operate. We continually assess our dividend policy, initiatives and expense structure on a quarterly basis.
Consolidated cash and cash equivalents of $254.3 million decreased by $115.6 million from November 30, 2013. Total long-term debt outstanding at August 31, 2014 was $308.2 million (November 30, 2013 – $307.9 million). As at August 31, 2014, $84.9 million was available to be drawn. The loan facility will be available to meet future operational and investment needs. We anticipate that cash balances and cash flow from operations, together with the available loan facility, will be sufficient in the foreseeable future to implement our business plan, fund our commitments related to our alternative asset management platform, finance selling commissions, satisfy regulatory and tax requirements, service debt repayment obligations, pay quarterly dividends, and fund any future share buybacks.
Capital Management Activities from Continuing Operations We actively manage our capital to maintain a strong and efficient capital base to maximize risk-adjusted returns to shareholders, to invest in future growth opportunities, including acquisitions, and to ensure that the regulatory capital requirements are met for each of our subsidiary companies.
AGF capital consists of shareholders’ equity and long-term debt. On an annual basis, AGF prepares a three-year plan detailing projected operating budgets and capital requirements. AGF is required to prepare and submit a three-year operating plan and budget to AGF’s Finance Committee for approval prior to seeking Board approval. AGF’s Finance Committee consists of the Chairman and CEO, the Vice-Chairman, Executive Vice-President and CFO, and the Executive Vice-President and Chief Operating Officer. Once approved by the Finance Committee, the three-year plans are reviewed and approved by AGF’s Board of Directors. These plans become the basis for the payment of dividends to shareholders, the repurchase of Class B Non-Voting shares and, combined with the reasonable use of leverage, the source of funds for expansion through organic growth and select acquisitions.
Normal Course Issuer Bid AGF has obtained applicable regulatory approval to purchase for cancellation, from time to time, certain of its Class B Non-Voting shares through the facilities of the Toronto Stock Exchange (TSX). AGF relies on an automatic purchase plan during the normal course issuer bid. The automatic purchase plan allows for purchases by AGF of its Class B Non-Voting shares during certain pre-determined black-out periods, subject to certain parameters. Outside of these pre-determined black-out periods, shares will be purchased in accordance with management’s discretion. Shares purchased for the employee benefit trust are also purchased under the Company’s normal course issuer bid. Under its normal course issuer bid, the Class B Non-Voting shares may be repurchased from time to time at prevailing market prices or such other price as may be permitted by the TSX. AGF may purchase up to 6,904,647 Class B Non-Voting shares, or 10% of the public float for such shares, through the facilities of the TSX (or as otherwise permitted by the TSX) between February 4, 2014 and February 3, 2015.
During the nine months ended August 31, 2014, under the previous normal course issuer bid,1,762,200 Class B Non-Voting shares were repurchased for a total consideration of $22.1 million at an average price of $12.55 per share.
During the three months ended August 31, 2014, under the new normal course issuer bid, 120,000 Class B Non-Voting shares were purchased for the employee benefit trust for a total consideration of $1.5 million at an average price of $12.23 per share. During the nine months ended August 31, 2014, under the new normal course issuer bid, 270,000 Class B Non-Voting shares were purchased for the employee benefit trust for a total consideration of $3.3 million at an average price of $12.22 per share. For additional information see Note 3.3 of the condensed consolidated interim financial statements.
Management’s Discussion and Analysis of Financial Condition and Results of Operations
AGF Management Limited – 16 – Third Quarter Report 2014
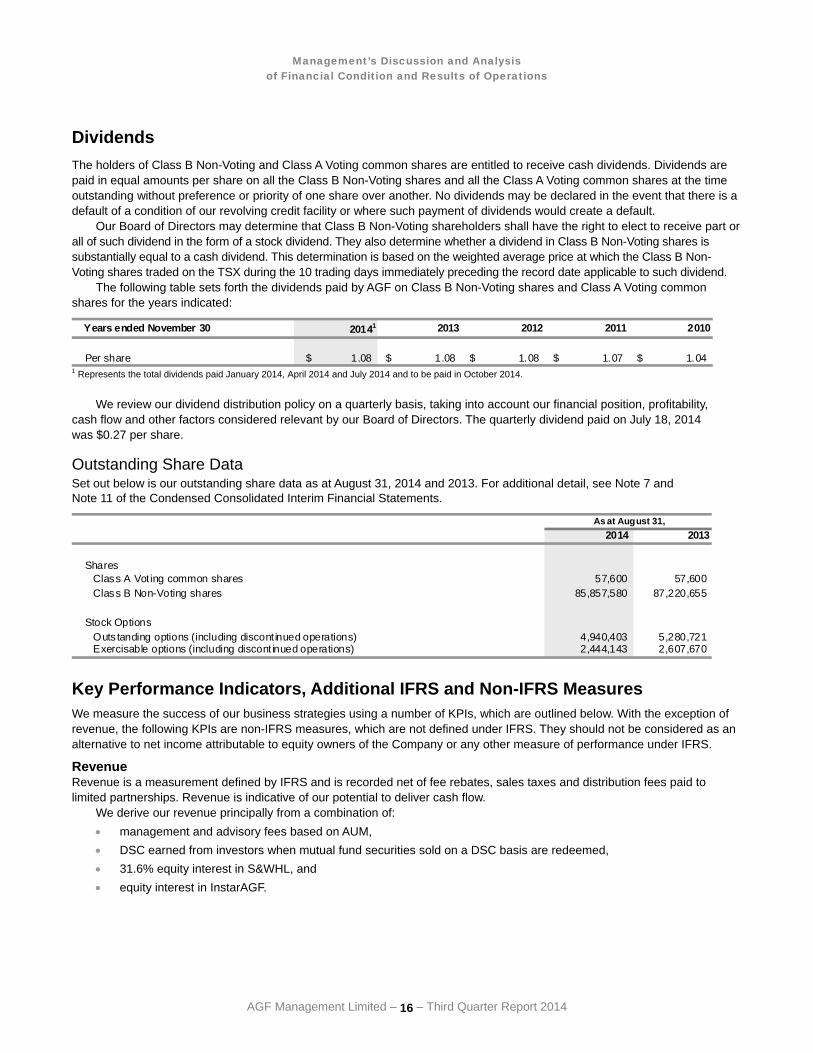
Dividends The holders of Class B Non-Voting and Class A Voting common shares are entitled to receive cash dividends. Dividends are paid in equal amounts per share on all the Class B Non-Voting shares and all the Class A Voting common shares at the time outstanding without preference or priority of one share over another. No dividends may be declared in the event that there is a default of a condition of our revolving credit facility or where such payment of dividends would create a default.
Our Board of Directors may determine that Class B Non-Voting shareholders shall have the right to elect to receive part or all of such dividend in the form of a stock dividend. They also determine whether a dividend in Class B Non-Voting shares is substantially equal to a cash dividend. This determination is based on the weighted average price at which the Class B Non-Voting shares traded on the TSX during the 10 trading days immediately preceding the record date applicable to such dividend.
The following table sets forth the dividends paid by AGF on Class B Non-Voting shares and Class A Voting common shares for the years indicated:
Years ended November 30 20141 2013 2012 2011 2010
Per share $ 1.08 $ 1.08 $ 1.08 $ 1.07 $ 1.04 1 Represents the total dividends paid January 2014, April 2014 and July 2014 and to be paid in October 2014.
We review our dividend distribution policy on a quarterly basis, taking into account our financial position, profitability, cash flow and other factors considered relevant by our Board of Directors. The quarterly dividend paid on July 18, 2014 was $0.27 per share.
Outstanding Share Data Set out below is our outstanding share data as at August 31, 2014 and 2013. For additional detail, see Note 7 and Note 11 of the Condensed Consolidated Interim Financial Statements.
2013
SharesClass A Vot ing common shares 57,600 Class B Non-Voting shares 87,220,655
Stock OptionsOuts tanding options (including discont inued operations) 5,280,721 Exercisable options (including discont inued operations) 2,607,670
As at August 31,
4,940,403
2014
2,444,143
57,600 85,857,580
Key Performance Indicators, Additional IFRS and Non-IFRS Measures We measure the success of our business strategies using a number of KPIs, which are outlined below. With the exception of revenue, the following KPIs are non-IFRS measures, which are not defined under IFRS. They should not be considered as an alternative to net income attributable to equity owners of the Company or any other measure of performance under IFRS.
Revenue Revenue is a measurement defined by IFRS and is recorded net of fee rebates, sales taxes and distribution fees paid to limited partnerships. Revenue is indicative of our potential to deliver cash flow.
We derive our revenue principally from a combination of: • management and advisory fees based on AUM, • DSC earned from investors when mutual fund securities sold on a DSC basis are redeemed, • 31.6% equity interest in S&WHL, and • equity interest in InstarAGF.

Management’s Discussion and Analysis of Financial Condition and Results of Operations
AGF Management Limited – 17 – Third Quarter Report 2014
EBITDA We define EBITDA from continuing operations as earnings before interest, taxes, depreciation and amortization and impairment of goodwill and management contracts. EBITDA is a standard measure used in the mutual fund industry by management, investors and investment analysts to understand and compare results. We believe this is an important measure as it allows us to assess our investment management businesses without the impact of non-operational items.
Please see the Consolidated Operating Results section on page 10 of this MD&A for a schedule showing how EBITDA reconciles to our IFRS financial statements.
Free Cash Flow We define free cash flow from continuing operations as cash flow from operations before net changes in non-cash balances related to operations less interest paid. Free cash flow for 2014 has been normalized to exclude taxes paid related to the transfer pricing audit. This is a relevant measure in the investment management business since a substantial amount of cash is spent on upfront commission payments. Free cash flow from continuing operations represents cash available for distribution to our shareholders, share buybacks and general corporate purposes.
($ millions) 2013 2014 2013
Net cash provided by cont inuing operating act ivit ies $ 27.8 $ 32.5 $ 3.9 $ 77.4 Adjusted for:
Net changes in non-cash work ing capital balances related to operations (1.7) (4.2) 24.1 8.8
Taxes paid related to trans fer pricing audit – – 39.5 – Interest paid (2.9) (2.9) (8.9) (8.7)
Free cash flow $ 23.2 $ 25.4 $ 58.6 $ 77.5
Three months ended August 31, Nine months ended August 31,2014
EBITDA Margin EBITDA margin provides useful information to management and investors as an indicator of our overall operating performance. We believe EBITDA margin is a valuable measure because it assesses the extent we are able to earn profit from each dollar of revenue. We define EBITDA margin as the ratio of EBITDA to revenue.
($ millions) 2013 2013
EBITDA $ 38.5 $ 38.6 $ 120.5 $ 130.0 Divided by revenue 116.9 117.7 352.8 367.1 EBITDA margin 32.9% 32.8% 34.2% 35.4%
Nine months ended August 31,2014 2014
Three months ended August 31,
Pre-tax Profit Margin Pre-tax profit margin provides useful information to management and investors as an indicator of our overall operating performance. We believe pre-tax profit margin is a valuable measure because it assesses the extent we are able to earn profit from each dollar of revenue. We define pre-tax profit margin as the ratio of income from continuing operations before taxes to revenue.
($ millions) 2013 2013
Net income from continuing operations $ 14.8 $ 10.1 $ 46.5 $ 15.3 Add: income taxes 4.8 4.0 15.9 41.0 Income before taxes $ 19.6 $ 14.1 $ 62.4 $ 56.3 Divided by revenue 116.9 117.7 352.8 367.1 Pre-tax profit margin 16.8% 12.0% 17.7% 15.3%
2014 Three months ended August 31, Nine months ended August 31,
2014
Management’s Discussion and Analysis of Financial Condition and Results of Operations
AGF Management Limited – 18 – Third Quarter Report 2014
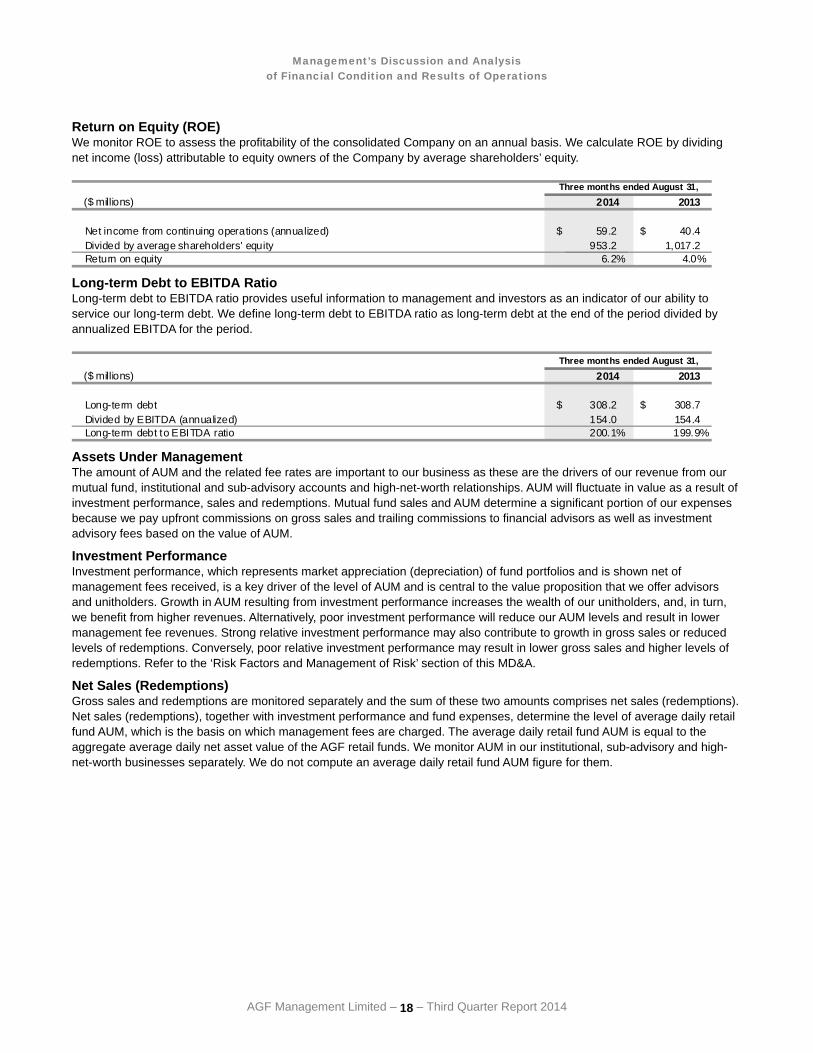
Return on Equity (ROE) We monitor ROE to assess the profitability of the consolidated Company on an annual basis. We calculate ROE by dividing net income (loss) attributable to equity owners of the Company by average shareholders’ equity.
($ millions) 2013
Net income from continuing operations (annualized) $ 59.2 $ 40.4 Divided by average shareholders' equity 953.2 1,017.2 Return on equity 6.2% 4.0%
Three months ended August 31,2014
Long-term Debt to EBITDA Ratio Long-term debt to EBITDA ratio provides useful information to management and investors as an indicator of our ability to service our long-term debt. We define long-term debt to EBITDA ratio as long-term debt at the end of the period divided by annualized EBITDA for the period.
($ millions) 2013
Long-term debt $ 308.2 $ 308.7 Divided by EBITDA (annualized) 154.0 154.4 Long-term debt to EBITDA ratio 200.1% 199.9%
Three months ended August 31,2014
Assets Under Management The amount of AUM and the related fee rates are important to our business as these are the drivers of our revenue from our mutual fund, institutional and sub-advisory accounts and high-net-worth relationships. AUM will fluctuate in value as a result of investment performance, sales and redemptions. Mutual fund sales and AUM determine a significant portion of our expenses because we pay upfront commissions on gross sales and trailing commissions to financial advisors as well as investment advisory fees based on the value of AUM. Investment Performance Investment performance, which represents market appreciation (depreciation) of fund portfolios and is shown net of management fees received, is a key driver of the level of AUM and is central to the value proposition that we offer advisors and unitholders. Growth in AUM resulting from investment performance increases the wealth of our unitholders, and, in turn, we benefit from higher revenues. Alternatively, poor investment performance will reduce our AUM levels and result in lower management fee revenues. Strong relative investment performance may also contribute to growth in gross sales or reduced levels of redemptions. Conversely, poor relative investment performance may result in lower gross sales and higher levels of redemptions. Refer to the ‘Risk Factors and Management of Risk’ section of this MD&A. Net Sales (Redemptions) Gross sales and redemptions are monitored separately and the sum of these two amounts comprises net sales (redemptions). Net sales (redemptions), together with investment performance and fund expenses, determine the level of average daily retail fund AUM, which is the basis on which management fees are charged. The average daily retail fund AUM is equal to the aggregate average daily net asset value of the AGF retail funds. We monitor AUM in our institutional, sub-advisory and high-net-worth businesses separately. We do not compute an average daily retail fund AUM figure for them.
Management’s Discussion and Analysis of Financial Condition and Results of Operations
AGF Management Limited – 19 – Third Quarter Report 2014
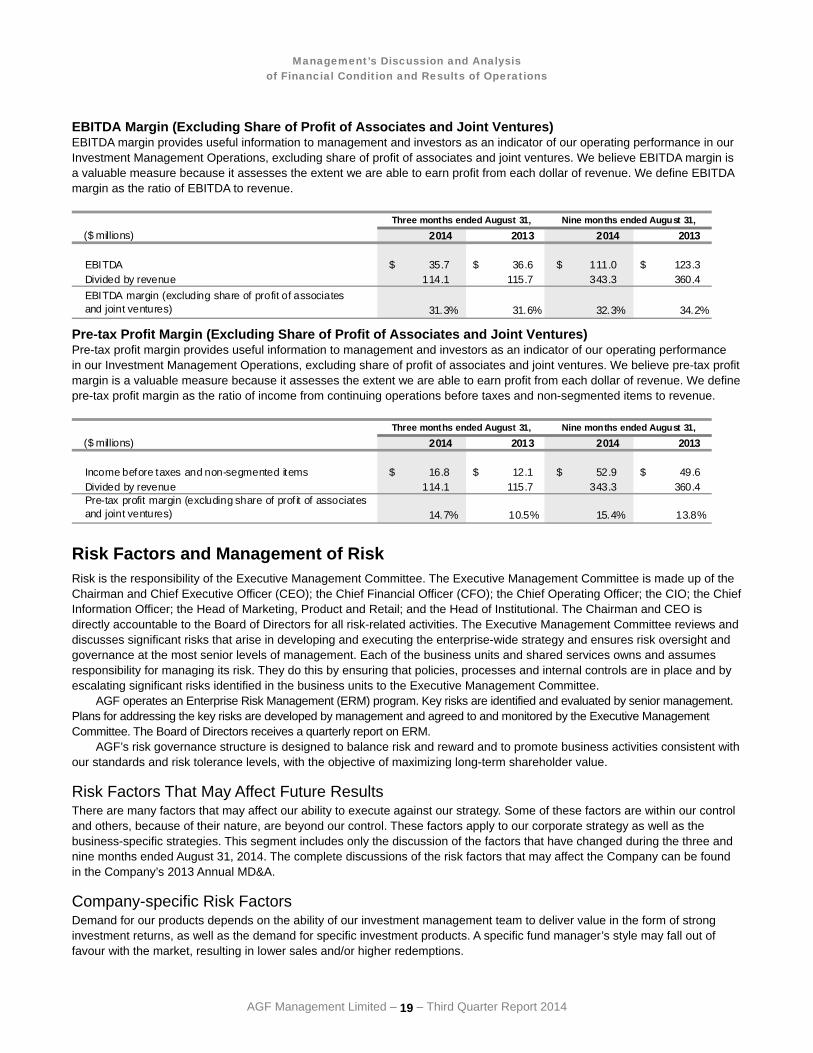
EBITDA Margin (Excluding Share of Profit of Associates and Joint Ventures) EBITDA margin provides useful information to management and investors as an indicator of our operating performance in our Investment Management Operations, excluding share of profit of associates and joint ventures. We believe EBITDA margin is a valuable measure because it assesses the extent we are able to earn profit from each dollar of revenue. We define EBITDA margin as the ratio of EBITDA to revenue.
($ millions) 2013 2013
EBITDA $ 35.7 $ 36.6 $ 111.0 $ 123.3 Divided by revenue 114.1 115.7 343.3 360.4 EBITDA margin (excluding share of profit of associatesand joint ventures) 31.3% 31.6% 32.3% 34.2%
Three months ended August 31, Nine months ended August 31,2014 2014
Pre-tax Profit Margin (Excluding Share of Profit of Associates and Joint Ventures) Pre-tax profit margin provides useful information to management and investors as an indicator of our operating performance in our Investment Management Operations, excluding share of profit of associates and joint ventures. We believe pre-tax profit margin is a valuable measure because it assesses the extent we are able to earn profit from each dollar of revenue. We define pre-tax profit margin as the ratio of income from continuing operations before taxes and non-segmented items to revenue.
($ millions) 2013 2013
Income before taxes and non-segmented items $ 16.8 $ 12.1 $ 52.9 $ 49.6 Divided by revenue 114.1 115.7 343.3 360.4 Pre-tax profit margin (excluding share of prof it of associates and joint ventures) 14.7% 10.5% 15.4% 13.8%
Three months ended August 31,2014 2014
Nine months ended August 31,
Risk Factors and Management of Risk Risk is the responsibility of the Executive Management Committee. The Executive Management Committee is made up of the Chairman and Chief Executive Officer (CEO); the Chief Financial Officer (CFO); the Chief Operating Officer; the CIO; the Chief Information Officer; the Head of Marketing, Product and Retail; and the Head of Institutional. The Chairman and CEO is directly accountable to the Board of Directors for all risk-related activities. The Executive Management Committee reviews and discusses significant risks that arise in developing and executing the enterprise-wide strategy and ensures risk oversight and governance at the most senior levels of management. Each of the business units and shared services owns and assumes responsibility for managing its risk. They do this by ensuring that policies, processes and internal controls are in place and by escalating significant risks identified in the business units to the Executive Management Committee.
AGF operates an Enterprise Risk Management (ERM) program. Key risks are identified and evaluated by senior management. Plans for addressing the key risks are developed by management and agreed to and monitored by the Executive Management Committee. The Board of Directors receives a quarterly report on ERM.
AGF’s risk governance structure is designed to balance risk and reward and to promote business activities consistent with our standards and risk tolerance levels, with the objective of maximizing long-term shareholder value.
Risk Factors That May Affect Future Results There are many factors that may affect our ability to execute against our strategy. Some of these factors are within our control and others, because of their nature, are beyond our control. These factors apply to our corporate strategy as well as the business-specific strategies. This segment includes only the discussion of the factors that have changed during the three and nine months ended August 31, 2014. The complete discussions of the risk factors that may affect the Company can be found in the Company’s 2013 Annual MD&A.
Company-specific Risk Factors Demand for our products depends on the ability of our investment management team to deliver value in the form of strong investment returns, as well as the demand for specific investment products. A specific fund manager’s style may fall out of favour with the market, resulting in lower sales and/or higher redemptions.

Management’s Discussion and Analysis of Financial Condition and Results of Operations
AGF Management Limited – 20 – Third Quarter Report 2014
Our future financial performance will be influenced by our ability to successfully execute our strategy and generate net sales. If sales do not materialize as planned or key personnel cannot be retained, margins may erode.
Our strategy includes strategic acquisitions and investments in associates and joint ventures. There is no assurance that we will be able to complete acquisitions on the terms and conditions that satisfy our investment criteria. After transactions are completed, meeting target return objectives is contingent upon many factors, including retaining key employees and growth in AUM of the acquired companies.
Our investments in associates and joint ventures may involve risks and uncertainties including, but not limited to, our dependency on partners and co-venturers that are not under our control and that might become bankrupt or otherwise fail to fund their share of required capital contributions, or suffer reputational damage that could have an adverse impact on us. We do not have sole control over certain major decisions relating to these assets and businesses, which could affect our future returns on these investments.
Our retail AUM is obtained through third-party distribution channels including financial advisors or strategic partners that offer our products to investors along with competing products. Our future success is dependent on continued access to these distribution channels that are independent of our company.
Non-company Risk Factors A general economic downturn, market volatility and an overall lack of investor confidence could result in lower sales, higher redemption levels and lower AUM levels. In addition, market uncertainty could result in retail investors avoiding traditional equity funds in favour of money market funds.
The level of competition in the industry is high. Sales and redemptions of mutual funds may be influenced by relative service levels, management fees, attributes of specific products in the marketplace and actions taken by competitors.
The success of our infrastructure investments may be influenced by government regulations, capital expenditure requirements, general economic conditions and other material disruptions.
We take all reasonable measures to ensure compliance with governing statutes, regulations and regulatory policies. Failure to comply with statutes, regulations or regulatory policies could result in sanctions or fines that could adversely affect earnings and reputation. Changes to laws, statutes, regulations or regulatory policies could affect us by changing certain economic factors in our industry. See the ‘Government Regulations’ section of the 2013 Annual MD&A for further details.
Revenues are generally not subject to significant seasonal swings, but are directly correlated to global stock market volatility. We experience somewhat higher sales during the Retirement Savings Plan (RSP) season; however, the immediate impact of the level of sales on total revenue is not significant. The Selected Quarterly Information table shows key performance statistics for the past eight quarters.
Internal Control Over Financial Reporting The Chief Executive Officer and the Chief Financial Officer have designed or caused the design of the Internal Controls Over Financial Reporting (ICFR) and Disclosure Controls and Procedures. There have been no changes in AGF’s internal controls during the three months ended August 31, 2014 that have materially affected, or are reasonably likely to materially affect, our internal control over financial reporting.

Management’s Discussion and Analysis of Financial Condition and Results of Operations
AGF Management Limited – 21 – Third Quarter Report 2014
Selected Quarterly Information (in millions of Canadian dollars, except per share amounts) Aug. 31, May 31, Feb. 28, Nov. 30,For the three-month period ended 2014 2014 2014 2013
Revenue (cont inuing operations) $ 116.9 $ 119.1 $ 116.9 $ 117.4 Free cash flow1 23.2 16.0 19.4 26.2 EBITDA (continuing operations)2 38.5 38.1 43.9 33.6 Pre-tax income (continuing operations) 19.6 19.5 23.2 9.7 Net income attributable to equity owners
of the Company 14.8 14.5 19.9 7.1 Net income (cont inuing operations) 14.8 14.5 17.1 7.1
EBITDA per share (continuing operations)Basic $ 0.45 $ 0.44 $ 0.51 $ 0.39 Diluted $ 0.45 $ 0.44 $ 0.51 $ 0.38
Earnings per share attributable to equity owners of the Company
Basic (continuing operat ions) $ 0.17 $ 0.17 $ 0.20 $ 0.08 Diluted (continuing operations) $ 0.17 $ 0.17 $ 0.20 $ 0.08 Basic $ 0.17 $ 0.17 $ 0.23 $ 0.08 Diluted $ 0.17 $ 0.17 $ 0.23 $ 0.08
Weighted average basic shares 85,950,736 86,009,993 86,188,463 87,145,604 Weighted average fully diluted shares 86,459,914 86,563,621 86,742,830 87,911,391
(in millions of Canadian dollars, except per share amounts) Aug. 31, May 31, Feb. 28, Nov. 30,For the three-month period ended 2013 2013 2013 2012
Revenue (cont inuing operations) $ 117.7 $ 126.9 $ 122.5 $ 124.9 Free cash flow1 25.4 27.7 24.4 24.9 EBITDA (continuing operations)2 38.6 46.1 45.3 49.9 Pre-tax income (continuing operations) 14.1 20.5 21.8 23.4 Net income (loss) attributable to equity owners
of the Company 10.1 (10.4) 15.6 15.7 Net income (loss) (cont inuing operations) 10.1 (10.4) 15.6 13.0
EBITDA per share (continuing operations)Basic $ 0.44 $ 0.52 $ 0.51 $ 0.55 Diluted $ 0.44 $ 0.52 $ 0.51 $ 0.55
Earnings (loss) per share attributable to equity owners of the Company
Basic (continuing operat ions) $ 0.12 $ (0.12) $ 0.18 $ 0.14 Diluted (continuing operations) $ 0.11 $ (0.12) $ 0.17 $ 0.14 Basic $ 0.12 $ (0.12) $ 0.18 $ 0.17 Diluted $ 0.11 $ (0.12) $ 0.17 $ 0.17
Weighted average basic shares 87,411,167 88,880,598 89,229,202 90,329,013 Weighted average fully diluted shares 88,026,012 89,395,236 89,538,278 90,594,421
1 As previously defined, see ‘Key Performance Indicators, Additional IFRS and Non-IFRS Measures – Free Cash Flow’ section. 2 As previously defined, see ‘Key Performance Indicators, Additional IFRS and Non-IFRS Measures – EBITDA’ section.
Additional Information Additional information relating to the Company can be found in the Company’s Condensed Consolidated Interim Financial Statements and accompanying notes for the three and nine months ended August 31, 2014, the Company’s 2013 Annual Information Form (AIF) and other documents filed with applicable securities regulators in Canada and may be accessed at www.sedar.com.

AGF Management Limited CONDENSED CONSOLIDATED INTERIM FINANCIAL STATEMENTS For the three and nine months ended August 31, 2014 and 2013
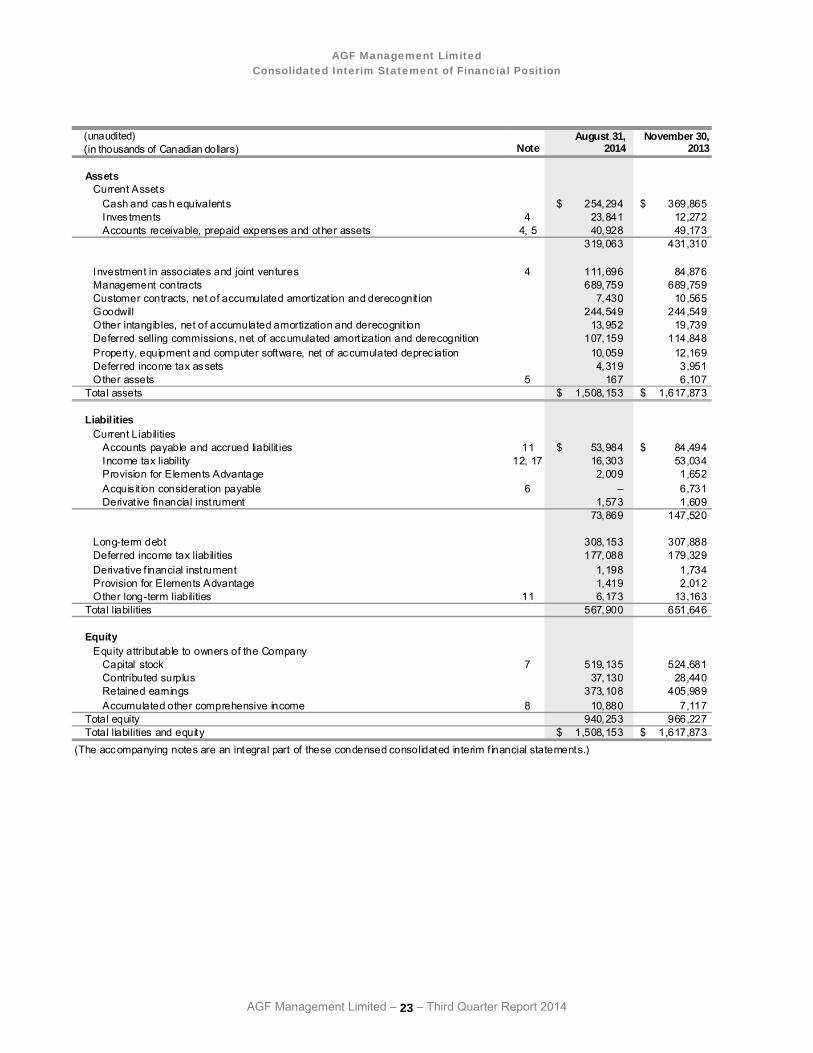
AGF Management Limited Consolidated Interim Statement of Financial Position
AGF Management Limited – 23 – Third Quarter Report 2014
(unaudited) August 31, November 30,(in thousands of Canadian dollars) Note 2014 2013
Assets Current Assets
Cash and cash equivalents $ 254,294 $ 369,865 Inves tments 4 23,841 12,272 Accounts receivable, prepaid expenses and other assets 4, 5 40,928 49,173
319,063 431,310
Investment in associates and joint ventures 4 111,696 84,876 Management contracts 689,759 689,759 Customer contracts, net of accumulated amortizat ion and derecognit ion 7,430 10,565 Goodwill 244,549 244,549 Other intangibles, net of accumulated amortization and derecognit ion 13,952 19,739 Deferred selling commissions, net of accumulated amort ization and derecognition 107,159 114,848 Property, equipment and computer software, net of accumulated deprec iation 10,059 12,169 Deferred income tax assets 4,319 3,951 Other assets 5 167 6,107
Total assets $ 1,508,153 $ 1,617,873
Liabil itiesCurrent Liabilities
Accounts payable and accrued liabilit ies 11 $ 53,984 $ 84,494 Income tax liability 12, 17 16,303 53,034 Provision for Elements Advantage 2,009 1,652 Acquis it ion considerat ion payable 6 – 6,731 Derivat ive financial instrument 1,573 1,609
73,869 147,520
Long-term debt 308,153 307,888 Deferred income tax liabilities 177,088 179,329 Derivative f inancial instrument 1,198 1,734 Provision for Elements Advantage 1,419 2,012 Other long-term liabilities 11 6,173 13,163
Total liabilities 567,900 651,646
EquityEquity attributable to owners of the Company
Capital stock 7 519,135 524,681 Contributed surplus 37,130 28,440 Retained earnings 373,108 405,989 Accumulated other comprehensive income 8 10,880 7,117
Total equity 940,253 966,227 Total liabilities and equity $ 1,508,153 $ 1,617,873
(The accompanying notes are an integral part of these condensed consolidated interim f inancial statements.)

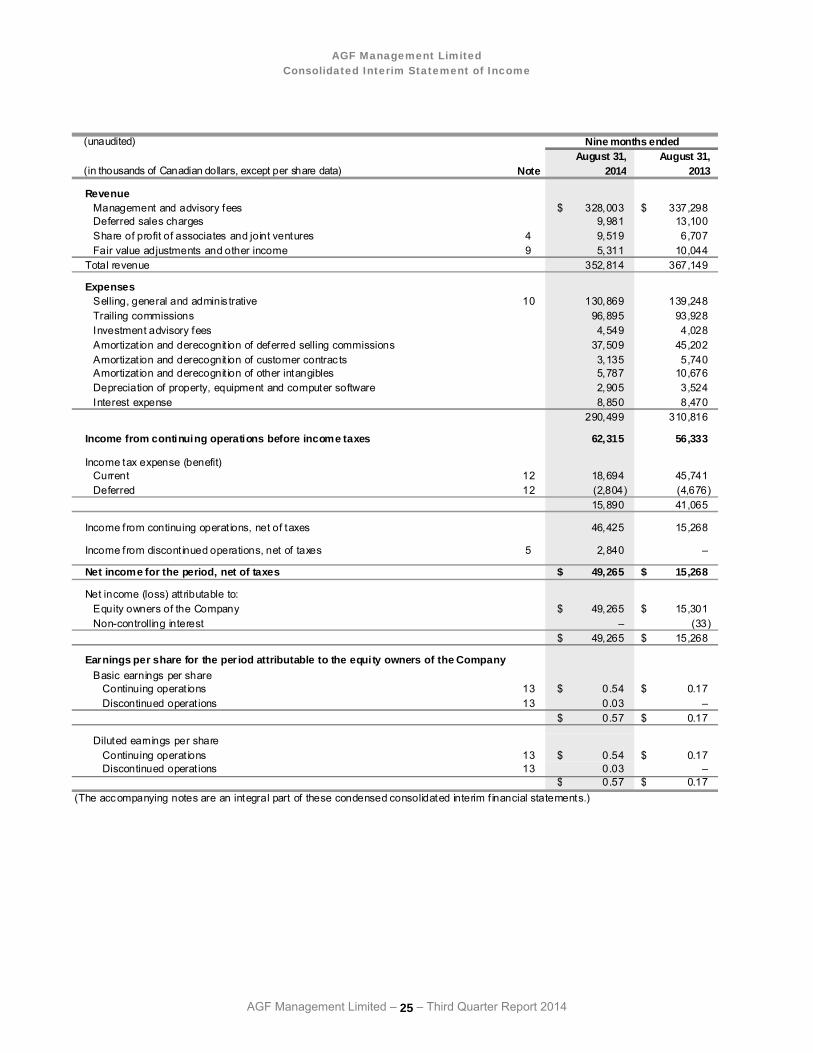
AGF Management Limited Consolidated Interim Statement of Income
AGF Management Limited – 24 – Third Quarter Report 2014
(unaudited)August 31, August 31,
(in thousands of Canadian dollars, except per share data) Note 2014 2013
RevenueManagement and advisory fees $ 109,580 $ 108,896 Deferred sales charges 2,678 4,068 Share of profit of associates and joint ventures 4 2,762 2,005 Fair value adjustments and other income 9 1,878 2,727
Total revenue 116,898 117,696
Expenses Selling, general and adminis trative 10 43,793 47,208 Trailing commissions 32,973 30,713 Investment advisory fees 1,568 1,236 Amortizat ion and derecognit ion of deferred selling commissions 12,713 15,511 Amortizat ion and derecognit ion of customer contrac ts 916 1,635 Amortizat ion and derecognit ion of other intangibles 1,626 3,343 Depreciation of property, equipment and computer software 919 1,206 Interest expense 2,804 2,756
97,312 103,608
Income from continuing operations before income taxes 19,586 14,088
Income tax expense (benefit)Current 12 5,021 5,152 Deferred 12 (240) (1,169)
4,781 3,983
Net income for the period attributable to the equity owners of the Company, net of taxes $ 14,805 $ 10,105
Earnings per share for the per iod attributable to the equity owners of the CompanyBasic earnings per share 13 $ 0.17 $ 0.12 Diluted earnings per share 13 $ 0.17 $ 0.11
(The accompanying notes are an integral part of these condensed consolidated interim f inancial statements.)
Three months ended
AGF Management Limited Consolidated Interim Statement of Income
AGF Management Limited – 25 – Third Quarter Report 2014
(unaudited)August 31, August 31,
(in thousands of Canadian dollars, except per share data) Note 2014 2013
RevenueManagement and advisory fees $ 328,003 $ 337,298 Deferred sales charges 9,981 13,100 Share of profit of associates and joint ventures 4 9,519 6,707 Fair value adjustments and other income 9 5,311 10,044
Total revenue 352,814 367,149
Expenses Selling, general and adminis trative 10 130,869 139,248 Trailing commissions 96,895 93,928 Investment advisory fees 4,549 4,028 Amortizat ion and derecognit ion of deferred selling commissions 37,509 45,202 Amortizat ion and derecognit ion of customer contrac ts 3,135 5,740 Amortizat ion and derecognit ion of other intangibles 5,787 10,676 Depreciation of property, equipment and computer software 2,905 3,524 Interest expense 8,850 8,470
290,499 310,816
Income from continuing operations before income taxes 62,315 56,333
Income tax expense (benefit)Current 12 18,694 45,741 Deferred 12 (2,804) (4,676)
15,890 41,065
Income from continuing operat ions, net of taxes 46,425 15,268
Income from discont inued operations, net of taxes 5 2,840 –
Net income for the period, net of taxes $ 49,265 $ 15,268
Net income (loss) attributable to:Equity owners of the Company $ 49,265 $ 15,301 Non-controlling interest – (33)
$ 49,265 $ 15,268
Earnings per share for the per iod attributable to the equity owners of the CompanyBasic earnings per share
Continuing operat ions 13 $ 0.54 $ 0.17 Discontinued operat ions 13 0.03 –
$ 0.57 $ 0.17
Diluted earnings per shareContinuing operat ions 13 $ 0.54 $ 0.17Discontinued operat ions 13 0.03 –
$ 0.57 $ 0.17(The accompanying notes are an integral part of these condensed consolidated interim f inancial statements.)
Nine months ended

AGF Management Limited Consolidated Interim Statement of Comprehensive Income
AGF Management Limited – 26 – Third Quarter Report 2014
(unaudited)(in thousands of Canadian dollars) 2014 2013 2014 2013
Net income for the period $ 14,805 $ 10,105 $ 49,265 $ 15,268
Other comprehensive income (loss), net of tax
Cumulative translation adjustmentForeign currency translation adjustments related to net
investments in foreign operat ions (625) 2,803 3,068 2,049 (625) 2,803 3,068 2,049
Net unrealized gains (losses) on investmentsUnrealized gains (losses) (250) 14 271 1,268 Reclassificat ion of realized gain to earnings – (1,293) – (1,703)
(250) (1,279) 271 (435)Net unrealized gains (losses) on cash flow hedge
Unrealized gains (losses) (14) 372 (333) 596 Reclassificat ion of realized losses to earnings 249 256 757 765
235 628 424 1,361
Total other comprehensive income (loss), net of tax $ (640) $ 2,152 $ 3,763 $ 2,975
Comprehensive income $ 14,165 $ 12,257 $ 53,028 $ 18,243
Comprehensive income (loss) attributable to:Equity holders of the Company $ 14,165 $ 12,257 $ 53,028 $ 18,276 Non-controlling interest – – – (33)
$ 14,165 $ 12,257 $ 53,028 $ 18,243
All items presented in other comprehensive income (loss) will be reclassif ied to the consolidated statement of income (loss) in subsequent periods
(The accompanying notes are an integral part of these condensed consolidated interim financial statements.)
Three months ended August 31, Nine months ended August 31,

AGF Management Limited Consolidated Interim Statement of Changes in Equity
AGF Management Limited – 27 – Third Quarter Report 2014
(unaudited)
(in thousands of Canadian dollars)Capital
stock
Balance, December 1, 2012 $ 533,684 $ 26,677 $ 495,323 $ (852) $ 1,054,832 $ 490 $ 1,055,322 Net income for the period – – 15,301 – 15,301 (33) 15,268 Other comprehensive income
(net of tax) – – – 2,975 2,975 – 2,975 Comprehensive income (loss)
for the period – – 15,301 2,975 18,276 (33) 18,243 Issued through dividend
reinvestment plan 1,910 – – – 1,910 – 1,910 Stock options 2,287 1,412 – – 3,699 – 3,699 AGF Class B Non-Voting
shares repurchased forcancellation (14,312) – (12,588) – (26,900) – (26,900)
AGF Class B Non-Voting sharesissued on acquis it ion of Acuity 1,231 – – – 1,231 – 1,231
Dividends on AGF Class AVoting common shares and AGF Class B Non-Voting shares,including tax of $0.7 million – – (72,430) – (72,430) – (72,430)
Increase in ownership interestin Highs treet Partners Limited – – (998) – (998) (454) (1,452)
Dividends to non-controllinginterest – – – – – (3) (3)
Balance, August 31, 2013 $ 524,800 $ 28,089 $ 424,608 $ 2,123 $ 979,620 $ – $ 979,620
Balance, December 1, 2013 $ 524,681 $ 28,440 $ 405,989 $ 7,117 $ 966,227 $ – $ 966,227 Net income for the period – – 49,265 – 49,265 – 49,265 Other comprehensive income
(net of tax) – – – 3,763 3,763 – 3,763 Comprehensive income
for the period – – 49,265 3,763 53,028 – 53,028 Issued through dividend
reinvestment plan 1,959 – – – 1,959 – 1,959 Stock options 4,437 369 – – 4,806 – 4,806 AGF Class B Non-Voting
shares repurchased forcancellation (10,623) – (11,486) – (22,109) – (22,109)
AGF Class B Non-Voting sharesissued on acquis it ion of Acuity 1,941 – – – 1,941 – 1,941
Dividends on AGF Class AVoting common shares and AGF Class B Non-Votingshares, including tax of $1.0 million – – (70,660) – (70,660) – (70,660)
Equity-sett led Restricted Share Units – 8,321 – – 8,321 – 8,321 Treasury s tock (3,260) – – – (3,260) – (3,260)Balance, August 31, 2014 $ 519,135 $ 37,130 $ 373,108 $ 10,880 $ 940,253 $ – $ 940,253
(The accompanying notes are an integral part of these condensed consolidated interim f inancial statements.)
Total equity
Contributed surplus
Retained earnings
Accumulated other
comprehensive income (loss)
Attributable to equity owners
of the Company
Non-controlling
interest

AGF Management Limited Consolidated Interim Statement of Cash Flow
AGF Management Limited – 28 – Third Quarter Report 2014
(unaudited)August 31, August 31,
(in thousands of Canadian dollars) Note 2014 2013Operating Activities
Net income for the period $ 49,265 $ 15,268
Adjustments forNet income from discontinued operations 5 (2,840) – Amortization, derecognition and depreciat ion 49,336 65,142 Interest expense 8,850 8,470 Income tax expense 12 15,890 41,065 Income taxes paid (57,437) (20,345)Stock-based compensation 11 2,565 9,270 Share of prof it of associates and joint venture 4 (9,519) (6,707)Distributions from assoc iates 4 2,346 1,242 Deferred selling commissions paid (29,820) (28,701)Other (665) 1,442
27,971 86,146
Net change in non-cash working capital balances related to operationsAccounts receivable, prepaid expenses and other assets 8,245 17,313 Other assets (1,538) (3,287)Accounts payable and accrued liabilit ies (23,881) (25,591)Other liabilities (6,895) 2,815
(24,069) (8,750)
Net cash provided by operating act ivities 3,902 77,396 Financing Activities
Repurchase of Class B Non-Vot ing shares for cancellation 7 (22,109) (26,900)Issue of Class B Non-Vot ing shares 7 4,068 2,138 Purchase of treasury stock 7 (3,300) – Dividends paid 14 (67,747) (69,809)Interest paid (8,853) (8,684)Net cash used in continuing financing activities (97,941) (103,255)
Investing Activities Increase in ownership interest in Highs treet Partners Limited – (4,423)Acquisition of Acuity Funds Ltd. and Acuity Investment Management Inc. 6 (4,440) (2,713)Purchase of investment in associates and joint ventures 4 (27,501) – Return of capital f rom associates and joint ventures 4 10,920 – Purchase of property, equipment and computer software, net of disposals (795) (2,189)Purchase of investments 4 (11,830) (757)Proceeds from sale of investments 4 2,114 24,655 Proceeds from sale of discontinued operations 10,000 – Net cash provided by (used in) continuing invest ing activities (21,532) 14,573
Decrease in cash and cash equivalents during the period (115,571) (11,286)Balance of cash and cash equivalents, beginning of period 369,865 371,299 Balance of cash and cash equivalents, end of period $ 254,294 $ 360,013
(The accompanying notes are an integral part of these condensed consolidated interim f inancial statements.)
Nine months ended
AGF Management Limited – 29 – Third Quarter Report 2014
Notes to Condensed Consolidated Interim Financial Statements For the three and nine months ended August 31, 2014 and 2013 (unaudited)
TNote 1: T General Information AGF Management Limited (AGF or the Company) is a limited liability company incorporated and domiciled in Canada under the Business Corporations Act (Ontario). The address of its registered office and principal place of business is Toronto-Dominion Bank Tower, 66 Wellington Street West, Toronto, Ontario.
The Company is an integrated, global wealth management corporation whose principal subsidiaries provide investment management for mutual funds, institutions and corporations, as well as high-net-worth clients. The Company conducts the management and distribution of mutual funds in Canada under the brand names AGF, Acuity, Elements and Harmony (collectively, AGF Investments).
These condensed consolidated interim financial statements were authorized for issue by the Board of Directors on September 23, 2014.
Note 2: Basis of Preparation These condensed consolidated interim financial statements have been prepared in accordance with International Financial Reporting Standards (IFRS) as issued by the International Accounting Standards Board (IASB) applicable to the preparation of interim financial statements, including International Accounting Standard 34 (IAS 34), Interim Financial Reporting. The accounting policies in these condensed consolidated interim financial statements are consistent with those disclosed in the Company’s annual consolidated financial statements for the year ended November 30, 2013, with the exception of the changes described below. The condensed consolidated interim financial statements should be read in conjunction with the Company’s annual consolidated financial statements for the year ended November 30, 2013, which have been prepared in accordance with IFRS as issued by the IASB.
Note 3: Changes in Accounting Policies
3.1 Adoption of New and Revised Accounting Standards The Company has adopted the following new and revised standards, along with all consequential amendments to other standards, effective December 1, 2013. These changes were adopted in accordance with the applicable transitional provisions of each new or revised standard.
IFRS 7, Financial Instruments: Disclosures, has been amended to address offsetting financial assets and financial liabilities. IFRS 7 requires additional disclosure to allow users of the financial statements to evaluate the effect or potential effect of master netting or other similar arrangements. The Company adopted the amended standard effective December 1, 2013 and will include additional disclosures in the Company’s annual consolidated financial statements.
IFRS 10, Consolidated Financial Statements, introduces a single consolidation model that uses the same criteria to determine control for entities of all types, irrespective of whether the investee is controlled by voting rights or other contractual arrangements. Under IFRS 10, an investee is consolidated only if the investor possesses power over the investee, has exposure to variable returns from its involvement with the investee and has the ability to use its power over the investee to affect its returns. The principle that a consolidated entity presents a parent and its subsidiaries as a single entity remains unchanged, as do the mechanics of consolidation. IFRS 10 supersedes the guidance in IAS 27, Consolidated and Separate Financial Statements, and SIC-12, Consolidation – Special Purpose Entities. The adoption of IFRS 10 did not result in any changes to the entities which are consolidated by the Company.
IFRS 11, Joint Arrangements, establishes principles for financial reporting by parties to a joint arrangement, and only differentiates between joint operations and joint ventures. The option to apply proportionate consolidation when accounting for joint ventures has been removed and equity accounting where the fair value option has not been elected is now applied in accordance with IAS 28, Investments in Associates and Joint Ventures. IFRS 11 supersedes existing guidance under IAS 31, Interests in Joint Ventures, and SIC-13, Jointly Controlled Entities – Non-Monetary Contributions by Venturers. As the Company did not have any interests in joint arrangements at December 1, 2013, there was no impact as a result of the adoption of IFRS 11.
IFRS 13, Fair Value Measurement, provides a single comprehensive framework for measuring fair value. IFRS 13 applies to fair value measurements where required or permitted by other IFRS but does not address when to measure fair value or require additional use of fair value. The measurement of the fair value of an asset or liability is based on assumptions that market participants would use when pricing the asset or liability under current market conditions, including assumptions about risk.
AGF Management Limited Notes to Condensed Consolidated Interim Financial Statements
AGF Management Limited – 30 – Third Quarter Report 2014
The new standard requires disclosures similar to those in IFRS 7, Financial Instruments: Disclosures, but applies to substantially all assets and liabilities measured at fair value, whereas IFRS 7 applies only to financial assets and liabilities measured at fair value. The Company adopted IFRS 13 prospectively on December 1, 2013. The adoption of IFRS 13 did not require any significant adjustments to the valuation techniques used by the Company to measure fair value and did not result in any significant measurement adjustments as at December 1, 2013. Certain interim disclosures under IAS 34, Interim Financial Reporting, related to the fair value of financial instruments have been expanded.
On December 1, 2013, the Company adopted IFRS 12, Disclosures of Interests in Other Entities, which integrates all of the disclosure requirements for interests in subsidiaries, joint arrangements, associates and structured entities into a single standard. The required disclosures provide information to evaluate the nature of, and risks associated with, an entity’s interests in other entities, and the effects of those interests on the entity’s financial statements. The standard is expected to result in additional disclosures in the Company’s annual consolidated financial statements.
Amendments to IAS 19, Employee Benefits, require changes to the recognition and measurement of defined benefit pension, post-retirement benefit expense and termination benefits and to the disclosures for all employee benefits. The Company adopted the amendments to IAS 19 retrospectively, which had no impact on the consolidated financial statements.
IAS 28, Investments in Associates and Joint Ventures, has been amended to be consistent with the changes to accounting for joint arrangements in IFRS 11. The amended standard prescribes the accounting for investments in associates and provides guidance on the application of the equity method when accounting for investments in associates and joint ventures. There was no impact to the Company as a result of the adoption of the amended standard.
3.2 Associates, Joint Ventures and Consolidated Structured Entities Associates are entities over which the Company has significant influence, but not control, generally accompanying between 20% and 50% of the voting rights. Joint ventures are arrangements whereby the parties have joint control over, and rights to the net assets of, the arrangement. Consolidated structured entities are entities over which the Company has control by means of a contractual agreement.
The Company’s interests in associates and joint ventures are generally accounted for using the equity method of accounting. The Company’s investments in associates includes goodwill and other intangible assets identified on acquisition. AGF’s share of its associates’ post-acquisition profits or losses is recognized in the consolidated interim statement of income and its share of post-acquisition other comprehensive income (loss) is recognized in other comprehensive income. The cumulative post-acquisition movements are adjusted against the carrying amount of the investment. When the Company’s share of losses in an associate equals or exceeds its interest in the associate, the Company does not recognize further losses, unless it has incurred obligations or made payments on behalf of the associate.
Unrealized gains on transactions between the Company and its associates are eliminated to the extent of the Company’s interest in the associates. Unrealized losses are also eliminated unless the transaction provides evidence of an impairment of the asset transferred. Associates’ accounting policies have been changed where necessary to ensure consistency with the policies adopted by AGF.
The Company assesses at each period-end whether there is any objective evidence that its interests in associates and joint ventures are impaired. If impaired, the carrying value of the Company’s share of the underlying assets of associates or joint ventures is written down to its estimated recoverable amounts (being the higher of fair value less costs to sell and value in use) and charged to the consolidated interim statement of income.
Additionally, the Company has determined that any interests it holds in funds it manages are associates as a result of the Company’s power conveyed through investment management and other agreements it has with the funds that permit the Company to make decisions about their investing and operating activities. None of these interests are individually significant and the Company has elected to designate its investments in these funds at fair value through profit or loss. These funds conduct their trading activities in Canada and Ireland, which may include trading of foreign denominated securities. The carrying amount of the Company’s interests in investment funds that it manages was $18.3 million at August 31, 2014 (November 30, 2013 – $10.8 million) and the fair value adjustments related to the Company’s interests in investment funds recognized on the consolidated interim statement of income were $0.6 million and $0.8 million for the three and nine months ended August 31, 2014 (2013 – $1.5 million and $2.1 million). Also, AGF’s participation in alternative asset management platform funds are generally designated as fair value through profit or loss.
None of the Company’s interests in associates or joint ventures that are accounted for using the equity method are quoted in active markets. Refer to Note 4 for additional information about the Company’s investments in funds that it manages and about its interests in other associates and joint ventures.
The Company established an employee benefit trust as a consolidated structured entity with the purpose of acquiring the Company’s Class B Non-Voting shares to be delivered to employees upon vesting of their Restricted Share Units (RSUs). Under the contractual agreement, the Company will provide financial support to the trust to fund the purchase of these shares. Refer to Note 3.3 and Note 7 for additional information.

AGF Management Limited Notes to Condensed Consolidated Interim Financial Statements
AGF Management Limited – 31 – Third Quarter Report 2014
3.3 Employee Benefits This note includes only the description of the policies that have changed during 2014 relating to employee benefits. The accounting policies for the Company’s employee benefits in place at November 30, 2013 can be found in the Company’s annual consolidated financial statements for the year ended November 30, 2013.
The Company has an Executive Share Unit Plan for senior employees under which certain employees are granted RSUs of Class B Non-Voting shares. RSUs vest three years from the grant date. On January 30, 2014, the Company amended its plan agreements to require share-based settlement of all RSUs granted to the employees of AGF and its Canadian subsidiaries and communicated this change to affected employees on February 11, 2014. In connection with the amendments, an employee benefit trust was established that is controlled and consolidated by the Company. The purpose of the trust is to acquire Class B Non-Voting shares of the Company in the open market to be delivered to employees upon vesting of their RSUs. Pursuant to the revised plan, the employees of AGF and its Canadian subsidiaries will not have an option to receive cash settlement for their RSUs and consequently, the Company has transferred the liabilities related to these awards from liabilities to equity. Compensation expense and contributed surplus related to these awards is recognized over the remaining vesting period based on the fair value of the Class B Non-Voting shares at the date of the plan change communication to employees and taking into account forfeitures. Going forward, new grants will be expensed over the vesting period based on the fair value of the Class B Non-Voting shares at the date of grant and taking into account forfeitures.
Employees of non-Canadian subsidiaries participating in the plan continue to have the option to receive cash settlement for their RSUs. The compensation expense and the related liability for these awards are recorded equally or graded over the three-year vesting period, taking into account fluctuations in the market price of Class B Non-Voting shares, dividends paid and forfeitures. AGF will redeem all of the participants’ RSUs in cash equal to the value of one Class B Non-Voting share for each RSU.
Note 4: Investments, Investments in Associated Companies and Joint Venture (a) The following table presents a breakdown of investments:
August 31, November 30,(in thousands of Canadian dollars) 2014 2013
Fair value through profit or lossAGF mutual funds and other $ 18,289 $ 10,779 Equity securities 564 509
18,853 11,288
Available for saleEquity securities and term deposits 4,682 679
Loans and receivablesCanadian government debt – Federal 306 305
$ 23,841 $ 12,272 AGF mutual funds and other are primarily composed of seed capital. Equity securities and term deposits are primarily composed of term deposits held by a foreign subsidiary with a maturity date of greater than three months at inception. The investment in Canadian government debt is composed of a fixed-rate Treasury bond with a maturity date within one year and a credit rating of AAA.
(b) The Company holds a 31.6% investment in S&WHL accounted for using the equity method. At August 31, 2014, the carrying value was $94.9 million (November 30, 2013 – $84.9 million). During the three and nine months ended August 31, 2014, the Company recognized earnings of $2.2 million and $8.6 million (2013 – $2.0 million and $6.7 million) and received nil and $1.6 million (2013 – nil and $1.2 million) in dividends from S&WHL.
(c) On December 31, 2013, the Company entered into a shareholder agreement with Instar Group Inc. related to the formation of an alternative asset management platform, InstarAGF Asset Management Inc. (InstarAGF). The Company holds a 50.1% interest in InstarAGF. The Company has agreed to commit $150.0 million under the alternative asset management platform over the next two to three years, subject to certain conditions being achieved. InstarAGF holds a 37.0% interest in Stream Asset Financial Management LP, manager of a midstream oil and gas infrastructure fund. InstarAGF’s interest in the manager is accounted for as a joint venture using the equity method. AGF’s participation in Stream Asset Financial LP (Stream) is designated as fair value through profit or loss. As at August 31, 2014, $16.6 million of the commitment has been funded by the Company. In addition, AGF will advance up to $5.0 million to InstarAGF on an as-needed basis as a working capital loan facility. As at August 31, 2014, the Company has advanced $1.2 million (November 30, 2013 – nil), which was included in

AGF Management Limited Notes to Condensed Consolidated Interim Financial Statements
AGF Management Limited – 32 – Third Quarter Report 2014
accounts receivable, prepaid expenses and other assets on the consolidated interim statement of financial position. During the three and nine months ended August 31, 2014, the Company recognized earnings of $0.6 million and $0.9 million (2013 – nil and nil) and received $0.3 million and $0.7 million (2013 – nil and nil) in distributions.
Note 5: Discontinued Operations On August 1, 2012, the Company completed its sale of 100% of the shares of AGF Trust Company (AGF Trust) for cash consideration corresponding to the net book value of AGF Trust at closing of $246.3 million. The agreement included a contingent consideration to a maximum of $20.0 million over five years if the credit performance of AGF Trust’s loan portfolio met certain thresholds. In May 2014, the Company finalized an early settlement of the contingent consideration receivable for $10.0 million (November 30, 2013 – $6.1 million). As a result, during the nine months ended August 31, 2014, the Company realized a gain on discontinued operations of $3.9 million, or $2.8 million after tax (2013 – nil). The amount receivable was settled on June 4, 2014.
Note 6: Acquisition of Acuity Funds Ltd. and Acuity Investment Management Inc. On February 1, 2011, the Company completed its acquisition of 100% of the shares of Acuity Funds Ltd. and Acuity Investment Management Inc. (Acuity) for a purchase price of $335.5 million.
On February 1, 2014, the Company fully extinguished its acquisition consideration payable to the Acuity vendors with a payment of $6.4 million, consisting of $4.5 million in cash and a settlement of the Class E exchangeable preferred shares through the issuance of 175,367 Class B Non-Voting shares valued at $1.9 million. As part of the consideration paid, 185,119 Class B Non-Voting shares held in escrow were released to the Acuity vendors on February 1, 2014.
During the three and nine months ended August 31, 2014, nil and a $0.3 million recovery (2013 – $0.2 million and $1.0 million in charges) was recognized related to the fair value adjustment on the mark to market related to the AGF Class B Non-Voting shares and interest accretion on the acquisition consideration payable.
Note 7: Capital Stock (a) Authorized Capital
The authorized capital of AGF consists of an unlimited number of AGF Class B Non-Voting shares and an unlimited number of AGF Class A Voting common shares. The Class B Non-Voting shares are listed for trading on the Toronto Stock Exchange (TSX).
(b) Changes During the Period
The change in capital stock is summarized as follows:
Nine months ended(in thousands of Canadian dollars, except share amounts) Shares Stated value Shares Stated value
Class A Voting common shares 57,600 $ – 57,600 $ –
Class B Non-Voting sharesBalance, beginning of the period 87,091,646 $ 524,681 89,057,691 $ 533,684 Issued through dividend reinvestment plan 154,288 1,959 178,341 1,910 Stock options exercised 465,058 4,437 259,450 2,287 Issued on acquisition of Acuity (Note 6) 175,367 1,941 107,138 1,231 Repurchased for cancellation (1,762,200) (10,623) (2,381,965) (14,312)Treasury stock purchased (270,000) (3,300) – – Treasury stock released 3,421 40 – – Balance, end of the period 85,857,580 $ 519,135 87,220,655 $ 524,800
August 31, 2014 August 31, 2013

AGF Management Limited Notes to Condensed Consolidated Interim Financial Statements
AGF Management Limited – 33 – Third Quarter Report 2014
(c) Class B Non-Voting Shares Purchased for Cancellation
AGF has obtained applicable regulatory approval to purchase for cancellation, from time to time, certain of its Class B Non-Voting shares through the facilities of the TSX (or as otherwise permitted by the TSX). AGF relies on an automatic purchase plan during the normal course issuer bid. The automatic purchase plan allows for purchases by AGF of its Class B Non-Voting shares during certain pre-determined black-out periods, subject to certain parameters. Outside of these pre-determined black-out periods, shares will be purchased in accordance with management’s discretion. Under its normal course issuer bid, AGF may purchase up to 10% of the public float outstanding on the date of the receipt of regulatory approval or up to 6,904,647 shares through to February 3, 2015. No shares were repurchased during the three months ended August 31, 2014. During the three months ended August 31, 2013, 873,400 Class B Non-Voting shares were repurchased at a cost of $9.8 million and the excess paid of $4.6 million over the recorded capital stock value of the shares repurchased for cancellation was charged to retained earnings. During the nine months ended August 31, 2014, under AGF’s previous normal course issuer bid, 1,762,200 (2013 – 2,381,965) Class B Non-Voting shares were repurchased at a cost of $22.1 million (2013 – $26.9 million) and the excess paid of $11.5 million (2013 – $12.6 million) over the recorded capital stock value of the shares repurchased for cancellation was charged to retained earnings.
(d) Class B Non-Voting Shares Purchased as Treasury Stock
During the three and nine months ended August 31, 2014, 120,000 and 270,000 (2013 – nil and nil) Class B Non-Voting shares were purchased for future share-based settlement of RSUs granted to the employees of AGF and its Canadian subsidiaries. Shares purchased for the employee benefit trust are also purchased under the Company’s normal course issuer bid and recorded as a reduction to capital stock. During the three and nine months ended August 31, 2014, 2,146 and 3,421 (2013 – nil and nil) Class B Non-Voting shares purchased as treasury stock were released. As at August 31, 2014, 266,579 (November 30, 2013 – nil) Class B Non-Voting shares were held as treasury stock. Refer to Note 3.3 for additional information.
Note 8: Accumulated Other Comprehensive Income (Loss)
Foreign Available currency for sale Cash flow
( in thousands of Canadian dollars) translation securities hedge Total
Opening composition of accumulated other comprehensive income (loss) at November 30, 2012Accumulated other comprehensive income (loss) $ (673) $ 3,265 $ (4,098) $ (1,506)Income tax recovery (expense) – (432) 1,086 654
Balance, November 30, 2012 (673) 2,833 (3,012) (852)
Transactions during the year ended November 30, 2013Other comprehensive income (loss) 7,298 (111) 1,052 8,239 Income tax recovery (expense) – 8 (278) (270)
Balance, November 30, 2013 6,625 2,730 (2,238) 7,117
Transactions during the period ended August 31, 2014Other comprehensive income 3,068 312 577 3,957 Income tax expense – (41) (153) (194)
Balance, August 31, 2014 $ 9,693 $ 3,001 $ (1,814) $ 10,880
All items presented in other comprehensive income (loss) will be reclassif ied to the consolidated statement of income (loss) in subsequent perio
Note 9: Fair Value Adjustments and Other Income (Loss)
(in thousands of Canadian dollars) 2014 2013
Fair value adjustment related to investment in AGF mutual funds (Note 4) $ 572 $ 1,467 Fair value adjustment related to acquisition consideration payable (Note 6) – (337)Interest income 1,284 1,323 Other 22 274
$ 1,878 $ 2,727
Three months ended August 31,

AGF Management Limited Notes to Condensed Consolidated Interim Financial Statements
AGF Management Limited – 34 – Third Quarter Report 2014
(in thousands of Canadian dollars) 2014 2013
Fair value adjustment related to investment in AGF mutual funds (Note 4) $ 787 $ 2,135 Fair value adjustment related to acquisition consideration payable (Note 6) 422 (1,137)Fair value adjustment related to put agreement with non-controlling shareholders – 677 Interest income 3,688 4,623 Other 414 3,746
$ 5,311 $ 10,044
Nine months ended August 31,
During the nine months ended August 31, 2014, the Company recognized nil (2013 − $3.7 million) of one-time other income.
Note 10: Expenses by Nature
(in thousands of Canadian dollars) 2014 2013
Selling, general and administrativeEmployee benef it expense $ 25,618 $ 27,463 Sales and marketing 3,333 2,954 Information technology and facilities 5,989 5,629 Professional fees 3,562 5,133 Fund absorpt ion and other fund costs 4,848 4,247 Other 443 1,782
$ 43,793 $ 47,208
Three months ended August 31,
(in thousands of Canadian dollars) 2014 2013
Selling, general and administrativeEmployee benef it expense $ 78,228 $ 82,118 Sales and marketing 8,816 8,772 Information technology and facilities 17,138 17,134 Professional fees 11,583 13,050 Fund absorpt ion and other fund costs 13,951 14,843 Other 1,153 3,331
$ 130,869 $ 139,248
Nine months ended August 31,
Note 11: Stock-based Compensation and Other Stock-based Payments (a) Stock Option Plans
Under the Company’s stock option plans, an additional maximum of 3,485,897 Class B Non-Voting shares could have been granted as at August 31, 2014 (November 30, 2013 – 4,068,024).
The change in stock options during the nine months ended August 31, 2014 and 2013 is summarized as follows:
Nine months ended August 31, 2014 August 31, 2013 Weighted Weighted
average averageOptions exercise price Options exercise price
Class B Non-Voting share optionsBalance, beginning of the period 4,823,331 $ 14.37 4,933,339 $ 15.33 Options granted 758,250 11.90 649,061 11.38 Options forfeited (26,721) 8.93 (135,829) 24.74 Options expired (149,399) 20.37 – – Options exercised (465,058) 8.75 (165,850) 8.24 Balance, end of the period 4,940,403 $ 14.37 5,280,721 $ 14.85
During the three months ended August 31, 2014, 340,545 (2013 – nil) stock options were granted and compensation expense and contributed surplus of $0.2 million (2013 – $0.4 million) was recorded. During the nine months ended August 31, 2014, 758,250 (2013 – 649,061) stock options were granted and compensation expense and contributed surplus of $0.8 million (2013 – $1.2 million) was recorded. The fair value of options granted during the three months ended

AGF Management Limited Notes to Condensed Consolidated Interim Financial Statements
AGF Management Limited – 35 – Third Quarter Report 2014
August 31, 2014 has been estimated at $1.01 per option (2013 – nil) using the Black-Scholes option-pricing model, while the fair value of the stock options granted during the three months ended February 28, 2014 has been estimated at $1.16 per option. The following assumptions were used to determine the fair value of the options granted during the nine months ended August 31, 2014:
Nine months ended August 31, 2014 August 31, 2013
Risk-free interest rate 1.5% - 1.6% 1.5%Expected dividend yield 8.7% - 9.6% 9.6%Five-year historical-based expected share price volatility 28.1% - 33.3% 41.9%Option term 5.0 years 5.0 years
(b) Other Stock-based Compensation
Other stock-based compensation includes RSUs, Performance Share Units (PSUs), Deferred Share Units (DSUs) and Partners Incentive Plan (PIP). Compensation expense for the three and nine months ended August 31, 2014 related to these share units was $1.4 million and $1.8 million (2013 – $3.2 million and $8.1 million). As at August 31, 2014, the Company recorded a liability of $4.5 million (November 30, 2013 – $16.1 million liability) related to other cash-settled stock-based compensation. As at August 31, 2014, the Company recorded contributed surplus of $8.3 million (November 30, 2013 – nil) related to equity-settled RSUs. During the nine months ended August 31, 2014, $6.0 million of the amount recorded in contributed surplus was transferred from liabilities upon conversion of the RSU plan to an equity-settled plan effective February 11, 2014.
The change in share units of RSUs, PSUs and DSUs during the nine months ended August 31, 2014 and 2013 is as follows:
Nine months ended
Outstanding, beginning of the periodNon-vested 1,311,817 995,683
IssuedInitial grant 556,182 569,101 In lieu of dividends 98,572 103,320
Settled in cash (40,998) (16,200)Settled in equity (3,420) – Forfeited and cancelled (239,166) (23,421)Outstanding, end of the period 1,682,987 1,628,483
August 31, 2014 August 31, 2013Number of share units Number of share units
Note 12: Income Tax Expense Income tax expense is recognized based on management’s best estimate of the weighted average annual income tax rate expected for the full financial year. The estimated effective tax rate related to continuing operations for the nine months ended August 31, 2014 was 25.5% (2013 – 72.9%). During the nine months ended August 31, 2014, the Company recorded tax contingencies of $1.4 million (2013 – $26.7 million) with respect to the Canada Revenue Agency (CRA) transfer pricing audit. Excluding the tax contingencies, the estimated effective tax rate for the nine months ended August 31, 2014 was 23.3% (2013 – 25.5%).
The income tax expense related to income from discontinued operations for the nine months ended August 31, 2014 was $1.0 million.
Refer to Note 17 for additional information on tax contingencies.
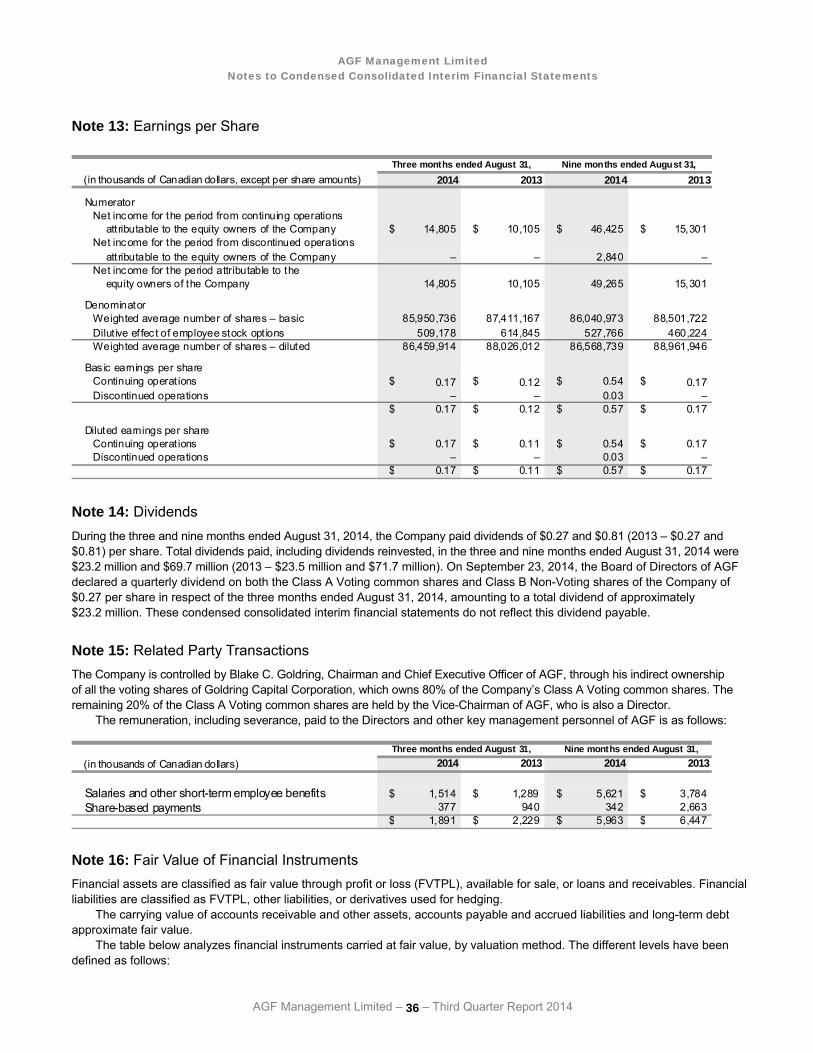
AGF Management Limited Notes to Condensed Consolidated Interim Financial Statements
AGF Management Limited – 36 – Third Quarter Report 2014
Note 13: Earnings per Share
(in thousands of Canadian dollars, except per share amounts) 2014 2013 2014 2013
Numerator Net income for the period from continuing operations
attributable to the equity owners of the Company $ 14,805 $ 10,105 $ 46,425 $ 15,301 Net income for the period from discontinued operations
attributable to the equity owners of the Company – – 2,840 – Net income for the period attributable to the
equity owners of the Company 14,805 10,105 49,265 15,301
Denominator Weighted average number of shares – basic 85,950,736 87,411,167 86,040,973 88,501,722 Dilut ive effec t of employee stock opt ions 509,178 614,845 527,766 460,224 Weighted average number of shares – diluted 86,459,914 88,026,012 86,568,739 88,961,946
Bas ic earnings per shareContinuing operat ions $ 0.17 $ 0.12 $ 0.54 $ 0.17 Discontinued operations – – 0.03 –
$ 0.17 $ 0.12 $ 0.57 $ 0.17
Diluted earnings per shareContinuing operat ions $ 0.17 $ 0.11 $ 0.54 $ 0.17 Discontinued operations – – 0.03 –
$ 0.17 $ 0.11 $ 0.57 $ 0.17
Three months ended August 31, Nine months ended August 31,
Note 14: Dividends During the three and nine months ended August 31, 2014, the Company paid dividends of $0.27 and $0.81 (2013 – $0.27 and $0.81) per share. Total dividends paid, including dividends reinvested, in the three and nine months ended August 31, 2014 were $23.2 million and $69.7 million (2013 – $23.5 million and $71.7 million). On September 23, 2014, the Board of Directors of AGF declared a quarterly dividend on both the Class A Voting common shares and Class B Non-Voting shares of the Company of $0.27 per share in respect of the three months ended August 31, 2014, amounting to a total dividend of approximately $23.2 million. These condensed consolidated interim financial statements do not reflect this dividend payable.
Note 15: Related Party Transactions The Company is controlled by Blake C. Goldring, Chairman and Chief Executive Officer of AGF, through his indirect ownership of all the voting shares of Goldring Capital Corporation, which owns 80% of the Company’s Class A Voting common shares. The remaining 20% of the Class A Voting common shares are held by the Vice-Chairman of AGF, who is also a Director.
The remuneration, including severance, paid to the Directors and other key management personnel of AGF is as follows:
(in thousands of Canadian dollars) 2014 2013 2014 2013
Salaries and other short-term employee benefits $ 1,514 $ 1,289 $ 5,621 $ 3,784 Share-based payments 377 940 342 2,663
$ 1,891 $ 2,229 $ 5,963 $ 6,447
Nine months ended August 31,Three months ended August 31,
Note 16: Fair Value of Financial Instruments Financial assets are classified as fair value through profit or loss (FVTPL), available for sale, or loans and receivables. Financial liabilities are classified as FVTPL, other liabilities, or derivatives used for hedging.
The carrying value of accounts receivable and other assets, accounts payable and accrued liabilities and long-term debt approximate fair value.
The table below analyzes financial instruments carried at fair value, by valuation method. The different levels have been defined as follows:

AGF Management Limited Notes to Condensed Consolidated Interim Financial Statements
AGF Management Limited – 37 – Third Quarter Report 2014
Level 1 Quoted prices (unadjusted) in active markets for identical assets and liabilities,
Level 2 Inputs other than quoted prices included within level 1 that are observable for the asset or liability, either directly (that is, as prices) or indirectly (that is, derived from prices), and
Level 3 Inputs for the asset or liability that are not based on observable market data (that is, unobservable inputs).
The following table presents the Company’s assets and liabilities measured at fair value on a recurring basis as at August 31, 2014:
(in thousands of Canadian dollars)August 31, 2014 Total
AssetsFinancial assets at fair value through profit or loss
Cash and cash equivalents $ 254,294 $ – $ – $ 254,294 AGF mutual funds and other 18,289 – – 18,289 Equity securities 564 – – 564
Available for saleEquity securities and term deposits 4,682 – – 4,682
Loans and receivablesCanadian government debt – Federal – 306 – 306
Total financial assets $ 277,829 $ 306 $ – $ 278,135
Liabil itiesDerivatives used for hedging $ – $ 2,771 $ – $ 2,771 Total financial liabilities $ – $ 2,771 $ – $ 2,771
Level 1 Level 2 Level 3
The fair value of financial instruments traded in active markets is determined using the quoted prices where they represent those at which regularly and recently occurring transactions take place.
Level 1 instruments include listed equity securities on major exchanges, investments in AGF mutual funds, highly liquid temporary deposits with Canadian banks, an Irish bank and non-Irish banks in Ireland, as well as bank term deposits.
Level 2 instruments include derivative instruments with a major Canadian chartered bank and Canadian federal government debt. The fair value of derivatives used to manage interest rate exposure on deposits and long-term debt is calculated through discounting future expected cash flows using the BA-based swap curve. Since the BA-based swap curve is an observable input, these financial instruments are considered level 2.
The following table presents changes in level 3 instruments for the nine months ended August 31, 2014:
(in thousands of Canadian dollars) Acquisition Contingentconsideration consideration
payable receivable Total
Balance at December 1, 2013 $ 6,731 $ 6,107 $ 12,838 Gains and losses recognized in prof it or loss (350) 28 (322)
Gain recognized in prof it or loss as discontinued operations1 – 3,865 3,865 Consideration paid (6,381) – (6,381)Reclassification to accounts receivable – (10,000) (10,000)Balance at August 31, 2014 $ – $ – $ –
1 Before taxes of $1.0 million.
Level 3 instruments included acquisition consideration payable and contingent consideration receivable. Instruments classified in this category had a parameter input or inputs that were unobservable and that had a more than insignificant impact on either the fair value of the instrument or the profit or loss of the instrument.
The acquisition consideration payable was settled on February 1, 2014 and comprised deferred cash payments and Class E exchangeable preferred shares that were subject to an adjustment based on Acuity’s net sales of institutional assets under management between the date of acquisition and the payment or redemption date of these preferred shares. The Class E exchangeable preferred shares were settled by the issuance of a variable number of AGF Class B Non-Voting shares, the number of which was determined by reference to a fixed exchange ratio.
The contingent consideration receivable was determined based on an early settlement agreement with the purchaser for $10.0 million. During the nine months ended August 31, 2014, the contingent consideration receivable was transferred from
AGF Management Limited Notes to Condensed Consolidated Interim Financial Statements
AGF Management Limited – 38 – Third Quarter Report 2014
level 3 to accounts receivable as the amount became fixed and guaranteed upon the signing of the early settlement agreement. The amount was settled on June 4, 2014. Refer to Note 5 for additional information.
There were no transfers into or out of level 1 and level 2 during the three and nine months ended August 31, 2014.
Note 17: Contingencies The Company believes that it has adequately provided for income taxes based on all of the information that is currently available. The calculation of income taxes in many cases, however, requires significant judgement in interpreting tax rules and regulations. The Company’s tax filings are subject to audits, which could materially change the amount of the current and deferred income tax assets and liabilities, and could, in certain circumstances, result in the assessment of interest and penalties.
In November 2013, the Company received a notice of reassessment (NOR) from the CRA relating to the transfer pricing and allocation of income between one of the Company’s Canadian legal entities and a foreign subsidiary, which would increase the Company’s taxes payable from its original tax filings by $10.0 million, $10.5 million and $15.4 million (before the application of any interest and penalties of $21.6 million) for its 2005, 2006 and 2007 fiscal years, respectively. Subsequent to the quarter end, the Company received a proposal letter from the CRA for its 2008 fiscal year in relation to the same matter, which would increase the Company’s taxes payable from its original tax filing by approximately $13.6 million (before the application of any interest and penalties). The basis of the 2008 proposal letter is consistent with the 2005, 2006 and 2007 reassessments on this matter. The amount of tax provision recorded on the consolidated interim statement of financial position has already reflected management’s best estimate on the resolution of this matter and hence no additional change to the tax provision is expected in respect of the 2008 proposal letter.
The Company strongly disagrees with the CRA’s position and filed an objection to the NOR for 2005, 2006 and 2007 in February 2014. The Company will respond to the proposal letter for 2008 received following the quarter and will object to the forthcoming reassessment with which it does not agree. In connection with the filing of an objection to the NOR for the 2005, 2006 and 2007 fiscal years, the Company was required to pay, and has paid, approximately $39.5 million (including interest and penalties) during the nine months ended August 31, 2014, even though the ultimate outcome may differ from this amount.
In consultation with its external advisors, the Company believes that its tax filing positions continue to be reasonable based on its transfer pricing methodology and the Company is contesting the CRA’s position and any related transfer pricing penalty. The Company believes it is likely that the CRA will reassess its taxes for subsequent years on a similar basis and that these may result in future cash payments on receipt of the reassessments. Upon receipt of the 2008 reassessment, when the Company objects to this reassessment, it will be required to pay 50% of the federal amount reassessed even though the ultimate outcome may differ from the amount reassessed. The amount of tax provision recorded on the consolidated interim statement of financial position reflects management’s best estimate of the final payment to be made on the ultimate resolution of this matter and includes any related estimated interest and penalties for the 2005 to 2014 fiscal years. The final result of the audit and appeals process may vary and may be materially different compared to the estimates and assumptions used by management in determining the Company’s consolidated income tax provision and in valuing its income tax assets and liabilities.
Further to the Company’s objection to the NOR, the Company is also seeking Competent Authority relief from double taxation under the applicable tax treaty.
The Company has been accepted by the CRA into a Bilateral Advance Pricing Arrangement (BAPA) between Canada and the relevant tax authorities to establish the appropriate transfer pricing methodologies for the tax years 2009 through 2016. This report contains forward-looking statements with respect to AGF, including its business operations, strategy, financial performance and condition. Although management believes that the expectations reflected in such forward-looking statements are reasonable, such statements involve risks and uncertainties. Actual results may differ materially from those expressed or implied by such forward-looking statements. Factors that could cause results to differ materially include, among other things, general economic and market factors including interest rates, business competition, changes in government regulations or in tax laws, and other factors discussed in materials filed with applicable securities regulatory authorities from time to time.