aging, social security reform and factor price in a...
TRANSCRIPT
IntroductionModel and Calibration
Main Results
Aging, Social Security Reform and Factor Price ina Transition Economy
Tomoaki Yamada
Rissho University
2, December 2007
Tomoaki Yamada (Rissho Univ.) The 9th Macroeconomics Conference at Keio University

IntroductionModel and Calibration
Main Results
MotivationObjectivesMain Results
Introduction: Motivation
Rapid aging of the population combined with the diminisingnumber of children
Tax burden and intergenerational inequalitySource of �nance
Macroeconomic perspective:
GDP growth rateAggregate capital and laborFactor prices (not obvious)
Microeconomic perspective:
Intragenerational and intergenerational heterogeneityRedistribution, insurance and distortion of social securityIdiosyncratic income risk
Tomoaki Yamada (Rissho Univ.) The 9th Macroeconomics Conference at Keio University
IntroductionModel and Calibration
Main Results
MotivationObjectivesMain Results
Objectives
A transition path in Japan from 2000 to 2200
Dynamic stochastic general equilibriumStationary equilibrium and transitionQuantitative analysis [positive and normative]
Heterogeneity
intergeneratinalintra-cohort
Four social security reforms)Equilibrium path and welfare
Reduction of the replacement rate by halfFull privatizationFinance by capital income taxFinance by consumption tax
Tomoaki Yamada (Rissho Univ.) The 9th Macroeconomics Conference at Keio University

IntroductionModel and Calibration
Main Results
MotivationObjectivesMain Results
Main Results (1)
There is more capital deepening [Benchmark]
The equilibrium wage increases by 6%The interest rate decreases by 1.5%Output per capita decreases by 20% because of the decrease inthe aggregate capital and labor supplyWelfare measured by expected value declines for 50 years
Reduction of the replacement rate by half moderatesintergenerational inequality
Tomoaki Yamada (Rissho Univ.) The 9th Macroeconomics Conference at Keio University

IntroductionModel and Calibration
Main Results
MotivationObjectivesMain Results
Main Results (2)
Introduction of consumption tax may not improve welfare
No distortion, but...(i) Redistribution and insurance e¤ect of social security decline(payroll tax)(ii) Opportunity: labor supply, borrowing constraint andsubstitution e¤ect
Introducing capital income tax improves welfare of young andfuture generations
Redistribution and insurance e¤ect
Tomoaki Yamada (Rissho Univ.) The 9th Macroeconomics Conference at Keio University

IntroductionModel and Calibration
Main Results
An Overlapping Generations ModelPolicy ExperimentsCalibration
A Model
A stochastic overlapping generations model with
Idiosyncratic income uncertaintyIntergenerational and intragenerational heterogeneityEndogenous labor supplyPay-as-you-go social security system and payroll taxRedistribution e¤ect of social securityCompute transition path
Tomoaki Yamada (Rissho Univ.) The 9th Macroeconomics Conference at Keio University
IntroductionModel and Calibration
Main Results
An Overlapping Generations ModelPolicy ExperimentsCalibration
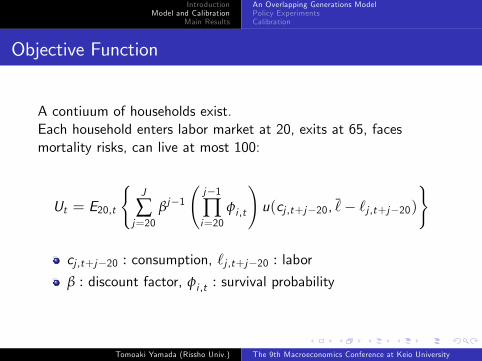
Objective Function
A contiuum of households exist.Each household enters labor market at 20, exits at 65, facesmortality risks, can live at most 100:
Ut = E20,t
(J
∑j=20
βj�1 j�1∏i=20
φi ,t
!u(cj ,t+j�20, ¯̀ � `j ,t+j�20)
)
cj ,t+j�20 : consumption, `j ,t+j�20 : laborβ : discount factor, φi ,t : survival probability
Tomoaki Yamada (Rissho Univ.) The 9th Macroeconomics Conference at Keio University

IntroductionModel and Calibration
Main Results
An Overlapping Generations ModelPolicy ExperimentsCalibration
Budget Constraint
Employee:
(1+ τct )cj ,t + aj+1,t+1 � yj ,t + (1+ (1� τat )rt/φj ,t�1)aj ,t ,
yj ,t = (1� τsst )wtηjej `j ,t .
aj ,t : asset holding, yj ,t : labor income, τt : each taxηj : average productivityrt : interest rate, wt : economy-wide wageomit uncertainty about long-living [private annuity market]
Retiree:
(1+ τct )cj ,t + aj+1,t+1 � wtb(τsst ,Wg ,t )+ (1+(1� τat )rt/φj ,t�1)aj ,t ,
b(τsst ,Wg ,t ) : replacement rate, Wg ,t : trust fund
Tomoaki Yamada (Rissho Univ.) The 9th Macroeconomics Conference at Keio University

IntroductionModel and Calibration
Main Results
An Overlapping Generations ModelPolicy ExperimentsCalibration
Earnings Risk
Three components of income shocks
Fixed e¤ectPersistent shockTransitory shock
Match the variance pro�le of log-earnings
Figure 1
Tomoaki Yamada (Rissho Univ.) The 9th Macroeconomics Conference at Keio University

Figure 1: Variance Profiles
0.00
0.05
0.10
0.15
0.20
0.25
0.30
20 25 30 35 40 45 50 55 60
cros
s cec
tiona
l var
ianc
e
age
Variance of Logarithm of Consumption Profile
data simulation
0.00 0.05 0.10 0.15 0.20 0.25 0.30 0.35 0.40
20 25 30 35 40 45 50 55 60
cros
s cec
tiona
l Var
ianc
e
age
Variance of Logarithm of Income Profile
data simulation

IntroductionModel and Calibration
Main Results
An Overlapping Generations ModelPolicy ExperimentsCalibration
Behavior of Firms
Production function
Yt = AtK θt L1�θt ,
Aggregation
Kt =J
∑j=20
µj ,t
Zaj ,tdΦt (aj , ej ) +Wg ,t ,
Lt =jr
∑j=20
µj ,t
Zηjej `j ,tdΦt (aj , ej ) .
Φt (aj , ej ) : distribution functionµt : the population distribution in period t
Factor prices
rt = θAt (Kt/Lt )θ�1 � δ, wt = (1� θ)At (Kt/Lt )
θ ,
Tomoaki Yamada (Rissho Univ.) The 9th Macroeconomics Conference at Keio University

IntroductionModel and Calibration
Main Results
An Overlapping Generations ModelPolicy ExperimentsCalibration
PAYG Social Security System
The government�s budget constraint
Wg ,t+1 = (1+ rt )Wg ,t + (T SSt + TCt + TAt )� Bt ,
Revenue and Bene�ts
T SSt : payroll tax
TCt : consumption tax
TAt : capital income taxBt : social security bene�t
Tomoaki Yamada (Rissho Univ.) The 9th Macroeconomics Conference at Keio University

IntroductionModel and Calibration
Main Results
An Overlapping Generations ModelPolicy ExperimentsCalibration
De�nition of Recursive Competitive Equilibrium
Recursive Competitive Equilibrium consists of
Household�s optimalityFirm�s optimalityMarket clearingGovernment�s budgetTransition law of motion
Detrend by population growth rate and TFP growth rate
Tomoaki Yamada (Rissho Univ.) The 9th Macroeconomics Conference at Keio University

IntroductionModel and Calibration
Main Results
An Overlapping Generations ModelPolicy ExperimentsCalibration
Four Policy Experiments
A Benchmark:
use medium variant of the population projection by theNational Institute of Population and Social Security ResearchThe replacement rate is targeted at 50%
1 Social security reform I: reduction of the replacement rate byhalf for 50 years
2 Social security reform II: (almost) full privatization for 50 years3 The other source of �nance I: capital income tax set at 30%(2001)
4 The other source of �nance II: consumption tax set at 5%(2001)
Tomoaki Yamada (Rissho Univ.) The 9th Macroeconomics Conference at Keio University

IntroductionModel and Calibration
Main Results
An Overlapping Generations ModelPolicy ExperimentsCalibration
Calibration: Fundamental Parameters
Set initial stationary state in 2000
Survival probability from Life Table (NIPSSR)
Instantaneous utility function
u�cj ,t , ¯̀ � `j ,t
�=
hcσj ,t (
¯̀ � `j ,t )1�σi1�γ
1� γ.
β = 0.985, γ = 2, σ = 0.38
Replacement rate:
50% of average earnings
Production parameters
θ = 0.312, δ = 0.089, A11�θt+1/A
11�θt = 1.01(8t)
Tomoaki Yamada (Rissho Univ.) The 9th Macroeconomics Conference at Keio University

IntroductionModel and Calibration
Main Results
An Overlapping Generations ModelPolicy ExperimentsCalibration
Demographic Structure
We consider the transition path from 2000 to 2200.
Use the NIPSSR(2002)�s projection
from 2001 to 2050
Three variants of projection
Medium variant [Benchmark]High variantLow variant
Converge to zero population growth (new stationary state)
population distribution converges to stationary state in 2160
Tomoaki Yamada (Rissho Univ.) The 9th Macroeconomics Conference at Keio University

0.0 0.1 0.2 0.3 0.4 0.5 0.6 0.7
2000 2020 2040 2060 2080 2100 2120 2140 2160 2180 2200
popu
latio
n
year
(b) Population Dynamics: Low Variant
0
500
1000
1500
2000
2500
popu
latio
n (1
,000
)
(a) Population Distribution in 2000
Figure 2: Population Dynamics in Japan
0.0 0.1 0.2 0.3 0.4 0.5 0.6 0.7
2000 2020 2040 2060 2080 2100 2120 2140 2160 2180 2200
popu
latio
n
year
(c) Population Dynamics: Medium Variant
0-19 20-65 66-100
year
0-19 20-65 66-100
0.0 0.1 0.2 0.3 0.4 0.5 0.6 0.7
2000 2020 2040 2060 2080 2100 2120 2140 2160 2180 2200
popu
latio
n
year
(d)Population Dynamics: High Variant
0-19 20-65 66-100
0 10 20 30 40 50 60 70 80 90 100 age

IntroductionModel and Calibration
Main Results
Stationary State AnalysisTransition Paths and WelfareConclusion
Main Results: Stationary State
Macroeconomic variables in 2000 as targets
K/Y = 2.42, r + 4.0%SS in 2000 ) SS in 2200
K/Y increases by 3.11%the interest rate decreases by 39 basis points
Benchmark ) Capital Income Tax by 30%
remaining payroll tax rate+ 5%labor supply increasesch(L) 6=ch(H)
Benchmark ) Consumption Tax by 5%
remaining payroll tax rate+ 5%labor supply decreases
Tomoaki Yamada (Rissho Univ.) The 9th Macroeconomics Conference at Keio University

IntroductionModel and Calibration
Main Results
Stationary State AnalysisTransition Paths and WelfareConclusion
Stationary Equilibrium (Table 3&4)
Medium Rep. Rate Tax Reform YearVariant 25% 0.1% cons. cap. 2200
K/Y 2.42 2.63 3.03 2.45 2.24 2.49ch(K/Y ): % � 8.72 25.53 1.54 -7.49 3.11r (%) 4.01 2.97 1.38 3.81 5.05 3.62w 1.03 1.07 1.14 1.03 0.99 1.04τss (%) 10.17 5.09 0.02 4.99 5.25 14.04K/N 3.50 4.10 5.36 3.58 3.14 3.32L/N 0.97 1.01 1.07 0.97 0.97 0.88ch(L/N): % � 3.78 9.97 0.09 0.52 -9.31ch(hours): % � 4.35 11.52 -0.04 0.74 1.31Y /N 1.45 1.56 1.76 1.46 1.40 1.33
Tomoaki Yamada (Rissho Univ.) The 9th Macroeconomics Conference at Keio University

IntroductionModel and Calibration
Main Results
Stationary State AnalysisTransition Paths and WelfareConclusion
Stationary Equilibrium (Table 3)
Medium Rep. Rate Tax ReformVariant 25% 0.1% cons. cap.
Gini (20-100) 0.596 0.590 0.583 0.605 0.611Gini (30-65) 0.531 0.549 0.565 0.543 0.548Gini (20s) 0.586 0.591 0.605 0.643 0.588Gini (30s) 0.589 0.586 0.589 0.634 0.580Gini (40s) 0.393 0.420 0.443 0.409 0.424Gini (50s) 0.263 0.254 0.232 0.267 0.276Gini (60s) 0.303 0.238 0.171 0.302 0.314
Tomoaki Yamada (Rissho Univ.) The 9th Macroeconomics Conference at Keio University
IntroductionModel and Calibration
Main Results
Stationary State AnalysisTransition Paths and WelfareConclusion
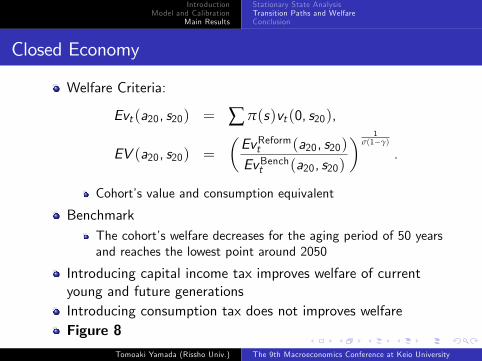
Closed Economy
Welfare Criteria:
Evt (a20, s20) = ∑ π(s)vt (0, s20),
EV (a20, s20) =
�EvReformt (a20, s20)EvBencht (a20, s20)
� 1σ(1�γ)
.
Cohort�s value and consumption equivalent
BenchmarkThe cohort�s welfare decreases for the aging period of 50 yearsand reaches the lowest point around 2050
Introducing capital income tax improves welfare of currentyoung and future generationsIntroducing consumption tax does not improves welfareFigure 8
Tomoaki Yamada (Rissho Univ.) The 9th Macroeconomics Conference at Keio University

-26.50
-26.00
-25.50
-25.00
-24.50
-24.00
-23.50
-23.00 1950 1960 1970 1980 1990 2000 2010 2020 2030 2040 2050 2060 2070 2080 2090 2100
expe
cted
val
ue
year
Figure 8: Welfare Comparison (Cohort at Age 20)
benchmark ss reform I ss reform II cap. tax con. tax

1.05
1.10
1.15
1.20
Figure 8: Welfare Comparison (EV)
0.80
0.85
0.90
0.95
1.00
1950 1970 1990 2010 2030 2050 2070 2090
EV
year
benchmark ss reform I ss reform II cap. tax con. tax

IntroductionModel and Calibration
Main Results
Stationary State AnalysisTransition Paths and WelfareConclusion
Small Open Economy
Lessons from Attanasio, Kitao, and Violante (2007)
Equilibrium payroll tax rate does not change so muchWelfare implication changes
Introducing capital income tax improves welfare more
Figure 9
Tomoaki Yamada (Rissho Univ.) The 9th Macroeconomics Conference at Keio University

-26.00
-25.50
-25.00
-24.50
-24.00
-23.50 1950 1960 1970 1980 1990 2000 2010 2020 2030 2040 2050 2060 2070 2080 2090 2100
expe
cted
val
ue
year
Figure 9: Welfare Comparison (Cohort at Age 20)
benchmark ss reform I ss reform II cap. tax con. tax

0.80
0.85
0.90
0.95
1.00
1.05
1.10
1.15
1.20
1950 1970 1990 2010 2030 2050 2070 2090
EV
year
Figure 9: Welfare Comparison (EV)
benchmark ss reform I ss reform II cap. tax con. tax

IntroductionModel and Calibration
Main Results
Stationary State AnalysisTransition Paths and WelfareConclusion
What causes the di¤erences?
Consumption tax improves welfare:
e.g. Tachibanaki et al. (2006)Intragenerational heterogeneityBorrowing constraint
Introducing consumption tax does not necessarily improvewelfare of the economy: Nishiyama and Smetters (2005,JPE)
with/without intragenerational heterogeneityredistribution and insurance e¤ect of social security system
Insurance or Opportunity?: Heathcote, Storesletten, andViolante (2005,JME)
The social security o¤ers insurance for life-time incomeConcentration of labor supply at high productivity (covarianceof hourly wage and work hours)
Tomoaki Yamada (Rissho Univ.) The 9th Macroeconomics Conference at Keio University

IntroductionModel and Calibration
Main Results
Stationary State AnalysisTransition Paths and WelfareConclusion
A Benchmark Case, SSR I & II
A Benchmark Case
The equilibrium interest rate decreaseThe equilibrium wage increase up to 5%The payroll tax rate increases up to 18%Output per capita decreases by 20%
SSR I (Reduction by Half)
The wage level increases by 10%The payroll tax rate does not exceed 12%Output per capita is �atter than in the benchmark case
SSR II (Full Privatization)
The real return on capital becomes negativeThe equilibrium wage rises over 20%
Tomoaki Yamada (Rissho Univ.) The 9th Macroeconomics Conference at Keio University

0.97 0.98 0.99 1.00 1.01 1.02 1.03 1.04 1.05 1.06
0.0%0.5%1.0%1.5%2.0%2.5%3.0%3.5%4.0%4.5%
2000 2020 2040 2060 2080
wag
e
inte
rest
rate
year
Factor Prices
0%
5%
10%
15%
20%
25%
0%
10%
20%
30%
40%
50%
60%
2000 2020 2040 2060 2080
payr
oll t
ax ra
te
repl
acem
ent r
ate
year
Social Security System
Figure 3: Benchmark Case (Medium Variant)
interest rate wage
0.6
0.7
0.8
0.9
1.0
1.1
1.2
0.75
0.80
0.85
0.90
0.95
1.00
1.05
2000 2020 2040 2060 2080
labo
r (L/
N)
capi
tal (
K/N
)
year
Capital and Labor: Population Adjusted (K, L)
capital labor
replacement rate payroll tax rate
0.6
0.7
0.8
0.9
1.0
1.1
1.2
2000 2020 2040 2060 2080
outp
ut
year
Output Per Capita

0.94 0.96 0.98 1.00 1.02 1.04 1.06 1.08 1.10 1.12
0.0%0.5%1.0%1.5%2.0%2.5%3.0%3.5%4.0%4.5%
2000 2020 2040 2060 2080
wag
e
inte
rest
rate
year
Factor Prices
0%
5%
10%
15%
20%
25%
0%
10%
20%
30%
40%
50%
60%
2000 2020 2040 2060 2080
payr
oll t
ax ra
te
repl
acem
ent r
ate
year
Social Security System
Figure 4: Social Security Reform I (25%)
interest rate wage
0.6
0.7
0.8
0.9
1.0
1.1
1.2
0.90
0.95
1.00
1.05
1.10
1.15
1.20
2000 2020 2040 2060 2080
labo
r (L/
N)
capi
tal (
K/N
)
year
Capital and Labor: Population Adjusted (K, L)
capital labor
replacement rate payroll tax rate
0.6
0.7
0.8
0.9
1.0
1.1
1.2
2000 2020 2040 2060 2080
outp
ut
year
Output Per Capita

0.90
0.95
1.00
1.05
1.10
1.15
1.20
1.25
-0.5%0.0%0.5%1.0%1.5%2.0%2.5%3.0%3.5%4.0%4.5%
2000 2020 2040 2060 2080
wag
e
inte
rest
rate
year
Factor Prices
0%
5%
10%
15%
20%
25%
0%
10%
20%
30%
40%
50%
60%
2000 2020 2040 2060 2080
payr
oll t
ax ra
te
repl
acem
ent r
ate
year
Social Security System
Figure 5: Social Security Reform II (0.1%)
interest rate wage
0.6
0.7
0.8
0.9
1.0
1.1
1.2
0.0 0.2 0.4 0.6 0.8 1.0 1.2 1.4 1.6 1.8
2000 2020 2040 2060 2080
labo
r (L/
N)
capi
tal (
K/N
)
year
Capital and Labor: Population Adjusted (K, L)
capital labor
replacement rate payroll tax rate
0.6
0.7
0.8
0.9
1.0
1.1
1.2
2000 2020 2040 2060 2080
outp
ut
year
Output Per Capita

IntroductionModel and Calibration
Main Results
Stationary State AnalysisTransition Paths and WelfareConclusion
Capital Income Tax and Consumption Tax
Capital Income Tax
Dynamic ine¢ ciency?(Abel, et al. (1989)Over-accumulation with precautionary saving?(Aiyagari(1995)Labor supply incentive?(Conesa and Krueger (2006)The maximum payroll tax rate does not exceed 16%Relatively small e¤ect on the factor prices pathPer capita output is large relative to the benchmark case
Consumption Tax
Factor price pathes are similar to the benchmark caseThe maximum payroll tax does not exceed 14%
Tomoaki Yamada (Rissho Univ.) The 9th Macroeconomics Conference at Keio University

0.97 0.98 0.99 1.00 1.01 1.02 1.03 1.04 1.05 1.06
0.0%0.5%1.0%1.5%2.0%2.5%3.0%3.5%4.0%4.5%
2000 2020 2040 2060 2080
wag
e
inte
rest
rate
year
Factor Prices
0%
5%
10%
15%
20%
25%
0%
10%
20%
30%
40%
50%
60%
2000 2020 2040 2060 2080
payr
oll t
ax ra
te
repl
acem
ent r
ate
year
Social Security System
Figure 6: Capital Income Tax
interest rate wage
0.6
0.7
0.8
0.9
1.0
1.1
1.2
0.75
0.80
0.85
0.90
0.95
1.00
1.05
2000 2020 2040 2060 2080
labo
r (L/
N)
capi
tal (
K/N
)
year
Capital and Labor: Population Adjusted (K, L)
capital labor
replacement rate payroll tax rate
0.60
0.70
0.80
0.90
1.00
1.10
1.20
2000 2020 2040 2060 2080
outp
ut
year
Output Per Capita

0.97 0.98 0.99 1.00 1.01 1.02 1.03 1.04 1.05 1.06
0.0%0.5%1.0%1.5%2.0%2.5%3.0%3.5%4.0%4.5%
2000 2020 2040 2060 2080
wag
e
inte
rest
rate
year
Factor Prices
0%
5%
10%
15%
20%
25%
0%
10%
20%
30%
40%
50%
60%
2000 2020 2040 2060 2080
payr
oll t
ax ra
te
repl
acem
ent r
ate
year
Social Security System
Figure 7: Consumption Tax
interest rate wage
0.6
0.7
0.8
0.9
1.0
1.1
1.2
0.75
0.80
0.85
0.90
0.95
1.00
1.05
2000 2020 2040 2060 2080
labo
r (L/
N)
capi
tal (
K/N
)
year
Capital and Labor: Population Adjusted (K, L)
capital labor
replacement rate payroll tax rate
0.60
0.70
0.80
0.90
1.00
1.10
1.20
2000 2020 2040 2060 2080
outp
ut
year
Output Per Capita
IntroductionModel and Calibration
Main Results
Stationary State AnalysisTransition Paths and WelfareConclusion
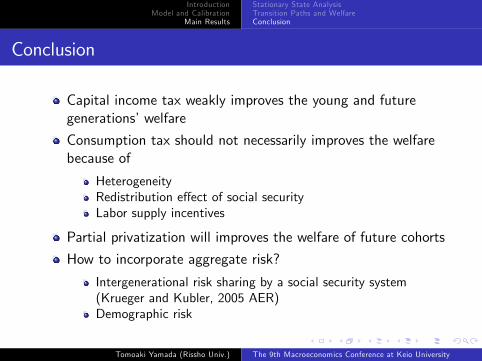
Conclusion
Capital income tax weakly improves the young and futuregenerations�welfare
Consumption tax should not necessarily improves the welfarebecause of
HeterogeneityRedistribution e¤ect of social securityLabor supply incentives
Partial privatization will improves the welfare of future cohorts
How to incorporate aggregate risk?
Intergenerational risk sharing by a social security system(Krueger and Kubler, 2005 AER)Demographic risk
Tomoaki Yamada (Rissho Univ.) The 9th Macroeconomics Conference at Keio University