agribusiness monthly march 2020 - rabobank-au
TRANSCRIPT

RaboResearch Food & Agribusiness 5 March 2020
Australia
Agribusiness Monthly March 2020

Grains & OilseedContinued export demand and falling global stocks outside of China support our view that international prices will now trade ten percent higher year on year in 2020.
Dairy Weakness in dairy markets’ pricing set to continue in the near term.
Beef Favourable seasons and strong producer demand will continue to support domestic livestock prices.
Sheepmeat Unseasonably high prices put pressure on the system.
Sugar Positive prospects for both cane growth and prices into the 2020 season.
Cotton Rainfall bolsters 2020/21 crop outlook, as virus concerns hit global markets.
Wool Wool prices level out, but uncertainty continues.
WineRabobank expects the US to be a more difficult market to grow both share of volume and price in 2020 than in previous years.
HorticultureRabobank expects coronavirus to bring softer export prices for key Australian fresh produce exports in the first half of 2020.
Farm InputsDue changes in the Chinese agrochemical supply chain, summer rain at home, and now, coronavirus, we consider it vital that farmers ensure they have adequate stocks for the upcoming winter crop.
FX Australian dollar smashed by coronavirus, but further downside exists.
Oil We expect that oil prices will remain under pressure, as a result diminished demand related to COVID-19.
Commodity outlook

Rural Commodities
Global equities crash, Australian rural commodity prices surgeWhile global stock markets lost around 10 percent in February as investors awakened to the risk of a global pandemic, the prices of Australian rural commodities surged by 10 percent (on a weighted-index basis).
There are four main reasons for such a counter-intuitive rally:
1. Re-stocking following long-awaited rainfall across the east coast of Australia has driven up demand for young livestock, pushing the EYCI and ESTLI up by 24 percent and 16 percent, respectively, since the start of the year (see our beef and sheep sections).
2. A sharp devaluation of the Australian dollar against the US dollar through February has exerted positive pressure on the price of any commodity in local currency terms (see our FX section).
3. Prices of ag commodities in US dollar terms have so far proved surprisingly resilient to the prospect of a sharp slowdown in Chinese and global growth (and in eating out in key markets).
4. The global sugar market has also rallied since the start of the year (see our sugar section).
The rally of Australian ag commodities in the face of global panic highlights a long-noted strength of the sector – the Australian dollar tends to offer an ‘automatic stabilizer’ in times of global booms and busts, somewhat softening the impact of global commodity price movements in local terms.
But we urge caution before assuming farmgate prices are immune to coronavirus. The spread of the virus may worsen, and lags in supply chain signals may mean the virus’s impacts are still to come.
What to watch
• The risk of getting caught between high farmgate prices and falling world markets – Current farmgate prices of most Australian ag commodities appear to assume that world markets for those products will hold firm in the coming months. Farmers, processors, and traders should at least consider the risk that the coronavirus situation will get worse before it gets better, and what that would mean for margins on things they buy today to sell in what may be quite a different market in the coming months.

70
90
110
130
150
170
190
Sep
-09
Feb
-10
Jul-1
0
Dec
-10
May
-11
Oct
-11
Mar
-12
Au
g-1
2
Jan
-13
Jun
-13
No
v-13
Ap
r-14
Sep
-14
Feb
-15
Jul-1
5
Dec
-15
May
-16
Oct
-16
Mar
-17
Au
g-1
7
Jan
-18
Jun
-18
No
v-18
Ap
r-19
Sep
-19
Feb
-20
com
mo
dit
y in
dex
(Sep
200
9 =
100
)
Source: Rabobank 2020 Note: Includes wheat, barley, canola, sorghum, beef, lamb, milk, cotton, wool, and sugar. To calculate the index, prices are weighted according to the value
share of the commodity in Australian production in any year. Prices are in Australian dollar terms.
Australian rural commodity prices surged 10 percent in February
Rabobank Australian Rural Commodity Index

Coronavirus
We haven’t felt all the impacts yetThe impacts of coronavirus (Covid-19) on Australian F&A to date have related to containment efforts in China.
The Australian F&A industry is heavily exposed to China. In 2018/19, 28 percent of sector exports by value were destined for this market. Rabobank estimates that around a third of these products are transported by refrigerated containers, and around 45 percent of all sales are into the Chinese foodservice industry.
China’s efforts to contain the virus have impacted Australian F&A exporters. Enforced holiday extensions and road blocks made it harder and slower to transport products to market – flowing through to a build-up of containers waiting to be unloaded in Chinese ports (and shortages of plugs to cool refrigerated containers). A combination of government restrictions and consumer fears also led to a sharp reduction in eating out. As of late January, Yum Brands (owner of Pizza Hut and KFC) had closed 30 percent of all stores in China and was experiencing a 40 percent to 50 percent reduction in sales at its remaining outlets.
Secondary markets exist for Australian products outside of China, but usually they pay less.
In the last week of February, available data and anecdotal evidence suggested that logistics were improving in China. Workers in many regions were being encouraged to return to work, and port operation was widely reported to have improved. Internal transport is likely to take months to normalize, but the bottleneck on the transportation of Australian F&A products is starting to loosen.
The regeneration of the Chinese foodservice sector will likely take longer. If official data is accurate, new infections in China had slowed to a trickle by early March. But even if that holds, consumers will likely only slowly regain confidence in congregating in public places in the coming months.
Any reacceleration of infection rates in China would set this recovery back significantly.
What to watch
• Evidence of foodservice recovery. Official data on Chinese retail and foodservice sales will not be available until late March (when the government will report January and February data combined). Until then, we are looking for company statements on the reopening of stores and improvement in sales and anecdotal evidence that store traffic is building. To date, we see little of this.

Coronavirus
A pandemic changes the equationIn late February, coronavirus (Covid-19) made its first appearance in a wide range of countries and gained a significant foothold in South Korea, Iran, and Italy.
The impacts of a pandemic (i.e. if the virus becomes widespread in many countries) on Australian F&A would come via several channels:
1. Reduction in foodservice sales. The dearth of traffic in Australia’s Chinatown restaurants shows that it doesn’t take government restrictions to keep people at home if they fear infection.
2. Logistical disruption. This would likely be less acute outside China (where the government was able to extend what was already a national holiday and has more appetite for intervention).
3. If it gets bad enough, eventually reduced income. A pandemic lasting at least six months would have significant impacts on economic activity and thus consumer wealth, income, and spending. In wealthier countries, people will still eat, but they would spend less on premium food and beverages.
Clearly, the impacts will be worse if coronavirus gains a foothold in Australia’s next most import export markets and globally important economies, Japan and the US, or in Australia itself.
The net impact of coronavirus would also depend on how China fares. If the virus is contained in China, the Australian F&A industry would be better placed to weather the storm of its spread to other markets.
The Australian F&A industry is likely to be afforded some offset to the virus’s spread via exchange rates. The worse the virus gets, the lower the Australian dollar will fall. Moreover, other market developments may help reduce the impact of the virus on some commodities. But the industry cannot hope to avoid lower pricing and a slowdown in sales if a pandemic ensues.
What to watch
• Containment efforts. Under anything but a worst-case scenario, the major impact of coronavirus on the Australian F&A industry will be via containment efforts (e.g. government restrictions on people’s movements or consumers’ self-imposed restrictions on dining out) rather than from the damage of the virus itself. How the governments and consumers respond in South Korea and Japan in the coming month will be important to the vibrancy of product sales into these markets.

Grains & Oilseeds
What to Watch• Ag Chemical – Supply chain disruption in China, including widespread closure of factories, may delay supplies
of crop chemicals. With ‘drought’-driven lower stocks on hand in Australia, coronavirus supply chain delays, and a softer dollar, higher prices and/or delayed supply may be a feature as winter crop planting season 2020 opens.
• Rabi pulse harvest for the subcontinent region is almost upon us. Expectations place the pulse Indian harvest volume up YOY but down on 2016/17 and 2017/18 and, importantly, below the government target. This shortfall relative to the government target, plus some tightening of stocks outside of India, should support pulse prices in 2020.
Still in search of the game changerCoronavirus is delivering volatility, as markets react to daily updates of the virus’s spread. Despite it also delivering some demand softening over the year, we remain bullish on global wheat prices. Continued export demand and falling global stocks outside of China support our view that international prices will trade 10 percent higher year on year in 2020. Summer rainfall and a favourable three-month rainfall forecast has lifted local production hopes, but the realisation of widespread rainfall between now and May remains critical for the ‘drought’ game to be changed.
Unlike agricultural goods that feature prominently in Chinese foodservice consumption, such as beef, wine, and rock lobster, the direct impact of measures to manage coronavirus in China on grain markets has been limited. Uncertainty in global markets generally has, however, translated to volatility for global grains markets. CBOT Wheat lost 4.5 percent during February and traded over a USc 40/bu range on its way down.
Despite ending the month at USc 525/bu, we expect CBOT Wheat to trade near USc 550/bu out to Q1 2021. This is due to our expectation that continued drawdown of Black Sea and US stocks, combined with lower European and US new crop wheat supply, will offset the forecast YOY increases in Russian and Ukrainian grain wheat supply. Across the eastern European and Black Sea regions, good rainfall throughout spring will be needed to reach current production forecasts after what has been one of the warmest winters on record. However, good rainfall in the current two-week forecast for the region is expected to kick any dryness concerns down the road for now.
February delivered the best rainfall in three years to some parts of the Australian cropping belt. This rain has prompted the planting of some additional summer crops (sorghum and mung beans primarily) in northern NSW and QLD, but the impact on the east coast grain balance sheet will be minimal because many farmers have elected to conserve moisture for winter crop planting and because it’s late in the growing season, so the yield potential for a crop like sorghum is curtailed. BOM models now have almost all of the cropping belt with an even or better chance of above-average rainfall between now and May.
We now expect APW Wheat to trade between AUD 330/tonne (FOB ADL) and AUD 390/tonne (FOB BNE) in Q4 this year. Meanwhile, with expectations of a relatively higher supply of barley and export concerns, we now put feed barley at between AUD 275/tonne (FOB ADL) and AUD 340/tonne (FOB BNE).
Cheryl Kalisch GordonSenior AnalystGrains & Oilseeds
+61 2 6363 [email protected]

Contagion hasn’t found wheat
Global values and Australian dollar depreciation continue to be supportive of Australian wheat prices
An increase in barley global supply and growing global stocks means AU barley pricing will be under pressure
150
200
250
300
350
400
450
500
550
600
AU
D/t
on
ne
USc
/bu
CBOT Wheat Rabobank forecast
0
10
20
30
40
0
40
80
120
160
mill
ion
to
nn
es
mill
ion
to
nn
es
Ending Stocks (RHS) Production (LHS)
Total Consumption (LHS)
Source: Bloomberg, Rabobank 2020 Source: IGC, Rabobank 2020

Dairy
Coronavirus takes centre stage, price fallsAt just past the 2019/20 season’s halfway mark (to January 2020), Australian milk production was down 3.7 percent. There are green shoots on the horizon. On a positive note, for the month of January 2020, milk production was higher year on year, with the southern export pool expanding for the first time since mid-2018.
Global dairy market fundamentals were broadly supportive of commodity prices at the start of 2020. However, unsurprisingly, there has been general weakness across the dairy complex in February 2020. Oceania spot commodity prices for milk powder dropped 5 percent. To date, the falls have been quite moderate, given the level of uncertainty. The key issue is coronavirus’s potential impact to dairy supply chains and end-user demand in China. However, dairy exporters are also dealing with supply chain and logistics disruptions.
Buyers and sellers will be assessing the full impact of coronavirus on global dairy market balances in the weeks to come. Adding to the equations are other forces that will have a material impact on global market fundamentals.
In New Zealand, unfavourable weather conditions across several parts of the country have taken a toll on milk collections. On a milksolids basis, milk production was down 1.1 percent in January 2020. This means milk production for the season is up just 0.4 percent. Unless there is an improvement in seasonal conditions, milk production will continue to fall over the close of the season.
Meanwhile, the Northern Hemisphere dairy export regions are witnessing improvements in milk production. The spring flushes in these regions will provide another litmus test for global markets in the months ahead. In the past three months, milk production in both the EU and US expanded by 1 percent.
What to watch
• Currency. There has been positive news on the currency front for Australian dairy exporters,
against a backdrop of weaker commodity prices (in US dollar terms). Since the start of this year,
the Australian dollar has fallen (against the US dollar). In February, it hit an eleven-year low. The
Australian dollar is still vulnerable, which may lead a further drift the coming months.
Michael HarveySenior AnalystDairy
+61 3 9940 [email protected]

Dry weather in New Zealand; Northern Hemisphere gains momentum
Source: USDA, Rabobank 2020 Source: Rabobank 2020
Latest month Last three months
EU 1.3% (Dec 19) 1.0%
US 0.9% (Jan 20) 1.0%
Australia 0% (Dec 19) -3.0%
NZ -0.5% (2019/20 season to January 2020)
Production growth in key exporting regionsGlobal dairy prices, 2014-2020
1,000
2,000
3,000
4,000
5,000
6,000
7,000
USD
/to
nn
e FO
B
Butter SMP WMP Cheese

Beef
Rain driving cattle prices into record territoryWidespread rain across many parts of eastern and northern Australia has stimulated producer activity, driving prices into record territory. The EYCI jumped over 20 percent in the space of a month to AUD 7.01/kg cwt on 27 February. Reflecting increased producer demand, saleyard prices lifted by more than over the hooks prices did, and lighter cattle (restocker and feeder weight cattle) saw bigger jumps than heavier finished cattle. With most of the country forecast to receive average to above-average rainfall over the next three months, we expect prices to remain elevated – particularly for younger stock – over the next month, with sustained demand from producers.
Eastern states’ weekly cattle slaughter figures show slaughter numbers for the four weeks of February are down 6 percent on the same period last year. Queensland saw a larger drop at 11 percent. With widespread rains and the more limited cattle supply, these numbers are expected to continue to contract. Cattle slaughter ended 2019 up 8 percent, at 8.47m head. Female slaughter was up 18 percent and male slaughter down 3 percent, with females ending the year accounting for 56 percent of the total slaughter.
January beef exports (79,221 tonnes swt) were up 17 percent YOY to be the largest volume exported in January in over ten years. Volumes to China (21,026 tonnes swt) continue to dominate, up 73 percent on January 2019 volumes. With declining slaughter volumes and coronavirus affecting Chinese trade, these export volumes are expected to drop in coming months. Live cattle export numbers for January were steady, compared to 2019, but there was a shift in numbers from Indonesia (down 29 percent) to Vietnam (up 193 percent).
What to watch
• Coronavirus – With China taking 27 percent of beef exports in January, the reduced foodservice trade in China and the problems with transport associated with coronavirus will have a significant impact on Australia's beef trade in February and March. Sales to China are expected to drop dramatically in Q1, be down in Q2, and start to recover in Q3, if the virus can be contained in the short term. This will place pressures on the processing sector to manage high domestic livestock prices and softer global demand.
Angus Gidley-BairdSenior AnalystAnimal Protein
+61 2 8115 [email protected]

Rain causes domestic livestock prices to jump, but a shock expected in exports to China
The EYCI heads towards record territory Beef exports to China still breaking records, but a shock waiting in the wings
350
450
550
650
750
Jan Feb Mar Apr May Jun Jul Aug Sep Oct Nov Dec
Au
c/kg
cw
t
2016 2018
2019 2020
Five-year average
0
5,000
10,000
15,000
20,000
25,000
30,000
35,000
40,000
JAN FEB MAR APR MAY JUN JUL AUG SEP OCT NOV DEC
EXPO
RTS
(TO
NN
ESSW
T)
2017 2018 2019
2020 5 YR AVE
Source: MLA, Rabobank 2020 Source: MLA, Rabobank 2020

Sheepmeat
Prices continue to defy limitsAll classes of lamb and sheep have continued to defy limits, with prices pushing towards record territory in February. Lamb and mutton prices are following a trend usually seen in May and June, when supplies become limited. Many are pushing towards - or have passed in the case of mutton -record levels normally seen in the middle of the year. The ESTLI reached AUD 9.11/kg cwt on 20 February. Mutton prices passed AUD 6.50/kg for the first time ever. We have not seen price rises of this magnitude at this time of the year, and with softer Chinese demand, there is risk of a market correction in the coming months. But with limited supplies, it is not expected to be severe.
Eastern states’ weekly slaughter numbers show lamb slaughter is down 6 percent for the first seven weeks of the year, compared to 2019, and sheep slaughter is down 7 percent. Meanwhile, sheep yardings are up 4 percent on 2019 numbers for the month of February. The MLA and AWI wool and sheepmeat survey in October 2019 forecast that there would be 11.6m lambs for sale between November and February. Since the beginning of November, there have only been 5.2m head slaughtered in the eastern states (WA would account for about 2.2m). Producers have either been more aggressive in their restocking plans than they had planned back in October 2019 and are holding more lambs, or they are looking to add additional weight to lambs while pasture is available. Lamb slaughter numbers (21.5m head) in 2019 were down 5 percent, while sheep numbers (9.3m head) were down 3 percent on 2018 volumes.
Lamb exports (23,366 tonnes swt) for the month of January were up 8 percent, with China continuing its strong demand (up 10 percent), while Europe also showed some strong growth. Mutton exports (18,643 tonnes swt) were also up 20 percent, with very strong trade to the US, up 150 percent. Volumes to China would not yet include the impact that coronavirus is expected to have on trade. We expect export volumes to Chinese to drop in February and March.
What to watch• Coronavirus – With 25 percent of Australia's lamb and 40 percent of Australia’s mutton
exported to China in 2019, the reduced trade into China as a result of the coronavirus will have a significant impact on Australia’s sheepmeat industry. Processors are expected to face pressure with high domestic livestock prices and reduced demand out of China. At the time of writing, indications were that trade was starting to open up again. It is expected that it will take some time before Chinese consumers and businesses return to normal, and, therefore, sales into China are expected to be impacted at least until the end of Q2 at the earliest.
Angus Gidley-BairdSenior AnalystAnimal Protein
+61 2 8115 [email protected]

Uncharacteristically high prices reflecting low supply, but export pressures loom
Eastern States Trade Lamb Indicator pushing towards an out-of-season record
Lamb exports to China expected to drop in February and March
400
500
600
700
800
900
1000
Jan Feb Mar Mar Apr May Jun Jul Aug Sep Oct Nov Dec
AU
c/kg
cw
t
2017 2018
2019 2020
Five-year average
0
1,500
3,000
4,500
6,000
7,500
9,000
Jan
Feb
Mar
Ap
r
May
Jun
Jul
Au
g
Sep
Oct
No
v
Dec
exp
ort
s (t
on
nes
sw
t)
2017 2018 2019
2020 5 yr ave
Source: MLA, Rabobank 2020 Source: DA, Rabobank 2020
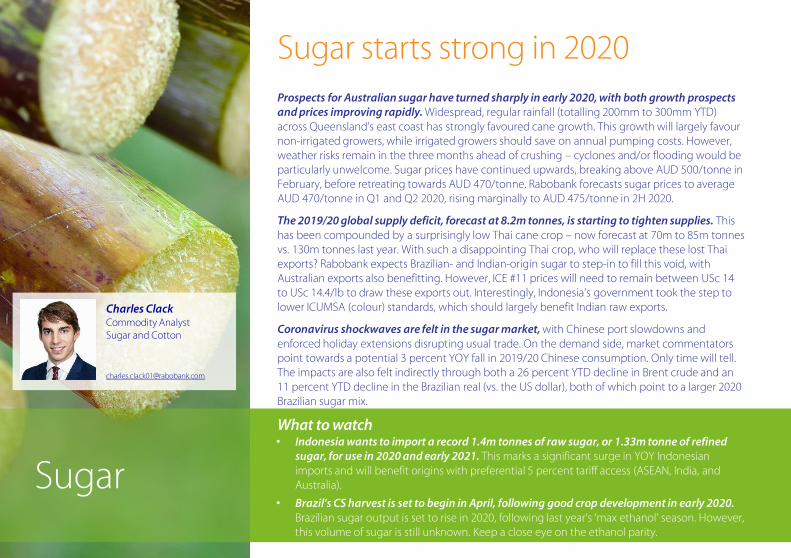
Sugar starts strong in 2020Prospects for Australian sugar have turned sharply in early 2020, with both growth prospects and prices improving rapidly. Widespread, regular rainfall (totalling 200mm to 300mm YTD) across Queensland’s east coast has strongly favoured cane growth. This growth will largely favour non-irrigated growers, while irrigated growers should save on annual pumping costs. However, weather risks remain in the three months ahead of crushing – cyclones and/or flooding would be particularly unwelcome. Sugar prices have continued upwards, breaking above AUD 500/tonne in February, before retreating towards AUD 470/tonne. Rabobank forecasts sugar prices to average AUD 470/tonne in Q1 and Q2 2020, rising marginally to AUD 475/tonne in 2H 2020.
The 2019/20 global supply deficit, forecast at 8.2m tonnes, is starting to tighten supplies. This has been compounded by a surprisingly low Thai cane crop – now forecast at 70m to 85m tonnes vs. 130m tonnes last year. With such a disappointing Thai crop, who will replace these lost Thai exports? Rabobank expects Brazilian- and Indian-origin sugar to step-in to fill this void, with Australian exports also benefitting. However, ICE #11 prices will need to remain between USc 14 to USc 14.4/lb to draw these exports out. Interestingly, Indonesia’s government took the step to lower ICUMSA (colour) standards, which should largely benefit Indian raw exports.
Coronavirus shockwaves are felt in the sugar market, with Chinese port slowdowns and enforced holiday extensions disrupting usual trade. On the demand side, market commentators point towards a potential 3 percent YOY fall in 2019/20 Chinese consumption. Only time will tell. The impacts are also felt indirectly through both a 26 percent YTD decline in Brent crude and an 11 percent YTD decline in the Brazilian real (vs. the US dollar), both of which point to a larger 2020 Brazilian sugar mix.
What to watch• Indonesia wants to import a record 1.4m tonnes of raw sugar, or 1.33m tonne of refined
sugar, for use in 2020 and early 2021. This marks a significant surge in YOY Indonesian imports and will benefit origins with preferential 5 percent tariff access (ASEAN, India, and Australia).
• Brazil’s CS harvest is set to begin in April, following good crop development in early 2020. Brazilian sugar output is set to rise in 2020, following last year’s ‘max ethanol’ season. However, this volume of sugar is still unknown. Keep a close eye on the ethanol parity.
Sugar
Charles ClackCommodity AnalystSugar and Cotton

300
350
400
450
500
550
600
650
AU
D/t
on
ne
ICE No. 11 Sugar Rabobank forecast
Sugar prospects improve sharply on both cane growth prospects and recovering prices
Source: Bloomberg, Rabobank 2020
Indonesia wants to import a record 1.4m tonnes of raw sugar, or 1.33m tonnes of refined sugar, for use in 2020 and early 2021. This marks a significant surge in YOY Indonesian imports.
Rabobank forecasts a significant 8.2m tonne 2019/20 global deficit to tighten world inventories
Bearish ICE #11 forecast offset by AUD/USD depreciation to keep prices at AUD 470-475/tonne
Source: F.O Licht, Rabobank 2020
unit Q2'19 Q3'19 Q4'19 Q1'20(f) Q2'20(f) Q3'20(f) Q4'20(f) Q1'21(f)
ICE #11 USc/lb 12.3 11.6 12.5 14.4 14.2 14.0 14.0 14.0
AUD/USD 0.70 0.69 0.68 0.68 0.67 0.66 0.65 0.65
Sugar AUD/t 386 374 407 467 467 468 475 475

Cotton
Rain bolsters cotton prospectsRainfall across the central-eastern regions of NSW and Southern Queensland raise hopes for future cotton prospects. These events have been beneficial for planted crops, particularly dryland, across large parts of the northern MDB catchment – Northern basin storages now sit at 13 percent full vs. 6 percent in early January. On-farm storages have also begun to fill, improving prospects for the 2021 crop. Following this year’s forecast 600,000 to 700,000 bale crop, Rabobank sees a potential 2020/21 season recovery towards 1m to 2m bales, pending future precipitation. 2020 crop development in both the Northern Territory (800ha dryland, 200ha irrigated) and WA (100ha dryland, 1,200ha irrigated) looks particularly encouraging.
The impact of coronavirus extends to May 2020 ICE #2 Cotton futures, with a sharp 10 percent fall through February. Both Chinese port activity and manufacturing have been slow or nearly stopped since mid-January – a factor extending into equities, currency, and broader commodity markets. Both speculative selling and short-term demand worries will pressure the ICE #2 in the short term, likely towards the low USc 60/lb region. However, Rabobank anticipates a price recovery later this year above USc 70/lb, or AUD 600/bale, as Chinese and Southeast Asian purchases ramp up in the later part of the year.
It’s bad news for basis as 2020/21 production recovers and the US-China trade deal returns ’normal’ trade routes. Rabobank anticipates the premiums enjoyed by local growers and merchants to diminish as supplies recover and the US returns as a major competitor. However, this will be somewhat offset by AUD/USD depreciation. Early forecasts for the 2020/21 season suggest a rise in world production of over 3m bales – driven primarily by Australia – which will drive a small 0.7m bale supply deficit.
What to watch
• The coronavirus has had a sharp impact on global cotton, and future developments will play out in global cotton prices going forward. Markets will want to see a return in Chinese manufacturing and fibre imports before the ICE #2 is able to recover.
• Performance of crops in the north remains a focus, particularly after the success of last season. The availability of water gives huge potential to the region, but issues of land ownership, ginning, and short seasons will require solutions.
Charles ClackCommodity AnalystSugar and Cotton

Rainfall raises domestic crop hopes, despite disruption across global markets
Domestic prices fall sharply in late February; Rabobank expects a recovery in coming months
Global inventories set to remain stable in 2020/21, with a demand-led dip in stocks-to-use ratio
Source: USDA, Rabobank 2020Source: Bloomberg, Rabobank 2020
The impact of coronavirus virus extends to May 2020 ICE #2 Cotton futures, with a sharp 10 percent fall through February. Both Chinese port activity and manufacturing have been slow or nearly stopped since mid-January.
0%
20%
40%
60%
80%
100%
0
20
40
60
80
100
120
sto
cks-
to-u
se ra
tio
mill
ion
bal
esWorld ending stocks World-China Ending Stocks
World stocks-to-use ratio Average stocks-to-use ratio
400
450
500
550
600
650
AU
D/b
ale
(227
kg)
2020 2021 2022

Wool rides through coronavirus relatively unscathedThe wool market has been relatively constant for the past month, despite expected disruptions to supply chains from factory closures and logistics issues associated with coronavirus. Early reports of factory closures in China over the extended Lunar New Year holiday suggested that there may be reduced Chinese buying activity through February. But more recently, Chinese buyers and top makers have once again been active at auctions, suggesting any disruptions may have passed. The EMI finished the month of February at AUc 1581/kg, after commencing the month at AUc 1548/kg. Declining cotton prices and possible reductions in Chinese consumer sentiment are being balanced by the reduced Chinese imports in 2019 in our wool price modelling. When sales resume (expected the week commencing 2 March), the market is expected to continue its steady trend.
Wool test data for February show that 11 percent less bales were tested in February, compared to 2019, with a 10.3 percent drop in greasy weight and a 2 percent drop in yield. Those figures bring the bales tested (1.15m) for the year to date down 6.1 percent and greasy weight (205,847 tonnes) down 5.7 percent. The expected offerings for the next couple of sales are likely to continue the trend of being down on previous years.
Export volumes for the month of December (21.9m kg) were 13 percent down on December 2018 volumes. Exports to China saw a large drop of 15 percent, while volumes to India increased 28 percent. Year-to-date (Dec) export volumes are down 15.4 percent. Chinese total wool imports finished the calendar year down 34 percent, from 369,000 tonnes in 2018 to 275,000 tonnes in 2019.
What to watch
• Australian currency – While it appears that the wool market has escaped major disruptions resulting from coronavirus, there remain the broader economic impact and the possible influence on Australia’s exchange rate. In a potentially positive outcome for the wool industry, the high exposure of Australia to China and the world market may see the Australian dollar weaken further against the US dollar.
Angus Gidley-BairdSenior AnalystAnimal Protein
+61 2 8115 [email protected]
Wool

Wool prices remain steady despite coronavirus
Source: National Bureau of Statistics China, Rabobank 2020
EMI still holding well at just above the five-year average
Chinese total wool imports recovering from lows
in 2019
Source: Bloomberg, Rabobank 2020
0
500
1,000
1,500
2,000
2,500
Jan
201
5
May
201
5
Sep
201
5
Jan
201
6
May
201
6
Sep
201
6
Jan
201
7
May
201
7
Sep
201
7
Jan
201
8
May
201
8
Sep
201
8
Jan
201
9
May
201
9
Sep
201
9
Jan
202
0
AU
c/kg
AWEX EMI (AUD) EMI (AUD) Five-yr. avg.
AWEX EMI (USD) EMI (USD) Five-yr. avg.
0
15
30
45
Jan Feb Mar Apr May Jun Jul Aug Sep Oct Nov Dec
wo
ol i
mp
ort
s (t
ho
usa
nd
to
nn
es)
2017 2018
2019 Five-year average

Wine
What to watch
• Increased investment in e-commerce platforms in China – With the impacts of coronavirus
following a difficult trading year for wine in China in 2019, Rabobank expects that there will be
increased focus on further developing these fast-growing sales channels for both imported and
domestic wines.
Sales channel complicationsQ1 2020 has brought exporters challenges not related to trade ructions for a change, but rather to market disruption. Coronavirus brings market disruption not previously experienced by some exporters.
The impact of the coronavirus outbreak on China’s on premise wine sales has been pronounced. Around one-third of all wine sales in China are through foodservice, which has been highly impacted due to containment restrictions imposed by the Chinese government. Exporters with sales programmes into China have been feeling the impacts of this on their sales. It is likely to take some months after any containment in China is confirmed for this segment to recover. Coronavirus follows a challenging 2019 in China’s wine market, and Rabobank expects the downturn in demand to continue in the coming months.
Other disruptions are more familiar foes, such as increased supply against sluggish demand.
For exporters considering shifting volumes of wine to the US in 2020 if other markets such as China or the UK become more difficult, the US market will be more challenging than in previous years.
The US wine market is showing signs of slowing demand against a backdrop of increased competition from alternative beverages, such as craft beer, craft spirits, and seltzers. Combined with a situation of rising US domestic wine inventory from increased supply, this is pressuring US bulk wine prices. For more, listen to our latest US podcast episode What a Tough Bulk Market Means for US Wine.
The UK market is likely to remain sluggish in 2020. As wine consumption, both per capita and in total, has shown steady decline in recent years, we do not expect actual demand to increase in 2020. With imports related to pre-Brexit inventory build-up rising across 2019, underlying demand for the balance of 2020 remains unclear as we sit in Q1 2020.
Hayden HigginsSenior AnalystHorticulture & Wine
+64 6 974 [email protected]

Source: Wine Australia, Rabobank 2020
Market mix favoured China and the US
-
300
600
900
1,200
China2018
China2019
US 2018 US 2019 UK 2018 UK 2019
litre
s(m
illio
n)
Year end December
-
50
100
150
200
250
300
China2018
China2019
US 2018 US 2019 UK 2018 UK 2019
AU
D F
OB
(mill
ion
)Year end December
Australian wine exports, value Australian wine exports, volume
Exports of Australian wine to China continued to soar across 2019, with an improvement in the US market also. Collectively, the Chinese, US, and UK markets accounted for almost 70 percent of Australian wine export receipts for the year ending December 2019.

Horticulture
What to watch
• Revised US almond crop numbers may bring lower almond prices – Recent US almond crop
forecasts put the 2019/20 crop at around 2.5bn pounds. This is above the earlier crop revisions in
2019, which had the crop at around 2.2bn pounds. We expect this to flow into price softening for
US almonds as the market readjusts.
Market depth to be tested Market and supply chain disruptions come at a window of traditional peak supply and exports for some key horticultural export crops.
Coronavirus brings complications for exporters of crops with a high reliance on China, such as citrus, table grapes, and almonds. For the year-end December 2019, China accounted for around 35 percent, 38 percent, and 55 percent of export receipts, respectively, for these crops. Despite indications of port access freeing up, Rabobank expects softening of in-market prices for fresh produce exports in China for the balance of Q1. This is not from a lack of demand, rather supply chain disruptions continue to impact ability to deliver produce to consumers. The depth of this price impact after Q1 remains uncertain and is highly dependent upon the timeframe it takes for China to contain the virus.
Q1 and Q2 2020 bring market trading conditions that will test the depths of alternative markets to Australia's number one fresh produce export destination, China.
The spread of coronavirus and its impacts to other key markets in Asia will likewise influence demand across the balance of Q1 and into Q2 2020. Rabobank expects that supply diverted to markets outside of China, where that supply is not unseasonal, will result in reduced local market prices bringing downside to total export receipts for the second half of the export year to June 2020. Further complicating the picture, as noted in our 2020 outlook, many Southeast Asian countries rely on trade with China. Further economic downside in China has the potential to flow into these economies, potentially bringing reduced demand across a wider geographic region.
A falling Australian dollar is expected to provide some buffer to offset any price reductions.
Hayden HigginsSenior AnalystHorticulture & Wine
+64 6 974 [email protected]
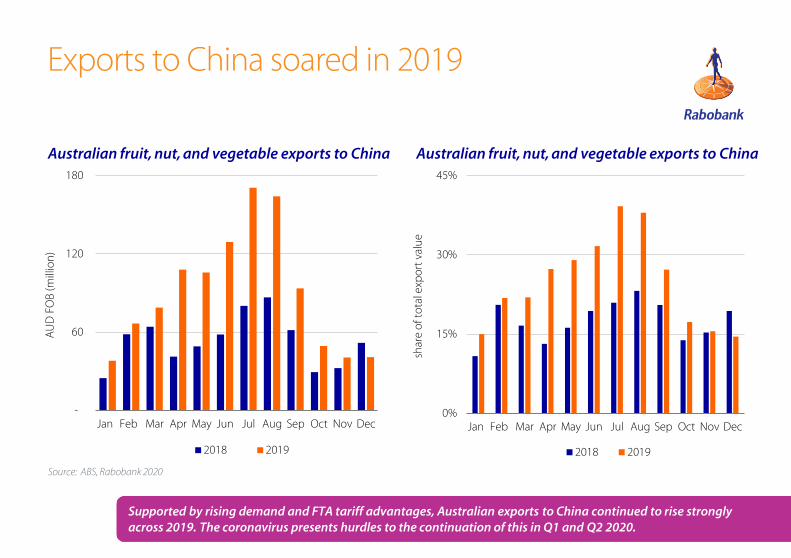
Exports to China soared in 2019
Source: ABS, Rabobank 2020
-
60
120
180
Jan Feb Mar Apr May Jun Jul Aug Sep Oct Nov Dec
AU
D F
OB
(mill
ion
)
2018 2019
0%
15%
30%
45%
Jan Feb Mar Apr May Jun Jul Aug Sep Oct Nov Decsh
are
of t
ota
l exp
ort
val
ue
2018 2019
Australian fruit, nut, and vegetable exports to China Australian fruit, nut, and vegetable exports to China
Supported by rising demand and FTA tariff advantages, Australian exports to China continued to rise strongly across 2019. The coronavirus presents hurdles to the continuation of this in Q1 and Q2 2020.

Farm Inputs
Coronavirus adds ag-chem concernDue to the impact of structural changes in the Chinese agrochemical-production supply chain, summer rain at home, and now coronavirus, we consider it vitally important that farmers ensure they have adequate stocks for the upcoming winter crop.
A ‘perfect storm’ has emerged over the Australian agrochemical market, disrupting supplies and import times from China. Over the last two years, agrochemical production in China has declined 44 percent, following a government effort to reduce oversupply issues and reduce the impact of production on the environment.
Furthermore, coronavirus has slowed Chinese ports, adding longer import times. With supply under pressure, healthy summer rain at home has elevated demand for summer knockdown sprays. While most local retailers are confident there will not be a major gap in the market ahead of planting, major chemicals such as glyphosate and trifluralin will be in very short supply until new supplies arrive, which is estimated to be in late March, early April.
While Chinese fertiliser production will also be impacted, we consider the risk of a shortage for Australian growers lower than agrochemicals, as supplies are not as concentrated on China.
Our expectation is for below-average prices to continue across the nutrient complex for the remainder of the first half of 2020. While prices for both phosphate and urea bounced off seasonal lows during February, we expect any short-term upside to be limited.
For phosphates, many producers across the globe are returning to full production, following the margin-driven curtailment during late 2019. We expect this will place a cap on global prices during the first half of this year. A major factor to watch is the export availability of phosphate from China (see below). A major decrease in export availability will partially offset increased production in other regions, adding support to prices.
Wes LefroyAgricultural Analyst
+61 2 8115 [email protected]
What to Watch• Chinese production of farm inputs – The coronavirus outbreak impacted production of agrochemicals,
fertilisers, and rural supplies in China. Market reports are that production is resuming in Chinese factories, and the local government is removing some of the local transport restrictions, which will enable an increased flow of goods to port. Chinese fertiliser may also be impacted, although local supplies are less reliant on Chinese imports than other input products.
• For local farmers, we see the biggest risks for some agrochemicals and rural supplies products.

0
1
2
3
4
2015 2016 2017 2018 2019
mill
ion
to
nn
es
Q1 Q2 Q3 Q4
Chinese agrochemical squeeze a risk for Australian farmers
Source: National Bureau of Statistics of China, Rabobank 2020
AUD-adjusted FOB global fertiliser prices, Urea ex. MiddleEast (above) & DAP ex. US Gulf (lower)Middle East (above) & DAP ex. US Gulf (lower)
Chinese agrochemical production
Source: Bloomberg, Rabobank 2020
200
300
400
500
600
Jan Feb Mar Apr May Jun Jul Aug Sep Oct Nov Dec
AU
D/t
on
ne
FOB
350
450
550
650
Jan Feb Mar Apr May Jun Jul Aug Sep Oct Nov Dec
AU
D/t
on
ne
FOB
Ten-year range Ten-year avg 2020

Rates & FX
AUD smashed by coronavirus, but there is still downsideThe Australian dollar will head into the low 60s against the US dollar if coronavirus takes off again in China or its becomes a global pandemic. Both scenarios are entirely possible.
The Australian dollar is being traded as a proxy for Chinese economic prospects and global risk,
both of which turned south in February. Coronavirus infections stabilized in China in late February, but the economy was clearly still operating at a fraction of its capacity. And with markets awakening to the prospect of a global pandemic, traders abandoned AUD investments for safe haven assets in the US. Yields on 10-year US Treasury bonds fell below 1 percent by early March, an all-time low and down from 2.75 percent just one year prior. The Australian dollar fell to just under 66 US cents on the4th of March, down from 67.6 US cents at the end of January.
The fate of the Australian dollar will be heavily influenced by the direction of the virus from here. It is hard to know what scenario the market has priced in to current exchange rates. Despite its recent smashing, the currency could still slip even further against the US dollar over the next 12 months, if either infection rates started to rise again in China or if the infection rates seen in Italy and South Korea are replicated in major economies like the US and Japan. Conversely, the Australian dollar may yet rise against the US dollar if the situation in China continues to improve and its spread beyond China remains limited.
We remain bearish, and expect the AUD to hit 63 US cents against the USD by Q1 2021.
What to watch
• Can China control coronavirus and work? If officially reported data is accurate, by the end of
February, China appeared to have proved it could stop the virus from spreading further,
provided that people barely moved and the economy ran at a snails pace. The next test (now
underway) is whether it can restart the economy without infections taking off again. If it can’t,
the Australian dollar will likely fall further against the greenback.

Source: RBA, Rabobank 2020
Coronavirus’s silver lining for Australian exporters
Australian currency against the US dollar
0.64
0.69
0.74
0.79
0.84
0.89
AU
D/U
SD

Source: Bloomberg, Rabobank 2020Source: AIP, Bloomberg, Rabobank 2020
Brent crude on a slippery slopeWe expect that oil prices will remain under pressure, as a result diminished demand related to COVID-19. Brent crude has fallen 26 percent year to date. Ahead of OPEC’s meeting this week, we expect Russia and OPEC will announce deeper production cuts, in order to meet virus-related demand concerns (70 to 80 percent chance). We expect a sharp recovery in prices and demand when China does return to the market, with the timing in question. Our base forecast is for Brent Crude to recover to 67 USD/bbl during Q2 ‘20.
Arguably, the biggest impact of the virus so far has been on shipping and logistics. The Baltic Dry Index has now fallen 51 percent year to date and 78 percent over the last six months. This has been primarily due to enforced holiday extensions and roadblocks in China, which have restricted the movement of goods to port. Over the last week, the number of new cases in China has slowed, and port movements are picking up again, enabling goods to flow. Looking ahead, shipping movements will be highly sensitive to the rate of increase in new cases and where new outbreaks occur.
Brent Crude Oil & Average Sydney Diesel Feb 2017-Feb 2020
Baltic Dry Index, Feb 2017-Feb 2020
Oil & Freight
0
500
1,000
1,500
2,000
2,500
Balt
ic D
ry In
dex
60708090100110120130140150160
20
30
40
50
60
70
80
90
Ap
r 16
Oct
16
Ap
r 17
Oct
17
Ap
r 18
Oct
18
Ap
r 19
Oct
19
AU
Cen
ts/
L
USD
/bb
l
Brent/diesel Spread (RHS)Brent crude (USD/bbl) (LHS)Ave Sydney Diesel TGPS (RHS)

Agri Price Dashboard As of 2/03/2020 Unit MOM Current Last month Last year
Grains & oilseeds
CBOT wheat USc/bushel ▼ 529 556 454
CBOT soybean USc/bushel ▲ 8 8 4 8 77 8 99
CBOT corn USc/bushel ▼ 367 379 364
Australian ASX EC Wheat AUD/tonne ▼ 321 342 316
Non-GM Canola Newcastle AUD/tonne ▼ 641.7 642.3 610
Feed Barley F1 Geelong AUD/tonne ▼ 28 2 304 341
Beef markets
Eastern Young Cattle Indicator AUc/kg cwt ▲ 718 58 8 434
Feeder Steer AUc/kg lwt ▲ 38 3 324 250
North Island Bull 300kg NZc/kg cwt ▼ 470 520 490
South Island Bull 300kg NZc/kg cwt ▼ 465 500 490
Sheepmeat markets
Eastern States Trade Lamb Indicator AUc/kg cwt ▲ 911 8 09 656
North Island Lamb 17.5kg YX NZc/kg cwt ▼ 690 735 700
South Island Lamb 17.5kg YX NZc/kg cwt ▼ 68 0 735 675
Venison markets
North Island Stag NZc/kg cwt ▼ 78 0 8 30 955
South Island Stag NZc/kg cwt ▼ 78 0 8 20 960
Dairy Markets
Butter USD/tonne FOB ▼ 4,08 8 4,238 4,425
Skim Milk Powder USD/tonne FOB ▼ 3,025 3,075 2,638
Whole Milk Powder USD/tonne FOB ▼ 2,975 3,238 3,025
Cheddar USD/tonne FOB ▲ 4,550 4,08 8 3,8 00

Agri Price Dashboard As of 2/03/2020 Unit MOM Current Last month Last year
Cotton markets
Cotlook A Index USc/lb ▼ 71.4 76.7 81
ICE No.2 NY Futures (nearby contract) USc/lb ▼ 61.6 66.8 73
Sugar markets
ICE Sugar No.11 USc/lb ▼ 14.5 14.9 12.62
ICE Sugar No.11 (AUD) AUD/tonne ▼ 478 481 438
Wool markets
Australian Eastern Market Indicator AUc/kg ▲ 1,581 1,548 2,016
Fertiliser
Urea USD/tonne FOB ▲ 245 236 240
DAP USD/tonne FOB ▲ 312 288 395
Other
Baltic Dry Index 1000=1985 ▲ 535 466 664
Brent Crude Oil USD/bbl ▼ 50 54 65
Economics/currency
AUD vs. USD ▼ 0.65 0.67 0.71
NZD vs. USD ▼ 0.62 0.65 0.68
RBA Official Cash Rate (03/03/2020) % ▼ 0.50 0.75 1.50
NZRB Official Cash Rate % • 1.00 1.00 1.75

PodcastsHere’s how to access our podcasts:
• Simply search for “Rabobank” in your podcast app
• Click on our food & agribusiness podcast channel
• Hit subscribe!
Want to keep up to date with the latest food & agribusiness insights?
Make our insights your advantage – Stay ahead of developments in your industry by subscribing to our podcast channel on your favourite podcast app.
Our podcasts are a fast and easy way to engage with our latest research findings and industry developments, right on your phone.
Most Apple devices have the Podcasts app pre-installed – if not, you can find it in the App Store. On Android devices, Stitcher and TuneIn Radio are popular podcast apps.

RaboResearch Food & AgribusinessAustralia and New Zealand
Rabobank AustraliaNearest branch call 1300 30 30 33www.rabobank.com.au
Tim HuntHead of Food & Agribusiness Research and Advisory, Australia and New Zealand+61 3 9940 [email protected]
Angus Gidley-BairdSenior Analyst – Animal Protein+ 61 2 8115 [email protected]
Michael HarveySenior Analyst – Dairy+61 3 9940 [email protected]
Cheryl Kalisch GordonSenior Analyst – Grains & Oilseeds+61 2 6363 [email protected]
Hayden Higgins Senior Analyst – Horticulture and Wine+64 6 974 [email protected]
Wes LefroyAgricultural Analyst+61 2 8115 [email protected]
Emma HigginsAnalyst – Dairy+64 3 961 [email protected]
Blake HolgateAnalyst – Animal Protein and Sustainability+64 3 955 [email protected]
Charlie ClackCommodity Analyst+61 2 8115 [email protected]
Dennis VoznesenskiAssociate Analyst+61 2 8115 [email protected]
Catherine KeoBusiness Coordinator+61 2 8115 [email protected]

This document is issued by a Rabobank Group member. The information and opinions contained in this document have been compiled or arrived at from sources believed to be reliable, but no representation or warranty, express or implied, is made as to their accuracy, completeness or correctness. This document is for information purposes only and is not, and should not be construed as, an offer or a commitment by any Rabobank Group member to enter into a transaction. This information is not professional advice and has not been prepared to be used as the basis for, and should not be used as the basis for, any financial or strategic decisions. This information is general in nature only and does not take into account an individual’s personal circumstances. All opinions expressed in this document are subject to change without notice. No Rabobank Group member accepts any liability whatsoever for any direct, indirect, consequential or other loss or damage howsoever arising from any use of this document or its contents or otherwise arising in connection therewith. This document may not be reproduced, distributed or published, in whole or in part, for any purpose, except with the prior written consent of a Rabobank Group member. By accepting this document you agree to be bound by the foregoing restrictions. All copyright is reserved © 2019