agricultural and forest meteorology - page not foundlkgray/uploads/7/3/6/2/7362679/gray_et... ·...
TRANSCRIPT

PC
La
b
c
d
ARRA
KCDCCWF
1
ct2esd
lctCoaeo
R
0h
Agricultural and Forest Meteorology 180 (2013) 152– 163
Contents lists available at SciVerse ScienceDirect
Agricultural and Forest Meteorology
jou rn al hom epage : www.elsev ier .com/ locate /agr formet
redicting the risk of cedar leaf blight (Didymascella thujina) in Britisholumbia under future climate change
aura K. Graya,∗, John H. Russellb, Alvin D. Yanchukc, Barbara J. Hawkinsd
University of Alberta, Department of Renewable Resources, 751 General Services Building, Edmonton, Alberta T5H 4R1, CanadaBritish Columbia Forest Service, Cowichan Lake Research Station, Box 335 Mesachie Lake, British Columbia V0R 2N0, CanadaMinistry of Forests, Lands and Natural Resources, Tree Improvement Branch, P.O. Box 9518 STN PROV GOVT, Victoria, British Columbia V8W 9C2, CanadaUniversity of Victoria, Centre for Forest Biology, 151 Cunningham Building, P.O. Box 3020 STN CSC, Victoria, British Columbia V8W 3N5, Canada
a r t i c l e i n f o
rticle history:eceived 26 November 2012eceived in revised form 22 April 2013ccepted 26 April 2013
eywords:limate envelope modelingidymascella thujinaedar leaf blight
a b s t r a c t
Cedar leaf blight (Didymascella thujina) is considered to be the most important disease of western redcedarin British Columbia. The disease is most prevalent in warm-moist coastal low-elevation environmentscausing mortality among seedlings and significant loss of incremental growth and branch death amongmature trees. In this study we used a principle component regression model to spatially project thedisease risk under observed climate (2003–2008) and multiple future climate scenarios for the 2020s,2050s, and 2080s. We found that while the majority of future climate scenarios predicted coastal envi-ronments will continue to favor occurrence of the disease, intensity is predicted to decrease toward the2080s. Projected reductions of available summer climate moisture (cumulative precipitation – potential
limate changeestern redcedar
orest health
evapotranspiration), corresponding to the time of ascospore discharge and germination, contribute sig-nificantly to this finding. Disease intensity is however, projected to increase under moderate temperatureand precipitation increases for the 2020s. We therefore recommend current reforestation efforts deploydisease resistant western redcedar seedlots in high risk environments common to hypermaritime coastalregions such as Haida Gwaii and northern maritime, to avoid significant mortality and growth reduction.
. Introduction
Increased severity of forest disease outbreaks due to climatehange has become one of the most significant obstacles to effec-ively managing commercial forests for the future (Sturrock et al.,011). It is clear that changes in temperature and precipitationxert strong direct effects on host susceptibility, as well as theurvival, reproduction and dispersal of pathogens responsible forisease outbreaks (Ayers and Lombardero, 2000).
For endemic forest pathogens, which are already well estab-ished throughout their host distributions, the effect that climatehange will have on their range expansion is probably secondaryo the changes expected on disease intensity (Dukes et al., 2009).limate envelope models offer the ability to distinguish the abi-tic niche requirements which control endemic pathogens, as well
s the ability to project how the frequency and intensity of for-st diseases might shift under new climates, based on currentbservations. Climate envelope models have been used to study∗ Corresponding author. Tel.: +1 780 492 2540.E-mail addresses: [email protected] (L.K. Gray), [email protected] (J.H.
ussell), [email protected] (A.D. Yanchuk), [email protected] (B.J. Hawkins).
168-1923/$ – see front matter © 2013 Elsevier B.V. All rights reserved.ttp://dx.doi.org/10.1016/j.agrformet.2013.04.023
© 2013 Elsevier B.V. All rights reserved.
climate-forest pathogen interactions for agricultural crops (e.g.Bourgeois et al., 2004), however examples relevant to forest ecosys-tems are limited. Meentemeyer et al. (2008) used climate envelopemodels to determine which climate factors and associated speciescould be used for early detection of sudden oak death caused by thepathogen Phytophthora ramorum. Similar studies have expandedthis approach to illustrate the vulnerability of Quercus dominatedecosystems to P. ramorum in the United States (Venette and Cohen,2006; Kelly et al., 2007; Venette, 2009), and Phytophthora cin-namomi in Europe (Bergot et al., 2004) under current and futureclimate. For a conifer species, Watt et al. (2010) developed a non-linear model to predict infection severity and foliage retention forSwiss needle cast on Douglas-fir under current and future climatein New Zealand.
Predicting how climate change will affect pathogen–host inter-actions in forest ecosystems is arguably more complex than inagricultural settings due in part to the long-lived nature of treesand the relatively short lifespan of most pathogens. Further, cli-mate envelope models need to be independently generated for
infectious agents as pathogen-host interactions are difficult togeneralize over multiple organisms. Despite the challenges, it isprudent to continue projecting disease risk in forest ecosystems,especially in locations where both temperature and precipitation
orest M
ataDBiDhrBitate2bp
j2tcAm(f1
otisaira1fBtmsaii
ubopctabbpdatececad
L.K. Gray et al. / Agricultural and F
re expected to increase. In the absence of water stress, warmeremperatures increase pathogen metabolism, reproductive rates,nd survival, leading to disease outbreaks (Boland et al., 2004;esprez-Loustau et al., 2006; Dukes et al., 2009). In northernritish Columbia, severe defoliation and unprecedented mortal-
ty of mature native lodgepole pine (Pinus contorta var. latifoliaougl. ex Loud.) from epidemic levels of dothistroma needle blightave been related to an increase in summer precipitation for theegion which favors the pathogen’s development (Woods, 2003;radshaw, 2004; Woods et al., 2005). While climate is not antic-
pated to shift uniformly across British Columbia, mean annualemperature and precipitation are projected to increase on aver-ge by as much as 4 ◦C, and 16%, respectively for the province byhe 2050s, with the largest temperature and precipitation increasesxpected for coastal environments (Murdock and Spittlehouse,011). Thus in the future, outbreaks similar to Dothistroma, coulde observed for other forest diseases in areas throughout therovince.
Given western redcedar (Thuja plicata Donn ex D. Don) is pro-ected to favor well under future climate change (Gray and Hamann,013), it may be important to consider the risk of Didymascellahujina (E.J. Durand) Marie (formally Keithia thujina E.J. Durand),ommonly known as cedar leaf blight on these forest ecosystems.lthough the disease is most prevalent in warm-moist environ-ents typical of coastal low elevations of the Pacific Northwest
Russell et al., 2007), the pathogen is endemic to North America andound throughout the natural range of western redcedar (Pawsey,960; Sinclair et al., 1987; Kope and Sutherland, 1994).
In natural stands, the cedar leaf blight disease cycle occursver two growing seasons, with seedlings and young trees beinghe most susceptible (Pawsey, 1960). In the first growing season,nfection of individual leaflets occurs, with disease expression andpread occurring the following year (Trotter et al., 1994). Maturescospores are discharged from wetted apothecia in the spring andnfect leaves of the current growing season. A second ascosporeelease can potentially occur in the early fall if conditions are wet,nd temperatures are above 10 ◦C (Moore and Green, 1976; Frankel,990; Trotter et al., 1994). Mortality of seedlings can be high if theungus is not treated (Trotter et al., 1994; Kope and Trotter, 1998a;urdekin and Phillips, 2008) and can significantly impact growth ofrees up to 10 years old (Russell et al., 2007). While there is agree-
ent that mortality is rare, infected mature individuals may exhibitignificant loss of incremental growth and branch death (Kope etl., 1996). More importantly, cedar leaf blight may be a pioneer-ng fungal pathogen that induces stress on a host tree, allowingnfections by secondary pathogens to occur (Russell et al., 2007).
In this study we adopt a climate envelope modeling approachsing multivariate regression to investigate the interactionetween climate and cedar leaf blight in British Columbia. Althoughur model is similar to Watt et al. (2010), we use a principal com-onent analysis to remove the collinearity among our selectedlimate variables while maintaining the environmental space. Fur-her, unlike previous studies (e.g. Meentemeyer et al., 2008; Watt etl., 2010), we do not pre-select or add climate variables to our modelased on biological significance, but rather we allow a branch-andound algorithm to select the set of climate variables which bestredicts disease intensity, which we define as the total amount ofisease present (Seem, 1984). Often observations of forest diseasere collected from performance trials which were not establishedo investigate forest health issues. Our objective, therefore, is tostablish a procedure where this kind of data on any forest diseasean be utilized to identify climatic factors that contribute to dis-
ase outbreak as well as model disease risk under novel climateonditions. Here, we define risk as the probability of an undesir-ble outcome (e.g. reduced growth or mortality) due to increasedisease levels (Madden et al., 2007).eteorology 180 (2013) 152– 163 153
Cedar leaf blight represents the first forest disease to be modeledand projected under future climate change for British Columbia,and as far as we know, the first using a conifer host and pathogen,both occurring in their native environment. Studies have shownsignificant variation in cedar leaf blight severity among popula-tions and this variation is related to seed origin such that treesfrom milder and wetter ecosystems are observed to be more resis-tant to the disease than other populations planted at the same site(Soegaard, 1956; Porter, 1957; Lines, 1988; Russell et al., 2007;Russell and Krakowski, 2010). The widespread climatic distribu-tion of the host coupled with the clear evidence of strong adaptivevariation for resistance to cedar leaf blight among western redcedarnatural populations, make this fungal pathogen an informative testcase from which to build a modeling procedure.
2. Materials and methods
2.1. Field sites and climate characterization
Six western redcedar populations, each comprised of two to fournatural stand seedlots based on similar geographic location, wereestablished as one-year-old seedlings across 36 field sites as part ofa larger genetics study (Fig. 1). Each population was represented by32 seedlings planted in a randomized incomplete block design withone tree per replication. The 36 field sites were established over sixyears between 1998 and 2004 with four to six sites per year. Sever-ity of leaf blight at ages seven and 10 years was scored on individualtrees using a 1–6 scale based on percentage of foliage infected,where 1 = no visual cedar leaf blight and 6 = more than 90% dam-age. Individual site analyses was undertaken using a linear mixedmodel, and population mean seven and 10 year scores at each siteand for each population were estimated from best linear unbiasedestimates (BLUE). The three populations with consistently highestcedar leaf blight scores across all sites were used for all subse-quent regression analyses; this was done to avoid underestimatingfuture disease risk. All linear model analyses were performed usingASREML v.3.0 (Gilmour et al., 2009). Geographic and climate char-acteristics of sites where cedar leaf blight was absent (score = 1) andpresent (score > 1) are provided in Table 1.
For climatic characterization of the field sites, spatiallyinterpolated climate data was generated using CLIMATE-WNA ver-sion 4.62 (http://www.genetics.forestry.ubc.ca/cfcg/ClimateWNA/ClimateWNA.html), which includes a bilinear interpolation of thePRISM (Parameter Regression of Independent Slopes Model) (Dalyet al., 2008), along with adjustments in temperature for mountain-ous terrain (see Hamann and Wang, 2005 for details). Monthlytemperature and precipitation surfaces for each field site from2000 to 2008 were generated using historic climate data observedat Canadian weather stations interpolated as anomalies from the1961–1990 climate normals (for details see Wang et al., 2012b).Observations have shown that disease incidence is low during thefirst growing season after infection (Kope and Sutherland, 1994),but becomes conspicuous during the following year as apotheciadevelop on either the juvenile, needle-like leaves on the stem, orthe mature, scale-like leaves on the branches (Kope, 1998). There-fore, climatic factors which initiate or increase measurable blightoccurrence are not necessarily reflected in the measurement year.Thus for each field site, climate variables were averaged for the yearin which cedar leaf blight measurements were collected, as well asthe two previous years. For example, if data collection occurred in2003 then site climate was averaged for 2001, 2002, and 2003.
Latitude, longitude, elevation, and approximately 75 monthly,seasonal and annual climate variables were considered for modelparameterization. Temperature variables included: mean annualtemperature, mean warmest month temperature, mean coldest

154 L.K. Gray et al. / Agricultural and Forest Meteorology 180 (2013) 152– 163
F e. Them
mJfaem(mf
TMla
ig. 1. Cedar leaf blight (CLB) intensity projected under 2003–2008 averaged climateasurement indicated.
onth temperature, continentality (difference between meananuary and mean July temperature), number of frost-free days,rost free period, the number of growing degree days above 0 ◦Cnd 5 ◦C, as well as average, minimum and maximum values forach month and season. Similarly, precipitation variables included:
ean annual precipitation, mean growing season precipitationMay–September), annual heat moisture index, summer heatoisture index (May–September), and cumulative precipitation
or each month and season. All of these variables are described in
able 1ean (±standard deviation), maximum and minimum geographic location, climate and
eaf blight (CLB), and phenotypic correlations between geographic and climatic variable averaged over the 2003–2008 period when disease observations were collected.
Variable CLB absent sites
Mean Min
Location Latitude (◦) 50.11 ± 1.24 4Longitude(◦) −123.23 ± 2.29 −12Elevation (m) 528 ± 291 10
Climate-general Mean annual temperature (◦C) 6.9 ± 1.9
Min winter temperature (◦C)a −4.0 ± 3.5 −Mean annual precipitation (mm) 1699 ± 385 66
Climate- in analysis Mean summer temperature (◦C) 15.2 ± 1.5 1Max July temperature (◦C) 22.7 ± 1.9 1Max August temperature (◦C) 21.9 ± 1.6 1Summer climate moisture index (cm) −6.9 ± 4.3 −1Spring precipitation (mm)b 335 ± 88 10Summer precipitation (mm) 181 ± 38 11May precipitation (mm) 94 ± 29 4July precipitation (mm) 52 ± 14 2
Disease intensity Cedar leaf blight score (BLUE)c 1 ± 0
a Winter temperatures were averaged over December, and January and February of theb Spring (March, April, May), summer (June, July, August), May and July precipitation vc BLUE: best linear unbiased estimate.
locations of western redcedar field progeny test sites are included with year of CLB
detail by Wang et al. (2012b). The fungus requires 80–100% relativehumidity for at least 12 h for ascospore discharge and germination(Porter, 1957; Kope, 2004). Since humidity measurements wereunavailable and cannot be generated for the province under cur-rent and future climate scenarios, climate-moisture indices were
estimated based on potential evapotranspiration. The four climate-moisture indices (Hogg, 1997) included in variable selection were:annual, spring (April, May, June), summer (June, July, August),and autumn (August, September, October). These indices indicatecedar leaf blight intensity for western redcedar field sites with and without cedarnd cedar leaf blight intensity across all sites. The values in this table reflect climate
CLB present sites Correlation withCLB (r2)
Max Mean Min Max
8.94 54.52 50.16 ± 1.81 48.4 55.07 0.198.32 −117.85 −126 ± 2.03 −128.78 −121.98 −0.640 1000 294 ± 243 70 960 −0.44
2.9 9.5 7.9 ±1.7 2.8 9.4 0.239.1 0.4 −1.1 ±2.9 −9.5 1.6 0.423 2353 2772 ±764 1303 3995 0.55
1.4 17.1 14.5 ±1.2 11.4 16.5 −0.318.3 27.1 20.2 ±1.9 17.6 23.2 −0.698.3 25.5 20.1 ±1.5 17.6 22.4 −0.655.6 0.6 4.8 ±11.3 −13 27.2 0.755 498 620 ±212 187 915 0.50 235 250 ±93 110 433 0.638 93 200 ±69 49 191 0.519 77 78 ±32 31 143 0.6
1 1 2.8 ±0.8 1.4 4.5
following year.ariables are cumulative values.
orest M
olase
2
pw1d
scaefiwt
eeFpt2gTCS(CUsrsicc2
2
i(Dasmlcuailaplmbo
L.K. Gray et al. / Agricultural and F
verall humidity of sites and generally correspond to cedareaf blight ascospore discharge and germination for spring andutumn inoculation events, as well as fungal growth during theummer months (with larger values indicative of humid coastalnvironments).
.2. Climate scenarios for British Columbia
Similar to the climate surfaces for the field sites, annualrovince-wide climate surfaces were generated using observedeather station data interpolated as anomalies from the
961–1990 climate normals using the CLIMATE-WNA software (foretails see Wang et al., 2012b).
This database was enhanced with lapse-rate based down-ampling to1 km resolution to avoid over-estimating climatehange effects in mountainous areas (Hamann and Wang, 2005),nd increase site specificity appropriate for forecasting plant dis-ase (Seem, 2004). Given disease observations were collected ateld sites from 2003 to 2008, annual climate surfaces for this periodere averaged to provide a province-wide estimate of disease risk
o compare against future projections.Climate surfaces for the 2020s, 2050s, and 2080s were gen-
rated by overlaying projections from general circulation modelsxpressed as the difference from the 1961 to 1990 normal period.or each future period, we focused on 13 climate projections pre-ared for the AR4 IPCC assessment (Solomon et al., 2007) fromhe third Coupled Model Inter-comparison Project (Meehl et al.,007), which incorporate the A1B, A2, and B1 SRES greenhouseas emissions scenarios (Nakicenovic et al., 2000; Carter, 2007).he modeling groups included: BCCR-BCM2.0 (Norway), CCCMA-GCM3.1 (Canada), CSIRO-Mk3.0 (Australia), GFDL-CM2.1 (Unitedtates), GISS-eh (United States), MIROC3.2 (hires and MEDRES)Japan), MRI-CGCM2.3.2 (Japan), MPI-ECHAM5 (Germany), NCAR-CSM3 (United States), UKMO-HadCM3 (United Kingdom), andKMO-HadGEM1 (United Kingdom). All modeling groups and SRES
cenarios combinations are listed in Fig. 2. These 13 models areecommended for use in British Columbia, and encompass a widepan of potential climate shifts with mean annual temperaturencreases ranging between 1 ◦C and 4 ◦C, and mean annual pre-ipitation changes ranging between −5% and +15% by the 2050s,ompared to the 1961–1990 period (Murdock and Spittlehouse,011).
.3. Climate variable selection
Variable selection was carried out with an all-subsets regressionmplemented with the regsubsets( ) function within leaps packageLumley and Miller, 2009) for the R programming environment (Revelopment Core Team, 2008). This method employs a branch-nd-bound algorithum to perform an exhaustive search for the bestubsets of input variables for predicting the response variable inultiple linear regression (Goodenough et al., 2012). Here the best
inear unbiased estimate (BLUE) of disease intensity for each sus-eptible population at seven and 10 year site measurements wassed as the response variable, and the geographic and climate vari-bles represented the independent variables. The leaps algorithums parameterized to output the best model at each level, where aevel is defined as the number of variables considered in the modelt any one time. This step prevents the results from relying on aenalty model to determine model size. The best model at each
evel is determined by comparing the R2 values of the candidateodels, and selecting the model with the highest R2. Among the
est models at each level, we compared the adjusted coefficientsf determination (R2
adj) and the root mean square error (RMSE)
eteorology 180 (2013) 152– 163 155
values to decide which set of climate variables best accounted forthe variation in the field site dataset.
2.4. Model development and validation
Principle component analysis (PCA) was performed on theselected climate variables to maintain full environmental space,but remove collinearity. Variable selection with the leaps algorithmwas then repeated to determine a final principal component regres-sion model. In this final model, the best linear unbiased estimate ofdisease intensity of each susceptible population at each test site andmeasurement year represented the response variable, and the PCAcomponents represented the independent variables. At each stageof variable selection, the Shapiro–Wilk test was used to determine ifthe model residuals were normally distributed (P = 0.05). Residualsfrom the principal component regression were also plotted againstboth the independent variables and predicted values to determinemodel bias.
The principle component analysis and regression were carriedout with the functions princomp( ) with option cor = T and glm( )respectively for the R programming environment (R DevelopmentCore Team, 2008). Principal component axis scores were usedto generate province-wide risk maps under the aggregated2003–2008 climate and each of the future climate projections.
The relative importance of each PCA component predictor inthe overall model performance was determined by the lmg method(Lindeman et al., 1980) where R2 is decomposed into non-negativecontributions that automatically sum to the total R2. Lmg parti-tions R2 on orders of regressors using a simple unweighted average,which is considered to be an advantage over other methods(Gromping, 2007). Relative importance lmg statistic was calculatedwith the relaimpo package (Gromping, 2006) for the R program-ming environment (R Development Core Team, 2008).
The widely accepted 10-fold application (Harrell, 2001) of theK-fold cross-validation analysis was performed on the final modelwith the cvFit function within the cvTools package (Alfons, 2012)for the R programming environment (R Development Core Team,2008). Here the seven and 10 year field site dataset was partitionedinto 10 equal sized, stratified subsamples, where each single sub-sample was used as validation dataset for testing the model trainedwith the remaining nine subsamples. This process was repeatedso that each subsample was used exactly once as the validationdataset. The aim of cross-validation is to estimate the expected levelof fit of a model to a data set that is independent of the data thatwere used to train the model. Goodness-of-fit for the final modelwas calibrated with the mean square error (MSEcv) averaged overthe 10-folds. Further, the 10-fold cross validation was repeated 100times to produce a more robust estimate as well as confidence inter-vals for the mean square error. The resulting mean square errorover the repreated 10-fold cross validation indicates the measureof under- or overestimation of cedar leaf blight intensity from thefinal model on the observed dataset.
2.5. Western redcedar habitat and regional classes
Projected province-wide cedar leaf blight under current andfuture climate was reduced to areas of western redcedar habitatusing the species-suitable habitat projections previously gener-ated by Gray and Hamann (2013). For the current period, the2003–2008 cedar leaf blight projection was overlaid with the1961–1990 climate normals western redcedar map which closelyrepresents the current species distribution for the province. For
future climate scenarios, Gray and Hamann (2013) illustrateincreased disagreement on species habitat suitability toward the2080s, by comparing suitable habitat projections for westernredcedar across 18 different climate scenarios from the AR3
156 L.K. Gray et al. / Agricultural and Forest Meteorology 180 (2013) 152– 163
Fig. 2. Variation in projected mean annual temperature and precipitation shifts for the 2050s from current climate (2003–2008 average) among 13 climate scenarios for10 regions of western redcedar habitat: (a) Haida Gwaii; (b) Nass-Skeena; (c) Maritime-north; (d) Maritime-south; (e) Submaritime-north-low; (f) Submaritime-south-low;(g) Submaritime-north-high; (h) Submaritime-south-high; (i) Interior-north; (j) Interior-south. Northern regions are represented in the left column of plots and each hasb elevg
IpwsecbCos
cpr5c(pwliMe
een paired with the corresponding southern region in the right column or the lowraphically small and difficult to view).
PCC assessment (IPCC, 2007). Therefore to bound our diseaserojections with resonable confidence, we only considered areashere at least 70% of the models used in Gray and Hamann’s
tudy agreed habitat would be suitable for western redcedar inach future period. Although our study employed different futurelimate models (AR3 scenarios vs. AR4 scenarios), the differencesetween actual climate values from each set of models for Britisholumbia is minimal (Murdock and Spittlehouse, 2011). For detailsn the methodology and further results of the western redcedaruitable habitat model refer to Gray and Hamann (2013).
To compare model results among areas with characteristi-ally high and low disease intensity, we divided current androjected suitable western redcedar habitat into 10 geographicegions (Fig. 2). All coastal north-south divisions were made at1.05◦ latitude. Martime and Submaritime regions followed theurrent British Columbia western redcedar seed planning zonesWoods, 2011), with the Georgia Lowlands and Maritime seedlanning zones combined. For the Maritime regions, Haida Gwaiias considered one region, and Vancouver Island north of 51.15◦
atitude and east of 127.58◦ longitude was considered north, result-ng in three Maritime regions: Haida Gwaii, Maritime-north, and
aritime south. Submaritime regions were further divided by anlevation band set at 600 m, resulting in four Submaritime regions:
ation equivalent. (Submaritime elevation divisions are not depicted since they are
Submaritime-north-high, Submaritime-north-low, Submaritime-south-high, and Submaritime-south-low. The elevation thresholdwas chosen to reflect that cedar leaf blight is rarely observedabove 600 meters in these environments (J. Russell, unpubl. data).The interior western redcedar habitat was similarly divided intotwo regions at 51.05◦ latitude: Interior-north, and Interior-south.Finally, we included the Nass-Skeena, which occurs northeast ofthe Submaritime region, but is geographically too far west to beconsidered climatically similar to the Interior-north region. Size,climatic details, and a map of these regions are provided in Table 2and Fig. 2.
3. Results
3.1. Climate trends associated with cedar leaf blight
Comparisons between field sites with cedar leaf bight present(score > 1) and absent (score = 1) show trends of warmer and wettersites favoring increased disease (Table 1). On average, sites where
the disease occurs are approximately 3 ◦C warmer in the winter,1 ◦C warmer annually and receive 1000 mm more annual precip-itation than sites where the disease is absent. Similar trends arefound in the Maritime-north (M-N) and Haida Gwaii (HG) regions,
L.K. Gray et al. / Agricultural and Forest M
Tab
le
2M
ean
size
, cli
mat
e,
and
ced
ar
leaf
blig
ht
inte
nsi
ty
(±st
and
ard
dev
iati
on)
acro
ss
defi
ned
regi
ons
of
wes
tern
red
ced
ar
hab
itat
in
Bri
tish
Col
um
bia.
The
valu
es
in
this
tabl
e
refl
ect
clim
ate
aver
aged
over
the
2003
–200
8
per
iod
wh
end
isea
se
obse
rvat
ion
s
wer
e
coll
ecte
d.
Var
iabl
e
Reg
ion
sa
Int-
N
Int-
S
M-N
HG
M-S
Nas
s
SM-N
-h
SM-N
-l
SM-S
-h
SM-S
-l
Loca
tion
Size
(sq.
km)
8623
4227
19,3
65
9351
40,3
34
831
141
565
1186
745
Elev
atio
n
(m)
770
±
152
1152
±
270
180
±
172
178
±
156
327
±
270
403
±
173
828
±
210
172
±
173
1064
± 30
4 24
4
±
192
Cli
mat
e-ge
ner
alM
ean
ann
ual
tem
per
atu
re
(◦ C)
3.9
±
0.7
4.3
±
1.0
8.0
±
0.8
7.5
±
0.7
8.7
±
1.1
4.4
±
0.8
4.1
±
1.1
7.2
±
1.0
5.1
± 1.
2
8.3
±
1.0
Min
win
ter
tem
per
atu
re
(◦ C)b
−11.
1
±
0.8
−10.
6
±
1.2
0.8
±
1.3
0.7
±
1.2
0.1
±
1.4
−9.1
±
1.0
−9.1
±
2.4
−2.7
±
2.3
−7.4
±
1.7
−2.6
±
1.8
Mea
n
ann
ual
pre
cip
itat
ion
(mm
)
741
±
138
830
±
224
3675
±
921
2628
±
1044
2621
±
1065
741
±
217
1318
±
699
2218
±
638
1983
±
335
1961
±
280
Cli
mat
e-in
anal
ysis
Mea
n
sum
mer
tem
per
atu
re
(◦ C)
14.3
±
0.8
15.1
±
1.1
13.6
±
0.7
12.8
±
0.6
15.5
±
1.1
14.1
±
0.7
13.1
±
0.8
14.7
± 0.
8 14
.7
±
1.1
16.6
±
1.0
Max
July
tem
per
atu
re
(◦ C)
22.7
±
1.4
25.1
±
1.5
17.5
±
1.0
16.2
±
0.6
21.5
±
1.6
21.0
±
1.0
20.7
±
1.0
20.5
± 1.
4 22
.9
±
1.2
24.0
±
1.4
Max
Au
gust
tem
per
atu
re
(◦ C)
21.6
±
1.2
23.0
±
1.5
18.3
±
0.9
17.8
±
0.6
21.4
±
1.4
20.9
±
1.1
20.9
±
1.0
20.8
± 1.
3
22.0
±
1.1
23.2
±
1.1
Sum
mer
clim
ate
moi
stu
re
ind
ex
(cm
)
−9.9
±
4.1
−14.
2
±
4.2
33.1
±
12.8
15.7
±
9.2
2.0
±
11.1
−5.3
±
2.4
−10.
0
±
11.1
4.8
±
10.9
−9.0
±
4.2
−8.1
±
3.8
Spri
ng
pre
cip
itat
ion
(mm
)c13
1
±
26
173
±
43
849
±
215
606
±
264
583
±
260
115
±
44
245
±
143
450
±
150
3909
±
77
409
±
68Su
mm
er
pre
cip
itat
ion
(mm
)
184
±
28
176
±
36
495
±
133
309
±
89
240
±
96
196
±
26
156
± 94
268
±
90
186
±
32
179
±
28M
ay
pre
cip
itat
ion
(mm
)
49
±
8
64
±
14
182
±
49
122
±
49
105
±
42
43
±
6
47
± 27
92
±
36
86
±
20
85
±
18Ju
ly
pre
cip
itat
ion
(mm
)53
±
1233
±
816
5
±
4410
9
±
3269
±
33
70
±
11
58
± 30
87
±
24
49
±
10
49
±
11
Dis
ease
inte
nsi
tyC
edar
leaf
blig
ht
scor
e
(BLU
E)d
1.5
±
0.2
1.1
±
0.1
4.6
±
0.5
3.7
±
0.4
2.5
±
0.3
1.8
±
0.4
1.4
±
0.0
2.3
±
0.2
1.4
±
0.2
1.3
±
0.1
aR
egio
n
cod
es
are
as
foll
ows:
Inte
rior
-nor
th
(In
t-N
);
Inte
rior
-sou
th
(In
t-S)
;
Mar
itim
e-n
orth
(M-N
);
Hai
da
Gw
aii (
HG
);
Mar
itim
e-so
uth
(M-S
);
Nas
s-Sk
een
a
(Nas
s);
Subm
arit
ime-
nor
th-h
igh
(SM
-N-h
);
Subm
arit
ime-
nor
th-l
ow(S
M-N
-l);
Subm
arit
ime-
sou
th-h
igh
(SM
-S-h
);
Subm
arit
ime-
sou
th-l
ow
(SM
-S-l
).b
Win
ter
tem
per
atu
res
wer
e
aver
aged
over
Dec
embe
r,
and
Jan
uar
y
and
Febr
uar
y
of
the
foll
owin
g
year
.c
Spri
ng
(Mar
ch, A
pri
l,
May
),
sum
mer
(Ju
ne,
July
, Au
gust
),
May
and
July
pre
cip
itat
ion
vari
able
s
are
cum
ula
tive
valu
es.
dB
LUE:
best
lin
ear
un
bias
ed
esti
mat
e.
eteorology 180 (2013) 152– 163 157
which characteristically have high disease occurrence, comparedto regions where cedar leaf blight is rare, such as Interior-south(Int-S) (Table 2).
3.2. Projected climate shifts for western redcedar regions
The range of projected changes in mean annual temperature andprecipitation for each of the 10 regions across the 13 projected cli-mate models for the 2050s are illustrated in Fig. 2. In this figure,northern regions are represented in the left column of plots andeach has been paired with the corresponding southern region in theright column or the low elevation equivalent. Among all regions theCCCMA CGCM3.1 A2-run5 and UKMO-HadGEM1 A1B-run1 mod-els project the greatest increases in mean annual precipitation andtemperature, respectively (Fig. 2). The ranges of projected climateshifts are fairly consistent among all regions with the exception ofthe Submaritime-high regions (Fig. 2g and h). For the Submaritime-north-high region, projected precipitation increase is greater thanany other region, ranging between +32 and +57% (Fig. 2g). Based onmodel scenarios, this region could experience annual precipitationbetween approximately 1740 and 2070 mm by the 2050s, which iswell within a standard deviation of the current mean annual pre-cipitation of Haida Gwaii and Martime-north regions where cedarleaf blight is currently prevalent (Table 2). The Submaritime-highregions are the only two areas where mean annual temperature isprojected to increase under all general circulation models (Fig. 2eand g).
3.3. Climatic variable selection and disease risk projections undercurrent climate
The inital variable selection revealed eight climate variables thatbest describe the relationship between cedar leaf blight intensityand field site environments (R2
adj = 0.78; Table 1, climate in analy-sis), including the most highly correlated variable, summer climatemoisture index (cmiJJA, r2 = 0.75). The second variable selection ofPCA components reduced the number of explanatory variables tofive described by:
CLBBLUE = 2.13 + 0.35 × PC1 − 0.81
× PC4 − 0.93 × PC6 + 0.56 × PC7 − 8.31 × PC8 (1)
with predicted values constrained to ≥1. The amount of vari-ation in the observed disease intensity accounted for in theinitial model was maintained in the principal component regres-sion (R2
adj = 0.78). Additionally, the final model had a RSME of0.5 and all variable coefficients were found to be significant(P < 0.001). Model residuals were found to be normally distributed(Shapiro–Wilk = 0.15) and exhibited little apparent bias with eitherpredicted or independent values (data not shown). The repeated10-fold cross validation analysis produced a MSEcv = 0.526 with aconfidence interval CIMSE = (0.517, 0.534), indicating on average ourmodel under- or overestimates cedar leaf blight intensity by half ameasured score level.
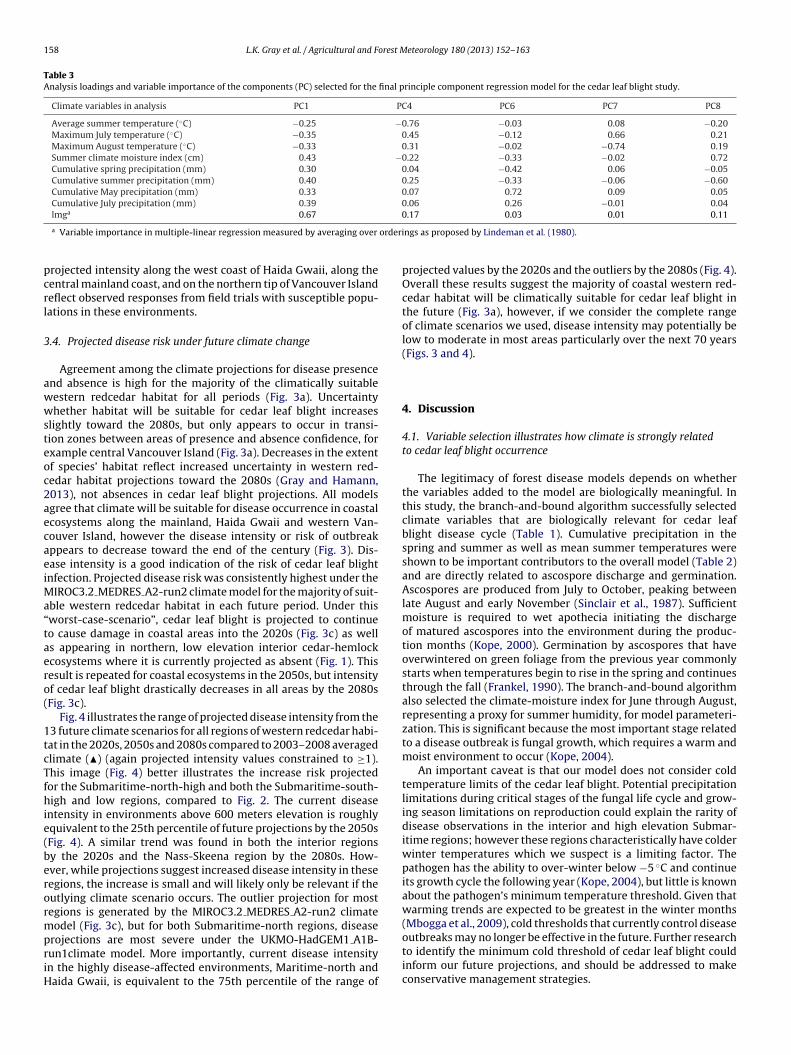
Relative importance (lmg) values indicate model accuracy isoverwhelmingly driven by PC1, which is approximately equallyweighted among the climate variables chosen in the initial variableselection (Table 3). PC4 and PC8, which are the second and thirddrivers, are weighted toward temperature and climate moistureindex variables, respectively (Table 3). The remaining two princi-ple components (PC6 and PC7) reflect significant weighting towardeither precipitation or temperature values (Table 3).
Projected disease intensity under 2003–2008 average climate isshown in Fig. 1. Cedar leaf blight intensity scores indicate degreeof climatic suitability for a disease outbreak, where green andred indicate low- and high-risk environments, respectively. Higher
158 L.K. Gray et al. / Agricultural and Forest Meteorology 180 (2013) 152– 163
Table 3Analysis loadings and variable importance of the components (PC) selected for the final principle component regression model for the cedar leaf blight study.
Climate variables in analysis PC1 PC4 PC6 PC7 PC8
Average summer temperature (◦C) −0.25 −0.76 −0.03 0.08 −0.20Maximum July temperature (◦C) −0.35 0.45 −0.12 0.66 0.21Maximum August temperature (◦C) −0.33 0.31 −0.02 −0.74 0.19Summer climate moisture index (cm) 0.43 −0.22 −0.33 −0.02 0.72Cumulative spring precipitation (mm) 0.30 0.04 −0.42 0.06 −0.05Cumulative summer precipitation (mm) 0.40 0.25 −0.33 −0.06 −0.60Cumulative May precipitation (mm) 0.33 0.07 0.72 0.09 0.05Cumulative July precipitation (mm) 0.39 0.06 0.26 −0.01 0.04
orderi
pcrl
3
awwsteoc2aecaeiMa“taero(
1tcTfhie(berormpriH
lmga 0.67
a Variable importance in multiple-linear regression measured by averaging over
rojected intensity along the west coast of Haida Gwaii, along theentral mainland coast, and on the northern tip of Vancouver Islandeflect observed responses from field trials with susceptible popu-ations in these environments.
.4. Projected disease risk under future climate change
Agreement among the climate projections for disease presencend absence is high for the majority of the climatically suitableestern redcedar habitat for all periods (Fig. 3a). Uncertaintyhether habitat will be suitable for cedar leaf blight increases
lightly toward the 2080s, but only appears to occur in transi-ion zones between areas of presence and absence confidence, forxample central Vancouver Island (Fig. 3a). Decreases in the extentf species’ habitat reflect increased uncertainty in western red-edar habitat projections toward the 2080s (Gray and Hamann,013), not absences in cedar leaf blight projections. All modelsgree that climate will be suitable for disease occurrence in coastalcosystems along the mainland, Haida Gwaii and western Van-ouver Island, however the disease intensity or risk of outbreakppears to decrease toward the end of the century (Fig. 3). Dis-ase intensity is a good indication of the risk of cedar leaf blightnfection. Projected disease risk was consistently highest under the
IROC3.2 MEDRES A2-run2 climate model for the majority of suit-ble western redcedar habitat in each future period. Under thisworst-case-scenario”, cedar leaf blight is projected to continueo cause damage in coastal areas into the 2020s (Fig. 3c) as wells appearing in northern, low elevation interior cedar-hemlockcosystems where it is currently projected as absent (Fig. 1). Thisesult is repeated for coastal ecosystems in the 2050s, but intensityf cedar leaf blight drastically decreases in all areas by the 2080sFig. 3c).
Fig. 4 illustrates the range of projected disease intensity from the3 future climate scenarios for all regions of western redcedar habi-at in the 2020s, 2050s and 2080s compared to 2003–2008 averagedlimate (�) (again projected intensity values constrained to ≥1).his image (Fig. 4) better illustrates the increase risk projectedor the Submaritime-north-high and both the Submaritime-south-igh and low regions, compared to Fig. 2. The current disease
ntensity in environments above 600 meters elevation is roughlyquivalent to the 25th percentile of future projections by the 2050sFig. 4). A similar trend was found in both the interior regionsy the 2020s and the Nass-Skeena region by the 2080s. How-ver, while projections suggest increased disease intensity in theseegions, the increase is small and will likely only be relevant if theutlying climate scenario occurs. The outlier projection for mostegions is generated by the MIROC3.2 MEDRES A2-run2 climateodel (Fig. 3c), but for both Submaritime-north regions, disease
rojections are most severe under the UKMO-HadGEM1 A1B-un1climate model. More importantly, current disease intensityn the highly disease-affected environments, Maritime-north andaida Gwaii, is equivalent to the 75th percentile of the range of
0.17 0.03 0.01 0.11
ngs as proposed by Lindeman et al. (1980).
projected values by the 2020s and the outliers by the 2080s (Fig. 4).Overall these results suggest the majority of coastal western red-cedar habitat will be climatically suitable for cedar leaf blight inthe future (Fig. 3a), however, if we consider the complete rangeof climate scenarios we used, disease intensity may potentially below to moderate in most areas particularly over the next 70 years(Figs. 3 and 4).
4. Discussion
4.1. Variable selection illustrates how climate is strongly relatedto cedar leaf blight occurrence
The legitimacy of forest disease models depends on whetherthe variables added to the model are biologically meaningful. Inthis study, the branch-and-bound algorithm successfully selectedclimate variables that are biologically relevant for cedar leafblight disease cycle (Table 1). Cumulative precipitation in thespring and summer as well as mean summer temperatures wereshown to be important contributors to the overall model (Table 2)and are directly related to ascospore discharge and germination.Ascospores are produced from July to October, peaking betweenlate August and early November (Sinclair et al., 1987). Sufficientmoisture is required to wet apothecia initiating the dischargeof matured ascospores into the environment during the produc-tion months (Kope, 2000). Germination by ascospores that haveoverwintered on green foliage from the previous year commonlystarts when temperatures begin to rise in the spring and continuesthrough the fall (Frankel, 1990). The branch-and-bound algorithmalso selected the climate-moisture index for June through August,representing a proxy for summer humidity, for model parameteri-zation. This is significant because the most important stage relatedto a disease outbreak is fungal growth, which requires a warm andmoist environment to occur (Kope, 2004).
An important caveat is that our model does not consider coldtemperature limits of the cedar leaf blight. Potential precipitationlimitations during critical stages of the fungal life cycle and grow-ing season limitations on reproduction could explain the rarity ofdisease observations in the interior and high elevation Submar-itime regions; however these regions characteristically have colderwinter temperatures which we suspect is a limiting factor. Thepathogen has the ability to over-winter below −5 ◦C and continueits growth cycle the following year (Kope, 2004), but little is knownabout the pathogen’s minimum temperature threshold. Given thatwarming trends are expected to be greatest in the winter months(Mbogga et al., 2009), cold thresholds that currently control disease
outbreaks may no longer be effective in the future. Further researchto identify the minimum cold threshold of cedar leaf blight couldinform our future projections, and should be addressed to makeconservative management strategies.
L.K. Gray et al. / Agricultural and Forest Meteorology 180 (2013) 152– 163 159
Fig. 3. Projections of cedar leaf blight (CLB) suitability under climate scenarios for the 2020s, 2050s and 2080s. (a) The degree of consensus among projections based onmultiple climate change scenarios, (b) average expected disease intensity based on multiple climate change scenarios, and (c) maximum projected disease intensity under as of GM
4o
c
ingle model which represents the “worst-case scenario”. See text for a description
.2. Future decline of disease risk could reflect climate thresholds
f cedar leaf blightPrimary concerns surrounding endemic pathogens and climatehange stem from the theory that “warmer and wet is better”
C model MIROC3.2-MEDRES A2-run2.
for these infectious agents. The majority of climate scenarios we
considered project both increased temperatures and precipitationfor future western redcedar habitat in the province (Fig. 2). How-ever, in most areas projected disease risk unexpectedly decreasessignificantly toward the 2080s (Fig. 3), compared to current
160 L.K. Gray et al. / Agricultural and Forest M
Fig. 4. Range of projected cedar leaf blight disease intensity for 10 regions of west-ern redcedar habitat in British Columbia for the 2020s, 2050s and 2080s. For eachregion and period, disease intensity under the 2003–2008 averaged climates is rep-resented as a solid triangle (�), the projection median is represented by a solid line,and the lower and upper box edges represent the 25th and 75th percentiles for eachregion, respectively. Lower and upper whiskers represent the minimum and max-ia
pfitsniami
CbW
will decrease in the future, adopting overly optimistic reforesta-
mum projected intensity values constrained to ≥1, and upper outlier projectionsre indicated by an open circle (©).
rojected levels (Fig. 1). Three reasons could account for thisnding. First, our model could be underestimating disease risk dueo poor model fit. Both the repeated 10-fold cross-validation meanquare error MSEcv = 0.526 and the adjusted coefficient of determi-ation Radj = 0.78 suggest the inclusion of additional variables may
mprove the model performance. However these values do suggest good approximation of disease observations and out-performultivariate regression models explaining climate-disease
nteractions previously reported (Watt et al., 2010).Second, we have not considered field sites outside British
olumbia, and we could therefore be excluding crucial cedar leaflight occurrences in warmer, wetter environments in coastalashington, Oregon, and California that may be similar to future
eteorology 180 (2013) 152– 163
projections. While cedar leaf blight is present in these environ-ments (Kope, 2000) it has been rarely documented and it isconsidered a minor problem (USDA, 1983). We can thereforepresume that the inclusion of environments external to BritishColumbia may adjust the presence-absence disease projections(Fig. 3a), but would have little effect on the disease intensity results(Fig. 3b and c).
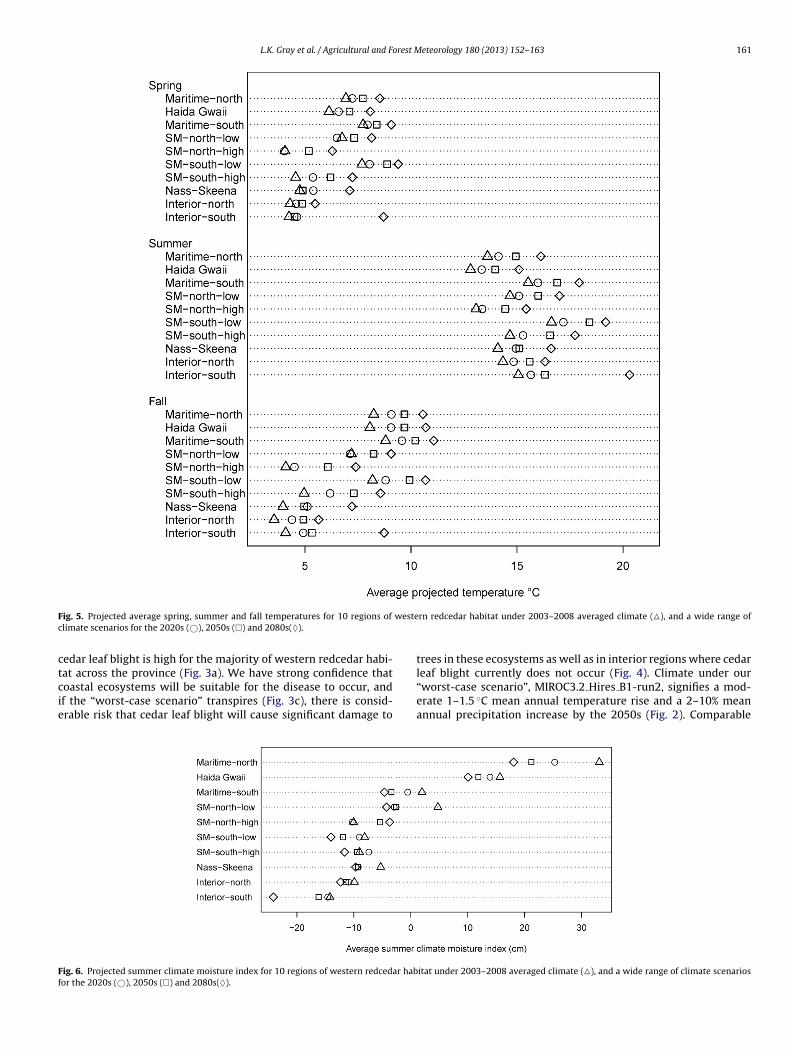
Finally, the decline of disease risk under future climate changecould reflect incongruities between projected climate shifts and theoptimal climate thresholds for the pathogen. Kope (2004) foundthe temperature range for cedar leaf blight ascospore dischargeand germination to be between 5 and 28 ◦C, with 15 ◦C represent-ing the optimum. In addition, the temperature range for fungalgrowth within infected western redcedar was found to be between13 and 25 ◦C, with 20 ◦C initiating accelerated growth (Pawsey,1960). Interestingly, projected temperature increases for the 2050ssupport amplified ascospore discharge and germination, averag-ing approximately 7.5 ◦C in the spring, 15 ◦C in the summer, and10 ◦C in the fall in the current high risk Maritime-north and HaidaGwaii regions (Fig. 5). Moreover, projected maximum summer tem-peratures range between 18 and 20 ◦C in current high disease riskregions for the 2050s further supporting accelerated fungal growth.However, on average, summer climate-moisture indices for allregions in the 2050s decrease by 49% with some values shiftingfrom positive to negative (Fig. 6) indicating potential evapotrans-piration will increase in all regions and, in some areas, exceedcumulative precipitation. A similar trend of reduced moisture avail-ability can be inferred for the spring and fall seasons as summerclimate moisture values are highly correlated with the values forspring and fall (spring r2 = 0.84, fall r2 = 0.76).
The Submaritime regions above 600 m are the only regionswhere projected climate moisture indices are greater than cur-rent values (Fig. 6). Correspondingly, we see the most pronouncedincreases in disease intensity in these regions with current mea-surement falling less than or equal to the 25th percentile offuture projections (Fig. 4). Reduced leaf wetness can slow germi-nation and fungal growth and eventually cause the fungus to dieif persistent (Kope, 2004). Potential evapotranspiration is derivedfrom elevation, a monthly cold temperature reduction factor, andmonthly vapor pressure deficit, and is highly correlated to the max-imum temperature for the period of measurement (Hogg, 1997).Projected climate shifts suggest that precipitation increases maynot keep pace with expected temperature increases resulting inhigher potential evapotranspiration and greater water-stress forthe pathogen possibly leading to decreased disease intensity in thefuture.
4.3. Range of model results should guide population selection forwestern redcedar reforestation
To aid seed transfer strategies for reforestation in BritishColumbia, emphasis has been placed on projecting where climat-ically suitable habitat for the province’s commercially importanttree species is expected to occur under future climate change(Hamann and Wang, 2006; Gray and Hamann, 2013; Wang et al.,2012a). Projecting disease risk from climate change may refinemanagement strategies for commercial tree species that are antici-pated to maintain or expand their climatically suitable habitat; oneof the most significant being western redcedar (Gray and Hamann,2013).
Even though our model projections suggest the risk of signif-icant damage from cedar leaf blight in western redcedar habitat
tion strategies may not be prudent for a number of reasons. First,while disease intensity varies among the wide range of climatescenarios, model agreement on the future climatic suitability for
L.K. Gray et al. / Agricultural and Forest Meteorology 180 (2013) 152– 163 161
F westec
ctcie
Ff
ig. 5. Projected average spring, summer and fall temperatures for 10 regions of
limate scenarios for the 2020s (©), 2050s (�) and 2080s(♦).
edar leaf blight is high for the majority of western redcedar habi-
at across the province (Fig. 3a). We have strong confidence thatoastal ecosystems will be suitable for the disease to occur, andf the “worst-case scenario” transpires (Fig. 3c), there is consid-rable risk that cedar leaf blight will cause significant damage toig. 6. Projected summer climate moisture index for 10 regions of western redcedar habor the 2020s (©), 2050s (�) and 2080s(♦).
rn redcedar habitat under 2003–2008 averaged climate (�), and a wide range of
trees in these ecosystems as well as in interior regions where cedar
leaf blight currently does not occur (Fig. 4). Climate under our“worst-case scenario”, MIROC3.2 Hires B1-run2, signifies a mod-erate 1–1.5 ◦C mean annual temperature rise and a 2–10% meanannual precipitation increase by the 2050s (Fig. 2). Comparableitat under 2003–2008 averaged climate (�), and a wide range of climate scenarios

1 orest M
imfto2Hr
ktiwtwgtosciera
sanii
rmerdaiehrt4en
(alassti
lCeta2praab
62 L.K. Gray et al. / Agricultural and F
ncreases of approximately 2 ◦C mean annual temperature and 12%ean annual precipitation have been observed in British Columbia
rom approximately 1975–2000 (Mbogga et al., 2009), suggestinghat “worst-case” climate shifts could very likely materialize. More-ver, if temperature slightly exceeds past shifts and follows the–3.5 ◦C mean annual temperature rise projected by the UKMO-adGEM1 A1B-run1 climate model, the northern Submaritime
egions may also experience higher disease intensity (Fig. 4).Second, due to the long-lived nature of forest trees, little is
nown about the selective and evolutionary forces that determinehe balance between the predictability of infection and selectiventensity in forest ecosystems (Burdon et al., 2012). Climate change
ill affect how temperature and precipitation favor the pathogen,he tree species, or both. For example, forest pathogens may over-helm ecosystems as their ability to adapt to new climates is far
reater than their long-lived hosts (Sturrock et al., 2011). In con-rast, elevated CO2 may increase host resistance to disease as wasbserved with loblolly pine (Pinus taeda) and northern red oakeedlings (Quercus rubra) to fusiform rust fungus (Cronartium quer-uum f. sp. fusiforme) and pitch canker fungus (Fusarium circinatum)n the southern United States (Runion et al., 2010). Unforeseennvironmental shifts that favor cedar leaf blight could thereforeesult in elevated levels of disease and significant maladaptationnd mortality not represented in the model projections.
Third, influxes in disease outbreaks may be driven by daily,mall scale or accumulated climate events which are difficult toccurately measure and predict at a provincial level. For example,eighboring trees may experience vastly different water availabil-
ty, depending on overstory cover, which could greatly affect theirnfection rate and the potential for ascospore germination.
Fourth, climate is not homogenous across some of the broaderegions we defined in this study. Disease outbreaks in keyicrosites could therefore have been outweighed when consid-
ring the regional average. For example, in the Maritime-southegion, the eastern coast of Vancouver Island is categorized as veryry or moist Maritime habitat, but the western coast is categorizeds very wet Montane and Submontane environments. Correspond-ngly, cedar leaf blight occurs at very low levels or is absent on theastern coast and higher elevations, but is prevalent at moderate toigh levels on the western coast as evidence by our Maritime southegion test sites. Projections suggest cedar leaf blight intensity inhe Maritime-south region will range between 1 (CLB absent) and
(CLB moderate-high intensity) in the future, however we wouldxpect there will be key microsites where disease intensity will beotably higher than the regional average.
Finally, cedar leaf blight is most damaging to young seedlingsFrankel, 1990; Kope, 2004). Under the worst case scenario, aver-ged disease intensity projections for the 2020s and 2050s show aevel 3 or greater for the majority of the west coast of Haida Gwaiind the northern tip of Vancouver Island (Fig. 3c). At these inten-ities, cedar leaf blight can cause up to 40% reduction in growth oneven to 10 year-old trees (data not shown). This was also shown byhe negative correlation between CLB breeding values and heightn Russell and Yanchuk (2012).
All of the above suggests that deployment strategies for coastalow elevation areas should consider disease resistant populations.urrent geographically-based seed transfer for wildstand west-rn redcedar in the Maritime seed planning zone allows seedlotso be moved 600 m upwards and 400 m downwards in elevation,nd 3◦ latitude north and south from point of origin (Snetsinger,005). These relatively relaxed transfer guidelines are a result ofrevious studies that have indicated minimal population variation
elated to seed origin in growth and physiological traits (Cherrynd Lester, 1992; Rehfeldt, 1994; Grossnickle et al., 2005; Russellnd Krakowski, 2010). However, population variation in cedar leaflight resistance appears more adaptive than for general growtheteorology 180 (2013) 152– 163
traits, such that trees from milder and wetter ecosystems weremore resistant to the disease (Russell et al., 2007; Russell andKrakowski, 2010). This, in conjunction with our results, would sug-gest that current transfer guidelines may not be appropriate whenconsidering cedar leaf blight infection. Movement of wildstandsouthern populations northward and of populations over 500 melevation downward should be avoided. For reforestation in sus-ceptible environments, the use of resistant wildstand populationsmay be an efficient management strategy to minimize the probabil-ity of cedar leaf blight outbreaks. However, in the southern portionof coastal British Columbia, the majority of western redcedar stockused in reforestation originates from seed orchard lots that includeparents tested for volume. These seedlots can be transferred freelywithin the Maritime seed planning zone (SPZ) up to 700 m eleva-tion and between 48◦ and 52◦ N latitude. Cedar leaf blight severityhas an on-significant genetic correlation with growth (Russell andYanchuk, 2012), resulting in current orchard seedlots not havingany substantive improvements in cedar leaf blight resistance.
For all disease risk assessments, resilience to negative surprisesshould be the most important policy aim (Shaw, 2009). There-fore, results of model projections from this study can be used asa guide to making reforestation investments with cedar leaf blight-resistant stock while considering a wide range of potential climateshifts for the province. In addition, disease intensity projectionsunder current climate could be used to identify areas that havemost likely historically been under significant disease pressurewhere new resistant western redcedar populations could be foundto enhance breeding programs. As more incident data on cedar leafblight is accumulated, and as climate models and global circula-tion model predictions improve, these models can be refined overtime to provide a very dynamic tool to further evaluate and adjustdeployment decisions for western redcedar.
Acknowledgements
We would like to thank the NSERC CREATE Program in Forestsand Climate Change for funding this research. Additionally wewould like to sincerely thank Jake King for developing the field CLBrating system and recording the ratings on tens of thousands oftrees across BC, Craig Ferguson and Jodie Krakowski for data man-agement, Harry Kope for his advice and assistance with the speciespathology, and Andreas Hamann for access to spatial software.
References
Alfons, A., 2012. cvTools: Cross-Validation Tools for Regression Models. R PackageVersion 0.3.2, URL http://CRAN.R-project.org/package=cvTools
Ayers, M.P., Lombardero, M.J., 2000. Assessing the consequences of global changefor forest disturbance from herbivores and pathogens. Sci. Total Environ. 262,263–286.
Bergot, M., Cloppet, E., Pernaud, V., Deque, M., Marcais, B., Desprez Loustau, M., 2004.Simulation of potential range expansion of oak disease caused by Phytophthoracinnamomi under climate change. Global Change Biol. 10, 1539–1552.
Boland, G.J., Melzer, M.S., Hopkin, A., Higgins, V., Nassuth, A., 2004. Climate changeand plant diseases in Ontario. Can. J. Plant. Pathol. 26, 335–350.
Bourgeois, G., Bourque, A., Deaudelin, G., 2004. Modelling the impact of climatechange on disease incidence: a bioclimatic challenge. Can. J. Plant Pathol. 26,285–290.
Bradshaw, R.E., 2004. Dothistroma (red-band) needle blight of pines and the doth-istromin toxin: a review. Forest Pathol. 34, 163–185.
Burdekin, D.A., Phillips, D.H., 2008. Chemical control of Didymascella thujina onwestern red cedar in forest nurseries. Ann. Appl. Biol. 67, 131–136.
Burdon, J.J., Thrall, P.H., Nemri, A., 2012. Approaches to understanding the impact oflife-history features on plant-pathogen co-evolutionary dynamics. In: Sniezko,R., YanchukF A.D., Kliejunas, J.T., Palmieri, K.M., Alexander, J.M., Frankel, S.J.(Eds.), Proceedings of the Fourth International Workshop on the Genetics of
Host–Parasite Interactions in Forestry: Disease and Insect Resistance in ForestTrees. Gen. Tech. Rep. PSW-GTR-240. Pacific Southwest Research Station, ForestService, U.S. Department of Agriculture, Albany, CA, pp. 104–111, p. 372.Carter, T.R., 2007. General Guidelines on the Use of Scenario Data for ClimateImpact and Adaptation Assessment. Version 2. Task Group on Data and Scenario

orest M
C
D
D
D
F
G
G
G
G
G
G
H
H
H
H
I
K
K
K
K
K
KK
L
L
L
M
M
M
M
M
L.K. Gray et al. / Agricultural and F
Support for Impact and Climate Assessment, Intergovernmental Panel on Cli-mate Change.
herry, M.L., Lester, D.T., 1992. Genetic variation in Chamaecyparis nootkatensis fromcoastal British Columbia. West. J. Appl. Forerst. 7, 25–29.
aly, C., Halbleib, M., Smith, J.I., Gibson, W.P., Doggett, M.K., Taylor, G.H., Curtis,J., Pasteris, P.P., 2008. Physiographically sensitive mapping of climatologicaltemperature and precipitation across the conterminous United States. Int. J.Climatol. 28, 2032–2064.
esprez-Loustau, M.-L., Marcais, B., Nageleisen, L.M., Ouiym, D., Vannini, A., 2006.Interactive effects of drought and pathogens in forest trees. Ann. For. Sci. 63,597–612.
ukes, J.S., Pontius, J., Orwig, D., Garnas, J.R., Rodgers, V.L., Brazee, N., Cooke, B.,Theoharides, K.A., Stange, E.E., Harrington, R., Ehrenfeld, J., Gurevitch, J., Lerdau,M., Stinson, K., Wick, R., Ayres, M., 2009. Responses of insect pests, pathogens,and invasive plant species to climate change in the forests of northeastern NorthAmerica: what can we predict? Can. J. For. Res. 39, 231–248.
rankel, S., 1990. Evaluation of Fungicides to Control Cedar leaf blight on westernred cedar at Hombolt Nursery. Forest Pest Management Report No. 90-01. USDAForest Service, Pacific Southwest Region, 4pp.
ilmour, A.R., Gogel, B.J., Cullis, B.R., Welham, S.J., Thompson, R., 2009. ASReml UserGuide. Release 3.0. VSN International, Hemel Hempstead.
oodenough, A.E., Hart, A.G., Stafford, R., 2012. Regression with empirical variableselection: description of a new method and application to ecological datasets.PLoS ONE 7, e34338, doi:10.1371/journal.pone.0034338.
ray, L.K., Hamann, A., 2013. Tracking suitable habitat for tree populations underclimate change in western North America. Clim. Change 117, 289–303.
romping, U., 2006. relaimpo: Relative Importance of Regressors in Linear Models.R Package Version 1.1-1, URL http://CRAN.R-project.org/package=relaimpo
romping, U., 2007. Estimators of relative importance in linear regression based onvariance decomposition. Am. Stat. 61, 139–147.
rossnickle, S.G., Fan, S., Russell, J.H., 2005. Variation in gas exchange and water useefficiency patterns among populations of western redcedar. Trees-Struct. Funct.19, 32–42.
amann, A., Wang, T., 2005. Models of climate normals for genecology and climatechange studies in British Columbia. Agric. For. Meteorol. 128, 211–221.
amann, A., Wang, T., 2006. Potential effects of climate change on ecosystem andtree species distribution in British Columbia. Ecology 87, 2773–2786.
arrell, F.E., 2001. Regression Modeling Strategies: With Applications to Linear Mod-els, Logistic Regression, and Survival Analysis. Springer-Verlag, Inc., New York,NY.
ogg, E.H., 1997. Temporal scaling of moisture and the forest-grassland boundaryin western Canada. Agric. For. Meteorol. 84, 115–122.
PCC, 2007. Climate Change 2007: The Physical Basics (Summary for Policymakers).Intergovernmental Panel on Climate Change, ISBN 9780521 70596-7.
elly, M., Guo, Q., Liu, D., Shaari, D., 2007. Modeling the risk for a new invasive forestdisease in the United States: an evaluation of five environmental niche models.Comput. Environ. Urban 31, 689–710.
ope, H.H., Sutherland, J.R., 1994. Keithia blight: review of the disease, and researchon container-grown, western redcedar in British Columbia, Canada. In: Perrin, R.,Sutherland, J.R. (Eds.), Disease and insects in forest nurseries. Proceedings of the2nd Meeting of the IUFRo Working Party. S2.07-09. 3–10 October 1993, Dijon,France. Institute National de la Recherche Agronomique, Versailles, France, pp.27–44.
ope, H.H., Sutherland, J., Trotter, D., 1996. Influence of cavity size, seedling growingdensity and fungicide applications on Keithia blight of western redcedar seedlinggrowth and field performance. New Forest. 11, 137–147.
ope, H.H., 1998. Analysis of proteins of disease-free and Didymascella thujina-infrested leaves of western red cedar (Thujia plicata). Plant Dis. 82, 210–212.
ope, H.H., Trotter, D., 1998a. Evaluation of mancozeb and propiconazole to con-trol Keithia leaf blight of container-grown western red cedar. For. Chron. 74,583–587.
ope, H.H., 2000. Didymascella thujina. Can. J. Plant Pathol. 22, 407–409.ope, H.H., 2004. Didymascella thujina. In: Forestry Compendium, 2005 Edition. CAB
International, Wallington, UK.indeman, R., Merenda, P., Gold, R., 1980. Introduction to Bivariate and Multivariate
Analysis. Scott Foresman, and Company, Glenview, IL.ines, R., 1988. Choice of seed origins for the main forest species in Britain: eastern
redcedar UK. Forest. Comm. Bull. 66, 37–38.umley, T., Miller, A., 2009. leaps: Regression Subset Selection. R package Version
2.7, URL http://CRAN.R-project.org/package=leapsadden, L.V., Hughes, G., van den Bosch, F., 2007. The Study of Plant Disease Epi-
demics. APS Press, St. Paul, MN.bogga, M.S., Hamann, A., Wang, T., 2009. Historical and projected climate data
for natural resource management in western Canada. Agric. For. Meteorol. 149,881–890.
eehl, G.A., Covey, C., Taylor, K.E., Delworth, T., Stouffer, R.J., Latif, M., McAvaney, B.,Mitchell, J.F.B., 2007. The WCRP CMIP3 multimodel dataset: a new era in climatechange research. Bull. Am. Meteorol. Soc. 88, 1383–1394.
eentemeyer, R.K., Anacker, B.L., Mark, W., Rizzo, D.M., 2008. Early detection ofemerging forest disease using dispersal estimation and ecological niche model-ing. Ecol. Appl. 18, 377–390.
oore, B., Green, J.L., 1976. Leaf-browning and shedding-Arbor-Vitae and Juniper.Ornamentals Northwest Achieve 1, 1–2.
eteorology 180 (2013) 152– 163 163
Murdock, T.Q., Spittlehouse, D.L., 2011. Selecting and Using Climate Change Sce-narios for British Columbia. Pacific Climate Impacts Consortium. University ofVictoria, Victoria, BC, 39 pp.
Nakicenovic, N., Alcamo, J., Davis, G., de Vries, B., Fenhann, J., Gaffin, S., Gregory, K.,Grübler, A., Jung, T.Y., Kram, T., La Rovere, E.L., Michaelis, L., Mori, S., Morita, T.,Pepper, W., Pitcher, H., Price, L., Raihi, K., Roehrl, A., Rogner, H.-H., Sankovski, A.,Schlesinger, M., Shukla, P., Smith, S., Swart, R., van Rooijen, S., Victor, N., Dadi, Z.,2000. IPCC Special Report on Emissions Scenarios. Cambridge University Press,Cambridge, United Kingdom and New York, NY, USA, 599 pp.
Pawsey, R.G., 1960. An investigation into Keithia disease of Thuja plicata. Forestry33, 174–186.
Porter, W.A., 1957. Biological Studies on Western Redcedar Blight Caused by Kei-thia thujina Durand. Canada Department of Agriculture, Forest Biology Division,Victoria, BC, Interim report.
R Development Core Team, 2008. R: A Language and Environment for StatisticalComputing. R Foundation for Statistical Computing, Vienna, Austria, ISBN 3-900051-07-0.
Rehfeldt, G., 1994. Genetic structure of western redcedar populations in the interiorwest. Can. J. For. Res. 24, 670–680.
Runion, G.B., Prior, S.A., Rogers, H.H., Mitchell, R.J., 2010. Effects of elevated atmo-spheric CO2 on two southern forest diseases. New Forest. 39, 275–285.
Russell, J.H., Kope, H.H., Ades, P., Collinson, H., 2007. Variation in cedar leaf blight(Didymascella thujina) resistance of western redcedar (Thuja plicata). Can. J. For.Res. 37, 1978–1986.
Russell, J.H., Krakowski, J., 2010. Yellow-cedar and western redcedar adaptation topresent and future climates. In: Proceedings a Tale of Two Cedars: InternationalSymposium on Yellow-cedar and Western Redcedar PNW GTR-828.
Russell, J.H., Yanchuk, A.D., 2012. Breeding for growth improvement and pest resis-tance in Thuja plicata. In: Proceedings of the 4th International Workshop onGenetics of Host-Parasite Interactions in Forestry. Gen. Tech. Rep. PSW-GTR-240,Pacific Southwest Research Station, Forest Service. U.S. Department of Agricul-ture, Albany, CA.
Seem, R.C., 1984. Disease incidence and severity relationships. Annu. Rev. Phy-topathol. 22, 133–150.
Sinclair, W.A., Lyon, H.H., Johnson, W.T., 1987. Diseases of Trees and Shrubs. CornellUniversity Press, Ithaca, NY.
Snetsinger, J., 2005. Chief Forester’s Standards for Seed Use. BC Ministry of Forests,Victoria, BC.
Soegaard, B., 1956. Leaf blight resistance in Thujia. In: Yearbook 1956. Royal Veteri-nary and Agricultural College, Copenhagen, Denmark, pp. 30–48.
Sturrock, R.N., Frankel, S.J., Brown, A.V., Hennon, P.E., Kliejunas, J.T., Lewis, K.J., Wor-rall, J.J., Woods, A.J., 2011. Climate change and forest diseases. Plant. Pathol. 60,133–149.
Seem, R.C., 2004. Forcasting plant disease in a changing climate: a question of scale.Can. J. Plant Pathol. 26, 274–283.
Shaw, M., 2009. Preparing for changes in plant disease due to climate change. PlantProd. Sci. 45, S3–S10.
Solomon, S., Qin, D., Manning, M., Marquis, M., Averyt, K., Tignor, M.M.B., MillerJr., H.L., Chen, Z. (Eds.), 2007. Climate Change 2007: The Physical Science Basis.Cambridge University Press, Cambridge UK, 996 pp.
Trotter, D., Shrimpton, G., Kope, H.H., 1994. The effects of Keitha blight on outplant-ing performance of western redcedar container seedlings at two reforestationsites in British Columbia – preliminary results. In: Landis, T.D., Dumroese, R.K.(Eds.), National Proceedings, Forest and Conservation Nursery Association. Gen-eral Technical Report. RM-257. US Department of Agriculture, Forest Service,Rocky Mountain Forest and Range Experiment Station, Fort Collins, CO, pp.196–202.
USDA, 1983. Forest Disease Management Notes. Pacific Northwest Region, USDAForest Service, Portland, OR, 54 p.
Venette, R.C., Cohen, S.D., 2006. Potential climatic suitability for establishment ofPhytophthora ramorum within the contiguous United States. Forest Ecol. Manag.231, 18–26.
Venette, R.C., 2009. Implication of global climate change on the distribution andactivity of Phytophthora ramorum. In: McManus, K.A., Gottschalk, K.W. (Eds.),Proceedings of the 20th U.S. Department of Agriculture Interagency ResearchForum on Invasive Species 2009. General Technical Report NRS-P-51. US Depart-ment of Agriculture, Forest Service, Northern Research Station, NewtownSquare, PA, pp. 58–59.
Watt, M.S., Stone, J.K., Hood, I.A., Palmer, D.J., 2010. Predicting the severity of Swissneedle cast on Douglas-fir under current and future climate in New Zealand.Forest Ecol. Manag. 260, 2232–2240.
Wang, T., Campbell, E.M., O’Neill, G.A., Aitken, S.N., 2012a. Projecting future distribu-tions of ecosystem climate niches: uncertainties and management applications.Forest Ecol. Manag. 279, 128–140.
Wang, T., Hamann, A., Spittlehouse, D., Murdock, T.N., 2012b. ClimateWNA – high-resolution spatial climate data for western North America. J. Appl. Meteorol.Clim. 61, 16–29.
Woods, J., 2011. Forest Genetics Council of BC Business Plan 2011/12. SD399.5.B74.
Forest Genetics Council of BC, Victoria, BC.Woods, A., 2003. Species diversity and forest health in northwest British Columbia.For. Chron. 79, 892–897.
Woods, A., Coates, K.D., Hamann, A., 2005. Is an unprecedented dothistroma needleblight epidemic related to climate change? Bioscience 55, 761–769.