agricultural product consumption risk assessment · 2020-04-14 · agricultural trends: potential...
TRANSCRIPT

Housatonic River Project
Agricultural Product Consumption Risk
Assessment
Agricultural Product Consumption Risk
Assessment
George Friesand
Donna J. Vorhees Menzie-Cura & Associates, Inc.
George Friesand
Donna J. Vorhees Menzie-Cura & Associates, Inc.
Housatonic River Project pg 2
OverviewOverview
• Identify current and possible future agricultural activities in the floodplain
• Estimate contaminant concentrations in animal products and home garden produce
• Select appropriate exposure assumptions
• Estimate human health risk associated with consuming food produced in the floodplain
• Identify current and possible future agricultural activities in the floodplain
• Estimate contaminant concentrations in animal products and home garden produce
• Select appropriate exposure assumptions
• Estimate human health risk associated with consuming food produced in the floodplain

Housatonic River Project pg 3
Current Agricultural Activities in the FloodplainCurrent Agricultural Activities in the Floodplain
COMMERCIAL ACTIVITY Dairy
corn silage grass-based feed grazing (heifers/dry cows)
Fruits and vegetables Free-range poultry NON-COMMERCIAL ACTIVITY Beef
grazing Deer hunting Home gardening Wild crop harvesting (e.g., ferns)
COMMERCIAL ACTIVITY Dairy
corn silage grass-based feed grazing (heifers/dry cows)
Fruits and vegetables Free-range poultry NON-COMMERCIAL ACTIVITY Beef
grazing Deer hunting Home gardening Wild crop harvesting (e.g., ferns)
Housatonic River Project pg 4
Agricultural Trends: Potential Future Activities in the FloodplainAgricultural Trends: Potential Future Activities in the Floodplain
• Dairy farms on the decline• Commercial dairy operations could be converted
to beef, goat, or sheep operations• Niche products (free-range poultry, organic beef
and dairy)• Backyard animal products (beef, dairy, poultry)
• Dairy farms on the decline• Commercial dairy operations could be converted
to beef, goat, or sheep operations• Niche products (free-range poultry, organic beef
and dairy)• Backyard animal products (beef, dairy, poultry)
Housatonic River Project pg 5
Exposure Scenarios:consumption of PlantsExposure Scenarios:consumption of Plants
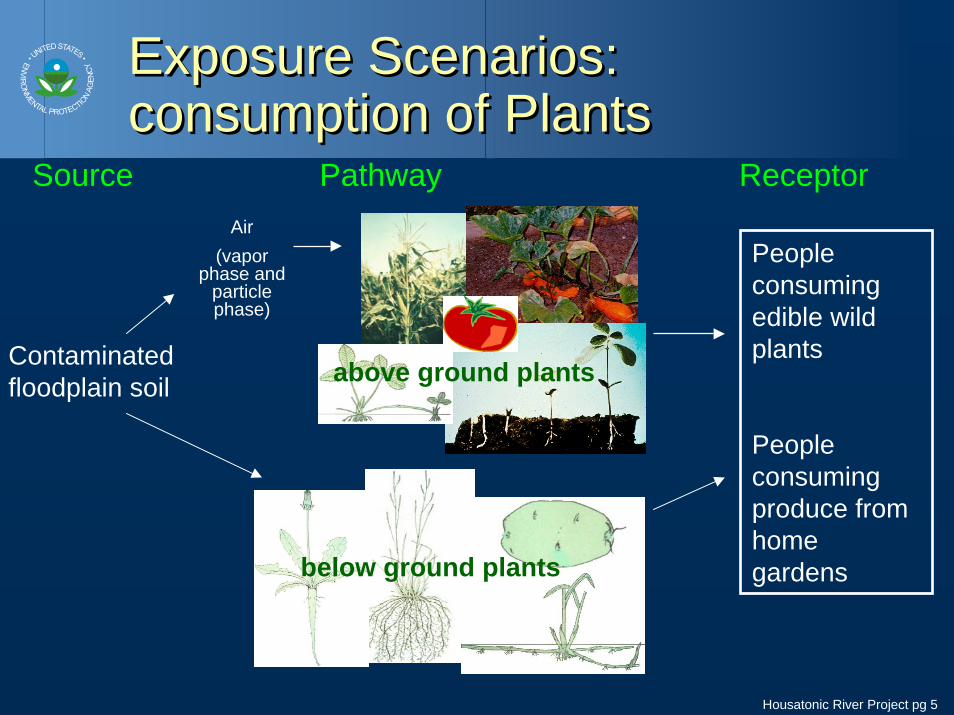
Source Pathway Receptor
Contaminated floodplain soil
below ground plants
above ground plants
Air(vapor
phase and particle phase)
People consuming edible wild plants
People consuming produce from home gardens

Housatonic River Project pg 6
Exposure Scenarios: Consumption of Animal ProductsExposure Scenarios: Consumption of Animal Products
Source Pathway Receptor
grazing & ingestion of soil
commercial and backyard farm families consuming beef, milk, chicken and eggs
hunting families consuming venison
dairy cattlebeef cattlepoultrygoatssheep deer
Contaminated floodplain soil
corn silage and grass-based feeds
Air(vapor
phase and particle phase)
Housatonic River Project pg 7
How were Farms and Gardens Assessed?How were Farms and Gardens Assessed?
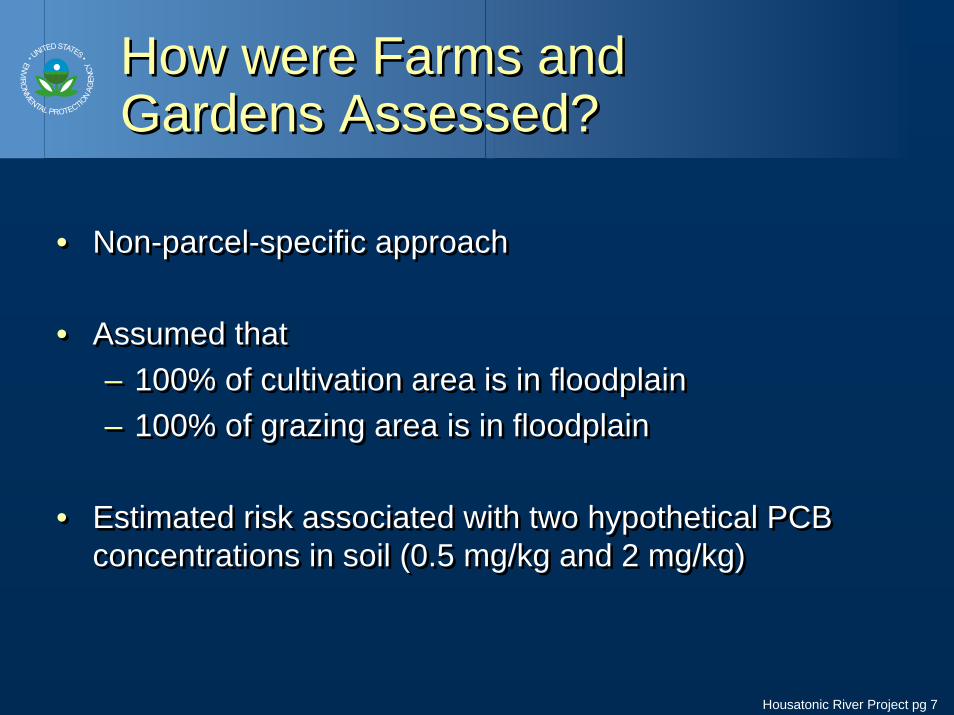
• Non-parcel-specific approach
• Assumed that– 100% of cultivation area is in floodplain– 100% of grazing area is in floodplain
• Estimated risk associated with two hypothetical PCB concentrations in soil (0.5 mg/kg and 2 mg/kg)
• Non-parcel-specific approach
• Assumed that– 100% of cultivation area is in floodplain– 100% of grazing area is in floodplain
• Estimated risk associated with two hypothetical PCB concentrations in soil (0.5 mg/kg and 2 mg/kg)
Housatonic River Project pg 8
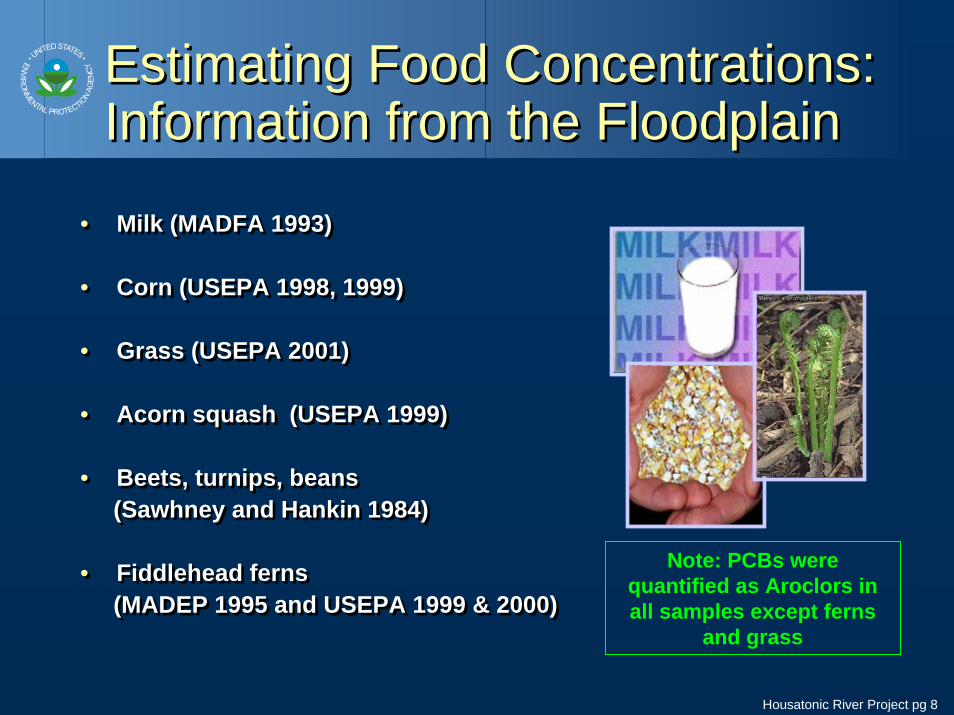
Estimating Food Concentrations: Information from the FloodplainEstimating Food Concentrations: Information from the Floodplain
• Milk (MADFA 1993)
• Corn (USEPA 1998, 1999)
• Grass (USEPA 2001)
• Acorn squash (USEPA 1999)
• Beets, turnips, beans (Sawhney and Hankin 1984)
• Fiddlehead ferns (MADEP 1995 and USEPA 1999 & 2000)
• Milk (MADFA 1993)
• Corn (USEPA 1998, 1999)
• Grass (USEPA 2001)
• Acorn squash (USEPA 1999)
• Beets, turnips, beans (Sawhney and Hankin 1984)
• Fiddlehead ferns (MADEP 1995 and USEPA 1999 & 2000)
Note: PCBs were quantified as Aroclors in all samples except ferns
and grass

Housatonic River Project pg 9
Milk DataMilk Data
• MADFA 1993 sampling program (n=7)
• 3-qt agitated, raw milk samples from bulk tanskon 7 farms
• No PCBs detected – LOQ ≤ 10 µg/L, whole milk basis (estimated)– LOD ≤ 4-5 µ g/L, whole milk basis (estimated)
• MADFA 1993 sampling program (n=7)
• 3-qt agitated, raw milk samples from bulk tanskon 7 farms
• No PCBs detected – LOQ ≤ 10 µg/L, whole milk basis (estimated)– LOD ≤ 4-5 µ g/L, whole milk basis (estimated)
Housatonic River Project pg 10
Factors Influencing Transfer of Persistent Organochlorine Contaminants to PlantsFactors Influencing Transfer of Persistent Organochlorine Contaminants to Plants
• Plant characteristics– lipid content– surface area – height of edible portions
• Soil characteristics• Chemical characteristics
– Lipophilicity– vapor pressure– solubility
• Farming practices– planting density
• Plant characteristics– lipid content– surface area – height of edible portions
• Soil characteristics• Chemical characteristics
– Lipophilicity– vapor pressure– solubility
• Farming practices– planting density
Housatonic River Project pg 11
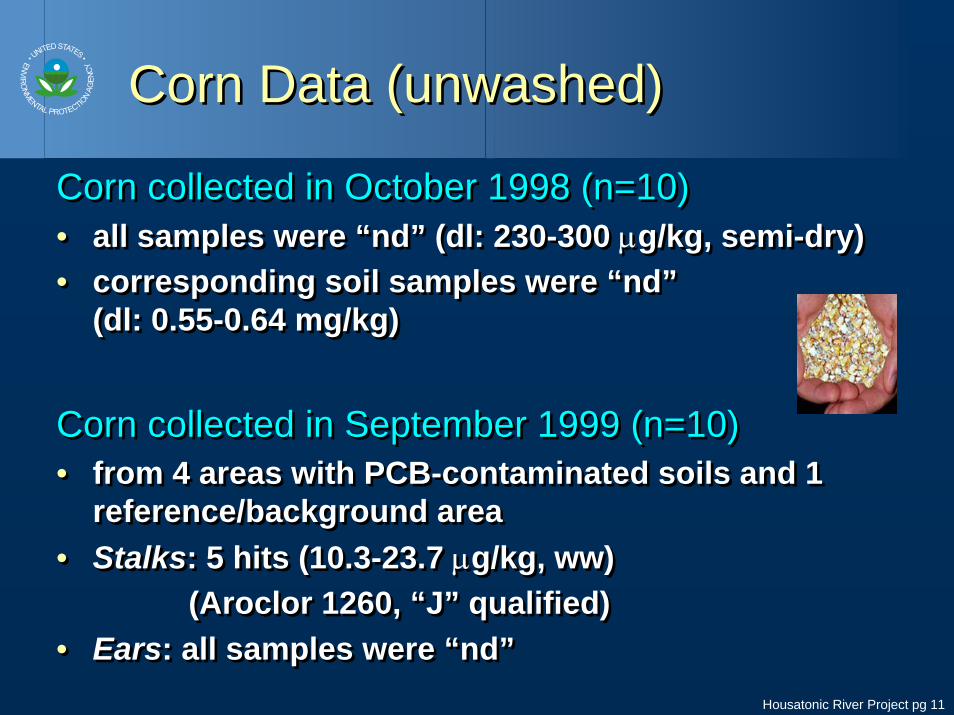
Corn Data (unwashed)Corn Data (unwashed)
Corn collected in October 1998 (n=10)• all samples were “nd” (dl: 230-300 µg/kg, semi-dry) • corresponding soil samples were “nd”
(dl: 0.55-0.64 mg/kg)
Corn collected in September 1999 (n=10)• from 4 areas with PCB-contaminated soils and 1
reference/background area• Stalks: 5 hits (10.3-23.7 µg/kg, ww)
(Aroclor 1260, “J” qualified)• Ears: all samples were “nd”

Housatonic River Project pg 12
Grass (unwashed)Grass (unwashed)
• Collected from former dairy farm in Reach 5 in July 2001 (n=10)
• Soil samples also collected (n=10)
• All samples analyzed for 100+ PCB congeners, dioxins, and furans
• tPCB concentrations in grass: 51-136 µg/kg, ww
• Collected from former dairy farm in Reach 5 in July 2001 (n=10)
• Soil samples also collected (n=10)
• All samples analyzed for 100+ PCB congeners, dioxins, and furans
• tPCB concentrations in grass: 51-136 µg/kg, ww
Housatonic River Project pg 13
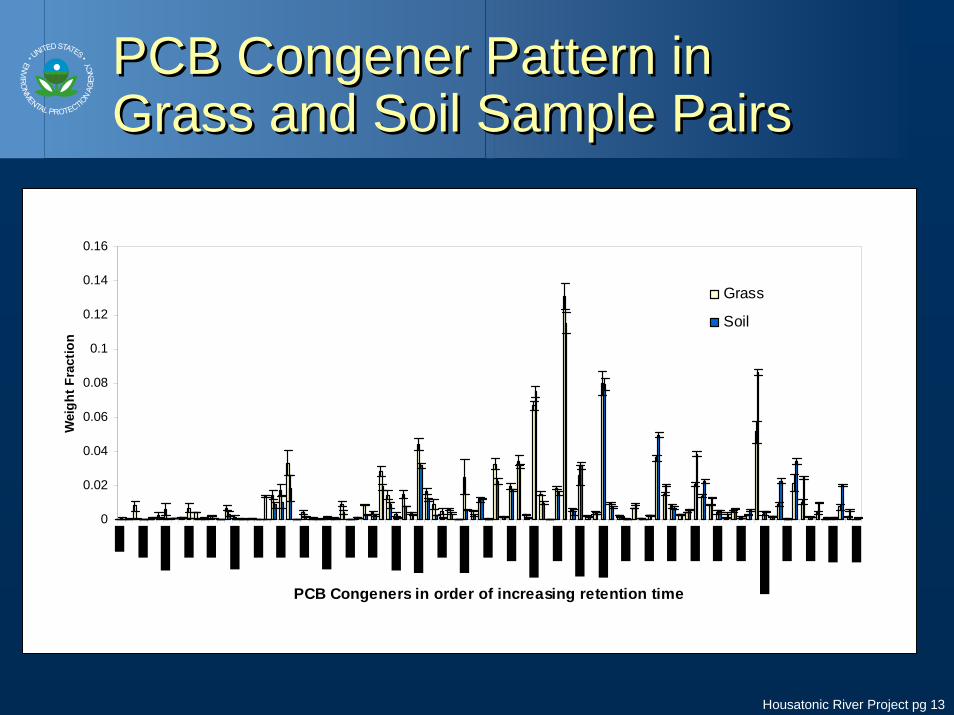
PCB Congener Pattern in Grass and Soil Sample PairsPCB Congener Pattern in Grass and Soil Sample Pairs
0
0.02
0.04
0.06
0.08
0.1
0.12
0.14
0.16
PCB Congeners in order of increasing retention time
Wei
ght F
ract
ion
Grass
Soil
Housatonic River Project pg 14
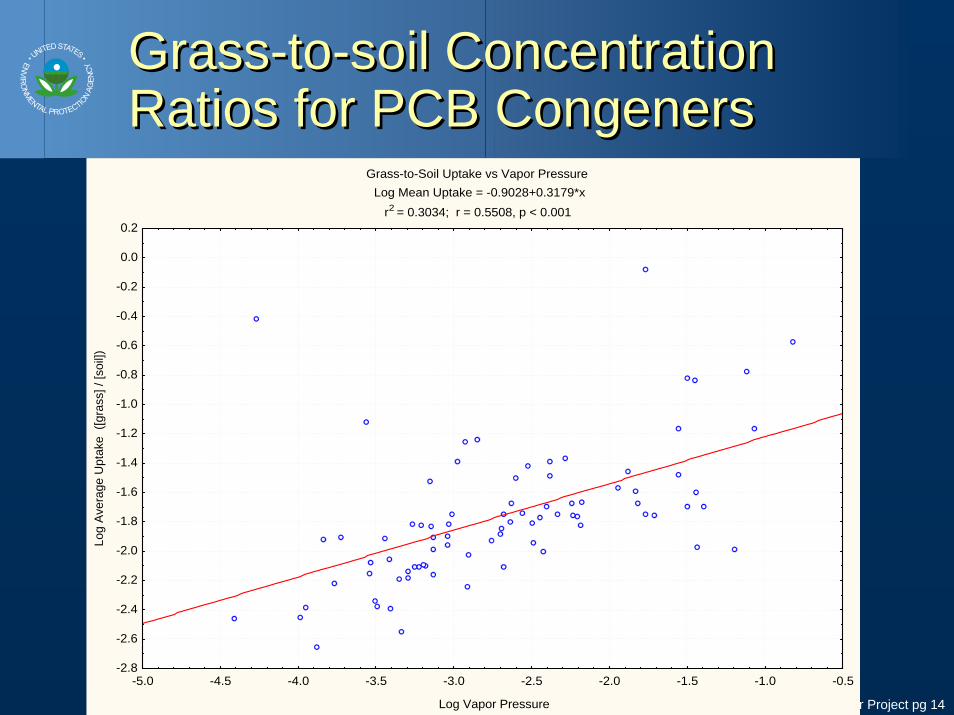
Grass-to-soil Concentration Ratios for PCB CongenersGrass-to-soil Concentration Ratios for PCB Congeners
Grass-to-Soil Uptake vs Vapor PressureLog Mean Uptake = -0.9028+0.3179*x
r2 = 0.3034; r = 0.5508, p < 0.001
-5.0 -4.5 -4.0 -3.5 -3.0 -2.5 -2.0 -1.5 -1.0 -0.5
Log Vapor Pressure
-2.8
-2.6
-2.4
-2.2
-2.0
-1.8
-1.6
-1.4
-1.2
-1.0
-0.8
-0.6
-0.4
-0.2
0.0
0.2
Log
Aver
age
Upt
ake
([gr
ass]
/ [s
oil])

Housatonic River Project pg 15
Squash Data (unwashed)Squash Data (unwashed)
Samples collected in September 1999 (n=4), mg/kg, dw
flesh pulp/seed whole
Reference 0.17 UJ - - 0.12 R
Sample 2 1.4 R - - 1.1 J
Sample 3 0.74 J 0.74 J 0.98 J
Sample 4 0.55 J - - 1.2 J
flesh pulp/seed whole
Reference 0.17 UJ - - 0.12 R
Sample 2 1.4 R - - 1.1 J
Sample 3 0.74 J 0.74 J 0.98 J
Sample 4 0.55 J - - 1.2 J
Housatonic River Project pg 16
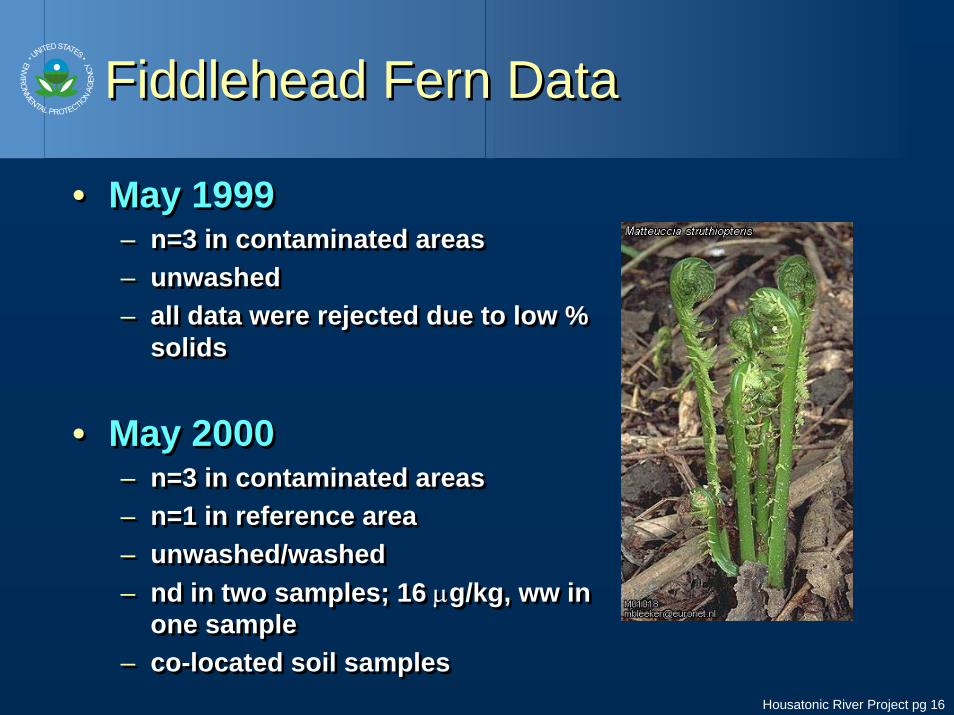
Fiddlehead Fern DataFiddlehead Fern Data
• May 1999– n=3 in contaminated areas– unwashed– all data were rejected due to low %
solids
• May 2000– n=3 in contaminated areas– n=1 in reference area– unwashed/washed– nd in two samples; 16 µg/kg, ww in
one sample – co-located soil samples
• May 1999– n=3 in contaminated areas– unwashed– all data were rejected due to low %
solids
• May 2000– n=3 in contaminated areas– n=1 in reference area– unwashed/washed– nd in two samples; 16 µg/kg, ww in
one sample – co-located soil samples

Housatonic River Project pg 17
Sawhney and HankinSawhney and Hankin
• Field study
• Plants grown in soil amended with Woods Pond sediment
• Plants washed with warm, soapy water prior to laboratory analysis
• Field study
• Plants grown in soil amended with Woods Pond sediment
• Plants washed with warm, soapy water prior to laboratory analysis
Housatonic River Project pg 18
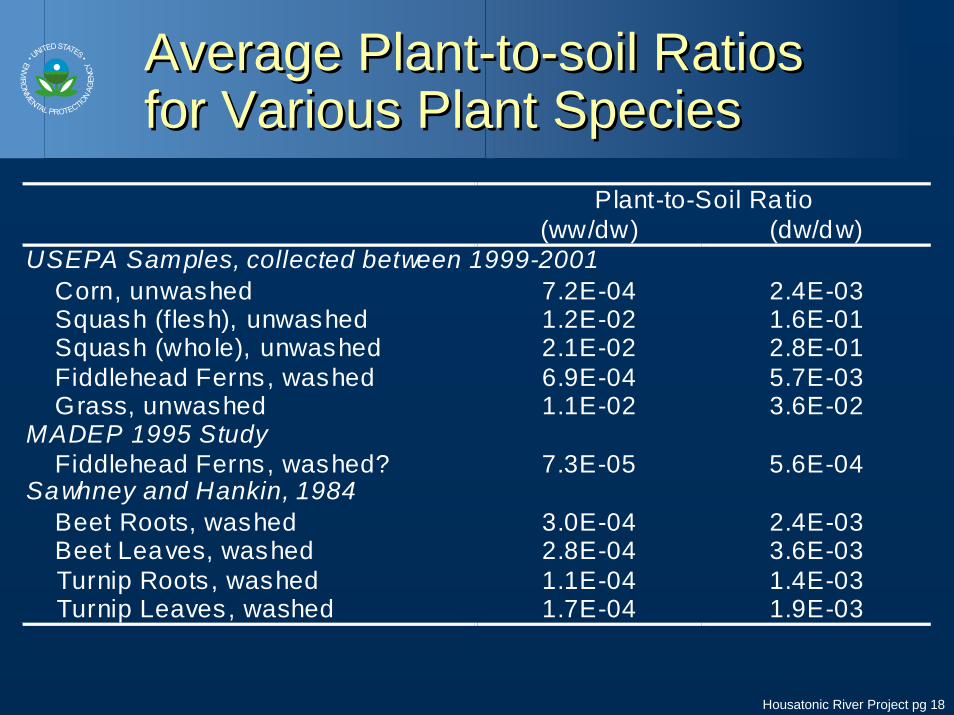
Average Plant-to-soil Ratios for Various Plant SpeciesAverage Plant-to-soil Ratios for Various Plant Species
Plant-to-Soil Ratio(ww/dw) (dw/dw)
USEPA Samples, collected between 1999-2001 Corn, unwashed 7.2E-04 2.4E-03 Squash (flesh), unwashed 1.2E-02 1.6E-01 Squash (who le), unwashed 2.1E-02 2.8E-01 Fiddlehead Ferns, washed 6.9E-04 5.7E-03 Grass, unwashed 1.1E-02 3.6E-02MADEP 1995 Study Fiddlehead Ferns, washed? 7.3E-05 5.6E-04Sawhney and Hankin, 1984 Beet Roots, washed 3.0E-04 2.4E-03 Beet Leaves, washed 2.8E-04 3.6E-03 Turnip Roots, washed 1.1E-04 1.4E-03 Turnip Leaves, washed 1.7E-04 1.9E-03
Housatonic River Project pg 19
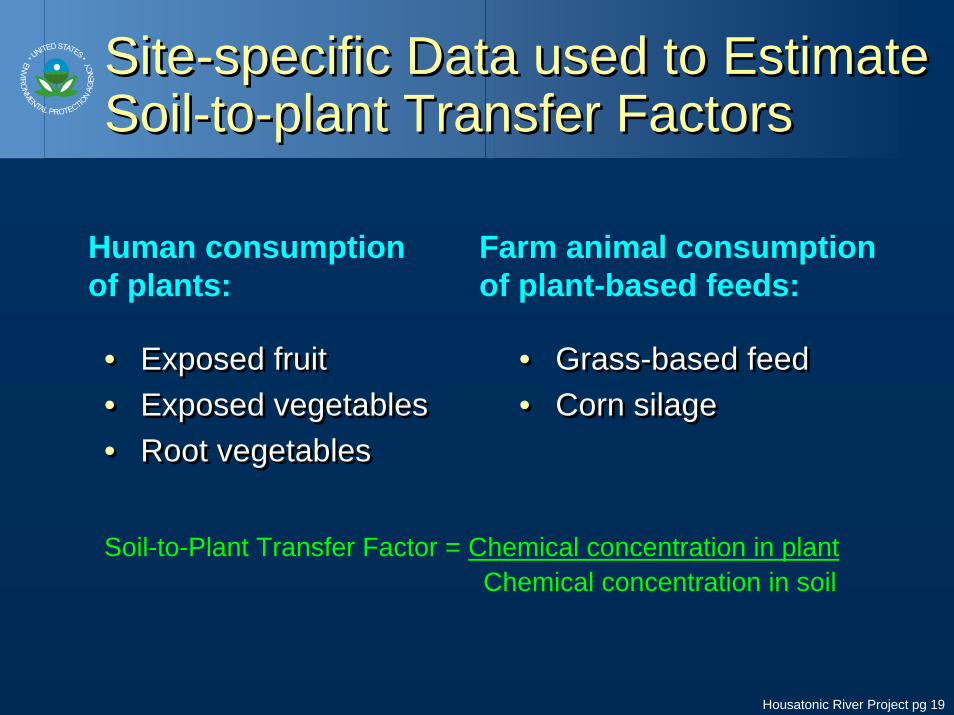
Site-specific Data used to Estimate Soil-to-plant Transfer FactorsSite-specific Data used to Estimate Soil-to-plant Transfer Factors
Human consumption of plants:
Farm animal consumption of plant-based feeds:
• Exposed fruit• Exposed vegetables• Root vegetables
• Exposed fruit• Exposed vegetables• Root vegetables
• Grass-based feed• Corn silage• Grass-based feed• Corn silage
Soil-to-Plant Transfer Factor = Chemical concentration in plantChemical concentration in soil

Housatonic River Project pg 20
Animal Management Commercial Dairy
Animal Management Commercial Dairy
• Lactating dairy cows are confined in areas out of the floodplain
• No animals graze in the Reach 5 floodplain, but non-lactating animals have in the past
• Non-lactating animals were observed grazing in floodplain of Reach 9
• Production practices could vary
• Lactating dairy cows are confined in areas out of the floodplain
• No animals graze in the Reach 5 floodplain, but non-lactating animals have in the past
• Non-lactating animals were observed grazing in floodplain of Reach 9
• Production practices could vary

Housatonic River Project pg 21
Animal ManagementDairy Feeding
Animal ManagementDairy Feeding
• Roughages– Corn silage– Grass silage– Hay – Hay – Pasture– Pasture
• Concentrates– Mainly grains– Mainly imported
• Roughages– Corn silage– Grass silage
• Concentrates– Mainly grains– Mainly imported
Housatonic River Project pg 22
Animal ManagementBeef
Animal ManagementBeef
• One commercial herd in the area. Does not have access to the floodplain or use feeds from the floodplain.
• Small non-commercial herd on a residential parcel on Reach 7
• Potential for conversion of dairy to beef.• Cull and surplus dairy could be used for beef.• Residue exposure and uptake would be similar to
that for growing dairy animals.
Housatonic River Project pg 23
Animal ManagementFree-Range Poultry
Animal ManagementFree-Range Poultry
• One farm in Reach 9• Confined to portable pens moved among
areas that could include the floodplain• Birds raised for meat only from April to
October• Commercial free-range egg production is
unlikely, but “backyard flocks” are possible
• One farm in Reach 9• Confined to portable pens moved among
areas that could include the floodplain• Birds raised for meat only from April to
October• Commercial free-range egg production is
unlikely, but “backyard flocks” are possible

Housatonic River Project pg 24
Animal Products Considered(Present and Potential)
Animal Products Considered(Present and Potential)
• Dairy Cattle (milk and meat)• Beef Cattle (meat)• Goats (milk)• Sheep (lamb meat)• Free-range poultry (eggs and meat)• Deer (meat)
• Dairy Cattle (milk and meat)• Beef Cattle (meat)• Goats (milk)• Sheep (lamb meat)• Free-range poultry (eggs and meat)• Deer (meat)

Housatonic River Project pg 25
Basic AssumptionsBasic Assumptions
• The amount of contaminant transferred is proportional to concentration
• Long-term exposures are evaluated –temporal variations are not considered
• The amount of contaminant transferred is proportional to concentration
• Long-term exposures are evaluated –temporal variations are not considered
Housatonic River Project pg 26
Steady StateAssumptions and Limitations
Steady StateAssumptions and Limitations
• True steady state does not occur because of normal variations in diet or physiological state.
• Can only be applied to averages for a cropping year or production cycle
• High production and weight loss in early lactation is balanced by low production and weight gain in late lactation
• Timing of intake by meat-producing animals is not important because half-lives of contaminants are long compared to age at slaughter
Housatonic River Project pg 27
Concentration in ProductConcentration in Product
Function of:1. Concentration in environmental matrix2. Animal access3. Characteristics of the chemical4. Physiological status of the animal
Function of:1. Concentration in environmental matrix2. Animal access3. Characteristics of the chemical4. Physiological status of the animal

Housatonic River Project pg 28
Pathways of Animal ExposurePathways of Animal Exposure
(1) Soil — Air — Plant — Animal — Product
(2) Soil — Animal — Product
(1) Soil — Air — Plant — Animal — Product
(2) Soil — Animal — Product
Housatonic River Project pg 29
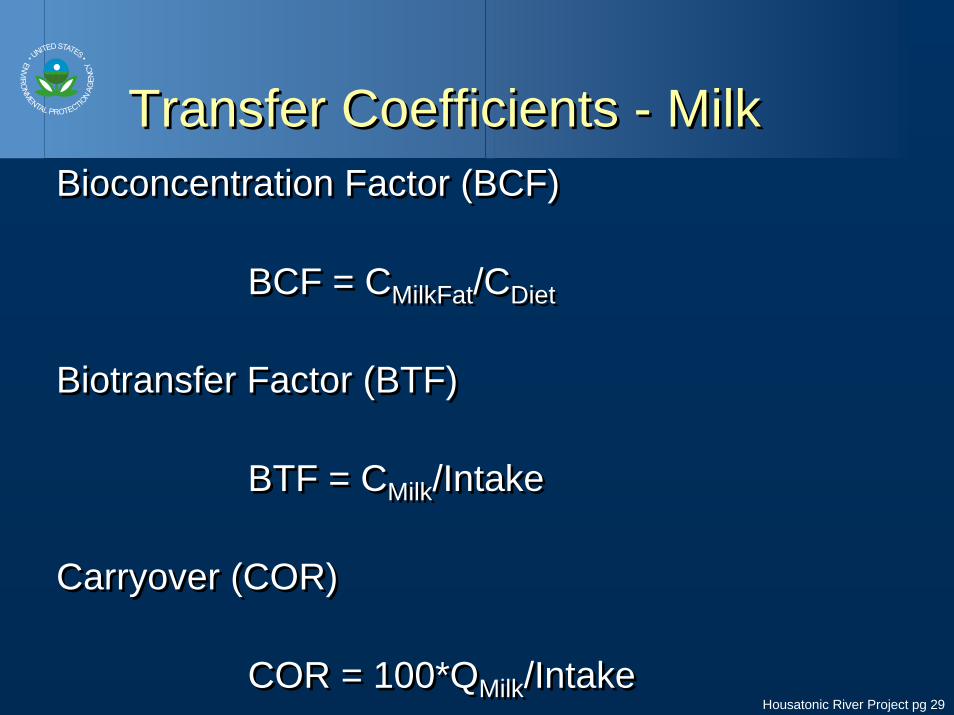
Transfer Coefficients - MilkTransfer Coefficients - MilkBioconcentration Factor (BCF)
BCF = CMilkFat/CDiet
Biotransfer Factor (BTF)
BTF = CMilk/Intake
Carryover (COR)
COR = 100*QMilk/Intake
Bioconcentration Factor (BCF)
BCF = CMilkFat/CDiet
Biotransfer Factor (BTF)
BTF = CMilk/Intake
Carryover (COR)
COR = 100*QMilk/Intake

Housatonic River Project pg 30
Prediction of Residue Concentrations in ProductsPrediction of Residue Concentrations in Products
Basic equation
Cprod = BCF*Cdiet(dw)
Expanded Equation
Cprod = (BCF*R*Dsoil*Csoil) + (BCF*DSil*CSil) + (BCF*DGrass*CGrass) + (BCF*DCon*CCon)
Cprod = Concentration in productCdiet(dw) = Concentration in diet (dry weight)R = bioavailability reduction factorDsoil = fraction of soil in the dietCsoil = Concentration in soilDSil = fraction of corn silage in the dietCSil = concentration in corn silageDGrass = fraction of grass-based feed in the dietCGrass = concentration in grass-based feedDcon = fraction of concentrate in the dietCcon = concentration in concentrate
Housatonic River Project pg 31
Intake Factors - GeneralIntake Factors - General• Percentages of dry matter intake from roughages,
concentrates and soil are required (annual averages assuming 6 months of pasturing)
• Values based on knowledge of local conditions, literature, and generally accepted good management practices
• Values consist of a best estimate and a range consistent with good management practices
• Percentages of dry matter intake from roughages, concentrates and soil are required (annual averages assuming 6 months of pasturing)
• Values based on knowledge of local conditions, literature, and generally accepted good management practices
• Values consist of a best estimate and a range consistent with good management practices

Housatonic River Project pg 32
Intake FactorsCommercial Dairy
Intake FactorsCommercial Dairy
00Soil, %
40-5045Concentrate, %
50-6055Total Roughage, %
00Grass Based, %
50-6055Corn Silage, %
RangeBest EstimateMatrix
Housatonic River Project pg 33
Bioconcentration Factors -PCB MixturesBioconcentration Factors -PCB Mixtures
• Cattle – Milk– Data for PCB mixtures but none for Aroclor 1260– Values for Aroclor 1254 used as a conservative
estimate for Aroclor 1260
• Cattle – Tissue– Little data; body fat BCFs were assumed to the same
as milk BCFs
• Poultry – Eggs and Tissue– Data for PCB mixtures but none for Aroclor 1260– Used the mean of Aroclor 1254 and 1268

Housatonic River Project pg 34
Bioconcentration Factors -Dioxin-like PCBsBioconcentration Factors -Dioxin-like PCBs
• Cattle – Milk– No generally accepted BCFs– No complete data set for dioxin-like congeners– Prediction equation derived using log KOW’s and absorption data
from the literature• Cattle – Tissue
– Little data; body fat BCFs were assumed to be the same as milk BCFs
• Poultry – Eggs and Tissue– No literature data PCB congeners– Prediction equations were derived for eggs and tissues– Assuming the relative values of congeners were the same in cattle
and poultry
Housatonic River Project pg 35
Bioconcentration Factors -PCDD/PCDFsBioconcentration Factors -PCDD/PCDFs
• Cattle – Milk– Used the mean values from three published studies
• Cattle – Tissue– Little data; Body fat BCFs were assumed to be the same as Milk
BCFs
• Poultry – Eggs and Tissue– Data from a study in laying hens fed a diet contain 10%
PCDD/PCDF-contaminated soil– Residue measurements were made in eggs and tissue
Housatonic River Project pg 36
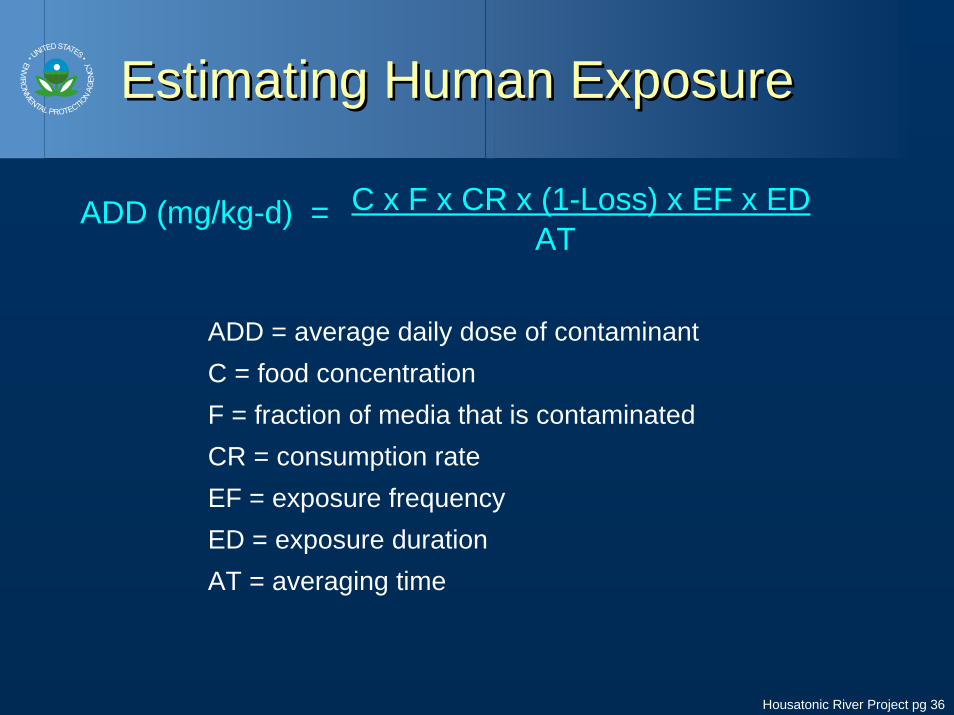
Estimating Human ExposureEstimating Human Exposure
ADD (mg/kg-d) = C x F x CR x (1-Loss) x EF x EDAT
ADD = average daily dose of contaminantC = food concentrationF = fraction of media that is contaminatedCR = consumption rateEF = exposure frequencyED = exposure durationAT = averaging time
Housatonic River Project pg 37
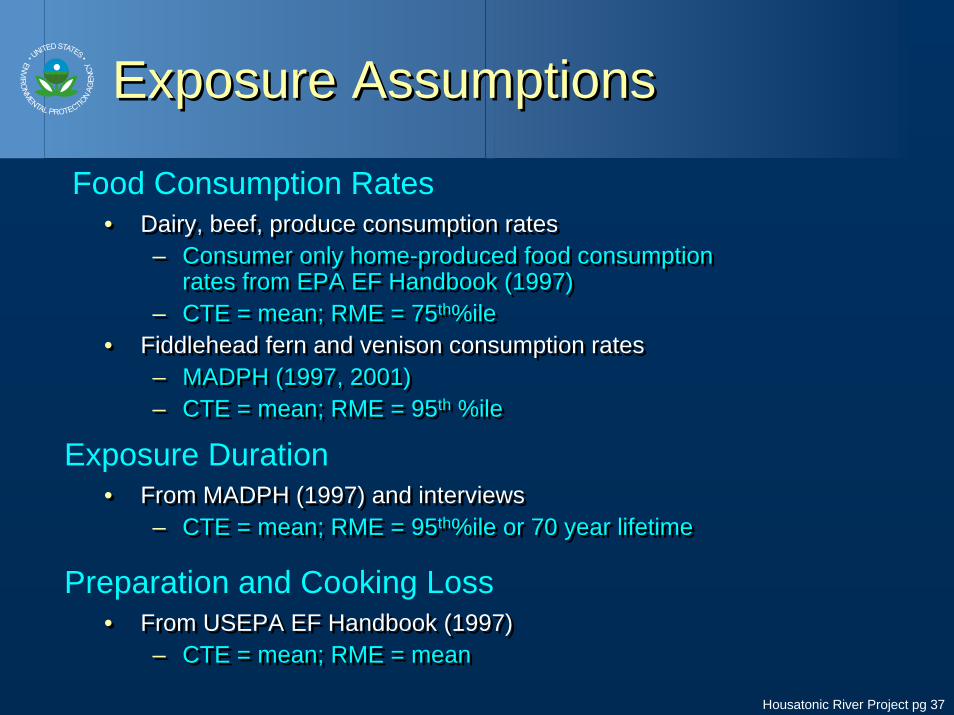
Exposure AssumptionsExposure Assumptions
Food Consumption Rates• Dairy, beef, produce consumption rates
– Consumer only home-produced food consumption rates from EPA EF Handbook (1997)
– CTE = mean; RME = 75th%ile• Fiddlehead fern and venison consumption rates
– MADPH (1997, 2001)– CTE = mean; RME = 95th %ile
• Dairy, beef, produce consumption rates– Consumer only home-produced food consumption
rates from EPA EF Handbook (1997) – CTE = mean; RME = 75th%ile
• Fiddlehead fern and venison consumption rates– MADPH (1997, 2001)– CTE = mean; RME = 95th %ile
Exposure Duration• From MADPH (1997) and interviews
– CTE = mean; RME = 95th%ile or 70 year lifetime• From MADPH (1997) and interviews
– CTE = mean; RME = 95th%ile or 70 year lifetime
Preparation and Cooking Loss• From USEPA EF Handbook (1997)
– CTE = mean; RME = mean• From USEPA EF Handbook (1997)
– CTE = mean; RME = mean
Housatonic River Project pg 38
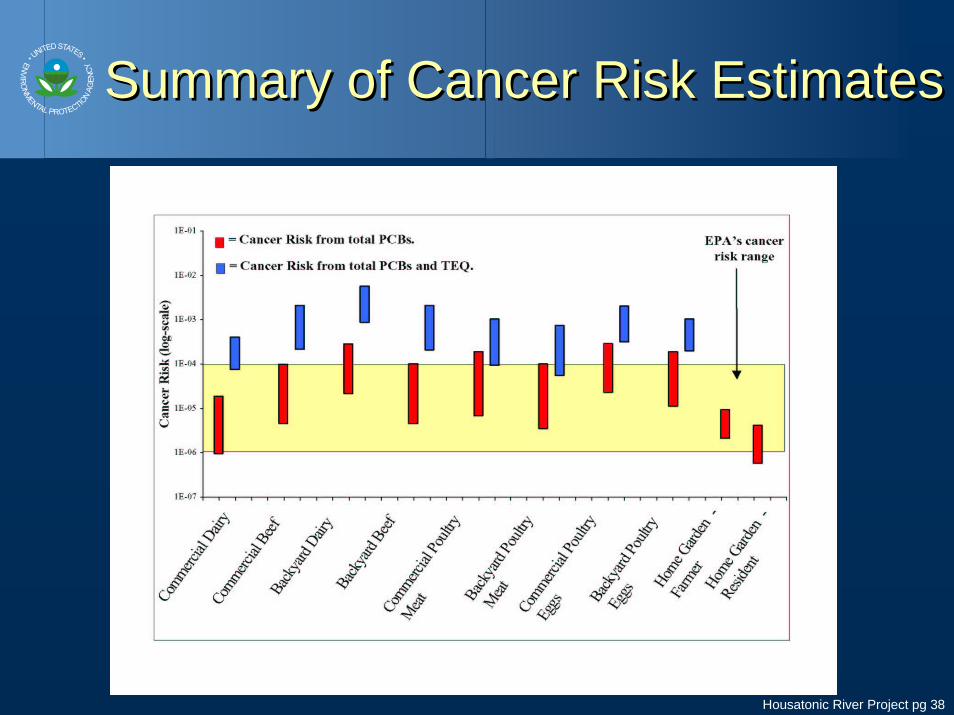
Summary of Cancer Risk EstimatesSummary of Cancer Risk Estimates
Housatonic River Project pg 39
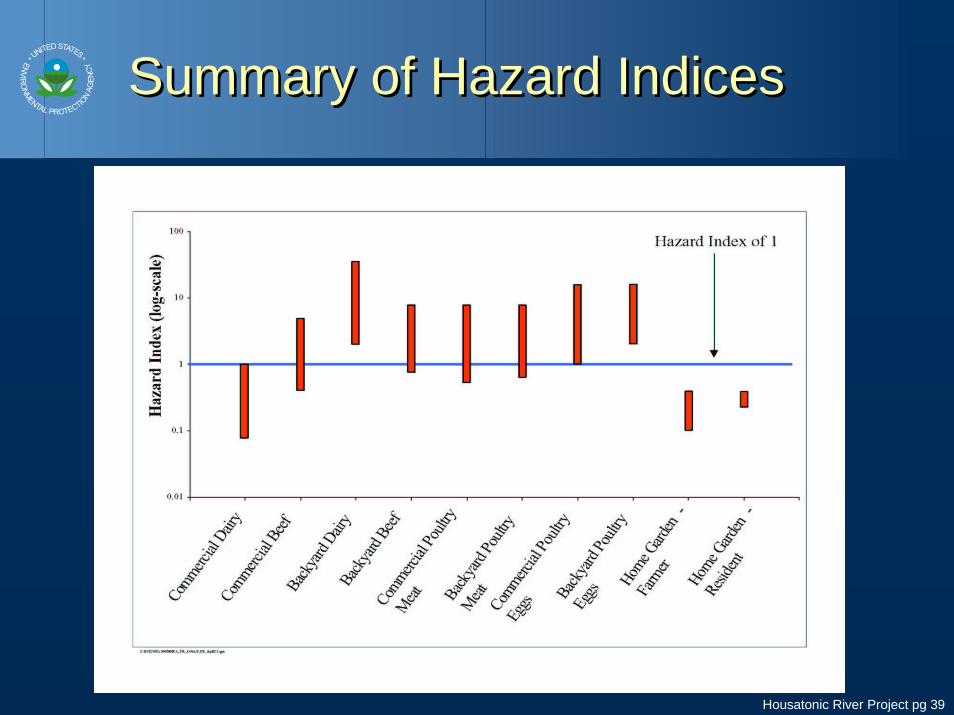
Summary of Hazard IndicesSummary of Hazard Indices