agricultural section - issct.org khanna studies on the...94 agricultural section ... red lolams :...
TRANSCRIPT

94 AGRICULTURAL SECTION
Mr. K. L. Khanna presented the following paper
Paper I
ON CULTIVATORS' FIELDS 1-N BIHAR
I<. L. KHANNA, R. C. ACHARYA AND
K. P. SINGH \
Central Sugarcane Research Station, Pusa, India.
INTRODUCTION.
Lying between latitudes 22" and 27" N and longitudes 834" and 87"E, the State of Bihar consists of two distinct physiographic units, viz., the Indo-Gail- getic alluvial plains extending over North and South Bihar and the table lands
PLATE I
MAP SHOWIIPBG THE Pwvsicnb FEATURES 08
1500' TO 3000'-
600' TO 1500' ITI 0 ' TO6001 IXZl OlsTRlcT8oU~oIlY - - -
of Chotanagpur with an average altitude of 2,000 ft. above sea level. &har proper is dissected into two nearly equal halves by the river Ganges. The State has a typically monsoon character. An intensely dry summer during the months of April, May and June is followed by the monsoon which generally


AGRICULTURAL SECTION

ILL KHANNA, R.C. ACHARY,i, K.P. SINGH
Soil reaction is highly alkaline (8.2-8.4). As a result of this and also on of the high free calcium carbonate content, availability of phosphates vity of micro-elements are restricte6. C/N ratio is rather narrow, organic
r status being low and nitrogen reserve poor. In the more arid regions of strict of Saran, intra-zonal soils, locally known as Usur or unproductive soils,
ove. C /N ratio is wide and nitrogen reserve extremely low. (3) Heavy clay: Heavy clay soils occLrr to the south of the Ganges and
r the districts of Patna, Gaya and a part of Shahabad. The soils are dark at the surface with profiles characterised by a high content of clay distributed st evenly through the entire depth. Leaching of soluble salts is extremely icted, mechanical translacatioll of materials being almost entirely absent. ical condition i s far from good, drainage characters being 11ighly unsatisfac-
C/N ratio is wide, due chiefly to a low nitrogeil level. Available phosphates comparatively higher. Soil reaction is on the alkaline side ofneutrality.
(4) §one alluviunn: This division occurs in the valley of the Sone in Shah- and part of Patna district in South Bihar. Three types are found, viz.,
, sandy clay and clay, representing admixture in varying proportions of the se sandy deposits of the Sane and heavy Gangetic alluvium. No evidence echanical illuviation has been obtained although leaching of soluble salis arent. Distinctive of these soils in,a tendency to mobilisation of sesqui- with organic carbon, specially in the lighter sections-a process analogous solisation. Soil reaction, however, is alkaline. C /N ratios progressively down from ilormal in sandy to very ,low in clay type. Available phos-
are medium and nitrogen reserve low. 5) Brown soils: These occur mostly in the portions of Bhagalpur and hyr districts lying to the south of the Ganges and vary in colour from brown dish brown, with profiles exhibiting abundant brown mottliilgs and patches.
e soils have developzd under conditions of intense silicate weathering with ted leaching. Aluminium is also mobile and the residual soil is rich in of iron. Organic carbon is stable in the surface Ilorizon and mechanical
ocation of finer parlicles absent. C / N ratio is variable, being generally e low side. Nitrogcn reserve is poor and available phosphates very low. (6) Red lolams : Red loan~s occur in the whole of Chotanagpur division.
climate here is inore humid owing to heavier rainfall and the close cover of a duous forest. During spring, the trees shed leaves and in the sumnler that ws, there is an intense evaporation and the thin soil layer is dried out corn-
. This probably accounts for the frequent occurrence of concretionary t~ of varying sizes. The base status is very low, brit the reaction a$
AGRICULTURAL SECTION
measured by pH values is not so acidic as might be expected, a circumstance attributable to the sesquioxide character of the clay complex. Theye is no marked alluviation and the structure is generally friable and granular. Cqrbon~Nitrogen ratio is narrow, available nitrogen and phosphates being very low. Response to nitrogen is positive and high. Added phosphates undergo irreversible Axa- j tion as highly insoluble form and aluminium phosphates.
The conditions of cane growing are unique in North Bihar in that the crop is produced without irrigation. It has to depend for its germination on the mois- ture conserved from the previous monsoon and tide over the hot weather with that moisture till the monsoon breaks. As the cane grows mainly during the monsoon period of 3 months, the growth consequently depends upon the vagaries of the rainfall, a late monsoon particularly depressing the yield, Floods often result from excessive precipitation in the sub-montane ares. and a poor crop follows. The area north of the river is entirely a white sugar tract possessing over three fifths of the total area under cane in the State and also 25 out of a total of 29 factories.
It will be clear from the foregoing paragraphs that the sugarcane crop in the State is raised under widely varying conditions of soil and climate, as represented by the different zones. In order to render real and effective service to the culti- vating community in the shape of definite and dependable advice as regards variety to plant, kind and quantity of manure to add, the most profitable schedule of irri- gation to follow and some other aspects, it is therefore of the utmost importance to carry out extensive experiments on cultivators' fields widely scattered over the State. The need for this has been widely appreciated in recent years (Yates, Finney and Panse, 1952), the inadequacy of resslts obtained in a few experimental farms as a sound basis for advising cultivators having been strongly felt in this connection. These farms can hardly be taken as representative of the soil cnndi- tions obtaining in innumerable cultivato;s9 fields in a particular tract. Further, they have attained a definitely higher level of fertility as A result of years of sound manuring and management in contfast to the exhausted condition of soils in cul- tivators' field which have been drained of their nutrient reserves with hardly any replenishment afforded over ages. Crop responses under the two divergent sets of conditions are therefore bound to differ very widely. Under the reorganised Cane Development Scheme in Bihar, a beginning was made in this direction, ultimate objective being not only confined to a study of the yield responses to various treatments envisaged but also extending to observations on such 0th aspects as quality attributes of cane and incidence of pests and diseases in relatio to such treatments.
The work reported here relates to manurial experiments of this natur carried out over a period of five years. The experiments were laid out on cultivators' fields scattered over the entire sugar belt and aimed at assessin responses to manurial schedules found most effective a t the Research Station a in a large number of co-ordinated experimental centres attached thereto. Bihar, similar experiments on crops other than sugarcane have been reporte by Mukherjee (1952).


100 AGRICULTURAL SECTION
ammonium sulphate being added to get the required NP levels). (ii) Inorganic series (Ammonium sulphate + single superphosphate).
In 1951-52, two series of inorganic fertilisers were under examination, viz., (i) Ammophos and (ii) Ammonium sulphate + single superphosphate.
In the year 1953-54, only one series was involved, viz., a "mixed series" wherein N was applied half in inorganic and half in organic form as a mixture of Ammonium sulphate and oilcalte, the balance of P20, (over that provided by oil- cake) being added as single superphosphate. The total numbers of experiments in the four successive years were 418, 790, 523 and 240 respectively.
, (2) Year 1954-55 : In this year, the survey method of experimentation (Panse and Sulchatme,
1953) was adopted. Two series were involved, viz., Series I which consisted of NP trials laid out in areas which had &shown no response to potash and Series 11, consisting of N P K trials laid out in areas where responses to potash had been indicated in trials at coordinated experimental centres (confined to the Sub-Himalayan regions of north west Champaran where high rainfall had brought about heavy leaching of bases). The total numbers of experiments in the two series were 445 and 23 and they comprised 8 groups'witl~ 4 treatments and 4 groups with 6 treatments respectively. A one acre plot was divided into 4 equal portions in Series I to 6 equal portions in Series IT, each portion receiving one of the treatments which were as follows:-
SERIES I
(1) 0 NIP, NIP2 N2P2 (2) 0 Nip1 N2P1 N2P2 (3) 0 Nl NIP1 NIP2 (4) 0 PI NlPl NZP,
(1) 0 NIP1 NIPIKI NIP,& N ~ P ~ K ~ (2) 0 NIPl NIPIKl NlPlK2 N2P1IC1 (3) 0 NIP2 NlP,Kl NIP,& NZP2Kl (4) 0 N,Pl N2PlKl N,P,K, N2P2R1
These designs were prepared in consultation with Dr. Finney, F.A.O. Statistician. The doses of NPK were as follows :
North Bihar South Bihar
N4 : 60N N, : 120N P, : 3OP,O, P, : 60P20,

K.L. KHANNA, R . C. ACHARYA, K.P. SINGH 101
itrogen was applied as a mixture of oilcake and ammonium sulphate,
rt- - -
ind potash as muriate of potash. It may be added here that an application if potash had indicated no response except in combination with nitrogen and
P $*hosphate, a treatment involving potash alone was not included in the experiments. @ The rainfall factor which dominates production almost entirely in North .pt, Bihar, varied considerably during the five years (Table I). g&,
TABLE I
DISTRIBUTION OF RAINFALL (IN INCHES) DURING THE FIVE YEARS OF EXPERIMENTATION
paran 45.56 39.11 48.65 46.70' 57.94 50.64 62.12 57.60 55.27 47.07 40.64 36.75 28.75 25.87 43.43 40.13 71.06 67.56 32.40 29.48
rpur 34.52 30.86 47.79 46.60 51.16 46.14 64.10 59.29 44.82 39.61 anea 41.86 37.39 32.93 30.09 48.78 44.02 51.23 44.73 45.25 40.17
PRESENTATION OF DATA
o-thirds and one-third of the nutrient being provided respectively in organic d inorganic forms. Phosphate was applied in the form of single superphosphate
Total June- Total June- Total June- Total June- Total June-
(1) Years 1950-51 to 1953-54 : (a) These experiments were carried out e vears 1950-51 and 1952-53. the total numbers in the two years being 84 and
tween the two doses, differences in yield were generally non-significant. ts of pooled analyses of data for the different districts have been presented
-
%
No. of expts. Do DI Dz L.S.D. at 5 % --t-
\ 51 respectively. Analyses of data in respect of each factory area (omitted for -
in Table 11. It will be seen that yield increases over control as a result of manuring are always significant. The higher dose does better than the lower one in all districts of North Bihar but in South Bihar thelatter showsabetterperformance.
, However, the extra response due to the higher dose as compared to the lower dose ,satisfied the criterion of statistical significance only in the year 1950-51 in respect of North Bihar as a whole as also for individual districts other than Saran.
TABLE I1
MEAN YIELDS IN TONS PER ACRE IN OILCAKE SERIES
1950-51 Saran 16 ' 24.2 ' 32.7 39.2 7.Q5 Champaran 7 21 .O 23.7 26.3 1.43 Muzaffarpur 1 7 , , . 13.8 17.4 20.1 1.43

AGRICULTURAL SECTION
TABLE I1 (Contd.)
No. of expts. Do D l D2 L.S.D. at 5%
1950-51 I Darbhanga 35 . 13.2 19.0 21.5 1.55 North Bihar 75 16.4 22.0 25.4 2.68 South Bihat 9 18.7 22.5 20.7 1.91
1952-53 Saran 23 22.5 24.5 25.0 1.80 Champaran 26 17.6 21.8 22.1 1.36 Darbhanga 2 10.8 15.3 19.4 - North Bihar 5 1 19.5 22.8 23.3 1.58
(b) Ammophos series : These experiments, 215 in number, were carried out during 1951-52. Here also, yield responses to manuring were significant in almost all cases. An examination of Table I11 depicting ,results of pooled analyses will show that responses to manuring are always significant. As between the t\iiro doses, systematically higher yields are afforded by the higher dose although the differences are significant only in respect of Saran, Muzaffarpur and North Bihar as a whole. On the contrary, the lower dose d w s better in South Bihar, the contraction against the higher dose being however non-significant.
I TABLE 111
MEAN YIELDS IN TONS PER ACRE IN AMMOPHOS SERIES , 1951-52
North Bihar
(c) Ammonium sulphate series : These experiments were conducted during 1950-51, 1951-52 and 1952-53, the numbers being 241, 324 and 422 respectively. As in the other series yield increases due to manuring were significant in almost all cases. The results of pooled analyses (Table IV) would show that responses to manuring were always significant, During 1950-51, the higher dose did uniformly better than the lower dose in North Bihar but the reverse held good for South Bihar. The differences were however significant only in so far as Saran and Muzaffarpur were concerned. In 1951-52, the higher dose did better in all areas other 'than the district of Saran where the reverse held good. The differences were, however, significant in respe~t of Muzaffarpur district only. Similarly during the year 1952-53 higher yields were obtained in all areas except Champaran district where the lower dose did significantly better. However, the better performance under higher dose fell short of the level of significance in South Bihar.

arriec Licanti

104 AGRICULTURAL SECTION
TABLE VI I
AVERAGE YIELD INCREASES (TONSIACRE) OVER NO MANURE PLOTS IN DIFFERENT SERIES (1950-51 TO 1953-54)
SeriesIDistrict Ammon sulph Oilcake + Ammon sulph +Oil- or + Ammophos
Soil divison Single super Single super. cake +Single super - p.pp.p-
(i) District (a) Lower dose (Dl)
Saran 6.5 5.8 7.1 5.9 Champaran 6.2 6.3 3.1 5.3 Muzaffarpur 5.2 6.7 3.5 9.4 Darbhanga 5.1 4.7 5.1 5.8 South Bihar 4.2 7.8 3.7 4.3
(b) Higher dose (DB)
Saran 3.5 8.8 8.8 7.8 Champaran 5.3 6.8 4.9 5.1 '
9.9 12.7 6.3 7.3 Muzaffarpur Darbhanga 7.i 5.4 6.6 5 .7 South Bihar 5.3 7.2 2.0
7 - 1.2
(ii) Soil division \
(a) Lower dose (Dl)
Calcareous 6.1 5.5 4.7 6.1 Non-calcareous 6.2 5.9 4.3 5.7 Sone alluvium 6.5 9.1 5.2 4.7 Heavy clay 2.7 1.6 1.9 2.3
(b) Higher dose (Dz)
Calcareous 7.5 8.4 Non-calcareous 5.5 4.8 S o ~ e ,alluvium 5.2 8.1 Heavy clay 3.3 ' 3.2
TABLE VIL
NET PROFITS IN RUPEES PER ACRE DUE TO MANURING IN DIFFERENT DISTRICTS AND SOIL DIVISIONS
(1950-51 to 1953-54)
SerieslDistrict or Ammon sulph Arnmophos Dl Oilcake + Sin- Ammon sulph +oil Soil division +Single super D2 Mean gle super Dl cake +Single super
Dl Ds Mean D2 Mean Dl Dz 'Mean - -.. - (i) District
Saran 172 176 174 165 263 214 175 193 184 146 182 164 Champaran 124 94 109 194 187 190 40 51 46 124 79 102 Muzaffarpur 127 268 198 206 411 309 42 100 71 277 164 221 Darbhanga 121 160 141 132 135 134 102 112 107 142 101 122 South Bihar 88 96 92 248 204, 226 50 Uneconomic 87 163 127
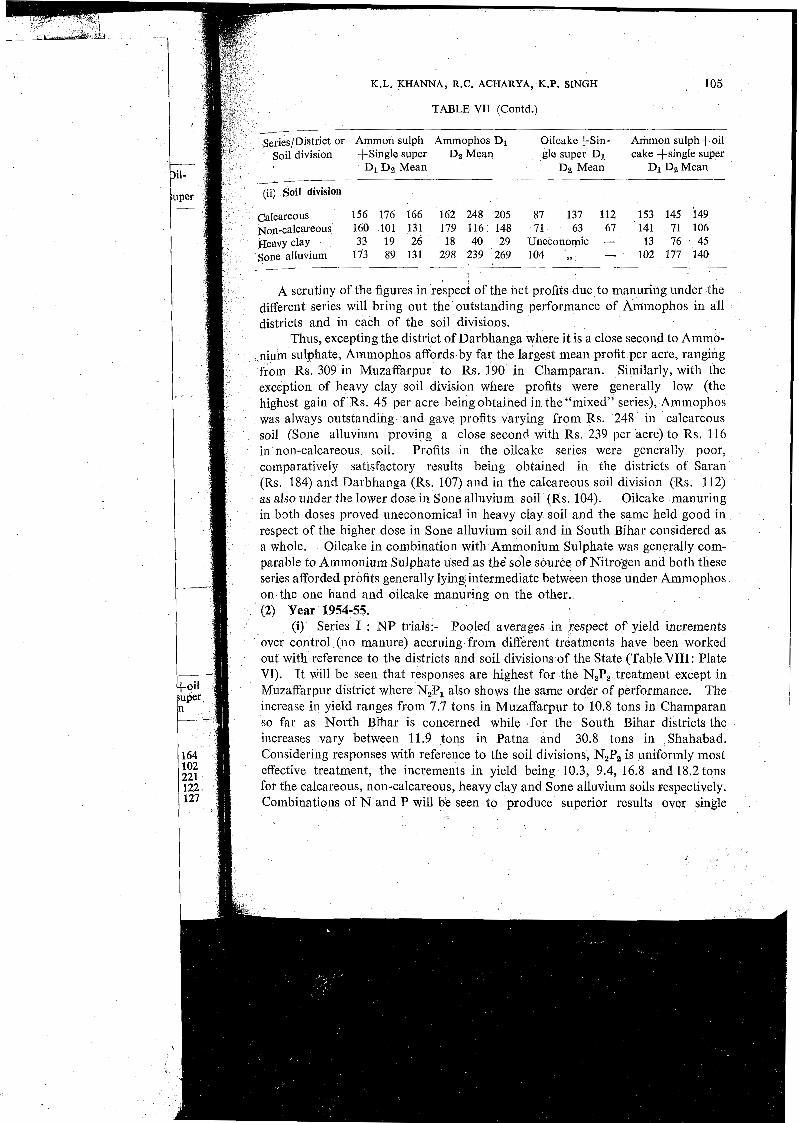
K.L. KHANNA, R.C. ACHARYA, K.P. SINGH 105
TABLE VII (Contd.)
156 176 166 162 248 205 87 137 112 153 145 i49
33 19 26 18 40 29 Uneconomic - 13 76 45 - 102 177 140
A scrutiny of the figures in respect of the net profits due to manuring under the different series will bring out the outstanding performance of Ammophos in all districts and in each of the soil divisions.
Thus, excepting the district of Darbhanga where it is a close second to Ammo-
soil (Sone alluvium proving a close second with Rs. 239 per acre) to Rs. 116 in non-calcareous soil. Profits in the oilcake series were generally poor, coliiparatively satisfactory results being obtained in the districts of Saran (Rs. 184) and Dalbhanga (Rs. 107) and in the calcareous soil division (Rs. 112) as also under the lower dose jn Sone alluvium soil (Rs. 104). Oilcake manuring in both doses proved uneconomical in heavy clay soil and the same held good in respect of the higher dose in Sone alluvium soil and in South Bihar considered as a whole. Oilcake in combination with Ammo~lium Sulphate was generally com- parable to Ammollium Sulphate used as the' sole source of Nitrogen and both these series afforded profits generally lying intermediate between those under Ammophos on the one hand and oilcake manuring on the other. (2) Year 1954-55.
(i) Series I : NP trials:- Pooled averages in respect of yield increments over control (no manure) accruing from different treatments have been worked out with reference to the districts and soil divisions of the State (Table VIII: Plate VT). It will be seen that responses are highest for the N,P, treatment except in Muzaffarpur district where N,P, also shows the same order of performance. The increase in yield ranges from 7.7 tons in Muzaffarpur to 10.8 tons in Champaran so far as North Bfhar is concerned while for the South Bihar districts the increases vary between 11.9 tons in Patna and 30.8 tons in Shahabad. Considering responses with reference to the soil divisions, N,P, is uniformly most effective treatment, the increments in yield being 10.3, 9.4, 16.8 and18.2 tons for the calcareous, non-calcareous, heavy clay and Sone alluvium soils respectively. Combinations of N and P will b'e seen to produce superior results over single
/

106 AGRICULTURAL SECTION
PLATE V
RESPONSETO MANURES IN DIFFERENT SOIL DIVISIONS (19%0*51 TO 1953.94)
4 v
PROFIT DUE To MMURING IN DIFFERENT %IL D~VISIONS (1950-51 TO 1953-54)
.** 9

K.L. KHANNA, ROC, ACHARYA, K.P. SINGH
TABLE VTII
5.2 6.8 5.6 4.5 5.7 7.3 7.6 18.9 10.4 6.9 6.6 5.5 6.4 6.6 9.5 10.5 21.7 12.4 7.9 8.2 7.8 7.8 7.3 12.1 14.7 25.0 15.1
(ii) Soil divisions
~ a l c a k o u s Non-calcareous Heavy clay Sone alluvium
--
MEAN RESPONSES TO N AND P
ean responses to N and P w~ith reference to the different districts and soil ns have been depicted in Tables IX and X. It will be seen that the responses
s to N, vary from 2.4 tons in calcareous to 8.8 tons in Sone alluvium.. those egard to N, ranging from 4.5 tons (non-calcareous) to 10.3 tons (Sone

108 AGRICULTURAL SECTION
PLATE VI
RESPONSE TO MUURE IN DIFFERENT SOIL tMVOSIO#S (NP SERIES)
I
1914-55
"I~IYII% 'ip~rDl"&, CALCAREOUS
PROFIT DUE TO MANURING IN DIFFERENT (NO SERIES)
1954 -55
-" ~6 - n - n - N aa P a (YNFIN N * % % --O_P N N N N t b i 5 Z ~ Z Z znzz Z P Z Z , .znzz Z P Z Z
CALCAREOVS NON CALCAREOUS HEAVY CLAY
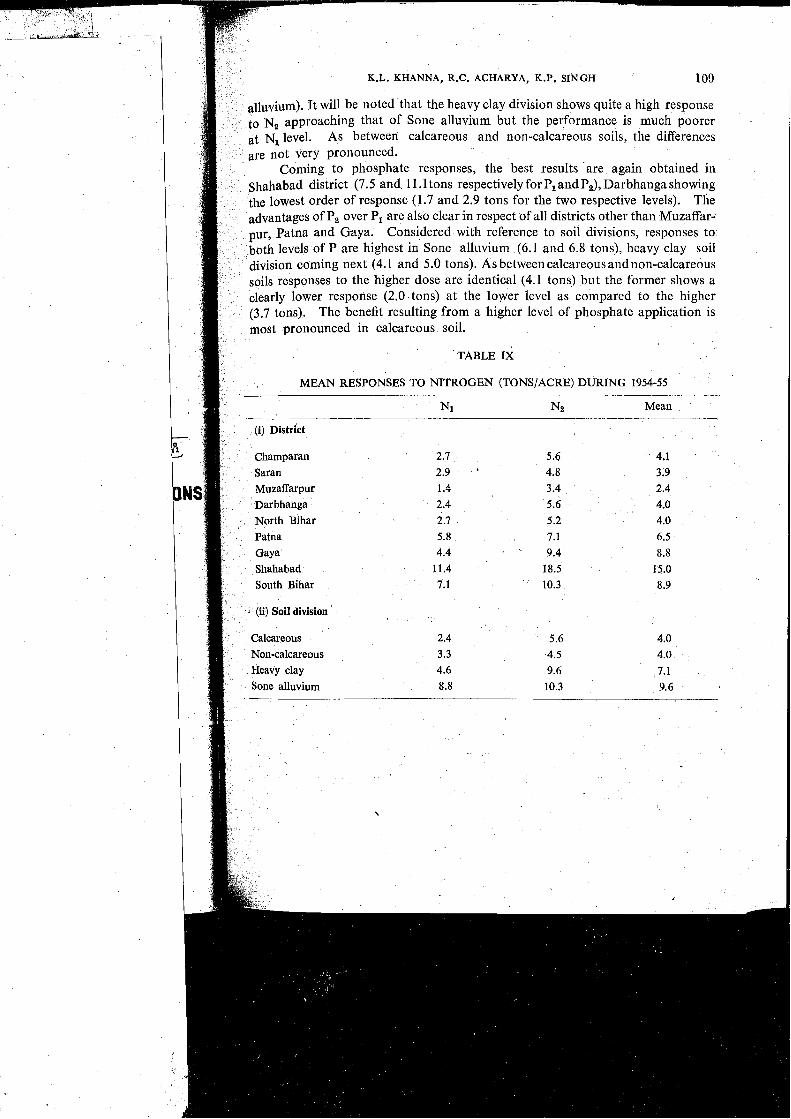
K.L. KHANNA, R.C. ACHARYA, K.P. SINGH 109
luvium). It will be noted that the heavy clay division shows quite a high response
ahabad district (7.5 and 11.1 tons respectively for P, and P,), Darbhanga showing
ost pronounced in calcareous soil.
TABLE IX
NI Mean
2.7 5.6 4.1 2.9 ' 4.8 3.9 1.4 3.4 2.4 2.4 5.6 4.0 2.7 5.2 4.0 5.8 7.1 6.5 4.4 9.4 8.8
11.4 18.5 15.0 7.1 10.3 8.9
2.4 5.6 4.0 3.3 4.5 4.0 4.6 9.6 7.1

/
110 AGRICULTURAL SECTION
TABLE X
MEAN RESPONSES TO PYOSPHATE (TONSIACRE) DURING 1954-55
PI p2 Mean
(i) District
Champaran Saran Muzaffarpur
' Darbhanga North Bihar Patnn Gaya Shahabad South Bihar
(ii) Soil division I
Calcareous Non-calcareous
Sone alluyium
(b) Series I1 : NPK trial8 (N. W. Champaran).-The responses to different treatments in this series have been shown in Table XI. In Table XII, responses
TABLE XI
RESPONSES TO DIFFERENT TREATMENTS IN THE NPK SERIES (TONSIACRE) DURING 1954-55
Increase over control Increase over conttol Treatment
to potash have been represented as increments in yield resulting from the two levels of K application over three different levels in respect of NP, viz., NIP,,
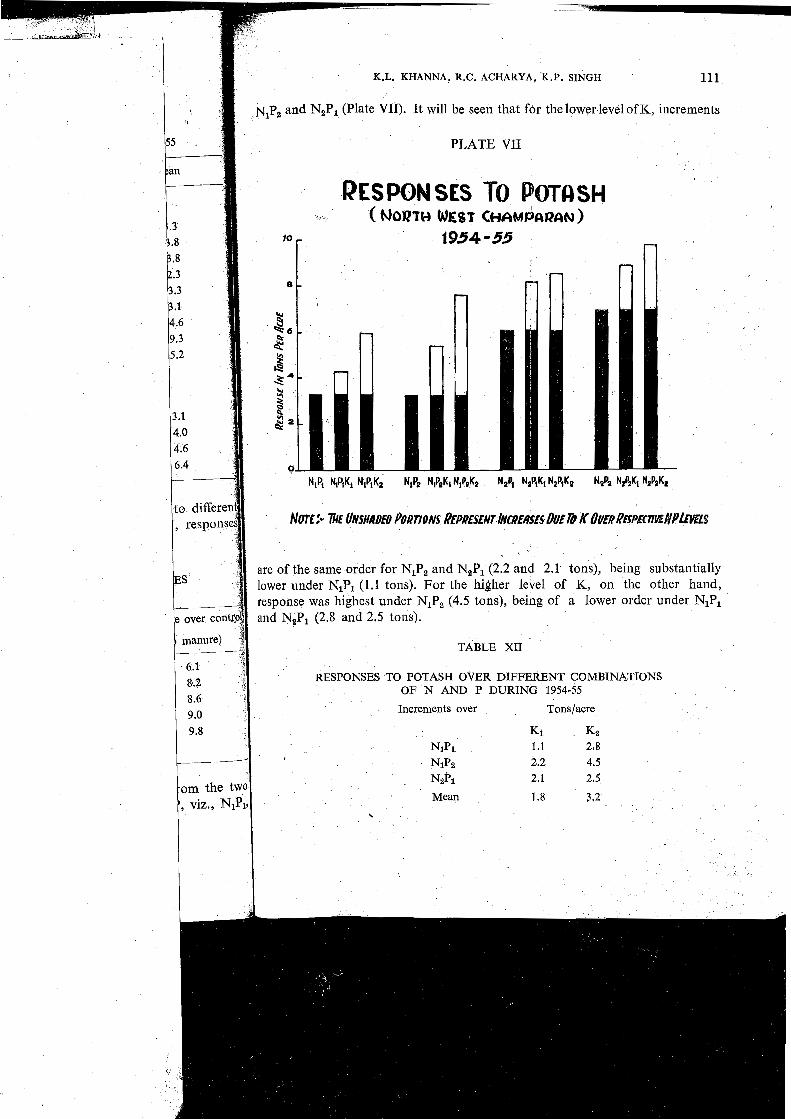
K.L. KHANNA. R.C. ACHARYA, K.P. SINGH 111
~ ~ p , and N,Pl (Plate VIT). It will be seen that for the lower level of K, increments
PLATE VII
RESPONSES TO POTQSH , ( NORTH WEST CHAM~RCIN )
NOT[:- TkE UNSHRDED PORTIONS R~PRESLNT &CREASES DUE@ IYOVFPRMB~C~K#PLE~~~S
are of the same order for NIP, and N,P, (2.2 and 2.1 tons), being substantially lower under NIP, (1.1 tons). For the higher level of K, on the other hand, response was highest under NIP, (4.5 tons), being of a lower order under NIPl and N,Pl (2.8 and 2.5 toas).
TABLE XI1
RESPONSES TO POTASH OVER DIFFERENT COMBINPATIONS OF N AND P DURING 1954-55
Increments over Tonslacre
K1 K2 NIPI 1.1 2.8 N1Pz 2.2 4.5 NzPl 2.1 2.5
Mean 1.8 3.2 \

112 AGRICULTURAL SECTION ,,
ECONOMICS OF MANURING FOR DIFFERENT TREATMENTS
Economics of manuring in respect of the treatments under examination calculated after deducting the cost of manurcs and fertilizers aphlied from the value of the extra crop harvested, have been shown with reference to the different district and soil divisions in Tables XI11 and XIV. It will be seen that N,P, proves most profitable in the districts of Champaran, Saran and Darbhanga in North Bihar and Gaya and Shahabad in South Bihar, yielding
' net profits per acre to the extent of Rs. 213, Rs. 180, Rs. 158, Rs. 232and Rs. 923 respectively. In Muzaffarpur and Patna districts, N2P, is most advantageous, giving profits of Rs. 134 and Rs. 246 respectively. This dose is also a close second for the district of Gaya. So far as the soil divisions are concerned N,P2 is most profitable in all cases. The extra profit obtained under this dose over N,Pl is most pronounced in heavy clay soil. The profits obtained in Sone alluvium are remarkable under a11 treatments involved.
Additional profits accruing from the two levels of potash application in N.W. Champaran have been shown in Table XV (Plate VTII). It would
PLATE VIII
~?ROFIT DUE TO POTASSIC APPLICATION 1954-55
appear that K, in co~~junction with NIP, leads to the highest extra profit ( ~ s . 117 per:acre), the least additional benefit being obtained with K, in association with NIPl (Rs. 17).

1 from thd
K.L. KHANNA, R.C. ACHARYA, K.P. SlNGH 113
I TABLE XI11
PROFITS DUE %TO MANURING IN DIFFERENT DISTRICTS IN RUPEES PER ACRE
1954-55
Champaran 99 130 123 213
Saran 158 119 147 180
~uzaffarpur 113 78 134 99
~arbhanga 103 114 135 158 xrnrth Rihar 120 119 134 183
Gaya 172 258 341 3 52
hah ha bad 591 675 728 923
South Bihar 277 331 356 425
TABLE XIV
PROFITS DUE TO MANURING IN DIFFERENT SOIL DIVISIONS IN RUPEES PER ACRE
(1954-55)
Calcareous 99 118 146 196
on-calcareous 107 132 124 163
Heavy clay 172 258 290 402
Sone alluvium 340 389 407 45 1
TABLE Xv %
PROFITS IN RUPEES PER ACRE.DUE TO POTASSIC APPLICATION (1954-55)
Increase in profit over K1 Kz
N ~ P I 17 55
NIP, 59 117 NzPi 54 46
Mean 43 73

114 AGRICULTURAL SECTION
TABLE XVI
RESPONSES AND NET PROFITS ACCRUING FROM A STANDARD DRESSING OF 20 Ibs. Ni-25 Ibs. P2O6 PER ACRE
(1954-55)
District or Soil division. Response (toilslacre) Net profit (Rupeeslaore) - --
(i) District
Saran . 4.3 Champaran 4.5 Muzaffarpur 3.7 Darbhanga 3.5 North Bihar 4.1 Patna 4.7 Gaya Shahabad 13.9 South Bihar 7.4
(ii) Soil divisio~~
Non-calcare~us 4.7 Calcareous 4.2 Heavy clay 5.3 Sone alluvium 7.7 -
STANDARDISED RESPONSE AND PROFITS : OPTIMAL DRESSING OF N AND P
As the nutrient levels under consideration differed in North and South Bihar, responses were standardised to a level of 20 N +25 P205 in order to obtain a comparative idea of the performances in different districts and soil divisi For this purpose, Mitscherlich exponential response curves, as used by Grow
constant K (which determines the. curvature) being taken from Carey and Robinson's paper (loc. cit.), viz., K,=0.006 and K,==0.010. The response curves (Plate IX) were utilised in working out the optimal dressings in respect of N and P,O,. Optimal combinatidnal dressings of the two nutrients were also calculated. The responses and profits accruing from a standard dressing of 20 N+25 P,05 have been shown with reference to the districts and soil divisions in Table XVI (Plate X). It would appear that among the districts of North Bihar responses are highest in Saran and Champaran (4.5 tons), Muzaffarpur and Darbhanga showing responses of a lower order (3.7 and 3.5 tons). Net profits show the sam trend, being Rs. 128 in Saran and Champaran as against Rs. 98 and Rs. 89 for Muzaffarpur and Darbhanga. So far as South Bihar is concerned, Shahabad leads with a response of 13.9 tons and profits of Rs. 478 per acre, followed Gaya (6.8 tons and Rs. 213) and Patna (4.7 tons and Rs. 135). The respon obtained and profits recovered are outstanding for South Bihar in general an Shahabad district in particular. Considering the soil divisions, Sone alluvium, proves


AGRICULTURAL SECTION
as to the supremeimportance of manuring vis-a-vis realisatioil of objects in respect of crop yields. It will be realised, therefore, that any efforts towards formulation of the right manurial schedule for each sugarcane growing hrea are bound to result in information of vital importance to the industry. As the soil survey scheme of factory areas progresses, the need to determine immediately the kind
PLATE X
STANDARD RESPONSES TO NITRBG EN2k PHOSPHATE~~PROFIT PER ACRE STANDARD DRESSING 20N+25P205 ACRE ( ~ ~ = 0 ' 0 0 6 , KP=o'O~O)
RESPONSE
PROFIT
and quantity of manures and fertilizers in different soil types isolated also becomes urgent. The completion of factory area tube-well scheme and of other similar projects also envisages rapid development of cane in concentrated blocks round such irrigation points and there is evident need to determine under cultivators' conditions variations in irrigation and manuring schedules worked out at the different research stations. For this purpose, a large number of experiments need to be laid out on cultivators' fields every year and besides yield responses, various other aspects being gradually incorporated, such as collectioil of profile soil samples from each experimental plot with a view to correlating crop responses to soil characters ; study of the interaction of irrigation andmanuring at different levels; juice quality variations in relation to treatments; residual effects on succeeding grain crops; pest and disease incidence at harvest with reference to treatments applied and so on. There is little doubt that such an endeavour will go a long way towards placing the Industry on a-sound footing.

--
K.L. KHANNA, R.C. ACHARYA, K.P. SINGH 117
SUMMARY
1. The results of nlanurial experiments on sugarcane conducted on s' fields widely scattered over the entire sugar belt of Bihar have been
2. The experiments conducted during the first four years comprised four ophos (ii) Ammonium sulphate with single super-
ith single superphosphate and (iv) oilcake and ammonium erphosphate, a higher and a lower level of manuring o manure as contro!. In North Bihar, the manurial and 60 N+75P205, those for South ~ i h a r being 60N
Op,O, and 80 N+60P,05. 3. In the fifth year, the survey method of experimentation was adopted. series were involved, viz., (i) N P trials'in areas showing no response to K h consisted of 8 groups with 4 treatments (single and combinational doses
N,, PI, P2 against no manure as control) and (ii) NPK trials in the high aran where potash response had been observed,
oups with 6 treatments (single doses of N,, N,, P,, P, f N,, N,, P,, P,, K,, K, against no manure as control).
r 40N, 80N, 50P,O,, 100 P,O,, 80 K,O, 160 K,O ihar N,, N, represented 60 N and 120 N, PI,
60 P,05, no potash treatments being examined in this ombination was one of ammonium sulphate and oil-
(contributing respectively one-third and two-thirds of the Nitrogen) with
, significant yield responses to manuring were yearsof experimentation the higher dose on an average, re in North Bihar as compared to the lower dose but
ifferences were generally non-significant. - In South Bihar, on the other indicated. In the fifth year, however, high doses
nuring proved very effective in increasing acre-yields, a dosage of 80 N : oing best in North Bihar with the 120 N : 60 P,O, combination excelling ihar. So far as the NPK trials in N.W. Champaran were concerned,
us es $1 nt )n to ill
responses to potash application were recorded, the effect being most ced with 160 lbs. K 2 0 over a combination of 40 lbs. N and 100 lbs.
. In the trials of the first four years, Ammophos generally gave the highest and oilcakes the least. Oilcake manuring proved hardly profitable in Bihar. Oilcake in combination with Ammonium sulphate was generally able to the latter used as the sole source of Nitrogen. . Individual effects of N and P,O, calculated with reference to the fifth ata show that the responses to N and P205 at both levels are highest in Sone
ium. In the calcareous soil division, the advantage resulting from a liigher of P,O, (as compared to the lower level) is also most pronounced.

AGRICULTURAL SECTION
7. The fifth year's data show high profits from manuring, the figures varying between Rs. 99 per acre in calcareous soil under 40 N : 50 P,O, dose to Rs. 451 per acre in Sone alluvium resulting from a 120 N: 60 P,O, dose. Likewise, profits due to potash application in N. W. Champaran vary from Rs. 17 per acre (80 Ibs. K,O over 40 Ibs. N and 50 lbs. P,O,), to Rs. 117 per acre (160 lbs. K,O over 40 Ibs. N and 100 lbs. P,O,).
8. On the basis of the fifth year's trials, optimal combinationaldressings of N and P,O, have been worked out for the different soil divisions.
These are: Non-calcareous 59.2 N + 97.5 P,O, Calcareous 51.9 N + 93.1 P,O,
68.0 N + 102.8 P,O, Sone alluvium 94.7 N + 118.9 P,O,.,
ACKNOWLEDGEMENT
The authors are indebted to the Government of Bihar and the Indian Central Sugarcane Committee for jointly financing the Sugarcane Research Schkme in Bihgr under which the present work was carried out. Their thanks are also due to Dr. ,A.S. Chakravarti for going through the manuscript and making useful suggCstions. They also wish to place on record their appreciation of the co-opera- tion extended by the sugar factories and the field work done by Cane Develo
, ment staff in different areas.
REFERENCES I
1. Yates, F., Finney, D. J. and 1952 I .C .A .R .Res .Ser . No. 1. Panse, V.G.
2. Mukherjee, H. N. 1952' Proc. Bihar Acad. Agric. Sci., 1 , 58, 94.
3. Panse, V.G. and Sukhatme, P.V. /953 Jour. Ind. Soc. Agric. Stat., 5 , 145-160.
4 . Growther, E.M. and Yates, F. 1941 Emp. Jour. Expt. Agric. 9 , 77-97.
5 . Carey, T. M. and Robinson , P. 1953 Ibid. 21, 99-115.
DISCUSSION
Dr. Arakeri asked if the soils on which these experiments were being conducted had been analysed. Mr. Khanna replied that the experiment had been scattered over different soil divisions whose characteristics had been fully studied in the soil survey conducted earlier.