agriculture stormwater sub-committee revision of pesticide
TRANSCRIPT

Agriculture Stormwater Sub-Committee
Revision of Pesticide Monitoring Recommendations
The Agricultural Stormwater Sub-Committee discussed the changes suggested by the Puget
Sound Stormwater Workgroup and have revised the pesticide monitoring recommendations
accordingly. The changes are discussed below by topic. The bold text is the change desired by
the Puget Sound Stormwater group. The regular text following the bold type is the revision by
the Agricultural Stormwater Sub-Committee.
1) Provide additional information on program for contextual understanding. The following
citation and web link provides detailed background information on the pesticide monitoring
program: Sargent, D. et al. 2010. Surface water monitoring program for pesticides in salmonid-
bearing streams 2006-2008 triennial report. WA State Dept. Ecology and WA State Dept. of
Agriculture. Pub. # 10-03-008. 305 pp. http://agr.wa.gov/FP/Pubs/docs/302-SWM2006-
2008Report.pdf
2) Articulate the monitoring questions & consider rotating panel sampling.
Revised Recommendation 1: Broad scale monitoring such as status and trends is not the
most cost-effective method to monitor pesticides in Puget Sound water bodies. We recommend a more targeted approach that combines source ID and program or watershed scale effectiveness monitoring. The Dept of Agriculture and Ecology’s current program provides a valuable foundation for pesticide monitoring in the state and uses source ID and effectiveness monitoring. We recommend continued reliance and funding for this program to serve as the baseline for stormwater agricultural pesticide monitoring. This program answers the following questions: Are pesticide levels in salmon-bearing surface waters within acceptable levels throughout the pesticide usage period in the Puget Sound region? Which chemicals are above acceptable levels? For any high level of detected pesticide, which crops are the likely contributors?
Revised Recommendation 2: The current pesticide monitoring program samples
agricultural lands on a weekly basis from March through mid-September, but does not specifically sample peak flow events. We recommend seeking funding to augment the current Ag/ECY pesticide monitoring program to use existing data to develop a model to estimate impacts due to peak flow events, then increase surface water sampling to test the model. This could start as a pilot program in the Skagit Basin because that is where the baseline data exists. The monitoring questions addressed are: Are the pesticide levels in salmon-bearing surface waters within acceptable levels during peak flow events? If not, which chemicals and crop type are associated with higher levels?
Revised Recommendation 3: The current pesticide monitoring program samples water
bodies susceptible to agricultural runoff in Skagit County. However, these water bodies may not be representative of areas where cropping patterns are significantly different. We recommend seeking funding to conduct pesticide monitoring throughout other areas of the Puget Sound region using a rotating panel of randomly-selected sites that are associated with different cropping patterns. The monitoring question that would be answered is: Are monitored pesticide levels in salmon-bearing surface waters associated with cropland throughout the Puget Sound region similar to those in extensively-monitored Skagit County? Based upon existing

information, the rotation period per site will need to be a minimum of three years and may need to be longer to account for annual variability. There may also be practical limitations with laboratory capacity.
3) Reflect on Overlap Between Agricultural, Residential, and Commercial Pesticide Uses.
The Agricultural Stormwater Sub-Committee considered the issue of pesticide impacts from
other land uses and appreciates the need to include these. It will be important to highlight this
data need as the strategy is developed. However, the sub-committee will not be able to
address other land use issues within its existing priorities and work plan.

1
Sept 19, 2012 ___ Decision ___ Discussion ___ Information SUBJECT: Recommendations for Monitoring Potential Animal Impacts to Stormwater
from Agricultural Lands ISSUE: Agricultural production of animal products can have water quality impacts
that are delivered via stormwater or direct deposit to streams. These include impairments in: sediment, pH, dissolved oxygen, nutrients, fecal coliform, and certain metals, impairing beneficial uses for salmon and other fish species, humans, and aquatic ecosystems as a whole. This strategy seeks to identify then address potential sources from all livestock operations including those that exist for profit and those that are hobby-related with a focus on rural/agricultural areas.
In terms of regulatory oversight, there are two basic categories of livestock
farms: those that have specific requirements under either the state dairy nutrient management program, the Concentrated Animal Feeding Operations (“CAFO”) National Pollution Discharge Elimination System (“NPDES”) permit system, or County Critical Areas Ordinances; and those that do not. Dairies and permitted facilities operate under a system that collects information about the potential impacts and addresses those impacts with Best Management Practices (BMPs). Follow-up monitoring includes implementation monitoring, soil tests, and occasional water quality investigations. While all licensed dairies are covered by the state dairy program, there are currently a small number of CAFOs that are covered by the permit. Most livestock operations are not part of either system, resulting in a lack of information about where and how much total potential impact exists within a watershed or sub-watershed.
Also, once potential pollutant loadings are identified, areas need to be prioritized and a successful program, based on good stewardship, needs to be applied to address the problems. Lastly, follow-up monitoring is needed to assure that water quality has improved to the level expected.
The recommendations described below provide a framework to: 1) use
broad-scale monitoring to identify and prioritize potential problem areas, 2) conduct an adequate process that can successfully address the issues, 3) use source identification monitoring to define specific problem reaches, 4) address the problems with BMPs, and 5) conduct follow-up effectiveness monitoring at a sub-watershed scale to confirm that the BMPs are implemented and have adequately addressed the problem. Lastly, we recommend that source identification for livestock impacts incorporate the suggested parameters in the attached source ID guidance paper.
BACKGROUND: Which types of monitoring and assessment information are needed and why? The Agriculture Stormwater Sub-Group reviewed existing information regarding agriculturally-produced animal products in Puget Sound. They found that not only is monitoring lacking for many types of livestock operations, but there is no process or strategy in place to address problems for farms that are

2
not under the Dairy Nutrient Management Program, or covered by a permit system. Also for all animal facilities, follow-up water quality monitoring at a broader scale is uncommon and needed to ensure that enough actions have been done to achieve standards where it counts: in the stream or ecosystem. The current situation is that licensed dairy farms and permitted CAFOs have oversight from the Departments of Agriculture and Ecology. The current level of monitoring for these activities are: 1) best management practices (BMPs) are monitored for implementation (were they installed and are they in use); 2) soil tests for nitrogen and phosphorus when manure and fertilizer is applied on cropland; 3) discharges are investigated; and 4) existing ambient water quality monitoring can be examined to assess water quality impacts. However, water quality measurements may have little correlation to stormwater events. The conclusion is that while there is existing implementation monitoring of the practices on dairies and the few permitted operations, such practice implementation monitoring is lacking for other livestock activities. Also, larger scale (watershed or sub-watershed) water quality monitoring is generally lacking, especially when related to stormwater. All other livestock farms are not under an oversight system and no monitoring or record-keeping is required. This includes heifers, feedlots, non-beef, and small/hobby farms. For these types of farms, the current situation is: 1) inventories of animals have been done in some counties, but not across the Puget Sound region; 2) Some of these inventories included prioritization of farms based upon a potential to pollute; 3) up until now, little guidance has existed on how to conduct adequate source identification monitoring to define problem reaches and how to use this information where it exists to improve water quality. The desired monitoring strategy for all types of livestock farms is described in the recommendations below. The strategy needs to be credible (confidence in methods, results, and conclusions), effective, as least-intrusive as possible, and alters behavior to result in good water quality. It includes collecting needed information on livestock operations, applying a strategy that is believed to be successful in addressing agriculture-related livestock problems with a heavy reliance on good stewardship and support from livestock landowners and the community, and guidance regarding what and how to monitor. Who was involved in the Subgroup, and how were decisions made? Members of the Agriculture Subgroup are or have been: Heather Kibbey (City of Everett), Mike Shelby (Western Washington Agriculture), Jay Gordon (Washington Dairy Federation), Karma Anderson and Dino Marshalonis (EPA), Bob Cusimano (ECY), Monte Marti and Bill Bowe (Snohomish Conservation District), Karen Bishop (Whidbey Island Conservation District), Sherre Copeland and Clare Flanagan (NRCS), Nora Mena, Chery Sullivan, Kelly McLain, and Jim Cowles (Washington Dept. of Agriculture), Rick Haley and Michael See (Skagit County), Joe Holtrop and Meghan Adamire (Clallam Conservation District), Carolyn Kelly (Skagit Conservation District), John Bolender (Mason Conservation District), Rosie Taylor (Jefferson Conservation District), George Boggs (Whatcom Conservation District), Heather Trim (People for Puget Sound), Richard Doenges (Thurston County), Adam Lorio (Samish Indian Nation, and Carol Smith (Washington Conservation Commission). These individuals had the opportunity to review and comment on all products, but do not necessarily endorse all the recommendations. Products included meeting summaries from five meetings: March, May, July, August, and October 2012. The recommendations were developed primarily in the March and May meetings. They were reviewed for submission to the Puget Sound Stormwater Workgroup during the August 9 meeting with revisions finalized at the October 12th meeting. A mix of participants was present at the March, May, July, August, and October meetings when this product was under development. Decisions were reached by consensus.

3
Where are we in the SWG approval process, and when are decisions needed? Draft recommendations were presented at the September 19th meeting. Consensus within the ag stormwater group was not fully reached at that time. A follow up presentation of revised recommendations is scheduled for the November 14th Puget Sound Stormwater Workgroup meeting. How and when are recommendations envisioned to be implemented? The agriculture stormwater subgroup will develop an implementation and funding plan in a future set of meetings. We want to develop this plan after we have a full set of agriculture recommendations to facilitate prioritization. Also, we only want to develop this plan for approved recommendations. What are the funding implications? See above answer. ALTERNATIVES CONSIDERED: We considered the circumstances as we know them, and our recommendations are in the following sections. The consideration of alternative solutions would involve work outside the scope of this sub-committee.
RECOMMENDATIONS AND REASONING:
Assure adequate support. To achieve success, certain key items need to be in place prior to implementation. Recommendation 1. Find the necessary technical, political, and financial support that is needed throughout the process. Some of the funding should be from a consistent source (not grants) for basic operations and monitoring. Supplemental funding could be used for additional monitoring and implementation. Technical support also includes a coordinator to manage funds, oversee activities, manage contracts with other entities to implement the program, and interface with the local political environment for continued support.
Recommendation 2. Develop an effective community support system to ease the need for extensive regulatory oversight. Along with an effective community support system examine the existing enforcement process that would occur only when local voluntary efforts are unsuccessful. Is existing enforcement well-defined, well-communicated, appropriate, and sufficient?
Use broad-scale monitoring to prioritize problem areas at a sub-watershed level where detailed source identification monitoring and implementation will occur. Significant data gaps exist, especially regarding the extent of potential problem areas associated with small (unpermitted/unlicensed) livestock farms or dairies. Key questions needing data are: in which sub-watersheds should we focus resources initially and to what extent do farm animals contribute to pollutant problems in Puget Sound during stormwater events? Our first recommendation is to use broad-scale monitoring and other data as triggers to identify the areas with the greatest problems. The second recommendation is to provide a clearer picture of current animal impact to stormwater conditions. Recommendation 3. Use triggers, such as broad-scale monitoring, to identify sub-watersheds that have a high potential impact. Triggers include the presence of a TMDL for agricultural parameters in an area with significant agriculture; documentation of downstream problems potentially relating to agriculture such as shellfish bed closures; water quality results (i.e., status and trends monitoring, ambient water quality monitoring, and others) that indicate problems; and farm survey information (focused on agricultural/rural lands). It is also important to prioritize by being proactive rather than just reactive and consider pollutant loading sources. How contributory are the sources to potential pollution? An example would

4
be a stream with high loads and high flows contributing to total impact. This situation would be prioritized over a stream with high loads and low flows.
Recommendation 4. Because farm survey results can be important identifiers of potential pollution, conduct surveys where data gaps currently exist for non-dairy, non-permitted operations. Important data to collect includes: animal numbers, types, location, proximity to water bodies, BMPs in use, and BMPs needed. This information is not easily documented. To facilitate this action, we have a few examples of forms and prioritization methods that can be used by others in the future (Appendix 1), although most importantly, the survey should include the above-listed data fields. Surveys have been completed in Whatcom, Samish, Clallam, Stillaguamish, Snohomish, Kitsap, and King County watersheds. Survey frequency will depend on local conditions, landowner turnover, and other factors resulting from adaptive management. Ideally, this work would be dynamic with GIS updates resulting from monitoring results, field visits, and implemented plans. Recommendation 5. Coordinate with existing monitoring programs to avoid duplication of effort and leverage existing resources. Examples are the Pollution Identification and Correction (PIC) work that the Department of Health is funding across Puget Sound and any implementation of Ecology’s Total Maximum Daily Loads (TMDLs). Conduct an adequate process to successfully address the problems. Once a high priority problem area has been identified, apply the following strategy to better define the problem and then address the problem using source ID monitoring. These recommendations will address the following questions:
What are the relative roles and value of community involvement, voluntary compliance, and enforcement in solving farm animal pollution?
How do we effectively monitor and then reduce and prevent the impact of farm animal waste?
Are current monitoring efforts sufficient for permitted or licensed dairy facilities. .for unpermitted facilities?
Recommendation 6. For high priority areas, further define the problems, while obtaining community support: a. Conduct community outreach to elevate the issue and obtain support. Define the
community to be small enough to be effective. If community support is not present, the remaining actions are unlikely to be successful. As part of building community support, identify an early adopter to show success quickly.
b. Collect detailed survey information for all potential sources of impact in that area. This includes non-ag, small farms, permitted and dairy facilities, and other commercial operations. It is recognized that pollutants from non-agricultural activities may influence the water quality in agricultural areas, and these other sources need to be inventoried as well.
Recommendation 7. Conduct source identification monitoring or bracket water quality monitoring around storm events to better characterize the sources of pollutants in these high priority areas. Can use the suggested parameters developed in this process (Appendix 2).
Recommendation 8. Implement best management practices (BMPs) to address the identified sources of problems. Monitor the implementation and maintenance of BMPs (see example of implementation monitoring form in Appendix 3). BMPs could include vegetative practices to improve water quality.
Recommendation 9. Conduct effectiveness monitoring and adaptive management to mark progress and implement additional practices.

5
Provide guidance for choosing source identification parameters for livestock farms. Recommendation 10. Provide and encourage source identification monitoring for livestock impacts to use the guidance in Appendix 2. This is a suggested list of parameters needed for initial source identification monitoring for livestock impacts. The choice of parameters will be driven by the site-specific needs of that area. This may require the addition of other parameters in some sites. Advance new monitoring techniques when proven to be effective. These data are important to help answer the question:
How can bracket monitoring better identify problem areas and subsequent changes/improvements after BMP implementation?

6
Appendix 1. Examples of Forms or Processes Used for Successful Livestock Surveys and Prioritization of Potential Impacts.
Example 1. Clallam Conservation District.
AGRICULTURAL WATER QUALITY REMEDIATION STRATEGY
STEP 1 – INVENTORY OF FARMS COUNTYWIDE - 1,252 Farms Inventoried in 2006
Performed a windshield survey of the entire county driving down all roads. Using hardcopy maps
farm parcels were outlined based on field observations and assigned a farm number. The farm
number and following information were entered into an access database on a laptop brought into
the field:
Parcel site address which was linked to a spatial database for mapping and data analysis
Number and type of livestock
Types of crops and acreage estimates
Notation of parcels with general agricultural activities such as poultry, apiaries, farm
stands, flowers, hay, nurseries, etc.
Farms “ranking” based on their potential to impact water quality (high, medium, low).
Took into account horse/livestock access to waterways, waterways with outlets,
proximity of manure piles and wintertime confinement areas to surface water, etc.
STEP 2 – PRIORITIZE FARMS according to potential impacts to surface water quality
MEDIUM and HIGH POTENTIAL IMPACT = HIGH PRIORITY
125 High Priority Farms Countywide
STEP 3 – PRIORITIZE FARMS by WRIA, WATERSHED and SUBWATERSHED
STEP 4 – DESCRIBE HIGH PRIORITY FARMS according to status with District
COOPERATORS – describe status (why are they still High Priority?)
NO RECENT or PREVIOUS CONTACT
UNCOOPERATIVE
STEP 5 – CONDUCT REGIONAL WORKSHOPS targeting HIGH PRIORITY FARMS
STEP 6 – INITIATE OUTREACH EFFORTS to HIGH PRIORITY FARMS
1. THREE CRABS AREA
2. Remainder of DUNGENESS BAY WATERSHED
3. Remainder of CLEAN WATER DISTRICT
Multiple contacts/visits over several months may be necessary before achieving cooperation.
STEP 7 – PROVIDE TECHNICAL and/or FINANCIAL ASSISTANCE to HIGH PRIORITY FARMS
If necessary to mitigate water quality impacts
STEP 8 – IF COOPERATION IS UNACHIEVABLE
Next steps will be evaluated on a case-by-case basis.
STEP 9 – ADD FARMS TO THE HIGH PRIORITY LIST AS NEEDED
Any HIGH PRIORITY FARM requesting assistance is a top priority, regardless of geographic location.
If resources are insufficient to meet demand, high priority farms will be prioritized according to
geographic location. Geographic priorities are listed under STEP 6. A LOW PRIORITY FARM may be
considered a high priority to assist if other factors, including status in the community help achieve
outreach goals in region.

7
Example 2. Snohomish Conservation District.
What data has been collected and how collected?
o Snohomish CD has collected a lot of “visual” livestock inventory data over the years.
The latest were two priority watersheds within the Stillaguamish Clean Water District.
Data collected was done via windshield surveys, on county roads. The staff did not go
down private drives or roads.
o SCD also did follow-up on completed farm plans over a period of 10 years to determine
the efficacy of implementation. This was done via phone calls and surveys as a way to
reconnect with landowners. We found this a very useful tool to identify BMPs that had
been developed after a grant or contract ended, and determine why they moved forward
with implementation and were they maintaining the BMP. It also provided a way to
assess why people weren’t implementing BMPs.
o SCD has also collected some livestock survey data via GPS technology.
o Other data collected was manually written down on each site according to numbers/type
of livestock, BMPs implemented, BMPs lacking, type of wetland/waterway or critical
area, access by livestock to water, notes for discussion to help prioritize site based on
water quality.
How is the data analyzed or summarized (if it was?)
o Data was manually put into an Access database, and any GPS coordinates were loaded. It
was then downloaded to a spreadsheet where we used pivot tables to analyze the data.
This allowed us to figure out percentages, and help prioritize “hot spots.” It also allowed
us to determine the amount of BMPs that were on the ground as well as how much was
lacking.
How was it used to prioritize workload or assist in decision making?
o This data allowed us to determine and sort the “high risk” properties to use as a priority
for funding as well as a priority for follow-up and continued effort within these
watersheds. The watersheds were prioritized for survey work by the Stillaguamish Clean
Water District and their proximity and/or impacts to shellfish beds and water quality
based on TMDLs, local knowledge, and existing water quality data.
Example 3. Department of Ecology.
Livestock and Water Quality Site Visit
Site Visit Information First Visit Follow-up Visit
Prepared by: Arrival Time:________ Depart: ______________
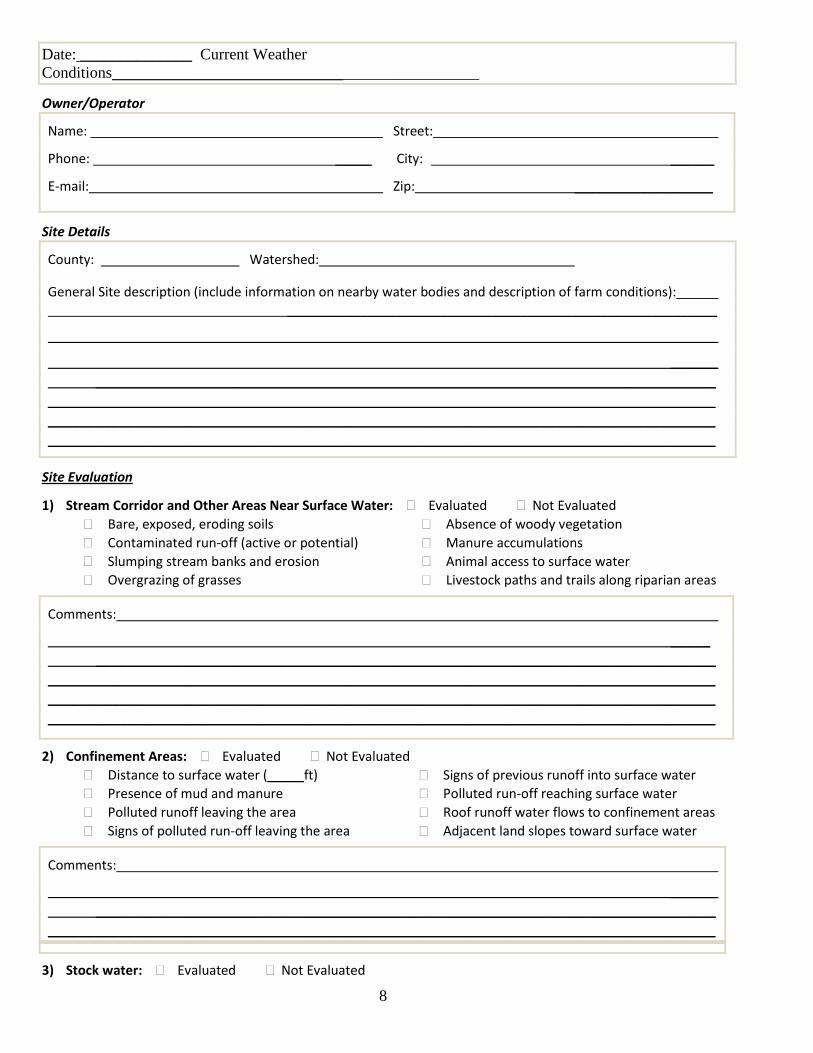
8
Date: ______________ Current Weather
Conditions______________________________________________
Owner/Operator
Name: Street:
Phone: _____ City: ______
E-mail: Zip: ___________________
Site Details
County: Watershed:
General Site description (include information on nearby water bodies and description of farm conditions): ___________________________________________________________
______ __________________________________________________________________________________________________________________________________________________________________________________________________________________________________________________________________________________________________________________________________________
Site Evaluation
1) Stream Corridor and Other Areas Near Surface Water: Evaluated Not Evaluated
Bare, exposed, eroding soils
Contaminated run-off (active or potential)
Slumping stream banks and erosion
Overgrazing of grasses
Absence of woody vegetation
Manure accumulations
Animal access to surface water
Livestock paths and trails along riparian areas
Comments:
_____ __________________________________________________________________________________________________________________________________________________________________________________________________________________________________________________________________________________________________________________________________________
2) Confinement Areas: Evaluated Not Evaluated
Distance to surface water (_____ft)
Presence of mud and manure
Polluted runoff leaving the area
Signs of polluted run-off leaving the area
Signs of previous runoff into surface water
Polluted run-off reaching surface water
Roof runoff water flows to confinement areas
Adjacent land slopes toward surface water
Comments:
______ __________________________________________________________________________________________________________________________________________________________________
3) Stock water: Evaluated Not Evaluated

9
Distance to surface water (_____ft)
Overflow from tanks on to the ground
Mud and standing water at tanks
Animals accesses stream for stock water
Comments:
_____ __________________________________________________________________________________________________________________________________________________________________
4) Upland Pasture Areas: Evaluated Not Evaluated
Animal access to stream corridors
Distance to surface water (_____ft)
Signs of overgrazing and erosion
Manure accumulations and bare ground
Comments:
_____ ______________________________________________________________________________________________________________________________________________________________________________________________________________________________________________________
5) Manure Management: Evaluated Not Evaluated Current manure management plan?_____
Manure collected and stored?______
Manure storage properly sized?
Manure storage covered?
Manure being collected often?
Manure stored on an impervious surface?_______
Applied during growing season?____ __
Manure applied during non-growing season? __
Vegetated buffer when manure is applied? _
Manure disposed off site? __

10
Comments:
_____ __________________________________________________________________________________________________________________________________________________________________
Other Areas of Concern/General Comments
__________________ ______ ________________________________________________________________________________________________________________________________________________________________________________________________________________________________________________________________________________________________________________________________________________________________________________________________________________________________________________________________________________________________________________________________________________________________________________________________________________________________________________________________________________________________________________________________________________________________________________________________________________________________________________________________________I
Corrective Actions Required
Install livestock exclusion fencing to keep animals at least ft from surface waters (35ft minimum) The exclusion area should be comprised of native shrubs and trees suited to the soils and hydrology of the site.
Install off-stream stock water watering facilities and locate them at least ft from surface to prevent risk of water quality impacts (minimum of 75ft)
Collect manure frequently and store it in a dry, covered area with an impervious floor or deck
Apply manure during the growing season at proper rates and times (minimum of 100ft setback from
surface water, or the use of a 35ft vegetative buffer)
Site and design confinement and manure storage areas to prevent pollution of surface and ground
water
Provide heavy use protection in confinement areas and at stock tanks to prevent run-off
Construct stream-crossings and emergency water locations in ways that protect the stream
Other Actions _______________________________________________________________
Photos Taken: Yes No Samples Taken: Yes No Conservation District Referral:
Yes No
General Comments: _________________ ________________________________________________________________________________________________________________________________________________________________________

11
Appendix 2. What parameters should be monitored to support Source ID?
Microbiological Examination Measurements
Solids Dissolved Oxygen, pH, Nitrogen, and Phosphorus Measurements
Copper, Zinc, and Hardness Measurements
Microbiological Examination Measurements
Fecal coliform E. coli % KES Enterococcus Chloride and Specific Conductance
Fecal wastes carry bacteria that can cause diseases in humans and animals directly by drinking
(gastrointestinal illness) or swimming (ear, nose, throat, and skin infections). Indirect contact by
eating contaminated food (shellfish) and getting contaminated water on your hands can also
cause illness. Since there are so many possible disease organisms, researchers have tried to find
bacteria organisms that are easily tested and commonly found in fecal wastes. There are several
bacteria indicators. Each has its own history, strength and weakness.
Fecal coliform (FC) using both the membrane filter (MF) and most probable number (MPN)
methods. FC is a family of indicator bacteria for manure and fecal wastes sources, but also
decaying vegetation. FC is the indicator used in Washington State Water Quality Standards to
determine the primary and secondary water contact recreation use of freshwater and primary
contact recreation in marine waters. The MF method is quicker and provides better precision.
The MPN method is more conservative and is compatible with FDA and Washington
Department of Health Shellfish Protection Program regulations for shellfish harvest areas.
E. coli is a more specific test for fecal sources from warm-blooded animals, and is recommended
by EPA as a superior indicator organism in freshwater.
% KES (Klebsiella, Enterobacter, and Serratia) confirms what portion of the FC count is from
vegetative sources.
Enterococcus is another group of fecal bacteria within the fecal streptococcus group. EPA now
recommends Entercoccus for measuring marine water sanitation for secondary contact
recreation. The FC/fecal streptococcus ratio was popular at one time to try and differentiate
between human and animal wastes. Researchers generally found the ratio works only if samples
are collected close to a fresh source of fecal material.
Chloride and Specific Conductance measurements are used to track potential sources of
wastes. The background levels in rivers and streams in western Washington are fairly low until

12
estuarine environments are encountered. The measurements will not change unless sources with
higher or lower levels are added to the waterway. Liquid wastes like sewage and manure have
high concentrations of chloride and high specific conductance readings. When a significant
source of wastes is discharged into the waterway, the increase in the chloride and specific
conductance is observable downstream and becomes stronger closer to the source.
Solids Measurements
Total suspended solids Total non-volatile suspended solids Total volatile suspended solids Turbidity
Erosion of sediment into waterways is a natural process, but too much sediment in waterways
can be the result of poor land management practices. Suspended solids and sediment can directly
harm aquatic organisms by damaging gills of swimming organisms and suffocating organisms
living on the bed of the stream, lake or estuary. Suspended solids can also interfere with feeding,
behavior, and movement of aquatic organisms, and block light penetration into the water. Also,
sediments and other solids transport other pollutants like bacteria, oils, pesticides, and
phosphorus that bind to solids particles. Other solids in the water column besides sediment are
organic materials from plants, algae, or other tissues growing in the water or materials that are
mechanically broken-down by biological, chemical and physical processes in the water. An
excessive amount of algae or sediment in the water column can be a problem for heat retention,
light penetration, visibility for swimming and boating safety, and aesthetic enjoyment. The
problem of suspended sediment and solids in the water column is one of both intensity of the
concentration and the duration that intensity is maintained.
Total suspended solids is a measurement of the amount of material in the water column that is
retained when the sample is filtered. The measurement can then be used to estimate the pounds
or tons of material being transported. Depending upon the species and life-stage of the fish,
concentrations as low as 10 mg/L – 20 mg/L over months of time can result in sub-lethal effects
like interference with feeding behavior, hatching rates, growth rates and disease resistance.
Months at 100 mg/L, and weeks or a few days of concentrations above 1000 mg/l could be lethal
to a majority of a local aquatic community.
Total non-volatile suspended solids measures the portion of the suspended material that is not
organic (by burning the sample in an oven) – mainly sediment materials. By subtracting the non-
volatile portion from the total suspended portion, the organic or total volatile suspended solids
fraction is found.
Turbidity is a measure of transparency of the water in nephelometic turbidity units (NTUs). It is
regulated in the Washington State Water Quality Standards by reference to a control sample
upstream of a source (not more than 5 or 10 NTUs over background). Particles that float or sink
easily are not adequately measured by turbidity procedures. If the particles are suspended
uniformly and suspended solid particles are not too heavy or light, turbidity can be highly
correlated with total suspended solids.
13
Dissolved Oxygen, pH, Nitrogen, and Phosphorus Measurements
Dissolved Oxygen (DO) pH Nitrogen (ammonia, nitrate-nitrite, total N) Phosphorus (total P and soluble reactive P)
Dissolved oxygen (DO) is regulated primarily to ensure fish survival. Washington State Water
Quality Standards are very salmon oriented. Since salmon spawn in gravels, the DO
concentrations required in the water column are high to keep salmon eggs and embryos in the
gravels aerated. Since DO levels in a healthy water body naturally swings to a maximum
concentration during the day and a minimum at night, the one-day minimum concentration is
regulated but the range between the maximum and minimum is also of interest. The one-day
minimum concentration allowed is 8 mg/L for salmon migration, rearing and spawning.
However, DO in some salmon areas cannot go below 9.5 mg/L. Warm water fisheries without
salmon only require 6.5 mg/L DO (none of these have been designated yet). Maximum and
minimum DO concentrations are affected by reaeration, temperature, biological activity, and
chemical reactions. Turbulent, shallow water will increase mixing with the atmosphere and raise
DO concentrations; slow and deep water will not mix as well and can have lower DO. Higher
temperatures will increase oxygen movement from the water to the atmosphere and decrease DO
in the water.
Algal growth, stimulated by nutrients, will increase DO concentrations in the daylight as algae
produce oxygen, and decrease DO concentrations at night as algae respire. As bacteria
breakdown organic materials, they use oxygen.
pH is a measure of the hydrogen ion activity in the water. Water bodies usually have a neutral
pH near 7 units. Under acidic conditions, pH moves down the scale to 6.5 units or less. Basic
conditions cause the pH to rise to 8 or 9 units. Surface waters in Washington generally fall within
the 6.5 – 8.5 unit Water Quality Standards. This range is considered healthy for aquatic
organisms and prevents some metals from disassociating and becoming toxic to aquatic
organisms. Higher pH values also increase the unionization of ammonia – increasing its toxicity.
The pH is moderated in freshwater by carbonate reactions. If CO2 is produced by bacterial
decomposition of organic material, algal respiration, or interchange with the atmosphere, then
pH will drop. As carbonates are formed from geochemical sources or algal productivity, then the
pH will rise.
Nitrogen and its compounds are present in most plant and animal materials and consequently are
present in decaying matter. Waters draining agricultural areas may contain high levels of the
different forms of nitrogen. Ammonia in large quantities is toxic to aquatic life and levels should
generally be <0.02 mg/L in non polluted freshwater. [Note: If stormwater discharges directly or
indirectly to nutrient-impaired marine water, then nitrogen measurements will be important.]
Phosphorus is an essential plant nutrient and may be limiting factor for plant growth in
freshwater. In comparison to other major nutritional and structural components in biota,

14
phosphorus is rarely found in significant concentrations in surface waters for two reasons: there
is only a relatively small amount available in the hydrosphere, and what is available is actively
taken up by plants. As with nitrogen, waters draining agricultural areas may contain high levels
of the different forms of phosphorus and can be a major pollutant that leads to eutrophication
processes. [Note: Phosphorus is closely associated with sediments. It can absorb to sediments in
overland flow processes and especially in erosional processes.]
Copper, Zinc, and Hardness Measurements Copper and zinc are common heavy metal constituents of water and are essential for all plant
and animal life. However, research has well established that higher levels of dissolved copper
and zinc can be toxic to aquatic organisms including salmon. Copper sulfate is used in a wide
range of application products in agriculture such as fungicides, pesticides, and herbicides. Zinc
is present in fertilizers and animal feeds and mineral premixes. Copper and zinc are normally
measured as both the total and dissolved fraction.
Hardness is a measure of dissolved minerals in water such as aluminum, calcium, iron, and
magnesium, although it is mostly determined by the sum of calcium and magnesium. The
toxicity of most heavy metals including copper and zinc in freshwater is a function of hardness.

1. Livestock Animal Units
a. Animal units planned for: __________________
b. Current animal units: __________________
Yes No N/A
Yes No
2. Cropland
a. Cropland base called for in the plan:
Grass silage __________ ac, Corn Silage ___________ ac, Pasture _________ac
b. Cropland base at present
Grass silage __________ ac, Corn Silage ___________ ac, Pasture _________ac
Yes No N/A
Yes No
3. New Land.
Yes No N/A
Yes No
Appendix 3. Example of implementation monitoring form. CHECKLIST FOR CONSERVATION DISTRICT CERTIFICATION OF FULLY
IMPLEMENTED DAIRY NUTRIENT MANAGEMENT PLAN
Nutrient Balance
OPERATOR: _____________________________________________________
Plan Date:__________________Operator Certification Date: ____________________Note: If any of the below determinations for this plan is “No”, then the plan will require modification prior to conservation district concurrence with the producer’s certification of
implementation.
Additional animal units do not exceed the capacity of the cropland base to utilize the additional nutrients
The additional AUs do not generate waste during the non-application period in excess of the storage facility design capacity.
The additional AUs do not materially affect the nutrient or storage provisions of the plan.
The ratio of corn to grass land provides nutrient (N) balance for the farm.
New fields substituted for previous, provide equivalent yields for nutrient use and farm balance.
The new land that is replacing previously leased/rented land has a current nutrient management specification.
The new land supports the same crop yields and crop nutrient requirements as previous land.Site conditions on the new land support waste application when called for in the plan (flood hazard, leaching or runoff potential, odor
concerns etc)
DETERMINATION
Recheck
Recheck Date: Initials:
The cropland acreage is within the parameters established for this plan.
DETERMINATIONNew land added to the farm operation through lease, rental, purchase or other arrangement has been incorporated into the nutrient management plan.
Recheck
DETERMINATION
The Livestock Animal Units are within the parameters established for this plan
Date: Initials:
Date: Initials:
Page 1 of 4
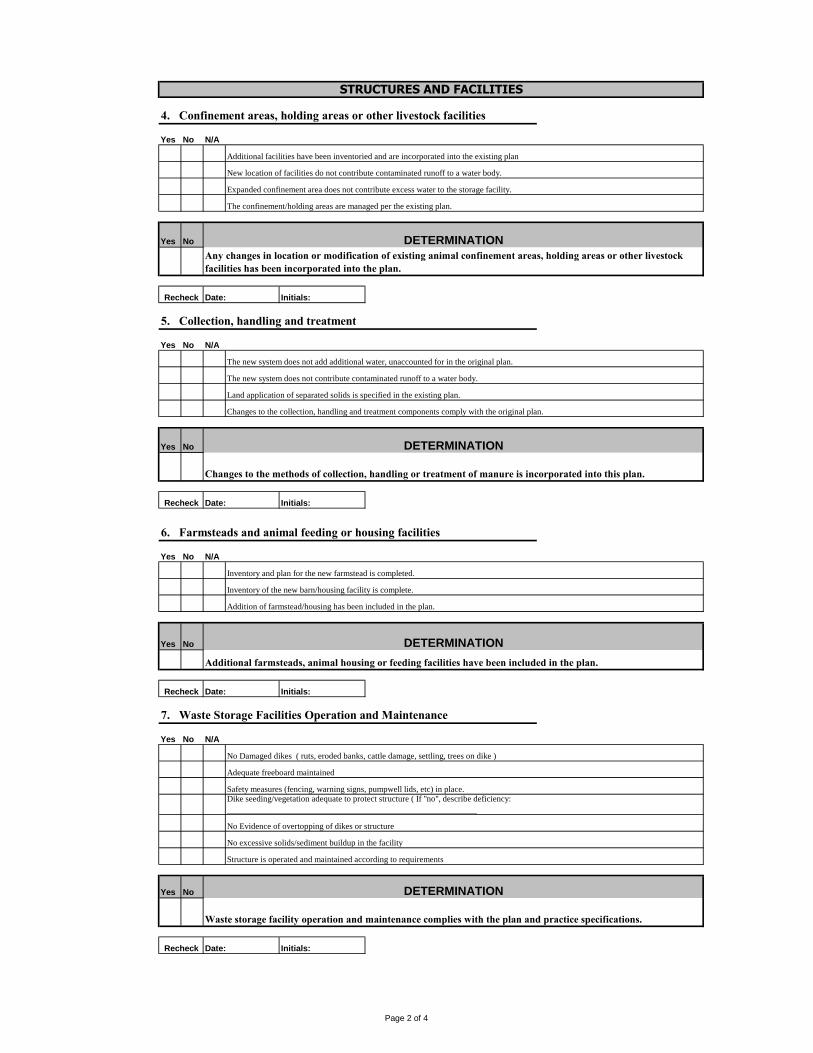
4. Confinement areas, holding areas or other livestock facilities
Yes No N/A
Yes No
Yes No N/A
Yes No
Yes No N/A
Yes No
Yes No N/A
Yes No
Date: Initials:
DETERMINATION
Waste storage facility operation and maintenance complies with the plan and practice specifications.
7. Waste Storage Facilities Operation and Maintenance
No Damaged dikes ( ruts, eroded banks, cattle damage, settling, trees on dike )
Adequate freeboard maintained
Safety measures (fencing, warning signs, pumpwell lids, etc) in place.Dike seeding/vegetation adequate to protect structure ( If "no", describe deficiency:
__________________________________________________________
No Evidence of overtopping of dikes or structure
No excessive solids/sediment buildup in the facility
Structure is operated and maintained according to requirements
Recheck
The confinement/holding areas are managed per the existing plan.
New location of facilities do not contribute contaminated runoff to a water body.
Expanded confinement area does not contribute excess water to the storage facility.
STRUCTURES AND FACILITIES
Additional facilities have been inventoried and are incorporated into the existing plan
Recheck Date: Initials:
5. Collection, handling and treatment
DETERMINATION
Any changes in location or modification of existing animal confinement areas, holding areas or other livestock facilities has been incorporated into the plan.
Recheck Date: Initials:
DETERMINATION
Changes to the methods of collection, handling or treatment of manure is incorporated into this plan.
The new system does not add additional water, unaccounted for in the original plan.
The new system does not contribute contaminated runoff to a water body.
Land application of separated solids is specified in the existing plan.
Changes to the collection, handling and treatment components comply with the original plan.
Recheck Date: Initials:
DETERMINATION
Additional farmsteads, animal housing or feeding facilities have been included in the plan.
6. Farmsteads and animal feeding or housing facilities
Inventory and plan for the new farmstead is completed.
Inventory of the new barn/housing facility is complete.
Addition of farmstead/housing has been included in the plan.
Page 2 of 4

Yes No N/A
Yes No
Yes No N/A
Yes No
Yes No N/A
Yes No
All distribution system components are functional and operated according to the plan. (if "no", specify):
______________________________________________________________________________________________________________
______________________________________________________________________________________________________________
______________________________________________________________________________________________________________
____________________________________________________________________________________
DETERMINATION
The waste collection and handling system functions properly and is operated and maintained according to the plan and practice specifications
Recheck Date: Initials:
All distribution system components are functional and operated according to the plan.
10. Waste Collection and Handling System
Recheck Date: Initials:
DETERMINATION
The waste distribution system functions properly and is operated and maintained according to the plan and practice specifications
Recheck Date: Initials:
The waste storage facilities accommodate any changes to the livestock numbers or livestock facilities without adversely affecting the required waste storage time.
9. Waste Distribution System
System provides for application to land parcels specified in plan (if "no" explain): _____________________
______________________________________________________________________________________________________________
____________________________________________________
Actual Storage time: ____________ months
Increased livestock accounted for with adequate waste storage time and volume
Rainwater diversion practices maintained
Other issues (explain) __________________________________________________________
_________________________________________________________________
The system provides planned for storage time
DETERMINATION
8. Storage Time
Required Storage time: ____________ months
Additional surface water does not enter the facility from roof or confinement areas
Page 3 of 4

Yes No N/A
Yes No
Yes No N/A
Yes No
Yes No N/A
Yes No
Checklist completed by:
______________________________________________ Date: __________________
Technician
13. Discharges or Potential Discharges
Field review of the farmstead and cropland did not disclose any discharges or potential discharges, either newly created or not identified
during initial inventory, that would affect water bodies and would cause this operation to potentially be in violation of state or federal law
Discharges or potential discharges are identified as described: _____________________________
______________________________________________________________________________________________________________
______________________________________________________________________________________________________________
______________________________________________________________________________________________________________
______________
DETERMINATION
Recheck Date: Initials:
All discharges or potential discharges that could transport sediment, organic matter, nutrients or bacteria to surface or ground water are adequately addressed in this plan
Livestock only have access to water bodies where specifically provided by plan
Exclusion from in-stream crossings is maintained
Fencing functional
Livestock water facilities (troughs, nose pumps, etc) are functional
All livestock facilities are functioning per plan
Recheck Date: Initials:
DETERMINATION
Livestock Exclusion practices specified in the plan are installed and performing their intended function.
Tree/shrub practices maintained according to plan and specifications, if "no",
explain:_______________________________________________________________________________________________________
______________________________________________________________________________________________________________
______________________________________________________________________________________________________________
__
Relay Crops/cover crops established according to plan and specifications, if "no",
explain:_______________________________________________________________________________________________________
______________________________________________________________________________________________________________
______________________________________________________________________________________________________________
_______________
Recheck Date: Initials:
DETERMINATION
Vegetative practices specified in the plan are installed and performing their intended function.
12. Livestock Exclusion
LAND TREATMENT/MANAGEMENT PRACTICES
11. Vegetative Practices
Filter strips maintained according to plan and specificaton, if "no", explain:
______________________________________________________________________________________________________________
______________________________________________________________________________________________________________
______________________________________________________________________________________________________________
______________
Page 4 of 4

Recommendations for Regional Stormwater Monitoring
Agricultural Runoff Subgroup Report to the SWG, March 20, 2014 Page 1 of 4
March 20, 2014
_x__ Decision
___ Discussion
___ Information
SUBJECT: Agricultural Stormwater Effectiveness Monitoring
ISSUE:
Effectiveness monitoring is an important component in program and project management. It can
demonstrate and/or quantify the success or failure of actions, allowing for adaptive management
to improve the actions when needed. Effectiveness monitoring has been recognized as
significant need within the Puget Sound Stormwater Monitoring Strategy. Our discussion within
the Agriculture Stormwater group built upon the work done by the Puget Sound Workgroup.
BACKGROUND:
What monitoring and assessment information is needed and why?
Stormwater effectiveness monitoring on agricultural activities is sparse in Washington State, but
has been studied around common best management practices (BMPs) in other parts of the United
States. Questions have been posed as to the transferability of those results to the Puget Sound
Region. Reasons why this monitoring might be region-specific include the difference in BMPs
from state to state. While the Natural Resources Conservation Service has nation-wide
agricultural BMPs, each state can increase conservation benefit for state-specific needs. In
Washington State, we have stricter state water quality standards compared to the national Clean
Water Act requirements, and we have endangered species concerns for salmon and other species
that can be impacted by impaired water quality.
In addition, there is a need for effectiveness monitoring on specific activities that appear to have
not been evaluated in other studies. However, the first step prior to implementing any of the
recommended studies should be a literature review to ascertain the current status of information.
Who was involved in the Subgroup, and how were decisions made?
Involvement: Heather Kibbey (City of Everett), Bobbi Lindemulder (Snohomish Conservation
District), Karen Bishop (Whidbey Island Conservation District, phone), Bob Cusimano (ECY),
Chery Sullivan (Washington Dept. of Agriculture), John Bolender (Mason Conservation
District), George Boggs (Whatcom Conservation District), Rich Doenges (Thurston County),
Monte Marti (Snohomish Conservation District), Rick Haley (Skagit County), Kelly McLain
(Washington Dept. of Agriculture), and Carol Smith (WA Conservation Commission)
participated in one or both of the two meetings when these were developed. In addition, Meghan

Recommendations for Regional Stormwater Monitoring
Agricultural Runoff Subgroup Report to the SWG, March 20, 2014 Page 2 of 4
Adamire (Clallam Conservation District), Adam Lorio (Samish Indian Nation), Dino
Marshalonis (EPA), Jay Gordon (WA Dairy Fed), Joe Holtrop (Clallam Conservation District),
Carolyn Kelly (Skagit Conservation District), Western WA Agriculture, Clare Flanagan (NRCS),
Sherre Copeland (NRCS), Bill Bowe (Snohomish Conservation District), Seth Book (Mason
Conservation District), and Michael See (Skagit County) were provided with opportunities to
participate in email reviews and discussions and a few of these did provide comment.
Decision Making Process: These recommendations were developed using the following
process.
1) We reviewed the following ranking criteria spreadsheet developed by the Puget Sound
Stormwater Work Group:
https://docs.google.com/viewer?a=v&pid=sites&srcid=ZGVmYXVsdGRvbWFpbnxwdWdldHN
vdW5kc3Rvcm13YXRlcndvcmtncm91cHxneDoyZmRkYjdkYTJhMjg0Y2E0
The criteria of interest were:
How many members submitted that particular study idea?
Could others use the information from this study?
What is the geographic impact of the study?
What is the ecological impact of the study?
Is it a resource intense study (not cost effective)?
Does it provide quantifiable improvements?
2) Each member submitted agricultural stormwater effectiveness monitoring ideas to the Chair.
We reviewed those at the July 2013 meeting. Although we didn’t formally quantify how each
topic performed relative to the criteria, we used the criteria to guide our prioritization.
3) Decisions were achieved via consensus of those present at the meetings. The decisions
(recommendations) were sent out for review to all sub-group members. Questions from others
were posed to the group and answered/addressed via email. All of the included
recommendations were agreed-to by the Agriculture Stormwater Workgroup without dissent.
Where are we in the SWG approval process, and when are decisions needed?
Recommendations were presented at the November 2013 meeting with decision at the March
2014 meeting.
How and when are recommendations envisioned to be implemented?
The agriculture stormwater subgroup will develop an implementation and funding plan in a
future set of meetings. We want to develop this plan after we have a full set of agriculture
recommendations to facilitate prioritization. Also, we only want to develop this plan for
approved recommendations.
What are the funding implications? See answer above.

Recommendations for Regional Stormwater Monitoring
Agricultural Runoff Subgroup Report to the SWG, March 20, 2014 Page 3 of 4
ALTERNATIVES CONSIDERED:
Alternative:
1) No adoption of recommendations. No change or improvement. Lack of coordination across
areas.
2) Partial adoption of recommendations.
RECOMMENDATIONS AND REASONING:
We decided upon a two-tiered prioritization. We discovered that most of the ideas fit into a few
categories and those were deemed highest priority and equal to each other in priority. These
were placed in Tier 1. They rank higher because they met all of the following criteria:
More than one member submitted that particular study idea
Others could use the information from this study
These have a broader geographic scope
These have a greater ecological benefit
The remaining ideas are important and could also benefit others, but are more specific and
limited, and therefore a slightly lower in geographic scope and ecological benefits. They are
listed in a second group as Tier 2.
It is recommended that a literature review be conducted on these topics as a first step.
Tier 1 Highest Priority:
What is the effectiveness of the typical suite of agricultural BMPs on reducing pollutants via
stormwater into Puget Sound streams? This includes, for example, ___. Hypothesis form:
Commonly prescribed agricultural BMPs have no effect on preventing agricultural stormwater
pollution from impacting water. Specific needs: There is a high confidence in the practices, but
low confidence in behavior. Need to do this at a larger scale, such as watershed or sub-
watershed. Should monitor over time to study adoption rate and continued implementation over
time. Another set of related questions: what is the best combination of practices per activity
(hobby farm, dairy, etc.)?
What is the effectiveness of drainage and stormwater-specific BMPs in reducing polluted run-off
from agricultural lands? This includes stormwater retention facilities, such as ponds, and roof
runoff and tiling. Hypothesis form: Stormwater and drainage BMPs do not reduce agricultural
pollutants from entering surface water. A related need is a study to show how upland sources
from other land uses (urban, forestry) impact runoff from agricultural lands that are located more
proximate to surface waters.
What is the effectiveness of ecological restoration to improve hydrology and other natural
functions? This would include trees, healthier soils, and compost and viewing the farm as an
ecological unit. Hypothesis form: Ecological restoration does not reduce stormwater impacts to
surface water from agriculture lands. This ties into the effort by Ecological Services in Whatcom

Recommendations for Regional Stormwater Monitoring
Agricultural Runoff Subgroup Report to the SWG, March 20, 2014 Page 4 of 4
looking at CREP sites. Another example is found in the Whidbey Island District, where a project
is assessing increased root masses and water flows. Ebey’s watershed provides an opportunity
to test flow in a similar manner. Consider soil classification in designing these studies.
What are the greatest barriers to landowner participation in agricultural and, where applicable,
stormwater-specific, BMP use? Conduct a survey to determine the social factors to stormwater
improvements. For example, is information protection a major barrier? Some literature might be
available to refine this question (Chesapeake). Focus group work might be useful.
Consider exploring opportunities for additional studies or expansion of these studies to address
impacts to groundwater and/or drinking water.
Tier 2 Medium Priority:
What is the effectiveness of roof runoff structural practices, such as dry wells and hard-lining to
a field ditch to avoid bird fecal contributions? Hypothesis form: Dry wells and hard-lining do
not improve water quality from bird inputs to roof run-off from agricultural structures.
What is the effectiveness of media filters (barley straw, compost, etc.) at reducing nutrients,
sediment, and bacteria? Hypothesis form: Media filters have no effect on reducing stormwater
pollution inputs into Puget Sound waters.
What is the effectiveness of settling tanks to treat runoff from non-manured production areas,
such as feed/commodity areas, then running the effluent through a field/filter strip? This is a
method recently used in Thurston County to deal with washed dairy water. Hypothesis form:
Dairy run-off treated with settling tanks and grass filters show no change in water quality.
Other Supporting Documentation
USGS study of ground/surface water interactions in the Nooksack Basin for fecals and nitrates.
http://pubs.usgs.gov/sir/2005/5255/index.html

February 3, 2014
Page 1 of 4
Stormwater Monitoring of Nutrients and Sediment from Cropland
in Puget Sound
Background
Cropland is a common land use in some Puget Sound Counties, particularly in north Puget Sound
(Figure 1). Cropland activities can result in potential impacts to surface waters. These include
pesticide pollution, excess sediment, and excess nutrient input. Best management practices
(bmps) are used to minimize these impacts, but monitoring is necessary to document the extent
of water quality improvements.
Figure 1. Puget Sound Cropland (WA Dept. Ag. 2012)
Acres of % of PS
County Cropland Cropland
Whatcom 61983 30.88
Skagit 57762 28.78
Snohomish 21896 10.91
Thurston 14535 7.24
King 12576 6.27
Pierce 10837 5.40
Island 6232 3.10
Clallam 4537 2.26
Jefferson 2796 1.39
Mason 1667 0.83
Kitsap 821 0.41
The Puget Sound Stormwater workgroup developed a strategy framework for monitoring
potential stormwater impacts, including those associated with agricultural lands. Detailed
recommendations are needed to complete the strategy. To address this need for agricultural
lands, a sub-group was formed to analyze data and develop the recommendations for potential
impacts from agricultural lands. This Agriculture Stormwater Sub-Group developed
recommendations for pesticide monitoring associated with croplands last year. These were
approved by the Puget Sound Stormwater Workgroup. This year, the sub-group focused on
monitoring recommendations for nutrient and sediment inputs from cropland, and these findings
are discussed below.
Process to Develop Recommendations
The recommendations were developed using the following process:
1. Document existing cropland in Puget Sound and potential impacts to nutrients and
sediment. This informs the level of needed monitoring for these parameters.
2. Identify existing monitoring programs that relate to nutrient and sediment monitoring
from croplands in Puget Sound. Review those programs for relevancy and to define
current status of monitoring these parameters.

February 3, 2014
Page 2 of 4
3. Compare existing monitoring efforts to needed levels to identify data gaps towards a
complete monitoring strategy for cropland sediment and nutrients.
4. Develop recommendations to fill data gaps.
Decisions were achieved via consensus of those present at the meetings. The decisions
(recommendations) were sent out for review to all sub-group members. Questions from others
were posed to the group and answered/addressed via email. All of the included
recommendations were agreed-to by the Agriculture Stormwater Workgroup without dissent.
Current Potential Cropland Impacts and Monitoring Programs
To define the current status and monitoring of cropland nutrients and sediment in Puget Sound,
the Agriculture Stormwater Sub-Group reviewed cropland use and current monitoring efforts for
nutrient and sediment inputs.
Cropland findings
Most cropland acreage is in north Puget Sound (Figure 1 and Appendix 1), which points
out a regional need to focus in that area.
Crop types in north Puget Sound include the same crop types in other areas, thereby
representing cropland throughout Puget Sound.
The timing of parameters of interest is: February through September for manure/nutrients
and springtime for sediment.
Some crop types do not fit the usual profile. These are berries, seed, and trees, which
have less impact as they are not annual crops and have less soil disturbance. Also
potatoes have reduced risk of nutrient input.
Shellfish production was not included in any of our review because we are focused on
terrestrial agriculture. Different participants would be needed for inclusion of shellfish
and should be a future task by a different workgroup composition.
Current Monitoring Activities and Needs
Below is a description of current monitoring activities by county. For a detailed list of specific
programs reviewed, see Appendix 2.
1) Whatcom County. Cropland monitoring has been lacking for both nutrients and sediment, but
new programs are beginning to fill some of these data gaps and new NRCS funding could be
used to further augment monitoring at the farm scale. Fecal coliform appears to be sampled by
two programs, and total suspended solids in a new program (Natural Resource Assessment
Program) that will focus on Bertrand Creek. Additional new monitoring has begun by the
Department of Ecology in Bertrand Creek, which is monitoring nutrients, sediment, and other
parameters.
However, even with the new sampling in Bertrand for the parameters of concern, there could be
a remaining need for sediment monitoring in other areas of the county. There are numerous
ditches on agricultural land that have a potential impact on transporting sediment and nutrients
downstream to beneficial use areas. Also, annual crops and perennial crops that are rotated out
of production and for which no cover crop has been established, can contribute sediment that

February 3, 2014
Page 3 of 4
directly impacts salmon redds. The accumulation of sediment over time diminishes watercourse
drainage capacity. This results in the desire/need to dredge out watercourse, eliminating fish
habitat. Current monitoring does not record the magnitude of this problem. Once results from
the new sampling are available, they should be analyzed and discussed as to whether or not they
are sufficient to represent the remainder of the county. The new edge-of-field sampling could be
used to fill some of the gaps too. Additional monitoring might be needed in the future for both
nutrients and sediment, but that should be decided after the initial results from the new programs
are analyzed.
2) Skagit County. The Skagit County Monitoring Program samples both nutrients and total
suspended solids. Originally, they sampled monthly from 2003-2008. Now they sample
quarterly. While they don’t specifically target crop locations, many of the sites are in actively-
farmed crop areas. It is ambient monitoring every two weeks for fecal, DO, temperature, pH,
conductivity, and turbidity. Given the size of their data set and the time span over many years,
the county believes it has data showing impacts from storm events. This level of monitoring fills
much of the data need in this cropland-heavy county.
3) Whidbey and Camano Islands. The county has a similar program to Skagit that includes both
nutrients and sediment with about 5 years worth of data. However, it probably is not linked to
storm events. It was developed with Critical Area Ordinance issues in mind.
All north Puget Sound counties recognized a need to know where drainage tiles exist. These
convey pollutants to surface waters quickly and need to be addressed.
Monitoring Conclusions
Monitoring potential cropland sediment and nutrient impacts in north Puget Sound is the
top geographic priority and likely well-represents other areas in Puget Sound.
Current levels of monitoring covers much of the need. Notable gaps include specific
linkage to stormwater events, effect of bmp implementation on marine dissolved oxygen
levels, certain cropland areas of interest, impacts from drainage tiles, combining existing
monitoring to NRCS’s new edge-of-field monitoring, and a need to address data sharing
laws that impede the flow of information.
Recommendations to Address Monitoring Needs
1) Current monitoring is generally good in Skagit and Whidbey Island Counties.
Monitoring in Whatcom County is improving with the addition of programs by the
Washington Departments of Agriculture and Ecology who are separately conducting new
monitoring there. Our first recommendation is to coordinate existing sampling of
sediments, nitrogen, and phosphorus with each other and with future sampling. This
includes the edge-of-field monitoring funded by NRCS in Fishtrap and Bertrand Creeks
and the Dept. of Ecology’s and Agriculture’s sampling. This would leverage the work in
existing programs. Sampling should include stormwater events. An action item from
this recommendation would be the development of a joint plan that melds the different
monitoring programs together in a cohesive, efficient way.

February 3, 2014
Page 4 of 4
2) Develop a strategy for data sharing, particularly for the NRCS edge-of-field monitoring.
Currently, some data from this funding source are prohibited from sharing under the
federal Farm Bill. A signed agreement will be needed to assure landowners of data use
limitations, while also allowing landowner data to be used by coordinated monitoring
efforts, including those by the Dept. of Ecology. The ability to combine these data with
state agency programmatic data will allow important linkage between bmp
implementation and pollution levels. This will allow for adaptive management and
demonstration of success or failure.
3) Increased nutrients can reduce dissolved oxygen levels by triggering algae blooms that
upon decomposition, lower oxygen levels. One source of nutrients is agricultural lands.
As BMPs are installed to decrease these loads, monitoring should be done to show the
effectiveness in nearby marine areas. Data are lacking for this topic, which is becoming
elevated in importance. The Puget Sound dissolved oxygen model nutrient load
summary is supporting documentation for this need, and can be found here:
https://fortress.wa.gov/ecy/publications/publications/1103057.pdf
4) Sub-surface drainage structures, such as tiles, are known to quickly convey pollutants and
flow to surface waters. However, their locations are mostly unknown. These need to be
inventoried in many areas of Puget Sound, including Whatcom, Island, Snohomish,
Jefferson (Chimacum Creek Valley) and Skagit Counties. Once inventoried, areas
should be prioritized to address problem areas. This work may also need a data sharing
agreement as mentioned in Recommendation 2.
5) A few areas have significant cropland with unique circumstances and are lacking in
monitoring of nutrients and sediment from croplands. This is needed in the Marshland,
French Creek, and Warm Beach areas of Snohomish County and Ebey’s watershed on
Whidbey Island. Monitoring should be bracketed to separate non-ag sources from ag
sources. The Ebey Watershed has potential inputs from other land uses upland that make
it a unique monitoring scenario.
Sub-Group Involvement: Heather Kibbey (City of Everett), Bobbi Lindemulder (Snohomish
Conservation District), Karen Bishop (Whidbey Island Conservation District, phone), Bob
Cusimano (ECY), Chery Sullivan (Washington Dept. of Agriculture), John Bolender (Mason
Conservation District), George Boggs (Whatcom Conservation District), Rich Doenges
(Thurston County), Monte Marti (Snohomish Conservation District), Rick Haley (Skagit
County), Kelly McLain (Washington Dept. of Agriculture), and Carol Smith (WA Conservation
Commission) participated in one or both of the two meetings when these were developed. In
addition, Meghan Adamire (Clallam Conservation District), Adam Lorio (Samish Indian
Nation), Dino Marshalonis (EPA), Jay Gordon (WA Dairy Fed), Joe Holtrop (Clallam
Conservation District), Carolyn Kelly (Skagit Conservation District), Western WA Agriculture,
Clare Flanagan (NRCS), Sherre Copeland (NRCS), Bill Bowe (Snohomish Conservation
District), Seth Book (Mason Conservation District), and Michael See (Skagit County) were
provided with opportunities to participate in email reviews and discussions and a few of these
provided comment.

February 3, 2014
Page 1 of 1
Appendix 2
Monitoring Programs Reviewed
The Natural Resources Assessment Section (NRAS) implemented by the Washington
Dept. of Agriculture. This program added two new sites in 2013 along Bertrand Creek in
Whatcom County in addition to the seven sites already sampled in Skagit and King
Counties. They will collect weekly samples from mid-March through the 3rd
week of
September and analyzes samples for over 170 pesticides, copper, DO, pH, temperature,
total suspended solids, and turbidity. They will not be measuring nutrients and
phosphate. They plan to report to berry growers regularly during the season with about a
month of lag time after each collection. This will allow for adaptive management. The
focus of this program is on ESA-listed salmonids.
NW Indian College in Whatcom County. The sites included in this program are not
specifically located around croplands. This routine monitoring program provides data for
"nodes" at the lower end of major drainages in areas where fecal coliform is a concern.
They are beginning to implement targeted monitoring in priority drainages by segmenting
tributaries. This might give a better tie to adjacent land uses. They are not planning to
sample directly from a particular parcel.
Department of Ecology water quality sampling led by Steve Hood samples the full suite
of parameters, but does so at a large scale, and it is difficult to tie to croplands.
The Whatcom Clean Water Program will be sampling fecal coliform. They are currently
working on the QAPP. This program is led by Andrea Hood (Department of Health).
Will get more details when the QAPP is final.
The Department of Ecology Environmental Assessment Program is monitoring Bertrand
Creek in Whatcom County for nutrients, sediment, and other paramenters.