combining lidar and stormwater infrastructure to...
TRANSCRIPT

Combining LiDAR and stormwater infrastructure to delineate sub-neighborhood scale watersheds
Eric E. Castle, Assistant Professor, University of Minnesota Crookston
MECA Annual Conference, Nisswa, MN 3/8/2012


Sttttttttt Pttttttt tttttt

Sediment Nutrients (nitrogen, phosphorous) Pathogens Pesticides Heavy metals Petroleum products Organic solvents Thermal
Image source: http://extension.oregonstate.edu/streaming/transcripts/after_the_rain/sect3.php
Sttttttttt Pttttttt ttttttttt

As of 2002:
40% of U.S. streams, rivers, lakes and estuaries are not clean
enough for basic use.
Urban areas are responsible for 40% of non-point source pollution (leaving 60% due to
agricultural areas)
http://www.epa.gov/iwi
40/40 Rule
Sttttttttt Pttttttt tttttt t ttttttttt

Shallow planted depression that retains and infiltrates stormwater
Improve water quality Reduce flooding Provide habitat for wildlife and increase biodiversity Visually and psychologically attractive Are good for play!
Rttttttttttt ttttttttttttt
ttttttttttttt…

Btttttttttt MNt Bttt Etttttttttt
Dietz and Clausen (2006) paired watershed study: • only 0.8% overflowed • mixed results for N and P


Gtttt Rtttt tttttt ttttttt

Gtttt Rtttt Htttt MN

Ptttttttt Ptttttttt tttttttttttt

Sttttttttt ttt UMC
Insert image of UMC campus
Clean water for future generations Dr. Svedarsky: “How can we do more…with less?” As budgets get tighter, how can communities
inventory stormwater infrastructure and assess community contributions to stormwater?
Progression of offline systems from a demonstration
and novelty, to one of targeted and prioritized approach

UMC Sttttttttt Mttttt Ptttt ttttttttttt
1. Collect/create campus base map data
2. Delineate campus watersheds
3. Identify natural resources found on campus
4. Establish baseline water quality & quantity data
5. Identify, evaluate and prioritize areas that could impact campus stormwater.

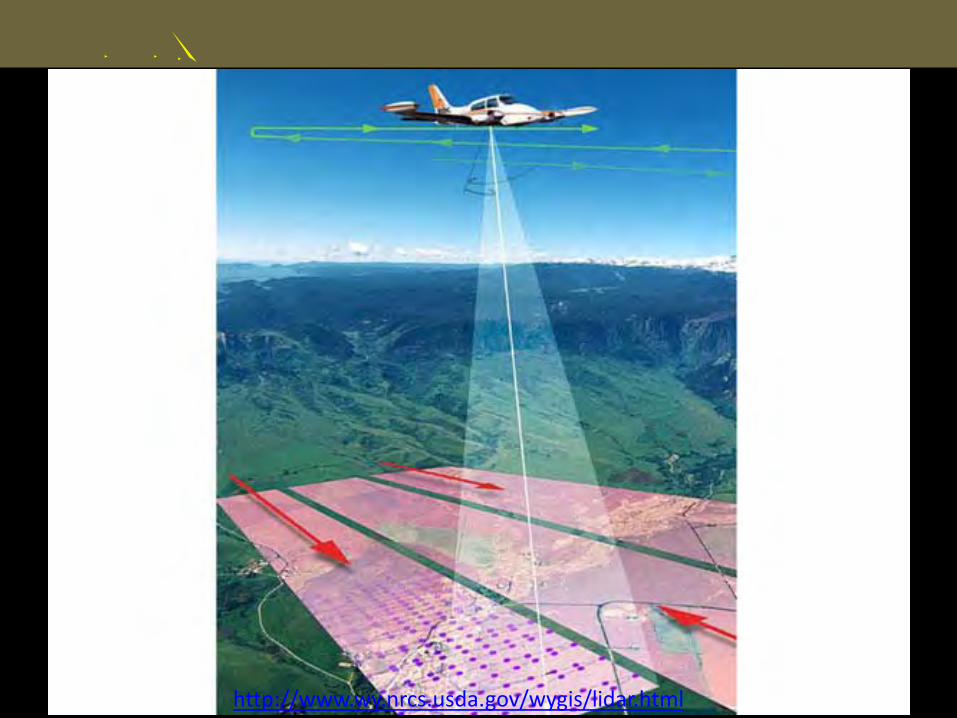
LtDARt tttt tttttttttt tttttttttt
Light Detection And Ranging
http://www.wy.nrcs.usda.gov/wygis/lidar.html

UMC Stttttttttt tttttt tttttttttt

tttttttt tt tttttttttt

Stttttttt ttttttttt 4t41 ttttt

Stttttttt ttttt 20t67 ttttt

Stttttttt ttttttt 11t07 ttttt

Stttttttt ttttttttt 14t04 ttttt
Dtttttttt tttttttt

Dtttttttt tttttttt

Dtttttttt tttttttt

Dtttttttt tttttttt 3t23 ttttt

Dtttttttt tttttttt 10t81 ttttt

Ttttt Ittttttttt Sttttttt 50t19 ttttt t25tt

Sttttt ttttttttt
67B Bearden silt loam 2-6% slope
935 Hegne-Fargo complex
1280 Gunclub silty clay loam
1304A Glyndon very fine sandy loam 0-2% slopes

Sttttt tttttttt
Field test 6”* per hour infiltration, Hegne-
Fargo Complex 0.06 to 0.20 in/hr
LtDARt tttt tttttttttt tttttttttt
Light Detection And Ranging
http://www.wy.nrcs.usda.gov/wygis/lidar.html

LtDARt tttt tttttttttt tttttttttt

LtDARt tttt tttttttttt tttttttttt

LtDARt tttt tttttttttt tttttttttt

LtDARt tttt tttttttttt tttttttttt

Wtttttttttt ttttttttt ttttt Att Htttt

Wtttttttttt ttttttttt

Dtttttttttt ttttttttt

Stttt Dtttt Itttttt ttttttttt

Wtttttttttt ttttttttt

Wtttttttttt tttttttt

Wtttttttttt tttttttt

Wtttttttttt tttttttttttttt

Vtttttttttt ttttttttt

Vtttttttttt ttttttttt

Vtttttttttt tttttttt


Rtttttttttttttt
1. Field verify the catchments
2. Field verify LiDAR vegetation returns
3. More detailed soil surveys of potential BMP sites
4. Use technology to leverage knowledge