agstar - valley 25x'25
TRANSCRIPT
Introduction
any livestock facilities in the United States handle manure as liquids Mand slurries. Stored manure liquids and slurries decompose anaerobically (i.e., in the absence of oxygen) producing large volumes of gas. This gas is often referred to as biogas. Biogas contains between 60 and 80 percent methane (about 600-800 BTU/ft3) and is considered a renewable energy resource.
Substantial opportunities exist across the country to recover and use biogas energy by adapting manure management practices to include biogas generation and collection. This handbook focuses on identifying and evaluating opportunities for recovering and utilizing this energy through the implementation of biogas technology.
This handbook is for livestock producers, developers, investors, and others in the agricultural and energy industry that may consider biogas technology as a livestock manure management option. The handbook provides a step-by-step method to determine whether a particular biogas recovery system is appropriate for a livestock facility. This handbook complements the guidance and other materials provided by the AgSTAR program to the development of biogas technologies at commercial farms in the United States.
The AgSTAR Program The AgSTAR Program is a voluntary effort jointly sponsored by the U.S. Environmental Protection Agency, the U.S. Department of Agriculture, and the U.S. Department of Energy. The program encourages the use of biogas capture and utilization at animal feeding operations that manage manures as liquids and slurries. A biogas system reduces emissions of methane, a greenhouse gas, while achieving other environmental benefits. In addition, converting livestock wastes into an energy source may increase net farm income.
AgSTAR currently provides the following reports and tools to assist livestock producers and other interested parties in making informed business decisions about the financial and environmental performance of these technologies:
General Information
The AgSTAR Program - Managing Manure with Biogas Recovery Systems
AgSTAR Digest: an annual newsletter
SECOND EDITION Introduction - i
Introduction
Project Development Tools
AgSTAR Handbook: A Manual for Developing Biogas Systems at Commercial Farms in the United States
FarmWare: A pre-feasibility software package that accompanies the AgSTAR Handbook
Industry Directory for On-farm Biogas Recovery Systems: a listing of digester designers and equipment suppliers
Funding On-farm Biogas Recovery Systems: A Guide to National and State Funding Resources
Market Opportunities for Biogas Recovery Systems: A Guide to Identifying Candidates for On-farm and Centralized Systems
Environmental Performance
Dairy Cattle Manure Management: A Case Study of a Plug Flow Anaerobic Digestion System
Swine Manure Management: A Case Study of a Covered Lagoon Anaerobic Digestion System (under development)
Swine Manure: A Case Study of a Complete Mix Digester System (under development)
All these products are free of charge and can be downloaded at www.epa.gov/agstar or ordered through the AgSTAR Hotline 1-800-95AgSTAR (1-800-952-4782).
Introduction - ii SECOND EDITION
Introduction
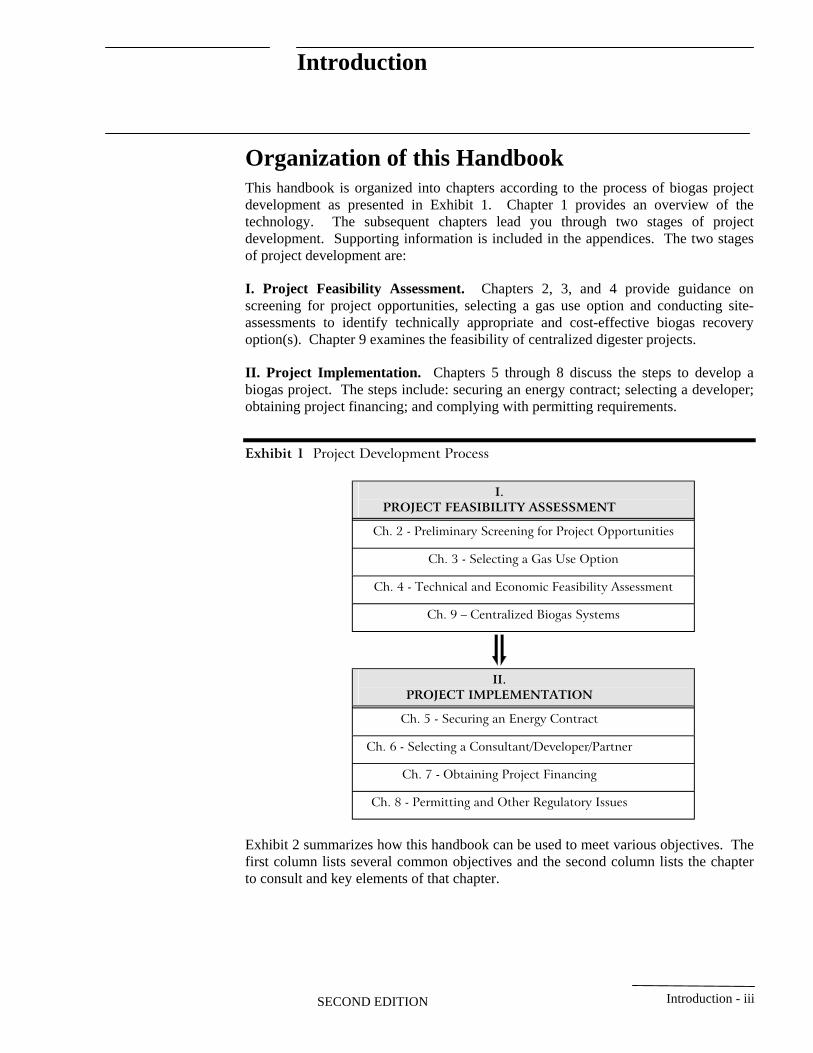
Organization of this Handbook This handbook is organized into chapters according to the process of biogas project development as presented in Exhibit 1. Chapter 1 provides an overview of the technology. The subsequent chapters lead you through two stages of project development. Supporting information is included in the appendices. The two stages of project development are:
I. Project Feasibility Assessment. Chapters 2, 3, and 4 provide guidance on screening for project opportunities, selecting a gas use option and conducting site-assessments to identify technically appropriate and cost-effective biogas recovery option(s). Chapter 9 examines the feasibility of centralized digester projects.
II. Project Implementation. Chapters 5 through 8 discuss the steps to develop a biogas project. The steps include: securing an energy contract; selecting a developer; obtaining project financing; and complying with permitting requirements.
Exhibit 1 Project Development Process
I. PROJECT FEASIBILITY ASSESSMENT
Ch. 4 - Technical and Economic Feasibility Assessment
Ch. 9 – Centralized Biogas Systems
II.
Ch. 5 - Securing an Energy Contract
Ch. 6 - Selecting a Consultant/Developer/Partner
Ch. 8 - Permitting and Other Regulatory Issues
Ch. 2 - Preliminary Screening for Project Opportunities
Ch. 3 - Selecting a Gas Use Option
PROJECT IMPLEMENTATION
Ch. 7 - Obtaining Project Financing
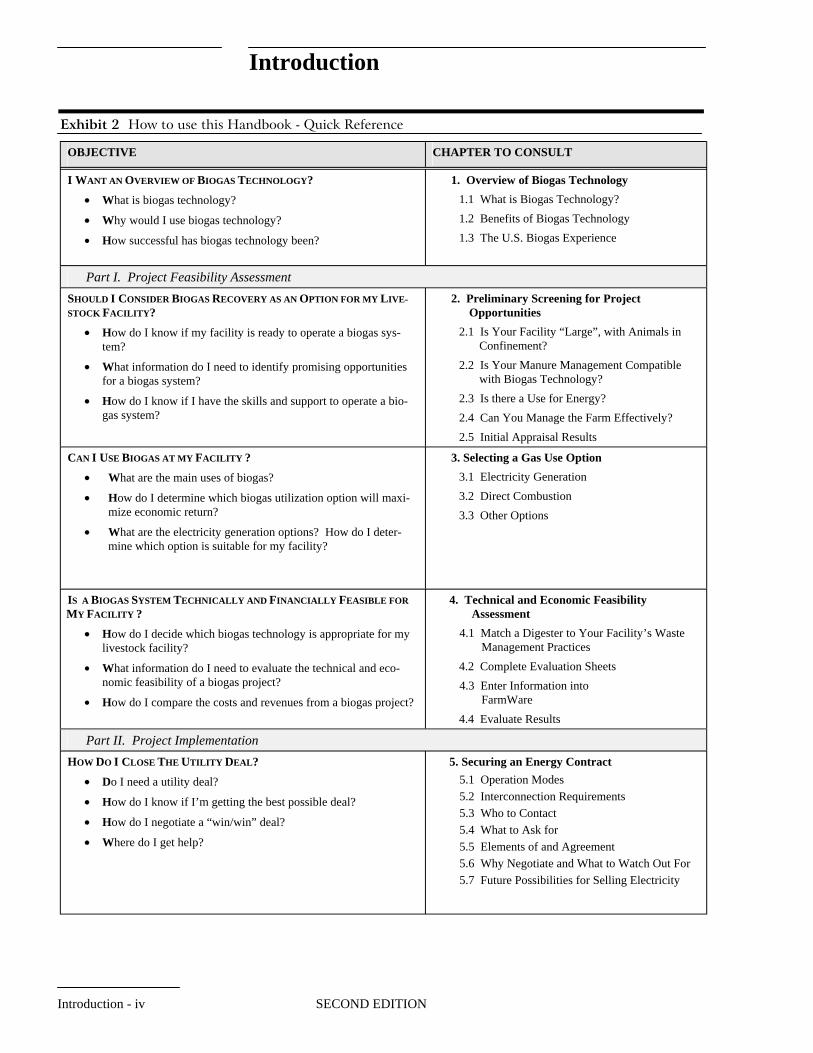
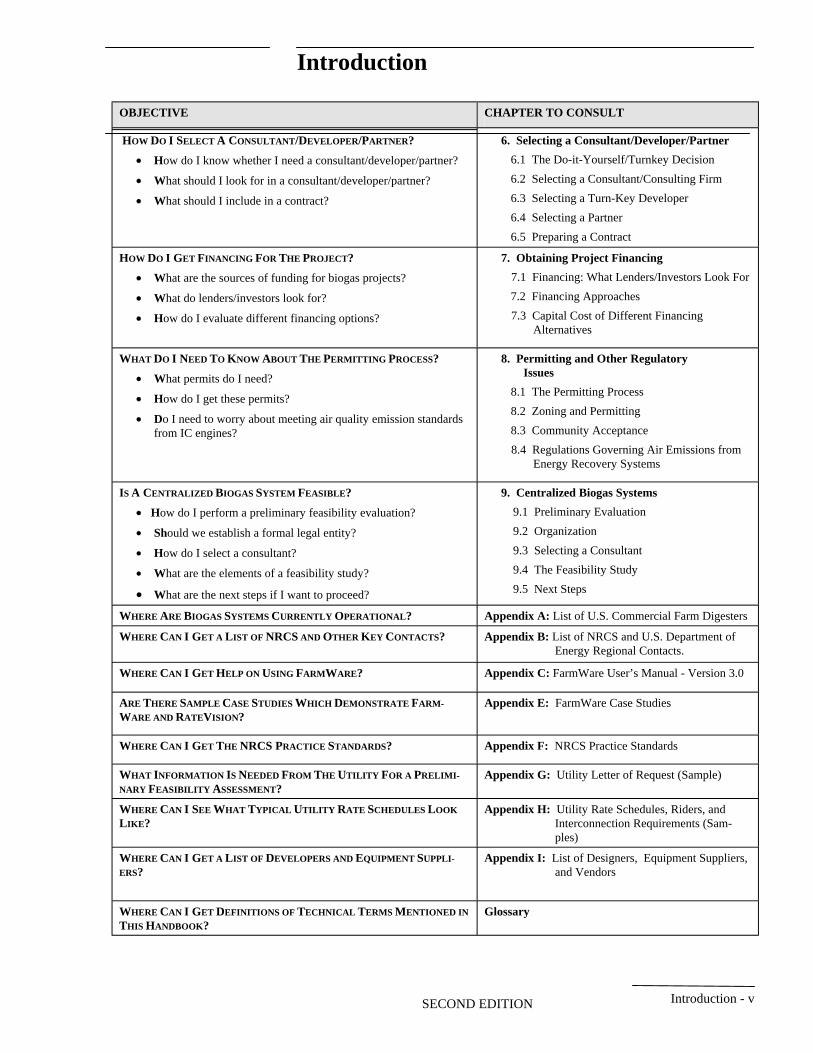
Exhibit 2 summarizes how this handbook can be used to meet various objectives. The first column lists several common objectives and the second column lists the chapter to consult and key elements of that chapter.
SECOND EDITION Introduction - iii
Introduction
Exhibit 2 How to use this Handbook - Quick Reference
OBJECTIVE CHAPTER TO CONSULT
I WANT AN O BIOGAS TECHNOLOGY?
• W
• W
• H
1.
1.1
1.2 Benefits of Biogas Technology
1.3 The U.S. Biogas Experience
Proj
SHOULD I C BIOGAS RECOVERY AS AN O LSTOCK FACILITY?
• H
• W
• How do I know if I have the skills and support to operate a bio
2.
2.1
2.2 Is Your Manure Management Compatible
2.3
2.4
2.5 Initial Appraisal Results
CAN I USE BIOGAS AT MY FACILITY ?
• What are the main uses of biogas?
• Hmize economic return?
• W How do I deter
3. Selecting a Gas Use Option
3.1
3.2 Direct Combustion
3.3 Other Options
IS A BIOGAS SYSTEM T F FEASIBLE FOR
MY FACILITY ?
• H
• W
• How do I compare the costs and revenues from a biogas project?
4. Technical and Economic Feasibility
4.1 Management Practices
4.2 Complete Evaluation Sheets
4.3 FarmWare
4.4 Evaluate Results
Part II. Project Implementation
HOW DO I CLOSE THE UTILITY DEAL?
• D
• H
• H
• Where do I get help?
5.1 Operation Modes
5.2 Interconnection Requirements
5.3 Who to Contact
5.4 What to Ask for
5.5
5.6
5.7 Future Possibilities for Selling Electricity
VERVIEW OF
hat is biogas technology?
hy would I use biogas technology?
ow successful has biogas technology been?
Overview of Biogas Technology
What is Biogas Technology?
Part I. ect Feasibility Assessment
ONSIDER PTION FOR MY IVE
ow do I know if my facility is ready to operate a biogas system?
hat information do I need to identify promising opportunities for a biogas system?
gas system?
Preliminary Screening for Project Opportunities
Is Your Facility “Large”, with Animals in Confinement?
with Biogas Technology?
Is there a Use for Energy?
Can You Manage the Farm Effectively?
ow do I determine which biogas utilization option will maxi
hat are the electricity generation options?mine which option is suitable for my facility?
Electricity Generation
ECHNICALLY AND INANCIALLY
ow do I decide which biogas technology is appropriate for my livestock facility?
hat information do I need to evaluate the technical and economic feasibility of a biogas project?
Assessment
Match a Digester to Your Facility’s Waste
Enter Information into
o I need a utility deal?
ow do I know if I’m getting the best possible deal?
ow do I negotiate a “win/win” deal?
5. Securing an Energy Contract
Elements of and Agreement
Why Negotiate and What to Watch Out For
Introduction - iv SECOND EDITION
Introduction
OBJECTIVE CHAPTER TO CONSULT
HOW DO I SELECT A CONSULTANT/DEVELOPER/PARTNER?
• How do I know whether I need a consultant/developer/partner?
• What should I look for in a consultant/developer/partner?
• What should I include in a contract?
6.
6.1
6.2 Selecting a Consultant/Consulting Firm
6.3
6.4 Selecting a Partner
6.5 Preparing a Contract
HOW DO I GET F FOR THE P ?
• What are the sources of funding for biogas projects?
• What do lenders/investors look for?
• How do I evaluate different financing options?
7. Obtaining Project Financing
7.1
7.2 Financing Approaches
7.3 Capital Cost of Different Financing Alternatives
WHAT DO I NEED TO KNOW ABOUT THE PERMITTING PROCESS?
• What permits do I need?
• How do I get these permits?
• Dfrom IC engines?
8.
8.1
8.2
8.3
8.4
IS A C BIOGAS SYSTEM FEASIBLE?
• H
• Sh
• How do I select a consultant?
• W
• W
9.
9.1
9.2 Organization
9.3 Selecting a Consultant
9.4
9.5 Next Steps
WHERE ARE BIOGAS SYSTEMS CURRENTLY O ?
WHERE CAN I GET A LIST OF NRCS AND OTHER KEY CONTACTS? List of NRCS and U.S. Department of
WHERE CAN I GET HELP ON USING FARMWARE?
ARE THERE SAMPLE CASE S WHICH DEMONSTRATE FARM
WARE AND RATEVISION? FarmWare Case Studies
WHERE CAN I GET THE NRCS P STANDARDS?
WHAT INFORMATION IS NEEDED FROM THE UTILITY FOR A PRELIMI
NARY FEASIBILITY ASSESSMENT?
WHERE CAN I SEE WHAT T UTILITY RATE SCHEDULES LOOK
LIKE? Interconnection Requirements (Samples)
WHERE CAN I GET A LIST OF DEVELOPERS AND EQUIPMENT SERS?
List of Designers, Equipment Suppliers, and Vendors
WHERE CAN I GET D T TERMS MENTIONED IN
THIS HANDBOOK? Glossary
Selecting a Consultant/Developer/Partner
The Do-it-Yourself/Turnkey Decision
Selecting a Turn-Key Developer
INANCING ROJECT
Financing: What Lenders/Investors Look For
o I need to worry about meeting air quality emission standards
Permitting and Other Regulatory Issues
The Permitting Process
Zoning and Permitting
Community Acceptance
Regulations Governing Air Emissions from Energy Recovery Systems
ENTRALIZED
ow do I perform a preliminary feasibility evaluation?
ould we establish a formal legal entity?
hat are the elements of a feasibility study?
hat are the next steps if I want to proceed?
Centralized Biogas Systems
Preliminary Evaluation
The Feasibility Study
PERATIONAL Appendix A: List of U.S. Commercial Farm Digesters
Appendix B: Energy Regional Contacts.
Appendix C: FarmWare User’s Manual - Version 3.0
TUDIES Appendix E:
RACTICE Appendix F: NRCS Practice Standards
Appendix G: Utility Letter of Request (Sample)
YPICAL Appendix H: Utility Rate Schedules, Riders, and
UPPLI Appendix I:
EFINITIONS OF ECHNICAL
SECOND EDITION Introduction - v
Chapter 1 Overview of Biogas Technology
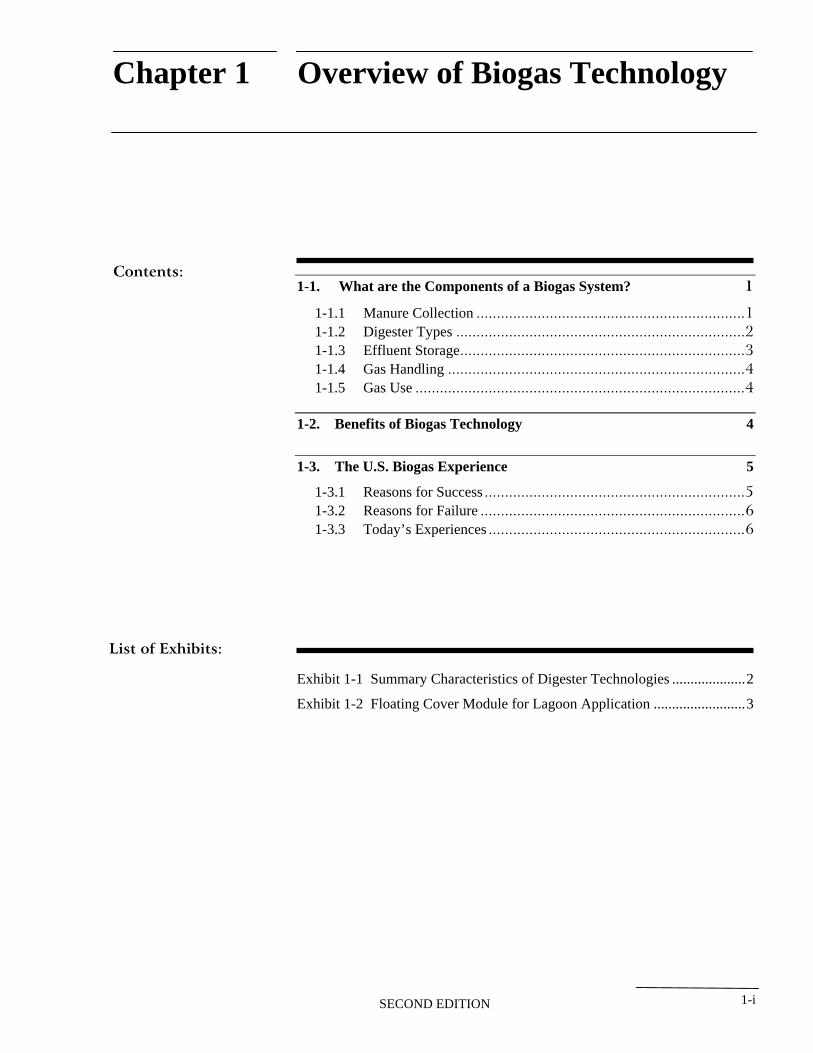
Contents: 1-1. What are the Components of a Biogas System?
1-1.1 Manure Collection ..................................................................11-1.2 Digester Types .......................................................................21-1.3 Effluent Storage......................................................................31-1.4 Gas Handling .........................................................................41-1.5 Gas Use .................................................................................4
1-2. Benefits of Biogas Technology
1-3. The U.S. Biogas Experience
1-3.1 Reasons for Success ................................................................51-3.2 Reasons for Failure .................................................................61-3.3 Today’s Experiences ...............................................................6
List of Exhibits:
Exhibit 1-1 Summary Characteristics of Digester Technologies ....................2
Exhibit 1-2 Floating Cover Module for Lagoon Application .........................3
SECOND EDITION 1-i
1
4
5
Chapter 1 Overview of Biogas Technology
The U.S. biogas experience in the 1970s and 1980s has demonstrated that biogas technology
is not applicable for all farms. In many situations however, it can be a cost-effective and environmentally friendly method for treating manure and liquid waste. Biogas production is best suited for farms that handle large amounts of manure as a liquid, slurry, or semi-solid with little or no bedding added. Biogas systems require a financial investment and a management responsibility. The system must be designed by an experienced animal waste digester designer, who is well versed with the common problems associated with these types of systems. Additionally, the farm owner or operator must be committed to the digester’s success.
This chapter provides an overview of biogas technology and opportunities to use this technology in livestock facilities across the United States. First, a brief description of biogas technology is provided. Then the benefits of biogas technology are discussed. Finally, the experience and status of biogas technology development in the United States are described.
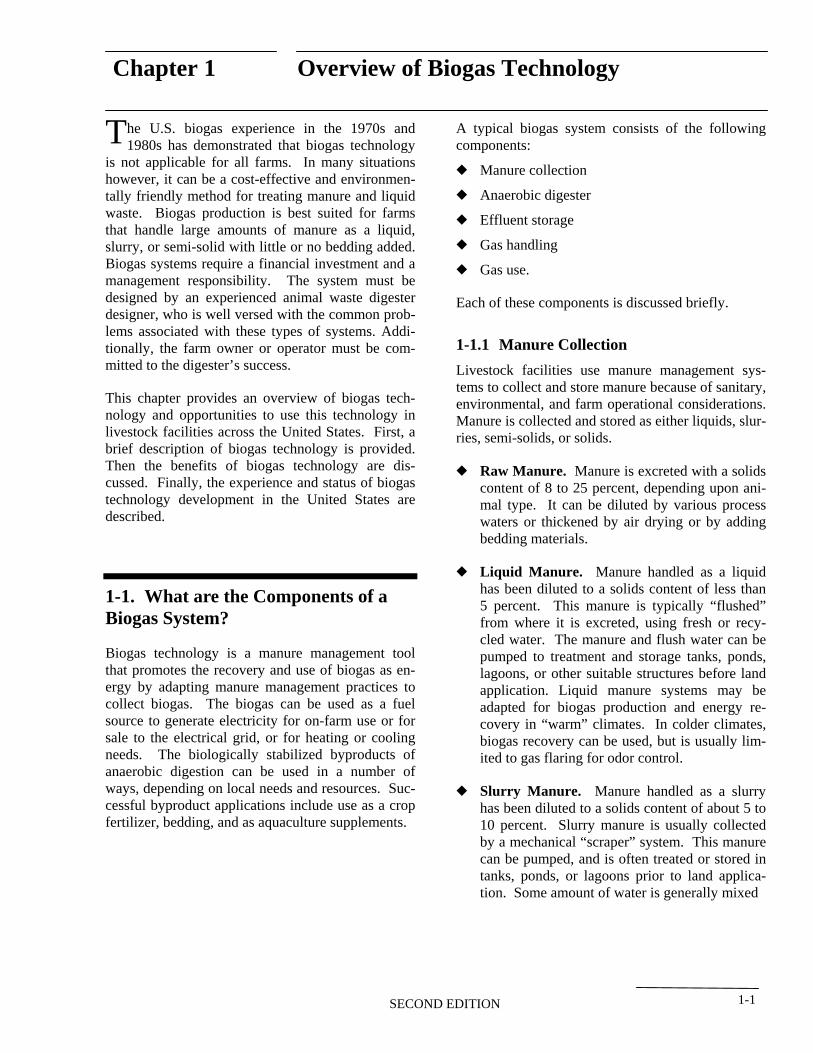
1-1. What are the Components of a Biogas System?
Biogas technology is a manure management tool that promotes the recovery and use of biogas as energy by adapting manure management practices to collect biogas. The biogas can be used as a fuel source to generate electricity for on-farm use or for sale to the electrical grid, or for heating or cooling needs. The biologically stabilized byproducts of anaerobic digestion can be used in a number of ways, depending on local needs and resources. Successful byproduct applications include use as a crop fertilizer, bedding, and as aquaculture supplements.
A typical biogas system consists of the following components:
— Manure collection
— Anaerobic digester
— Effluent storage
— Gas handling
— Gas use.
Each of these components is discussed briefly.
1-1.1 Manure Collection
Livestock facilities use manure management systems to collect and store manure because of sanitary, environmental, and farm operational considerations. Manure is collected and stored as either liquids, slurries, semi-solids, or solids.
— Raw Manure. Manure is excreted with a solids content of 8 to 25 percent, depending upon animal type. It can be diluted by various process waters or thickened by air drying or by adding bedding materials.
— Liquid Manure. Manure handled as a liquid has been diluted to a solids content of less than 5 percent. This manure is typically “flushed” from where it is excreted, using fresh or recycled water. The manure and flush water can be pumped to treatment and storage tanks, ponds, lagoons, or other suitable structures before land application. Liquid manure systems may be adapted for biogas production and energy recovery in “warm” climates. In colder climates, biogas recovery can be used, but is usually limited to gas flaring for odor control.
— Slurry Manure. Manure handled as a slurry has been diluted to a solids content of about 5 to 10 percent. Slurry manure is usually collected by a mechanical “scraper” system. This manure can be pumped, and is often treated or stored in tanks, ponds, or lagoons prior to land application. Some amount of water is generally mixed
SECOND EDITION 1-1
Chapter 1 Overview of Biogas Technology
with the manure to create a slurry. For example, spilled drinking water mixes with pig manure to create a slurry. Manure managed in this manner may be used for biogas recovery and energy production, depending on climate and dilution factors.
— Semi-Solid Manure. Manure handled as a semi-solid has a solids content of 10 to 20 percent. This manure is typically scraped. Water is not added to the manure, and the manure is typically stored until it is spread on local fields. Fresh scraped manure (less than one week old) can be used for biogas and energy production in all climates, because it can be heated to promote bacterial growth.
— Solid Manure. Manure with a solids content of greater than 20 percent is handled as a solid by a scoop loader. Aged solid manure or manure that is left “unmanaged” (i.e., is left in the pasture where it is deposited by the animals) or allowed to dry is not suitable for biogas recovery.
1-1.2 Digester Types
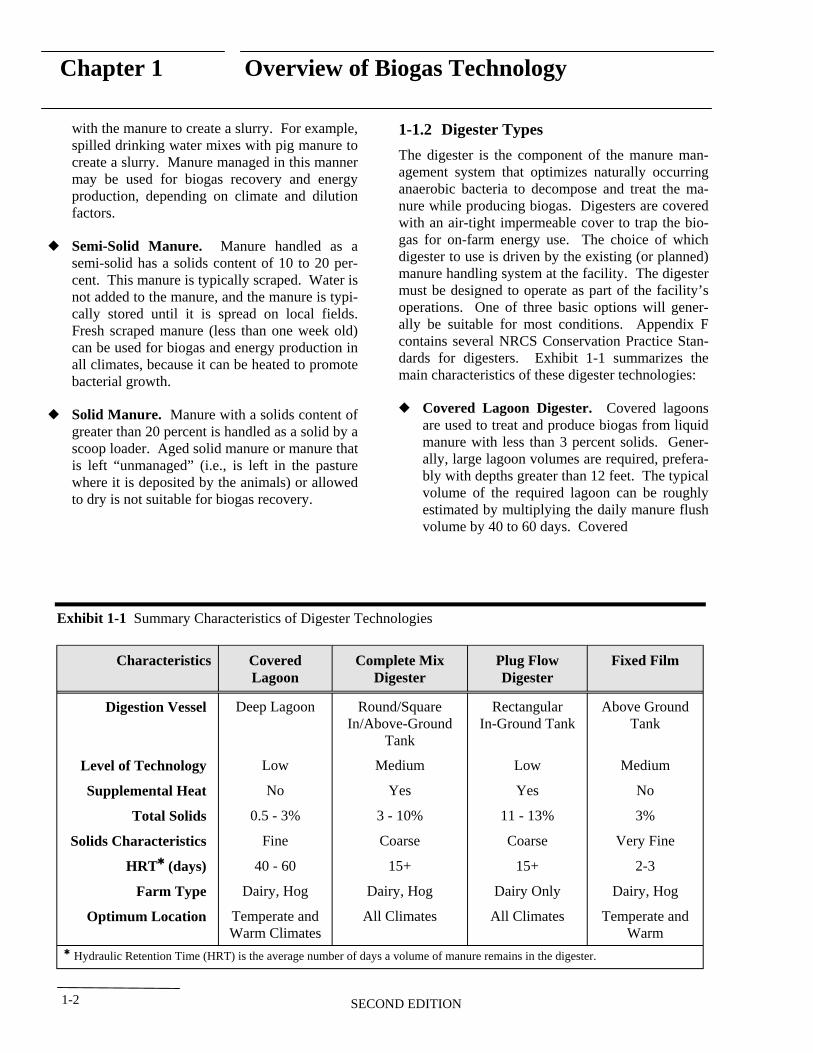
The digester is the component of the manure management system that optimizes naturally occurring anaerobic bacteria to decompose and treat the manure while producing biogas. Digesters are covered with an air-tight impermeable cover to trap the biogas for on-farm energy use. The choice of which digester to use is driven by the existing (or planned) manure handling system at the facility. The digester must be designed to operate as part of the facility’s operations. One of three basic options will generally be suitable for most conditions. Appendix F contains several NRCS Conservation Practice Standards for digesters. Exhibit 1-1 summarizes the main characteristics of these digester technologies:
— Covered Lagoon Digester. Covered lagoons are used to treat and produce biogas from liquid manure with less than 3 percent solids. Generally, large lagoon volumes are required, preferably with depths greater than 12 feet. The typical volume of the required lagoon can be roughly estimated by multiplying the daily manure flush volume by 40 to 60 days. Covered
Exhibit 1-1 Summary Characteristics of Digester Technologies
Characteristics Covered Complete Mix Plug Flow Fixed Film Lagoon Digester Digester
Digestion Vessel Deep Lagoon Round/Square Rectangular Above Ground In/Above-Ground In-Ground Tank Tank
Tank
Level of Technology Low Medium Low Medium
Supplemental Heat No Yes Yes No
Total Solids 0.5 - 3% 3 - 10% 11 - 13% 3%
Solids Characteristics Fine Coarse Coarse Very Fine
HRTr (days) 40 - 60 15+ 15+ 2-3
Farm Type Dairy, Hog Dairy, Hog Dairy Only Dairy, Hog
Optimum Location Temperate and All Climates All Climates Temperate and Warm Climates Warm
r Hydraulic Retention Time (HRT) is the average number of days a volume of manure remains in the digester.
SECOND EDITION 1-2
Chapter 1 Overview of Biogas Technology
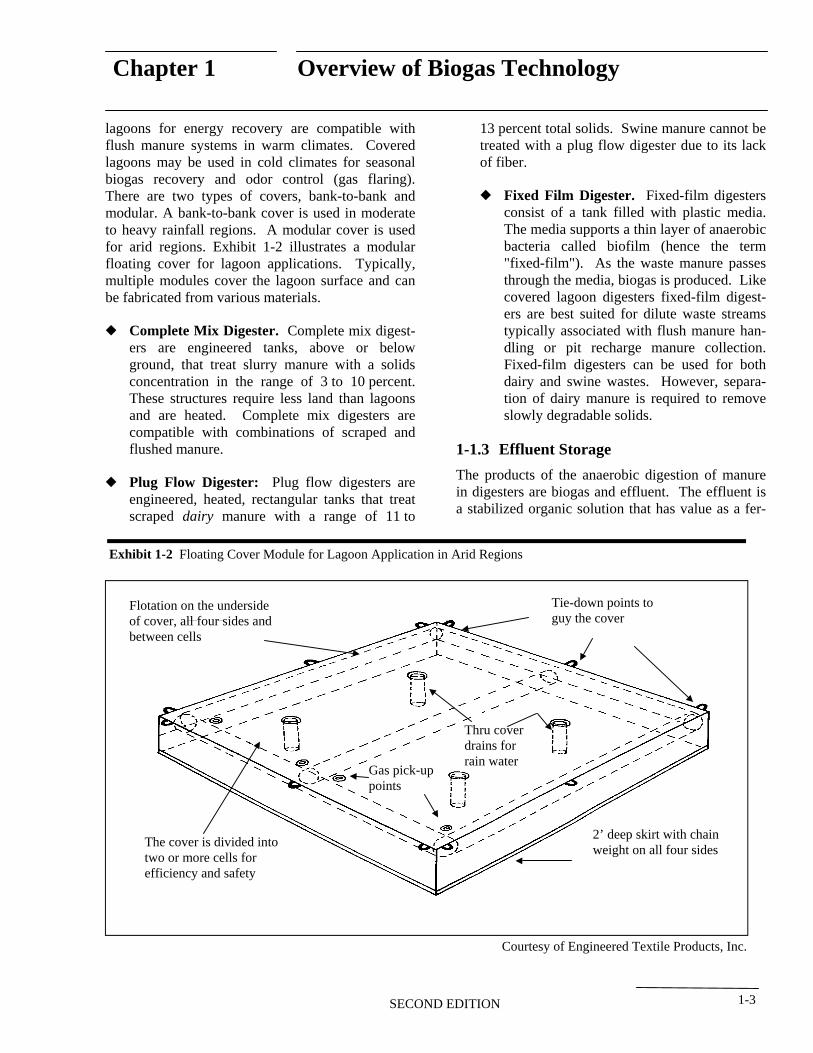
lagoons for energy recovery are compatible with flush manure systems in warm climates. Covered lagoons may be used in cold climates for seasonal biogas recovery and odor control (gas flaring). There are two types of covers, bank-to-bank and modular. A bank-to-bank cover is used in moderate to heavy rainfall regions. A modular cover is used for arid regions. Exhibit 1-2 illustrates a modular floating cover for lagoon applications. Typically, multiple modules cover the lagoon surface and can be fabricated from various materials.
— Complete Mix Digester. Complete mix digesters are engineered tanks, above or below ground, that treat slurry manure with a solids concentration in the range of 3 to 10 percent. These structures require less land than lagoons and are heated. Complete mix digesters are compatible with combinations of scraped and flushed manure.
— Plug Flow Digester: Plug flow digesters are engineered, heated, rectangular tanks that treat scraped dairy manure with a range of 11 to
13 percent total solids. Swine manure cannot be treated with a plug flow digester due to its lack of fiber.
— Fixed Film Digester. Fixed-film digesters consist of a tank filled with plastic media. The media supports a thin layer of anaerobic bacteria called biofilm (hence the term "fixed-film"). As the waste manure passes through the media, biogas is produced. Like covered lagoon digesters fixed-film digesters are best suited for dilute waste streams typically associated with flush manure handling or pit recharge manure collection. Fixed-film digesters can be used for both dairy and swine wastes. However, separation of dairy manure is required to remove slowly degradable solids.
1-1.3 Effluent Storage
The products of the anaerobic digestion of manure in digesters are biogas and effluent. The effluent is a stabilized organic solution that has value as a fer-
Exhibit 1-2 Floating Cover Module for Lagoon Application in Arid Regions
Flotation on the underside Tie-down points to
of cover, all four sides and guy the cover
between cells
Thru cover drains for rain water
Gas pick-up points
2’ deep skirt with chain The cover is divided into
weight on all four sides two or more cells for efficiency and safety
Courtesy of Engineered Textile Products, Inc.
SECOND EDITION 1-3
Chapter 1 Overview of Biogas Technology
tilizer and other potential uses. Waste storage facilities are required to store treated effluent because the nutrients in the effluent cannot be applied to land and crops year round.
The size of the storage facility and storage period must be adequate to meet farm requirements during the non-growing season. Facilities with longer storage periods allow flexibility in managing the waste to accommodate weather changes, equipment availability and breakdown, and overall operation management.
1-1.4 Gas Handling
A gas handling system removes biogas from the digester and transports it to the end-use, such as an engine or flange. Gas handling includes: piping; gas pump or blower; gas meter; pressure regulator; and condensate drain(s).
Biogas produced in the digester is trapped under an airtight cover placed over the digester. The biogas is removed by pulling a slight vacuum on the collection pipe (e.g., by connecting a gas pump/blower to the end of the pipe), which draws the collected gas from under the cover. A gas meter is used to monitor the gas flow rate. Sometimes a gas scrubber is needed to clean or “scrub” the biogas of corrosive compounds contained in the biogas (e.g., hydrogen sulfide). Warm biogas cools as it travels through the piping and water vapor in the gas condenses. A condensate drain(s) removes the condensate produced.
1-1.5 Gas Use
Recovered biogas can be utilized in a variety of ways. The recovered gas is 60 - 80 percent methane, with a heating value of approximately 600 - 800 Btu/ft3. Gas of this quality can be used to generate electricity; it may be used as fuel for a boiler, space heater, or refrigeration equipment; or it may be directly combusted as a cooking and lighting fuel. Chapter 3 provides more information on biogas use.
Electricity can be generated for on-farm use or for sale to the local electric power grid. The most common technology for generating electricity is an internal combustion engine with a generator. The predicted gas flow rate and the operating plan are
used to size the electricity generation equipment.
Engine-generator sets are available in many sizes. Some brands have a long history of reliable operation when fueled by biogas. Electricity generated in this manner can replace energy purchased from the local utility, or can be sold directly to the local electricity supply system. In addition, waste heat from these engines can provide heating or hot water for farm use.
Biogas can also be used directly on-site as a fuel for facility operations. Equipment that normally uses propane or natural gas can be modified to use biogas. Such equipment includes boilers, heaters, and chillers.
— Boilers and Space Heaters. Boilers and space heaters fired with biogas produce heat for use in the facility operations. Although this may not be the most efficient use of the gas, in some situations it may be a farm’s best option.
— Chilling/Refrigeration. Dairy farms use considerable amounts of energy for refrigeration. Approximately 15 to 30 percent of a dairy’s electricity load is used to cool milk. Gas-fired chillers are commercially available and can be used for this purpose. For some dairies, this may be the most cost effective option for biogas utilization.
Other energy use options may exist. For example, a nearby greenhouse could be heated with the biogas, and carbon dioxide from the heater exhaust could be used to enhance plant growth. These options need to be evaluated on a case-by-case basis.
1-2. Benefits of Biogas Technology
Most confined livestock operations handle manure as liquids, slurries, semi-solids, or solids that are stored in lagoons, concrete basins, tanks, and other containment structures. These structures are typically designed to comply with local and state environmental regulations and are a necessary cost of production.
Biogas technology can be a cost-effective, environment and neighborhood friendly addition to existing
SECOND EDITION 1-4
Chapter 1 Overview of Biogas Technology
manure management strategies. Biogas technologies anaerobically digest manure, resulting in biogas and a liquefied, low-odor effluent. By managing the anaerobic digestion of manure, biogas technologies significantly reduce Biochemical Oxygen Demand (BOD), and pathogen levels; remove most noxious odors; and convert most of the organic nitrogen to plant available inorganic nitrogen.
The principal reasons a farmer or producer would consider installing a biogas system are:
— On-Site Farm Energy. By recovering biogas and producing on-farm energy, livestock producers can reduce monthly energy purchases from electric and gas suppliers.
— Reduced Odors. Biogas systems reduce offensive odors from overloaded or improperly managed manure storage facilities. These odors impair air quality and may be a nuisance to nearby communities. Biogas systems reduce these offensive odors because the volatile organic acids, the odor causing compounds, are consumed by biogas producing bacteria.
— High Quality Fertilizer. In the process of anaerobic digestion, the organic nitrogen in the manure is largely converted to ammonium. Ammonium is the primary constituent of commercial fertilizer, which is readily available and utilized by plants.
— Reduced Surface and Groundwater Contamination. Digester effluent is a more uniform and predictable product than untreated manure. The higher ammonium content allows better crop utilization and the physical properties allow easier land application. Properly applied, digester effluent reduces the likelihood of surface or groundwater pollution.
— Pathogen Reduction. Heated digesters reduce pathogen populations dramatically in a few days. Lagoon digesters isolate pathogens and allow pathogen kill and die-off prior to entering storage for land application.
Biogas recovery can improve profitability while improving environmental quality. Maximizing farm resources in such a manner may prove essential to
remain competitive and environmentally sustainable in today’s livestock industry. In addition, more widespread use of biogas technology will create jobs related to the design, operation, and manufacture of energy recovery systems and lead to the advancement of U.S. agribusiness.
1-3. The U.S. Biogas Experience
Rising oil prices in the 1970’s triggered an interest in developing “commercial farm-scale” biogas systems in the United States. During this developmental period (1975-1990) approximately 140 biogas systems were installed in the United States, of which about 71 were installed at commercial swine, dairy, and caged layer farms.
Many of these initial biogas systems failed. However, learning from failures is part of the technology development process. Examining past failures and successes led to improvements and refinements in existing technologies and newer, more practical systems. The main reasons for the success and failure of biogas recovery projects follow.
1-3.1 Reasons for Success
Biogas recovery projects succeeded because:
1. The owner/operator realized the benefits biogas technology had to offer and wanted to make it work.
2. The owner/operator had some mechanical knowledge and ability and had access to technical support.
3. The designer/builder built systems that were compatible with farm operation.
4. The owner/operator increased the profitability of biogas systems through the utilization and sale of manure byproducts. Some facilities generate more revenues from the sale of electricity and other manure byproducts than from the sale of milk.
SECOND EDITION 1-5
Chapter 1 Overview of Biogas Technology
1-3.2 Reasons for Failure
Biogas recovery projects failed because:
1. Operators did not have the skills or the time required to keep a marginal system operating.
2. Producers selected digester systems that were not compatible with their manure handling methods.
3. Some designer/builders sold “cookie cutter” designs to farms. For example, of the 30 plug flow digesters built, 19 were built by one designer and 90 percent failed.
4. The designer/builders installed the wrong type of equipment, such as incorrectly sized engine-generators, gas transmission equipment, and electrical relays.
5. The systems became too expensive to maintain and repair because of poor system design.
6. Farmers did not receive adequate training and technical support for their systems.
7. There were no financial returns of the system or returns diminished over time.
8. Farms went out of business due to non-digester factors.
This handbook draws from these lessons and provides a realistic screening process for livestock facilities to decide if biogas technology is an appropriate match for the farm and farm owner.
1-3.3 Today’s Experiences
The development of anaerobic digesters for livestock manure treatment and energy production has accelerated at a very face pace over the past few years. Factors influencing this market demand include: increased technical reliability of anaerobic digesters through the deployment of successful operating systems over the past decade; growing concern of farm owners about environmental quality; an increasing number of states and federal programs designed to cost share in the development of these systems; and the emergence of new state
energy policies designed to expand growth in reliable renewable energy and green power markets.
There are currently about 70 operating digester systems, with another 35 planned for construction in 2004. Six of these centralized systems provide manure treatment for surrounding farms. Currently, three centralized systems are operational and three more are planned. A methodology for assessing and reviewing centralized projects is discussed further in Chapter 9. More information on some of the operating digesters can be found in Appendix A.
SECOND EDITION 1-6
Chapter 2 Preliminary Screening for Project Opportunities
Contents:
List of Exhibits:
2-1. Is the Confined Livestock Facility “Large”?
2-1.1 Is the Livestock Facility “Large” ...................................................1 2-1.2 Is Manure Production and Collection Stable Year Round? ...........2
2-2. Is Your Manure Management Compatible with Biogas Technology?
2-2.1 What Type of Manure is Collected? ..............................................3 2-2.2 Is the Manure Collected at One Point? ..........................................3 2-2.3 Is the Manure Collected Daily or Every Other Day? .....................4 2-2.4 Is the Manure Free of Large Amounts of Bedding?.......................4
2-3. Is There a Use for Energy?
2-4. Can You Manage a Biogas System Effectively?
2-5. Initial Appraisal Results
Exhibit 2-1 Checklist for Facility Characteristics ...........................................2
Exhibit 2-2 Appropriate Manure Characteristics and Handling Systems for Specific Types of Biogas Digester Systems................................3
Exhibit 2-3 Checklist for Manure Management..............................................4
Exhibit 2-4 Checklist for Energy Use .............................................................5
Exhibit 2-5 Checklist for Management ...........................................................6
Exhibit 2-6 Initial Appraisal Results Checklist...............................................7
SECOND EDITION 2-i
1
2
5
5
7
Chapter 2 Preliminary Screening for Project Opportunities
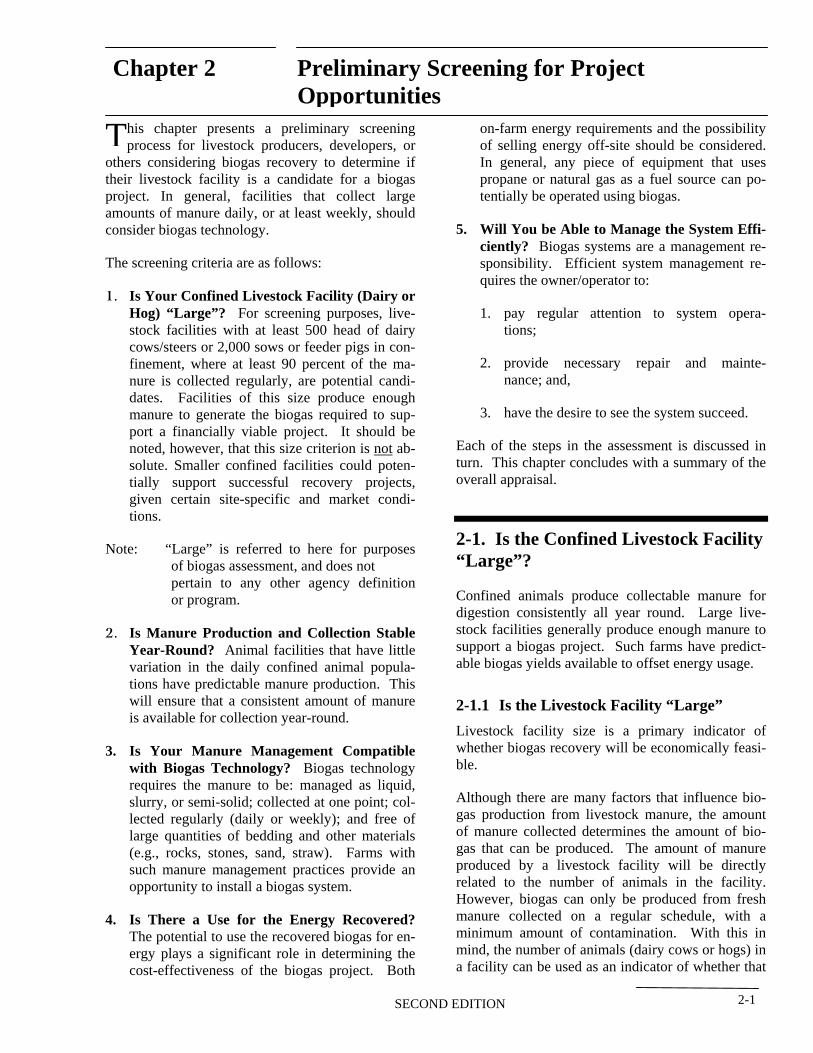
his chapter presents a preliminary screening Tprocess for livestock producers, developers, or others considering biogas recovery to determine if their livestock facility is a candidate for a biogas project. In general, facilities that collect large amounts of manure daily, or at least weekly, should consider biogas technology.
The screening criteria are as follows:
1. Is Your Confined Livestock Facility (Dairy or Hog) “Large”? For screening purposes, livestock facilities with at least 500 head of dairy cows/steers or 2,000 sows or feeder pigs in confinement, where at least 90 percent of the manure is collected regularly, are potential candidates. Facilities of this size produce enough manure to generate the biogas required to support a financially viable project. It should be noted, however, that this size criterion is not absolute. Smaller confined facilities could potentially support successful recovery projects, given certain site-specific and market conditions.
Note: “Large” is referred to here for purposes of biogas assessment, and does not pertain to any other agency definition or program.
2. Is Manure Production and Collection Stable Year-Round? Animal facilities that have little variation in the daily confined animal populations have predictable manure production. This will ensure that a consistent amount of manure is available for collection year-round.
3. Is Your Manure Management Compatible with Biogas Technology? Biogas technology requires the manure to be: managed as liquid, slurry, or semi-solid; collected at one point; collected regularly (daily or weekly); and free of large quantities of bedding and other materials (e.g., rocks, stones, sand, straw). Farms with such manure management practices provide an opportunity to install a biogas system.
4. Is There a Use for the Energy Recovered? The potential to use the recovered biogas for energy plays a significant role in determining the cost-effectiveness of the biogas project. Both
on-farm energy requirements and the possibility of selling energy off-site should be considered. In general, any piece of equipment that uses propane or natural gas as a fuel source can potentially be operated using biogas.
5. Will You be Able to Manage the System Efficiently? Biogas systems are a management responsibility. Efficient system management requires the owner/operator to:
1. pay regular attention to system operations;
2. provide necessary repair and mainte nance; and,
3. have the desire to see the system succeed.
Each of the steps in the assessment is discussed in turn. This chapter concludes with a summary of the overall appraisal.
2-1. Is the Confined Livestock Facility “Large”?
Confined animals produce collectable manure for digestion consistently all year round. Large livestock facilities generally produce enough manure to support a biogas project. Such farms have predictable biogas yields available to offset energy usage.
2-1.1 Is the Livestock Facility “Large”
Livestock facility size is a primary indicator of whether biogas recovery will be economically feasible.
Although there are many factors that influence biogas production from livestock manure, the amount of manure collected determines the amount of biogas that can be produced. The amount of manure produced by a livestock facility will be directly related to the number of animals in the facility. However, biogas can only be produced from fresh manure collected on a regular schedule, with a minimum amount of contamination. With this in mind, the number of animals (dairy cows or hogs) in a facility can be used as an indicator of whether that
SECOND EDITION 2-1
Chapter 2 Preliminary Screening for Project Opportunities
operation generates, or has the potential to generate, a significant amount of biogas. The number of animals and proportion of the manure collected can be used to indicate whether more detailed technical assessments should be undertaken.
As a general rule of thumb, manure collection equivalent to the total daily manure production from 500 dairy cows or 2,000 sows or feeder pigs is the minimum size to be considered. This rough estimate takes into account the general manure production rate and manure composition of these animals. This minimum value is not absolute. Other factors, such as climate, diet, value of energy, odor and other environmental concerns, and existing manure management system can affect this minimum value. The software tool, FarmWare contained in this handbook allows you to evaluate the impact of these factors in terms of farm costs and benefits.
2-1.2 Is Manure Production and Collection Stable Year Round?
In addition to a minimum number of animals from which manure is collected, candidate facilities should have relatively constant animal populations year round. This will ensure that a consistent amount of manure is available for collection year round. Knowing the amount of collectible manure is critical in sizing the digester and gas use components. If the daily manure produced is greater or less than the digester capacity, there will be addi-
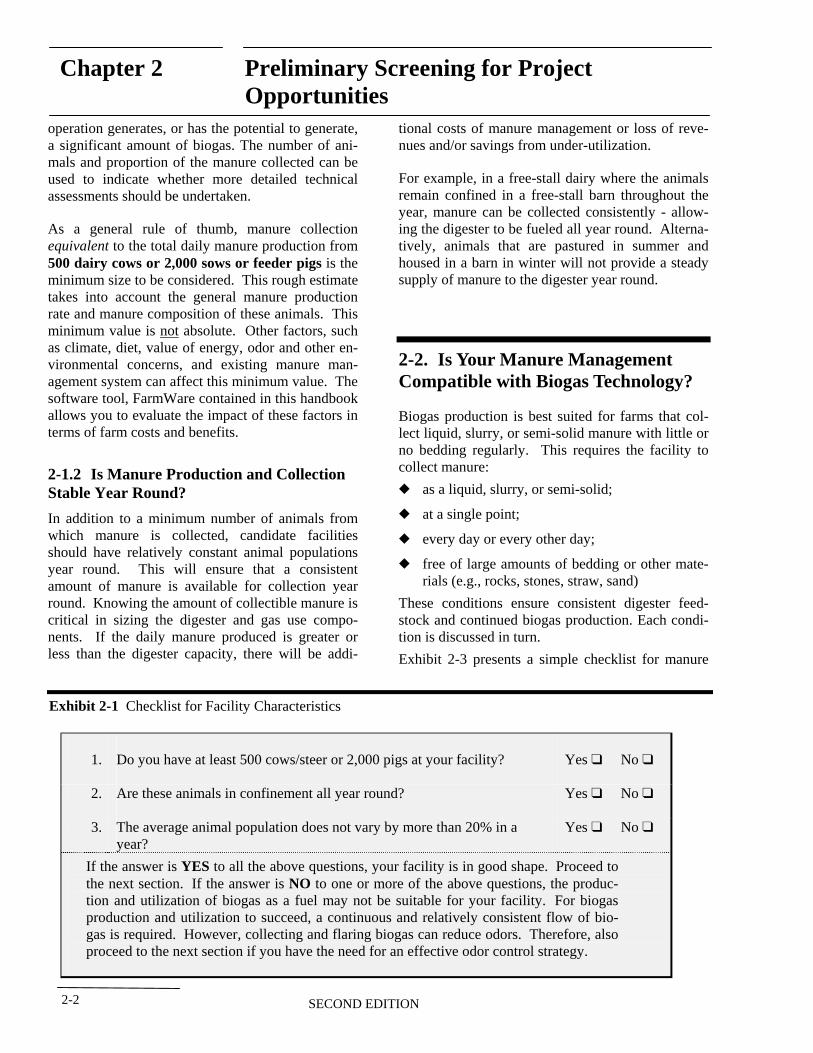
Exhibit 2-1 Checklist for Facility Characteristics
tional costs of manure management or loss of revenues and/or savings from under-utilization.
For example, in a free-stall dairy where the animals remain confined in a free-stall barn throughout the year, manure can be collected consistently - allowing the digester to be fueled all year round. Alternatively, animals that are pastured in summer and housed in a barn in winter will not provide a steady supply of manure to the digester year round.
2-2. Is Your Manure Management Compatible with Biogas Technology?
Biogas production is best suited for farms that collect liquid, slurry, or semi-solid manure with little or no bedding regularly. This requires the facility to collect manure:
— as a liquid, slurry, or semi-solid;
— at a single point;
— every day or every other day;
— free of large amounts of bedding or other materials (e.g., rocks, stones, straw, sand)
These conditions ensure consistent digester feedstock and continued biogas production. Each condition is discussed in turn.
Exhibit 2-3 presents a simple checklist for manure
1. Yes “ No “
2. Yes “ No “
3. Yes “ No “
YES Proceed to the next section. NO
gas is required.
Do you have at least 500 cows/steer or 2,000 pigs at your facility?
Are these animals in confinement all year round?
The average animal population does not vary by more than 20% in a year?
If the answer is to all the above questions, your facility is in good shape. If the answer is to one or more of the above questions, the produc
tion and utilization of biogas as a fuel may not be suitable for your facility. For biogas production and utilization to succeed, a continuous and relatively consistent flow of bio
However, collecting and flaring biogas can reduce odors. Therefore, also proceed to the next section if you have the need for an effective odor control strategy.
SECOND EDITION 2-2
Chapter 2 Preliminary Screening for Project Opportunities
management conditions favoring biogas technology.
2-2.1 What Type of Manure Is Collected?
Livestock facilities that collect manure as a liquid, slurry, or semi-solid are the best candidates for biogas recovery projects. At such facilities, farm operators will know the daily operational management requirements for these materials and it is likely that the manure can be digested to produce biogas.
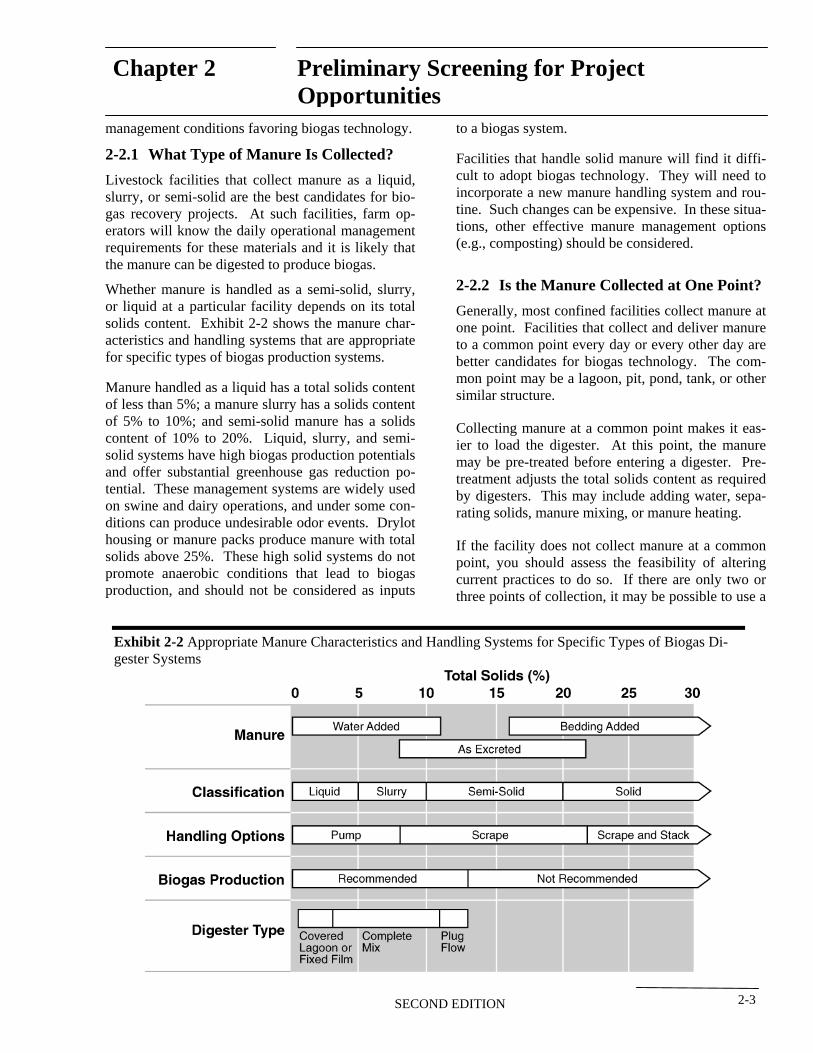
Whether manure is handled as a semi-solid, slurry, or liquid at a particular facility depends on its total solids content. Exhibit 2-2 shows the manure characteristics and handling systems that are appropriate for specific types of biogas production systems.
Manure handled as a liquid has a total solids content of less than 5%; a manure slurry has a solids content of 5% to 10%; and semi-solid manure has a solids content of 10% to 20%. Liquid, slurry, and semisolid systems have high biogas production potentials and offer substantial greenhouse gas reduction potential. These management systems are widely used on swine and dairy operations, and under some conditions can produce undesirable odor events. Drylot housing or manure packs produce manure with total solids above 25%. These high solid systems do not promote anaerobic conditions that lead to biogas production, and should not be considered as inputs
to a biogas system.
Facilities that handle solid manure will find it difficult to adopt biogas technology. They will need to incorporate a new manure handling system and routine. Such changes can be expensive. In these situations, other effective manure management options (e.g., composting) should be considered.
2-2.2 Is the Manure Collected at One Point?
Generally, most confined facilities collect manure at one point. Facilities that collect and deliver manure to a common point every day or every other day are better candidates for biogas technology. The common point may be a lagoon, pit, pond, tank, or other similar structure.
Collecting manure at a common point makes it easier to load the digester. At this point, the manure may be pre-treated before entering a digester. Pretreatment adjusts the total solids content as required by digesters. This may include adding water, separating solids, manure mixing, or manure heating.
If the facility does not collect manure at a common point, you should assess the feasibility of altering current practices to do so. If there are only two or three points of collection, it may be possible to use a
Exhibit 2-2 Appropriate Manure Characteristics and Handling Systems for Specific Types of Biogas Digester Systems
SECOND EDITION 2-3
Chapter 2 Preliminary Screening for Project Opportunities
digester at the largest of these points.
2-2.3 Is the Manure Collected Daily or Every Other Day?
Manure is the feedstock for a digester system. While an occasional daily feeding of a digester might be missed with little consequence under normal operations, not feeding a digester for a week can lead to a loss of biogas production. More importantly, feeding the digester in irregular intervals can disrupt the biological process and cause the system to work inefficiently or stop entirely. Therefore, most digesters are designed to be fed daily. With continuous feed and discharge of material from the system, the bacteria work efficiently and higher volumes of manure are processed.
Daily manure collection is also efficient in terms of conserving the nutrient values of the manure and preserving its gas production potential. Any decomposition of organic material outside the digester will reduce biogas production. Therefore, it is best to feed fresh manure to a digester.
If you do not collect manure daily, you should consider converting to daily manure collection.
Exhibit 2-3 Checklist for Manure Management
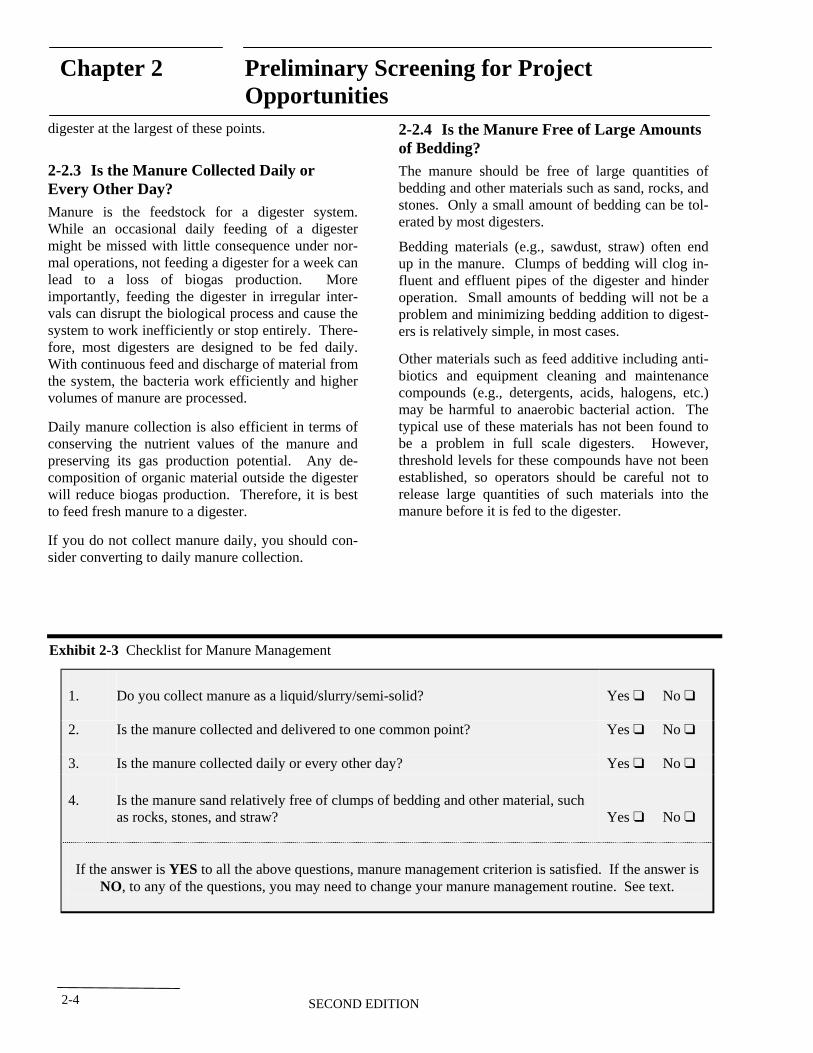
2-2.4 Is the Manure Free of Large Amounts of Bedding?
The manure should be free of large quantities of bedding and other materials such as sand, rocks, and stones. Only a small amount of bedding can be tolerated by most digesters.
Bedding materials (e.g., sawdust, straw) often end up in the manure. Clumps of bedding will clog influent and effluent pipes of the digester and hinder operation. Small amounts of bedding will not be a problem and minimizing bedding addition to digesters is relatively simple, in most cases.
Other materials such as feed additive including antibiotics and equipment cleaning and maintenance compounds (e.g., detergents, acids, halogens, etc.) may be harmful to anaerobic bacterial action. The typical use of these materials has not been found to be a problem in full scale digesters. However, threshold levels for these compounds have not been established, so operators should be careful not to release large quantities of such materials into the manure before it is fed to the digester.
1. Yes “ No “
2. Yes “ No “
3. Yes “ No “
4. as rocks, stones, and straw? Yes “ No “
If the answer is YES If the answer is NO See text.
Do you collect manure as a liquid/slurry/semi-solid?
Is the manure collected and delivered to one common point?
Is the manure collected daily or every other day?
Is the manure sand relatively free of clumps of bedding and other material, such
to all the above questions, manure management criterion is satisfied. , to any of the questions, you may need to change your manure management routine.
SECOND EDITION2-4
Chapter 2 Preliminary Screening for Project Opportunities
2-3. Is There a Use for Energy? The most cost effective biogas projects are those where the energy in the biogas can be used or sold. In many cases, the value of the energy produced from the gas can more than offset the cost of collecting and processing the gas, thereby making the project cost effective on its own. The purpose of this step is to assess whether it is likely that there are suitable uses for the gas recovered from the livestock facility manure.
There are two main gas use options: (1) generation of electricity for on-site use or sale to the power grid; and (2) direct use of the gas locally, either on-site or nearby.
The biogas can be used to fuel a reciprocating engine or gas turbine, which then turns a generator to generate electricity. Modern mechanized dairies and swine facilities typically require a significant amount of electricity to operate equipment. For example, dairies operate vacuum pumps, chillers, feed mixers, and fans. Swine facilities typically operate heat lamps and ventilation equipment. If the electricity is not required on-site, it could be sold to the local power grid.
On-farm use of the gas is often simple and cost-effective. The biogas can be used to fuel boilers or heaters, and in most processes requiring heat, steam, or refrigeration. Dairies and swine farms generally require hot wash water for cleaning and other operations. However, most farms can produce far more gas than they require to replace on-site gas
Exhibit 2-4 Checklist for Energy Use
needs.
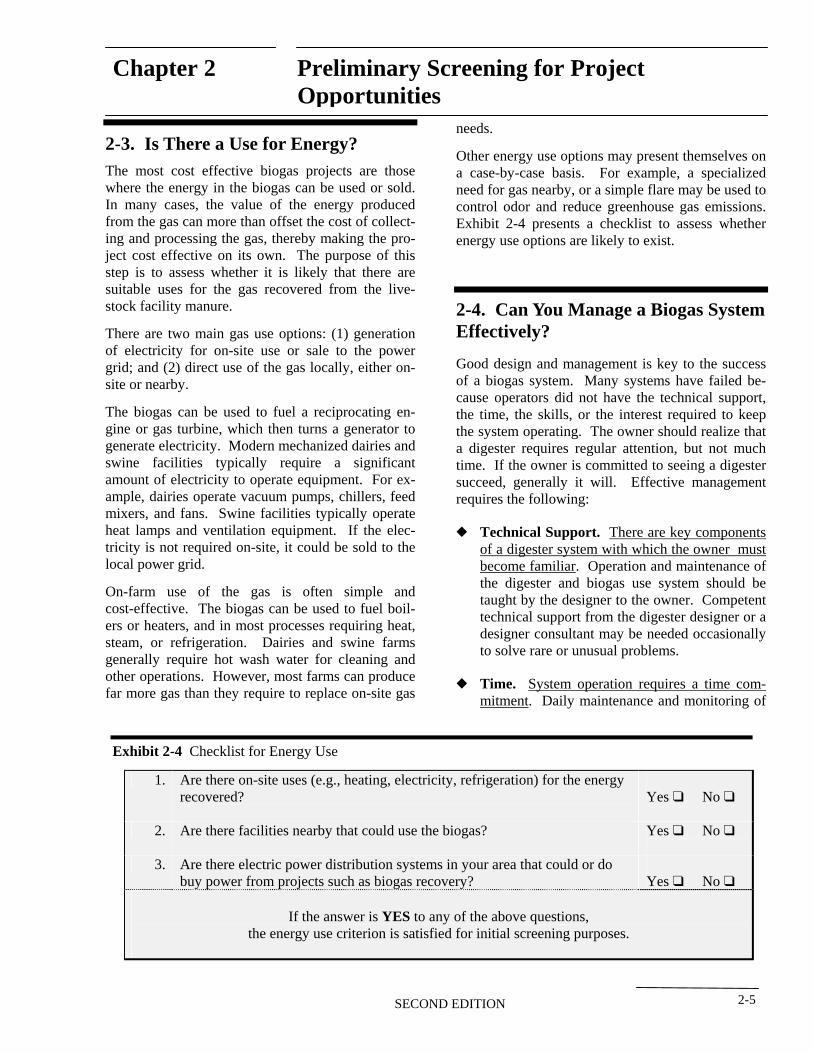
Other energy use options may present themselves on a case-by-case basis. For example, a specialized need for gas nearby, or a simple flare may be used to control odor and reduce greenhouse gas emissions. Exhibit 2-4 presents a checklist to assess whether energy use options are likely to exist.
2-4. Can You Manage a Biogas System Effectively?
Good design and management is key to the success of a biogas system. Many systems have failed because operators did not have the technical support, the time, the skills, or the interest required to keep the system operating. The owner should realize that a digester requires regular attention, but not much time. If the owner is committed to seeing a digester succeed, generally it will. Effective management requires the following:
— Technical Support. There are key components of a digester system with which the owner must become familiar. Operation and maintenance of the digester and biogas use system should be taught by the designer to the owner. Competent technical support from the digester designer or a designer consultant may be needed occasionally to solve rare or unusual problems.
— Time. System operation requires a time commitment. Daily maintenance and monitoring of
1. recovered? Yes “ No “
2. Yes “ No “
3. Yes “ No “
If the answer is YES
Are there on-site uses (e.g., heating, electricity, refrigeration) for the energy
Are there facilities nearby that could use the biogas?
Are there electric power distribution systems in your area that could or do buy power from projects such as biogas recovery?
to any of the above questions, the energy use criterion is satisfied for initial screening purposes.
SECOND EDITION 2-5
Chapter 2 Preliminary Screening for Project Opportunities
a system require approximately 15-30 minutes. sion on equipment purchases. Additionally, infrequent blocks of time for repair and preventive maintenance are required. — Desire. The owner must accept the system as The time required for these tasks ranges from his/her own and want to operate it. Owners approximately 10 minutes to 10 hours, with should understand how the technology works most maintenance tasks requiring 30 minutes to and be committed to seeing the system succeed. 2 hours. The need for (and lack of) infrequent Systems where the management was left to sea-major repairs has led to the failure of many sys sonal farm labor or third parties often failed betems. cause of lack of motivation and incentive.
— Technical skills. A biogas system will require In the ideal management scenario, a trained per-some maintenance. In addition to the general son would spend approximately 30 minutes to 1 mechanical skills found at most farms, an indi hour a day operating the system. This person vidual skilled in engine repair and maintenance would understand the fundamentals of anaerobic is invaluable. This does not imply that a full- digestion and would be involved in the opera-time mechanic is required. Rather, an individual tion and maintenance of the system. Addition-with some mechanical knowledge and ability is ally, this person would possess the technical sufficient. Typical skills required include en- acuity to understand and operate mechanical gine repair, maintenance, and overhauls; trou equipment. Ideally, this person would be part of bleshooting and repair of electrical control prob- the planning and construction of the system. In lems; plumbing; and welding. Additionally, re- cases where the operator is not the owner, operpair parts and services should be easily accessi ating incentives such as bonuses based on sysble. These services are often available through tem “up time” may be considered. equipment dealers. Access to these services is an important consideration when making a deci-
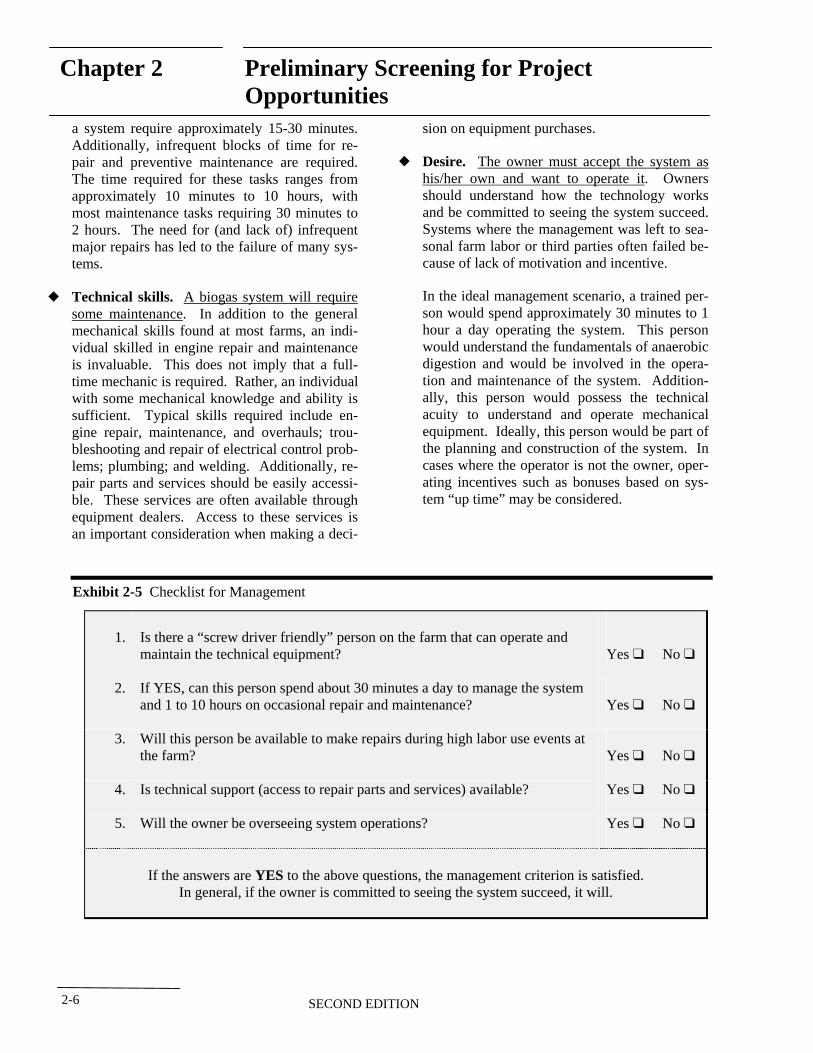
Exhibit 2-5 Checklist for Management
1. Yes “ No “
2. Yes “ No “
3. Yes “ No “
4. Is technical support (access to repair parts and services) available? Yes “ No “
5. Yes “ No “
If the answers are YES
Is there a “screw driver friendly” person on the farm that can operate and maintain the technical equipment?
If YES, can this person spend about 30 minutes a day to manage the system and 1 to 10 hours on occasional repair and maintenance?
Will this person be available to make repairs during high labor use events at the farm?
Will the owner be overseeing system operations?
to the above questions, the management criterion is satisfied. In general, if the owner is committed to seeing the system succeed, it will.
SECOND EDITION 2-6
Chapter 2 Preliminary Screening for Project Opportunities
— Environmental Problems. The Federal Clean 2-5. Initial Appraisal Results Water Act requires zero discharge of contami
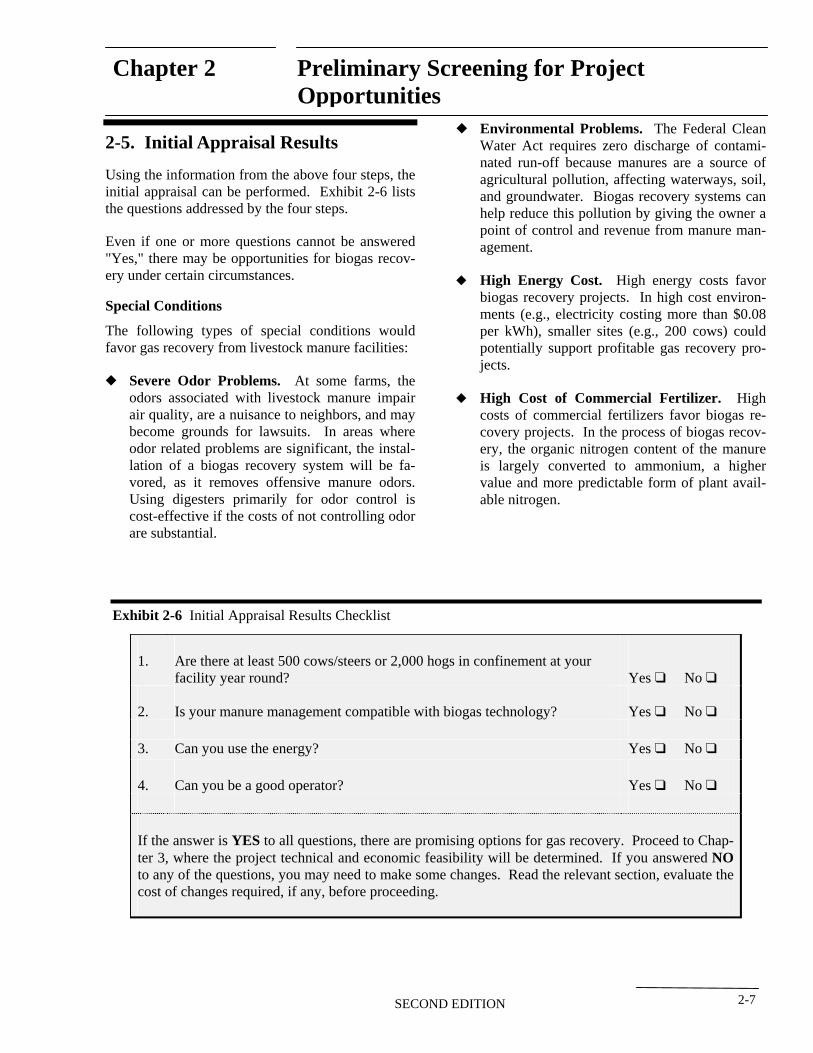
nated run-off because manures are a source of Using the information from the above four steps, the initial appraisal can be performed. Exhibit 2-6 lists the questions addressed by the four steps.
agricultural pollution, affecting waterways, soil, and groundwater. Biogas recovery systems can help reduce this pollution by giving the owner a point of control and revenue from manure man-
Even if one or more questions cannot be answered agement. "Yes," there may be opportunities for biogas recovery under certain circumstances. — High Energy Cost. High energy costs favor
biogas recovery projects. In high cost environ-Special Conditions
ments (e.g., electricity costing more than $0.08 The following types of special conditions would per kWh), smaller sites (e.g., 200 cows) could favor gas recovery from livestock manure facilities: potentially support profitable gas recovery pro
jects. — Severe Odor Problems. At some farms, the
odors associated with livestock manure impair — High Cost of Commercial Fertilizer. High air quality, are a nuisance to neighbors, and may costs of commercial fertilizers favor biogas re-become grounds for lawsuits. In areas where covery projects. In the process of biogas recovodor related problems are significant, the instal- ery, the organic nitrogen content of the manure lation of a biogas recovery system will be fa- is largely converted to ammonium, a higher vored, as it removes offensive manure odors. value and more predictable form of plant avail-Using digesters primarily for odor control is able nitrogen. cost-effective if the costs of not controlling odor are substantial.
Exhibit 2-6 Initial Appraisal Results Checklist
1. Yes “ No “
2. Yes “ No “
3. Yes “ No “
4. Yes “ No “
If the answer is YESNO
Are there at least 500 cows/steers or 2,000 hogs in confinement at your facility year round?
Is your manure management compatible with biogas technology?
Can you use the energy?
Can you be a good operator?
to all questions, there are promising options for gas recovery. Proceed to Chapter 3, where the project technical and economic feasibility will be determined. If you answered to any of the questions, you may need to make some changes. Read the relevant section, evaluate the cost of changes required, if any, before proceeding.
SECOND EDITION 2-7
Chapter 2 Preliminary Screening for Project Opportunities
— Compost, Potting Soil, and Soil Amendment Markets. Digested dairy manure solids can be used to replace purchased bedding or can be sold alone and in mixes for potting soil and garden soil amendments. Regional markets exist for soil products. Digested solids have been sold to wholesale and retail customers.
— Niche Applications. Options for utilizing the by-products of anaerobic digestion may present themselves. For example, the digester effluent may be used to stimulate the growth of algae in fishponds and thereby provide feed for fish. These niche options must be evaluated on a case-by-case basis.
SECOND EDITION2-8
Chapter 3 Selecting a Gas Use Option
Contents:
List of Exhibits:
3-1. Electricity Generation
3-1.1 Electricity Generation System Components...............................2 3-1.2 Electricity Generation Options ...................................................3
3-2. Direct Combustion
3-2.1 Heating .......................................................................................4 3-2.2 Chilling/Refrigeration ................................................................4
Exhibit 3-1 Summary of Potential Gas Use Options.......................................1 Exhibit 3-2 Typical Engine-Generator Set......................................................3 Exhibit 3-3 Hot Water Mats Replace Heat Lamps in Farrowing
Buildings for Additional Energy Savings ....................................4
SECOND EDITION 3-i
2
4
Chapter 3 Selecting a Gas Use Option
he purpose of this chapter is to examine how Tbiogas can be used at a farm. Electricity generation with waste heat recovery (cogeneration) is usually the most profitable option for a farm. However, other options may be profitable in certain circumstances. This chapter serves as a reference to determine what factors need to be considered when determining how to use the biogas.
There are several important factors to be considered when selecting a biogas use option:
— What type of energy does the farm use? Farms use electricity, natural gas, propane, or fuel oil energy. Biogas can be used to replace purchased energy for electricity, heating, or cooling. For most farms, the most profitable biogas use option will be to fuel an internal combustion (IC) engine or gas turbine driven generator to produce electricity. Other options include using biogas to fuel forced air furnaces, direct fire room heaters, and adsorption chillers.
— How much energy does the farm use and when? Farm energy requirements will vary daily and seasonally. For example: heating and air conditioning are seasonal uses; most lighting is used at night; milking two or three times a day for four hours is a very uneven use of electricity;
— Is electricity the primary energy requirement? In the United States, electricity is the largest stationary use of energy on farms. Electric motors for pumps, fans, and motors, as well as lights are generally in use all year round. Usually electricity production for on-farm use is the most viable option.
— Can the engine generator be serviced? Easy access for maintenance tasks and ready availability of parts and services are critical considerations.
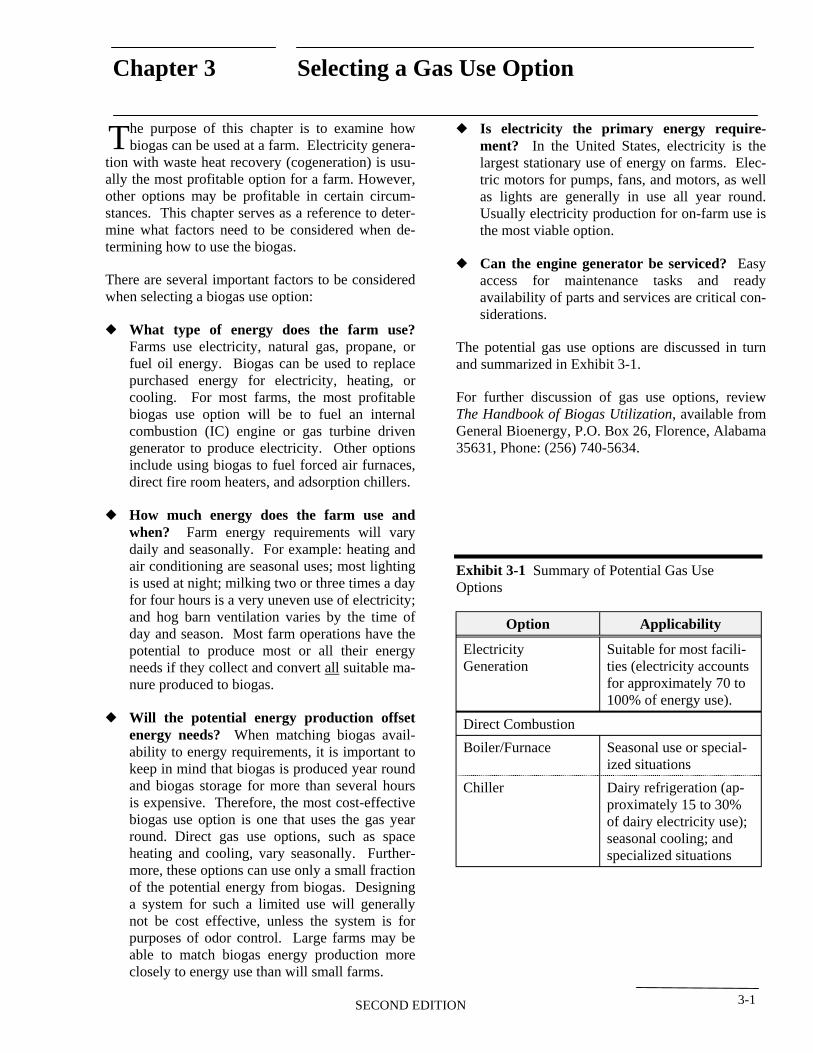
The potential gas use options are discussed in turn and summarized in Exhibit 3-1.
For further discussion of gas use options, review The Handbook of Biogas Utilization, available from General Bioenergy, P.O. Box 26, Florence, Alabama 35631, Phone: (256) 740-5634.
Exhibit 3-1 Summary of Potential Gas Use Options
and hog barn ventilation varies by the time of day and season. Most farm operations have the potential to produce most or all their energy needs if they collect and convert all suitable manure produced to biogas.
— Will the potential energy production offset energy needs? When matching biogas availability to energy requirements, it is important to keep in mind that biogas is produced year round and biogas storage for more than several hours is expensive. Therefore, the most cost-effective biogas use option is one that uses the gas year round. Direct gas use options, such as space heating and cooling, vary seasonally. Furthermore, these options can use only a small fraction of the potential energy from biogas. Designing a system for such a limited use will generally not be cost effective, unless the system is for purposes of odor control. Large farms may be able to match biogas energy production more closely to energy use than will small farms.
Option Applicability
Electricity Suitable for most facili-Generation ties (electricity accounts
for approximately 70 to 100% of energy use).
Direct Combustion
Boiler/Furnace Seasonal use or specialized situations
Chiller Dairy refrigeration (approximately 15 to 30% of dairy electricity use); seasonal cooling; and specialized situations
SECOND EDITION 3-1
Chapter 3 Selecting a Gas Use Option
3-1. Electricity Generation
Electricity can be generated for on-farm use or for sale to the local electric power grid. Modern dairies and swine facilities require a significant amount of electricity to operate equipment. Hog nurseries require a large amount of circulating heat, but few have hot water heat. Almost all use electric heat lamps and supplemental propane heaters to maintain a suitable temperature. Similarly, 30 percent of dairy electricity consumption is used to cool milk.
The most commonly used technology for generating electricity is an internal combustion engine with a generator. Recovering waste heat from these engines can provide heating, hot water for farm use, or hot water for digester heating thereby improving the overall energy efficiency of the system.
3-1.1 Electricity Generation System Components Typical electricity generation systems consist of: (1) an IC engine or gas turbine; (2) a generator; (3) a control system, and (4) an optional heat recovery system. Each component is discussed briefly, in turn.
1. IC Engine or Gas Turbine. Both IC engines and gas turbine driven generators sets are being used to generate electricity from biogas.
— IC Engine. Natural gas or propane engines are easily converted to burn biogas by modifying carburetion and ignition systems. Natural gas engines are available in virtually any capacity that is required. The most successful engines are industrial natural gas engines that can burn wellhead natural gas. A biogas fueled engine generator will normally convert 18 - 25 percent of the biogas BTUs to electricity, depending on engine design and load factor. Gas treatment is not necessary if proper maintenance procedures are followed. Biogas engines less than 200 horsepower (150 kW) generally meet the most stringent California pollution restrictions without modification if run with a lean
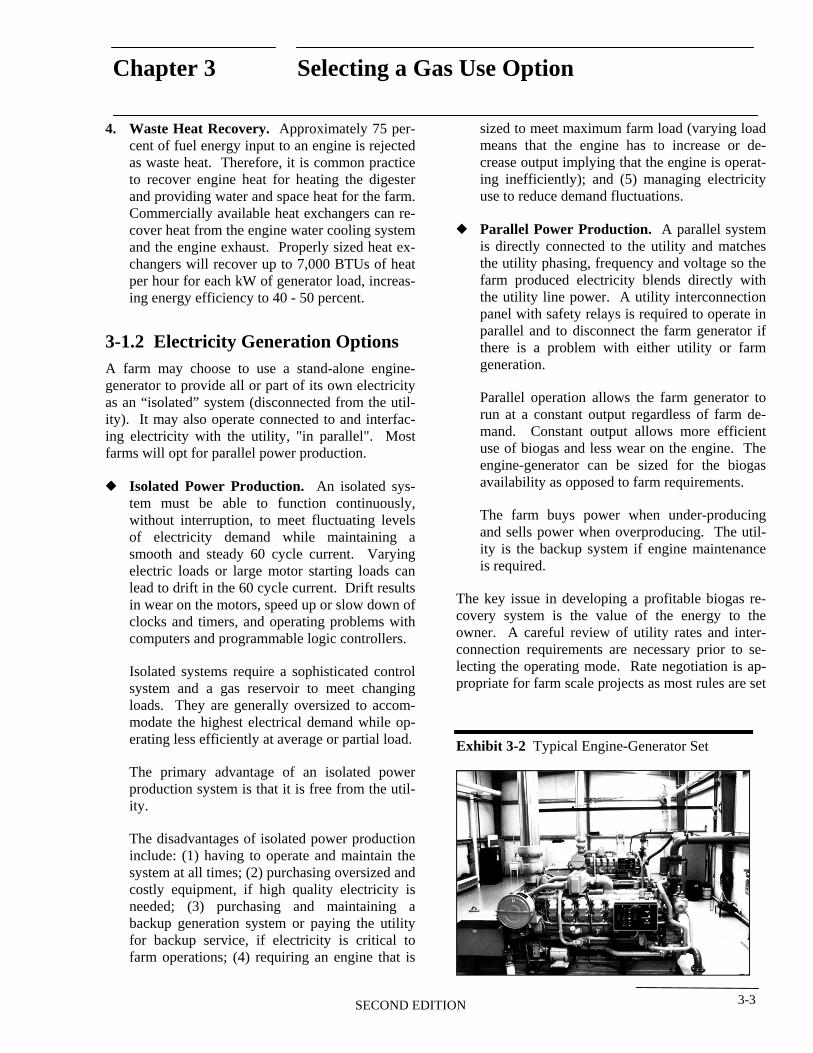
fuel mixture. Exhibit 3-2 shows a typical engine-generator set.
— Gas Turbines. Small gas turbines that are specifically designed to use biogas are also available. An advantage to this technology is lower NOx emissions and lower maintenance costs, however energy efficiency is less than with IC engines and it costs more.
2. Generator. There are two types of generators that are used on farms: induction generators and synchronous generators.
— Induction Generator. An induction generator will operate in parallel with the utility and cannot stand alone. Induction generation derives phase, frequency, and voltage from the utility. Negotiations with a utility for interconnection of a small induction generator are generally much easier.
— Synchronous Generator. A synchronous generator will operate either isolated or in parallel. The synchronous generator can provide electricity to the farm if the utility is shut down. Synchronous parallel generation requires a sophisticated interconnection to match generator output to utility phase, frequency, and voltage. This is typically more expensive than controls for an induction generation.
Most farm-scale systems will use induction generators. The options for electricity generation modes (isolated versus parallel) are discussed further in Section 3-1.2.
3. Control System. Controls are required to protect the engine and to protect the utility. These systems are well developed. Control packages are available that shut the engine off due to mechanical problems such as high water temperature or low oil level. The control system will also shut off the engine if the utility power is off, or if utility electricity is out of its specified voltage and frequency range. It is important to recognize that the control system selected must be designed to operate in a damp environment where corrosive gases, such as ammonia, may be present.
SECOND EDITION3-2
Chapter 3 Selecting a Gas Use Option
4. Waste Heat Recovery. Approximately 75 percent of fuel energy input to an engine is rejected as waste heat. Therefore, it is common practice to recover engine heat for heating the digester and providing water and space heat for the farm. Commercially available heat exchangers can recover heat from the engine water cooling system and the engine exhaust. Properly sized heat exchangers will recover up to 7,000 BTUs of heat per hour for each kW of generator load, increasing energy efficiency to 40 - 50 percent.
3-1.2 Electricity Generation Options A farm may choose to use a stand-alone engine-generator to provide all or part of its own electricity as an “isolated” system (disconnected from the utility). It may also operate connected to and interfacing electricity with the utility, "in parallel". Most
sized to meet maximum farm load (varying load means that the engine has to increase or decrease output implying that the engine is operating inefficiently); and (5) managing electricity use to reduce demand fluctuations.
— Parallel Power Production. A parallel system is directly connected to the utility and matches the utility phasing, frequency and voltage so the farm produced electricity blends directly with the utility line power. A utility interconnection panel with safety relays is required to operate in parallel and to disconnect the farm generator if there is a problem with either utility or farm generation.
Parallel operation allows the farm generator to run at a constant output regardless of farm demand. Constant output allows more efficient
farms will opt for parallel power production. use of biogas and less wear on the engine. The engine-generator can be sized for the biogas
— Isolated Power Production. An isolated sys- availability as opposed to farm requirements.
tem must be able to function continuously, without interruption, to meet fluctuating levels The farm buys power when under-producing
of electricity demand while maintaining a and sells power when overproducing. The util
smooth and steady 60 cycle current. Varying ity is the backup system if engine maintenance
electric loads or large motor starting loads can is required.
lead to drift in the 60 cycle current. Drift results in wear on the motors, speed up or slow down of The key issue in developing a profitable biogas re-
clocks and timers, and operating problems with covery system is the value of the energy to the
computers and programmable logic controllers. owner. A careful review of utility rates and interconnection requirements are necessary prior to se-
Isolated systems require a sophisticated control lecting the operating mode. Rate negotiation is ap
system and a gas reservoir to meet changing propriate for farm scale projects as most rules are set
loads. They are generally oversized to accommodate the highest electrical demand while operating less efficiently at average or partial load. Exhibit 3-2 Typical Engine-Generator Set
The primary advantage of an isolated power production system is that it is free from the utility.
The disadvantages of isolated power production include: (1) having to operate and maintain the system at all times; (2) purchasing oversized and costly equipment, if high quality electricity is needed; (3) purchasing and maintaining a backup generation system or paying the utility for backup service, if electricity is critical to farm operations; (4) requiring an engine that is
SECOND EDITION 3-3
Chapter 3 Selecting a Gas Use Option
up for very large independent power producers. Chapter 5 discusses how a livestock producer should negotiate with a utility. FarmWare can help you understand the impact of utility rates on electrical costs and expected revenues from the project.
3-2. Direct Combustion
The recovered biogas can be used directly on-site as a fuel. Equipment that normally uses propane or natural gas such as boilers, forced air furnaces, and chillers, can be modified to use biogas. Typical farms use only a limited amount of these fuels compared to electricity.
3-2.1 Heating Heating is usually a seasonal operation. Boilers and forced air furnaces can be fired with biogas to produce heat. Although this may be an efficient use of the gas, it is generally not as convenient as electricity. Nevertheless, in some situations it may be a best option.
— Boilers. Thousands of biogas-fired boilers are in use at municipal waste treatment plants in the United States, where they provide hot water for building and digester heat. Conversion efficiencies are typically at 75 to 85 percent. Several have been installed on farm digesters. Farms require hot water year round, but there is typically more biogas available than hot water required. Farrow to wean and farrow to nursery hog farms in cold climates are the only type of farm where heat requirements could consume most or all of the available biogas production potential. Exhibit 3-23 shows.
A cast iron natural gas boiler can be used for most farm applications. The air-fuel mix will require adjustment and burner jets will have to be enlarged for medium BTU gas. Cast iron boilers are available in a wide range of sizes, from 45,000 BTU/hour and larger. Untreated biogas can be burned in these boilers. However, all metal surfaces of the housing should be painted. Flame tube boilers with heavy gauge flame tubes may be used if the exhaust temperature is maintained above 300°F to minimize
condensation. High hydrogen sulfide (H2S) concentration in the gas may result in clogging of flame tubes.
— Forced Air Furnaces. Forced air furnaces could be used in hog farms in place of direct fired room heaters, which are commonly used in hog farrowing and nursery rooms. A farm will typically have multiple units. Biogas fired units have not been installed in the United States due to a number of reasons. These heaters are available and in use in Taiwan.
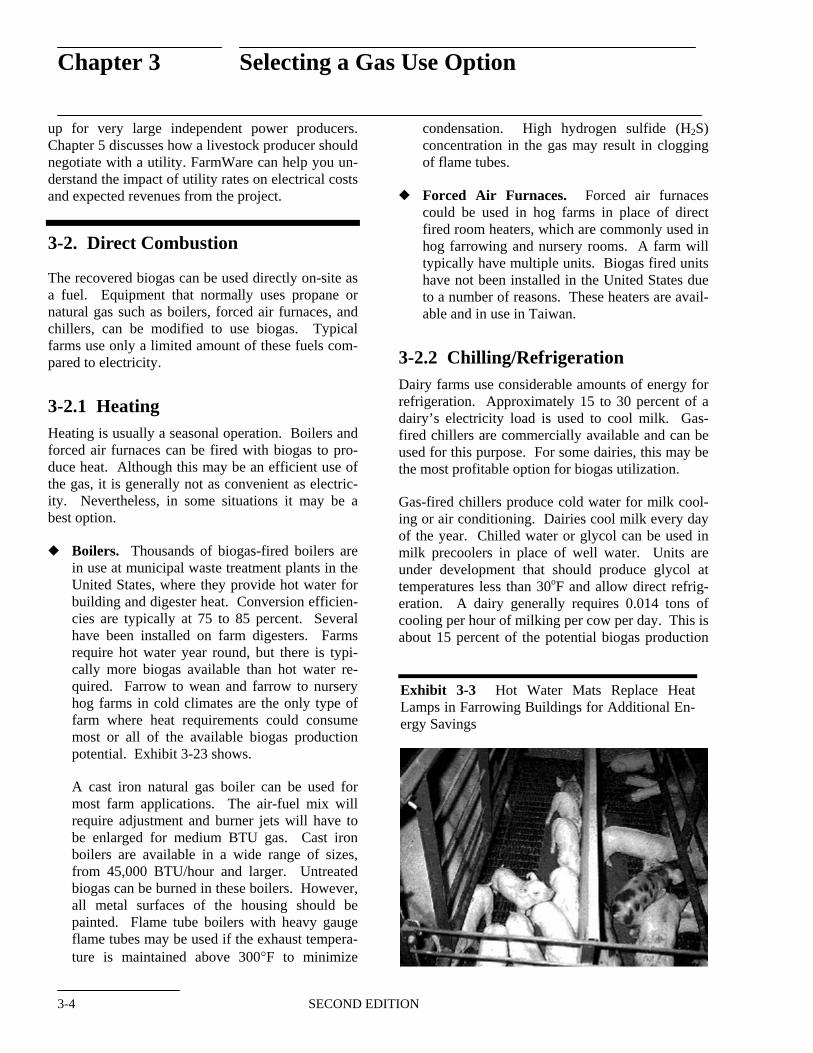
3-2.2 Chilling/Refrigeration Dairy farms use considerable amounts of energy for refrigeration. Approximately 15 to 30 percent of a dairy’s electricity load is used to cool milk. Gas-fired chillers are commercially available and can be used for this purpose. For some dairies, this may be the most profitable option for biogas utilization.
Gas-fired chillers produce cold water for milk cooling or air conditioning. Dairies cool milk every day of the year. Chilled water or glycol can be used in milk precoolers in place of well water. Units are under development that should produce glycol at temperatures less than 30oF and allow direct refrigeration. A dairy generally requires 0.014 tons of cooling per hour of milking per cow per day. This is about 15 percent of the potential biogas production
Exhibit 3-3 Hot Water Mats Replace Heat Lamps in Farrowing Buildings for Additional Energy Savings
SECOND EDITION3-4

Chapter 3 Selecting a Gas Use Option
from the same cow (one ton of cooling = 12,000 BTU/hour).
Double effect chillers, producing hot and cold water simultaneously, are available for applications of over 30 tons and could be coupled with a heated digester.
SECOND EDITION 3-5
Chapter 4 Technical and Economic Feasibility Assessment
Contents: 4-1. Match a Digester to Your Facility
4-1.1 Where Is The Facility Located? .....................................................2 4-1.2 What is the Total Solids Content of the Manure? ..........................3
What is the Raw Manure Total Solids Percentage?..............................3 How do the Waste Management Practices affect Manure Total Solids Percentage? ...........................................................................................3
4-1.3 Summary Appraisal........................................................................4
4-2. Complete Evaluation Forms
4-3. Enter Information into FarmWare
4-4. Evaluate Results
List of Exhibits: Exhibit 4-1 Covered Lagoons for Energy Recovery - Below the Line of
Climate Limitation ......................................................................2 Exhibit 4-2 "As Excreted" Value by Animal Type .........................................3 Exhibit 4-3 Manure Collection and Management Options .............................4 Exhibit 4-4 Matching a Digester to Your Facility...........................................5
SECOND EDITION 4-i
1
5
6
7
Chapter 4 Technical and Economic Feasibility Assessment
he purpose of this chapter is to lead you through Tthe technical and economic feasibility assessment of biogas technology at a facility. This process involves several steps. First, the compatibility of existing manure management practices with potential digester types is examined. Then site-specific data are collected using evaluation forms. These data are entered into FarmWare, the decision support software developed by AgSTAR. It will perform the technical and economic feasibility analyses. Finally, the results from FarmWare are evaluated and a final appraisal of project opportunities is performed.
It is expected that the owner/operator or the person most knowledgeable about the facility will be collecting data and performing this assessment. In some areas, NRCS may be contacted for assistance. See Appendix B for a list of contacts. Checklists and screening forms have been provided to assist you through the process. Additionally, sample case studies have been presented in Appendix E to assist you further.
To select an appropriate and cost effective biogas technology option(s), complete the following steps:
1. Match a Digester to Your Facility. Whether a digester can be integrated into a facility’s existing or planned manure management system depends on the climate and solids content of the manure. Section 4-1 discusses this step in more detail.
2. Complete Evaluation Forms. These forms record the information required to complete the FarmWare assessment. A separate form is provided for swine and dairy facilities. Section 4-2 presents the screening forms and necessary directions.
3. Enter Information into FarmWare. The information from Step 2 is entered into Farm-Ware, the decision support software provided with this handbook (Appendix C). Section 4-3 discusses this step in more detail.
4. Evaluate Results. Using the results from the FarmWare analyses, a final appraisal of project opportunities can be performed. This process is presented in Section 4-4.
Each step is discussed in turn.
4-1. Match a Digester to Your Facility
The choice of which digester to use is driven primarily by the climate and characteristics of the existing manure management system, in particular how the system affects the total solids content of the manure.
As mentioned in Chapter 1, one of four digester types will be suitable for most manure management conditions: covered lagoon; complete mix digester; plug-flow digester, and fixed film.
— Covered Lagoon Digester. Covered lagoons require warm climates to be cost effective unless odor management is the goal. They can be used to treat liquid manure with up to 3 percent total solids.
— Fixed Film Digester. Fixed film digesters are best suited for use in warm climates. They can treat liquid manure with up to 3 percent total solids after removal of coarse solids by settling or screening.
— Complete Mix Digester. Complete mix digesters are applicable in all climates. They can treat manure with total solids in the range of about 3 to 10 percent.
— Plug Flow Digester: Plug flow digesters are applicable in all climates. They can treat only dairy manure with a range of about 11 to 13 percent total solids.
This section will help you decide which digester is suitable for your facility. First, the digesters appropriate for the climatic conditions at your facility are identified. Then the process of determining the total solids content of the manure is presented. Using the information from the first two steps, the digester appropriate for your facility is determined. The table presented in Exhibit 4-4 outlines this selection process.
SECOND EDITION 4-1
Chapter 4 Technical and Economic Feasibility Assessment
4-1.1 Where Is The Facility Located?
Temperature is one of the major factors affecting the growth of bacteria responsible for biogas production. Biogas production can occur anywhere between 39° and 155°F (4° to 68°C). As the temperature increases, the gas production rate also increases, up to a limit.
Complete mix digesters and plug flow digesters are usable in virtually all climates. Plug-flow digesters and complete-mix digesters use supplemental heat to ensure optimal temperature conditions in the 95° to 130°F range (35° to 55°C). Capturing waste heat from a generator set is the preferred method for heating these types of digesters.
Covered lagoons generally do not use supplemental heat because there is not enough waste heat available to heat the large volume of dilution water. Lagoons require large capacities to treat the liquid manure properly at low temperatures; providing heat for these large capacities is expensive and usually not cost-effective. Therefore, covered lagoons for energy recovery are feasible only in moderate to
warm climates, where additional heat will not be required.
However, covered lagoons may be considered for use as an odor management and greenhouse gas reduction system in colder climates. Since gas production varies by season, covered lagoons in colder climates should be equipped with a simple flare system to combust the biogas produced in the lagoon. Flared gas makes a strong odor management statement. However, flaring available gas does not guarantee odor free manure availability for crop applications. Manure characteristics during crop application events are dependent upon lagoon sizing and operational parameters.
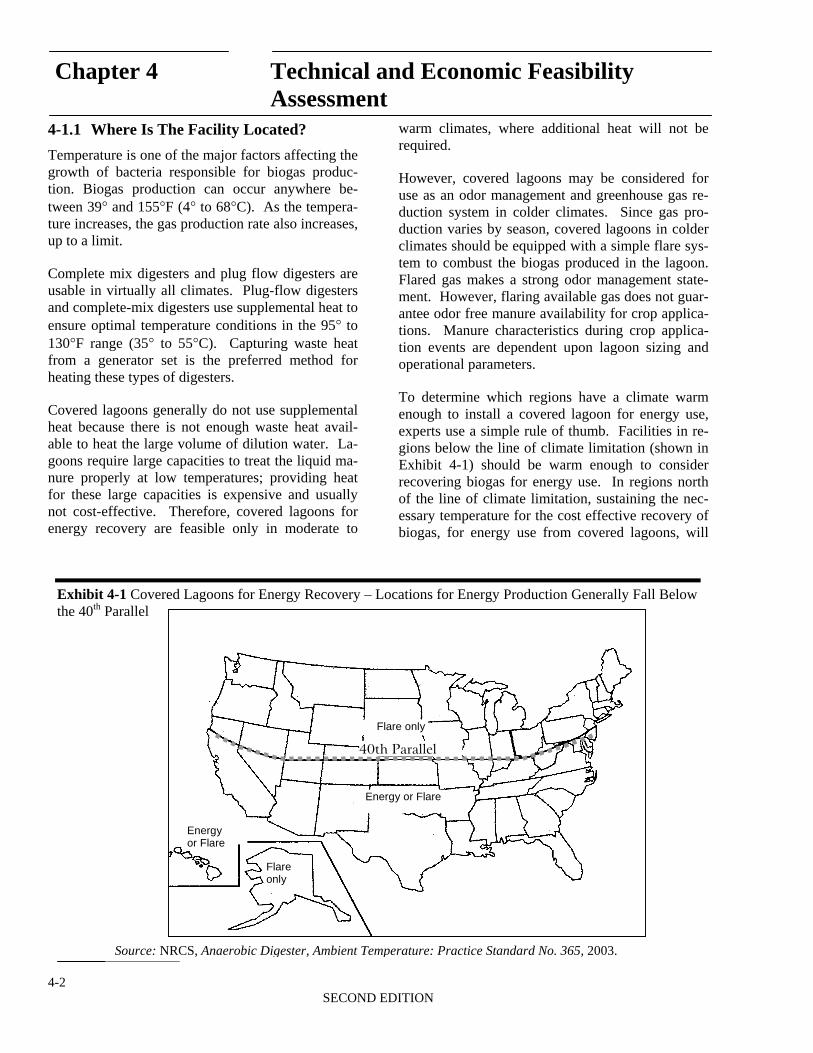
To determine which regions have a climate warm enough to install a covered lagoon for energy use, experts use a simple rule of thumb. Facilities in regions below the line of climate limitation (shown in Exhibit 4-1) should be warm enough to consider recovering biogas for energy use. In regions north of the line of climate limitation, sustaining the necessary temperature for the cost effective recovery of biogas, for energy use from covered lagoons, will
Exhibit 4-1 Covered Lagoons for Energy Recovery – Locations for Energy Production Generally Fall Below the 40th Parallel
Source: NRCS, A gester, Ambient Temp 2003.
ly
lare
l
40th Parallel
naerobic Di erature: Practice Standard No. 365,
Flare on
Energy or F
Flare only
Energy or F are
SECOND EDITION4-2
Chapter 4 Technical and Economic Feasibility Assessment
not be cost effective in most cases.
4-1.2 What Is the Total Solids Content of the Manure?
The total solids (TS) content of the collected manure is another controlling factor in determining which digester to use. TS content, usually expressed as a percentage, indicates the fraction of the total weight of the manure that is not water.
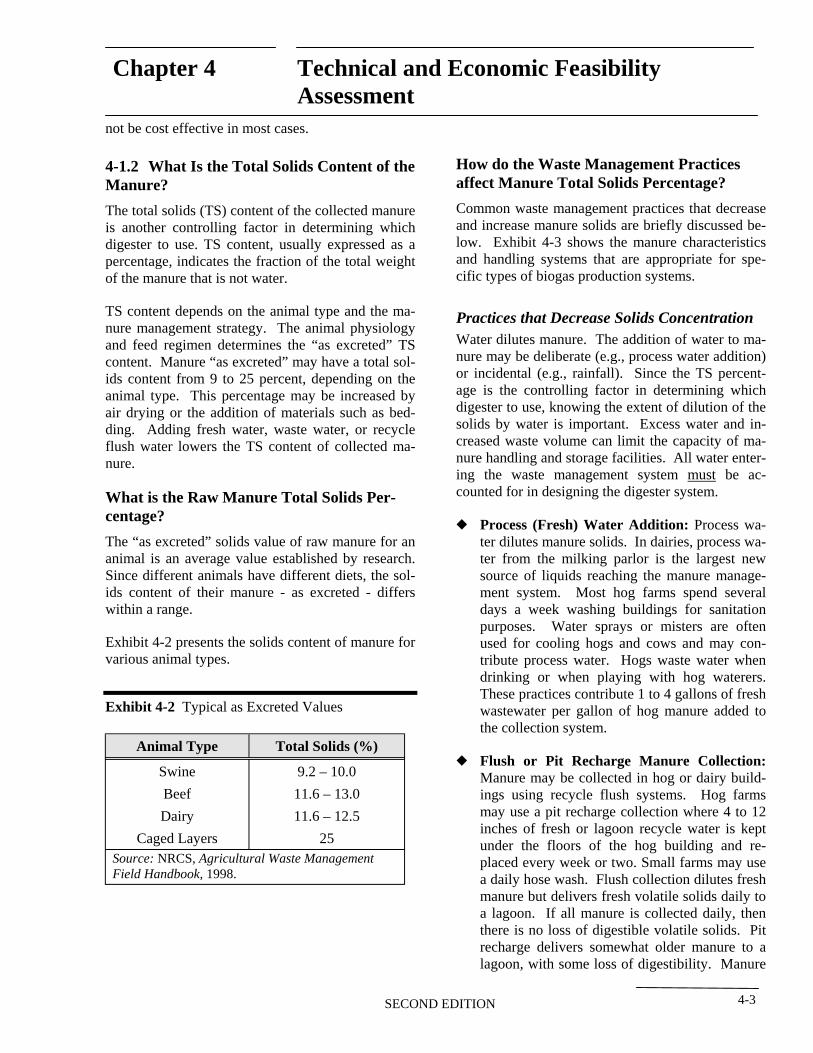
TS content depends on the animal type and the manure management strategy. The animal physiology and feed regimen determines the “as excreted” TS content. Manure “as excreted” may have a total solids content from 9 to 25 percent, depending on the animal type. This percentage may be increased by air drying or the addition of materials such as bedding. Adding fresh water, waste water, or recycle flush water lowers the TS content of collected manure.
What is the Raw Manure Total Solids Percentage?
The “as excreted” solids value of raw manure for an animal is an average value established by research. Since different animals have different diets, the solids content of their manure - as excreted - differs within a range.
Exhibit 4-2 presents the solids content of manure for various animal types.
Exhibit 4-2 Typical as Excreted Values
Animal Type Total Solids (%)
Swine
Beef
Dairy
Caged Layers
9.2 – 10.0
11.6 – 13.0
11.6 – 12.5
25 Source: NRCS, Agricultural Waste Management Field Handbook, 1998.
How do the Waste Management Practices affect Manure Total Solids Percentage?
Common waste management practices that decrease and increase manure solids are briefly discussed below. Exhibit 4-3 shows the manure characteristics and handling systems that are appropriate for specific types of biogas production systems.
Practices that Decrease Solids Concentration Water dilutes manure. The addition of water to manure may be deliberate (e.g., process water addition) or incidental (e.g., rainfall). Since the TS percentage is the controlling factor in determining which digester to use, knowing the extent of dilution of the solids by water is important. Excess water and increased waste volume can limit the capacity of manure handling and storage facilities. All water entering the waste management system must be accounted for in designing the digester system.
— Process (Fresh) Water Addition: Process water dilutes manure solids. In dairies, process water from the milking parlor is the largest new source of liquids reaching the manure management system. Most hog farms spend several days a week washing buildings for sanitation purposes. Water sprays or misters are often used for cooling hogs and cows and may contribute process water. Hogs waste water when drinking or when playing with hog waterers. These practices contribute 1 to 4 gallons of fresh wastewater per gallon of hog manure added to the collection system.
— Flush or Pit Recharge Manure Collection: Manure may be collected in hog or dairy buildings using recycle flush systems. Hog farms may use a pit recharge collection where 4 to 12 inches of fresh or lagoon recycle water is kept under the floors of the hog building and replaced every week or two. Small farms may use a daily hose wash. Flush collection dilutes fresh manure but delivers fresh volatile solids daily to a lagoon. If all manure is collected daily, then there is no loss of digestible volatile solids. Pit recharge delivers somewhat older manure to a lagoon, with some loss of digestibility. Manure
SECOND EDITION 4-3
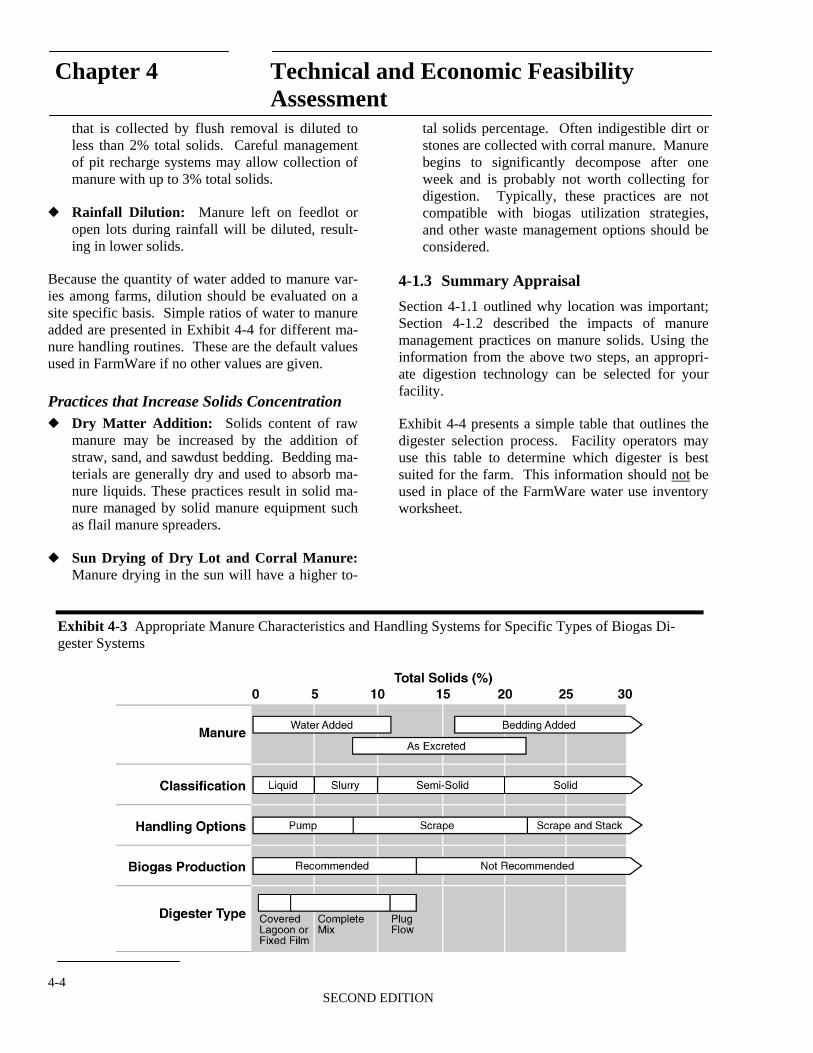
Chapter 4 Technical and Economic Feasibility Assessment
that is collected by flush removal is diluted to less than 2% total solids. Careful management of pit recharge systems may allow collection of manure with up to 3% total solids.
— Rainfall Dilution: Manure left on feedlot or open lots during rainfall will be diluted, resulting in lower solids.
Because the quantity of water added to manure varies among farms, dilution should be evaluated on a site specific basis. Simple ratios of water to manure added are presented in Exhibit 4-4 for different manure handling routines. These are the default values used in FarmWare if no other values are given.
Practices that Increase Solids Concentration — Dry Matter Addition: Solids content of raw
manure may be increased by the addition of straw, sand, and sawdust bedding. Bedding materials are generally dry and used to absorb manure liquids. These practices result in solid manure managed by solid manure equipment such as flail manure spreaders.
— Sun Drying of Dry Lot and Corral Manure: Manure drying in the sun will have a higher to
tal solids percentage. Often indigestible dirt or stones are collected with corral manure. Manure begins to significantly decompose after one week and is probably not worth collecting for digestion. Typically, these practices are not compatible with biogas utilization strategies, and other waste management options should be considered.
4-1.3 Summary Appraisal
Section 4-1.1 outlined why location was important; Section 4-1.2 described the impacts of manure management practices on manure solids. Using the information from the above two steps, an appropriate digestion technology can be selected for your facility.
Exhibit 4-4 presents a simple table that outlines the digester selection process. Facility operators may use this table to determine which digester is best suited for the farm. This information should not be used in place of the FarmWare water use inventory worksheet.
Exhibit 4-3 Appropriate Manure Characteristics and Handling Systems for Specific Types of Biogas Digester Systems
SECOND EDITION4-4
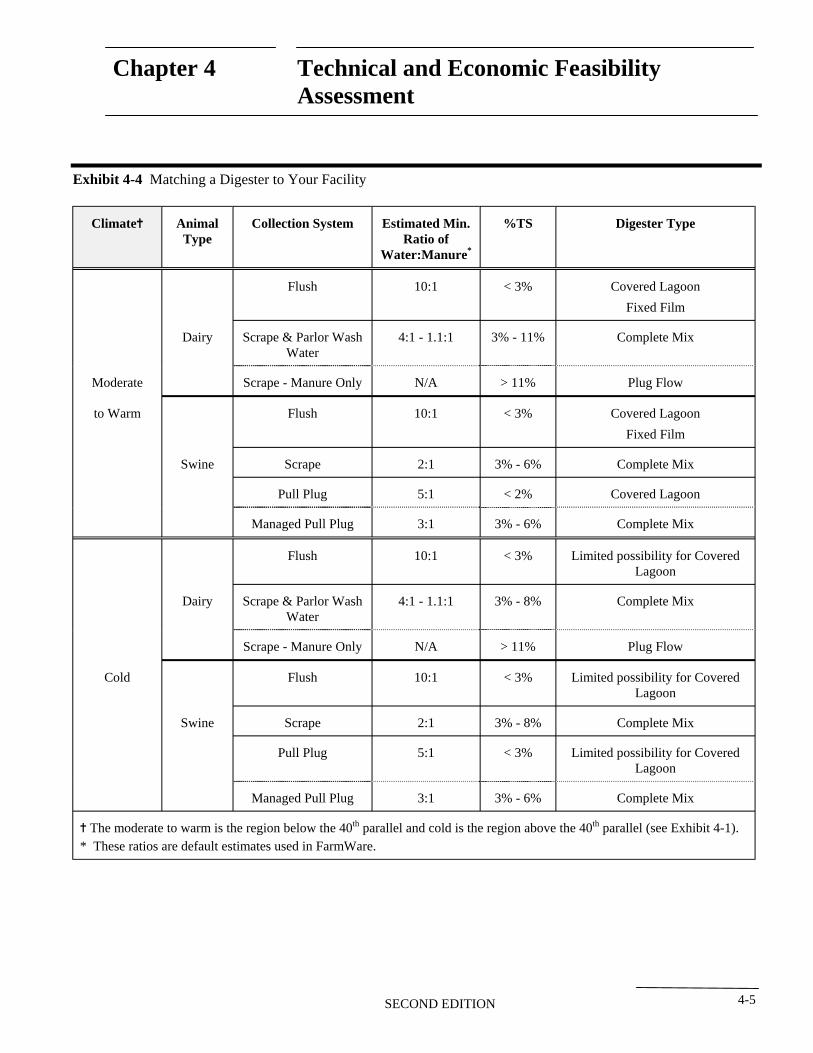
Chapter 4 Technical and Economic Feasibility Assessment
Exhibit 4-4 Matching a Digester to Your Facility
Climate^ Animal Type
Collection System Estimated Min. Ratio of
Water:Manure*
%TS Digester Type
Moderate
to Warm
Dairy
Flush 10:1 < 3% Covered Lagoon
Fixed Film
Scrape & Parlor Wash Water
Scrape - Manure Only
4:1 - 1.1:1
N/A
3% - 11%
> 11%
Complete Mix
Plug Flow
Swine
Flush 10:1 < 3% Covered Lagoon
Fixed Film
Scrape 2:1 3% - 6% Complete Mix
Pull Plug
Managed Pull Plug
5:1
3:1
< 2%
3% - 6%
Covered Lagoon
Complete Mix
Cold
Dairy
Flush 10:1 < 3% Limited possibility for Covered Lagoon
Scrape & Parlor Wash Water
Scrape - Manure Only
4:1 - 1.1:1
N/A
3% - 8%
> 11%
Complete Mix
Plug Flow
Swine
Flush 10:1 < 3% Limited possibility for Covered Lagoon
Scrape 2:1 3% - 8% Complete Mix
Pull Plug
Managed Pull Plug
5:1
3:1
< 3%
3% - 6%
Limited possibility for Covered Lagoon
Complete Mix
^ The moderate to warm is the region below the 40th parallel and cold is the region above the 40th parallel (see Exhibit 4-1). * These ratios are default estimates used in FarmWare.
SECOND EDITION 4-5
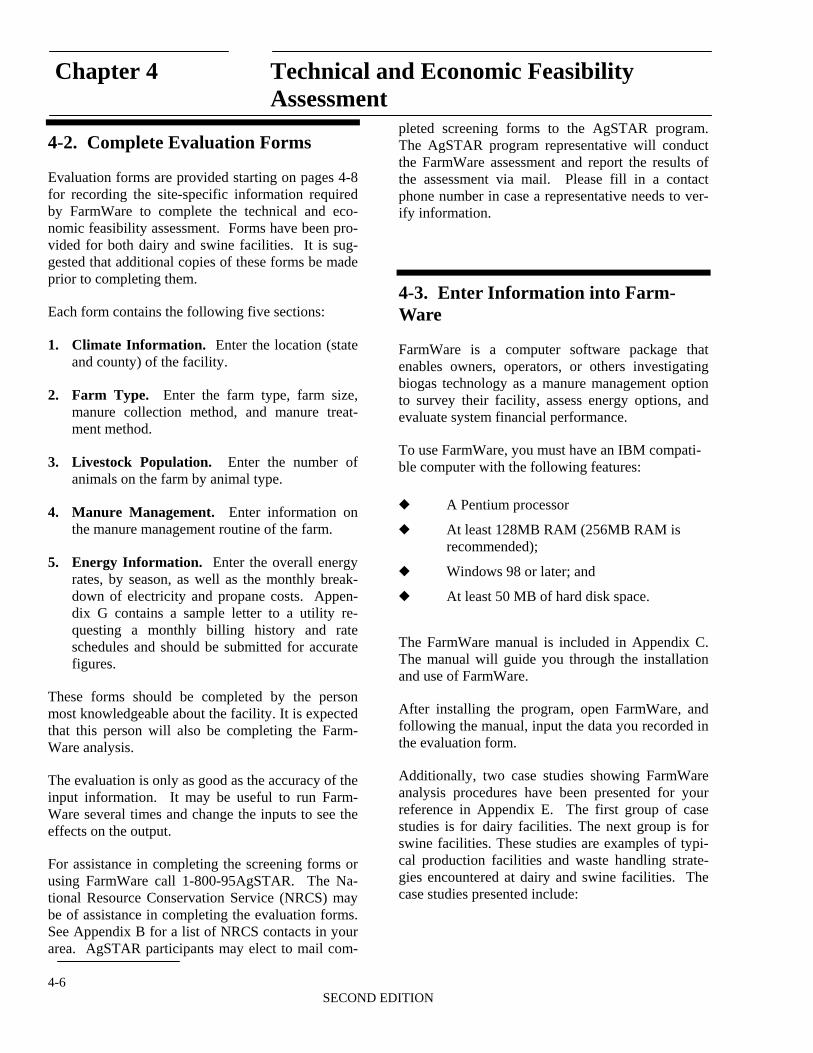
Chapter 4 Technical and Economic Feasibility Assessment
4-2. Complete Evaluation Forms
Evaluation forms are provided starting on pages 4-8 for recording the site-specific information required by FarmWare to complete the technical and economic feasibility assessment. Forms have been provided for both dairy and swine facilities. It is suggested that additional copies of these forms be made prior to completing them.
Each form contains the following five sections:
1. Climate Information. Enter the location (state and county) of the facility.
2. Farm Type. Enter the farm type, farm size, manure collection method, and manure treatment method.
3. Livestock Population. Enter the number of animals on the farm by animal type.
4. Manure Management. Enter information on the manure management routine of the farm.
5. Energy Information. Enter the overall energy rates, by season, as well as the monthly breakdown of electricity and propane costs. Appendix G contains a sample letter to a utility requesting a monthly billing history and rate schedules and should be submitted for accurate figures.
These forms should be completed by the person most knowledgeable about the facility. It is expected that this person will also be completing the Farm-Ware analysis.
The evaluation is only as good as the accuracy of the input information. It may be useful to run Farm-Ware several times and change the inputs to see the effects on the output.
For assistance in completing the screening forms or using FarmWare call 1-800-95AgSTAR. The National Resource Conservation Service (NRCS) may be of assistance in completing the evaluation forms. See Appendix B for a list of NRCS contacts in your area. AgSTAR participants may elect to mail com
pleted screening forms to the AgSTAR program. The AgSTAR program representative will conduct the FarmWare assessment and report the results of the assessment via mail. Please fill in a contact phone number in case a representative needs to verify information.
4-3. Enter Information into Farm-Ware
FarmWare is a computer software package that enables owners, operators, or others investigating biogas technology as a manure management option to survey their facility, assess energy options, and evaluate system financial performance.
To use FarmWare, you must have an IBM compatible computer with the following features:
— A Pentium processor
— At least 128MB RAM (256MB RAM is recommended);
— Windows 98 or later; and
— At least 50 MB of hard disk space.
The FarmWare manual is included in Appendix C. The manual will guide you through the installation and use of FarmWare.
After installing the program, open FarmWare, and following the manual, input the data you recorded in the evaluation form.
Additionally, two case studies showing FarmWare analysis procedures have been presented for your reference in Appendix E. The first group of case studies is for dairy facilities. The next group is for swine facilities. These studies are examples of typical production facilities and waste handling strategies encountered at dairy and swine facilities. The case studies presented include:
SECOND EDITION4-6
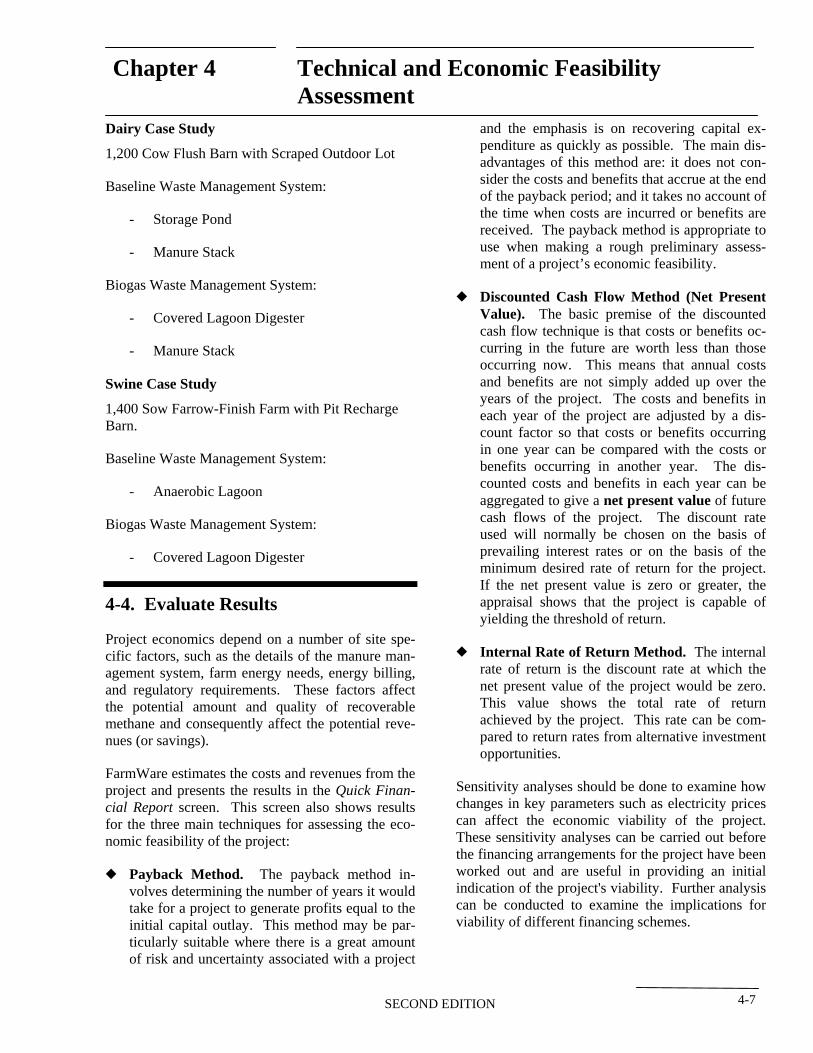
Chapter 4 Technical and Economic Feasibility Assessment
Dairy Case Study
1,200 Cow Flush Barn with Scraped Outdoor Lot
Baseline Waste Management System:
- Storage Pond
- Manure Stack
Biogas Waste Management System:
- Covered Lagoon Digester
- Manure Stack
Swine Case Study
1,400 Sow Farrow-Finish Farm with Pit Recharge Barn.
Baseline Waste Management System:
- Anaerobic Lagoon
Biogas Waste Management System:
- Covered Lagoon Digester
4-4. Evaluate Results
Project economics depend on a number of site specific factors, such as the details of the manure management system, farm energy needs, energy billing, and regulatory requirements. These factors affect the potential amount and quality of recoverable methane and consequently affect the potential revenues (or savings).
FarmWare estimates the costs and revenues from the project and presents the results in the Quick Financial Report screen. This screen also shows results for the three main techniques for assessing the economic feasibility of the project:
— Payback Method. The payback method involves determining the number of years it would take for a project to generate profits equal to the initial capital outlay. This method may be particularly suitable where there is a great amount of risk and uncertainty associated with a project
and the emphasis is on recovering capital expenditure as quickly as possible. The main disadvantages of this method are: it does not consider the costs and benefits that accrue at the end of the payback period; and it takes no account of the time when costs are incurred or benefits are received. The payback method is appropriate to use when making a rough preliminary assessment of a project’s economic feasibility.
— Discounted Cash Flow Method (Net Present Value). The basic premise of the discounted cash flow technique is that costs or benefits occurring in the future are worth less than those occurring now. This means that annual costs and benefits are not simply added up over the years of the project. The costs and benefits in each year of the project are adjusted by a discount factor so that costs or benefits occurring in one year can be compared with the costs or benefits occurring in another year. The discounted costs and benefits in each year can be aggregated to give a net present value of future cash flows of the project. The discount rate used will normally be chosen on the basis of prevailing interest rates or on the basis of the minimum desired rate of return for the project. If the net present value is zero or greater, the appraisal shows that the project is capable of yielding the threshold of return.
— Internal Rate of Return Method. The internal rate of return is the discount rate at which the net present value of the project would be zero. This value shows the total rate of return achieved by the project. This rate can be compared to return rates from alternative investment opportunities.
Sensitivity analyses should be done to examine how changes in key parameters such as electricity prices can affect the economic viability of the project. These sensitivity analyses can be carried out before the financing arrangements for the project have been worked out and are useful in providing an initial indication of the project's viability. Further analysis can be conducted to examine the implications for viability of different financing schemes.
SECOND EDITION 4-7
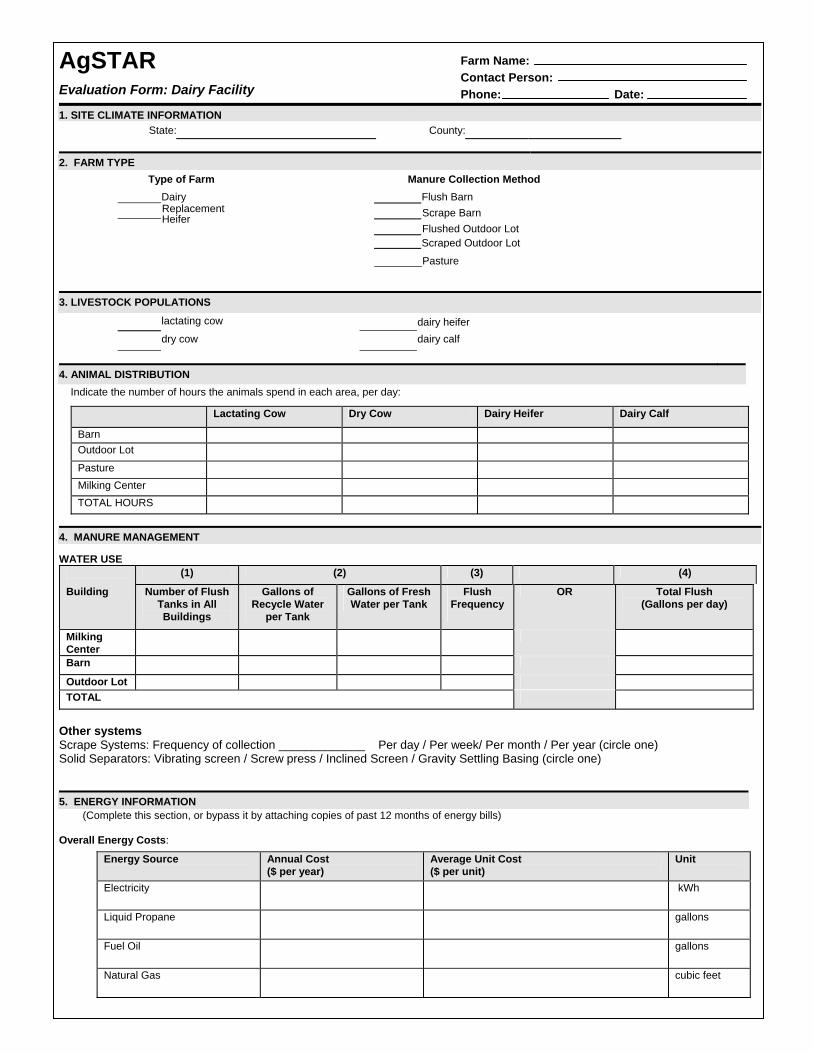
AgSTAR Evaluation Form: Dairy Facility
1. SITE CLIMATE INFORMATION State: County:
2. FARM TYPE Type of Farm Manure Collection Method
Dairy Flush Barn
Scrape Barn
Replacement Heifer
Flushed Outdoor Lot Scraped Outdoor Lot Pasture
3. LIVESTOCK POPULATIONS lactating cow dairy heifer
dry cow dairy calf
4. ANIMAL DISTRIBUTION
Indicate the number of hours the animals spend in each area, per day:
Lactating Cow Dry Cow Dairy Heifer Dairy Calf
Barn Outdoor Lot
Pasture Milking Center TOTAL HOURS
4. MANURE MANAGEMENT
WATER USE (1) (2) (3) (4)
Building Number of Flush Tanks in All Buildings
Gallons of Recycle Water
per Tank
Gallons of Fresh Water per Tank
Flush Frequency
OR Total Flush (Gallons per day)
Milking Center
Barn
Outdoor Lot TOTAL
Other systems Scrape Systems: Frequency of collection _____________ Per day / Per week/ Per month / Per year (circle one) Solid Separators: Vibrating screen / Screw press / Inclined Screen / Gravity Settling Basing (circle one)
5. ENERGY INFORMATION (Complete this section, or bypass it by attaching copies of past 12 months of energy bills) Overall Energy Costs:
Energy Source Annual Cost ($ per year)
Average Unit Cost ($ per unit)
Unit
Electricity kWh
Liquid Propane gallons
Fuel Oil gallons
Natural Gas cubic feet
Farm Name:Conta
ct Person:
Phone: Date:

Month Electric Liquid Propane Fuel Oil Natural Gas
Peak kW kWh Cost gals Cost gals Cost Cubic Feet Cost
January
February
March
April
May
June
July
August
September
October
November
December
6. HAVE YOU OBTAINED YOUR BILLING HISTORY AND RATE SCHEDULES? (See Appendix G for sample utility letter)
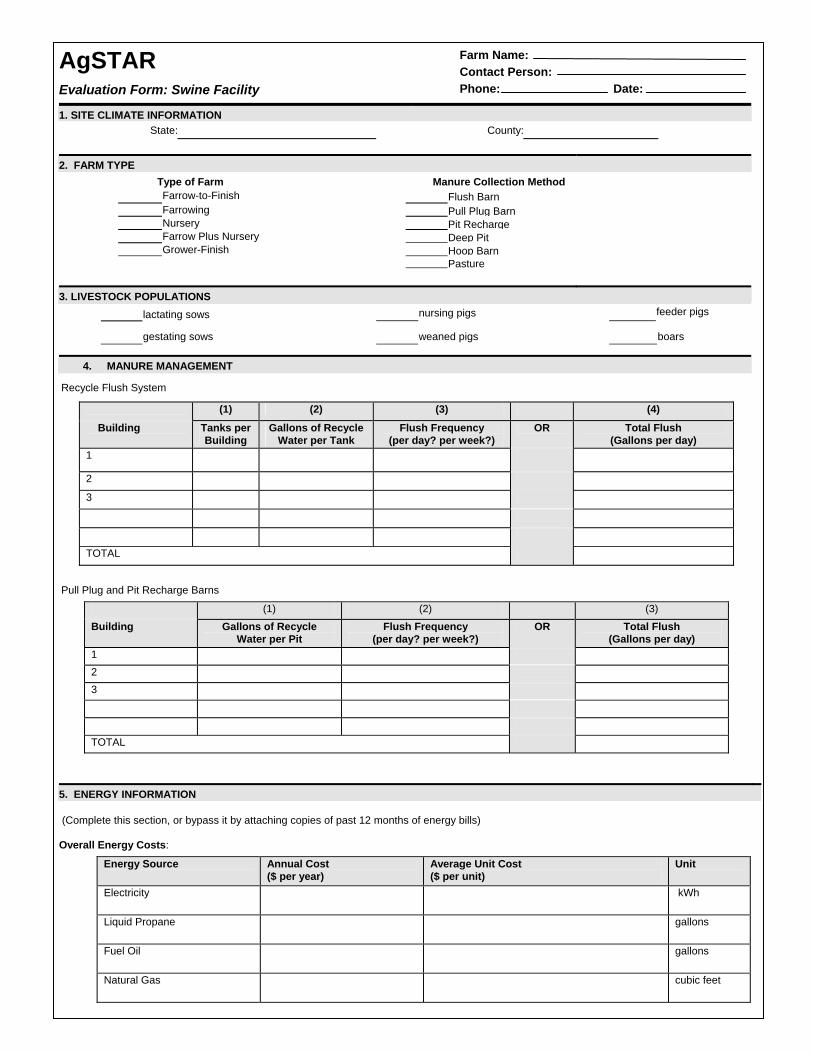
AgSTAR Evaluation Form: Swine Facility
1. SITE CLIMATE INFORMATION State: County:
2. FARM TYPE
Type of Farm Manure Collection Method Farrow-to-Finish Flush Barn
Farrowing Pull Plug Barn Nursery Pit Recharge Farrow Plus Nursery Deep PitGrower-Finish Hoop Barn Pasture
3. LIVESTOCK POPULATIONS lactating sows nursing pigs feeder pigs
gestating sows weaned pigs boars
4. MANURE MANAGEMENT
Recycle Flush System
Pull Plug and Pit Recharge Barns
(1) (2) (3)
Building Gallons of Recycle Water per Pit
Flush Frequency (per day? per week?)
OR Total Flush (Gallons per day)
1 2 3 TOTAL
(1) (2) (3) (4)
Building Tanks per Building
Gallons of Recycle Water per Tank
Flush Frequency (per day? per week?)
OR Total Flush (Gallons per day)
1
2
3
TOTAL
5. ENERGY INFORMATION (Complete this section, or bypass it by attaching copies of past 12 months of energy bills) Overall Energy Costs:
Energy Source Annual Cost ($ per year)
Average Unit Cost ($ per unit)
Unit
Electricity kWh
Liquid Propane gallons
Fuel Oil gallons
Natural Gas cubic feet
Farm Name:Conta
ct Person:
Phone: Date:
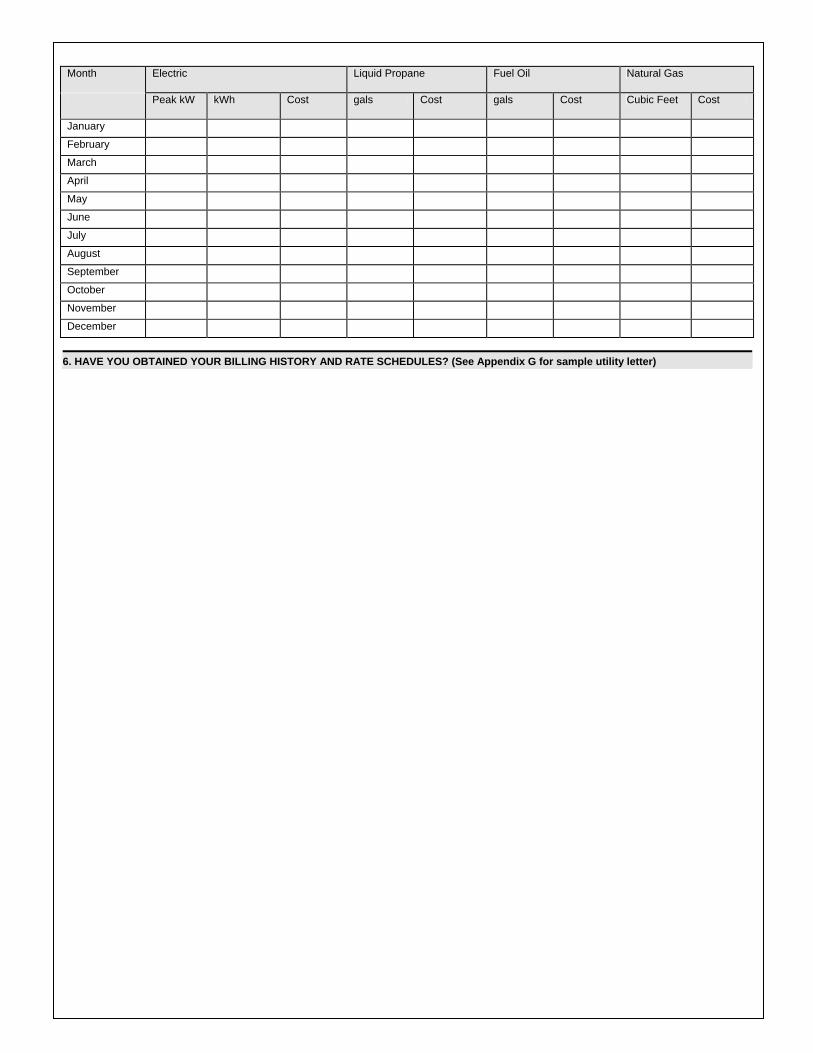
Month Electric Liquid Propane Fuel Oil Natural Gas
Peak kW kWh Cost gals Cost gals Cost Cubic Feet Cost
January
February
March
April
May
June
July
August
September
October
November
December
6. HAVE YOU OBTAINED YOUR BILLING HISTORY AND RATE SCHEDULES? (See Appendix G for sample utility letter)
Chapter 5 Securing an Energy Contract
Contents: 5-1. Operational Modes
5-1.1 Sale of Electricity to the Utility .........................................................1 Buy All - Sell All ..................................................................................2 Surplus Sale ..........................................................................................2 Net Metering .........................................................................................2
5-2. Interconnection Requirements 2
5-3. Whom to Contact 3
5-4. What to Ask For 3
5-5. Elements of an Energy Agreement
5-6. Why Negotiate and What to Watch Out For
5-6.1 Examples of Contract Elements that May Be Included and Must Be Identified and Renegotiated...............................................................4
5-6.2 Benefits to the Utility from Farm Biogas Systems ............................5
5-7. Transmission (Wheeling) Arrangements
SECOND EDITION 5-i
1
4
4
6
Chapter 5 Securing an Energy Contract
his chapter provides a guide to the issues in-Tvolved in negotiating a contract to operate a small biogas fired generator in parallel with a utility. When electrical production is the desired mode of operation, the utility contract is the most important issue affecting the profitability of a project.
While utilities are legally required to work with farm biogas electrical generators, there are no set industry rules or procedures that govern the process for small power producers (<250 kW), as most rules were developed for very large independent power producers (>1 MW). In general, utility rules apply to interconnection requirements, capacity guarantees, and energy payment/purchase rates. In the best of cases, some utilities have developed handbooks of procedures, specifications, options and draft contracts in an effort to provide small power producers with a standard contractual process. In these cases, the process is orderly and straightforward. In other cases, some utilities have dispersed responsibilities across a number of different groups within their organizational structure. These groups may include metering, rates, engineering, agricultural services, and others. In these cases, the process can become confusing, time consuming, and may present impediments to project development. Negotiation is an appropriate method to develop successful small power contracts, given the many approaches utilities may take toward these types of projects. Since contract negotiation is often a complex process, farm owner/operators and developers may want to consult an expert for information and guidance in this area.
Since the first edition of this handbook was written, deregulation has resulted in a major restructuring of electric utilities. Many utilities have sold their generating capacity to independent power producers and now purchase all the electricity delivered to their customers charging a fee for distribution. Theoretically, each customer has or will have choice as to the source of the electricity that they purchase. However, the progress toward total deregulation has varied among states and in some states there is only one choice, especially for residential customers. Conversely, customers in other states may have several options including a supplier that generates "green power" from a renewable resource such as biogas. As a source of green power, farms selling electricity produced using biogas may be able to receive a premium price for the electricity that they
sell to their local utility due to a higher rate structure for electricity generated from a renewable resource.
In Chapter 3, considerations of the types of generation arrangements were discussed. This chapter applies to farm biogas generators operating in parallel with a utility. Operating modes are described, utility contracts are discussed, and the utility contract process is presented.
5-1. Operational Modes
The key issue in developing a biogas recovery system is the value of the energy to the owner. A careful review of utility rates and interconnection requirements are necessary prior to selecting the operating mode. In addition, the owner or developer must realistically estimate the potential to generate electricity and analyze the farm’s monthly energy use and history. The analysis may show that the farm will make some surplus electricity or require more than it can produce. Once the potential sur-plus/shortfall situation is known, the following options may be considered. Not all utilities offer these options under these names.
5-1.1 Sale of Electricity to the Utility
In 1978, the Public Utilities Regulatory Policy Act (PURPA) required an electric utility to buy electricity from a power project, that is granted Qualifying Facility (QF) status by the Federal Energy Regulatory Commission (FERC). The electricity would be bought at the utilities’ current avoided cost rate. A power project is granted QF status as either a "small power producer" or a "qualifying cogenerator." PURPA prohibits utilities or utility holding companies from having more than 50 percent ownership in QF projects, and it stipulates size and fuel requirements as follows:
“Small Power Producer. Small power producers must be no more than 80 MW in size and must use a primary energy source of biomass, waste, renewable resources, or geothermal resources.”
Biogas fueled electricity generation qualifies by definition. However, because the avoided cost offered by utilities for purchasing power from QF’s,
SECOND EDITION 5-1
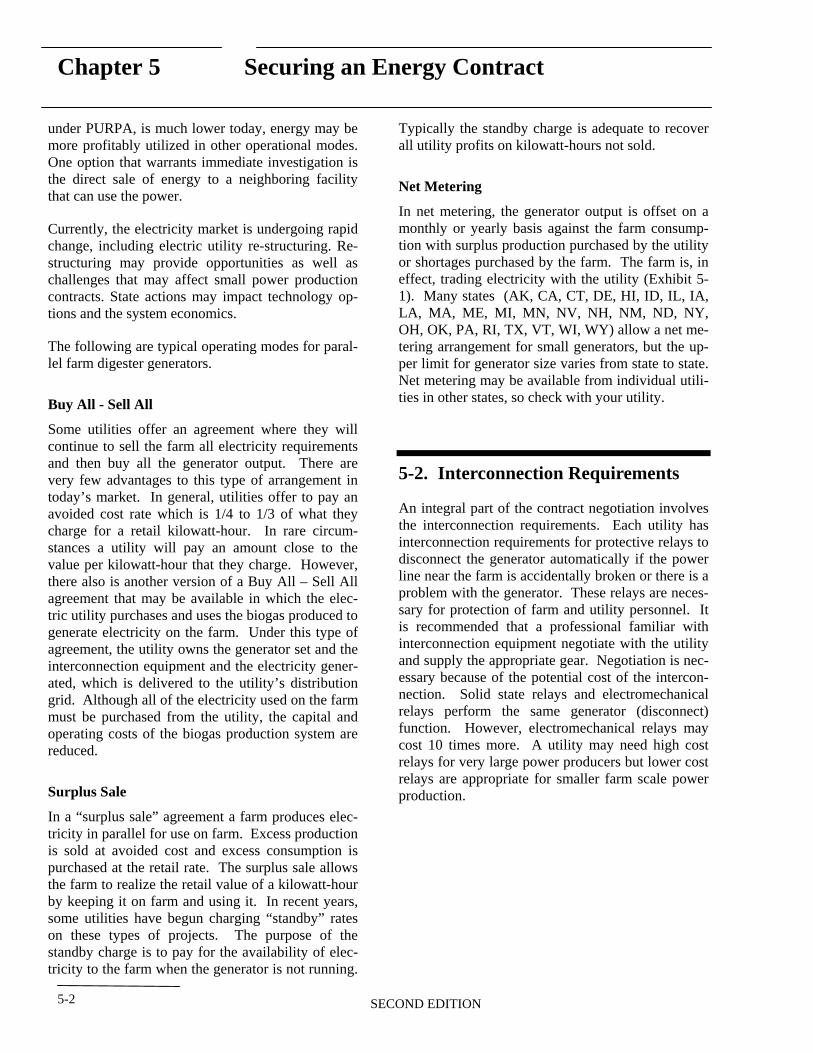
Chapter 5 Securing an Energy Contract
under PURPA, is much lower today, energy may be more profitably utilized in other operational modes. One option that warrants immediate investigation is the direct sale of energy to a neighboring facility that can use the power.
Currently, the electricity market is undergoing rapid change, including electric utility re-structuring. Restructuring may provide opportunities as well as challenges that may affect small power production contracts. State actions may impact technology options and the system economics.
The following are typical operating modes for parallel farm digester generators.
Buy All - Sell All
Some utilities offer an agreement where they will continue to sell the farm all electricity requirements and then buy all the generator output. There are very few advantages to this type of arrangement in today’s market. In general, utilities offer to pay an avoided cost rate which is 1/4 to 1/3 of what they charge for a retail kilowatt-hour. In rare circumstances a utility will pay an amount close to the value per kilowatt-hour that they charge. However, there also is another version of a Buy All – Sell All agreement that may be available in which the electric utility purchases and uses the biogas produced to generate electricity on the farm. Under this type of agreement, the utility owns the generator set and the interconnection equipment and the electricity generated, which is delivered to the utility’s distribution grid. Although all of the electricity used on the farm must be purchased from the utility, the capital and operating costs of the biogas production system are reduced.
Surplus Sale
In a “surplus sale” agreement a farm produces electricity in parallel for use on farm. Excess production is sold at avoided cost and excess consumption is purchased at the retail rate. The surplus sale allows the farm to realize the retail value of a kilowatt-hour by keeping it on farm and using it. In recent years, some utilities have begun charging “standby” rates on these types of projects. The purpose of the standby charge is to pay for the availability of electricity to the farm when the generator is not running.
Typically the standby charge is adequate to recover all utility profits on kilowatt-hours not sold.
Net Metering
In net metering, the generator output is offset on a monthly or yearly basis against the farm consumption with surplus production purchased by the utility or shortages purchased by the farm. The farm is, in effect, trading electricity with the utility (Exhibit 51). Many states (AK, CA, CT, DE, HI, ID, IL, IA, LA, MA, ME, MI, MN, NV, NH, NM, ND, NY, OH, OK, PA, RI, TX, VT, WI, WY) allow a net metering arrangement for small generators, but the upper limit for generator size varies from state to state. Net metering may be available from individual utilities in other states, so check with your utility.
5-2. Interconnection Requirements
An integral part of the contract negotiation involves the interconnection requirements. Each utility has interconnection requirements for protective relays to disconnect the generator automatically if the power line near the farm is accidentally broken or there is a problem with the generator. These relays are necessary for protection of farm and utility personnel. It is recommended that a professional familiar with interconnection equipment negotiate with the utility and supply the appropriate gear. Negotiation is necessary because of the potential cost of the interconnection. Solid state relays and electromechanical relays perform the same generator (disconnect) function. However, electromechanical relays may cost 10 times more. A utility may need high cost relays for very large power producers but lower cost relays are appropriate for smaller farm scale power production.
SECOND EDITION5-2
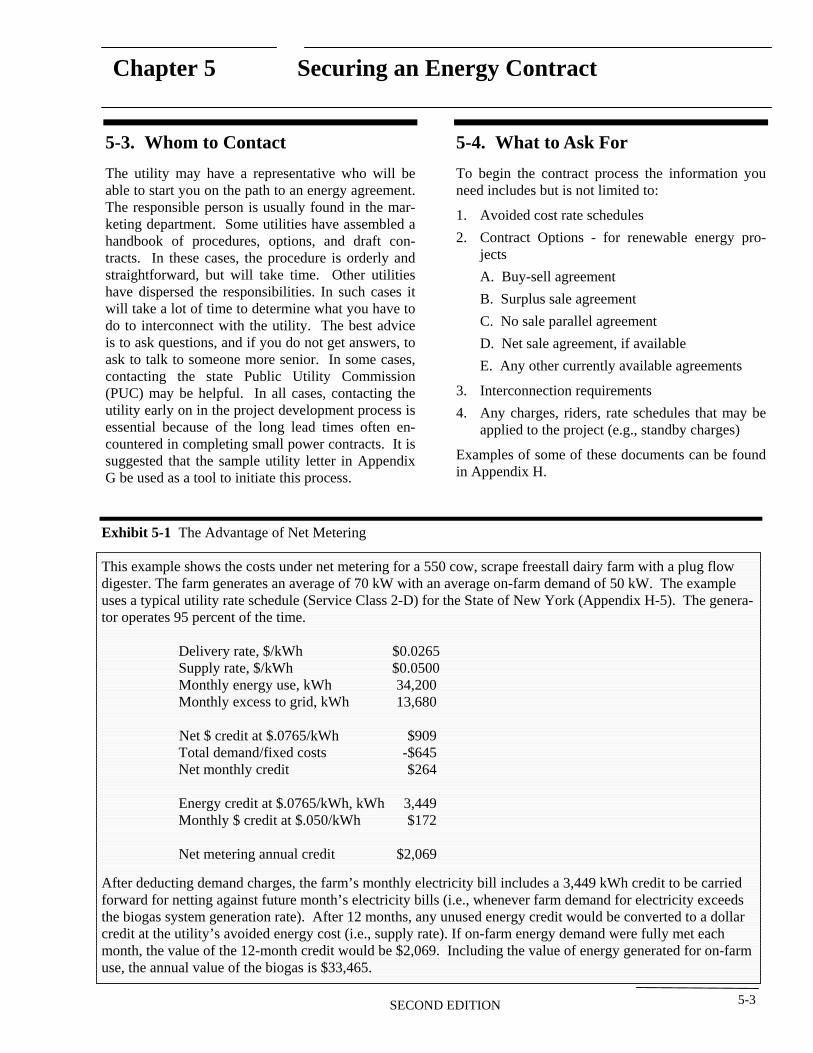
Chapter 5 Securing an Energy Contract
5-3. Whom to Contact
The utility may have a representative who will be able to start you on the path to an energy agreement. The responsible person is usually found in the marketing department. Some utilities have assembled a handbook of procedures, options, and draft contracts. In these cases, the procedure is orderly and straightforward, but will take time. Other utilities have dispersed the responsibilities. In such cases it will take a lot of time to determine what you have to do to interconnect with the utility. The best advice is to ask questions, and if you do not get answers, to ask to talk to someone more senior. In some cases, contacting the state Public Utility Commission (PUC) may be helpful. In all cases, contacting the utility early on in the project development process is essential because of the long lead times often encountered in completing small power contracts. It is suggested that the sample utility letter in Appendix G be used as a tool to initiate this process.
Exhibit 5-1 The Advantage of Net Metering
5-4. What to Ask For
To begin the contract process the information you need includes but is not limited to:
1. Avoided cost rate schedules
2. Contract Options - for renewable energy projects
A. Buy-sell agreement
B. Surplus sale agreement
C. No sale parallel agreement
D. Net sale agreement, if available
E. Any other currently available agreements
3. Interconnection requirements
4. Any charges, riders, rate schedules that may be applied to the project (e.g., standby charges)
Examples of some of these documents can be found in Appendix H.
The genera
$0.0265 $0.0500 34,200 13,680
Net $ credit at $.0765/kWh $909 -$645 $264
3,449 $172
$2,069
use, the annual value of the biogas is $33,465.
This example shows the costs under net metering for a 550 cow, scrape freestall dairy farm with a plug flow digester. The farm generates an average of 70 kW with an average on-farm demand of 50 kW. The example uses a typical utility rate schedule (Service Class 2-D) for the State of New York (Appendix H-5). tor operates 95 percent of the time.
Delivery rate, $/kWh Supply rate, $/kWh Monthly energy use, kWh Monthly excess to grid, kWh
Total demand/fixed costs Net monthly credit
Energy credit at $.0765/kWh, kWh Monthly $ credit at $.050/kWh
Net metering annual credit
After deducting demand charges, the farm’s monthly electricity bill includes a 3,449 kWh credit to be carried forward for netting against future month’s electricity bills (i.e., whenever farm demand for electricity exceeds the biogas system generation rate). After 12 months, any unused energy credit would be converted to a dollar credit at the utility’s avoided energy cost (i.e., supply rate). If on-farm energy demand were fully met each month, the value of the 12-month credit would be $2,069. Including the value of energy generated for on-farm
SECOND EDITION 5-3
Chapter 5 Securing an Energy Contract
5-5. Elements of an Agreement
A long-term contract is usually favored to ensure revenues for projects, and is usually required to obtain financing. However, review short and medium term options to be sure to choose the most beneficial options to the project. Many utilities have a standard offer contract for qualifying facilities such as farm-scale anaerobic digesters.
The entire contract offered by a utility should be carefully reviewed by the project developer and legal counsel to ensure that each of the terms is acceptable. If they are not, a more acceptable, revised version of the contract should be presented to the utility for negotiation. The details of the agreements are crucial to limiting issues that may adversely impact the system in the future.
Primary contract considerations include:
— Term. The contract term should be sufficient to support financing and/or the life of the project. A satisfactory term is usually 15 years or more.
— Termination. Grounds for contract termination should be very limited in order to protect the long-term interests of all parties.
— Assignment. The contract should consider assignment for purposes such as financing. For example, allowing for contract assignment to heirs or to partners may be advisable to avoid ownership arrangement difficulties.
— Force Majeure. Situations that constitute force majeure (e.g., storms, acts of war) should be agreed upon, otherwise this clause could be used to interrupt operations or payment.
— Schedule. There should be some flexibility allowed for meeting milestone dates and extensions (e.g., in penalty provisions such as nonperformance). This is necessary in case unforeseen circumstances cause delays.
— Price. The contract price should ensure the long-term viability of the project, which means that accounting for potential cost escalation through the contract term will be very important.
5-6. Why Negotiate and What to Watch Out For
Negotiating is a difficult task and only experience can help. Patience and common sense are virtues. If a contract clause request seems unreasonable, it might be negotiable. However, remember that power contract agreements are binding with the utility, and therefore any changes or agreements need to be in writing.
Utility contracts or standard offers tend to have one or more unique clauses that must be recognized as potentially costly to the project. Some standard offers are developed for certain QF’s and then applied to all projects. This is fine if the contract was developed for a small cogenerator, but can be fatal to a small project if the standard clauses were developed for a 2 MW steam turbine project. Some unfavorable clauses from some utility standard offers are summarized below as examples. The owner/developer should be aware that these and other clauses might exist. At a minimum, the financial impact of these clauses on the project, must be fully assessed. Where clauses appear to be unreasonable, they should be renegotiated.
5-6.1 Examples of Contract Elements that May Be Included and Must Be Identified and Renegotiated
These include:
— Change in the farm retail rate. The utility may mandate a new retail rate for a farm with biogas cogeneration. A change in rate affects project financial performance, and must be accounted for in the project’s financial analysis.
— Standby charges. Standby charges may be applied to the project by the utility. Standby or “backstand” charges typically are rate schedules or riders that add additional charges to the project. Utilities levy these charges on customers that purchase power on an intermittent or ‘as needed’ basis, such as those using a farm-scale biogas system. These charges need to be carefully evaluated in terms of their financial im-
SECOND EDITION5-4
Chapter 5 Securing an Energy Contract
pacts on the project, in relation to the expected engine generator performance.
— Interconnection requirements. The Federal Energy Regulatory Commission (FERC) proposed expedited grid-connection procedures for smaller generators, such as digester electricity projects to help standardize the interconnection process and make it less of a burden. Appendix H contains the proposed rules. It is recommended that project developers contact their local utility early in the process to discuss interconnection requirements.
— Insurance Requirements. Liability insurance is a requirement for any project. Most farms have adequate insurance for the operation that will also cover the digester with minimal additional premium. Some utilities have asked farms to add the utility to the policy and to increase the limits of the insurance to levels higher than any farm insurance carrier normally writes.
— Monitoring and Reporting. Some utility companies have clauses requiring such things as hourly reporting of generator output and thermal heat use. They are designed to ensure that natural gas cogenerators meet PURPA thresholds. Such requirements are generally not necessary for a farm digester, and should be renegotiated.
— Telemetry. Some contracts can mandate direct control of the farm generator from the utility power management center, via a leased phone line. This is excessive for small power contracts and is an example of applying large power production specifications to small power producers.
— Construction of the Interconnection. Some utilities prohibit cogenerators from supplying their own equipment. This action can add costs to the project that can affect financial performance. This is another example of applying large power production specifications to small power producers.
The farm has to be careful in rate analysis because “high” demand charges can negate half the value of the electricity produced. “Demand” is usually the highest rate of electricity consumption for 15 minutes during the month. To offset demand charges, a
generator must achieve 99.6% operation. Some utilities offer a “backup” or “standby” charge that is usually a lower fee than a demand charge. Farm-Ware can be used to evaluate these financial impacts.
5-6.2 Benefits to the Utility from Farm Biogas Systems
When working with a utility, it is important to remember that these projects can also meet their needs and to emphasize how successful implementation of the project will benefit both parties. For example, there are several non-monetary benefits to a utility from a farm anaerobic digester generator that utilities should consider in project negotiations, including:
1. Customer Retention. A digester may allow a farm to continue in business and continue purchasing some of its electricity needs, when a methane recovery system eliminates odor problems with neighbors.
2. Demand Reduction. Most utilities try to manage the peak demand by demand side management programs that reward customers for not using electricity during peak demand times. A digester generator reduces farm demand for utility power meeting the management goal.
3. Voltage Support. Where farms are near the end of utility transmission laterals, the generator supports the line voltage, keeping it from fluctuating. This saves the utility the cost of providing voltage support or paying for burned out motors.
4. Deferred Capital Expenditures. In rural areas, a digester generator (distributed generation) provides a remote generation source. It can delay the need for increasing system capacity and defer expenditures for conductors and substations, by supplying electricity at the point of use.
5. Greenhouse Gas Reductions. Several utilities have joined the Climate Leaders Program to reduce emissions of greenhouse gases. Methane recovery from animal wastes and combustion reduces its atmospheric effects. The recovery of
5-5SECOND EDITION
Chapter 5 Securing an Energy Contract
one pound of methane is the same as reducing carbon dioxide emissions by 21 pounds. By encouraging biogas production and its use to generate electricity, the utility objectives to reduce greenhouse gas emissions are advanced without capital expenditures.
6. Renewable Portfolio Standards. A Renewable Portfolio Standard (RPS) requires that a minimum amount of renewable energy is included in the portfolio of electricity resources serving a particular area. Utility purchases of electricity from biogas projects may help meet these RPS requirements.
5-7. Transmission (Wheeling) Arrangements
Another option for producing revenue from biogas generated electricity is the direct sale to a third party using the local utility transmission lines. This strategy may be possible if the local utility is required to enter into a long-term contract to deliver or “wheel” electricity from other generators at a reasonable price. Also, farms with more than one site may be able to wheel surplus electricity via the local utility lines to their other locations. Wheeling could produce more revenue than the sale of surplus electricity to the local electric utility or may be an option if an acceptable long-term purchase agreement cannot be negotiated with the local utility. Before considering wheeling, contact the Public Utility Commission to determine if electric utilities in the state are required to wheel electricity generated by small power producers.
SECOND EDITION5-6
Chapter 6 Selecting a Consultant/Developer/ Partner
Contents: 6-1. The Do-It-Yourself/Turn-key Decision
6-2. Selecting a Consultant/Consulting Firm
6-3. Selecting a Turn-Key Developer
6-4. Selecting a Partner
6-5. Preparing a Contract
List of Exhibits: Exhibit 6-1 The Developer Selection Process……………………………….2 Exhibit 6-2 Project Development Tasks..........................................................3
Exhibit 6-3 Elements of a Consultant Contract...............................................6
SECOND EDITION 6-i
1
4
4
4
5
Chapter 6 Selecting a Consultant/Developer/Partner
his chapter provides a guide to selecting a con-Tsultant, turn-key developer, or partner.
The selection of a consultant or developer is a critical decision. The farm owner often relies on the consultant or developer to manage the process of transforming a feasible idea into a functioning facility. Some owners have the expertise, resources, and desire to lead the development effort on their own, but even in this case, choosing the right consultant can greatly improve the likelihood of project success. This chapter provides guidance to owners who are attempting to determine: (1) the role that they might take in the development process; (2) the right consultant to get the project developed, financed, and built; and (3) if an investment partner would be advisable.
From the owner's perspective, there are three general ways to structure the development of a biogas project:
1. Owner-Builder. Farm owner hires a consultant, plans and manages the design-construction effort, and maintains ownership control of the project. This approach maximizes economic returns to the owner, but also places most of the project risks on the owner (e.g., construction, equipment performance, financial performance).
2. Purchase Turn-Key Project. Owner selects a qualified development company to provide the owner with a "turn-key" digester plant, which is built by the developer but owned by the farm owner.
The “turn-key” digester plant option requires expertise in developing the following areas: (1) Digester; (2) Gas Handling; (3) Engines; (4) Utility Interconnection; and (5) Utility Rates.
3. Team With a Partner: Owner teams with an equipment vendor, engineering/procurement /construction (EPC) firm or investor to develop the project and to share the risks and financial returns.
With these structures in mind, a farm owner can determine his or her desired role in the project development process by considering two key questions:
— Should the owner self-develop, buy a turn-key project, or find a partner?
— If a partner is desired, what kind of partner best complements the owner and the project?
The owner can answer the first question by conducting a frank examination of his or her own expertise, objectives, and resources. The second question is more complicated because it entails an assessment of the owner's specific needs and a search for the right partner to complement those needs.
Appendix I provides a list of suppliers, vendors, and EPC firms.
Exhibit 6-1 illustrates the process of determining the best development approach. As it indicates, in cases where the owner wants to be involved in the project development process, a number of issues must be considered. These issues are discussed in the following sections.
6-1. The Do-It-Yourself/Turn-key Decision
Before deciding whether to develop the project internally, the owner must understand the tasks involved in a project, which are outlined in Exhibit 6-2.
Next, an assessment of the owner's objectives, expertise, and resources determines whether or not the owner should undertake project development independently or try to find a turn-key developer.
SECOND EDITION 6-1
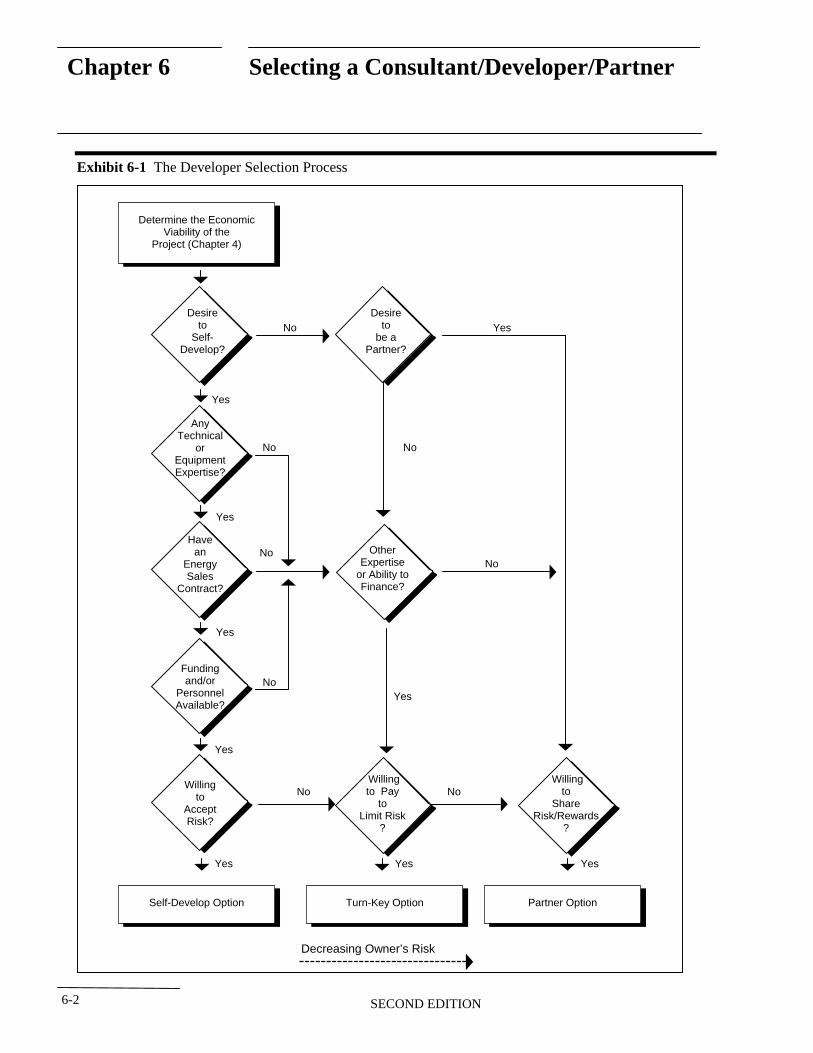
Chapter 6 Selecting a Consultant/Developer/Partner
Exhibit 6-1 The Developer Selection Process
Determine the Economic
Project (Chapter 4)
No
Desire to
Self-Develop?
Any Technical
or Equipment Expertise?
Have an
Energy Sales
Contract?
Funding and/or
Personnel Available?
Willing to
Accept Risk?
Self-Develop Option
Desire to
be a Partner?
Other Expertise
Finance?
Willing to
Share
?
NoNo
No
No
No
No
Partner Option
Willing to Pay
to Limit Risk
?
No
Viability of the
Yes
or Ability to
Risk/Rewards
Yes
Yes
Yes
Decreasing Owner’s Risk
Yes
Yes
Yes
Turn-Key Option
Yes
Yes
SECOND EDITION 6-2
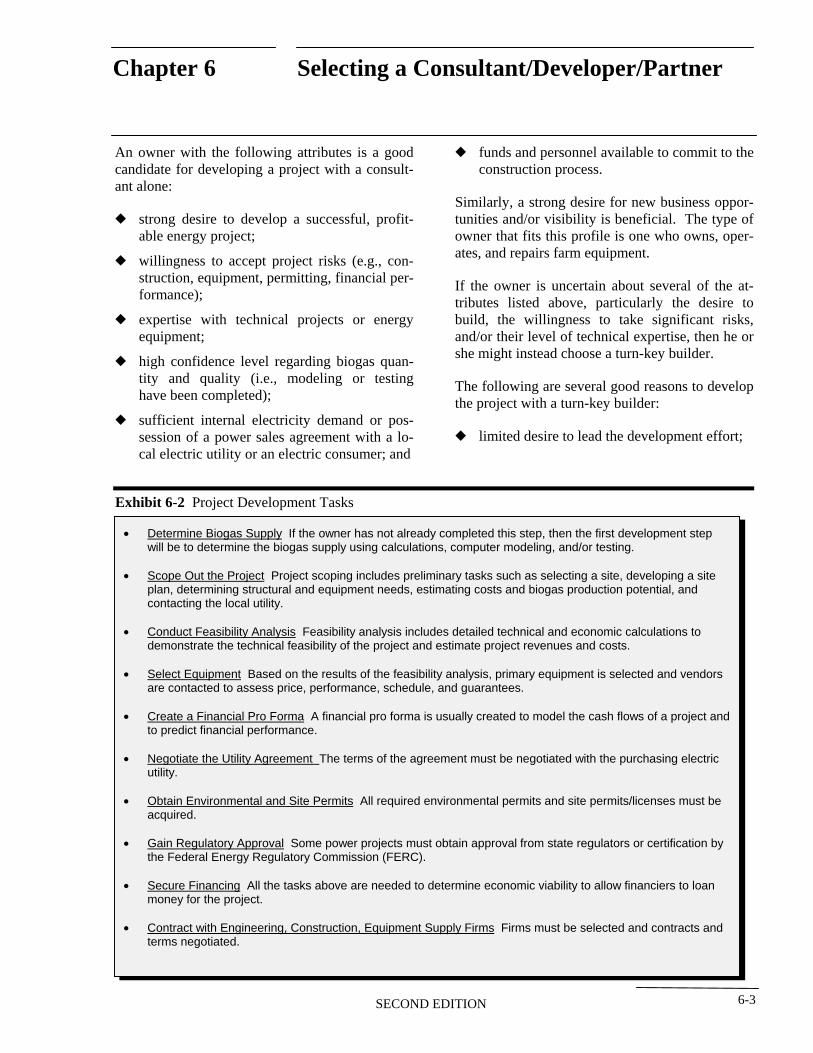
Chapter 6 Selecting a Consultant/Developer/Partner
An owner with the following attributes is a good candidate for developing a project with a consultant alone:
— strong desire to develop a successful, profitable energy project;
— willingness to accept project risks (e.g., construction, equipment, permitting, financial performance);
— expertise with technical projects or energy equipment;
— high confidence level regarding biogas quantity and quality (i.e., modeling or testing have been completed);
— sufficient internal electricity demand or possession of a power sales agreement with a local electric utility or an electric consumer; and
Exhibit 6-2 Project Development Tasks
— funds and personnel available to commit to the construction process.
Similarly, a strong desire for new business opportunities and/or visibility is beneficial. The type of owner that fits this profile is one who owns, operates, and repairs farm equipment.
If the owner is uncertain about several of the attributes listed above, particularly the desire to build, the willingness to take significant risks, and/or their level of technical expertise, then he or she might instead choose a turn-key builder.
The following are several good reasons to develop the project with a turn-key builder:
— limited desire to lead the development effort;
• Determine Biogas Supply
• Scope Out the Project
•
• Select Equipment
• Create a Fito predict financial performance.
• ith the purchasing electric
• Obtain Environmental and Site Permitsacquired.
•
• Secure Financing
• Contract wi irms Firms must be selected and contracts and terms negotiated.
If the owner has not already completed this step, then the first development step will be to determine the biogas supply using calculations, computer modeling, and/or testing.
Project scoping includes preliminary tasks such as selecting a site, developing a site plan, determining structural and equipment needs, estimating costs and biogas production potential, and contacting the local utility.
Conduct Feasibility Analysis Feasibility analysis includes detailed technical and economic calculations to demonstrate the technical feasibility of the project and estimate project revenues and costs.
Based on the results of the feasibility analysis, primary equipment is selected and vendors are contacted to assess price, performance, schedule, and guarantees.
nancial Pro Forma A financial pro forma is usually created to model the cash flows of a project and
Negotiate the Utility Agreement The terms of the agreement must be negotiated wutility.
All required environmental permits and site permits/licenses must be
Gain Regulatory Approval Some power projects must obtain approval from state regulators or certification by the Federal Energy Regulatory Commission (FERC).
All the tasks above are needed to determine economic viability to allow financiers to loan money for the project.
th Engineering, Construction, Equipment Supply F
SECOND EDITION 6-3
Chapter 6 Selecting a Consultant/Developer/Partner
— limited technical resources and/or experience;
— need to share or avoid specific project risks;
— difficulty financing the project alone;
— inability to dedicate personnel or time to the development effort;
— project development outside the scope of organization.
The questions in Exhibit 6-1 illustrate other critical considerations in making the owner-builder/turn-key decision. Most owners choose self build with consultant or turn-key options.
6-2. Selecting a Consulting Firm
Once the decision to self build with a consultant has been made, the owner should review the capabilities of individual consulting firms that meet the owner's general needs. When selecting a consultant, there are several qualities and capabilities that owners should look for, including:
— previous biogas project experience;
— a successful project track record; and
— in-house resources (e.g., engineering, finance, operation) including experience with environmental permitting and community issues.
Information about individual firm qualifications can be gained from reports, brochures, and project descriptions, as well as from discussions with references, other owners, and engineers. Potential warning signs include: lawsuits, disputes with owners, lack of operating projects and failed projects (although a few failed efforts and/or underperforming projects can normally be found in the portfolio of any consultant). Published information can be obtained by researching trade literature, through legal information services, and through computer research services.
6-3. Selecting a Turn-Key Developer
Selecting a turn-key developer to manage the development process is a good way for the owner to shed development responsibility and risks, and get the project built at a guaranteed cost. In addition, the developer typically provides the owner with the strongest development skills and experience. Other reasons for selecting a turn-key developer include:
— the developer's skills and experience may be invaluable in bringing a successful project online and keeping it operational; and
— some developers have access to financing.
In return for accepting project risks, most turn-key projects cost more than self built systems. The turn-key option is a good approach if the owner does not want the risk and responsibility of construction. In a turn-key approach, the developer assumes development responsibility and construction risk, builds the facility, and then receives payment when the facility is complete and performing up to specifications. The turn-key approach enables each entity to contribute what it does best: the developer accepts development, construction, and performance risk; and the owner accepts financial performance risk.
6-4. Selecting a Partner
A partner reduces risks to the owner by bearing or sharing the responsibilities of project development, although the amount of risk reduction provided depends on the type of partner chosen.
Selecting a partner who is not a developer is a good choice if two key conditions exist:
SECOND EDITION6-4
Chapter 6 Selecting a Consultant/Developer/Partner
1. The owner wants to keep management control of the project and has sufficient in-house expertise and resources to do so; and,
2. The partner can fulfill a specific role or provide equipment for the project.
In this case, the owner must have a clear desire to manage the development process and should have sufficient technical experience, personnel, and funds to support the effort. The owner should also have a relatively high confidence level regarding biogas production capability, as well as a willingness to accept a significant share of the project's risks (e.g., financial, environmental permitting, community acceptance).
There are three basic types of firms that may enter into partnership agreements with owners: equipment vendors, EPC firms, and investors. Each of these firms has different strengths and will assume different types of project risk. The key characteristics of these types of firms are summarized below.
— Equipment Vendors. Some equipment vendors such as engine manufacturers become partners in energy projects, including biogas projects, as a way to support the sale of equipment and services to potential customers. Equipment vendors may assist in financing the project, and may be willing to accept the equipment performance risk over a specified length of time for the equipment that they provide. However, equipment vendors typically do not take on responsibilities beyond their equipment services, and they generally want to recover their interest in a project as quickly as possible after the project has been built.
— EPC Firms. Similarly, some of the biogas EPC firms may become partners in biogas power projects with the objective of selling services and gaining a return on equity and/or time invested. However, this type of partner tends primarily to pursue large projects (i.e., >1 MW) where the EPC's strength as a man
ager of large, complex projects is more valuable.
— Investment Firm. Finally, an individual or investment company might become a partner in the biogas project if it has significant use for any available tax credits, or if the project has an attractive rate of return on investment.
6-5. Preparing a Contract
Once the firm has been selected, the terms of the agreement should be formalized in a contract. The contract should accomplish several objectives, including allocating risk among project participants. Some of the key elements of a contract are listed in Exhibit 6-3.
As Exhibit 6-3 indicates, contracting with a developer or partner in a biogas energy project can be a complex issue. Each contract will be different depending on the specific nature of the project and the objectives and limitations of the participants. Because of this complexity, the owner may wish to hire a qualified attorney to prepare and review the contract.
SECOND EDITION 6-5
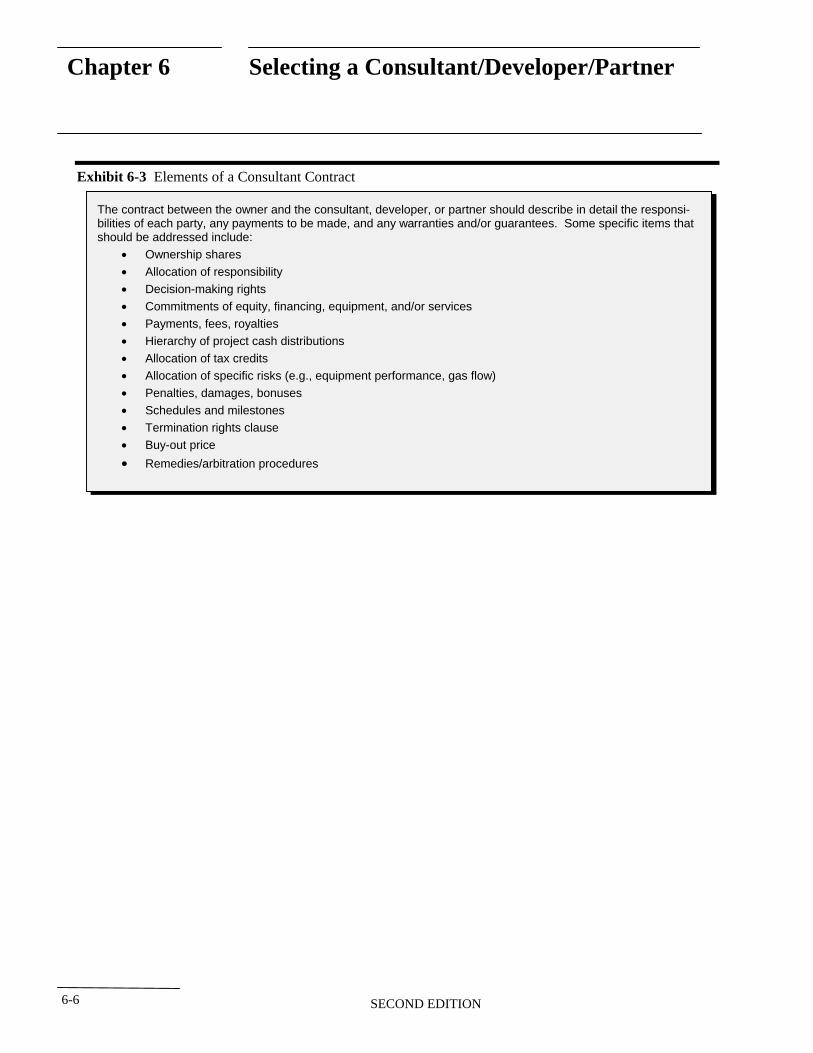
Chapter 6 Selecting a Consultant/Developer/Partner
Exhibit 6-3 Elements of a Consultant Contract
should be addressed include:
• • Allocation of responsibility
• Decision-making rights
• • • • Allocation of tax credits
• • Penalties, damages, bonuses
• Schedules and milestones
• • • Remedies/arbitration procedures
The contract between the owner and the consultant, developer, or partner should describe in detail the responsibilities of each party, any payments to be made, and any warranties and/or guarantees. Some specific items that
Ownership shares
Commitments of equity, financing, equipment, and/or services
Payments, fees, royalties
Hierarchy of project cash distributions
Allocation of specific risks (e.g., equipment performance, gas flow)
Termination rights clause
Buy-out price
SECOND EDITION 6-6
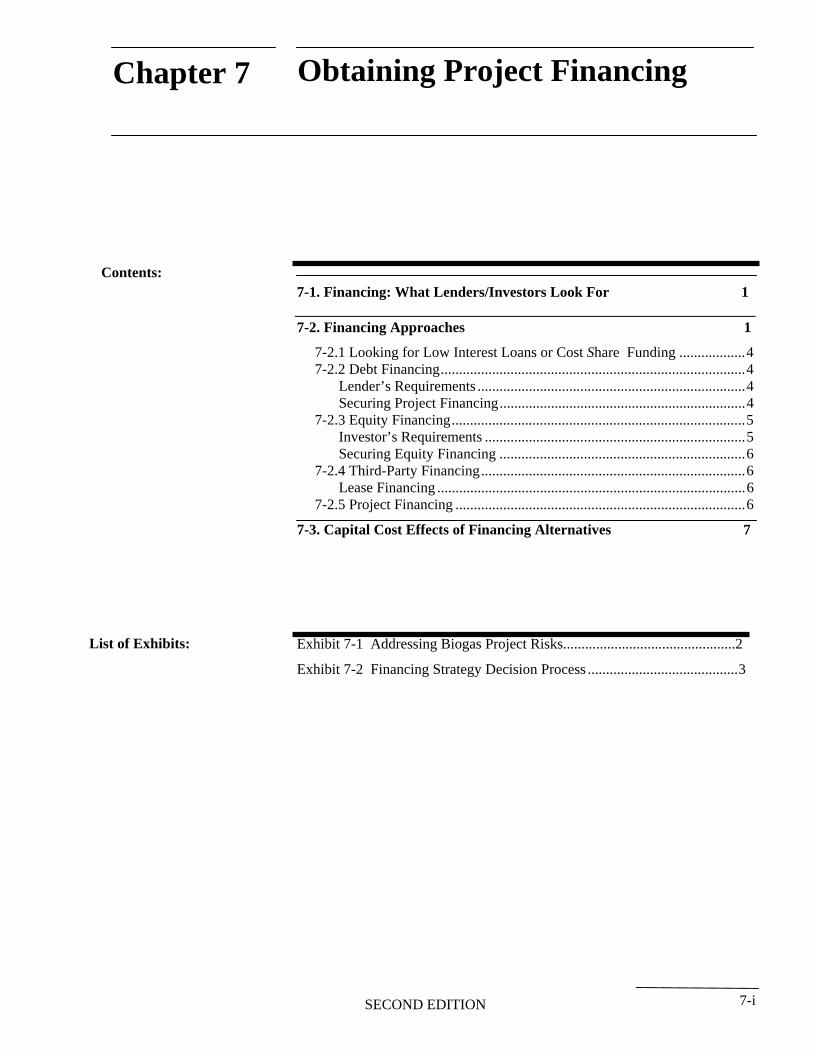
Chapter 7 Obtaining Project Financing
Contents: 7-1. Financing: What Lenders/Investors Look For
7-2. Financing Approaches
7-2.1 Looking for Low Interest Loans or Cost Share Funding ..................4 7-2.2 Debt Financing...................................................................................4
Lender’s Requirements .........................................................................4 Securing Project Financing...................................................................4
7-2.3 Equity Financing................................................................................5 Investor’s Requirements .......................................................................5
Securing Equity Financing ...................................................................6 7-2.4 Third-Party Financing........................................................................6
Lease Financing ....................................................................................6 7-2.5 Project Financing ...............................................................................6
7-3. Capital Cost Effects of Financing Alternatives
List of Exhibits: Exhibit 7-1 Addressing Biogas Project Risks...............................................2
Exhibit 7-2 Financing Strategy Decision Process .........................................3
SECOND EDITION 7-i
1
1
7
Chapter 7 Obtaining Project Financing
his chapter provides a guide to obtaining project Tfinancing and provides some insights into what lenders and investors look for. It is assumed that the farm owner has experience borrowing money from banks or other agricultural lenders, and has first discussed financing a biogas system with their own lender.
This chapter discusses alternative financing methods, some advantages and disadvantages of each method, and some potential sources for financing.
The following general categories of project financing avenues may be available to biogas projects:
— waste management cost sharing or renewable energy loan/grant programs,
— debt financing,
— equity financing,
— third-party financing, and
— project financing.
Federal cost sharing or state energy low interest loans or partial grants may be available for anaerobic digester projects. Debt financing is probably the most common method used for funding agricultural biogas projects. Equipment leasing, one method of third-party financing is used occasionally. Equity financing other than by the owner is rarely used, while project financing has never been used, but may be available to very large projects in the future.
7-1. Financing: What Lend-ers/Investors Look For
Lenders and investors will decide to finance a biogas project based upon its expected financial performance and risks. Financial performance is usually evaluated using a pro forma model of project cash flows as discussed in Chapter 4. FarmWare, when properly used, can provide financial performance information for securing financing.
A lender or investor usually evaluates the financial strength of a potential project using the two following measures:
— Debt Coverage Ratio: The main measure of a project’s financial strength is the farm’s ability to adequately meet debt payments. Debt-coverage is the ratio of operating income to debt service requirements, usually calculated on an annual basis.
— Owner's Rate of Return (ROR) on Equity: If a digester system is essential to continuation of farm operations, a break-even project is very satisfactory to the owner. However, banks or other lenders currently prefer to see a ROR between 12% and 18% for most types of projects. Outside investors will typically expect a ROR of 15% to 20% or more.
Exhibit 7-1 summarizes the project risk categories, viewed from the lender's perspective. The most important actions to control risks are to obtain contracts securing project construction costs and revenues. Potential investors and lenders will look to see how the farm owner or project developer has addressed risks through contracts, permitting actions, project structure, or financial strategies.
7-2. Financing Approaches
This section briefly discusses funding resources for digester projects and the means of securing financing from the five sources listed above. The use of third-party financing is briefly discussed. The advantages and disadvantages of each approach are also discussed. Exhibit 7-2 is a flow chart summarizing the decision process for selecting the appropriate source of financing.
SECOND EDITION 7-1
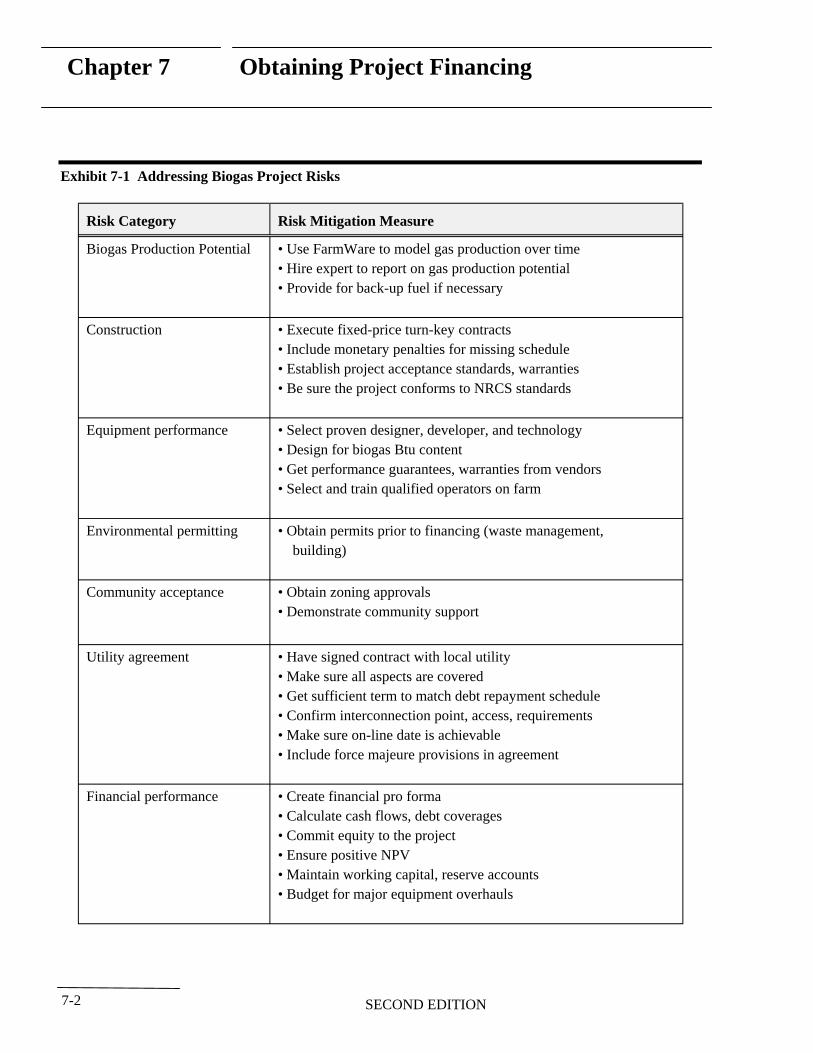
Chapter 7 Obtaining Project Financing
Exhibit 7-1 Addressing Biogas Project Risks
Risk Category Risk Mitigation Measure
Biogas Production Potential • Use FarmWare to model gas production over time • Hire expert to report on gas production potential • Provide for back-up fuel if necessary
Construction • Execute fixed-price turn-key contracts • Include monetary penalties for missing schedule • Establish project acceptance standards, warranties • Be sure the project conforms to NRCS standards
Equipment performance • Select proven designer, developer, and technology • Design for biogas Btu content • Get performance guarantees, warranties from vendors • Select and train qualified operators on farm
Environmental permitting • Obtain permits prior to financing (waste management, building)
Community acceptance • Obtain zoning approvals • Demonstrate community support
Utility agreement • Have signed contract with local utility • Make sure all aspects are covered • Get sufficient term to match debt repayment schedule • Confirm interconnection point, access, requirements • Make sure on-line date is achievable • Include force majeure provisions in agreement
Financial performance • Create financial pro forma • Calculate cash flows, debt coverages • Commit equity to the project • Ensure positive NPV • Maintain working capital, reserve accounts • Budget for major equipment overhauls
SECOND EDITION 7-2
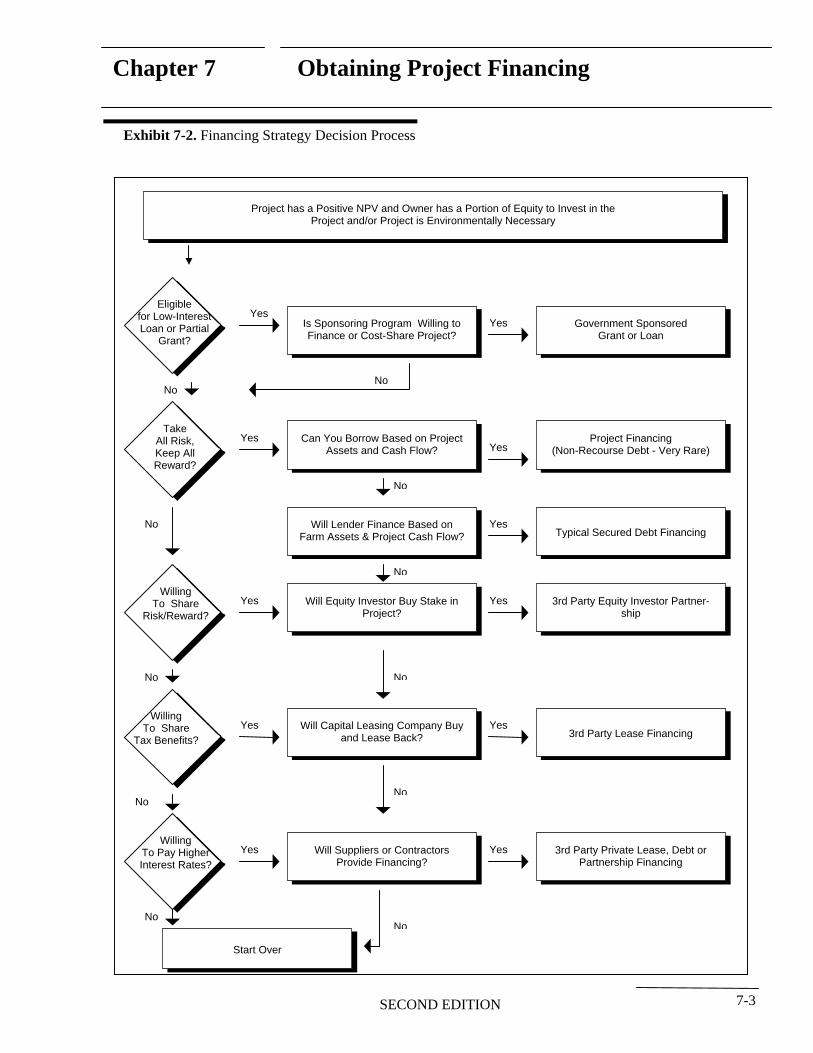
Chapter 7 Obtaining Project Financing
Exhibit 7-2. Financing Strategy Decision Process
Eligible
Loan or Partial Grant?
No
No
No
No
No
No
Will Lender Finance Based on
Is Sponsoring Program Willing to Finance or Cost-Share Project?
Government Sponsored Grant or Loan
Project Financing
Project?
All Risk, Keep All
ship
Willing To Share
No
No
Willing To Share
Tax Benefits? and Lease Back?
No
Willing
Interest Rates?
Start Over
Will Suppliers or Contractors Provide Financing? Partnership Financing
No
No
Yes for Low-Interest Yes
Farm Assets & Project Cash Flow?
Can You Borrow Based on Project Assets and Cash Flow?
Project has a Positive NPV and Owner has a Portion of Equity to Invest in the Project and/or Project is Environmentally Necessary
Yes Yes (Non-Recourse Debt - Very Rare)
Yes Typical Secured Debt Financing
Will Equity Investor Buy Stake in Yes
Take
Reward?
3rd Party Equity Investor PartnerYes
Risk/Reward?
Will Capital Leasing Company Buy Yes 3rd Party Lease Financing
Yes
To Pay Higher Yes 3rd Party Private Lease, Debt or Yes
SECOND EDITION 7-3
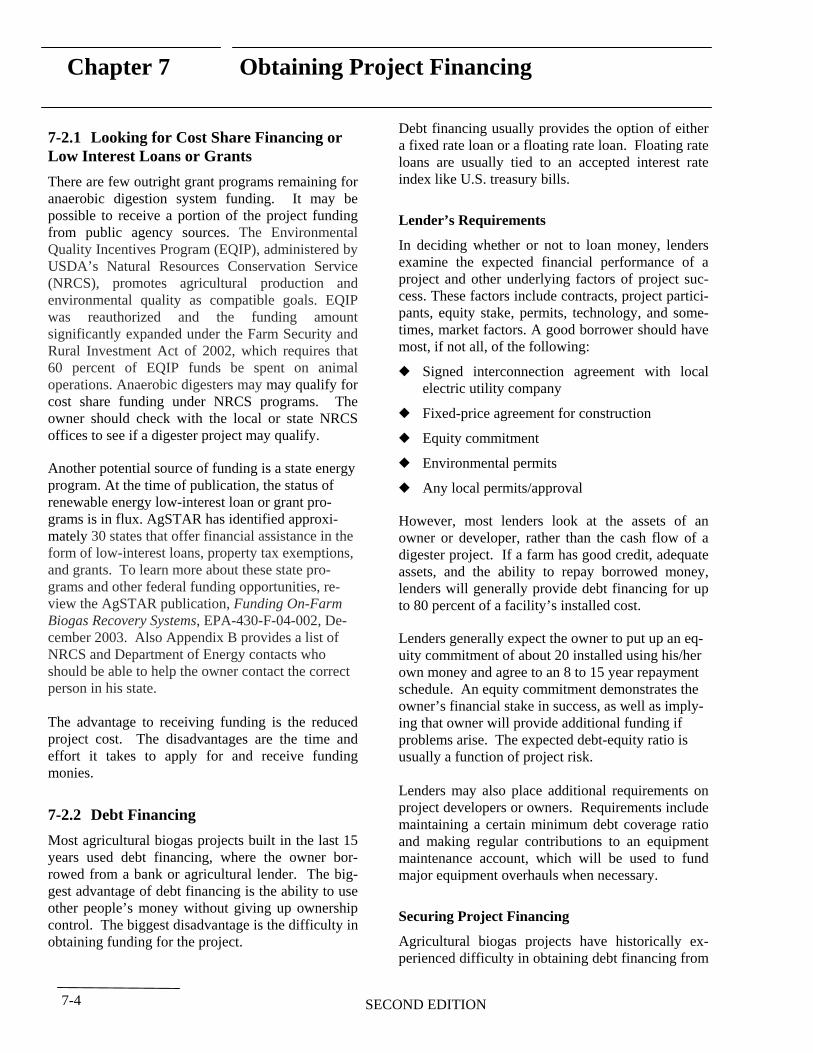
Chapter 7 Obtaining Project Financing
7-2.1 Looking for Cost Share Financing or Low Interest Loans or Grants
There are few outright grant programs remaining for anaerobic digestion system funding. It may be possible to receive a portion of the project funding from public agency sources. The Environmental Quality Incentives Program (EQIP), administered by USDA’s Natural Resources Conservation Service (NRCS), promotes agricultural production and environmental quality as compatible goals. EQIP was reauthorized and the funding amount significantly expanded under the Farm Security and Rural Investment Act of 2002, which requires that 60 percent of EQIP funds be spent on animal operations. Anaerobic digesters may may qualify for cost share funding under NRCS programs. The owner should check with the local or state NRCS offices to see if a digester project may qualify.
Another potential source of funding is a state energy program. At the time of publication, the status of renewable energy low-interest loan or grant programs is in flux. AgSTAR has identified approximately 30 states that offer financial assistance in the form of low-interest loans, property tax exemptions, and grants. To learn more about these state programs and other federal funding opportunities, review the AgSTAR publication, Funding On-Farm Biogas Recovery Systems, EPA-430-F-04-002, December 2003. Also Appendix B provides a list of NRCS and Department of Energy contacts who should be able to help the owner contact the correct person in his state.
The advantage to receiving funding is the reduced project cost. The disadvantages are the time and effort it takes to apply for and receive funding monies.
7-2.2 Debt Financing
Most agricultural biogas projects built in the last 15 years used debt financing, where the owner borrowed from a bank or agricultural lender. The biggest advantage of debt financing is the ability to use other people’s money without giving up ownership control. The biggest disadvantage is the difficulty in obtaining funding for the project.
Debt financing usually provides the option of either a fixed rate loan or a floating rate loan. Floating rate loans are usually tied to an accepted interest rate index like U.S. treasury bills.
Lender’s Requirements
In deciding whether or not to loan money, lenders examine the expected financial performance of a project and other underlying factors of project success. These factors include contracts, project participants, equity stake, permits, technology, and sometimes, market factors. A good borrower should have most, if not all, of the following:
— Signed interconnection agreement with local electric utility company
— Fixed-price agreement for construction
— Equity commitment
— Environmental permits
— Any local permits/approval
However, most lenders look at the assets of an owner or developer, rather than the cash flow of a digester project. If a farm has good credit, adequate assets, and the ability to repay borrowed money, lenders will generally provide debt financing for up to 80 percent of a facility’s installed cost.
Lenders generally expect the owner to put up an equity commitment of about 20 installed using his/her own money and agree to an 8 to 15 year repayment schedule. An equity commitment demonstrates the owner’s financial stake in success, as well as implying that owner will provide additional funding if problems arise. The expected debt-equity ratio is usually a function of project risk.
Lenders may also place additional requirements on project developers or owners. Requirements include maintaining a certain minimum debt coverage ratio and making regular contributions to an equipment maintenance account, which will be used to fund major equipment overhauls when necessary.
Securing Project Financing
Agricultural biogas projects have historically experienced difficulty in obtaining debt financing from
SECOND EDITION 7-4
Chapter 7 Obtaining Project Financing
commercial lenders because of their relatively small size and the perceived risk associated with the technology. The best opportunities for agricultural biogas projects to secure debt financing are with banks, smaller capital companies, where the owner currently borrows money, or at one of the energy investment funds that commonly finance smaller projects.
There are public sources that may provide debt financing for agricultural biogas projects. The US Department of Agriculture’s Farm Service Administration (FSA) is a common source of debt financing for agricultural projects. Additionally, the Small Business Administration can guarantee up to $1,000,000 for Pollution Control Loans to eligible businesses. Pollution Control Loans are intended to provide loan guarantees to eligible small businesses for the financing of the planning, design, or installation of a pollution control facility. The SBA suggests that farmers first exhaust FSA loan possibilities.
It may be worth contacting local and regional commercial banks. Some of these banks have a history of providing debt financing for small energy projects, and may be willing to provide project financing to a "bundle" of two or more farm biogas projects. However, transaction costs for arranging debt financing are relatively high, owing to the lender’s due diligence (i.e., financial and risk investigation) requirements. It is often said that the transaction costs are the same for a 100-kW project as they are for a 10-MW or greater project. For this reason, most large commercial banks and investment houses hesitate to lend to farm scale projects with capital requirements less than about $20 million.
7-2.3 Equity Financing
Investor equity financing is a rarely used method of financing agricultural biogas projects. Project investors typically provide equity or subordinated debt. Equity is invested capital that creates ownership in the project, like a down payment on a home mortgage. Equity is more expensive than debt, because the equity investor accepts more risk than the debt lender. This is because debt lenders usually require that they be paid from project earnings before they are distributed to equity investors. Thus, the cost of financing with equity is usually significantly higher than financing with debt. Subordinated debt is re
paid after any senior debt lenders are paid and before equity investors are paid. Subordinated debt is sometimes viewed as an equity-equivalent by senior lenders, especially if provided by a credit-worthy equipment vendor or industrial company partner.
There are two methods for equity finance: self and investor. Regardless of method, the following basic principles apply.
In order to use equity financing, an investor must be willing to take an ownership position in the potential biogas project. In return for this share of project ownership, the investor is willing to fund all or part of the project costs. Project, as well as some equipment vendors, fuel developers, or nearby farms could be potential equity investors.
The primary advantage of this method is its availability to most projects; the primary disadvantage is its high cost.
Investor’s Requirements
The equity investor will conduct a thorough due diligence analysis to assess the likely ROR associated with the project. This analysis is similar in scope to banks’ analyses, but is often accomplished in much less time because of the entrepreneurial nature of equity investors as compared to institutional lenders. The equity investor’s due diligence analysis typically includes a review of contracts, project participants, equity commitments, permitting status, technology and market factors.
The key requirement for most pure equity investors is sufficient ROR on their investment. The due diligence analysis, combined with the cost and operating data for the project, enables the investor to calculate the project’s financial performance (e.g., cash flows, ROR) and determine its investment offer based on anticipated returns. An equity investor may be willing to finance up to 100% of the pro-ject’s installed cost, often with the expectation that additional equity or debt investors will be located at a later time.
Some types of partners who provide equity or subordinated debt may have unique requirements. Potential partners such as equipment vendors generally expect to realize some benefits other than just cash
SECOND EDITION 7-5
Chapter 7 Obtaining Project Financing
flow. The desired benefits may include equipment sales, service contracts, tax benefits, and economical and reliable energy supplies. For example, an engine vendor may provide equity or subordinated debt up to the value of the engine equipment, with the expectation of selling out its interest after the project is built. A nearby farm company might want to gain access to inexpensive fuel or derived energy. The requirements imposed by each of these potential investors are sure to include an analysis of the technical and financial merit of the project, and a consideration of the unique objectives of each investor.
Securing Equity Financing
To fully explore the possibilities for equity or subordinated debt financing, farm owners should ask potential developers if this is a service they can provide. The second most common source of equity financing is an investment bank that specializes in the placement of equity or debt. Additionally, the equipment vendors, and companies that are involved in the project may be willing to provide financing for the project, at least through the construction phase. The ability to provide financing could be an important consideration when selecting a builder, equipment vendor, or other partners.
7-2.4 Third-Party Financing
Should a farm owner or project developer be unable to raise the required capital using equity or debt or be unwilling to accept project risks, one last form of financing might be considered. With each of the following methods, the project sponsor gives up some of the project’s economic benefits in exchange for a third-party becoming responsible for raising funds, project implementation, system operation, or a combination of these activities. Some of the disadvantages of third-party financing include accounting and liability complexities, as well as the possible loss of tax benefits by the farm owner.
Lease Financing
Lease financing encompasses several strategies in which a farm owner leases all or part of the project’s assets from the asset owner(s). Typically, lease arrangements provide the advantage of transferring tax benefits such as accelerated depreciation or energy tax credits to an entity that can best use them. Lease
arrangements commonly provide the lessee with the option, at pre-determined intervals, to purchase the assets or extend the lease. Several large equipment vendors have subsidiaries that lease equipment, as do some financing companies. There are several variations on the lease concept including:
— Leveraged Lease. In a leveraged lease, the equipment user leases the equipment from the owner, who finances the equipment purchase with extended debt and/or equity.
— Sales-Leaseback. In a sales-leaseback, the equipment user buys the equipment, then sells it back to a corporation, which then leases it back to the user under contract.
— Energy Savings Performance Contracting (ESPC). ESPC is another contracting agreement that might enable a large project to be implemented without any up-front costs. The ESPC entity, such as a venture capitalist or green investor, actually owns the system and incurs all costs associated with its design, installation, or maintenance in exchange for a share of any cost savings. The ESPC entity recovers its investment and ultimately earns a profit. It is earned by charging the farm for supplied energy at a rate below what energy from a conventional utility would cost. The end-user must usually must commit to take a specified quantity of energy or to pay a minimum service charge. This “take or pay” structure is necessary to secure the ESPC.
7-2.5 Project Financing
"Project finance" is a method for obtaining commercial debt financing for the construction of a facility. Lenders look at the credit-worthiness of the facility to ensure debt repayment rather than at the assets of the developer/sponsor. Farm biogas projects have historically experienced difficulty securing project financing because of their relatively small size and the perceived risks associated with the technology. However, project financing may be available to large projects in the future. In most project finance cases, lenders will provide project debt for up to about 80% of the facility's installed cost and accept a debt repayment schedule over 8 to 15 years. Pro-
SECOND EDITION 7-6
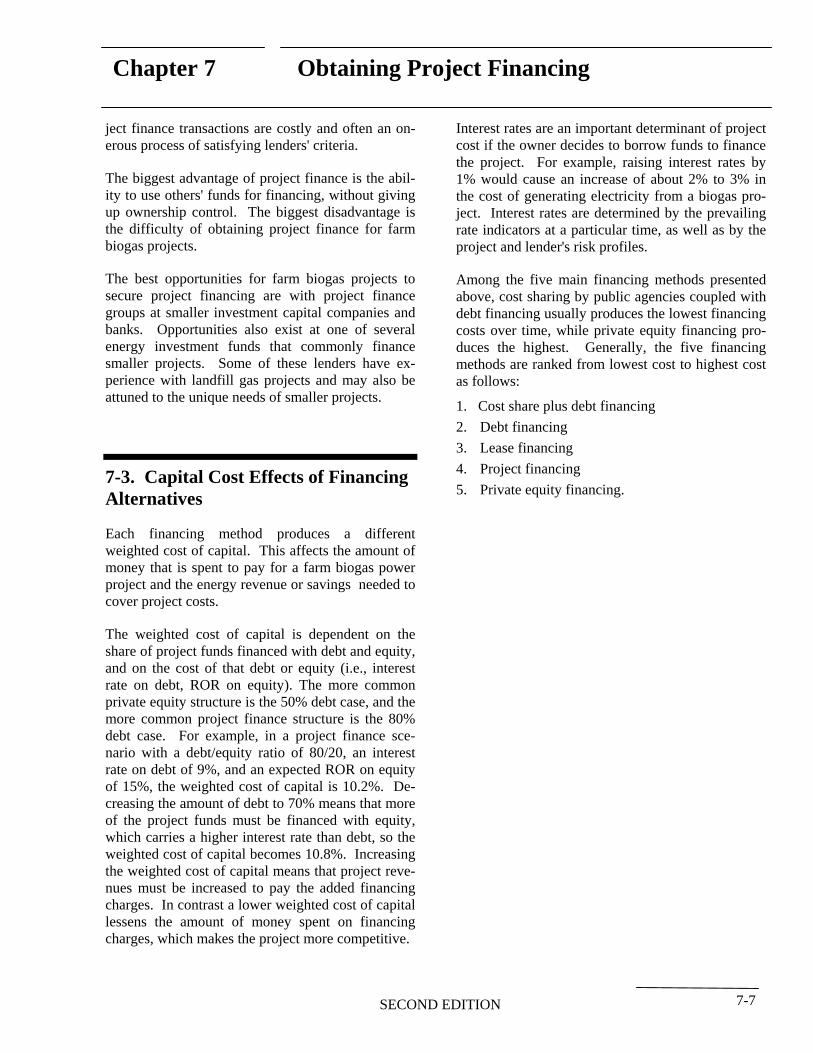
Chapter 7 Obtaining Project Financing
ject finance transactions are costly and often an onerous process of satisfying lenders' criteria.
The biggest advantage of project finance is the ability to use others' funds for financing, without giving up ownership control. The biggest disadvantage is the difficulty of obtaining project finance for farm biogas projects.
The best opportunities for farm biogas projects to secure project financing are with project finance groups at smaller investment capital companies and banks. Opportunities also exist at one of several energy investment funds that commonly finance smaller projects. Some of these lenders have experience with landfill gas projects and may also be attuned to the unique needs of smaller projects.
7-3. Capital Cost Effects of Financing Alternatives
Each financing method produces a different weighted cost of capital. This affects the amount of money that is spent to pay for a farm biogas power project and the energy revenue or savings needed to cover project costs.
The weighted cost of capital is dependent on the share of project funds financed with debt and equity, and on the cost of that debt or equity (i.e., interest rate on debt, ROR on equity). The more common private equity structure is the 50% debt case, and the more common project finance structure is the 80% debt case. For example, in a project finance scenario with a debt/equity ratio of 80/20, an interest rate on debt of 9%, and an expected ROR on equity of 15%, the weighted cost of capital is 10.2%. Decreasing the amount of debt to 70% means that more of the project funds must be financed with equity, which carries a higher interest rate than debt, so the weighted cost of capital becomes 10.8%. Increasing the weighted cost of capital means that project revenues must be increased to pay the added financing charges. In contrast a lower weighted cost of capital lessens the amount of money spent on financing charges, which makes the project more competitive.
Interest rates are an important determinant of project cost if the owner decides to borrow funds to finance the project. For example, raising interest rates by 1% would cause an increase of about 2% to 3% in the cost of generating electricity from a biogas project. Interest rates are determined by the prevailing rate indicators at a particular time, as well as by the project and lender's risk profiles.
Among the five main financing methods presented above, cost sharing by public agencies coupled with debt financing usually produces the lowest financing costs over time, while private equity financing produces the highest. Generally, the five financing methods are ranked from lowest cost to highest cost as follows:
1. Cost share plus debt financing
2. Debt financing
3. Lease financing
4. Project financing
5. Private equity financing.
SECOND EDITION 7-7
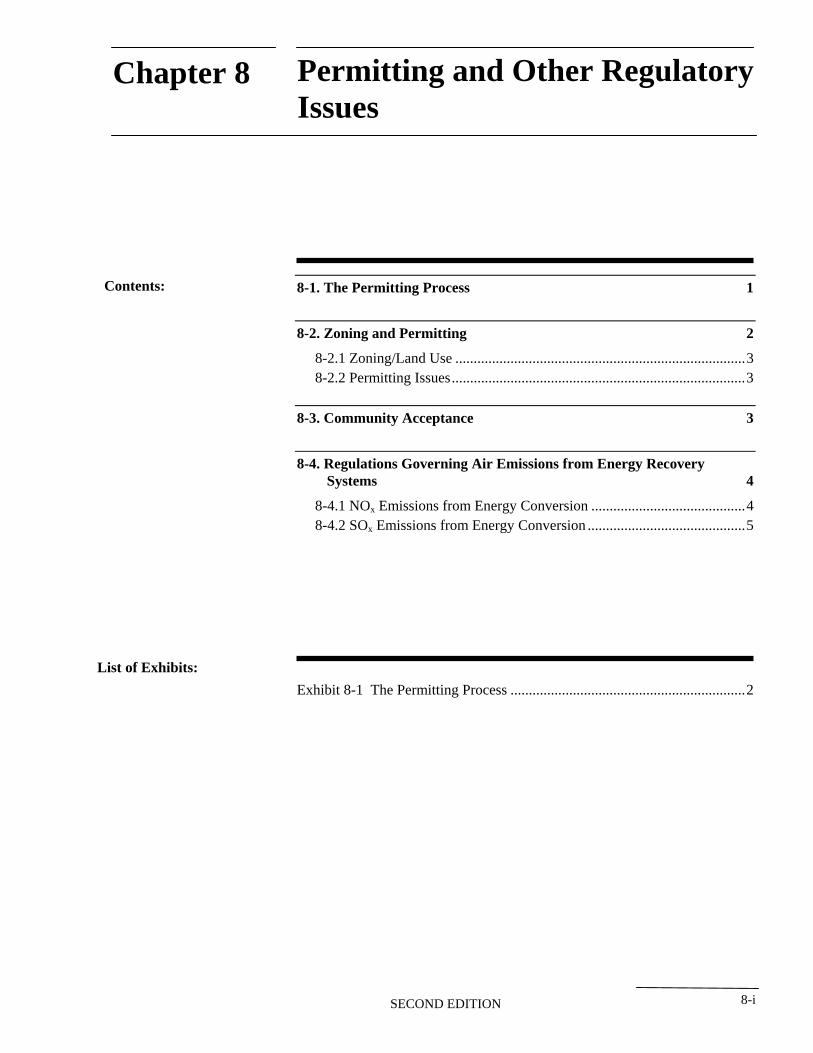
Chapter 8 Permitting and Other Regulatory Issues
Contents: 8-1. The Permitting Process
8-2. Zoning and Permitting
8-2.1 Zoning/Land Use ...............................................................................3 8-2.2 Permitting Issues ................................................................................3
8-3. Community Acceptance
8-4. Regulations Governing Air Emissions from Energy Recovery Systems
8-4.1 NOx Emissions from Energy Conversion ..........................................4 8-4.2 SOx Emissions from Energy Conversion ...........................................5
List of Exhibits:
Exhibit 8-1 The Permitting Process ................................................................2
SECOND EDITION 8-i
1
2
3
4
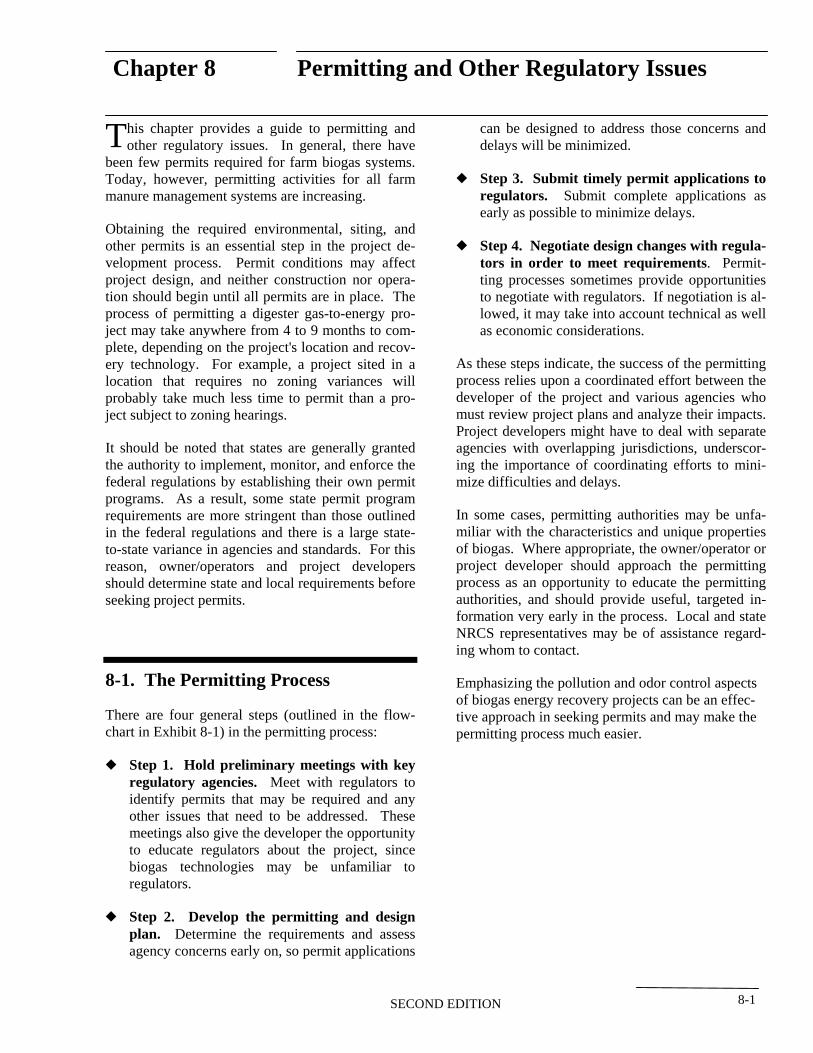
Chapter 8 Permitting and Other Regulatory Issues
his chapter provides a guide to permitting and Tother regulatory issues. In general, there have been few permits required for farm biogas systems. Today, however, permitting activities for all farm manure management systems are increasing.
Obtaining the required environmental, siting, and other permits is an essential step in the project development process. Permit conditions may affect project design, and neither construction nor operation should begin until all permits are in place. The process of permitting a digester gas-to-energy project may take anywhere from 4 to 9 months to complete, depending on the project's location and recovery technology. For example, a project sited in a location that requires no zoning variances will probably take much less time to permit than a project subject to zoning hearings.
It should be noted that states are generally granted the authority to implement, monitor, and enforce the federal regulations by establishing their own permit programs. As a result, some state permit program requirements are more stringent than those outlined in the federal regulations and there is a large state-to-state variance in agencies and standards. For this reason, owner/operators and project developers should determine state and local requirements before seeking project permits.
8-1. The Permitting Process
There are four general steps (outlined in the flowchart in Exhibit 8-1) in the permitting process:
— Step 1. Hold preliminary meetings with key regulatory agencies. Meet with regulators to identify permits that may be required and any other issues that need to be addressed. These meetings also give the developer the opportunity to educate regulators about the project, since biogas technologies may be unfamiliar to regulators.
— Step 2. Develop the permitting and design plan. Determine the requirements and assess agency concerns early on, so permit applications
can be designed to address those concerns and delays will be minimized.
— Step 3. Submit timely permit applications to regulators. Submit complete applications as early as possible to minimize delays.
— Step 4. Negotiate design changes with regulators in order to meet requirements. Permitting processes sometimes provide opportunities to negotiate with regulators. If negotiation is allowed, it may take into account technical as well as economic considerations.
As these steps indicate, the success of the permitting process relies upon a coordinated effort between the developer of the project and various agencies who must review project plans and analyze their impacts. Project developers might have to deal with separate agencies with overlapping jurisdictions, underscoring the importance of coordinating efforts to minimize difficulties and delays.
In some cases, permitting authorities may be unfamiliar with the characteristics and unique properties of biogas. Where appropriate, the owner/operator or project developer should approach the permitting process as an opportunity to educate the permitting authorities, and should provide useful, targeted information very early in the process. Local and state NRCS representatives may be of assistance regarding whom to contact.
Emphasizing the pollution and odor control aspects of biogas energy recovery projects can be an effective approach in seeking permits and may make the permitting process much easier.
SECOND EDITION 8-1
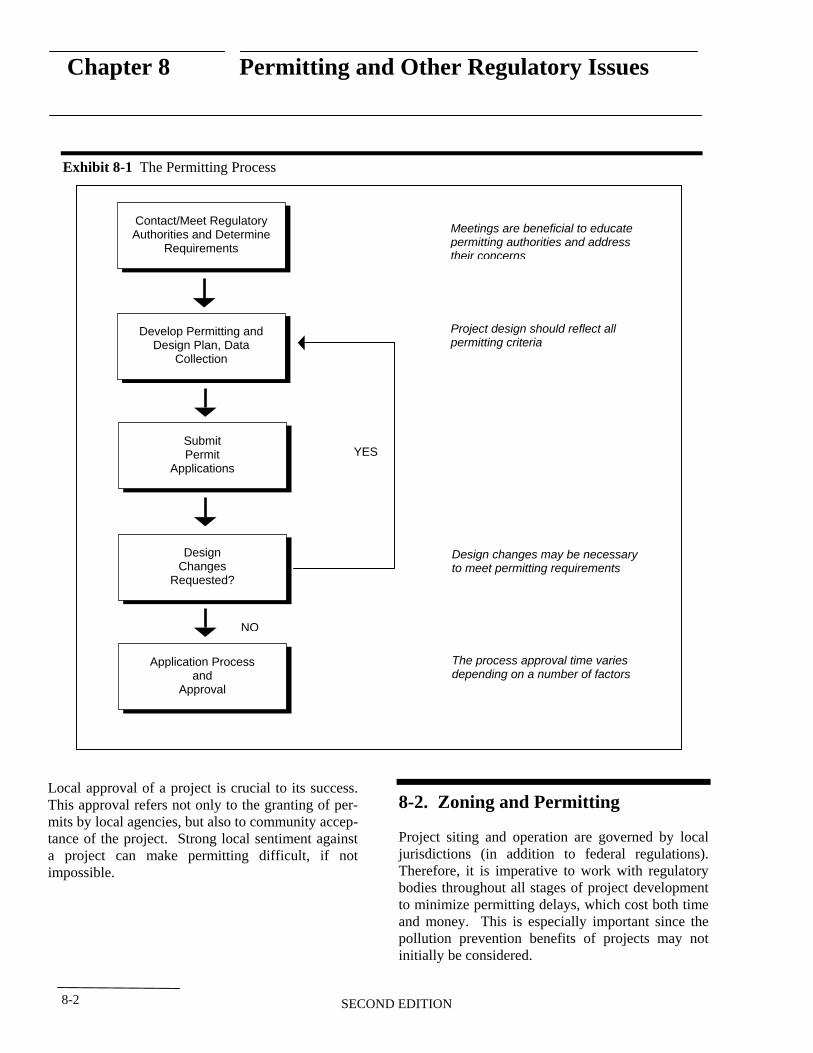
Chapter 8 Permitting and Other Regulatory Issues
Exhibit 8-1 The Permitting Process
Local approval of a project is crucial to its success. This approval refers not only to the granting of permits by local agencies, but also to community acceptance of the project. Strong local sentiment against a project can make permitting difficult, if not impossible.
Contact/Meet Regulatory Authorities and Determine
Requirements
Develop Permitting and Design Plan, Data
Collection
Submit Permit
Applications
Design Changes
Requested?
Application Process and
Approval
YES
NO
Meetings are beneficial to educate permitting authorities and address
ncerns
Project design should reflect all permitting criteria
Design changes may be necessary to meet permitting requirements
depending on a number of factors
their co
The process approval time varies
8-2. Zoning and Permitting
Project siting and operation are governed by local jurisdictions (in addition to federal regulations). Therefore, it is imperative to work with regulatory bodies throughout all stages of project development to minimize permitting delays, which cost both time and money. This is especially important since the pollution prevention benefits of projects may not initially be considered.
SECOND EDITION8-2
Chapter 8 Permitting and Other Regulatory Issues
8-2.1 Zoning/Land Use
The first local issue to be addressed is the compatibility of the project with community land use specifications. Projects on existing farms should have few problems. Most communities have a zoning and land use plan that identifies where different types of development are allowed (e.g., residential, commercial, industrial). The local zoning board determines whether or not land use criteria are met by a new farm project, and can usually grant variances if conditions warrant.
8-2.2 Permitting Issues
In addition to land use specifications, local agencies have jurisdiction over a number of other parameters that may or may not be applicable to the project or location, such as the following:
— Confined Animal Facility Operation Permits (CAFO). Depending on the size of the animal confinement operation, a state agency regulated confined animal facility operation (CAFO) permit may be in force. The permit was developed under the National Pollution Discharge Elimination System (NPDES). Generally, any alteration in methodologies employed to manage manure require review and approval by that agency. Discussion of project benefits (odor, pathogen, weedseed, nutrient mineralization) may aid the regulators during preliminary conversation and subsequent authorization.
— Recycling. Projects with financial viability dependent on sale of recycled materials likely are subject to review of the state/regional agency governing recycling programs. Some degree of marketing research and product purchase commitment may be required. This is particularly true of projects generating revenues through the receipt of “tipping” fees to receive wastes for disposal and processing. Regulators do not want materials received for an income-generating fee to accumulate and not be subsequently sold.
— Noise. Most local zoning ordinances stipulate the allowable decibel levels for noise sources. These levels vary, depending on the zoning classification at the source site (e.g., a site lo
cated near residential areas will have a lower decibel requirement than one located in an isolated area). Even enclosed facilities may be required to meet these requirements; therefore, it is important to keep them in mind when designing project facilities.
— Wastewater. All farms remain under zero discharge rules for digester effluent. The CAFO permits control facilities and operations.
— Water. Water requirements depend on the type and size of the project. If current facilities cannot meet the needs of the project, then new facilities (e.g., pipeline, pumping capacity, wells) may need to be constructed. Groundwater permits could be required if new wells are needed to supply the project's water needs.
— Solid Waste Disposal. The only solid wastes generated by a biogas project are likely packaging materials, cleaning solvents, and equipment fluids. While there may only be a small amount of solid waste generated, it must be properly disposed.
— Stormwater Management. State environmental agencies regulate stormwater management, and may require a permit for discharges during construction and operation. Good facility design that maintains the predevelopment runoff characteristics of the site allows the project to easily meet permitting requirements.
8-3. Community Acceptance
As any project developer will attest, community support is extremely important to the success of a project, especially since some communities require public participation in project zoning/siting cases. Many farms are encountering local opposition such as the "not in my backyard (NIMBY)" syndrome, or perceptions of project impacts (e.g., odor, groundwater pollution). Therefore, it is important to educate the public and to develop a working relationship with the neighboring community in order to dispel any fears or doubts about the expected impact
SECOND EDITION 8-3
Chapter 8 Permitting and Other Regulatory Issues
of the project. Project details should always be presented in a very forthcoming and factual manner.
Biogas projects bring many benefits to the neighboring community (e.g., improved air quality, reduction of odor and pollution potential). These benefits should be emphasized during the permitting process. AgSTAR materials may be used to fulfill some of these needs.
8-4. Regulations Governing Air Emissions from Energy Recovery Systems
New Source Review (NSR) is a preconstruction review program under the Clean Air Act that applies to new and modified major sources. In almost all cases, farm scale biogas systems will be too small to trigger NSR permitting. NSR most likely will apply only to biogas-fueled boilers, engine-generator sets, and flares for very large projects and projects on farms near large urban areas. However, each state has a permitting program for new or modified minor sources. The emission thresholds for requiring a minor source permit or registration vary by state. Therefore, you should check with your local air permitting authority about permit requirements early in the planning process.
Links to state and local air pollution control agencies can be found at www.cleanairworld.org.
Regulations have been promulgated under the Clean Air Act governing airborne emissions from new and existing sources. These regulations require new or modified major sources to undergo the NSR process before they can commence construction. The addition of a biogas recovery system at an existing farm would be an example of a modified source. The purpose of NSR is to ensure that new and modified major sources meet the applicable air quality standards and that emissions are controlled using state-of-the-art technology.
The permit requirements will vary depending on local air quality. All areas of the country are classified by their attainment status with National Ambi
ent Air Quality Standards (NAAQS) for six pollutants - sulfur dioxide, particulate matter, nitrogen dioxide, carbon dioxide, lead, and ozone. Areas that meet the NAAQS for a particular air pollutant are classified as in "attainment" for that pollutant. Areas that do not meet the NAAQS are classified as in "nonattainment" for that pollutant.
Permitting requirements are more stringent for non-attainment areas. Under NSR, sources in attainment areas undergo Prevention of Significant Deterioration (PSD) permitting while those in nonattainment areas undergo nonattainment area NSR permitting. Nonattainment area permitting requires more stringent emission controls and imposes other requirements. Because a location can be classified as attainment for some pollutants and nonattainment for others, a source may be permitted under both PSD and nonattainment area NSR. For example, a biogas combustion engine may be reviewed under PSD for carbon monoxide and nonattainment NSR for ozone.
In summary, small projects that are typical of most farm scale biogas systems may find the air permitting process to be quite straightforward. Very large projects (i.e., >500 kW), particularly those in urban nonattainment areas, may require NSR. The process of obtaining a NSR permit can be extensive and can require lead times of 6 to 9 months to obtain a permit. Construction of a project cannot begin until the permit is issued. Given the complexity of the air permitting regulations, an owner/operator may wish to consult an expert familiar with the NSR process in a particular area.
8-4.1 NOx Emissions from Energy Conversion
Combustion of biogas -- in an engine, turbine, or boiler -- generates nitrogen oxides (NOx). For biogas combustion sources, NOx is likely to be the emission of greatest concern to state air pollution regulators. Nitrogen oxides contribute to the formation of atmospheric ozone and fine particulate matter. Obtaining a permit may require selection of a combustion device with low NOx emissions.
Reciprocating Internal Combustion Engines
There are two basic types of reciprocating engines: naturally aspirated and fuel injected lean-burn:
SECOND EDITION8-4
Chapter 8 Permitting and Other Regulatory Issues
— Naturally Aspirated engines draw combustion air and biogas through a carburetor in stoichiometric proportions, much the same way that an automobile equipped with a carburetor would draw its air/fuel mixture. Just enough air is drawn into the combustion chamber to ignite the air/biogas mix. In addition, residence time in the combustion chamber is relatively long. Therefore, this type of engine emits relatively high levels of NOx
— Fuel injected lean-burn engines inject biogas into the combustion chamber along with air that is in excess of the stoichiometric mix. This type of engine provides both greater engine power output and fewer NOx
emissions than a comparable naturally aspirated engine. In recent years, manufacturers have developed engines with very low NOx
emissions.
When internal combustion engines are used in conventional natural gas applications, catalysts can be used to reduce NOx emissions. To date, catalysts have not been required in any farm scale applications because the impurities found in biogas quickly limit the ability of the catalyst to control NOx emissions.
Turbines and Boilers
With modern designs, gas-fired boilers and turbines emit levels of NOx that are lower than fuel injected lean burn internal combustion engines. For typical farm scale systems, additional controls should not be required to obtain a permit.
8-4.2 SOx Emissions from Energy Conversion
Combustion of biogas also can generate sulfur oxides (SOx). Sulfur oxides are generated when biogas containing hydrogen sulfide and other reduced sulfur compounds are combusted. Sulfur oxides contribute to the formation of fine particulate matter.
In some areas, obtaining a permit may require installation of a scrubbing technique to remove hydrogen sulfide and other reduced sulfur compounds before biogas combustion. It is likely that only biogas produced from large swine operations would contain enough sulfur compounds to warrant the consideration of scrubbing.
SECOND EDITION 8-5
Appendix A Operating U.S. Farm-Scale Digesters
This section provides information on farm-scale digester systems currently operating at commercial livestock farms in the U.S. Of the 40 operating digester systems, nine are at swine farms, 29 are at dairy farms, one is at a caged layer farm, and one is at a duck farm. Three of these systems are centralized digester operations for dairy farms that receive manure from surrounding dairy farms. Table A-1 provides information about each of these digester systems. The table is organized by animal type and state location.
In the past two years, the number of operating farm-scale digesters has increased by nearly 30 percent. In addition, seven additional systems are currently under construction or in start-up (Table A-2). AgSTAR estimates that in October 2002, at least 40 additional systems were in various stages of planning and should come on line during the next several years.
In 35 of the 40 operational systems, the captured biogas is used to generate electrical power and heat. The systems combined produce the equivalent of approximately 4 MW of energy output per year. The remaining five systems flare the captured gas for odor control. Each year, the 40 operating digesters prevent the emission of nearly 124,000 metric tons of methane, on a carbon dioxide equivalent basis,1 from entering the atmosphere.
1Greenhouse gas emissions are most commonly expressed as metric tons of carbon dioxide equivalents (MTCO2E/year). This measure is used to compare the emissions of different greenhouse gases based on their potential to trap heat in the atmosphere. Methane has 21 times the global warming potential of CO2. A metric ton is 1.1 tons.
Appendix A - iSECOND EDITION
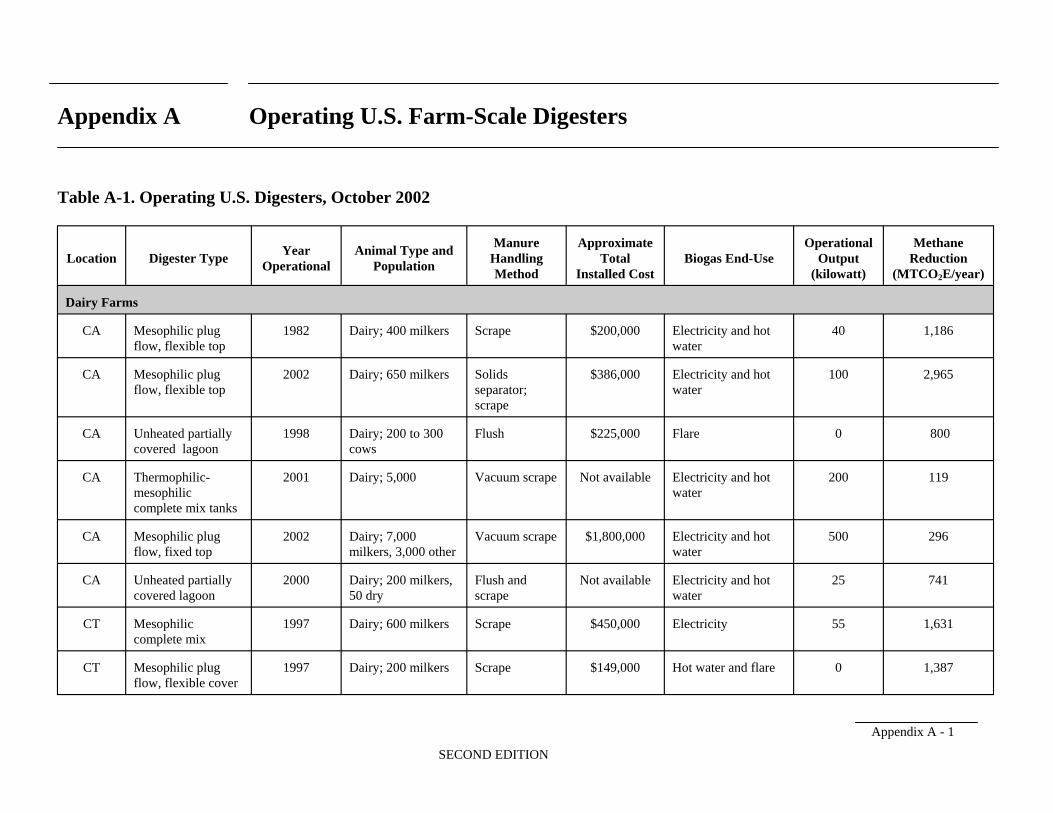
Appendix A Operating U.S. Farm-Scale Digesters
Table A-1. Operating U.S. Digesters, October 2002
Location Digester Type Year
Operational Animal Type and
Population
Manure Handling Method
Approximate Total
Installed Cost Biogas End-Use
Operational Output
(kilowatt)
Methane Reduction
(MTCO2E/year)
Dairy Farms
CA Mesophilic plug flow, flexible top
1982 Dairy; 400 milkers Scrape $200,000 Electricity and hot water
40 1,186
CA Mesophilic plug 2002 Dairy; 650 milkers Solids $386,000 Electricity and hot 100 2,965 flow, flexible top separator; water
scrape
CA Unheated partially covered lagoon
1998 Dairy; 200 to 300 cows
Flush $225,000 Flare 0 800
CA Thermophilic 2001 Dairy; 5,000 Vacuum scrape Not available Electricity and hot 200 119 mesophilic water complete mix tanks
CA Mesophilic plug flow, fixed top
2002 Dairy; 7,000 milkers, 3,000 other
Vacuum scrape $1,800,000 Electricity and hot water
500 296
CA Unheated partially covered lagoon
2000 Dairy; 200 milkers, 50 dry
Flush and scrape
Not available Electricity and hot water
25 741
CT Mesophilic complete mix
1997 Dairy; 600 milkers Scrape $450,000 Electricity 55 1,631
CT Mesophilic plug flow, flexible cover
1997 Dairy; 200 milkers Scrape $149,000 Hot water and flare 0 1,387
Appendix A - 1
SECOND EDITION
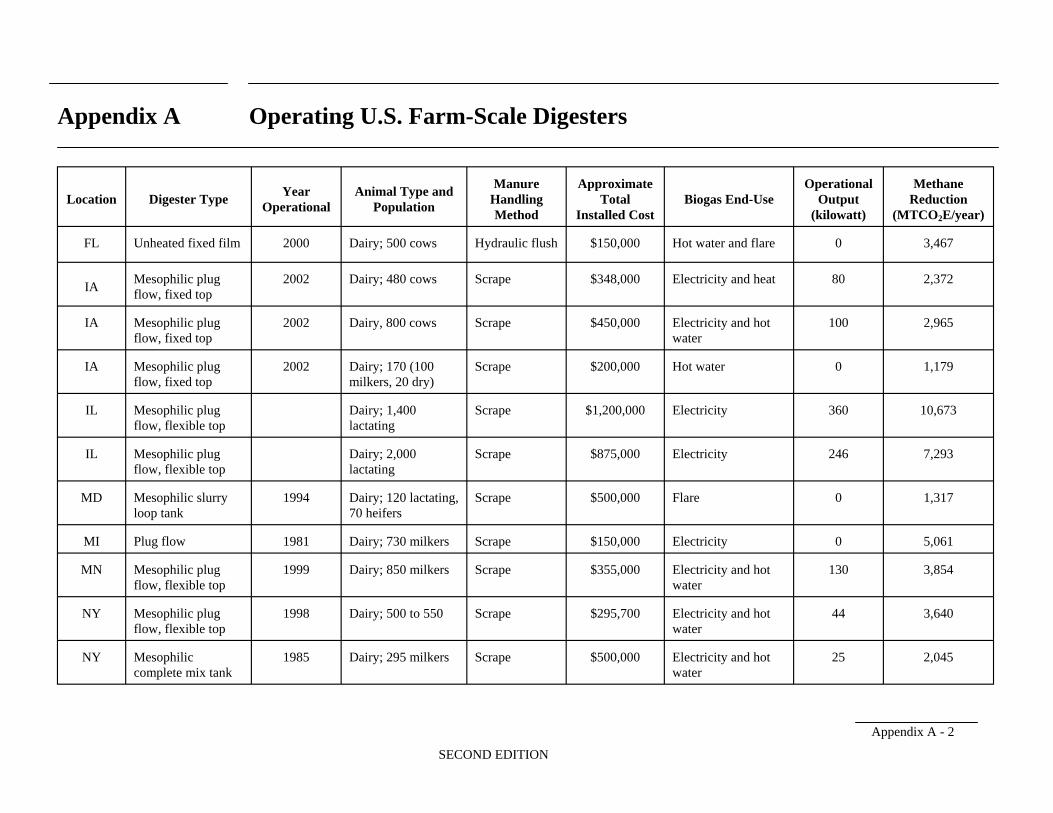
Appendix A Operating U.S. Farm-Scale Digesters
Location Digester Type Year
Operational Animal Type and
Population
Manure Handling Method
Approximate Total
Installed Cost Biogas End-Use
Operational Output
(kilowatt)
Methane Reduction
(MTCO2E/year)
FL Unheated fixed film 2000 Dairy; 500 cows Hydraulic flush $150,000 Hot water and flare 0 3,467
IA Mesophilic plug flow, fixed top
2002 Dairy; 480 cows Scrape $348,000 Electricity and heat 80 2,372
IA Mesophilic plug flow, fixed top
2002 Dairy, 800 cows Scrape $450,000 Electricity and hot water
100 2,965
IA Mesophilic plug flow, fixed top
2002 Dairy; 170 (100 milkers, 20 dry)
Scrape $200,000 Hot water 0 1,179
IL Mesophilic plug flow, flexible top
Dairy; 1,400 lactating
Scrape $1,200,000 Electricity 360 10,673
IL Mesophilic plug flow, flexible top
Dairy; 2,000 lactating
Scrape $875,000 Electricity 246 7,293
MD Mesophilic slurry loop tank
1994 Dairy; 120 lactating, 70 heifers
Scrape $500,000 Flare 0 1,317
MI Plug flow 1981 Dairy; 730 milkers Scrape $150,000 Electricity 0 5,061
MN Mesophilic plug flow, flexible top
1999 Dairy; 850 milkers Scrape $355,000 Electricity and hot water
130 3,854
NY Mesophilic plug flow, flexible top
1998 Dairy; 500 to 550 Scrape $295,700 Electricity and hot water
44 3,640
NY Mesophilic complete mix tank
1985 Dairy; 295 milkers Scrape $500,000 Electricity and hot water
25 2,045
Appendix A - 2
SECOND EDITION
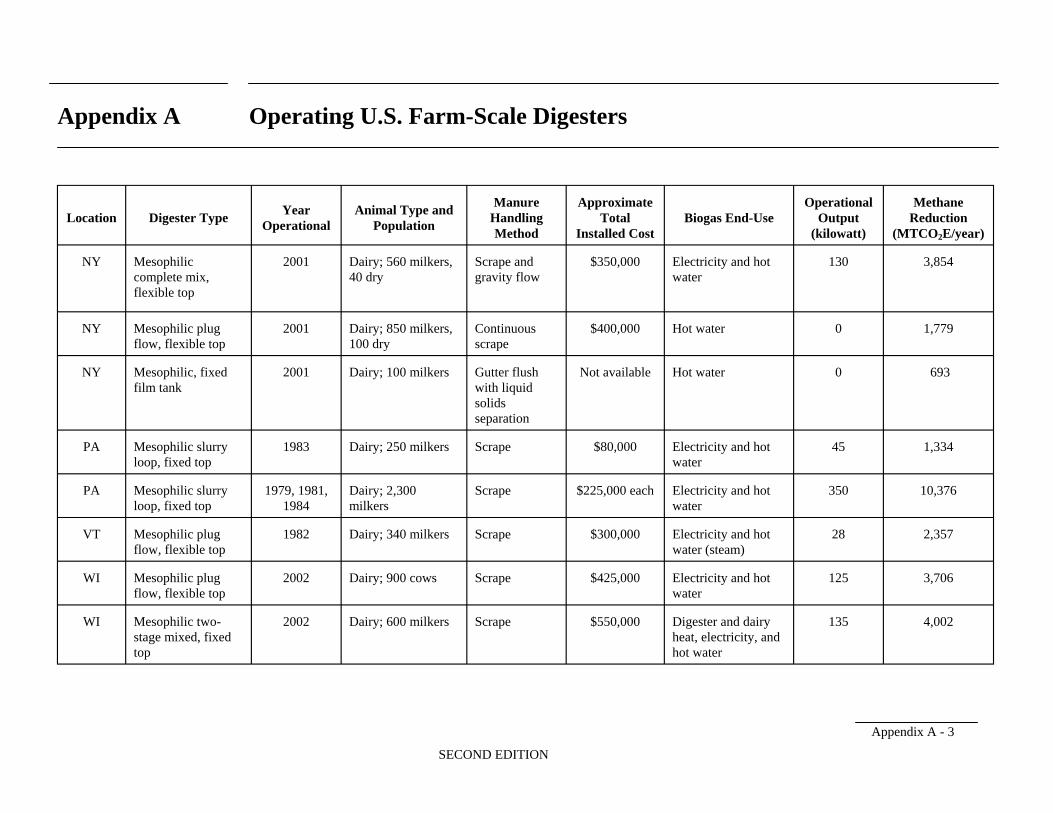
Appendix A Operating U.S. Farm-Scale Digesters
Location Digester Type Year
Operational Animal Type and
Population
Manure Handling Method
Approximate Total
Installed Cost Biogas End-Use
Operational Output
(kilowatt)
Methane Reduction
(MTCO2E/year)
NY Mesophilic 2001 Dairy; 560 milkers, Scrape and $350,000 Electricity and hot 130 3,854 complete mix, 40 dry gravity flow water flexible top
NY Mesophilic plug flow, flexible top
2001 Dairy; 850 milkers, 100 dry
Continuous scrape
$400,000 Hot water 0 1,779
NY Mesophilic, fixed film tank
2001 Dairy; 100 milkers Gutter flush with liquid solids
Not available Hot water 0 693
separation
PA Mesophilic slurry loop, fixed top
1983 Dairy; 250 milkers Scrape $80,000 Electricity and hot water
45 1,334
PA Mesophilic slurry loop, fixed top
1979, 1981, 1984
Dairy; 2,300 milkers
Scrape $225,000 each Electricity and hot water
350 10,376
VT Mesophilic plug flow, flexible top
1982 Dairy; 340 milkers Scrape $300,000 Electricity and hot water (steam)
28 2,357
WI Mesophilic plug flow, flexible top
2002 Dairy; 900 cows Scrape $425,000 Electricity and hot water
125 3,706
WI Mesophilic two- 2002 Dairy; 600 milkers Scrape $550,000 Digester and dairy 135 4,002 stage mixed, fixed heat, electricity, and top hot water
Appendix A - 3
SECOND EDITION
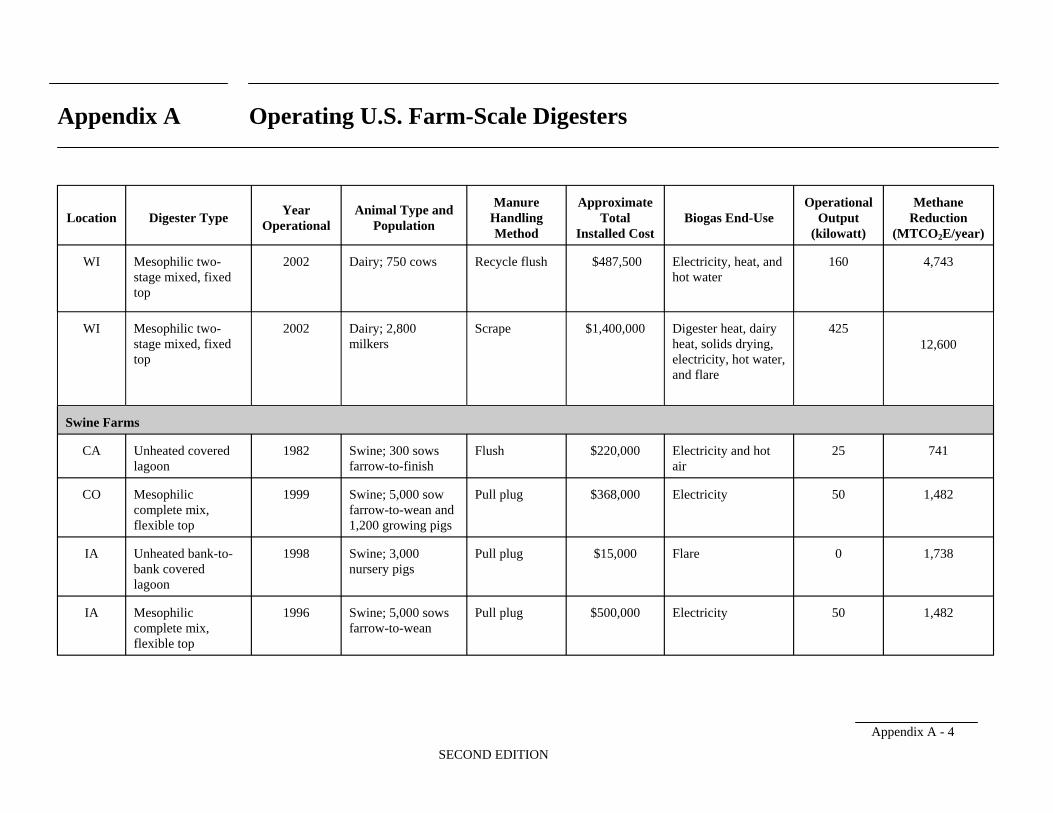
Appendix A Operating U.S. Farm-Scale Digesters
Location Digester Type Year
Operational Animal Type and
Population
Manure Handling Method
Approximate Total
Installed Cost Biogas End-Use
Operational Output
(kilowatt)
Methane Reduction
(MTCO2E/year)
WI Mesophilic two- 2002 Dairy; 750 cows Recycle flush $487,500 Electricity, heat, and 160 4,743 stage mixed, fixed hot water top
WI Mesophilic two-stage mixed, fixed
2002 Dairy; 2,800 milkers
Scrape $1,400,000 Digester heat, dairy heat, solids drying,
425 12,600
top electricity, hot water, and flare
Swine Farms
CA Unheated covered lagoon
1982 Swine; 300 sows farrow-to-finish
Flush $220,000 Electricity and hot air
25 741
CO Mesophilic 1999 Swine; 5,000 sow Pull plug $368,000 Electricity 50 1,482 complete mix, farrow-to-wean and flexible top 1,200 growing pigs
IA Unheated bank-to- 1998 Swine; 3,000 Pull plug $15,000 Flare 0 1,738 bank covered nursery pigs lagoon
IA Mesophilic 1996 Swine; 5,000 sows Pull plug $500,000 Electricity 50 1,482 complete mix, farrow-to-wean flexible top
Appendix A - 4
SECOND EDITION
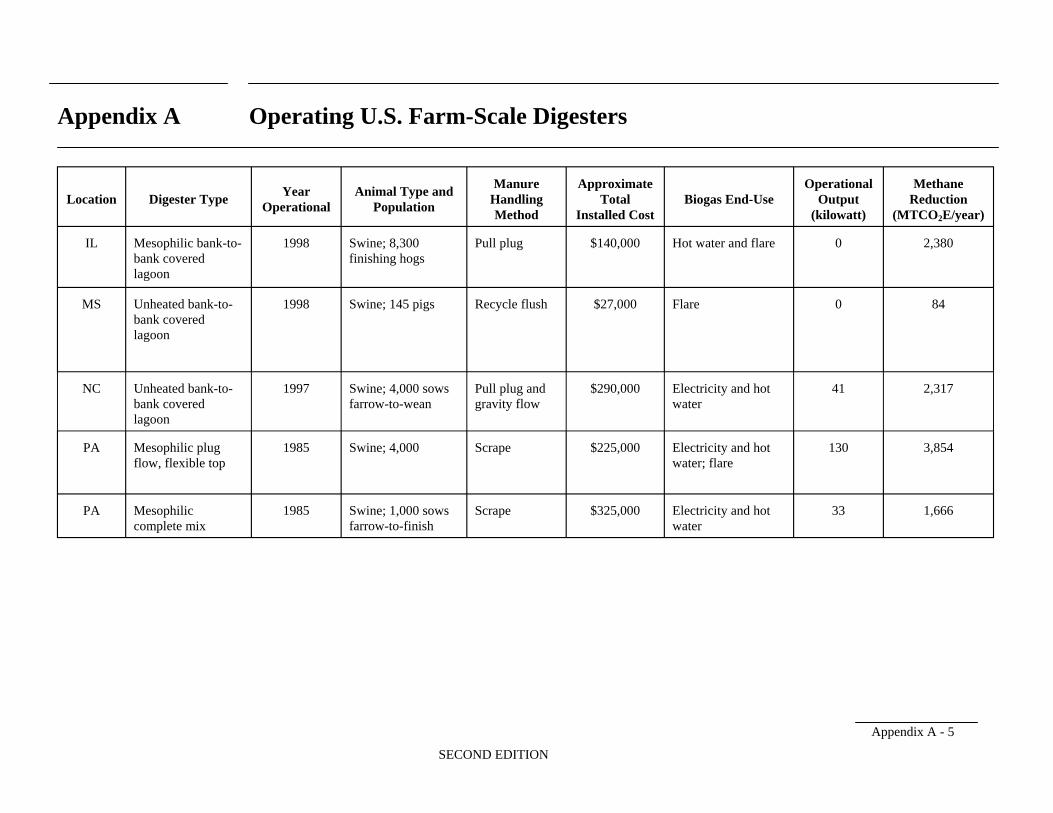
Appendix A Operating U.S. Farm-Scale Digesters
Location Digester Type Year
Operational Animal Type and
Population
Manure Handling Method
Approximate Total
Installed Cost Biogas End-Use
Operational Output
(kilowatt)
Methane Reduction
(MTCO2E/year)
IL Mesophilic bank-to- 1998 Swine; 8,300 Pull plug $140,000 Hot water and flare 0 2,380 bank covered finishing hogs lagoon
MS Unheated bank-to- 1998 Swine; 145 pigs Recycle flush $27,000 Flare 0 84 bank covered lagoon
NC Unheated bank-to- 1997 Swine; 4,000 sows Pull plug and $290,000 Electricity and hot 41 2,317 bank covered farrow-to-wean gravity flow water lagoon
PA Mesophilic plug flow, flexible top
1985 Swine; 4,000 Scrape $225,000 Electricity and hot water; flare
130 3,854
PA Mesophilic complete mix
1985 Swine; 1,000 sows farrow-to-finish
Scrape $325,000 Electricity and hot water
33 1,666
Appendix A - 5
SECOND EDITION
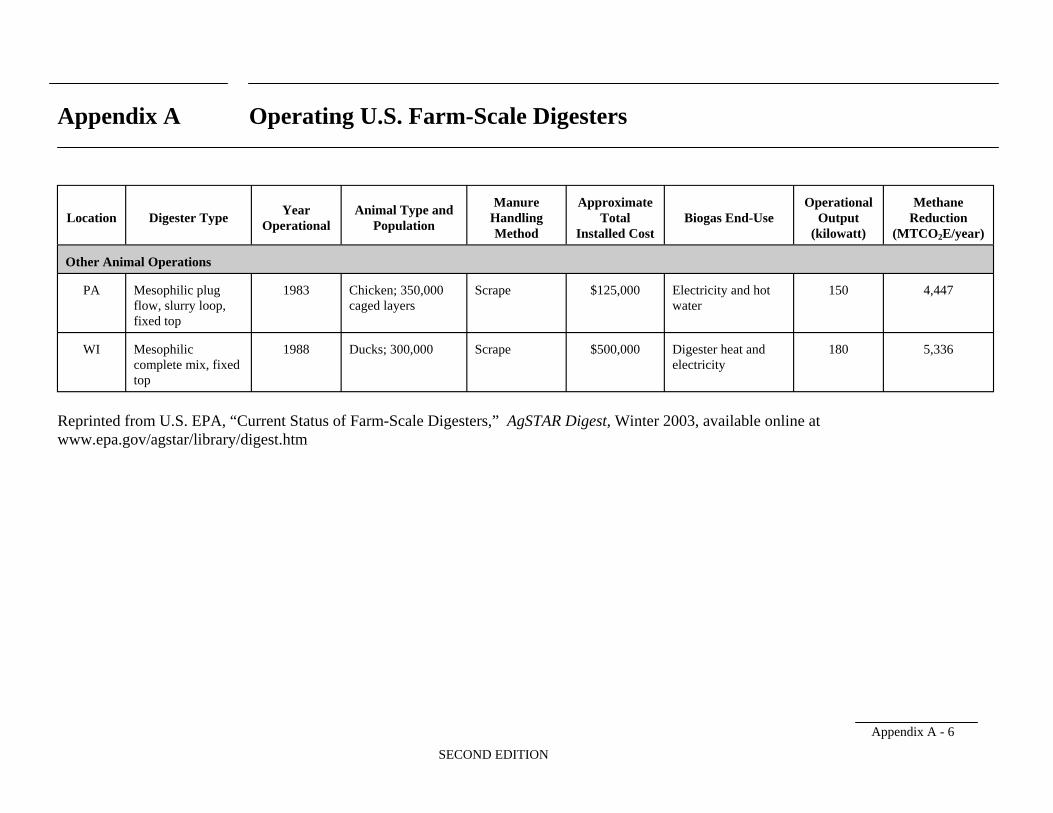
Appendix A Operating U.S. Farm-Scale Digesters
Location Digester Type Year
Operational Animal Type and
Population
Manure Handling Method
Approximate Total
Installed Cost Biogas End-Use
Operational Output
(kilowatt)
Methane Reduction
(MTCO2E/year)
Other Animal Operations
PA Mesophilic plug flow, slurry loop, fixed top
1983 Chicken; 350,000 caged layers
Scrape $125,000 Electricity and hot water
150 4,447
WI Mesophilic complete mix, fixed top
1988 Ducks; 300,000 Scrape $500,000 Digester heat and electricity
180 5,336
Reprinted from U.S. EPA, “Current Status of Farm-Scale Digesters,” AgSTAR Digest, Winter 2003, available online at www.epa.gov/agstar/library/digest.htm
Appendix A - 6
SECOND EDITION
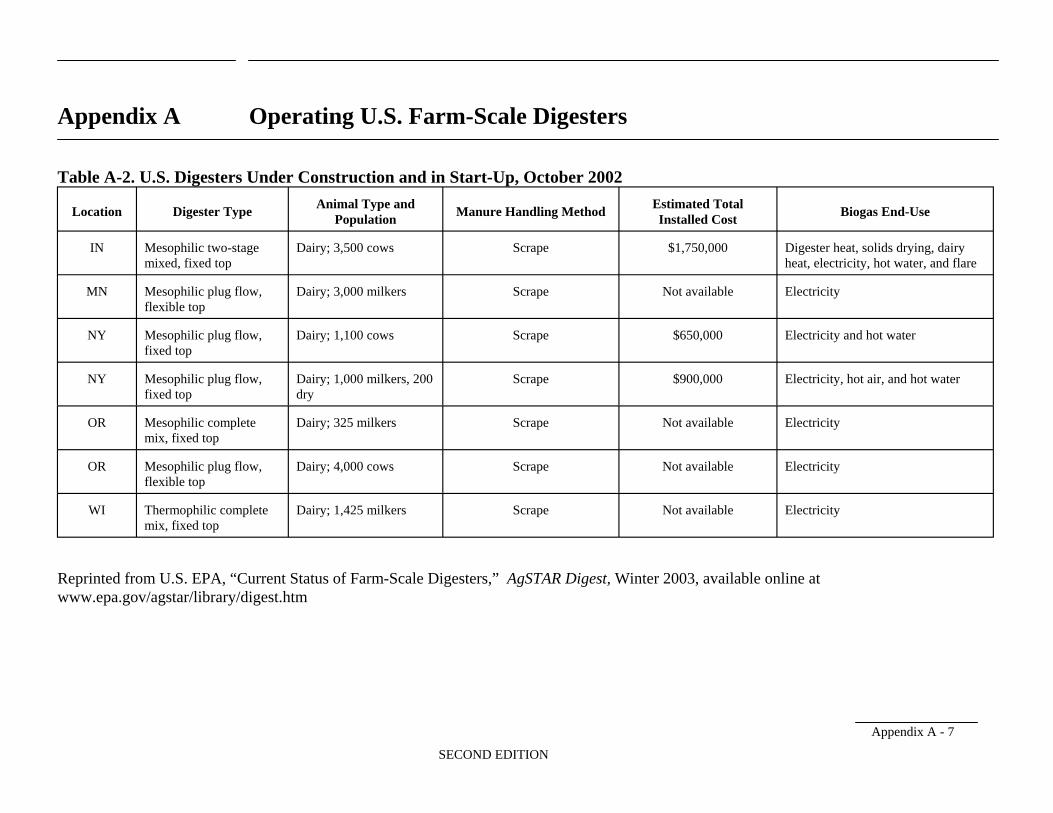
Appendix A Operating U.S. Farm-Scale Digesters
Table A-2. U.S. Digesters Under Construction and in Start-Up, October 2002
Location Digester Type Animal Type and
Population Manure Handling Method
Estimated Total Installed Cost
Biogas End-Use
IN Mesophilic two-stage mixed, fixed top
Dairy; 3,500 cows Scrape $1,750,000 Digester heat, solids drying, dairy heat, electricity, hot water, and flare
MN Mesophilic plug flow, flexible top
Dairy; 3,000 milkers Scrape Not available Electricity
NY Mesophilic plug flow, fixed top
Dairy; 1,100 cows Scrape $650,000 Electricity and hot water
NY Mesophilic plug flow, fixed top
Dairy; 1,000 milkers, 200 dry
Scrape $900,000 Electricity, hot air, and hot water
OR Mesophilic complete mix, fixed top
Dairy; 325 milkers Scrape Not available Electricity
OR Mesophilic plug flow, flexible top
Dairy; 4,000 cows Scrape Not available Electricity
WI Thermophilic complete mix, fixed top
Dairy; 1,425 milkers Scrape Not available Electricity
Reprinted from U.S. EPA, “Current Status of Farm-Scale Digesters,” AgSTAR Digest, Winter 2003, available online at www.epa.gov/agstar/library/digest.htm
Appendix A - 7
SECOND EDITION
Appendix B National Resource Conservation Service and U.S. Department of Energy Regional Contacts
Contents:
B-2. U.S. Department of Energy Regional Biomass Energy Program Contacts 5
B-1. National Resource Conservation Service Contacts
SECOND EDITION Appendix B-i
1
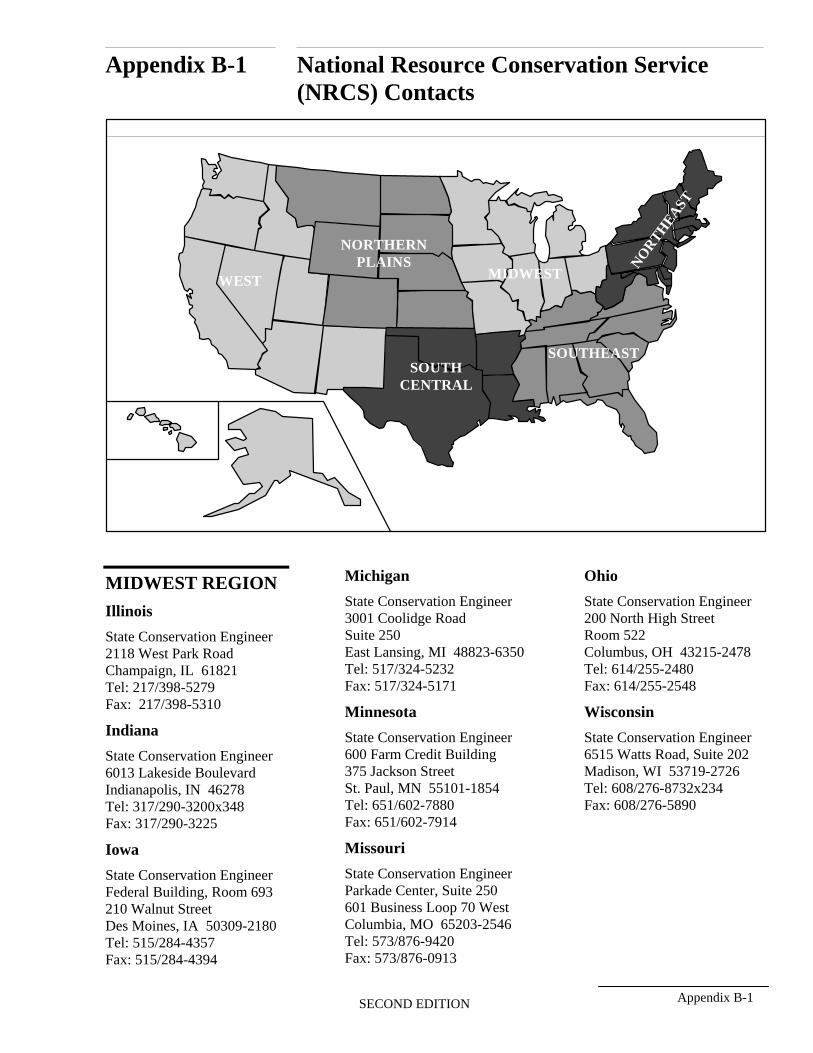
Appendix B-1
MIDWEST REGION
Illinois
State Conservation Engineer 2118 West Park Road Champaign, IL 61821 Tel: 217/398-5279 Fax: 217/398-5310
Indiana
State Conservation Engineer 6013 Lakeside Boulevard Indianapolis, IN 46278 Tel: 317/290-3200x348 Fax: 317/290-3225
Iowa
State Conservation Engineer Federal Building, Room 693 210 Walnut Street Des Moines, IA 50309-2180 Tel: 515/284-4357 Fax: 515/284-4394
National Resource Conservation Service
NO
RTH
EAST
MIDWEST
SOUTHEAST SOUTH
CENTRAL
NORTHERN PLAINS
WEST
(NRCS) Contacts
Michigan Ohio
State Conservation Engineer State Conservation Engineer 3001 Coolidge Road 200 North High Street Suite 250 Room 522 East Lansing, MI 48823-6350 Columbus, OH 43215-2478 Tel: 517/324-5232 Tel: 614/255-2480 Fax: 517/324-5171 Fax: 614/255-2548
Minnesota Wisconsin
State Conservation Engineer State Conservation Engineer 600 Farm Credit Building 6515 Watts Road, Suite 202 375 Jackson Street Madison, WI 53719-2726 St. Paul, MN 55101-1854 Tel: 608/276-8732x234 Tel: 651/602-7880 Fax: 608/276-5890 Fax: 651/602-7914
Missouri
State Conservation Engineer Parkade Center, Suite 250 601 Business Loop 70 West Columbia, MO 65203-2546 Tel: 573/876-9420 Fax: 573/876-0913
SECOND EDITION Appendix B-1
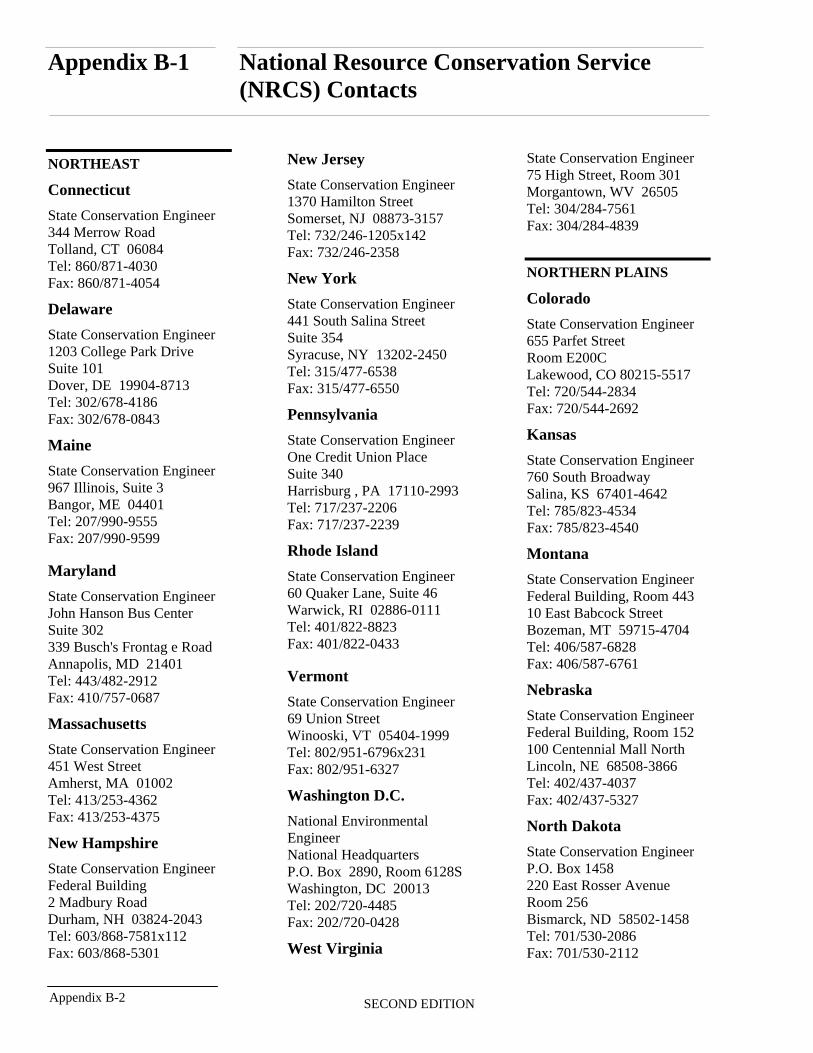
Appendix B-1
NORTHEAST
Connecticut
State Conservation Engineer 344 Merrow Road Tolland, CT 06084 Tel: 860/871-4030 Fax: 860/871-4054
Delaware
State Conservation Engineer 1203 College Park Drive Suite 101 Dover, DE 19904-8713 Tel: 302/678-4186 Fax: 302/678-0843
Maine
State Conservation Engineer 967 Illinois, Suite 3 Bangor, ME 04401 Tel: 207/990-9555 Fax: 207/990-9599
Maryland
State Conservation Engineer John Hanson Bus Center Suite 302 339 Busch's Frontag e Road Annapolis, MD 21401 Tel: 443/482-2912 Fax: 410/757-0687
Massachusetts
State Conservation Engineer 451 West Street Amherst, MA 01002 Tel: 413/253-4362 Fax: 413/253-4375
New Hampshire
State Conservation Engineer Federal Building 2 Madbury Road Durham, NH 03824-2043 Tel: 603/868-7581x112 Fax: 603/868-5301
National Resource Conservation Service (NRCS) Contacts
New Jersey
State Conservation Engineer 1370 Hamilton Street Somerset, NJ 08873-3157 Tel: 732/246-1205x142 Fax: 732/246-2358
New York
State Conservation Engineer 441 South Salina Street Suite 354 Syracuse, NY 13202-2450 Tel: 315/477-6538 Fax: 315/477-6550
Pennsylvania
State Conservation Engineer One Credit Union Place Suite 340 Harrisburg , PA 17110-2993 Tel: 717/237-2206 Fax: 717/237-2239
Rhode Island
State Conservation Engineer 60 Quaker Lane, Suite 46 Warwick, RI 02886-0111 Tel: 401/822-8823 Fax: 401/822-0433
Vermont
State Conservation Engineer 69 Union Street Winooski, VT 05404-1999 Tel: 802/951-6796x231 Fax: 802/951-6327
Washington D.C.
National Environmental Engineer National Headquarters P.O. Box 2890, Room 6128S Washington, DC 20013 Tel: 202/720-4485 Fax: 202/720-0428
West Virginia
State Conservation Engineer 75 High Street, Room 301 Morgantown, WV 26505 Tel: 304/284-7561 Fax: 304/284-4839
NORTHERN PLAINS
Colorado
State Conservation Engineer 655 Parfet Street Room E200C Lakewood, CO 80215-5517 Tel: 720/544-2834 Fax: 720/544-2692
Kansas
State Conservation Engineer 760 South Broadway Salina, KS 67401-4642 Tel: 785/823-4534 Fax: 785/823-4540
Montana
State Conservation Engineer Federal Building, Room 443 10 East Babcock Street Bozeman, MT 59715-4704 Tel: 406/587-6828 Fax: 406/587-6761
Nebraska
State Conservation Engineer Federal Building, Room 152 100 Centennial Mall North Lincoln, NE 68508-3866 Tel: 402/437-4037 Fax: 402/437-5327
North Dakota
State Conservation Engineer P.O. Box 1458 220 East Rosser Avenue Room 256 Bismarck, ND 58502-1458 Tel: 701/530-2086 Fax: 701/530-2112
Appendix B-2 SECOND EDITION
Appendix B-1 National Resource Conservation Service (NRCS) Contacts
South Dakota
State Conservation Engineer Federal Building 200 Fourth Street SW Huron, SD 57350-2475 Tel: 605/352-1260 Fax: 605/352-1270
Wyoming
State Conservation Engineer Federal Office Building Room 3124 100 East B Street Casper, WY 82601-1911 Tel: 307/261-6462 Fax: 307/261-6490
SOUTH CENTRAL
Arkansas
State Conservation Engineer Federal Building, Room 3416 700 West Capitol Avenue Little Rock, AR 72201-3228 Tel: 501/301-3141 Fax: 501/301-3188
Louisiana
State Conservation Engineer 3737 Government Street Alexandria, LA 71302 Tel: 318/473-7673 Fax: 318/473-7682
Oklahoma
State Conservation Engineer 100 USDA, Suite 206 Stillwater, OK 74074-2655 Tel: 405/742-1261 Fax: 405/742-1201
Texas
State Conservation Engineer W.R. Portage Building 101 South Main Street Temple, TX 76501-7682
Tel: 254/742-9911 Fax: 254/742/9909
SOUTHEAST
Alabama
State Conservation Engineer P.O Box 311 665 Opelika Road Auburn, AL 36830 Tel: 334/887-4536 Fax: 334/887-4551
Florida
State Conservation Engineer P.O. Box 141510 2614 N.W. 43rd Street Gainesville, FL 32614-1510 Tel: 352/338-9557 Fax: 352/338-9578
Georgia
State Conservation Engineer Federal Building, Stop 200 355 East Hancock Avenue Athens, GA 30601-2769 Tel: 706/546-2091 Fax: 706/546-2145
Kentucky
State Conservation Engineer 771 Corporate Drive Suite 110 Lexington, KY 40503-5479 Tel: 859/224-7383 Fax: 859/224-7410
Mississippi
State Conservation Engineer Federal Building, Suite 1321 100 West Capitol Street Jackson, MS 39269-1399 Tel: 601/965-5035x225 Fax: 601/965-4430
North Carolina
AgSTAR Engineer 4405 Bland Road, Suite 205 Raleigh, NC 27609-6293 Tel: 919/873-2127 Fax: 919/873-2156
Puerto Rico
State Conservation Engineer IBM Building, Suite 604 654 Munoz Rivera Avenue Hato Rey, PR 00918 Tel: 787/766-5206x232 Fax: 787/766-5987
South Carolina
State Conservation Engineer Thurmond Federal Building Room 950 1835 Assembly Street Columbia, SC 29201-2489 Tel: 803/765-5683 Fax: 803/253-3670
Tennessee
State Conservation Engineer 675 Courthouse 801 Broadway Nashville, TN 37203-3878 Tel: 615/277-2558 Fax: 615/277-2577
Virginia
State Conservation Engineer Culpepper Building, Suite 209 1606 Santa Rosa Road Richmond, VA 23229-5014 Tel: 804/287-1653 Fax: 804/287-1736
SECOND EDITION Appendix B-3
Appendix B-1 National Resource Conservation Service (NRCS) Contacts
WEST
Alaska
State Conservation Engineer 510 L Street, Suite 270 Anchorage, AK 99501 Tel: 907/271-2424x117 Fax: 907/271-3951
Arizona
State ConservationEngineer 3003 North Central Avenue Suite 800 Phoenix , AZ 85012-2945 Tel: 602/280-8839 Fax: 602/280-8805
California
State Conservation Engineer 430 G Street, #4164 Davis, CA 95616-4164 Tel: 530/792-5622 Fax: 530/792-5791
Guam
State Conservation Engineer FHB Building, Suite 301 400 Route 8 Maite, GU 96927 Tel: 671/472-7105 Fax: 671/472-7288
Hawaii
State Conservation Engineer P.O. Box 50004 300 Ala Moana Boulevard Room 4-118 Honolulu, HI 96850-0002 Tel: 808/541-2600x126 Fax: 808/541-1335
Idaho
State Conservation Engineer 9173 West Barnes Drive Suite C Boise, ID 83709-1274 Tel: 208/378-5727 Fax: 208/378-5735
Appendix B-4
New Mexico
State Conservation Engineer 6200 Jefferson NE Albuquerque, NM 871093734 Tel: 505/761-4489 Fax: 505/761-4462
Nevada
State Conservation Engineer Building F, Suite 201 5301 Longley Lane Reno, NV 89511-1805 Tel: 775/784-5317 Fax: 775/784-5939
Oregon
State Conservation Engineer 101 SW Main, Suite 1300 Portland, OR 97204-3211 Tel: 503/414-3252 Fax: 503/414-3277
Utah
State Conservation Engineer Bennett Federal Building 125 South State Street Room 4402 Salt Lake City, UT 84111 Tel: 801/524-4559 Fax: 801/524-4403
Washington
State Conservation Engineer 316 West Boone Avenue Suite 450 Spokane, WA 99201-2348 Tel: 509/323-2955 Fax: 509/323-2979
SECOND EDITION
Appendix B-2 U.S. Department of Energy Regional Biomass Energy Program Contacts
U.S. DEPARTMENT OF ENERGY
Office of National Programs 1000 Independence Avenue, SW Washington, DC 20585 Tel: 202/586-1480 Fax: 202/586-1605
NORTHEAST
CONEG Policy Research Center, Inc. 400 North Capitol Street, NW Suite 382 Washington, DC 20001 Tel: 202/624-8454 Fax: 202/624-8463
States served: Connecticut, Delaware, Maine, Maryland, Massachusetts, New Hampshire, New Jersey, New York, Pennsylvania, Rhode Island, and Vermont
SOUTHEAST
Southern States Energy Board 6325 Amherst Court Norcross, GA 30092 Tel: 770/242-7711 Fax: 770/242-9956
States served: Alabama, Arkansas, Florida, Georgia, Kentucky, Louisiana, Mississippi, Missouri, North Carolina, South Carolina, Tennessee, Virginia, and West Virginia
GREAT LAKES
Council of Great Lakes Governors 35 East Wacker Drive, Suite 1850 Chicago, IL 60601 Tel: 312/407-0177 Fax: 312/407-0038
States served: Illinois, Indiana, Iowa, Michigan, Minnesota, Ohio, and Wisconsin.
WESTERN
Denver Regional Office U.S. Department of Energy 1617 Cole Boulevard Golden, CO 80401 Tel: 303/275-4821 Fax: 303/275-4830
States served: Arizona, California, Colorado, Kansas, Nebraska, Nevada, New Mexico, North Dakota, Oklahoma, South Dakota, Texas, Utah, and Wyoming.
PACIFIC NORTHWEST
Seattle Regional Office U.S. Department of Energy 800 Fifth Avenue, Suite 3950 Seattle, WA 98104 Tel: 206/553-2079 Fax: 206/553-2200
States served: Alaska, Hawaii, Idaho, Oregon, Montana, and Washington.
SECOND EDITION Appendix B-5
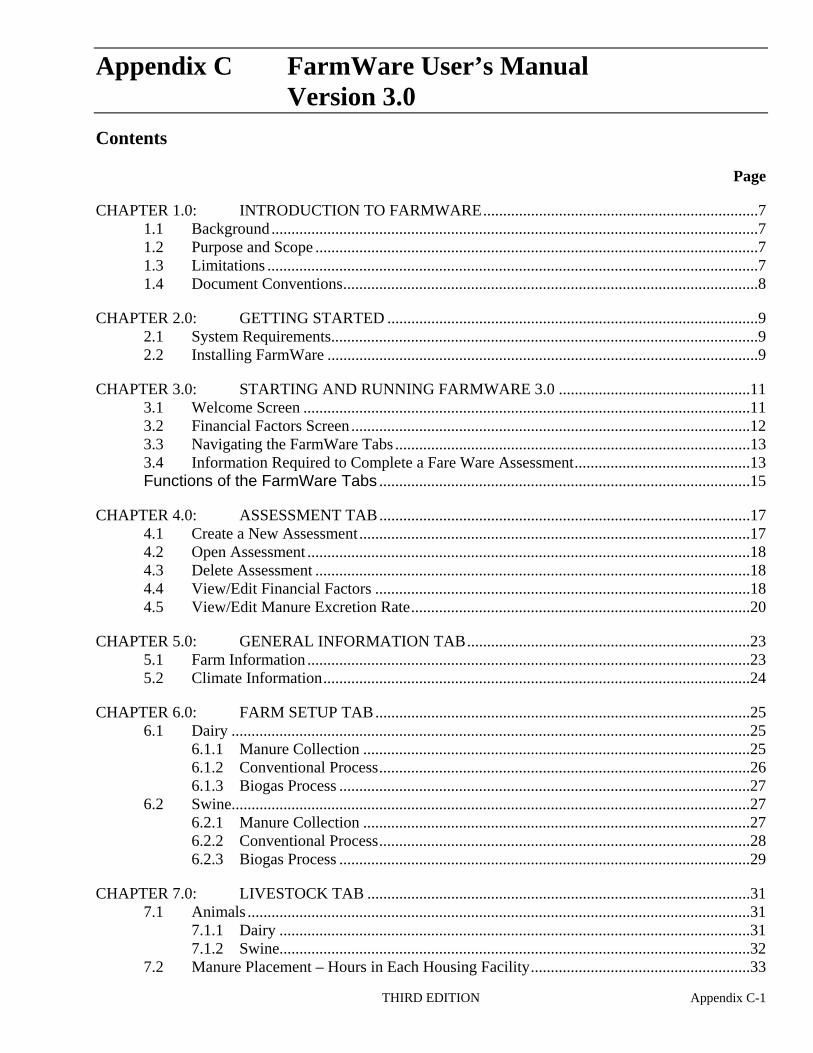
Appendix C FarmWare User’s Manual Version 3.0
Contents
Page
CHAPTER 1.0: INTRODUCTION TO FARMWARE.....................................................................7 1.1 Background..........................................................................................................................7 1.2 Purpose and Scope ...............................................................................................................7 1.3 Limitations ...........................................................................................................................7 1.4 Document Conventions........................................................................................................8
CHAPTER 2.0: GETTING STARTED .............................................................................................9 2.1 System Requirements...........................................................................................................9 2.2 Installing FarmWare ............................................................................................................9
CHAPTER 3.0: STARTING AND RUNNING FARMWARE 3.0 ................................................11 3.1 Welcome Screen ................................................................................................................11 3.2 Financial Factors Screen ....................................................................................................12 3.3 Navigating the FarmWare Tabs .........................................................................................13 3.4 Information Required to Complete a Fare Ware Assessment............................................13 Functions of the FarmWare Tabs .............................................................................................15
CHAPTER 4.0: ASSESSMENT TAB.............................................................................................17 4.1 Create a New Assessment..................................................................................................174.2 Open Assessment ...............................................................................................................18 4.3 Delete Assessment .............................................................................................................18 4.4 View/Edit Financial Factors ..............................................................................................184.5 View/Edit Manure Excretion Rate.....................................................................................20
CHAPTER 5.0: GENERAL INFORMATION TAB.......................................................................23 5.1 Farm Information ...............................................................................................................23 5.2 Climate Information...........................................................................................................24
CHAPTER 6.0: FARM SETUP TAB..............................................................................................25 6.1 Dairy ..................................................................................................................................25
6.1.1 Manure Collection .................................................................................................25 6.1.2 Conventional Process.............................................................................................26 6.1.3 Biogas Process .......................................................................................................27
6.2 Swine..................................................................................................................................27 6.2.1 Manure Collection .................................................................................................27 6.2.2 Conventional Process.............................................................................................28 6.2.3 Biogas Process .......................................................................................................29
CHAPTER 7.0: LIVESTOCK TAB ................................................................................................31 7.1 Animals ..............................................................................................................................31
7.1.1 Dairy ......................................................................................................................31 7.1.2 Swine......................................................................................................................32
7.2 Manure Placement – Hours in Each Housing Facility.......................................................33
THIRD EDITION Appendix C-1
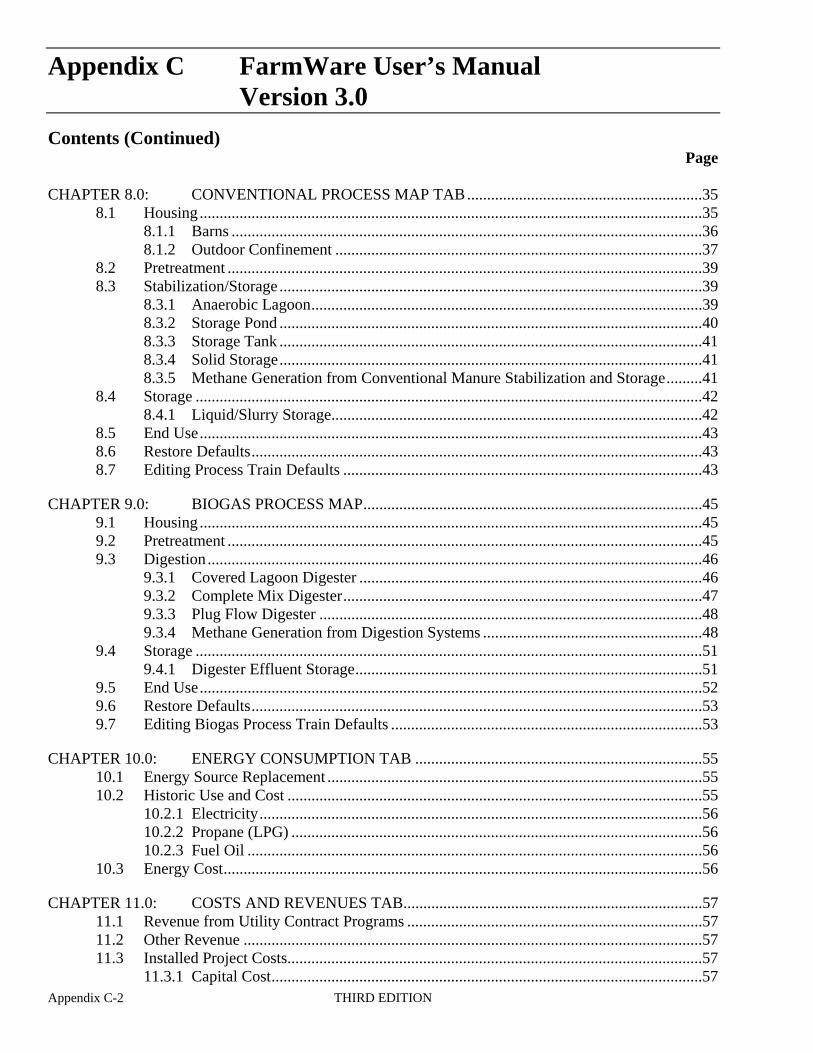
Appendix C FarmWare User’s Manual Version 3.0
Contents (Continued) Page
CHAPTER 8.0: CONVENTIONAL PROCESS MAP TAB...........................................................35 8.1 Housing ..............................................................................................................................35
8.1.1 Barns ......................................................................................................................36 8.1.2 Outdoor Confinement ............................................................................................37
8.2 Pretreatment .......................................................................................................................39 8.3 Stabilization/Storage ..........................................................................................................39
8.3.1 Anaerobic Lagoon..................................................................................................39 8.3.2 Storage Pond ..........................................................................................................40 8.3.3 Storage Tank ..........................................................................................................41 8.3.4 Solid Storage..........................................................................................................418.3.5 Methane Generation from Conventional Manure Stabilization and Storage.........41
8.4 Storage ...............................................................................................................................42 8.4.1 Liquid/Slurry Storage.............................................................................................42
8.5 End Use..............................................................................................................................43 8.6 Restore Defaults.................................................................................................................43 8.7 Editing Process Train Defaults ..........................................................................................43
CHAPTER 9.0: BIOGAS PROCESS MAP.....................................................................................45 9.1 Housing ..............................................................................................................................45 9.2 Pretreatment .......................................................................................................................45 9.3 Digestion............................................................................................................................46
9.3.1 Covered Lagoon Digester ......................................................................................46 9.3.2 Complete Mix Digester..........................................................................................47 9.3.3 Plug Flow Digester ................................................................................................48 9.3.4 Methane Generation from Digestion Systems .......................................................48
9.4 Storage ...............................................................................................................................51 9.4.1 Digester Effluent Storage.......................................................................................51
9.5 End Use..............................................................................................................................52 9.6 Restore Defaults.................................................................................................................53 9.7 Editing Biogas Process Train Defaults ..............................................................................53
CHAPTER 10.0: ENERGY CONSUMPTION TAB ........................................................................55 10.1 Energy Source Replacement ..............................................................................................55 10.2 Historic Use and Cost ........................................................................................................55
10.2.1 Electricity...............................................................................................................56 10.2.2 Propane (LPG) .......................................................................................................56 10.2.3 Fuel Oil ..................................................................................................................56
10.3 Energy Cost........................................................................................................................56
CHAPTER 11.0: COSTS AND REVENUES TAB...........................................................................57 11.1 Revenue from Utility Contract Programs ..........................................................................57 11.2 Other Revenue ...................................................................................................................57 11.3 Installed Project Costs........................................................................................................57
11.3.1 Capital Cost............................................................................................................57 Appendix C-2 THIRD EDITION
Appendix C FarmWare User’s Manual Version 3.0
Contents (Continued) Page
11.3.2 Operating and Maintenance Cost...........................................................................57
CHAPTER 12.0: REPORTS TAB.....................................................................................................59 12.1 Executive Summary ...........................................................................................................59 12.2 Introduction to the Full Report ..........................................................................................60 12.3 User Inputs .........................................................................................................................60 12.4 Technical Feasibility..........................................................................................................61 12.5 Economic Feasibility .........................................................................................................62 12.6 Environmental Performance ..............................................................................................63 12.7 Warnings ............................................................................................................................63
CHAPTER 13.0: ACRONYMS.........................................................................................................65
CHAPTER 14.0: DEFINITIONS.......................................................................................................67
THIRD EDITION Appendix C-3
Appendix C FarmWare User’s Manual Version 3.0
List of Tables
Page
3-1 Information Required to Complete the Assessment ..........................................................13
3-2 Default Information Used to Complete the Assessment....................................................14
4-1 Default Manure Excretion Rates........................................................................................20
4-2 Converted Default Manure Excretion Rates ......................................................................21
7-1 FarmWare Animal Count Estimates for Swine Farms ......................................................32
8-1 Open Lot Area per Animal Assumed by FarmWare .........................................................38
8-2 Solid Separation Types in FarmWare ................................................................................39
9-1 Applicable Total Solids Content of Influent to Digestion .................................................46
9-2 Default Design Parameters for Digesters...........................................................................46
9-3 Hydraulic Retention Times Assumed for Digesters in FarmWare ....................................50
Appendix C-4 THIRD EDITION
Appendix C FarmWare User’s Manual Version 3.0
List of Figures
Page
3-1 Welcome Screen ................................................................................................................11
3-2 Financial Factors Screen ....................................................................................................12
3-3 Financial Factors Update Screen .......................................................................................12
4-1 Assessment Tab .................................................................................................................17
4-2 Open Assessment Screen ...................................................................................................18
4-3 Delete Assessment Screen .................................................................................................18
4-4 Financial Factors Screen ....................................................................................................19
4-5 Financial Factors Update Screen .......................................................................................19
5-1 General Information Tab....................................................................................................23
6-1 Farm Setup Tab (Dairies)...................................................................................................25
6-2 Farm Setup Tab (Swine) ....................................................................................................28
7-1 Livestock Tab (Dairy)........................................................................................................31
7-2 Livestock Tab (Swine).......................................................................................................33
8-1 Conventional Process Train Screen ...................................................................................35
8-2 Flush Barn Screen ..............................................................................................................36
8-3 Scrape Barn Screen ............................................................................................................36
8-4 Pit Recharge Barn Screen ..................................................................................................37
8-5 Open Lot Design Parameters Screen .................................................................................37
8-6 Pasture Screen....................................................................................................................38
8-7 Milking Center Process Water Screen ...............................................................................39
8-8 Anaerobic Lagoon Design Parameters Screen...................................................................40
8-9 Storage Pond Design Parameters Screen ...........................................................................40
8-10 Storage Tank Design Parameters Screen ...........................................................................41
THIRD EDITION Appendix C-5
Appendix C FarmWare User’s Manual Version 3.0
List of Figures (Continued) Page
8-11 Liquid/Slurry Storage Design Parameters Screen..............................................................43
9-1 Biogas Process Train Screen..............................................................................................45
9-2 Covered Lagoon Digester Design Parameters Screen .......................................................47
9-3 Complete Mix Digester Design Parameters Screen...........................................................47
9-4 Plug Flow Digester Design Parameters Screen .................................................................48
9-5 Liquid/Slurry Storage Design Parameters Screen..............................................................52
9-6 Biogas Utilization (Methane Shack) Screen ......................................................................53
Appendix C-6 THIRD EDITION
Appendix C FarmWare User’s Manual Version 3.0CHAPTER 1.0: INTRODUCTION TO FARMWARE
This User’s Guide provides step-by-step instructions and guidance on how to use AgSTAR FarmWare 3.0.
1.1 Background
AgSTAR FarmWare 3.0 is a computerized decision support program that assesses whether or not a methane production, capture, and utilization system can be integrated into your farm’s existing or planned manure management system. FarmWare estimates how much the system will cost and the financial benefits that may be gained by producing energy for on-farm use or sale or both.
If you were a FarmWare 2.0 user, you will notice some changes in FarmWare 3.0. FarmWare 3.0 contains the same options and general information; however, the user interface has been updated and the Interview portion of the application was removed. Additionally, FarmWare 3.0 presents environmental benefits associated with the use of biogas recovery waste management. Finally, FarmWare 3.0 contains an option to simultaneously model the performance of a waste management system with and without anaerobic digestion and biogas recovery.
1.2 Purpose and Scope
This User’s Guide provides step-by-step instructions and guidance about how to use FarmWare 3.0 and contains:
Instructions for first-time users; An introduction to navigating through FarmWare; and Information for each of FarmWare’s primary components.
1.3 Limitations
The FarmWare assessment is only the first step in evaluating the technical and financial feasibility of biogas production for use as a source of energy at a farm. This assessment should be considered preliminary and only be used as input to determining whether to proceed with a more rigorous assessment. It is imperative that a qualified engineer conducts a detailed feasibility assessment prior to commencing facility design or construction activities.
It is important to note also what types of farms are best suited for a biogas recovery system. Livestock facilities that collect manure on a daily basis as a liquid (total solid content < 5%), slurry (total solid content of 5% to 10%), or semi-solid (total solid content of 10% to 20%) are the best candidates for a biogas recovery system.
THIRD EDITION Appendix C-7
Appendix C FarmWare User’s Manual Version 3.01.4 Document Conventions
This user’s guide will use the following conventions:
Bold = software tab name in the various screens; Underline = software labels on the various screens; and Italic = software buttons on the various screens.
Appendix C-8 THIRD EDITION
Appendix C FarmWare User’s Manual Version 3.0CHAPTER 2.0: GETTING STARTED
The following sections describe what you need to know to begin using FarmWare 3.0.
2.1 System Requirements
FarmWare requires the following:
Hardware Requirements — IBM compatible computer with a Pentium processor, — 128 megabytes of RAM (256 megabytes of RAM recommended), — Hard drive with at least 50 megabytes of space available, and — Mouse to operate the menus and screens.
Software Requirements — Microsoft Windows XP or 2000.
Other — Screen Resolution (recommended) 800 x 600 or greater, and — Printer, to print FarmWare reports.
2.2 Installing FarmWare
To install FarmWare on your computer, follow the instructions below:
Copy the installation file from the FarmWare CD or from the EPA AgStar webpage: http://www.epa.gov/agstar/resources/handbook.html onto your hard drive;
Double select the installation file named ”setup.exe”; and Follow the onscreen instructions during the installation process.
THIRD EDITION Appendix C-9

Appendix C FarmWare User’s Manual Version 3.0
(This page intentionally left blank.)
Appendix C-10 THIRD EDITION
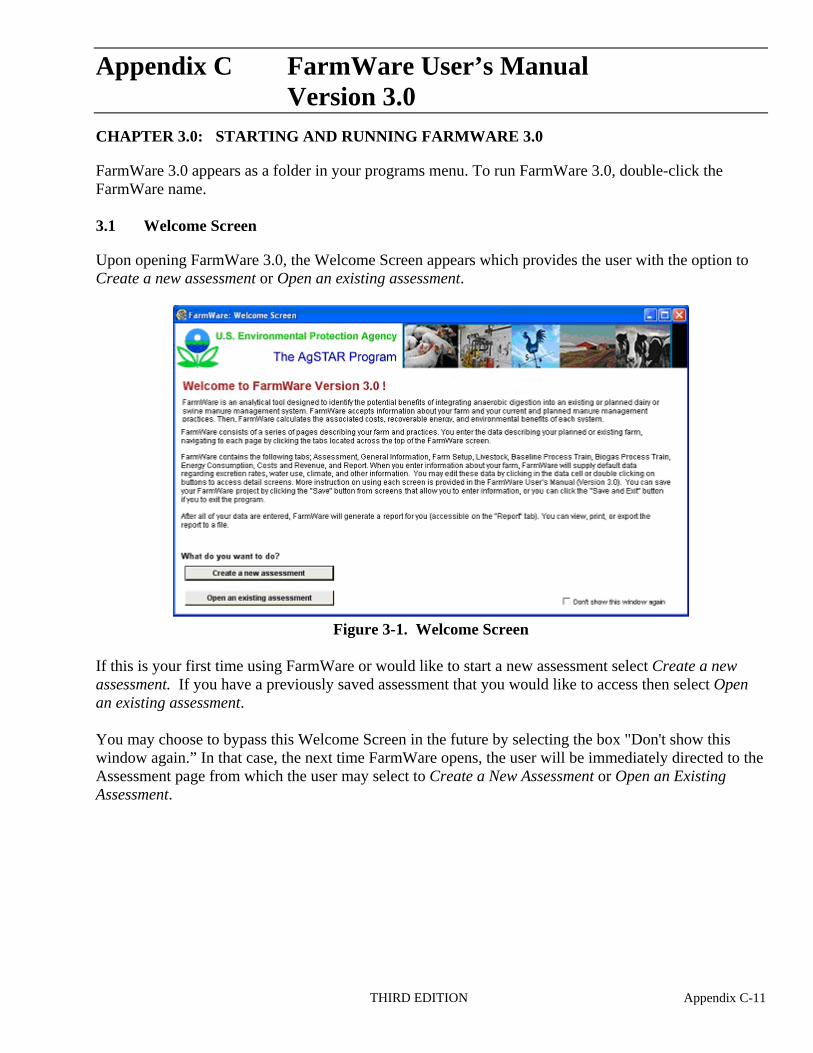
Appendix C FarmWare User’s Manual Version 3.0CHAPTER 3.0: STARTING AND RUNNING FARMWARE 3.0
FarmWare 3.0 appears as a folder in your programs menu. To run FarmWare 3.0, double-click the FarmWare name.
3.1 Welcome Screen
Upon opening FarmWare 3.0, the Welcome Screen appears which provides the user with the option to Create a new assessment or Open an existing assessment.
Figure 3-1. Welcome Screen
If this is your first time using FarmWare or would like to start a new assessment select Create a new assessment. If you have a previously saved assessment that you would like to access then select Open an existing assessment.
You may choose to bypass this Welcome Screen in the future by selecting the box "Don't show this window again.” In that case, the next time FarmWare opens, the user will be immediately directed to the Assessment page from which the user may select to Create a New Assessment or Open an Existing Assessment.
THIRD EDITION Appendix C-11
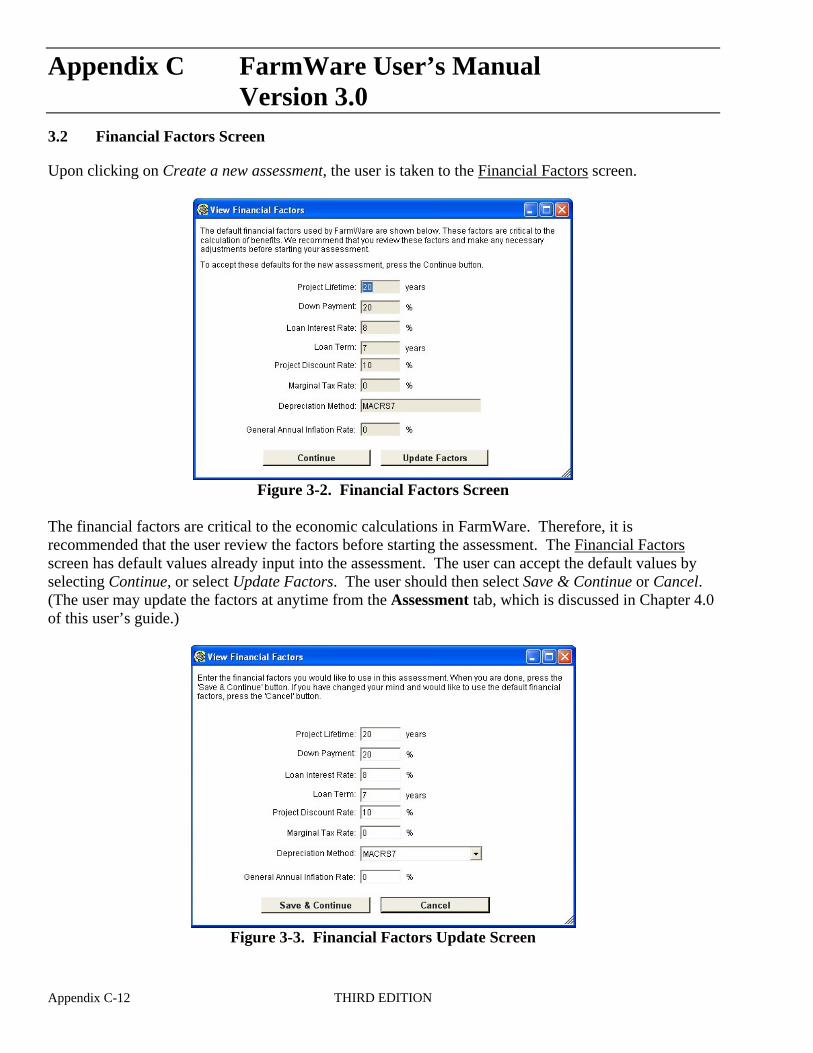
Appendix C FarmWare User’s Manual Version 3.03.2 Financial Factors Screen
Upon clicking on Create a new assessment, the user is taken to the Financial Factors screen.
Figure 3-2. Financial Factors Screen
The financial factors are critical to the economic calculations in FarmWare. Therefore, it is recommended that the user review the factors before starting the assessment. The Financial Factors screen has default values already input into the assessment. The user can accept the default values by selecting Continue, or select Update Factors. The user should then select Save & Continue or Cancel. (The user may update the factors at anytime from the Assessment tab, which is discussed in Chapter 4.0 of this user’s guide.)
Figure 3-3. Financial Factors Update Screen
Appendix C-12 THIRD EDITION
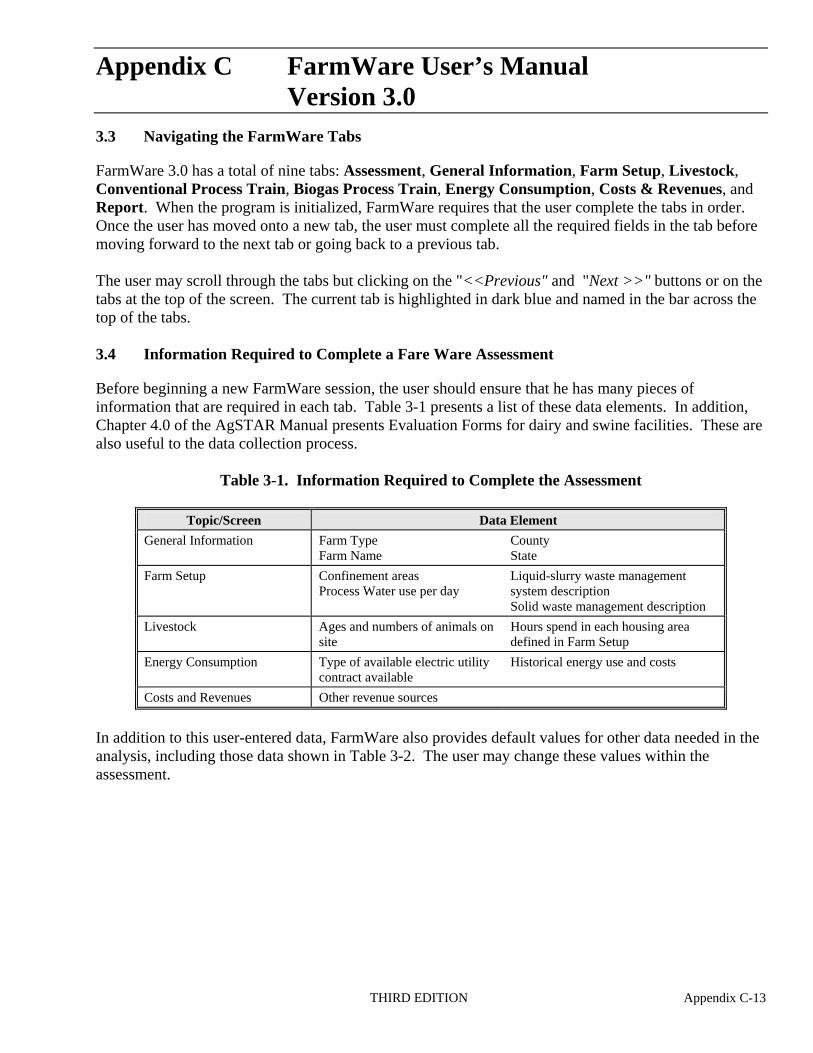
Appendix C FarmWare User’s Manual Version 3.03.3 Navigating the FarmWare Tabs
FarmWare 3.0 has a total of nine tabs: Assessment, General Information, Farm Setup, Livestock, Conventional Process Train, Biogas Process Train, Energy Consumption, Costs & Revenues, and Report. When the program is initialized, FarmWare requires that the user complete the tabs in order. Once the user has moved onto a new tab, the user must complete all the required fields in the tab before moving forward to the next tab or going back to a previous tab.
The user may scroll through the tabs but clicking on the "<<Previous" and "Next >>" buttons or on the tabs at the top of the screen. The current tab is highlighted in dark blue and named in the bar across the top of the tabs.
3.4 Information Required to Complete a Fare Ware Assessment
Before beginning a new FarmWare session, the user should ensure that he has many pieces of information that are required in each tab. Table 3-1 presents a list of these data elements. In addition, Chapter 4.0 of the AgSTAR Manual presents Evaluation Forms for dairy and swine facilities. These are also useful to the data collection process.
Table 3-1. Information Required to Complete the Assessment
Topic/Screen Data Element
General Information Farm Type Farm Name
County State
Farm Setup Confinement areas Process Water use per day
Liquid-slurry waste management system description Solid waste management description
Livestock Ages and numbers of animals on site
Hours spend in each housing area defined in Farm Setup
Energy Consumption Type of available electric utility contract available
Historical energy use and costs
Costs and Revenues Other revenue sources
In addition to this user-entered data, FarmWare also provides default values for other data needed in the analysis, including those data shown in Table 3-2. The user may change these values within the assessment.
THIRD EDITION Appendix C-13
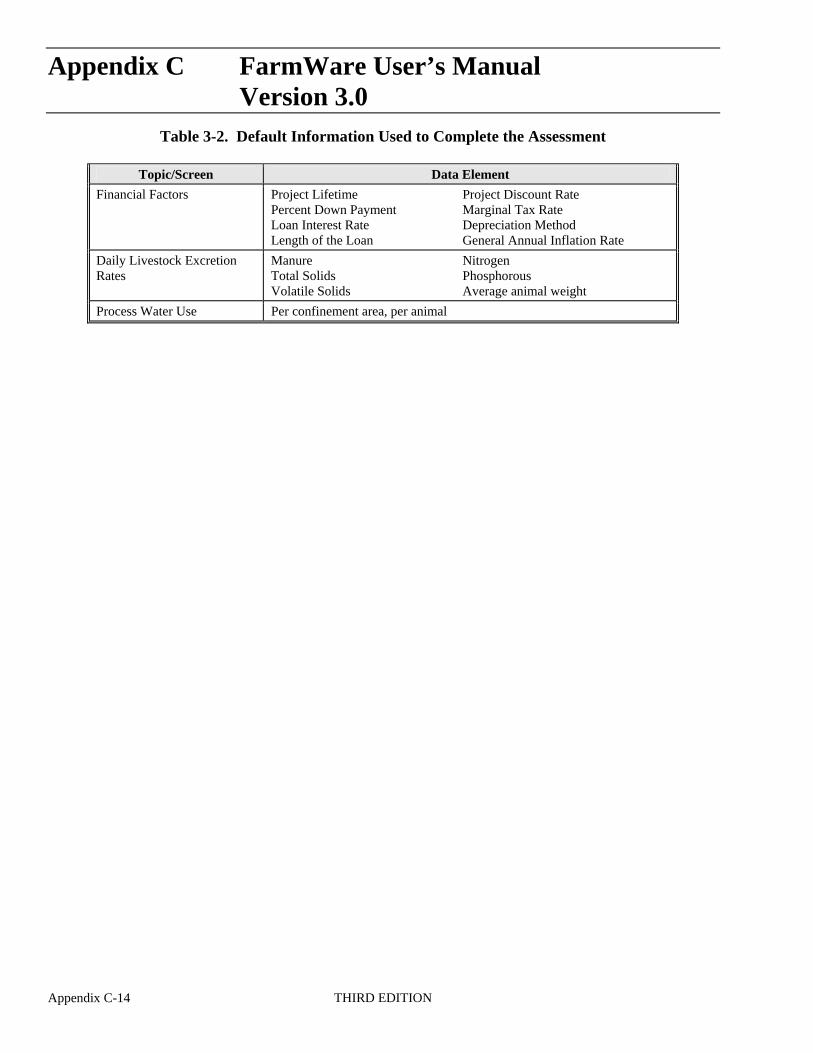
Appendix C FarmWare User’s Manual Version 3.0
Table 3-2. Default Information Used to Complete the Assessment
Topic/Screen Data Element
Financial Factors Project Lifetime Percent Down Payment Loan Interest Rate Length of the Loan
Project Discount Rate Marginal Tax Rate Depreciation Method General Annual Inflation Rate
Daily Livestock Excretion Rates
Manure Total Solids Volatile Solids
Nitrogen Phosphorous Average animal weight
Process Water Use Per confinement area, per animal
Appendix C-14 THIRD EDITION
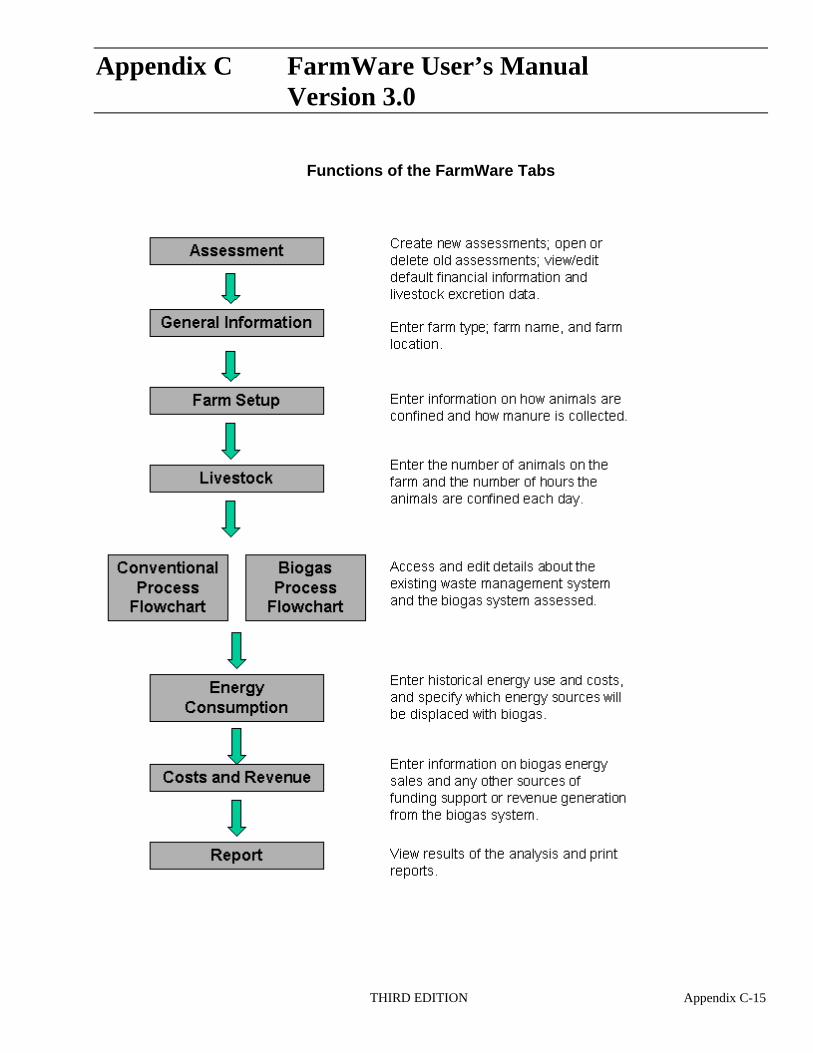
Appendix C FarmWare User’s Manual Version 3.0
Functions of the FarmWare Tabs
THIRD EDITION Appendix C-15

Appendix C FarmWare User’s Manual Version 3.0
(This page intentionally left blank.)
Appendix C-16 THIRD EDITION
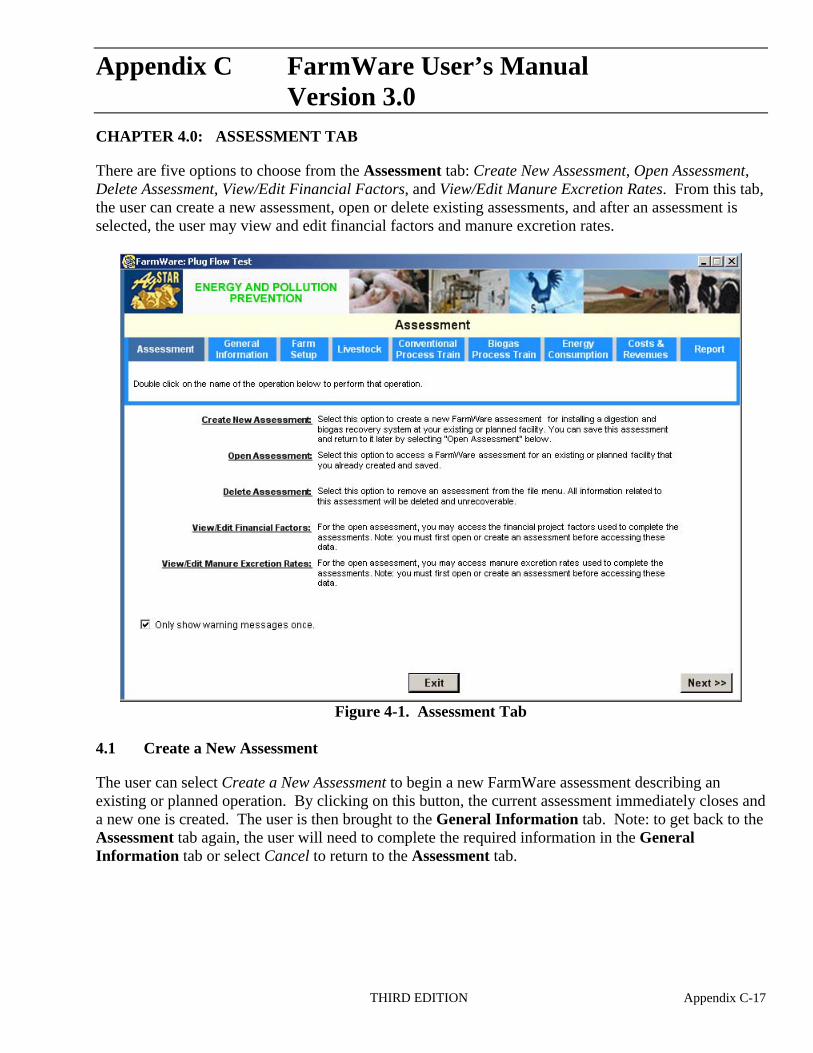
Appendix C FarmWare User’s Manual Version 3.0CHAPTER 4.0: ASSESSMENT TAB
There are five options to choose from the Assessment tab: Create New Assessment, Open Assessment, Delete Assessment, View/Edit Financial Factors, and View/Edit Manure Excretion Rates. From this tab, the user can create a new assessment, open or delete existing assessments, and after an assessment is selected, the user may view and edit financial factors and manure excretion rates.
Figure 4-1. Assessment Tab
4.1 Create a New Assessment
The user can select Create a New Assessment to begin a new FarmWare assessment describing an existing or planned operation. By clicking on this button, the current assessment immediately closes and a new one is created. The user is then brought to the General Information tab. Note: to get back to the Assessment tab again, the user will need to complete the required information in the General Information tab or select Cancel to return to the Assessment tab.
THIRD EDITION Appendix C-17
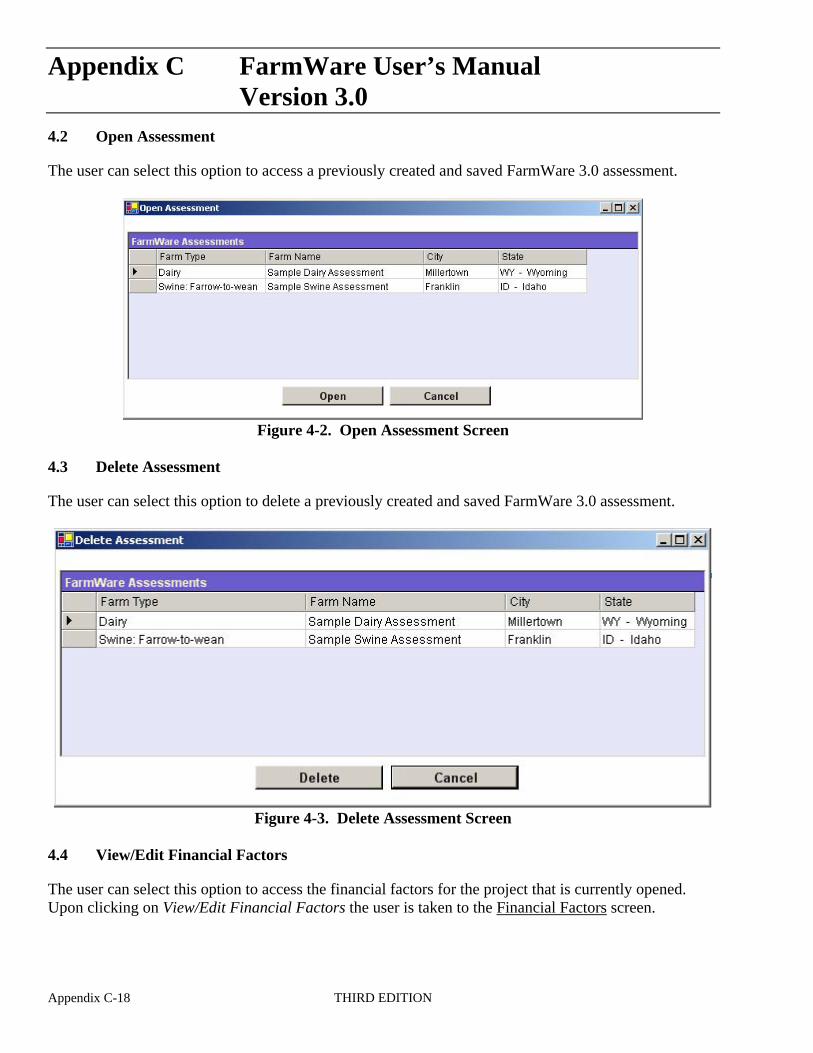
Appendix C FarmWare User’s Manual Version 3.04.2 Open Assessment
The user can select this option to access a previously created and saved FarmWare 3.0 assessment.
Figure 4-2. Open Assessment Screen
4.3 Delete Assessment
The user can select this option to delete a previously created and saved FarmWare 3.0 assessment.
Figure 4-3. Delete Assessment Screen
4.4 View/Edit Financial Factors
The user can select this option to access the financial factors for the project that is currently opened. Upon clicking on View/Edit Financial Factors the user is taken to the Financial Factors screen.
Appendix C-18 THIRD EDITION
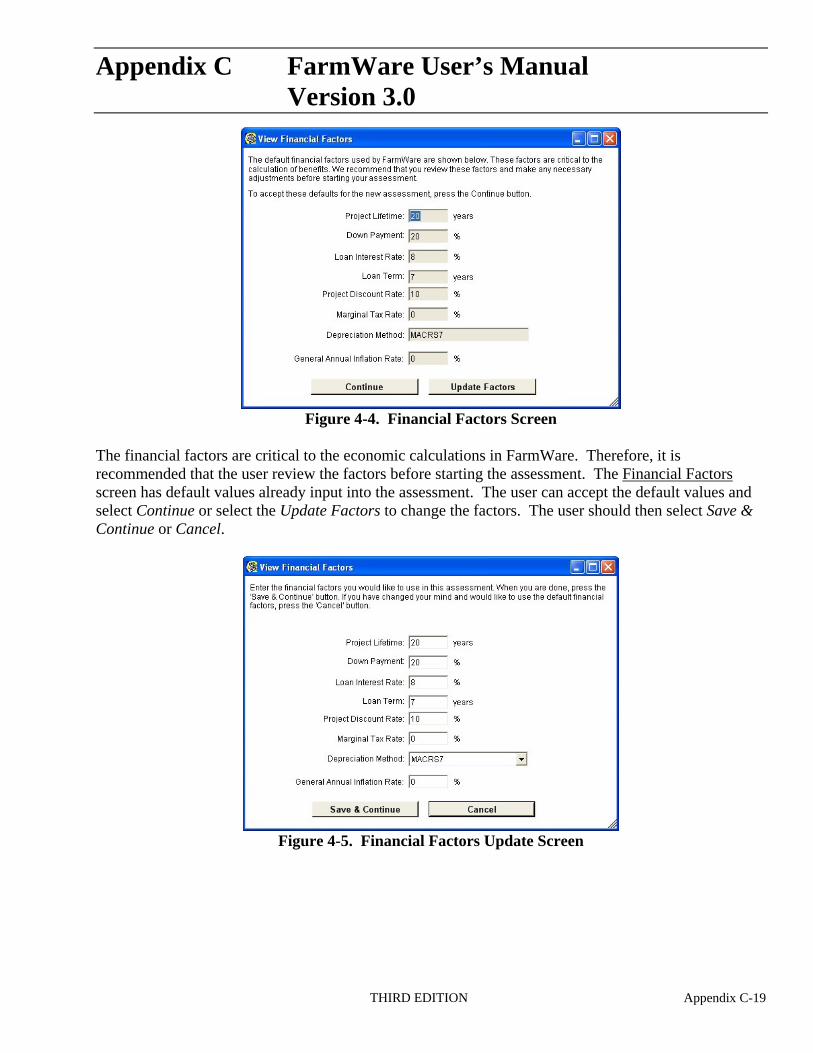
Appendix C FarmWare User’s Manual Version 3.0
Figure 4-4. Financial Factors Screen
The financial factors are critical to the economic calculations in FarmWare. Therefore, it is recommended that the user review the factors before starting the assessment. The Financial Factors screen has default values already input into the assessment. The user can accept the default values and select Continue or select the Update Factors to change the factors. The user should then select Save & Continue or Cancel.
Figure 4-5. Financial Factors Update Screen
THIRD EDITION Appendix C-19
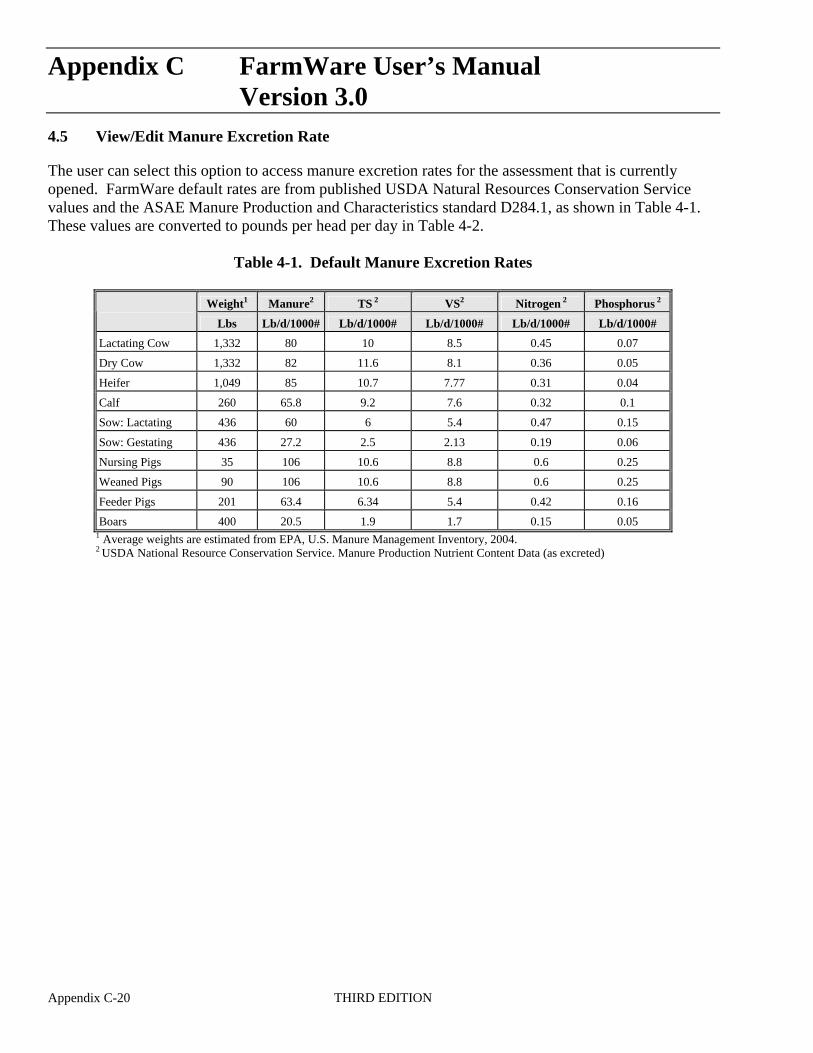
Appendix C FarmWare User’s Manual Version 3.04.5 View/Edit Manure Excretion Rate
The user can select this option to access manure excretion rates for the assessment that is currently opened. FarmWare default rates are from published USDA Natural Resources Conservation Service values and the ASAE Manure Production and Characteristics standard D284.1, as shown in Table 4-1. These values are converted to pounds per head per day in Table 4-2.
Table 4-1. Default Manure Excretion Rates
Weight1 Manure2 TS 2 VS2 Nitrogen 2 Phosphorus 2
Lbs Lb/d/1000# Lb/d/1000# Lb/d/1000# Lb/d/1000# Lb/d/1000#
Lactating Cow 1,332 80 10 8.5 0.45 0.07
Dry Cow 1,332 82 11.6 8.1 0.36 0.05
Heifer 1,049 85 10.7 7.77 0.31 0.04
Calf 260 65.8 9.2 7.6 0.32 0.1
Sow: Lactating 436 60 6 5.4 0.47 0.15
Sow: Gestating 436 27.2 2.5 2.13 0.19 0.06
Nursing Pigs 35 106 10.6 8.8 0.6 0.25
Weaned Pigs 90 106 10.6 8.8 0.6 0.25
Feeder Pigs 201 63.4 6.34 5.4 0.42 0.16
Boars 400 20.5 1.9 1.7 0.15 0.05 1 Average weights are estimated from EPA, U.S. Manure Management Inventory, 2004. 2 USDA National Resource Conservation Service. Manure Production Nutrient Content Data (as excreted)
Appendix C-20 THIRD EDITION
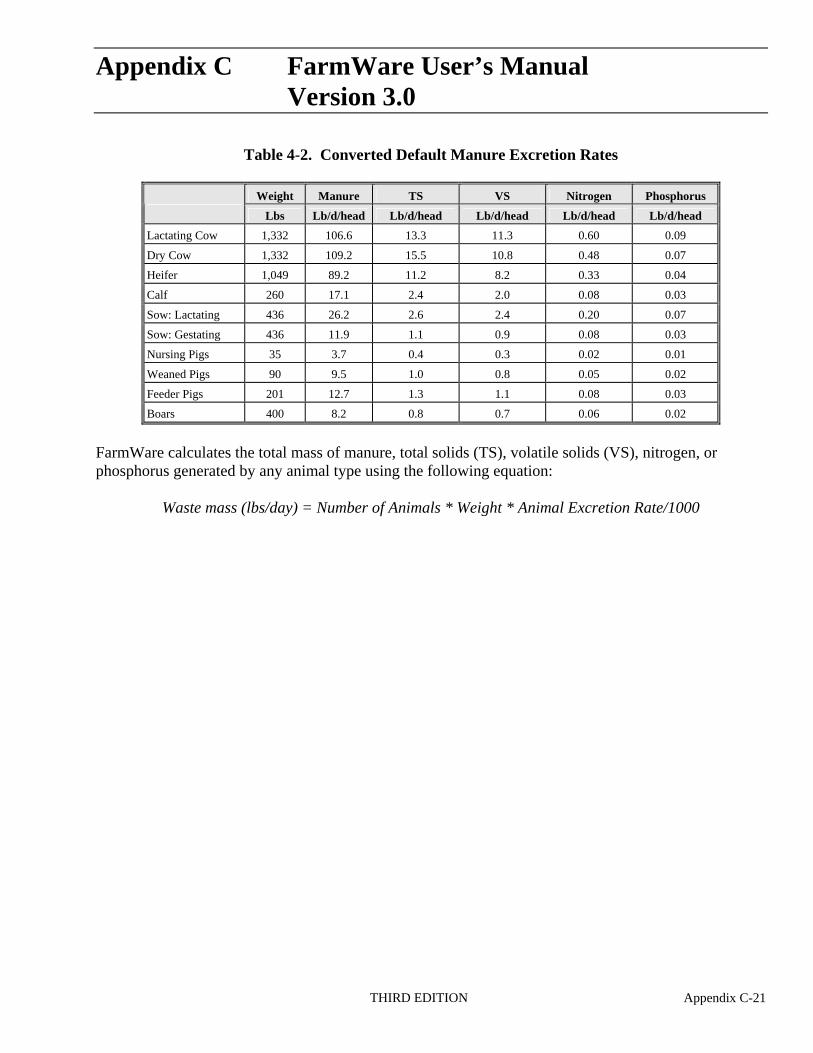
Appendix C FarmWare User’s Manual Version 3.0
Table 4-2. Converted Default Manure Excretion Rates
Weight Manure TS VS Nitrogen Phosphorus
Lbs Lb/d/head Lb/d/head Lb/d/head Lb/d/head Lb/d/head
Lactating Cow 1,332 106.6 13.3 11.3 0.60 0.09
Dry Cow 1,332 109.2 15.5 10.8 0.48 0.07
Heifer 1,049 89.2 11.2 8.2 0.33 0.04
Calf 260 17.1 2.4 2.0 0.08 0.03
Sow: Lactating 436 26.2 2.6 2.4 0.20 0.07
Sow: Gestating 436 11.9 1.1 0.9 0.08 0.03
Nursing Pigs 35 3.7 0.4 0.3 0.02 0.01
Weaned Pigs 90 9.5 1.0 0.8 0.05 0.02
Feeder Pigs 201 12.7 1.3 1.1 0.08 0.03
Boars 400 8.2 0.8 0.7 0.06 0.02
FarmWare calculates the total mass of manure, total solids (TS), volatile solids (VS), nitrogen, or phosphorus generated by any animal type using the following equation:
Waste mass (lbs/day) = Number of Animals * Weight * Animal Excretion Rate/1000
THIRD EDITION Appendix C-21

Appendix C FarmWare User’s Manual Version 3.0
(This page intentionally left blank.)
Appendix C-22 THIRD EDITION
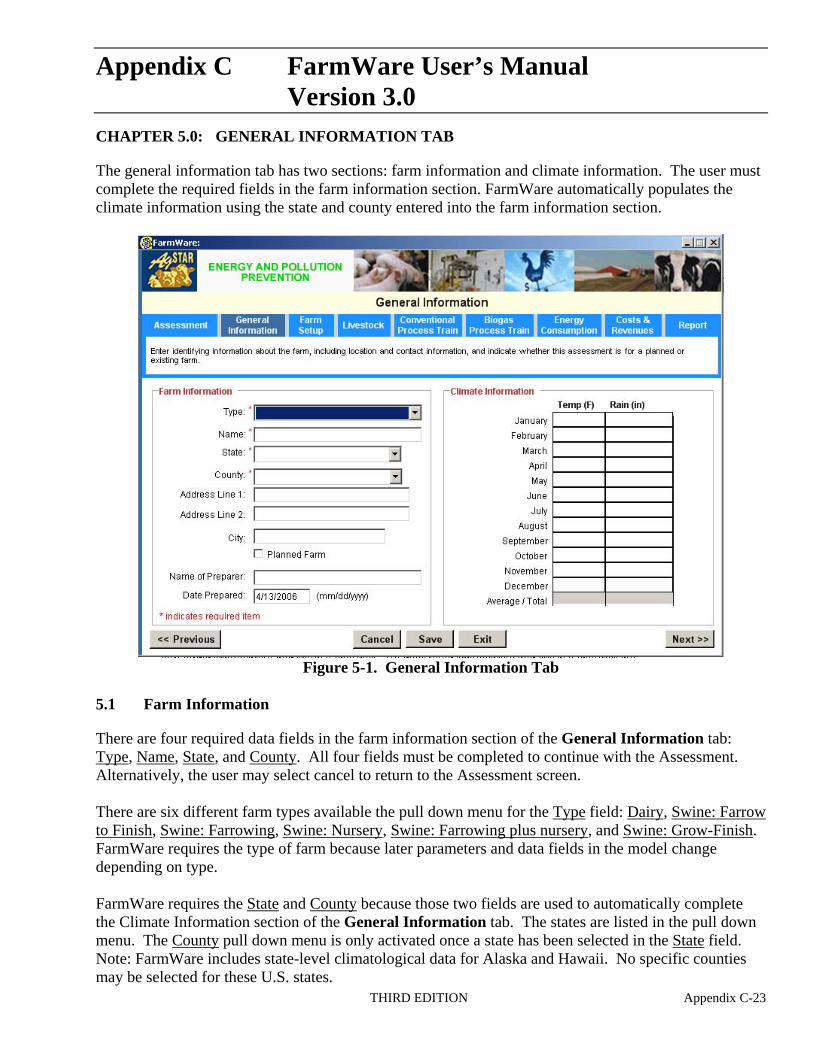
Appendix C FarmWare User’s Manual Version 3.0CHAPTER 5.0: GENERAL INFORMATION TAB
The general information tab has two sections: farm information and climate information. The user must complete the required fields in the farm information section. FarmWare automatically populates the climate information using the state and county entered into the farm information section.
Figure 5-1. General Information Tab
5.1 Farm Information
There are four required data fields in the farm information section of the General Information tab: Type, Name, State, and County. All four fields must be completed to continue with the Assessment. Alternatively, the user may select cancel to return to the Assessment screen.
There are six different farm types available the pull down menu for the Type field: Dairy, Swine: Farrow to Finish, Swine: Farrowing, Swine: Nursery, Swine: Farrowing plus nursery, and Swine: Grow-Finish. FarmWare requires the type of farm because later parameters and data fields in the model change depending on type.
FarmWare requires the State and County because those two fields are used to automatically complete the Climate Information section of the General Information tab. The states are listed in the pull down menu. The County pull down menu is only activated once a state has been selected in the State field. Note: FarmWare includes state-level climatological data for Alaska and Hawaii. No specific counties may be selected for these U.S. states.
THIRD EDITION Appendix C-23
Appendix C FarmWare User’s Manual Version 3.0
5.2 Climate Information
FarmWare uses precipitation, evaporation, and temperature data to calculate methane production and to size liquid stabilization and storage facilities. All uncovered stabilization and storage facilities are required to have the capacity to hold runoff and direct precipitation from the peak storm event. FarmWare 3.0 assumes that the peak storm event is the 25-year/24-hour storm event for dairies and existing swine operations, and the peak storm event for planned (new) swine operations is the 100year/24-hour storm event for swine operations. These event parameters were selected to be consistent with the design requirements for lagoons in EPA's Effluent Limitations and Guidelines for Confined Animal Feeding Operations. The climate data are from the National Climate Data Center, averaged for all weather stations within a county.
Appendix C-24 THIRD EDITION
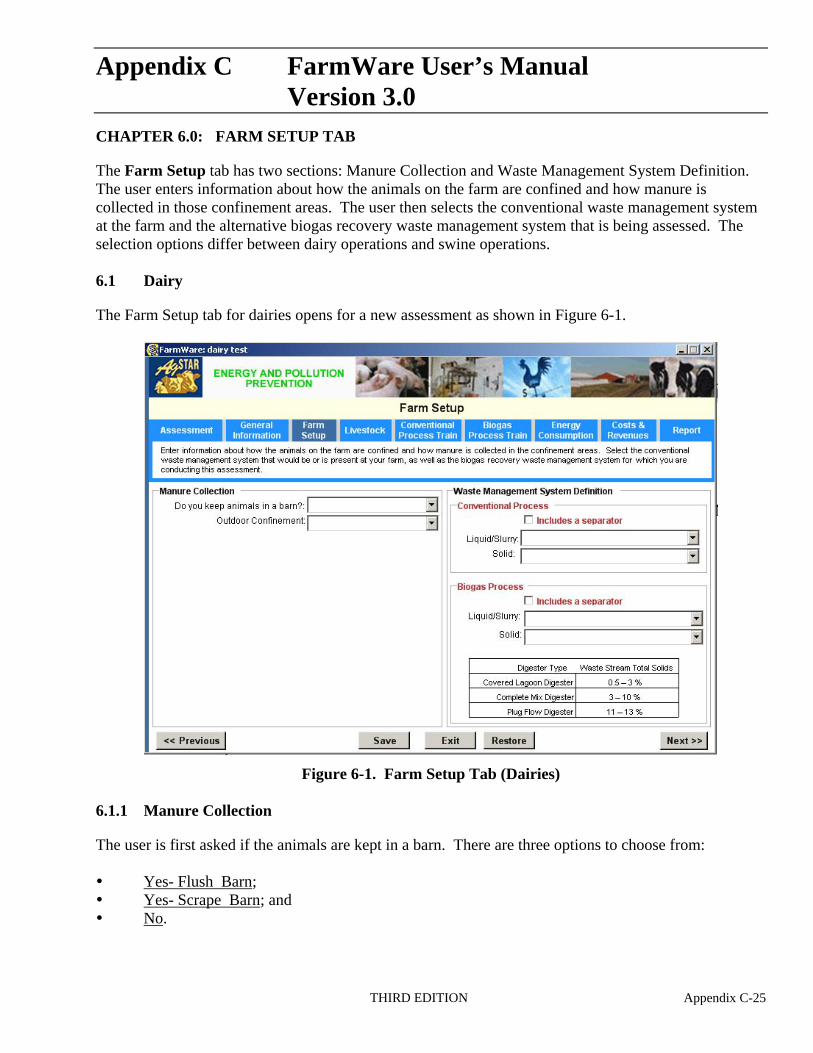
Appendix C FarmWare User’s Manual Version 3.0CHAPTER 6.0: FARM SETUP TAB
The Farm Setup tab has two sections: Manure Collection and Waste Management System Definition. The user enters information about how the animals on the farm are confined and how manure is collected in those confinement areas. The user then selects the conventional waste management system at the farm and the alternative biogas recovery waste management system that is being assessed. The selection options differ between dairy operations and swine operations.
6.1 Dairy
The Farm Setup tab for dairies opens for a new assessment as shown in Figure 6-1.
Figure 6-1. Farm Setup Tab (Dairies)
6.1.1 Manure Collection
The user is first asked if the animals are kept in a barn. There are three options to choose from:
Yes- Flush Barn; Yes- Scrape Barn; and No.
THIRD EDITION Appendix C-25
Appendix C FarmWare User’s Manual Version 3.0A flush barn uses recycled water to collect and Special Case: California Dairies transport manure into a storage or stabilization facility. A scrape barn uses a mechanical California-style dairies are a special style of animal and
device to collect and remove manure. If a waste management system in which the herd has access
flush barn is selected, the user can either enter to a free-stall barn without side or end walls but possibly side curtains and an open lot or corral. This type of dairy
the amount of water used to flush the barn or should be treated as two separate housing areas: a barn derive the amount of water used to flush the and an open lot. The user should indicate what type of
barn by entering the number of barns, the manure collection occurs within each separate
number of flush tanks per barn, the gallons per confinement area (i.e., flushed or scraped manure), and provide detail on the open lot portion of the confinement
flush, and the number of flushes per day. If area in terms of pavement and the time the cattle the user selects a scrape barn, no additional typically spend within each area. information is required.
The user is then asked if there is any outdoor confinement for the animals. There are again three options to choose from: Pasture, Open Lot, or No Outdoor Housing. No additional information is required ifPasture or No Outdoor Housing is selected. If animals are only kept in a pasture then a biogas collection system is not feasible.
6.1.2 Conventional Process
The user has four options to selection from in the conventional process: Anaerobic Lagoon with Liquid/Slurry Storage, Combined Treatment and Storage Lagoon, Storage Pond, and Storage Tank.
Multi-cell Anaerobic Lagoons (Anaerobic Lagoon with Storage): Manure and process wastewater is discharged into a primary cell that operates at a constant volume for initial stabilization. Although some additional waste stabilization may occur, the primary function of the final cell is storage. Intermediate cells, if present, also operate at a constant volume to provide additional waste stabilization.
Combined Treatment and Storage Lagoons: Manure, process wastewater, and runoff from open lots are diverted to one large combined treatment and storage lagoon. The lagoon is designed to provide the minimum treatment volume, accumulated solids volume, waste volume, and runoff for the storage period. A solid separator can be selected to reduce the volume of solids that enter the system.
Storage Tanks: A conventional system may store manure and process water in above-ground or in-ground tanks. If there is an open lot on site, runoff is diverted to a separate storage structure, reserving the tank volume for manure and minimal process water. Solids separation can reduce the volume of solids entering the tank.
Storage Ponds: A conventional system may use storage ponds to store manure and process water. If there is an open lot on site, runoff is diverted to the storage pond. Again, solids separation can reduce the volume of solids entering the tank.
Appendix C-26 THIRD EDITION
Appendix C FarmWare User’s Manual Version 3.06.1.3 Biogas Process
The user may choose one of three options to digest manure at their facility: Complete Mix Digester, Covered Lagoon Digester, and Plug Flow Digester.
Complete mix digesters are above-ground or in-ground vessels that treat slurry manure with a solids Special Case: Dairies With Sand
concentration in the range of 3 to 10 percent. These Bedding
structures require less land than lagoons and are If a dairy has sand bedding, a sand trap is required prior to a digester.
heated. Complete mix digesters are compatible with This cost is not accounted for in combinations of scraped and flushed manure. FarmWare.
FarmWare assumes that complete mix digesters operate at a temperature of 95 to 100 degrees Fahrenheit.
Covered Lagoon Digesters are used to treat and produce biogas from liquid manure with less than 3 percent solids. Generally, a large lagoon is required, preferably with a depth of at least 12 feet. The volume of the digester equal to the minimum treatment volume appropriate for the volatile solids loading rate in that climate region. Covered lagoons for energy recovery are compatible with flush manure systems in warm climates. Covered lagoons may be used in cold climates for odor control with collected biogas disposal by flaring.
Plug Flow Digesters are heated, rectangular tanks that treat scraped dairy manure with a range of 11 to 13 percent total solids. Swine manure cannot be treated with a plug flow digester due to its typically lower total solids content and lower viscosity. For a plug flow digestion system, FarmWare assumes that milking center process water and manure is diverted to a storage basin and not to the digester in order to maintain the appropriate solids content of the digester influent. For all other systems, FarmWare assumes that milking center process water and manure are discharged to the digester.
6.2 Swine
The Farm Setup tab for dairies opens for a new assessment as shown in Figure 6-2.
6.2.1 Manure Collection
The user is first asked how animals are confined and manure is collected. There are six options:
Flush Barns; Open Lot; Deep Pit Barns; Pull Plug Barns/Pit Recharge Barns; Hoop Barns; and Pasture.
Flush barns and open lots at swine facilities operate similarly to those at dairy operations, and are described in Section 6.1.
THIRD EDITION Appendix C-27
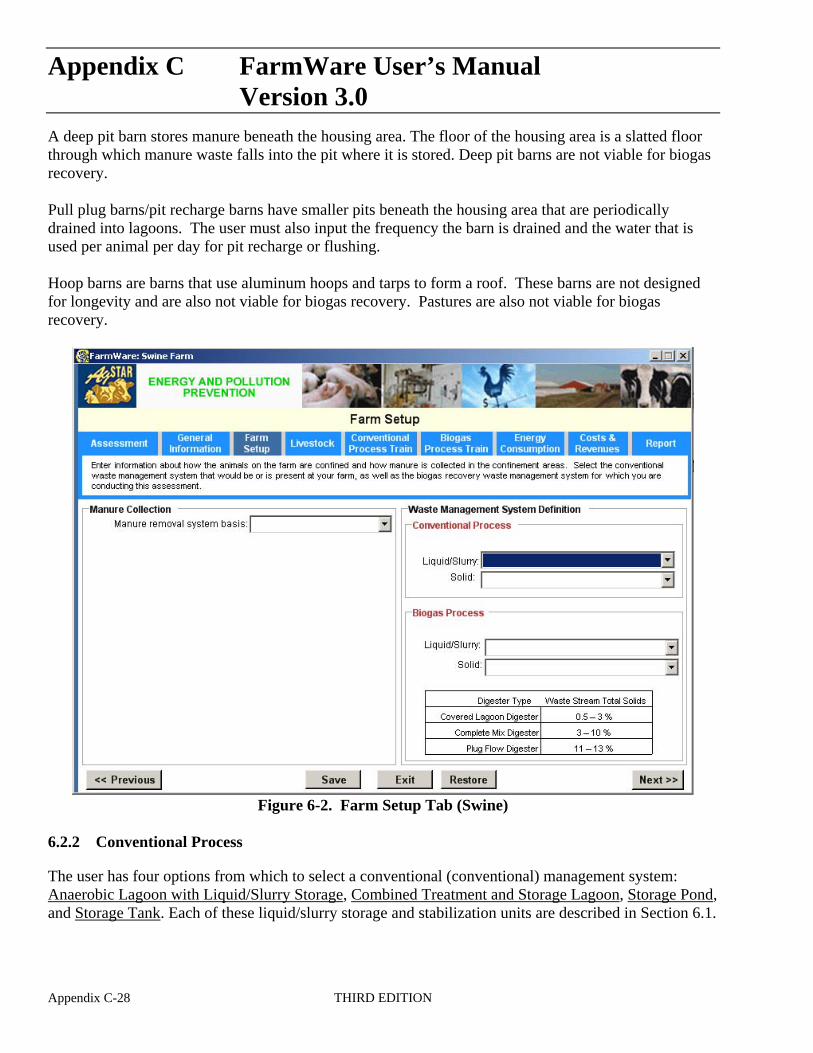
Appendix C FarmWare User’s Manual Version 3.0A deep pit barn stores manure beneath the housing area. The floor of the housing area is a slatted floor through which manure waste falls into the pit where it is stored. Deep pit barns are not viable for biogas recovery.
Pull plug barns/pit recharge barns have smaller pits beneath the housing area that are periodically drained into lagoons. The user must also input the frequency the barn is drained and the water that is used per animal per day for pit recharge or flushing.
Hoop barns are barns that use aluminum hoops and tarps to form a roof. These barns are not designed for longevity and are also not viable for biogas recovery. Pastures are also not viable for biogas recovery.
Figure 6-2. Farm Setup Tab (Swine)
6.2.2 Conventional Process
The user has four options from which to select a conventional (conventional) management system: Anaerobic Lagoon with Liquid/Slurry Storage, Combined Treatment and Storage Lagoon, Storage Pond, and Storage Tank. Each of these liquid/slurry storage and stabilization units are described in Section 6.1.
Appendix C-28 THIRD EDITION
Appendix C FarmWare User’s Manual Version 3.06.2.3 Biogas Process
The user may select from two options to define the biogas management system: Complete Mix Digester or Covered Lagoon Digester . Section 6.1 describes these digestion methods.
THIRD EDITION Appendix C-29

Appendix C FarmWare User’s Manual Version 3.0
(This page intentionally left blank.)
Appendix C-30 THIRD EDITION
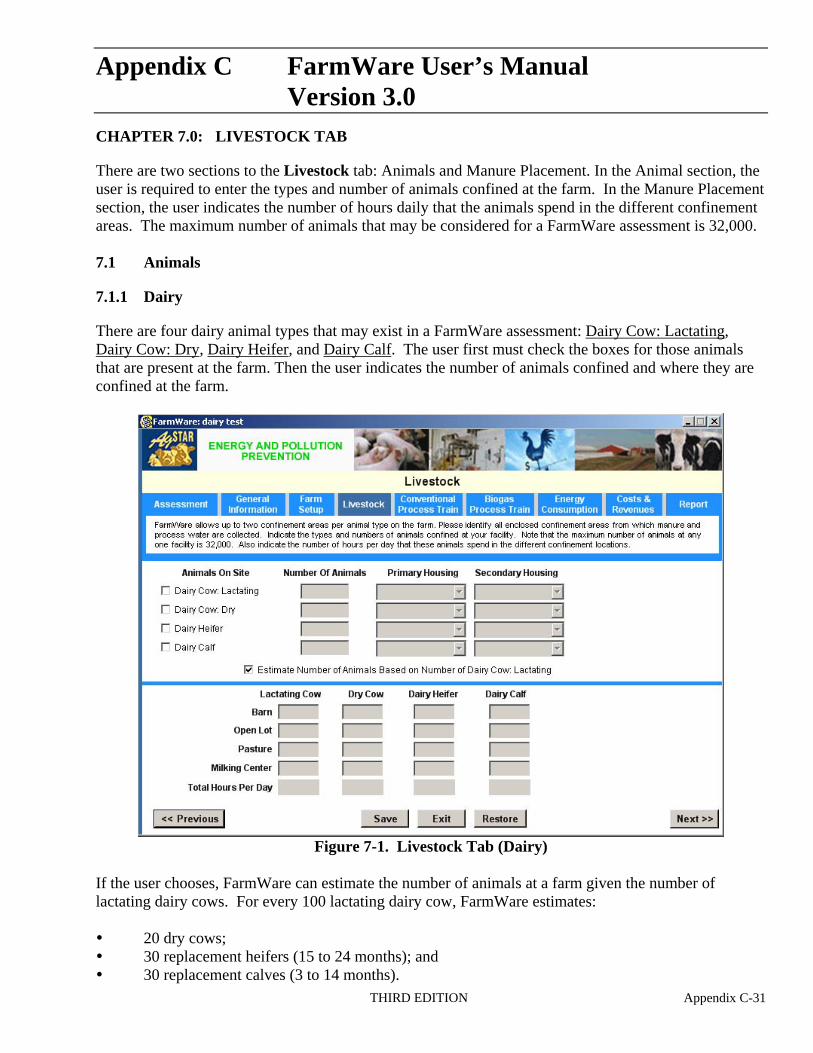
Appendix C FarmWare User’s Manual Version 3.0CHAPTER 7.0: LIVESTOCK TAB
There are two sections to the Livestock tab: Animals and Manure Placement. In the Animal section, the user is required to enter the types and number of animals confined at the farm. In the Manure Placement section, the user indicates the number of hours daily that the animals spend in the different confinement areas. The maximum number of animals that may be considered for a FarmWare assessment is 32,000.
7.1 Animals
7.1.1 Dairy
There are four dairy animal types that may exist in a FarmWare assessment: Dairy Cow: Lactating, Dairy Cow: Dry, Dairy Heifer, and Dairy Calf. The user first must check the boxes for those animals that are present at the farm. Then the user indicates the number of animals confined and where they are confined at the farm.
Figure 7-1. Livestock Tab (Dairy)
If the user chooses, FarmWare can estimate the number of animals at a farm given the number of lactating dairy cows. For every 100 lactating dairy cow, FarmWare estimates:
20 dry cows; 30 replacement heifers (15 to 24 months); and 30 replacement calves (3 to 14 months).
THIRD EDITION Appendix C-31
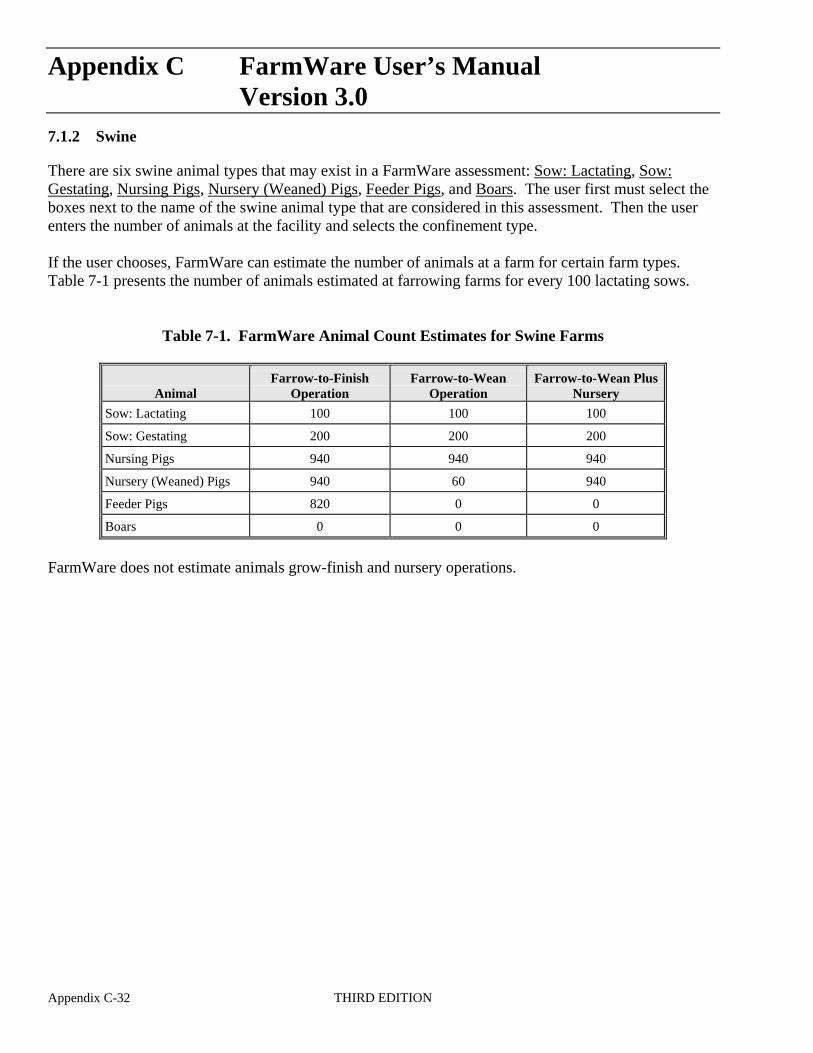
Appendix C FarmWare User’s Manual Version 3.07.1.2 Swine
There are six swine animal types that may exist in a FarmWare assessment: Sow: Lactating, Sow: Gestating, Nursing Pigs, Nursery (Weaned) Pigs, Feeder Pigs, and Boars. The user first must select the boxes next to the name of the swine animal type that are considered in this assessment. Then the user enters the number of animals at the facility and selects the confinement type.
If the user chooses, FarmWare can estimate the number of animals at a farm for certain farm types. Table 7-1 presents the number of animals estimated at farrowing farms for every 100 lactating sows.
Table 7-1. FarmWare Animal Count Estimates for Swine Farms
Animal Farrow-to-Finish
Operation Farrow-to-Wean
Operation Farrow-to-Wean Plus
Nursery
Sow: Lactating 100 100 100
Sow: Gestating 200 200 200
Nursing Pigs 940 940 940
Nursery (Weaned) Pigs 940 60 940
Feeder Pigs 820 0 0
Boars 0 0 0
FarmWare does not estimate animals grow-finish and nursery operations.
Appendix C-32 THIRD EDITION
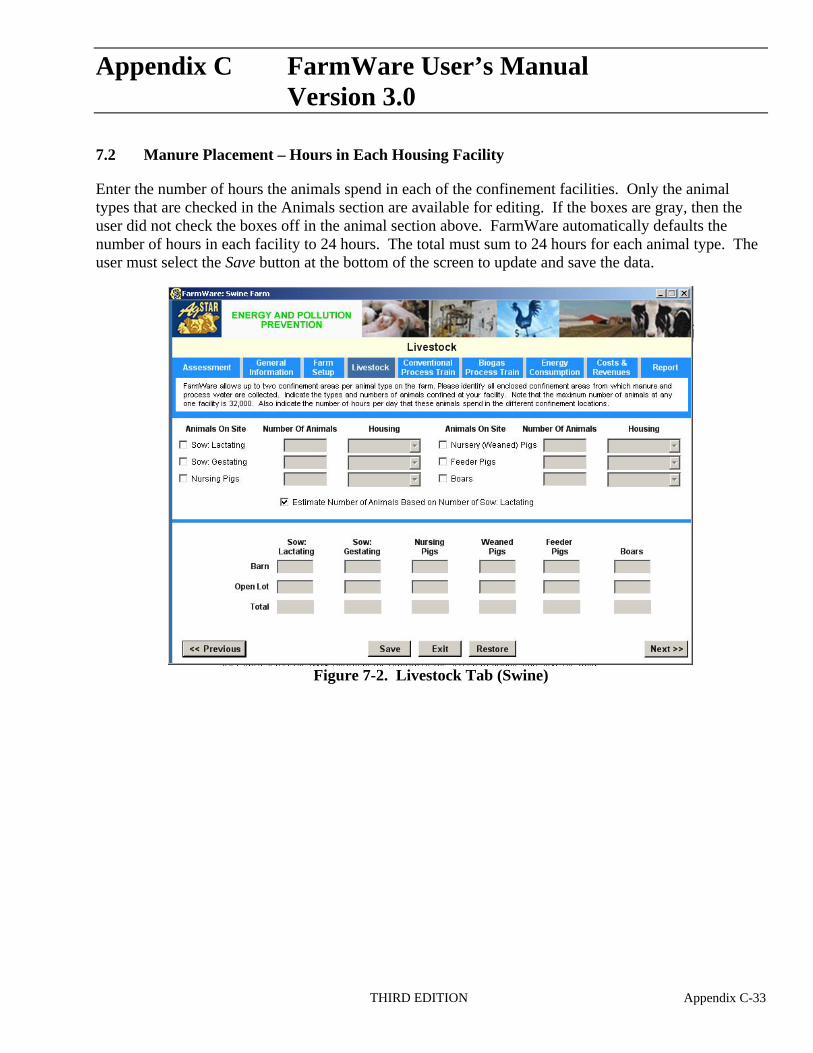
Appendix C FarmWare User’s Manual Version 3.0
7.2 Manure Placement – Hours in Each Housing Facility
Enter the number of hours the animals spend in each of the confinement facilities. Only the animal types that are checked in the Animals section are available for editing. If the boxes are gray, then the user did not check the boxes off in the animal section above. FarmWare automatically defaults the number of hours in each facility to 24 hours. The total must sum to 24 hours for each animal type. The user must select the Save button at the bottom of the screen to update and save the data.
Figure 7-2. Livestock Tab (Swine)
THIRD EDITION Appendix C-33

Appendix C FarmWare User’s Manual Version 3.0
(This page intentionally left blank.)
Appendix C-34 THIRD EDITION
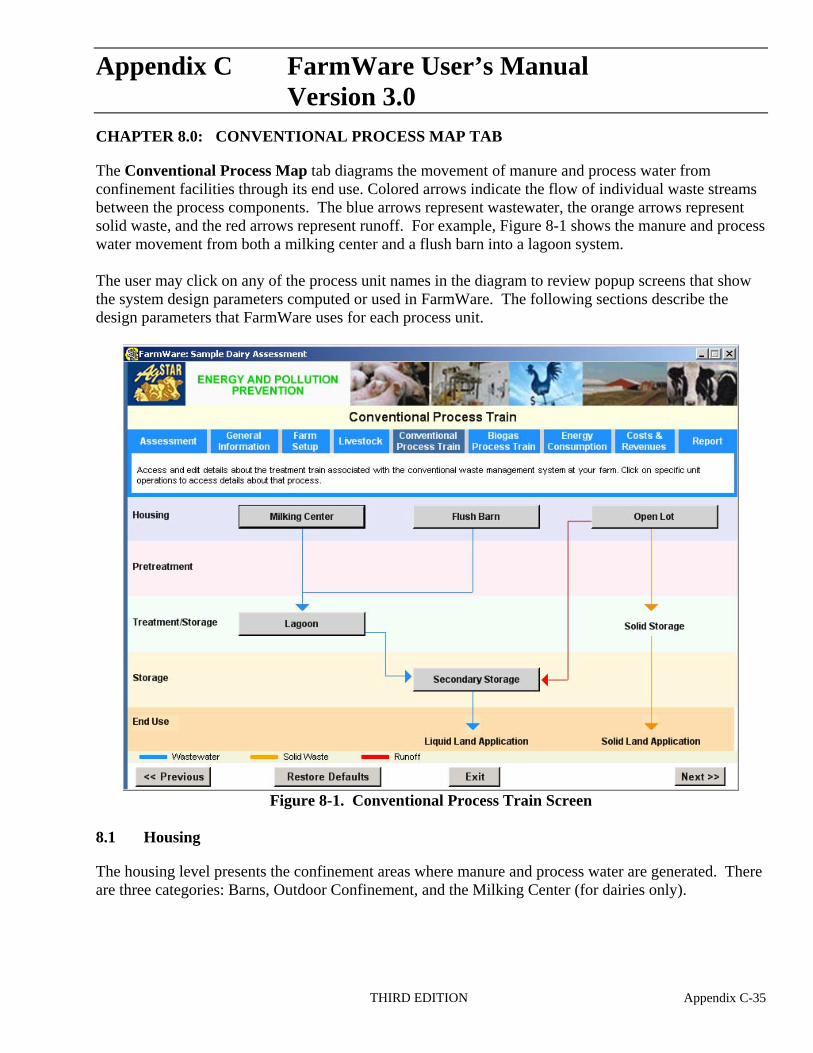
Appendix C FarmWare User’s Manual Version 3.0CHAPTER 8.0: CONVENTIONAL PROCESS MAP TAB
The Conventional Process Map tab diagrams the movement of manure and process water from confinement facilities through its end use. Colored arrows indicate the flow of individual waste streams between the process components. The blue arrows represent wastewater, the orange arrows represent solid waste, and the red arrows represent runoff. For example, Figure 8-1 shows the manure and process water movement from both a milking center and a flush barn into a lagoon system.
The user may click on any of the process unit names in the diagram to review popup screens that show the system design parameters computed or used in FarmWare. The following sections describe the design parameters that FarmWare uses for each process unit.
Figure 8-1. Conventional Process Train Screen
8.1 Housing
The housing level presents the confinement areas where manure and process water are generated. There are three categories: Barns, Outdoor Confinement, and the Milking Center (for dairies only).
THIRD EDITION Appendix C-35
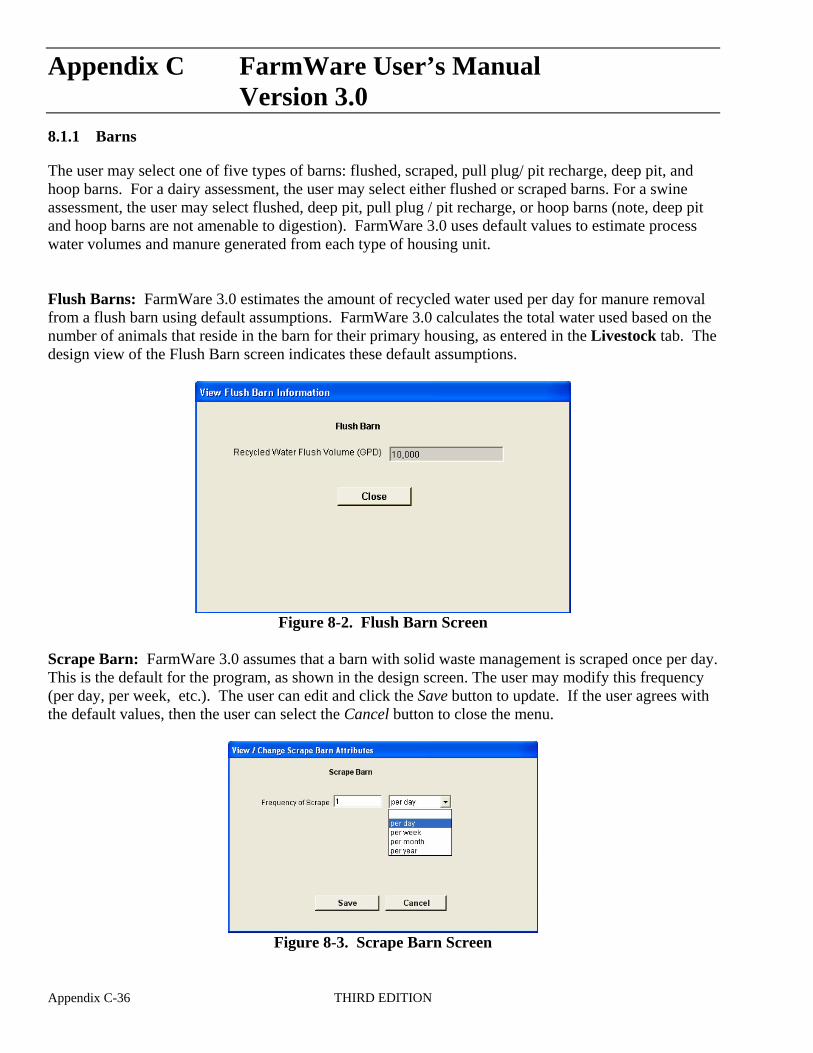
Appendix C FarmWare User’s Manual Version 3.08.1.1 Barns
The user may select one of five types of barns: flushed, scraped, pull plug/ pit recharge, deep pit, and hoop barns. For a dairy assessment, the user may select either flushed or scraped barns. For a swine assessment, the user may select flushed, deep pit, pull plug / pit recharge, or hoop barns (note, deep pit and hoop barns are not amenable to digestion). FarmWare 3.0 uses default values to estimate process water volumes and manure generated from each type of housing unit.
Flush Barns: FarmWare 3.0 estimates the amount of recycled water used per day for manure removal from a flush barn using default assumptions. FarmWare 3.0 calculates the total water used based on the number of animals that reside in the barn for their primary housing, as entered in the Livestock tab. The design view of the Flush Barn screen indicates these default assumptions.
Figure 8-2. Flush Barn Screen
Scrape Barn: FarmWare 3.0 assumes that a barn with solid waste management is scraped once per day. This is the default for the program, as shown in the design screen. The user may modify this frequency (per day, per week, etc.). The user can edit and click the Save button to update. If the user agrees with the default values, then the user can select the Cancel button to close the menu.
Figure 8-3. Scrape Barn Screen
Appendix C-36 THIRD EDITION
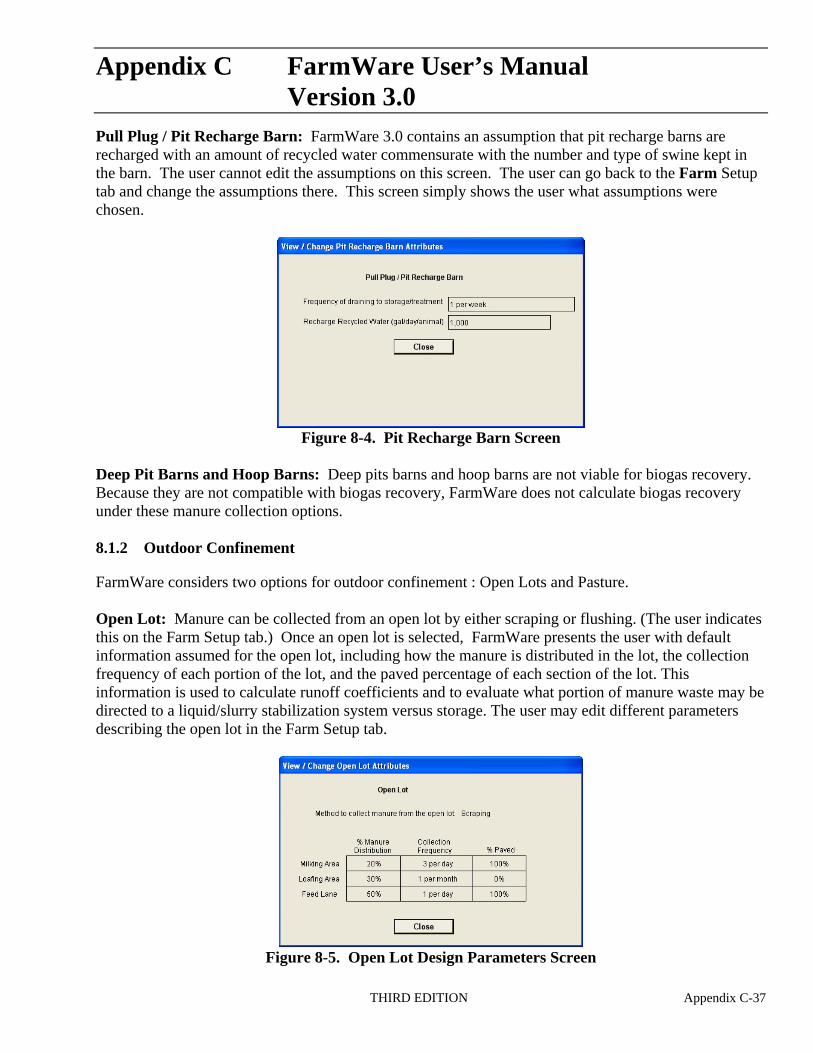
Appendix C FarmWare User’s Manual Version 3.0Pull Plug / Pit Recharge Barn: FarmWare 3.0 contains an assumption that pit recharge barns are recharged with an amount of recycled water commensurate with the number and type of swine kept in the barn. The user cannot edit the assumptions on this screen. The user can go back to the Farm Setup tab and change the assumptions there. This screen simply shows the user what assumptions were chosen.
Figure 8-4. Pit Recharge Barn Screen
Deep Pit Barns and Hoop Barns: Deep pits barns and hoop barns are not viable for biogas recovery. Because they are not compatible with biogas recovery, FarmWare does not calculate biogas recovery under these manure collection options.
8.1.2 Outdoor Confinement
FarmWare considers two options for outdoor confinement : Open Lots and Pasture.
Open Lot: Manure can be collected from an open lot by either scraping or flushing. (The user indicates this on the Farm Setup tab.) Once an open lot is selected, FarmWare presents the user with default information assumed for the open lot, including how the manure is distributed in the lot, the collection frequency of each portion of the lot, and the paved percentage of each section of the lot. This information is used to calculate runoff coefficients and to evaluate what portion of manure waste may be directed to a liquid/slurry stabilization system versus storage. The user may edit different parameters describing the open lot in the Farm Setup tab.
Figure 8-5. Open Lot Design Parameters Screen
THIRD EDITION Appendix C-37
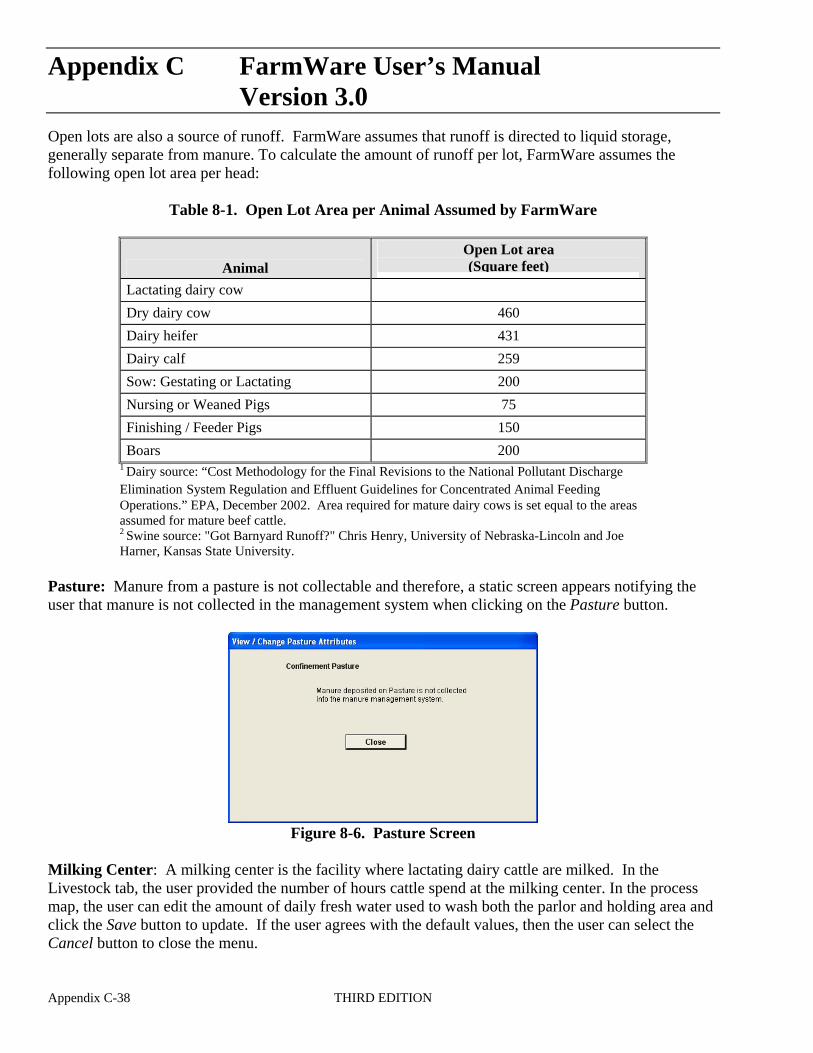
Appendix C FarmWare User’s Manual Version 3.0Open lots are also a source of runoff. FarmWare assumes that runoff is directed to liquid storage, generally separate from manure. To calculate the amount of runoff per lot, FarmWare assumes the following open lot area per head:
Table 8-1. Open Lot Area per Animal Assumed by FarmWare
Animal Open Lot area (Square feet)
Lactating dairy cow
Dry dairy cow 460
Dairy heifer 431
Dairy calf 259
Sow: Gestating or Lactating 200
Nursing or Weaned Pigs 75
Finishing / Feeder Pigs 150
Boars 200 1 Dairy source: “Cost Methodology for the Final Revisions to the National Pollutant Discharge Elimination System Regulation and Effluent Guidelines for Concentrated Animal Feeding Operations.” EPA, December 2002. Area required for mature dairy cows is set equal to the areas assumed for mature beef cattle. 2 Swine source: "Got Barnyard Runoff?" Chris Henry, University of Nebraska-Lincoln and Joe Harner, Kansas State University.
Pasture: Manure from a pasture is not collectable and therefore, a static screen appears notifying the user that manure is not collected in the management system when clicking on the Pasture button.
Figure 8-6. Pasture Screen
Milking Center: A milking center is the facility where lactating dairy cattle are milked. In the Livestock tab, the user provided the number of hours cattle spend at the milking center. In the process map, the user can edit the amount of daily fresh water used to wash both the parlor and holding area and click the Save button to update. If the user agrees with the default values, then the user can select the Cancel button to close the menu.
Appendix C-38 THIRD EDITION
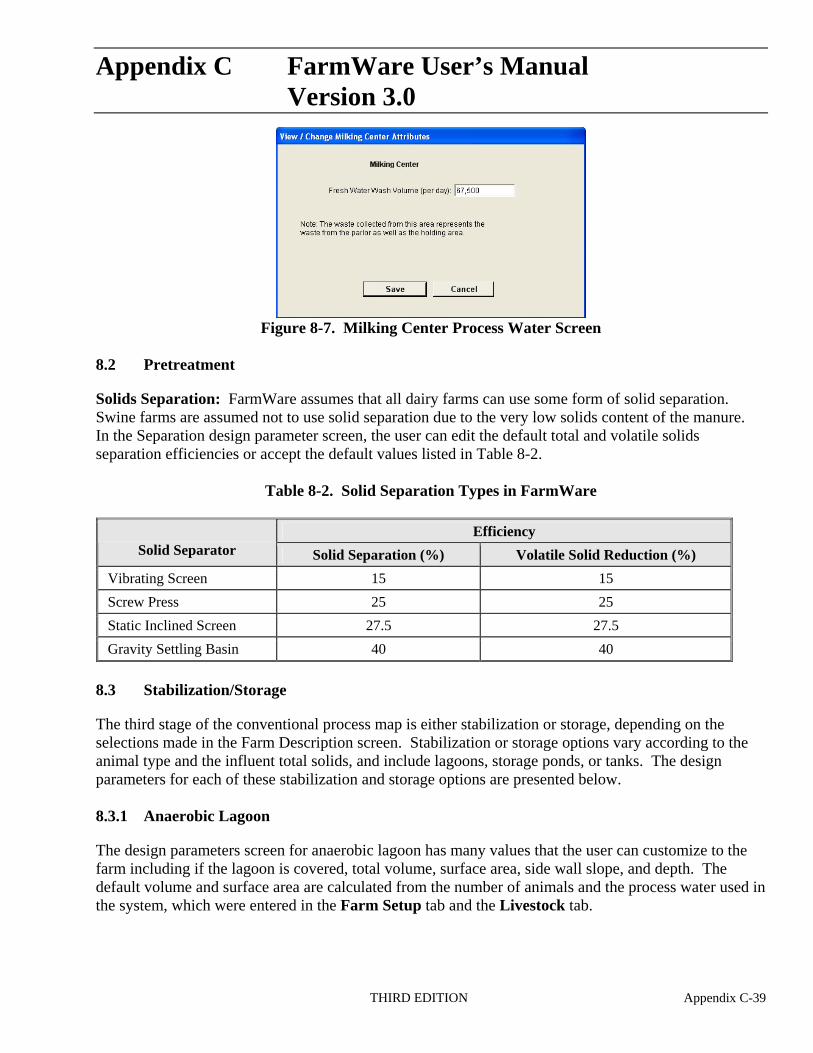
Appendix C FarmWare User’s Manual Version 3.0
Figure 8-7. Milking Center Process Water Screen
8.2 Pretreatment
Solids Separation: FarmWare assumes that all dairy farms can use some form of solid separation. Swine farms are assumed not to use solid separation due to the very low solids content of the manure. In the Separation design parameter screen, the user can edit the default total and volatile solids separation efficiencies or accept the default values listed in Table 8-2.
Table 8-2. Solid Separation Types in FarmWare
Solid Separator Efficiency
Solid Separation (%) Volatile Solid Reduction (%)
Vibrating Screen 15 15
Screw Press 25 25
Static Inclined Screen 27.5 27.5
Gravity Settling Basin 40 40
8.3 Stabilization/Storage
The third stage of the conventional process map is either stabilization or storage, depending on the selections made in the Farm Description screen. Stabilization or storage options vary according to the animal type and the influent total solids, and include lagoons, storage ponds, or tanks. The design parameters for each of these stabilization and storage options are presented below.
8.3.1 Anaerobic Lagoon
The design parameters screen for anaerobic lagoon has many values that the user can customize to the farm including if the lagoon is covered, total volume, surface area, side wall slope, and depth. The default volume and surface area are calculated from the number of animals and the process water used in the system, which were entered in the Farm Setup tab and the Livestock tab.
THIRD EDITION Appendix C-39
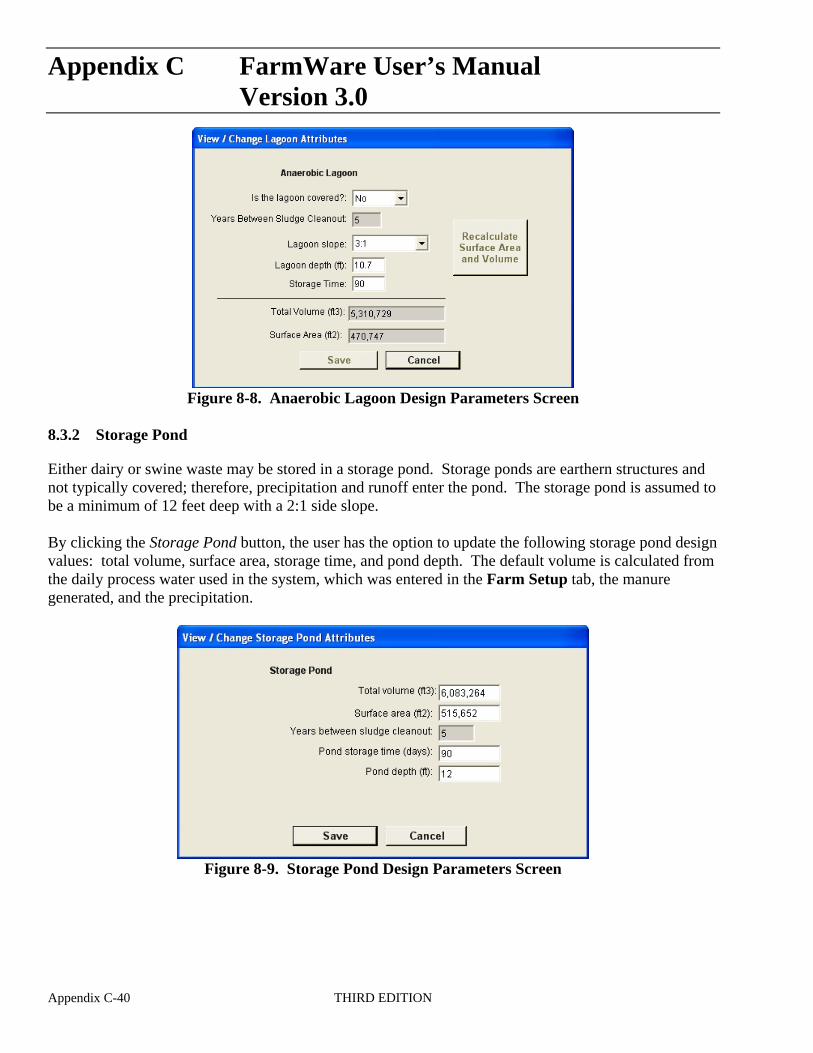
Appendix C FarmWare User’s Manual Version 3.0
Figure 8-8. Anaerobic Lagoon Design Parameters Screen
8.3.2 Storage Pond
Either dairy or swine waste may be stored in a storage pond. Storage ponds are earthern structures and not typically covered; therefore, precipitation and runoff enter the pond. The storage pond is assumed to be a minimum of 12 feet deep with a 2:1 side slope.
By clicking the Storage Pond button, the user has the option to update the following storage pond design values: total volume, surface area, storage time, and pond depth. The default volume is calculated from the daily process water used in the system, which was entered in the Farm Setup tab, the manure generated, and the precipitation.
Figure 8-9. Storage Pond Design Parameters Screen
Appendix C-40 THIRD EDITION
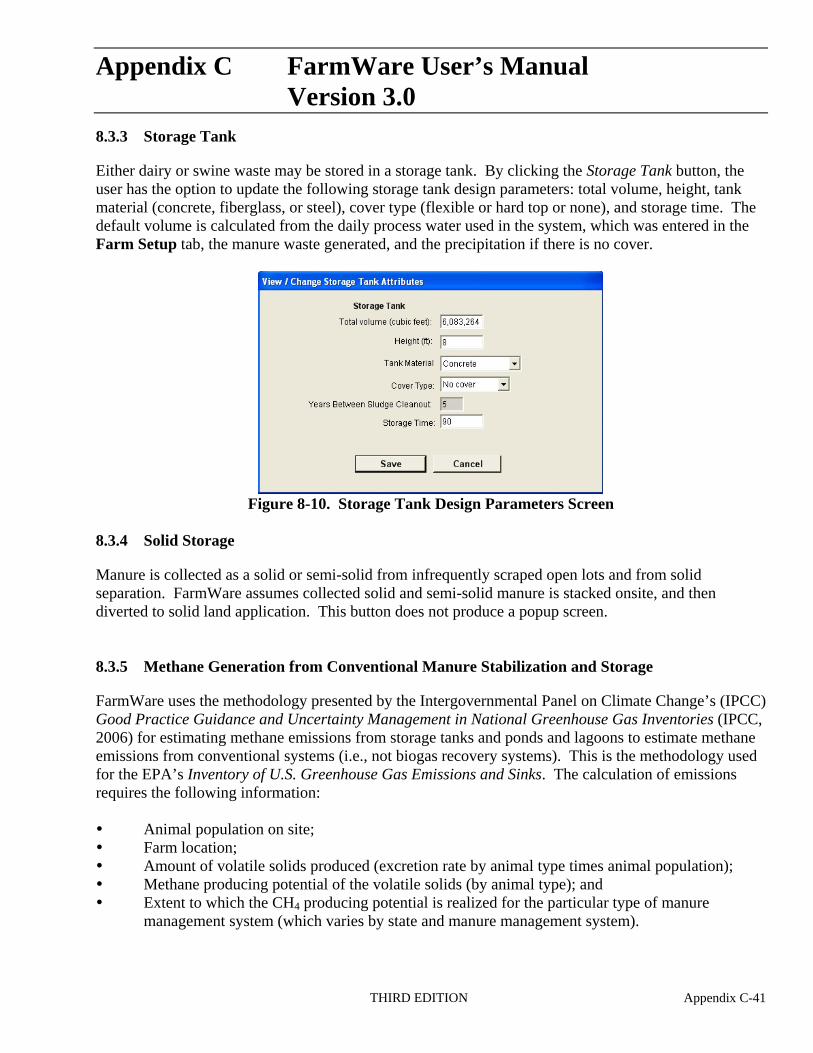
Appendix C FarmWare User’s Manual Version 3.08.3.3 Storage Tank
Either dairy or swine waste may be stored in a storage tank. By clicking the Storage Tank button, the user has the option to update the following storage tank design parameters: total volume, height, tank material (concrete, fiberglass, or steel), cover type (flexible or hard top or none), and storage time. The default volume is calculated from the daily process water used in the system, which was entered in the Farm Setup tab, the manure waste generated, and the precipitation if there is no cover.
Figure 8-10. Storage Tank Design Parameters Screen
8.3.4 Solid Storage
Manure is collected as a solid or semi-solid from infrequently scraped open lots and from solid separation. FarmWare assumes collected solid and semi-solid manure is stacked onsite, and then diverted to solid land application. This button does not produce a popup screen.
8.3.5 Methane Generation from Conventional Manure Stabilization and Storage
FarmWare uses the methodology presented by the Intergovernmental Panel on Climate Change’s (IPCC) Good Practice Guidance and Uncertainty Management in National Greenhouse Gas Inventories (IPCC, 2006) for estimating methane emissions from storage tanks and ponds and lagoons to estimate methane emissions from conventional systems (i.e., not biogas recovery systems). This is the methodology used for the EPA’s Inventory of U.S. Greenhouse Gas Emissions and Sinks. The calculation of emissions requires the following information:
Animal population on site; Farm location; Amount of volatile solids produced (excretion rate by animal type times animal population); Methane producing potential of the volatile solids (by animal type); and Extent to which the CH4 producing potential is realized for the particular type of manure
management system (which varies by state and manure management system).
THIRD EDITION Appendix C-41
Appendix C FarmWare User’s Manual Version 3.0There are three steps used in this methodology:
1) Quantify the influent volatile solids. 2) Assign the methane conversion factor relevant to the liquid/slurry system, animal type, and state. 3) Calculate the methane from the system:
Methane animal group = [VS × Bo × MCFanimal, system, state × 0.662)]* 2.205
where: Methaneanimal group = methane emissions for that animal group (kg CH4/yr) Population = annual average state animal population for that animal group (head) VS = total volatile solids produced annually per animal (kg/yr/head) Bo = maximum methane producing capacity per kilogram of VS (m3 CH4/kg VS) MCFanimal, state = weighted MCF for the animal group, waste management system, and state 0.662 = conversion factor of m3 CH4 to kilograms CH4 (kg CH4 /m
3 CH4) 2.205 = conversion of kilograms to pounds
FarmWare calculates influent volatile solids based on the user inputs and NRCS manure excretion rate estimates for volatile solids. Additionally, FarmWare uses Bo that were independently derived for FarmWare, rather than the values used for the Manure Management Greenhouse Gas Inventory methodology.
8.4 Storage
8.4.1 Liquid/Slurry Storage
Liquid manure and wastewater may be stored in a storage basin after primary stabilization or storage occurs. In addition to receiving effluent from primary stabilization and storage, the storage pond directly collects runoff from open lots. FarmWare assumes liquid waste is stored here until it may be land applied. (Note: If the there is a storage pond in the stabilization and storage level, then FarmWare assumes there is no additional storage).
As with storage ponds, liquid/slurry storage basins are not typically covered, and therefore allow precipitation and runoff to enter the pond. The storage pond is assumed to be a minimum of 12 feet deep with a 2:1 side slope.
By clicking the Storage Pond button in the storage level of the process train, the user has the option to update the following storage design parameters: total volume, surface area, pond storage time, and pond depth. The default volume is calculated from the daily process water used in the system (entered in the Farm Setup tab), the manure generated, the default accumulated sludge, and the precipitation.
Appendix C-42 THIRD EDITION
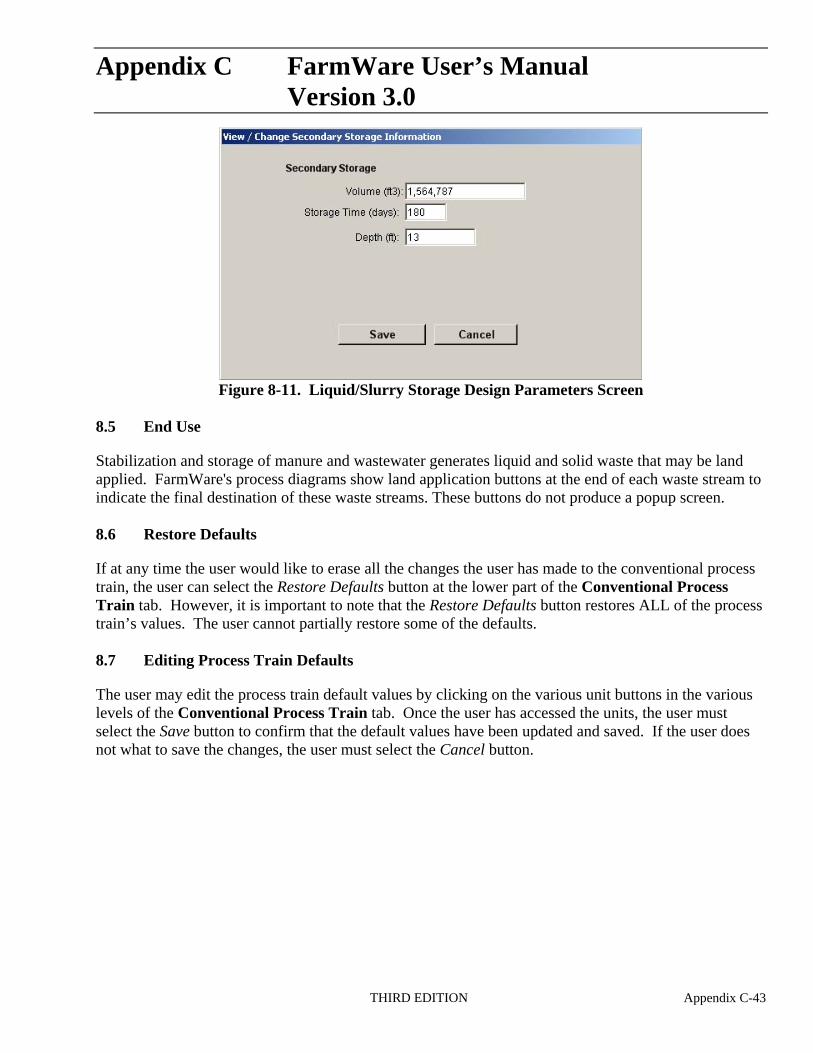
Appendix C FarmWare User’s Manual Version 3.0
Figure 8-11. Liquid/Slurry Storage Design Parameters Screen
8.5 End Use
Stabilization and storage of manure and wastewater generates liquid and solid waste that may be land applied. FarmWare's process diagrams show land application buttons at the end of each waste stream to indicate the final destination of these waste streams. These buttons do not produce a popup screen.
8.6 Restore Defaults
If at any time the user would like to erase all the changes the user has made to the conventional process train, the user can select the Restore Defaults button at the lower part of the Conventional Process Train tab. However, it is important to note that the Restore Defaults button restores ALL of the process train’s values. The user cannot partially restore some of the defaults.
8.7 Editing Process Train Defaults
The user may edit the process train default values by clicking on the various unit buttons in the various levels of the Conventional Process Train tab. Once the user has accessed the units, the user must select the Save button to confirm that the default values have been updated and saved. If the user does not what to save the changes, the user must select the Cancel button.
THIRD EDITION Appendix C-43

Appendix C FarmWare User’s Manual Version 3.0
(This page intentionally left blank.)
Appendix C-44 THIRD EDITION
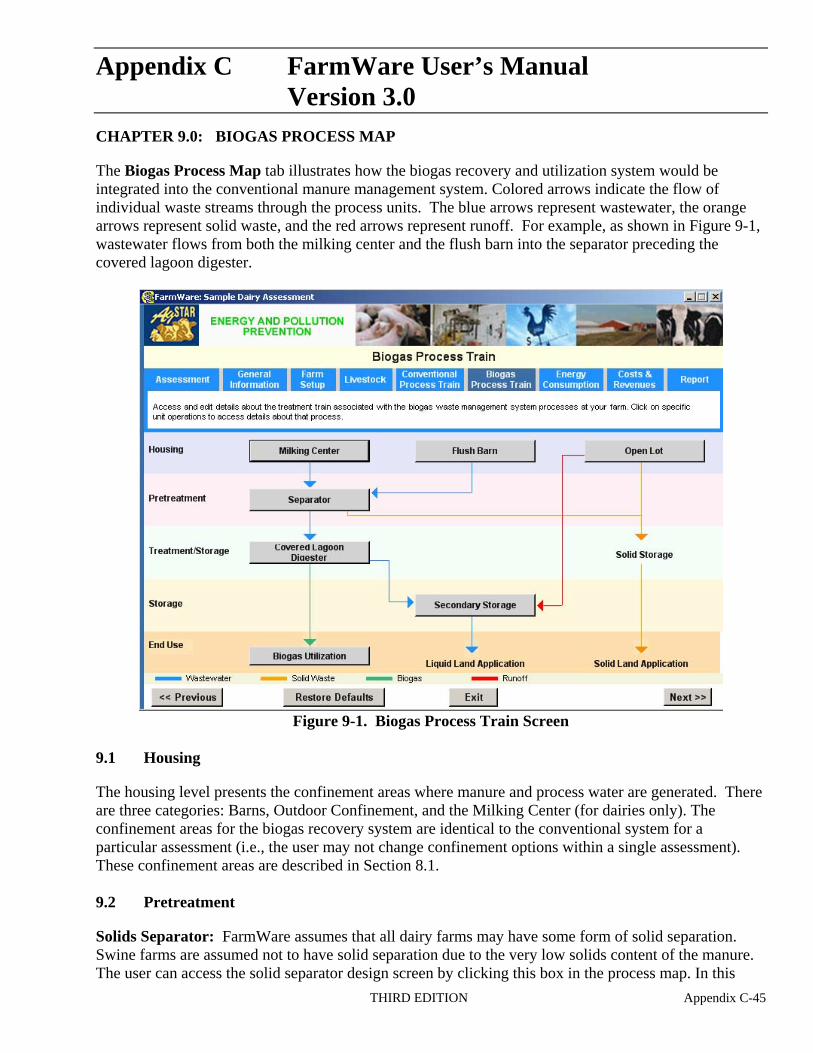
Appendix C FarmWare User’s Manual Version 3.0CHAPTER 9.0: BIOGAS PROCESS MAP
The Biogas Process Map tab illustrates how the biogas recovery and utilization system would be integrated into the conventional manure management system. Colored arrows indicate the flow of individual waste streams through the process units. The blue arrows represent wastewater, the orange arrows represent solid waste, and the red arrows represent runoff. For example, as shown in Figure 9-1, wastewater flows from both the milking center and the flush barn into the separator preceding the covered lagoon digester.
Figure 9-1. Biogas Process Train Screen
9.1 Housing
The housing level presents the confinement areas where manure and process water are generated. There are three categories: Barns, Outdoor Confinement, and the Milking Center (for dairies only). The confinement areas for the biogas recovery system are identical to the conventional system for a particular assessment (i.e., the user may not change confinement options within a single assessment). These confinement areas are described in Section 8.1.
9.2 Pretreatment
Solids Separator: FarmWare assumes that all dairy farms may have some form of solid separation. Swine farms are assumed not to have solid separation due to the very low solids content of the manure. The user can access the solid separator design screen by clicking this box in the process map. In this
THIRD EDITION Appendix C-45
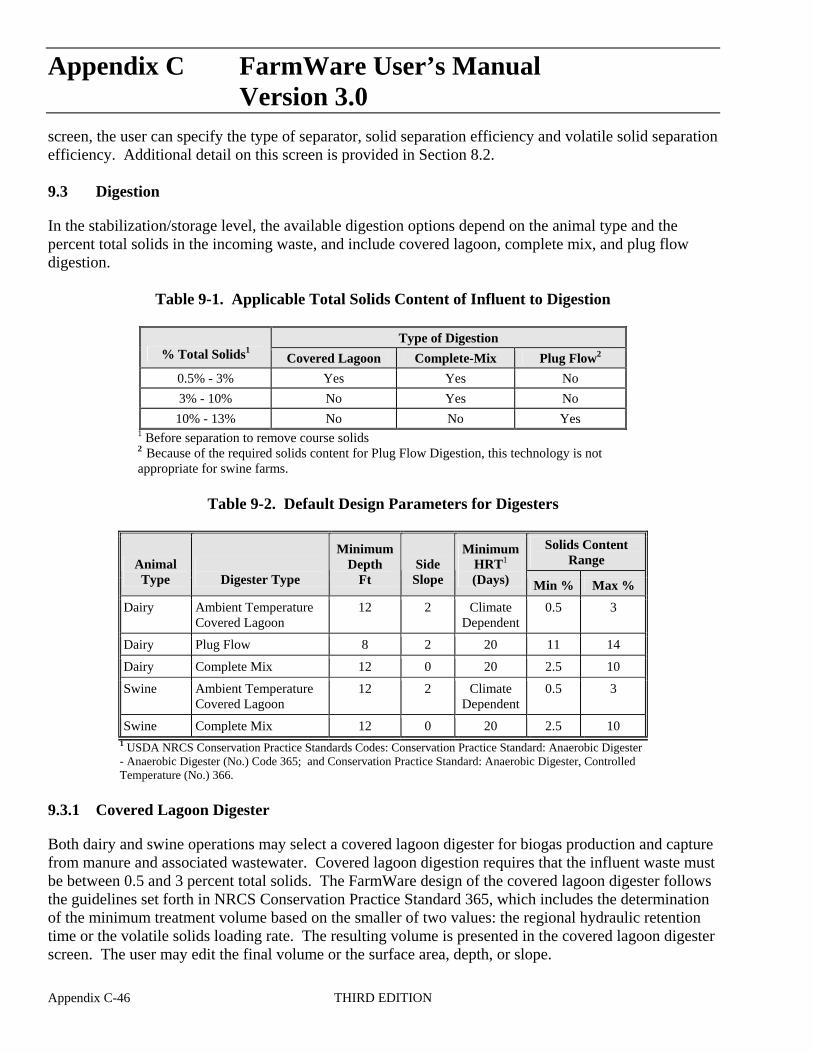
Appendix C FarmWare User’s Manual Version 3.0screen, the user can specify the type of separator, solid separation efficiency and volatile solid separation efficiency. Additional detail on this screen is provided in Section 8.2.
9.3 Digestion
In the stabilization/storage level, the available digestion options depend on the animal type and the percent total solids in the incoming waste, and include covered lagoon, complete mix, and plug flow digestion.
Table 9-1. Applicable Total Solids Content of Influent to Digestion
% Total Solids1 Type of Digestion
Covered Lagoon Complete-Mix Plug Flow2
0.5% - 3% Yes Yes No
3% - 10% No Yes No
10% - 13% No No Yes 1 Before separation to remove course solids 2 Because of the required solids content for Plug Flow Digestion, this technology is not appropriate for swine farms.
Table 9-2. Default Design Parameters for Digesters
Animal Type Digester Type
Minimum Depth
Ft Side
Slope
Minimum HRT1
(Days)
Solids Content Range
Min % Max %
Dairy Ambient Temperature Covered Lagoon
12 2 Climate Dependent
0.5 3
Dairy Plug Flow 8 2 20 11 14
Dairy Complete Mix 12 0 20 2.5 10
Swine Ambient Temperature Covered Lagoon
12 2 Climate Dependent
0.5 3
Swine Complete Mix 12 0 20 2.5 10 1 USDA NRCS Conservation Practice Standards Codes: Conservation Practice Standard: Anaerobic Digester - Anaerobic Digester (No.) Code 365; and Conservation Practice Standard: Anaerobic Digester, Controlled Temperature (No.) 366.
9.3.1 Covered Lagoon Digester
Both dairy and swine operations may select a covered lagoon digester for biogas production and capture from manure and associated wastewater. Covered lagoon digestion requires that the influent waste must be between 0.5 and 3 percent total solids. The FarmWare design of the covered lagoon digester follows the guidelines set forth in NRCS Conservation Practice Standard 365, which includes the determination of the minimum treatment volume based on the smaller of two values: the regional hydraulic retention time or the volatile solids loading rate. The resulting volume is presented in the covered lagoon digester screen. The user may edit the final volume or the surface area, depth, or slope.
Appendix C-46 THIRD EDITION
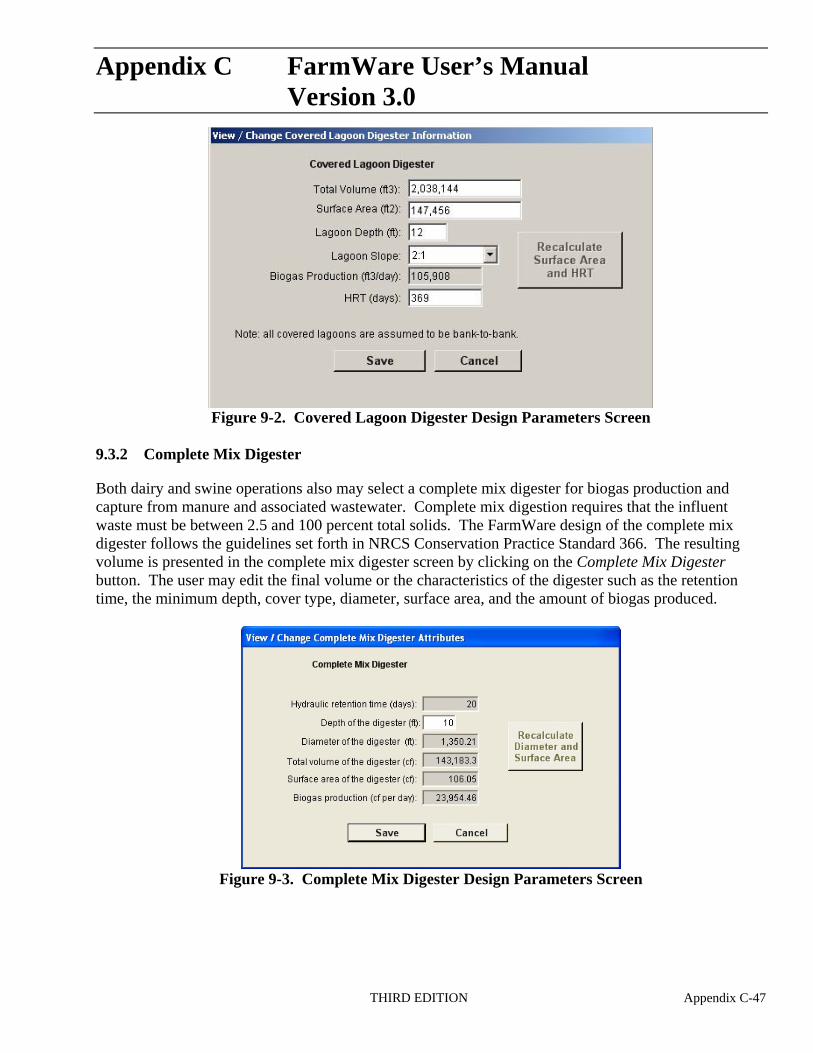
Appendix C FarmWare User’s Manual Version 3.0
Figure 9-2. Covered Lagoon Digester Design Parameters Screen
9.3.2 Complete Mix Digester
Both dairy and swine operations also may select a complete mix digester for biogas production and capture from manure and associated wastewater. Complete mix digestion requires that the influent waste must be between 2.5 and 100 percent total solids. The FarmWare design of the complete mix digester follows the guidelines set forth in NRCS Conservation Practice Standard 366. The resulting volume is presented in the complete mix digester screen by clicking on the Complete Mix Digester button. The user may edit the final volume or the characteristics of the digester such as the retention time, the minimum depth, cover type, diameter, surface area, and the amount of biogas produced.
Figure 9-3. Complete Mix Digester Design Parameters Screen
THIRD EDITION Appendix C-47
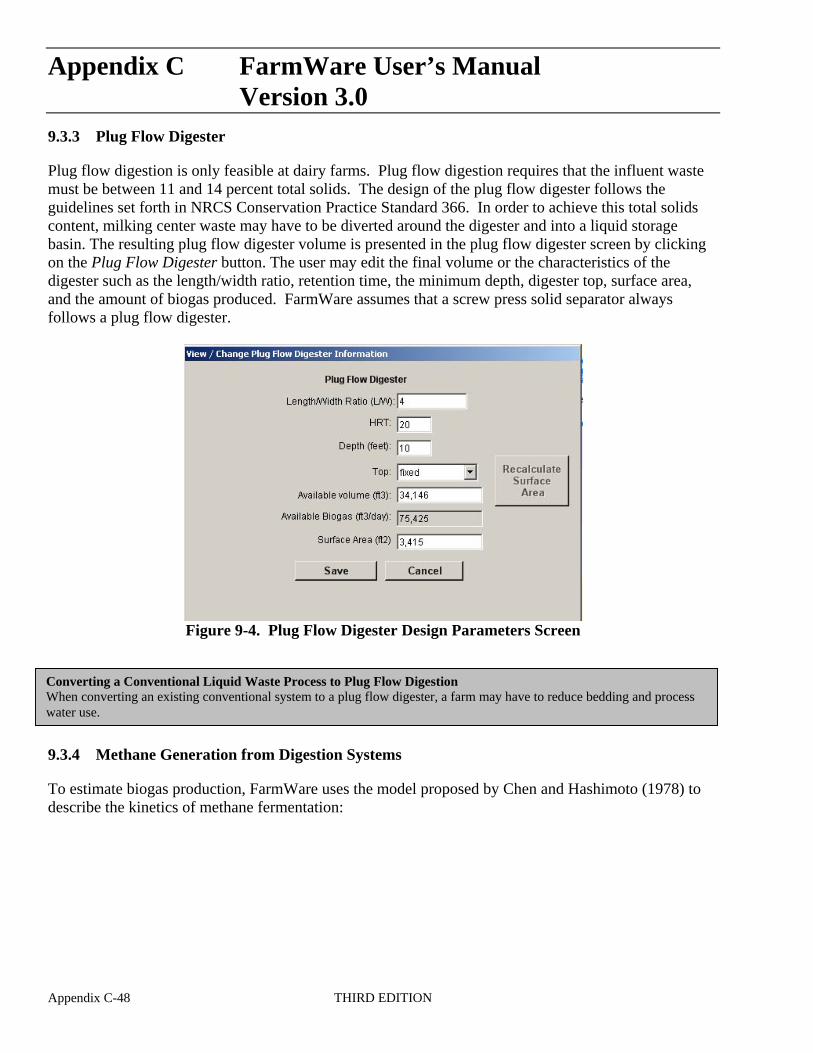
Appendix C FarmWare User’s Manual Version 3.09.3.3 Plug Flow Digester
Plug flow digestion is only feasible at dairy farms. Plug flow digestion requires that the influent waste must be between 11 and 14 percent total solids. The design of the plug flow digester follows the guidelines set forth in NRCS Conservation Practice Standard 366. In order to achieve this total solids content, milking center waste may have to be diverted around the digester and into a liquid storage basin. The resulting plug flow digester volume is presented in the plug flow digester screen by clicking on the Plug Flow Digester button. The user may edit the final volume or the characteristics of the digester such as the length/width ratio, retention time, the minimum depth, digester top, surface area, and the amount of biogas produced. FarmWare assumes that a screw press solid separator always follows a plug flow digester.
Figure 9-4. Plug Flow Digester Design Parameters Screen
Converting a Conventional Liquid Waste Process to Plug Flow Digestion When converting an existing conventional system to a plug flow digester, a farm may have to reduce bedding and process water use.
9.3.4 Methane Generation from Digestion Systems
To estimate biogas production, FarmWare uses the model proposed by Chen and Hashimoto (1978) to describe the kinetics of methane fermentation:
Appendix C-48 THIRD EDITION
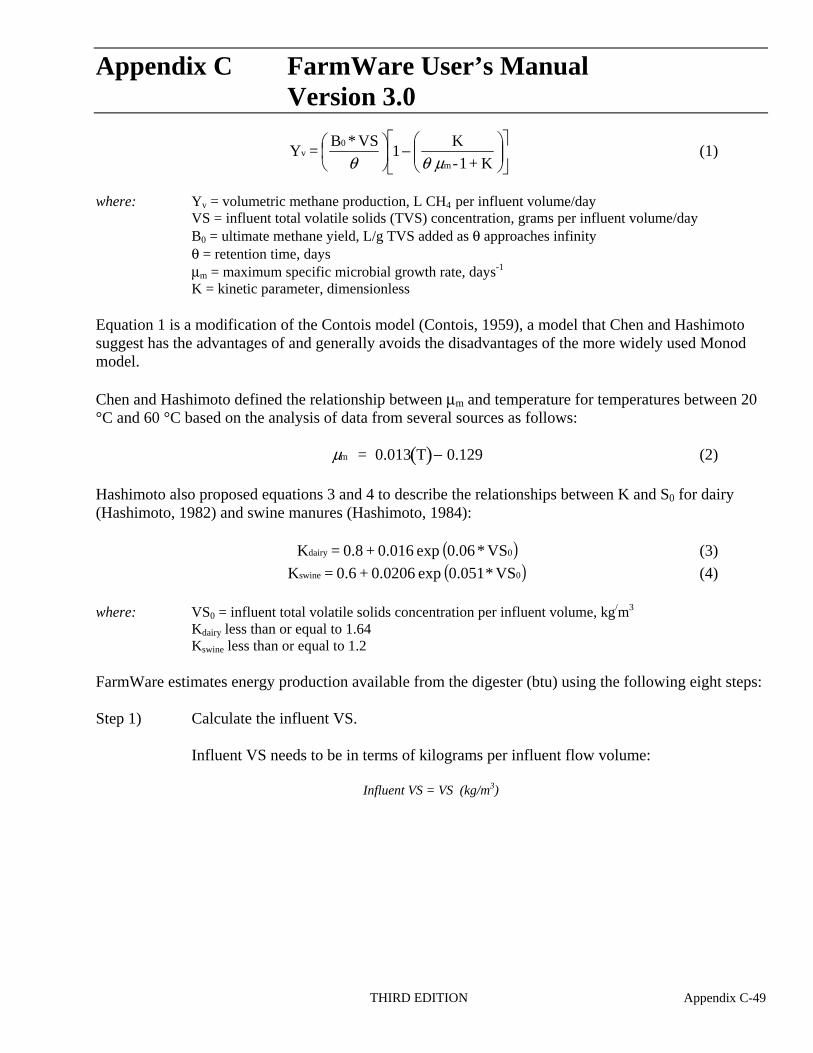
Appendix C FarmWare User’s Manual Version 3.0
Yv = ⎛⎜⎝
B0 * VS ⎞⎟⎠
1 ⎡ ⎢⎣
−⎛ K ⎞⎤θ ⎜⎜
⎝θ μm-1+ K ⎟⎟⎠⎥⎦
(1)
where: Yv = volumetric methane production, L CH4 per influent volume/day VS = influent total volatile solids (TVS) concentration, grams per influent volume/day
B0 = ultimate methane yield, L/g TVS added as θ approaches infinity θ = retention time, days μm = maximum specific microbial growth rate, days-1
K = kinetic parameter, dimensionless
Equation 1 is a modification of the Contois model (Contois, 1959), a model that Chen and Hashimoto suggest has the advantages of and generally avoids the disadvantages of the more widely used Monod model.
Chen and Hashimoto defined the relationship between μm and temperature for temperatures between 20 °C and 60 °C based on the analysis of data from several sources as follows:
μm 0.013 T − 0.129 (2)= ( )
Hashimoto also proposed equations 3 and 4 to describe the relationships between K and S0 for dairy (Hashimoto, 1982) and swine manures (Hashimoto, 1984):
Kdairy = 0.8 + 0.016 exp (0.06 * VS0) (3)
Kswine = 0.6 + 0.0206 exp (0.051* VS0) (4)
where: VS0 = influent total volatile solids concentration per influent volume, kg/m3
Kdairy less than or equal to 1.64 Kswine less than or equal to 1.2
FarmWare estimates energy production available from the digester (btu) using the following eight steps:
Step 1) Calculate the influent VS.
Influent VS needs to be in terms of kilograms per influent flow volume:
Influent VS = VS (kg/m3)
THIRD EDITION Appendix C-49
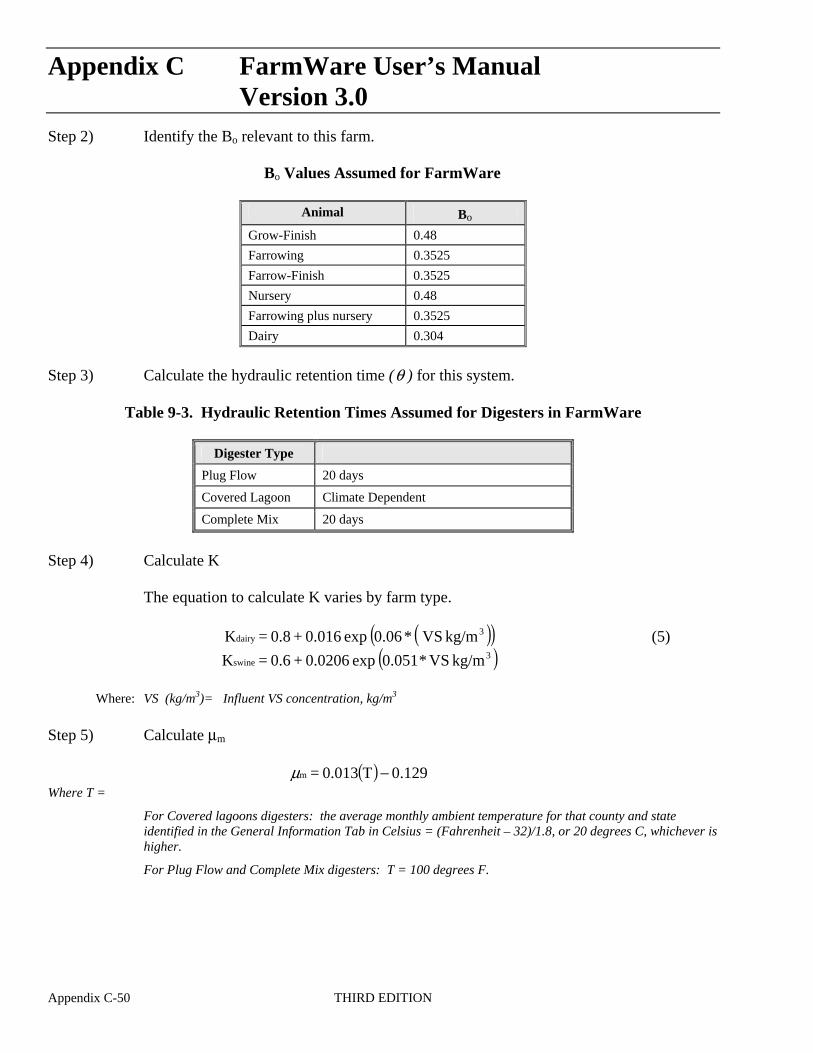
Appendix C FarmWare User’s Manual Version 3.0Step 2) Identify the Bo relevant to this farm.
Bo Values Assumed for FarmWare
Animal Bo
Grow-Finish 0.48
Farrowing 0.3525
Farrow-Finish 0.3525
Nursery 0.48
Farrowing plus nursery 0.3525
Dairy 0.304
Step 3) Calculate the hydraulic retention time (θ ) for this system.
Table 9-3. Hydraulic Retention Times Assumed for Digesters in FarmWare
Digester Type �
Plug Flow 20 days
Covered Lagoon Climate Dependent
Complete Mix 20 days
Step 4) Calculate K
The equation to calculate K varies by farm type.
3Kdairy = 0.8 + 0.016 exp (0.06 * ( VS kg/m )) (5)
Kswine = 0.6 + 0.0206 exp (0.051* VS kg/m3 ) Where: VS (kg/m3)= Influent VS concentration, kg/m3
Step 5) Calculate μm
( )− 0.129μm = 0.013 T Where T =
For Covered lagoons digesters: the average monthly ambient temperature for that county and state identified in the General Information Tab in Celsius = (Fahrenheit – 32)/1.8, or 20 degrees C, whichever is higher.
For Plug Flow and Complete Mix digesters: T = 100 degrees F.
Appendix C-50 THIRD EDITION
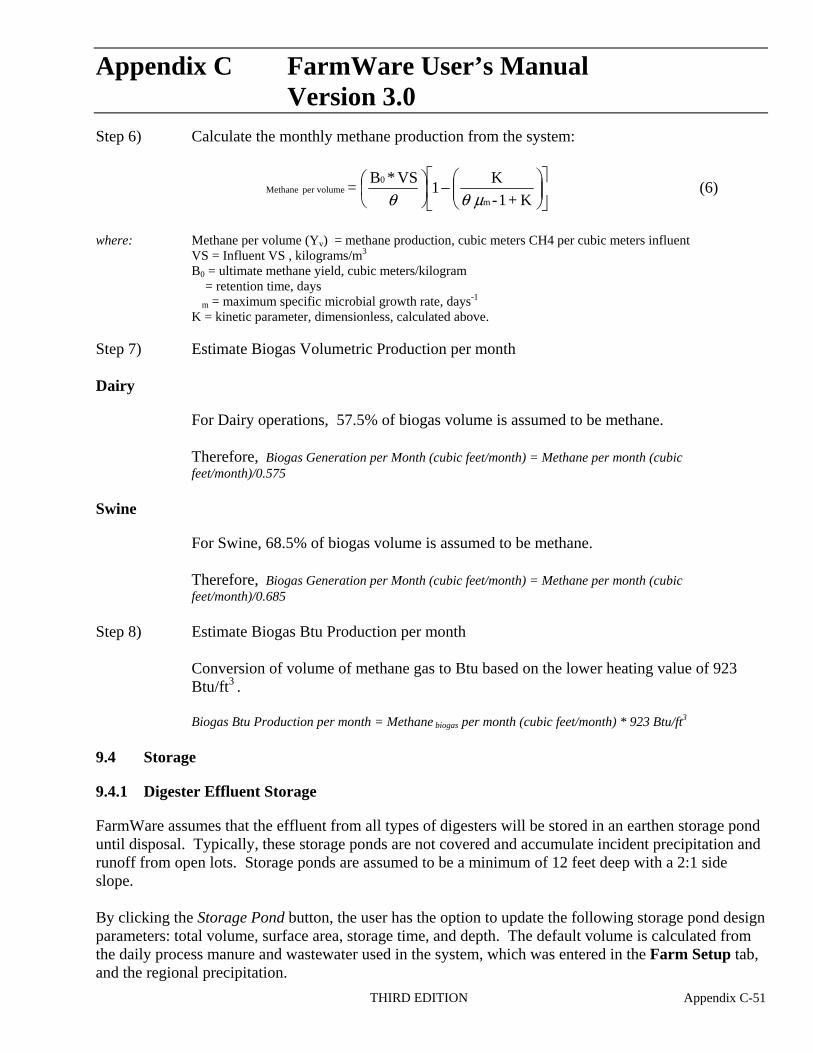
Appendix C FarmWare User’s Manual Version 3.0
Step 6) Calculate the monthly methane production from the system:
⎞⎟⎠
1 ⎡ ⎢⎣
−⎤⎛ ⎞⎛
⎜⎝
B0 * VS K(6)⎥
⎦Methane per volume = ⎜⎜
⎝⎟⎟⎠θ θ μm -1+ K
where: Methane per volume (Yv) = methane production, cubic meters CH4 per cubic meters influent VS = Influent VS , kilograms/m3
B0 = ultimate methane yield, cubic meters/kilogram � = retention time, days �m = maximum specific microbial growth rate, days-1
K = kinetic parameter, dimensionless, calculated above.
Step 7) Estimate Biogas Volumetric Production per month
Dairy
For Dairy operations, 57.5% of biogas volume is assumed to be methane.
Therefore, Biogas Generation per Month (cubic feet/month) = Methane per month (cubic feet/month)/0.575
Swine
For Swine, 68.5% of biogas volume is assumed to be methane.
Therefore, Biogas Generation per Month (cubic feet/month) = Methane per month (cubic feet/month)/0.685
Step 8) Estimate Biogas Btu Production per month
Conversion of volume of methane gas to Btu based on the lower heating value of 923 Btu/ft3 .
Biogas Btu Production per month = Methane biogas per month (cubic feet/month) * 923 Btu/ft3
9.4 Storage
9.4.1 Digester Effluent Storage
FarmWare assumes that the effluent from all types of digesters will be stored in an earthen storage pond until disposal. Typically, these storage ponds are not covered and accumulate incident precipitation and runoff from open lots. Storage ponds are assumed to be a minimum of 12 feet deep with a 2:1 side slope.
By clicking the Storage Pond button, the user has the option to update the following storage pond design parameters: total volume, surface area, storage time, and depth. The default volume is calculated from the daily process manure and wastewater used in the system, which was entered in the Farm Setup tab, and the regional precipitation.
THIRD EDITION Appendix C-51
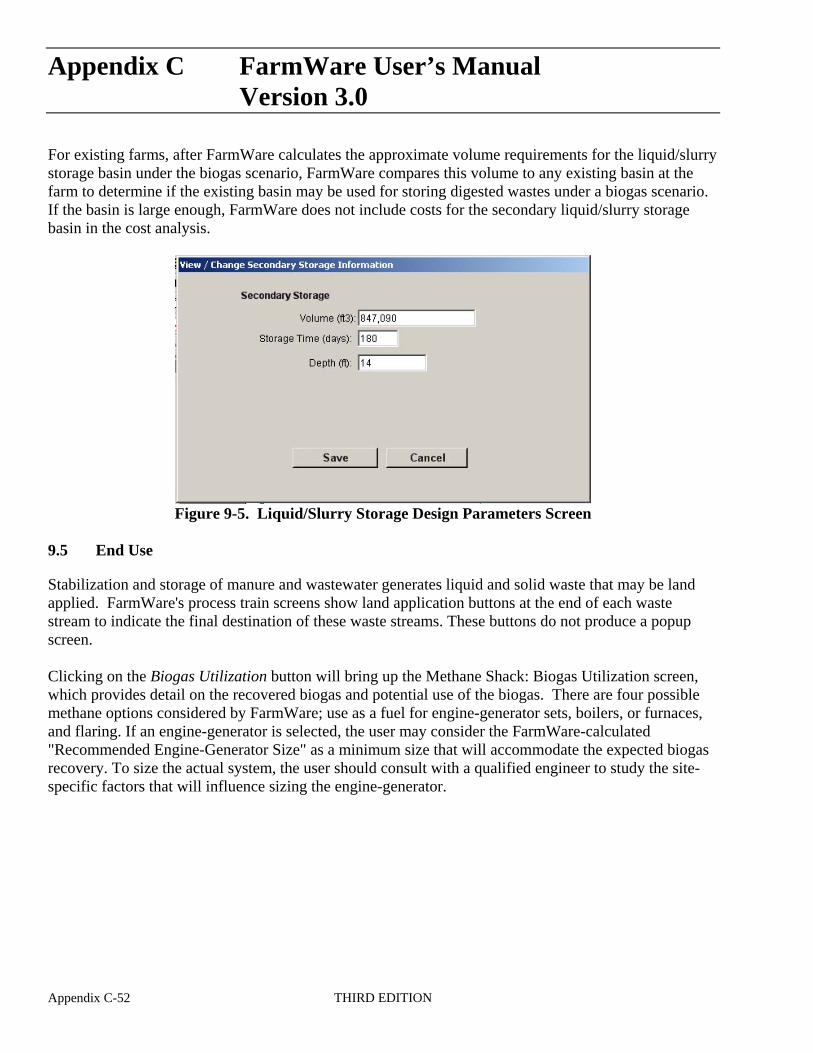
Appendix C FarmWare User’s Manual Version 3.0
For existing farms, after FarmWare calculates the approximate volume requirements for the liquid/slurry storage basin under the biogas scenario, FarmWare compares this volume to any existing basin at the farm to determine if the existing basin may be used for storing digested wastes under a biogas scenario. If the basin is large enough, FarmWare does not include costs for the secondary liquid/slurry storage basin in the cost analysis.
Figure 9-5. Liquid/Slurry Storage Design Parameters Screen
9.5 End Use
Stabilization and storage of manure and wastewater generates liquid and solid waste that may be land applied. FarmWare's process train screens show land application buttons at the end of each waste stream to indicate the final destination of these waste streams. These buttons do not produce a popup screen.
Clicking on the Biogas Utilization button will bring up the Methane Shack: Biogas Utilization screen, which provides detail on the recovered biogas and potential use of the biogas. There are four possible methane options considered by FarmWare; use as a fuel for engine-generator sets, boilers, or furnaces, and flaring. If an engine-generator is selected, the user may consider the FarmWare-calculated "Recommended Engine-Generator Size" as a minimum size that will accommodate the expected biogas recovery. To size the actual system, the user should consult with a qualified engineer to study the site-specific factors that will influence sizing the engine-generator.
Appendix C-52 THIRD EDITION
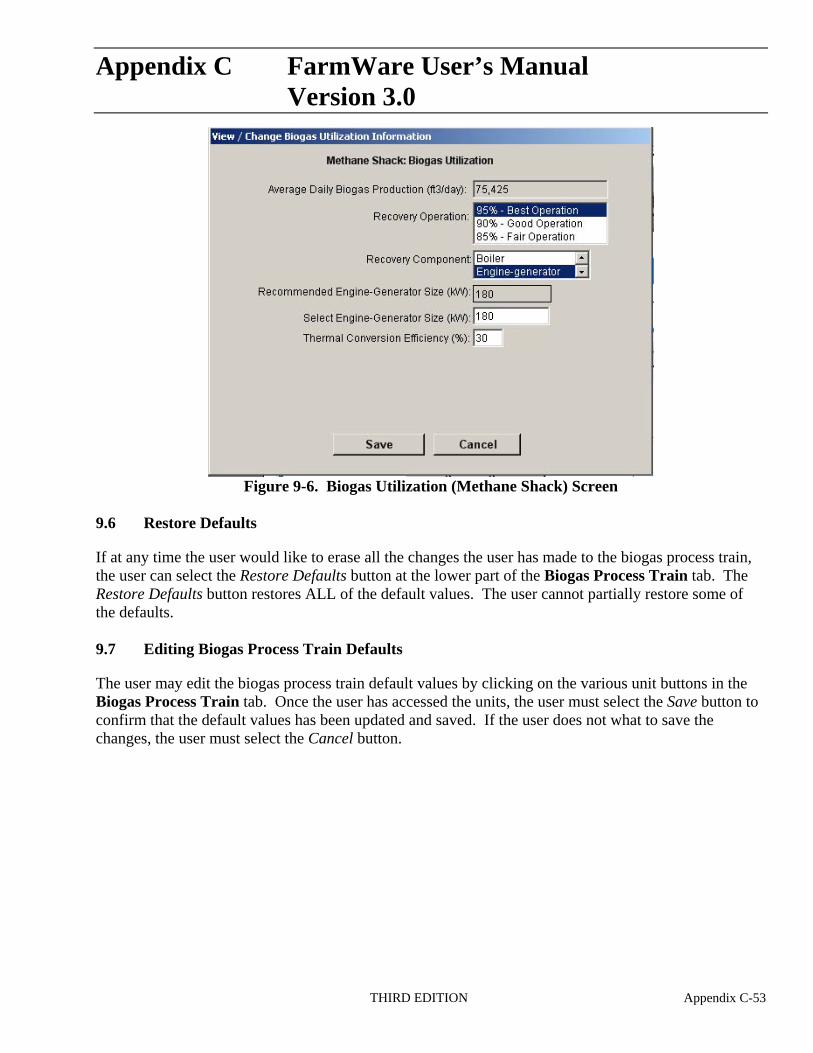
Appendix C FarmWare User’s Manual Version 3.0
Figure 9-6. Biogas Utilization (Methane Shack) Screen
9.6 Restore Defaults
If at any time the user would like to erase all the changes the user has made to the biogas process train, the user can select the Restore Defaults button at the lower part of the Biogas Process Train tab. The Restore Defaults button restores ALL of the default values. The user cannot partially restore some of the defaults.
9.7 Editing Biogas Process Train Defaults
The user may edit the biogas process train default values by clicking on the various unit buttons in the Biogas Process Train tab. Once the user has accessed the units, the user must select the Save button to confirm that the default values has been updated and saved. If the user does not what to save the changes, the user must select the Cancel button.
THIRD EDITION Appendix C-53

Appendix C FarmWare User’s Manual Version 3.0
(This page intentionally left blank.)
Appendix C-54 THIRD EDITION
Appendix C FarmWare User’s Manual Version 3.0CHAPTER 10.0: ENERGY CONSUMPTION TAB
The Energy Consumption tab collects information about the use and consumption of energy on the farm. The user will be asked for monthly energy consumption and costs, as well as the energy sources that the biogas will replace.
10.1 Energy Source Replacement
The user will be prompted from a pull down menu to identify which energy source will be replaced with biogas. There are five options to choose from: electricity only, cogeneration of electricity and heat, fuel oil, propane (LPG), or none.
"Electricity only” means that the recovered biogas is used only as fuel to generate electricity. The default value for the thermal conversion efficiency, which can be seen by clicking on the Biogas Utilization button on the Biogas Process Train tab, is 30%; however, the user may edit this percentage to within reasonable limits. A lower practical limit is 15%, and it is unlikely that a system can achieve more than 40% efficiency. (You may edit this field to values between 1 and 60%.)
“Fuel oil” or “Propane (LPG)” means thatthe recovered biogas will be used to replace A Note on Cogeneration
FarmWare assumes that 100 percent of the propane or fuel oil or propane for water or space heating fuel oil is available for replacement by recovered heat. or both. The amount of fuel oil or LPG that If there are physical limitations to 100 percent can be replaced by using biogas depends on replacement, then the heat recovery (and revenue
two things: the need for digester heating, the estimates) will be less than what FarmWare indicates.
energy conversion efficiency that can be achieved with biogas combustion, and the on-farm demand for thermal energy.
If Your Farm Uses Natural Gas If the user is replacing natural gas with biogas the user might consider using fuel oil as a surrogate. Natural gas costs about 20% higher than fuel oil per btu. Department of Energy http://www.eia.doe.gov/emeu/mer/pdf/pages/sec9.pdf
"Cogeneration" Cogeneration means that the recovered biogas will be used to generate electricity, and the waste heat from the engine-generator will be captured. The heat from the engine after digester heating requirements are satisfied is recovered and used to replace fuel that would have been used for heat generation at the farm. If cogeneration is selected, the user is then prompted to pick which heating fuel it will replace: fuel oil or propane (LPG).
10.2 Historic Use and Cost
The Energy Consumption screen prompts the user to provide historical energy use and cost by month for one year. FarmWare uses these data to calculate an average cost per unit of electricity or fuel. The user can use the scroll bar to the right of the months to scroll through all of the months. The user only needs to complete the historical energy for the source or sources that may be replaced with biogas energy.
THIRD EDITION Appendix C-55
Appendix C FarmWare User’s Manual Version 3.010.2.1 Electricity
The user can enter the amount of electricity used historically and the cost by month. The user should enter any available historical data. FarmWare records energy use in units of kWh/month and cost must be in units of $/month. The monthly cost of electricity should exclude demand and fixed charges. In the historical data, the user should include the electricity usage affiliated with the source with which you would like to offset. If the user chooses to participate in a electric utility program, the historical rate entered here represents the expected future cost to the user of electricity. This does not represent the cost the utility will pay the user for electricity from the user, which is requested on the following screen "Costs and Revenues."
10.2.2 Propane (LPG)
The user can enter the amount of propane used historically and the cost by month. FarmWare collects these data in units of gallons/month and cost must be in units of $/month.
10.2.3 Fuel Oil
The user can enter the amount of fuel oil used historically and the cost by month. FarmWare collects these data in units of gallons/month and cost must be in units of $/month.
10.3 Energy Cost
If the user has entered any historical data and if there is at least one instance of usage and one instance of cost, the user can select the Calculate button to have FarmWare calculate an average cost for energy. If no historical data are available, the user must estimate energy cost in this field. This cost should reflect what the user expects to pay for each energy source (e.g., $/kWh, $/gallon).
Appendix C-56 THIRD EDITION
Appendix C FarmWare User’s Manual Version 3.0CHAPTER 11.0: COSTS AND REVENUES TAB
The Costs and Revenues tab is divided into three sections: Revenue from Electric Utility Programs, Other Revenue, and Installed Project Costs. This tab also allows the user to indicate if the farm has additional revenue or costs. The user can elect to account for any funding assistance or can assign a cost-savings associated with odor control, fiber utilization, nutrient management planning, or other sources. The screen also presents the calculated capital costs of the proposed biogas recovery system for review. The user can elect to edit these capital and annual costs also.
11.1 Revenue from Utility Contract Programs
The user can select from three options for the Electricity Utility Programs from the pull down menu. Those three options are: net metering, sell all, or surplus sales. The types of programs available vary by state. If the user is interested in pursuing one of these options, the user should contact their state utility commission for more information.
11.2 Other Revenue
The user can elect to include other sources of revenue. Included are the value of grants and other types of financial assistance received, and this value is deducted from the capital cost used in the financial analysis. The user also can enter annual benefits, such as cost-benefits from fiber sales/bedding replacement, odor control, and/or other benefits.
11.3 Installed Project Costs
The Installed Project Cost table shows the estimated capital costs and annual operating and maintenance costs for a biogas recovery project. The capital costs are one-time costs initially incurred for construction and equipment. FarmWare estimates the average project costs for each digestion system based on actual and projected project costs provided to EPA as part of biogas recovery programs. All costs are normalized to the year 2005.
11.3.1 Capital Cost
In FarmWare, capital costs are the costs the construction and equipment costs initially incurred to assemble the system and are one-time costs. The sum of these costs, which is the total investment required, is used to calculate the annual loan payment that would be required. Grants and cost share money indicated in the Costs and Revenue screen are deducted from the capital cost. FarmWare assumes that the rate of return and the loan term are the same for both internally provided and borrowed capital.
11.3.2 Operating and Maintenance Cost
FarmWare defines the operating and maintenance cost as being the sum of the costs that are routinely incurred after the system is in operation. These are recurring costs such as the cost of routine engine-generator set maintenance and repair. FarmWare assigns an operating and maintenance cost of 5% of the total project capital cost before any grants or cost share costs are deducted from the capital cost.
THIRD EDITION Appendix C-57

Appendix C FarmWare User’s Manual Version 3.0
(This page intentionally left blank.)
Appendix C-58 THIRD EDITION
Appendix C FarmWare User’s Manual Version 3.0CHAPTER 12.0: REPORTS TAB
After the user has entered all of the data describing the farm and the manure management processes at the farm, FarmWare generates a report summarizing these data and the feasibility assessment. The report will have the name of the farm and the location in the upper left hand corner of each page. In addition, for easy reference, the version of FarmWare and the date the report was opened is printed at the bottom of the page with the page number.
From the Reports tab, the user can select any of 10 buttons to view, print, or export the report. By clicking on the View Entire Report button the entire report will open in another screen. By clicking on either the View the Executive Summary button or the other View Section # buttons, the corresponding section of the report will pop up. Only one section or the entire report can be open at one time. To return to the Report tab, select the “X” button at the uppermost right hand corner of the screen.
The user can navigate the report using the arrows at the top of the page. While reviewing any individual section or table, if the user would like to bookmark a table, the user can select anywhere on the table and the table will appear in an additional window. The user may toggle between the report and the various tables by clicking on the tabs in the Windows task bar.
The user has the option to print the entire report by clicking on the Print Entire Report button. Individual sections cannot be printed.
Export
The user has the option to export the entire report by clicking on the Export Entire Report button. FarmWare can export the report in the following formats: Crystal Reports (*.rpt), Adobe Acrobat (*.pdf), Microsoft Excel (*.xls) (either the whole report or just the data), Microsoft Word (*.doc), or Rich Text Format (*.rtf). When exportation is complete, a message indicating “Export completed” will pop up.
Close
At any point, the user may return to the FarmWare interface by closing the report window using the 'X' button in the top right hand corner of the report window.
12.1 Executive Summary
The Executive Summary identifies basic information about the farm, the conventional manure management system, and the proposed biogas system. The executive summary also includes three tables as shown in Figure 12-1.
THIRD EDITION Appendix C-59
Appendix C FarmWare User’s Manual Version 3.0Table ES-1: Assessment of Financial Feasibility of Modifying the Conventional Manure
Management System to Capture and Utilize Biogas
This table includes the total capital investment required, annual revenue from the recovery and use of biogas, total annual costs, simple payback, estimated average annual net income before taxes, and the net present value. Total annual costs include operating and maintenance costs as well as annual taxes and insurance (estimated at 5% capital costs).
Table ES-2: Summary of Biogas System Performance Estimates
This table includes the estimated potential and estimated value of biogas production and electricity generation.
Table ES-3: Environmental Performance Comparison
This table summaries the amount of methane that generated from the system. The table also displays the changes in ammonia and chemical oxygen demand during digestion based on differences between digester influent and effluent concentrations.
12.2 Introduction to the Full Report
The user may access the introduction to the report by clicking on the View Section 1 button. This introduction summarizes the farm and briefly describes the manure system. The introduction also describes a description for the other sections of the report: Section 2.0 User Inputs, Section 3.0 Technical Feasibility, Section 4.0 Economic Feasibility, Section 5.0 Environmental Performance, and Section 6.0 Warnings.
12.3 User Inputs
Section 2.0, User Inputs, presents the user the opportunity to review user input. It is important for the user to check the accuracy of this information to insure the accuracy of the assessment. Section 2.0 includes four tables:
Table 2-1 Summary of General Information Provided by the User
The table lists the farm’s name, city (if entered), state, and the type of farm. The table also provides a list of the confinement facilities and manure collection system. It summarizes the current waste management system at the planned or existing farm and the proposed biogas recovery modifications.
Table 2-2: Standing Animal Populations and Time Spent in Housing
This table lists the types of the animals on the farm, the number of animals, and the hours per day spent in each of the housing facilities.
Appendix C-60 THIRD EDITION
Appendix C FarmWare User’s Manual Version 3.0Table 2-3: Record of Energy Use in the Most Recent 12 Months
The table shows the amount of energy used and the cost by electricity, fuel oil, and propane for the last 12 months. Electricity cost excludes demand and fixed charges.
Table 2-4: Estimates of Water Use and Waste Flow through Housing
The table displays the type of housing on the farm and the amount of fresh water and recycled water is used per day. In the last column, it also shows the amount of manure that is generated per day.
12.4 Technical Feasibility
Based on the user inputs summarized in Section 2.0 of the report, Section 3.0 presents the monthly estimates for biogas methane produced, the amount of electricity that can be generated from the biogas, and the amount of fuel that can be saved. There are four tables in Section 3.0.
Table 3-1: Monthly Estimates of Biogas, Methane, and BTU Production Potential
Table 3-1 Monthly Estimates of Biogas, Methane, and BTU Production Potential lists the amount of biogas that FarmWare estimates will be produced.
Table 3-2: Design Parameters
This table lists all of the assumptions that FarmWare is using to generate the numbers listed in Table 3-1 Monthly Estimates of Biogas, Methane, and BTU Production Potential. Because every farm is different, each will have a different system plan and the assumptions will vary. But generally, the table will have the type of biogas production system, the total amount of waste generated and details about where the waste is stored (i.e. volume, retention time, and surface area).
Table 3-3: Monthly Estimates of the Potential of Using Biogas
This table will also vary depending on what selection was made on the Energy Consumption tab. The table will only list what the user selected: electricity, fuel oil, propane, or a combination of electricity and either fuel oil or propane (if cogeneration was chosen).
Table 3-4: Energy Balance
The fourth table is Table 3-4 Energy Balance. This table depends on the user’s selection for the type of utility contract on the Costs & Revenues tab. The choices were net metering, sell all/buy all, and surplus sales. The table will always display the historical data by month, and the electricity that can be generated from the biogas. If “net metering” was chosen it will also have a column that shows the net difference between the historical use and the electricity generated from the biogas. If “sell all/buy all” was chosen, it will have a column for the potential sale to the utility and a column that shows what would be required from the local utility. If “surplus sale” was chosen it again will have a column for potential sale to the utility and the required from the local utility.
THIRD EDITION Appendix C-61
Appendix C FarmWare User’s Manual Version 3.012.5 Economic Feasibility
This section of the report gives the user s brief overview of the economic feasibility of a biogas recovery system. There are four tables in Section 4.0: Table 4-1 Financial Factors, Table 4-2 Equipment Capital Costs, Table 4-3 Operating and Maintenance Costs, and Table 4-4 Estimate of Energy Expense Saved through Biogas Use. The data in tables 4-1 through 4-3 are used by FarmWare to generate the numbers in table 4-4.
Table 4-1: Financial Factors
The first table is Table 4-1 Financial Factors lists all of the factors that the user can view on the Assessment tab by clicking the View/Edit Financial Factors button. The Factors include: project lifetime, down payment percentage, loan interest rate, loan term, project discount rate, marginal tax rate, depreciation method, and general annual inflation rate.
If the user would only like to look at this table, the user can select anywhere on the table and it will bring up another tab called Table 4-1.rpt. The user can now easily scroll between the report and the various tables by clicking on the tabs.
Table 4-2: Capital Costs
The second table is Table 4-2 Capital Costs. The table lists the various components of the facility including some design details, and the total capital cost. If the user would only like to look at this table, the user can select anywhere on the table and it will bring up another tab called table4-2.rpt. The user can now easily scroll between the report and the various tables by clicking on the tabs.
Table 4-3: Operating and Maintenance Costs
The third table is Table 4-3 Operating and Maintenance Costs, and is similar to the previous table. This table again lists the various components of the facility and the operating and maintenance costs associated with each part of the facility.
Table 4-4: Estimate of Net Income from Biogas Production
The fourth table is Table 4-4, Estimate of Energy Expense Saved through Biogas Use. This table is broken up by months and with five columns. The first column is the future energy cost, based on the user's current estimated use and implementation of the selected energy recovery system. The second column is the value of the energy derived from the biogas that used onsite. The third column is value of energy derived from biogas, delivered to the local electric utility. The fourth column is the cost associated with generating energy derived from biogas. The final column is the estimated net income derived from the biogas produced.
Appendix C-62 THIRD EDITION
Appendix C FarmWare User’s Manual Version 3.012.6 Environmental Performance
This section contains one table, Table 5-1 Environmental Performance Comparison. The table lists the various components of the conventional system and the biogas recovery system along with air quality and water quality parameters associated with those components. This table presents quantitative estimates of methane generation from conventional and digester systems for comparison. Additionally, the table presents qualitative estimates of reductions in hydrogen sulfide, odor control, ammonia, COD, nitrogen, phosphorus, and pathogens.
Environmental performance data used in FarmWare is estimated from the following reports summarizing the performance of biogas recovery at dairy and swine farms:
• Barhams Study: Martin, J.H., Jr. 2002. A Comparison of the Performance of Three Swine Waste Stabilization Systems. Final report submitted to the U.S. Environmental Protection Agency AgSTAR Program by the Eastern Research Group, Inc., Boston, MA.
• Colorado Pork: Martin, J.H., Jr. 2003. An Assessment of the Performance of the Colorado Pork, LLC, Anaerobic Digestion and Biogas Utilization System. Final report submitted to the U.S. Environmental Protection Agency AgSTAR Program by the Eastern Research Group, Inc., Boston, MA.
• AA Dairy Study: Martin, J.H., Jr. 2004. A Comparison of Dairy Cattle Manure Management With and Without Anaerobic Digestion and Biogas Utilization. Final report submitted to the U.S. Environmental Protection Agency AgSTAR Program by the Eastern Research Group, Inc., Boston, MA.
• Deep Pit Study: Martin, J.H., Jr. 2003. A Characterization of Transformations Occurring as Swine Manure Accumulates in Deep Pits. Final report submitted to the U.S. Environmental Protection Agency AgSTAR Program by the Eastern Research Group, Inc., Boston, MA.
12.7 Warnings
The final section of the report lists various warnings that FarmWare previously indicated to the user and were not corrected. There are seven possible warnings that FarmWare tracks:
Caution: A covered lagoon digester in this climate region may not effectively produce enough methane for energy recovery. You may choose another type of digestion on this page or select a methane use other than electricity generation in the Methane Utilization subscreen.
Plug flow digestion requires at least weekly scraping for open lot manure to be viable waste for the digester.
If your entire operation is 'All-In/ All-Out', then your revenues using digestion with methane recovery will be decreased from the analysis shown in FarmWare, because FarmWare assumes a
THIRD EDITION Appendix C-63
Appendix C FarmWare User’s Manual Version 3.0
constant standing population of animals. Your operation may not be ideal for digestion given the variability in manure availability if period between production cycles are excessively long.
Caution: The process water and manure distribution inputs you have entered for this farm results in a hydraulic retention time (HRT) less than is recommended in this geographic region.
Caution: The process water you have entered for this farm results in a hydraulic retention time (HRT) that is more than twice what is needed in this geographic region.
The total solids entering the digester is {a} %. The digester system chosen operates ideally at {b}% to {c}% total solids. You may want to return to Farm Setup and change your inputs to improve the performance of your system.
Appendix C-64 THIRD EDITION
Appendix C FarmWare User’s Manual Version 3.0CHAPTER 13.0: ACRONYMS
This section contains a list of acronyms frequently used in this Guide. Additional information may be available in section 14.0 Glossary.
BTU: British Thermal Units
COD: Chemical Oxygen Demand
CTSL: Combined Treatment and Storage Lagoons
DDB: Double Declining Balance
GPD: Gallons Per Day
HRT: Hydraulic Retention Time
kW: Kilowatt
kWh: Kilowatt Hour
LPG: Liquified Petroleum Gas
MACRS: Modified Accelerated Cost Recovery System
MCL: Multiple Celled Lagoon
MOU: Memorandum of Understanding
NPV: Net Present Value
O & M: Operating and Maintenance
SYD: Sum of Years’ Digits
TS: Total Solids
WMS: Waste Management System
VS: Total volatile solids
Bo: Maximum methane producing capacity
THIRD EDITION Appendix C-65

Appendix C FarmWare User’s Manual Version 3.0
(This page intentionally left blank.)
Appendix C-66 THIRD EDITION
Appendix C FarmWare User’s Manual Version 3.0CHAPTER 14.0: DEFINITIONS
25 Year, 24 Hour Storm Event: The rainfall event with a probable recurrence interval of once in 25 years with a duration of 24 hours, as defined by the National Weather Service in technical Paper Number 40, “Rainfall Frequency Atlas of the United States:, May 1961, and subsequent amendments.
AgSTAR: A voluntary federal program that encourages the use of effective technologies to capture methane gas, generated from the decomposition of animal manure, for use as an energy resource.
Anaerobic: Requiring, or not destroyed by, the absence of air or free oxygen.
Anaerobic Bacteria: Bacteria that only grow in the absence of free elemental oxygen.
Anaerobic Lagoon: A treatment or stabilization process that involves retention under anaerobic conditions.
Anaerobic Digester: A tank or other vessel for the decomposition of organic matter in the absence of elemental oxygen.
Anaerobic Digestion: The degradation of organic matter including manure brought about through the action of microorganisms in the absence of elemental oxygen.
Bacteria: A group of universally distributed and essentially unicellular microscopic organisms lacking chlorophyll.
Barn: A totally or partially enclosed structure where animals are confined.
Conventional System The existing or planned farm that does not have a biogas recovery system in place.
Best Management Practice (BMP): A practice or combination of practices found to be the most effective, practicable (including economic and institutional considerations) means of preventing or reducing the amount of pollution generated by nonpoint sources to a level compatible with water quality goals.
Biogas: Gas resulting from the decomposition of organic matter under anaerobic conditions. The principal constituents are methane and carbon dioxide.
Biogas Recovery System A series of additional components and equipment that allow a farm to capture and use biogas from their waste stream for energy.
Biomass: Plant materials and animal wastes used especially as a source of fuel.
British Thermal Unit (BTU): The amount of heat required to raise the temperature of one pound of water one degree Fahrenheit. One cubic foot of biogas typically contains about 600 to 800 BTUs of heat energy. By comparison, one cubic foot of natural gas contains about 1,000 BTUs.
Calf: An immature dairy or beef animal up to approximately six months of age.
Chemical Oxygen Demand (COD): COD is used as a measure of the oxygen equivalent of the organic matter content of a sample that is susceptible to oxidation by a strong chemical oxidant. For a sample from a specific source, COD can be related empirically to biochemical oxygen demand (BOD), organic carbon, ororganic matter. (Note-This is the Standard Methods definition.)
Complete Mix Digester: A controlled temperature, constant volume, mechanically, hydraulically, or gas mixed vessel designed to maximize biological treatment, methane production, and odor control as part of a manure management facility with methane recovery.
THIRD EDITION Appendix C-67
Appendix C FarmWare User’s Manual Version 3.0
Composting: The biological decomposition and stabilization of organic matter under conditions, which allow the development of elevated temperatures as the result of biologically produced heat. When complete, the final product is sufficiently stable for storage and application to land without significant release of noxious odors.
Covered Lagoon Digester: An anaerobic lagoon fitted with a gas impermeable cover designed to capture biogas resulting from the decomposition of manure.
Cow: A mature female dairy or beef animal that has produced at least one calf.
Cow, Dry: A mature cow in the period between the cessation of lactation and calving.
Cow, Lactating: A lactating dairy or beef cow.
Dairy-Open Lot: A dairy farm where cows are confined and fed in an open lot, also called a corral or paddock in some regions.
DDB Depreciation: Double declining balance (DDB) depreciation is an accelerated depreciation method in which first year depreciation is double the amount of straight-line depreciation.
Demand charge: The peak kW demand during any quarter hour interval multiplied by the demand charge rate.
Digester: A concrete vessel used for the biological, physical, or chemical breakdown of livestock and poultry manure.
Discount rate: The interest rate used to convert future payments into present values.
Down payment: The investment made by the owner in a project.
Effluent: The discharge from an anaerobic digester or other manure stabilization process. ?????
Energy Charge: The energy charge rate times the total kWh of electricity used.
FarmWare: AgSTAR decision support software that allows the evaluation of the costs and benefits of methane recovery systems.
Fecal coliforms: Bacteria usually present in the feces and intestinal tracts of warm-blooded animals that ferment lactose to produce acid and gas. These can enter water bodies from human and animal waste.
Fecal streptococcus Bacteria usually present in the feces and intestinal tracts of warm-blooded animals. These can enter water bodies from human and animal waste.
Feed Apron: A paved or hard surface along one side of a open lot where feed is provided to the animals.
Feeder Pig: A pig from about 60 pounds to market weight.
Finisher: A swine animal finished for market.
Flushing System: A manure collection system that collects and transports manure using water.
Freeboard: The distance between the highest possible wastewater level in a manure storage/treatment structure and the top of the structure. Freeboard is an important design parameter in designing lagoons, ponds, storage basins, digesters, and other manure storage and treatment structures to avoid uncontrolled waste discharges.
Gilt: A female swine that has not produced a litter of pigs. .
Greenhouse Gas: An atmospheric gas, which is transparent to incoming solar radiation but absorbs the infrared radiation emitted by the Earth’s surface. The principal greenhouse gases are carbon dioxide, methane, and CFCs.
Grower: An immature male or female pig managed between weaning and finishing weights.
Appendix C-68 THIRD EDITION
Appendix C FarmWare User’s Manual Version 3.0
Heifer: A female dairy or beef animal that has not produced a calf.
Hydraulic Retention Time (HRT): The average time required to displace the contents of a tank or lagoon at a given rate of effluent discharge (volume divided by rate of discharge). The HRT is an important design parameter for treatment lagoons, covered lagoon digesters, complete mix digesters, and plug flow digesters.
Inflation Rate: The annual rate of increase in costs or sales prices in percent.
Influent: The flow into an anaerobic digester or other manure stabilization process.
Internal Rate of Return (IRR): The discount rate that makes the NPV of an income stream equal to zero.
Kilowatt (kW): One thousand watts (1.341 horsepower).
Kilowatt Hour (kWh): A unit of work or energy equal to that expended by one kilowatt in one hour or to 3.6 million joules. A unit of work or energy equal to that expended by one kilowatt in one hour (1.341 horsepower-hours).
Lagoon: Any large holding or detention pond, usually with earthen dikes, used to contain wastewater while sedimentation and biological treatment or stabilization occurs.
Land Application: Application of manure to land for reuse of the nutrients and organic matter for their fertilizer value.
Liquid Manure: Manure having a total solids content of no more than five percent on a wet weight basis.
Organic Loading Rate: The rate of volatile solids (VS) entering a manure management structure for biological stabilization. Loading rate often is expressed as pounds of VS/1000 cubic feet.
Loan Rate: The interest rate on borrowed capital.
MACRS Modified Accelerated Cost Recovery System. A depreciation method that may be applied in FarmWare over 7 or 10 years.
Manure: The fecal and urinary excretions of livestock and poultry.
Marginal Tax Rate: The percent of the methane recovery project net income to be paid in taxes.
Memorandum of Understanding (MOU): An agreement between AgSTAR Partners, Allies, and Endorsers and the EPA stating the responsibilities and commitments agreed to by both parties.
Mesophilic: Operationally between 80°F and 100°F (27°C and 38°C).
Methane: A colorless, odorless, flammable gaseous hydrocarbon that is produced during the anaerobic decomposition of organic mater. Methane is a major greenhouse gas. Methane is also the principal component of natural gas.
Methane Project Lifetime: The useful life of the structural components of the project.
Methane Recovery Lagoon: See covered lagoon digester.
Minimum Treatment Volume: The minimum volume necessary for the design HRT or loading rate.
Mix Tank: A control point where manure is collected and added to water or dry manure to achieve the required solids content for a complete mix or plug flow digester.
Natural Gas: A combustible mixture of hydrocarbons containing primarily used chiefly as a fuel.
Net Present Value (NPV): The present value of all cash inflows and outflows of a project at a given discount rate over the life of the project.
Nonpoint Source Pollution: Pollution resulting from intermittent discharges of pollutants from diffuse sources and transported over land before entering a water body.
THIRD EDITION Appendix C-69
Appendix C FarmWare User’s Manual Version 3.0
NPV Payback: The number of years it takes to pay back the capital cost of a project calculated with discounted future revenues and costs. Profitable projects will have an NPV Payback value less than or equal to the lifetime of the project.
Nursery: A facility used to house and feed pigs between weaning and the grow/finish phase of swine production.
Nursery Pig: A weaned pig up to about 60 pounds live weight.
Nutrients: A substance required for plant or animal growth. The primary nutrients required by plants are nitrogen, phosphorus, and potassium. The primary nutrients required by animals are carbohydrates, fats, and proteins.
Operating Volume: The volume of the lagoon needed to hold and treat the influent manure and accumulated precipitation.
Milking Center: A facility where lactating cows are assembled and milked and the milk produced is stored
AgSTAR Partner: A livestock producer who signs a Memorandum of Understanding (MOU) with the U.S. EPA and agrees to survey his/her facility and install methane recovery systems where profitable within 3 years.
Pasture: An open area where the animals may roam freely and satisfy at least a substantial portion of their nutrient needs through grazing.
Payback Years: The number of years it takes to pay back the capital cost of a project.
pH: A measure of acidity or alkalinity. The pH scale ranges from zero to 14, with a value of 7 considered neutral. The lower a value, the higher the acidity, and the higher the value, the higher the alkalinity.
Piglet: A nursing pig.
Plug Flow Digester: A constant volume, flow-through, controlled temperature biological treatment unit designed to maximize biological treatment, methane production, and odor control as part of a manure management facility with methane recovery.
Point Source Pollution: Pollution entering surface waters from a discrete conveyance such as a pipe or ditch.
Process Water: Water used in the normal operation of a livestock farm. Process water includes all sources of water that may need to be managed in the farm’s manure management system.
Psychrophilic: Operationally between 54°F and 64°F (12°C and 18°C).
Pull Plug Pit: A series of one or more pits where manure is collected until transferred to a storage or treatment structure.
Scrape System: Collection method that uses a mechanical device to regularly remove manure from barns, drylots, or other similar areas where manure is deposited.
Separator: A mechanical device or gravity settling basin that separates manure into solid and liquid fractions.
Settling Basin: A basin designed to remove solids by gravitational settling.
Sideslope: The slope of a lagoon embankment, often expressed as the ratio of the horizontal displacement and vertical displacement.
Simple Payback: The number of years it takes to pay back the capital cost of a project calculated without discounting future revenues or costs.
Appendix C-70 THIRD EDITION
Appendix C FarmWare User’s Manual Version 3.0
Sludge Volume: Volume to allow for sludge accumulation in a manure storage or treatment structure. Sludge volume is an important design parameter for manure storage and treatment structures.
Slurry (Semi-solid) Manure: Manure having a total solids content between five and ten percent.
Solids Manure: Manure having a total solids content exceeding 10 percent.
Sow: A female pig that has produced at least one litter of piglets.
Storage Pond: An earthen basin designed to store manure and wastewater until it can be utilized. Storage ponds are not designed to treat manure.
Storage Tank: A concrete or metal tank designed to store manure and wastewater until it can be utilized. Storage tanks are not designed to treat manure.
Storm Water Runoff: Manure contaminated rainfall which must be stored and utilized on the farm and may not be discharged into rivers, streams, lakes, or other bodies of water.
Straight-Line Depreciation: Depreciation per year equals the total facility cost divided by the years of depreciation (usually the facility lifetime).
Supplemental Heat: Heat added to complete mix and plug-flow digesters to maintain a constant operating temperature.
Swine-Farrow-to-Finish: A swine operation where pigs are raised from birth to market weight.
Swine-Farrow-to-Nursery: A swine operation where pigs are raised from birth to weaning.
Swine-Farrow-to-Feeder: A swine operation where pigs are raised from birth to approximately 60 pounds live weight.
Swine-Grow/Finish: A swine operation where feeder pigs are fed to market weight.
SYD Depreciation: Sum of Years' Digits (SYD) is a common accelerated depreciation method where the sum of the digits is the total of the numbers representing the years of depreciation (usually the facility lifetime).
Thermophilic: Operationally between 110°F and 140°F (43°C and 60°C).
Total Solids: The sum of dissolved and suspended solids usually expressed as a concentration or percentage on a wet basis.
Utility Interconnection: The method of utilizing electricity produced from manure management facilities. Options include: Sell all/Buy all, Surplus Sale, or Net Metering
Volatile Solids: The fraction of total solids that is comprised primarily of organic matter.
Volatilization: The loss of a dissolved gas, such as ammonia, from solution.
Volumetric Loading Rate: The influent or effluent flow rate per unit of system volume. Usually expressed as cubic feet per 1,000 cubic feet per day..
THIRD EDITION Appendix C-71
Appendix D Reserved
Reserved for Future Use
SECOND EDITION Appendix D-i
Appendix E FarmWare Case Studies
To be inserted later
SECOND EDITION Appendix E-i
Appendix F National Resource Conservation Service Practice Standards
Contents:
F-1. Anaerobic Digester, Ambient Temperature (No. 365)
F-2. Anaerobic Digester, Controlled Temperature (No. 366)
F-3. Waste Facility Cover (No. 367)
F-4. Waste Storage Facility (No. 313)
Each state determines which national conversation practice standards are applicable in their state. States often add technical criteria and issue them as state conservation practice standards. You should consult with the state to ensure that you meet all state and local standards, which may be more restrictive than national standards. To find your state office or review these practice standards on line, please visit www.nrcs.usda.gov.
SECOND EDITION Appendix F-i
1
7
13
16
Appendix F National Resource Conservation Service Practice Standards
ANAEROBIC DIGESTER – AMBIENT TEMPERATURE
(No.)
Code 365 DEFINITION
An unheated waste treatment impoundment.
PURPOSE
To biologically treat waste as a component of a waste management system to:
• produce biogas and capture for energy
• improve air quality
• reduce greenhouse gas emissions
CONDITIONS WHERE PRACTICE APPLIES
This practice applies where:
• Biogas production and capture are components of a planned animal waste management system. Suitable geographic areas for energy recovery are shown in Figure F-1.
• Existing waste impoundment(s) can be modified to the requirements of this standard or for new construction.
• The digester is in conjunction with a separate waste storage facility or where the digester and storage are congruent.
• Manure can be collected fresh and delivered to the digester with a total solids (TS) concentration in the influent waste of less than 2 percent.
• The operator has the interest and training to monitor and maintain processes or contracts with a consultant to provide these services.
CRITERIA
General Criteria Applicable to All Purposes
Laws and Regulations. Waste treatment facilities must be planned, designed, and constructed to meet all Federal, State, and local regulations.
Manure Characteristics. This practice is applicable to manure that is collected fresh, generally less than 7 days old. Manure shall be essentially free of soil, sand, stones, or fibrous bedding material (including clumps of straw), or processed to remove such material.
Ruminant's manure shall be treated with solid separation prior to entry into the digester.
Rainfall Runoff. Rainfall runoff shall be diverted away from the digester.
Anaerobic Digester. The digester shall meet the General Criteria for All Lagoons given in Practice Standard 359, Waste Treatment Lagoon, as appropriate, and the following additional requirements:
1. Minimum Treatment (Design Operating) Volume. The design operating volume shall be based either on the daily volatile solids (VS) loading rate per 1,000 ft3 or the minimum hydraulic retention time (HRT) adequate for methane production, whichever is greater. The maximum daily VS loading rate shall be selected from the values listed on the map in Figure F-2. The minimum HRT shall be selected from values listed on the map in Figure F-3.
2. Required Total Volume. The required total volume of the digester shall be equal to the minimum treatment volume except where waste storage is included in the design, in which case the volume shall meet the additional criteria for Design Storage Volume in Practice Standard 313, Waste Storage Facility, as appropriate.
Appendix F-1 SECOND EDITION
Appendix F National Resource Conservation Service Practice Standards
The digester storage volume does not need to account for rainfall except for partially covered digesters.
3. A minimum of 2 feet of freeboard above the digester design water surface shall be provided except when rainfall is included in determining the operating volume, where only 1 foot of freeboard is required.
4. Length to Width Ratio. The ratio of length to width of the digester is limited to 4:1 or less.
5. Operating Depth. The operating depth of the digester shall be at least 12 feet over 50 percent or more of the bottom area.
6. Interior Slopes. Interior slopes shall be as steep as permitted by soil properties and construction techniques.
7. Waste Inlet and Outlet. The inlet and outlet devices shall be located as far apart as practical to minimize “short circuiting.”
8. The inlet shall discharge a minimum of 12 inches below the digester water surface.
9. Outlet. The digester shall be equipped with an outflow device that maintains the digester water surface at its operating level. Except where the digester is designed to include storage, the outlet shall release directly to the waste storage facility without release of trapped gas.
10. Digester Cover. The digester cover, materials, anchorage, and all appurtenances, such as weights and floats, shall be designed to capture and convey biogas to the gas collection system. The digester cover and materials shall meet the requirements of Practice Standard 367, Waste Facility Cover.
Separate Waste Storage Facility. Separate waste storage facilities shall meet the requirements of Practice Standard 313, Waste Storage Facility. No storage credit shall be attributed to the digester in meeting the minimum storage requirements in Practice Standard 313 except for sludge volume reduction based on expected total solids (TS) removed or destroyed.
Gas Collection, Transfer, and Control System. The biogas collection, transfer, and control system
shall be designed to convey captured gas from under the digester cover to gas utilization equipment or device (flare, boiler, engine, etc.).
Gas Collection and Transfer
1) Perforated pipe and other components under the digester cover shall be designed to exclude floating debris and waste residue and shall have a service life consistent with the expected cover life, but not less than 10 years.
2) Pipe and components under the cover shall be securely anchored to prevent displacement from normal cover forces.
3) The collection and transfer pipe shall be designed for wet biogas. In colder climates, the pipe shall be protected as necessary to prevent frost buildup. In no case shall the pipe size be less than 3-inch diameter.
4) Pipe used for transfer of gas can be buried or installed above ground and must include provisions for drainage of condensate, pressure and vacuum relief, and flame traps.
Gas Control
1) Gas control equipment and components shall be conveniently located and sheltered from the elements. A minimum distance of 30 feet (10 m) shall separate the control facility from the digester.
2) Gas control equipment and components shall have a service life of not less than 2 years and shall be readily accessible for replacement or repair.
3) The size of equipment and connecting pipe shall be based on head loss, cost of energy, cost of components, and manufacturers’ recommendations.
4) Where electrical service is required at the control facility, the installation and all electrical wire, fixtures and equipment shall meet the National Electrical Code and local and state requirements.
Gas Utilization. Gas utilization equipment shall be designed and installed in accordance with standard engineering practice and the manufacturer
Appendix F-2 SECOND EDITION
Appendix F National Resource Conservation Service Practice Standards
recommendations. As a minimum, the installation will include a flare to burn off collected gas.
1. The flare shall be equipped with automatic ignition and powered by battery/solar or direct connection to electrical service. The flare shall have a minimum capacity equal to the anticipated maximum biogas production.
2. Gas-fired boilers, turbines, and internal combustion engines, when a component of the system, shall be designed for burning biogas directly or shall include equipment for removing H2S and other contaminants from the biogas.
Monitoring. When the purpose is to produce and capture biogas for energy, equipment needed to properly monitor the digester and gas production shall be installed as part of the system. As a minimum, the following equipment is required: • A temperature sensor and readout device to
measure internal temperature of digester. • Gas meter suitable for measuring biogas.
Safety. Methane is a flammable gas. The gas collection, control, and utilization system shall be designed to incorporate measures to prevent undue safety hazards. As a minimum, “Warning Flammable Gas” and “No Smoking” signs shall be posted.
Flares shall be located a minimum distance of 95 feet (30 m) from the biogas source and grounded or otherwise protected to minimize the chance of lightening strikes.
A flame trap device shall be provided in the gas line between the digester and points of use (flare, boiler, engine, etc.).
The location of underground gas pipe shall be marked with signs to prevent accidental disturbance or rupture. Mark exposed pipe to indicate whether gas line or other.
CONSIDERATIONS
Location. In determining the location of the waste storage facility, consider elevation and distance
from the covered digester to take advantage of gravity flow.
The covered digester should be located as near the source of manure as practicable and as far from neighboring dwellings or public areas (minimum distance of 300 ft (100 m)) as possible. Proper location should consider slope, distance of manure transmission, vehicle access, wind direction, neighboring dwellings, proximity of streams and flood plains, and visibility.
Using available gas to heat the digester can improve total solids destruction and further reduce greenhouse gas emissions. In geographic areas north of the 40th parallel (Figure F-1), heat is required to maintain year around anaerobic digestion.
The covered digester should be located near a suitable site for energy utilization equipment. Short distances for the transmission of methane through buried pipe are preferable.
Waste Transfer Pipe. The standard practice is to locate a cleanout immediately upstream of the digester. Influent from the waste collection pit discharges below the digester operating level, and depending on the installation, solids tend to build up in the inlet pipe. The cleanout is also a good location for venting any gas that builds up in the transfer pipe.
Visual Screening. Analyze the visual impact of the digester within the overall landscape context or viewshed. Screening with vegetative plantings, landforms, or other measures may be implemented to alleviate a negative impact or enhance the view.
Depth of Digester. Improved digester performance and reduced cover cost (less area for given volume) can be realized with deeper digesters.
Rainfall. Rainfall on the digester cover can result in increased effluent discharge into the storage facility. For normal rainfall events this is probably not a problem. In locations subject to high rainfall events (thunderstorms and hurricanes), a ported riser on the outflow pipe should be considered to provide temporary storage and reduce outflow rate.
Appendix F-3 SECOND EDITION
Appendix F National Resource Conservation Service Practice Standards
Gas Transfer Pipe. Exposed pipe conveying flammable gas is generally painted orange.
PLANS AND SPECIFICATIONS
Plans and specifications shall be prepared in accordance with the criteria of this standard and good engineering practice. The plans and specifications shall include all details necessary for construction and completion of the work.
As a minimum, the plans and specifications shall provide the following:
1. Layout of livestock facilities, waste collection points, waste transfer pipe, digester, and storage pond.
2. Location of all digester influent pipes and devices.
3. Details of pipe material, size, and grade.
4. All digester and storage pond dimensions, type of lining material, and other parameters as appropriate.
5. Digester cover material and dimensions of covered surface. Means of rainfall removal or details of drainage.
6. Details of digester cover anchorage (ex: location and width of trench, depth, backfill material, and compaction of fill).
7. Details of the gas collection system, including type of pipe, devices, sizes, location, material, and grades.
8. Details of gas control facility, piping layout, components, electrical service if required, and protection from the elements.
9. Appropriate gas safety equipment or protective measures.
Warranties. The cover manufacturer and/or installer shall warrant the cover for the intended use and design life, provide maintenance instructions, and certify that the cover is properly installed.
OPERATION AND MAINTENANCE
An operation and maintenance (O&M) plan shall be developed and reviewed with the owner prior to construction. The O&M plan shall be consistent with the purposes of the practice, its intended life, safety requirements, and the criteria for its design. The plan shall list operation and maintenance requirements including but not limited to:
1. Proper loading rate of the digester and total solids content of influent.
2. Proper operating level of the digester.
3. Estimates of biogas production, methane content, and potential energy recovery.
4. A description of the planned startup procedures, normal operation, safety issues, and normal maintenance items.
5. Alternative operation procedures in the event of equipment failure.
6. Instructions for safe use and/or flaring of biogas.
7. Cover and gas collection system maintenance.
8. Daily inspection of the following:
- Cover material – check for cracks, tears, or points of distress around perimeter.
- Check for excessive ballooning of cover or presence of odor.
- Check for excess rainwater on cover.
- Check gas control panel, regulators, pressure gages, electrical power, flowmeter, flare igniter, and flare operation.
9. Frequency of measuring and recording digester inflow, operating temperatures, biogas yield, and/or other information as appropriate.
Appendix F-4 SECOND EDITION
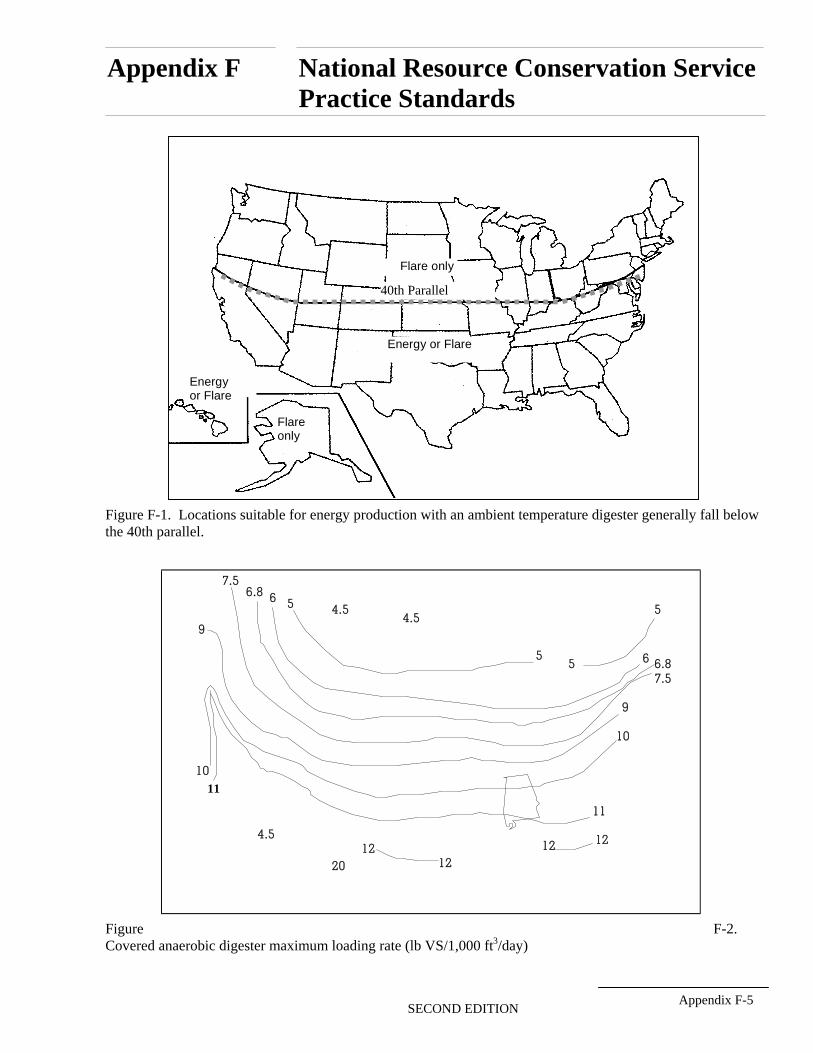
Appendix F National Resource Conservation Service Practice Standards
lyFlare on
Energy or Flare
Flare only
Energy or Flare
40th Parallel
Figure F-1. Locations suitable for energy production with an ambient temperature digester generally fall below the 40th parallel.
4.55
5
6
6
9
9
5
5
6.8
7.5
121212
11
11
10
10
20
4.5
12
7.5
6.8
4.5
Figure F-2. Covered anaerobic digester maximum loading rate (lb VS/1,000 ft3/day)
SECOND EDITION Appendix F-5
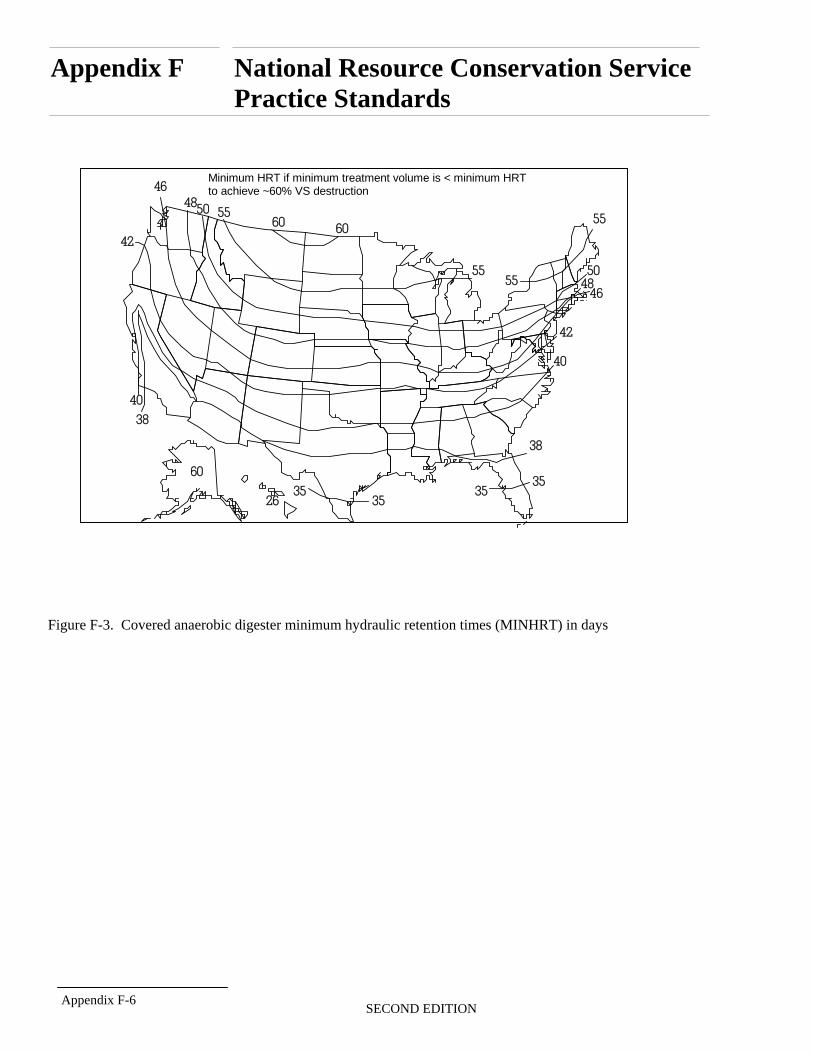
Min. HRT if minimum treatment volume is < Min. HRTTo Achieve ~ 60% VS destruction
Appendix F National Resource Conservation Service Practice Standards
Minimum HRT if minimum treatment volume is < minimum HRT 46 to achieve ~60% VS destruction
60 60 55
55
50
50
48
48
42
42
55
55
46
35
38
38
40
40
60
26 35 35
35
Figure F-3. Covered anaerobic digester minimum hydraulic retention times (MINHRT) in days
Appendix F-6 SECOND EDITION
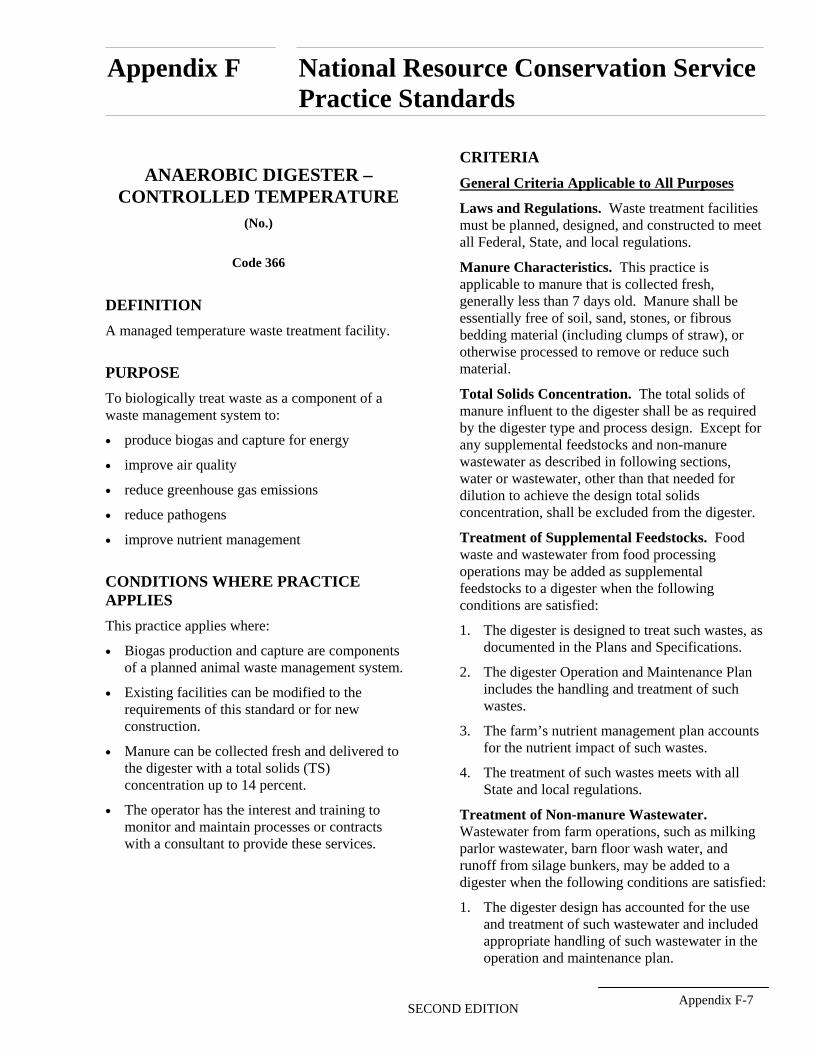
Appendix F National Resource Conservation Service Practice Standards
ANAEROBIC DIGESTER – CONTROLLED TEMPERATURE
(No.)
Code 366
DEFINITION
A managed temperature waste treatment facility.
PURPOSE
To biologically treat waste as a component of a waste management system to:
• produce biogas and capture for energy
• improve air quality
• reduce greenhouse gas emissions
• reduce pathogens
• improve nutrient management
CONDITIONS WHERE PRACTICE APPLIES
This practice applies where:
• Biogas production and capture are components of a planned animal waste management system.
• Existing facilities can be modified to the requirements of this standard or for new construction.
• Manure can be collected fresh and delivered to the digester with a total solids (TS) concentration up to 14 percent.
• The operator has the interest and training to monitor and maintain processes or contracts with a consultant to provide these services.
CRITERIA
General Criteria Applicable to All Purposes
Laws and Regulations. Waste treatment facilities must be planned, designed, and constructed to meet all Federal, State, and local regulations.
Manure Characteristics. This practice is applicable to manure that is collected fresh, generally less than 7 days old. Manure shall be essentially free of soil, sand, stones, or fibrous bedding material (including clumps of straw), or otherwise processed to remove or reduce such material.
Total Solids Concentration. The total solids of manure influent to the digester shall be as required by the digester type and process design. Except for any supplemental feedstocks and non-manure wastewater as described in following sections, water or wastewater, other than that needed for dilution to achieve the design total solids concentration, shall be excluded from the digester.
Treatment of Supplemental Feedstocks. Food waste and wastewater from food processing operations may be added as supplemental feedstocks to a digester when the following conditions are satisfied:
1. The digester is designed to treat such wastes, as documented in the Plans and Specifications.
2. The digester Operation and Maintenance Plan includes the handling and treatment of such wastes.
3. The farm’s nutrient management plan accounts for the nutrient impact of such wastes.
4. The treatment of such wastes meets with all State and local regulations.
Treatment of Non-manure Wastewater. Wastewater from farm operations, such as milking parlor wastewater, barn floor wash water, and runoff from silage bunkers, may be added to a digester when the following conditions are satisfied:
1. The digester design has accounted for the use and treatment of such wastewater and included appropriate handling of such wastewater in the operation and maintenance plan.
Appendix F-7 SECOND EDITION
Appendix F National Resource Conservation Service Practice Standards
2. The farm’s nutrient management plan accounts for the nutrient impact of such wastewater.
Safety. If the digester will create a safety hazard, it shall be fenced and warning signs posted to prevent children and others from using it for purposes other than intended.
The effect of earthquake loads on the digester and biogas system shall be considered and appropriate protective measures incorporated into the design.
Biogas is flammable and highly toxic. The design of the digester and gas components must consider the hazards associated with normal operation and maintenance and provide adequate safety measures.
Digester Design. Digesters shall be designed to facilitate anaerobic digestion of animal manure and meet the minimum design and operational requirements below for the type of digester specified. The design documentation shall specify the type of digester and include a process diagram with the following minimum information:
1. Flow rates, influent, and effluent
2. Design total and volatile solids content of influent and effluent
3. Digester volume
4. Retention time
5. Heating system, control, and monitoring
6. Methane yield
7. 12-month energy budget when applicable
8. Process control and monitoring
Digester Types
Plug Flow Digester
• For ruminant manure the total solids concentration of influent shall be 11 to 14 percent. For other manure sources the total solids concentration shall be 8 to 14 percent.
• Digester retention time shall be > 20 days.
• Operational temperature shall be mesophilic (35 ºC to 40 ºC).
• The length to width ratio of digester flow path shall be between 3.5:1 and 5:1.
• The ratio of flow path width to fluid depth shall be less than 2.5:1.
• The shape of the floor and walls shall be uniform to minimize mixing.
Complete Mix Digester
• Total solids concentration of manure influent shall be from 2.5 to 10percent.
• Digester retention time shall be > 17 days.
• Operational temperature shall be mesophilic (35 ºC to 40 ºC).
• Appropriate mixing devices shall be provided to assure a complete mix process.
Fixed Film Digester
• Total solids concentration of influent shall be < 5 percent. For total solids concentration > 2.5 percent, the influent particle size shall be < 0.25 inch.
• Digester retention time shall range from 1 to 6 days, depending on waste biodegradability.
• Operational temperature shall range from 15 ºC (59 ºF) to 40 ºC (103 ºF).
• Microbial support material with > 3 inch openings
Alternative Digester Design Criteria
Design of digesters not meeting the listed design and operational criteria or for a type other than listed in this standard shall be based on the documented design and performance of such existing animal waste digester and certified as such by a registered professional engineer licensed in the state of the proposed installation.
Digester Vessel Characteristics. The digester vessel (tank) shall be a corrosion-protected material or concrete structure, above or below ground, with allowances for entry and exit of manure, heat pipes, and/or other appurtenances. The tank shall be equipped with a suitable cover designed for accumulation and collection of biogas. The tank and internal components shall be designed to facilitate periodic removal of accumulated solids.
Appendix F-8 SECOND EDITION
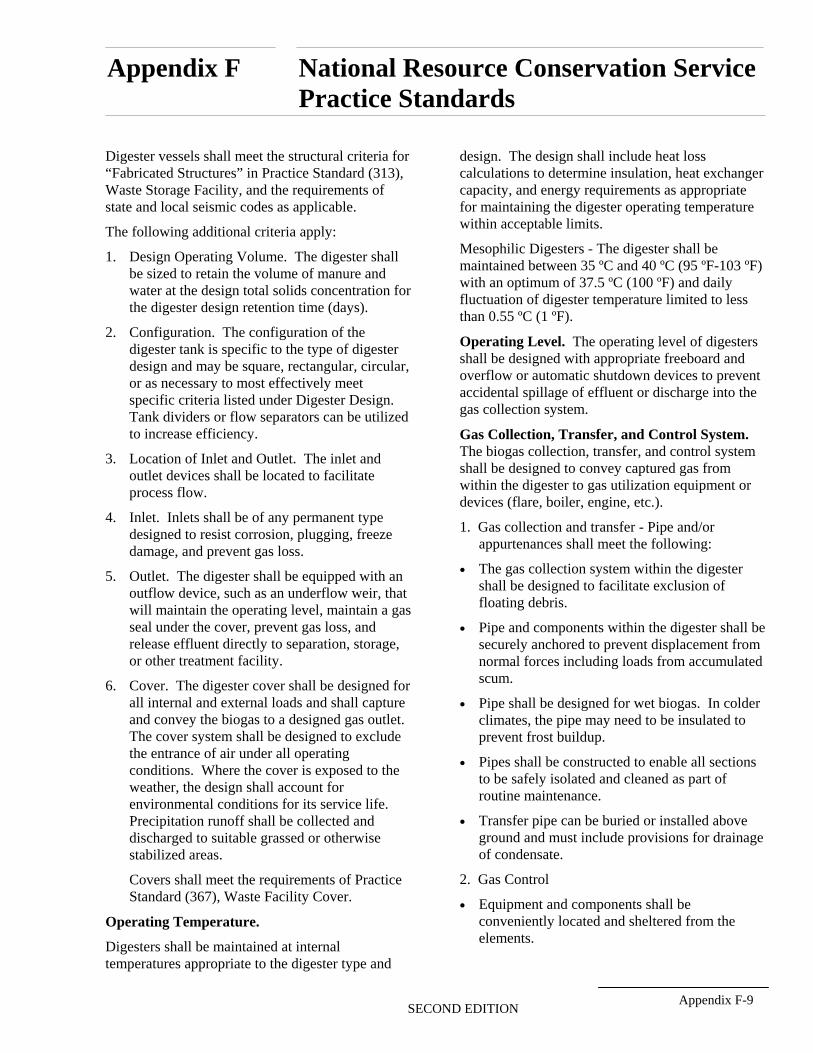
Appendix F National Resource Conservation Service Practice Standards
Digester vessels shall meet the structural criteria for “Fabricated Structures” in Practice Standard (313), Waste Storage Facility, and the requirements of state and local seismic codes as applicable.
The following additional criteria apply:
1. Design Operating Volume. The digester shall be sized to retain the volume of manure and water at the design total solids concentration for the digester design retention time (days).
2. Configuration. The configuration of the digester tank is specific to the type of digester design and may be square, rectangular, circular, or as necessary to most effectively meet specific criteria listed under Digester Design. Tank dividers or flow separators can be utilized to increase efficiency.
3. Location of Inlet and Outlet. The inlet and outlet devices shall be located to facilitate process flow.
4. Inlet. Inlets shall be of any permanent type designed to resist corrosion, plugging, freeze damage, and prevent gas loss.
5. Outlet. The digester shall be equipped with an outflow device, such as an underflow weir, that will maintain the operating level, maintain a gas seal under the cover, prevent gas loss, and release effluent directly to separation, storage, or other treatment facility.
6. Cover. The digester cover shall be designed for all internal and external loads and shall capture and convey the biogas to a designed gas outlet. The cover system shall be designed to exclude the entrance of air under all operating conditions. Where the cover is exposed to the weather, the design shall account for environmental conditions for its service life. Precipitation runoff shall be collected and discharged to suitable grassed or otherwise stabilized areas.
Covers shall meet the requirements of Practice Standard (367), Waste Facility Cover.
Operating Temperature.
Digesters shall be maintained at internal temperatures appropriate to the digester type and
design. The design shall include heat loss calculations to determine insulation, heat exchanger capacity, and energy requirements as appropriate for maintaining the digester operating temperature within acceptable limits.
Mesophilic Digesters - The digester shall be maintained between 35 ºC and 40 ºC (95 ºF-103 ºF) with an optimum of 37.5 ºC (100 ºF) and daily fluctuation of digester temperature limited to less than 0.55 ºC (1 ºF).
Operating Level. The operating level of digesters shall be designed with appropriate freeboard and overflow or automatic shutdown devices to prevent accidental spillage of effluent or discharge into the gas collection system.
Gas Collection, Transfer, and Control System. The biogas collection, transfer, and control system shall be designed to convey captured gas from within the digester to gas utilization equipment or devices (flare, boiler, engine, etc.).
1. Gas collection and transfer - Pipe and/or appurtenances shall meet the following:
• The gas collection system within the digester shall be designed to facilitate exclusion of floating debris.
• Pipe and components within the digester shall be securely anchored to prevent displacement from normal forces including loads from accumulated scum.
• Pipe shall be designed for wet biogas. In colder climates, the pipe may need to be insulated to prevent frost buildup.
• Pipes shall be constructed to enable all sections to be safely isolated and cleaned as part of routine maintenance.
• Transfer pipe can be buried or installed above ground and must include provisions for drainage of condensate.
2. Gas Control
• Equipment and components shall be conveniently located and sheltered from the elements.
Appendix F-9 SECOND EDITION
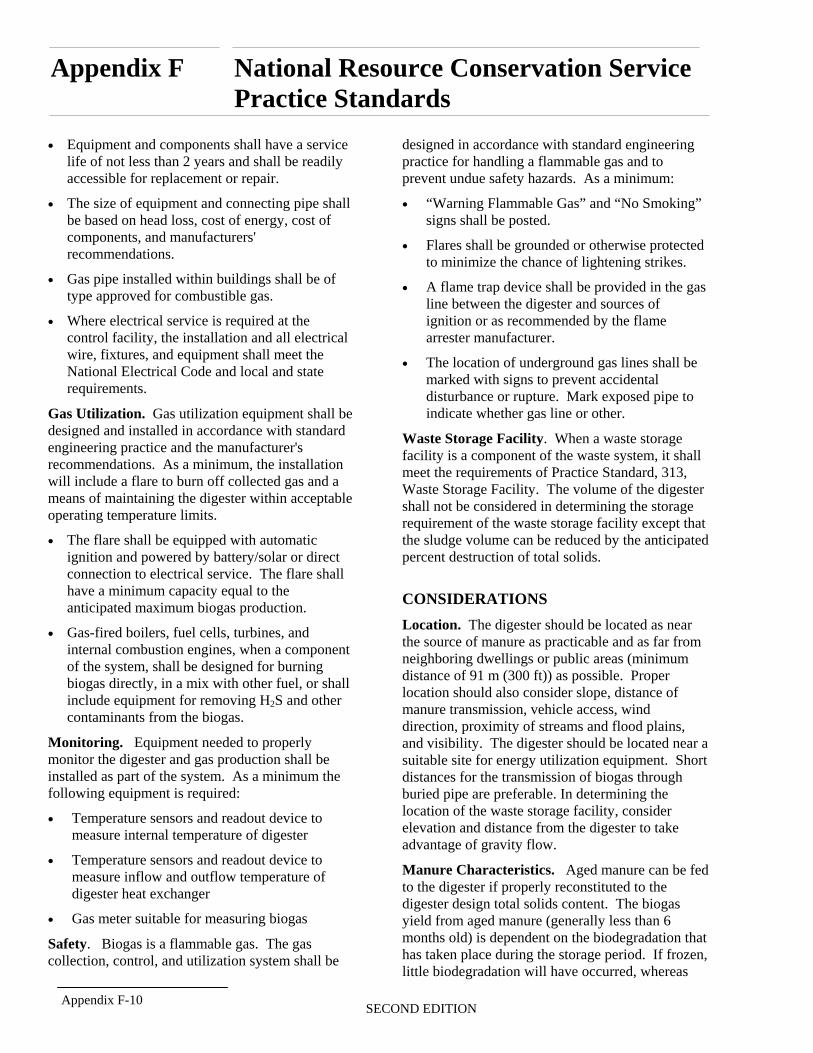
Appendix F National Resource Conservation Service Practice Standards
• Equipment and components shall have a service life of not less than 2 years and shall be readily accessible for replacement or repair.
• The size of equipment and connecting pipe shall be based on head loss, cost of energy, cost of components, and manufacturers' recommendations.
• Gas pipe installed within buildings shall be of type approved for combustible gas.
• Where electrical service is required at the control facility, the installation and all electrical wire, fixtures, and equipment shall meet the National Electrical Code and local and state requirements.
Gas Utilization. Gas utilization equipment shall be designed and installed in accordance with standard engineering practice and the manufacturer's recommendations. As a minimum, the installation will include a flare to burn off collected gas and a means of maintaining the digester within acceptable operating temperature limits.
• The flare shall be equipped with automatic ignition and powered by battery/solar or direct connection to electrical service. The flare shall have a minimum capacity equal to the anticipated maximum biogas production.
• Gas-fired boilers, fuel cells, turbines, and internal combustion engines, when a component of the system, shall be designed for burning biogas directly, in a mix with other fuel, or shall include equipment for removing H2S and other contaminants from the biogas.
Monitoring. Equipment needed to properly monitor the digester and gas production shall be installed as part of the system. As a minimum the following equipment is required:
• Temperature sensors and readout device to measure internal temperature of digester
• Temperature sensors and readout device to measure inflow and outflow temperature of digester heat exchanger
• Gas meter suitable for measuring biogas
Safety. Biogas is a flammable gas. The gas collection, control, and utilization system shall be
designed in accordance with standard engineering practice for handling a flammable gas and to prevent undue safety hazards. As a minimum:
• “Warning Flammable Gas” and “No Smoking” signs shall be posted.
• Flares shall be grounded or otherwise protected to minimize the chance of lightening strikes.
• A flame trap device shall be provided in the gas line between the digester and sources of ignition or as recommended by the flame arrester manufacturer.
• The location of underground gas lines shall be marked with signs to prevent accidental disturbance or rupture. Mark exposed pipe to indicate whether gas line or other.
Waste Storage Facility. When a waste storage facility is a component of the waste system, it shall meet the requirements of Practice Standard, 313, Waste Storage Facility. The volume of the digester shall not be considered in determining the storage requirement of the waste storage facility except that the sludge volume can be reduced by the anticipated percent destruction of total solids.
CONSIDERATIONS
Location. The digester should be located as near the source of manure as practicable and as far from neighboring dwellings or public areas (minimum distance of 91 m (300 ft)) as possible. Proper location should also consider slope, distance of manure transmission, vehicle access, wind direction, proximity of streams and flood plains, and visibility. The digester should be located near a suitable site for energy utilization equipment. Short distances for the transmission of biogas through buried pipe are preferable. In determining the location of the waste storage facility, consider elevation and distance from the digester to take advantage of gravity flow.
Manure Characteristics. Aged manure can be fed to the digester if properly reconstituted to the digester design total solids content. The biogas yield from aged manure (generally less than 6 months old) is dependent on the biodegradation that has taken place during the storage period. If frozen, little biodegradation will have occurred, whereas
Appendix F-10 SECOND EDITION
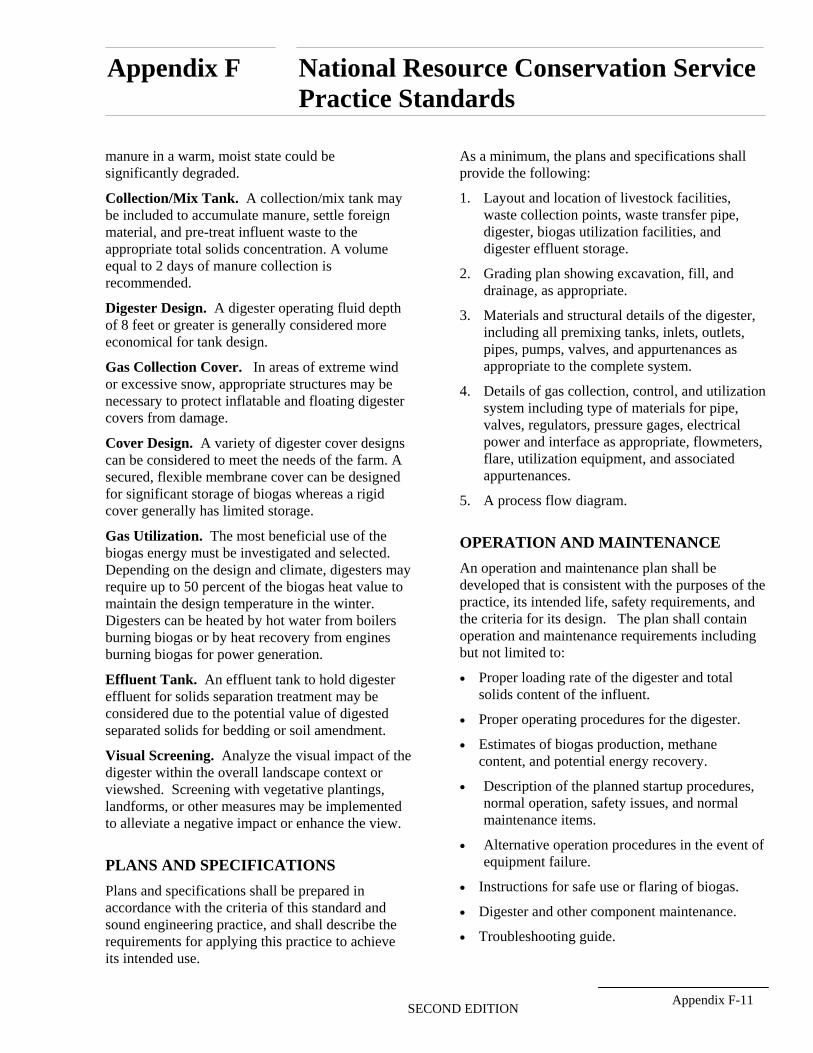
Appendix F National Resource Conservation Service Practice Standards
manure in a warm, moist state could be significantly degraded.
Collection/Mix Tank. A collection/mix tank may be included to accumulate manure, settle foreign material, and pre-treat influent waste to the appropriate total solids concentration. A volume equal to 2 days of manure collection is recommended.
Digester Design. A digester operating fluid depth of 8 feet or greater is generally considered more economical for tank design.
Gas Collection Cover. In areas of extreme wind or excessive snow, appropriate structures may be necessary to protect inflatable and floating digester covers from damage.
Cover Design. A variety of digester cover designs can be considered to meet the needs of the farm. A secured, flexible membrane cover can be designed for significant storage of biogas whereas a rigid cover generally has limited storage.
Gas Utilization. The most beneficial use of the biogas energy must be investigated and selected. Depending on the design and climate, digesters may require up to 50 percent of the biogas heat value to maintain the design temperature in the winter. Digesters can be heated by hot water from boilers burning biogas or by heat recovery from engines burning biogas for power generation.
Effluent Tank. An effluent tank to hold digester effluent for solids separation treatment may be considered due to the potential value of digested separated solids for bedding or soil amendment.
Visual Screening. Analyze the visual impact of the digester within the overall landscape context or viewshed. Screening with vegetative plantings, landforms, or other measures may be implemented to alleviate a negative impact or enhance the view.
PLANS AND SPECIFICATIONS
Plans and specifications shall be prepared in accordance with the criteria of this standard and sound engineering practice, and shall describe the requirements for applying this practice to achieve its intended use.
As a minimum, the plans and specifications shall provide the following:
1. Layout and location of livestock facilities, waste collection points, waste transfer pipe, digester, biogas utilization facilities, and digester effluent storage.
2. Grading plan showing excavation, fill, and drainage, as appropriate.
3. Materials and structural details of the digester, including all premixing tanks, inlets, outlets, pipes, pumps, valves, and appurtenances as appropriate to the complete system.
4. Details of gas collection, control, and utilization system including type of materials for pipe, valves, regulators, pressure gages, electrical power and interface as appropriate, flowmeters, flare, utilization equipment, and associated appurtenances.
5. A process flow diagram.
OPERATION AND MAINTENANCE
An operation and maintenance plan shall be developed that is consistent with the purposes of the practice, its intended life, safety requirements, and the criteria for its design. The plan shall contain operation and maintenance requirements including but not limited to:
• Proper loading rate of the digester and total solids content of the influent.
• Proper operating procedures for the digester.
• Estimates of biogas production, methane content, and potential energy recovery.
• Description of the planned startup procedures, normal operation, safety issues, and normal maintenance items.
• Alternative operation procedures in the event of equipment failure.
• Instructions for safe use or flaring of biogas.
• Digester and other component maintenance.
• Troubleshooting guide.
Appendix F-11 SECOND EDITION
Appendix F National Resource Conservation Service Practice Standards
Monitoring plan with frequency of measuring and recording digester inflow, operating temperatures, biogas yield, and/or other information as appropriate.
Appendix F-12 SECOND EDITION
Appendix F National Resource Conservation Service Practice Standards
WASTE FACILITY COVER (No.)
CODE 367 DEFINITION
A fabricated rigid, semi-rigid, or flexible membrane over a waste treatment or storage facility.
PURPOSE
To cover a waste facility for:
• water quality improvement
• air quality improvement
• capture of biogas for energy production
CONDITIONS WHERE PRACTICE APPLIES
This practice applies where:
• Exclusion of precipitation from an animal waste storage or treatment facility will improve management of an existing or planned system.
• Capture and controlled release or flaring of emissions from an existing or planned agricultural waste storage will improve air quality.
• Bio-treatment of emissions from an existing or planned waste storage or treatment facility will improve air quality
• Biogas production and capture for energy are components of an existing or planned animal waste system.
CRITERIA
General Criteria Applicable to All Purposes
Laws and Regulations. Cover systems for animal waste facilities must be planned, designed, and constructed to meet all federal, state and local regulations.
Service Life. The cover and appurtenances shall be designed to provide a service life of not less than 10 years.
Materials. The type, thickness and material properties of the cover and any supporting members shall account for all loads and stresses due to operational, environmental, and climatic conditions.
Flexible membrane materials, used for fabrication of inflated and floating covers, shall be certified by the manufacturer as suitable for the intended application.
Loads. Where applicable, the membrane cover and support system shall be designed to resist snow and wind loads as specified in ASAE EP288.5, Agricultural Building Snow and Wind Loads.
Biogas Emissions. The cover system shall provide for capture and control of biogas, bio-reduction and direct release of gaseous emissions, or contain and release of gaseous emissions, as appropriate.
Capture and Control
The cover system shall be designed to capture biogas emissions and transfer to point of discharge without mixing with air. The point of discharge shall be equipped with a flare or utilization equipment as appropriate.
Bio-reduction and Direct Release
The cover shall be fabricated of a permeable composite membrane designed to promote biological treatment of gaseous emissions. Gaseous emissions pass through the membrane for direct release to the atmosphere.
Contain and Release
The cover system is designed for rainfall exclusion and not to specifically capture biogas. Therefore special handling or treatment of biogas emissions is not required except as necessary to prevent undue safety hazards.
Anchorage. The cover anchorage system shall be designed in a manner to resist internal gas pressures, corrosive environment, wind loads or other forces as appropriate to the cover system.
Repair. New and aged flexible cover materials shall be readily repairable by solvent, adhesive, or
Appendix F-13 SECOND EDITION
Appendix F National Resource Conservation Service Practice Standards
thermoplastic welding. Semi-rigid cover material shall be repairable by sectional replacement. Precipitation. Impermeable covers shall direct precipitation to collection points for removal by pumping or by controlled release to suitable grassed or otherwise stabilized areas for discharge.
Access. Covers shall be removable or otherwise provided with suitable equipment access as necessary for normal operation and maintenance of the waste facility.
Safety. The cover shall include safety features, including fences and warning signs as appropriate to prevent undue hazards.
As a minimum all covers shall include the following:
• “Warning Flammable Gas” and “No Smoking” signs shall be posted.
Where biogas is captured, the gas collection and control system shall be designed in accordance with standard engineering practice for safely handling a flammable gas.
Flares shall be grounded or otherwise protected to minimize the chance of lightening strikes.
A flame trap device shall be provided in the gas line between the flare and the waste facility.
The location of underground gas lines shall be marked with signs to prevent accidental disturbance or rupture.
Additional Criteria for Rigid Covers
Rigid covers shall meet the structural requirements of Practice Standard 313, Waste Storage Facility.
The cover or cover vessel design shall include provisions for fail safe pressure relief. Maximum pressure shall not exceed 12 inches water column.
Additional Criteria for Inflated Covers
Covers inflated and supported by forced air from mechanical means shall be:
• Equipped with a warning system to notify operator of blower failure.
• Provided with a support system to limit cover collapse in the event the blower fails and for access of equipment.
• Provided with a suitable access port for normal maintenance equipment.
Additional Criteria for Floating Covers
Floating membrane covers shall be supplemented with floatation materials as necessary for proper function, operation, and maintenance.
Minimum membrane or composite membrane thickness shall be 40 mils.
Additional Criteria for Energy Production
The cover materials and all appurtenances such as weights and floats shall be designed to capture and convey biogas to the gas collection system. The cover design shall provide for the following:
1. Air Infiltration. The cover system and appurtenances, including perimeter soil slopes above the water line for in-ground digesters, shall be designed to exclude the entrance of air under all operating conditions.
2. Material. The minimum material thickness for flexible geomembrane covers shall be:
• 40 mils for non reinforced material
• 36 mils for reinforced materials
3. Gas Collection, Control, and Utilization. The collection of biogas and flaring or other end use shall meet appropriate criteria in Practice Standard 365, Anaerobic Digester – Ambient Temperature.
CONSIDERATIONS
Animal waste storage facilities can release large amounts of biogas at certain times of the year. The cover and gas collection system should be designed for release of this gas.
Storage of biogas should be considered when installing flexible covers over storage impoundments (lagoons) to attenuate gas supply for end use or controlled release.
PLANS AND SPECIFICATIONS
Plans and specifications shall be prepared in accordance with the criteria of this standard and
Appendix F-14 SECOND EDITION
Appendix F National Resource Conservation Service Practice Standards
shall describe the requirements for applying the practice to achieve its intended use.
OPERATION AND MAINTENANCE
An operation and maintenance plan shall be developed that is consistent with the purposes of the practice, its intended life, safety requirements, and the criteria used for its design.
When gas storage is included in the system design, the plan shall contain instructions as to limits of cover ballooning and emergency procedures if control equipment fails.
Warranties. The cover manufacturer and or installer shall warrant the cover for the intended use and design life, provide maintenance instructions, and certify that the cover is properly installed.
Appendix F-15 SECOND EDITION
Appendix F National Resource Conservation Service Practice Standards
WASTE STORAGE FACILITY
(No.)
CODE 313
DEFINITION
A waste storage impoundment made by constructing an embankment and/or excavating a pit or dugout, or by fabricating a structure.
PURPOSE
To temporarily store wastes such as manure, wastewater, and contaminated runoff as a storage function component of an agricultural waste management system.
CONDITIONS WHERE PRACTICE APPLIES
• Where the storage facility is a component of a planned agricultural waste management system
• Where temporary storage is needed for organic wastes generated by agricultural production or processing
• Where the storage facility can be constructed, operated and maintained without polluting air or water resources
• Where site conditions are suitable for construction of the facility
• To facilities utilizing embankments with an effective height of 35 feet or less where damage resulting from failure would be limited to damage of farm buildings, agricultural land, or township and country roads.
• To fabricated structures including tanks, stacking facilities, and pond appurtenances.
CRITERIA
General Criteria Applicable to All Waste Storage Facilities.
Laws and Regulations. Waste storage facilities must be planned, designed, and constructed to meet all federal, state, and local laws and regulations.
Location. To minimize the potential for contamination of streams, waste storage facilities should be located outside of floodplains. However, if site restrictions require location within a floodplain, they shall be protected from inundation or damage from a 25-year flood event, or larger if required by laws, rules, and regulations. Waste storage facilities shall be located so the potential impacts from breach of embankment, accidental release, and liner failure are minimized; and separation distances are such that prevailing winds and landscape elements such as building arrangement, landforms, and vegetation minimize odors and protect aesthetic values.
Storage Period. The storage period is the maximum length of time anticipated between emptying events. The minimum storage period shall be based on the timing required for environmentally safe waste utilization considering the climate, crops, soil, equipment, and local, state, and federal regulations.
Design Storage Volume. The design storage volume equal to the required storage volume, shall consist of the total of the following as appropriate:
(a) Manure, wastewater, and other wastes accumulated during the storage period
(b) Normal precipitation less evaporation on the surface area (at the design storage volume level) of the facility during the storage period
(c) Normal runoff from the facility's drainage area during the storage period
(d) 25-year, 24-hour precipitation on the surface (at the required design storage volume level) of the facility
(e) 25-year, 24-hour runoff from the facility's drainage area
Appendix F-16 SECOND EDITION
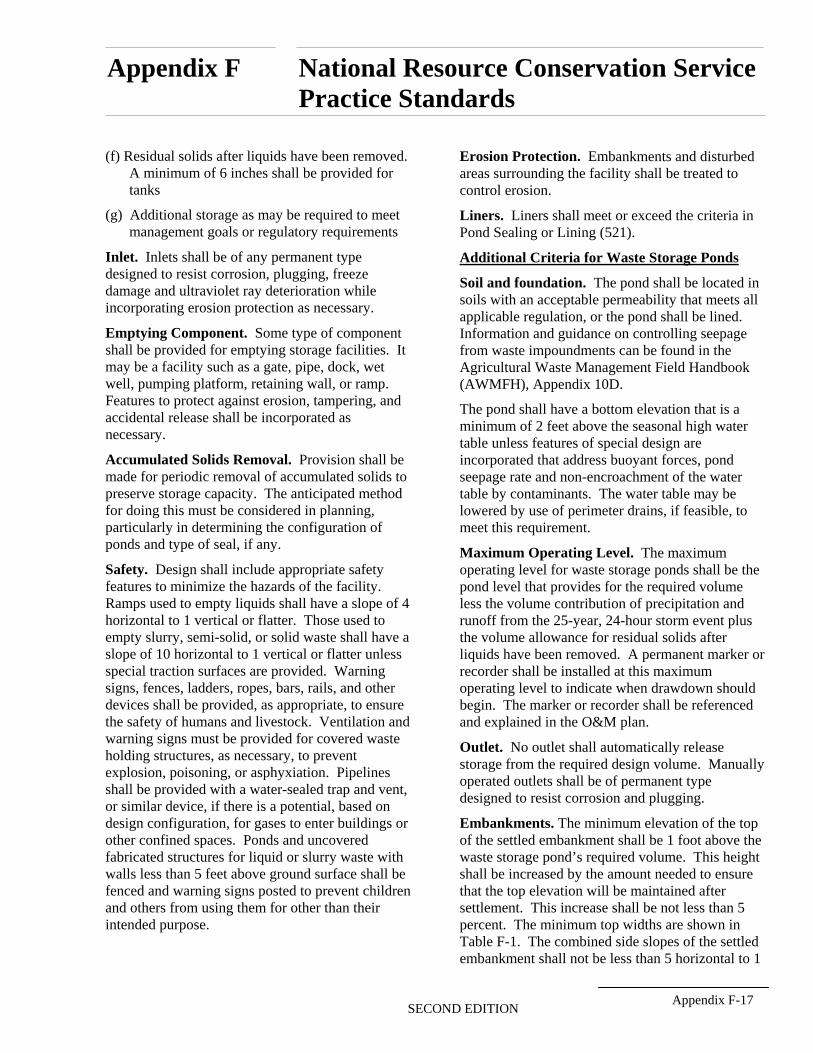
Appendix F National Resource Conservation Service Practice Standards
(f) Residual solids after liquids have been removed. A minimum of 6 inches shall be provided for tanks
(g) Additional storage as may be required to meet management goals or regulatory requirements
Inlet. Inlets shall be of any permanent type designed to resist corrosion, plugging, freeze damage and ultraviolet ray deterioration while incorporating erosion protection as necessary.
Emptying Component. Some type of component shall be provided for emptying storage facilities. It may be a facility such as a gate, pipe, dock, wet well, pumping platform, retaining wall, or ramp. Features to protect against erosion, tampering, and accidental release shall be incorporated as necessary.
Accumulated Solids Removal. Provision shall be made for periodic removal of accumulated solids to preserve storage capacity. The anticipated method for doing this must be considered in planning, particularly in determining the configuration of ponds and type of seal, if any.
Safety. Design shall include appropriate safety features to minimize the hazards of the facility. Ramps used to empty liquids shall have a slope of 4 horizontal to 1 vertical or flatter. Those used to empty slurry, semi-solid, or solid waste shall have a slope of 10 horizontal to 1 vertical or flatter unless special traction surfaces are provided. Warning signs, fences, ladders, ropes, bars, rails, and other devices shall be provided, as appropriate, to ensure the safety of humans and livestock. Ventilation and warning signs must be provided for covered waste holding structures, as necessary, to prevent explosion, poisoning, or asphyxiation. Pipelines shall be provided with a water-sealed trap and vent, or similar device, if there is a potential, based on design configuration, for gases to enter buildings or other confined spaces. Ponds and uncovered fabricated structures for liquid or slurry waste with walls less than 5 feet above ground surface shall be fenced and warning signs posted to prevent children and others from using them for other than their intended purpose.
Erosion Protection. Embankments and disturbed areas surrounding the facility shall be treated to control erosion.
Liners. Liners shall meet or exceed the criteria in Pond Sealing or Lining (521).
Additional Criteria for Waste Storage Ponds
Soil and foundation. The pond shall be located in soils with an acceptable permeability that meets all applicable regulation, or the pond shall be lined. Information and guidance on controlling seepage from waste impoundments can be found in the Agricultural Waste Management Field Handbook (AWMFH), Appendix 10D.
The pond shall have a bottom elevation that is a minimum of 2 feet above the seasonal high water table unless features of special design are incorporated that address buoyant forces, pond seepage rate and non-encroachment of the water table by contaminants. The water table may be lowered by use of perimeter drains, if feasible, to meet this requirement.
Maximum Operating Level. The maximum operating level for waste storage ponds shall be the pond level that provides for the required volume less the volume contribution of precipitation and runoff from the 25-year, 24-hour storm event plus the volume allowance for residual solids after liquids have been removed. A permanent marker or recorder shall be installed at this maximum operating level to indicate when drawdown should begin. The marker or recorder shall be referenced and explained in the O&M plan.
Outlet. No outlet shall automatically release storage from the required design volume. Manually operated outlets shall be of permanent type designed to resist corrosion and plugging.
Embankments. The minimum elevation of the top of the settled embankment shall be 1 foot above the waste storage pond’s required volume. This height shall be increased by the amount needed to ensure that the top elevation will be maintained after settlement. This increase shall be not less than 5 percent. The minimum top widths are shown in Table F-1. The combined side slopes of the settled embankment shall not be less than 5 horizontal to 1
Appendix F-17 SECOND EDITION
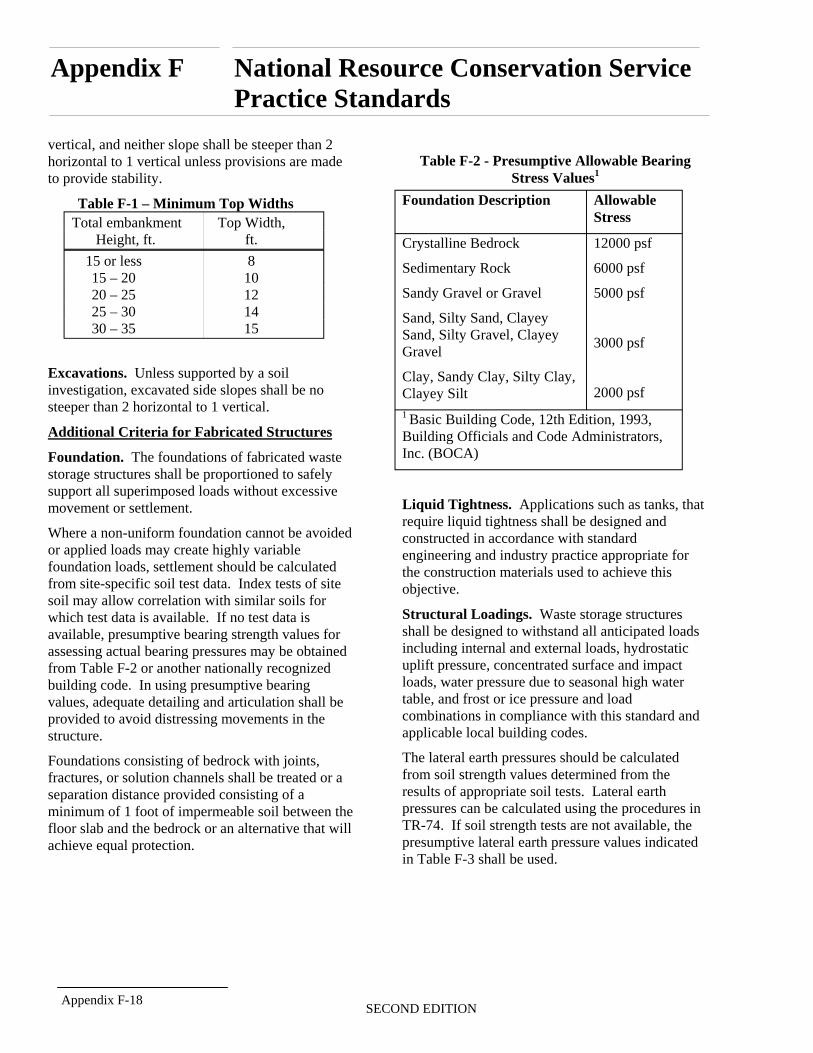
Appendix F National Resource Conservation Service Practice Standards
vertical, and neither slope shall be steeper than 2 horizontal to 1 vertical unless provisions are made Table F-2 - Presumptive Allowable Bearing to provide stability. Stress Values1
Table F-1 – Minimum Top Widths Total embankment Top Width, Height, ft. ft.
15 or less 8 15 – 20 10 20 – 25 12 25 – 30 14 30 – 35 15
Excavations. Unless supported by a soil investigation, excavated side slopes shall be no steeper than 2 horizontal to 1 vertical.
Additional Criteria for Fabricated Structures
Foundation. The foundations of fabricated waste storage structures shall be proportioned to safely support all superimposed loads without excessive movement or settlement.
Where a non-uniform foundation cannot be avoided or applied loads may create highly variable foundation loads, settlement should be calculated from site-specific soil test data. Index tests of site soil may allow correlation with similar soils for which test data is available. If no test data is available, presumptive bearing strength values for assessing actual bearing pressures may be obtained from Table F-2 or another nationally recognized building code. In using presumptive bearing values, adequate detailing and articulation shall be provided to avoid distressing movements in the structure.
Foundations consisting of bedrock with joints, fractures, or solution channels shall be treated or a separation distance provided consisting of a minimum of 1 foot of impermeable soil between the floor slab and the bedrock or an alternative that will achieve equal protection.
Foundation Description Allowable Stress
Crystalline Bedrock
Sedimentary Rock
Sandy Gravel or Gravel
Sand, Silty Sand, Clayey Sand, Silty Gravel, Clayey Gravel
Clay, Sandy Clay, Silty Clay, Clayey Silt
12000 psf
6000 psf
5000 psf
3000 psf
2000 psf
1 Basic Building Code, 12th Edition, 1993, Building Officials and Code Administrators, Inc. (BOCA)
Liquid Tightness. Applications such as tanks, that require liquid tightness shall be designed and constructed in accordance with standard engineering and industry practice appropriate for the construction materials used to achieve this objective.
Structural Loadings. Waste storage structures shall be designed to withstand all anticipated loads including internal and external loads, hydrostatic uplift pressure, concentrated surface and impact loads, water pressure due to seasonal high water table, and frost or ice pressure and load combinations in compliance with this standard and applicable local building codes.
The lateral earth pressures should be calculated from soil strength values determined from the results of appropriate soil tests. Lateral earth pressures can be calculated using the procedures in TR-74. If soil strength tests are not available, the presumptive lateral earth pressure values indicated in Table F-3 shall be used.
Appendix F-18 SECOND EDITION
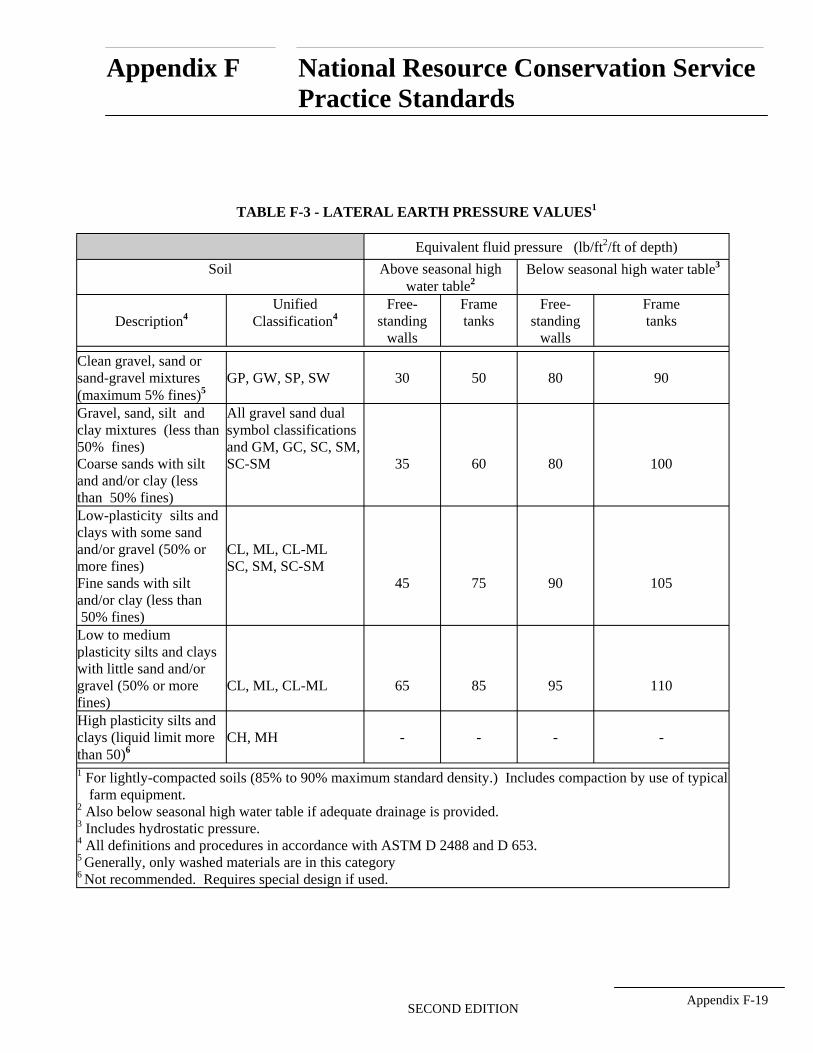
Appendix F National Resource Conservation Service Practice Standards
TABLE F-3 - LATERAL EARTH PRESSURE VALUES1
Soil Above seasonal high water table2
Equivalent fluid pressure
Below seasonal high water table3
(lb/ft2/ft of depth)
Description4 Unified
Classification4 Free
standing walls
Frame tanks
Freestanding
walls
Frame tanks
Clean gravel, sand or sand-gravel mixtures (maximum 5% fines)5
GP, GW, SP, SW 30 50 80 90
Gravel, sand, silt and clay mixtures (less than 50% fines) Coarse sands with silt and and/or clay (less than 50% fines)
All gravel sand dual symbol classifications and GM, GC, SC, SM, SC-SM 35 60 80 100
Low-plasticity silts and clays with some sand and/or gravel (50% or more fines) Fine sands with silt and/or clay (less than 50% fines)
CL, ML, CL-ML SC, SM, SC-SM
45 75 90 105
Low to medium plasticity silts and clays with little sand and/or gravel (50% or more fines)
CL, ML, CL-ML 65 85 95 110
High plasticity silts and clays (liquid limit more than 50)6
CH, MH - - - -
1 For lightly-compacted soils (85% to 90% maximum standard density.) Includes compaction by use of typical farm equipment.
2 Also below seasonal high water table if adequate drainage is provided. 3 Includes hydrostatic pressure. 4 All definitions and procedures in accordance with ASTM D 2488 and D 653. 5 Generally, only washed materials are in this category 6 Not recommended. Requires special design if used.
Appendix F-19SECOND EDITION
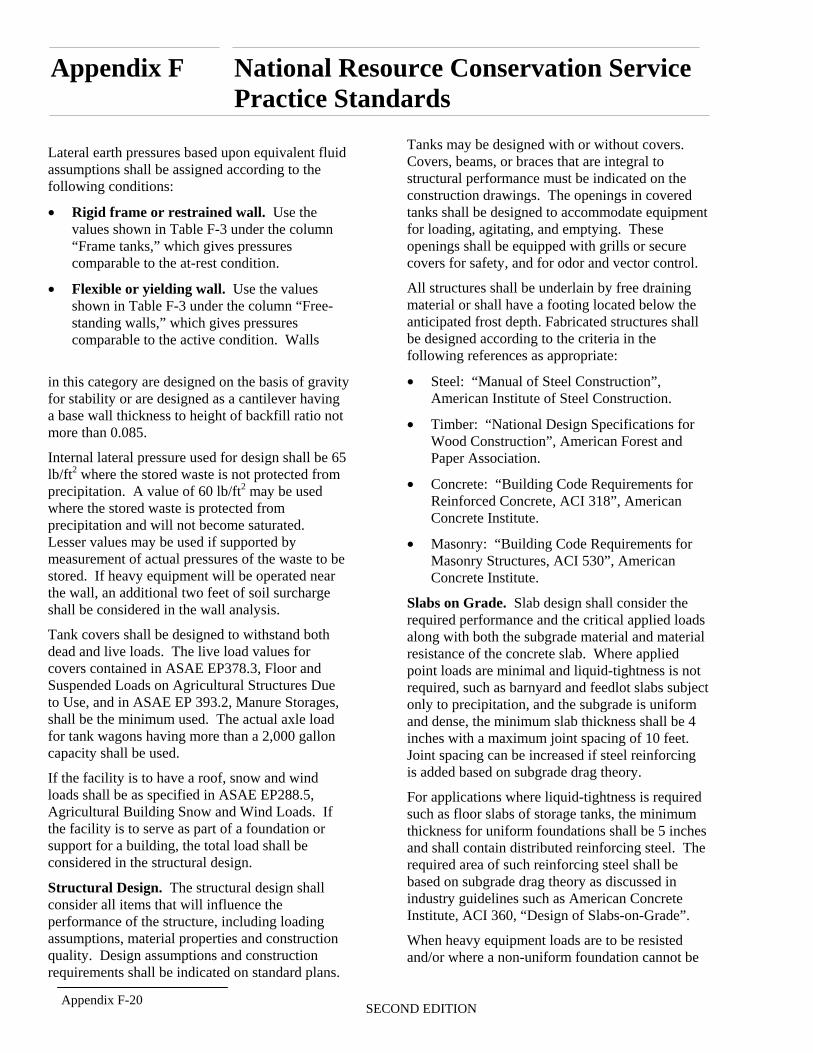
Appendix F National Resource Conservation Service Practice Standards
Lateral earth pressures based upon equivalent fluid assumptions shall be assigned according to the following conditions:
• Rigid frame or restrained wall. Use the values shown in Table F-3 under the column “Frame tanks,” which gives pressures comparable to the at-rest condition.
• Flexible or yielding wall. Use the values shown in Table F-3 under the column “Freestanding walls,” which gives pressures comparable to the active condition. Walls
in this category are designed on the basis of gravity for stability or are designed as a cantilever having a base wall thickness to height of backfill ratio not more than 0.085.
Internal lateral pressure used for design shall be 65 lb/ft2 where the stored waste is not protected from precipitation. A value of 60 lb/ft2 may be used where the stored waste is protected from precipitation and will not become saturated. Lesser values may be used if supported by measurement of actual pressures of the waste to be stored. If heavy equipment will be operated near the wall, an additional two feet of soil surcharge shall be considered in the wall analysis.
Tank covers shall be designed to withstand both dead and live loads. The live load values for covers contained in ASAE EP378.3, Floor and Suspended Loads on Agricultural Structures Due to Use, and in ASAE EP 393.2, Manure Storages, shall be the minimum used. The actual axle load for tank wagons having more than a 2,000 gallon capacity shall be used.
If the facility is to have a roof, snow and wind loads shall be as specified in ASAE EP288.5, Agricultural Building Snow and Wind Loads. If the facility is to serve as part of a foundation or support for a building, the total load shall be considered in the structural design.
Structural Design. The structural design shall consider all items that will influence the performance of the structure, including loading assumptions, material properties and construction quality. Design assumptions and construction requirements shall be indicated on standard plans.
Tanks may be designed with or without covers. Covers, beams, or braces that are integral to structural performance must be indicated on the construction drawings. The openings in covered tanks shall be designed to accommodate equipment for loading, agitating, and emptying. These openings shall be equipped with grills or secure covers for safety, and for odor and vector control.
All structures shall be underlain by free draining material or shall have a footing located below the anticipated frost depth. Fabricated structures shall be designed according to the criteria in the following references as appropriate:
• Steel: “Manual of Steel Construction”, American Institute of Steel Construction.
• Timber: “National Design Specifications for Wood Construction”, American Forest and Paper Association.
• Concrete: “Building Code Requirements for Reinforced Concrete, ACI 318”, American Concrete Institute.
• Masonry: “Building Code Requirements for Masonry Structures, ACI 530”, American Concrete Institute.
Slabs on Grade. Slab design shall consider the required performance and the critical applied loads along with both the subgrade material and material resistance of the concrete slab. Where applied point loads are minimal and liquid-tightness is not required, such as barnyard and feedlot slabs subject only to precipitation, and the subgrade is uniform and dense, the minimum slab thickness shall be 4 inches with a maximum joint spacing of 10 feet. Joint spacing can be increased if steel reinforcing is added based on subgrade drag theory.
For applications where liquid-tightness is required such as floor slabs of storage tanks, the minimum thickness for uniform foundations shall be 5 inches and shall contain distributed reinforcing steel. The required area of such reinforcing steel shall be based on subgrade drag theory as discussed in industry guidelines such as American Concrete Institute, ACI 360, “Design of Slabs-on-Grade”.
When heavy equipment loads are to be resisted and/or where a non-uniform foundation cannot be
Appendix F-20 SECOND EDITION
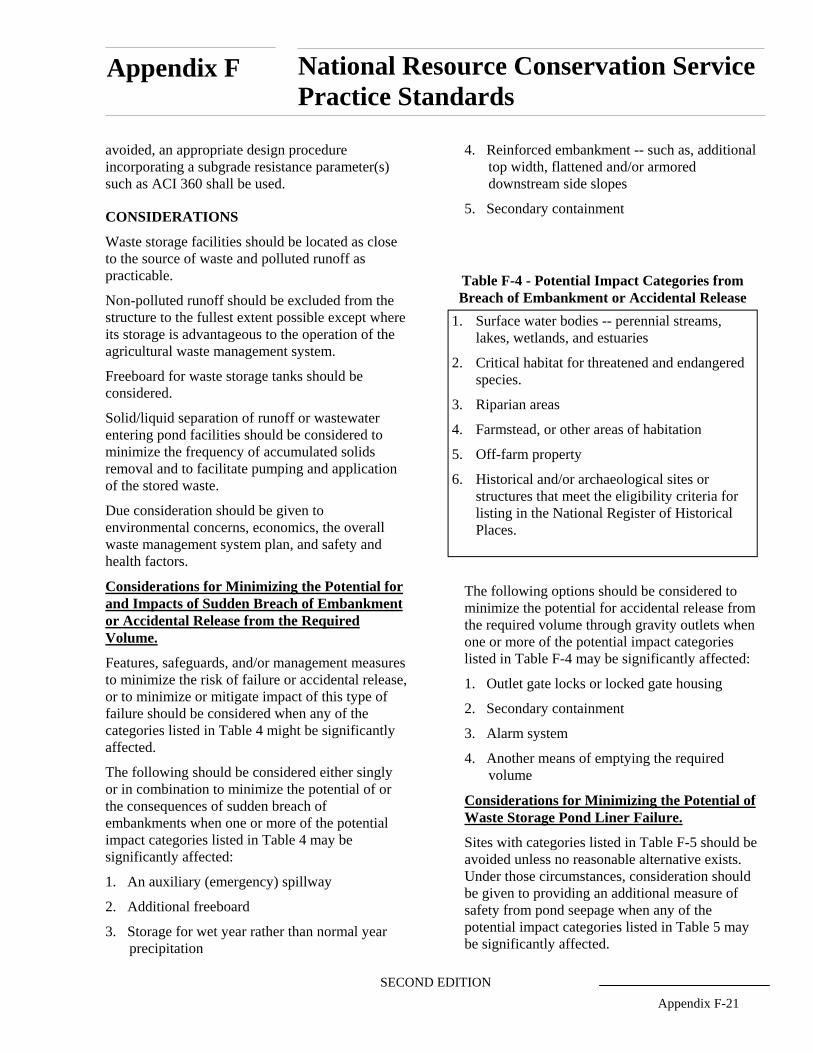
Appendix F National Resource Conservation Service Practice Standards
avoided, an appropriate design procedure incorporating a subgrade resistance parameter(s) such as ACI 360 shall be used.
CONSIDERATIONS
Waste storage facilities should be located as close to the source of waste and polluted runoff as practicable.
Non-polluted runoff should be excluded from the structure to the fullest extent possible except where its storage is advantageous to the operation of the agricultural waste management system.
Freeboard for waste storage tanks should be considered.
Solid/liquid separation of runoff or wastewater entering pond facilities should be considered to minimize the frequency of accumulated solids removal and to facilitate pumping and application of the stored waste.
Due consideration should be given to environmental concerns, economics, the overall waste management system plan, and safety and health factors.
Considerations for Minimizing the Potential for and Impacts of Sudden Breach of Embankment or Accidental Release from the Required Volume.
Features, safeguards, and/or management measures to minimize the risk of failure or accidental release, or to minimize or mitigate impact of this type of failure should be considered when any of the categories listed in Table 4 might be significantly affected.
The following should be considered either singly or in combination to minimize the potential of or the consequences of sudden breach of embankments when one or more of the potential impact categories listed in Table 4 may be significantly affected:
1. An auxiliary (emergency) spillway
2. Additional freeboard
3. Storage for wet year rather than normal year precipitation
4. Reinforced embankment -- such as, additional top width, flattened and/or armored downstream side slopes
5. Secondary containment
Table F-4 - Potential Impact Categories from Breach of Embankment or Accidental Release
1. Surface water bodies -- perennial streams, lakes, wetlands, and estuaries
2. Critical habitat for threatened and endangered species.
3. Riparian areas
4. Farmstead, or other areas of habitation
5. Off-farm property
6. Historical and/or archaeological sites or structures that meet the eligibility criteria for listing in the National Register of Historical Places.
The following options should be considered to minimize the potential for accidental release from the required volume through gravity outlets when one or more of the potential impact categories listed in Table F-4 may be significantly affected:
1. Outlet gate locks or locked gate housing
2. Secondary containment
3. Alarm system
4. Another means of emptying the required volume
Considerations for Minimizing the Potential of Waste Storage Pond Liner Failure.
Sites with categories listed in Table F-5 should be avoided unless no reasonable alternative exists. Under those circumstances, consideration should be given to providing an additional measure of safety from pond seepage when any of the potential impact categories listed in Table 5 may be significantly affected.
SECOND EDITION
Appendix F-21
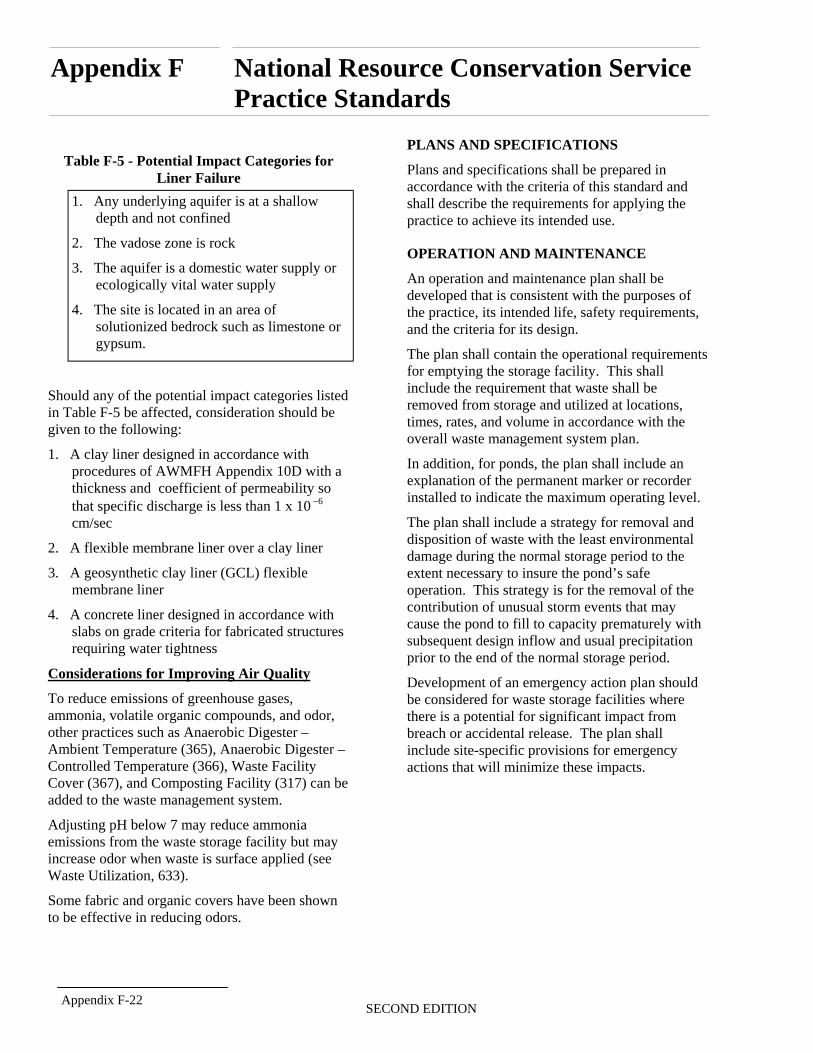
Appendix F National Resource Conservation Service Practice Standards
Table F-5 - Potential Impact Categories for Liner Failure
1. Any underlying aquifer is at a shallow depth and not confined
2. The vadose zone is rock
3. The aquifer is a domestic water supply or ecologically vital water supply
4. The site is located in an area of solutionized bedrock such as limestone or gypsum.
Should any of the potential impact categories listed in Table F-5 be affected, consideration should be given to the following:
1. A clay liner designed in accordance with procedures of AWMFH Appendix 10D with a thickness and coefficient of permeability so that specific discharge is less than 1 x 10 −6
cm/sec
2. A flexible membrane liner over a clay liner
3. A geosynthetic clay liner (GCL) flexible membrane liner
4. A concrete liner designed in accordance with slabs on grade criteria for fabricated structures requiring water tightness
Considerations for Improving Air Quality
To reduce emissions of greenhouse gases, ammonia, volatile organic compounds, and odor, other practices such as Anaerobic Digester – Ambient Temperature (365), Anaerobic Digester – Controlled Temperature (366), Waste Facility Cover (367), and Composting Facility (317) can be added to the waste management system.
Adjusting pH below 7 may reduce ammonia emissions from the waste storage facility but may increase odor when waste is surface applied (see Waste Utilization, 633).
Some fabric and organic covers have been shown to be effective in reducing odors.
PLANS AND SPECIFICATIONS
Plans and specifications shall be prepared in accordance with the criteria of this standard and shall describe the requirements for applying the practice to achieve its intended use.
OPERATION AND MAINTENANCE
An operation and maintenance plan shall be developed that is consistent with the purposes of the practice, its intended life, safety requirements, and the criteria for its design.
The plan shall contain the operational requirements for emptying the storage facility. This shall include the requirement that waste shall be removed from storage and utilized at locations, times, rates, and volume in accordance with the overall waste management system plan.
In addition, for ponds, the plan shall include an explanation of the permanent marker or recorder installed to indicate the maximum operating level.
The plan shall include a strategy for removal and disposition of waste with the least environmental damage during the normal storage period to the extent necessary to insure the pond’s safe operation. This strategy is for the removal of the contribution of unusual storm events that may cause the pond to fill to capacity prematurely with subsequent design inflow and usual precipitation prior to the end of the normal storage period.
Development of an emergency action plan should be considered for waste storage facilities where there is a potential for significant impact from breach or accidental release. The plan shall include site-specific provisions for emergency actions that will minimize these impacts.
Appendix F-22 SECOND EDITION
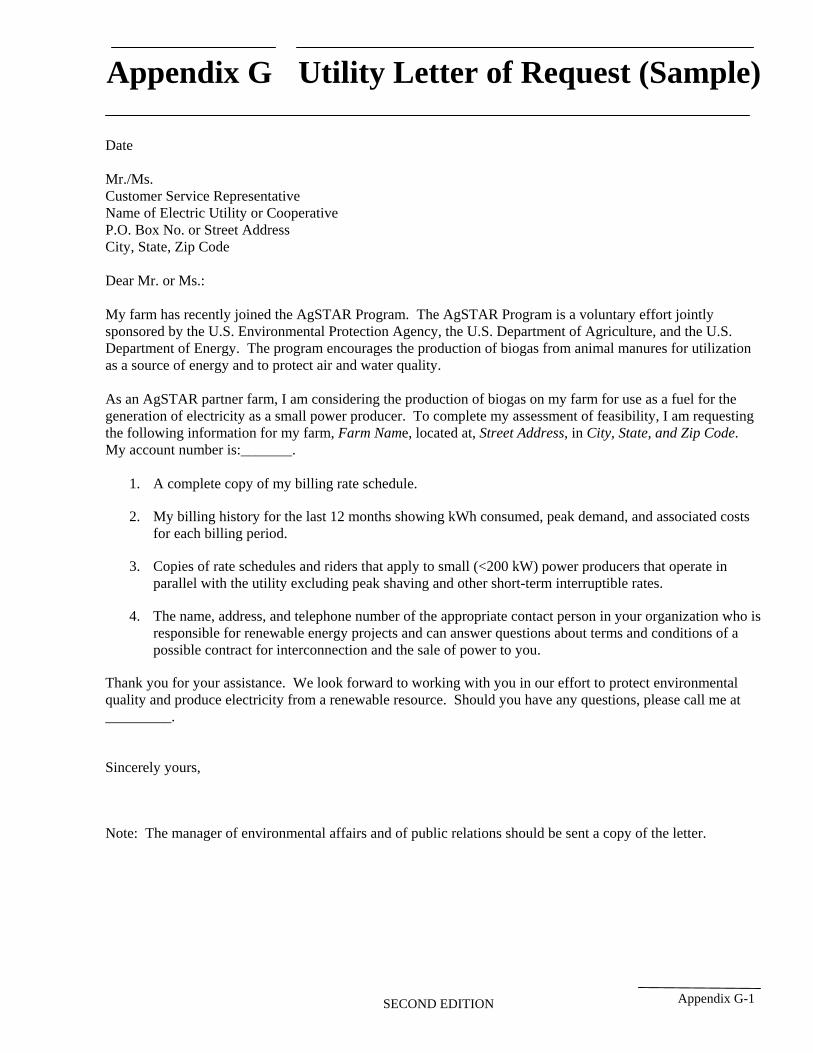
Appendix G Utility Letter of Request (Sample)
Date
Mr./Ms. Customer Service Representative Name of Electric Utility or Cooperative P.O. Box No. or Street Address City, State, Zip Code
Dear Mr. or Ms.:
My farm has recently joined the AgSTAR Program. The AgSTAR Program is a voluntary effort jointly sponsored by the U.S. Environmental Protection Agency, the U.S. Department of Agriculture, and the U.S. Department of Energy. The program encourages the production of biogas from animal manures for utilization as a source of energy and to protect air and water quality.
As an AgSTAR partner farm, I am considering the production of biogas on my farm for use as a fuel for the generation of electricity as a small power producer. To complete my assessment of feasibility, I am requesting the following information for my farm, Farm Name, located at, Street Address, in City, State, and Zip Code. My account number is:_______.
1. A complete copy of my billing rate schedule.
2. My billing history for the last 12 months showing kWh consumed, peak demand, and associated costs for each billing period.
3. Copies of rate schedules and riders that apply to small (<200 kW) power producers that operate in parallel with the utility excluding peak shaving and other short-term interruptible rates.
4. The name, address, and telephone number of the appropriate contact person in your organization who is responsible for renewable energy projects and can answer questions about terms and conditions of a possible contract for interconnection and the sale of power to you.
Thank you for your assistance. We look forward to working with you in our effort to protect environmental quality and produce electricity from a renewable resource. Should you have any questions, please call me at _________.
Sincerely yours,
Note: The manager of environmental affairs and of public relations should be sent a copy of the letter.
SECOND EDITION Appendix G-1
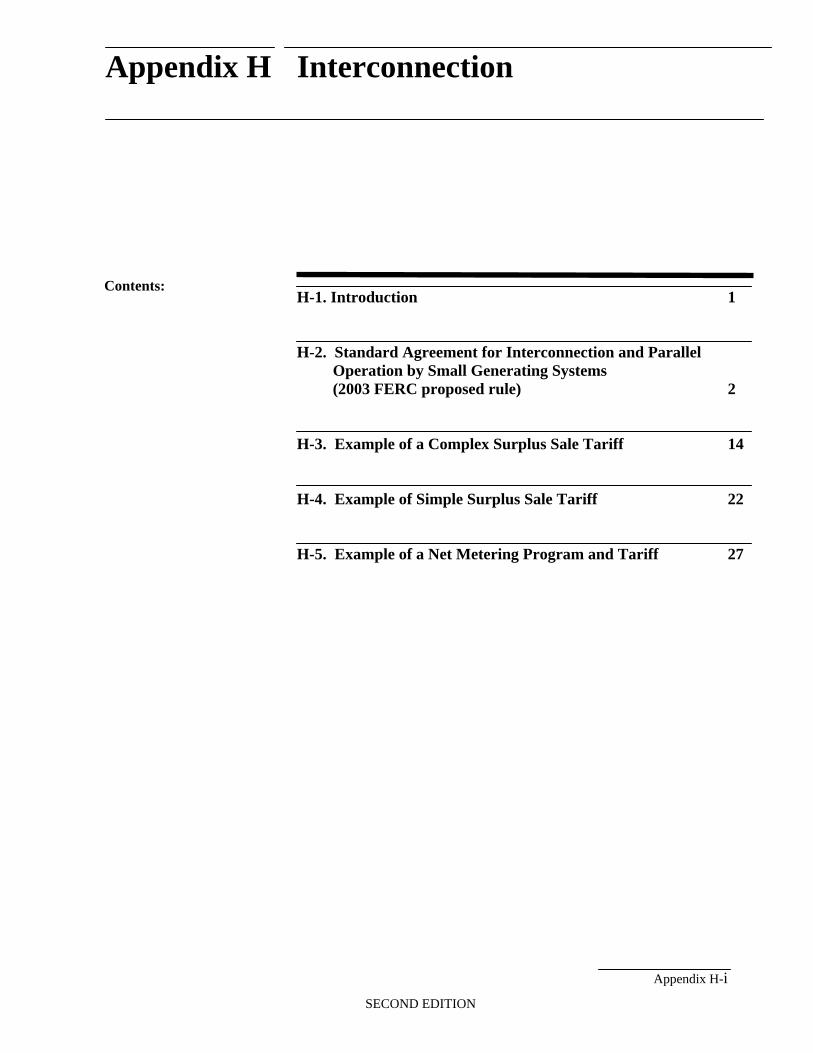
Appendix H Interconnection
Contents: H-1. Introduction
H-2. Standard Agreement for Interconnection and Parallel
Operation by Small Generating Systems
(2003 FERC proposed rule)
H-3. Example of a Complex Surplus Sale Tariff
H-4. Example of Simple Surplus Sale Tariff
H-5. Example of a Net Metering Program and Tariff
Appendix H-i
SECOND EDITION
1
2
14
22
27
Appendix H Interconnection Requirements
H-1. Introduction
In July 2003, the Federal Energy Regulatory Commission (FERC) proposed expedited grid-connection procedures for small generators, such as commercial farms producing and using biogas to generate electricity. FERC divided generators with a capacity of 20 MW or less into three categories. For connecting a generator of 2 MW capacity or less in capacity to a distribution, using pre-certified equipment, FERC proposed “super expedited“ procedures that avoid any costly grid connection studies. The procedures for generators with a capacity between 2 and 10 MW will be more complicated but are not likely to include the requirement of a grid connection study. Only generators with more than 10 MW in capacity or connected to a high voltage transmission grid would likely be required to perform a grid connection study.
State Public Utility Commissions will implement the FERC rule when promulgated. Promulgation is expected by the summer of 2004. The expedited interconnection procedures for small generators with 2 MW or less of capacity is in Section H-2. For the complete FERC rule, Standardized Interconnection
Agreements and Procedures for Small Generators, and links to fact sheets, visit the FERC web site at www.ferc.gov.
As discussed in Chapter 5, there are several types of possible agreements for the sale of electricity generated using biogas to a utility. However, the options that are available will vary depending on Public Utility Commission regulations in the state. In addition, contractual requirements also will vary by state and utility. Examples of complex and simple contractual requirements for surplus sale agreements are presented in Sections H-3 and H-4, respectively. One feature of the more complex program is the requirement for a standby service rider. An example of a net metering program and tariff is presented in Section H-5.
Appendix H-1 SECOND EDITION
Appendix H Interconnection Requirements
H-2. STANDARD AGREEMENT FOR INTERCONNECTION AND PARALLEL
OPERATION BY SMALL GENERATING SYSTEMS
(2003 FERC PROPOSED RULE)
Appendix H-2 SECOND EDITION
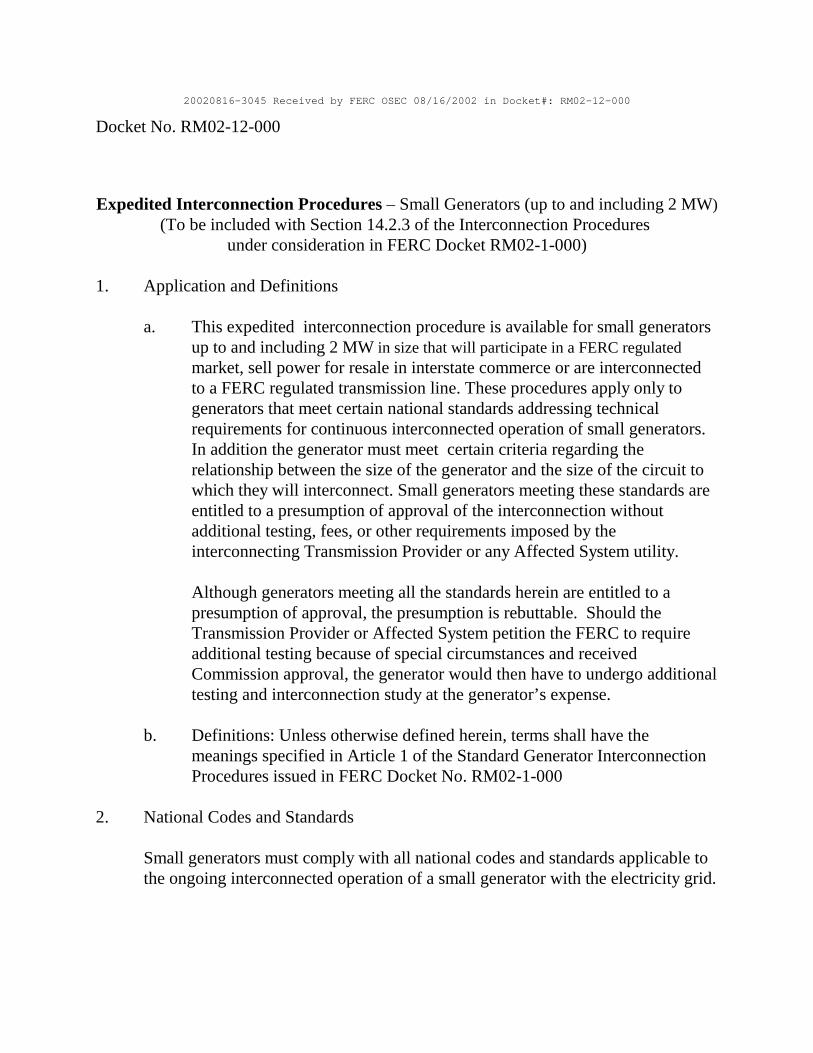
20020816-3045 Received by FERC OSEC 08/16/2002 in Docket#: RM02-12-000
Docket No. RM02-12-000
Expedited Interconnection Procedures – Small Generators (up to and including 2 MW) (To be included with Section 14.2.3 of the Interconnection Procedures
under consideration in FERC Docket RM02-1-000)
1. Application and Definitions
a. This expedited interconnection procedure is available for small generators up to and including 2 MW in size that will participate in a FERC regulated market, sell power for resale in interstate commerce or are interconnected to a FERC regulated transmission line. These procedures apply only to generators that meet certain national standards addressing technical requirements for continuous interconnected operation of small generators. In addition the generator must meet certain criteria regarding the relationship between the size of the generator and the size of the circuit to which they will interconnect. Small generators meeting these standards are entitled to a presumption of approval of the interconnection without additional testing, fees, or other requirements imposed by the interconnecting Transmission Provider or any Affected System utility.
Although generators meeting all the standards herein are entitled to a presumption of approval, the presumption is rebuttable. Should the Transmission Provider or Affected System petition the FERC to require additional testing because of special circumstances and received Commission approval, the generator would then have to undergo additional testing and interconnection study at the generator’s expense.
b. Definitions: Unless otherwise defined herein, terms shall have the meanings specified in Article 1 of the Standard Generator Interconnection Procedures issued in FERC Docket No. RM02-1-000
2. National Codes and Standards
Small generators must comply with all national codes and standards applicable to the ongoing interconnected operation of a small generator with the electricity grid.
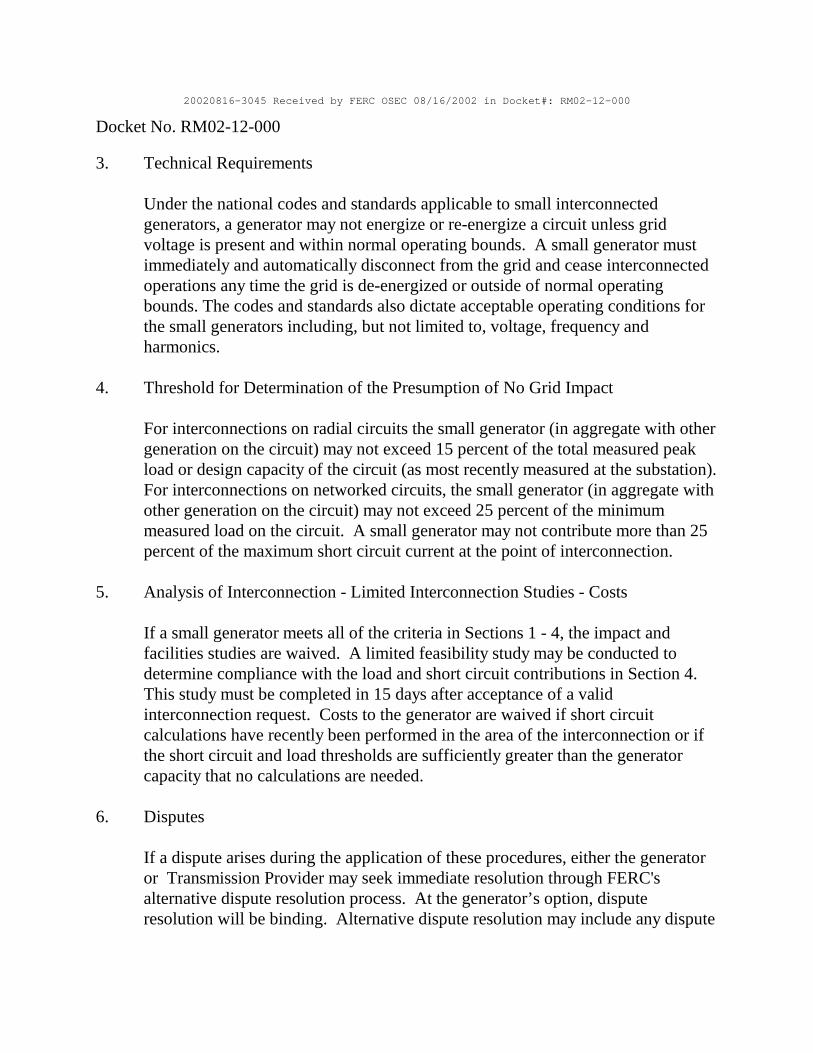
20020816-3045 Received by FERC OSEC 08/16/2002 in Docket#: RM02-12-000
Docket No. RM02-12-000
3. Technical Requirements
Under the national codes and standards applicable to small interconnected generators, a generator may not energize or re-energize a circuit unless grid voltage is present and within normal operating bounds. A small generator must immediately and automatically disconnect from the grid and cease interconnected operations any time the grid is de-energized or outside of normal operating bounds. The codes and standards also dictate acceptable operating conditions for the small generators including, but not limited to, voltage, frequency and harmonics.
4. Threshold for Determination of the Presumption of No Grid Impact
For interconnections on radial circuits the small generator (in aggregate with other generation on the circuit) may not exceed 15 percent of the total measured peak load or design capacity of the circuit (as most recently measured at the substation). For interconnections on networked circuits, the small generator (in aggregate with other generation on the circuit) may not exceed 25 percent of the minimum measured load on the circuit. A small generator may not contribute more than 25 percent of the maximum short circuit current at the point of interconnection.
5. Analysis of Interconnection - Limited Interconnection Studies - Costs
If a small generator meets all of the criteria in Sections 1 - 4, the impact and facilities studies are waived. A limited feasibility study may be conducted to determine compliance with the load and short circuit contributions in Section 4. This study must be completed in 15 days after acceptance of a valid interconnection request. Costs to the generator are waived if short circuit calculations have recently been performed in the area of the interconnection or if the short circuit and load thresholds are sufficiently greater than the generator capacity that no calculations are needed.
6. Disputes
If a dispute arises during the application of these procedures, either the generator or Transmission Provider may seek immediate resolution through FERC's alternative dispute resolution process. At the generator’s option, dispute resolution will be binding. Alternative dispute resolution may include any dispute
20020816-3045 Received by FERC OSEC 08/16/2002 in Docket#: RM02-12-000
Docket No. RM02-12-000
resolution services made available by the FERC including those that occur by telephone.
Should a Transmission Provider desire a waiver from these procedures that would otherwise apply to the small generator interconnection, the Transmission Provider must seek such wavier from FERC within 15 days of the receipt of a valid small generator interconnection request. The Transmission Provider shall have the burden to show, in a clear and convincing manner, why the application of these rules would result in an unsafe or unreliable interconnection or that the interconnection would interfere with the quality of electric service to other customers.
7. Capacity and Energy. Metering.
Small generators are entitled to participate in any available energy and capacity markets and receive the appropriate compensation due to participants in those markets. Metering shall be installed as needed to participate in the various markets.
20020816-3045 Received by FERC OSEC 08/16/2002 in Docket#: RM02-12-000
Docket No. RM02-12-000
STANDARD AGREEMENT FOR INTERCONNECTION AND PARALLEL OPERATION OF SMALL GENERATION SYSTEMS (Pre-certified systems up to and including 2 MW)
This Interconnection Agreement (“Agreement”) is made and entered into this ________ day of ________________, 19__, by _______________________________, (“Transmission Provider”), and __________________________________________ (“Generator”), a [specify whether corporation, and if so name state, municipal corporation, cooperative corporation, or other], each hereinafter sometimes referred to individually as “Party” or both referred to collectively as the “Parties”. In consideration of the mutual covenants set forth herein, the Parties agree as follows: 1. Definitions Unless otherwise defined herein, terms in this Agreement shall have the meanings specified in Article 1 of the STANDARD GENERATOR INTERCONNECTION AND OPERATING AGREEMENT (IA) issued in FERC Docket No. RM02-1-000. 2. Scope of Agreement -- This Agreement is applicable to conditions under which the Transmission Provider and the Generator agree that one or more generating facility or facilities up to and including two (2) MW to be interconnected to the Transmission Provider’s system, as described in Exhibit A. 3. Establishment of Point(s) of Interconnection -- Transmission Provider and Generator agree to interconnect the Facility at the locations specified in this Agreement and in accordance with Federal Energy Regulatory Commission Rules relating to Interconnection of Small Generation systems. 4. Responsibilities of Transmission Provider and Generator -- Each Party will, at its own cost and expense, operate, maintain, repair, and inspect, and shall be fully responsible for, Facility or Facilities which it now or hereafter may own unless otherwise specified on Exhibit A. Generator shall conduct operations of its facility(s) in compliance with all aspects of the Rules, and Transmission Provider shall conduct operations on its utility system in compliance with all aspects of the Rules, or as further described and mutually agreed to in the applicable Facility Schedule. Maintenance of Generator and associated interconnection equipment shall be performed in accordance with the applicable manufacturer’s recommended maintenance schedule. The Parties agree to cause their Facilities or systems to be constructed in accordance with applicable specifications equal to or greater than those provided by the National Electrical Safety Code, the American National Standards Institute, IEEE and Underwriter’s Laboratory in effect at the time of construction. Each Party covenants and agrees to design, install, maintain, and operate, or cause the design, installation, maintenance, and operation of its transmission and distribution system and related Facilities and Units so as to reasonably minimize the likelihood of a disturbance, originating in the system of one Party, affecting or impairing the system of the other Party, or other systems with which a Party is interconnected. Transmission Provider will notify Generator if there is evidence that the operation of Generator’s equipment causes disruption or deterioration of service to other customers served from the same grid or if the generator operation causes damage to Transmission Provider’s or Affected Systems. Generator will notify Transmission Provider of any emergency or hazardous condition or occurrence with the Generator’s Unit(s) which could affect safe operation of the system. 5. Limitation of Liability and Indemnification The Parties shall at all times indemnify, defend, and save the other Party harmless from, any and all damages, losses, claims, including claims and actions relating to injury to or death of any person or damage to property, demand, suits, recoveries, costs and expenses, court costs, attorney fees, and all other obligations by or to third parties, arising out of or resulting from the other Party's performance of obligations under this Agreement on behalf of the indemnifying Party, except in cases of negligence or intentional wrongdoing by the indemnifying Party. 6. Right of Access, Equipment Installation, Removal & Inspection– Upon reasonable notice, the Transmission Provider may send a qualified person to the premises of the Generator at or immediately before the time the Facility first produces energy to inspect the interconnection, and observe the Facility’s commissioning (including any testing), startup, and operation for a period of up to no more than three days after initial startup of the unit.
20020816-3045 Received by FERC OSEC 08/16/2002 in Docket#: RM02-12-000
Docket No. RM02-12-000
Following the initial inspection process described above, at reasonable hours, and upon reasonable notice, or at any time without notice in the event of an emergency or hazardous condition, Transmission Provider shall have access to Generator’s premises for any reasonable purpose in connection with the performance of the obligations imposed on it by this Agreement or if necessary to meet its legal obligation to provide service to its customers. 7. Disconnection of Unit – Generator retains the option to disconnect from Transmission Provider’s utility system. Generator will notify the Transmission Provider of its intent to disconnect by giving the Transmission Provider at least thirty days’ prior written notice. Such disconnection shall not be a termination of the agreement unless Generator exercises rights under Section 7. Generator shall disconnect Facility from Transmission Provider’s system upon the effective date of any termination under Section 7. Subject to Commission Rule, for routine maintenance and repairs on Transmission Provider’s utility system, Transmission Provider shall provide Generator with seven business days’ notice of service interruption. Transmission Provider shall have the right to suspend service in cases where continuance of service to Generator will endanger persons or property. During the forced outage of the Transmission Provider’s utility system serving Generator, Transmission Provider shall have the right to suspend service to effect immediate repairs on Transmission Provider’s utility system, but the Transmission Provider shall use its best efforts to provide the Generator with reasonable prior notice. 8. Effective Term and Termination Rights-- This Agreement becomes effective when executed by both parties and shall continue in effect until terminated. The agreement may be terminated for the following reasons:
(a) Generator may terminate this Agreement at any time, by giving the Transmission Provider sixty days’ written notice;
(b) Transmission Provider may terminate upon failure by the Generator to generate energy from the Facility in parallel with the Transmission Provider’s system within twelve months after completion of the interconnection;
(c) either party may terminate by giving the other party at least sixty days prior written notice that the other Party is in default of any of the material terms and conditions of the Agreement, so long as the notice specifies the basis for termination and there is reasonable opportunity to cure the default; or
(d) Transmission Provider may terminate by giving Generator at least sixty days notice in the event that there is a material change in an applicable rule or statute. 9. Governing Law and Regulatory Authority -- The validity, interpretation and performance of this Agreement and each of its provisions shall be governed by the laws of the State where the Point of Interconnection is located, without regard to its conflicts of law principles. This Agreement is subject to all Applicable Laws and Regulations. Each Party expressly reserves the right to seek changes in, appeal, or otherwise contest any laws, orders, rules, or regulations of a Governmental Authority. 10. Amendment --This Agreement may be amended only upon mutual agreement of the Parties, which amendment will not be effective until reduced to writing and executed by the Parties. 11. Entirety of Agreement and Prior Agreements Superseded -- This Agreement, including all attached Exhibits and Facility Schedules, which are expressly made a part hereof for all purposes, constitutes the entire agreement and understanding between the Parties with regard to the interconnection of the facilities of the Parties at the Points of Interconnection expressly provided for in this Agreement. The Parties are not bound by or liable for any statement, representation, promise, inducement, understanding, or undertaking of any kind or nature (whether written or oral) with regard to the subject matter hereof not set forth or provided for herein. This Agreement replaces all prior agreements and undertakings, oral or written, between the Parties with regard to the subject matter hereof, including without limitation [specify any prior agreements being superseded], and all such agreements and undertakings are agreed by the Parties to no longer be of any force or effect. It is expressly acknowledged that the Parties may have other agreements covering other services not expressly provided for herein, which agreements are unaffected by this Agreement.
______________________ ______________________ ______________________ ______________________ ______________________ ______________________ ______________________
20020816-3045 Received by FERC OSEC 08/16/2002 in Docket#: RM02-12-000
Docket No. RM02-12-000
12. Notices -- Notices given under this Agreement are deemed to have been duly delivered if hand delivered or sent by United States certified mail, return receipt requested, postage prepaid, to: (a) If to Transmission Provider: (b) If to Generator:
The above-listed names, titles, and addresses of either Party may be changed by written notification to the other, notwithstanding Section 10.
13. Invoicing and Payment -- Invoicing and payment terms for services associated with this agreement shall be consistent with applicable Rules of the Commission. 14. No Third-Party Beneficiaries -- This Agreement is not intended to and does not create rights, remedies, or benefits of any character whatsoever in favor of any persons, corporations, associations, or entities other than the Parties, and the obligations herein assumed are solely for the use and benefit of the Parties, their successors in interest and, where permitted, their assigns. 15. No Waiver -- The failure of a Party to this Agreement to insist, on any occasion, upon strict performance of any provision of this Agreement will not be considered to waive the obligations, rights, or duties imposed upon the Parties. 16. Headings -- The descriptive headings of the various articles and sections of this Agreement have been inserted for convenience of reference only and are to be afforded no significance in the interpretation or construction of this Agreement. 17. Multiple Counterparts -- This Agreement may be executed in two or more counterparts, each of which is deemed an original but all constitute one and the same instrument. IN WITNESS WHEREOF, the Parties have caused this Agreement to be signed by their respective duly authorized representatives.
[Transmission Provider NAME] BY:___________________________________ TITLE:__________________________ _________________________________ DATE:___________________________
[Transmission owner NAME (if different from Transmission Provider)] BY:___________________________________ TITLE:__________________________ _________________________________ DATE:___________________________
[Generator NAME] BY:_____________________________ TITLE:__________________________ DATE:_________________________________
20020816-3045 Received by FERC OSEC 08/16/2002 in Docket#: RM02-12-000
Docket No. RM02-12-000
EXHIBIT A to the agreement
FACILITY SCHEDULE NO. _________ [The following information is to be specified for each Point of Interconnection, if applicable.] 1. Name: 2. Facility location: 3. Delivery voltage: 4. Metering (voltage, location, losses adjustment due to metering location, and other): 5. Normal Operation of Interconnection: 6. One line diagram attached (check one): ______ Yes /_______ No 7. Facilities to be furnished by Transmission Provider (usually none): 8. Facilities to be furnished by Generator (usually contained with pre-certified generator): 9. Cost Responsibility (if any): 10. Control area interchange _______________________ 11. Supplemental terms and conditions attached (check one): _____ Yes / ______ No
20020816-3045 Received by FERC OSEC 08/16/2002 in Docket#: RM02-12-000
Docket No. RM02-12-000
EXHIBIT B to the agreement
Small Generator Interconnection Application (For use with Generators up to and including 2 MW)
An applicant (Generator Owner) makes application to _____________ (Transmission Provider) to install and operate
a generating facility up to and including 2 MW interconnected with the ______________ utility system.. This
application, unless otherwise established at the scoping meeting between Generator Owner and Transmission Provider,
will be considered as application for a feasibility study for generators under Federal Energy Regulatory Commission
rules for expedited treatment of generators up to an d including 2 MW in capacity.
Section 1, Applicant Information
Name:_____________________________________________________________________________________
Mailing Address: ____________________________________________________________________________
City: ____________________________________ State:__________________ Zip Code: ________________
Facility Location (if different from above): ________________________________________________________
Telephone (Daytime): Area Code _____ Number ___________ (Evening) Area Code _____ Number__________
Account No. (if applicable): _____________________________ Pole Number: ________________
Energy Service Provider Name: ________________________________
Section 2, Generator Qualifications
(informational only) Is the generator a Qualifying Facility as defined under Subpart B, Section 201 of the Federal
Energy Regulatory Commission’s regulations per the Public Utility Regulatory Policies Act of 1978?
_____Yes _____ No
Is Generator powered from a Renewable Qualifying Energy Source: ______Yes _____ No
Type Qualifying Energy Source (if applicable): _____ Solar _____ Wind ______ Hydro _____ Other
Other generator energy source: ____ Diesel, Natural Gas ____ Diesel, Fuel Oil Other: ________________
(State type)
Will excess power be exported? _____ Yes ______ No
Site Load: __________________ kW (Typical) Maximum Export: ____________________ kW.
Section 3, Generator Technical Information Type of Generator: _____ Synchronous _____Induction _____DC Generator or Solar with Inverter
Generator (or solar collector) Manufacturer, Model Name & Number: __________________________________
(A copy of Generator Nameplate and Manufacturer’s Specification Sheet may be substituted)
Output Power Rating in kW: _______________________ _____ Single phase _____ Three phase
Inverter Manufacturer, Model Name & Number (if used): _____________________________________________
_______ _________
_________
__________________________
20020816-3045 Received by FERC OSEC 08/16/2002 in Docket#: RM02-12-000
Docket No. RM02-12-000
Adjustable Setpoints __________________________________________________________________________
(A copy of Inverter Manufacturer’s Specification Sheet may be substituted)
Generator Characteristic Data (for rotating machines): (Not needed if Generator Nameplate and Manufacture’s Specification Sheet is provided)
Direct Axis Synchronous Reactance, Xd: P.U. Negative Sequence Reactance: P.U.
Direct Axis Transient Reactance, X’ d: _______ P.U. Zero Sequence Reactance: P.U.
Direct Axis Subtransient Reactance, X” d: _______ P.U. KVA Base:
Section 4, Interconnecting Equipment Technical Data
Will an interposing transformer be used between the generator and the point of interconnection? ____Yes ___ No
Transformer Data (if applicable, for Customer Owned Transformer):
(A copy of transformer Nameplate and Manufacturer’s Test Report may be substituted)
Size: ______ KVA . Transformer Primary : ________ Volts ___Delta ____ Wye _____Wye Grounded
Transformer Secondary: ________ Volts ___Delta ____ Wye _____Wye Grounded
Transformer Impedance: ______% on ______ KVA Base
Transformer Fuse Data (if applicable, for Customer Owned Fuse):
(Attach copy of fuse manufacturer’s Minimum Melt & Total Clearing Time-Current Curves)
Manufacturer: ______________ Type: _____________ Size: ________________ Speed: _____________
(A copy of breaker’s Nameplate and Specification Sheet may be substituted)
Manufacturer: _________ Type: _______ Load Rating: ______ Interrupting Rating: _______ Trip Speed: ____
(Amps) (Amps) (Cycles)
(Enclose copy of any proposed Time-Overcurrent Coordination Curves)
Interconnecting Circuit Breaker (if applicable):
Circuit Breaker Protective Relays (if applicable):
Manufacturer: ________ Type: _______ Style/Catalog No.: __________ Proposed Setting: ________________
Manufacturer: ________ Type: _______ Style/Catalog No.: __________ Proposed Setting: ________________
Manufacturer: ________ Type: _______ Style/Catalog No.: __________ Proposed Setting: ________________
Manufacturer: ________ Type: _______ Style/Catalog No.: __________ Proposed Setting: ________________
Manufacturer: ________ Type: _______ Style/Catalog No.: __________ Proposed Setting: ________________
Current Transformer Data (if applicable):
(Enclose copy of Manufacturer’s Excitation & Ratio Correction Curves)

20020816-3045 Received by FERC OSEC 08/16/2002 in Docket#: RM02-12-000
Docket No. RM02-12-000
Manufacturer: ________ Type: _______ Accuracy Class: ________ Proposed Ratio Connection: ______/5
Manufacturer: ________ Type: _______ Accuracy Class: ________ Proposed Ratio Connection: ______/5
Section 5, General Technical Information
Enclose copy of site One-Line Diagram showing configuration and interconnection of all equipment, current and
potential circuits and protection and control schemes. Is One-Line Diagram Enclosed?: _____Yes
Enclose copy of any site documentation that describes and details the operation of the protection and control
schemes. Is Any Available Documentation Enclosed?: ______ Yes
Enclose copies of schematic drawings for all protection and control circuits, relay current circuits, relay potential
circuits, and alarm/monitoring circuits (if applicable). Are Schematic Drawings Enclosed? _____Yes
Section 6, Installation Details
Installing Electrician: __________________ Firm: ______________________ License No.: ____________
Mailing Address: ____________________________________________________________________________
City: ____________________________________ State:__________________ Zip Code: ________________
Telephone: Area Code: _________ Number: _________________________
Installation Date: __________________________ Interconnection Date: ___________________________
Supply certification that the generating system has been installed and inspected in compliance with the local
Building/Electrical code of the municipality of _____________________________________________________
Signed (Inspector): ___________________________________________ Date: _________________________
(In lieu of signature of Inspector, a copy of the final inspection certificate may be attached)
Section 7, Generator/Equipment Certification Generating systems must be compliant with IEEE, NEC, ANSI, and UL standards. By signing below, the Applicant certifies that the installed generating equipment meets the appropriate preceding requirement(s) and can supply documentation that confirms compliance.
Signed (Applicant): ____________________________________Date: _________________________
Section 8, Applicant Signature
I hereby certify that, to the best of my knowledge, all the information provided in the Interconnection Application is true and correct. I also agree to install a Warning Label provided by (utility) on or near my service meter location.
20020816-3045 Received by FERC OSEC 08/16/2002 in Docket#: RM02-12-000
Docket No. RM02-12-000
Signature of Applicant: ________________________________________ Date: ________________________
Send the completed application to:
(Utility Address)
This section for use by ___________(utility) Only
Section 9, Approval or Non-Approval
(utility): _____Has Approved ______Has Not Approved this Interconnection Application.
Name : _________________________________________________ Date: _________________________
Signature: ______________________________________________
Reason for Not Approving:
Approval to connect to the Company system indicates only that the minimum requirements for a safe proper interconnection have been satisfied. Such approval does not imply that the Generator Owner’s facility meets all federal, state and local standards or regulations.
Section 10, Internal Notifications
Send Applicant Warning Label for installing on/ near service meter: _____Yes
Notify Billing Dept. of Interconnected Generation: _____Yes
Notify District Engineering of Interconnected Generation: _____Yes
Notify System Protection of Interconnected Generation: _____Yes
Appendix H Interconnection Requirements
H-3. EXAMPLE OF A COMPLEX SURPLUS SALE TARIFF
Appendix H-4 SECOND EDITION
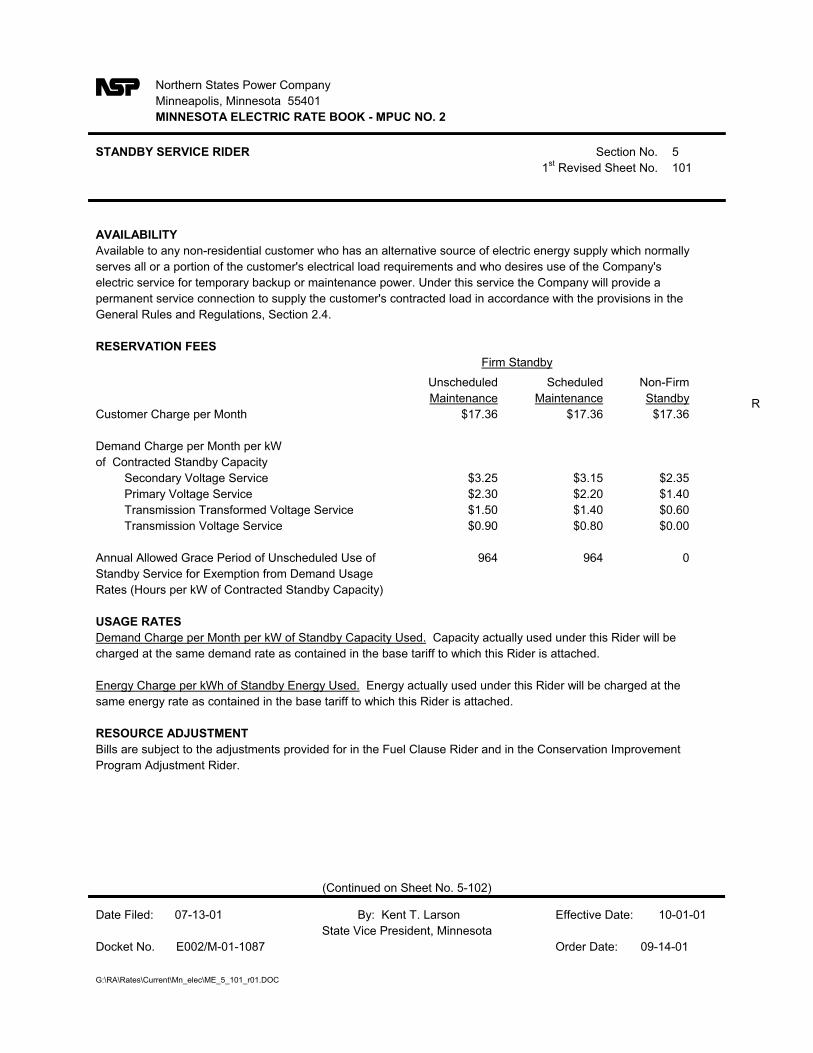
Northern States Power Company
Minneapolis, Minnesota 55401
MINNESOTA ELECTRIC RATE BOOK - MPUC NO. 2
1
5 st Revised Sheet No. 101
ith the provisions in the
Fi
Unscheduled Scheduled
Maintenance Maintenance Standby R $17.36 $17.36 $17.36
Demand Charge per Month per kW
$3.25 $3.15 $2.35
$2.30 $2.20 $1.40
$1.50 $1.40 $0.60
$0.90 $0.80 $0.00
964 964 0
)
Program Adjustment Rider.
(Continued on Sheet No. 5-102)
General Rules and Regulations, Section 2.4.
Non-Firm
Customer Charge per Month
STANDBY SERVICE RIDER Section No.
AVAILABILITY
Available to any non-residential customer who has an alternative source of electric energy supply which normally
serves all or a portion of the customer's electrical load requirements and who desires use of the Company's
electric service for temporary backup or maintenance power. Under this service the Company will provide a
permanent service connection to supply the customer's contracted load in accordance w
RESERVATION FEES
rm Standby
of Contracted Standby Capacity
Secondary Voltage Service
Primary Voltage Service
Transmission Transformed Voltage Service
Transmission Voltage Service
Annual Allowed Grace Period of Unscheduled Use of
Standby Service for Exemption from Demand Usage
Rates (Hours per kW of Contracted Standby Capacity
USAGE RATES
Demand Charge per Month per kW of Standby Capacity Used. Capacity actually used under this Rider will be
charged at the same demand rate as contained in the base tariff to which this Rider is attached.
Energy Charge per kWh of Standby Energy Used. Energy actually used under this Rider will be charged at the
same energy rate as contained in the base tariff to which this Rider is attached.
RESOURCE ADJUSTMENT
Bills are subject to the adjustments provided for in the Fuel Clause Rider and in the Conservation Improvement
Date Filed: 07-13-01 By: Kent T. Larson Effective Date: 10-01-01
State Vice President, Minnesota
Docket No. E002/M-01-1087 Order Date: 09-14-01
G:\RA\Rates\Current\Mn_elec\ME_5_101_r01.DOC
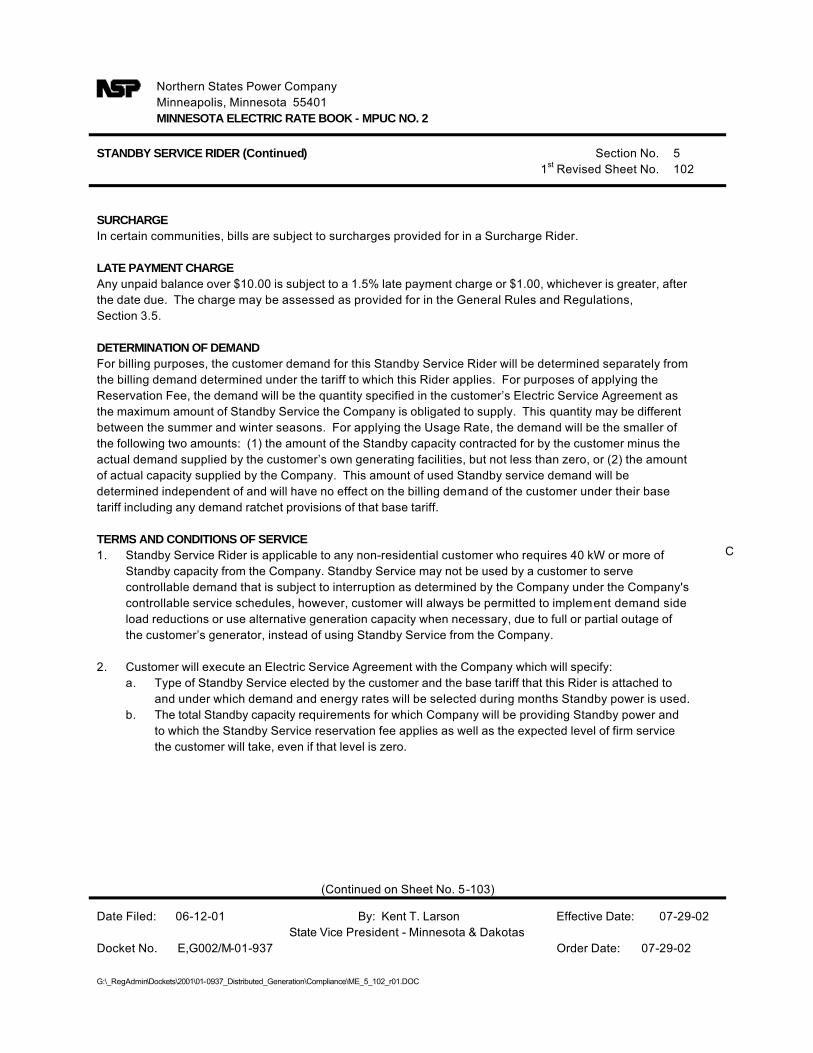
Northern States Power Company
Minneapolis, Minnesota 55401
MINNESOTA ELECTRIC RATE BOOK - MPUC NO. 2
Section No. 5
1st Revised Sheet No.
SURCHARGE
In certain communities, bills are subject to surcharges provided for in a Surcharge Rider.
LATE PAYMENT CHARGE
Any unpaid balance over $10.00 is subject to a 1.5% late payment charge or $1.00, whichever is greater, after
DETERMINATION OF DEMAND
For billing purposes, the customer demand for this Standby Service Rider will be determined separately from
Reservation Fee, the demand will be the quantity specified in the customer’s Electric Service Agreement as
actual demand supplied by the customer’s own generating facilities, but not less than zero, or (2) the amount
tariff including any demand ratchet provisions of that base tariff.
TERMS AND CONDITIONS OF SERVICE
1.
Standby capacity from the Company. Standby Service may not be used by a customer to serve
controllable demand that is subject to interruption as determined by the Company under the Company's
load reductions or use alternative generation capacity when necessary, due to full or partial outage of
the customer’s generator, instead of using Standby Service from the Company.
2. Customer will execute an Electric Service Agreement with the Company which will specify:
a. Type of Standby Service elected by the customer and the base tariff that this Rider is attached to
and under which demand and energy rates will be selected during months Standby power is used.
b.
to which the Standby Service reservation fee applies as well as the expected level of firm service
the customer will take, even if that level is zero.
C
102
STANDBY SERVICE RIDER (Continued)
the date due. The charge may be assessed as provided for in the General Rules and Regulations,
Section 3.5.
the billing demand determined under the tariff to which this Rider applies. For purposes of applying the
the maximum amount of Standby Service the Company is obligated to supply. This quantity may be different
between the summer and winter seasons. For applying the Usage Rate, the demand will be the smaller of
the following two amounts: (1) the amount of the Standby capacity contracted for by the customer minus the
of actual capacity supplied by the Company. This amount of used Standby service demand will be
determined independent of and will have no effect on the billing dem and of the customer under their base
Standby Service Rider is applicable to any non-residential customer who requires 40 kW or more of
controllable service schedules, however, customer will always be permitted to implem ent demand side
The total Standby capacity requirements for which Company will be providing Standby power and
(Continued on Sheet No. 5-103)
Date Filed: 06-12-01 By: Kent T. Larson Effective Date: 07-29-02
State Vice President - Minnesota & Dakotas
Docket No. E,G002/M-01-937 Order Date: 07-29-02
G:\_RegAdmin\Dockets\2001\01-0937_Distributed_Generation\Compliance\ME_5_102_r01.DOC
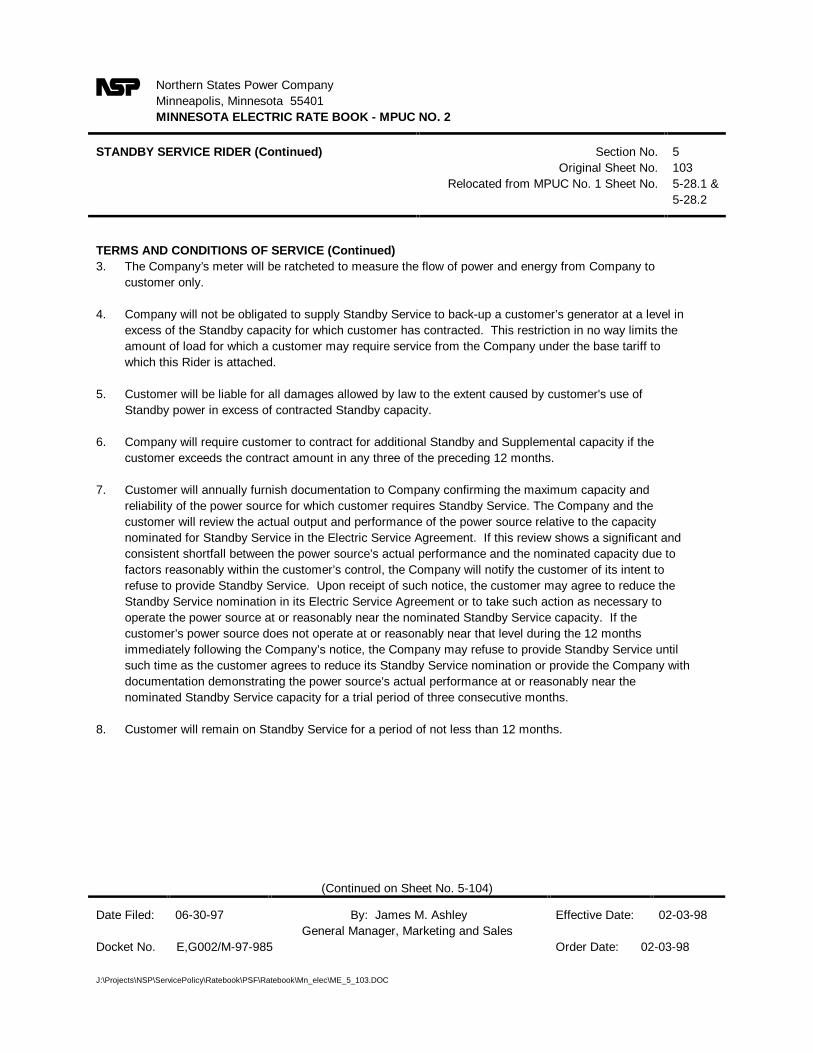
Northern States Power Company Minneapolis, Minnesota 55401 MINNESOTA ELECTRIC RATE BOOK - MPUC NO. 2
i 5 l 103
3.
4. i l in i i i imi
l i i i i
l i
6. i i l i i
l i i i i i i i
i l l i nomi i i l i i i i
ll i i i l
i i i i inati i l i i i
i i l l duri
i l ll i i i il such ti i i inati i
i i nomi i ial i i
i i l
i
l
i
7.
ct
STANDBY SERVICE RIDER (Continued) Sect on No. Origina Sheet No.
Re ocated from MPUC No. 1 Sheet No. 5-28.1 & 5-28.2
TERMS AND CONDITIONS OF SERVICE (Continued) The Company’s meter will be ratcheted to measure the flow of power and energy from Company to customer only.
Company will not be obligated to supply Standby Serv ce to back-up a customer’s generator at a leve excess of the Standby capacity for wh ch customer has contracted. This restr on in no way l ts the amount of oad for wh ch a customer may require serv ce from the Company under the base tar ff to which this R der is attached.
5. Customer will be liab e for all damages allowed by law to the extent caused by customer's use of Standby power n excess of contracted Standby capacity.
Company will requ re customer to contract for addit onal Standby and Supplementa capacity f the customer exceeds the contract amount n any three of the preced ng 12 months.
Customer will annual y furn sh documentat on to Company conf rm ng the max mum capacity and reliability of the power source for which customer requ res Standby Serv ce. The Company and the customer will rev ew the actua output and performance of the power source re at ve to the capacity
nated for Standby Serv ce n the E ectr c Serv ce Agreement. If th s review shows a signif cant and consistent shortfa between the power source’s actual performance and the nom nated capacity due to factors reasonably w th n the customer’s contro , the Company will notify the customer of its intent to refuse to provide Standby Serv ce. Upon rece pt of such not ce, the customer may agree to reduce the Standby Serv ce nom on in ts E ectr c Serv ce Agreement or to take such act on as necessary to operate the power source at or reasonably near the nom nated Standby Serv ce capacity. If the customer’s power source does not operate at or reasonably near that eve ng the 12 months mmediate y fo ow ng the Company’s not ce, the Company may refuse to provide Standby Serv ce unt
me as the customer agrees to reduce ts Standby Serv ce nom on or provide the Company w th documentat on demonstrat ng the power source’s actual performance at or reasonably near the
nated Standby Serv ce capacity for a tr per od of three consecut ve months.
8. Customer will remain on Standby Serv ce for a per od of not ess than 12 months.
(Cont nued on Sheet No. 5-104)
lDate Fi ed: 06-30-97 By: James M. Ashley iEffect ve Date: 02-03-98 iGeneral Manager, Market ng and Sales
Docket No. E,G002/M-97-985 Order Date: 02-03-98
i iJ:\Projects\NSP\Serv cePol cy\Ratebook\PSF\Ratebook\Mn_elec\ME_5_103.DOC
Northern States Power Company Minneapolis, Minnesota 55401 MINNESOTA ELECTRIC RATE BOOK - MPUC NO. 2
i 5 l 104
l i ifi i i i i i i iod
i i i ifi i iod
i l i i
i i ivi i i l i
i i i i 15 mi i i i
i i i i
10. i i i i i i i i
i ici i i i i i i i
i l i i i i
li i l l ing:
a. ifi l i l i
i i i l not i l i
i
b. ifi l i l i
i i i
shall i i
i
l i i
i i
l
i
l i
l
l l
j l
ow
STANDBY SERVICE RIDER (Continued) Sect on No. Origina Sheet No.
Re ocated from MPUC No. 1 Sheet No. 5-28.2 & 5-28.3
TERMS AND CONDITIONS OF SERVICE (Continued) 9. Customer will be allowed annual y a grace per od as spec ed above for use of unscheduled Standby
Serv ce w thout ncurr ng addit onal demand charges for use of Standby Serv ce. Use of th s grace per will be measured in terms of Standby energy used by customer w th the max mum amount of grace energy be ng the hours spec ed above t mes the contracted Standby capacity. After the grace per has been exhausted and customer uses unscheduled Standby Serv ce, the customer shal pay the Usage Rates instead of the Reservat on Fees as l sted above. In a billing month, when customer uses Standby Service, the base tar ff billing demand and the Standby Serv ce billing demand will be determined ind dually. The base tar ff billing demand will be the greatest 15 m nute oad determ ned after separat ng Standby Serv ce usage from the tota metered demands. The t me of th s determ ned greatest
nute demand may or may not be at the same t me when Standby Serv ce s used. Billed demand charges for usage of Standby Serv ce will be in addit on to the billed demand charges for the base tar ff as just descr bed.
Notw thstanding the grace per od noted n Sect on 9 above, n the event customer requires unscheduled Standby Serv ce at the t mes of Company’s system peak hours in wh ch the Company would have nsuff ent accred ted capac ty under the M d-Cont nent Area Power Pool (MAPP) Agreement, f not for addit onal capacity purchases, and the Company incurs addit onal capacity costs as a result of such unscheduled Standby Serv ce, customer shal pay peak demand charges for the month in wh ch such unscheduled Standby Serv ce occurs and for each of the f ve succeed ng months instead of the above sted demand charges, or the demand charges under Sect on 9 above. Such peak demand charges shal
be based upon the fo
If customer has not ed Company of an unscheduled outage at east three hours pr or to Company’s system peak hour, such peak demand charges shal be based on one-s xth of any addit onal capacity costs incurred by the Company as a result of the unscheduled outage. Such addit onal capac ty costs shal nc ude any MAPP after-the-fact capac ty purchase costs ncurred by the Company.
If customer has not not ed the Company of any unscheduled outage at east three hours pr or to the Company’s system peak hour, such peak demand charges shal be based on one-s xth of any addit onal capac ty costs or MAPP after-the-fact purchase costs ncurred by the Company as a result of the unscheduled outage. The demand for billing purposes for the succeeding five months
be equal to the demand placed on the system dur ng the t me of the Company’s system peak hour.
(Cont nued on Sheet No. 5-105)
Date Fi ed: 06-30-97 By: James M. Ashley Effect ve Date: 02-03-98 Genera Manager, Market ng and Sa es
Docket No. E,G002/M-97-985 Order Date: 02-03-98
J:\Pro ects\NSP\Serv cePo cy\Ratebook\PSF\Ratebook\Mn_elec\ME_5_104.DOC
Northern States Power Company Minneapolis, Minnesota 55401 MINNESOTA ELECTRIC RATE BOOK - MPUC NO. 2
i 5 l 105
11. i i i i i i ion 10 above
l i ion 10 shall i i ly
12. l i i ifi ibl ial
i ion.
13. i i i i i ifi
l i i lli i i
i l i i l i i l i i l i
i l i i i i i l l i
i l i
i
i
i ining
ll
at
STANDBY SERVICE RIDER (Continued) Sect on No. Origina Sheet No.
Relocated from MPUC No. 1 Sheet No. 5-28.3
TERMS AND CONDITIONS OF SERVICE (Continued) In the event any port on of the capac ty assoc ated with the addit onal capac ty costs or MAPP after-the-fact purchase costs incurred by the Company and attr butable to the customer under Sect are subsequent y used to sat sfy the Company’s MAPP requirements for the Company’s customers, the peak demand charges under Sect be discounted w th respect to that port on subsequent used by the Company’s customers.
The Company shal provide not ce to the Standby customers when peak load condit ons are expected to occur through the same means that the Company not es nterrupt e customers of the potent nterrupt
Company will install and charge customer for the meter ng necessary, as determ ned by the Company, to allow for proper billing of the separate base tar ff and Standby R der demands and grace per od ident ed above. Customer shal re mburse the Company for the costs of nsta ng, operat ng, and ma ntathese meters and any other facilities requ red to serve the customer’s Standby load. Such required addit onal equipment shal nclude the meter ng equipment used to measure the e ectr cal output of the customers’ alternat ve source of e ectr c energy supply. In part cular, the Company will install a meter that measures the f ow of power and energy from the customer’s own generat ng facility. If, as a result of the customer’s construct on and instal at on of the r generat ng facility, it is more practica or econom cal for the customer to nsta some or al of the meter ng equipment required, the customer may be perm tted to do so subject to Company’s approval of an instal on plan for such equipment.
(Cont nued on Sheet No. 5-106)
lDate Fi ed: 06-30-97 By: James M. Ashley iEffect ve Date: 02-03-98 iGeneral Manager, Market ng and Sales
Docket No. E,G002/M-97-985 Order Date: 02-03-98
i iJ:\Projects\NSP\Serv cePol cy\Ratebook\PSF\Ratebook\Mn_elec\ME_5_105.DOC
Northern States Power Company
Minneapolis, Minnesota 55401
MINNESOTA ELECTRIC RATE BOOK - MPUC NO. 2
Section No. 5
1st Revised Sheet No.
ADDITIONAL TERMS AND CONDITIONS OF SERVICE WITH FIRM STANDBY SCHEDULED MAINTENANCE
1. Scheduled maintenance rates are available to Standby Service customers who agree to schedule
2. Qualifying Scheduled Maintenance Periods
the calendar months of April, May, October, and November. Customer must provide Company with
written notice of scheduled maintenance prior to the beginning of the maintenance period.
those times when Company expects system seasonal peak load conditions to occur, and at those
notice to the Company based on the following schedule:
Outage Length
Less than 48 hours
2 days to 30 days
Over 30 days
Required Notice
7 days
90 days
3. The duration of qualifying scheduled maintenance periods may not exceed a total of six weeks in any 12
month period.
4. An additional charge shall apply if customer does not comply with all terms and conditions for qualifying
additional charges which would have applied if customer were billed on the Unscheduled Maintenance
5. General Service or General Time of Day Service demand charges shall not apply to use during
energy will not count against the grace period.
C Maintenance must occur within
Maintenance must occur at a
106
STANDBY SERVICE RIDER (Continued)
maintenance of their power source during qualifying scheduled maintenance periods.
Customers With 40 kW to 10,000 kW of Contracted Standby Capacity.
Customers With Greater Than 10,000 kW of Contracted Standby Capacity.
time period mutually agreed to by Company and customer. These time periods will normally not include
times when Company is required to use oil-fired generation equipment or to purchase power that
results in equivalent production costs. Customer shall provide an annual projection of scheduled
maintenance to the Company. Customer shall be allowed changes or additions to this projection upon
24 hours
scheduled maintenance periods. The additional charge shall be determined by calculating the
Option for the period extending back to the customer's last scheduled maintenance period.
qualifying scheduled maintenance periods. Further, qualifying scheduled maintenance period time and
(Continued on Sheet No. 5-107)
Date Filed: 06-12-01 By: Kent T. Larson Effective Date: 07-29-02
State Vice President – Minnesota & Dakotas
Docket No. E,G002/M-01-937 Order Date: 07-29-02
G:\_RegAdmin\Dockets\2001\01-0937_Distributed_Generation\Compliance\ME_5_106_r01.DOC
Northern States Power Company Minneapolis, Minnesota 55401 MINNESOTA ELECTRIC RATE BOOK - MPUC NO. 2
i 5 l 107
1. i l i i
2. i l i i i
3. i i i ly i
4. i i i l i
a. i i i i
b. i i i i i
5. i i i i ri i i
6. i i i i l i i ial iod.
l l
ii
STANDBY SERVICE RIDER (Continued) Sect on No. Origina Sheet No.
Relocated from MPUC No. 1 Sheet No. 5-29
ADDITIONAL TERMS AND CONDITIONS OF SERVICE FOR NON-FIRM STANDBY OPTION Non-f rm standby rates are avai able to customers who agree to use Standby Serv ce only by prearrangement w th the Company.
Company makes no guarantee that Standby Serv ce will be availab e to Non-F rm Standby Serv ce customers; however, the Company will make reasonable efforts to provide Standby Serv ce whenever possible.
Customer must request use of Standby Serv ce and rece ve approval from the Company pr or to actual using Standby Serv ce.
Use of Standby Serv ce w thout pr or approval by the Company shal subject the Non-Firm Standby Service customer to the follow ng:
Genera Serv ce or Genera Time of Day Serv ce monthly demand charges for the unapproved Standby Serv ce used n a given month, plus Firm Standby Serv ce unscheduled ma ntenance opt on reservat on fees for six months pr or to the month in wh ch unapproved use of Standby Serv ce occurred.
If unapproved use of Standby Serv ce occurs tw ce n any 12 month per od, the Company reserves the ght to convert the Non-Firm Standby Serv ce customer to Firm Standby Serv ce.
Non-Firm Standby Serv ce customers will remain on Non-F rm Standby Serv ce for a per od of not ess than f ve years wh ch includes a one year tr per
Date Filed: 06-30-97 By: James M. Ashley Effective Date: 02-03-98 General Manager, Marketing and Sales
Docket No. E,G002/M-97-985 Order Date: 02-03-98
J:\Projects\NSP\ServicePolicy\Ratebook\PSF\Ratebook\Mn_elec\ME_5_107.DOC
Appendix H Interconnection Requirements
H-4. EXAMPLE OF SIMPLE SURPLUS SALE TARIFF
Appendix H-22 SECOND EDITION
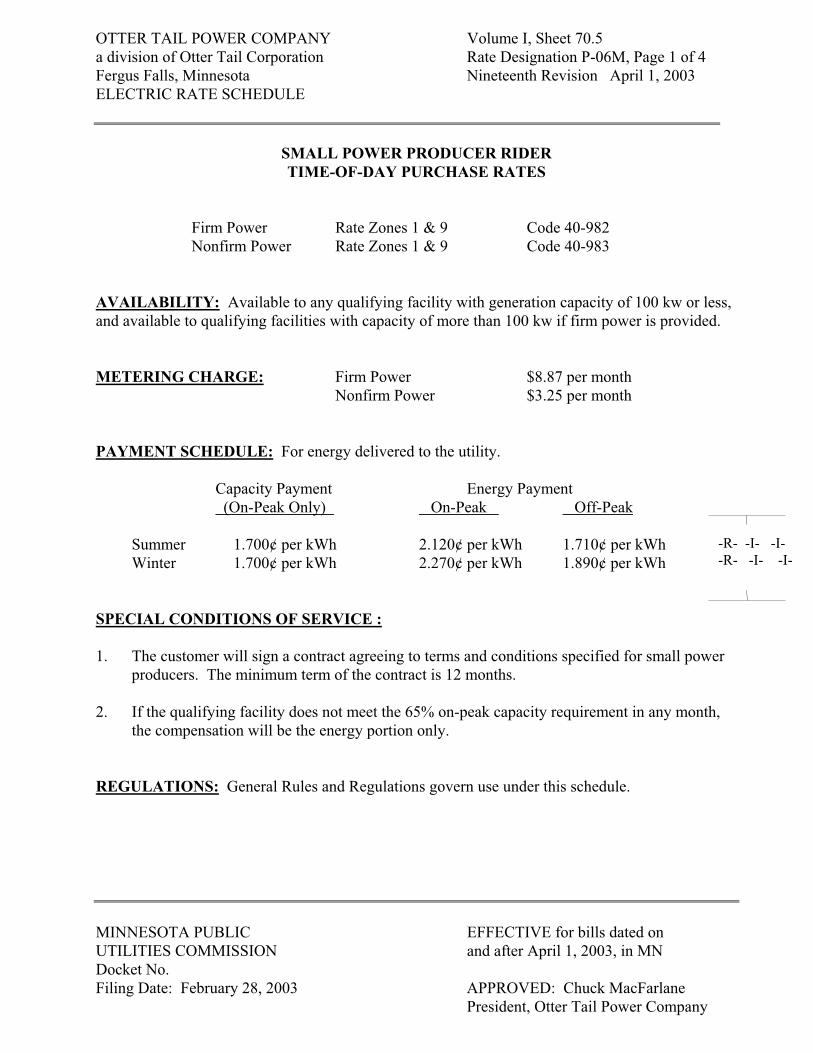
OTTER TAIL POWER COMPANY a division of Otter Tail Corporation Fergus Falls, Minnesota ELECTRIC RATE SCHEDULE
Volume I, Sheet 70.5 Rate Designation P-06M, Page 1 of 4 Nineteenth Revision April 1, 2003
SMALL POWER PRODUCER RIDER
TIME-OF-DAY PURCHASE RATES
Rate Zones 1 & 9 Code 40-982 Rate Zones 1 & 9 Code 40-983
AVAILABILITY:
METERING CHARGE:
PAYMENT SCHEDULE: For energy delivered to the utility.
(On-Peak Only) On-Peak Off-Peak
-I--R- -I- -I-
SPECIAL CONDITIONS OF SERVICE :
1.
2.
REGULATIONS: General Rules and Regulations govern use under this schedule.
Available to any qualifying facility with generation capacity of 100 kw or less,
Firm Power Nonfirm Power
and available to qualifying facilities with capacity of more than 100 kw if firm power is provided.
Firm Power $8.87 per month Nonfirm Power $3.25 per month
Capacity Payment Energy Payment
Summer 1.700¢ per kWh 2.120¢ per kWh 1.710¢ per kWh -R- -I-
Winter 1.700¢ per kWh 2.270¢ per kWh 1.890¢ per kWh
The customer will sign a contract agreeing to terms and conditions specified for small power producers. The minimum term of the contract is 12 months.
If the qualifying facility does not meet the 65% on-peak capacity requirement in any month, the compensation will be the energy portion only.
MINNESOTA PUBLIC EFFECTIVE for bills dated on UTILITIES COMMISSION and after April 1, 2003, in MN Docket No. Filing Date: February 28, 2003 APPROVED: Chuck MacFarlane
President, Otter Tail Power Company
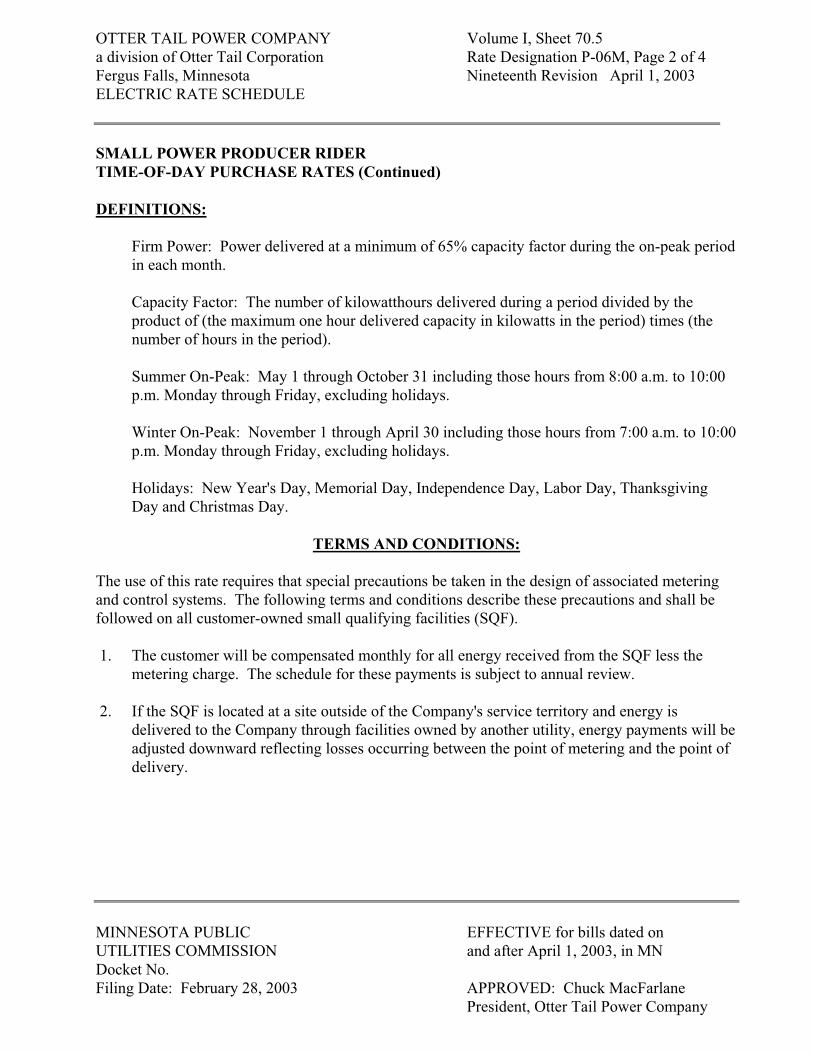
OTTER TAIL POWER COMPANY a division of Otter Tail Corporation Fergus Falls, Minnesota ELECTRIC RATE SCHEDULE
Volume I, Sheet 70.5 Rate Designation P-06M, Page 2 of 4 Nineteenth Revision April 1, 2003
SMALL POWER PRODUCER RIDER
TIME-OF-DAY PURCHASE RATES (Continued)
DEFINITIONS:
TERMS AND CONDITIONS:
1.
2.
delivery.
Firm Power: Power delivered at a minimum of 65% capacity factor during the on-peak period in each month.
Capacity Factor: The number of kilowatthours delivered during a period divided by the product of (the maximum one hour delivered capacity in kilowatts in the period) times (the number of hours in the period).
Summer On-Peak: May 1 through October 31 including those hours from 8:00 a.m. to 10:00 p.m. Monday through Friday, excluding holidays.
Winter On-Peak: November 1 through April 30 including those hours from 7:00 a.m. to 10:00 p.m. Monday through Friday, excluding holidays.
Holidays: New Year's Day, Memorial Day, Independence Day, Labor Day, Thanksgiving Day and Christmas Day.
The use of this rate requires that special precautions be taken in the design of associated metering and control systems. The following terms and conditions describe these precautions and shall be followed on all customer-owned small qualifying facilities (SQF).
The customer will be compensated monthly for all energy received from the SQF less the metering charge. The schedule for these payments is subject to annual review.
If the SQF is located at a site outside of the Company's service territory and energy is delivered to the Company through facilities owned by another utility, energy payments will be adjusted downward reflecting losses occurring between the point of metering and the point of
MINNESOTA PUBLIC EFFECTIVE for bills dated on UTILITIES COMMISSION and after April 1, 2003, in MN Docket No. Filing Date: February 28, 2003 APPROVED: Chuck MacFarlane
President, Otter Tail Power Company
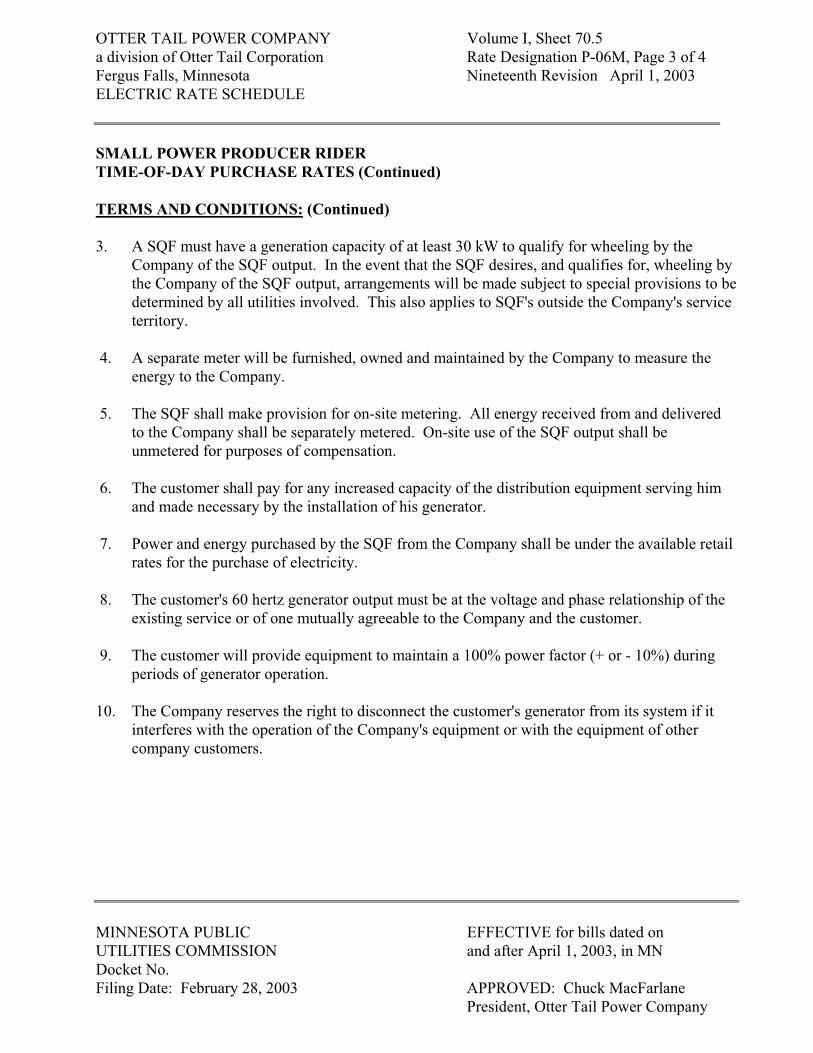
OTTER TAIL POWER COMPANY a division of Otter Tail Corporation Fergus Falls, Minnesota ELECTRIC RATE SCHEDULE
Volume I, Sheet 70.5 Rate Designation P-06M, Page 3 of 4 Nineteenth Revision April 1, 2003
SMALL POWER PRODUCER RIDER
TIME-OF-DAY PURCHASE RATES (Continued)
3. In the event that the SQF desires, and qualifies for, wheeling by
territory.
4.
5. On-site use of the SQF output shall be
6.
7. rates for the purchase of electricity.
8.
9. periods of generator operation.
10.
TERMS AND CONDITIONS: (Continued)
A SQF must have a generation capacity of at least 30 kW to qualify for wheeling by the Company of the SQF output. the Company of the SQF output, arrangements will be made subject to special provisions to be determined by all utilities involved. This also applies to SQF's outside the Company's service
A separate meter will be furnished, owned and maintained by the Company to measure the energy to the Company.
The SQF shall make provision for on-site metering. All energy received from and delivered to the Company shall be separately metered. unmetered for purposes of compensation.
The customer shall pay for any increased capacity of the distribution equipment serving him and made necessary by the installation of his generator.
Power and energy purchased by the SQF from the Company shall be under the available retail
The customer's 60 hertz generator output must be at the voltage and phase relationship of the existing service or of one mutually agreeable to the Company and the customer.
The customer will provide equipment to maintain a 100% power factor (+ or - 10%) during
The Company reserves the right to disconnect the customer's generator from its system if it interferes with the operation of the Company's equipment or with the equipment of other company customers.
MINNESOTA PUBLIC EFFECTIVE for bills dated on UTILITIES COMMISSION and after April 1, 2003, in MN Docket No. Filing Date: February 28, 2003 APPROVED: Chuck MacFarlane
President, Otter Tail Power Company
OTTER TAIL POWER COMPANY a division of Otter Tail Corporation Fergus Falls, Minnesota ELECTRIC RATE SCHEDULE
Volume I, Sheet 70.5 Rate Designation P-06M, Page 4 of 4 Nineteenth Revision April 1, 2003
SMALL POWER PRODUCER RIDER
TIME-OF-DAY PURCHASE RATES (Continued)
11. No
12.
13.
14.
TERMS AND CONDITIONS: (Continued)
Prior to installation, a detailed electrical diagram of the generator and related equipment must be furnished to the Company for its approval for connection to the Company's system. warranties, express or implied, will be made as to the safety or fitness of the said equipment by the Company due to this approval.
The customer shall execute an electric service contract with the Company which may include, among other provisions, a minimum term of service.
Equipment shall be provided by the customer that provides a positive means of preventing feedback to the Company during an outage or interruption of that system.
The customer shall install, own and maintain all equipment deemed necessary by the Company to assure proper parallel operation of the system.
MINNESOTA PUBLIC EFFECTIVE for bills dated on UTILITIES COMMISSION and after April 1, 2003, in MN Docket No. Filing Date: February 28, 2003 APPROVED: Chuck MacFarlane
President, Otter Tail Power Company
Appendix H Interconnection Requirements
H-5. EXAMPLE OF A NET METERING PROGRAM AND TARIFF
Appendix H - 27SECOND EDITION
PSC No: 120 – Electricity Leaf No. 1 New York State Electric and Gas Corporation Revision: 0 Initial Effective Date: December 1, 2003 Superseding Revision:
P.S.C. No. 120 - ELECTRICITY
SUPERSEDING P.S.C. NO. 115
NEW YORK STATE GAS AND ELECTRIC CORPORATION
RULES, REGULATIONS AND GENERAL INFORMATION
SCHEDULE
FOR
ELECTRIC SERVICE
Applicable
In
All territory served by this Corporation and
In all rate schedules except as otherwise
Provided in individual rate schedules
Appendix H-28 SECOND EDITION
PSC No: 120 - Electricity Leaf No. 116 New York State Electric and Gas Corporation Revision: 0 Initial Effective Date: December 1, 2003 Superseding Revision:
GENERAL INFORMATION
22. Farm Waste Electric Generating System Option
Applicable to any customer who owns or operates farm waste electric generating equipment ("Facility"), that generates electric energy from biogas produced by the anaerobic digestion of agricultural wastes with a rated capacity of not more than four hundred kilowatts (400 kW), located and used at his or her "farm operation" as defined in Subdivision 11 of Section 301 of the Agriculture and Markets Law. Such definition states that a "farm operation" means the land and on-farm buildings, equipment, manure processing and handling facilities, and practices which contribute to the production, preparation and marketing of crops, livestock and livestock products as a commercial enterprise, including a "commercial horse boarding operation" as defined in subdivision thirteen of this Section 301 of the Agriculture and Markets Law.
The Facility must be manufactured, installed and operated in accordance with applicable government and industry standards. Such Facility must be connected to NYSEG's electric system and operated in parallel with NYSEG's transmission and distribution facilities. The Facility must be fueled, at a minimum of 90% on an annual basis , by biogas produced from the anaerobic digestion of agricultural waste such as livestock manure materials, crop residues and food processing waste. The Facility must be fueled by biogas generated by anaerobic digestion with at least 75% by weight of its feedstock being livestock manure materials on an annual basis. The customer, at its expense, shall promptly provide to NYSEG all relevant, accurate and complete information, documents, and data, as may be reasonably requested by NYSEG, to enable NYSEG to determine whether the customer is in compliance with these requirements.
The Farm Waste Electric Generating System Option will be available to eligible customers, on a first come, first served basis, until the total rated generating capacity for farm waste electric generating equipment owned or operated by customer-generators in NYSEG's service area is equivalent to 9,912 kW (four-tenths percent of NYSEG's electric demand for the year 1996).
Customers electing service under this Section 22 must operate in compliance with standards and requirements set forth in the Distributed Generation Interconnection Requirements found in PSC 119 - Electricity, Section 9. In addition, customers must execute the NYS Standardized Contract For Interconnection of New Distributed Generation Units With Capacity of 300 kVA or Less, or Farm Waste Generators of 400 kW of Less, to be Operated in Parallel ("SIR Contract"), as contained in PSC 119 - Electricity, Section 9.F.V.
For time-differentiated and demand-billed customers or customers requesting two meters, NYSEG will install (a) an appropriate meter for the customer's service classification to measure the electricity delivered to the customer (the "Billing Meter"), and (b) a non-demand, non-time differentiated meter to measure the electricity generated by the Facility ("Credit Meter"). For each billing period during
Appendix H - 29 SECOND EDITION

the term of the Standard Contract for Farm Waste Electric Generating Systems, NYSEG will determine the billing units (kWh) registered on the Billing Meter (the "Billing Meter Units" or "BMU") for the billing period and the units (kWh) registered on the Credit Meter (the "Credit Meter Units" or "CMU") or the billing period, and NYSEG will compare and net such amounts. If the customer's Billing Meter records delivery on time-differentiated periods (TOU meter), e.g., On-Peak/Off-Peak or Day/Night, this meter arrangement will require the allocation of the CMU to the appropriate Billing Meter time-periods. This allocation will be done according to allocation factors as set forth in a Special Provision provided in each service classification in this Schedule. In lieu of using the Special Provision allocation factors, a customer with a TOU Billing Meter has the option of purchasing, at its expense, a TOU meter as the Credit Meter for the purpose of recording Peak and Off-Peak or Day and Night kWh production for netting against the appropriate Billing Meter time-period kWh usage.
Appendix H-30 SECOND EDITION
PSC No: 120 - Electricity Leaf No. 116 New York State Electric and Gas Corporation Revision: 0 Initial Effective Date: December 1, 2003 Superseding Revision:
GENERAL INFORMATION
22. Farm Waste Electric Generating System Option (Cont’d.)
For any time-differentiated period within the current billing period, if the allocated CMU exceeds the BMU kWhs for the same time-differentiated period (i.e., CMU > BMU), the residual CMU kWhs will be added to a tracking account (the "Credit Account") and carried over to a future billing period. For demand-billed customers, prior to adding residual CMU kWhs to the Credit Account, any residual CMU kWhs will be converted to a dollar value using the applicable tariff per kWh rate and applied as a credit to the current utility bill Customer Charge and Demand Charge. If the dollar value of the residual CMU kWh exceeds the current Customer Charge and Demand Charge, any remaining dollars will be converted back to kWhs and added to the Credit Account and carried over for a future billing period. Likewise, for any time-differentiated period within the current billing period, if the allocated CMU is less than the BMU (i.e., CMU < BMU), then NYSEG will reduce any units in the Credit Account by the BMU residual units. If the BMU residual units exceed the Credit Account, NYSEG will bill the customer for the net of the BMU and CMU units at the customer's applicable tariff rate and the Credit Account will be reset to zero.
Customers taking service under a non-time-differentiated, non-demand-billed meter may choose to have usage and generation measured through one standard, single energy meter. For non-time-differentiated, non-demand-billed customers that choose to have usage and generation measured through one, standard single energy meter, any excess customer generation will be added to a Credit Account and carried over for a future billing period. Similarly, for a non-time-differentiated, non-demand-billed customers that request service under this option using two meters, any excess customer generation will be added to the Credit Account and carried forward to a future billing period for appropriate netting. The Customer Charge is not impacted by any excess amount in the Credit Account.
If, (a) on an annual basis, during the term of the SIR Contract or (b) on the date the SIR Contract is terminated pursuant to the terms and conditions of said Contract, there exists a positive (kWh) balance in the Credit Account, then NYSEG will issue the customer a cash payment. The payment shall be for an amount equal to the product of the positive Credit Account (kWh) balance times NYSEG's average avoided cost for energy over the most recent 12-month period. The balance in the Credit Account shall be reset to zero once NYSEG makes the cash payment. Upon NYSEG's determination that the customer has taken service under this Section 22 while in violation of the conditions of service set forth in General Information Section 22 of this Schedule, the customer shall forfeit any positive balance accrued in its Credit Account during the annual period in which the violation occurred.
Appendix H - 31 SECOND EDITION

In the event that NYSEG determines that it is necessary to install a dedicated transformer or transformers to protect the safety and adequacy of electric service provided to other customers, the customer shall pay NYSEG's actual costs of purchasing and installing such transformer(s) located and used at customer's "farm operation," in an amount not to exceed three thousand dollars ($3,000) per "farm operation."
Appendix H-32 SECOND EDITION
SERVICE CLASSIFICATION NO. 3
APPLICABLE TO THE USE OF SERVICE FOR:
Primary Service for any customer with a demand of 25 kilowatts or more but less than 500 kilowatts.
CHARACTER OF SERVICE:
Continuous - Alternating Current, 60 Cycle; Primary (Distribution) Service at 2,400, 4,160, 4,800, 7,200, 8,320, 12,000, 12,470, 13,200, 34,500(Regulated) Volts; Subtransmission Service at 34,500 or 46,000 (Both Non-Regulated) Volts; or 34,500 (Regulated) Volts for "Grandfathered Customers" only; (see Special Provisions (a)); Single or Three Phase. (Characteristics depend upon available circuits and equipment.)
RATE CHOICES AVAILABLE TO CUSTOMERS:
Pursuant to NYSEG's Electric Rate Plan and Customer Advantage Program, General Information Section 12 of this Schedule, customers served under this Service Classification will choose from four different electric rate choices offered by the Company as described below. NYSEG will offer two Retail Access rate choices and two Non-Retail Access rate choices.
The two Retail Access choices (1 and 2 below) consist of the Competitive Supplier Price (also known as the ESCO Rate Option ["ERO"] in the Electric Rate Plan), and the NYSEG Fixed Price with Supply Credit (also known as the Bundled Rate Option with Retail Access ["BRO w/RAC"] in the Electric Rate Plan). The two Non-Retail Access choices (3 and 4 below) include the NYSEG Fixed Price (also known as the Bundled Rate Option ["BRO"], and the NYSEG Variable Price (also known as the Variable Rate Option ["VRO"]).
NYSEG will provide Delivery Service only for the two Retail Access choices. Commodity Service will
be provided by an Energy Services Company (ESCO).
1. Competitive Supplier Price (ERO)
This Retail Access choice includes a fixed component for NYSEG delivery service, which reflects a credit of $0.002 per kWh, and a fluctuating Transition Charge (Non-Bypassable Wires Charge ["NBWC"]) described in this section. Pursuant to the Electric Rate Plan, the $0.002 per kWh credit will apply unless and until replaced by the Commission in the Unbundling Track, Case No. 00-M-0504.
Appendix H - 33 SECOND EDITION
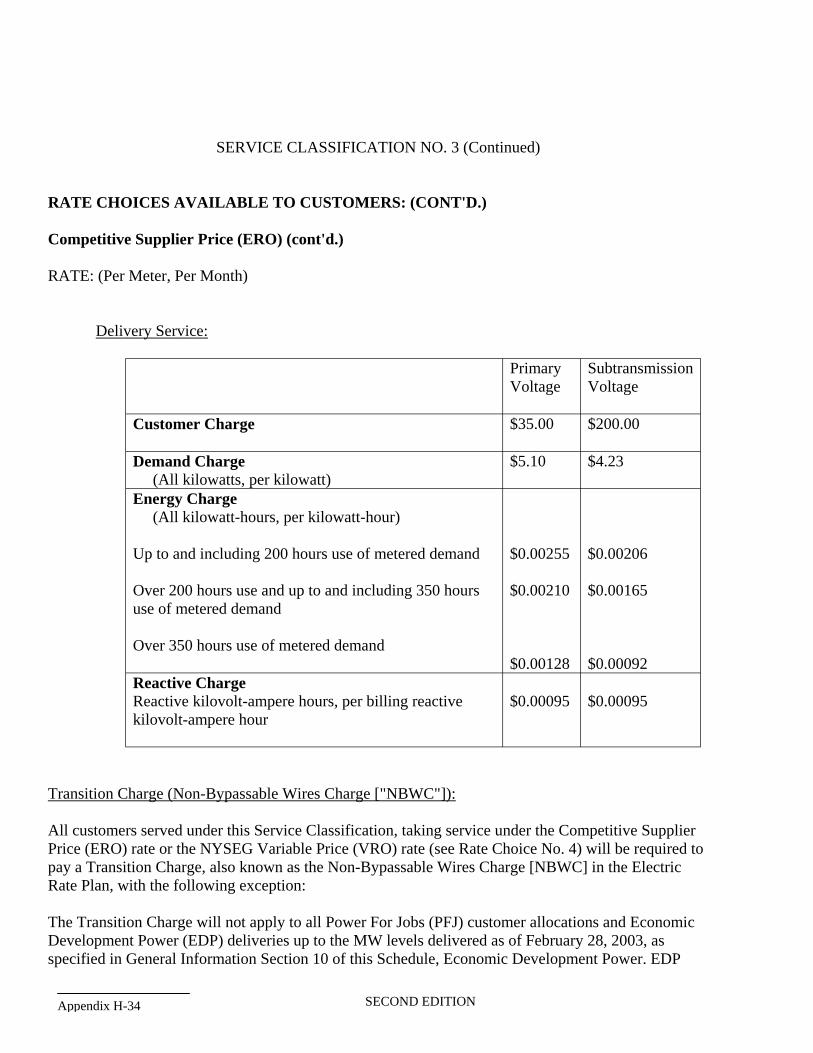
SERVICE CLASSIFICATION NO. 3 (Continued)
RATE CHOICES AVAILABLE TO CUSTOMERS: (CONT'D.)
Competitive Supplier Price (ERO) (cont'd.)
RATE: (Per Meter, Per Month)
Delivery Service:
Primary Subtransmission Voltage Voltage
Customer Charge $35.00 $200.00
Demand Charge $5.10 $4.23 (All kilowatts, per kilowatt)
Energy Charge
(All kilowatt-hours, per kilowatt-hour)
Up to and including 200 hours use of metered demand $0.00255 $0.00206
Over 200 hours use and up to and including 350 hours $0.00210 $0.00165 use of metered demand
Over 350 hours use of metered demand $0.00128 $0.00092
Reactive Charge
Reactive kilovolt-ampere hours, per billing reactive $0.00095 $0.00095 kilovolt-ampere hour
Transition Charge (Non-Bypassable Wires Charge ["NBWC"]):
All customers served under this Service Classification, taking service under the Competitive Supplier Price (ERO) rate or the NYSEG Variable Price (VRO) rate (see Rate Choice No. 4) will be required to pay a Transition Charge, also known as the Non-Bypassable Wires Charge [NBWC] in the Electric Rate Plan, with the following exception:
The Transition Charge will not apply to all Power For Jobs (PFJ) customer allocations and Economic Development Power (EDP) deliveries up to the MW levels delivered as of February 28, 2003, as specified in General Information Section 10 of this Schedule, Economic Development Power. EDP
Appendix H-34 SECOND EDITION
deliveries exceeding the above-referenced February 28, 2003 delivery levels will be delivered at the Competitive Supplier Price (ERO) rate, which is subject to the Transition Charge.
The Transition Charge (NBWC) is a per kilowatt-hour charge calculated by summing the above-market costs and below-market benefits of the Company's existing power purchase obligations. The charge includes the difference between (a) the market value of electricity from NYSEG-owned hydroelectric plants, Non-Utility Generators ("NUGs"), and Nine Mile Point 2, and b) contract payments for that electricity. The Transition Charge (NBWC) also includes costs associated with moving electricity through the transmission and distribution systems and the benefits of existing transmission contracts. Additionally, the Transition Charge (NBWC) includes ancillary service costs as well as NYPA Transmission Access Charges ("NTAC").
For customers taking service under the Competitive Supplier Price (ERO) rate or the NYSEG Variable Price (VRO) rate, the Transition Charge (NBWC) may vary monthly, depending on the market prices of electricity. For such customers whose service is electrically connected East of the NYISO Total East Interface, the Transition Charge (NBWC) will include a credit to reflect the higher cost to serve load in that area.
A Transition Charge (NBWC) Statement setting forth the monthly Transition Charge (NBWC) will be filed with the Public Service Commission on not less than three (3) days' notice from the effective date of the revised charge for the first day of the billing cycle each month. Such statement can be found at the end of this Schedule (PSC 120 - Electricity).
2. NYSEG Fixed Price with Supply Credit (BRO w/RAC)
This Retail Access choice provides a Retail Access Credit ("RAC") applied to the NYSEG Fixed Price Choice ("BRO"). This BRO rate can be found in the description for Rate Choice No. 3, the NYSEG Fixed Price, in this Service Classification. The RAC, further described below, fluctuates with the market price of electricity, and consists of energy, Energy Losses (which include Unaccounted For Energy); Unforced Capacity ("UCAP"), UCAP Losses, UCAP Reserves, and an Additional Component of $0.003 per kWh.
Retail Access Credit (RAC)
The RAC consists of three components:
a) Energy Component: For each day of the customer's billing cycle, a daily average value of market supply is derived from the day ahead NYISO posted Locational Based Marginal Prices (LBMP) of electricity for the region (East or West of the NYISO Total East Interface) in which the customer is located, weighted to reflect hourly usage based on load studies for the calendar month and day-type (Weekday, Saturday or Sunday/Holiday) for Service Classification No. 3. LBMP in Zone C will be used for customers electrically connected West of the Total East NYISO Interface. LBMP in Zone G will be used for customers electrically connected East of the NYISO Total East Interface. The daily load weighted market price of energy will be adjusted to reflect losses and Unaccounted For Energy.
Appendix H - 35 SECOND EDITION
SERVICE CLASSIFICATION NO. 3 (Continued)
RATE CHOICES AVAILABLE TO CUSTOMERS: (CONT'D.)
These daily average market supply values are used in conjunction with the service classification daily load study usage data to develop a weighted average value of market supply for the customer's specific billing period. The weighted average value of market supply is multiplied by the customer's metered kWh usage to determine the value of market supply to be credited to the customer's bill.
monthly capacity auction price.
b) Capacity Component: The RAC also includes a component for the value of Unforced Capacity (UCAP), defined as the market-clearing price of capacity in $/kWh as determined from the NYISO's
The Capacity Component will be revised in accordance with each monthly UCAP auction held by the NYISO. The capacity price will also include UCAP Reserves, and will then be adjusted for UCAP Losses.
c) Additional Component: An additional credit ("Adder") in the amount of $0.003 per kWh.
Large Commercial Farm Customers taking service under this Service Classification who were participating in the Pilot as of March 31, 2001, are eligible to elect an Adder in the amount of $0.004. A Commercial Farm Pilot customer who returns to NYSEG bundled service after March 31, 2001 will not be eligible for this farm Pilot adder if such customer later elects to participate in Retail Access. In that event, such customer will receive an adder of $0.003 per kWh.
NYSEG will provide Delivery and Commodity Service for the two Non-Retail Access choices.
Appendix H-36 SECOND EDITION
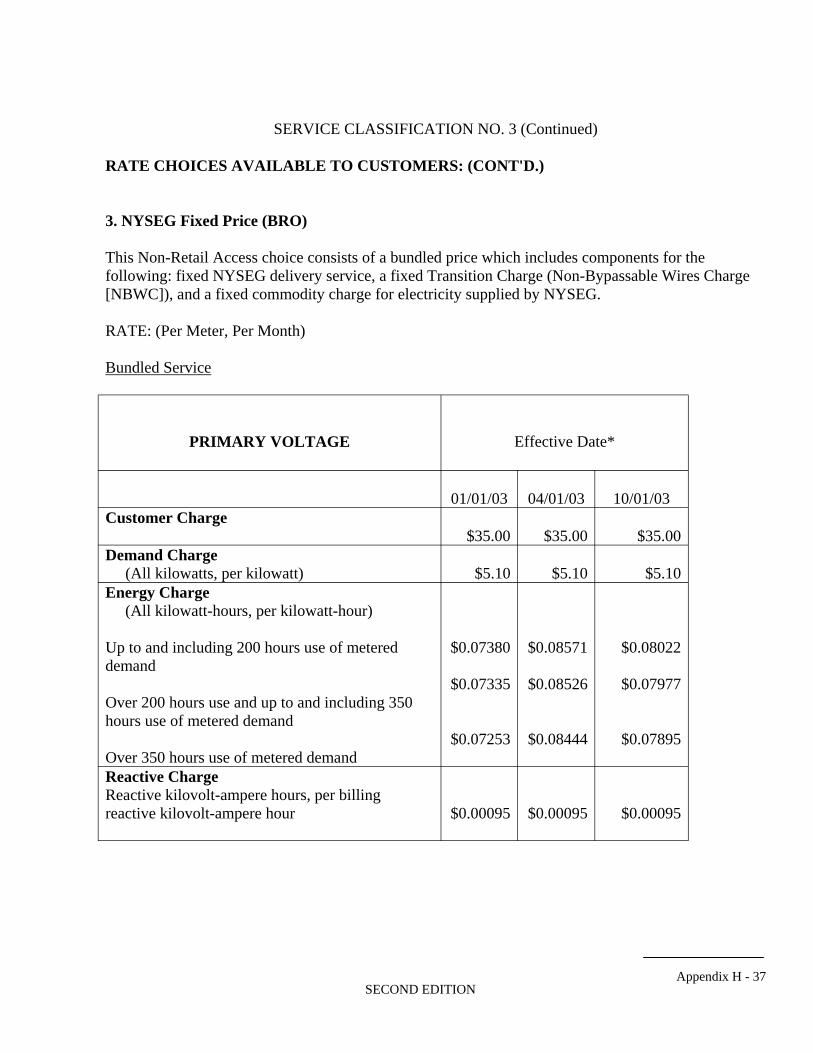
SERVICE CLASSIFICATION NO. 3 (Continued)
RATE CHOICES AVAILABLE TO CUSTOMERS: (CONT'D.)
3. NYSEG Fixed Price (BRO)
This Non-Retail Access choice consists of a bundled price which includes components for the following: fixed NYSEG delivery service, a fixed Transition Charge (Non-Bypassable Wires Charge [NBWC]), and a fixed commodity charge for electricity supplied by NYSEG.
RATE: (Per Meter, Per Month)
Bundled Service
PRIMARY VOLTAGE Effective Date*
01/01/03 04/01/03 10/01/03
Customer Charge
$35.00 $35.00 $35.00
Demand Charge
(All kilowatts, per kilowatt) $5.10 $5.10 $5.10
Energy Charge
(All kilowatt-hours, per kilowatt-hour)
$0.07380 $0.08571 $0.08022
$0.07335 $0.08526 $0.07977 Over 200 hours use and up to and including 350
$0.07253 $0.08444 $0.07895
$0.00095 $0.00095 $0.00095
Up to and including 200 hours use of metered demand
hours use of metered demand
Over 350 hours use of metered demand
Reactive Charge
Reactive kilovolt-ampere hours, per billing reactive kilovolt-ampere hour
Appendix H - 37 SECOND EDITION
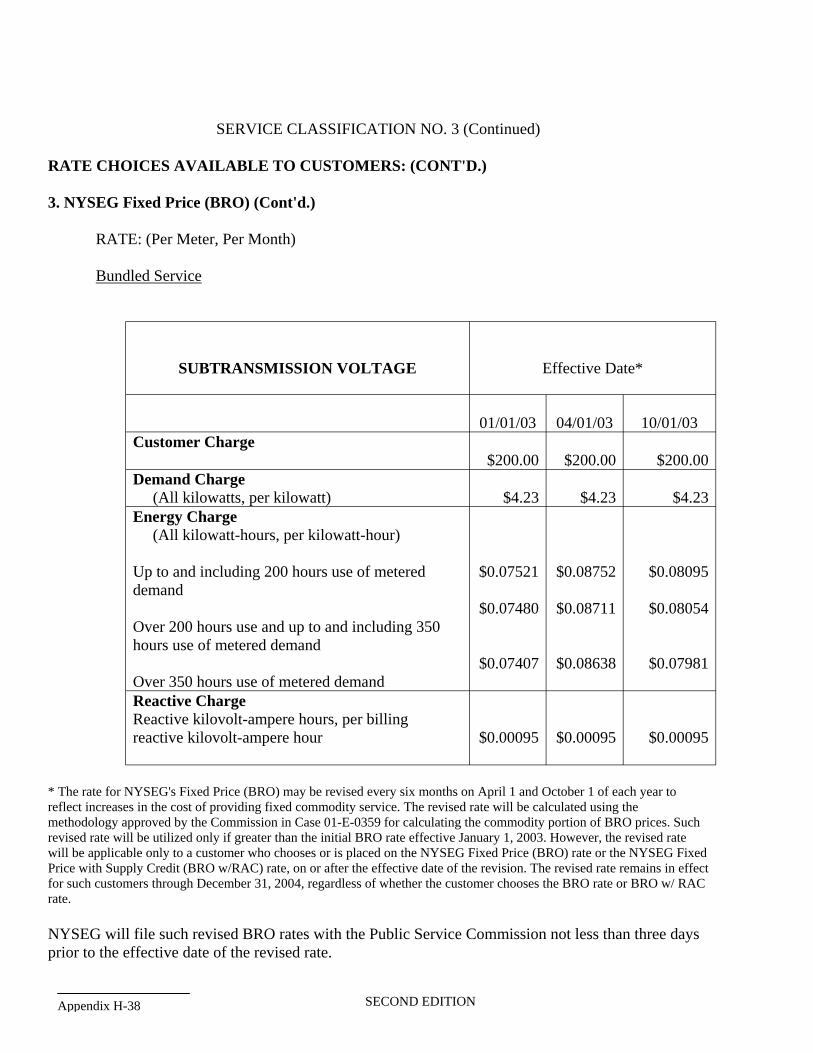
SERVICE CLASSIFICATION NO. 3 (Continued)
RATE CHOICES AVAILABLE TO CUSTOMERS: (CONT'D.)
3. NYSEG Fixed Price (BRO) (Cont'd.)
RATE: (Per Meter, Per Month)
Bundled Service
Effective Date*
01/01/03 04/01/03 10/01/03
Customer Charge
$200.00 $200.00 $200.00
Demand Charge
(All kilowatts, per kilowatt) $4.23 $4.23 $4.23
Energy Charge
(All kilowatt-hours, per kilowatt-hour)
$0.07521 $0.08752 $0.08095
$0.07480 $0.08711 $0.08054 Over 200 hours use and up to and including 350
$0.07407 $0.08638 $0.07981
$0.00095 $0.00095 $0.00095
SUBTRANSMISSION VOLTAGE
Up to and including 200 hours use of metered demand
hours use of metered demand
Over 350 hours use of metered demand
Reactive Charge
Reactive kilovolt-ampere hours, per billing reactive kilovolt-ampere hour
* The rate for NYSEG's Fixed Price (BRO) may be revised every six months on April 1 and October 1 of each year to reflect increases in the cost of providing fixed commodity service. The revised rate will be calculated using the methodology approved by the Commission in Case 01-E-0359 for calculating the commodity portion of BRO prices. Such revised rate will be utilized only if greater than the initial BRO rate effective January 1, 2003. However, the revised rate will be applicable only to a customer who chooses or is placed on the NYSEG Fixed Price (BRO) rate or the NYSEG Fixed Price with Supply Credit (BRO w/RAC) rate, on or after the effective date of the revision. The revised rate remains in effect for such customers through December 31, 2004, regardless of whether the customer chooses the BRO rate or BRO w/ RAC rate.
NYSEG will file such revised BRO rates with the Public Service Commission not less than three days prior to the effective date of the revised rate.
Appendix H-38 SECOND EDITION
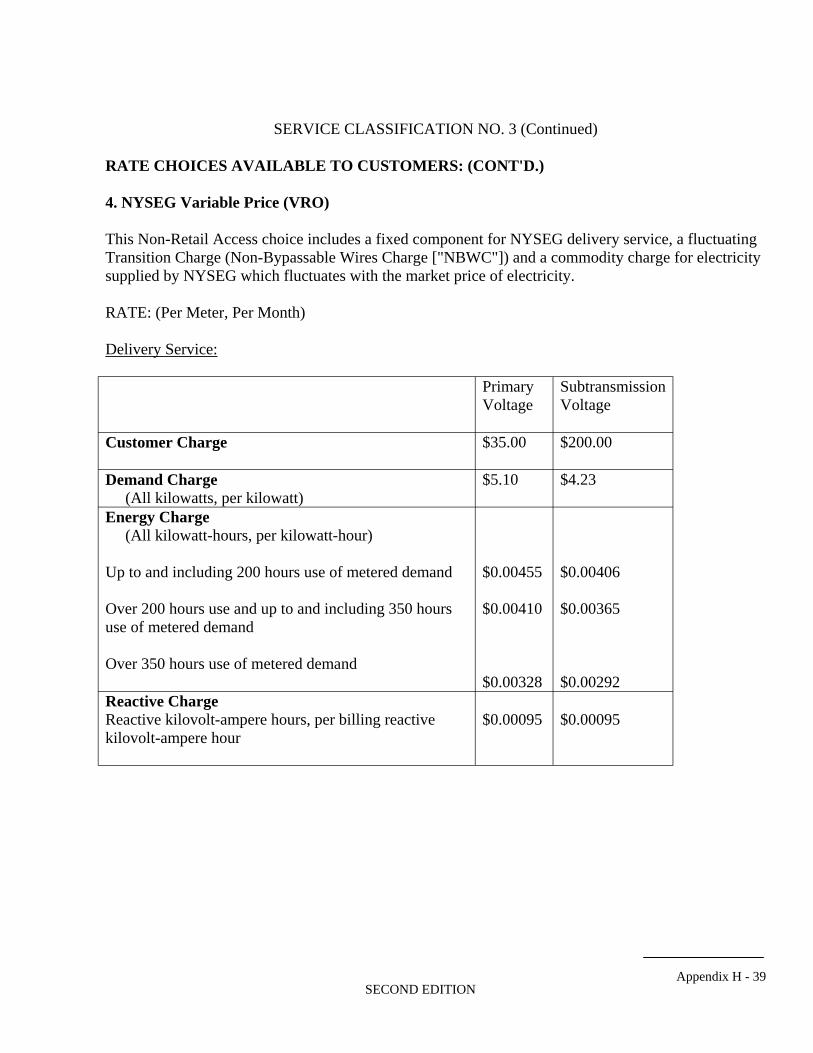
SERVICE CLASSIFICATION NO. 3 (Continued)
RATE CHOICES AVAILABLE TO CUSTOMERS: (CONT'D.)
4. NYSEG Variable Price (VRO)
This Non-Retail Access choice includes a fixed component for NYSEG delivery service, a fluctuating Transition Charge (Non-Bypassable Wires Charge ["NBWC"]) and a commodity charge for electricity supplied by NYSEG which fluctuates with the market price of electricity.
RATE: (Per Meter, Per Month)
Delivery Service:
Primary Subtransmission Voltage Voltage
Customer Charge $35.00 $200.00
Demand Charge $5.10 $4.23 (All kilowatts, per kilowatt)
Energy Charge
(All kilowatt-hours, per kilowatt-hour)
Up to and including 200 hours use of metered demand $0.00455 $0.00406
Over 200 hours use and up to and including 350 hours $0.00410 $0.00365use of metered demand
Over 350 hours use of metered demand $0.00328 $0.00292
Reactive Charge
Reactive kilovolt-ampere hours, per billing reactive $0.00095 $0.00095kilovolt-ampere hour
Appendix H - 39 SECOND EDITION
SERVICE CLASSIFICATION NO. 3 (Continued)
RATE CHOICES AVAILABLE TO CUSTOMERS: (CONT'D.)
Transition Charge (Non-Bypassable Wires Charge ["NBWC"]):
All customers served under this Service Classification, taking service under the NYSEG Variable Price (VRO) rate will be required to pay a Transition Charge (NBWC), as further described under Rate Choice No. 1, Competitive Supplier Price (ERO).
Commodity Service
The charge for Electric Power Supply provided by NYSEG will fluctuate with the market price of electricity and will include the following components: energy, Energy Losses (which include Unaccounted For Energy), Unforced Capacity (UCAP), UCAP Reserves, and UCAP Losses. This charge is determined using the same methodology as described above in this Service Classification under the detailed explanation of the Retail Access Credit (applied to the NYSEG Fixed Price with Supply Credit, Rate Choice No. 2); items "a" (Energy) and "b" (Capacity).
In the event that NYSEG determines that it will incur an estimated gain or loss because purchases for VRO customers were made in the real-time market at prices differing from those in the day-ahead market, NYSEG will credit or recover the full amount of the estimated gain or loss through the nonbypassable wires charge from VRO customers.
MINIMUM CHARGE:
The minimum charge for service under this Service Classification is the Customer Charge as listed above, or as otherwise stated in the applicable special provisions.
The minimum charge for customers who choose to take all or part of their back-up or maintenance service under this service classification rather than under NYSEG's Service Classification No. 11 is described in the "DETERMINATION OF DEMAND" section.
SURCHARGE TO COLLECT SYSTEM BENEFITS CHARGE ("SBC"):
A surcharge of $.0015 per kWh will be added to each Energy Charge on the customers' bills in this Service Classification to collect the System Benefits Charge (as explained in this Schedule, General Information Section 4).
This charge will be effective with usage beginning January 1, 2003.
Appendix H-40 SECOND EDITION
SERVICE CLASSIFICATION NO. 3 (Continued)
RATE CHOICES AVAILABLE TO CUSTOMERS: (CONT'D.)
OMPETITIVE METERING OPTION: Qualified Customers who select the Competitive Metering Option must comply with the requirements specified in PSC 119 - Electricity and specified in General Information Section 14 of this Schedule, and will receive a Competitive Metering Credit as set forth in Section 2 of Addendum-MET of PSC 119, or superseding issues thereof.
METER OWNED BY CUSTOMER, INSTALLED AND MAINTAINED BY THE CORPORATION: Customers electing to own their own meters, as described in Section 3.A.2 of PSC 119 - Electricity, will receive a Meter Ownership Credit as described in Section 3.A.2.a.i of that Schedule. This provision is separate and distinct from Competitive Metering.
Customers participating in Competitive Metering will not receive a Meter Ownership Credit in addition to the existing Competitive Metering Credit provided to such customers.
INCREASE IN RATES AND CHARGES: The rates and charges under this Service Classification, including minimum charges, will be increased by a surcharge pursuant to Section 6 of PSC No. 120 to reflect the tax rates applicable within the municipality where the customer takes service.
DETERMINATION OF DEMAND: The billing demand will be the metered demand, which is the highest average kilowatts used in a fifteen-minute interval during the month.
For subtransmission customers also served by the Corporation under Special Provision F of Service Classification No. 10, the measured demand of the output provided by the customer's generating facility will be added to the measured demand as determined by the Corporation's meter for service under this Classification.
Customers who choose to take all or part of their back-up or maintenance service under this service classification rather than under NYSEG's Service Classification No. 11 will pay a minimum demand charge as described in NYSEG's Service Classification No. 11. Customers will pay a minimum demand charge related to generation, ancillary, and transmission costs. The minimum demand charge is based on a rate per kW of the contract demand and is accumulated over a 12-month period. The accumulated contract demand charge component will be compared to the accumulated demand charge in this service classification. If the contract demand charge is greater than the demand charge in this service classification, then the customer will only pay the contract demand charge in that month. If it is less than the demand charge in this service classification, then the customer will pay that difference in that month.
Appendix H - 41 SECOND EDITION
SERVICE CLASSIFICATION NO. 3 (Continued)
RATE CHOICES AVAILABLE TO CUSTOMERS: (CONT'D.)
DETERMINATION OF REACTIVE KILOVOLT-AMPERE HOURS: Whenever the customer's metered demand is 200 kW or more for two consecutive billing periods, the reactive kilovolt-ampere hours shall thereafter be metered. The billing reactive kilovolt-ampere hours shall be the reactive kilovolt-ampere hours in excess of one-third of the metered kilowatt hours.
TERMS OF PAYMENT: All bills are rendered at the above "unit prices" and that amount is due on bills paid on or before the "past due" date indicated on the bill. A late payment charge at the rate of one and one-half percent (1 1/2%) per month will be billed on all amounts not paid by that date. (Further details in Section 4 of P.S.C. No. 119 - Electricity or superseding issues thereof.)
TERM: One year and thereafter until terminated by 30 days' written notice. However, the Corporation may, with the permission of the Public Service Commission, require the customer to agree to take service at rates from time to time effective for a longer term dependent upon the amount of investment required or other unusual conditions incident to the service.
SPECIAL PROVISIONS:
(a) Primary Discounts: The above subtransmission rates reflect a discount for a customer who furnishes and maintains the necessary substation and purchases energy at 34,500 or 46,000 (both Non-Regulated) Volts.
Customers receiving service prior to February 15, 2000 ("Grandfathered Customers"), will receive the stated Primary Discounts when the customer furnishes and maintains the necessary substation and purchases energy at 34,500 (Regulated).
(b) Balanced Billing: Customers may, by signing an application, be billed monthly in accordance with the plan set forth in Section 4-0 of P.S.C. No. 119 - Electricity or superseding issues thereof.
(c) Submetering: Submetering may be available according to certain conditions as explained in the general information leaves of this schedule, Section 2. Submetering.
Appendix H-42 SECOND EDITION
SERVICE CLASSIFICATION NO. 3 (Continued)
SPECIAL PROVISIONS: (Cont'd)
(d) Economic Incentives: Customer load supplied by the New York Power Authority (NYPA) is not eligible to receive an economic incentive.
(1) Economic Revitalization Incentive: Customers who qualify under the Economic Revitalization Incentive (ERI) in Section 7 of the General Information section of this Schedule shall take service under the applicable NYSEG Fixed Price (BRO) rate, as specified in this Service Classification and Section 12, Customer Advantage Program, of this Schedule, for the qualified incented load.
Such customers will have their service bills reduced, for a term of 36 months, by an incentive rate of $.01 per kilowatt-hour for all qualified kilowatt-hours used thereunder. For two subsequent 12-month phase-out terms, the incentive rate will be multiplied by .66 and .33 for each term, respectively.
(2) Economic Development Incentive: Customers who qualify, under the Economic Development Incentive (EDI) in Section 8 of the General Information section of this Schedule, to receive an incentive for load qualified prior to July 1, 2003 shall take service under the applicable NYSEG Fixed Price (BRO) rate, as specified in this service classification and Section 12, Customer Advantage Program, of this Schedule, for the qualified incented load.
Such customers will have their service bills reduced, for a term of 60 months, by an incentive rate of $.015 per kilowatt-hour for all qualified kilowatt-hours used thereunder.
Customers who qualify, under the Economic Development Incentive (EDI) in Section 8 of the General Information section of this Schedule, to receive an incentive for load qualified on or after July 1, 2003 may select one of the following rate options, as specified in this Service Classification and Section 12, Customer Advantage Program, of this Schedule, for such qualified incented load: 1) NYSEG Fixed Price (BRO), 2) NYSEG Variable Price (VRO), or 3) Competitive Supplier Price (ERO).
Such customers will have their service bills reduced, for a term of 60 months, by an incentive rate per kilowatt-hour for all qualified kilowatt-hours used thereunder. The incentive rate will be the lesser of: a) $.015 or b) the equivalent of the applicable Transition Charge (NBWC), as specified in this Service Classification, less the ancillary service costs and NYPA Transmission Access Charges (NTAC) components of the Transition Charge.
Appendix H - 43 SECOND EDITION
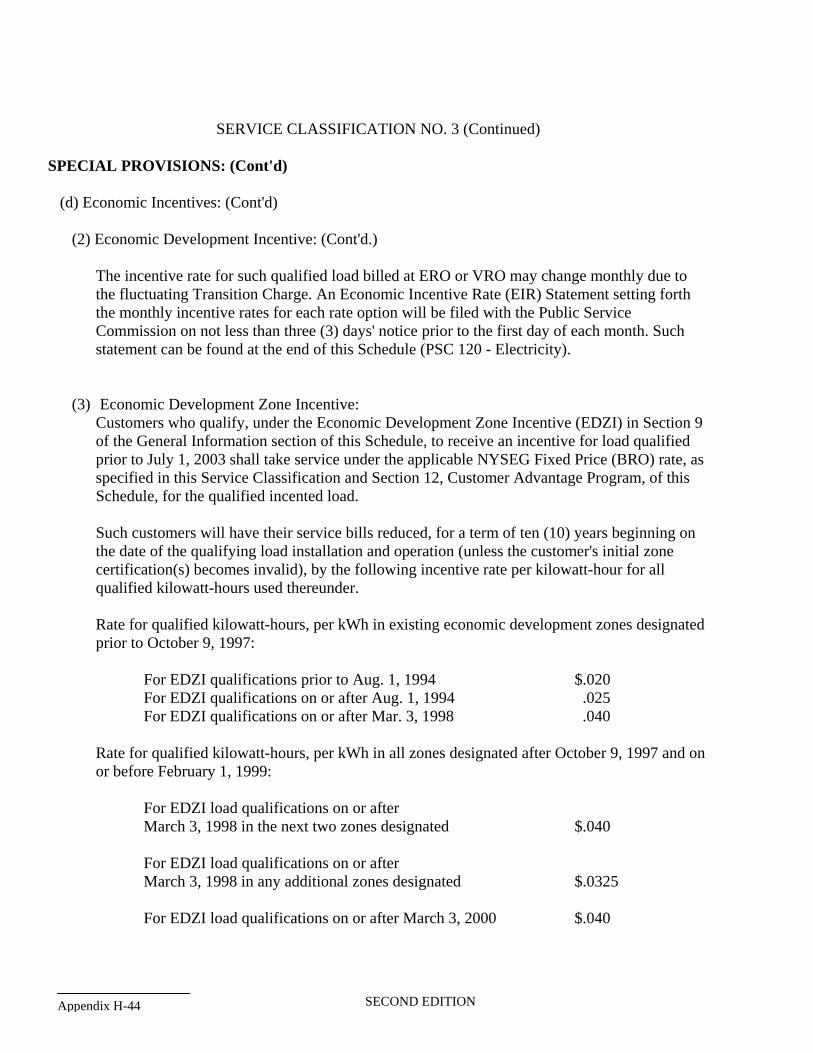
SERVICE CLASSIFICATION NO. 3 (Continued)
SPECIAL PROVISIONS: (Cont'd)
(d) Economic Incentives: (Cont'd)
(2) Economic Development Incentive: (Cont'd.)
The incentive rate for such qualified load billed at ERO or VRO may change monthly due to the fluctuating Transition Charge. An Economic Incentive Rate (EIR) Statement setting forth the monthly incentive rates for each rate option will be filed with the Public Service Commission on not less than three (3) days' notice prior to the first day of each month. Such statement can be found at the end of this Schedule (PSC 120 - Electricity).
(3) Economic Development Zone Incentive: Customers who qualify, under the Economic Development Zone Incentive (EDZI) in Section 9 of the General Information section of this Schedule, to receive an incentive for load qualified prior to July 1, 2003 shall take service under the applicable NYSEG Fixed Price (BRO) rate, as specified in this Service Classification and Section 12, Customer Advantage Program, of this Schedule, for the qualified incented load.
Such customers will have their service bills reduced, for a term of ten (10) years beginning on the date of the qualifying load installation and operation (unless the customer's initial zone certification(s) becomes invalid), by the following incentive rate per kilowatt-hour for all qualified kilowatt-hours used thereunder.
Rate for qualified kilowatt-hours, per kWh in existing economic development zones designated prior to October 9, 1997:
For EDZI qualifications prior to Aug. 1, 1994 $.020 For EDZI qualifications on or after Aug. 1, 1994 .025 For EDZI qualifications on or after Mar. 3, 1998 .040
Rate for qualified kilowatt-hours, per kWh in all zones designated after October 9, 1997 and on or before February 1, 1999:
For EDZI load qualifications on or after March 3, 1998 in the next two zones designated $.040
For EDZI load qualifications on or after March 3, 1998 in any additional zones designated $.0325
For EDZI load qualifications on or after March 3, 2000 $.040
Appendix H-44 SECOND EDITION
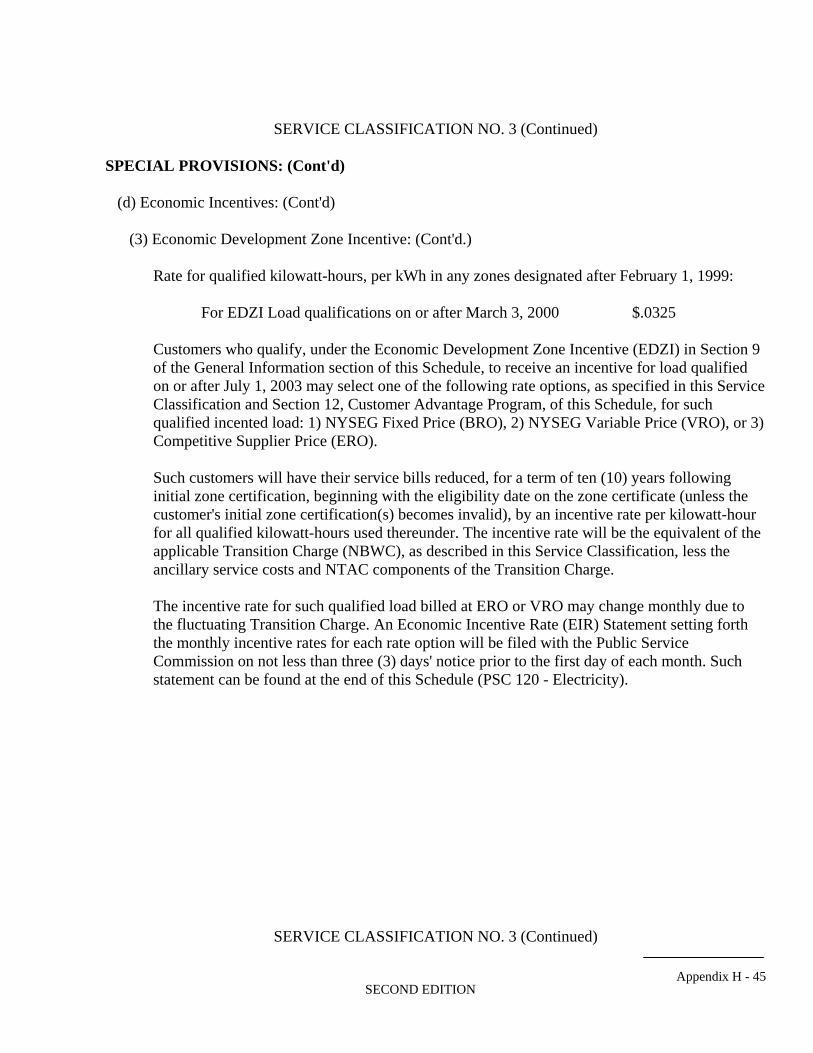
SERVICE CLASSIFICATION NO. 3 (Continued)
SPECIAL PROVISIONS: (Cont'd)
(d) Economic Incentives: (Cont'd)
(3) Economic Development Zone Incentive: (Cont'd.)
Rate for qualified kilowatt-hours, per kWh in any zones designated after February 1, 1999:
For EDZI Load qualifications on or after March 3, 2000 $.0325
Customers who qualify, under the Economic Development Zone Incentive (EDZI) in Section 9 of the General Information section of this Schedule, to receive an incentive for load qualified on or after July 1, 2003 may select one of the following rate options, as specified in this Service Classification and Section 12, Customer Advantage Program, of this Schedule, for such qualified incented load: 1) NYSEG Fixed Price (BRO), 2) NYSEG Variable Price (VRO), or 3) Competitive Supplier Price (ERO).
Such customers will have their service bills reduced, for a term of ten (10) years following initial zone certification, beginning with the eligibility date on the zone certificate (unless the customer's initial zone certification(s) becomes invalid), by an incentive rate per kilowatt-hour for all qualified kilowatt-hours used thereunder. The incentive rate will be the equivalent of the applicable Transition Charge (NBWC), as described in this Service Classification, less the ancillary service costs and NTAC components of the Transition Charge.
The incentive rate for such qualified load billed at ERO or VRO may change monthly due to the fluctuating Transition Charge. An Economic Incentive Rate (EIR) Statement setting forth the monthly incentive rates for each rate option will be filed with the Public Service Commission on not less than three (3) days' notice prior to the first day of each month. Such statement can be found at the end of this Schedule (PSC 120 - Electricity).
SERVICE CLASSIFICATION NO. 3 (Continued)
Appendix H - 45 SECOND EDITION
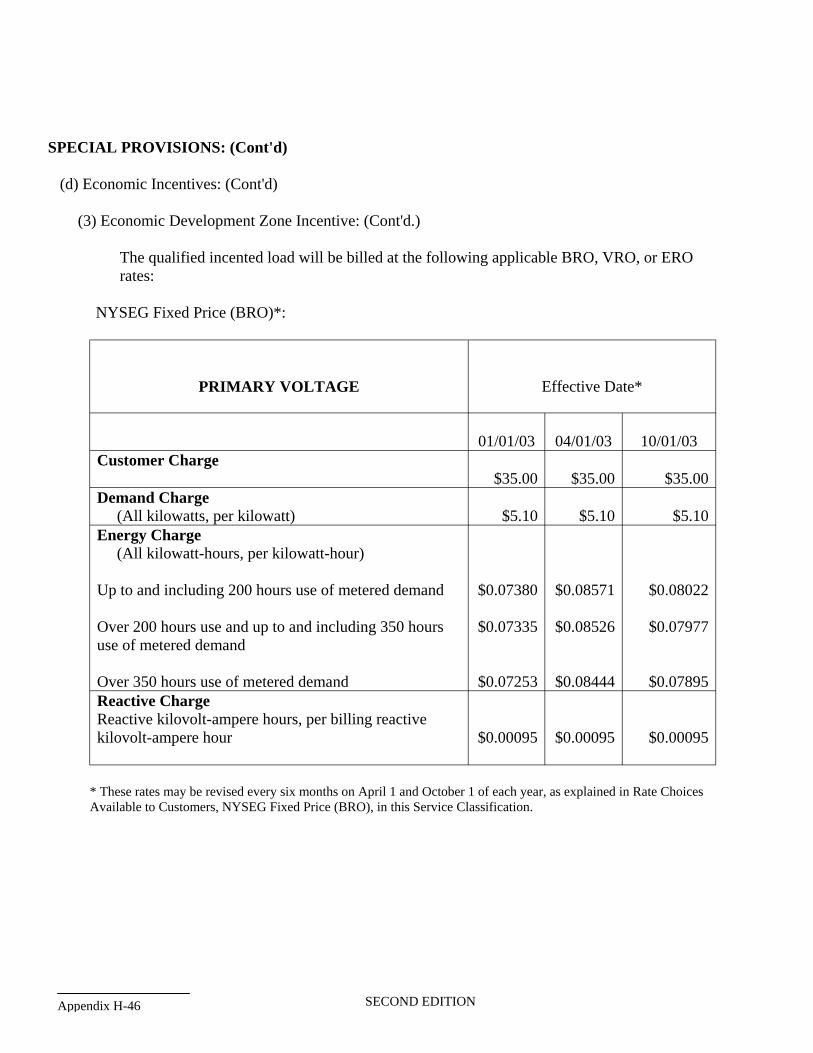
SPECIAL PROVISIONS: (Cont'd)
(d) Economic Incentives: (Cont'd)
(3) Economic Development Zone Incentive: (Cont'd.)
The qualified incented load will be billed at the following applicable BRO, VRO, or ERO rates:
NYSEG Fixed Price (BRO)*:
PRIMARY VOLTAGE Effective Date*
01/01/03 04/01/03 10/01/03
Customer Charge
$35.00 $35.00 $35.00
Demand Charge
(All kilowatts, per kilowatt) $5.10 $5.10 $5.10
Energy Charge
(All kilowatt-hours, per kilowatt-hour)
$0.07380 $0.08571 $0.08022
Over 200 hours use and up to and including 350 hours $0.07335 $0.08526 $0.07977
$0.07253 $0.08444 $0.07895
$0.00095 $0.00095 $0.00095
Up to and including 200 hours use of metered demand
use of metered demand
Over 350 hours use of metered demand
Reactive Charge
Reactive kilovolt-ampere hours, per billing reactive kilovolt-ampere hour
* These rates may be revised every six months on April 1 and October 1 of each year, as explained in Rate Choices Available to Customers, NYSEG Fixed Price (BRO), in this Service Classification.
Appendix H-46 SECOND EDITION
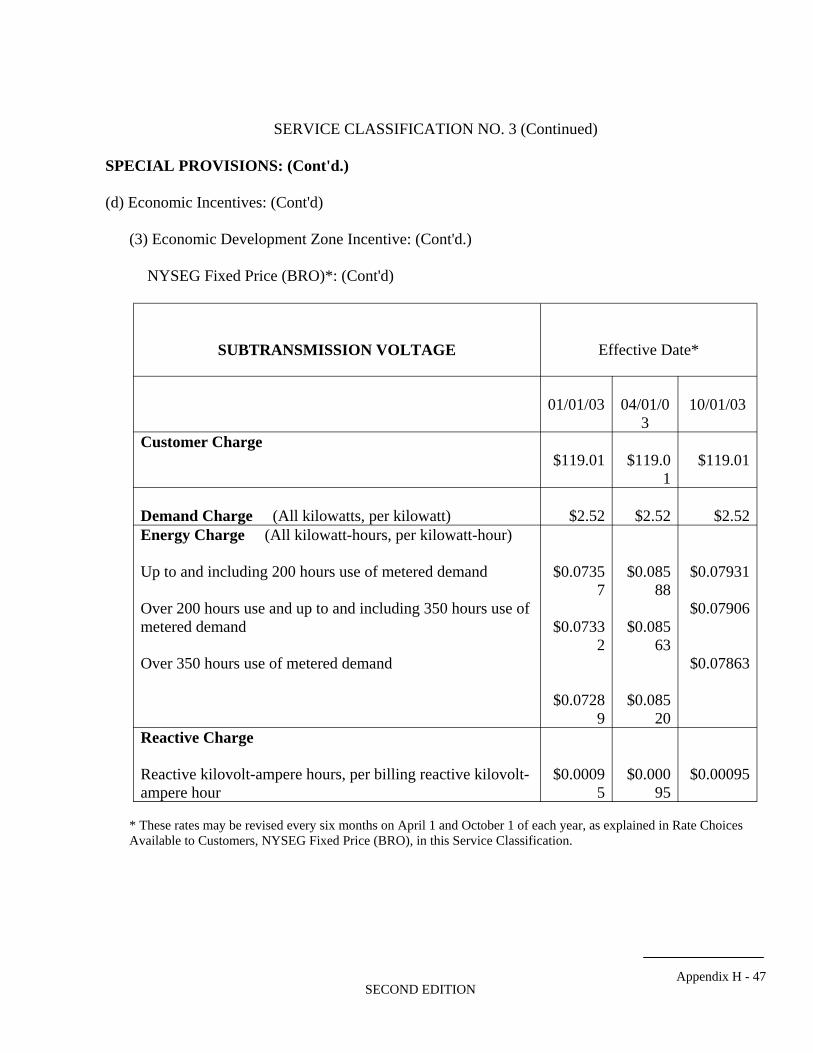
SERVICE CLASSIFICATION NO. 3 (Continued)
SPECIAL PROVISIONS: (Cont'd.)
(d) Economic Incentives: (Cont'd)
(3) Economic Development Zone Incentive: (Cont'd.)
NYSEG Fixed Price (BRO)*: (Cont'd)
Effective Date*
01/01/03 04/01/0 10/01/03 3
Customer Charge
$119.01 $119.0 $119.01 1
Demand Charge (All kilowatts, per kilowatt) $2.52 $2.52 $2.52
Energy Charge
$0.0735 $0.085 $0.07931 7
Over 200 hours use and up to and including 350 hours use of $0.07906 $0.0733 $0.085
2 $0.07863
$0.0728 $0.085 9
$0.0009 $0.000 $0.00095 5
SUBTRANSMISSION VOLTAGE
(All kilowatt-hours, per kilowatt-hour)
Up to and including 200 hours use of metered demand 88
metered demand 63
Over 350 hours use of metered demand
20
Reactive Charge
Reactive kilovolt-ampere hours, per billing reactive kilovolt-ampere hour 95
* These rates may be revised every six months on April 1 and October 1 of each year, as explained in Rate Choices Available to Customers, NYSEG Fixed Price (BRO), in this Service Classification.
Appendix H - 47 SECOND EDITION
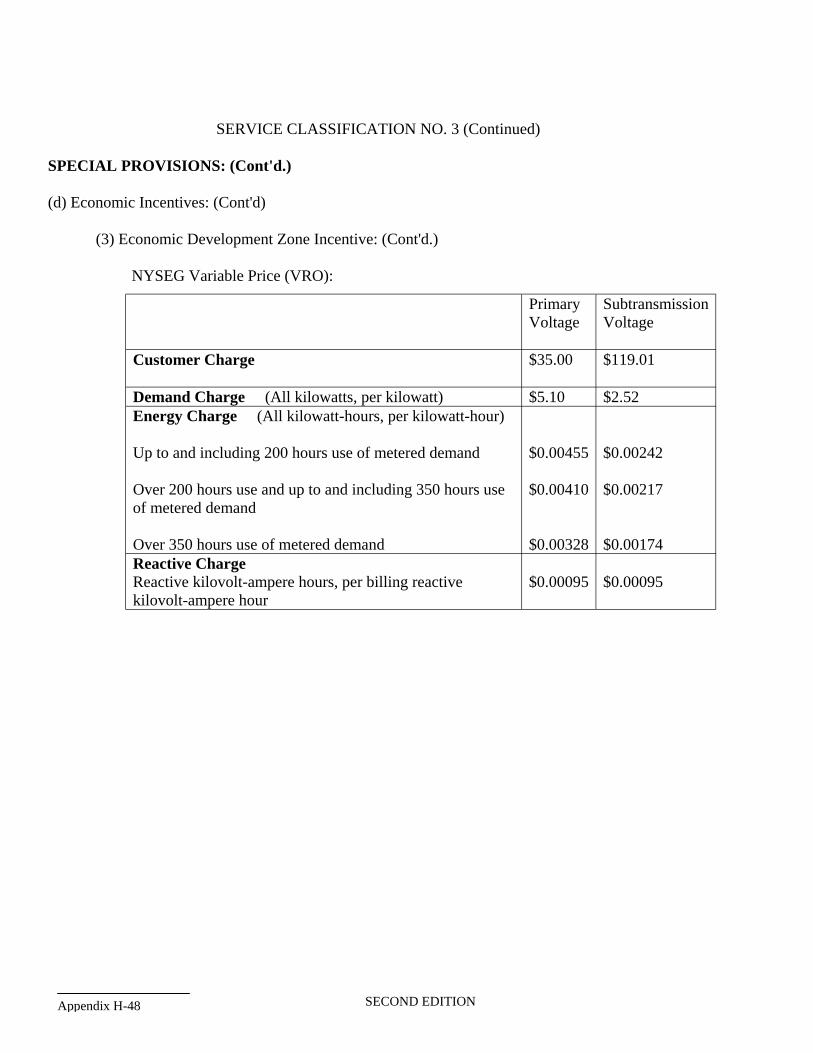
SERVICE CLASSIFICATION NO. 3 (Continued)
SPECIAL PROVISIONS: (Cont'd.)
(d) Economic Incentives: (Cont'd)
(3) Economic Development Zone Incentive: (Cont'd.)
NYSEG Variable Price (VRO):
Primary Subtransmission Voltage Voltage
$35.00 $119.01
Demand Charge (All kilowatts, per kilowatt)
Customer Charge
$5.10 $2.52
Energy Charge (All kilowatt-hours, per kilowatt-hour)
Up to and including 200 hours use of metered demand $0.00455 $0.00242
Over 200 hours use and up to and including 350 hours use $0.00410 $0.00217 of metered demand
Over 350 hours use of metered demand $0.00328 $0.00174
Reactive Charge
Reactive kilovolt-ampere hours, per billing reactive $0.00095 $0.00095 kilovolt-ampere hour
Appendix H-48 SECOND EDITION
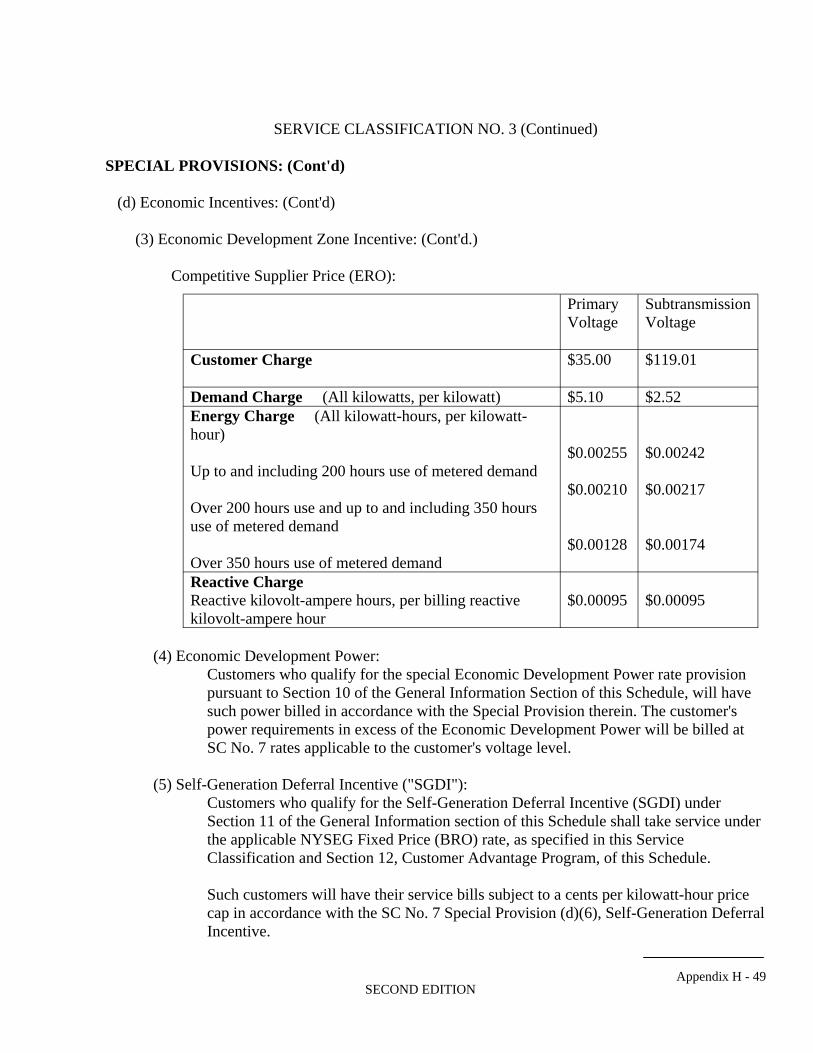
SERVICE CLASSIFICATION NO. 3 (Continued)
SPECIAL PROVISIONS: (Cont'd)
(d) Economic Incentives: (Cont'd)
(3) Economic Development Zone Incentive: (Cont'd.)
Competitive Supplier Price (ERO):
Primary Subtransmission Voltage Voltage
Customer Charge $35.00 $119.01
Demand Charge (All kilowatts, per kilowatt) $5.10 $2.52
Energy Charge (All kilowatt-hours, per kilowatt-hour)
$0.00255 $0.00242 Up to and including 200 hours use of metered demand
$0.00210 $0.00217 Over 200 hours use and up to and including 350 hours use of metered demand
$0.00128 $0.00174 Over 350 hours use of metered demand
Reactive Charge
Reactive kilovolt-ampere hours, per billing reactive $0.00095 $0.00095 kilovolt-ampere hour
(4) Economic Development Power: Customers who qualify for the special Economic Development Power rate provision pursuant to Section 10 of the General Information Section of this Schedule, will have such power billed in accordance with the Special Provision therein. The customer's power requirements in excess of the Economic Development Power will be billed at SC No. 7 rates applicable to the customer's voltage level.
(5) Self-Generation Deferral Incentive ("SGDI"): Customers who qualify for the Self-Generation Deferral Incentive (SGDI) under Section 11 of the General Information section of this Schedule shall take service under the applicable NYSEG Fixed Price (BRO) rate, as specified in this Service Classification and Section 12, Customer Advantage Program, of this Schedule.
Such customers will have their service bills subject to a cents per kilowatt-hour price cap in accordance with the SC No. 7 Special Provision (d)(6), Self-Generation Deferral Incentive.
Appendix H - 49 SECOND EDITION
SERVICE CLASSIFICATION NO. 3 (Continued)
SPECIAL PROVISIONS: (Cont'd.)
(d) Economic Incentives: (Cont'd)
(6) Incubator Development Incentive ("IDI"): Customers who qualify under the Incubator Development Incentive (IDI) in Section 13 of the General Information section of this Schedule prior to July 1, 2003 shall take service under the applicable NYSEG Fixed Price (BRO) rate, as specified in this Service Classification and Section 12, Customer Advantage Program, of this Schedule, for the qualified incented load.
Such customers will have their service bills reduced by an incentive rate of $.025 per kilowatt-hour for all qualified kilowatt hours thereunder.
Customers who qualify under the Incubator Development Incentive (IDI) in Section 13 of the General Information section of this Schedule on or after July 1, 2003 may select the applicable NYSEG Fixed Price (BRO) or the NYSEG Fixed Price with Supply Credit (BRO w/RAC) for the qualified incented load.
Such customers will have their service bills reduced by an incentive rate of $.0186 per kilowatt-hour for all qualified kilowatt-hours used thereunder.
Effective January 1, 2005, this incentive rate will be revised to be equivalent to the applicable Transition Charge, less the ancillary service costs and NTAC components, associated with the NYSEG Fixed Price (BRO) rates established for the second commodity offering period, per the Company's Electric Rate Plan.
Under the BRO w/RAC, the market-based backout will not include the Additional Component as described in this Service Classification and General Information Section 16.D., General Retail Access, of this Schedule.
(7) Business Retention Incentive: This provision expired on March 2, 2003. Any customers who were receiving the BRI discount as of that date may transition to the Economic Revitalization Incentive (ERI), as described in General Information Section 7 of this Schedule, for the remainder of their five-year term.
Appendix H-50 SECOND EDITION
SERVICE CLASSIFICATION NO. 3 (Continued)
SPECIAL PROVISIONS: (Cont'd.)
(d) Economic Incentives: (Cont'd)
The transition will be based on the start date of their BRI discount, and the following incentive rate reductions will apply:
• A customer in the first, second, or third year of BRI would receive the full ERI reduction for those years.
• A customer in the fourth year of BRI would receive the ERI reduction multiplied by a factor of .66 for that year.
• A customer in the fifth (and final) year of BRI would receive the ERI reduction multiplied by a factor of .33 for that year.
(8) Small Business Growth Incentive ("SBGI"): Customers who qualify under the Small Business Growth Incentive (SBGI) in Section 19 of the General Information section of this Schedule shall take service under the applicable NYSEG Fixed Price (BRO) rate, as specified in this Service Classification and Section 12, Customer Advantage Program, of this Schedule, for the qualified incented load.
Customers who are qualified for such SBGI prior to July 1, 2003 will have their service bills reduced by an incentive rate of $.030 per kilowatt-hour, for all qualified kilowatt-hours used thereunder, through December 31, 2003.
Beginning January 1, 2004, the incentive rate will be revised annually, calculated based on the Transition Charge associated with the NYSEG Fixed Price (BRO) rates. Effective January 1, 2004, the incentive rate per kWh for qualified kWhs will be $.0281. Annual incentive rates thereafter will be determined in conjunction with the BRO rates for the second commodity offering period, pursuant to the Company's Electric Rate Plan.
Customers who are qualified for such SBGI on or after July 1, 2003 will have their service bills reduced by an incentive rate of $.0225 per kilowatt-hour for all qualified kilowatt-hours used thereunder.
Effective January 1, 2005, the incentive rate will be revised to be equivalent to the applicable Transition Charge associated with the NYSEG Fixed Price (BRO) rates established for the second commodity offering period, per the Company's Electric Rate Plan.
Appendix H - 51 SECOND EDITION
SERVICE CLASSIFICATION NO. 3 (Continued)
SPECIAL PROVISIONS: (Cont'd.)
(e) Controlled Load Time-of-Use Service Option: Customers who have a total connected load of at least 25 kW, with at least 12.5 kW of that load being newly installed controlled equipment, may choose to take their entire service under Service Classification No. 7 with Time-of-Use metering. Controlled Load equipment will include, but not be limited to, Electric Thermal Storage equipment (E.T.S.), Air Conditioning equipment, Water Heating or other Heating/Cooling installations which are designed to operate advantageously during off-peak hours as defined in Service Classification No. 7.
(f) RESERVED FOR FUTURE USE
(g) RESERVED FOR FUTURE USE
(h) Industrial/High Load Factor ("I/HLF") Rate Provision: (1) Available to a customer's account that meets usage eligibility as defined in (2) or (3) of
this section: Customers who are taking service under NYSEG's Economic Development Incentive, Economic Development Zone Incentive, New York Power Authority (NYPA) programs (Expansion Power, Economic Development Power, and Power For Jobs) or S.C. 14 may take service under this rate provision, only for that portion of their load served at NYSEG's standard tariff rate, provided that the non-discounted load meets the eligibility requirements of this special provision. Allocation of billing units (kW, kWh, rkvah) for partial load is explained in (3) of this section.
Recipients of other NYSEG incentive rates applicable to their entire load, may qualify for this special provision by relinquishing eligibility under the incentive, provided that they meet the eligibility requirements of this special provision.
Any customer taking service under the Economic Revitalization Incentive and, choosing instead to take service under this Rate Provision, must have met or agrees to continue to meet its Economic Revitalization commitments.
(2) Eligibility: Eligibility will be determined based on the total metered demand and energy excluding the NYPA portion of that metered amount. (i) Industrial Rate Provision:
Not applicable to customers in this service classification. Customers with average annual demands in excess of 500 kW, are served under S.C. No. 7.
Appendix H-52 SECOND EDITION
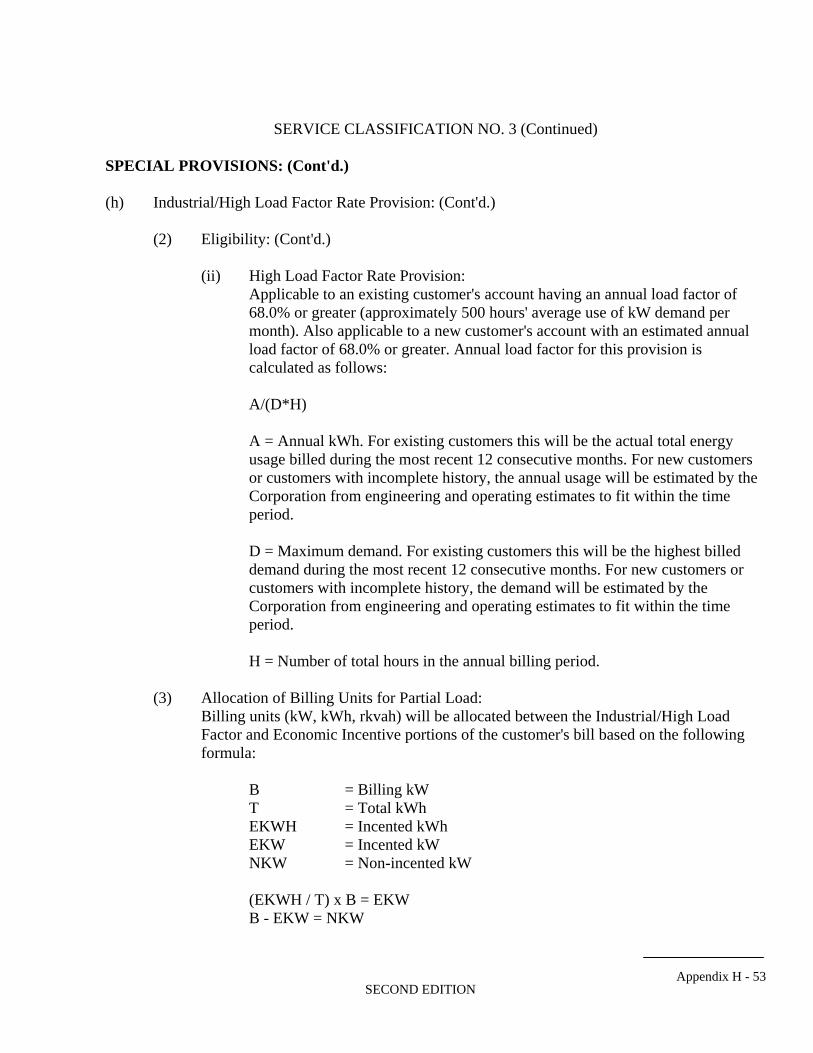
SERVICE CLASSIFICATION NO. 3 (Continued)
SPECIAL PROVISIONS: (Cont'd.)
(h) Industrial/High Load Factor Rate Provision: (Cont'd.)
(2) Eligibility: (Cont'd.)
(ii) High Load Factor Rate Provision: Applicable to an existing customer's account having an annual load factor of 68.0% or greater (approximately 500 hours' average use of kW demand per month). Also applicable to a new customer's account with an estimated annual load factor of 68.0% or greater. Annual load factor for this provision is calculated as follows:
A/(D*H)
A = Annual kWh. For existing customers this will be the actual total energy usage billed during the most recent 12 consecutive months. For new customers or customers with incomplete history, the annual usage will be estimated by the Corporation from engineering and operating estimates to fit within the time period.
D = Maximum demand. For existing customers this will be the highest billed demand during the most recent 12 consecutive months. For new customers or customers with incomplete history, the demand will be estimated by the Corporation from engineering and operating estimates to fit within the time period.
H = Number of total hours in the annual billing period.
(3) Allocation of Billing Units for Partial Load: Billing units (kW, kWh, rkvah) will be allocated between the Industrial/High Load Factor and Economic Incentive portions of the customer's bill based on the following formula:
B = Billing kW T = Total kWh EKWH = Incented kWh EKW = Incented kWNKW = Non-incented kW
(EKWH / T) x B = EKW B - EKW = NKW
Appendix H - 53 SECOND EDITION
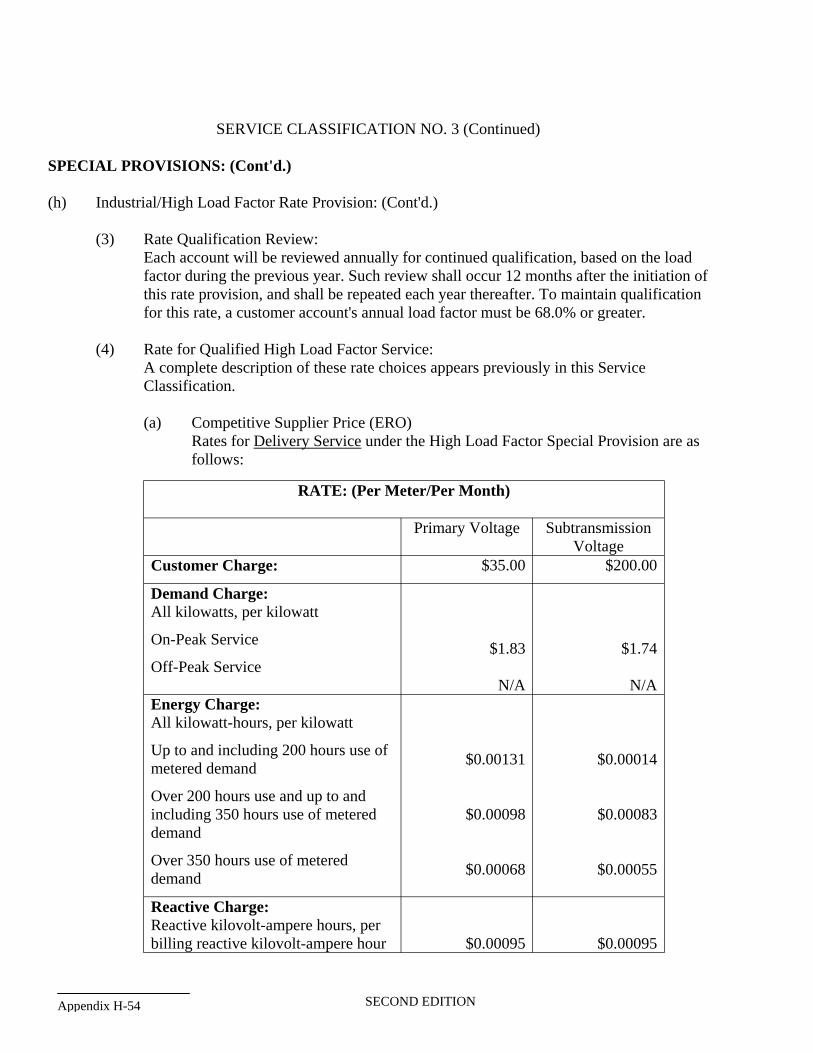
SERVICE CLASSIFICATION NO. 3 (Continued)
SPECIAL PROVISIONS: (Cont'd.)
(h) Industrial/High Load Factor Rate Provision: (Cont'd.)
(3) Rate Qualification Review: Each account will be reviewed annually for continued qualification, based on the load factor during the previous year. Such review shall occur 12 months after the initiation of this rate provision, and shall be repeated each year thereafter. To maintain qualification for this rate, a customer account's annual load factor must be 68.0% or greater.
(4) Rate for Qualified High Load Factor Service: A complete description of these rate choices appears previously in this Service Classification.
(a) Competitive Supplier Price (ERO) Rates for Delivery Service under the High Load Factor Special Provision are as follows:
RATE: (Per Meter/Per Month)
Primary Voltage Subtransmission Voltage
$35.00 $200.00Customer Charge:
Demand Charge:
All kilowatts, per kilowatt
On-Peak Service $1.83 $1.74
Off-Peak Service N/A N/A
Energy Charge:
All kilowatt-hours, per kilowatt
Up to and including 200 hours use of $0.00131 $0.00014
metered demand
Over 200 hours use and up to and including 350 hours use of metered $0.00098 $0.00083 demand
Over 350 hours use of metered $0.00068 $0.00055
demand
Reactive Charge:
Reactive kilovolt-ampere hours, per billing reactive kilovolt-ampere hour $0.00095 $0.00095
Appendix H-54 SECOND EDITION
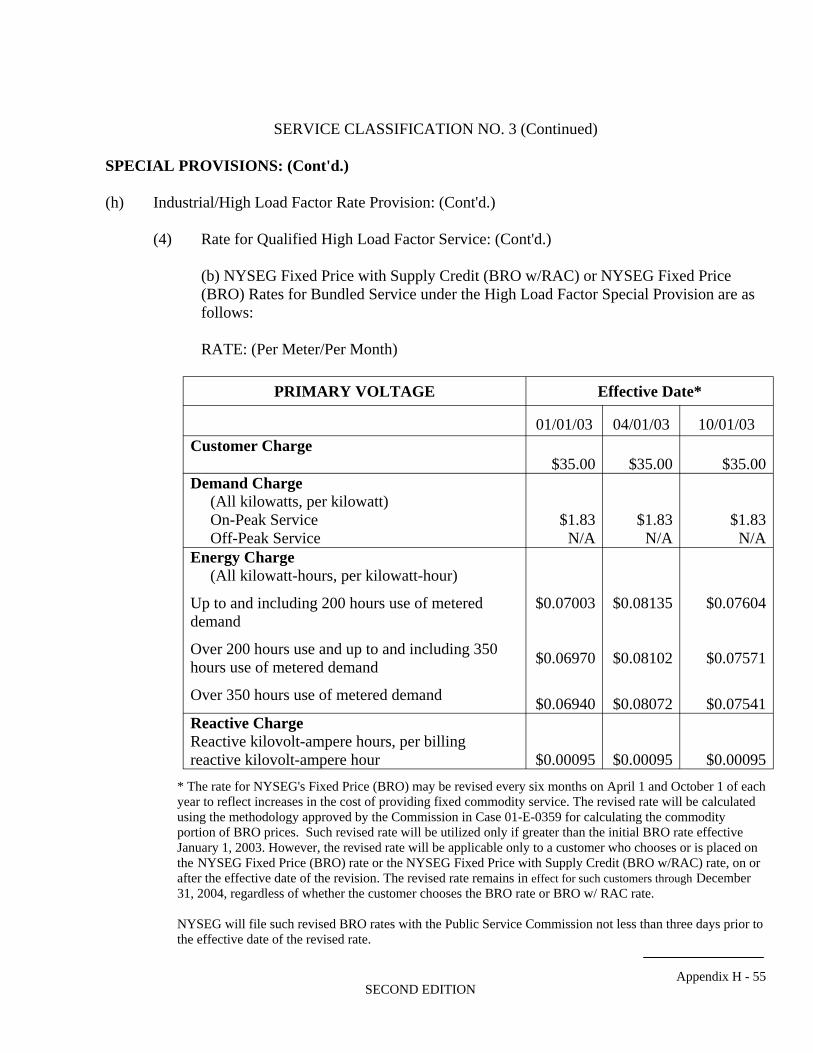
SERVICE CLASSIFICATION NO. 3 (Continued)
SPECIAL PROVISIONS: (Cont'd.)
(h) Industrial/High Load Factor Rate Provision: (Cont'd.)
(4) Rate for Qualified High Load Factor Service: (Cont'd.)
(b) NYSEG Fixed Price with Supply Credit (BRO w/RAC) or NYSEG Fixed Price (BRO) Rates for Bundled Service under the High Load Factor Special Provision are as follows:
RATE: (Per Meter/Per Month)
PRIMARY VOLTAGE Effective Date*
01/01/03 04/01/03 10/01/03
Customer Charge
$35.00 $35.00 $35.00
Demand Charge
(All kilowatts, per kilowatt) On-Peak Service $1.83 $1.83 $1.83Off-Peak Service N/A N/A N/A
Energy Charge
(All kilowatt-hours, per kilowatt-hour)
Up to and including 200 hours use of metered $0.07003 $0.08135 $0.07604 demand
Over 200 hours use and up to and including 350 $0.06970 $0.08102 $0.07571
hours use of metered demand
Over 350 hours use of metered demand $0.06940 $0.08072 $0.07541
Reactive Charge
Reactive kilovolt-ampere hours, per billing reactive kilovolt-ampere hour $0.00095 $0.00095 $0.00095
* The rate for NYSEG's Fixed Price (BRO) may be revised every six months on April 1 and October 1 of each year to reflect increases in the cost of providing fixed commodity service. The revised rate will be calculated using the methodology approved by the Commission in Case 01-E-0359 for calculating the commodity portion of BRO prices. Such revised rate will be utilized only if greater than the initial BRO rate effective January 1, 2003. However, the revised rate will be applicable only to a customer who chooses or is placed on the NYSEG Fixed Price (BRO) rate or the NYSEG Fixed Price with Supply Credit (BRO w/RAC) rate, on or after the effective date of the revision. The revised rate remains in effect for such customers through December 31, 2004, regardless of whether the customer chooses the BRO rate or BRO w/ RAC rate.
NYSEG will file such revised BRO rates with the Public Service Commission not less than three days prior to the effective date of the revised rate.
Appendix H - 55 SECOND EDITION
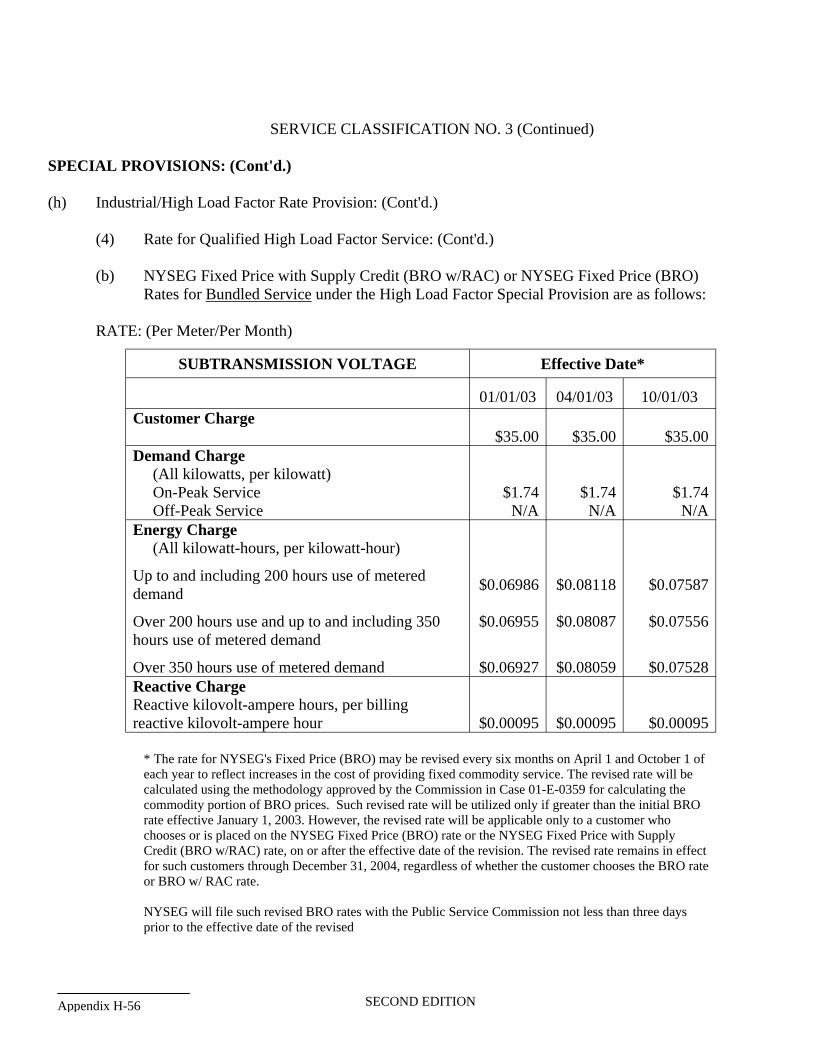
SERVICE CLASSIFICATION NO. 3 (Continued)
SPECIAL PROVISIONS: (Cont'd.)
(h) Industrial/High Load Factor Rate Provision: (Cont'd.)
(4) Rate for Qualified High Load Factor Service: (Cont'd.)
(b) NYSEG Fixed Price with Supply Credit (BRO w/RAC) or NYSEG Fixed Price (BRO) Rates for Bundled Service under the High Load Factor Special Provision are as follows:
RATE: (Per Meter/Per Month)
SUBTRANSMISSION VOLTAGE Effective Date*
01/01/03 04/01/03 10/01/03
Customer Charge
$35.00 $35.00 $35.00
Demand Charge
(All kilowatts, per kilowatt) On-Peak Service $1.74 $1.74 $1.74Off-Peak Service N/A N/A N/A
Energy Charge
(All kilowatt-hours, per kilowatt-hour)
Up to and including 200 hours use of metered $0.06986 $0.08118 $0.07587
demand
Over 200 hours use and up to and including 350 $0.06955 $0.08087 $0.07556 hours use of metered demand
Over 350 hours use of metered demand $0.06927 $0.08059 $0.07528
Reactive Charge
Reactive kilovolt-ampere hours, per billing reactive kilovolt-ampere hour $0.00095 $0.00095 $0.00095
* The rate for NYSEG's Fixed Price (BRO) may be revised every six months on April 1 and October 1 of each year to reflect increases in the cost of providing fixed commodity service. The revised rate will be calculated using the methodology approved by the Commission in Case 01-E-0359 for calculating the commodity portion of BRO prices. Such revised rate will be utilized only if greater than the initial BRO rate effective January 1, 2003. However, the revised rate will be applicable only to a customer who chooses or is placed on the NYSEG Fixed Price (BRO) rate or the NYSEG Fixed Price with Supply Credit (BRO w/RAC) rate, on or after the effective date of the revision. The revised rate remains in effect for such customers through December 31, 2004, regardless of whether the customer chooses the BRO rate or BRO w/ RAC rate.
NYSEG will file such revised BRO rates with the Public Service Commission not less than three days prior to the effective date of the revised
Appendix H-56 SECOND EDITION
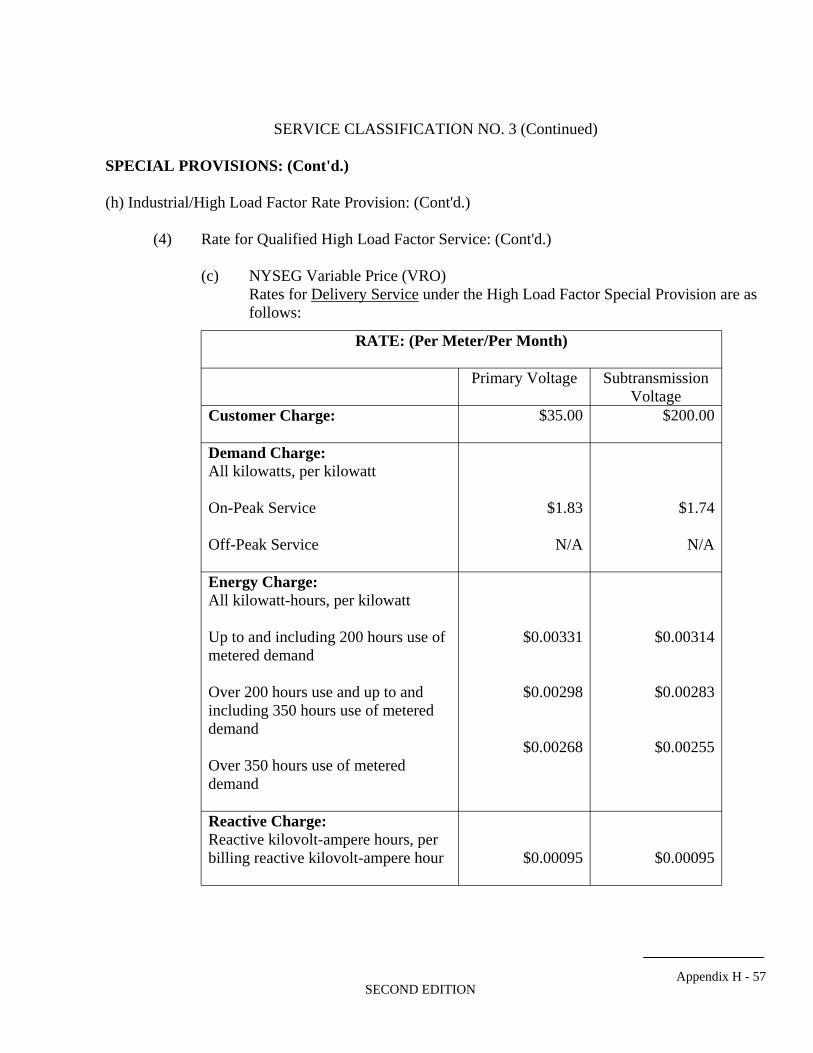
SERVICE CLASSIFICATION NO. 3 (Continued)
SPECIAL PROVISIONS: (Cont'd.)
(h) Industrial/High Load Factor Rate Provision: (Cont'd.)
(4) Rate for Qualified High Load Factor Service: (Cont'd.)
(c) NYSEG Variable Price (VRO) Rates for Delivery Service under the High Load Factor Special Provision are as follows:
RATE: (Per Meter/Per Month)
Primary Voltage Subtransmission Voltage
$35.00 $200.00Customer Charge:
Demand Charge:
All kilowatts, per kilowatt
On-Peak Service $1.83 $1.74
Off-Peak Service N/A N/A
Energy Charge:
All kilowatt-hours, per kilowatt
Up to and including 200 hours use of $0.00331 $0.00314 metered demand
Over 200 hours use and up to and $0.00298 $0.00283 including 350 hours use of metered demand
$0.00268 $0.00255 Over 350 hours use of metered demand
Reactive Charge:
Reactive kilovolt-ampere hours, per billing reactive kilovolt-ampere hour $0.00095 $0.00095
Appendix H - 57 SECOND EDITION
SERVICE CLASSIFICATION NO. 3 (Continued)
SPECIAL PROVISIONS: (Cont'd.)
(h) Industrial/High Load Factor Rate Provision: (Cont'd.)
(4) Rate for Qualified High Load Factor Service (Per Month) (Cont'd.)
Primary Discounts: The above subtransmission rates reflect a discount for a customer who furnishes and maintains the necessary substation and purchases energy at 34,500 or 46,000 (both Non-Regulated) volts. Customers receiving service prior to February 15, 2000 ("Grandfathered Customer"), will receive the stated Primary Discounts when the customer furnishes and maintains the necessary substation and purchases energy at 34,500 (Regulated).
(i) Real Time Pricing ("RTP") Provision:
REAL TIME PRICING: This RTP provision will provide customers with an opportunity to develop load management programs to better respond to high hourly market prices and take advantage of low hourly market prices. The program will provide experience with interval metering and billing solutions. Customers will be encouraged to modify operations to reduce usage during high priced periods or to shift usage to take advantage of the lower energy costs during certain hours.
ELIGIBILITY: The Company will solicit commercial, industrial and public authority customers who have the ability to shift loads and benefit from hourly pricing. To participate, customers may not have other incentives, receive NYPA power or participate in retail access. This program is available to customers with load capped at 25 MW in the aggregate. Eligible customers may enroll on a first-come, first served basis. To be eligible, customers must choose the NYSEG Variable Price (VRO) rate option, a complete description of which appears previously in this Service Classification, and in Section 12 of this Schedule, Customer Advantage Program.
ADDITIONAL REQUIREMENTS AND METERING: Customers shall install all necessary equipment, including, but not limited to, interval metering and required telephone lines. Such metering will be installed, controlled, operated and maintained by the Company at the customer's expense. The Company will provide meters at cost (including materials and labor) to customers who enroll in the RTP Program. The Company may, at the customer's expense, require installation of additional communication equipment, software or a monthly subscription service for the administration of this special provision.
Appendix H-58 SECOND EDITION
SERVICE CLASSIFICATION NO. 3 (Continued)
SPECIAL PROVISIONS: (Cont'd.)
(i) Real Time Pricing ("RTP") Provision: (Cont’d.)
Eligible customers receiving metering from competitive metering providers may participate in this Real Time Pricing Program, using metering equipment and communications capabilities that the Company has determined can provide the necessary hourly interval usage data.
CALCULATION OF THE RTP BILL: Customers are responsible for all charges associated with the NYSEG Variable Price (VRO) rate option as described in this Service Classification, and General Information Section 12 of this Schedule – Customer Advantage Program. Additionally, the VRO Commodity Service will be replaced with the RTP Program Commodity Service, described as follows.
The hourly day-ahead NYISO Locational-Based Marginal Prices ("LBMP") of electricity in Zones C or G (as applicable) will be applied to the customer's interval metered hourly usage. NYSEG will also add Energy Losses (which include Unaccounted For Energy), Unforced Capacity (UCAP), UCAP Reserves, and UCAP Losses to the LBMP determined prices. UCAP is defined as the market-clearing price of capacity in $/kWh as determined from the NYISO's monthly capacity auction price and the service classification load profile. The Capacity Component will be revised in accordance with each monthly UCAP auction held by the NYISO.
TERM AND EVALUATION OF THE PILOT PROGRAM:The term of service is consistent with the customer choosing the NYSEG Variable Price (VRO) rate option, a complete description of which appears previously in this Service Classification, and in Section 12 of this Schedule, Customer Advantage Program. The Company will work closely with each RTP customer. The Company will evaluate the Program, including costs and benefits and propose necessary changes after each year of the Program.
(j) Emergency Demand Response Program ("EDRP"):
The EDRP seeks to provide customers with an economic incentive to respond to Emergency Operating Conditions as identified by the NYISO. EDRP can provide the NYISO, through the Company, with the ability to request voluntary load curtailment or replacement by participating customers for electric usage.
Customers who are qualified under EDRP in Section 20 of the General Information section of this Schedule may participate in the NYSEG EDRP as set forth therein.
Appendix H - 59 SECOND EDITION
SERVICE CLASSIFICATION NO. 3 (Continued)
SPECIAL PROVISIONS: (Cont'd.)
(k) C.A.$.H.BACK Special Provision: The Company will provide a voluntary program for load normally supplied and delivered by NYSEG, for eligible customers to curtail load. NYSEG's program, entitled C.A.$.H.BACK, implements the NYISO's day-ahead economic load-curtailment program. Under this program, a customer agrees to curtail load when their bid is submitted and accepted by the NYISO.
Customers who are qualified under C.A.$.H.BACK in Section 21 of the General Information section of this Schedule may participate in the NYSEG C.A.$.H.BACK Program as set forth therein.
(l) Farm Waste Electric Generating System Option: This option is for a customer qualifying for the Farm Waste Electric Generating System Option pursuant to General Information Section 22 of this Schedule, and taking service under SC 3. The Company will net, as provided for in Section 22:
(1) The kilowatt-hours produced for up to and including the first 200 hours of the measured electricity produced by the customer's Facility as measured on the non-demand, non-time differentiated Credit Meter and at the billed demand on the Billing Meter with that consumed by the customer and billed as kilowatt-hours, per kilowatt for up to and including 200 hours use of metered demand from the Billing Meter.
(2)The kilowatt-hours produced for over 200 hours use and up to and including 350 hours of the measured electricity produced by the customer's Facility as measured on the non-demand, non-time differentiated Credit Meter and at the billed demand on the Billing Meter with that consumed by the customer and billed as kilowatt-hours, per kilowatt for over 200 hours use and up to and including 350 hours use of metered demand from the Billing Meter.
(3) The kilowatt-hours produced for over 350 hours use measured electricity produced by the customer's Facility as measured on the non-demand, non-time differentiated Credit Meter and at the billed demand on the Billing Meter with that consumed by the customer and billed as kilowatthours, per kilowatt for over 350 hours use of metered demand from the Billing Meter.
Appendix H-60 SECOND EDITION
Appendix I Industry Directory for On-Farm Biogas Recovery Systems
This appendix is a reprint of the AgSTAR Program’s second edition of the Industry Directory for On-Farm Biogas Recovery Systems (released in July 2003). This Directory is designed to help farm owners identify appropriate consultants, project developers, energy service providers, equipment manufacturers and distributors, and commodity organizations. The Directory provides descriptions, relevant experience, and contact information for each business listed. While the best efforts were made to contact domestic and international businesses with relevant experience, the Directory is not exhaustive. AgSTAR will continue to update the Directory as new businesses emerge or existing businesses expand into the livestock waste market. These updates will be posted on the AgSTAR Web site (www.epa.gov/agstar), where this Directory and other AgSTAR Program products can be downloaded.
The organizations are listed in the following order:
• Commodity Organizations
• Consultants
• Developers
• Equipment Suppliers/Distributors: Covers
• Equipment Suppliers/Distributors: Engines
• Equipment Suppliers/Distributors: System Components
• General Energy Services
• Publishers
• Universities
If you are interested in being included in this Directory, please call the AgSTAR Hotline at 1-800-95 AgSTAR (1-800-952-4782) from 9:00 a.m. to 5:00 p.m. Eastern Standard Time.
EPA does not guarantee the accuracy of the information that has been supplied by the listed organizations. Listing in this Directory does not imply EPA endorsement of any listed organization. All users of this Directory must employ their own due diligence in making decisions based on information found within.
SECOND EDITION Appendix I-1
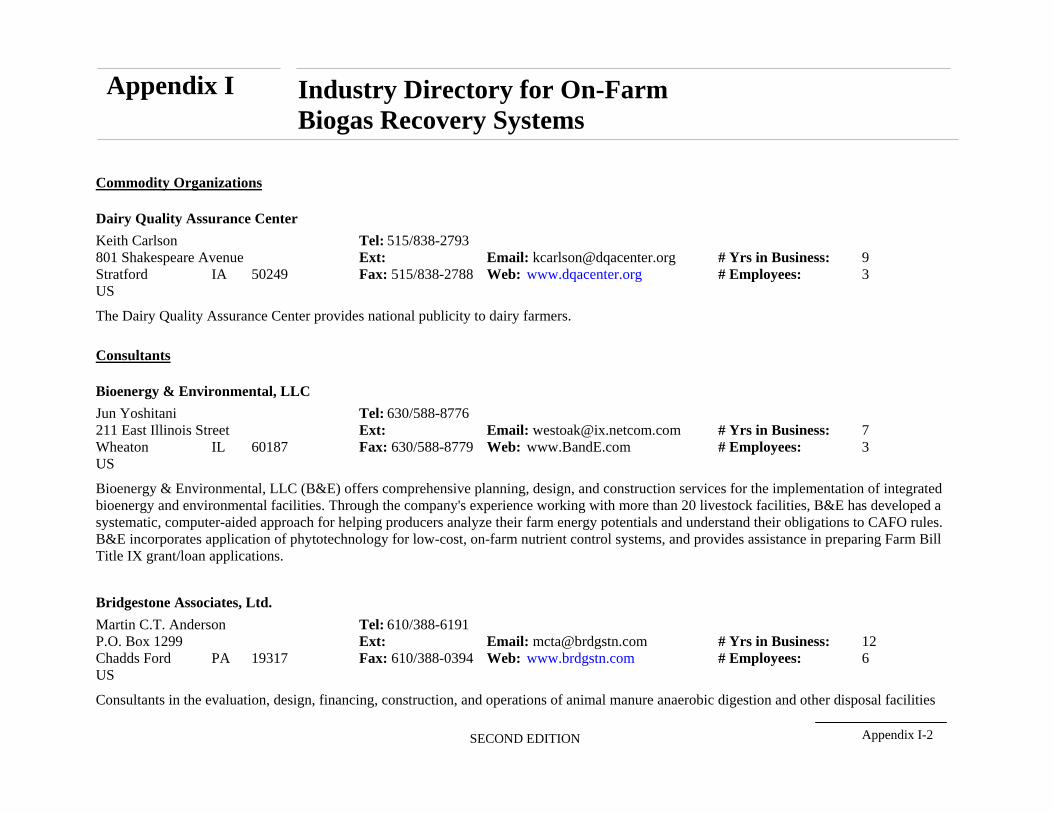
Appendix I Industry Directory for On-Farm Biogas Recovery Systems
Commodity Organizations
Dairy Quality Assurance Center
Keith Carlson Tel: 515/838-2793 801 Shakespeare Avenue Ext: Email: [email protected] # Yrs in Business: 9 Stratford IA 50249 Fax: 515/838-2788 Web: www.dqacenter.org # Employees: 3 US
The Dairy Quality Assurance Center provides national publicity to dairy farmers.
Consultants
Bioenergy & Environmental, LLC
Jun Yoshitani Tel: 630/588-8776 211 East Illinois Street Ext: Email: [email protected] # Yrs in Business: 7 Wheaton IL 60187 Fax: 630/588-8779 Web: www.BandE.com # Employees: 3 US
Bioenergy & Environmental, LLC (B&E) offers comprehensive planning, design, and construction services for the implementation of integrated bioenergy and environmental facilities. Through the company's experience working with more than 20 livestock facilities, B&E has developed a systematic, computer-aided approach for helping producers analyze their farm energy potentials and understand their obligations to CAFO rules. B&E incorporates application of phytotechnology for low-cost, on-farm nutrient control systems, and provides assistance in preparing Farm Bill Title IX grant/loan applications.
Bridgestone Associates, Ltd.
Martin C.T. Anderson Tel: 610/388-6191 P.O. Box 1299 Ext: Email: [email protected] # Yrs in Business: 12 Chadds Ford PA 19317 Fax: 610/388-0394 Web: www.brdgstn.com # Employees: 6 US
Consultants in the evaluation, design, financing, construction, and operations of animal manure anaerobic digestion and other disposal facilities
SECOND EDITION Appendix I-2
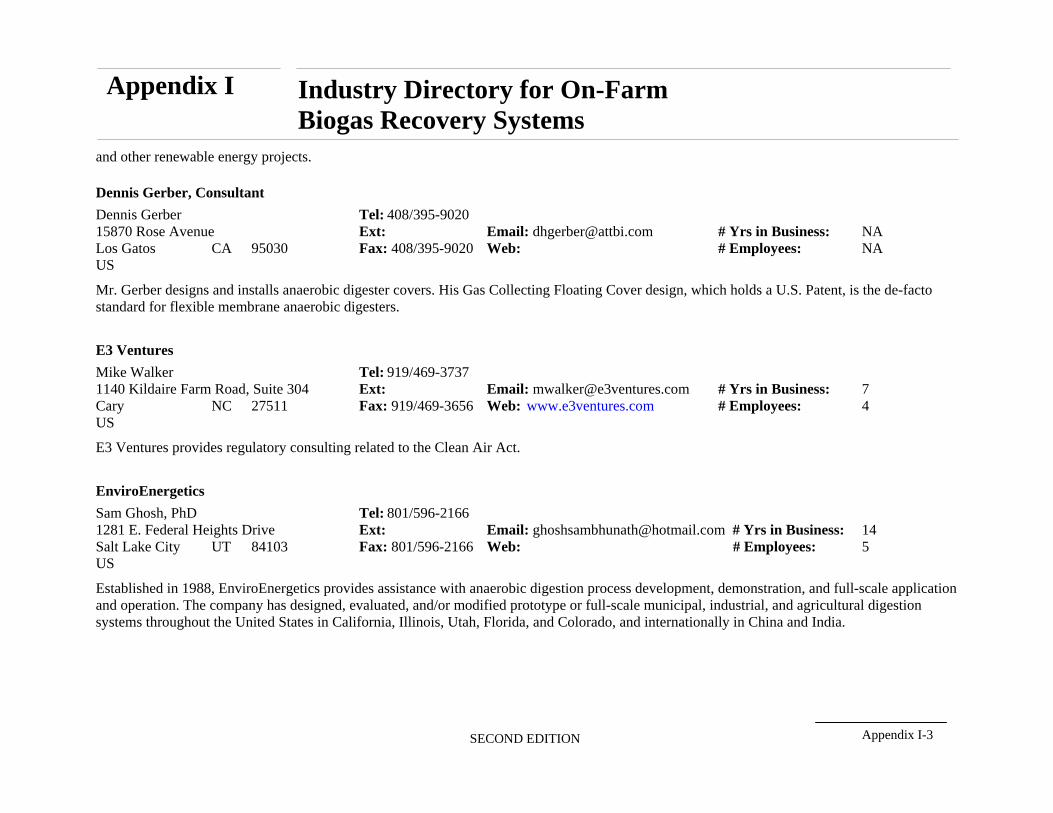
Appendix I Industry Directory for On-Farm Biogas Recovery Systems
and other renewable energy projects.
Dennis Gerber, Consultant
Dennis Gerber Tel: 408/395-9020 15870 Rose Avenue Ext: Email: [email protected] # Yrs in Business: NA Los Gatos CA 95030 Fax: 408/395-9020 Web: # Employees: NA US
Mr. Gerber designs and installs anaerobic digester covers. His Gas Collecting Floating Cover design, which holds a U.S. Patent, is the de-facto standard for flexible membrane anaerobic digesters.
E3 Ventures
Mike Walker Tel: 919/469-3737 1140 Kildaire Farm Road, Suite 304 Ext: Email: [email protected] # Yrs in Business: 7 Cary NC 27511 Fax: 919/469-3656 Web: www.e3ventures.com # Employees: 4 US
E3 Ventures provides regulatory consulting related to the Clean Air Act.
EnviroEnergetics
Sam Ghosh, PhD Tel: 801/596-2166 1281 E. Federal Heights Drive Ext: Email: [email protected] # Yrs in Business: 14 Salt Lake City UT 84103 Fax: 801/596-2166 Web: # Employees: 5 US
Established in 1988, EnviroEnergetics provides assistance with anaerobic digestion process development, demonstration, and full-scale application and operation. The company has designed, evaluated, and/or modified prototype or full-scale municipal, industrial, and agricultural digestion systems throughout the United States in California, Illinois, Utah, Florida, and Colorado, and internationally in China and India.
SECOND EDITION Appendix I-3
Appendix I Industry Directory for On-Farm Biogas Recovery Systems
Environmental Resource Recovery Group, LLC (EnRRG)
Burt Tribble Tel: 913/886-8051 15789 202 Street Ext: Email: [email protected] # Yrs in Business: NA Nortonville KS 66060 Fax: 775/205-1966 Web: www.enrrg.com # Employees: 10 US
Environmental Resource Recovery Group (EnRRG) is a recently formed company whose partners have experience in anaerobic digestion and waste-to-energy in agriculture, agribusiness, and the food industry. EnRRG's business is identifying practical energy recovery, anaerobic digestion, and waste management projects, evaluating their economic potentials, and bringing together qualified projects with development partners. Qualified projects are those meeting technical requirements and economic investment guidelines.
Fraunhofer Center for Energy and Environment
Junchul Kim, Ph.D. Tel: 412/624-8609 5940 Baum Square, Suite 7 Ext: Email: [email protected] # Yrs in Business: 2 Pittsburgh PA 15206 Fax: 412/624-8860 Web: # Employees: 4 US
Fraunhofer Center for Energy and Environment was established in 2001 as a non-profit organization. The goal of the Center is to introduce technologies and processes developed and demonstrated by Fraunhofer in Germany into the United States, providing solutions to solve regional and national problems in energy and the environment. The Center cooperates with the School of Engineering at the University of Pittsburgh. All Fraunhofer projects are affiliated with local, state, and federal agencies, and private sectors. On-farm biogas generation using manure or other biomass is one of the technologies developed and successfully demonstrated by Fraunhofer. The technology’s use has been extended to various applications, including sewage sludge treatment, industrial wastewater with high organic contents, co-digestion, and biowaste digestion.Gas Technology Institute
J. Robert Paterek, Ph.D. Tel: 847/768-0720 1700 Mount Prospect Road Ext: Email: [email protected] # Yrs in Business: 53 Des Plaines IL 60018 Fax: 847/768-0546 Web: www.gastechnology.org # Employees: 320 US
Gas Technology Institute (GTI) and the Environmental Science & Technology Center have been carrying out research and development projects and technology demonstrations in the areas of anaerobic digestion and biogas generation since the 1970s. GTI holds a number of patents on the
SECOND EDITION Appendix I-4
Appendix I Industry Directory for On-Farm Biogas Recovery Systems
two-phase reactor system and other reactor designs and systems. The two-phase digestion technology has been in full-scale commercial use for activated sludge treatment for more than five years. The two-stage system has proven successful for swine and dairy manure in large-scale laboratory evaluations and GTI is preparing for farm demonstrations and full-scale deployments.
General Bioenergy, Inc.
Phillip Badger Tel: 256/740-5634 P.O. Box 26 Ext: Email: [email protected] # Yrs in Business: 3 Florence AL 35630 Fax: 256/740-5635 Web: www.bioenergyupdate.com # Employees: 4 US
Mr. Badger is the Technical Director for the Southeastern Regional Biomass Energy Program, which has funded a variety of projects related to farm-scale systems (mainly lagoon digester projects) and wastewater treatment plants. He publishes and sells the "Biogas Utilization Handbook." General Bioenergy has performed feasibilty studies for farm biogas systems.
MacMillan & Associates
Roy MacMillan Tel: 503/628-0277 17815 NE Courtney Road Ext: Email: [email protected] # Yrs in Business: 30 Newberg OR 97132 Fax: Web: # Employees: 6 US
MacMillan & Associates is an integrated engineering and consulting company that specializes in providing energy-related services to the agricultural community.
MCON BIO, Inc.
Hans Meyer Tel: 909/600-1385 39642 Via Temprano Ext: Email: [email protected] # Yrs in Business: 10 Murrieta CA 92563 Fax: 909/600-1285 Web: www.mconbio.com # Employees: 170 US
MCON BIO is a consulting, engineering, and management company that works with all aspects of biogas operations, from logistics and management to finished products applications. MCON BIO also represents Farmatic Biotech Energy AG, which builds complete biogas and waste water treatment plants.
SECOND EDITION Appendix I-5
Appendix I Industry Directory for On-Farm Biogas Recovery Systems
Meridian Capital Investments, Inc.
Gino Heilizer Tel: 301/983-5000 10220 River Road Ext: Email: [email protected] # Yrs in Business: 15 Potomac MD 20854 Fax: 301/983-9012 Web: www.meridianinvestments.com # Employees: 40 US
Meridian Investments is the largest provider of tax credit equity in America. Since 1992, the company has underwritten over $8 billion worth of federal tax credits. Meridian Investments has experience in all major federal tax credit programs, including sections 42, 29, and 45. The company provides information on selling credits to clients with plants that currently generate or will be generating a qualifying fuel under section 29 or 45 of the IRC.
National Methane
William J. Lingo, Sr. Tel: 937/256-7500 905 Glendean Avenue, Suite 7 Ext: Email: [email protected] # Yrs in Business: 20 Riverside OH 45431 Fax: 937/256-7500 Web: # Employees: 5 US
National Methane holds a patent for a system that can verify the basis for each of the "multiple" avenues of income streams their system develops. National Methane provides complete farm evaluations and recommendations for incorporating biogas technology into a farm plan. National Methane has provided evaluations for more than 100 chicken farms, more than 60 swine farms, more than 25 dairy farms, and one sheep farm. The company also provides grant writing and public relations services related to on-farm biogas recovery and fee-based speakers for Community Groups and Agricultural Seminars.
Nelson and Associates
D.O. "Swede" Nelson Tel: 650/364-7273 76 Almendral Avenue Ext: Email: [email protected] # Yrs in Business: 18 Atherton CA 94027 Fax: 650/367-0365 Web: # Employees: 12
SECOND EDITION Appendix I-6
Appendix I Industry Directory for On-Farm Biogas Recovery Systems
US
Nelson and Associates is a domestic and international consulting group specializing in the planning, technical study, implementation, and financing of petroleum and environmental projects. The company is affiliated with firms with extensive experience in biogas projects and is currently completing design, installation, and start-up of a bioremediation and thermal desorption project in the western United States.
Omega-Alpha Recycling Systems
Robert Hamburg Tel: 304/655-8662 Route 1, Box 51 Ext: Email: [email protected] # Yrs in Business: 24 Orma WV 25268 Fax: NA Web: # Employees: 1 US
Omega-Alpha Recycling Systems (OARS) works on projects related to organic recycling and biogas systems integrated with organic farming and permaculture facilities. OARS has designed four small-scale, ambient temperature digesters: 1) Arcadia Farm, a goat, chicken, and horse farm in Orma, West Virginia with a Chinese style extended batch digester; 2) Urbanic Farm, a horse, cow, and chicken farm in Chloe, West Virginia with a Chinese style extended batch digester; 3) Agriculture Research Farm, a swine farm in Bamaco, Mali, West Africa with a Chinese style extended batch digester; and 4) the Mandali School, a school with cattle, in Chhopark, Nepal, an Indian design Gobar Gas demonstration project. OARS was also instrumental in halting a project that was environmentally and economically unsound.
R. K. Frobel & Associates
Ronald K. Frobel, P.E. Tel: 303/679-0285 1153 Bergen Parkway; Suite M-240 Ext: Email: [email protected] # Yrs in Business: 15 Evergreen CO 80439 Fax: 303/679-8955 Web: # Employees: 3 US
Established in 1988, R.K. Frobel & Associates Consulting Engineers provides design and construction assistance in the growing field of geosynthetics, including design assistance in both animal waste lining systems and cover systems for waste/anaerobic digesters. Design assistance is provided to full-service engineering firms or facility/farm owners. As principal of R.K.Frobel & Associates, Mr. Frobel has over 25 years of experience in synthetic lining and cover systems, including agricultural applications.
Richmond Energy Associates
SECOND EDITION Appendix I-7
Appendix I Industry Directory for On-Farm Biogas Recovery Systems
Jeff Forward Tel: 802/434-3770 P.O. Box 615 Ext: Email: [email protected] # Yrs in Business: 3 Richmond VA 05477 Fax: 802/434-2344 Web: # Employees: 1 US
Richmond Energy Associates is a renewable energy company specializing in anaerobic digestion feasibility analysis.
Robert A. Beckstrom, Electrical Consultant
Robert (Bob) Beckstrom Tel: 209/576-1740 1512 Gladwin Lane Ext: Email: # Yrs in Business: NA Modesto CA 95355 Fax: Web: # Employees: 1 US
Mr. Beckstrom provides electrical design and consulting services and specializes in alternative power projects. He wrote the electrical specifications for the first 100 wind generators installed on the Altamont Pass. In addition, Mr. Beckstrom participated in the design of the first geothermal test well in Hawaii, as well as several hydro-electric plants.
Selective Site Energy
Terry Super Tel: 913/438-7700 8500 West 110th Street, Suite 300 Ext: Email: [email protected] # Yrs in Business: 1 Overland Park KS 66210 Fax: 913/438-7777 Web: www.selectivesite.com # Employees: 4 US
Selective Site Energy was formed as a division of Selective Site Consultants, a wireless telecommunications, cellular tower, and facility design-build consultancy. All the principles, partners, engineers, and related professional staff at SSC/SSE have extensive backgrounds in all forms of engineering and construction projects, including water and wastewater treatment, power, and cogeneration.
SECOND EDITION Appendix I-8
Appendix I Industry Directory for On-Farm Biogas Recovery Systems
The Dubara Company
Stephen Hoyt Tel: 518/732-7618 1177 Route 9 Ext: Email: [email protected] # Yrs in Business: 2 Castleton NY 12033 Fax: 518/732-7618 Web: # Employees: 1 US
The Dubara Company is currently operating three pilot reactors for the Vermont Department of Public Service and testing the rate of digestion of whole dairy manure. The company hopes to increase the rate of digestion and reduce the size of digesters, and to address ways to remove sediment and prevent its accumulation.
Consultants
Tim Goodman & Associates
Tim Goodman Tel: 952/544-6005 2337 Texas Avenue South Ext: Email: [email protected] # Yrs in Business: 1 St. Louis Park MN 55426 Fax: 952/544-2307 Web: # Employees: 1 US
Tim Goodman & Associates has experience in a variety of biomass projects, including green waste composting, food waste composting, and biomass-to-energy facilities. The company can provide feasibility studies for anaerobic digestion of animal waste at farms and feedlot operations, biogas system design, and vendor procurement assistance.
Universal Entech, LLC
Daniel Musgrove Tel: 602/268-8849 5501 N. 7th Avenue, PMB 233 Ext: Email: [email protected] # Yrs in Business: 10 Phoenix AZ 85013-1756 Fax: 602/268-9742 Web: # Employees: 12 US
Universal Entech, LLC is an organic resource management company providing manure management and wastewater treatment services to the CAFO industry. The company focuses on developing turnkey solutions that comply with its clients' nutrient management plans and discharge
SECOND EDITION Appendix I-9
Appendix I Industry Directory for On-Farm Biogas Recovery Systems
requirements. Universal Entech's team has extensive experience in the development and operation of renewable energy systems utilizing biogas from municipal wastewater and landfill applications.
Williams Creek Consulting, Inc.
Joel Johnston Tel: 317/722-9567 P.O. Box 20821 Ext: Email: [email protected] # Yrs in Business: 1 Indianapolis IN 46220 Fax: 317/726-0703 Web: # Employees: 4 US
Williams Creek Consulting, Inc. specializes in designing and building natural wastewater treatment systems, including hybrid wetland systems. The company is currently working to incorporate biogas recovery into these systems to maximize potential energy usage.
Developers
ADI Systems Inc.
Albert A. Cocci Tel: 603/893-2134 182 Main Street, Unit 6 Ext: Email: [email protected] # Yrs in Business: 13 Salem NH 03079 Fax: 603/898-3991 Web: www.adi.ca # Employees: 15 US Farm Projects: 0
ADI Systems has been involved in approximately 100 full-scale anaerobic system installations throughout the world. Approximately 50 of these systems treat agri-waste from food-related processing, while the remaining systems treat brewery, beverage, and chemical wastes. Each of these systems involves biogas collection and flaring or utilization (in most cases via burning in a boiler to produce hot water and steam). In several instances, utilization has involved cogeneration.
SECOND EDITION Appendix I-10
Appendix I Industry Directory for On-Farm Biogas Recovery Systems
Ag Environmental Solutions
Carl Theunis Tel: 920/532-4804 2768 Poplar Street Ext: Email: [email protected] # Yrs in Business: 3 Kaukauna WI 54130 Fax: 920/532-5039 Web: ag-env-sol.com # Employees: 6 US Farm Projects: 1
Ag Environmental Solutions employs a process patented by and licensed to Iowa State Research. Ag Environmental Solutions' Tinedale Project is one of the largest dairy farm biogas systems in the United States with a 2,500-head capacity. The process is a complete mix using thermophilic and mesophilic temperatures enabling the system to produce a Class A bio-solid.
Agri Bio Systems
Richard Vetter, PhD, PAS, ACAN Tel: 847/888-7854 2333 Tara Drive Ext: Email: [email protected] # Yrs in Business: 18 Elgin IL 60123 Fax: 847/888-1484 Web: # Employees: NA US Farm Projects: 7 Agri Bio Systems performs feasibility assessments and designs and installs biogas systems in the United States and abroad. Examples of biogas systems include: 1) Lindstrom Farm: a 50-cow dairy farm in Welch, Minnesota; 2) Leefer Farm, a 1,000-cow beef confinement farm in Carbin Carlinville, Illinois; 3) Smith Farm, a 70,000-broiler poultry farm in Princeton, North Carolina; 4) Naser Farm, a 1,000-sow finishing swine farm in Sibley, Iowa; 5) Hamilton Farm, a 450-sow finishing farm and a 120,000-layer poultry farm in Iowa Falls, Iowa; 6) Huntington Dairy, a 300cow dairy farm in Cooperstown, New York; 7) Cushman Farm, a 600-cow dairy in Franklin, Connecticut; and 8) International Project, Taiwan, Environmental Training Center for Waste Management.
AnAerobics
Sarah Ploss Tel: 315/364-5062 P.O. Box 307, Aurora Place, Suite 202 Ext: Email: [email protected] # Yrs in Business: 7 Aurora NY 13026 Fax: 315/364-7713 Web: www.anaerobics.com # Employees: 13 US Farm Projects: 1
AnAerobics delivers treatment of organic waste streams using proprietary and patented technologies that create opportunities for renewable energy utilization. Methane gas produced by the company’s patented process is used at its treatment sites to operate boilers that heat wastewater for
SECOND EDITION Appendix I-11
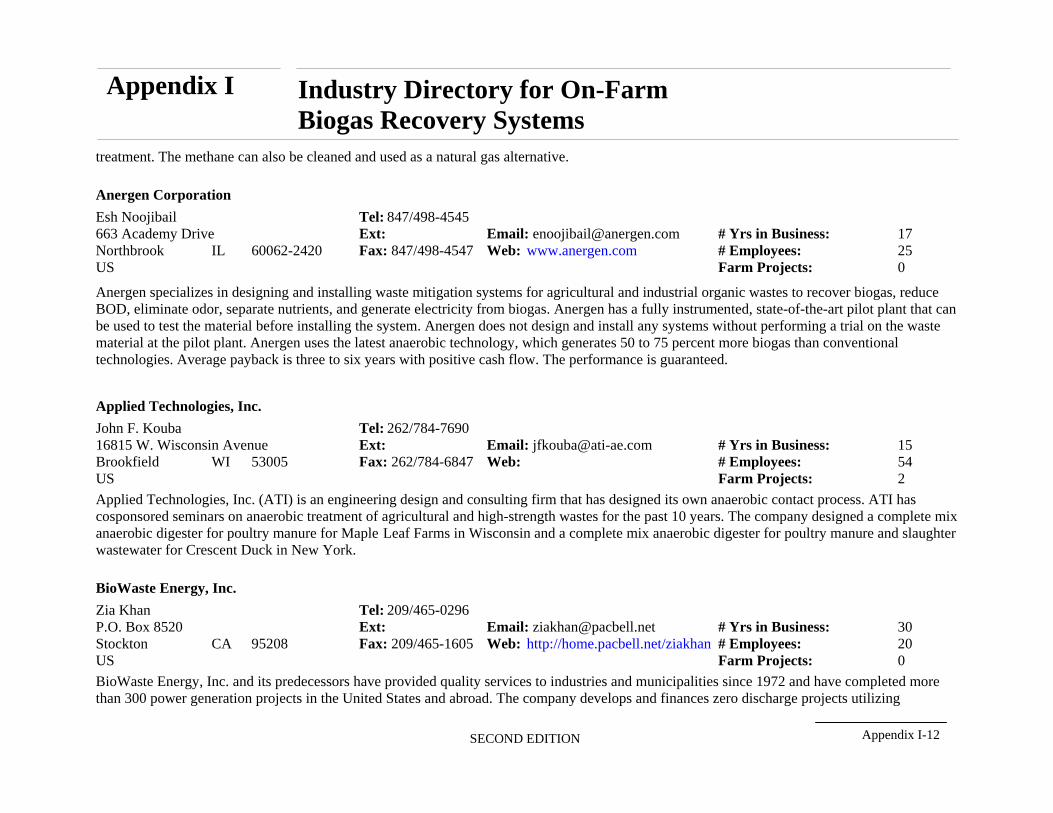
Appendix I Industry Directory for On-Farm Biogas Recovery Systems
treatment. The methane can also be cleaned and used as a natural gas alternative.
Anergen Corporation
Esh Noojibail Tel: 847/498-4545 663 Academy Drive Ext: Email: [email protected] # Yrs in Business: 17 Northbrook IL 60062-2420 Fax: 847/498-4547 Web: www.anergen.com # Employees: 25 US Farm Projects: 0
Anergen specializes in designing and installing waste mitigation systems for agricultural and industrial organic wastes to recover biogas, reduce BOD, eliminate odor, separate nutrients, and generate electricity from biogas. Anergen has a fully instrumented, state-of-the-art pilot plant that can be used to test the material before installing the system. Anergen does not design and install any systems without performing a trial on the waste material at the pilot plant. Anergen uses the latest anaerobic technology, which generates 50 to 75 percent more biogas than conventional technologies. Average payback is three to six years with positive cash flow. The performance is guaranteed.
Applied Technologies, Inc.
John F. Kouba Tel: 262/784-7690 16815 W. Wisconsin Avenue Ext: Email: [email protected] # Yrs in Business: 15 Brookfield WI 53005 Fax: 262/784-6847 Web: # Employees: 54 US Farm Projects: 2
Applied Technologies, Inc. (ATI) is an engineering design and consulting firm that has designed its own anaerobic contact process. ATI has cosponsored seminars on anaerobic treatment of agricultural and high-strength wastes for the past 10 years. The company designed a complete mix anaerobic digester for poultry manure for Maple Leaf Farms in Wisconsin and a complete mix anaerobic digester for poultry manure and slaughter wastewater for Crescent Duck in New York.
BioWaste Energy, Inc.
Zia Khan Tel: 209/465-0296 P.O. Box 8520 Ext: Email: [email protected] # Yrs in Business: 30 Stockton CA 95208 Fax: 209/465-1605 Web: http://home.pacbell.net/ziakhan # Employees: 20 US Farm Projects: 0
BioWaste Energy, Inc. and its predecessors have provided quality services to industries and municipalities since 1972 and have completed more than 300 power generation projects in the United States and abroad. The company develops and finances zero discharge projects utilizing
SECOND EDITION Appendix I-12
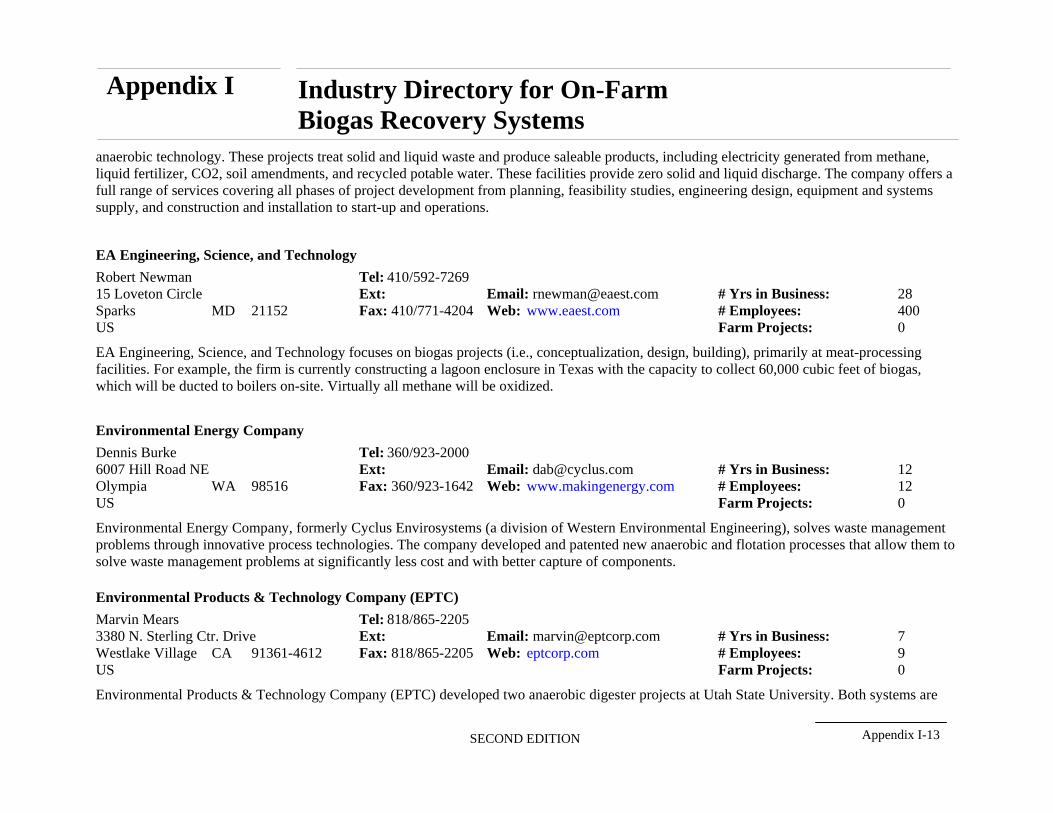
Appendix I Industry Directory for On-Farm Biogas Recovery Systems
anaerobic technology. These projects treat solid and liquid waste and produce saleable products, including electricity generated from methane, liquid fertilizer, CO2, soil amendments, and recycled potable water. These facilities provide zero solid and liquid discharge. The company offers a full range of services covering all phases of project development from planning, feasibility studies, engineering design, equipment and systems supply, and construction and installation to start-up and operations.
EA Engineering, Science, and Technology
Robert Newman Tel: 410/592-7269 15 Loveton Circle Ext: Email: [email protected] # Yrs in Business: 28 Sparks MD 21152 Fax: 410/771-4204 Web: www.eaest.com # Employees: 400 US Farm Projects: 0
EA Engineering, Science, and Technology focuses on biogas projects (i.e., conceptualization, design, building), primarily at meat-processing facilities. For example, the firm is currently constructing a lagoon enclosure in Texas with the capacity to collect 60,000 cubic feet of biogas, which will be ducted to boilers on-site. Virtually all methane will be oxidized.
Environmental Energy Company
Dennis Burke Tel: 360/923-2000 6007 Hill Road NE Ext: Email: [email protected] # Yrs in Business: 12 Olympia WA 98516 Fax: 360/923-1642 Web: www.makingenergy.com # Employees: 12 US Farm Projects: 0
Environmental Energy Company, formerly Cyclus Envirosystems (a division of Western Environmental Engineering), solves waste management problems through innovative process technologies. The company developed and patented new anaerobic and flotation processes that allow them to solve waste management problems at significantly less cost and with better capture of components.
Environmental Products & Technology Company (EPTC)
Marvin Mears Tel: 818/865-2205 3380 N. Sterling Ctr. Drive Ext: Email: [email protected] # Yrs in Business: 7 Westlake Village CA 91361-4612 Fax: 818/865-2205 Web: eptcorp.com # Employees: 9 US Farm Projects: 0
Environmental Products & Technology Company (EPTC) developed two anaerobic digester projects at Utah State University. Both systems are
SECOND EDITION Appendix I-13
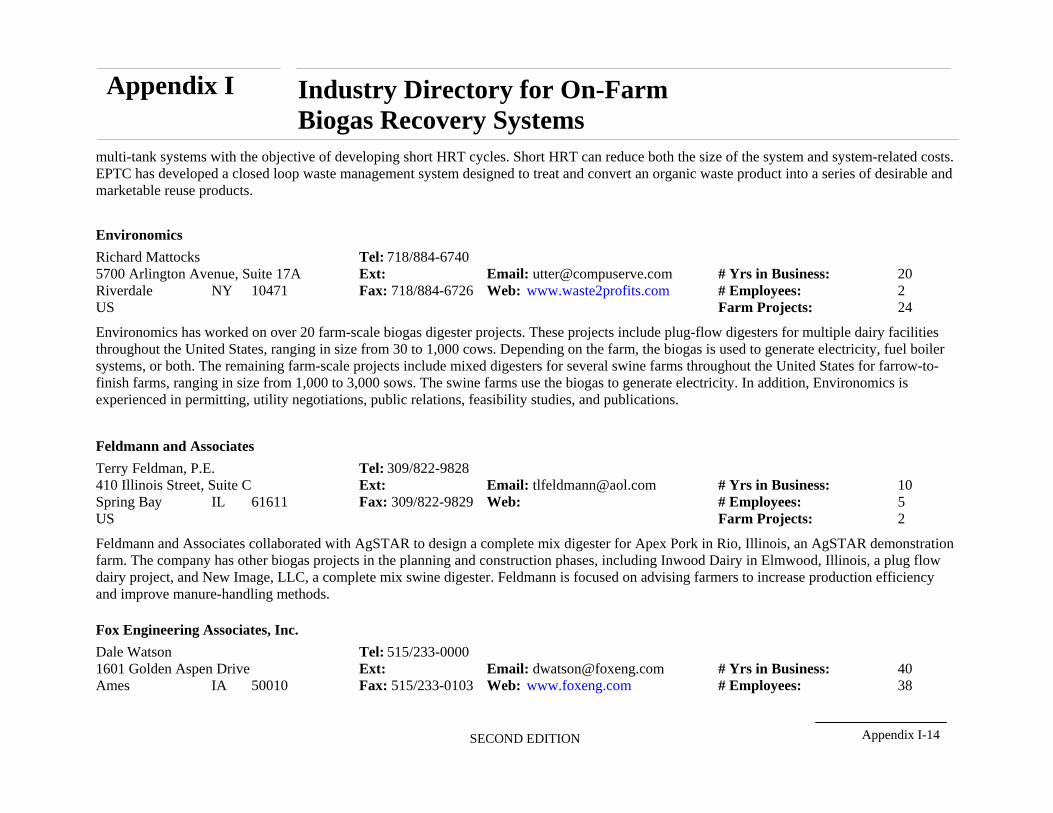
Appendix I Industry Directory for On-Farm Biogas Recovery Systems
multi-tank systems with the objective of developing short HRT cycles. Short HRT can reduce both the size of the system and system-related costs. EPTC has developed a closed loop waste management system designed to treat and convert an organic waste product into a series of desirable and marketable reuse products.
Environomics
Richard Mattocks Tel: 718/884-6740 5700 Arlington Avenue, Suite 17A Ext: Email: [email protected] # Yrs in Business: 20 Riverdale NY 10471 Fax: 718/884-6726 Web: www.waste2profits.com # Employees: 2 US Farm Projects: 24
Environomics has worked on over 20 farm-scale biogas digester projects. These projects include plug-flow digesters for multiple dairy facilities throughout the United States, ranging in size from 30 to 1,000 cows. Depending on the farm, the biogas is used to generate electricity, fuel boiler systems, or both. The remaining farm-scale projects include mixed digesters for several swine farms throughout the United States for farrow-to-finish farms, ranging in size from 1,000 to 3,000 sows. The swine farms use the biogas to generate electricity. In addition, Environomics is experienced in permitting, utility negotiations, public relations, feasibility studies, and publications.
Feldmann and Associates
Terry Feldman, P.E. Tel: 309/822-9828 410 Illinois Street, Suite C Ext: Email: [email protected] # Yrs in Business: 10 Spring Bay IL 61611 Fax: 309/822-9829 Web: # Employees: 5 US Farm Projects: 2
Feldmann and Associates collaborated with AgSTAR to design a complete mix digester for Apex Pork in Rio, Illinois, an AgSTAR demonstration farm. The company has other biogas projects in the planning and construction phases, including Inwood Dairy in Elmwood, Illinois, a plug flow dairy project, and New Image, LLC, a complete mix swine digester. Feldmann is focused on advising farmers to increase production efficiency and improve manure-handling methods.
Fox Engineering Associates, Inc.
Dale Watson Tel: 515/233-0000 1601 Golden Aspen Drive Ext: Email: [email protected] # Yrs in Business: 40 Ames IA 50010 Fax: 515/233-0103 Web: www.foxeng.com # Employees: 38
SECOND EDITION Appendix I-14
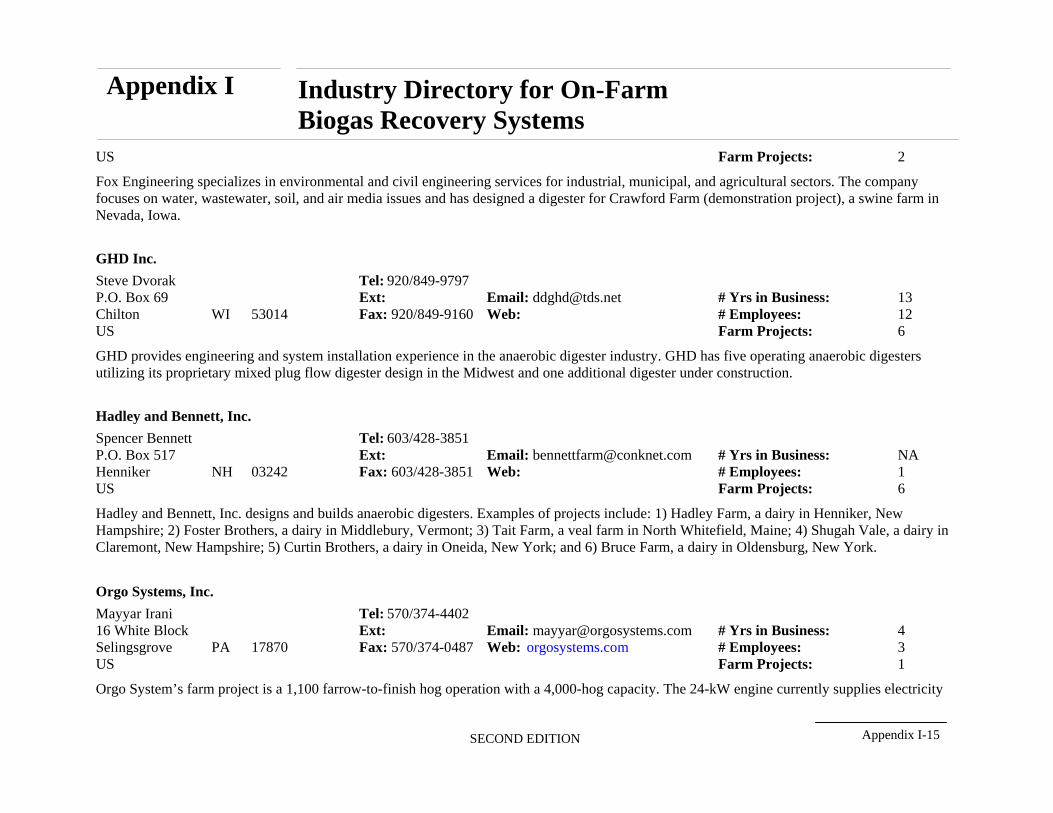
2
Appendix I Industry Directory for On-Farm Biogas Recovery Systems
US Farm Projects:
Fox Engineering specializes in environmental and civil engineering services for industrial, municipal, and agricultural sectors. The company focuses on water, wastewater, soil, and air media issues and has designed a digester for Crawford Farm (demonstration project), a swine farm in Nevada, Iowa.
GHD Inc.
Steve Dvorak Tel: 920/849-9797 P.O. Box 69 Ext: Email: [email protected] # Yrs in Business: 13 Chilton WI 53014 Fax: 920/849-9160 Web: # Employees: 12 US Farm Projects: 6
GHD provides engineering and system installation experience in the anaerobic digester industry. GHD has five operating anaerobic digesters utilizing its proprietary mixed plug flow digester design in the Midwest and one additional digester under construction.
Hadley and Bennett, Inc.
Spencer Bennett Tel: 603/428-3851P.O. Box 517 Ext: Email: [email protected] # Yrs in Business: NA Henniker NH 03242 Fax: 603/428-3851 Web: # Employees: 1 US Farm Projects: 6
Hadley and Bennett, Inc. designs and builds anaerobic digesters. Examples of projects include: 1) Hadley Farm, a dairy in Henniker, New Hampshire; 2) Foster Brothers, a dairy in Middlebury, Vermont; 3) Tait Farm, a veal farm in North Whitefield, Maine; 4) Shugah Vale, a dairy in Claremont, New Hampshire; 5) Curtin Brothers, a dairy in Oneida, New York; and 6) Bruce Farm, a dairy in Oldensburg, New York.
Orgo Systems, Inc.
Mayyar Irani Tel: 570/374-4402 16 White Block Ext: Email: [email protected] # Yrs in Business: 4 Selingsgrove PA 17870 Fax: 570/374-0487 Web: orgosystems.com # Employees: 3 US Farm Projects: 1
Orgo System’s farm project is a 1,100 farrow-to-finish hog operation with a 4,000-hog capacity. The 24-kW engine currently supplies electricity
SECOND EDITION Appendix I-15
Appendix I Industry Directory for On-Farm Biogas Recovery Systems
to the barn, and the project will soon upgrade to a 100-kW engine. Orgo Systems designed an operational prototype that produces electricity, reduces odors, and separates solids for better handling of waste. Orgo Systems is working on plans for a second generation digester system at a 300-cow dairy that will digest, separate, compost, and aerate for total nutrient management.
PRIME Technologies, LLC
Phillip D. Lusk Tel: 605/945-1311 108 E. Missouri Avenue Ext: Email: [email protected] # Yrs in Business: 3 Pierre SD 57501 Fax: 605/945-0194 Web: www.primecapture.com # Employees: 16 US Farm Projects: 0
The proposed PRIME Technologies biorefinery includes a locally managed system comprised of a 20-million gallon/year ethanol plant that uses local crops and an adjoining 28,000-head confined cattle feedlot connected to an anaerobic digester. Independent contractors will run “backgrounding“ operations with additional 13,000- to 15,000-head of cattle. The complex will produce fuel-grade ethanol, finished cattle, biogas, and biofertilizers. The biorefinery is economically attractive, with an estimated internal rate of return of approximately 30 percent, achievable through significant economies of scope. A commercial demonstration of this referenced biorefinery is undergoing final detailed engineering and project development at a site located outside of Pierre, South Dakota. Construction is scheduled to commence late spring of 2002 and start-up is scheduled for the summer of 2003.
RCM Digesters, Inc.
Mark Moser Tel: 510/658-4466 P.O. Box 4716 Ext: Email: [email protected] # Yrs in Business: 18 Berkeley CA 94704 Fax: 510/658-2729 Web: www.rcmdigesters.com # Employees: 2 US Farm Projects: 30
RCM Digesters, Inc. has designed 30 farm-scale biogas projects. Examples include: 1) Apex Pork (for AgSTAR), a swine farm in Rio, Illinois with a covered, heated, mixed lagoon; 2) Freund Dairy (for AgSTAR), a dairy farm in East Canaan, Connecticut with a plug flow digester; 3) AA Dairy (for AgSTAR), a dairy farm in Candor, New York; 4) Martin Hog Farm (for AgSTAR), a swine farm in South Boston, Virginia with a covered lagoon; 5) Barham Hog Farm (for AgSTAR), a swine farm in Zebulon, North Carolina with a covered lagoon; 6) Craven Dairy, a dairy farm in Cloverdale, Oregon with a plug flow digester; 7) Cal Poly Dairy (for AgSTAR), a dairy farm in San Luis Obispo, California with a covered lagoon; 8) Palmer Hog Farm, a swine farm in Yell County, Arkansas with a covered lagoon; 9) Tohoku Farm, a swine farm in Aamori Prefecture, Japan with a mixed digester; and 10) Langerwerf Dairy, a dairy farm in Durham, California with a plug flow digester.
SECOND EDITION Appendix I-16
Appendix I Industry Directory for On-Farm Biogas Recovery Systems
Sharp Energy, Inc.
Roy Sharp Tel: 559/688-2051 24684 Road 148 Ext: Email: [email protected] # Yrs in Business: 18 Tulare CA 93274 Fax: 559/688-1111 Web: # Employees: 2 US Farm Projects: 5
Sharp Energy, Inc. consults, designs, and sets up effective and efficient waste management and energy production systems. Sharp Energy developed systems for the following farms: 1) Royal Farms, a 16,000-head swine farm in Tulare, California; 2) Sharp Ranch, a 5,000-head swine farm in Tulare, California; 3) Sharp Enterprises, an 8,000-head swine farm in Caruthers, California; and 4) Petrorio Farm, a 3,000-head swine farm in Skopje, Macedonia. Sharp Energy designed covers for the following farms: Cal Poly San Luis Obispo (an AgSTAR Demonstration Farm), a 300-cow dairy in San Luis Obispo, California; and Laurenco Dairy, a 1,200-cow dairy in Tulare, California.
Synagro
Paul Sellew Tel: 978/371-0501 1800 Bering Drive, Suite 1000 Ext: Email: [email protected] # Yrs in Business: 16 Houston TX 77057 Fax: 713/369-1750 Web: www.synagro.com # Employees: 1,000 US Farm Projects: 1
Synagro operates at over 1,000 wastewater treatment plants throughout the country, providing operations and residuals management services. Many of these wastewater treatment plants employ anaerobic digestion. The company is using this experience to expand into the agribusiness market with its first operational facility, which was designed and built in Chino, California. This digester is designed for 225 wet tons of fresh cow manure per day. It employs dewatering and onsite cogeneration using Capstone Microturbines.
Williams Engineering Associates
Doug Williams, P.E. Tel: 805/528-01312073 Buckskin Drive Ext:Los Osos CA 93402 Fax:US
Email: [email protected] # Yrs in Business: 17 Web: # Employees: 1
Farm Projects: 1
Williams Engineering Associates specializes in anaerobic digestion, biogas energy utilization, energy conservation, and farm machinery systems. The company has designed and developed many methane digester systems for dairy and swine facilities.
SECOND EDITION Appendix I-17
Appendix I Industry Directory for On-Farm Biogas Recovery Systems
Equipment Suppliers/Distributors: Covers
Dennis Gerber, Consultant
Dennis Gerber Tel: 408/395-9020 15870 Rose Avenue Ext: Email: [email protected] # Yrs in Business: NA Los Gatos CA 95030 Fax: 408/395-9020 Web: # Employees: NA US
Mr. Gerber designs and installs anaerobic digester covers. His Gas Collecting Floating Cover design, which holds a U.S. Patent, is the de-facto standard for flexible membrane anaerobic digesters.
Engineered Textile Products
Carter Damp Tel: 800/222-8001 P.O. Box 7474 Ext: Email: [email protected] # Yrs in Business: 20 Mobile AL 36670 Fax: 888/222-8277 Web: www.etpinfo.com # Employees: 36 US
Engineered Textile Products, Inc. manufactures and distributes lagoon covers. The company manufactured the covers for Martin's Farm, a swine farm with a covered lagoon in South Boston, Virginia, and Palmers Farm, a swine farm with a covered lagoon in Petite Jean Mt., Arkansas.
Environmental Fabrics, Inc.
Ray E. Pickel Tel: 803/551-5700 85 Pascon Court Ext: Email: # Yrs in Business: 6 Gaston SC 29053 Fax: 803/551-5701 Web: # Employees: 30 US
Environmental Fabrics Inc. has manufactured covers for five farms, including: 1) Dowell Ramsey Farm, a swine farm in Nash County, North Carolina; 2) Gold 'N Plump Poultry, a poultry farm in Cold Springs, Minnesota; 3) Pelican Rapids, a farm in Pelican Rapids, Minnesota; 4) Apex Pork, a swine farm in Rio, Illinois; and 5) Barham Farms, a swine farm in Zebulon, North Carolina.
SECOND EDITION Appendix I-18
Appendix I Industry Directory for On-Farm Biogas Recovery Systems
Firestone Building Products Company
William Johnson Tel: 800/428-4442 575 Congressional Blvd. Ext: Email: [email protected] # Yrs in Business: 18 Carmel IN 46032 Fax: 317/575-7002 Web: www.firestonebpco.com # Employees: 1300 US
Firestone Building Products Company manufactures a variety of EPDM rubber geosynthetic products for agricultural use. Firestone can recommend a network of independent installers familiar with agricultural installations and Firestone's products. Firestone Building Products Company can advise customers in the selection of a cost-effective selection of EPDM rubber geosynthetic products for a number of agricultural uses, including biogas recovery.
GSE Lining Technology, Inc.
Don Diguilio Tel: 800/446-8216 167 Anderson Road Ext:608 Email: [email protected] # Yrs in Business: 20 Cranberry Township PA 16066 Fax: 724/452-3195 Web: www.gseworld.com # Employees: 1,200 US
GSE Lining Technology, Inc. provides geosynthetic products and installation services to the agriculture industry. GSE's experienced staff assists customers in selecting the right materials to line livestock ponds to prevent contamination.
Industrial & Environmental Concepts, Inc.
Mike Morgan Tel: 952/829-0731 6009 Chapel Drive Ext: Email: [email protected] # Yrs in Business: 10 Minneapolis MN 55439 Fax: 952/829-9770 Web: www.ieccovers.com # Employees: 5 to 25 US
Industrial & Environmental Concepts, Inc. (IEC) produces and installs five types of floating modular covers for ponds and tanks. IEC's patented systems utilize a variety of geomembranes to provide cost-effective solutions to control problems with heat loss, odor, algae growth, and gas production in basins, ponds, lagoons, or tanks.
SECOND EDITION Appendix I-19
Appendix I Industry Directory for On-Farm Biogas Recovery Systems
MPC Containment
Edward Reicin Tel: 773/927-4120 4834 South Oakley Ext: Email: [email protected] # Yrs in Business: 80 Chicago IL 60609 Fax: 773/650-6028 Web: www.mpccontainment.com # Employees: 50 US
MPC Containment designs, fabricates, and installs floating-membrane liner systems, as well as other primary and secondary containment systems. The company also manufactures collapsible storage/pillow tanks for fuel, water, and waste.
Equipment Suppliers/Distributors: Engines
California Power Partners, Inc.
Tom Moore Tel: 858/277-8585 3944 Murphy Canyon Road; Suite Ext: Email: [email protected] # Yrs in Business: 3 San Diego CA 92123 Fax: 858/277-8514 Web: www.calpwr.com # Employees: 18 US
California Power Partners, Inc. is a turn-key provider of services to the distributed generation and cogeneration industry. Its services include financial and technical analysis, engineering, equipment supply, project management, construction, financing, O&M, and other related activities.
Capstone Turbine Corporation
George Wiltsee Tel: 818/734-5300 21211 Nordhoff Street Ext: Email: [email protected] # Yrs in Business: 14 Chatsworth CA 91311 Fax: 818/734-5320 Web: www.microturbine.com # Employees: 275 US
Capstone manufactures microturbines that can burn biogas with as little as 35 percent methane content. The currently available biogas model is a 30-kW microturbine that was initially offered for natural gas, propane, oil field waste gas, and diesel. During early 2000, a demonstration test program was conducted with Los Angeles County Sanitation Districts at Puente Hills landfill and at Palmdale wastewater treatment plant. Successful testing during 2000 led to commercial operations at 20 biogas facilities, as of March, 2002, using a total of 117 Capstone microturbines. The Capstone microturbine achieves a combustion efficiency of 99.999 percent. The patented premix combustion system is uniquely designed to reduce emissions of NOx, CO, and hydrocarbons to extremely low levels.
SECOND EDITION Appendix I-20
Appendix I Industry Directory for On-Farm Biogas Recovery Systems
Caterpillar, Inc.
Rob Schueffner Tel: 309/578-6376PO Box 610; AC6109 Ext: Email: [email protected] # Yrs in Business: 75 Mossville IL 61525 Fax: 309/578-7302 Web: www.cat.com # Employees: 80 US
For more than 75 years, Caterpillar, Inc. has been building the world's infrastructure. In partnership with Caterpillar dealers, it is driving sustainable change in every continent. A Fortune 100 company, Caterpillar is the world's leading manufacturer of construction and mining equipment, diesel and natural gas engines, and industrial gas turbines. The company is a technological leader in construction, transportation, mining, forestry, energy, logistics, electronics, financing, and electric power generation.
Charles Equipment Company
Tel: 800/842-4279 PO Box 388 Ext: Email: [email protected] # Yrs in Business: 40 Addison IL 60101 Fax: 630/543-4174 Web: www.charlesequipment.com # Employees: 35 US
Charles Equipment Company has specialized in reciprocating engine power systems for businesses, homes, and municipalities for more than 43 years. Charles Equipment Company has three offices located across the Midwest, providing full service in Illinois, Indiana, Michigan, Wisconsin, and Northwest Ohio.
Coffman Electrical Equipment
Greg Mulder Tel: 616/452-8708 3300 Jefferson SE Ext: Email: [email protected] # Yrs in Business: 54 Grand Rapids MI 49548 Fax: 616/452-1337 Web: www.steadypower.com # Employees: 16 US
As distributors of Hess Microgen and Bowman Power Microturbine cogeneration systems, Coffman Electrical Equipment offer disgester consultation, proven electrical production, and hot water absorption chilling. The company works with both single and multiple stage digesters.
SECOND EDITION Appendix I-21
Appendix I Industry Directory for On-Farm Biogas Recovery Systems
DTE Energy Technologies, Inc. (Power Partner of Waukesha Engines)
John Macgowan Tel: 800/472-3585 1715 Lake Drive West Ext: Email: [email protected] # Yrs in Business: 90 Chanhassen MN 55317 Fax: 952/448-9302 Web: www.dtech.com # Employees: 1000+ US
Waukesha Engine is a leading manufacturer of stationary natural gas, methane, and biogas powered engines. DTE Energy provides comprehensive application engineering services to help ensure systems are configured to each customer's specific requirements and energy objectives.
FlexEnergy, Inc.
Edan Prabhu Tel: 949/380-4899 22922 Tiagua Ext: Email: [email protected] # Yrs in Business: 6 Mission Viejo CA 92692 Fax: 949/380-8407 Web: # Employees: 2 US
FlexEnergy is developing the Flex-Microturbine® to expand the range of biomass-derived gases that can be converted to electricity. Proof-of-concept testing was successful, and several prototype units are currently being built for testing on dairy digester gas, landfill gas, and producer gas from wood and nutshell gasification. Flex-Microturbine accepts gases at atmospheric pressure. This technology will be commercially available in two years.
Ingersoll-Rand
Holly Emerson Tel: 704/896-4051 800A Beaty Street Ext: Email: [email protected] # Yrs in Business: 130 Davidson NC 28036 Fax: 704/896-4327 Web: www.irenergysystems.com # Employees: NA US
Ingersoll-Rand (IR)'s EcoWorks microturbine systems turn digester gas into electricity and hot water. IR offers compact, integrated cogeneration packages that reduce NOx emissions and odors associated with flaring. IR's solution includes a fuel conditioner to compress and clean the biogas for reliable long-term operation at low O&M costs.
SECOND EDITION Appendix I-22
Appendix I Industry Directory for On-Farm Biogas Recovery Systems
Martin Machinery LLC
Harlan Martin Tel: 660/458-7000 39425 Excelsior Drive Ext: Email: [email protected] # Yrs in Business: 26 Latham MO 65050 Fax: 660/458-7100 Web: # Employees: 20 US
Martin Machinery first entered the biogas industry in 1982 with the design and construction of 850-kW switch gear to parallel an induction generator to the utility. Additionally, the company supplied one 50-kW, one 100-kW, and four 350-kW electric biogas generator systems. Since the 1980s, the company has continued work on its Custom Designed Paralleling Switch Gear, making several updates as new technology became available. The company currently custom designs new and rebuilt electric generator systems to operate using biogas. It also services biogas units powered by engines with 460-cubic-inch to 7,040-cubic-inch engine blocks.
MCX Environmental Energy Corp.
Rasheed Mustakeem Tel: 404/816-2892 110 East Andrews Drive - Suite 309 Ext: Email: [email protected] # Yrs in Business: 10 Atlanta GA 30305 Fax: 404/237-7160 Web: www.mcxeec.com # Employees: 7 US
Global distributor of the Capstone microturbine.
Stewart & Stevenson, Distributed Energy Solutions
Jim Jodice Tel: 253/931-0138 10750 Telge Road Ext: Email: [email protected] # Yrs in Business: 100 Houston TX 77095 Fax: 253/931-1175 Web: www.ssss.com # Employees: 3000+ US
Stewart & Stevenson, Distributed Energy Solutions packages engine/generator sets for prime power and biogas applications. Stewart & Stevenson provides engineering, equipment, and construction services as well as operation and maintenance of power generation equipment.
SECOND EDITION Appendix I-23
Appendix I Industry Directory for On-Farm Biogas Recovery Systems
STM Power
Randy Thomas Tel: 610/323-4519 275 Metty Drive Ext: Email: [email protected] # Yrs in Business: 13 Ann Arbor MI 48103 Fax: 610/323-4870 Web: www.stmpower.com # Employees: 65 US
STM Power is a designer and developer of commercial-scale external combustion (Stirling cycle) engines.
Canada Composting Inc.
Kevin Matthews Tel: 905/830-1160 390 Davis Drive, Suite 301 Ext: Email: [email protected] # Yrs in Business: 8 Newmarket Ontario L3Y 7T8 Fax: 905-830-0416 Web: www.canadacomposting.com # Employees: 8 Canada
Canada Composting Inc. is a private company that holds the exclusive rights to the BTA-Process throughout Canada and the United States. The BTA-Process technology employs anaerobic digestion for the production of biogas and compost from organic waste.
Dresser ROOTS
John Parrish Tel: 281/966-4700 2135 Hwy 6 South Ext: Email: [email protected] # Yrs in Business: 148 Houston TX 77077 Fax: 281/966-4309 Web: www.rootsblower.com # Employees: US
Dresser ROOTS Blowers and Compressors manufactures and sells positive displacement rotary lobe blowers and vacuum pumps, as well as a complete line of centrifugal compressors. The company's product line covers from 5 to 300,000 cfm with differential pressures of up to 30 PSI and vacuum levels of up to 28" Hg.
SECOND EDITION Appendix I-24
Appendix I Industry Directory for On-Farm Biogas Recovery Systems
Kompogas AG
W. Schmid Tel: 41 1 809 71 00 Rohrstrasse 36 Ext: Email: [email protected] # Yrs in Business: 12 Glattbrugg CH-8152 Fax: 41 1 809 71 10 Web: www.kompogoas.ch # Employees: 50 Switzerland
Kompogas AG has developed an anaerobic process for the fermentation of biogenous yard and kitchen waste combined with energy production. Waste recycling using the Kompogas process offers numerous advantages. The end products obtained from the process include CO2-neutral renewable energy (biogas), as well as high-quality compost and liquid fertilizer. The biogas recovered provides energy in the form of heat, electric power, and vehicle fuel.
MWH Energy Solutions
Stephen Chippas Tel: 630/836-8977 27755 Diehl Road Ext: Email: [email protected] # Yrs in Business: 2 Warrenville IL 60555 Fax: 630/836-8959 Web: www.mwhglobal.com # Employees: 6 US
MWH Energy Solutions has extensive experience in the recovery, cleaning, and combustion of biogas. This expertise includes wastewater treatment plants, landfills, and agricultural applications. MWH can provide complete turnkey services including planning, design, procurement, construction, financing, and O&M services.
Norton Environmental Equipment, Ltd.
Steven Viny Tel: 216/447-0070 6200 Rockside Woods Blvd. Ext:148 Email: [email protected] # Yrs in Business: 3 Independence OH 44131 Fax: NA Web: # Employees: 6 US
Norton Environmental Equipment Company, Ltd. is the exclusive distributor for Komptech composting equipment in North America. Komptech's BFSC system is for digesting on-farm waste, including compost production and gas recovery. Several such systems have been installed and are operating successfully in Europe.
SECOND EDITION Appendix I-25
Appendix I Industry Directory for On-Farm Biogas Recovery Systems
Vaughan Company, Inc.
Mike Panther Tel: 360/249-4042 364 Monte-Elma Road Ext: Email: [email protected] # Yrs in Business: 42 Montesano WA 98563 Fax: 360/249-6155 Web: www.chopperpumps.com # Employees: 57 US
Vaughan Company, Inc. designs and builds complete hydraulic mixing systems for methane digesters and sludge-storage tanks. Each digester mixing system is supplied with a mixing guarantee. Vaughan Company, Inc. also manufactures a complete line of heavy-duty chopper pumps for sludge and manure with high concentrations of solids. The company has been a leader in solids-handling technology for over 40 years. Each pump is backed with a non-clog performance guarantee.
Equipment Suppliers/Distributors: Tanks
Engineered Storage Products Company
Dave Friederick Tel: 815/756-1551 345 Harvestore Drive Ext: Email: [email protected] # Yrs in Business: 52 Dekalb IL 60115 Fax: 815/756-1659 Web: www.slurrystore.com # Employees: 143 US
Engineered Storage Products Company (E.S.P.C.) performs feasibility assessments and designs and installs biogas systems. E.S.P.C. has designed biogas systems for seven farms in the United States and 10 farms in Europe. Representative projects include: 1) Huntington Dairy, a 600-cow dairy in Cooperstown, New York; and 2) University of Florida, a 500-cow dairy in Gainesville, Florida.
Alliant Energy
Duane Hanusa Tel: 608/742-0888 2777 Columbia Drive Ext: Email: [email protected] # Yrs in Business: 5 Portage WI 53901-9483 Fax: 608/742-0890 Web: www.alliantenergy.com # Employees: 7,200 US
Headquartered in Madison, Wisconsin, Alliant Energy Corporation is a growing energy-service provider with operations in the United States and abroad. The company provides electric, natural gas, water, and steam services to nearly three million customers worldwide.
SECOND EDITION Appendix I-26
Appendix I Industry Directory for On-Farm Biogas Recovery Systems
Chevron Energy Solutions
Felix Lopez; Dennis Potter Tel: 415/733-4531 345 California Street Ext: Email: [email protected] # Yrs in Business: 3 San Francisco CA 94104 Fax: 415-733-4954 Web: www.chevronenergy.com # Employees: 150 US
Chevron Energy Solutions' initial focus is on large dairies and waste treatment plants in California's Central Valley. Chevron Energy Solutions also supplies fuel cells, cogeneration, and microturbines, combined with other energy services.
Prime Power, Inc.
Guy Hallgren; Joel Moore Tel: 607/535-5407 535 South Madison Avenue Ext: Email: [email protected] # Yrs in Business: 4 Watkins Glen NY 14891 Fax: 607/535-8048 Web: primepwr.com # Employees: 3 US
Prime Power, Inc. provides complete service in the design, development, and construction of anaerobic digester systems and other alternative energy solutions. Prime Power is headquartered in Watkins Glen, New York, and is owned and operated by Joel Moore and Guy Hallgren. They have over 35 years combined experience in electric and gas engineering and construction.
Publishers
BioCycle Magazine
Jerry Goldstein Tel: 610/967-4135 419 State Avenue Ext:25 Email: [email protected] # Yrs in Business: 25 Emmaus PA 18049 Fax: 610/967-1345 Web: www.biocycle.net # Employees: 10 US
Published since 1960, BioCycle, Journal of Composting & Organics Recycling is recognized as the foremost magazine on using organic residuals to maximum advantage. The journal explores topics ranging from improving the health of soils and crops to producing renewable energy in the form of methane and alcohol fuels. In addition, the editors of BioCycle have published two special reports on renewable energy: "The BioCycle Guide to Anaerobic Digestion" and "Renewable Energy from Organics Recycling." Both reports are available from The JG Press, Inc., publisher of BioCycle. Publications can be ordered online at www.biocycle.net.
SECOND EDITION Appendix I-27
Appendix I Industry Directory for On-Farm Biogas Recovery Systems
Universities
University of Florida, Soil and Water Science Department
Dr. Ann C. Wilkie Tel: 352/392-8699 P.O. Box 110960 University of Florida Ext: Email: [email protected] # Yrs in Business: NA Gainsville FL 32611-0960 Fax: 352/392-8699 Web: http://soils.ifas.ufl.edu/ # Employees: NA US
Dr. Wilkie is an associate professor with the Soil and Water Science Department at the University of Florida and an environmental microbiologist. She investigates and develops bioremediation techniques for agricultural and industrial wastes, with emphasis on the microbial and environmental factors influencing biodegradation. Dr. Wilkie specializes in anaerobic microbiology and in the practical application of anaerobic digestion technologies for waste treatment, odor control, and biogas production.
SECOND EDITION Appendix I-28
Glossary
25 Year, 24 Hour Storm Event: The rainfall event with a probable recurrence interval of once in 25 years with a duration of 24 hours, as defined by the National Weather Service in technical Paper Number 40, “Rainfall Frequency Atlas of the United States:, May 1961, and subsequent amendments.
Aerobic Bacteria: Bacteria that require free elemental oxygen to sustain life.
Aerobic: Requiring, or not destroyed by, the presence of free elemental oxygen.
AgSTAR: A voluntary federal program that encourages the use of effective technologies to capture methane gas, generated from the decomposition of animal manure, for use as an energy resource.
Ally: Companies in the agricultural and energy industries that assist AgSTAR Partners by developing and distributing up-to-date technology for methane recovery systems.
Anaerobic: Requiring, or not destroyed by, the absence of air or free oxygen.
Anaerobic Bacteria: Bacteria that only grow in the absence of free elemental oxygen.
Anaerobic Lagoon: A treatment or stabilization process that involves retention under anaerobic conditions.
Anaerobic: A tank or other vessel for the decomposition of organic matter in the absence of elemental oxygen.
Anaerobic Digestion: The degradation of organic matter including manure brought about through the action of microorganisms in the absence of elemental oxygen.
Bacteria: A group of universally distributed and essentially unicellular microscopic organisms lacking chlorophyll.
Barn: A totally or partially enclosed structure where animals are confined.
Best Management Practice A practice or combination of practices found to be the most effective, practi-(BMP): cable (including economic and institutional considerations) means of prevent
ing or reducing the amount of pollution generated by nonpoint sources to a level compatible with water quality goals.
Biogas: Gas resulting from the decomposition of organic matter under anaerobic conditions. The principal constituents are methane and carbon dioxide.
Biomass: Plant materials and animal wastes used especially as a source of fuel.
Boar: An uncastrated male pig.
British Thermal Unit (BTU): The amount of heat required to raise the temperature of one pound of water one degree Fahrenheit. One cubic foot of biogas typically contains about 600 to 800 BTUs of heat energy. By comparison, one cubic foot of natural gas contains about 1,000 BTUs.
Bull: A mature (approximately 24 months of age or older) uncastrated male dairy or beef animal.
Calf: An immature dairy or beef animal up to approximately six months of age.
Carbohydrates: Any of various compounds of carbons, hydrogen, and oxygen (e.g., sugars, starches, and celluloses), which are generally formed by green plants. Carbohydrates are a principal source of energy in animal feeds and are excreted if not utilized.
Complete Mix Digester: A controlled temperature, constant volume, mechanically mixed vessel designed to maximize biological treatment, methane production, and odor control as part of a manure management facility with methane recovery.
SECOND EDITION Glossary-1
Glossary
Composting:
Confine:
Cover Fraction:
Covered Lagoon Digester:
Cow:
Cow-Dry:
Cow-Lac:
Dairy-Drylot:
Dairy-Free Stall:
Dairy-Tie Stall:
Dairy-Stand-Alone-Heifer:
DDB Depreciation:
Demand charge:
Digester:
Discount rate:
Down payment:
Drylot:
Drystack:
Effluent:
Endorsers:
Energy Charge:
Facultative:
Facultative Bacteria:
The biological decomposition and stabilization of organic matter under conditions which allow the development of elevated temperatures as the result of biologically produced heat. When complete, the final product is sufficiently stable for storage and application to land without adverse environmental effects.
A confinement facility for swine animals.
The fraction of the lagoon (0-100%) that is covered by an impermeable gas- and air-tight cover.
An anaerobic lagoon fitted with an impermeable, gas- and air-tight cover designed to capture biogas resulting from the decomposition of manure.
A mature female dairy or beef animal that has produced at least one calf.
A mature cow in the period between the cessation of lactation and calving.
A lactating dairy or beef cow.
A dairy farm where cows are confined and fed in an open lot, also called a corral or paddock in some regions.
A dairy farm where cows are confined in a totally or partially enclosed structure but are not confined in individual stalls.
A dairy farm where cows are confined in a totally or partially enclosed structure and are confined in individual stalls.
A dairy operation that specializes in raising calves as dairy cow replacements.
Double declining balance (DDB) depreciation is an accelerated depreciation method in which first year depreciation is double the amount of straight-line depreciation.
The peak kW demand during any quarter hour interval multiplied by the demand charge rate.
A concrete vessel used for the biological, physical, or chemical breakdown of livestock and poultry manure.
The interest rate used to convert future payments into present values.
The initial amount paid at the time of purchase or construction expressed as a percent of the total initial cost.
An enclosed, unpaved area where the animals can move about freely and where they can feed along a feed apron.
Solid or dry manure that is scraped from a barn, feedlane, drylot or other similar surface and stored in a pile until it can be utilized.
The discharge from an anaerobic digester or other manure stabilization process. Professional and trade associations, colleges and universities, institutions, and societies who support AgSTAR and encourage the use of renewable energy sources.
The energy charge rate times the total kWh of electricity used.
Living, active, or occurring in the presence or absence of free oxygen.
Bacteria living in the presence or absence of free oxygen. Facultative bacteria are important in the decomposition of manure.
Glossary-2 SECOND EDITION
Glossary
FarmWare: A computerized decision support system that allows the evaluation of the costs and benefits of AgSTAR methane recovery systems.
Fats: Any of numerous compounds of carbon, hydrogen, and oxygen that are glycerides of fatty acids, the chief constituents of plant and animal fat, and a major class of energy-rich food. "Fats are a principal source of energy in animal feeds and are excreted if not utilized."
Feed Apron: A paved or hard surface along one side of a drylot where feed is provided to the animals.
Feeder Pig: A pig from about 60 pounds to market weight.
Finisher: A swine animal finished for market.
Fixed Film Digester: An anaerobic digester in which the microorganisms responsible for waste stabilization and biogas production are attached to some inert medium.
Flushing System: A manure collection system that collects and transports manure using water.
Freeboard: The distance between the highest possible wastewater level in a manure stor-age/treatment structure and the top of the structure. Freeboard is an important design parameter in designing lagoons, ponds, storage basins, digesters, and other manure storage and treatment structures.
Gilt: A female swine that has not produced pigs and has not reached an evident stage of pregnancy.
Greenhouse Gas: An atmospheric gas, which is transparent to incoming solar radiation but absorbs the infrared radiation emitted by the Earth’s surface. The principal greenhouse gases are carbon dioxide, methane, and CFCs.
Grower: An immature male or female swine animal managed between weaning and finishing weights.
Heifer: A female dairy or beef animal that has not produced a calf.
Hydraulic Retention Time The average length of time any particle of manure remains in a manure treat-(HRT): ment or storage structure. The HRT is an important design parameter for
treatment lagoons, covered lagoon digesters, complete mix digesters, and plug flow digesters.
Inflation Rate: The annual rate of increase in costs or sales prices in percent.
Influent: The flow into an anaerobic digester or other manure stabilization process.
Internal Rate of Return (IRR): The discount rate that makes the NPV of an income stream equal to zero.
Kilowatt (kW): One thousand watts (1.341 horsepower).
Kilowatt Hour (kWh): A unit of work or energy equal to that expended by one kilowatt in one hour or to 3.6 million joules. A unit of work or energy equal to that expended by one kilowatt in one hour (1.341 horsepower-hours).
Lagoon: Any large holding or detention pond, usually with earthen dikes, used to contain wastewater while sedimentation and biological treatment or stabilization occur.
Land Application: Application of manure to land for reuse of the nutrients and organic matter for their fertilizer value.
Liquid Manure Manure having a total solids content of no more than five percent.
SECOND EDITION Glossary-3
Glossary
Loading Rate:
Loan Rate:
Manure:
Marginal Tax Rate:
Memorandum of Understanding (MOU):
Mesophilic:
Methane:
Methane Project Lifetime:
Methane Recovery Lagoon:
Minimum Treatment Volume:
Mix Tank:
Natural Gas:
Net Present Value (NPV):
Nonpoint Source Pollution:
NPV Payback:
Nursery:
Nursery Pig:
Nutrients:
Operating Volume:
Parlor:
Partner:
Pasture:
A measure of the rate of volatile solids (VS) entry into a manure management facility with methane recovery. Loading rate is often expressed as pounds of VS/1000 cubic feet.
The percent of the total loan amount paid per year.
The fecal and urinary excretions of livestock and poultry.
The percent of the methane recovery project net income to be paid in taxes.
An agreement between AgSTAR Partners, Allies, and Endorsers and the EPA stating the responsibilities and commitments agreed to by both parties.
Operationally between 80°F and 100°F (27°C and 38°C).
A colorless, odorless, flammable gaseous hydrocarbon that is a product of the decomposition of organic mater. Methane is a major greenhouse gas. Methane is also the principal component of natural gas.
The period of time during which the project is installed and completely paidfor.
See covered lagoon digester.
The minimum volume necessary for the design HRT or loading rate.
A control point where manure is collected and added to water or dry manure to achieve the required solids content for a complete mix or plug flow digester.
A combustible mixture of methane and other hydrocarbons used chiefly as a fuel.
The present value of all cash inflows and outflows of a project at a given discount rate over the life of the project.
Pollution resulting from intermittent discharges of pollutants from diffuse sources and is in transit over land before entering a water body.
The number of years it takes to pay back the capital cost of a project calculated with discounted future revenues and costs. Profitable projects will have an NPV Payback value less than or equal to the lifetime of the project.
An immature male or female swine animal managed between birth and grow-ing/finishing.
A weaned pig up to about 60 pounds live weight.
A substance required for plant or animal growth. The primary nutrients required by plants are nitrogen, phosphorus, and potassium. The primary nutrients required by animals are carbohydrates, fats, and proteins.
The volume of the lagoon needed to hold and treat the manure influent and the rain-evap volume.
Facility where lactating cows are managed before, during, and after milking.
A livestock producer who signs a Memorandum of Understanding (MOU) with the U.S. EPA and agrees to survey his/her facility and install methane recovery systems where profitable within 3 years.
An open area where the animals may roam freely.
Glossary-4 SECOND EDITION
Glossary
Payback Years: The number of years it takes to pay back the capital cost of a project.
pH: A measure of acidity or alkalinity. The pH scale ranges from zero to 14, with a value of 7 considered neutral. The lower a value, the higher the acidity, and the higher the value, the higher the alkalinity.
Piglet: A nursing pig.
Plug Flow Digester: A constant volume, flow-through, controlled temperature biological treatment unit designed to maximize biological treatment, methane production, and odor control as part of a manure management facility with methane recovery.
Point Source Pollution: Pollution entering a water body from a discrete conveyance such as a pipe or ditch.
Process Water: Water used in the normal operation of a livestock farm. Process water includes all sources of water that may need to be managed in the farm’s manure management system.
Proteins: Any of numerous naturally occurring extremely complex combinations of amino acids containing the elements carbon, hydrogen, nitrogen, and oxygen. Proteins are in animal feeds are utilized for growth, reproduction, and lactation and are excreted if not utilized.
Psychrophilic: Operationally between 54°F and 64°F (12°C and 18°C).
Pull Plug Pit: A series of one or more pits where manure is collected until it is utilized or transferred to a storage or treatment structure.
Rain-Evap Volume: The volume of the lagoon needed to hold the average rainfall on the surface and any watershed runoff minus the average evaporation at the surface.
Scrape System: Collection method that uses a mechanical or other device to regularly remove manure from barns, confine buildings, drylots, or other similar areas where manure is deposited.
Separator: A mechanical device or gravity settling basin that separates manure into solid and liquid fractions.
Settling Basin: A basin designed to separate solid and fibrous material in the manure from the liquid portion.
Sideslope: The slope of a lagoon embankment, often expressed as the ratio of the horizontal displacement and vertical displacement.
Simple Payback: The number of years it takes to pay back the capital cost of a project calculated without discounting future revenues or costs.
Sludge Volume: Volume to allow for sludge accumulation in a manure storage or treatment structure. Sludge volume is an important design parameter for manure storage and treatment structures.
Slurry (Semi-solid) Manure: Manure having a total solids content between five and ten percent.
Solids Manure Manure having a total solids content exceeding 10 percent.
Sow: A female pig that has produced at least one litter of piglets.
Storage Pond: An earthen basin designed to store manure and wastewater until it can be utilized. Storage ponds are not designed to treat manure.
Storage Tank: A concrete or metal tank designed to store manure and wastewater until it can be utilized. Storage tanks are not designed to treat manure.
SECOND EDITION Glossary-5
Glossary
Storm Runoff: Manure contaminated rainfall which must be stored and utilized on the farm and may not be discharged into rivers, streams, lakes, or other bodies of water.
Straight-Line Depreciation: Depreciation per year equals the total facility cost divided by the years of depreciation (usually the facility lifetime).
Supplemental Heat: Heat added to complete mix and plug-flow digesters to maintain a constant operating temperature to increase rates of waste stabilization and biogas production.
Swine-Farrow-to-Finish: A swine operation where pigs are raised from birth to market weight.
Swine-Farrow-to-Nursery: A swine operation where pigs are raised from birth to weaning.
Swine-Farrow-to-Feeder: A swine operation where pigs are raised from birth to approximately 60 pounds live weight.
Swine-Grow/Finish: A swine operation where feeder pigs are fed to market weight.
Supplemental Heat: Additional heat added to complete mix and plug flow digester to maintain a constant operating temperature at which maximum biological treatment may occur.
SYD Depreciation: Sum of Years' Digits (SYD) is a common accelerated depreciation method where the sum of the digits is the total of the numbers representing the years of depreciation (usually the facility lifetime).
Thermophilic: Operationally between 110°F and 140°F (43°C and 60°C).
Total Solids: The sum of dissolved and suspended solids usually expressed as a concentration or percentage on a wet basis.
Utility Interconnection: The method of utilizing electricity produced from manure management facilities. Options include either (1) on farm first use then sale to utility or (2) sale to the utility then direct purchase.
Volatile Solids: The fraction of total solids that is comprised primarily of organic matter.
Volatilization: The loss of a dissolved gas, such as ammonia, from solution.
Volumetric Loading Rate: The rate of addition per unit of system volume per unit time. Usually expressed as pounds of volatile solids per 1,000 cubic feet per day for biogas production systems.
Watershed: A facility of berms, channels, or other devices to collect and hold manure contaminated runoff for up to a 25yr-24 hr storm event.
Withdrawal Schedule: The fraction of the treated manure and water effluent that is withdrawn from the effluent storage facility each month.
Glossary-6 SECOND EDITION