air quality, particulate matter, and geographic ... · ... such as outdoor air pollution as an...
TRANSCRIPT
Air quality, particulate matter, and geographic characterization in a potential asthma prone region of eastern central Puerto Rico
R. Suro-Maldonado1, A. Gonzalez2 & A. Rivera-Rentas2 1Universidad Metropolitana, San Juan, Puerto Rico 2Universidad del Turabo, Gurabo, Puerto Rico
Abstract
Asthma is a rapidly growing worldwide chronic disease with an increase in both prevalence and exacerbations throughout the late twentieth century. Air pollution and asthma in the Caribbean are a major environmental health issue and a costly public health concern. CDC reports showed that Puerto Rico had a significantly higher overall prevalence of lifetime (19.6%) and current (11.6%) asthma in the US. The central eastern region of the island has the highest prevalence in the age range 0-17. This work examines ambient air measurements of particulate matter (PM2.5 and PM10), coupled with the spatial variations between rural and urban areas to study the relationship between air quality, anthropogenic activities, natural resources, and asthma occurrence. We sampled in the 11 communities of the municipality of Caguas, five (5) classified as urban districts and six (6) as rural areas. Our results indicate that on average the urban districts presented higher particulate matter concentrations than the rural areas. These higher concentrations in the urban districts may have anthropogenic origins while results from rural areas may have geomorphologic bases. Our results also revealed particulate matter concentrations at some areas and at certain time periods that were above the US National Ambient Air Quality Standards. The latter may be related to the high asthma prevalence reported for the municipality. Keywords: air quality, particulate matter, asthma, forests, Puerto Rico.
1 Introduction
Asthma is a rapidly growing worldwide chronic disease with an increase in both prevalence and exacerbations throughout the late twentieth century, with
© 2006 WIT PressWIT Transactions on Ecology and the Environment, Vol 86, www.witpress.com, ISSN 1743-3541 (on-line)
Air Pollution XIV 745
doi:10.2495/AIR06074

reported estimates of 300 million people having this illness (Donaldson et al. [1]; Masoli et al. [2]). Asthma attacks include repeated episodes of wheezing, breathlessness, chest tightness, and nighttime or early morning coughing and it is the most common long-term disease of children (Centers for Disease Control (CDC) [3]). Numerous epidemiological studies have linked environmental exposure, such as outdoor air pollution as an asthma trigger in children and the elderly (Lebowitz [4]). Diagnosis of asthma as well as asthma attacks in children has increased throughout the years and environmental exposures are among the many possibilities that have been proposed to explain this manifestation (Etzel [5]). This respiratory disease is the leading work-related lung disease, more than 10 million school days are lost because of asthma each year. Studies have demonstrated that asthma kills more than 5,000 Americans and results in half a million hospitalizations every year (Pérez et al. [6]). An increase in the prevalence, use of medical care, and mortality from asthma has been reported in the United States (US) and other western countries (Tenias et al. [7]). The CDC reported evidence of an increase in asthma related incidents for members of low-income minority groups, especially in the Hispanic community. This report revealed that Puerto Rico has a significant higher overall prevalence of lifetime (19.6%) and current (11.6%) asthma among all the US states and territories (MMWR [8]). Homa et al. [9] presented that among Hispanics in the US, Puerto Ricans have the highest overall asthma mortality rates. This study indicated that from 1990 to 1995 there were 30,785 deaths attributed to asthma in the US, of these, 1,663 were in Hispanics. Of the Hispanics deaths from asthma, 34% were in Puerto Ricans, 31% were in Mexican-American, 25% Cuban-American, and the remaining 25% in other Hispanic-Americans. The 2000 Behavioral Risk Factor Surveillance System (BRFSS) on the Puerto Rican population stated that almost half (45.6%) of asthmatics reported having children affected with the condition. The prevalence of asthma in any children of the interviewed was 33.2%, 51.3% were receiving treatment, and 30.6% and 24.3% reported having one (1) to three (3) visits to emergency departments, and hospital admissions resulting from asthma in the last year (Pérez et al. [6]). The central eastern region of the island has been identified as having the highest prevalence in the age range 0-17 as reported by the Puerto Rico Department of Health (PRDH) [10]. Even though studies suggest that genetic factors are key variables in the development of asthma, environmental triggers may determine the development and exacerbations of asthma; as a result, geographical differences can be expected (Etzel [5]; Pérez et al. [6]). These findings emphasize the public health concern of asthma towards the Puerto Rican population and the need for further research on the environmental factors that exacerbate this biomedical condition. The US Environmental Protection Agency (EPA) currently lists six (6) criteria air pollutants CO, lead, NO2, O3, PM, SO2. PM or particulate matter is the term for particles that consist of many different substances suspended in the air in the form of particles of solid or liquid matter, which vary widely in size, chemical composition, source, and that remain suspended in the air for long periods (Abelsohn et al. [11] and Maynard et al. [12]). PM can be classified in
© 2006 WIT PressWIT Transactions on Ecology and the Environment, Vol 86, www.witpress.com, ISSN 1743-3541 (on-line)
746 Air Pollution XIV
PM2.5, which describes the fine particles that are less than or equal to 2.5 µm in diameter and PM10 refers to all particles less than or equal to 10 µm in diameter. The latter is usually made up of a mixture of natural and anthropogenic sources but in the finer PM2.5 component almost all particles come from anthropogenic sources. While PM is unhealthy for anyone to breathe, people with lung disease, asthmatics, older adults, and children are especially at risk (Environmental Protection Agency (EPA) [13]). Sources of ambient PM include combustion sources such as trucks and passenger cars, off road equipment, industrial processes, forest and agricultural burning, fugitive dust from paved and unpaved roads, construction, agricultural activities, fertilizer operations and motor vehicles (California Air and Resources Board (CARB) [14]). PM research has increased throughout the years mainly because of the increase in air pollution and the adverse environmental and health effects. Numerous studies have provided evidence associating ambient PM as an asthma trigger (Abelsohn et al. [11]; Burge et al. [15]; Tenias et al. [7]; and Wallace et al. [16]). Particles that are small enough to get into the lungs can cause numerous health and environmental problems, many affecting the well being of people and becoming an important public health issue (Bernstein et al. [17]). High concentrations of PM10 have been linked with increased incidence and severity of respiratory illnesses. The smaller particles of PM2.5 are considered the most damaging to health, since they can more easily penetrate the respiratory tract (Beckett et al. [18]). Exposure to PM in ambient air aggravates a number of respiratory illnesses (CARB [14]). Studies also presented an association between PM levels and increase in emergency room visits for respiratory diseases, chronic obstructive pulmonary disease, and asthma. These studies suggest that ambient particulate pollution, even at relatively low concentrations exacerbates chronic respiratory conditions (Bernard et al. [19]; Atkinson et al. [20]). Evidence suggests that children, the elderly, and persons with pre-existing heart and lung disease are more vulnerable to exposure to ambient PM (Maynard et al. [12]). Amongst public health issues, asthma is one of the most common chronic diseases amongst individuals’ worldwide (Masoli et al. [2]). In Latin America and the Caribbean air quality is a major environmental health issue, especially in urban areas with high pollution levels (Hertel et al. [21]; Reyes et al. [22]). Spatial variation is an important component in the characterization of PM2.5 and PM10. Several reports demonstrated significant differences between urban and rural regions, where the urban sites account for higher concentrations of PM (Eiguren-Fernandez et al. [23]). Many of the research performed on spatial variability of PM concentrations and the development of asthma focused on the vicinity to major roads (urban backgrounds). Traffic related pollution accounts for most of the PM concentration, which may increase the effects on public health (Beckett et al. [24] and Hoek et al. [25]). As anthropogenic emissions will likely continue to rise, several studies have examined the benefits of trees in urban regions and their role in the reduction of pollutants. There is growing, and historical evidence that trees can be used to improve air quality. Studies in the United Kingdom by Beckett et al., 1998 (as cited in Beckett et al. [24]), revealed
© 2006 WIT PressWIT Transactions on Ecology and the Environment, Vol 86, www.witpress.com, ISSN 1743-3541 (on-line)
Air Pollution XIV 747

that trees provide many beneficial characteristics that enable them to capture pollutant particles and hence reduce their concentration in the air. Woodlands are of utmost importance in the uptake of particulates than shorter vegetation. Trees have greater leaf areas than other types of vegetation, much greater surface roughness, and they also create more turbulent mixing of the air passing over land than shorter vegetation (Beckett et al. [18]; Beckett et al. [26]). Evidence suggests that the presence of woodland in urban areas may thus improve air quality by the removal of gaseous pollutants and particles (Freer-Smith et al. [27]). Beckett et al. [18] stated that previous studies recognized the importance of urban-tree establishment to create dust filters in towns and cities. They emphasized the importance of trees in the urban areas, stating that trees can be effective in reducing the impacts of damaging forms of particulate pollution such as PM10, since they act as biological filters, removing large numbers of airborne particles and improving the quality of air in polluted environments. Studies examining the role of forests in air quality provided strong evidence that air quality improves with increased percentage tree cover (Nowak [28]). This study aims to examine ambient air measurements of particulate matter (PM2.5 and PM10), coupled with the spatial variations between urban and rural regions in order to study the relationship between air quality, anthropogenic activities, natural resources, and asthma occurrence. We performed environmental sampling for PM2.5 and PM10 mass data in urban and rural regions of the municipality of Caguas, located in the central eastern mountainous region of Puerto Rico. Caguas is amongst the top 10 municipalities in Puerto Rico with the highest asthma prevalence as reported by the PRDH [10]. This work contributes to the understanding of environmental factors and asthma as a biomedical environmental condition that is known to be a health disparity amongst underrepresented communities.
2 Materials and methods
2.1 Geography and meteorology
The municipality of Caguas, (18°15’49” N and 66°2’30”W), is located in the central eastern mountainous region of Puerto Rico, with an average population of over 140,502 (US Census [29]). Caguas is surrounded by the Central Mountain Range to the west, the Sierra de Cayey to the southeast and the Sierra de Luquillo to the northeast. It encloses the largest of the interior plains, known as the Caguas Valley covering an area of 41 km2 (“La geografía y los sistemas de información geográfica” [30]). Figure 1 illustrates the geographic location of the area of study. The highest elevations are the Lucero at 2,887 ft, Alto de la Mesa at 1,210 ft, and Los Altos de San Luis at 886 ft. This municipality is the largest in the central eastern region covering an area of 58 sq. mi., embracing 38,628 acres of land, with a large metropolitan and industrial area surrounded by mountains, hills, and forests (“La geografía y los sistemas de información geográfica” [30]). As many other cities, Caguas faces expanding urbanization, reduction of green
© 2006 WIT PressWIT Transactions on Ecology and the Environment, Vol 86, www.witpress.com, ISSN 1743-3541 (on-line)
748 Air Pollution XIV

spaces, high traffic congestion, and increase in air pollution. The climate is humid-tropical and since it is surrounded by mountains and hills the topography creates a stable temperature that is mainly warm. The predominant wind direction for Puerto Rico is eastward, which can be a factor in levels of ambient PM in this region because of the impact of other emission sources such as ashes from the active volcanoes in our neighboring island of Guadalupe and Monserrat, and airborne dust particles from the Sahara desert. According to Holdridge’s system of classification (as cited in Ewel and Whitmore [31]), this region occurs within the Subtropical Moist Forest Zone, which is the dominant life zone in Puerto Rico, covering more than 58% (5500 km2) of the area. This region is characterized by a mean annual rainfall of 1000 or 1100mm to about 2000 or 2200 mm and a mean biotemperature between 18 and 24°C. Most of the Subtropical Moist Forest Zone provides good climatic conditions for agriculture. At one time this forest was eliminated to provide space for agricultural activities. Much of the later successional forest is now evergreen forest of secondary origin (Ewel and Whitmore [31]). The combination of a variable geography, forest, prevailing winds, temperature, humidity conditions, and rainfall in this region create an excellent environmental setting for the continuing development of pollen, fungi, and mold that are known asthma triggers (Burge et al. [15]).
Figure 1: Topographic map of Puerto Rico illustrating the location of the Municipality of Caguas with the Central Mountain Range to the West, the Sierra de Cayey to the southeast, and the Sierra de Luquillo to the northeast.
2.1.1 Monitoring of air quality The Environmental Quality Board (EQB) of Puerto Rico has a series of sampling stations across the island, with the purpose of collecting air pollution data. The municipality of Caguas has one airborne particulate matter (PM2.5) sampler
Caribbean Sea
Atlantic Ocean
Caguas Valley
© 2006 WIT PressWIT Transactions on Ecology and the Environment, Vol 86, www.witpress.com, ISSN 1743-3541 (on-line)
Air Pollution XIV 749

monitored by this national agency (EQB [32]). The station is located in the central urban area of the municipality and does not monitor air quality in rural areas of the region. Thus, this study on the spatial variation of ambient concentrations of PM2.5 and PM10 in rural and urban regions of the municipality of Caguas will contribute with PM data in areas there not monitored before. We sampled in the 11 communities of the municipality. The Puerto Rico Planning Board (PRPB) [33], classifies five (5) of these communities: Río Cañas, Cañabon, Turabo, Bairoa, and Pueblo as urban and the remaining six (6): Beatriz, San Salvador, Borinquen, Cañaboncito, Tomas de Castro, and San Antonio as rural. PM measurements were obtained using the portable Met One 531 Aerosol Particulate Profiler programmed as a mass particulate monitor, where particles are detected, sized, and counted in multiple size ranges (data displayed as PM1, PM2.5, PM7, or PM10) (Met One Instruments, Inc., Grants Pass, OR.). We used a Magellan Global Positioning System (GPS) to determine the exact location and elevation of the sampling site, and a Sper Scientific Humidity and Temperature Meter-Datalogger was used to record the weather related parameters (Sper Scientific LTD). The duration of the sampling period was eight (8) weeks (March 14, 2005 - May 6, 2005), data was collected three (3) times a week from 8:00 AM to 5:10 PM rotating the hours for each location on every sampling day. A total of 1,452 samples were recorded, statistically analyzed, and integrated with GIS data. We performed summary statistics to analyze the spatial variation of PM2.5 and PM10 concentrations recorded between urban and rural sites. We calculated the arithmetic mean (M) and standard deviation (SD) of the total number of samples (N). Puerto Rico lacks national air quality standards and even though we know that air quality standards vary with environmental conditions we used the annual averages established by US EPA National Ambient Air Quality Standards (NAAQS) as our only point of reference to compare our results. The average results found in this study were compared with the NAAQS annual average for PM2.5 (15.0 µg/m3) and PM10 (50.0 µg/m3) (EPA [34]). Finally, we used Manifold 6.50 as our geographic information system (GIS) tool to characterize the geographic distribution of the PM2.5 and PM10 concentrations between the sampling sites.
3 Results and discussion
In this study we compared air pollution levels in urban and rural areas of the municipality of Caguas. Our main objective was to examine the spatial/geographic variation of ambient PM2.5 and PM10 mass concentrations in an asthma prone region in Puerto Rico. This approach allowed us to study the possible role of forest in air quality and their potential to become biological filters for environmental asthma triggers. Using a portable particulate profiler as a mass monitor we collected the PM measurements at each of the 11 communities of the municipality of Caguas. The PRPB classifies five (5) of the communities studied (Río Cañas, Cañabon, Turabo, Bairoa, and Pueblo) as urban, whereas the remaining six (6) communities (Beatriz, San Salvador, Borinquen, Cañaboncito, Tomas de Castro, and San Antonio) are classified as rural (PRPB [33]). For eight (8) weeks we monitored PM levels in all
© 2006 WIT PressWIT Transactions on Ecology and the Environment, Vol 86, www.witpress.com, ISSN 1743-3541 (on-line)
750 Air Pollution XIV

communities three (3) times a week from 8:00 AM to 5:10 PM. For each community the average PM concentration at each given time was determined by calculating the arithmetic mean (M) of the three (3) obtained samples. The map in Figure 2 illustrates the study area with the exact location of the sampling sites as per GPS data. Table 1 presents the total average (µg/m3) of PM2.5 and PM10 for both urban and rural communities in Caguas. These results indicated that urban areas have the highest average levels of PM2.5 and PM10 for the municipality of Caguas, with the exception of the rural community of San Antonio.
Figure 2: Map of study area with selected air-sampling sites.
Table 1: Average PM2.5 and PM10 Concentrations [µg/m3] at the 11 sampling sites.
URBAN AREAS RURAL AREAS Community PM2.5
(µg/m3) PM10 (µg/m3)
Community PM2.5 (µg/m3)
PM10 (µg/m3)
1. Río Cañas 5.03 23.83 1. Beatriz 4.20 17.91 2. Cañabon 5.03 20.85 2. San Salvador 4.66 18.95 3. Turabo 5.23 21.72 3. Borinquen 4.72 17.95 4. Bairoa 5.30 21.55 4. Cañaboncito 4.82 17.97 5. Pueblo 5.31 19.98 5.Tomas de Castro 4.84 19.68 AREA MEAN 5.18 21.59 6. San Antonio 6.32 25.03 AREA MEAN 4.93 19.92 NAAQS Annual Average PM2.5 = 15.0 µg/m3 NAAQS Annual Average PM10 = 50.0 µg/m3
© 2006 WIT PressWIT Transactions on Ecology and the Environment, Vol 86, www.witpress.com, ISSN 1743-3541 (on-line)
Air Pollution XIV 751

The rural community of San Antonio had the highest PM2.5 and PM10 average concentrations for the municipality as a whole. Further examination of this community revealed it has environmental characteristics of an urban area. Observations at the sampling site showed that it has a high density of heavy load truck traffic. In addition, it is situated nearby quarries, urban development, constructions, and demolitions. Our data also revealed that it is located within a low elevated forest area at 180 ft over mean sea level, recognized as the lowest elevation measured in our study. Results from this site presented similar average PM concentrations levels with the PRPB classified urban sites. The strong urban background observed and measured in this study indicate that the community of San Antonio classified by the PRPB as a rural site must be included as an urban site based on environmental conditions of the area. Table 2 shows the reorganization of the results of this work based on the above mentioned criteria including San Antonio as an urban site.
Table 2: Average PM2.5 and PM10 Concentrations [µg/m3] at the 11 sampling sites, including San Antonio as an urban site.
URBAN AREAS RURAL AREAS Community PM2.5
(µg/m3)PM10 (µg/m3)
Community PM2.5 (µg/m3)
PM10 (µg/m3)
1. Rio Cañas 5.03 23.83 1. Beatriz 4.20 17.91 2. Cañabon 5.03 20.85 2. San Salvador 4.66 18.95 3. Turabo 5.23 21.72 3. Borinquen 4.72 17.95 4. Bairoa 5.30 21.55 4. Cañaboncito 4.82 17.97 5. Pueblo 5.31 19.98 5. Tomas de Castro 4.84 19.68 6. San Antonio 6.32 25.03 AREA MEAN 4.65 18.49 AREA MEAN 5.37 22.16 NAAQS Annual Average PM2.5 = 15.0 µg/m3 NAAQS Annual Average PM10 = 50.0 µg/m3
Our results showed that regardless of the geographic classification of the sampling sites in Caguas the area mean for both PM2.5 and PM10 at urban and rural areas are below the NAAQS annual averages. The Puerto Rico EQB is responsible for the air quality monitory in the island. It has a PM2.5 monitoring station in the urban area of Caguas. In 2003 the EQB reported 7.2 µg/m3 PM2.5 level for this station with an annual peak of 32 µg/m3 (EQB [32]). In 2004, the EQB reported 6.5 µg/m3 PM2.5 level for this station with an annual peak of 25 µg/m3 (EQB [32]). The reported EQB annual average results for urban Caguas are below the NAAQS limits, while the annual reported peaks are above them. Even though this study was completed in 2005, the average PM2.5 reported in our study for both urban and rural areas are similar to those reported by the EQB in 2003 and 2004. Interestingly, the results from the San Antonio site are more similar to the urban data reported by the EQB in 2004. This data validates our recommendation to reclassify San Antonio as a rural area with an urban background or as an urban site due to its environmental conditions.
© 2006 WIT PressWIT Transactions on Ecology and the Environment, Vol 86, www.witpress.com, ISSN 1743-3541 (on-line)
752 Air Pollution XIV

The EQB also has a monitoring station in the municipality of Humacao, which is located southeast from Caguas. Since we do not have any official data from the EQB regarding PM10 for comparison reasons we used the data reported for Humacao. This station also located in the urban downtown area of the municipality monitors both PM2.5 and PM10. Table 3 summarizes the EQB results for this station.
Table 3: EQB reported data for the Humacao urban monitoring station.
PM2.5 (µg/m3) PM10 (µg/m3) Year Annual Mean Recorded
Peak Annual Mean
Recorded Peak
2003 5.47 23.9 23 91 2004 4.52 15.3 20 76
Humacao is within a 20 minutes drive from Caguas, and there are no significant physical or geographical boundaries between both municipalities. Interestingly the PM2.5 annual average for urban Caguas is higher than the one reported for Humacao. This may suggest a possible influence of anthropogenic sources such as traffic and development, as both urban areas lack forests and green areas. However, Caguas has a significantly higher number of industries, population, and development in its urban surroundings than Humacao. Nevertheless our results for PM10 in the studied urban areas are similar to those reported by the EQB for Humacao. Within the studied rural areas the Beatriz site had the lowest average concentration for both PM parameters. This site has the highest rural background of all sites. Beatriz is located in the southwestern mountain region of the municipality at an elevation of 1,479 ft over mean sea level; it is an area with high tree density, low vehicular traffic, and no major roads nor freeways. Within the urban sites, San Antonio had the highest levels of both PM2.5 and PM10. Even though it does not have a high population density, it has the lowest elevation of all sites, and a combination of forest and anthropogenic activities that impact the PM levels recorded. Pueblo (Downtown) and Bairoa sites also had high PM2.5 concentrations, and both sites have high population densities (24,023) Pueblo and (19,201) Bairoa (U.S. Census [29]). These communities are located in the metropolitan region of the municipality, with an increased urban development, large industrial sites, and a close proximity to major roads and freeways such as the San Juan Expressway number 52 and Caguas road number 1. The Río Cañas and Turabo sites had high PM10 average concentrations. These urban sites are located in low elevations, with observed high road traffic density, few green areas, and are in constant urban development. The results of this study are similar to those reported in the literature demonstrating that urban areas with significant anthropogenic activities and low or no green spaces exhibit higher PM levels than unpopulated forest dense areas. In this study we also collected PM data at all sites between 8:00 AM and 5:10 PM in order to examine potential peak PM concentrations at any given time
© 2006 WIT PressWIT Transactions on Ecology and the Environment, Vol 86, www.witpress.com, ISSN 1743-3541 (on-line)
Air Pollution XIV 753
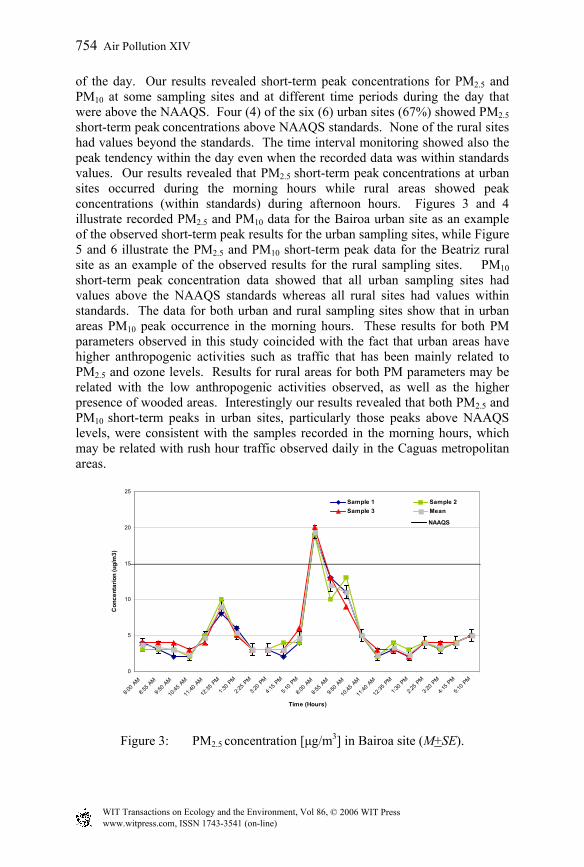
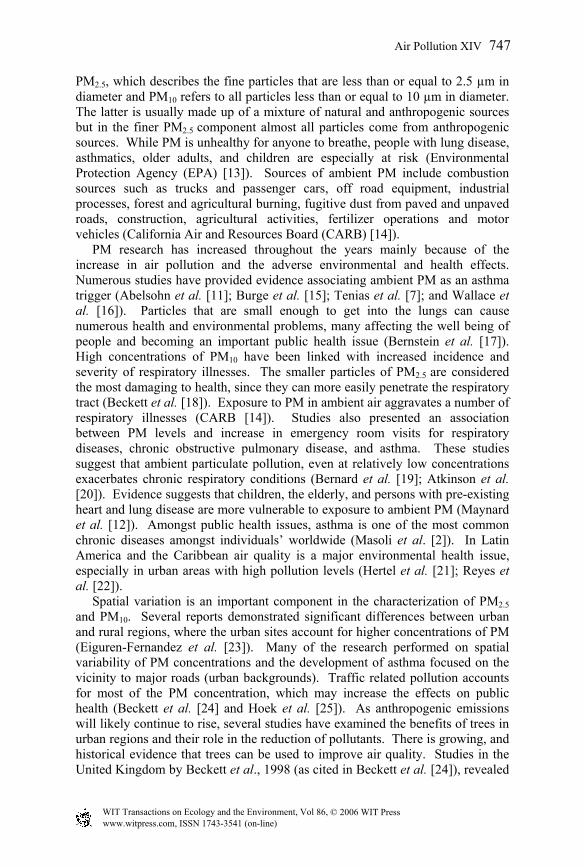
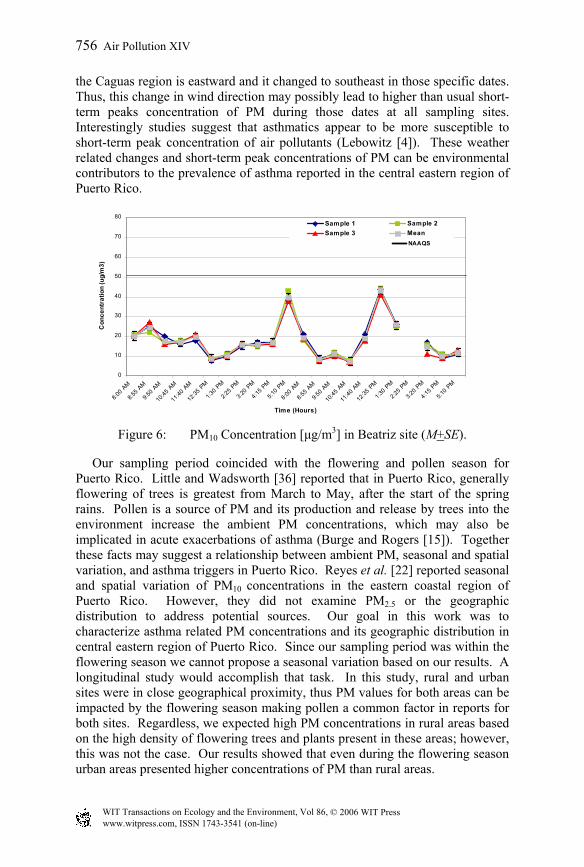
of the day. Our results revealed short-term peak concentrations for PM2.5 and PM10 at some sampling sites and at different time periods during the day that were above the NAAQS. Four (4) of the six (6) urban sites (67%) showed PM2.5 short-term peak concentrations above NAAQS standards. None of the rural sites had values beyond the standards. The time interval monitoring showed also the peak tendency within the day even when the recorded data was within standards values. Our results revealed that PM2.5 short-term peak concentrations at urban sites occurred during the morning hours while rural areas showed peak concentrations (within standards) during afternoon hours. Figures 3 and 4 illustrate recorded PM2.5 and PM10 data for the Bairoa urban site as an example of the observed short-term peak results for the urban sampling sites, while Figure 5 and 6 illustrate the PM2.5 and PM10 short-term peak data for the Beatriz rural site as an example of the observed results for the rural sampling sites. PM10 short-term peak concentration data showed that all urban sampling sites had values above the NAAQS standards whereas all rural sites had values within standards. The data for both urban and rural sampling sites show that in urban areas PM10 peak occurrence in the morning hours. These results for both PM parameters observed in this study coincided with the fact that urban areas have higher anthropogenic activities such as traffic that has been mainly related to PM2.5 and ozone levels. Results for rural areas for both PM parameters may be related with the low anthropogenic activities observed, as well as the higher presence of wooded areas. Interestingly our results revealed that both PM2.5 and PM10 short-term peaks in urban sites, particularly those peaks above NAAQS levels, were consistent with the samples recorded in the morning hours, which may be related with rush hour traffic observed daily in the Caguas metropolitan areas.
Figure 3: PM2.5 concentration [µg/m3] in Bairoa site (M+SE).
0
5
10
15
20
25
8:00 A
M
8:55 A
M
9:50 A
M
10:45
AM
11:40
AM
12:35
PM
1:30 P
M
2:25 P
M
3:20 P
M
4:15 P
M
5:10 P
M
8:00 A
M
8:55 A
M
9:50 A
M
10:45
AM
11:40
AM
12:35
PM
1:30 P
M
2:25 P
M
3:20 P
M
4:15 P
M
5:10 P
M
Time (Hours)
Con
cent
ario
n (u
g/m
3)
Sample 1 Sample 2Sample 3 Mean
NAAQS
© 2006 WIT PressWIT Transactions on Ecology and the Environment, Vol 86, www.witpress.com, ISSN 1743-3541 (on-line)
754 Air Pollution XIV
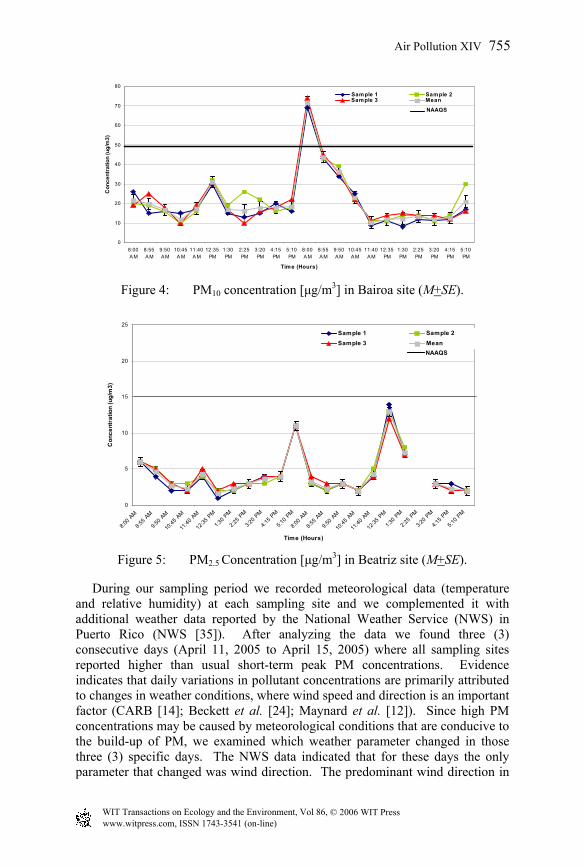
Figure 4: PM10 concentration [µg/m3] in Bairoa site (M+SE).
Figure 5: PM2.5 Concentration [µg/m3] in Beatriz site (M+SE).
During our sampling period we recorded meteorological data (temperature and relative humidity) at each sampling site and we complemented it with additional weather data reported by the National Weather Service (NWS) in Puerto Rico (NWS [35]). After analyzing the data we found three (3) consecutive days (April 11, 2005 to April 15, 2005) where all sampling sites reported higher than usual short-term peak PM concentrations. Evidence indicates that daily variations in pollutant concentrations are primarily attributed to changes in weather conditions, where wind speed and direction is an important factor (CARB [14]; Beckett et al. [24]; Maynard et al. [12]). Since high PM concentrations may be caused by meteorological conditions that are conducive to the build-up of PM, we examined which weather parameter changed in those three (3) specific days. The NWS data indicated that for these days the only parameter that changed was wind direction. The predominant wind direction in
0
10
20
30
40
50
60
70
80
8:00AM
8:55AM
9:50AM
10:45A M
11:40AM
12:35PM
1:30PM
2:25PM
3:20PM
4:15PM
5:10PM
8:00AM
8:55AM
9:50AM
10:45AM
11:40AM
12:35PM
1:30PM
2:25PM
3:20PM
4:15PM
5:10PM
Time (Hours)
Con
cent
ratio
n (u
g/m
3)
Sample 1 Sample 2Sample 3 Mean
NAAQS
0
5
10
15
20
25
8:00
AM
8:55
AM
9:50
AM
10:45
AM
11:40
AM
12:35
PM
1:30 P
M
2:25 P
M
3:20 P
M
4:15 P
M
5:10 P
M
8:00
AM
8:55
AM
9:50
AM
10:45
AM
11:40
AM
12:35
PM
1:30 P
M
2:25 P
M
3:20 P
M
4:15 P
M
5:10 P
M
Time (Hours)
Con
cent
ratio
n (u
g/m
3)
Sample 1 Sample 2Sample 3 Mean
NAAQS
© 2006 WIT PressWIT Transactions on Ecology and the Environment, Vol 86, www.witpress.com, ISSN 1743-3541 (on-line)
Air Pollution XIV 755
the Caguas region is eastward and it changed to southeast in those specific dates. Thus, this change in wind direction may possibly lead to higher than usual short-term peaks concentration of PM during those dates at all sampling sites. Interestingly studies suggest that asthmatics appear to be more susceptible to short-term peak concentration of air pollutants (Lebowitz [4]). These weather related changes and short-term peak concentrations of PM can be environmental contributors to the prevalence of asthma reported in the central eastern region of Puerto Rico.
Figure 6: PM10 Concentration [µg/m3] in Beatriz site (M+SE).
Our sampling period coincided with the flowering and pollen season for Puerto Rico. Little and Wadsworth [36] reported that in Puerto Rico, generally flowering of trees is greatest from March to May, after the start of the spring rains. Pollen is a source of PM and its production and release by trees into the environment increase the ambient PM concentrations, which may also be implicated in acute exacerbations of asthma (Burge and Rogers [15]). Together these facts may suggest a relationship between ambient PM, seasonal and spatial variation, and asthma triggers in Puerto Rico. Reyes et al. [22] reported seasonal and spatial variation of PM10 concentrations in the eastern coastal region of Puerto Rico. However, they did not examine PM2.5 or the geographic distribution to address potential sources. Our goal in this work was to characterize asthma related PM concentrations and its geographic distribution in central eastern region of Puerto Rico. Since our sampling period was within the flowering season we cannot propose a seasonal variation based on our results. A longitudinal study would accomplish that task. In this study, rural and urban sites were in close geographical proximity, thus PM values for both areas can be impacted by the flowering season making pollen a common factor in reports for both sites. Regardless, we expected high PM concentrations in rural areas based on the high density of flowering trees and plants present in these areas; however, this was not the case. Our results showed that even during the flowering season urban areas presented higher concentrations of PM than rural areas.
0
10
20
30
40
50
60
70
80
8:00 A
M
8:55 A
M
9:50 A
M
10:45
AM
11:40
AM
12:35
PM
1:30 P
M
2:25 P
M
3:20 P
M
4:15 P
M
5:10 P
M
8:00 A
M
8:55 A
M
9:50 A
M
10:45
AM
11:40
AM
12:35
PM
1:30 P
M
2:25 P
M
3:20 P
M
4:15 P
M
5:10 P
M
Time (Hours)
Con
cent
ratio
n (u
g/m
3)
Sample 1 Sample 2Sample 3 Mean
NAAQS
© 2006 WIT PressWIT Transactions on Ecology and the Environment, Vol 86, www.witpress.com, ISSN 1743-3541 (on-line)
756 Air Pollution XIV

The urban region of the municipality of Caguas has a variety of area wide sources that might be associated with the higher average PM concentrations observed in our study such as large industrial sites, increases in construction and demolition for urban development, and proximity to major roads and highways. Evidence suggests that these area wide sources contribute to the increases in PM pollution in urban areas (CARB [14]; Röösli et al. [37]). These results are similar to those of Eiguren-Fernandez et al. [23] who studied fine particle-phase (PM2.5) PAHs in urban and rural communities of Southern California, and observed higher concentrations in the urban communities than in rural areas, his study also presented that the exhaust emissions from motor vehicles was crucial to the observed particle-phase (PM2.5) PAH levels. In the rural region of our study, all of the sampling sites were located at the mountainous region of the municipality. Their elevations ranged from 1,094 ft in Tomas de Castro to 1,509 ft in Cañaboncito, as measured in this study using a GPS at each sampling site. Large green areas, in higher elevations, surrounded the sampling sites with an abundance of trees and vegetation, no major roads nor highways, and while obtaining the samples no high vehicular traffic was observed. The results of the spatial/geographical variation encountered between urban and rural regions could be strongly associated to the reported fact that trees and other vegetation act as biological filters, trapping and absorbing PM, helping improve air quality (Beckett et al. [18]; Beckett et al. [24]; Beckett et al. [26] and Freer-Smith et al. [27]). In addition to having a significant tree density, rural sites do not have major roads or freeways in its vicinity, thus we can assume that impact of vehicle exhaust is minimal. The latter also concurs with Hoek et al. [25], who performed environmental sampling for PM2.5 concentrations in urban and rural sites in various countries of Europe, concluding that the concentrations at rural sites were lower than those of the urban monitoring sites, mainly because of the difference in traffic intensity. There is strong evidence that trees are effective in the uptake of particulates, therefore contributing to the improvement of air quality in the environment. This work provided evidence that rural areas had lower PM concentrations and these areas are characterized as having high tree density, thus it supports the importance of forest areas as biological air pollution filters.
4 Conclusions
This work is the first effort to characterize ambient PM in an asthma prone region in Puerto Rico. We examined the geographical distribution of PM levels in the municipality of Caguas as well as potential sources of air pollution. Our results demonstrated that urban areas had a higher PM concentration than rural areas and these results concurred with previous reports in the literature. Our results also support the idea of enhancing air quality by increasing green areas in urban regions. PM is a well-known environmental asthma trigger and Caguas is one of the top 10 municipalities in Puerto Rico with reported asthma prevalence in the age range of 0-17 years old (PRDH [10]). Our results suggest that ambient PM concentrations coupled with anthropogenic activities in the urban areas as
© 2006 WIT PressWIT Transactions on Ecology and the Environment, Vol 86, www.witpress.com, ISSN 1743-3541 (on-line)
Air Pollution XIV 757

well as the geomorphology of the region, including its weather-environmental characteristics, may be related to and serve as synergistic factors that may aggravate and trigger asthma symptoms in the area. We propose that in order to have a more precise characterization of PM and its association with public health impacts, air quality, and seasonal and spatial variation in this region, future research should be performed during all seasons at urban and rural sites and focus on the identification of the physical and chemical properties of PM to have a better understanding of the environmental factors and the high prevalence of asthma as a biomedical condition known to be a health disparity among underrepresented communities.
References
[1] Donaldson, K., Gilmour, M.I. & MacNee, W., Asthma and PM10. Respir Res, 1(1), pp. 12-15, 2000.
[2] Masoli, Fabian, Holt & Beasley. Medical Research Institute of New Zealand, University of Southampton, Global Initiative for Asthma. (2003). Global Burden of Asthma. http://www.ginasthma.com/
[3] Centers for Disease Control and Prevention. (November 15, 2004). Asthma speaker’s kit for health care professionals. Air Pollution and Respiratory Health Branch, National Center for Environmental Health. http://www.cdc.gov/asthma/speakkit/intro.htm
[4] Lebowitz, M.D., Epidemiological studies of the respiratory effects of air pollution. Eur Respir J., 9, pp. 1029-1054, 1996.
[5] Etzel, R.A., How environmental exposures influence the development and exacerbation of asthma. Pediatrics, 112, pp. 233-239, 2003.
[6] Pérez, R., Pérez, C., Disdier, O. & Cintron, Y., Prevalence and correlates of asthma in the Puerto Rican population: Behavioral Risk Factor Surveillance System, 2000. Journal of Asthma, 40(5), pp. 465-474, 2003.
[7] Tenias, J.M., Ballester, F. & Rivera, M.L., Association between hospital emergency visits for asthma and air pollution in Valencia, Spain. Occup. Environ. Med., 55, pp. 541-547, 1998.
[8] Centers for Disease Control. Asthma prevalence and control characteristics by race/ethnicity- United States, 2002. MMWR, 53, pp. 145-148, 2004.
[9] Homa, D.M., Mannino, D.M. & Lara, M., Asthma mortality in U.S. Hispanics of Mexican, Puerto Rican, and Cuban heritage, 1990-1995. Am J Respir Crit Care Med, 161, pp. 504-509, 2000.
[10] Puerto Rico Department of Health (PRDH). Estudio Continuo de Salud para los Municipios de Puerto Rico Año 2001. www.salud.gov.pr/estadisticas/Estudio%20Continuo.htm
[11] Abelsohn, A., Stieb, D., Sanborn, M.D. & Weir, E., Identifying and managing adverse environmental health effects: 2. Outdoor air pollution. CAMJ, 166(9), 2002.
[12] Maynard, R., Krewski, D., Burnett, R.T., Samet, J., Brook, J.R., Granville, G., et al., Health and air quality: directions for policy-relevant research.
© 2006 WIT PressWIT Transactions on Ecology and the Environment, Vol 86, www.witpress.com, ISSN 1743-3541 (on-line)
758 Air Pollution XIV

Journal of Toxicology and Environmental Health, Part A, 66, pp. 1891-1903, 2003.
[13] National Air Quality 2001 Status and Trends, Particulate Matter; U.S. Environmental Protection Agency (EPA). http://www.epa.gov/air/airtrends/aqtrn01/pmatter.html
[14] The 2004 California Almanac of Emissions and Air Quality; California Air and Resources Board (CARB). http://www.arb.ca.gov
[15] Burge, H.A. & Rogers, C.A., Outdoor allergens. Environmental Health Perspectives, 108(S4), 2000.
[16] Wallace, L.A., Mitchell, H., O'Connor, G.T., Neas, L., Lippmann, M., Kattan, M., et al., Particle concentrations in inner-city homes of children with asthma: the effect of smoking, cooking, and outdoor pollution. Environmental Health Perspectives, 111, pp. 1265-1272, 2003.
[17] Bernstein, J.A., Alexis, N., Barnes, C., Bernstein, L., Nel, A., Peden, D., et al., Health effects of air pollution. Journal of Allergy and Clinical Immunology, 114(5), 2004.
[18] Beckett, K.P., Freer-Smith, P.H. & Taylor, G., Urban Woodlands: their role in reducing the effects of particulate matter pollution. Environmental Pollution, 99, pp. 347-360, 1998.
[19] Bernard, S.M., Samet, J.M., Grambsch, A., Ebi, K.L. & Romieu, I., The potential impacts of climate variability and change on air pollution-related health effects in the United States. Environmental Health Perspectives, 190(2), 2001.
[20] Atkinson, R.W., Anderson, H.R., Sunyer, J., Ayres, J., Baccini, M., Vonk, J.M., et al., Acute effects of particulate air pollution on respiratory admissions. Am J Respir Crit Care Med, 164, pp. 1860-1866, 2001.
[21] Hertel, O., Jensen, S.S., Andersen, H.V., Palmgren, F., Wahlin, P., Skow, H., et al., Human exposure to traffic pollution. Experience from Danish studies. Pure Appl. Chem., 73(1), pp. 137-145, 2001.
[22] Reyes, D.R., Rosario, O., Rodriguez, J.F. & Jiménez, B.D., Toxic evaluation of organic extracts from airborne particulate matter in Puerto Rico. Environmental Health Perspectives, 108(7), pp. 635-640, 2000.
[23] Eiguren-Fernandez, A., Miguel, A.H., Froines, J.R., Thurairatnam, S., & Avol, E.L., Seasonal and spatial variation of polycyclic aromatic hydrocarbons in vapor-phase and PM2.5 in Southern California urban and rural communities. Aerosol Science and Technology, 38, pp. 447-455, 2004.
[24] Beckett, K.P., Freer-Smith, P. & Taylor, G., Effective tree species for local air-quality management. Journal of Arboriculture, 26(1), pp. 12-19, 2000a.
[25] Hoek, G., Meliefste, K., Cyrys, J., Lewne, M., Bellander, T., Brauer, M., et al., Spatial variability of fine particle concentrations in three European areas. Atmospheric Environment, 36, pp. 4077-4088, 2002.
[26] Beckett, K.P., Freer-Smith, P. & Taylor, G., Particulate pollution capture by urban trees: effect of species and windspeed. Global Change Biology, 6, pp. 995-1003, 2000b.
© 2006 WIT PressWIT Transactions on Ecology and the Environment, Vol 86, www.witpress.com, ISSN 1743-3541 (on-line)
Air Pollution XIV 759

[27] Freer-Smith, P.H., Holloway, S. & Goodman, A., The uptake of particulates by an urban woodland: site description and particulate composition. Environmental Pollution, 95, pp. 27-35, 1997.
[28] Nowak, D.J., The effects of urban trees on air quality. USDA Forest Service, Northern Research Station, http://www.fs.fed.us/ne/syracuse
[29] Table PR-EST2001-02- Puerto Rico population change by municipio: April 1, 2000 to July 1, 2001 Source: Population Division, U.S. Census Bureau.
[30] La geografía y los sistemas de informaciόn geográfica. (2004; julio-diciembre). Caguas Informa a su Gente, 2(2), pp. 1-7.
[31] Ewel, J.J. & Whitmore, J.L., The ecological life zones of Puerto Rico and the U.S. Virgin Islands. Institute of Tropical Forestry, Forest Service/U.S. Department of Agriculture, Forest Service Research Paper, ITF-18, pp. 1-74, 1973.
[32] Puerto Rico Environmental Quality Board (EQB). Air Quality Area, Puerto Rico Air Quality Sampling Network, www.prtc.net/~jcaaqs/Index.html
[33] Puerto Rico Planning Board (PRPB), Municipio Autónomo de Caguas, http://www.caguas.gov.pr/
[34] United States Environmental Protection Agency (EPA). National Ambient Air Quality Standards (NAAQS), http://www.epa.gov/ait/criteria.html
[35] National Weather Service (NWS), Forecast Office, San Juan, PR, http://www.srh.noaa.gov/sju/
[36] Little, E.L. & Wadsworth, F.H., Common trees of Puerto Rico and the Virgin Islands (Introduction). Washington D.C., pp. 1-11, 1991.
[37] Röösli, M., Braun- Fahrländer, C., Künzli, N. & Oglesby, L., Spatial variability of different particulate matter within an urban environment and between urban and rural sites. J. Air & Waste Manage. Assoc., 50, pp. 1115-1124, 2000.
© 2006 WIT PressWIT Transactions on Ecology and the Environment, Vol 86, www.witpress.com, ISSN 1743-3541 (on-line)
760 Air Pollution XIV