air quality trends in the illawarra 2015 comply with australian standards and with the aaq nepm...
TRANSCRIPT

Air Quality Trends in the Illawarra
Current knowledge based on emission, monitoring and
modelling studies, and areas of ongoing research
September 2015
© Copyright State of NSW and Office of Environment and Heritage
With the exception of photographs, the State of NSW and Office of Environment and Heritage are
pleased to allow this material to be reproduced in whole or in part for educational and non-commercial
use, provided the meaning is unchanged and its source, publisher and authorship are acknowledged.
Specific permission is required for the reproduction of photographs.
The Office of Environment and Heritage (OEH) has compiled this technical report in good faith,
exercising all due care and attention. No representation is made about the accuracy, completeness or
suitability of the information in this publication for any particular purpose. OEH shall not be liable for
any damage which may occur to any person or organisation taking action or not on the basis of this
publication. Readers should seek appropriate advice when applying the information to their specific
needs.
All content in this publication is owned by OEH and is protected by Crown Copyright. It is licensed
under the Creative Commons Attribution 4.0 International (CC BY 4.0) , subject to the exemptions
contained in the licence. The legal code for the licence is available at Creative Commons .
OEH asserts the right to be attributed as author of the original material in the following manner: ©
State of New South Wales and Office of Environment and Heritage 2015.
Acknowledgements:
The report was authored by Lisa T.-C. Chang, Yvonne Scorgie and Toan Trieu of the Climate and
Atmospheric Science Branch of the Office of Environment and Heritage, with contributions by Alan
Betts, David Salter and Peter Crabbe. Inputs received from Environment Protection Authority staff
Paul Wearne, Jen Byrne, David Robinson, Nick Agapides and Gareth Jones are gratefully
acknowledged.
Cover: View of the Illawarra from Sublime Point. Photo: Jen Byrne/EPA
Published by:
Office of Environment and Heritage NSW
59 Goulburn Street, Sydney NSW 2000
PO Box A290, Sydney South NSW 1232
Phone: (02) 9995 5000 (switchboard)
Phone: 131 555 (environment information and publications requests)
Phone: 1300 361 967 (national parks, climate change and energy efficiency information, and
publications requests)
Fax: (02) 9995 5999
TTY: (02) 9211 4723
Email: [email protected]
Website: www.environment.nsw.gov.au
Report pollution and environmental incidents
Environment Line: 131 555 (NSW only) or [email protected]
See also www.environment.nsw.gov.au
ISBN: 978-1-76039-108-9
OEH 2015/0587
September 2015

Air Quality Trends in the Illawarra iii
Contents
Contents............................................................................................................................... iii
Executive summary .............................................................................................................. 1
1 Introduction ................................................................................................................. 6
2 Overview of the region ................................................................................................ 7
2.1 Population and topography .................................................................................. 7
2.2 Regional climate and meteorology ....................................................................... 7
3 Sources of information on emissions and air pollution ........................................ 12
3.1 Illawarra air quality monitoring network .............................................................. 13
3.2 NSW Greater Metropolitan Region Air Emission Inventory ................................. 17
3.3 National Pollutant Inventory................................................................................ 17
3.4 National shipping air emissions inventory ........................................................... 18
3.5 Particle speciation and source apportionment .................................................... 18
4 Air quality in the Illawarra ......................................................................................... 19
4.1 National ambient air quality standards ................................................................ 19
4.2 Overview of air quality in the Illawarra ................................................................ 20
4.3 Particle levels in the Illawarra ............................................................................. 23
4.4 Illawarra air quality compared with cities nationally and internationally .............. 29
4.5 Airborne particles composition and characterisation ........................................... 35
4.6 Ozone levels in the Illawarra .............................................................................. 37
4.7 Summary of findings .......................................................................................... 41
5 Sources of air pollution ............................................................................................ 43
5.1 Wollongong regional emissions compared to Sydney and Newcastle ............... 44
5.2 Contribution of human activities to total emissions in the Illawarra .................... 45
5.3 Particle emission sources in the Illawarra ........................................................... 46
5.4 Sources of gaseous emissions ........................................................................... 52
5.5 Recent trends in industrial emissions ................................................................. 57
5.6 Summary of findings .......................................................................................... 61
6 Air quality modelling ................................................................................................. 64
6.1 Contribution of interregional transport to ozone and particle events .................. 64
6.2 Future air quality ................................................................................................ 64
7 Research to further extend the evidence base ....................................................... 67
7.1 2013 NSW GMR Air Emissions Inventory ........................................................... 67
7.2 Regional airshed modelling ................................................................................ 67

iv Office of Environment and Heritage
7.3 Air quality forecasting ......................................................................................... 68
7.4 Particle characterisation ..................................................................................... 69
7.5 Emerging monitoring techniques ........................................................................ 69
7.6 Health effects of air pollution .............................................................................. 70
7.7 Air quality management research ....................................................................... 70
7.8 Climate change impacts on air quality ................................................................ 71
7.9 Research by science partners ............................................................................ 71
References .......................................................................................................................... 73
Appendix A – Seasonal wind roses for the Illawarra region .......................................... 76
Appendix B – Diurnal wind roses for Wollongong ........................................................... 80
Appendix C – Top source contributions to emissions within the Kiama, Shellharbour,
and Wollongong LGAs (EPA 2012) .......................................................................... 84
Figures
Figure 1: Study area for Air Quality Trends in the Illawarra ........................................................... 9
Figure 2: Annual average wind roses for the Illawarra ................................................................. 10
Figure 3: Estimated mixing height by time of day for Port Kembla ............................................. 11
Figure 4: Methods used to characterise outdoor air pollution ...................................................... 12
Figure 5: Current and decommissioned air quality monitoring stations in the
Illawarra region .................................................................................................................................... 15
Figure 6: OEH air quality monitoring stations at Albion Park (left) and Wollongong (right) .... 16
Figure 7: Daily maximum 8-hour average CO recorded at Wollongong monitoring stations
1992–2014 ........................................................................................................................................... 22
Figure 8: Annual average NO2 recorded at Illawarra regional monitoring stations
1992–2014 ........................................................................................................................................... 22
Figure 9: Annual average SO2 recorded at Illawarra regional monitoring stations
1992–2014 ........................................................................................................................................... 23
Figure 10: Annual average PM10 recorded at Illawarra regional monitoring stations
1992–2014 ........................................................................................................................................... 24
Figure 11: Maximum 24-hour average PM10 recorded at Illawarra regional monitoring
stations 1992–2014 ............................................................................................................................ 24
Figure 12: Annual average PM2.5 recorded at Illawarra regional monitoring stations
1992–2014 ........................................................................................................................................... 26
Figure 13: Maximum 24-hour average PM2.5 recorded at Illawarra regional monitoring
stations 1992–2014 ............................................................................................................................ 26
Figure 14: Long-term trend of daily average PM10 and PM 2.5 recorded at Wollongong
monitoring station 1994–2014 .......................................................................................................... 29
Air Quality Trends in the Illawarra v
Figure 15: Comparison of annual average PM10 concentrations for Illawarra with several
Australian and international cities 2010–11 (WHO 2014) ............................................................ 31
Figure 16: Comparison of annual average PM2.5 concentrations for Illawarra with several
Australian and international cities 2010–11 (WHO 2014) ............................................................ 32
Figure 17: Comparison of annual average of the 8-hour O3 daily maximum concentrations for
Illawarra, Sydney and the Illawarra (2013) with levels measured in international cities for
2011 (Environment Canada 2014) ................................................................................................... 33
Figure 18: AQI categories as a percentage of time in each region of NSW 2010–14
(OEH 2015b) ....................................................................................................................................... 34
Figure 19: Average PM2.5 mass and composition for Australian east coast sites,
July 1998 to May 2008 (ANSTO 2008) ........................................................................................... 35
Figure 20: Annual average PM2.5 composition for Warrawong 2000–09 (ANSTO 2014) ........ 36
Figure 21: Percentage contribution of chemical species to annual average PM2.5
concentration at Warrawong 2000–09 ............................................................................................ 37
Figure 22: Maximum 1-hour O3 measured at Illawarra regional monitoring stations
1992–2014 ........................................................................................................................................... 38
Figure 23: Maximum 4-hour O3 recorded at Illawarra regional monitoring stations
1992–2014 ........................................................................................................................................... 39
Figure 24: Long-term trend of daily 1-hour and 4-hour maximum O3 levels recorded at
Illawarra regional monitoring stations 1994–2014 ......................................................................... 41
Figure 25: Summary of total annual emissions for the Wollongong, Newcastle and Sydney
regions 2008 (kilotonnes per year) .................................................................................................. 45
Figure 26: Contribution of human and natural sources to total emissions in the
Wollongong, Shellharbour and Kiama LGAs 2008 (kilotonnes per year) .................................. 45
Figure 27: Geographic comparisons for PM10 and PM2.5 (a) total annual emissions
(tonnes/year) and (b) emission intensities (tonnes/year/km2) in Kiama, Shellharbour and
Wollongong LGAs 2008 ..................................................................................................................... 46
Figure 28: Major source group contributions to PM10 and PM2.5 emissions
in Kiama LGA (%) ............................................................................................................................... 47
Figure 29: Major source group contributions to PM10 and PM2.5 emissions
in Shellharbour LGA (%) .................................................................................................................... 47
Figure 30: Major source group contributions to PM10 and PM2.5 emissions
in Wollongong LGA (%) ..................................................................................................................... 47
Figure 31: PM2.5 shipping emissions for Port Kembla by machinery type (top) and activity
(bottom) (2010–11) (Goldsworthy & Goldsworthy 2014) ............................................................. 50
Figure 32: Vessel type contributions to PM2.5 emissions for Port Kembla (2010–11)
(Goldsworthy & Goldsworthy 2014) ................................................................................................. 50
Figure 33: Spatial distribution of PM10 emissions in the Illawarra region ................................... 51
Figure 34: Spatial distribution of PM2.5 emissions in the Illawarra region .................................. 51

vi Office of Environment and Heritage
Figure 35: Geographic comparisons for SO2, NOx and VOC (a) annual emissions
(tonnes/year) and (b) emission intensities (tonnes/year/km2) in Kiama,
Shellharbour and Wollongong LGAs ............................................................................................... 52
Figure 36: Major source group contributions to SO2, NOx and VOC emissions
in Kiama LGA (%) ............................................................................................................................... 53
Figure 37: Major source group contributions to SO2, NOx and VOC emissions
in Shellharbour LGA (%) .................................................................................................................... 53
Figure 38: Major source group contributions to SO2, NOx and VOC emissions
in Wollongong LGA (%) ..................................................................................................................... 54
Figure 39: Spatial distribution of SO2 emissions in the Illawarra region .................................... 56
Figure 40: Spatial distribution of NOx emissions in the Illawarra region .................................... 56
Figure 41: Spatial distribution of VOC emissions in the Illawarra region ................................... 57
Figure 42: Total industrial facility emissions for PM10, SO2, NOx and VOC in the Illawarra ... 58
Figure 43: Contribution of major source categories to total annual PM10 and PM2.5
emissions for the Illawarra based on the 2008 GMR Air Emissions Inventory ......................... 62
Figure 44: Spatial distribution of exceedences for 4 hour ozone > 80 ppb for recent years
(1996–2005) and projected for the near future (2021–30) and far future (2051–60)
(Cope et al. 2008). .............................................................................................................................. 65
Figure 45: OEH portable monitoring station able to hold up to seven air quality monitors
that comply with Australian Standards and with the AAQ NEPM ............................................... 69
Figure 46: Contour map video animations for black carbon, soil, ammonium sulfate
and PM2.5 mass .................................................................................................................................. 71
Figure 47: TCCON ground validation site at UOW ...................................................................... 72
Figure 48: Primary MUMBA campaign site in Wollongong ......................................................... 72
Tables
Table 1: Air quality monitoring stations in the Illawarra region operated by OEH .................... 14
Table 2: AAQ NEPM air quality standards...................................................................................... 19
Table 3: AAQ NEPM air quality standards and maximum ambient air pollutant
concentrations measured at OEH monitoring stations in the Illawarra region 1992–2014 ..... 20
Table 4: Number of days exceeding the national 24-hour PM10 standard of 50 µg/m³ at
Illawarra monitoring stations 1992–2014 (standard specifies not more than 5 exceedance
days per year) ..................................................................................................................................... 25
Table 5: Number of days exceeding the national 24-hour PM2.5 advisory reporting standard
recorded at Illawarra regional monitoring stations 1992–2014 .................................................... 27
Table 6. Number of days exceeding the national 1-hour O3 standard recorded at Illawarra
regional monitoring stations 1992–2014 ......................................................................................... 38
Table 7: Number of days exceeding the national 4-hour O3 standard at Illawarra regional
monitoring stations 1992–2014 ........................................................................................................ 39
Table 8: PM10 and PM2.5 emissions from major source groups for 2003 and 2008 in the
Illawarra ................................................................................................................................................ 49

Air Quality Trends in the Illawarra vii
Table 9: SO2, NOx and VOC emissions from major source groups in 2003 and 2008
within Illawarra region ........................................................................................................................ 54
Table 10: NPI-reporting industrial facilities in the Illawarra with the greatest PM10 and PM2.5
emissions for 2012–13 ....................................................................................................................... 59
Table 11: NPI-reporting industrial facilities in the Illawarra with the greatest NOx, VOC and
SO2 emissions for 2012–13 .............................................................................................................. 60


Air Quality Trends in the Illawarra 1
Executive summary
Air Quality Trends in the Illawarra provides an overview of how air quality has varied in the
Illawarra region over the 1992 to 2014 period, based primarily on data from the Office of
Environment and Heritage (OEH) air quality monitoring network. Reference is also made to
information from emission inventories, particle speciation studies and modelling research,
while the environmental factors affecting air quality and its impacts are also discussed. This
report is intended to inform air policies and programs implemented by NSW Environment
Protection Authority (EPA) to improve air quality in the region.
Regional context and air quality
The Illawarra region on the NSW east coast includes Wollongong, Shellharbour and Kiama
local government areas (LGAs) with a combined population of about 300,000 people. The
proximity to the coast and topography influences the local meteorology and therefore the air
quality of the region, with the escarpment and land–sea breeze circulation affecting wind
patterns and the height to which air pollutants can mix.
Air quality monitoring has been undertaken by OEH in the Illawarra since 1992, with carbon
monoxide (CO), nitrogen dioxide (NO2), sulfur dioxide (SO2), particulate matter (PM10, PM2.5)
and ozone (O3) measured at several sites to assess regional air quality affecting the general
population. Air quality in the Illawarra has been observed to be comparable with cities in New
South Wales and other Australian jurisdictions, and good by world standards. CO, NO2 and
SO2 concentrations have generally decreased since the 1990s, with recent measured levels
within national air quality standards.
Particle levels (PM10 and PM2.5) and ozone concentrations in the Illawarra are comparable with
the levels measured in Australian cities and below levels measured in several countries
abroad. However, these pollutants do exceed national standards from time to time, posing
pollution-related health risks to local communities. Health effects due to exposures to ambient
particle and ozone concentrations are also known to occur at levels which are below national
standards.
Ground-level ozone is a secondary photochemical pollutant formed in the air when precursor
pollutants, oxides of nitrogen (NOx) and volatile organic compounds (VOCs), react in the
presence of sunlight. Particle pollution incudes primary particles released directly from
sources, and secondary particles produced by chemical reactions between gases or between
gases and other particles in the air. The composition of PM2.5 has been found to typically
include ammonium sulfate, sea salt, black carbon, organic matter and soil. This indicates that
particle and gaseous emissions from natural and human-made sources contribute to ambient
PM2.5 concentrations.
Exceedances of particle standards often coincide with regional dust storms or bushfire events.
High ozone levels can occur as a result of photochemical smog produced from local
emissions, smog or precursors transported down the coast from Sydney, or emissions from
inland bushfires. Exceedances of the ozone standards generally occur during the warmer
months of the year, with peaks coinciding with periods of high temperatures and with regional
bushfire events.

2 Office of Environment and Heritage
Air emission sources in the Illawarra
Whereas the importance of interregional transport of air pollutants is recognised, an overview
of air pollution sources situated in the Illawarra is provided in the report. Major sources
contributing to total regional and LGA emissions were identified based on the most recent
NSW Greater Metropolitan Region (GMR) Air Emissions Inventory, undertaken for the 2008
calendar year. Trends in source emissions were evaluated by comparing information from the
2003 and 2008 GMR emission inventories, with reference also made to industry-reported
emissions data from the National Pollutant Inventory (NPI) for the 2008 to 2013 period.
Major sources of particle emissions in the Illawarra are industrial (70% of PM2.5 and 81% of
PM10 emissions) and domestic–commercial sources (12% of PM2.5 and 20% of PM10
emissions). Iron and steel production, and mining and extractive activities account for the bulk
of industrial emissions. Residential wood heating accounts for over 90% of particle emissions
from domestic–commercial sources. Other sources of particle emissions include on-road and
non-road mobile sources.
Significant sources of VOC emissions are natural (45%), domestic–commercial (30%) and on-
road mobile (10%). In the natural source category, biogenic emissions from vegetation is the
largest source. The use of solvents, aerosols and surface coatings by households and
commercial businesses accounts for about half of the VOC emissions from domestic–
commercial sources.
Notable sources of NOx emissions are industrial (60%), on-road mobile (26%), and non-road
mobile (11%). Iron and steel production is the greatest industrial source. Industrial sources
account for about 98% of the SO2 emissions in the Illawarra in 2008, with iron and steel
production contributing the bulk of these emissions. The highest levels of particle, SO2 and
ground-level ozone precursor emissions in the Illawarra occur in the industrial areas at Port
Kembla.
Total on-road mobile emissions reduced over the 2003 to 2008 period due to advances in
vehicle technology, more stringent national vehicle emission standards and the introduction of
cleaner fuels, despite increases in vehicle activity. Reductions in vehicle emissions are
projected to continue over the next 10 to 20 years in spite of the continued increase in vehicle
activity. However, some transport routes may experience an increase in vehicle emissions due
to more substantial growth in activity rates. Residential development along major transport
corridors can also increase the potential for greater exposure to air pollutants being released
from transport corridors.
No emission standards are in place for non-road mobile sources, which include diesel-
powered construction and mining equipment, rail locomotives, equipment at ports and ships.
This sector is the largest source of fine particles that remains largely unregulated. Increases in
particle, NOx and VOC emissions from non-road mobile sources between 2003 and 2008
occurred mainly because of increased activity levels. The lower SO2 emissions from non-road
mobile sources was largely due to refinements in the data and methods used for estimating
shipping emissions. Due to reductions in the sulfur content of diesel fuel prescribed by
national fuel quality standards, lower SO2 emissions were estimated for industrial non-road
vehicles.
Particle, SO2, NOx and VOC emissions from industrial and commercial sources decreased
over the 2003 to 2008 period. Regulation of EPA-licensed premises including the application
of increasingly stringent emission standards under the Protection of the Environment
Operations (POEO) Clean Air Regulation and the implementation of pollution reduction
programs is expected to have contributed to the reduction in emissions. Based on NPI-

Air Quality Trends in the Illawarra 3
reported facility data, emissions have increased in 2009–10 and 2010–11 but decreased in
more recent years. Changes in emissions at the Port Kembla steelworks have contributed to
the increase and subsequent reduction in recent years. Advances in emission estimation
techniques accounted in part for lower commercial source emissions in 2008.
Emissions from biogenic (i.e. natural and living) and geogenic (i.e. natural non-living) sources
include wind erosion of exposed areas, agricultural burning, bushfires and prescribed burning.
These emissions typically vary from year to year, with higher emissions occurring during
hotter, dryer years. Higher biogenic and geogenic emissions were estimated to occur in 2003
due to greater bushfire activity.
A 24% increase in fine particle emissions from domestic–commercial sources occurred over
the 2003 to 2008 period, due to equivalent increases in residential wood heater emissions.
Future air quality
Factors affecting future air quality in the Illawarra include regional growth, changes in transport
and industrial activity levels, and changes in climate and air quality management practices.
Potential reductions in on-road and industrial emissions in the region due to progressively
more stringent regulation and the general decline in industrial activity may be offset by
increased non-road mobile emissions and residential emissions (wood heaters; aerosols,
solvent and surface coatings use).
Changes in climate are also projected to affect future air quality in the region. Based on
modelling by the Commonwealth Scientific and Industrial Research Organisation (CSIRO),
climate change is projected to increase the number of days exceeding the ozone standard in
the Illawarra and the geographical extent of ozone impacts, as a result of increased
temperatures. Changes to rainfall, temperature and weather patterns may also increase the
frequency of dust storms and bushfire-related pollution events, leading to higher particle
emissions.
Research to further extend the evidence base
Future research will contribute to a better understanding of air pollution sources and impacts
in the region. Major research efforts by OEH, EPA and leading science partners include the
following:
Emissions inventory – EPA is updating the NSW GMR Air Emissions Inventory for the
2013 calendar year to improve the evidence on source contributions to total emissions. The
inventory update will include improvements, such as the inclusion of additional sources and
particle components to support regional particle modelling.
Regional airshed modelling – OEH’s Regional Airshed Modelling Program is being
implemented to progressively advance photochemical and secondary particle modelling
capabilities to enhance the evidence base for NSW air policy and support development
planning.
Air quality forecasting – The OEH Air Quality Forecasting Program is progressively
expanding the scope and enhancing the accuracy of air quality forecasting capabilities in
New South Wales. The intention is to design and develop a scalable, cost-effective and fit-
for-purpose forecasting capability, with a focus on forecasting ozone and particle pollution
within the GMR and key regional areas of New South Wales.

4 Office of Environment and Heritage
Particle characterisation – OEH, EPA and NSW Health continue to collaborate with
Australian Nuclear Science and Technology Organisation (ANSTO) and CSIRO to
undertake particle speciation and source apportionment studies in New South Wales. To
date, particle speciation studies have been undertaken for Sydney (OEH 2014a) and the
Upper Hunter (Hibberd et al. 2013) and a further study is underway in the Lower Hunter
(OEH 2015a). PM2.5 sampling and characterisation at Warrawong in the Illawarra,
conducted as part of ANSTO’s east coast Aerosol Sampling Program (ASP), is ongoing
and allows changes in particle composition over time to be tracked and compared to
particle composition measured at other sites.
Emerging monitoring techniques for rapid response – OEH recently established rapid
response air quality monitoring capabilities for deployment within New South Wales, with
OEH and EPA devising procedures to guide the implementation of such incidence
monitoring and the assessment and communication of measurement results. OEH’s
monitoring includes two portable stations able to hold up to seven air quality monitors that
comply with Australian Standards and the National Environment Protection Measure
(NEPM) for Ambient Air Quality (the ‘AAQ NEPM’), non-compliance monitors for rapid
deployment and ‘indicative’ measurement to support immediate decision-making,
meteorological monitors, telemetry and communications systems and web reporting
capabilities for incident monitoring. To further extend these capabilities OEH is
investigating air toxics sampling methods and emerging technologies.
Black carbon monitoring – Black carbon is a major component of airborne fine particulate
matter in urban areas and has received increasing attention internationally due to its effects
on urban air quality, public health and global climate. Although the monitoring of black
carbon is not required by Australian legislation, OEH is trialling the measurement of
Equivalent Black Carbon (EBC) using AE33 aethalometers at two sites located in the
Lower Hunter region. Research into the application of aethalometers to support source
apportionment is ongoing.
Health effects of air pollution – EPA, OEH and NSW Health collaborate with the
independent Centre for Air Quality and Health Research and Evaluation1 to initiate new
research to increase understanding of the health impacts, risks and costs of air pollution in
New South Wales. An evaluation of the health impacts of difference sources, types and
levels of airborne particles in New South Wales is due for completion in 2015. EPA, NSW
Health, the Centre for Air Pollution and Health Research and Evaluation and CSIRO are
collaborating on a study to estimate the health impacts of PM2.5 -related shipping emissions
in the Greater Metropolitan Region, including Port Kembla. This research is expected to be
completed in 2015. EPA is supporting the University of Tasmania in an interstate study on
the relative health effects of smoke pollution from bushfire events and planned hazard
reduction burns. This is a multi-year study initiated in 2014.
Air quality management – EPA leads a range of projects assessing the technical
feasibility and benefits and costs of a range of air pollution mitigation measures. These
include the assessment of measures implementable by the industrial and commercial
sector, and measures to address emissions from residential wood burning and the non-
road mobile sector (industrial vehicles, locomotives, shipping). The EPA-commissioned
assessment of the technical feasibility, ship-owner/operator costs and emission impacts of
1 www.car-cre.org.au

Air Quality Trends in the Illawarra 5
adopting emission reduction measures for shipping in the Greater Metropolitan Region is
due for completion during the first half of 2015.
Climate change impacts on air quality – Projections of climate change and related
impacts on regional air quality are being undertaken as part of the NSW and ACT Regional
Climate Modelling (NARCliM) project, a multi-agency research partnership between the
NSW and ACT governments and the Climate Change Research Centre at The University of
New South Wales. This research will address future trends in both ozone and particle
pollution.

6 Office of Environment and Heritage
1 Introduction
Community research undertaken by the NSW Government has consistently found that air
quality is a key environmental issue for NSW residents (OEH 2012). Providing information to
local communities on air quality is listed as a high priority in NSW 2021 – A plan to make NSW
number one (NSW Government 2014).
The Office of Environment and Heritage (OEH) supports industry and communities in
understanding air pollution and their role in making our air cleaner. OEH also gathers and
analyses information on air quality in our towns and cities to keep local communities informed
about the air they breathe, and works with the NSW Environment Protection Authority (EPA)
and NSW Health to provide a scientific basis for measures to reduce air pollution and protect
the community's health.
Air Quality Trends in the Illawarra, prepared by OEH, provides an overview of how air quality
has varied in this region over the 1992 to 2014 period, based primarily on data from the OEH
Illawarra air quality monitoring network. Reference is also made to information from emission
inventories, particle speciation studies and modelling research, while a description is also
provided about the environmental factors such as topography, population, climate,
meteorology and sources of atmospheric emissions which affect air quality and contribute to
its impacts.
An overview of the region and available information sources to inform the assessment of air
quality trends is provided in Sections 2 and 3 respectively. Air quality trends measured in the
Illawarra are discussed in Section 4, with information on sources and emissions of
atmospheric emissions provided in Section 5 and air quality modelling studies discussed in
Section 6. An overview of research underway to improve our understanding of past, present
and future air quality in the Illawarra region is presented in Section 7.
This report is intended to inform air policies and programs implemented by EPA to improve air
quality in the region.

Air Quality Trends in the Illawarra 7
2 Overview of the region
The Illawarra region on the NSW east coast, south of Sydney, includes Wollongong,
Shellharbour and Kiama local government areas (LGAs) (Figure 1)2. An overview of
information relevant to regional ambient air quality in the region is provided in this section,
including a description of the topography, population, climate and meteorology.
2.1 Population and topography
The combined population of the three LGAs is approximately 300,000 with about 70% of
people residing in the Wollongong LGA.
The region has over 100 kilometres of coastline, characterised by long sandy beaches, rivers,
large protected estuaries and small coastal bays protected by large sandstone headlands.
The coastal plain is clearly delineated from the rolling hills of the Southern Highlands in the
west, by the sharp rise of the Illawarra escarpment which stretches 120 kilometres from the
sea cliffs of Royal National Park in the north to the junction of the Shoalhaven and Kangaroo
rivers in the south. The escarpment rises from 300 metres above sea level in the north to 700
metres in the south around Albion Park.
Land use in the region includes national parks, agricultural and mineral extractive lands,
fisheries and urban areas comprising residential, commercial and industrial areas.
2.2 Regional climate and meteorology
The proximity of the Illawarra region to the coast and its topography significantly influences the
local meteorology and hence the air quality of the region. The meteorology influences the
generation, dispersion, transportation and eventual removal of pollutants from the
atmosphere. The behavior of air pollutants is dependent on the prevailing winds, the stability
of the atmosphere, the depth to which pollutants are able to disperse and the amount of
rainfall.
2.2.1 Rainfall and temperature
The Illawarra region has a mostly cool temperate climate, with an average annual rainfall
slightly under 1100 millimetres. Precipitation is nearly uniformly distributed throughout the year
with slight summer–autumn dominance. The highest precipitation occurs to the east of the
steep escarpment, south of Wollongong, with an average annual precipitation of over 1600
millimetres. Summers are mild throughout most of the region, with winters cool closer to the
Southern Highlands (OEH 2014b).
2.2.2 Regional wind and mixing height
Annual average wind roses (Figure 2) indicate the prevailing winds are largely aligned with the
orientation of the coast at coastal meteorological monitoring sites. South-westerly winds are
2 This geographical definition of the Illawarra was selected to align with the Illawarra region delineation used in the
EPA’s air policies and programs.

8 Office of Environment and Heritage
prevalent at Wollongong, with north-easterly airflow representing the next most prominent flow
quadrant. At Bellambi and Kiama, northerly and southerly airflows occur frequently, as do
offshore airflows with a westerly component. Inland, airflow patterns are strongly influenced by
the local terrain. Southerly to south-easterly flow occurs more frequently at Albion Park South,
with westerly winds prevalent at Kembla Grange.
Seasonal wind roses, given in Appendix A, illustrate intra-annual variations in airflow patterns
occurring due to seasonal changes in synoptic-scale circulation. During winter, offshore
westerly flow occurs frequently over much of the region. During summer, onshore airflow
becomes more frequent, with such flow occurring as northerly, north-easterly, southerly and
south-easterly winds depending on the configuration of the coastline in relation to monitoring
station locations. More varied airflow patterns are characteristic of autumn and spring.
The surface wind field is strongly influenced by topography and local land–sea breezes (Hyde
et al. 1997). The escarpment can result in the deflection of surface winds and the decoupling
of winds above and below the escarpment. Inversions may form at the top of the escarpment,
limiting the dispersion of pollutants in the region. The vertical structure of the atmosphere is
also influenced by the land–sea breeze circulation, and the interface between land and marine
air masses. Onshore sea breezes occur during the daytime, with return flow observed above
the sea breeze in the region. At night, westerly drainage flows from the escarpment have been
observed over much of the region (Hyde & Prescott 1984). Diurnal variations in airflow
patterns for Wollongong are illustrated in Appendix B. Stronger north-easterly (onshore) wind
occurs during the daytime in summer, with the sea breeze strengthened by synoptic
circulation patterns. Whereas during the night time in autumn and winter, strong south-
westerly (offshore) winds occur as a result of the combined influence of synoptic and land
breeze circulations.
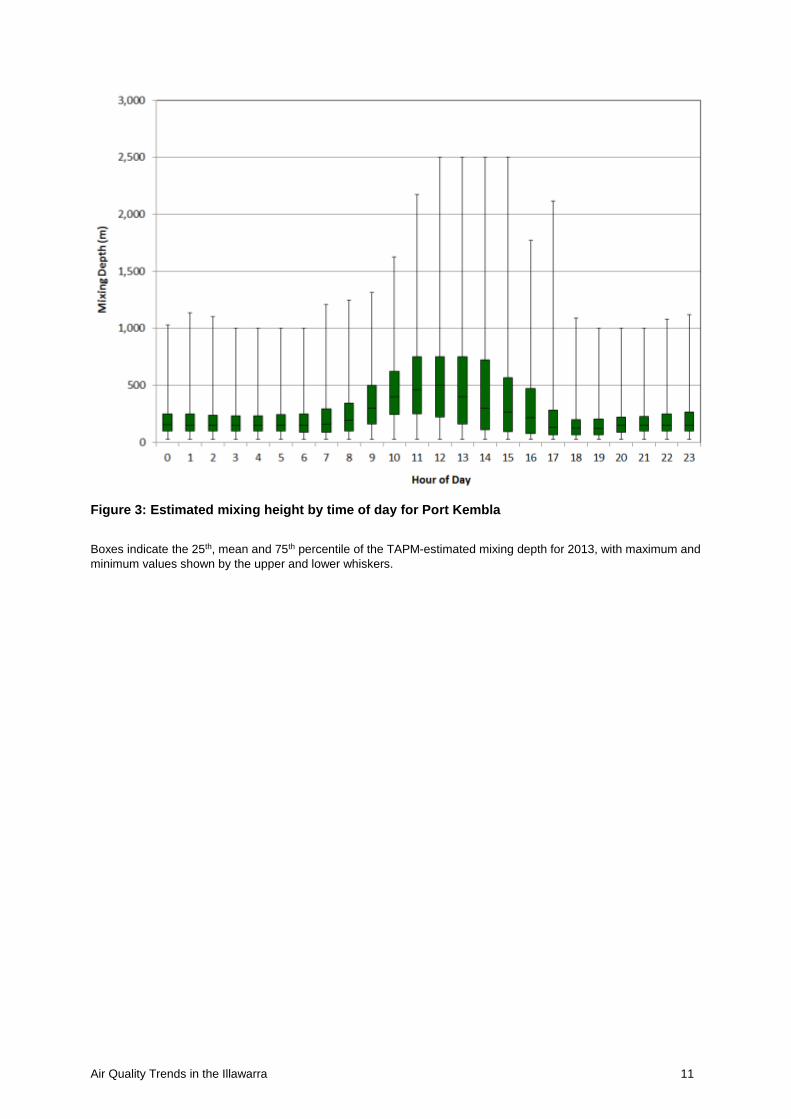
The height to which air pollutants are able to mix is termed the ‘mixing depth’. Mixing depth is
not routinely measured at meteorological sites and needs to be estimated. Diurnal variations
in the mixing depth for Port Kembla, projected using CSIRO’s The Air Pollution Model (TAPM)
prognostic meteorological model for 2013, are shown in Figure 3. The mixing depth and extent
to which pollution will accumulate or disperse in the atmosphere is dependent on the degree
of thermal (convective) and mechanical turbulence. Mixing depth typically increases during the
day as the heat from the sun promotes convective mixing, with maximum depths occurring in
the mid to late afternoon periods at the time of peak solar energy. High wind speeds in
combination with surface roughness generate mechanical turbulence which enhances the
extent of the mixing zone.

Air Quality Trends in the Illawarra 9
Figure 1: Study area for Air Quality Trends in the Illawarra

10 Office of Environment and Heritage
Figure 2: Annual average wind roses for the Illawarra3
3 Wind roses for Wollongong, Kembla Grange, Albion Park South are generated from OEH air quality monitoring
data for 2013 and Warrawong for 2005; wind roses for Bellambi, Kiama are generated from Bureau of Meteorology
(BOM) weather stations for 2013.
Air Quality Trends in the Illawarra 11
Figure 3: Estimated mixing height by time of day for Port Kembla
Boxes indicate the 25th, mean and 75th percentile of the TAPM-estimated mixing depth for 2013, with maximum and
minimum values shown by the upper and lower whiskers.

12 Office of Environment and Heritage
3 Sources of information on emissions and air pollution
To understand how air pollution varies over time and across regions, and what sources
contribute to it, we draw on a range of information sources and methods. Emission
inventories, ambient air quality monitoring, particle characterisation studies and air quality
modelling are important methods for air quality assessment and management, as shown in
Figure 4.
Figure 4: Methods used to characterise outdoor air pollution
These methods are used to characterise air pollution in the region, with further analysis then
undertaken to assess the effects of pollution on human health and the environment.
Increasingly, these methods are improving our understanding of pollutants emitted directly into
the air and pollutants formed in the atmosphere such as ozone and secondary particle
pollution.
The NSW Greater Metropolitan Region Air Emissions Inventory provides information on
natural and human-made sources of air emissions including primary particle emissions and
precursor gas releases which lead to ground-level ozone and secondary particle formation.
Information from the emissions inventory is used, together with meteorological and terrain
Emissions
Natural and human-made sources
Particles and precursor gases
Terrain and land use
Coastal areas, valleys, regional areas, urban areas
Meteorology
Wind and weather
Air chemistry
Secondary particles and ozone formed
Emission inventories
Natural and human-made sources of a wide range of air pollutants including particles and gaseous pollutants
Air pollutant modelling
Transport, mixing and removal of pollutants. More complex models can account for ozone and secondary particles formed in the air.
Air quality monitoring
Measurement of PM2.5, PM10, O3, SO2, CO, NO2 at air quality monitoring stations
Particle speciation and source apportionment
Particles are sampled and their chemical composition and potential sources identified
Outdoor air pollution
How pollution levels vary over time and across regions
Chemical composition of particles
Particle size
Sources of particles
AMBIENT AIR POLLUTION
AIR QUALITY ASSESSMENT TOOLS
ENVIRONMENTAL FACTORS
Air Quality Trends in the Illawarra 13
data within air quality models, to predict air pollutant concentrations. Other sources of
emissions information relevant to the Illawarra include the National Pollutant Inventory (NPI)
and a national shipping air emissions inventory compiled by the Australian Maritime College,
University of Tasmania.
The NSW air quality monitoring network provides continuous, high quality measurements of
air pollutant concentrations at a number of sites and makes this information available to
government and communities in near real-time (i.e. within an hour of the measurement being
made). This network is intended to monitor regional air quality relevant for assessing more
widespread general population exposures and compliance with national air quality standards.
Air pollutants which are typically measured include particles (including PM10: particulate matter
with a diameter of less than 10 micrometres, and PM2.5: particulate matter less than 2.5
micrometres in diameter), sulfur dioxide (SO2), carbon monoxide (CO), ozone (O3) and
nitrogen dioxide (NO2). Further information on the Illawarra air quality monitoring network is
given in Section 3.1.
Protection of the Environment Operations Act 1997 (POEO Act) scheduled activities, for
example coal mines and power stations, may be required to monitor the concentration of air
pollutants as a result of a condition of an environment protection licence. This monitoring is
generally intended to measure source-related peak air pollutant concentrations under specific
conditions, and is usually not acceptable for assessing compliance with national air quality
standards.
Since it is not possible to measure pollution everywhere, air quality models are used to
provide additional information on how air pollution levels vary over a region. Models are also
useful for assessing the extent to which air emissions affect pollutant concentrations and allow
us to project future changes in air pollutant levels and evaluate the benefits of emission
reduction measures.
Particles can be made up of a range of chemical species depending on the source of the
particle or the precursor gases from which they form. So the chemical composition of particles
in the air can, in some cases, indicate the source of the particles. In particle speciation
studies, airborne particles are sampled and the chemical composition of the particles
determined. Mathematical models, known as ‘receptor models’, are then used to estimate
source contributions to the particles occurring at the measurement site.
3.1 Illawarra air quality monitoring network
In the Illawarra, OEH currently operates air quality monitoring stations at Wollongong, Albion
Park South and Kembla Grange to characterise regional air quality. Ozone (O3), nitrogen
oxides (NOx, NO, NO2), PM10, PM2.5, sulfur dioxide (SO2), carbon monoxide (CO), visibility
and meteorology (wind speed, wind direction, air temperature and relative humidity) are
continuously monitored at these stations. Lead monitoring was discontinued in 2004 due to
reductions in ambient lead levels to well below the national standard. Air quality monitoring
was previously conducted at Albion Park, Albion Park Rail and Warrawong (Table 1).
Locations of current and decommissioned monitoring stations are shown in Figure 5.
The Wollongong and Kembla Grange stations were established in 1992 and 1994
respectively. The station at Albion Park South was established in 2005 and was a
replacement for the Albion Park station. Each air quality monitoring station conforms to the
National Environment Protection Measure (NEPM) for Ambient Air Quality (the ‘AAQ NEPM’)
requirements of providing a representative measure of regional air quality across the Illawarra

14 Office of Environment and Heritage
region. The monitoring sites are also designed to conform, as far as practical, to the Australian
Standard AS/NZS 3580.1.1:2007 Methods for sampling and analysis of ambient air – Part 1.1:
Guide to siting air monitoring equipment. The Illawarra air quality monitoring network was
upgraded in 2014–15; see Box 1 for further details.
Table 1: Air quality monitoring stations in the Illawarra region operated by OEH
Station Year established
Ozo
ne (
O3)
Nit
rog
en
oxid
es
(NO
x)
Part
icle
s (
PM
10)
Part
icle
s (
PM
2.5)
Carb
on
mo
no
xid
e
(CO
)
Su
lfu
r d
ioxid
e
(SO
2)
Vis
ibil
ity
(nep
helo
metr
y)
Mete
oro
log
y
Wollongong (a)
1992 (1994)(1998)
Albion Park South (b)
2005
Kembla Grange (b)
1994 (2004) (2015)
Albion Park 1998 (operated till 2005)
Albion Park Rail
1992 (operated till 1997)
Warrawong 1993 (operated till 2006)
(1993)(1996)
(a) Wollongong monitoring station is a classified as a ‘trend’ air quality monitoring station under the AAQ NEPM and therefore measures a more complete suite of air pollutants.
(b) Albion Park South and Kembla Grange monitoring stations are classified as ‘performance’ monitoring stations under the AAQ NEPM, comprising permanent upper bound stations where selected pollutants are measured to ensure that major pollutant events are captured and reported.

Air Quality Trends in the Illawarra 15
Figure 5: Current and decommissioned air quality monitoring stations in the Illawarra region

16 Office of Environment and Heritage
Box 1 – Upgrades to Illawarra air quality monitoring stations
The Illawarra air quality monitoring network was upgraded during the September 2014 to March 2015
period to replace assets past their useable life, modernise with the latest technology, standardise
station configuration across the statewide air quality monitoring network, improve data acquisition
validity and instrument online time and improve work health and safety. The following specific
improvements were made to the Illawarra network:
An entirely new monitoring site was established at Kembla Grange, located just 50 metres away
from the original site, with provision made for a new concrete footing, fencing and a new shed.
PM10 is measured using a tapered element oscillating microbalance (TEOM) analyser in line with
Australian Standards (AS/NZS 3580.9.8:2008). New 1405 TEOMs were installed at the
Wollongong, Albion Park South and Kembla Grange sites to replace PM10 monitoring using the
more dated 1400ab TEOMs.
PM2.5 monitoring was initiated at Kembla Grange with the installation of a Beta Attenuation
Monitor (BAM) Thermo 5014i instrument. BAM monitoring of PM2.5 is in line with Australian
Standards (AS/NZS 3580.9.12:2013).
Existing monitoring sheds were replaced at all three sites with new sheds comprising modernised
configurations, reduced carbon footprint due to better insulation, improved work health and safety
by using a work platform instead of fall restraint systems and improved aesthetics.
New data loggers were installed at all three sites comprising a new industrial type with a
completely solid-state design to eliminate malfunctions related to moving parts such as hard disk
drives and cooling fans.
Relative humidity and temperature sensors were replaced with sensors allowing digital output due
to the data logger requiring digital inputs.
Uninterruptable power supply (UPS) units were installed at all three sites to keep the data logger
powered during power outages.
Permanently mounted staircases and access platforms were installed to replace the ladders being
used to gain access to the roof of the monitoring sheds to perform maintenance on the instrument
inlets and meteorological instrumentation. This represents a significant work health and safety
improvement.
Figure 6: OEH air quality monitoring stations at Albion Park (left) and Wollongong (right)

Air Quality Trends in the Illawarra 17
3.2 NSW Greater Metropolitan Region Air Emission Inventory
The NSW Greater Metropolitan Region (GMR) Air Emissions Inventory developed by the EPA
is the most comprehensive study of air emissions in Australia. It is used for:
evaluating the effectiveness of existing air quality programs, such as the Protection of the
Environment Operations (Clean Air Regulation) 2010 for EPA-licensed industry, service
stations and residential wood heaters
identifying new cost-effective approaches for improving air quality, like the Dust Stop
program for EPA-licensed coal mines
fulfilling NSW state of the environment reporting obligations.
The EPA updates the emissions inventory every five years, gathering data from various
household, commercial business and EPA-licensed industry surveys, as well as a wide range
of government and non-government service providers. The most recent inventory, for the 2008
calendar year, was published in 2012 and is available on the EPA website (EPA 2012). The
next update, for the 2013 calendar year, is due to be finalised in 2016.
The inventory covers Sydney, Newcastle and Wollongong and surrounding regions, known
collectively as the Greater Metropolitan Region (GMR). It presents emissions and their
sources for over 1000 pollutants in the GMR, where about 75% of the NSW population
resides. In the Illawarra, the inventory covers the entire Wollongong and Shellharbour LGAs
and 66% of the Kiama LGA (169 square kilometres of the total 258 square kilometres).
The inventory includes emissions from biogenic (i.e. natural and living), geogenic (i.e. natural
non-living) and anthropogenic (i.e. human-made) sources, as follows:
natural (e.g. bushfires, marine aerosols and vegetation)
commercial businesses (e.g. non-EPA-licensed printers, quarries and service stations)
domestic activities (e.g. residential lawn mowing, portable fuel containers and wood
heaters)
industrial premises (e.g. EPA-licensed coal mines, oil refineries and power stations)
non-road vehicles and equipment (e.g. dump trucks, bulldozers and marine vessels)
on-road transport (e.g. registered buses, cars and trucks).
The pollutants detailed in the inventory include primary emissions of total suspended particles
(TSP), PM10 and PM2.5, and emissions of precursors of ground-level ozone and secondary
particles, as well as other common pollutants, organic compounds, metals and greenhouse
gases.
A web-based tool Air Emissions in My Community (EPA 2014a) provides an accessible way
for the community to learn about air emissions. It presents data at a glance from the air
emissions inventory in a variety of interactive chart views. The data can be displayed for
different geographical areas, ranging from the entire NSW Greater Metropolitan Region down
to postcode level.
3.3 National Pollutant Inventory
In addition to the NSW GMR Air Emissions Inventory, annually updated emissions data for
industrial facilities are available from the National Pollutant Inventory (NPI) program. The NPI

18 Office of Environment and Heritage
contains information on emissions reported annually by industrial facilities, with the collated
information made available to the public on the NPI website at www.npi.gov.au. Only
industries which exceed NPI thresholds are required to report their emissions, which are
calculated and submitted by industry and validated by state or territory environmental
regulators.
Due to the scope and scientific rigour of the NSW GMR Air Emissions Inventory, this data set
is considered the primary source of information on sources of atmospheric emissions for the
Greater Metropolitan Region, including the Illawarra. However, given that the NSW GMR Air
Emissions Inventory is updated every five years, with 2008 being the most current inventory
year available, the NPI provides a useful indication of trends in emissions from industrial
facilities over more recent years.
3.4 National shipping air emissions inventory
The Australian Maritime College, University of Tasmania, has compiled a 2010–11 national
emissions inventory, which includes ship engine exhaust emissions and fuel consumption in
Australian waters and ports (Goldsworthy & Goldsworthy 2014, 2015). Emissions are
estimated by vessel type for regions within 300 kilometres of major capital cities, including
bulk carriers, containers, crude oil tankers, general cargo carriers and passenger ships etc.
The emissions inventory includes PM10, PM2.5, VOC, CO, SO2 and NOx emission estimates, in
addition to estimates for various air toxics and greenhouse gases.
3.5 Particle speciation and source apportionment
Particle speciation and source apportionment studies have been commissioned by the NSW
Government for Sydney and the Upper and Lower Hunter to determine the characteristics of
PM2.5 particles and identify the relative contribution of emission sources to airborne fine
particles. Similar studies have been undertaken by the Australian Nuclear Science and
Technology Organisation (ANSTO) for a number of Australian east coast sites including a site
in the Illawarra at Warrawong.

Air Quality Trends in the Illawarra 19
4 Air quality in the Illawarra
Past trends and the current state of ambient air quality in the
Illawarra region is described in this section. Reference is mainly
made to air pollution measurements from the OEH-operated
Illawarra air quality monitoring network, with the levels
measured compared to national air quality standards. Since
particle and ozone pollution levels do exceed national standards
from time to time, a more detailed discussion of these pollutants
is given. The chemical composition of airborne fine particles is
described using information from the ANSTO Aerosol Sampling
Program. Particles (PM10 and PM2.5) and ozone concentrations
in the Illawarra are also compared with levels measured in
various cities in Australia and overseas, and generally found to
be good by national and world standards.
4.1 National ambient air quality standards
To help protect the health of the Australian population, the National Environment Protection
Measure for Ambient Air Quality (‘AAQ NEPM’) sets national ambient air quality standards for
six criteria pollutants: carbon monoxide (CO), nitrogen dioxide (NO2), sulfur dioxide (SO2),
ozone (O3), lead (Pb) and particles as PM10 as well as an advisory reporting standard for PM2.5
(Table 2). AAQ NEPM standards for PM2.5, PM10, SO2, NO2 and O3 are currently under review.
Australian Environment Ministers have agreed to revise the AAQ NEPM particle standards by
end-2015.
Table 2: AAQ NEPM air quality standards
Pollutant Averaging
period Standard
Maximum allowable exceedences
Carbon monoxide (CO) 8 hours 9.0 ppm 1 day a year
Nitrogen dioxide (NO2) 1 hour
1 year
0.12 ppm
0.03 ppm
1 day a year
None
Sulfur dioxide (SO2)
1 hour
1 day
1 year
0.20 ppm
0.08 ppm
0.02 ppm
1 day a year
1 day a year
None
Photochemical oxidants (as ozone O3) 1 hour
4 hours
0.10 ppm
0.08 ppm
1 day a year
1 day a year
Lead (Pb) 1 year 0.5 µg/m³ None
Particles as PM10 (a) 1 day 50 µg/m³ 5 days a year
Particles as PM2.5 (a) 1 day
Annual
25 µg/m³ (b)
8 µg/m³ (b)
1 day a year
Not applicable
(a) Particles smaller than 10 micrometres in diameter (PM10) and smaller than 2.5 micrometres in diameter (PM2.5).
(b) AAQ NEPM advisory reporting standard – the NEPM aims to collect sufficient PM2.5 data to develop national standards.
Air quality information is
available in near real-time from
the OEH website:
www.environment.nsw.gov.au/
AQMS/hourlydata.htm
Air quality information for the
Illawarra is also routinely
reported within NSW annual air
quality statements and NSW
annual NEPM compliance
reports:
www.environment.nsw.gov.au/
aqms/datareports.htm

20 Office of Environment and Heritage
4.2 Overview of air quality in the Illawarra
Air quality monitoring has been undertaken in the Illawarra since 1992, which has included
CO, NO2, SO2, PM10, PM2.5 and O3 at several sites (i.e. Albion Park, Albion Park Rail, Albion
Park South, Kembla Grange, Warrawong and Wollongong). The OEH air quality monitoring
network in the Illawarra is intended to characterise the regional air quality, i.e. the air quality
the region’s population is exposed to.
Concentrations of CO, NO2 and SO2 recorded at OEH air quality monitoring stations have
generally decreased since the 1990s, with recent levels recorded to be within national air
quality standards. No exceedance of the national air quality standard for CO has been
recorded during the 1992 to 2014 period (Figure 7 and Table 3). Over this entire period, the
maximum 8-hour average CO concentration measured was 4.9 ppm (in 1995), which is 55%
of the national standard. In 2013, the maximum CO concentration was 2.7 ppm which is 30%
of the national standard.
Similarly, no exceedances of the 1-hour and annual average NO2 standards were recorded
during the 1992 to 2014 period (Figure 7, Table 3). The maximum 1-hour average NO2
concentration recorded (0.09 ppm at Wollongong in 1993), is 75% of the national standard.
The maximum annual NO2 concentration measured (0.012 ppm at Wollongong in 1994) is
40% of the national standard. In 2014 the maximum 1-hour and annual average NO2
concentrations were 32% and 27% of the relevant national standards respectively.
Historically, maximum 1-hourly SO2 levels exceeded the national standard on only three
occasions: once at Wollongong (1993) and twice at Albion Park (1992 and 1993) (Figure 8,
Table 3). One of the major point-source emitters of SO2 in the region ceased operation in
2002, which has resulted in a significant drop in SO2 concentrations. In 2014, the maximum
1-hour average SO2 concentration measured in the region (0.02 ppm) was 10% of the national
standard. No exceedances of either the maximum 24-hour or annual average SO2 standards
have been recorded at OEH air quality monitoring stations.
Although, in general, particles (PM10 and PM2.5) and ozone concentrations in the Illawarra are
comparable with other Australia cities and good by world standards, these pollutants do
exceed national standards from time to time, posing air-pollution-related health risks to local
communities (Table 3). Further discussion of ambient particulate matter and ozone levels and
emission sources contributing to ambient concentrations of these sources is provided in
subsequent sections.
Table 3: AAQ NEPM air quality standards and maximum ambient air pollutant concentrations
measured at OEH monitoring stations in the Illawarra region 1992–2014 (total exceedences of
the standard are shown, not accounting for maximum allowable exceedences)
Pollutant Averaging
period Standard
Exceedences (1992–2013)
Maximum concentration (same units as the standard), (% of the standard)
1992–2013 2014
Carbon monoxide (CO)
8 hours 9.0 ppm
None 4.9 (55 %)
Wollongong 1995
0.9 (10%)
Wollongong

Air Quality Trends in the Illawarra 21
Pollutant Averaging
period Standard
Exceedences (1992–2013)
Maximum concentration (same units as the standard), (% of the standard)
1992–2013 2014
Nitrogen dioxide (NO2)
1 hour 0.12 ppm
None 0.09 (75%)
Wollongong 1993
0.04 (33%)
Wollongong
1 year 0.03 ppm
None 0.012 (40%)
Wollongong 1994
0.008 (27%)
Wollongong
Sulfur dioxide (SO2)
1 hour 0.20 ppm
3 in Wollongong (1993)
2 in Warrawong (1993)
2 in Albion Park (1992, 1993)
0.287 (144%)
Wollongong 1993
0.02 (10%)
Wollongong
1 day 0.08 ppm
None 0.034 (43%)
Wollongong 1994 0.019 (23%)
Albion Park South
1 year 0.02 ppm
None
0.002 (10%)
Wollongong 1999, 2001
Warrawong 2001
0.001 (5%)
Wollongong, Albion Park South
Photochemical oxidants (as ozone O3)
1 hour 0.10 ppm Total of 64(a) 0.144 (144%)
Albion Park 1997
0.094 (94%)
Kembla Grange, Albion Park South
4 hours 0.08 ppm Total of 94(b) 0.124 (155%)
Albion Park 1997
0.08 (100%)
Kembla Grange
Particles as PM10
1 day 50 µg/m³ Total of 177(c)
1360 (2720%)
Albion Park South
2009(e)
99.2 (198%)
Kembla Grange
Particles as PM2.5
1 day 25 µg/m³
19 in Warrawong
28 in Wollongong(d)
241 (964%)
Wollongong 2009(e)
17.3 (69%)
Wollongong
Annual 8 µg/m³
3 in Warrawong (2002, 2003,
2004)
1 in Wollongong (2002)
9.4 (118%)
Warrawong 2002
7.1 (89%)
Wollongong
(a) Detailed information is given in Table 6 (b) Detailed information is given in Table 7 (c) Detailed information is given in Table 4 (d) Detailed information is given in Figure 13 (e) The high particle concentrations measured in 2009 coincided with the large regional dust storm event in September 2009 which affected air quality across much of New South Wales.

22 Office of Environment and Heritage
Figure 7: Daily maximum 8-hour average CO recorded at Wollongong monitoring stations
1992–2014
Figure 8: Annual average NO2 recorded at Illawarra regional monitoring stations 1992–2014

Air Quality Trends in the Illawarra 23
Figure 9: Annual average SO2 recorded at Illawarra regional monitoring stations 1992–2014
4.3 Particle levels in the Illawarra
4.3.1 PM10 concentrations
PM10 levels vary significantly from year to year, as shown by annual average concentrations
recorded in the Illawarra over the 1992 to 2014 period (Figure 10). Annual average PM10
levels are generally in the range of 10 micrograms per cubic metre (µg/m3) to 25 µg/m3 and
below the NSW EPA Impact Assessment Criterion of 30 µg/m3. Reference was made to the
NSW EPA Impact Assessment Criterion since there is currently no national air quality
standard for annual average PM10. The addition of an annual national air quality standard for
PM10 is, however, being considered as part of the AAQ NEPM revision process with an annual
maximum concentration of 20 µg/m³ proposed for consideration during the consultation period
(Australian Government 2014). The potential exists for this proposed standard to be exceeded
during years significantly affected by dust storms or bushfires and at sites close to Port
Kembla industrial areas (e.g. Warrawong).
Exceedances of the maximum 24-hour PM10 national standard (50 µg/m3 with greater than 5
exceedence days per year) were recorded to occur in 2002, 2003, 2006, 2009 and 2013
(Figure 11 and Table 4). High PM10 concentrations are typically recorded during years affected
by large bushfires and dust storm events. Bushfires were the major contributor to high PM10
concentrations recorded in the Illawarra during 2002–03. Major statewide dust storms in
September 2009 accounted for the extremely high 24-hour averaged PM10 concentration of
1360 µg/m3 recorded in Albion Park South and the 14 exceedence days measured at Kembla
Grange. In 2013 the 24-hour PM10 standard was exceeded on six days of the year; three of
these exceedances occurred during the October–November bushfire emergency.

24 Office of Environment and Heritage
Figure 10: Annual average PM10 recorded at Illawarra regional monitoring stations 1992–2014
Figure 11: Maximum 24-hour average PM10 recorded at Illawarra regional monitoring stations
1992–2014

Air Quality Trends in the Illawarra 25
Table 4: Number of days exceeding the national 24-hour PM10 standard of 50 µg/m³ at Illawarra
monitoring stations 1992–2014 (maximum allowable exceedances 5 days a year)
Year
Number of days exceeding the national PM10 standard
Albion Park Albion Park
South Kembla Grange
Warrawong Wollongong
1992 - - - - -
1993 - - - 0 0
1994 - - - 3 5
1995 - - - 0 4
1996 - - - 1 3
1997 2 - - 2 2
1998 5 - - 0 1
1999 0 - - 0 0
2000 2 - - 0 3
2001 1 - - 1 5
2002 7 - - 12 11
2003 4 - - 5 8
2004 1 - 1 2 0
2005 0 - 4 5 1
2006 - 2 9 - 4
2007 - 1 5 - 3
2008 - 1 4 - 1
2009 - 9 14 - 6
2010 - 0 0 - 0
2011 - 1 1 - 0
2012 - 0 3 - 0
2013 - 2 4 - 6
2014 - 0 1 - 0
Note: ‘-’ indicates data was not available because the air quality monitoring station was not in operation.
4.3.2 PM2.5 concentrations
Annual average PM2.5 concentrations measured in the Illawarra over the 1992 to 2014 period
were below the national advisory reporting standard of 8 µg/m³ with the exception of 2002,
2003 and 2004 (Figure 12). Exceedances of the maximum 24-hour PM2.5 national advisory
reporting standard of 25 µg/m³ were recorded in 1996, 1997, 1998, 2000, 2001, 2002, 2003,
2006, 2009 and 2013 (Figure 12 and Figure 13, Table 5). This standard is typically exceeded
0–2 days for most years, with more frequent exceedances occurring in bushfire and dust
storm affected years such as 2002–03, 2006, 2009 and 2013.

26 Office of Environment and Heritage
Major statewide dust storms in September 2009 accounted for the extremely high 24-hour
averaged PM2.5 concentration of 241 µg/m3 recorded at Wollongong. Bushfires are believed to
account for the 24-hour PM2.5 concentration of 152 µg/m3 recorded at Warrawong in 2003 and
the 11 (10) exceedence days measured at Wollongong (Warrawong) in 2002. The
exceedances recorded at the Wollongong station in 2013 coincided with the October–
November 2013 bushfires (see Box 2). The maximum daily average PM2.5 of 88.4 µg/m³
measured at Wollongong on 19 October 2013 occurred during the bushfire emergency period.
Figure 12: Annual average PM2.5 recorded at Illawarra regional monitoring stations 1992–2014
Figure 13: Maximum 24-hour average PM2.5 recorded at Illawarra regional monitoring stations
1992–2014

Air Quality Trends in the Illawarra 27
Table 5: Number of days exceeding the national 24-hour PM2.5 advisory reporting standard
recorded at Illawarra regional monitoring stations 1992–2014
Year
Number of days exceeding the PM2.5 advisory reporting standard
Warrawong Wollongong
1992 - -
1993 - -
1994 - -
1995 - -
1996 1 -
1997 1 -
1998 1 0
1999 0 0
2000 2 1
2001 0 2
2002 10 11
2003 4 5
2004 0 0
2005 0 0
2006 - 2
2007 - 0
2008 - 0
2009 - 3
2010 - 0
2011 - 0
2012 - 0
2013 - 4
2014 - 0
Note: ‘-’ indicates data was not available because the air quality monitoring station was not in operation.

28 Office of Environment and Heritage
Box 2 – 2013 air quality affected by bushfires and high temperatures (OEH 2014c)
After several years of very good air quality across much of the State, air quality in New South Wales
in 2013 was generally poorer due mainly to warmer and drier conditions and severe bushfires. The
year began with above-average temperatures and increased bushfire activity. January 2013 saw one
of the warmest maximum temperatures on record in Sydney and across the State, followed by
above-average temperatures during July–October and long periods of little or no rain. Warm, dry and
windy conditions in September and October led to severe early-season bushfire activity in western
Sydney, the Blue Mountains, Wollondilly and the Hunter Valley.
During the bushfire emergency, NSW Health issued a number of air pollution health alerts. This saw
a significant increase in visits to the Air Quality Index webpage and subscriptions to the automated
air pollution alert system.
4.3.3 Long-term trends in PM10 and PM2.5
In New South Wales particle pollution levels can vary significantly as a result of large-scale
climate variations. The El Niño–La Niña climate cycle, which typically occurs between three to
five years but can vary from two to seven years, affects the prevailing weather conditions. Dry
El Niño years are associated with a greater frequency of bushfires and dust storms and
therefore higher particle pollution levels. Lower particle pollution levels tend to occur during
wetter La Niña years.
Statistical analysis of PM10 and PM2.5 concentration measurements was undertaken for the
Wollongong trend monitoring station to remove seasonal variations in pollution levels so
longer-term trends could be considered. This was done by expressing each daily PM10 and
PM2.5 concentration as a deviation from the mean for that day of the year based on the long-
term record. The long-term trend of daily average PM10 and PM2.5 for Wollongong are shown
in Figure 14. Over the two decades of measurement, it appears there are higher PM10 and
PM2.5 levels during dry El Niño years (2002–07) when compared to the wetter La Niña years
(2010–12).
PM10 levels have remained below long-term average levels in recent years (2011–14). The
increase in PM2.5 levels measured in recent years is expected to be mainly due to PM2.5
measurement method being changed from Tapered Element Oscillating Microbalance (TEOM)
instruments to Beta Attenuation Monitors (BAMs) in 2012, although bushfires impacting on
airborne fine particles in the Illawarra during the October–November 2013 bushfire emergency
period may also have contributed to the increase (see Box 2). Research is underway to
remove the effect of the change in measurement method from the trend and to issue a final
revised long-term PM2.5 trend. The 2013 and 2014 years were equally the warmest years on
record for maximum temperatures, with 2014 also being the warmest year on record for mean
temperatures and the fourth-warmest year for minimum temperatures (Bureau of Meteorology
2014, 2015). Although above-average rainfall was experienced along the coast in 2013, inland
regions were generally drier and more prone to dust generation and bushfires. The 2014 year
was characterised by below-average rainfall across much of New South Wales and significant
heatwaves in January, May, October and November.

Air Quality Trends in the Illawarra 29
Figure 14: Long-term trend of daily average PM10 and PM 2.5 recorded at Wollongong monitoring
station 1994–2014
Extremely high 24-hour averaged PM10 concentrations associated with major statewide dust storms on 23 September 2009 were excluded from long-term trend analyses.
4.4 Illawarra air quality compared with
cities nationally and internationally
Air quality in the Illawarra is generally comparable with cities in other Australian jurisdictions
and good by world standards. This is shown in
strong El Niño (dry conditions)
strong La Niña (wet conditions)

30 Office of Environment and Heritage
Figure 15 and Figure 16 based on annual average PM10 and PM2.5 concentrations, and in
Figure 17 for annual average 8-hour daily maximum ozone concentrations.
For the PM10 and PM2.5 comparison, reference is made to the global comparison of air
pollution levels undertaken by the World Health Organisation (WHO). The annual average
PM10 concentration in the Illawarra shown for 2010–11 (8 μg/m³) is comparable to levels in
other regions of New South Wales including Sydney and the Lower Hunter, and generally
much lower than is measured in cities internationally (
Figure 15). PM10 concentrations in the Illawarra are lower than the NSW EPA Impact
Assessment Criterion (30 μg/m³), and international air quality standards (European Union: 40
μg/m³, World Health Organization: 20 μg/m³). No air quality standards are set nationally in
Australia or the United States for annual average PM10. However, an annual standard of 20
µg/m³ has been proposed for consideration as part of the AAQ NEPM review process in
Australia (Australian Government 2014).

Air Quality Trends in the Illawarra 31
Figure 15: Comparison of annual average PM10 concentrations for Illawarra
with several Australian and international cities 2010–11 (WHO 2014)

32 Office of Environment and Heritage
The annual average PM2.5 concentration in the Illawarra (5 μg/m³) is also comparable to
concentrations in other NSW regions and Australian cities, and is generally low by world
standards as illustrated in Figure 16. The Australian annual average advisory reporting
standard of 8 μg/m³ for PM2.5 is more stringent than the air quality standards set internationally
(European Union: 25 μg/m³, United States EPA: 12 μg/m³, World Health Organization:
10 μg/m³).
Figure 16: Comparison of annual average PM2.5 concentrations for Illawarra
with several Australian and international cities 2010–11 (WHO 2014)

Air Quality Trends in the Illawarra 33
Environment Canada recently did an international comparison of ozone levels using as an
indicator the annual average of the 8-hour daily maximum ozone concentration measured in
major cities in 2011. Ozone concentrations measured in the Illawarra and other NSW cities
and regions in 2013 were calculated on the same basis for comparison as shown in Figure 17.
The ozone concentration in the Illawarra (19 ppb) was measured to be 46% and 33% lower
than ozone levels recorded in Sydney and the Lower Hunter respectively, and in general is
considered to be low by world standards.
Figure 17: Comparison of annual average of the 8-hour O3 daily maximum concentrations for
Illawarra, Sydney and the Illawarra (2013) with levels measured in international cities for 2011
(Environment Canada 2014)
OEH uses the Air Quality Index (AQI) to provide a simple comparison of pollutants affecting air
quality. AQI values for the Illawarra are illustrated for the past five years (2010–14) in Box 3,
and compared to air quality reported for other regions of New South Wales.

34 Office of Environment and Heritage
Box 3 – Air quality using the OEH Air Quality Index (OEH 2015b)
The OEH AQI standardises measurements of ozone, carbon monoxide, sulfur dioxide, nitrogen
dioxide, air particles and visibility into one easy-to-understand index. Using the AQI, air quality is
classified as ‘very good’, ‘good’, ‘fair’, ‘poor’, ‘very poor’ and ‘hazardous’. More information on the
AQI is available on the OEH website (www.environment.nsw.gov.au/AQMS/aboutaqi.htm). AQI levels
for the Illawarra are given for the 2010 to 2014 period and compared to other regions of New South
Wales in Figure 18.
Over the past five years air quality in the Illawarra was in the ‘very good’ or ‘good’ category for 78%
to 85% of the time, in the ‘fair’ category for 13% to 20% of the time, and classified as ‘poor’ or worse
for 1% to 7% of the time. The poor air quality days coincided with periods of high airborne particles or
ozone pollution, with years significantly affected by regional events such as bushfires, dust storms or
high temperatures experiencing the greatest frequency of poor or worse air quality days (e.g. 7%
poor or worse air quality days in 2013 due to bushfires and high temperatures, see Box 2).
Based on OEH monitoring station measurements during the 2010 to 2014 period, the Illawarra is
reported to typically experience fewer fair and poor or worse air quality days compared to Sydney
and the Hunter, and more of such days compared to the Central Coast and rural New South Wales.
(Note that PM2.5 levels are not recorded in rural New South Wales, and that air quality monitoring
was initiated more recently for the Central Coast with the establishment of the Wyong station.)
Figure 18: AQI categories as a percentage of time in each region of NSW 2010–14 (OEH
2015b)

Air Quality Trends in the Illawarra 35
4.5 Airborne particles composition and characterisation
As part of its Aerosol Sampling Program, the Australian Nuclear Science and Technology
Organisation (ANSTO) has been conducting PM2.5 sampling and characterisation at several
Australian east coast sites since 1990, including several sites within New South Wales and a
background (pristine environment) site at Cape Grim in Tasmania (ANSTO 2015a). The PM2.5
sampling is conducted on two days each week (Wednesday and Sunday). Within the Illawarra,
sampling is conducted at Warrawong. The long-term average (1998–2008) PM2.5
concentration and the composition of fine particles measured at these sites is shown in Figure
19. Particle composition was generally found to include ammonium sulfate, black carbon,
organic matter, salt, soil and ‘other’ components.
At the Warrawong site, the long-term average PM2.5 concentration was measured to be
6.9 µg/m³. At this site, ammonium sulfate (29%) comprised the largest component of the long-
term average PM2.5 composition, followed by salt (16%), black carbon (15%), organic matter
(14%), and soil (10%), with about 16% of the PM2.5 mass being classified as ‘other’.
Ammonium sulfate is a secondary pollutant, formed in the atmosphere when sulfur dioxide
(SO2) emissions react with ammonia. SO2 is emitted in the Illawarra region by industrial
sources, non-road sources such as industrial vehicles and shipping, on-road vehicles and
residential fuel burning (see Section 5.4). The ‘salt’ component of fine particles is associated
with sea salt aerosols emitted by waves breaking in the open ocean and from coastal surf
breaks. Black carbon is emitted directly into the air during incomplete combustion of fossil
fuels used for transport, heating and industrial activities, and from biomass burning due to
vegetation fires (see 5.3).
Figure 19: Average PM2.5 mass and composition for Australian east coast sites,
July 1998 to May 2008 (ANSTO 2008)
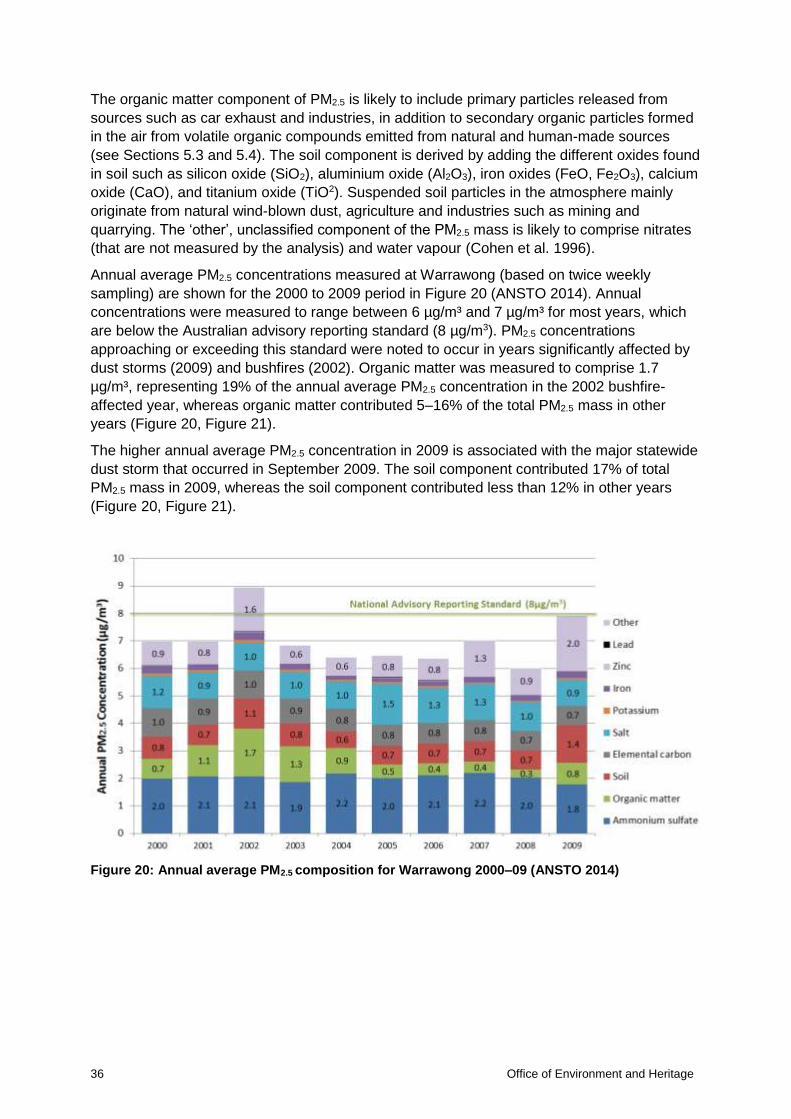
36 Office of Environment and Heritage
The organic matter component of PM2.5 is likely to include primary particles released from
sources such as car exhaust and industries, in addition to secondary organic particles formed
in the air from volatile organic compounds emitted from natural and human-made sources
(see Sections 5.3 and 5.4). The soil component is derived by adding the different oxides found
in soil such as silicon oxide (SiO2), aluminium oxide (Al2O3), iron oxides (FeO, Fe2O3), calcium
oxide (CaO), and titanium oxide (TiO2). Suspended soil particles in the atmosphere mainly
originate from natural wind-blown dust, agriculture and industries such as mining and
quarrying. The ‘other’, unclassified component of the PM2.5 mass is likely to comprise nitrates
(that are not measured by the analysis) and water vapour (Cohen et al. 1996).
Annual average PM2.5 concentrations measured at Warrawong (based on twice weekly
sampling) are shown for the 2000 to 2009 period in Figure 20 (ANSTO 2014). Annual
concentrations were measured to range between 6 µg/m³ and 7 µg/m³ for most years, which
are below the Australian advisory reporting standard (8 µg/m3). PM2.5 concentrations
approaching or exceeding this standard were noted to occur in years significantly affected by
dust storms (2009) and bushfires (2002). Organic matter was measured to comprise 1.7
µg/m³, representing 19% of the annual average PM2.5 concentration in the 2002 bushfire-
affected year, whereas organic matter contributed 5–16% of the total PM2.5 mass in other
years (Figure 20, Figure 21).
The higher annual average PM2.5 concentration in 2009 is associated with the major statewide
dust storm that occurred in September 2009. The soil component contributed 17% of total
PM2.5 mass in 2009, whereas the soil component contributed less than 12% in other years
(Figure 20, Figure 21).
Figure 20: Annual average PM2.5 composition for Warrawong 2000–09 (ANSTO 2014)
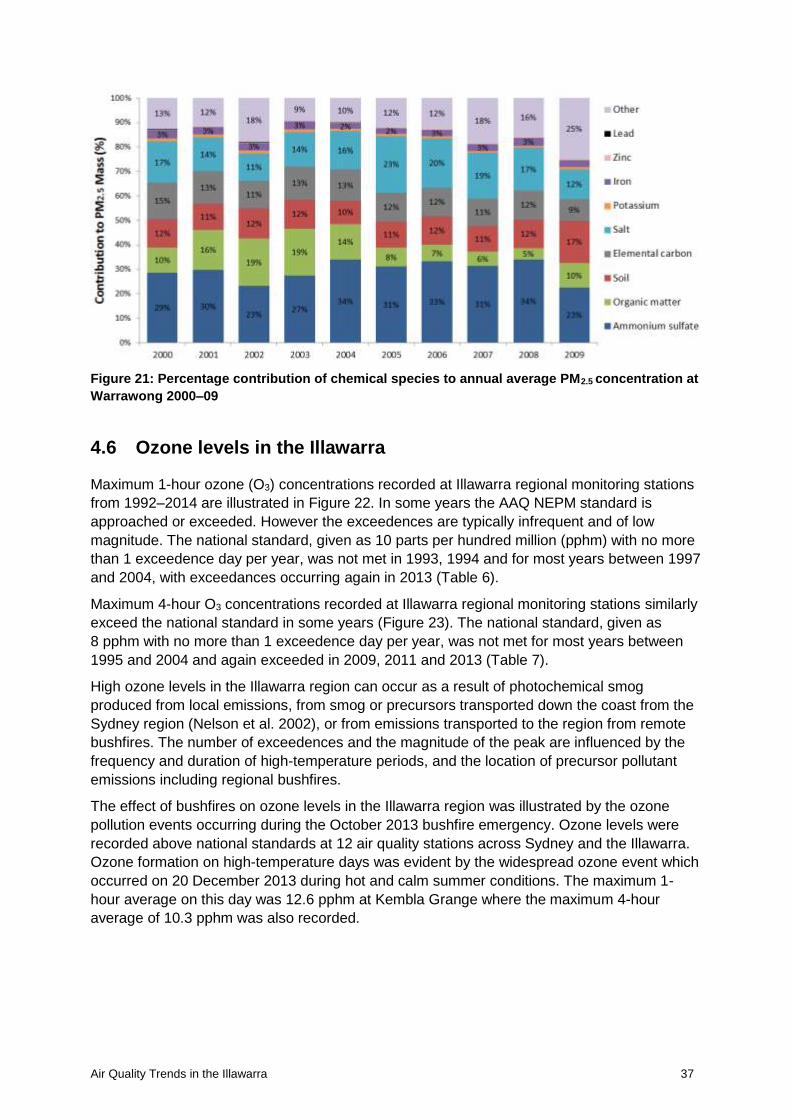
Air Quality Trends in the Illawarra 37
Figure 21: Percentage contribution of chemical species to annual average PM2.5 concentration at
Warrawong 2000–09
4.6 Ozone levels in the Illawarra
Maximum 1-hour ozone (O3) concentrations recorded at Illawarra regional monitoring stations
from 1992–2014 are illustrated in Figure 22. In some years the AAQ NEPM standard is
approached or exceeded. However the exceedences are typically infrequent and of low
magnitude. The national standard, given as 10 parts per hundred million (pphm) with no more
than 1 exceedence day per year, was not met in 1993, 1994 and for most years between 1997
and 2004, with exceedances occurring again in 2013 (Table 6).
Maximum 4-hour O3 concentrations recorded at Illawarra regional monitoring stations similarly
exceed the national standard in some years (Figure 23). The national standard, given as
8 pphm with no more than 1 exceedence day per year, was not met for most years between
1995 and 2004 and again exceeded in 2009, 2011 and 2013 (Table 7).
High ozone levels in the Illawarra region can occur as a result of photochemical smog
produced from local emissions, from smog or precursors transported down the coast from the
Sydney region (Nelson et al. 2002), or from emissions transported to the region from remote
bushfires. The number of exceedences and the magnitude of the peak are influenced by the
frequency and duration of high-temperature periods, and the location of precursor pollutant
emissions including regional bushfires.
The effect of bushfires on ozone levels in the Illawarra region was illustrated by the ozone
pollution events occurring during the October 2013 bushfire emergency. Ozone levels were
recorded above national standards at 12 air quality stations across Sydney and the Illawarra.
Ozone formation on high-temperature days was evident by the widespread ozone event which
occurred on 20 December 2013 during hot and calm summer conditions. The maximum 1-
hour average on this day was 12.6 pphm at Kembla Grange where the maximum 4-hour
average of 10.3 pphm was also recorded.

38 Office of Environment and Heritage
Figure 22: Maximum 1-hour O3 measured at Illawarra regional monitoring stations 1992–2014
Table 6. Number of days exceeding the national 1-hour O3 standard recorded at Illawarra
regional monitoring stations 1992–2014
Year
Number of days exceeding the national 1-hour average O3 standard
Albion Park Albion Park
South Kembla Grange
Warrawong Wollongong
1992 - - - - -
1993 - - - 1 2
1994 - - 1 1 2
1995 - - 0 0 0
1996 - - 0 0 0
1997 5 - 4 2 4
1998 2 - 2 0 1
1999 0 - 1 0 0
2000 1 - 3 0 1
2001 0 - 2 0 1
2002 0 - 0 2 2
2003 4 - 2 0 0
2004 1 - 3 1 1
2005 0 - 0 0 1
2006 - 0 0 - 0
2007 - 0 0 - 0
2008 - 0 0 - 0
2009 - 1 1 - 0

Air Quality Trends in the Illawarra 39
Year
Number of days exceeding the national 1-hour average O3 standard
Albion Park Albion Park
South Kembla Grange
Warrawong Wollongong
2010 - 0 0 - 0
2011 - 1 1 - 0
2012 - 0 0 - 0
2013 - 3 2 - 2
2014 - 0 0 - 0
Note: ‘-’ indicates data was not available because the air quality monitoring station was not in operation.
Figure 23: Maximum 4-hour O3 recorded at Illawarra regional monitoring stations 1992–2014
Table 7: Number of days exceeding the national 4-hour O3 standard at Illawarra regional
monitoring stations 1992–2014
Year
Number of days exceeding the national 4-hour average O3 standard
Albion Park Albion Park
South Kembla Grange
Warrawong Wollongong
1992 - - - - -
1993 - - - 0 1
1994 - - 1 1 3
1995 - - 0 0 0
1996 - - 0 0 0
1997 5 - 5 3 4
1998 5 - 5 0 1

40 Office of Environment and Heritage
Year
Number of days exceeding the national 4-hour average O3 standard
Albion Park Albion Park
South Kembla Grange
Warrawong Wollongong
1999 1 - 1 0 0
2000 3 - 4 3 2
2001 1 - 2 0 1
2002 1 - 1 2 2
2003 4 - 3 1 0
2004 1 - 3 1 2
2005 0 - 1 1 1
2006 - 0 1 - 1
2007 - 0 1 - 0
2008 - 0 0 - 0
2009 - 1 2 - 0
2010 - 0 0 - 0
2011 - 3 2 - 0
2012 - 0 0 - 0
2013 - 3 2 - 2
2014 - 0 0 - 0
Note: ‘-’ indicates data was not available because the air quality monitoring station was not in operation.
Statistical analysis of the daily 1-hour and 4-hour maximum ozone concentrations measured
at Wollongong, Kembla Grange and Albion Park South were undertaken to remove seasonal
variations in pollution levels so that longer term trends could be considered. This was done by
expressing the daily maximum of each 1-hour and 4-hour ozone concentration as a deviation
from the mean for that day of the year based on the long-term record. Trends were found to
be similar for the three stations, with the trend for Wollongong shown in Figure 24. Based on
the two decades of monitoring, higher ozone levels were recorded during dry and typically hot
El Niño years (2002–07), as compared to the wetter and generally cooler La Niña years
(2010–12).
Increasing ozone levels were recorded in 2013 and 2014. In New South Wales these years
were equally the warmest years on record for maximum temperatures, with 2014 also being
the warmest year on record for mean temperatures and the fourth-warmest year for minimum
temperatures (Bureau of Meteorology 2014, 2015). Although above-average rainfall was
experienced along the coast in 2013, inland regions were generally drier and more prone to
dust generation and bushfires. Bushfire emissions contributed significantly to ozone levels in
the Illawarra during the October–November 2013 bushfire emergency period. The 2014 year
was characterised by below-average rainfall across much of New South Wales and significant
heatwaves in January, May, October and November.

Air Quality Trends in the Illawarra 41
Figure 24: Long-term trend of daily 1-hour and 4-hour maximum O3 levels recorded at Illawarra
regional monitoring stations 1994–2014
4.7 Summary of findings
Air quality monitoring has been undertaken by OEH in the Illawarra since 1992, with
monitoring having been undertaken for CO, NO2, SO2, PM10, PM2.5 and O3 at several sites.
Monitoring sites have included Albion Park, Albion Park Rail, Albion Park South, Kembla
Grange, Warrawong and Wollongong, with stations located to track regional air quality
affecting the general population.
Air quality in the Illawarra is generally comparable with cities in other Australian jurisdictions
and good by world standards. Concentrations of CO, NO2 and SO2 recorded at OEH air
quality monitoring stations have generally decreased since the 1990s, with recent levels
recorded to be within national air quality standards. Ambient lead levels decreased
significantly to well within national standards after the introduction of unleaded fuel, resulting
in ambient lead monitoring being discontinued in 2004.
Particle levels (PM10 and PM2.5) and ozone concentrations in the Illawarra are comparable with
the levels recorded in Australian cities and below levels measured in several countries abroad.
However, these pollutants do exceed national standards from time to time, posing air
pollution-related health risks to local communities. It is also of note that health effects due to
exposures to ambient particle and ozone concentrations have been observed to occur at
levels which are within national standards (NEPC 2010).
Exceedances of the national 24-hour standard for PM10 and the national 24-hour advisory
reporting standard for PM2.5 in the Illawarra region usually coincides with regional dust storms
or bushfire events. Annual average PM10 levels are observed to be within the EPA Impact
Assessment Criterion of 30 µg/m³ at OEH monitoring stations. The addition of an annual
national air quality standard for PM10 is being considered as part of the AAQ NEPM revision
process with an annual maximum concentration of 20 µg/m³ proposed for consideration
(Australian Government 2014). The potential exists for this proposed standard to be exceeded
during years significantly affected by dust storms or bushfires (or both) and at sites close to
Port Kembla industrial areas (e.g. Warrawong). Annual average PM2.5 concentrations have

42 Office of Environment and Heritage
been observed to exceed the national advisory reporting standard of 8 µg/m³ in some years,
generally coinciding with dry, bushfire-affected years.
The composition of airborne fine particles typically includes ammonium sulfate, sea salt, black
carbon, organic matter and soil. This indicates that primary particles emitted directly from
sources and secondary particles formed in the air as a result of chemical reactions between
gaseous pollutants (precursor pollutants) or gases and existing particles contribute to airborne
PM2.5 levels. The chemical composition also indicates that PM2.5 concentrations in the region
are associated with both natural and human-made sources of particle and gaseous emissions.
Elevated ozone levels in the Illawarra region can occur as a result of photochemical smog
produced from local emissions, smog or precursors transported down the coast from the
Sydney region, or emissions from regional bushfires. Exceedances of the 1-hour and 4-hour
ozone national standards generally occur during the warmer months of the year, with peaks
coinciding with periods of high temperature and with regional bushfire events.

Air Quality Trends in the Illawarra 43
5 Sources of air pollution
The relationship between ambient air quality (presented in the previous section) and air
emissions (presented in this section) is quite complex and influenced by a range of factors,
including meteorology, topography, chemical reactions of pollutants in the air and source type
(see Box 4). For this reason, source contributions to total emissions in a region do not
compare well with source contributions to air pollution levels at a particular location. This
should be kept in mind when interpreting the emissions data presented.
Air quality in the Illawarra is affected by sources located in the region in addition to sources
situated further afield, with interregional transport contributing to local air pollution levels
(Nelson et al. 2002). Similarly, atmospheric emissions within the Illawarra region can affect air
quality within neighbouring areas. While recognising the importance of interregional transport,
this section focuses on sources of air pollution situated within the Illawarra region.
In this section, sources of air emissions in the Illawarra region are identified and described
based on the EPA’s NSW Greater Metropolitan Region (GMR) Air Emissions Inventory which
provides detailed information on emissions for the 2003 and 2008 calendar years (EPA 2012).
Whereas the NSW GMR Air Emissions Inventory covers the entire Wollongong and
Shellharbour LGAs, it should be noted the inventory (and hence the emissions information
presented) covers only 66% of the Kiama LGA (169 square kilometres of the total 258 square
kilometres) (EPA 2013a). Reference is also made to industry-reported emissions from the
National Pollutant Inventory (NPI) to assess recent trends in industrial emissions, and to
shipping related emissions data for Port Kembla from the national shipping air emissions
inventory (Goldsworthy & Goldsworthy 2014).
Attention is specifically paid to primary particle emissions, ground-level ozone precursor
pollutants (volatile organic compounds [VOC] and oxides of nitrogen [NOx]), and to sulfur
dioxide (SO2). Gaseous pollutants such as SO2, VOC and NOx contribute to the formation of
secondary particles in the air.

44 Office of Environment and Heritage
Box 4 – Emissions inventory information compared to air quality information
When interpreting emission inventory information, it is important to understand the relationship
between emissions and ambient air quality is quite complex and influenced by a number of factors.
How emissions are dispersed, transported and transformed depends on:
Meteorology (wind speed and direction, temperature, sunlight and rainfall) – high wind speeds
tend to dilute emissions, while wind direction determines where they are transported. Medium-
and long-range transport of emissions may impact on local air quality when emissions from a
large distant source are transported by wind. Temperature and sunlight play a key role in
atmospheric reactions.
Topography (surrounding terrain) – this can either trap emissions, influence how they disperse or
determine the direction they are transported.
Atmospheric reactions – in addition to primary emissions released directly from sources,
secondary pollutants, such as photochemical smog (ground-level ozone is an indicator) or
secondary particulate matter (inorganic sulfates, nitrates and secondary organic aerosols) can be
formed.
Source location and type – the influence of a particular emission source on local air quality tends
to decrease with distance from the source. Sources range from elevated point sources, like a
boiler chimney, to ground-level, area sources such as motor vehicle emissions in an urban road
network or wind-blown dust from an exposed area.
5.1 Wollongong regional emissions
compared to Sydney and Newcastle
Annual PM10, PM2.5 and NOx emissions for the ‘Wollongong region’ (as defined within the
GMR Emissions Inventory) during 2008 were equivalent to about 15% to 17% of the annual
emissions for the Sydney region (Figure 25) (EPA 2013a). SO2 emissions in the Wollongong
region are estimated to be about 84% of SO2 emissions for Sydney, with VOC releases in
Wollongong being less than 10% of total VOC emissions for Sydney. When compared to
emissions in the Newcastle region, Wollongong emits about half as much PM10, about 10%
less PM2.5, about 20% less SO2, 25% less VOC and about 20% more NOx emissions.

Air Quality Trends in the Illawarra 45
Figure 25: Summary of total annual emissions for the Wollongong, Newcastle and Sydney
regions 2008 (kilotonnes per year)
5.2 Contribution of human activities
to total emissions in the Illawarra
Human sources contribute significantly to overall emissions of particles, SO2, NOx and VOC in
the Illawarra (Figure 26). Natural sources, and notably biogenic emissions from forested
areas, also contribute significantly to VOC emissions in the region. An overview of emissions
by Illawarra LGA is provided in subsequent sections.
Figure 26: Contribution of human and natural sources to total emissions in the Wollongong,
Shellharbour and Kiama LGAs 2008 (kilotonnes per year)

46 Office of Environment and Heritage
5.3 Particle emission sources in the Illawarra
Total annual PM10 and PM2.5 emissions and emission intensities are illustrated for Kiama,
Shellharbour and Wollongong for 2008 in Figure 27. The highest total annual PM10 and PM2.5
emissions are estimated for the Wollongong LGA, followed by Shellharbour and Kiama LGAs.
This indicates that sources in the Wollongong LGA contribute the most to total emissions in
the Illawarra region. The highest PM10 emission intensity is estimated for Shellharbour LGA,
with similar PM2.5 emission intensities for Shellharbour and Wollongong LGAs.
(a) (b)
Figure 27: Geographic comparisons for PM10 and PM2.5 (a) total annual emissions (tonnes/year)
and (b) emission intensities (tonnes/year/km2) in Kiama, Shellharbour & Wollongong LGAs 2008
5.3.1 Major sources of particle emissions
Major source groups contributing to PM10 and PM2.5 emissions in Kiama, Shellharbour and
Wollongong LGAs are shown in Figure 28, Figure 29 and Figure 30 respectively. The source
groups are: industrial sources (i.e. EPA-licensed industry), on-road mobile sources (e.g. cars
and trucks), non-road mobile sources (e.g. bulldozers, haul trucks, ships and locomotives),
domestic–commercial sources (e.g. residential heating), commercial activities (e.g. service
stations) and natural sources (e.g. vegetation, bushfires and sea salt).
Industrial emissions are the most significant source of PM10 emissions, accounting for 75% to
86% of total PM10 emissions in the three LGAs, followed by domestic–commercial emissions,
accounting for 10% to 13% of total emissions.
Industrial emissions are also the dominant source of PM2.5 emissions in Wollongong and
Shellharbour LGAs, followed by domestic–commercial emissions (notably residential wood
heating). Industrial and domestic–commercial sources contribute similar amounts of PM2.5
emissions in Kiama LGA.
The top ten source types of PM10 and PM2.5 emissions are given in Appendix C. The top
individual source types contributing to PM10 and PM2.5 emissions by LGA are:
Kiama – non-metallic mineral mining and quarrying, and residential wood heating
Shellharbour – non-metallic mineral mining and quarrying, and residential wood heating
Wollongong – basic ferrous metal manufacturing and residential wood heating.

Air Quality Trends in the Illawarra 47
Figure 28: Major source group contributions to PM10 and PM2.5 emissions in Kiama LGA (%)
Figure 29: Major source group contributions to PM10 and PM2.5 emissions in Shellharbour
LGA(%)
Figure 30: Major source group contributions to PM10 and PM2.5 emissions in Wollongong LGA(%)

48 Office of Environment and Heritage
5.3.2 Trends in particle emissions over time
PM10 and PM2.5 emissions from major source groups in the Illawarra region are summarised in
Table 8 for the 2003 and 2008 calendar years. Total PM10 and PM2.5 emissions decreased by
12% and 19% respectively between 2003 and 2008, however overall changes in emissions
vary across major source groups.
Total on-road mobile emissions reduced over the 2003 to 2008 period, despite increases in
vehicle activity rates in the region. Passenger vehicle activity typically increases in line with
population growth, while freight vehicle activity grows in accordance with economic growth.
This reduction in on-road mobile emissions is due to vehicle emission limits (Australian Design
Rules) becoming progressively more stringent and the use of cleaner fuels (Australian
Government fuel quality standards). Reductions in total vehicle emissions are expected over
the next 10 to 20 years in spite of the continued increase in vehicle activity (EPA 2014b).
Notwithstanding this overall trend in total emissions, areas within regions may experience an
increase in vehicle emissions due, for example, to increased road haulage of freight along a
route. Furthermore, increased residential development pressure along major transport
corridors increases the potential for exposure to air pollutants released.
Particle emissions from the industrial and commercial sources decreased over the 2003 to
2008 period. Regulation of EPA-licensed premises through the application of more stringent
emission standards in the Protection of the Environment Operations (Clean Air Regulation)
2010 and as licence conditions and regulatory action including pollution reduction programs,
has in part contributed to this reduction. Advances in emission estimation techniques also
accounted for lower commercial sector emissions in 2008.
Despite Australia having introduced increasingly stringent national emissions standards for on-
road diesel trucks and vehicles since 1996, there are no similar national standards in place
controlling emissions from non-road diesel plant and equipment. This includes non-road diesel
powered construction and mining equipment, rail locomotives, equipment at ports and ships.
The non-road sector is the largest source of fine particles that remains largely unregulated.
PM2.5 emissions from non-road sources (primarily emitted from diesel vehicles and equipment)
were estimated to increase by 17% between 2003 and 2008 despite reductions in regulated
on-road and industrial sources. In 2008, industrial vehicles and equipment accounted for 56%
of PM2.5 emissions from non-road mobile sources, with shipping and locomotive emissions
contributing 20% and 16% of non-road mobile PM2.5 emissions respectively. More information
on PM2.5 emissions from shipping, drawn from the national shipping air emissions inventory, is
given in Box 5.
The greatest percentage growth in particle emissions in the Illawarra is from domestic–
commercial sources, with emissions dominated by residential wood heaters which account for
over 90% of PM10 and PM2.5 from this sector. Lawn mowing, household liquid fuel burning and
barbecues are minor sources compared to residential wood heaters. The 23–24% increase in
particle emissions over the 2003 to 2008 period was due to equivalent increases in residential
wood heater emissions.
Biogenic and geogenic emissions include wind erosion of exposed areas, agricultural burning,
bushfires and prescribed burning. These emissions typically vary from year to year, with
higher emissions occurring during hotter, dryer years. Higher biogenic and geogenic
emissions occurred in 2003 due to greater emissions from vegetation burning.

Air Quality Trends in the Illawarra 49
Table 8: PM10 and PM2.5 emissions from major source groups for 2003 and 2008 in the Illawarra
Major source groups
PM10 emissions PM2.5 emissions
2003 2008 Change
2003 2008 Change
(tonnes/year) (tonnes/year)
Biogenic 19 18 -5% 16 4 -75%
Non-road mobile 99(a) 87 -12% 71(a) 83 17%
On-road mobile 165 141 -15% 157 107 -32%
Commercial 107(b) 66 -38% 44(b) 18 -59%
Domestic–commercial 383 474 24% 371 456 23%
Industrial 3666(c) 3116 -15% 2110(c) 1564 -26%
Total 4435 3901 -12% 2766 2231 -19%
(a) The 2003 NSW GMR Air Emissions Inventory includes exhaust and wheel-generated dust from industrial and commercial vehicles within the ‘non-road’ source group. However, in the 2008 NSW GMR Air Emissions Inventory wheel-generated dust is included in the ‘commercial’ and ‘industrial’ source groups. To allow comparisons, the wheel-generated dust for commercial and industrial vehicles was removed from the 2003 ‘non-road’ source group and included in the ‘commercial’ and ‘industrial’ source groups respectively.
(b) PM10/PM2.5 emissions from commercial vehicle wheel-generated dust were included to allow comparison with 2008 emissions data.
(c) PM10/PM2.5 emissions from industrial vehicle wheel-generated dust were included to allow comparison with 2008 emissions data.

50 Office of Environment and Heritage
Box 5 – Fine particle (PM2.5) emissions from shipping at Port Kembla
Many ships are powered by large engines
operating on high sulfur fuel and emit high
levels of fine particles and sulfur dioxide
(EPA 2015). PM2.5 emissions released
within Port Kembla port boundaries in
2010–11 were estimated as part of a
national shipping air emissions inventory
(Goldsworthy & Goldsworthy 2015). Total
PM2.5 emissions from shipping were
estimated to be about 51 tonnes/year for
the port area.
At Port Kembla, most PM2.5 shipping
emissions were estimated to occur when
vessels are at berth, with auxiliary engines
being the most significant source of
emissions (Figure 31). Although emissions
associated with ships at anchor were
relatively low, it is notable that most
anchorage associated with Port Kembla
occurs outside port boundaries (and
therefore is not included in the inventory for
the port).
Most fine-particle emissions from shipping
at Port Kembla in 2010–11 were estimated
to come from bulk carriers (51%), general
cargo (21%) and vehicle carriers (21%)
(Figure 32). More recently (2012–13),
general cargo activity has reduced by a
factor of about four, with little change in
bulk exports (Goldsworthy & Goldsworthy
2014).
Figure 31: PM2.5 shipping emissions for Port Kembla
by machinery type (top) and activity (bottom)
(2010–11) (Goldsworthy & Goldsworthy 2014)
Figure 32: Vessel type contributions to PM2.5
emissions for Port Kembla (2010–11)
(Goldsworthy & Goldsworthy 2014)

Air Quality Trends in the Illawarra 51
5.3.3 Spatial trends in particle emissions
The spatial distribution of PM10 and PM2.5 emissions is illustrated in Figure 33 and Figure 34,
respectively. Higher levels of primary particle emissions coincide with the industrial areas at
Port Kembla.
Figure 33: Spatial distribution of PM10 emissions in the Illawarra region
Figure 34: Spatial distribution of PM2.5 emissions in the Illawarra region
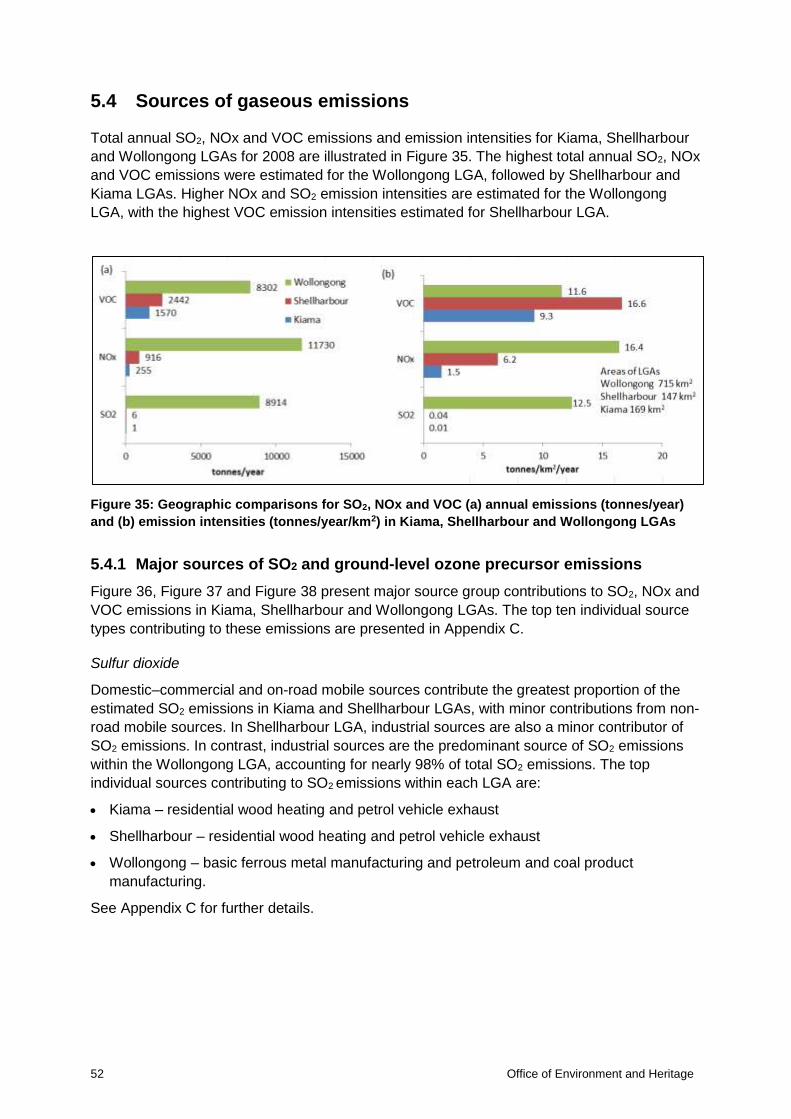
52 Office of Environment and Heritage
5.4 Sources of gaseous emissions
Total annual SO2, NOx and VOC emissions and emission intensities for Kiama, Shellharbour
and Wollongong LGAs for 2008 are illustrated in Figure 35. The highest total annual SO2, NOx
and VOC emissions were estimated for the Wollongong LGA, followed by Shellharbour and
Kiama LGAs. Higher NOx and SO2 emission intensities are estimated for the Wollongong
LGA, with the highest VOC emission intensities estimated for Shellharbour LGA.
Figure 35: Geographic comparisons for SO2, NOx and VOC (a) annual emissions (tonnes/year)
and (b) emission intensities (tonnes/year/km2) in Kiama, Shellharbour and Wollongong LGAs
5.4.1 Major sources of SO2 and ground-level ozone precursor emissions
Figure 36, Figure 37 and Figure 38 present major source group contributions to SO2, NOx and
VOC emissions in Kiama, Shellharbour and Wollongong LGAs. The top ten individual source
types contributing to these emissions are presented in Appendix C.
Sulfur dioxide
Domestic–commercial and on-road mobile sources contribute the greatest proportion of the
estimated SO2 emissions in Kiama and Shellharbour LGAs, with minor contributions from non-
road mobile sources. In Shellharbour LGA, industrial sources are also a minor contributor of
SO2 emissions. In contrast, industrial sources are the predominant source of SO2 emissions
within the Wollongong LGA, accounting for nearly 98% of total SO2 emissions. The top
individual sources contributing to SO2 emissions within each LGA are:
Kiama – residential wood heating and petrol vehicle exhaust
Shellharbour – residential wood heating and petrol vehicle exhaust
Wollongong – basic ferrous metal manufacturing and petroleum and coal product
manufacturing.
See Appendix C for further details.

Air Quality Trends in the Illawarra 53
Oxides of nitrogen
On-road mobile sources account for 59% and 68% of NOx emissions in Kiama and
Shellharbour LGAs respectively, while contributing only 22% of NOx emissions in the
Wollongong LGA with industrial sources contributing about 67% of emissions in Wollongong
LGA. Other sources of NOx include non-road mobile, natural and domestic–commercial
activities. Natural source emissions contribute 18% of NOx emissions in the Kiama LGA, but
have a smaller contribution within other LGAs. The top individual sources contributing to NOx
emissions by LGA are:
Kiama – diesel vehicle exhaust and petrol vehicle exhaust
Shellharbour – petrol vehicle exhaust and diesel vehicle exhaust
Wollongong – basic ferrous metal manufacturing and petrol vehicle exhaust.
See Appendix C for further details.
Figure 36: Major source group contributions to SO2, NOx and VOC emissions in Kiama LGA (%)
Figure 37: Major source group contributions to SO2, NOx and VOC emissions in Shellharbour
LGA (%)

54 Office of Environment and Heritage
Figure 38: Major source group contributions to SO2, NOx and VOC emissions in Wollongong
LGA (%)
Volatile organic compounds
Natural and domestic–commercial sources together contribute around 70% of VOC emissions
in Shellharbour and Wollongong LGAs. Natural sources are the predominant contributor to
VOC emissions within the Kiama LGA, accounting for about 83% of emissions. Tree canopy
and grassland emissions are the top individual source types contributing to VOC emissions in
the three LGAs followed by emissions from the use of aerosols and solvents.
5.4.2 Trends in SO2 and ground-level ozone precursor emissions
SO2, NOx and VOC emissions from major sources in the Illawarra region in 2003 and 2008
are summarised in Table 9.
Table 9: SO2, NOx and VOC emissions from major source groups in 2003 and 2008 within
Illawarra region
Major source groups
SO2 emissions NOx emissions VOC emissions
2003 2008 Change
2003 2008 Change
2003 2008 Change
(tonnes/year) (tonnes/year) (tonnes/year)
Biogenic 0.4 0.1 -73% 141 147 4% 5475 5580 2%
Non-road mobile
197 168 -15% 1115 1427 28% 228 532 133%
On-road mobile
84 12 -85% 4663 3334 -29% 3130 1250 -60%
Commercial 1.1 0.7 -33% 115 13 -89% 832 480 -42%
Domestic–commercial
8 10 19% 148 179 20% 3593 3705 3%
Industrial 10578 8731 -17% 7962 7802 -2% 905 767 -15%
Total 10868 8921 -18% 14144 12901 -9% 14163 12315 -13%

Air Quality Trends in the Illawarra 55
As for particle emissions, total on-road mobile gaseous emissions reduced over the 2003 to
2008 period, despite increases in vehicle activity rates in the region. Advances in vehicle
technology, implementation of increasingly more stringent vehicle emission standards and the
use of cleaner fuels contributed to this reduction (EPA 2014b). However, some transport
routes may experience an increase in vehicle emissions due to more substantial growth in
activity rates. Residential development along major transport corridors can also increase the
potential for greater exposure to air pollutants being released from transport corridors.
No emission standards are in place for non-road mobile sources. NOx and VOC emissions
increased from non-road mobile source mainly due to higher activity rates. Due to reductions
in the sulfur content of diesel fuel required by Australian Government fuel quality standards,
SO2 emissions from industrial non-road vehicles reduced in 2008. The lower SO2 emissions
from non-road mobile sources was largely due to refinements in the data and methods used to
quantify shipping emissions.
Increases in population were in part responsible for the growth in emissions from domestic–
commercial sources. SO2, NOx and VOC emissions from the industrial and commercial
source groups were estimated to decrease over the 2003 to 2008 period. Regulation of EPA-
licensed premises, including the application of increasingly stringent emission standards under
the POEO Act and the implementation of pollution reduction programs by sites, is expected to
have contributed to this reduction. Advances in emission estimation techniques accounted in
part for the lower commercial sector emissions estimated in 2008. The derivation of site-
specific emission factors for boilers used at hospitals based on surveys, and improved surface
coating consumption data for the smash repair industry, represent the most significant
improvements, resulting in lower, more robust emission estimates for 2008.
5.4.3 Spatial trends in SO2 and ground-level ozone precursor emissions
The spatial distribution of SO2, NOx and VOC emissions is illustrated in Figure 39, Figure 40
and Figure 41 respectively. Areas of maximum emissions for these pollutants are all located
around the Port Kembla region.

56 Office of Environment and Heritage
Figure 39: Spatial distribution of SO2 emissions in the Illawarra region
Figure 40: Spatial distribution of NOx emissions in the Illawarra region

Air Quality Trends in the Illawarra 57
Figure 41: Spatial distribution of VOC emissions in the Illawarra region
5.5 Recent trends in industrial emissions
The National Pollutant Inventory (NPI) is a source of industry-reported information. Given that
emissions information is published annually, this inventory provides useful information on
recent changes in industrial emissions for the Illawarra region.
Annual PM10, SO2, NOx and VOC emissions from all NPI-reporting industrial facilities in the
Illawarra are shown for the 2008 to 2013 period in Figure 42. Annual PM10 emissions
increased from 1323 tonnes in 2008–09 to 2265 tonnes in 2010–11, then decreased to 1984
tonnes in 2012–13. Reported reductions in PM10 emissions from BlueScope Steel Port
Kembla Steelworks contributed significantly to the overall trend. Estimated industrial PM2.5
emissions for 2012–13 were more than double that in 2008–09.

58 Office of Environment and Heritage
Figure 42: Total industrial facility emissions for PM10, SO2, NOx and VOC in the Illawarra
Annual SO2 emissions from NPI-reporting industrial facilities were estimated to increase to
8464 tonnes in 2010–11, following which decreases to 5655 tonnes in 2012–13 were
reported. During this period, SO2 emissions from the BlueScope Steel Port Kembla
Steelworks reduced from 7692 tonnes in 2010–11 to 4952 tonnes in 2012–13, contributing
significantly to the overall trend in industrial SO2 emissions.
Annual VOC emissions of 380 tonnes were reported in 2009–10, reducing by 40% to 231
tonnes in 2011–12 and 2012–13. A 50% reduction in VOC emissions was reported for the
BlueScope Steel Port Kembla Steelworks over the same period (reducing from 240 tonnes in
2009–10 to 121 tonnes in 2012–13).
Over the period illustrated, total industrial facility NOx emissions peaked in 2010–11 (8986
tonnes), then decreased significantly in 2011–12 (6707 tonnes), with slightly increased levels
reported for 2012–13 (7291 tonnes).

Air Quality Trends in the Illawarra 59
Industrial facilities comprising the top five sources of particulate matter emissions in the
Illawarra are listed in Table 10 based on the NPI data for the 2012–13 reporting year. The
BlueScope Steel Port Kembla Steelworks was the largest source, with Port Kembla Coal
Terminal, Albion Park and Boral Dunmore quarry operations, and Metropolitan and
Dendrobium coal mines identified as significant contributors.
Table 10: NPI-reporting industrial facilities in the Illawarra with the greatest PM10 and PM2.5
emissions for 2012–13
Substance Facility name LGA
2012–13
emissions in
NPI database
(tonnes/year)
Contribution to
total NPI-reported
industrial
emissions in the
Illawarra
PM10
BlueScope Steel Port Kembla
Steelworks [Port Kembla NSW] Wollongong 1432.8 72%
Albion Park Quarry [Albion Park
NSW] Shellharbour 179.9 9%
Boral Dunmore Quarry [Dunmore
NSW] Shellharbour 80.8 4%
Metropolitan Collieries Pty Ltd
[Helensburgh NSW] Wollongong 70.1 4%
Port Kembla Coal Terminal [Port
Kembla NSW] Wollongong 50.7 3%
PM2.5
BlueScope Steel Port Kembla
Steelworks [Port Kembla NSW] Wollongong 172.2 81%
Metropolitan Collieries Pty Ltd
[Helensburgh NSW] Wollongong 12.1 6%
Dendrobium Mine [Mount Kembla
NSW] Wollongong 5.9 3%
Albion Park Quarry [Albion Park-
NSW] Shellharbour 4.4 2%
Boral Dunmore Quarry [Dunmore
NSW] Shellharbour 4.3 2%

60 Office of Environment and Heritage
Table 11 lists industrial facilities comprising the top five sources of ground-level ozone
precursor emissions (NOx, total VOC) and SO2 emissions in the NPI database for 2012–13.
BlueScope Steel Port Kembla Steelworks in Wollongong is the most significant industrial
source of NOx, VOC and SO2 emissions.
Table 11: NPI-reporting industrial facilities in the Illawarra with the greatest NOx, VOC and SO2
emissions for 2012–13
Substance Facility name LGA
2012–13
emissions in
NPI database
(tonnes/year)
Contribution to
total NPI-reported
industrial
emissions in the
Illawarra
NOx
BlueScope Steel Port Kembla
Steelworks [Port Kembla NSW] Wollongong 6,469 89%
Energy Australia Tallawarra Pty Ltd
[Yallah NSW] Wollongong 257 4%
Metropolitan Collieries Pty Ltd
[Helensburgh NSW] Wollongong 145 2%
Dendrobium Mine [Mount Kembla
NSW] Wollongong 75 1%
Albion Park Quarry [Albion Park
NSW] Shellharbour 65 1%
VOC
BlueScope Steel Port Kembla
Steelworks [Port Kembla NSW] Wollongong 121 52%
Caltex Port Kembla Petroleum
Depot [Port Kembla NSW] Wollongong 27 11%
BANZ, Mills & Coating – Springhill
[Port Kembla NSW] Wollongong 19 8%
Energy Australia Tallawarra Pty Ltd
[Yallah NSW] Wollongong 18 8%
Metropolitan Collieries Pty Ltd
[Helensburgh NSW] Wollongong 15 6%
SO2
BlueScope Steel Port Kembla
Steelworks [Port Kembla NSW] Wollongong 4,952 88%
Coalcliff Coke Works [Coalcliff
NSW] Wollongong 326 6%
Corrimal Coke Works [Corrimal
NSW] Wollongong 311 5%
Orica Port Kembla Site [Port
Kembla NSW] Wollongong 45 1%
Energy Australia Tallawarra Pty Ltd
[Yallah NSW] Wollongong 11 0.2%

Air Quality Trends in the Illawarra 61
5.6 Summary of findings
Air quality in the Illawarra is affected by sources located in the region and remote sources
situated further afield, with interregional transport contributing to local air pollution levels, as
discussed in more detail in other sections of this report. This section focuses on air pollutants
emitted within the Illawarra region.
The relationship between ambient air quality and air emissions is quite complex and
influenced by a range of factors, including meteorology, topography, chemical reactions of
pollutants in the air and source type. Source contributions to total emissions in the region do
not compare well with source contributions to air pollution levels at specific locations. This
must be kept in mind when interpreting the emissions inventory data.
Human sources contribute most of the emissions of particles, SO2 and NOx in the Illawarra
and also contribute substantially to VOC emissions. Natural sources, and notably biogenic
emissions from forested areas, are an important source of VOC emissions in the region.
The 2008 NSW GMR Air Emissions Inventory supports the following conclusions about source
contributions to total emissions for the Illawarra region:
Major sources of particle emissions in the Illawarra are industrial (70% of PM2.5 and 81% of
PM10 emissions) and domestic–commercial sources (12% of PM2.5 and 20% of PM10
emissions) (Figure 43). Iron and steel production, and mining and extractive activities
account for the bulk of industrial emissions. Residential wood heating accounts for over
90% of particle emissions from domestic–commercial sources. Other sources of particle
emissions include on-road and non-road mobile sources.
Significant sources of VOC emissions are natural (45%), domestic–commercial (30%) and
on-road mobile (10%). In the natural source category, biogenic emissions from vegetation
is the largest source. The use of solvents, aerosols and surface coatings by households
and commercial businesses accounts for about half of the VOC emissions from domestic–
commercial sources.
Notable sources of NOx emissions are industrial (60%), on-road mobile (26%), and non-
road mobile (11%). Iron and steel production is the greatest industrial source.
Industrial sources account for about 98% of the SO2 emissions in the Illawarra in 2008, with
iron and steel production contributing the bulk of these emissions.
The highest levels of particle, SO2 and ground-level ozone precursor emissions in the
Illawarra occur in the industrial areas at Port Kembla.

62 Office of Environment and Heritage
Figure 43: Contribution of major source categories to total annual PM10 and PM2.5 emissions for
the Illawarra based on the 2008 GMR Air Emissions Inventory
Trends in emissions were evaluated by comparing information from the 2003 and 2008 NSW
GMR Air Emissions Inventory. Reference was also made to industry-reported emissions data
from the NPI to assess more recent trends in industrial emissions.
On-road mobile emissions reduced over the 2003 to 2008 period, despite increases in vehicle
activity. This is due to advances in vehicle technology, implementation of increasingly more
stringent national vehicle emission standards and cleaner fuels introduced through Australian
Government fuel quality standards. Reductions in vehicle emissions are expected to continue
over the next 10 to 20 years in spite of the continued increase in vehicle activity (EPA 2014b).
However, some transport routes may experience an increase in vehicle emissions due to
more substantial growth in activity rates. Residential development along major transport
corridors can also increase the potential for greater exposure to air pollutants being released
from transport corridors.
No emission standards are in place for non-road mobile sources. This sector includes non-
road diesel-powered construction and mining equipment, rail locomotives, equipment at ports
and ships. The non-road sector is the largest source of fine particles that remains largely
unregulated. Increases in particle, NOx and VOC emissions from non-road mobile sources
between 2003 and 2008 occurred mainly because of increased activity levels. The lower SO2
emissions from non-road mobile sources was largely due to refinements in the data and
methods used for estimating shipping emissions. Due to reductions in the sulfur content of
diesel fuel prescribed by Australian Government fuel quality standards, lower SO2 emissions
were estimated for industrial non-road vehicles.
Particle, SO2, NOx and VOC emissions from industrial and commercial sources decreased
over the 2003 to 2008 period. Regulation of EPA-licensed premises including the application
of increasingly stringent emission standards under the POEO Clean Air Regulation and the
implementation of pollution reduction programs is expected to have contributed to the
reduction in emissions (EPA 2013b). Based on NPI-reported facility data, emissions increased
in 2009–10 to 2010–11 but have decreased in more recent years with emission reductions at
the Port Kembla Steelworks contributing to the peak and the subsequent reduction. Advances
in emission estimation techniques accounted in part for lower commercial source emissions in
the 2008 emissions inventory.

Air Quality Trends in the Illawarra 63
The 24% increase in fine particle emissions from domestic–commercial sources over the 2003
to 2008 period was due to equivalent increases in residential wood heater emissions which
account for over 90% of the particles from domestic–commercial sources.
Biogenic and geogenic emissions include wind erosion of exposed areas, agricultural burning,
bushfires and prescribed burning. These emissions typically vary from year to year, with
higher emissions occurring during hotter, dryer years. Higher biogenic and geogenic
emissions were estimated to occur in 2003 due to greater bushfire activity.
64 Office of Environment and Heritage
6 Air quality modelling
6.1 Contribution of interregional transport
to ozone and particle events
Air quality modelling carried out as part of the large Metropolitan Air Quality Study (EPA 1996)
provided evidence of factors contributing to ozone event days. The study demonstrated that
precursor emissions from local sources can contribute to ozone events in the Illawarra region,
with major sources of precursors in the Illawarra including vehicle traffic, iron and steel
production and associated coke-making and primary metallurgical works. The Illawarra region
is only about 80 kilometres south of Sydney, with modelling showing that air pollutants are
occasionally transported between the two regions, and particularly from Sydney to the
Illawarra. Ozone events in the Illawarra were concluded to occur typically as a combined effect
of both local emissions and the transport of precursors and photochemical smog from other
regions (Cope & Ischtwan 1996). Similar conclusions have been reached in the Interregional
Transport of Air Pollutants Study (Nelson et al. 2002) and the more recent ozone modelling
conducted by CSIRO (Cope et al. 2008).
Bushfires occurring outside the Illawarra have also been found to contribute to high ozone and
particle events in the region. This was evident during the October 2013 bushfire period when
the transport of smoke plumes from inland fires coincided with high ozone and fine particle
levels in the Illawarra. Further details on such events are provided in Section 4.
6.2 Future air quality
Factors affecting future air quality in the Illawarra include regional growth, changes in transport
and industrial activity levels, changes in climate and air quality management practices.
Potential reductions in on-road and industrial emissions in the region due to progressively
more stringent regulation and the general decline in industrial activity may be offset by
increased non-road mobile emissions and residential emissions (wood heaters; aerosols,
solvent and surface coatings use). Changes in climate are also projected to affect future air
quality in the region.
CSIRO modelling shows the conditions associated with climate change are likely to result in
an increase in the number of days exceeding the ozone standard in the Illawarra and the
geographical extent of ozone impacts, as a result of increased temperatures. Changes to
rainfall, temperature and weather patterns may also increase the frequency of dust storms and
bushfire-related pollution events, leading to higher particle emissions. The results of the
CSIRO modelling work are provided below and provide information on the predicted increase
in land area where there will be three ozone exceedances per year (Cope et al. 2008).

Air Quality Trends in the Illawarra 65
Figure 44: Spatial distribution of exceedences for 4 hour ozone > 80 ppb for recent years
(1996–2005) and projected for the near future (2021–30) and far future (2051–60) (Cope et al.
2008).
Projections of climate change and related impacts on regional air quality are being undertaken
as part of the NSW and ACT Regional Climate Modelling (NARCliM) project, a multi-agency
research partnership between the NSW and ACT governments and the Climate Change
Research Centre at The University of New South Wales. The NARCliM project has produced
a suite of 12 regional climate projections for south-east Australia spanning the range of likely
future changes in climate. Over 100 climate variables, including temperature, rainfall and wind,
are available at fine resolution (10-kilometre and hourly intervals). The data is being used for
impacts and adaptation research, and made available to decision makers. The data is also
available to the public and will help to better understand possible changes in NSW climate
(http://climatechange.environment.nsw.gov.au/).
Climate projections for the Illawarra region are available on the Adapt NSW website (OEH
2014b). Based on long-term (1910–2011) observations, surface air temperature in the
Illawarra region has been increasing since about 1960, with higher temperatures experienced
in recent decades. Based on the NARCliM results, the region is projected to continue to warm
in the near future (2020–39) and far future (2060–79), compared to recent years (1990–2009).
The warming is projected to be on average about 0.6°C in the near future, increasing to about
1.9°C in the far future. The number of hot days is projected to increase, with fewer potential
frost-risk days anticipated in parts of the region. An increase in the number of severe fire-
weather-risk days (i.e. days with a Forest Fire Danger Index [FFDI] above 50) is projected for
summer and spring.
The region experiences considerable rainfall variability from year to year, as is evident from
long-term precipitation records dating back to 1910. Natural variations in the climate system
result in periods of droughts and flood. Regional climate models do not agree on how annual
precipitation in the region will change, however, the majority of the 12 NARCliM climate
models project a decrease in spring rainfall and an increase in autumn rainfall for the Illawarra
region.

66 Office of Environment and Heritage
The implications of climate change for regional air quality, based on the NARCliM projections,
is the subject of ongoing research by OEH. This research will address future trends in both
ozone and particle pollution.
Air Quality Trends in the Illawarra 67
7 Research to further extend the evidence base
An overview of research areas of relevance to the Illawarra is provided in this section, with
reference to major programs being implemented by OEH and EPA, in addition to research
being conducted by leading science partners. Although not all of the research efforts
referenced involve measurements in the Illawarra, the information generated by such research
will contribute to a better understanding of air pollution sources and impacts in the region.
7.1 2013 NSW GMR Air Emissions Inventory
The EPA is updating the NSW GMR Air Emissions Inventory for the 2013 calendar year to
improve the evidence about current contributions from all sources and past and future trends
in emissions. The inventory update will include a number of improvements, such as the
inclusion of additional sources not considered previously (e.g. lightning NOx), and additional
particle components to support regional particle modelling.
This work will enable the EPA to communicate accurate, up-to-date information to community,
environmental and industry stakeholders; evaluate the effectiveness of existing programs and
develop new cost-effective programs aimed at improving air quality. The 2013 NSW GMR Air
Emissions Inventory will be completed in 2016. The web-based tool Air Emissions in My
Community will continue to provide stakeholders with access to updated air emissions,
displayed for different geographical areas, ranging from the entire NSW Greater Metropolitan
Region down to postcode level.
Source and emissions data from the NSW GMR Air Emissions Inventory also represents a
critical input to regional airshed modelling for the Greater Metropolitan Region.
7.2 Regional airshed modelling
Whereas OEH’s air quality monitoring network provides robust, continuous air pollution
concentration data for selected sites, regional airshed modelling provides a way of projecting
high-resolution spatial variations in air pollution concentrations. Regional meteorological and
chemical transport modelling supports air quality forecasting, source contribution study and
scenario analysis to assesses the impact of development proposals and planned mitigation
measures on regional air quality.
Because ozone and fine particle concentrations in New South Wales exceed national air
quality standards from time to time, regional airshed modelling efforts in New South Wales
focus on simulating ozone photochemistry and particle formation and removal processes.
OEH’s Regional Airshed Modelling Program aims to progressively enhance modelling
capabilities, with the following key projects being undertaken over the 2014–16 period:
Tailoring and verification of the Conformal-Cubic Atmospheric Model (CCAM)
meteorological model and Chemical Transport Model (CTM) chemical transportation model
for regional airshed modelling applications in New South Wales. CSIRO demonstrated the
use of CCAM–CTM during the Sydney Particle Study (Cope et al. 2013). Building on this
study, OEH is collaborating with CSIRO to establish tailored and verified ozone and
secondary particle modelling for New South Wales, with a focus on the GMR which
includes the Illawarra, Newcastle and the Upper Hunter.

68 Office of Environment and Heritage
A collaborative OEH–University of Wollongong project to establish a model evaluation
framework to evaluate the performance of meteorological and chemical transport models.
This project also involves the configuration and verification of the Weather Research and
Forecasting (WRF) meteorological model and the selection, configuration and verification
of an open source chemical transport model for application in New South Wales.
Advanced ozone and particle modelling will enhance the evidence base for NSW air policy,
with the establishment of verified 3-D deterministic numerical modelling systems making it
possible to provide local communities with accurate air quality forecasts.
7.3 Air quality forecasting
Accurate air quality forecasting provides information that can help people susceptible to poor
air quality take preventative actions to minimise personal health impacts. Forecasting can also
be used to inform emission reduction measures to avoid air pollution episodes.
OEH currently provides 24-hour ozone pollution forecasts for the Sydney region, expressed in
Air Quality Index class and updated daily at 4pm on the OEH website (OEH 2014d). A
qualitative forecasting method is applied, drawing on forecasters’ technical and domain
knowledge and experience, meteorological forecasts provided by the Bureau of Meteorology
and information received from the NSW Rural Fire Service on current fires and planned
hazard reduction burns. OEH’s current ozone forecasting for the Sydney region is of moderate
skill and capability for forecasting high particle pollution days.
The OEH Air Quality Forecasting Program aims to progressively expand the scope and
enhance the accuracy of air quality forecasting capabilities in New South Wales over the next
five years through collaboration and the development of advanced tools and analysis. The
focus is on forecasting ozone and particle pollution within the Greater Metropolitan Region
and key regional areas of New South Wales. Specific projects being undertaken or
participated in under this program include:
Development, verification and deployment of statistical and deterministic air quality
forecasting tools and techniques by the Climate and Atmospheric Science branch of OEH.
Information on deterministic modelling being developed is given in the previous section.
OEH is collaborating with the Bureau of Meteorology, CSIRO and NSW Rural Fire Service
on the Fire and Air Quality subproject of the Bureau’s Forecast Demonstration Project
(FDP). This 2014–15 subproject, led by CSIRO, is evaluating the use and accuracy of high-
resolution quantitative fire weather and air pollution forecasts based on the medium-range
ensemble numerical weather prediction from the Bureau’s ACCESS model.
OEH is collaborating with The University of New South Wales on a project funded by the
NSW Environmental Trust which aims to produce a tool for forecasting air pollution impacts
caused by hazard reduction burns over the greater Sydney region. This tool is intended to
improve the planning of burn times to reduce the potential for extreme air pollution risk to
the community, while still allowing NSW land managers and fire agencies to carry out
critical burns required to reduce bushfire risk.
The previously mentioned collaborative OEH–University of Wollongong project to evaluate
and enhance regional airshed modelling will also contribute to improvements in deterministic
forecasting capabilities.

Air Quality Trends in the Illawarra 69
7.4 Particle characterisation
OEH, EPA and NSW Health have collaborated with ANSTO and CSIRO to undertake particle
speciation and source apportionment studies in New South Wales. To date, particle speciation
studies have been undertaken for Sydney (OEH 2014a) and the Upper Hunter (Hibberd et al.
2013) and a further study is underway in the Lower Hunter (OEH 2015a). Further information
on ANSTO’s ongoing east coast PM2.5 speciation and source apportionment work, including at
Warrawong in the Illawarra, is described in Section 7.9.1.
7.5 Emerging monitoring techniques
7.5.1 Rapid response monitoring
The recent Hazelwood mine fire in Morwell, Victoria, highlighted the need for rapid-response
monitoring for air quality incidents. OEH has established rapid-response air quality monitoring
capabilities for deployment within New South Wales. This monitoring includes:
two portable monitoring stations able to hold up to seven air quality monitors that comply
with Australian Standards and with the AAQ NEPM (Figure 45)
non-compliance monitors that could be rapidly deployed for ‘indicative’ measurements to
support immediate decision-making (e.g. DustTraks aerosol dust monitors)
meteorological monitors
telemetry and communications systems
web reporting capabilities for incident monitoring.
Figure 45: OEH portable monitoring station able to hold up to seven air quality monitors that
comply with Australian Standards and with the AAQ NEPM
To further extend and enhance rapid response monitoring capabilities, OEH is investigating air
toxics sampling methods and a range of emerging technologies including non-compliance,
continuous monitors that are cheaper, easier and quicker to deploy for indicative monitoring.

70 Office of Environment and Heritage
OEH and EPA are also devising procedures to guide the implementation of incidence
monitoring and the assessment and communication of measurement results.
7.5.2 Black carbon monitoring
Black carbon is a major component of airborne fine particulate matter in urban areas and has
received increasing attention internationally due to its effects on urban air quality, public health
and global climate. These fine particles are directly emitted into the air during the incomplete
combustion of fossil fuels used for transport, heating and industrial activities, and from
biomass burning due to vegetation fires. The monitoring of black carbon as a proxy for traffic
combustion exhaust is being applied in a number of European, American and Asian urban
environments.
OEH is investigating the measurement of Equivalent Black Carbon (EBC) using multi-
wavelength aethalometers at two sites located in the Lower Hunter. These aethalometers
support continuous, real-time, temporally resolved measurements of EBC at seven
wavelengths (370, 470, 520, 590, 660, 880 and 950 nanometres). The measurement of
absorption at 880 nanometres is interpreted as concentrations of black carbon.
Simultaneous measurement at multiple wavelengths is able to support studies of aerosol light
absorption and source apportionment, with black carbon from fossil fuel being distinguishable
from biomass combustion. OEH research into the operation of aethalometers and the
interpretation of the trends measured is ongoing.
7.6 Health effects of air pollution
The EPA, OEH and NSW Health collaborate with the independent Centre for Air Quality and
Health Research and Evaluation (CAR)4 to initiate new research to increase understanding of
the health impacts, risks and costs of air pollution in New South Wales. An evaluation into the
health impacts of difference sources, types and levels of airborne particles in New South
Wales is due for completion in 2015.
The EPA, NSW Health, CAR and CSIRO are collaborating on a study to estimate the health
impacts of PM2.5-related shipping emissions in the Greater Metropolitan Region, including Port
Kembla. This research is expected to be completed in 2015.
The EPA is supporting the University of Tasmania in an interstate study on the relative health
effects of smoke pollution from bushfire events and planned hazard reduction burns. This is a
multi-year study initiated in 2014.
7.7 Air quality management research
The EPA leads a range of research assessing the technical feasibility and benefits and costs
of a range of air pollution mitigation measures. This has included the assessment of measures
implementable by the industrial and commercial sector, in addition to measures for addressing
emissions from residential wood burning and the non-road mobile sector.
4 www.car-cre.org.au

Air Quality Trends in the Illawarra 71
Recently the EPA has commissioned an assessment of the technical feasibility, ship-
owner/operator costs and emission impacts of adopting emission reduction measures for
shipping in the Greater Metropolitan Region. This assessment is due for completion in 2015.
7.8 Climate change impacts on air quality
Projections of climate change and related impacts on regional air quality are being undertaken
as part of the NSW and ACT Regional Climate Modelling (NARCliM) project, a multi-agency
research partnership between the NSW and ACT governments and the Climate Change
Research Centre at The University of New South Wales (see Section 6.2). This research will
address future trends in both ozone and particle pollution.
7.9 Research by science partners
7.9.1 Particle speciation and source apportionment by ANSTO
The Australian Nuclear Science and Technology Organisation (ANSTO) has been using ion
beam analysis (IBA) techniques to analyse fine particle pollution samples collected from key
sites around Australia, and internationally, for more than 20 years (ANSTO 2015a).
Accelerator-based IBA techniques (PIXE, PIGE, PESA and RBS) play a key role in this
research, being able to simultaneously determine 21 key air pollution elements (H, F, Na, Al,
Si, P, S, Cl, K, Ca, Ti, V, Cr, Mn, Fe, Co, Cu, Ni, Zn, Br and Pb) collected on exposed filters
(ANSTO 2015b).
PM2.5 sampling and characterisation
at Warrawong conducted as part of
ANSTO’s east coast Aerosol
Sampling Program (ASP) is ongoing,
allowing changes in particle
composition over time to be tracked
and compared to particle composition
measured at other sites.
ANSTO has recently released fine-
particle concentration contour maps
based on the long-term ANSTO ASP
data collected for the NSW GMR
from 2007–14. Monthly average
PM2.5 concentrations from 2007–13
have been used to produce contour
maps which provide an indication of
fine particle concentration levels from
Wollongong through Sydney to
Newcastle. Contour map video
animations are available for black
carbon, soil, ammonium sulfate and
total PM2.5 mass (Figure 46).
Figure 46: Contour map video animations for black
carbon, soil, ammonium sulfate and PM2.5 mass
Available at www.ansto.gov.au/ResearchHub/IER/Capabilities/ASP/

72 Office of Environment and Heritage
7.9.2 Centre for Atmospheric Chemistry, University of Wollongong
The Centre for Atmospheric Chemistry at the University of Wollongong (UOW) has been
studying air in the Illawarra for over 20 years. The group runs observatories at both
Wollongong (Figure 47) and Darwin that measure the changing amounts of trace gases in the
troposphere and stratosphere, including greenhouse gases and ozone-depleting gases.
These measurements are used to monitor the changing atmosphere as part of several
international networks, such as the Total Carbon Column Observing Network (TCCON)
(www.tccon.caltech.edu) and the Network for the Detection of Atmospheric Composition
Change (NDACC) (www.acd.ucar.edu/irwg/index.html). They are also used for testing
satellite-based instruments.
The Centre for Atmospheric Chemistry
also makes ground-level measurements of
greenhouse gases, volatile organic
compounds, reactive species, aerosols
and atmospheric radiation measurements
(which are linked to Australia’s Cape Grim
station in Tasmania). Measurement
campaigns study remote or poorly
understood regions with a comprehensive
range of instruments to more fully
characterise the local atmosphere and
emissions. UOW has orchestrated or
collaborated in many such campaigns to
measure both greenhouse gases and air
quality, including agricultural sites as well
as ship-borne and train-borne voyages.
Figure 47: TCCON ground validation
site at UOW
Figure 48: Primary MUMBA
campaign site in Wollongong
The Measurements of Urban, Marine, and
Biogenic Air (MUMBA) campaign was
recently organised by UOW to better
characterise the atmosphere within the
Illawarra region (Figure 48). More than 20
different instruments were deployed at
three sites to complement OEH’s routine
air quality monitoring program. The
detailed information obtained is useful for
improving air quality models. More recently
UOW is developing skills in atmospheric
composition modelling ranging from global
(e.g. GEOS-Chem, ACCESS) through
regional and local scales (STILT,
CHIMERE) to paddock scale for
agricultural flux measurements (Windtrax).
UOW is working with OEH to further
improve the air quality forecasting
capabilities in the region.

Air Quality Trends in the Illawarra 73
References
ANSTO 2008, ‘A Long Term Fine Particle Database Along the Australian East Coast’, Fine
Particle Aerosol Sampling Newsletter, Number 38, July 2008,
www.ansto.gov.au/cs/groups/corporate/documents/webcontent/mdaw/mday/~edisp/acstes
t_040330.pdf
ANSTO 2014, Aerosol Sampling Program sampling for Warrawong, information available
for the 2000 to 2009 period, research-data.ansto.gov.au/collection/401
ANSTO 2015a, Aerosol Sampling Program: fine particle pollution research,
www.ansto.gov.au/ResearchHub/IER/Capabilities/ASP/, accessed June 2015.
ANSTO 2015b, Ion Beam Analysis capabilities,
www.ansto.gov.au/ResearchHub/IER/Capabilities/IBA/IBACapabilities/index.htm,
accessed June 2015.
Australian Government 2014, Impact Statement and draft varied Ambient Air Quality
NEPM, www.environment.gov.au/protection/nepc/nepms/ambient-air-quality/variation-
2014/impact-statement
Bureau of Meteorology 2014, Annual Climate Summary for New South Wales, Product
Code IDCKGC15R0,
www.bom.gov.au/climate/current/month/nsw/archive/201401.summary.shtml
Bureau of Meteorology 2015, Annual Climate Summary for New South Wales, Product
Code IDCKGC55R0,
www.bom.gov.au/climate/current/annual/nsw/summary.shtml#records
Cohen, DD, Bailey, GM & Kondepudi R 1996, ‘Elemental analysis by PIXE and other IBA
techniques and their application to source fingerprinting of atmospheric fine particle
pollution’, Nucl. Instrum. Methods Phys. Res. B 1996, 109–110, 218. doi:10.1016/0168-
583X(95)00912-4
Cope, ME & Ischtwan, J 1996, Metropolitan air quality study, airshed modelling, final
report from Environment Protection Authority, Victoria to NSW Environment Protection
Authority.
Cope, M, Lee, S, Physick, B, Abbs, D, Nguyen, K & McGregor, J 2008, A Methodology for
Determining the Impact of Climate Change on Ozone Levels in an Urban Area, CSIRO.
Cope, M, Keywood, M, Emmerson, K, Galbally, I, Boast, K, Chambers, S, Cheng, M,
Crumeyrolle, S, Dunne, E, Fedele, R, Gillett, R, Griffiths, A, Harnwell, J, Katzfey, J, Hess,
D, Lawson, S, Miljevic, B, Molloy, S, Powell, J, Reisen, F, Ristovski, Z, Selleck, P, Ward, J,
Zhang, C, and Zeng, J 2013, Sydney Particle Study – Stage-II, The Centre for Australian
Weather and Climate Research (CAWCR) on behalf of the Office of Environment and
Heritage, www.environment.nsw.gov.au/resources/aqms/SydParticleStudy10-13.pdf
Environment Canada 2014, International Comparison of Urban Air Quality,
www.ec.gc.ca/indicateurs-indicators/default.asp?lang=en&n=1B7C2AC9-1, accessed
June 2015.
EPA 1996, Metropolitan Air Quality Study – Outcomes and Implications for Managing Air
Quality, NSW Environment Protection Authority.
74 Office of Environment and Heritage
EPA 2012, 2008 Calendar Year Air Emissions Inventory for the Greater Metropolitan
Region in NSW, NSW Environment Protection Authority,
www.epa.nsw.gov.au/air/airinventory2008.htm
EPA 2013a, Air Emissions in My Community web tool: Geographical areas information,
NSW Environment Protection Authority,
www.epa.nsw.gov.au/resources/air/130842aegeogfs.pdf
EPA 2013b, Managing particles and improving air quality in NSW, NSW Environment
Protection Authority, www.epa.nsw.gov.au/air/20130784ManPartStr.htm
EPA 2014a, Air Emissions in My Community web tool overview, NSW Environment
Protection Authority, www.epa.nsw.gov.au/air/airemissionsinmycommunity.htm
EPA 2014b, TP01: Trends in Motor Vehicles and their Emissions, NSW Environment
Protection Authority report to the Advisory Committee on Tunnel Air Quality,
www.chiefscientist.nsw.gov.au/__data/assets/pdf_file/0007/54790/Road-
Tunnels_TP01_Trends_inMotor_Vehicles_and_Their_Emissions.pdf
EPA 2015, Diesel and Marine Emissions Management Strategy, NSW Environment
Protection Authority, www.epa.nsw.gov.au/resources/air/150038Diesel-marine-
strategy.pdf
Goldsworthy L & Goldsworthy B 2014, Exhaust Emissions from Ship Engines in Australian
Waters Including Ports – Focus on NSW Ports, presentation for NSW Environment
Protection Authority workshop, November 2014, Sydney,
www.epa.nsw.gov.au/resources/epa/presn-exhaustemissions.pdf
Goldsworthy L & Goldsworthy B 2015, ‘Modelling of ship engine exhaust emissions in
ports and extensive coastal waters based on terrestrial AIS data – an Australian case
study’, Environmental Modelling & Software, 63 (2015) 45–60.
Hibberd, M, Selleck, P, Keywood, M, Cohen, D, Stelcer, E & Atanacio, A 2013, Upper
Hunter Valley Particle Characterisation Study, final report, prepared for the Office of
Environment and Heritage and the NSW Department of Health
Hyde, R & Prescott, A 1984, The Illawarra Sea Breeze Study, Applied Meteorology Group,
School of Earth Sciences, Macquarie University.
Hyde, R, Young, MA, Hurley, PJ & Manins, PC 1997, ‘Metropolitan Air Quality Study:
Meteorology – Air movements’, report prepared for NSW Environment Protection
Authority.
Nelson, PF, Azzi, M, Cope, M, Lilley, W, Carras, JN, Hurley, PJ & Hyde, R 2002,
Interregional Transport of Air Pollutants Study (IRTAPS), CSIRO Energy Technology, New
South Wales.
NEPC 2010, Review of the National Environment Protection (Ambient Air Quality)
Measure: Discussion Paper, Air Quality Standards, National Environment Protection
Council, ISBN 978-1-921173-66-0.
NSW Government 2014, NSW 2021: A plan to make NSW number one,
www.2021.nsw.gov.au/index.php
OEH 2012, Who Cares about the Environment? Office of Environment and Heritage,
www.environment.nsw.gov.au/communities/who-cares.htm

Air Quality Trends in the Illawarra 75
OEH 2014a, Sydney Particle Study, Office of Environment and Heritage,
www.environment.nsw.gov.au/aqms/sydparticlestudy.htm
OEH 2014b, Illawarra Climate Change Snapshot, Adapt NSW website, Office of
Environment and Heritage, www.climatechange.environment.nsw.gov.au/Climate-
projections-for-NSW/Climate-projections-for-your-region/Illawarra-Climate-Change-
Downloads
OEH 2014c, New South Wales Air Quality Statement 2013, Office of Environment and
Heritage, www.environment.nsw.gov.au/aqms/140057nswairqual13.htm
OEH 2014d, Sydney AQI forecast, Office of Environment and Heritage,
www.environment.nsw.gov.au/aqms/aqiforecast.htm
OEH 2015a, Lower Hunter Particle Characterisation Study, Office of Environment and
Heritage, www.environment.nsw.gov.au/aqms/lowhunterparticle.htm
OEH 2015b, New South Wales Air Quality Statement 2014, Office of Environment and
Heritage, www.environment.nsw.gov.au/aqms/150004nswairqual14.htm
WHO 2014, Ambient (outdoor) air quality and health, Fact sheet N°313, updated March
2014, World Health Organisation,
www.who.int/mediacentre/factsheets/fs313/en/index.html

76 Office of Environment and Heritage
Appendix A – Seasonal wind roses for the Illawarra region
Figure A.1: Winter-average wind roses in OEH air quality monitoring stations Wollongong,
Kembla Grange, Albion Park South for 2013 and Warrawong (decommissioned) for 2005; and
BOM weather stations Bellambi, Kiama for 2013

Air Quality Trends in the Illawarra 77
Figure A.2: Spring-average wind roses in OEH air quality monitoring stations Wollongong,
Kembla Grange, Albion Park South for 2013 and Warrawong (decommissioned) for 2005; and
BOM weather stations Bellambi, Kiama for 2013

78 Office of Environment and Heritage
Figure A.3: Summer-average wind roses in OEH air quality monitoring stations Wollongong,
Kembla Grange, Albion Park South for 2013 and Warrawong (decommissioned) for 2005; and
BOM weather stations Bellambi, Kiama for 2013

Air Quality Trends in the Illawarra 79
Figure A.4: Autumn-average wind roses in OEH air quality monitoring stations Wollongong,
Kembla Grange, Albion Park South for 2013 and Warrawong (decommissioned) for 2005; and
BOM weather stations Bellambi, Kiama for 2013
80 Office of Environment and Heritage
Appendix B – Diurnal wind roses for Wollongong
Figure B.1: Winter-average diurnal wind roses (a) 0-6, (b) 6-12, (c) 12-18 and (d) 18-24 local
standard time (LST)
(a) (b)
(c) (d)

Air Quality Trends in the Illawarra 81
Figure B.2: Spring-average diurnal wind roses (a) 0-6, (b) 6-12, (c) 12-18 and (d) 18-24 LST
(a) (b)
(c) (d)

82 Office of Environment and Heritage
Figure B.3: Summer-average diurnal wind roses (a) 0-6, (b) 6-12, (c) 12-18 and (d) 18-24 LST
(a) (b)
(c) (d)

Air Quality Trends in the Illawarra 83
Figure B.4: Autumn-average diurnal wind roses (a) 0-6, (b) 6-12, (c) 12-18 and (d) 18-24 LST
(a) (b)
(c) (d)

84 Office of Environment and Heritage
Appendix C – Top source contributions to emissions within the Kiama, Shellharbour, and Wollongong LGAs (EPA 2012)
Kiama LGA Shellharbour LGA Wollongong LGA
Figure C.1: Top ten PM10 emission sources (tonnes per year)

Air Quality Trends in the Illawarra 85
Kiama LGA Shellharbour LGA Wollongong LGA
Figure C.2: Top ten PM2.5 emission sources (tonnes per year)
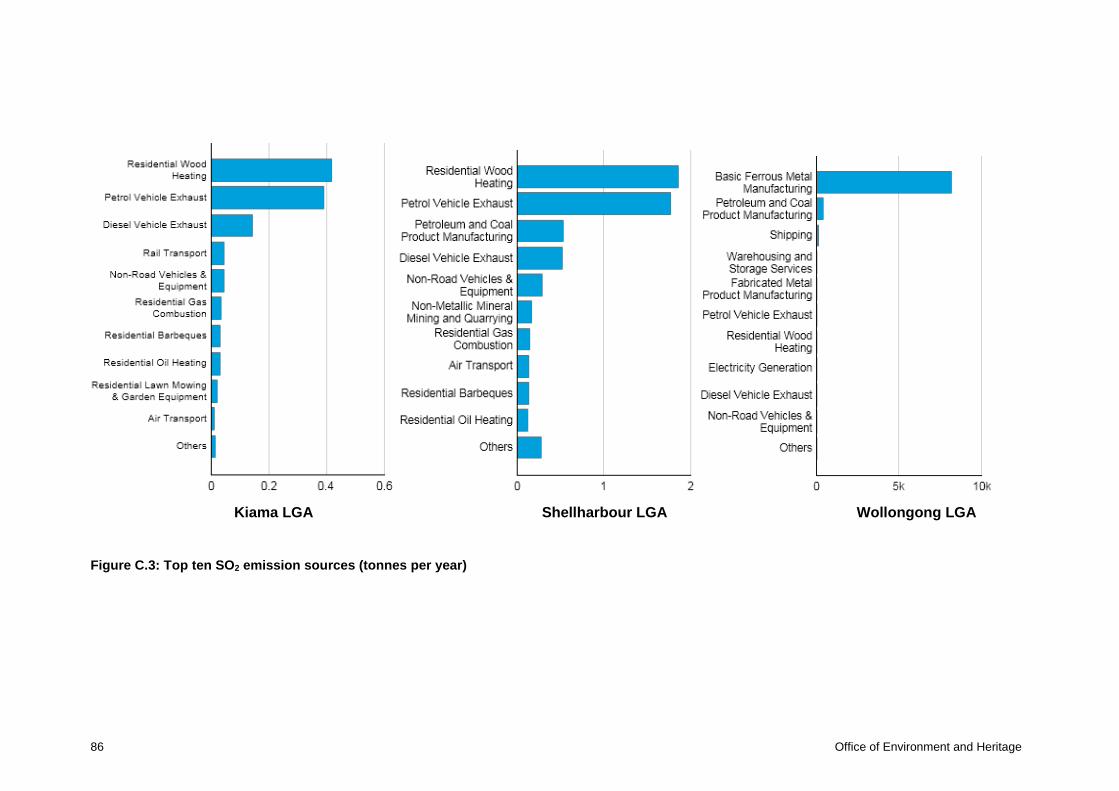
86 Office of Environment and Heritage
Kiama LGA Shellharbour LGA Wollongong LGA
Figure C.3: Top ten SO2 emission sources (tonnes per year)

Air Quality Trends in the Illawarra 87
Kiama LGA Shellharbour LGA Wollongong LGA
Figure C.4: Top ten NOx emission sources (tonnes per year)

88 Office of Environment and Heritage
Kiama LGA Shellharbour LGA Wollongong LGA
Figure C.5 Top ten VOC emission sources (tonnes per year)