air quality/greenhouse gas report
TRANSCRIPT

Air Quality/Greenhouse Gas Report Big Rock Cluster Solar Project
Imperial County
Prepared for:
90FI 8ME, LLC and 92JT 8ME, LLC c/o 8minutenergy Renewables LLC
211 Sutter Street, Fl. 6
San Francisco, CA 94108
Prepared by:
308 San Dimas Avenue
Oceanside, CA 92057
Revised 3/1/2018

Air Quality/Greenhouse Gas Report
Big Rock Cluster Solar Project, Imperial County
OB-1 Air Analyses Revised March 2018 Page ii
Table of Contents
SECTION 1.0 – INTRODUCTION ........................................................................................................................... 1
1.1. REPORT PURPOSE ................................................................................................................................... 1
1.2. PROJECT LOCATION ............................................................................................................................... 1
1.3. PROJECT DESCRIPTION.......................................................................................................................... 1
SECTION 2.0 – EXISTING CONDITIONS ............................................................................................................. 4
2.1. CLIMATOLOGY/ METEOROLOGY ........................................................................................................ 4
Temperature and Precipitation ..................................................................................................................... 4
Humidity ...................................................................................................................................................... 5
Wind 5
Inversions .................................................................................................................................................... 5
2.2. LOCAL AIR QUALITY CONDITIONS .................................................................................................... 6
Criteria Air Pollutants .................................................................................................................................. 6
Pollutant Transport ...................................................................................................................................... 9
Toxic Air Contaminants ............................................................................................................................ 10
Sensitive Receptors.................................................................................................................................... 11
2.3. GREENHOUSE GASES ........................................................................................................................... 12
GHG Emission Levels ............................................................................................................................... 14
Potential Environmental Effects ................................................................................................................ 15
California Implications .............................................................................................................................. 15
2.4. BASELINE CONDITIONS ....................................................................................................................... 16
Local Ambient Air Quality ........................................................................................................................ 16
Local Emissions Inventory ........................................................................................................................ 17
SECTION 3.0 – REGULATORY CONTEXT ........................................................................................................ 21
3.1. REGULATORY AGENCIES .................................................................................................................... 21
Environmental Protection Agency (EPA) .................................................................................................. 21
California Air Resources Board (CARB) .................................................................................................. 21
Imperial County Air Pollution Control District (ICAPCD) ....................................................................... 21
3.2. ATTAINMENT STATUS ......................................................................................................................... 22
3.2.1 Designations/Classifications ........................................................................................................ 22
3.2.2 Federal Clean Air Act Requirements ........................................................................................... 22
3.3. REGULATORY FRAMEWORK ............................................................................................................. 24
3.3.1 Federal Regulations and Standards .............................................................................................. 24
3.3.2 State Regulations and Standards .................................................................................................. 24
3.3.3 Local Regulations and Standards ................................................................................................. 24
Air Quality Management Plans (AQMP) .................................................................................................. 25

Air Quality/Greenhouse Gas Report
Big Rock Cluster Solar Project, Imperial County
OB-1 Air Analyses Revised March 2018 Page iii
3.4. CLIMATE CHANGE ................................................................................................................................ 27
Federal Climate Change Legislation.......................................................................................................... 27
State Climate Change Legislation.............................................................................................................. 28
SECTION 4.0 – SIGNIFICANCE CRITERIA ....................................................................................................... 32
4.1. CEQA SIGNIFICANCE DETERMINATION THRESHOLDS ............................................................... 32
4.2. ICAPCD REGIONAL THRESHOLDS OF SIGNIFICANCE .................................................................. 32
4.2.1 Operational Thresholds ................................................................................................................ 32
4.2.2 Construction Thresholds for Tier 1 Projects ................................................................................ 34
4.2.3 Toxics or Hazardous Air Pollutant Thresholds ............................................................................ 35
4.2.4 Odor Threshold ............................................................................................................................ 35
4.3. GREENHOUSE GAS (GHG) / CLIMATE CHANGE ............................................................................. 35
4.3.1 California Environmental Quality Act (CEQA) .......................................................................... 35
4.3.2 Local Significance Thresholds ..................................................................................................... 35
SECTION 5.0 – IMPACT ANALYSIS .................................................................................................................... 37
5.1. ANALYSIS METHODOLOGY ................................................................................................................ 37
Construction Emissions ............................................................................................................................. 37
Operational Emissions ............................................................................................................................... 38
5.2. ANALYSIS OF ENVIRONMENTAL IMPACTS .................................................................................... 40
IMPACT 1: Would the Project conflict with or obstruct implementation of the applicable air quality
plan? ................................................................................................................................... 40
IMPACT 2: Would the Project violate any air quality standard or contribute substantially to an existing
or projected air quality violation? ...................................................................................... 42
IMPACT 3: Would the Project result in construction-related air quality impacts? ............................... 42
IMPACT 4: Would the Project result in operational-related air quality impacts?................................. 52
IMPACT 5: Would the Project result in a cumulatively considerable net increase of any criteria
pollutant for which the project region is nonattainment under an applicable federal or state
ambient air quality standard (including releasing emissions which exceed quantitative
thresholds for ozone precursors)?....................................................................................... 53
IMPACT 6: Would the Project expose sensitive receptors to substantial pollutant concentrations? .... 54
IMPACT 7: Would the Project create objectionable odors affecting a substantial number of people? . 55
IMPACT 8: Would the Project generate GHG emissions, either directly or indirectly, that may have a
significant impact on the environment? ............................................................................. 56
IMPACT 9: Would the Project conflict with an applicable plan, policy, or regulation adopted for the
purpose of reducing the emissions of GHGs? .................................................................... 57

Air Quality/Greenhouse Gas Report
Big Rock Cluster Solar Project, Imperial County
OB-1 Air Analyses Revised March 2018 Page iv
LIST OF TABLES
Table 1 – Big Rock Cluster Components ...................................................................................................................... 2
Table 2 – National and State Ambient Air Quality Standards ....................................................................................... 7
Table 3 – 2010 TAC Emissions in Imperial County (tons per year) ........................................................................... 11
Table 4 – Global Warming Potentials.......................................................................................................................... 13
Table 5 – Ambient Air Quality Monitoring Summary for Project Vicinity ................................................................. 17
Table 6 – Imperial County 2020 Estimated Annual Emissions ................................................................................... 18
Table 7 – Designations/Classifications for the Basin .................................................................................................. 23
Table 8 – Regional Operational Thresholds of Significance ....................................................................................... 33
Table 9 – Construction Threshold Guide ..................................................................................................................... 34
Table 10 – Project Phase Durations ............................................................................................................................. 38
Table 11 – Unmitigated Construction Emissions for Big Rock 1 Solar Farm ............................................................. 44
Table 12 – Unmitigated Construction Emissions for Laurel 1 Solar Farm .................................................................. 44
Table 13 – Unmitigated Construction Emissions for Laurel 2 Solar Farm .................................................................. 45
Table 14 – Unmitigated Construction Emissions for Laurel 3 Solar Farm .................................................................. 45
Table 15 – Unmitigated Criteria Temporal Summary for Project ............................................................................... 46
Table 16 – Mitigated Construction Emissions for Big Rock 1 Solar Farm ................................................................. 49
Table 17 – Mitigated Construction Emissions for Laurel 1 Solar Farm ...................................................................... 49
Table 18 – Mitigated Construction Emissions for Laurel 2 Solar Farm ...................................................................... 50
Table 19 – Mitigated Construction Emissions for Laurel 3 Solar Farm ...................................................................... 50
Table 20 – Mitigated Criteria Temporal Summary for Project .................................................................................... 51
Table 21 – Estimated Operational Criteria Emissions ................................................................................................. 53
Table 22 – Project GHG Emissions ............................................................................................................................. 57
LIST OF FIGURES
Figure 1 – Project Vicinity ............................................................................................................................................ 1
Figure 2 – Project Location ........................................................................................................................................... 3
Figure 3 - Phased Cluster Activity Distributions ......................................................................................................... 39
APPENDIX A – Air Quality and GHG Calculations

Air Quality/Greenhouse Gas Report
Big Rock Cluster Solar Project, Imperial County
OB-1 Air Analyses Revised March 2018 Page v
Acronyms and Abbreviations
µg/m3 micrograms per cubic meter
AAQS ambient air quality standard
AB Assembly Bill
AQMP Imperial County Air Quality Management Plan
AQR Air Quality Report
AR4 IPCC’s Fourth Assessment Report
AVTD average vehicle trips per day
BACM Best Available Control Measure
BACT Best Available Control Technology
BAU business as usual
BR-1 Big Rock 1 Solar Farm
CAAQS California Ambient Air Quality Standards
CalEEMod™ California Emissions Estimator Model
CAQAR Comprehensive Air Quality Analysis Report
CARB California Air Resources Control Board
CAT Climate Action Team
CEC California Energy Commission
CEQA California Environmental Quality Act
CFC chlorofluorocarbon
CH4 methane
CNRA California Natural Resources Agency
CO carbon monoxide
CO2 carbon dioxide
CO2e carbon dioxide equivalent
CTI California Toxic Inventory
DPM diesel particulate matter
EI emission inventory
EIR Environmental Impact Report
EMFAC Emission Factors model for on-road mobile sources
EO Executive Order
EPA United States Environmental Protection Agency
FCAA Federal Clean Air Act
gen-tie generator tie-ins
GHG greenhouse gas
GWP global warming potential
HFC hydrofluorocarbon
HRA Health Risk Assessment
ICAPCD Imperial County Air Pollution Control District
IPCC International Panel on Climate Change
IRP Integrated Resource Plan
kV kilovolt
L-1 Laurel 1 Solar Farm

Air Quality/Greenhouse Gas Report
Big Rock Cluster Solar Project, Imperial County
OB-1 Air Analyses Revised March 2018 Page vi
Acronyms and Abbreviations
L-2 Laurel 2 Solar Farm
L-3 Laurel 3 Solar Farm
M million
MtCO2e million tonnes of carbon dioxide equivalents
MW-AC megawatts of alternating current
N2O nitrous oxide
N natural sources
NAAQS National Ambient Air Quality Standards
NH3 ammonia
NH4NO3 ammonium nitrate
NO nitric oxide
NO2 nitrogen dioxide
NOX nitrogen oxides
O&M operations and maintenance
PFC perfluorocarbon
PM particulate matter
PM10 respirable particulate matter of 10 micrometers or less in size
PM2.5 fine particulate matter of 2.5 micrometers or less in size
ppb parts per billion
ppm parts per million
Project Big Rock Cluster Solar Project
PV photovoltaic
ROG reactive organic gases
RPS Renewables Portfolio Standard
SB Senate Bill
SCAQMD South Coast Air Quality Management District
SF6 sulfur hexafluoride
SIP State Implementation Plan
SSAB Salton Sea Air Basin
t abbreviation for tonne (or metric ton)
TAC toxic air contaminants
tCO2e tonne of carbon dioxide equivalents
TIA Traffic Impact Analysis
UNFCCC United Nations Framework Convention on Climate Change
URBEMIS Urban Emissions computer model
VDE Visible Dust Emissions
WRI World Resources Institute

Air Quality/Greenhouse Gas Report
Big Rock Cluster Solar Project, Imperial County
OB-1 Air Analyses Revised March 2018 Page 1
SECTION 1.0 – INTRODUCTION
1.1. Report Purpose
The purpose of this Air Quality Report (AQR) is to analyze the potential air quality and climate
change impacts that could occur with the construction and operation of the Big Rock Cluster Solar
Project (Project), in Imperial County, California. This assessment was conducted within the context
of the California Environmental Quality Act (CEQA, California Public Resources Code Sections
21000 et seq.). The methodology follows the CEQA Air Quality Handbook1 prepared by the
Imperial County Air Pollution Control District (ICAPCD) for quantification of emissions and
evaluation of potential impacts to air resources.
1.2. Project Location
The Project sites will be approximately 9 miles west southwest of the City of El Centro, California in
southern Imperial County (see Figure 1). The Project site is adjacent to the Campo Verde Solar
Farm. The Project site is generally south of Interstate 8, west of Drew Road and Vogel Road, north
of Mandrapa Road, and east of Hyde Road in the Imperial Irrigation District. The Project Sites are
approximately eight miles southwest of the City of El Centro and three miles south of Seeley, a
census-designated place, in the unincorporated area of Imperial County. Agricultural uses lie to the
north and east, and solar farms are planned or completed/constructed to the west and to the south.
Figure 1 – Project Vicinity
1.3. Project Description
92JT 8me, LLC, known herein as the “Big Rock Applicant”, is proposing the development a single
utility-scale solar farm and 90FI 8me, LLC, known herein as the “Laurel Applicant” is proposing to
construct three utility-scale solar farms. These four projects together are known as the Big Rock
1 CEQA Air Quality Handbook: Guidelines for the Implementation of the California Air Quality Act of
1970 as amended. Imperial County Air Pollution Control District, November 2007.

Air Quality/Greenhouse Gas Report
Big Rock Cluster Solar Project, Imperial County
OB-1 Air Analyses Revised March 2018 Page 2
Cluster Solar Farm Project (Project). The four projects are as follows: Big Rock 1 Solar Farm (BR-
1), Laurel 1 Solar Farm (L-1), Laurel 2 Solar Farm (L-2), and Laurel 3 Solar Farm (L-3) (see Figure
2). Gross acreage and proposed size in megawatts of alternative current (MW-AC) for each project is
presented in Figure 2. Projects may cooperate if necessary to meet power production requirements.
Each project is intended to have operations and maintenance (O&M) facilities and an on-site
substation but may also utilize shared facilities.
Table 1 – Big Rock Cluster Components
Site Name Abbr. Gross Acreage Size (MW)
Big Rock 1 Solar Farm BR-1 342 75
Laurel 1 Solar Farm L-1 171 40
Laurel 2 Solar Farm L-2 280 70
Laurel 3 Solar Farm L-3 587 140
TOTAL for Project 1,380 325
Each solar site will utilize photovoltaic (PV) panels or modules on mounting frameworks to convert
sunlight directly into electricity. Individual panels will be installed on either fixed-tilt or tracker
mount systems (single- or dual-axis, using galvanized steel or aluminum). If the panels are
configured for fixed tilt, the panels will be oriented toward the south. For tracking configurations, the
panels will rotate to follow the sun over the course of the day. The panels will stand up to 30 feet
high, depending on mounting system used. All the sites have historically been used for agriculture
and are relatively flat.
In addition to the PV panels, the sites will include inverter stations, energy storage units, substations,
generator tie-in lines (gen-ties), above-ground water storage tanks, and O&M buildings. Sites near
each other may share O&M, substations, and/or transmission facility areas with neighboring sites.
For conservative estimates, this AQR assumes that each site will construct separate facilities.
Power generated by the Projects will be delivered from the Project sites via up to 230 kilovolt (kV)
overhead and/or underground electrical transmission line(s) originating from an on-site substation(s)/
switchyard(s) and terminating at the proposed Imperial Irrigation District Fern Substation. In the
alternative, power may be delivered to the San Diego Gas & Electric Imperial Valley Substation,
Drew Switchyard, or Imperial Solar Energy Center West Substation.
The projects may include an energy storage system(s), located at or near the substation(s) (onsite or
shared) and/or at the inverter stations, but possibly elsewhere onsite. The Projects may share an
energy storage system with one another and/or nearby solar projects or may operate standalone
energy storage facilities within the Project Sites.
After the useful life of each project (up to 40 years), the panels are easily disassembled from the steel
mounting frames and the site restored to pre-development condition.

Air Quality/Greenhouse Gas Report
Big Rock Cluster Solar Project, Imperial County
OB-1 Air Analyses Revised March 2018 Page 3
Figure 2 – Project Location

Air Quality/Greenhouse Gas Report
Big Rock Cluster Solar Project, Imperial County
OB-1 Air Analyses Revised March 2018 Page 4
SECTION 2.0 – EXISTING CONDITIONS
Air quality is determined primarily by the type and quantity of contaminants emitted into the atmosphere,
the size and topography of the air basin, and its meteorological conditions. Atmospheric conditions such
as wind speed, wind direction, and air temperature gradients, along with local topography, provide the
link between air pollution emissions and air quality.
2.1. Climatology/ Meteorology
Meteorology is the study of weather and climate. Weather refers to the state of the atmosphere at a
given time and place regarding temperature, air pressure, humidity, cloudiness, and precipitation.
The term “weather” refers to conditions over short periods; conditions over prolonged periods,
generally at least 30 to 50 years, are referred to as climate. Climate, in a narrow sense, is usually
defined as the “average weather,” or more rigorously as the statistical description in terms of the
mean and variability of relevant quantities over a period ranging from months to thousands or
millions of years. These quantities are most often surface variables such as temperature,
precipitation, and wind.
Climatic conditions in Imperial County are governed by the large-scale sinking and warming of air in
the semi-permanent tropical high-pressure center of the Pacific Ocean. The high-pressure ridge
blocks out most mid-latitude storms except in winter when the high is weakest and farthest south.
The coastal mountains prevent the intrusion of any cool, damp air found in California coastal
environs. Because of the weakened storms and barrier, Imperial County experiences clear skies,
extremely hot summers, mild winters, and little rainfall. The flat terrain of the valley and the strong
temperature differentials created by intense solar heating, produce moderate winds and deep thermal
convection.
The combination of subsiding air, protective mountains, and distance from the ocean all combine to
limit precipitation severely. Rainfall is highly variable with precipitation from a single heavy storm
sometimes exceeding the entire annual total during a later drought condition.
Imperial County enjoys a year-round climate characterized by a temperate fall, winter, and spring
and a harsh summer. Humidity often combines with the valley's normal elevated temperatures to
produce a moist, tropical atmosphere that frequently seems hotter than the thermometer suggests.
The sun shines, on the average, more in the Imperial County that anywhere else in the United States.
Temperature and Precipitation
The nearest National Weather Service Cooperative Observer Program weather station to the Project
is the station in El Centro, called El Centro 2 SSW, which is located approximately 8.5 miles north-
northeast of the Project. At the El Centro 2 SSW 2, average recorded rainfall during the Period of
Record (1932 to 2016) measured 2.64 inches, with 93 percent of precipitation occurring between
2 Western U.S. Climate Historical Summaries. Western Regional Climate Center.
http://www.wrcc.dri.edu/Climsum.html. Accessed September 2017.

Air Quality/Greenhouse Gas Report
Big Rock Cluster Solar Project, Imperial County
OB-1 Air Analyses Revised March 2018 Page 5
August and March and 45 percent in just December through February. Monthly average maximum
temperatures at this station vary annually by 38.1 degrees Fahrenheit (ºF); 108.0 °F at the hottest to
69.9 ºF at the coldest and monthly average minimum temperatures vary by 36.2 °F annually; i.e.
from 40.1 °F to 76.3 ºF. In fact, this station shows that the months of June, July, August, and
September have monthly maximum temperatures greater than 100 ºF
Humidity
Humidity in Imperial County is typically low throughout the year, ranging from 28 percent in
summer to 52 percent in winter. The large daily oscillation of temperature produces a corresponding
large variation in the relative humidity. Nocturnal humidity rises to 50-60 percent, but drop to about
10 percent during the day. Summer weather patterns are dominated by intense heat induced low-
pressure areas that form over the interior desert.
Wind
The wind direction follows two general patterns. The first pattern occurs seasonally from fall through
spring, where prevailing winds are from the west and northwest. Most of these winds originate in the
Los Angeles Basins. The Imperial County area occasionally experiences periods of high winds.
Wind speeds exceeding 31 mph occur most frequently in April and May. On an annual basis, high
winds, those exceeding 31 mph, are observed 0.6 percent of the time, where speeds of less than 6.8
miles per hour account for more than one-half of the observed winds. Wind statistics indicate
prevailing winds are from the west-northwest through southwest; however, a secondary flow pattern
from the southeast is also evident.
Inversions
Air pollutant concentrations are primarily determined by the amount of pollutant emissions in an
area and the degree to which these pollutants are dispersed in the atmosphere. The stability of the
atmosphere is one of the key factors affecting pollutant dispersion. Atmospheric stability regulates
the amount of vertical and horizontal air exchange, or mixing, that can occur within a given air basin.
Horizontal mixing is a result of winds, as discussed above, but vertical mixing also affects the degree
of stability in the atmosphere. An interruption of vertical mixing is called inversions.
In the atmosphere, air temperatures normally decrease as altitude increases. At varying distances
above the earth's surface, however, a reversal of this gradient can occur. This condition, termed an
inversion, is simply a warm layer of air above a layer of cooler air, and it has the effect of limiting
the vertical dispersion of pollutants. The height of the inversion determines the size of the vertical
mixing volume trapped below. Inversion strength or intensity is measured by the thickness of the
layer and the difference in temperature between the base and the top of the inversion. The strength of
the inversion determines how easily it can be broken by winds or solar heating.
Imperial County experiences surface inversions almost every day of the year. Due to strong surface
heating, these inversions are usually broken allowing pollutants to disperse more easily. Weak,
surface inversions are caused by radiational cooling of air in contact with the cold surface of the
earth at night. In valleys and low-lying areas, this condition is intensified by the addition of chilly air

Air Quality/Greenhouse Gas Report
Big Rock Cluster Solar Project, Imperial County
OB-1 Air Analyses Revised March 2018 Page 6
flowing down slope from the hills and pooling on the valley floor.
The presence of the Pacific High-Pressure Cell can cause the air to warm to a temperature higher
than the air below. This highly stable atmospheric condition, termed a subsidence inversion can act
as a nearly impenetrable lid to the vertical mixing of pollutants. The strength of these inversions
makes them difficult to disrupt. Consequently, they can persist for one or more days, causing air
stagnation and the buildup of pollutants. Highest or worst-case ozone levels are often associated with
the presence of this type of inversion.
2.2. Local Air Quality Conditions
Criteria Air Pollutants
As required by the Federal Clean Air Act (FCAA), the Environmental Protection Agency (EPA) has
identified criteria pollutants and established National Ambient Air Quality Standards (NAAQS) to
protect public health and welfare. NAAQS have been established for ozone, carbon monoxide (CO),
nitrogen dioxide (NO2), sulfur dioxide, suspended particulate matter (PM), and lead. Suspended PM
has standards for both PM with an aerodynamic diameter of 10 micrometers or less (respirable PM,
or PM10) and PM with an aerodynamic diameter of 2.5 micrometers or less (fine PM, or PM2.5). The
California Air Resources Board (CARB) has established separate standards for the State, i.e. the
California Ambient Air Quality Standards (CAAQS). CARB established CAAQS for all the federal
pollutants and sulfates, hydrogen sulfide, and visibility-reducing particles.
For some of the pollutants, the identified air quality standards are expressed in more than one
averaging time to address the typical exposures found in the environment. For example, CO is
expressed as a one-hour averaging time and an eight-hour averaging time. Regulations have set
NAAQS and CAAQS limits in parts per million (ppm), parts per billion (ppb), or micrograms per
cubic meter (µg/m3). The standards are presented in Table 2 and the following text provides
descriptions and health effects of each.
2.2.1.1 Ozone
Ozone is not emitted directly to the atmosphere, but is formed by photochemical reactions between
reactive organic gases (ROG) and oxides of nitrogen (NOX) in the presence of sunlight. The long, hot,
humid days of summer are particularly contributing to ozone formation; thus, ozone levels are of
concern primarily during the months of May through September.
▪ Reactive organic gases (ROG) are defined as any compound of carbon, excluding CO, carbon
dioxide (CO2), carbonic acid, metallic carbides or carbonates, and ammonium carbonate, which
participate in atmospheric photochemical reactions. It should be noted that there are no State or
national ambient air quality standard for ROG because ROGs are not classified as criteria
pollutants. They are regulated, however, because a reduction in ROG emissions reduces certain
chemical reactions that contribute to the formulation of ozone. ROGs are also transformed into
organic aerosols in the atmosphere, which contribute to higher PM10 and lower visibility.

Air Quality/Greenhouse Gas Report
Big Rock Cluster Solar Project, Imperial County
OB-1 Air Analyses Revised March 2018 Page 7
Table 2 – National and State Ambient Air Quality Standards3
Air Pollutant Averaging Time California Standard National Standard
Ozone (O3) 1 hour
8 hour
0.09 ppm
0.070 ppm
—
0.070 ppm
Respirable particulate
matter (PM10)
24 hour
Mean
50 µg/m3
20 µg/m3
150 µg/m3
—
Fine particulate matter
(PM2.5)
24 hour
Mean
—
12 µg/m3
35 µg/m3
12.0 µg/m3
Carbon monoxide (CO) 1 hour
8 hour
20 ppm
9.0 ppm
35 ppm
9 ppm
Nitrogen dioxide (NO2) 1 hour
Mean
0.18 ppm
0.030 ppm
100 ppb
0.053 ppm
Sulfur dioxide (SO2) 1 hour
24 hour
0.25 ppm
0.04 ppm
75 ppb
—
Lead 30-day
Rolling 3-month
1.5 µg/m3
—
—
0.15 µg/m3
Sulfates 24 hour 25 µg/m3
No
Federal
Standard
Hydrogen sulfide 1 hour 0.03 ppm
Vinyl chloride 24 hour 0.01 ppm
Visibility-reducing particles 8 hour
Extinction coefficient of 0.23 per
kilometer, visibility of ten miles or
more due to particles when relative humidity is less than 70%.
Abbreviations:
ppm = parts per million ppb = parts per billion 30-day = 30-day average
µg/m3 = micrograms per cubic meter Mean = Annual Arithmetic Mean
▪ Nitrogen oxides (NOX) serve as integral participants in the process of photochemical smog
production. The two major forms of NOX are nitric oxide (NO) and NO2. NO is a colorless,
odorless gas formed from atmospheric nitrogen and oxygen when combustion takes place under
hot temperature and/or high pressure. NO2 is a reddish-brown irritating gas formed by the
combination of NO and oxygen. NOX is an ozone precursor. A precursor is a directly emitted air
contaminant that, when released into the atmosphere, forms, causes to be formed, or contributes
to the formation of a secondary air contaminant for which an ambient air quality standard
3 Ambient Air Quality Standards. California Air Resources Board.
http://www.arb.ca.gov/research/aaqs/aaqs2.pdf. Accessed September 2017.

Air Quality/Greenhouse Gas Report
Big Rock Cluster Solar Project, Imperial County
OB-1 Air Analyses Revised March 2018 Page 8
(AAQS) has been adopted, or whose presence in the atmosphere will contribute to the violation of
one or more AAQSs. When NOX and ROG are released in the atmosphere, they can chemically
react with one another in the presence of sunlight to form ozone.
Ozone is a strong chemical oxidant that adversely impacts human health through effects on
respiratory function. Ozone can also damage forests and crops. Ozone is not emitted directly by
industrial sources or motor vehicles but instead, is formed in the lower atmosphere, the troposphere.
Ozone is formed by a complex series of chemical reactions involving NOX, the result of combustion
processes and evaporative ROGs such as industrial solvents, toluene, xylene, and hexane as well as
the various hydrocarbons that are evaporated from the gasoline used by motor vehicles or emitted
through the tailpipe following combustion. Additionally, ROGs are emitted by natural sources such as
trees and crops. Ozone formation is promoted by strong sunlight, warm temperatures, and winds.
High concentrations tend to be a problem in the Imperial County only during the sizzling summer
months when these conditions frequently occur.
2.2.1.2 Particulate matter (PM)
PM is a general term used to describe a complex group of airborne solid, liquid, or semi-volatile
materials of various size and composition. Primary PM is emitted directly into the atmosphere from
both human activities (including agricultural operations, industrial processes, construction and
demolition activities, and entrainment of road dust into the air) and non-anthropogenic activities
(such as windblown dust and ash resulting from forest fires). Secondary PM is formed in the
atmosphere from predominantly gaseous combustion by-product precursors, such as sulfur oxides
and NOX, and ROGs. The overwhelming majority of airborne PM in Imperial County is primary PM.
The major source of primary PM is fugitive windblown dust, with other contributions from entrained
road dust, farming, and construction activities.
Particle size is a critical characteristic of PM that primarily determines the location of PM deposition
along the respiratory system (and associated health effects) as well as the degradation of visibility
through light scattering. In the United States, federal and state agencies have established two types of
PM air quality standards as shown in Table 2. PM10 corresponds to the fraction of PM no greater
than 10 microns in aerodynamic diameter and is commonly called respirable particulate matter,
while PM2.5 refers to the subset of PM10 of aerodynamic diameter smaller than 2.5 microns, which is
commonly called fine particulate matter.
PM air pollution has undesirable and detrimental environmental effects. PM affects vegetation, both
directly (e.g. deposition of nitrates and sulfates may cause direct foliar damage) and indirectly (e.g.
coating of plants upon gravitational settling reduces light absorption). PM also accumulates to form
regional haze, which reduces visibility due to scattering of light. Agencies concerned with haze
include the National Park Service, the U.S. Forest Service, the Western Regional Air Partnership,
and the Western States Air Resources Council.
PM10 is respirable, with fine and ultrafine particles reaching the alveoli deep in the lungs, and larger
particles depositing principally in the nose and throat area. PM10 deposition in the lungs results in

Air Quality/Greenhouse Gas Report
Big Rock Cluster Solar Project, Imperial County
OB-1 Air Analyses Revised March 2018 Page 9
irritation that triggers a range of inflammation responses, such as mucus secretion and
bronchoconstriction, and exacerbates pulmonary dysfunctions, such as asthma, emphysema, and
chronic bronchitis. Sufficiently small particles may penetrate the bloodstream and impact functions
such as blood coagulation, cardiac autonomic control, and mobilization of inflammatory cells from
the bone marrow. Individuals susceptible to higher health risks from exposure to PM10 airborne
pollution include children, the elderly, smokers, and people of all ages with low pulmonary/
cardiovascular function. For these individuals, adverse health effects of PM10 pollution include
coughing, wheezing, shortness of breath, phlegm, bronchitis, and aggravation of lung or heart
disease, leading for example to increased risks of hospitalization and mortality from asthma attacks
and heart attacks.
2.2.1.3 Other Criteria Pollutants
The standards for other criteria pollutants are either being met or are unclassified in the Salton Sea
Air Basin (SSAB), and the latest pollutant trends suggest that these standards will not be exceeded in
the foreseeable future.
Pollutant Transport
As stated above, ozone is a “secondary” pollutant, formed in the atmosphere by reactions between
NOX and ROG. These reactions are driven by sunlight and proceed at varying rates. Transport is the
movement of ozone or the pollutants that form ozone from one area (known as the upwind area) to
another area (known as the downwind area). Pollutant transport is a very complex phenomenon.
Sometimes transport is a straightforward matter of wind blowing from one area to another at ground
level, carrying ozone with it, but usually it is not that simple. Transport is three-dimensional; it can
take place at the surface, or high above the ground. Meteorologists use the terms “surface” and
“aloft” to distinguish these two cases. Often, winds can blow in different directions at different
heights above the ground. To complicate matters further, winds can shift during the day, pushing a
polluted air mass first one way, then another. Finally, because ozone and ozone forming emissions
from an upwind area can mix with locally generated ozone and locally generated emissions, it is
often difficult to determine the origin of the culpable emissions causing high pollution levels.
Political boundaries do not prevent transport of pollutants. Transport over distances of several
hundred miles has often been documented in California.
The accurate determination of the impacts of transport requires detailed technical analyses in
conjunction with modeling studies. The Imperial County Air Quality Management Plan4 (AQMP)
identifies how the transport of emissions and pollutants from Mexico and other areas (South Coast
and San Diego) impact ozone violations within Imperial County. Although the Imperial County is
currently in attainment of the 1997 8-hour ozone NAAQS, it is important to note that any future
analysis of air emissions impacting Imperial County must take into consideration the influence of
transport from three distinct sources, that of the South Coast Air Basin via the Coachella Valley to
4 Final 2009 1997 8-Hour Modified Air Quality Management Plan. Imperial County Air Pollution Control
District. July 13, 2010.

Air Quality/Greenhouse Gas Report
Big Rock Cluster Solar Project, Imperial County
OB-1 Air Analyses Revised March 2018 Page 10
the north, the San Diego Air Basin to the west and the international city of Mexicali, Mexico to the
south.
Toxic Air Contaminants
In addition to the above-listed criteria pollutants, toxic air contaminants (TACs) are another group of
pollutants of concern. AB 18075 sets forth a procedure for the identification and control of TAC in
California defines a TAC as an air pollutant which may cause or contribute to an increase in
mortality or an increase in serious illness, or which may pose a present or potential hazard to human
health. There are almost 200 compounds that have been designated as TACs in California. The ten
TACs posing the greatest known health risk in California, based primarily on ambient air quality
data, are acetaldehyde, benzene, 1,3-butadiene, carbon tetrachloride, hexavalent chromium,
formaldehyde, methylene chloride, para-dichlorobenzene, perchloroethylene, and diesel particulate
matter (DPM).
TACs do not have ambient air quality standards. Since no safe levels of TACs can be determined,
there are no air quality standards for TACs. Instead, TAC impacts are evaluated by calculating the
health risks associated with a given exposure.
Since 2004, CARB has maintained the California Toxic Inventory (CTI), which provides emissions
estimates by stationary and aggregated point; areawide; on-road gasoline and diesel; off-road mobile
gasoline, diesel, and other; and natural sources. Stationary sources include point sources provided by
facility operators and/or districts pursuant to the Air Toxics “Hot Spots” Program (Assembly Bill
[AB] 2588), and aggregated point sources estimated by CARB and/or districts. Areawide sources are
those that do not have specific locations and are spread out over large areas such as consumer
products and unpaved roads. Mobile sources consist of on-road vehicles such as passenger cars and
trucks, motorcycles, busses, and heavy-duty trucks. Off-road sources include trains, ships, and boats.
Natural sources like wildfires are also included.
The top three contributors of the potential cancer risk come primarily from on road motor vehicles -
DPM, 1,3 butadiene, and benzene. Cleaner motor vehicles and fuels are reducing the risks from these
priority toxic air pollutants. The remaining toxic air pollutants, such as hexavalent chromium and
perchloroethylene, while not appearing to contribute as much to the overall risks, can present high
risks to people living close to a source. CARB has Air Toxic Control Measures that are either
already on the books, in development, or under evaluation for most of the remaining top ten, where
actions are suitable through our motor vehicle, consumer products, or industrial source programs. Of
these top ten, carbon tetrachloride is unique in that most of the health risk from this toxic air
pollutant is not attributable to specific sources, but rather to background concentrations. Emissions
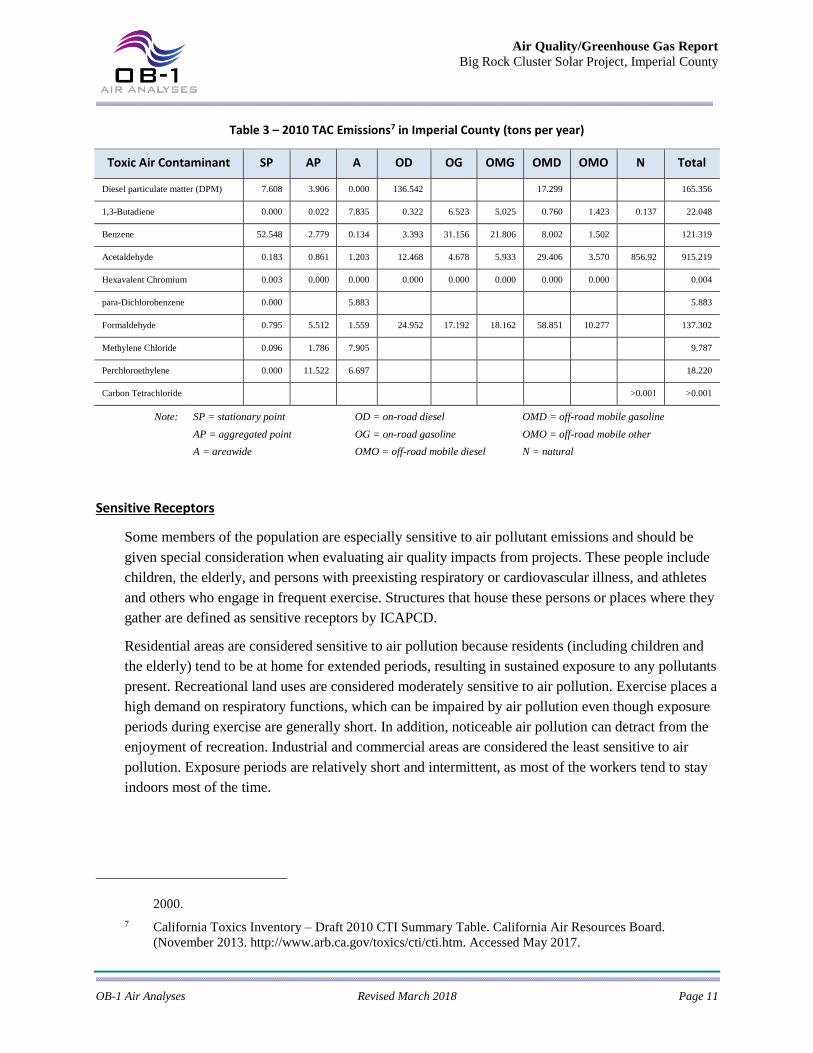
from the top ten6 TACs in Imperial County in 2010 are presented in Table 3.
5 Enacted in September 1983. Health & Safety Code section 39650 et seq., Food & Agriculture Code
Section 14021.
6 Based on relative contributions to the estimated potential cancer risk from outdoor levels for the year
Air Quality/Greenhouse Gas Report
Big Rock Cluster Solar Project, Imperial County
OB-1 Air Analyses Revised March 2018 Page 11
Table 3 – 2010 TAC Emissions7 in Imperial County (tons per year)
Toxic Air Contaminant SP AP A OD OG OMG OMD OMO N Total
Diesel particulate matter (DPM) 7.608 3.906 0.000 136.542 17.299 165.356
1,3-Butadiene 0.000 0.022 7.835 0.322 6.523 5.025 0.760 1.423 0.137 22.048
Benzene 52.548 2.779 0.134 3.393 31.156 21.806 8.002 1.502 121.319
Acetaldehyde 0.183 0.861 1.203 12.468 4.678 5.933 29.406 3.570 856.92 915.219
Hexavalent Chromium 0.003 0.000 0.000 0.000 0.000 0.000 0.000 0.000 0.004
para-Dichlorobenzene 0.000 5.883 5.883
Formaldehyde 0.795 5.512 1.559 24.952 17.192 18.162 58.851 10.277 137.302
Methylene Chloride 0.096 1.786 7.905 9.787
Perchloroethylene 0.000 11.522 6.697 18.220
Carbon Tetrachloride >0.001 >0.001
Note:
SP = stationary point
AP = aggregated point
A = areawide
OD = on-road diesel
OG = on-road gasoline
OMO = off-road mobile diesel
OMD = off-road mobile gasoline
OMO = off-road mobile other
N = natural
Sensitive Receptors
Some members of the population are especially sensitive to air pollutant emissions and should be
given special consideration when evaluating air quality impacts from projects. These people include
children, the elderly, and persons with preexisting respiratory or cardiovascular illness, and athletes
and others who engage in frequent exercise. Structures that house these persons or places where they
gather are defined as sensitive receptors by ICAPCD.
Residential areas are considered sensitive to air pollution because residents (including children and
the elderly) tend to be at home for extended periods, resulting in sustained exposure to any pollutants
present. Recreational land uses are considered moderately sensitive to air pollution. Exercise places a
high demand on respiratory functions, which can be impaired by air pollution even though exposure
periods during exercise are generally short. In addition, noticeable air pollution can detract from the
enjoyment of recreation. Industrial and commercial areas are considered the least sensitive to air
pollution. Exposure periods are relatively short and intermittent, as most of the workers tend to stay
indoors most of the time.
2000.
7 California Toxics Inventory – Draft 2010 CTI Summary Table. California Air Resources Board.
(November 2013. http://www.arb.ca.gov/toxics/cti/cti.htm. Accessed May 2017.

Air Quality/Greenhouse Gas Report
Big Rock Cluster Solar Project, Imperial County
OB-1 Air Analyses Revised March 2018 Page 12
2.3. Greenhouse Gases
Constituent gases that trap heat in the Earth’s atmosphere are called greenhouse gases (GHGs),
analogous to the way a greenhouse retains heat. GHGs play a critical role in the Earth’s radiation
budget by trapping infrared radiation emitted from the Earth’s surface, which would otherwise have
escaped into space. Prominent GHGs contributing to this process include CO2, methane (CH4),
nitrous oxide (N2O), and chlorofluorocarbons (CFCs). Without the natural heat-trapping effect of
GHG, the earth’s surface would be about 34 °F cooler8. This is a natural phenomenon, known as the
“Greenhouse Effect,” is responsible for maintaining a habitable climate. However, anthropogenic
emissions of these GHGs more than natural ambient concentrations are responsible for the
enhancement of the greenhouse effect, and have led to a trend of unnatural warming of the Earth’s
natural climate known as global warming or climate change, or more accurately Global Climate
Disruption. Emissions of these gases that induce global climate disruption are attributable to human
activities associated with industrial/manufacturing, utilities, transportation, residential, and
agricultural sectors.
The global warming potential (GWP) is the potential of a gas or aerosol to trap heat in the
atmosphere. Individual GHG compounds have varying GWP and atmospheric lifetimes. The
reference gas for the GWP is CO2; CO2 has a GWP of one. The calculation of the CO2 equivalent
(CO2e) is a consistent methodology for comparing GHG emissions since it normalizes various GHG
emissions to a consistent metric. Methane’s warming potential of 25 indicates that methane has a 25
times greater warming affect than CO2 on a molecular basis. he larger the GWP, the more that a
given gas warms the Earth compared to CO2 over that period. The period usually used for GWPs is
100 years. GWPs for the three GHGs produced by the Project are presented in Table 4. A CO2e is the
mass emissions of an individual GHG multiplied by its GWP. GHGs are often presented in units
called tonnes (t) (i.e. metric tons) of CO2e (tCO2e).
Carbon Dioxide (CO2) is a colorless, odorless gas consisting of molecules made up of two oxygen
atoms and one carbon atom. CO2 is produced when an organic carbon compound (such as
wood) or fossilized organic matter, (such as coal, oil, or natural gas) is burned in the presence of
oxygen. CO2 is removed from the atmosphere by CO2 “sinks”, such as absorption by seawater
and photosynthesis by ocean-dwelling plankton and land plants, including forests and
grasslands. However, seawater is also a source of CO2 to the atmosphere, along with land
plants, animals, and soils, when CO2 is released during respiration. Whereas the natural
production and absorption of CO2 is achieved through the terrestrial biosphere and the ocean,
humankind has altered the natural carbon cycle by burning coal, oil, natural gas, and wood.
Since the industrial revolution began in the mid-1700s, each of these activities has increased in
scale and distribution. Prior to the industrial revolution, concentrations CO2 were stable at a
range of 275 to 285 ppm9. The National Oceanic and Atmospheric Administration’s Earth
8 Climate Action Team Report to Governor Schwarzenegger and the California Legislature. California
Environmental Protection Agency, Climate Action Team. March 2006.
9 Contribution of Working Group I to the Fourth Assessment Report of the Intergovernmental Panel on

Air Quality/Greenhouse Gas Report
Big Rock Cluster Solar Project, Imperial County
OB-1 Air Analyses Revised March 2018 Page 13
System Research Laboratory10 indicates that global concentration of CO2 was 398.17 ppm in
July 2015. In addition, the CO2 levels at Mauna Loa11 averaged over 400 ppm for the first time
during the week of May 26, 2013. These concentrations of CO2 exceed by far the natural range
over the last 650,000 years (180 to 300 ppm) as determined from ice cores.
Table 4 – Global Warming Potentials12
Pollutant
GWP for 100-year time horizon
Second assessment report (SAR)13
4th assessment report (AR4) 14
Carbon dioxide (CO2) 1 1
Methane (CH4) 21 25
Nitrous oxide (N2O) 310 298
Note: Current protocol is to use the 4th assessment values, however, the second assessment report values are
also provided since they are the values used by many inventories and public documents.
Methane (CH4) is a colorless, odorless non-toxic gas consisting of molecules made up of four
hydrogen atoms and one carbon atom. CH4 is combustible, and it is the main constituent of
natural gas-a fossil fuel. CH4 is released when organic matter decomposes in low oxygen
environments. Natural sources include wetlands, swamps and marshes, termites, and oceans.
Human sources include the mining of fossil fuels and transportation of natural gas, digestive
processes in ruminant animals such as cattle, rice paddies and the buried waste in landfills. Over
the last 50 years, human activities such as growing rice, raising cattle, using natural gas, and
mining coal have added to the atmospheric concentration of CH4. Other anthropogenic sources
include fossil-fuel combustion and biomass burning.
Climate Change, 2007. Solomon, S., D. Qin, M. Manning, Z. Chen, M. Marquis, K.B. Averyt, M. Tignor
and H.L. Miller (eds.). Cambridge University Press, Cambridge, United Kingdom and New York, NY,
USA.
10 Trends in Atmospheric Carbon Dioxide. Earth System Research Laboratory. National Oceanic and
Atmospheric Administration. http://www.esrl.noaa.gov/gmd/ccgg/trends/global.html. Accessed May
2017.
11 ibid
12 Global Warming Potentials. Greenhouse Gas Protocol. World Resources Institute and World Business
Council on Sustainable Development. http://www.ghgprotocol.org/files/ghgp/tools/Global-Warming-
Potential-Values.pdf. May 2015. Accessed September 2017.
13 Second Assessment Report. Climate Change 1995: WG I - The Science of Climate Change.
Intergovernmental Panel on Climate Change. 1996
14 Climate Change 2007: The Physical Science Basis. Contribution of Working Group I to the Fourth
Assessment Report of the Intergovernmental Panel on Climate Change. 2007

Air Quality/Greenhouse Gas Report
Big Rock Cluster Solar Project, Imperial County
OB-1 Air Analyses Revised March 2018 Page 14
Nitrous Oxide (N2O) is a colorless, non-flammable gas with a sweetish odor, commonly known as
“laughing gas”, and sometimes used as an anesthetic. N2O is naturally produced in the oceans
and in rainforests. Man-made sources of N2O include the use of fertilizers in agriculture, nylon
and nitric acid production, cars with catalytic converters and the burning of organic matter.
Concentrations of N2O also began to rise at the beginning of the industrial revolution.
Chlorofluorocarbons (CFCs) are gases formed synthetically by replacing all hydrogen atoms in
CH4 or ethane with chlorine and/or fluorine atoms. CFCs are nontoxic, nonflammable,
insoluble, and chemically un-reactive in the troposphere (the level of air at the Earth’s surface).
CFCs have no natural source but were first synthesized in 1928. It was used for refrigerants,
aerosol propellants, and cleaning solvents. Because of the discovery that they can destroy
stratospheric ozone, an ongoing global effort to halt their production was undertaken and has
been extremely successful, so much so that levels of the major CFCs are now remaining steady
or declining. However, their long atmospheric lifetimes mean that some of the CFCs will
remain in the atmosphere for over 100 years.
Hydrofluorocarbons (HFCs) are synthesized chemicals that are used as a substitute for CFCs. Out
of all the GHGs; HFCs are one of three groups with the highest GWP. HFCs are synthesized for
applications such as automobile air conditioners and refrigerants.
Perfluorocarbons (PFCs) have stable molecular structures and do not break down through the
chemical processes in the lower atmosphere. High-energy ultraviolet rays about 60 kilometers
above Earth’s surface can destroy the compounds. Because of this, PFCs have very long
lifetimes, between 10,000 and 50,000 years. The two main sources of PFCs are primary
aluminum production and semiconductor manufacture.
Sulfur Hexafluoride (SF6) is an extremely potent greenhouse gas. SF6 is very persistent, with an
atmospheric lifetime of more than a thousand years. Thus, a relatively small amount of SF6 can
have a significant long-term impact on global climate change. SF6 is human-made, and the
primary user of SF6 is the electric power industry. Because of its inertness and dielectric
properties, it is the industry's preferred gas for electrical insulation, current interruption, and arc
quenching (to prevent fires) in the transmission and distribution of electricity. SF6 is used
extensively in high voltage circuit breakers and switchgear, and in the magnesium metal casting
industry.
GHG Emission Levels
Per the World Resources Institute15 (WRI) in 2014, total worldwide GHG emissions were estimated
to be 42,204.5 million (M) t CO2e (MtCO2e) and GHG emissions per capita worldwide was 4.61
tCO2e. These emissions exclude GHG emissions associated with the land use, land-use change, and
forestry sector, and bunker fuels. The WRI reports that in 2014, total GHG emissions in the U.S.
15 Climate Analysis Indicators Tool. International Dataset. World Resources Institute. http://cait.wri.org/.
Accessed October 2017.
Air Quality/Greenhouse Gas Report
Big Rock Cluster Solar Project, Imperial County
OB-1 Air Analyses Revised March 2018 Page 15
were 5,234 MtCO2e, with average GHG emissions per capita of 16.43 tCO2e and total GHG
emissions in California were 454.52 MtCO2e in 2014, with average GHG emissions per capita of
11.75 tCO2e.
California has a larger percentage of its total GHG emissions coming from the transportation sector
(47%) than the U.S. emissions (29%) and a smaller percentage of its total GHG emissions from the
electricity generation sector, i.e. California have 11 percent but the U.S. has 31 percent.
Potential Environmental Effects
Worldwide, average temperatures are likely to increase by 3 °F to 7 °F by the end of the 21st
century16. However, a global temperature increase does not directly translate to a uniform increase in
temperature in all locations on the earth. Regional climate changes are dependent on multiple
variables, such as topography. One region of the Earth may experience increased temperature,
increased incidents of drought, and similar warming effects, whereas another region may experience
a relative cooling. According to the International Panel on Climate Change’s (IPCC’s) Working
Group II Report17, climate change impacts to North America may include diminishing snowpack,
increasing evaporation, exacerbated shoreline erosion, exacerbated inundation from sea level rising,
increased risk and frequency of wildfire, increased risk of insect outbreaks, increased experiences of
heat waves, and rearrangement of ecosystems, as species and ecosystem zones shift northward and to
higher elevations.
California Implications
Even though climate change is a global problem and GHGs are global pollutants, the specific
potential effects of climate change on California have been studied. The third assessment produced by
the California Natural Resources Agency (CNRA)18 explores local and statewide vulnerabilities to
climate change, highlighting opportunities for taking concrete actions to reduce climate-change
impacts. Projected changes for the remainder of this century in California include:
• Temperatures – By 2050, California is projected to warm by approximately 2.7 °F above 2000
averages, a threefold increase in the rate of warming over the last century and springtime
warming — a critical influence on snowmelt — will be particularly pronounced.
• Rainfall – Even though model projections continue to show the Mediterranean pattern of wet
winters and dry summers with seasonal, year-to-year, and decade-to-decade variability, improved
climate models shift towards drier conditions by the mid-to-late 21st century in Central, and most
notably, Southern California.
16 Climate Change 2007: Impacts, Adaptation, and Vulnerability. Website
http://www.ipcc.ch/ipccreports/ar4-wg2.htm. Accessed March 2013.
17 ibid
18 Our Changing Climate 2012: Vulnerability & Adaptation to the Increasing Risks from Climate Change in
California. California Natural Resources Agency. July 2012 / CEC-500-2012-007

Air Quality/Greenhouse Gas Report
Big Rock Cluster Solar Project, Imperial County
OB-1 Air Analyses Revised March 2018 Page 16
• Wildfire - Earlier snowmelt, higher temperatures, and longer dry periods over a longer fire
season will directly increase wildfire risk. Indirectly, wildfire risk will also be influenced by
potential climate-related changes in vegetation and ignition potential from lightning, with human
activities continuing to be the biggest factor in ignition risk. Models are showing that estimated
that property damage from wildfire risk could be as much as 35 percent lower if smart growth
policies were adopted and followed than if there is no change in growth policies and patterns.
The third assessment by CNRA not only defines projected vulnerabilities to climatic changes but
analyzes potential impacts from adaptation measures used to minimize harm and take advantage of
beneficial opportunities that may arise from climate change.
The report highlights important new insights and data, using probabilistic and detailed climate
projections and refined topographic, demographic, and land use information. The findings include:
• The state’s electricity system is more vulnerable than was previously understood.
• The Sacramento-San Joaquin Delta is sinking, putting levees at growing risk.
• Wind and waves, in addition to faster rising seas, will worsen coastal flooding.
• Animals and plants need connected “migration corridors” to allow them to move to habitats
that are more suitable to avoid serious impacts.
• Native freshwater fish are particularly threatened by climate change.
• Minority and low-income communities face the greatest risks from climate change.
2.4. Baseline Conditions
Local Ambient Air Quality
Existing levels of ambient air concentrations and historical trends and projections in the Project area
are best documented by measurements made by the ICAPCD and CARB. Imperial County began its
ambient air monitoring in 1976; however, monitoring of ozone began in 1986 at the El Centro
monitoring station. Since that time, monitoring has been performed by the ICAPCD, CARB, and
private industry. There are six monitoring sites in Imperial County from Niland to Calexico.
The nearest monitoring station to the Project site is approximately 8 miles east of the Project site.
The El Centro-9th station is in El Centro at 150 9th Street. The station monitors ozone, PM2.5, PM10,
CO, and NO2. Table 5 summarizes 2011 through 2016 published monitoring data from the CARB’s
Aerometric Data Analysis and Management System for the El Centro-9th Station.
The monitoring data shows that the El Centro station demonstrated the general air quality problems
of the Basin in it exceeded the State and federal ozone standards and the State PM10 standard in all
six years. The National 8-hour ozone standard was changed in October of 2015 so only the 2016
monitoring year was evaluated to the 2016 Standard and the other 5 years evaluated to the 2008
Standard. The federal PM10 standard was exceeded in the years 2015 and 2016. The station only
exceeded the federal PM2.5 standard in 2011. The State or federal CO standards were not exceeded
and the CO monitor was removed after the 2012 year. This station exceeded the NO2 federal
standard in 2011 only.

Air Quality/Greenhouse Gas Report
Big Rock Cluster Solar Project, Imperial County
OB-1 Air Analyses Revised March 2018 Page 17
Table 5 – Ambient Air Quality Monitoring Summary for Project Vicinity19
Air Pollutant Monitoring Year
Ozone 2011 2012 2013 2014 2015 2016
Max 1 Hour (ppm)
Days > CAAQS (0.09 ppm)
0.103
5
0.111
9
0.110
7
0.101
2
0.099
2
0.108
4
Max 8 Hour (ppm)
Days > NAAQS (0.075 ppm)
Days > NAAQS (0.070 ppm)
Days > CAAQS (0.070 ppm)
0.084
12
N/A
21
0.091
14
N/A
26
0.088
11
N/A
23
0.080
5
N/A
13
0.079
6
N/A
12
0.082
N/A
11
11
Inhalable Particulate Matter (PM10) 2011 2012 2013 2014 2015 2016
Max Daily National Measurement
Days > NAAQS (150 µg/m3)
Days > CAAQS (50 µg/m3)
81.9
0
9
75.6
0
6
147.9
0
10
120.4
0
15
165.9
1
7
185.1
2
N/A
Fine Particulate Matter (PM2.5) 2011 2012 2013 2014 2015 2016
Max Daily National Measurement
Days > NAAQS (35 µg/m3)
54.4
2
26.4
0
30.0
0
27.5
0
31.2
0
31.3
0
Carbon Monoxide (CO) 2011 2012 2013 2014 2015 2016
Max 8 Hour (ppm)
Days > NAAQS (9 ppm)
Days > CAAQS (9.0 ppm)
9.01
0
0
3.64
0
0
N/A N/A N/A N/A
Nitrogen Dioxide (NO2) 2011 2012 2013 2014 2015 2016
Max Hourly (ppb)
Days > NAAQS (100 ppb)
Days > CAAQS (0.18 ppm)
117.4
1
0
72.0
0
0
53.0
0
0
59.3
0
0
59.1
0
0
50.9
0
0
Abbreviations:
> = exceed Bold = exceedance N/A = not available ppm = parts per million ppb = parts per billion µg/m3 = micrograms per cubic meter
CAAQS = California Ambient Air Quality Standard NAAQS = National Ambient Air Quality Standard
Local Emissions Inventory
An emissions inventory is an account of the amount of air pollution generated by various emissions
sources in a specified area. To estimate the sources and quantities of pollution CARB, in cooperation
with local air districts, other government agencies, and industry, maintains an inventory of California
emission sources. Sources are subdivided into four major emission categories: mobile, stationary,
area-wide, and natural sources.
Mobile sources include on-road sources and off-road mobile sources. The on-road emissions
inventory, which includes automobiles, motorcycles, and trucks, is based on an estimation of
population, activity, and emissions of the on-road motor vehicles used in California. The off-road
emissions inventory is based on an estimate of the population, activity, and emissions of various off-
road equipment, including recreational vehicles, farm and construction equipment, lawn and garden
19 Aerometric Data Analysis and Management System, Air Quality Data Statistics. California Air Resources
Board. http://www.arb.ca.gov/adam/welcome.html. Accessed September 2017.

Air Quality/Greenhouse Gas Report
Big Rock Cluster Solar Project, Imperial County
OB-1 Air Analyses Revised March 2018 Page 18
equipment, forklifts, locomotives, commercial marine ships, and marine pleasure craft.
Stationary sources are large, fixed sources of air pollution, such as power plants, refineries, and
manufacturing facilities. Stationary sources also include aggregated point sources. These include
many small point sources, or facilities, that are not inventoried individually but are estimated as a
group and reported as a single-source category. Examples include gas stations and dry cleaners. Each
of the local air districts estimates the emissions for most stationary sources within its jurisdiction.
Areawide sources include source categories associated with human activity that take place over a
wide geographic area. Emissions from area-wide sources may be either from small, individual
sources, such as residential fireplaces, or from widely distributed sources that cannot be tied to a
specific location, such as consumer products, and dust from unpaved roads or farming operations
(such as tilling).
2.4.1.1 Imperial County Emissions Inventory
Table 6 summarizes Imperial County’s estimated 2020 projected emissions inventory (EI) for major
categories of air pollutants presented in tons per day. Detailed breakdowns of the emissions sources
and categories are available at CARB’s website20.
Table 6 – Imperial County 2020 Estimated Annual Emissions
Emission Category 2020 Emissions in tons per day
Stationary Sources ROG CO NOX PM10 PM2.5 NH3
Fuel combustion 0.11 0.49 1.72 0.20 0.18 0
Waste disposal 0 0 0 0 0 0
Cleaning and surface coatings 0.62 0 0 0 0 0
Petroleum production and marketing 0.63 0 0 0 0 0
Industrial processes 0 0.09 0.08 4.55 0.84 0
Areawide Sources ROG CO NOX PM10 PM2.5 NH3
Solvent evaporation 3.67 0 0 0 0 14.74
Miscellaneous processes 3.54 11.76 0.51 278.8 36.79 15.40
Mobile Sources ROG CO NOX PM10 PM2.5 NH3
On-road motor vehicles 2.26 17.60 5.67 0.40 0.18 0.19
Other mobile sources 3.91 20.37 6.39 1.04 0.98 0
GRAND TOTAL 14.65 50.31 14.37 285.00 38.97 31.83
Notes:
All values in tons per day. Forecasted 2020 emissions are estimated from a base year inventory for 2012 and based on
growth and control factors available from CARB. Control reflects only those rules already adopted. The sum of values may
not equal total shown, due to rounding.
20 Almanac Emissions Projection Data. California Air Resources Board.
http://www.arb.ca.gov/app/emsinv/. Accessed May 2017.

Air Quality/Greenhouse Gas Report
Big Rock Cluster Solar Project, Imperial County
OB-1 Air Analyses Revised March 2018 Page 19
2.4.1.2 2020 Imperial County Projected Emission Inventory Summary
Reactive organic gases (ROG)
ROG emissions result primarily from incomplete fuel combustion and the evaporation of chemical
solvents and fuels. In 2020, Imperial County is projected to have 24 percent of the ROG emissions
contributed by miscellaneous processes, primarily farming operations; approximately 25 percent will
be contributed by solvent evaporation, such as pesticides and fertilizers and consumer products; 27
percent came from other mobile sources, primarily aircraft; and 15 percent came from on-road
vehicles, predominantly light- and medium-duty cars and trucks.
Carbon monoxide (CO)
The primary source of CO in Imperial County in 2020 is projected to be from on-road motor
vehicles, which will contribute 35 percent of the total CO. Other off-road engines and vehicles (such
as aircraft and construction equipment) will contribute another 40 percent and miscellaneous
processes (mainly from managed burning and disposal. Higher levels of CO generally occur in areas
with heavy traffic congestion.
Nitrogen Oxides (NOX)
A review of the projected 2020 EI shows that over 84 percent of the total NOX emissions in Imperial
County is projected to come from on- and off-road vehicles (39.5% from on-road and 44.5% from
off-road). The largest portion of on-road NOX emissions come from heavy-duty diesel trucks (48.7%
of the total for on-road). The largest contributors from off-road sources are trains (37.6% of total off-
road), aircraft (25.5%), and farm equipment (23.6%).
Inhalable Particulate Matter (PM10)
Almost 98 percent of the total PM10 emissions in Imperial County is projected to come from the
category labeled Miscellaneous Processes in 2020. The largest portion of the PM10 emissions from
miscellaneous processes comes from fugitive windblown dust (76.2% of the total for miscellaneous
processes) and unpaved road dust (18.6%).
However, as part of ICAPCD’s PM10 State Implementation Plan (SIP)21, analysis of the potential
sources of fugitive windblown shows that during high winds, Imperial County’s desert areas can
produce PM emissions over 50 times greater than the emissions from any anthropogenic source,
including agricultural cropland. In addition, Imperial County is bordered to the south by the densely-
populated city of Mexicali, Mexico. Mexicali comprises approximately 760,000 people within
approximately 200 square miles, and has PM emissions estimated at 257 tons/day, compared with
emissions of approximately 13 tons/day for the considerably smaller US town of Calexico situated
just across the Mexican border from Mexicali. Under stagnant and light wind conditions, elevated
dust concentrations in Mexicali can cause PM from Mexico to drift across the border into Calexico.
21 2009 Imperial County State Implementation Plan for Particulate Matter Less Than 10 Microns in
Aerodynamic Diameter - Draft Final. Imperial County Air Pollution Control District. July 10, 2009.

Air Quality/Greenhouse Gas Report
Big Rock Cluster Solar Project, Imperial County
OB-1 Air Analyses Revised March 2018 Page 20
Because of Imperial County’s desert climate and of its shared border with the densely-populated city
of Mexicali, the primary reasons for elevated PM levels in Imperial County are thus (i) disturbance
of soils by wind and human activity, (ii) transport of PM10 from Mexico, and occasionally, (iii)
wildfires.
Fine Particulate Matter (PM2.5)
Whereas a sizeable portion of PM10 emissions come from dislocation processes (fugitive
windblown), PM2.5 is smaller and is more often a result of particulates coming from combustion
sources. However, in Imperial County Miscellaneous Processes will still represent 94 percent of the
total PM2.5, with fugitive windblown dust contributing approximately 78 percent of the
miscellaneous processes total.
Ammonia (NH3)
Ammonia (NH3) is addressed in the 2013 PM2.5 SIP22 due to NH3’s role as a precursor to PM10,
specifically the wintertime violations. The cooler temperatures and higher humidity of the winter
months are conducive to ammonium nitrate (NH4NO3) formation through a complex process
involving NOX, NH3, and ROGs. This occurs both at the surface and aloft, via both daytime and
nighttime chemistry. Understanding the interactions amongst these precursors is needed to design an
appropriate and effective approach to reduce NH4NO3. The 2020 Imperial County EI shows that
about 48% of the NH3 is generated from farming operations (primarily feedlots) and another 46% is
from the use of pesticides and fertilizers.
22 Imperial County 2013 SIP for the 2006 24-hr PM2.5 Moderate Nonattainment Area. Imperial County Air
Pollution Control District. December 2, 2014.

Air Quality/Greenhouse Gas Report
Big Rock Cluster Solar Project, Imperial County
OB-1 Air Analyses Revised March 2018 Page 21
SECTION 3.0 – REGULATORY CONTEXT
Air pollutants are regulated at the national, State, and air basin level; each agency has a different degree
of control. The EPA regulates at the national level; the CARB regulates at the State level; and the
ICAPCD regulates at the air basin level in the Project area.
3.1. Regulatory Agencies
Environmental Protection Agency (EPA)
EPA is the federal agency responsible for overseeing state air programs as they relate to the FCAA,
approving SIP, establishing NAAQS and setting emission standards for mobile sources under federal
jurisdiction. EPA has delegated the authority to implement many of the federal programs to the states
while retaining an oversight role to ensure that the programs continue to be implemented.
California Air Resources Board (CARB)
CARB is the state agency responsible for establishing CAAQS, adopting and enforcing emission
standards for various sources including mobile sources (except where federal law preempts their
authority), fuels, consumer products, and toxic air contaminants. CARB is also responsible for
providing technical support to California’s 35 local air districts, which are organized at the county or
regional level, overseeing local air district compliance with State and federal law, approving local air
plans and submitting the SIP to the EPA. CARB also regulates mobile emission sources in
California, such as construction equipment, trucks, and automobiles.
For the purposes of managing air quality in California, the California Health & Safety Codes Section
39606(a)(2) gave the CARB the responsibility to “based upon similar meteorological and geographic
conditions and consideration for political boundary lines whenever practicable, divide the State into
air basins to fulfill the purposes of this division”. Imperial County is located within the Salton Sea
Air Basin.
Imperial County Air Pollution Control District (ICAPCD)
The ICAPCD shares responsibility with CARB for ensuring that all State and federal ambient air
quality standards are achieved and maintained within the County. State law assigns to local air
pollution control districts the primary responsibility for control of air pollution from stationary
sources, while reserving an oversight role for CARB. Generally, the air pollution control districts
must meet minimum State and EPA program requirements. The air pollution control district is also
responsible for the inspection of stationary sources, monitoring of ambient air quality, and planning
activities such as modeling and maintenance of the emission inventory. Air pollution control districts
in State nonattainment areas are also responsible for developing and implementing transportation
control measures necessary to achieve the state ambient air quality. Regarding the SIP, air pollution
control districts will implement the following activities:
1. Development of emission inventories, modeling process, trend analysis and quantification
and comparison of emission reduction strategies;

Air Quality/Greenhouse Gas Report
Big Rock Cluster Solar Project, Imperial County
OB-1 Air Analyses Revised March 2018 Page 22
2. Necessary information on all federal and State adopted emission reduction measures which
affect the area;
3. Review of emissions inventory, modeling, and self-evaluation work;
4. Technical and strategic assistance, as appropriate, in the selection and implementation of
emission reduction strategies;
5. Technical and planning assistance in developing and implementing processes to address the
impact of emissions growth beyond the attainment date;
6. Maintenance of monitors and reporting and analysis of monitoring data;
7. Support for public education efforts by providing information to the community for means of
outreach;
8. Coordinate communication between local areas and EPA to facilitate continuing EPA review
of local work;
9. Expeditious review of the locally developed plan, and if deemed adequate, propose
modification of the AQMP to adopt the early progress plan;
10. Adoption of emission reduction strategies into the AQMP as expeditiously as possible.
3.2. Attainment Status
3.2.1 Designations/Classifications
EPA has identified nonattainment and attainment areas for each NAAQS. Under amendments to the
FCAA, EPA has designated air basins or portions thereof as attainment, nonattainment, or
unclassifiable, based on whether the national standards have been achieved. The State designates air
basins or portions thereof for all CAAQS. The State designation criteria specify four categories:
nonattainment, nonattainment-transitional, attainment, and unclassified.
In addition, the FCAA uses a classification system to design clean-up requirements appropriate for
the severity of the pollution and set realistic deadlines for reaching clean-up goals. If an air basin is
not in federal attainment for a pollutant, the Basin is classified as a marginal, moderate, serious,
severe, or extreme nonattainment area, based on the estimated time it would take to reach attainment.
Nonattainment areas must take steps towards attainment by a specific timeline. Table 7 shows the
federal and State attainment designations and federal classifications for the Basin.
3.2.2 Federal Clean Air Act Requirements
The FCAA requires plans to provide for the implementation of all reasonably available control
measures including the adoption of reasonably available control technology for reducing emissions
from existing sources. The FCAA encourages market-based approaches to emission control
innovations.
On April 30, 2004, Imperial County was classified as a “Marginal” nonattainment area for 8-Hour
Ozone NAAQS under the FCAA. On March 13, 2008, the EPA found that Imperial County failed to
meet attainment for the 8-Hour Ozone NAAQS by June 15, 2007 and was reclassified as “Moderate”
nonattainment. However, on November 17, 2009, EPA announced that Imperial County has met the
1997 federal 8-hour ozone standard—demonstrating improved air quality in the area. The

Air Quality/Greenhouse Gas Report
Big Rock Cluster Solar Project, Imperial County
OB-1 Air Analyses Revised March 2018 Page 23
announcement is based on three years of certified clean air monitoring data for the years 2006-2008.
Table 7 shows the designations and classifications for the Basin.
In response to the opinion of the US Court of Appeals for the Ninth Circuit in Sierra Club v. United
States Environmental Protection Agency, et al., in August 2004 the EPA found that the Imperial
Valley PM10 nonattainment area had failed to attain by the moderate area attainment date of
December 31, 1994, and as a result reclassified under the FCAA the Imperial Valley from a
moderate to a serious PM10 nonattainment area. Also in August 2004, the EPA proposed a rule to
find that the Imperial area had failed to attain the annual and 24-hour PM10 standards by the serious
area deadline of December 31, 2001. The EPA finalized the rule on December 11, 2007, citing as the
basis for the rule that six Imperial County monitoring stations were in violation of the 24-hour
standard during 1999-2001. The EPA’s final rule action requires the State to submit to the EPA by
December 11, 2008 (within one year of the rule’s publication in the Federal Register) an air quality
plan that demonstrates that the County will attain the PM10 standard as expeditiously as practicable.
Table 7 – Designations/Classifications for the Basin23
Pollutant State Designation Federal Designation (Classification)
Ozone Nonattainment Attainment
Respirable PM (PM10) Nonattainment Nonattainment (Serious) *
Fine PM (PM2.5) Attainment*** Nonattainment **
Carbon Monoxide (CO) Attainment Unclassifiable/Attainment
Nitrogen Dioxide (NO2) Attainment Unclassifiable/Attainment
Sulfur Dioxide Attainment Attainment
Sulfates Attainment
No
Federal
Standard
Lead Attainment
Hydrogen Sulfide Unclassified
Visibility reducing Particles Unclassified
* Designation for Imperial Valley Planning Area only, which is most of Imperial County save for a small
stretch of land on the County's eastern end.
** Designation is only for the urban areas within Imperial County
*** Designation for the whole of Imperial County except the City of Calexico.
On November 13, 2009, EPA published Air Quality Designations for the 2006 24-Hour Fine Particle
(PM2.5) National Ambient Air Quality Standards24 wherein Imperial County was listed as designated
23 Area Designations and Maps – 2013. California Air Resources Board. April 10, 2014.
24 Air Quality Designations for the 2006 24-Hour Fine Particle (PM2.5) National Ambient Air Quality
Standards. United States Environmental Protection Agency. Federal Register. Vol. 74, No. 218.
November 13, 2009.

Air Quality/Greenhouse Gas Report
Big Rock Cluster Solar Project, Imperial County
OB-1 Air Analyses Revised March 2018 Page 24
nonattainment for the 2006 24-hour PM2.5 NAAQS. However, the nonattainment designation for
Imperial County is only for the urban area within the County25 and it has been determined that the
Project is located outside of the nonattainment boundaries for PM2.5. On April 10, 2014, CARB
Board gave final approval to the 2013 Amendments to Area Designations for CAAQSs. For the State
PM2.5 standard, effective July 1, 2014, the City of Calexico will be designated nonattainment, while
the rest of the SSAB will be designated attainment.
3.3. Regulatory Framework
This section contains a discussion of the federal, State, and local air quality regulations, plans, and
policies applicable to the proposed landfill plan. Federal, state, and local authorities have adopted
rules and regulations that govern the emissions of air pollutants from any facility. The local and
federal authorities each have specific criteria for the evaluation of a source and its emissions and the
authority to issue permit conditions and specify recordkeeping and reporting requirements that must
be met to operate a source of air pollutants. This section focuses on current air quality regulations
and their impact on the currently permitted landfill and on the proposed landfill plan.
3.3.1 Federal Regulations and Standards
The FCAA was enacted in 1970 and last amended in 1990 (42 USC 7401, et seq.) with the purpose
of controlling air pollution and providing a framework for national, state, and local air pollution
control efforts. Basic components of the FCAA and its amendments include NAAQS for major air
pollutants, hazardous air pollutants standards, SIP requirements, motor vehicle emissions standards,
and enforcement provisions. The FCAA was enacted for the purposes of protecting and enhancing
the quality of the nation’s air resources to benefit public health, welfare, and productivity.
3.3.2 State Regulations and Standards
CARB is responsible for responding to the FCAA, regulating emissions from motor vehicles and
consumer products, and implementing the CCAA. The CCAA outlines a program to attain the
CAAQSs for ozone, sulfur dioxide, and CO by the earliest practical date. Since CAAQSs are more
stringent than NAAQSs in most cases, attainment of the CAAQS will require more emissions
reductions than what would be required to show attainment of the NAAQS. Like the federal system,
the State requirements and compliance dates are based upon the severity of the ambient air quality
standard violation within a region.
3.3.3 Local Regulations and Standards
The ICAPCD also has the authority to adopt and enforce regulations dealing with controls for specific
types of sources, emissions of hazardous air pollutants, and New Source Review. The ICAPCD Rules
and Regulations are part of the SIP and are separately enforceable by the EPA. The following
ICAPCD rules potentially apply to the proposed Project:
25 Final 2009 1997 8-Hour Modified Air Quality Management Plan. Imperial County Air Pollution Control
District. July 13, 2010.

Air Quality/Greenhouse Gas Report
Big Rock Cluster Solar Project, Imperial County
OB-1 Air Analyses Revised March 2018 Page 25
▪ Rules 800 (General Requirements for Control of Fine Particulate Matter), 801 (Construction and
Earthmoving Activities), 802 (Bulk Materials, 803 (Carry-out and Track-out), 804 (Open Areas),
and 805 (Paved and Unpaved Roads) are intended to reduce the amount of PM10 entrained in the
ambient air because of emissions generated by anthropogenic fugitive dust sources by requiring
actions to prevent, reduce, or mitigate PM10 emissions. These rules include opacity limits, control
measure requirements, and dust control plan requirements that apply to activities at the Facility.
Air Quality Management Plans (AQMP)
3.3.3.1 Ozone Plan
On December 3, 2009, the EPA issued a final ruling determining that the Imperial County
“moderate” 8-hour ozone non-attainment area attained the 1997 8-hour NAAQS for ozone. The
determination by EPA was based upon complete, quality-assured, and certified ambient air
monitoring data for the years 2006 thru 2008. This determination effectively suspended the
requirement for the state to submit an attainment demonstration, a RFP plan, contingency measures,
and other planning requirements for so long as Imperial County continues to attain the 1997 8-hour
ozone NAAQS. However, this determination did not constitute a re-designation to attainment;
therefore, the classification and designation status for Imperial County remain as a “moderate”
nonattainment area of the 1997 8-hour ozone NAAQS. As such, Imperial County was required to
submit for EPA approval a 2009 8-Hour Ozone “Modified” Air Quality Management Plan (Modified
AQMP), which was approved July 13, 2010.
The Modified AQMP serves as a comprehensive planning document intended to provide guidance to
the ICAPCD, the County, and other local agencies on how to continue maintaining the 1997 8-hour
ozone NAAQS. The Modified AQMP includes control measures consisting of three components: 1)
the ICAPCD’s Stationary Source Control Measures; 2) Regional Transportation Control Measures;
and 3) the State Strategy. These measures primarily rely on the traditional command-and-control
approach and as such provide the framework for ICAPCD rules that reduce ROG and NOX
emissions.
3.3.3.2 PM10 Plan
The ICAPCD District Board of Directors adopted the PM10 SIP for Imperial County on August 11,
200926. The PM10 SIP meets EPA requirements to demonstrate that the County will attain the PM10
standard as expeditiously as practicable. The PM10 SIP was required to address and meet the
following elements, required under the FCAA of areas classified to be in serious nonattainment of the
NAAQS:
• Best available emission inventories;
• A plan that enables attainment of the PM10 federal air quality standards;
26 2009 Imperial County State Implementation Plan for Particulate Matter Less Than 10 Microns in
Aerodynamic Diameter. Imperial County Air Pollution Control District. July 10, 2009.

Air Quality/Greenhouse Gas Report
Big Rock Cluster Solar Project, Imperial County
OB-1 Air Analyses Revised March 2018 Page 26
• Annual reductions in PM10 or PM10 precursor emissions that are of not less than 5 percent
from the date of SIP submission until attainment;
• Best available control measures and best available control technologies for significant sources
and major stationary sources of PM10, to be implemented no later than 4 years after
reclassification of the area as serious;
• Transportation conformity and motor vehicle emission budgets in accord with the attainment
plan;
• Reasonable further progress and quantitative milestones; and
• Contingency measures to be implemented (without the need for additional rulemaking
actions) if the control measure regulations incorporated in the plan cannot be successfully
implemented or fail to give the expected emission reductions.
The PM10 SIP updated the emission inventory to incorporate revised cattle emissions, revised
windblown dust model results, revised South Coast Association of Governments activity data, and
updated entrained and windblown unpaved road dust estimates. The adjustments made to the
emission inventory fell in two categories: (i) adjustments to incorporate new methodology and
updated information (e.g., throughputs, activity data, etc.), and (ii) adjustments to incorporate
emission reductions arising from the implementation of new control measures.
Additionally, the PM10 SIP demonstrates that Imperial County attained the Federal PM10 NAAQS,
but-for international emissions from Mexico, based on 2006-2008 monitoring data. Attainment was
due, in part, to ICAPCD’s November 2005 adoption and subsequent implementation of Regulation
VIII fugitive dust rules; those rules were based on the related 2005 Best Available Control Measure
(BACM) analysis.
Since the reclassification of Imperial County to serious nonattainment for PM10 occurred on August
2004 and control of fugitive PM10 emissions from the significant source categories that meets BACM
stringency identified in the PM10 SIP began in January 2006.
Major stationary sources are required to implement Best Available Control Technology (BACT) to
control PM10 emissions (Rule 207) and they are required to comply with the 20 percent opacity (Rule
403). In addition, stationary sources will be required to mitigate fugitive dust emissions from access
roads, construction activities, handling and transferring of bulk materials, and track-out/carry-out
according to the requirements of Regulation VIII.
Because the Imperial County is shown in the PM10 SIP to have attained the 24-hour PM10 NAAQS
but-for international transport of Mexicali emissions in 2006-2008, reasonable further progress and
milestone requirements are unnecessary, and specifically the 5% yearly emission reductions
requirement does not apply to future years. As documented in the PM10 SIP, all remaining SIP
requirements applicable to the 2009 Imperial County PM10 Plan have been successfully addressed.

Air Quality/Greenhouse Gas Report
Big Rock Cluster Solar Project, Imperial County
OB-1 Air Analyses Revised March 2018 Page 27
3.3.3.3 PM2.5 Plan
The ICAPCD District Board of Directors adopted the PM2.5 SIP for Imperial County on December 2,
2014 27. The PM2.5 SIP fulfills the requirements of the FCAA for those areas classified as “moderate”
nonattainment for PM2.5. The PM2.5 SIP incorporates updated emission inventories, and analysis of
Reasonable Available Control Measures, an assessment of Reasonable Further Progress, and a
discussion of contingency measures. Analyses in the PM2.5 SIP included assessing emission
inventories from Imperial County and Mexicali; evaluating the composition and elemental makeup
of samples collected on Calexico violation days; reviewing the meteorology associated with high
concentration measurements; and performing directional analysis of the sources potentially
impacting the Calexico PM2.5 monitor. As is demonstrated in the PM2.5 SIP, the primary reason for
elevated PM2.5 levels in Imperial County is transport from Mexico. Essentially, the PM2.5 SIP
demonstrated attainment of the 2006 PM2.5 NAAQS “but-for” transport of international emissions
from Mexicali, Mexico.
3.4. Climate Change
Federal Climate Change Legislation
The federal government is taking several common-sense steps to address the challenge of climate
change. EPA collects several types of GHG emissions data. This data helps policy makers,
businesses, and EPA track GHG emissions trends and identify opportunities for reducing emissions
and increasing efficiency. EPA has been collecting a national inventory of GHG emissions since
1990 and in 2009 established mandatory reporting of GHG emissions from large GHG emissions
sources.
EPA is also getting GHG reductions through partnerships and initiatives; evaluating policy options,
costs, and benefits; advancing the science; partnering internationally and with states, localities, and
tribes; and helping communities adapt. Below is a program that has been implemented by the federal
government.
3.4.1.1 Climate Action Plan
In June 2013, President Obama unveiled his Climate Action Plan. The plan was a national blueprint
to slow the effects of climate change, and focuses on both CO2 and short-lived climate pollutants,
such as CH4 and HFCs. Whereas, components of the plan are still active, the current administration
is “committed to eliminating harmful and unnecessary policies such as the Climate Action Plan”28.
27 Imperial County 2013 SIP for the 2006 24-hr PM2.5 Moderate Nonattainment Area. Imperial County Air
Pollution Control District. December 2, 2014.
28 An America First Energy Plan. White House Issues. White House. Accessed March 26, 2017. URL:
https://www.whitehouse.gov/america-first-energy.

Air Quality/Greenhouse Gas Report
Big Rock Cluster Solar Project, Imperial County
OB-1 Air Analyses Revised March 2018 Page 28
State Climate Change Legislation
3.4.1.2 Executive Order S 3-05
On June 1, 2005, the Governor issued Executive Order S 3-05 which set the following GHG
emission reduction targets:
• By 2010, reduce GHG emissions to 2000 levels;
• By 2020, reduce GHG emissions to 1990 levels;
• By 2050, reduce GHG emissions to 80 percent below 1990 levels.
To meet these targets, the Climate Action Team prepared a report to the Governor in 2006 that
contains recommendations and strategies to help ensure the targets in Executive Order S-3-05 are
met.
3.4.1.3 Assembly Bill 32 (AB 32)
In 2006, the California State Legislature enacted the California Global Warming Solutions Act of
2006, also known as AB 32. AB 32 focuses on reducing GHG emissions in California. GHGs, as
defined under AB 32, include CO2, CH4, N2O, HFCs, PFCs, and SF6. AB 32 requires that GHGs
emitted in California be reduced to 1990 levels by the year 2020. The CARB is the state agency
charged with monitoring and regulating sources of emissions of GHGs that cause global warming to
reduce emissions of GHGs. AB 32 also requires that by January 1, 2008, the CARB must determine
what the statewide GHG emissions level was in 1990, and it must approve a statewide GHG
emissions limit so it may be applied to the 2020 benchmark. The CARB approved a 1990 GHG
emissions level of 427 MtCO2e, on December 6, 2007 in its Staff Report. Therefore, in 2020,
emissions in California are required to be at or below 427 MtCO2e.
Under the “business as usual or (BAU)” scenario established in 2008, Statewide emissions were
increasing at a rate of approximately 1 percent per year as noted below. It was estimated that the
2020 estimated BAU of 596 MtCO2e would have required a 28 percent reduction to reach the 1990
level of 427 MtCO2e.
3.4.1.4 Climate Change Scoping Plan
The Scoping Plan29 released by CARB in 2008outlined the state’s strategy to achieve the AB-32
goals. This Scoping Plan, developed by CARB in coordination with the Climate Action Team
(CAT), proposed a comprehensive set of actions designed to reduce overall GHG emissions in
California, improve the environment, reduce dependence on oil, diversify our energy sources, save
energy, create new jobs, and enhance public health. It was adopted by CARB at its meeting in
December 2008. According to the Scoping Plan, the 2020 target of 427 MtCO2e requires the
reduction of 169 MtCO2e, or approximately 28.3 percent, from the State’s projected 2020 BAU
emissions level of 596 MtCO2e.
29 Climate Change Scoping Plan: a framework for change. California Air Resources Board. December 2008.

Air Quality/Greenhouse Gas Report
Big Rock Cluster Solar Project, Imperial County
OB-1 Air Analyses Revised March 2018 Page 29
In August 2011, the Scoping Plan was re-approved by the Board and includes the Final Supplement
to the Scoping Plan Functional Equivalent Document30. This document includes expanded analysis
of project alternatives as well as updates the 2020 emission projections considering the updated
economic forecasts. The updated 2020 BAU estimate of 507 MtCO2e yielded that only a 16 percent
reduction below the estimated new BAU levels would be necessary to return to 1990 levels by 2020.
The 2011 Scoping Plan expands the list of nine Early Action Measures into a list of 39
Recommended Actions contained in Appendices C and E of the Plan.
However, in May 2014, CARB developed; in collaboration with the CAT, the First Update to
California’s Climate Change Scoping Plan31 (Update), which shows that California is on track to
meet the near-term 2020 GHG limit and is well positioned to maintain and continue reductions
beyond 2020 as required by AB-32. In accordance with the United Nations Framework Convention
on Climate Change (UNFCCC), CARB has mostly transitioned to the use of the IPCC’s Fourth
Assessment Report (AR4’s)32 100-year GWPs in its climate change programs. CARB recalculated
the 1990 GHG emissions level with the AR4 GWPs to be 431 MtCO2e, therefore the 2020 GHG
emissions limit established in response to AB-32 is now slightly higher than the 427 MtCO2e in the
initial Scoping Plan.
A Proposed Scoping Plan33 is out for comment which builds upon the former Scoping Plan and
Update by outlining priorities and recommendations for the State to achieve its long-term climate
objectives. The Proposed Scoping Plan establishes a proposed framework of action for California to
meet the climate target of a 40 percent reduction in GHGs by 2030, compared to 1990 levels. The
major elements of the framework proposed are enhancement of the Renewables Portfolio Standard
(RPS) and the Low Carbon Fuel Standard; a Mobile Source Strategy, Sustainable Freight Action
Plan, Short-Lived Climate Pollutant Reduction Strategy, Sustainable Communities Strategies, and a
Post-2020 Cap-and-Trade Program; a 20 percent reduction in GHG emissions from the refinery
sector and an Integrated Natural and Working Lands Action Plan.
3.4.1.5 Renewables Portfolio Standard (Scoping Action E-3)
The California Energy Commission estimates that in 2000 about 12 percent of California’s retail
electric load was met with renewable resources. Renewable energy includes (but is not limited to)
wind, solar, geothermal, small hydroelectric, biomass, anaerobic digestion, and landfill gas.
30 Final Supplement to the AB 32 Scoping Plan Functional Equivalent Document. California Air Resources
Board. August 19, 2011.
31 First Update to the Climate Change Scoping Plan, Building on the Framework. California Air Resources
Board. May 2014.
32 Climate Change 2007: Synthesis Report. Contribution of Working Groups I, II and III to the Fourth
Assessment Report of the Intergovernmental Panel on Climate Change. Intergovernmental Panel on
Climate Change. Core Writing Team; Pachauri, R.K; Reisinger, A., eds., 2007. ISBN 92-9169-122-4.
33 The 2017 Climate Change Scoping Plan Update: The Proposed Strategy for Achieving California’s 2030
Greenhouse Gas Target. California Air Resources Board. January 20, 2017. URL:
https://www.arb.ca.gov/cc/scopingplan/2030sp_pp_final.pdf

Air Quality/Greenhouse Gas Report
Big Rock Cluster Solar Project, Imperial County
OB-1 Air Analyses Revised March 2018 Page 30
California’s current RPS is intended to increase that share to 20 percent by 2010. Increased use of
renewables will decrease California’s reliance on fossil fuels, thus reducing emissions of GHGs from
the electricity sector. Based on the Governor’s call for a Statewide 33 percent RPS, the Scoping Plan
anticipates that California will have 33 percent of its electricity provided by renewable resources by
2020, and includes this reduction in GHG emissions.
3.4.1.6 Senate Bill 350 (SB 350)
More recently, Governor Brown signed into legislation Senate Bill (SB) 350 in October 2015, which
establishes new clean energy, clean air, and GHG reduction goals for 2030 and beyond. SB 350
established the State's 2030 GHG reduction target of 40 percent below 1990 levels. To achieve this
goal, SB 350 sets ambitious 2030 targets for energy efficiency and renewable electricity, among
other actions aimed at reducing GHG emissions across the energy and transportation sectors. SB 350
will greatly enhance the state's ability to meet its long-term climate goal of reducing GHG emissions
to 80 percent below 1990 levels by 2050.
SB 350 requires the California Energy Commission (CEC) to develop and submit Integrated
Resource Plans (IRPs), which will detail how each utility will meet their customers resource needs,
reduce GHG emissions and ramp up the deployment of clean energy resources. Goals of the IRPs
include, among others, meeting the 50 percent RPS and meeting ARB-established utility-specific
GHG emission reduction targets by 2030. The CEC is also required to identify all potentially
achievable energy efficiency savings, and establish targets for statewide energy efficiency savings
and demand reductions to achieve doubling of energy efficiency by January 1, 2030 and implement
the increased RPS target of 50 percent by December 31, 2030 for the publicly owned utilities.
3.4.1.7 Senate Bill 375 (SB 375)
SB 375 passed the Senate on August 30, 2008 and was signed by the Governor on September 30,
2008. According to SB 375, the transportation sector is the largest contributor of GHG emissions and
contributes over 40 percent of the GHG emissions in California, with automobiles and light trucks
alone contributing almost 30 percent. SB 375 indicates that GHGs from automobiles and light trucks
can be reduced by new vehicle technology. However, significant reductions from changed land use
patterns and improved transportation also are necessary. SB 375 states, “Without improved land use
and transportation policy, California will not be able to achieve the goals of AB 32.” SB 375 does
the following: (1) requires metropolitan planning organizations to include sustainable community
strategies in their regional transportation plans for reducing GHG emissions, (2) aligns planning for
transportation and housing, and (3) creates specified incentives for the implementation of the
strategies.
3.4.1.8 Executive Order B-30-15
On April 29, 2015, the Governor issued Executive Order (EO) B-30-15 which added an interim
target of GHG emissions reductions to help ensure the State meets its 80 percent reduction by 2050,
as set in EO S-3-05. The interim target is reducing GHG emissions by 40 percent by 2030. It also

Air Quality/Greenhouse Gas Report
Big Rock Cluster Solar Project, Imperial County
OB-1 Air Analyses Revised March 2018 Page 31
directs State agencies to update the Scoping Plan, update Adaptation Strategy every 3 years, and take
climate change into account in their planning and investment strategies. Additionally, it requires the
State’s Five-Year Infrastructure Plan will take current and future climate change impacts into
account in all infrastructure projects. adopt a regulation that establishes a system of market-based
declining annual aggregate emissions limits for sources or categories of sources that emit GHGs,
applicable from January 1, 2012, to December 31, 2020, inclusive, as specified. adopt a regulation
that establishes a system of market-based declining annual aggregate emissions limits for sources or
categories of sources that emit GHGs, applicable from January 1, 2012, to December 31, 2020,
inclusive, as specified.
3.4.1.9 Assembly Bill 398 (AB 398)
On July 25, 2017, the Governor approved AB 398, which requires CARB to provide an updated
scoping plan no later than January 1, 2018 and update it a least once every 5 years; adopt a
regulation that establishes a system of market-based declining annual aggregate emissions limits for
sources or categories of sources that emit GHGs; and include specified price ceilings, price
containment points, offset credit compliance limits, and industry assistance factors for allowance
allocation as part of market-based system. AB 398 was declared that it was to take effect
immediately as an urgency statute.

Air Quality/Greenhouse Gas Report
Big Rock Cluster Solar Project, Imperial County
OB-1 Air Analyses Revised March 2018 Page 32
SECTION 4.0 – SIGNIFICANCE CRITERIA
The ICAPCD CEQA Air Quality Handbook34 outlines significance determination thresholds. The
significance criteria described in this section have been derived from this guidance document. In addition,
significance criteria for stationary sources, which are permitted by the ICAPCD, are also cited in this
section of the document.
4.1. CEQA Significance Determination Thresholds
As stated in the ICAPCD CEQA Air Quality Handbook and in the State CEQA Guidelines, a project
is deemed to have a “potentially significant impact” on air quality if it could:
• Conflict with or obstruct implementation of the applicable air quality plan;
• Violate any air quality standard or contribute to an existing or projected air quality violation;
• Result in cumulatively considerable net increase of any criteria pollutant for which the project
region is in non-attainment under an applicable federal or state ambient air quality standard
(including releasing emissions that exceed quantitative thresholds for ozone precursors);
• Expose the public (especially schools, day care centers, hospitals, retirement homes
convalescence facilities, and residences) to substantial pollutant concentrations; or
• Create objectionable odors affecting a substantial number of people. Each of these threshold
criteria is discussed in this section.
4.2. ICAPCD Regional Thresholds of Significance
Under CEQA, each public agency is encouraged to develop and publish thresholds of significance.
These thresholds of significance should be an identifiable quantitative, qualitative, or performance
level of an environmental effect; the noncompliance with would mean the effect would normally be
significant while compliance with would mean the effect would normally be less than significant.
4.2.1 Operational Thresholds
The ICAPCD has determined in their Guidelines that, because the operational phase of a proposed
project has the potential of creating lasting or long-term impacts on air quality, it is important that a
proposed development evaluate the potential impacts carefully. Therefore, air quality analyses
should compare all operational emissions of a project, including motor vehicle, area source, and
stationary or point sources to the thresholds in Table 8 below. Table 8 provides general guidelines
for determining the significance of impacts and the recommended type of environmental analysis
required based on the total emissions that are expected from the operational phase of a project.
34 CEQA Air Quality Handbook: Guidelines for the Implementation of the California Air Quality Act of
1970, as amended. Imperial County Air Pollution Control District. December 12, 2017.
http://www.co.imperial.ca.us/AirPollution/PlanningDocs/CEQAHandbook.pdf.
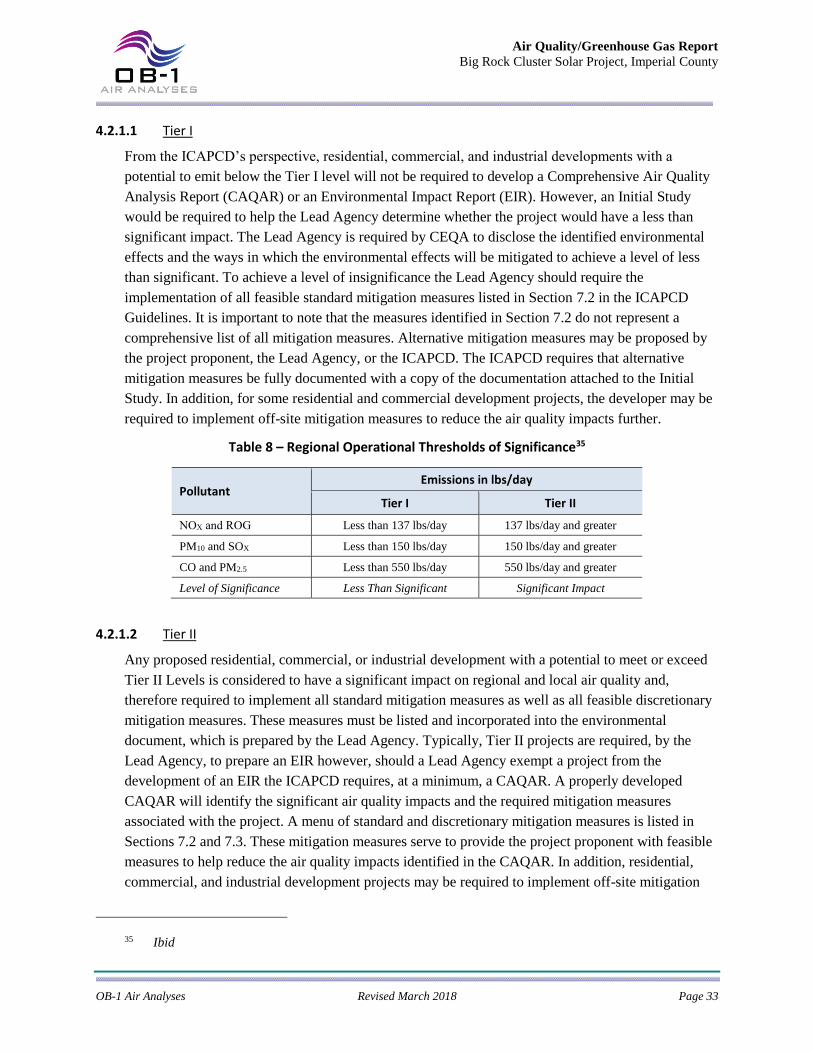
Air Quality/Greenhouse Gas Report
Big Rock Cluster Solar Project, Imperial County
OB-1 Air Analyses Revised March 2018 Page 33
4.2.1.1 Tier I
From the ICAPCD’s perspective, residential, commercial, and industrial developments with a
potential to emit below the Tier I level will not be required to develop a Comprehensive Air Quality
Analysis Report (CAQAR) or an Environmental Impact Report (EIR). However, an Initial Study
would be required to help the Lead Agency determine whether the project would have a less than
significant impact. The Lead Agency is required by CEQA to disclose the identified environmental
effects and the ways in which the environmental effects will be mitigated to achieve a level of less
than significant. To achieve a level of insignificance the Lead Agency should require the
implementation of all feasible standard mitigation measures listed in Section 7.2 in the ICAPCD
Guidelines. It is important to note that the measures identified in Section 7.2 do not represent a
comprehensive list of all mitigation measures. Alternative mitigation measures may be proposed by
the project proponent, the Lead Agency, or the ICAPCD. The ICAPCD requires that alternative
mitigation measures be fully documented with a copy of the documentation attached to the Initial
Study. In addition, for some residential and commercial development projects, the developer may be
required to implement off-site mitigation measures to reduce the air quality impacts further.
Table 8 – Regional Operational Thresholds of Significance35
Pollutant Emissions in lbs/day
Tier I Tier II
NOX and ROG Less than 137 lbs/day 137 lbs/day and greater
PM10 and SOX Less than 150 lbs/day 150 lbs/day and greater
CO and PM2.5 Less than 550 lbs/day 550 lbs/day and greater
Level of Significance Less Than Significant Significant Impact
4.2.1.2 Tier II
Any proposed residential, commercial, or industrial development with a potential to meet or exceed
Tier II Levels is considered to have a significant impact on regional and local air quality and,
therefore required to implement all standard mitigation measures as well as all feasible discretionary
mitigation measures. These measures must be listed and incorporated into the environmental
document, which is prepared by the Lead Agency. Typically, Tier II projects are required, by the
Lead Agency, to prepare an EIR however, should a Lead Agency exempt a project from the
development of an EIR the ICAPCD requires, at a minimum, a CAQAR. A properly developed
CAQAR will identify the significant air quality impacts and the required mitigation measures
associated with the project. A menu of standard and discretionary mitigation measures is listed in
Sections 7.2 and 7.3. These mitigation measures serve to provide the project proponent with feasible
measures to help reduce the air quality impacts identified in the CAQAR. In addition, residential,
commercial, and industrial development projects may be required to implement off-site mitigation
35 Ibid

Air Quality/Greenhouse Gas Report
Big Rock Cluster Solar Project, Imperial County
OB-1 Air Analyses Revised March 2018 Page 34
measures to further reduce the air quality impacts. All residential, commercial, and industrial
projects are required to abide by off-site mitigation requirements under Section 7.4 of the ICAPCD
Guidelines.
4.2.2 Construction Thresholds for Tier 1 Projects
Even though construction emissions are generally temporary in nature, they can have an adverse
impact on air quality. Construction, by its very nature may produce a variety of emissions; however,
PM10 is the pollutant of greatest concern. While construction PM10 emissions can vary greatly
depending on the phase of the construction, level of activity, and other factors, ICPACD states there
are feasible mitigation or control measures which can be reasonably implemented to reduce PM10
emissions significantly. Because particulate emissions from construction activities have the potential
of leading to adverse health effects as well as nuisance concerns, such as reduced visibility, all
projects are required to mitigate construction fugitive dust impacts by regulation, i.e. ICAPCD
Regulation VIII. Another source of construction-related emissions comes from the use of diesel
powered construction equipment which have been known to produce ozone precursor emissions and
combustion related particulate emissions. To help projects address these emissions The ICAPCD has
also listed standard mitigation measures for construction equipment in their Guidelines.
The ICAPCD suggests that the approach of the CEQA analyses for construction PM10 impacts
should be qualitative as opposed to quantitative. While a Lead Agency may elect to quantify
construction emissions, the ICAPCD recommends the implementation of effective and
comprehensive mitigation measures. Standard Mitigation Measures for construction equipment and
fugitive PM10 must be implemented at all construction sites. However, Table 9 shows construction
thresholds ICAPCD provides to serve as a guide for project developers and interested parties in
determining the recommended type of mitigation measures.
Table 9 – Construction Threshold Guide36
Pollutant Threshold in lbs/day
PM10 150
ROG 75
NOX 100
CO 550
For those projects, which fall below the threshold for construction, adherence to the most current
rules adopted for the control of fugitive dust is mandatory. In addition, the ICAPCD requires the use
of the Standard Mitigation Measures for construction equipment and fugitive dust found under the
Guidelines.
Projects that are greater than the threshold for construction may have a significant impact on local
and, under certain circumstances, regional air quality. These projects must conduct a construction
36 ibid

Air Quality/Greenhouse Gas Report
Big Rock Cluster Solar Project, Imperial County
OB-1 Air Analyses Revised March 2018 Page 35
analysis that appropriately reflects the identified potential construction air quality impacts. In
addition, the quantification of construction emissions should be utilized to help define the need for a
Health Risk Assessment (HRA). Projects that are prone to a significant use of heavy-duty diesel
equipment and that are within areas prone to human exposure will be required to perform a diesel
exhaust screening level. Factors considered by the ICAPCD staff when determining if a screening
risk analysis is necessary include the expected emissions from diesel equipment, the location of the
project and the distance to sensitive receptors.
Standard mitigation measures listed in the Guidelines for construction equipment and fugitive PM10
control should be implemented at all sites. In addition, all discretionary mitigation measures listed in
the guidelines should be implemented at construction sites greater than 4 acres in size.
4.2.3 Toxics or Hazardous Air Pollutant Thresholds
The ICAPCD has also determined that project impacts may also be considered significant if the
project, which has the potential to emit toxic or hazardous air pollutants and are near sensitive
receptors. These projects may be required to prepare an HRA to determine the potential level of risk
associated with the operation.
4.2.4 Odor Threshold
While offensive odors rarely cause any physical harm, they still can be very unpleasant, leading to
considerable distress among the public and often generating citizen complaints to local governments
and the District. Any project with the potential to expose members of the public to objectionable
odors frequently would be deemed to have a significant impact.
4.3. Greenhouse Gas (GHG) / Climate Change
4.3.1 California Environmental Quality Act (CEQA)
Effective March 18, 2010, CEQA Appendix G states that a project would have potentially significant
GHG emission impacts if it would:
o Generate GHG emissions, either directly or indirectly, that may have a significant impact
on the environment or
o Conflict with an applicable plan, policy, or regulation adopted for the purpose of
reducing the emissions of GHGs.
4.3.2 Local Significance Thresholds
It is widely recognized that no single project could generate enough GHG emissions to noticeably
change the global climate temperature. However, the combination of GHG emissions from past,
present, and future projects could contribute substantially to global climate change. Thus, project
specific GHG emissions should be evaluated in terms of whether they would result in a cumulatively
significant impact on global climate change.
This analysis proposes the use of the “Tier 3” quantitative thresholds for residential and commercial

Air Quality/Greenhouse Gas Report
Big Rock Cluster Solar Project, Imperial County
OB-1 Air Analyses Revised March 2018 Page 36
projects as recommended by the South Coast Air Quality Management District (SCAQMD)37. The
SCAQMD proposes that if a project generates GHG emissions below 3,000 tCO2e, it could be
concluded that the project’s GHG contribution is not “cumulatively considerable” and is therefore
less than significant under CEQA. If the project generates GHG emissions above the threshold, the
analysis must identify mitigation measures to reduce GHG emissions.
37 Draft Guidance Document – Interim CEQA Greenhouse Gas (GHG) Significance Threshold. South Coast
Air Quality Management District. October 2008.

Air Quality/Greenhouse Gas Report
Big Rock Cluster Solar Project, Imperial County
OB-1 Air Analyses Revised March 2018 Page 37
SECTION 5.0 – IMPACT ANALYSIS
5.1. Analysis Methodology
Regional and local emissions of criteria air pollutants and precursors, and GHGs during Project
construction and operations were assessed in accordance with the methodologies described below.
ICAPCD suggests that the “approach of the CEQA analyses for construction PM10 impacts should be
qualitative as opposed to quantitative”38 but that any projects which are greater than the level of
significance for construction may have a significant impact on local and, under certain
circumstances, regional air quality. Even though the size of the Project is not large, this AQR has
decided to include PM10 in the quantification.
Due to the type of project (i.e. solar farm), it was determined that emissions from the construction
activities related to the Project could not be easily estimated using existing models, including Urban
Emissions Model (URBEMIS2007) and California Emissions Estimator Model (CalEEMod) as these
models are designed for “typical” land development projects. Therefore, this analysis attempts to
provide detailed analysis of impacts related to site preparation, including any erosion control
measures deemed necessary; stabilization of construction entrances and exits to reduce tracking;
internal access roads; construction of PV modules; and testing/certification.
This AQR presents the emissions information separately for each of the four solar projects (BR-1, L-
1, L-2, and L-3) as well as for the combined Big Rock Cluster. In combining the projects to estimate
the effects of all four together, individual construction phases were staggered.
Construction Emissions
Construction of the Project would result in temporary emissions of ROG, CO, NOX, SOX, PM10, and
PM2.5. Emissions from construction activities would result from fuel combustion and exhaust from
construction equipment and vehicle traffic (i.e., worker commute and delivery truck trips), and
grading and site work. Construction for the Project is expected to conservatively last 15 months,
scheduled to begin early 2018. Each separate site would be divided into four potentially overlapping
broad phase activities:
• Phase 1 - Site Preparation, Fencing, and Ingress/Egress, which includes erosion control (if
necessary); stabilized construction entrances & exits; fencing & gates; and
communication/security systems.
• Phase 2 - Civil Improvements - Grading/Roads/ Earthwork, which includes surface
smoothing & grading; preparation of solar foundations; and internal access roads.
• Phase 3 - PV Panel Construction, which includes placement of underground electrical &
communication lines; concrete for foundations & equipment pads; support structures (posts);
cross-members & other hardware; electrical connections & equipment; and PV modules.
38 CEQA Air Quality Handbook: Guidelines for the Implementation of the California Air Quality Act of
1970, and amended. Imperial County Air Pollution Control District, November 2007.

Air Quality/Greenhouse Gas Report
Big Rock Cluster Solar Project, Imperial County
OB-1 Air Analyses Revised March 2018 Page 38
• Phase 4 - Testing and Commissioning, which includes final inspections testing, start-up, and
certification; and facility brought on-line in stages and tested at every stage.
Each individual solar site is not projected to take the entire 15 months. To distribute potential
impacts, the start dates of the individual solar projects will be staggered, or phased. Presented in
Table 10 are the activity phase durations per solar site that were used in the estimation of emissions
and Figure 3 graphically represents the proposed scheduling for the entire cluster Construction would
primarily occur during daylight hours, Monday through Friday.
Table 10 – Project Phase Durations
Activity Phase Duration (months)
BR-1 L-1 L-2 L-3
Phase 1 - Site Preparation, Fencing, and Ingress/Egress 1.5 0.8 1.5 1.9
Phase 2 - Civil Improvements - Grading/Roads/Earthwork 2.0 1.3 2.0 2.5
Phase 3 - PV Panel Construction 3.2 1.8 3.2 6.0
Phase 4 - Testing and Commissioning 1.0 0.7 1.0 1.3
Solar Site Facility Estimated Duration 6 5 8 9
Note: the sum of the individual activity phase durations does not add up to the overall
project duration due to activity phase overlap or downtime.
For each solar site, emissions from off-road equipment, such as tractors, graders, loaders, scrapers,
forklifts, trenchers, compactors, rollers, and post drivers; onsite mobile equipment, such as water
trucks, pickup trucks, lube/fuel trucks, and flatbed delivery trucks; mobile activity from vendors,
such as flatbed/delivery trucks and Porto-let trucks; and employee vehicular commute were
estimated. Potential double counting that would occur by proportioning the size of the labor force as
well as the duration of activity based on individual solar site size was left in to provide an overall
conservative estimation. A detailed summary of the assumptions and model data used to estimate the
Project’s construction emissions is provided in Appendix A.
Operational Emissions
The facilities would be remotely operated, controlled, and monitored and with no requirement for
daily on-site employees. Local and remote operations and maintenance staff would be on-call to
respond to any alerts generated by the monitoring systems, and would be present on the site
periodically to perform maintenance. A part-time O&M staff of up to five persons per project would
be responsible for performing all routine and emergency operational and maintenance activities.
Once operational, sources of emissions associated with the Project would be limited to routine
maintenance and monitoring activities, such as inspections, equipment servicing, site and landscape
clearing, and periodic washing of the PV modules if needed (up to four times per year) to increase
the performance of the panels.

Air Quality/Greenhouse Gas Report
Big Rock Cluster Solar Project, Imperial County
OB-1 Air Analyses Revised March 2018 Page 39
Figure 3 - Phased Cluster Activity Distributions
These facilities would operate seven days a week, 24 hours a day, generating electricity during
normal daylight hours when the solar energy is available. Maintenance activities may occur seven
days a week, 24 hours a day to ensure PV Panel output when solar energy is available; however,
most scheduled maintenance would occur during daytime hours but work may be performed at night
for safety reasons.
Air Quality/Greenhouse Gas Report
Big Rock Cluster Solar Project, Imperial County
OB-1 Air Analyses Revised March 2018 Page 40
A detailed summary of the assumptions and model data used to estimate the Project’s operational
emissions is provided in Appendix A.
Other air quality impacts (i.e., local emissions of CO, odors, and construction- and operation-related
TACs) were assessed in accordance with methodologies recommended by CARB and ICAPCD.
5.2. Analysis of Environmental Impacts
IMPACT 1: Would the Project conflict with or obstruct implementation of the applicable air quality plan?
CEQA requires that projects be consistent with the applicable AQMP. A consistency determination
plays a significant role in local agency project review by linking local planning and individual
projects to the AQMP. It fulfills the CEQA goal of informing decision-makers of the environmental
efforts of the project under consideration at a stage early enough to ensure that air quality concerns
are fully addressed.
ICAPCD’s CEQA Handbook states that a CAQAR of a proposed project should demonstrate
compliance with the most recent ozone AQMP and PM10 SIP. It also states the Analysis Report
should also demonstrate compliance with the Imperial County Rules and Regulations but also those
of the State and federal regulations.
Ozone Air Quality Management Plan (AQMP)
To develop the Modified AQMP39, a control strategy for meeting State and federal requirements is
required. The ICAPCD control strategy included an interactive process of technology and strategy
review supported by ambient air quality modeling. The air quality modeling assists in identifying
current and remaining emission targets that would help to achieve the ambient air quality standards.
The Modified AQMP control measures consist of three components: 1) the ICAPCD’s Stationary
Source Control Measures; 2) Regional Transportation Strategy and Control Measures; and 3) State
Strategy. These measures primarily rely on the traditional command and control approach and as
such provide the framework for ICAPCD Rules that reduce ROG and NOX emissions.
The Project does not produce new residential activity, produces only minimal additional traffic
activity during project operations; and does not fall outside of the modeling forecast estimations used
in determining continued maintenance.
PM10 State Implementation Plan (PM10 SIP)
The PM10 SIP was required to address and meet the following elements, required under the FCAA of
areas classified to be in serious nonattainment of the NAAQS:
▪ Best available emission inventories;
▪ A plan that enables attainment of the PM10 federal air quality standards;
39 Final 2009 1997 8-Hour Modified Air Quality Management Plan. Imperial County Air Pollution Control
District. July 13, 2010.

Air Quality/Greenhouse Gas Report
Big Rock Cluster Solar Project, Imperial County
OB-1 Air Analyses Revised March 2018 Page 41
▪ Annual reductions in PM10 or PM10 precursor emissions that are of not less than 5 percent
from the date of SIP submission until attainment;
▪ Best available control measures and best available control technologies for significant
sources and major stationary sources of PM10, to be implemented no later than 4 years after
reclassification of the area as serious;
▪ Transportation conformity and motor vehicle emission budgets in accord with the attainment
plan;
▪ Reasonable further progress and quantitative milestones; and
▪ Contingency measures to be implemented (without the need for additional rulemaking
actions) if the control measure regulations incorporated in the plan cannot be successfully
implemented or fail to give the expected emission reductions.
In November 2005, revised Regulation VIII fugitive dust control measures were adopted, which
form the core of the Imperial County PM10 control strategy. Portions of Regulation VIII that would
apply to Construction and Earthmoving Activities are:
▪ Required to limit Visible Dust Emissions (VDE) to 20% opacity by complying with the following
measures:
o Phase work to minimize the amount of disturbed surface area at one time;
o Apply water or chemical stabilization;
o Construct and maintain wind barriers around the activity site;
o Restrict vehicular access to the area by fencing or signage;
o Mitigate track out/carry out of bulk materials at the site in compliance with Rule
803; and
o Transport bulk material to, from, and around the site in compliance with Rule
802.
▪ Required to provide a Dust Control Plan that documents the type and location of the project,
the expected start and completion dates of the dust generating activities, the total area of land
surface to be disturbed, the actual and potential sources of fugitive dust emissions on the site
(including the location of Bulk Material handling and storage areas, paved and unpaved
roads, entrances and exits where track out/carry out may occur, etc.), and all the fugitive dust
control measures to be implemented before, during, and after any dust-generating activity.
▪ For unpaved haul/access roads, unpaved traffic areas larger than 1 acre and with ≥ 75 average
vehicle trips per day (AVTD), unpaved roads with ≥ 50 AVTD, and canal roads with ≥ 20
AVTD, visible dust emissions (VDE) must be limited to 20% opacity by applying at least one
of the stabilization methods described below;
o Paving,
o Applying chemical stabilization as directed by the product manufacturer,
o Applying and maintaining gravel, recrushed/recycled asphalt, or other material of
low silt content (<5%) to a depth of three or more inches, or
Air Quality/Greenhouse Gas Report
Big Rock Cluster Solar Project, Imperial County
OB-1 Air Analyses Revised March 2018 Page 42
o Applying water one or more times daily.
At only 40 vehicles per day, operational activities related to the Project would not generate enough
traffic to significantly impact regional transportation emissions budgets; will comply with all
applicable ICAPCD Rules and Regulations40; and will comply with all applicable State and federal
requirements for attainment of air quality objectives.
Level of Significance Before Mitigation: The Project would not conflict with, or obstruct
implementation of, the applicable air quality plan, therefore would result in a less than
significant impact.
Mitigation Measures: No mitigation measures are necessary.
Level of Significance After Mitigation: Impacts would be less than significant.
IMPACT 2: Would the Project violate any air quality standard or contribute substantially to an existing or projected air quality violation?
An impact is potentially significant if emissions levels exceed the State or federal AAQSs. The
ICAPCD has established that construction related PM10 emissions can cause a substantial increase in
localized concentrations, which under certain circumstances can contribute to violations of the State
and federal AAQSs. As such, the Imperial County adopted Regulation VIII which contains a variety
of feasible fugitive dust control measures to help bring the ICAPCD into compliance with the
NAAQS. Therefore, compliance with Regulation VIII and its measures is required and applies to any
project regardless of its determined level of significance or size. In addition, the proposed Project
will adopt all feasible discretionary measures listed in the ICAPCD’s Guidelines (see Impact 3).
Level of Significance Before Mitigation: The Project would not violate an air quality standard
or contribute to an existing or projected air quality violation, therefore would result in a
less than significant impact.
Mitigation Measures: No mitigation measures are necessary.
Level of Significance After Mitigation: Impacts would be less than significant.
IMPACT 3: Would the Project result in construction-related air quality impacts?
Construction of the Project would result in emissions of the air pollutants ROG, NOX, CO, PM10,
PM2.5, and SOX. Emissions from construction would result from fuel combustion and exhaust from
construction equipment and vehicle traffic and fugitive dust from earth moving operations and
roadways.
Criteria pollutant emissions from off-road construction equipment use were estimated using the
underlying emission and load factors of URBEMIS and CalEEMod computer models. Emissions
40 Imperial County Air Pollution Control District Rules and Regulations. Imperial County Air Pollution
Control District. Revised June 2, 2009.

Air Quality/Greenhouse Gas Report
Big Rock Cluster Solar Project, Imperial County
OB-1 Air Analyses Revised March 2018 Page 43
were estimated from the exhaust off-road equipment by using emission factors from Table 3.4 of
Appendix D in the CalEEMod User’s Guide41 for year calendar year 2018.
Emissions from vehicular activity related to construction employees and vendors were estimated
using CARB’s EMFAC2011 Web Based Data Access42 with emission rate data for Imperial County
for the 2018 calendar year. This AQR used EMFAC2011’s aggregate model years, which is an
average age of vehicles specific for Imperial County. To generate expected exhaust emissions from
employee vehicles, this AQR also used CARB’s EMFAC2011 Web Based Data Access and to more
accurately represent the type of vehicles used by the potential employee work pool, an activity-
weighted average emission factor was generated using light-duty automobiles and light-duty trucks.
The averages were derived from the distributions of vehicle miles travelled from EMFAC2011.
Grading fugitive dust was estimated using methodology described in Section 11.9, Western Surface
Coal Mining, of the EPA AP-4243 and as presented in the CalEEMod User’s Guide. Entrained road
dust emissions were assigned to both employee and vendor activity. Per the ICAPCD, 50 percent of
vehicular travel in Imperial County is assumed to be on unpaved roads.
Emissions are presented below for each of the two individual solar projects and the combined
Project. Since the thresholds for criteria pollutants are in pounds per day, emissions estimated from
each activity phase for each project, the combined with other activity phases where they overlap, to
generate the maximum emissions per day. There is some overlap of activity phases for each separate
project, as well as some overlap between projects in the overall scheduling of the entire Project.
Emissions presented below are considered unmitigated, which is to mean hypothetical emissions
from construction activity, which does not apply equipment or activity restrictions or controls, even
those required by ICAPCD regulations.
Project Specific Estimates
The BR-1 project is estimated to be completed within 6 months from project start and Table 11
presents the daily maximum hypothetical unmitigated emissions for each month of construction for
the Big Rock 1 Solar Farm.
41 User’s Guide: California Emissions Estimator Model® (CalEEMod). Version 2016.3.1. California Air
Pollution Control Officers Association. September 2016.
42 http://www.arb.ca.gov/msei/modeling.htm#emfac2011_web_based_data
43 Compilation of Air Pollutant Emission Factors – AP-42. Fifth Edition. United States Environmental
Protection Agency. January 1995.
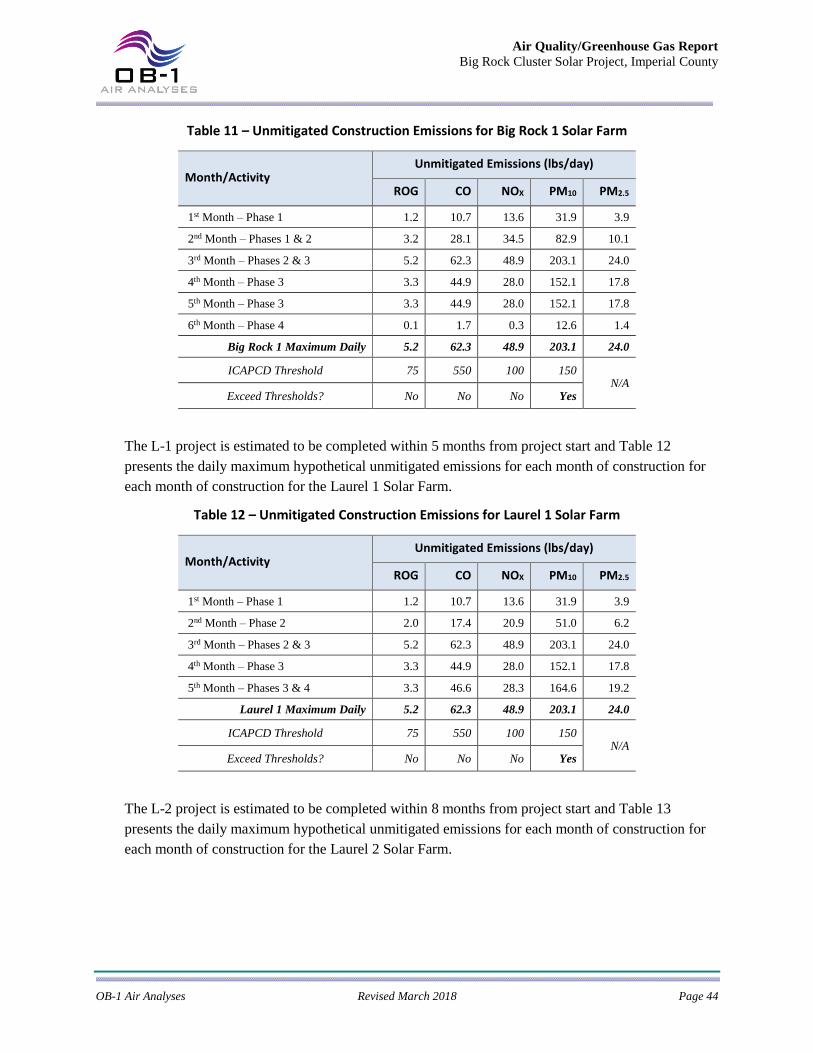
Air Quality/Greenhouse Gas Report
Big Rock Cluster Solar Project, Imperial County
OB-1 Air Analyses Revised March 2018 Page 44
Table 11 – Unmitigated Construction Emissions for Big Rock 1 Solar Farm
Month/Activity Unmitigated Emissions (lbs/day)
ROG CO NOX PM10 PM2.5
1st Month – Phase 1 1.2 10.7 13.6 31.9 3.9
2nd Month – Phases 1 & 2 3.2 28.1 34.5 82.9 10.1
3rd Month – Phases 2 & 3 5.2 62.3 48.9 203.1 24.0
4th Month – Phase 3 3.3 44.9 28.0 152.1 17.8
5th Month – Phase 3 3.3 44.9 28.0 152.1 17.8
6th Month – Phase 4 0.1 1.7 0.3 12.6 1.4
Big Rock 1 Maximum Daily 5.2 62.3 48.9 203.1 24.0
ICAPCD Threshold 75 550 100 150 N/A
Exceed Thresholds? No No No Yes
The L-1 project is estimated to be completed within 5 months from project start and Table 12
presents the daily maximum hypothetical unmitigated emissions for each month of construction for
each month of construction for the Laurel 1 Solar Farm.
Table 12 – Unmitigated Construction Emissions for Laurel 1 Solar Farm
Month/Activity Unmitigated Emissions (lbs/day)
ROG CO NOX PM10 PM2.5
1st Month – Phase 1 1.2 10.7 13.6 31.9 3.9
2nd Month – Phase 2 2.0 17.4 20.9 51.0 6.2
3rd Month – Phases 2 & 3 5.2 62.3 48.9 203.1 24.0
4th Month – Phase 3 3.3 44.9 28.0 152.1 17.8
5th Month – Phases 3 & 4 3.3 46.6 28.3 164.6 19.2
Laurel 1 Maximum Daily 5.2 62.3 48.9 203.1 24.0
ICAPCD Threshold 75 550 100 150 N/A
Exceed Thresholds? No No No Yes
The L-2 project is estimated to be completed within 8 months from project start and Table 13
presents the daily maximum hypothetical unmitigated emissions for each month of construction for
each month of construction for the Laurel 2 Solar Farm.

Air Quality/Greenhouse Gas Report
Big Rock Cluster Solar Project, Imperial County
OB-1 Air Analyses Revised March 2018 Page 45
Table 13 – Unmitigated Construction Emissions for Laurel 2 Solar Farm
Month/Activity Unmitigated Emissions (lbs/day)
ROG CO NOX PM10 PM2.5
1st Month – Phase 1 1.2 10.7 13.6 31.9 3.9
2nd Month – Phase 1 1.2 10.7 13.6 31.9 3.9
3rd Month – Phase 2 2.0 17.4 20.9 51.0 6.2
4th Month – Phase 2 2.0 17.4 20.9 51.0 6.2
5th Month – Phase 3 3.3 44.9 28.0 152.1 17.8
6th Month – Phase 3 3.3 44.9 28.0 152.1 17.8
7th Month – Phase 3 3.3 44.9 28.0 152.1 17.8
8th Month – Phases 3 & 4 3.3 46.6 28.3 164.6 19.2
Laurel 2 Maximum Daily 3.3 46.6 28.3 164.6 19.2
ICAPCD Threshold 75 550 100 150 N/A
Exceed Thresholds? No No No Yes
The L-3 project is estimated to be completed within 9 months from project start and Table 14
presents the daily maximum hypothetical unmitigated emissions for each month of construction for
each month of construction for the Laurel 3 Solar Farm.
Table 14 – Unmitigated Construction Emissions for Laurel 3 Solar Farm
Month/Activity Unmitigated Emissions (lbs/day)
ROG CO NOX PM10 PM2.5
1st Month – Phases 1 & 2 3.2 28.1 34.5 82.9 10.1
2nd Month – Phases 1 & 2 3.2 28.1 34.5 82.9 10.1
3rd Month – Phase 2 2.0 17.4 20.9 51.0 6.2
4th Month – Phase 3 3.3 44.9 28.0 152.1 17.8
5th Month – Phase 3 3.3 44.9 28.0 152.1 17.8
6th Month – Phase 3 3.3 44.9 28.0 152.1 17.8
7th Month – Phase 3 3.3 44.9 28.0 152.1 17.8
8th Month – Phases 3 & 4 3.3 46.6 28.3 164.6 19.2
9th Month – Phases 3 & 4 3.3 46.6 28.3 164.6 19.2
Laurel 3 Maximum Daily 3.3 46.6 34.5 164.6 19.2
ICAPCD Threshold 75 550 100 150 N/A
Exceed Thresholds? No No No Yes
In summary, individually all 4 projects would potentially exceed the PM10 threshold if unmitigated.
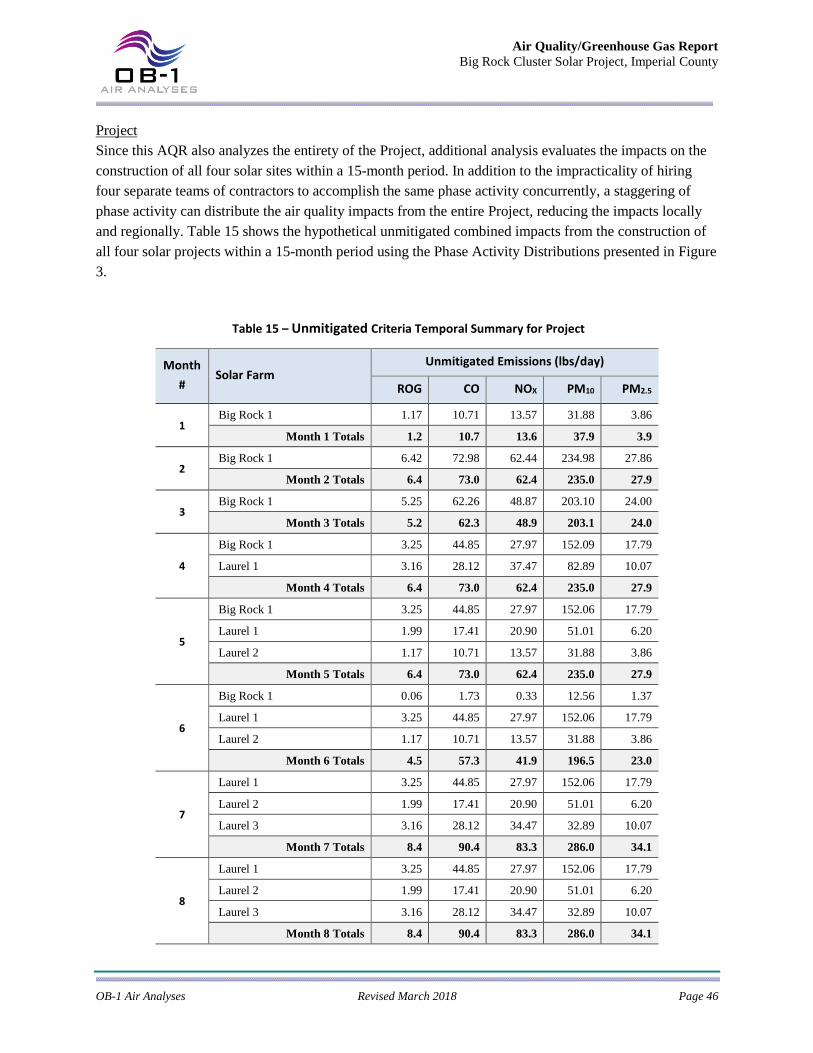
Air Quality/Greenhouse Gas Report
Big Rock Cluster Solar Project, Imperial County
OB-1 Air Analyses Revised March 2018 Page 46
Project
Since this AQR also analyzes the entirety of the Project, additional analysis evaluates the impacts on the
construction of all four solar sites within a 15-month period. In addition to the impracticality of hiring
four separate teams of contractors to accomplish the same phase activity concurrently, a staggering of
phase activity can distribute the air quality impacts from the entire Project, reducing the impacts locally
and regionally. Table 15 shows the hypothetical unmitigated combined impacts from the construction of
all four solar projects within a 15-month period using the Phase Activity Distributions presented in Figure
3.
Table 15 – Unmitigated Criteria Temporal Summary for Project
Month
# Solar Farm
Unmitigated Emissions (lbs/day)
ROG CO NOX PM10 PM2.5
1 Big Rock 1 1.17 10.71 13.57 31.88 3.86
Month 1 Totals 1.2 10.7 13.6 37.9 3.9
2 Big Rock 1 6.42 72.98 62.44 234.98 27.86
Month 2 Totals 6.4 73.0 62.4 235.0 27.9
3 Big Rock 1 5.25 62.26 48.87 203.10 24.00
Month 3 Totals 5.2 62.3 48.9 203.1 24.0
4
Big Rock 1 3.25 44.85 27.97 152.09 17.79
Laurel 1 3.16 28.12 37.47 82.89 10.07
Month 4 Totals 6.4 73.0 62.4 235.0 27.9
5
Big Rock 1 3.25 44.85 27.97 152.06 17.79
Laurel 1 1.99 17.41 20.90 51.01 6.20
Laurel 2 1.17 10.71 13.57 31.88 3.86
Month 5 Totals 6.4 73.0 62.4 235.0 27.9
6
Big Rock 1 0.06 1.73 0.33 12.56 1.37
Laurel 1 3.25 44.85 27.97 152.06 17.79
Laurel 2 1.17 10.71 13.57 31.88 3.86
Month 6 Totals 4.5 57.3 41.9 196.5 23.0
7
Laurel 1 3.25 44.85 27.97 152.06 17.79
Laurel 2 1.99 17.41 20.90 51.01 6.20
Laurel 3 3.16 28.12 34.47 32.89 10.07
Month 7 Totals 8.4 90.4 83.3 286.0 34.1
8
Laurel 1 3.25 44.85 27.97 152.06 17.79
Laurel 2 1.99 17.41 20.90 51.01 6.20
Laurel 3 3.16 28.12 34.47 32.89 10.07
Month 8 Totals 8.4 90.4 83.3 286.0 34.1

Air Quality/Greenhouse Gas Report
Big Rock Cluster Solar Project, Imperial County
OB-1 Air Analyses Revised March 2018 Page 47
Month
# Solar Farm
Unmitigated Emissions (lbs/day)
ROG CO NOX PM10 PM2.5
9
Laurel 1 0.06 1.73 0.33 12.56 1.37
Laurel 2 3.25 44.85 27.97 152.06 17.79
Laurel 3 1.99 17.41 20.90 51.01 6.20
Month 9 Totals 5.3 64.0 49.2 215.7 25.4
10
Laurel 2 3.25 44.85 27.97 152.06 17.79
Laurel 3 3.25 44.85 27.97 152.06 17.79
Month 10 Totals 6.5 89.7 55.9 304.2 35.6
11
Laurel 2 3.25 44.85 27.97 152.06 17.79
Laurel 3 3.25 44.85 27.97 152.06 17.79
Month 11 Totals 6.5 89.7 55.9 304.2 35.6
12
Laurel 2 3.31 46.58 28.30 164.65 19.16
Laurel 3 3.25 44.85 27.97 152.06 17.79
Month 12 Totals 6.6 91.4 56.3 316.7 37.0
13 Laurel 3 3.25 44.85 27.97 152.06 17.79
Month 13 Totals 3.3 44.9 28.0 152.1 17.8
14 Laurel 3 3.31 46.58 28.30 164.65 19.16
Month 14 Totals 3.3 46.6 28.3 164.6 19.2
15 Laurel 3 3.31 46.58 28.30 164.65 19.16
Month 15 Totals 3.3 46.6 28.3 164.6 19.2
Project Maximum Daily 8.4 91.4 83.3 316.7 37.0
ICAPCD Threshold 75 550 100 150 N/A
Exceed Thresholds? No No No Yes
The unmitigated impacts from the construction of the entire Project within a 15-month period would
exceed the threshold for PM10.
Level of Significance Before Mitigation: The Project would potentially have a significant impact
from construction-related emissions.
Mitigation and Control: As described above, the individual projects are expected to generate
unmitigated construction emissions that would exceed the ICAPCD construction threshold for
PM10. Since the ICAPCD requires all projects to implement Standard Mitigation Measures as
presented in the ICAPCD’s CEQA Guidelines44 and, since the Project has a construction site
greater than 5 acres, the ICAPCD also requires the inclusion of practicable Discretionary
44 CEQA Air Quality Handbook: Guidelines for the Implementation of the California Air Quality Act of
1970, and amended. Imperial County Air Pollution Control District, November 2007.

Air Quality/Greenhouse Gas Report
Big Rock Cluster Solar Project, Imperial County
OB-1 Air Analyses Revised March 2018 Page 48
Mitigation Measures.
Therefore, all individual projects will adopt all standard mitigations and all feasible
discretionary mitigation measures for construction activities. Full compliance with ICAPCD’s
Regulation VIII Fugitive Dust Rules will also reduce fugitive dust emissions.
Although it is not Mitigation per CEQA standards, fugitive PM10 emissions will be reduced in
the mandatory compliance with Regulation VIII. The operator shall implement the following
Regulation VIII controls as listed in the CEQA Guidelines as standard mitigation measures:
• The operator shall insure that all disturbed areas, including bulk material storage which is
not being actively utilized, will be effectively stabilized and visible emissions will be
limited to no greater than 20% opacity for dust emissions by using water, chemical
stabilizers, dust suppressants, tarps, or other suitable material such as vegetative ground
cover.
• The operator shall insure that all on-site unpaved roads will be effectively stabilized and
visible emissions be limited to no greater than 20% opacity for dust emissions by paving,
chemical stabilizers, dust suppressants, and/or watering.
• The operator shall insure that all unpaved traffic areas with 75 or more average vehicle
trips per day will be effectively stabilized and visible emission be limited to no greater
than 20% opacity for dust emissions by paving, chemical stabilizers, dust suppressants,
and/or watering.
• The operator shall insure that all transport (import or export) of borrow material used as
cover material will be completely covered unless six inches of freeboard space from the
top of the container is maintained with no spillage and loss of borrow material. In
addition, the cargo compartment of all haul trucks is to be cleaned and/or washed at
delivery site after removal of bulk material.
• The operator shall insure that all track-out or carryout will be cleaned at the end of each
workday.
• The operator shall insure that all movement of borrow material handling or transfer shall
be stabilized prior to handling or at points of transfer with application of sufficient water,
chemical stabilizers, or by sheltering or enclosing the operation and transfer line.
In addition to Regulation VIII controls that relate to fugitive dust, the Project will implement the
following mitigation:
MM-1 The operator shall water exposed soil with adequate frequency for continued moist soil and
limit vehicle speed for all construction vehicles to less than 15 mph on any unpaved surface
at the site.
Project Specific Estimates
Emissions presented below represent the estimated emissions associated with construction activity,

Air Quality/Greenhouse Gas Report
Big Rock Cluster Solar Project, Imperial County
OB-1 Air Analyses Revised March 2018 Page 49
which exhibit the “regulated” emissions resulting from compliance with ICAPCD Regulation VIII
and emissions from construction activity, which are “mitigated” pursuant to Mitigation Measures,
listed above.
Applying controls obtained from Regulation VIII compliance and implementation of MM-1, the
mitigated emissions are presented in for BR-1 in Table 16, for L-1 in Table 17, for L-2 in Table 18,
and for L-3 in Table 19.
Table 16 – Mitigated Construction Emissions for Big Rock 1 Solar Farm
Month/Activity Mitigated Emissions (lbs/day)
ROG CO NOX PM10 PM2.5
1st Month – Phase 1 1.2 10.7 13.6 14.0 1.9
2nd Month – Phases 1 & 2 3.2 28.1 34.5 36.5 5.1
3rd Month – Phases 2 & 3 5.2 62.3 48.9 88.9 11.7
4th Month – Phase 3 3.3 44.9 28.0 66.5 8.5
5th Month – Phase 3 3.3 44.9 28.0 66.5 8.5
6th Month – Phase 4 0.1 1.7 0.3 5.4 0.6
Big Rock 1 Maximum Daily 5.2 62.3 48.9 88.9 11.7
ICAPCD Threshold 75 550 100 150 N/A
Exceed Thresholds? No No No Yes
Table 17 – Mitigated Construction Emissions for Laurel 1 Solar Farm
Month/Activity Mitigated Emissions (lbs/day)
ROG CO NOX PM10 PM2.5
1st Month – Phase 1 1.2 10.7 13.6 14.0 1.9
2nd Month – Phase 2 2.0 17.4 20.9 22.5 3.1
3rd Month – Phases 2 & 3 5.2 62.3 48.9 88.9 11.7
4th Month – Phase 3 3.3 44.9 28.0 66.5 8.5
5th Month – Phases 3 & 4 3.3 46.6 28.3 71.9 9.1
Laurel 1 Maximum Daily 5.2 62.3 48.9 88.9 11.7
ICAPCD Threshold 75 550 100 150 N/A
Exceed Thresholds? No No No Yes

Air Quality/Greenhouse Gas Report
Big Rock Cluster Solar Project, Imperial County
OB-1 Air Analyses Revised March 2018 Page 50
Table 18 – Mitigated Construction Emissions for Laurel 2 Solar Farm
Month/Activity Mitigated Emissions (lbs/day)
ROG CO NOX PM10 PM2.5
1st Month – Phase 1 1.2 10.7 13.6 14.0 1.9
2nd Month – Phase 1 1.2 10.7 13.6 14.0 1.9
3rd Month – Phase 2 2.0 17.4 20.9 22.5 3.1
4th Month – Phase 2 2.0 17.4 20.9 22.5 3.1
5th Month – Phase 3 3.3 44.9 28.0 66.5 8.5
6th Month – Phase 3 3.3 44.9 28.0 66.5 8.5
7th Month – Phase 3 3.3 44.9 28.0 66.5 8.5
8th Month – Phases 3 & 4 3.3 46.6 28.3 71.9 9.1
Laurel 2 Maximum Daily 3.3 46.6 28.3 71.9 9.1
ICAPCD Threshold 75 550 100 150 N/A
Exceed Thresholds? No No No Yes
Table 19 – Mitigated Construction Emissions for Laurel 3 Solar Farm
Month/Activity Mitigated Emissions (lbs/day)
ROG CO NOX PM10 PM2.5
1st Month – Phases 1 & 2 3.2 28.1 34.5 36.5 5.1
2nd Month – Phases 1 & 2 2.0 17.4 20.9 36.5 5.1
3rd Month – Phase 2 2.0 17.4 20.9 22.5 3.1
4th Month – Phase 3 3.3 44.9 28.0 66.5 8.5
5th Month – Phase 3 3.3 44.9 28.0 66.5 8.5
6th Month – Phase 3 3.3 44.9 28.0 66.5 8.5
7th Month – Phase 3 3.3 44.9 28.0 66.5 8.5
8th Month – Phases 3 & 4 3.3 46.6 28.3 71.9 9.1
9th Month – Phases 3 & 4 3.3 46.6 28.3 71.9 9.1
Laurel 3 Maximum Daily 3.3 46.6 34.5 71.9 9.1
ICAPCD Threshold 75 550 100 150 N/A
Exceed Thresholds? No No No Yes
Project
Table 20 shows the regulated and mitigated emissions from construction all four sites within a 15-
month period, i.e. the Project, by applying the mitigated emissions for each individual solar site to
the Phase Activity Distributions.

Air Quality/Greenhouse Gas Report
Big Rock Cluster Solar Project, Imperial County
OB-1 Air Analyses Revised March 2018 Page 51
Table 20 – Mitigated Criteria Temporal Summary for Project
Month
# Solar Farm
Mitigated Emissions (lbs/day)
ROG CO NOX PM10 PM2.5
1 Big Rock 1 1.17 10.71 13.57 14.04 1.94
Month 1 Totals 1.2 10.7 13.6 14.0 1.9
2 Big Rock 1 6.42 72.98 62.44 102.97 13.61
Month 2 Totals 6.4 73.0 62.4 103.0 13.6
3 Big Rock 1 5.25 62.26 48.87 88.93 11.67
Month 3 Totals 5.2 62.3 48.9 88.9 11.7
4
Big Rock 1 3.25 44.85 27.97 66.47 8.55
Laurel 1 3.16 28.12 37.47 36.51 5.06
Month 4 Totals 6.4 73.0 62.4 103.0 13.6
5
Big Rock 1 3.25 44.85 27.97 66.47 8.55
Laurel 1 1.99 17.41 20.90 22.47 3.12
Laurel 2 1.17 10.71 13.57 14.04 1.94
Month 5 Totals 6.4 73.0 62.4 103.0 13.6
6
Big Rock 1 0.06 1.73 0.33 5.42 0.60
Laurel 1 3.25 44.85 27.97 66.47 8.55
Laurel 2 1.17 10.71 13.57 14.04 1.94
Month 6 Totals 4.5 57.3 41.9 85.9 11.1
7
Laurel 1 3.25 44.85 27.97 66.47 8.55
Laurel 2 1.99 17.41 20.90 22.47 3.12
Laurel 3 3.16 28.12 34.47 36.51 5.06
Month 7 Totals 8.4 90.4 83.3 125.4 16.7
8
Laurel 1 3.25 44.85 27.97 66.47 8.55
Laurel 2 1.99 17.41 20.90 22.47 3.12
Laurel 3 3.16 28.12 34.47 36.51 5.06
Month 8 Totals 8.4 90.4 83.3 125.4 16.7
9
Laurel 1 0.06 1.73 0.33 5.42 0.60
Laurel 2 3.25 44.85 27.97 66.47 8.55
Laurel 3 1.99 17.41 20.90 22.47 3.12
Month 9 Totals 5.3 64.0 49.2 94.4 12.3
10
Laurel 2 3.25 44.85 27.97 66.47 8.55
Laurel 3 3.25 44.85 27.97 66.47 8.55
Month 10 Totals 6.5 89.7 55.9 132.9 17.1

Air Quality/Greenhouse Gas Report
Big Rock Cluster Solar Project, Imperial County
OB-1 Air Analyses Revised March 2018 Page 52
Month
# Solar Farm
Mitigated Emissions (lbs/day)
ROG CO NOX PM10 PM2.5
11
Laurel 2 3.25 44.85 27.97 66.47 8.55
Laurel 3 3.25 44.85 27.97 66.47 8.55
Month 11 Totals 6.5 89.7 55.9 132.9 17.1
12
Laurel 2 3.31 46.58 28.30 71.89 9.15
Laurel 3 3.25 44.85 27.97 66.47 8.55
Month 12 Totals 6.6 91.4 56.3 138.4 17.7
13 Laurel 3 3.25 44.85 27.97 66.47 8.55
Month 13 Totals 3.3 44.9 28.0 66.5 8.5
14 Laurel 3 3.31 46.58 28.30 71.89 9.15
Month 14 Totals 3.3 46.6 28.3 71.9 9.1
15 Laurel 3 3.31 46.58 28.30 71.89 9.15
Month 15 Totals 3.3 46.6 28.3 71.9 9.1
Project Maximum Daily 8.4 91.4 83.3 138.4 17.7
ICAPCD Threshold 75 550 100 150 N/A
Exceed Thresholds? No No No No
Level of Significance After Mitigation: Less than significant for each individual solar site and for the
Project.
IMPACT 4: Would the Project result in operational-related air quality impacts?
These facilities would operate seven days a week, 24 hours a day, generating electricity during
normal daylight hours when the solar energy is available. Maintenance activities may occur seven
days a week, 24 hours a day to ensure PV Panel output when solar energy is available. Additionally,
the surface of the PV panels would be washed seasonally to increase the average optical
transmittance of the flat panel surface. Since the TIA estimates that the entire IRIS Solar Cluster
would require 40 vehicle trips per day during operations, the total trips were distributed between the
four sites. These vehicle trips would be off-site trips consisting mostly worker commute, with the
occasional general service, electrical service, and equipment/delivery vehicles. In addition, there
would be some activity from vehicles onsite including pickup trucks, water trucks, and utility/service
vehicles. Table 21 summarizes each site’s total project-related annual operational air emissions. The
ICAPCD thresholds of significance are also included in this table as well as information regarding
whether annual operational emissions would exceed those thresholds. As shown in Table 21,
operational emissions would be well below ICAPCD Tier 1 Regional thresholds. Detailed emissions
calculations are included in Appendix A.

Air Quality/Greenhouse Gas Report
Big Rock Cluster Solar Project, Imperial County
OB-1 Air Analyses Revised March 2018 Page 53
Table 21 – Estimated Operational Criteria Emissions
Solar
Farm Activity Type
Criteria Emissions (lbs/d)
ROG CO NOX PM10 PM2.5
BR-1
Onsite Activity 0.001 0.038 0.004 0.001 0.000
Offsite Activity 0.014 0.687 0.066 0.017 0.007
Big Rock 1 Solar Farm Total 0.02 0.73 0.07 0.02 0.01
L-1
Onsite Activity 0.001 0.038 0.004 0.001 0.000
Offsite Activity 0.014 0.687 0.066 0.017 0.007
Laurel 1 Solar Farm Total 0.02 0.73 0.07 0.02 0.01
L-2
Onsite Activity 0.001 0.038 0.004 0.001 0.000
Offsite Activity 0.014 0.687 0.066 0.017 0.007
Laurel 2 Solar Farm Total 0.02 0.73 0.07 0.02 0.01
L-3
Onsite Activity 0.001 0.038 0.004 0.001 0.000
Offsite Activity 0.014 0.687 0.066 0.017 0.007
Laurel 3 Solar Farm Total 0.02 0.73 0.07 0.02 0.01
Maximum Daily for Big Rock Cluster 0.1 2.9 0.3 0.1 0.0
ICAPCD Regional Thresholds 137 550 137 150 550
Exceed Thresholds? No No No No No
Level of Significance Before Mitigation: The Project’s operational emissions would not create
a significant quantity of criteria emissions, therefore would result in a less than significant
impact.
Mitigation Measures: No mitigation measures are necessary.
Level of Significance After Mitigation: Impacts would be less than significant.
IMPACT 5: Would the Project result in a cumulatively considerable net increase of any criteria pollutant for which the project region is nonattainment under an applicable federal or state ambient air quality standard (including releasing emissions which exceed quantitative thresholds for ozone precursors)?
In accordance with CEQA Guidelines 15130(b), this analysis of cumulative impacts incorporates a
summary of projections. The following three-tiered approach is to assess cumulative air quality
impacts.

Air Quality/Greenhouse Gas Report
Big Rock Cluster Solar Project, Imperial County
OB-1 Air Analyses Revised March 2018 Page 54
▪ Consistency with the ICAPCD project specific thresholds for construction and operation;
▪ Project consistency with existing air quality plans; and
▪ Assessment of the cumulative health effects of the pollutants.
Project Specific Thresholds
As established previously in Impact 2, during construction, after implementation of mitigation
measures, emissions of NOX and PM10 are not expected to exceed the ICAPCD regional significance
thresholds. It is assumed that construction emissions that do not exceed the project specific thresholds
will not result in a cumulative impact.
Air Quality Plans
The area in which the Project is located, is in nonattainment for ozone and PM10. As such, the
ICAPCD is required to prepare and maintain an AQMP to document the strategies and measures to be
undertaken to reach attainment of ambient air quality standards. While the ICAPCD does not have
direct authority over land use decisions, it was recognized that changes in land use and circulation
planning were necessary to maintain clean air. As discussed above in Impact 1, the Project is
compliant with the AQMP and would not result in a significant impact.
Cumulative Health Impacts
The area is in nonattainment for ozone and PM10, which means that the background levels of those
pollutants are at times higher than the ambient air quality standards. The air quality standards were set
to protect the health of sensitive individuals (i.e., elderly, children, and the sick). Therefore, when the
concentration of those pollutants exceeds the standard, it is likely that some of the sensitive
individuals of the population experience adverse health effects.
The localized significance analysis in Impact 2 demonstrated that during construction activities, no
localized significance threshold was expected to be exceeded; therefore, the emissions of particulate
matter and NOX would not result in a significant cumulative health impact.
Level of Significance before Mitigation: The Project would not result in cumulatively
considerable net increase of a precursor to a criteria pollutant for which the region is in
nonattainment under an applicable federal or State ambient air quality standard.
Mitigation Measures: No mitigation measures are necessary.
Level of Significance After Mitigation: Impacts would be less than significant.
IMPACT 6: Would the Project expose sensitive receptors to substantial pollutant concentrations?
Sensitive receptors are defined as land uses where sensitive population groups are likely to be
located (e.g., children, the elderly, the acutely ill, and the chronically ill). These land uses include
residences, schools, childcare centers, retirement homes, convalescent homes, medical care
facilities, and recreational facilities. Sensitive receptors that may be adversely affected by the
Project include the surrounding residential land uses.

Air Quality/Greenhouse Gas Report
Big Rock Cluster Solar Project, Imperial County
OB-1 Air Analyses Revised March 2018 Page 55
Impacts to sensitive receptors, particularly from dust, would vary depending on the level and type of
activity, the silt content of the soil, and prevailing weather. As mentioned above, the project vicinity
consists predominantly of agricultural and undeveloped land with an occasional rural residence.
Even though the Project has a few residential (rural-very low density) adjacent to the solar site’s
boundaries, the physical proximity to the construction activity is not adjacent. It is important to note
that distances to potential receptors are measured from the exterior boundary of the project and not
from the individual construction project areas within the interior of the site. The Project’s
compliance with Regulation VIII will prevent the residences exposure to substantial pollutant
concentrations.
Another way a project can establish significance with this impact is the potential to create a CO
hotspot. CO hotspots can occur when vehicles are idling at highly congested intersections.
According to the Traffic Impact Analysis (TIA)45, the Project would not create an increase in
congestion of the magnitude required to generate a CO hotspot.
During construction activities, diesel equipment will be operating and DPM is known to the State of
California as a TAC. However, the risks associated with exposure to substances with carcinogenic
effects are typically evaluated based on a lifetime of chronic exposure, which is defined as 24 hours
per day, 7 days per week, 365 days per year, for 70 years. However, the short-term nature of project
construction would support that exposure to diesel exhaust emissions during construction would not
be significant.
Level of Significance Before Mitigation: The Project would not expose the public to
substantial pollutant concentrations.
Mitigation Measures: No mitigation measures are necessary.
Level of Significance After Mitigation: Impacts would be less than significant.
IMPACT 7: Would the Project create objectionable odors affecting a substantial number of people?
The CEQA Guidelines indicate that a significant impact would occur if a project would create
objectionable odors affecting a substantial number of people. While offensive odors rarely cause any
physical harm, they can be very unpleasant, leading to considerable distress among the public and
often generating citizen complaints to local governments and the ICAPCD. Because offensive odors
rarely cause any physical harm and no requirements for their control are included in State or federal
air quality regulations, the ICAPCD has no rules or standards related to odor emissions, other than its
nuisance rule.
The construction and operation of a solar farm is not an odor producer nor located near an odor
producer; therefore, the Project would not result in a significant odor impact.
45 Traffic Impact Analysis. Big Rock Cluster Solar Farm. Linscott, Law & Greenspan. September 18, 2017.

Air Quality/Greenhouse Gas Report
Big Rock Cluster Solar Project, Imperial County
OB-1 Air Analyses Revised March 2018 Page 56
Level of Significance Before Mitigation: The Project would not create objectionable odors
affecting a substantial number of people.
Mitigation Measures: No mitigation measures are necessary.
Level of Significance After Mitigation: Impacts would be less than significant.
IMPACT 8: Would the Project generate GHG emissions, either directly or indirectly, that may have a significant impact on the environment?
Construction and operation of the Project would result in a relatively small amount of GHG
emissions. The project would generate GHG emissions during construction and routine operational
activities at the sites. During construction, GHG emissions would be generated from operation of
both on-road and off-road equipment. Once operational, emissions associated with the Project would
be limited to vehicle trips associated with routine maintenance and monitoring activities at each of
the sites.
Solar projects are an integral part of CARB’s emission reduction strategy presented in the Scoping
Plans. The 2008 Scoping Plan46 specifically addresses critical complementary measures directed at
emission sources that are included in the cap-and-trade program that are designed to achieve cost-
effective emissions reductions while accelerating the necessary transition to the low-carbon
economy. One of these measures was the RPS, which was to promote multiple objectives, including
diversifying the electricity supply by accelerating the transformation of the Electricity sector,
including investment in the transmission infrastructure and system changes to allow integration of
massive quantities of intermittent wind and solar generation. Therefore, this project complies with an
approved GHG emission reduction plan and is presumed to have less-than-significant GHG impacts.
Using the methods developed by the SCAQMD when comparing to their adopted GHG thresholds,
GHGs are quantified as the sum of annual operational GHG emissions and total construction GHG
emissions amortized over 30 years. Table 22 shows that the amortized construction plus annual
operation for the Project would be 124 tCO2e per year.
In addition, the Project would be a renewable source of energy that could displace electricity
generated by fossil fuel combustion and provide low-GHG electricity to consumers. Of the potential
fossil fuels typically used for power generation, natural gas is one of the cleanest. To provide a
conservative estimate, this AQR estimated emissions that would be generated from an equivalent
amount of energy by natural gas generators to estimate the reduction in GHG emissions by electricity
displacement by assuming that the solar power displaces electricity generated by dispatchable
natural-gas fired combined-cycle power plants and that the Project has a capacity factor of 26
percent. Natural gas energy requirements for generation by combined-cycle power plants and
emission factors from The Climate Registry were used to estimate the displaced emissions. This
AQR estimated the 325 MW-AC generated by the Project would displace 212,913 tCO2e per year.
46 Climate Change Scoping Plan: a framework for change. California Air Resources Board. December 2008.

Air Quality/Greenhouse Gas Report
Big Rock Cluster Solar Project, Imperial County
OB-1 Air Analyses Revised March 2018 Page 57
Detailed calculations are presented in Appendix A.
Table 22 – Project GHG Emissions
Phase Source tCO2e per Year
Co
nst
ruct
ion
Big Rock 1 (BR-1) 370
Laurel 1 (L-1) 213
Laurel 2 (L-2) 372
Laurel 3 (L-3) 590
Project Construction Total 1,545
Amortized over 30 years 51
Op
erat
ion
Big Rock 1 (BR-1) 18.2
Laurel 1 (L-1) 18.2
Laurel 2 (L-2) 18.2
Laurel 3 (L-3) 18.2
Project Operational Total 73
Total Annual Emissions 124
Annually Displaced Emissions (212,913)
Net Project GHG Emissions (213,788)
Level of Significance Before Mitigation: The Project would not generate GHG emissions,
either directly or indirectly, that may have a significant impact on the environment.
Mitigation Measures: No mitigation measures are necessary.
Level of Significance After Mitigation: Impacts would be less than significant.
IMPACT 9: Would the Project conflict with an applicable plan, policy, or regulation adopted for the purpose of reducing the emissions of GHGs?
One of the critical complementary measures directed at emission sources that are included in the cap-
and-trade program is the RPS, which places an obligation on electricity supply companies to produce
33 percent of their electricity from renewable energy sources by 2020. A key prerequisite to reaching
the target would be to provide sufficient electric transmission lines to renewable resource zones and
system changes to allow integration of massive quantities of intermittent wind and solar generation.
The Project would help the State meet this goal by generating up to 325 MW-AC of power to
California’s current renewable portfolio. Therefore, in this regard, the Project would help the state
meet its goals under AB 32.
Neither the County of Imperial or ICAPCD have any specific plans, policies, nor regulations adopted
for reducing the emissions of GHGs. However, since the long-term, operational GHG emissions are
minimal and the construction emissions are short-term, the Project would not conflict with any
applicable plan, policy, or regulation adopted for reducing the emissions of GHGs.
Air Quality/Greenhouse Gas Report
Big Rock Cluster Solar Project, Imperial County
OB-1 Air Analyses Revised March 2018 Page 58
Level of Significance Before Mitigation: The Project would not conflict with an applicable
plan, policy, or regulation adopted for reducing the emissions of GHGs.
Mitigation Measures: No mitigation measures are necessary.
Level of Significance After Mitigation: Impacts would be less than significant.
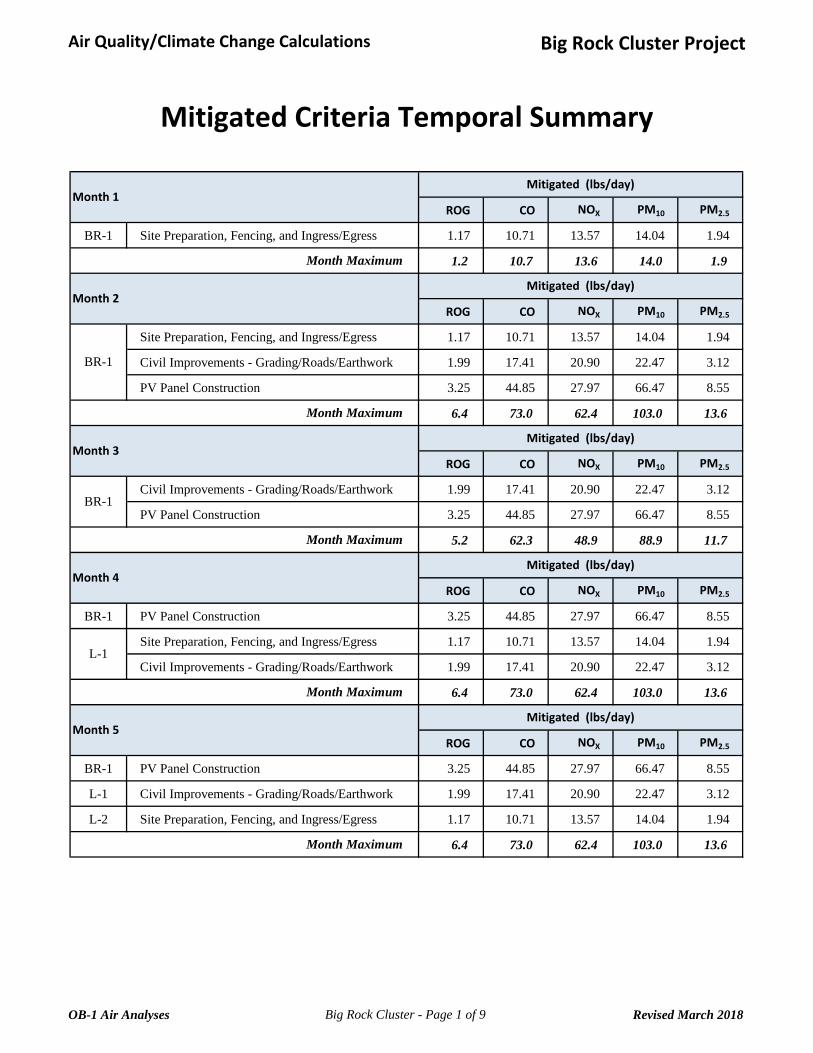
Air Quality/Climate Change Calculations Big Rock Cluster Project
ROG CO NOX PM10 PM2.5
BR-1 Site Preparation, Fencing, and Ingress/Egress 1.17 10.71 13.57 14.04 1.94
1.2 10.7 13.6 14.0 1.9
ROG CO NOX PM10 PM2.5
Site Preparation, Fencing, and Ingress/Egress 1.17 10.71 13.57 14.04 1.94
Civil Improvements - Grading/Roads/Earthwork 1.99 17.41 20.90 22.47 3.12
PV Panel Construction 3.25 44.85 27.97 66.47 8.55
6.4 73.0 62.4 103.0 13.6
ROG CO NOX PM10 PM2.5
Civil Improvements - Grading/Roads/Earthwork 1.99 17.41 20.90 22.47 3.12
PV Panel Construction 3.25 44.85 27.97 66.47 8.55
5.2 62.3 48.9 88.9 11.7
ROG CO NOX PM10 PM2.5
BR-1 PV Panel Construction 3.25 44.85 27.97 66.47 8.55
Site Preparation, Fencing, and Ingress/Egress 1.17 10.71 13.57 14.04 1.94
Civil Improvements - Grading/Roads/Earthwork 1.99 17.41 20.90 22.47 3.12
6.4 73.0 62.4 103.0 13.6
ROG CO NOX PM10 PM2.5
BR-1 PV Panel Construction 3.25 44.85 27.97 66.47 8.55
L-1 Civil Improvements - Grading/Roads/Earthwork 1.99 17.41 20.90 22.47 3.12
L-2 Site Preparation, Fencing, and Ingress/Egress 1.17 10.71 13.57 14.04 1.94
6.4 73.0 62.4 103.0 13.6
Month Maximum
Month 2Mitigated (lbs/day)
BR-1
Month Maximum
Month 3
L-1
Month Maximum
Month Maximum
Month 5Mitigated (lbs/day)
Mitigated Criteria Temporal Summary
Month 1 Mitigated (lbs/day)
Month Maximum
Month 4Mitigated (lbs/day)
Mitigated (lbs/day)
BR-1
OB-1 Air Analyses Big Rock Cluster - Page 1 of 9 Revised March 2018
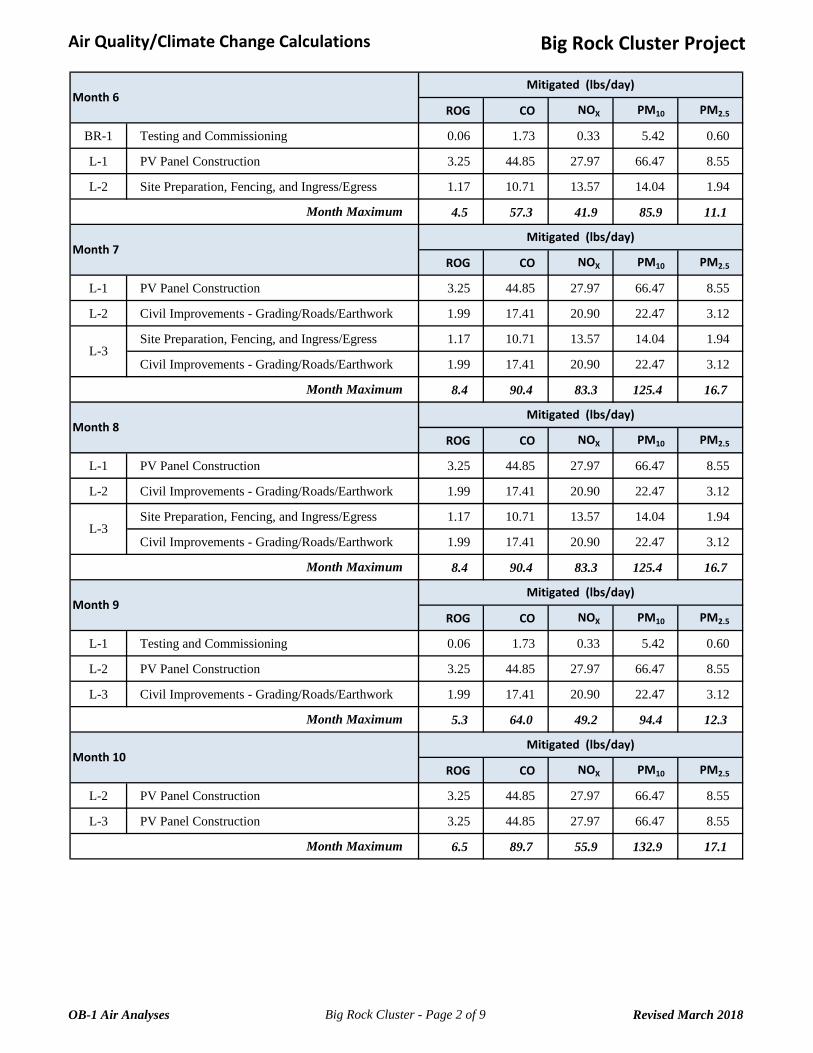
Air Quality/Climate Change Calculations Big Rock Cluster Project
ROG CO NOX PM10 PM2.5
BR-1 Testing and Commissioning 0.06 1.73 0.33 5.42 0.60
L-1 PV Panel Construction 3.25 44.85 27.97 66.47 8.55
L-2 Site Preparation, Fencing, and Ingress/Egress 1.17 10.71 13.57 14.04 1.94
4.5 57.3 41.9 85.9 11.1
ROG CO NOX PM10 PM2.5
L-1 PV Panel Construction 3.25 44.85 27.97 66.47 8.55
L-2 Civil Improvements - Grading/Roads/Earthwork 1.99 17.41 20.90 22.47 3.12
Site Preparation, Fencing, and Ingress/Egress 1.17 10.71 13.57 14.04 1.94
Civil Improvements - Grading/Roads/Earthwork 1.99 17.41 20.90 22.47 3.12
8.4 90.4 83.3 125.4 16.7
ROG CO NOX PM10 PM2.5
L-1 Testing and Commissioning 0.06 1.73 0.33 5.42 0.60
L-2 PV Panel Construction 3.25 44.85 27.97 66.47 8.55
L-3 Civil Improvements - Grading/Roads/Earthwork 1.99 17.41 20.90 22.47 3.12
5.3 64.0 49.2 94.4 12.3
ROG CO NOX PM10 PM2.5
L-2 PV Panel Construction 3.25 44.85 27.97 66.47 8.55
L-3 PV Panel Construction 3.25 44.85 27.97 66.47 8.55
6.5 89.7 55.9 132.9 17.1
Month Maximum
Month 10Mitigated (lbs/day)
Month Maximum
Month Maximum
Month 9Mitigated (lbs/day)
L-3
Month Maximum
Month 8Mitigated (lbs/day)
L-3
Month 7Mitigated (lbs/day)
Month 6Mitigated (lbs/day)
Month Maximum
OB-1 Air Analyses Big Rock Cluster - Page 2 of 9 Revised March 2018

Air Quality/Climate Change Calculations Big Rock Cluster Project
ROG CO NOX PM10 PM2.5
L-2 PV Panel Construction 3.25 44.85 27.97 66.47 8.55
L-3 PV Panel Construction 3.25 44.85 27.97 66.47 8.55
6.5 89.7 55.9 132.9 17.1
ROG CO NOX PM10 PM2.5
PV Panel Construction 3.25 44.85 27.97 66.47 8.55
Testing and Commissioning 0.06 1.73 0.33 5.42 0.60
L-3 PV Panel Construction 3.25 44.85 27.97 66.47 8.55
6.6 91.4 56.3 138.4 17.7
ROG CO NOX PM10 PM2.5
L-3 PV Panel Construction 3.25 44.85 27.97 66.47 8.55
3.3 44.9 28.0 66.5 8.5
ROG CO NOX PM10 PM2.5
PV Panel Construction 3.25 44.85 27.97 66.47 8.55
Testing and Commissioning 0.06 1.73 0.33 5.42 0.60
3.3 46.6 28.3 71.9 9.1
ROG CO NOX PM10 PM2.5
PV Panel Construction 3.25 44.85 27.97 66.47 8.55
Testing and Commissioning 0.06 1.73 0.33 5.42 0.60
3.3 46.6 28.3 71.9 9.1
8.4 91.4 83.3 138.4 17.7
75 550 100 150
N N N N
Month Maximum
Month 12Mitigated (lbs/day)
L-2
Month Maximum
Month 13Mitigated (lbs/day)
Month Maximum
Month 15Mitigated (lbs/day)
L-3
Month Maximum
Exceeds?
Big Rock Cluster Project Maximun Pounds per Day
ICAPCD Thresholds
Month Maximum
Month 14Mitigated (lbs/day)
L-3
Month 11Mitigated (lbs/day)
N/A
OB-1 Air Analyses Big Rock Cluster - Page 3 of 9 Revised March 2018

Air Quality/Climate Change Calculations Big Rock Cluster Project
ROG CO NOX PM10 PM2.5
BR-1 Site Preparation, Fencing, and Ingress/Egress 1.17 10.71 13.57 31.88 3.86
1.2 10.7 13.6 31.9 3.9
ROG CO NOX PM10 PM2.5
Site Preparation, Fencing, and Ingress/Egress 1.17 10.71 13.57 31.88 3.86
Civil Improvements - Grading/Roads/Earthwork 1.99 17.41 20.90 51.01 6.20
PV Panel Construction 3.25 44.85 27.97 152.09 17.79
6.4 73.0 62.4 235.0 27.9
ROG CO NOX PM10 PM2.5
Civil Improvements - Grading/Roads/Earthwork 1.99 17.41 20.90 51.01 6.20
PV Panel Construction 3.25 44.85 27.97 152.09 17.79
5.2 62.3 48.9 203.1 24.0
ROG CO NOX PM10 PM2.5
BR-1 PV Panel Construction 3.25 44.85 27.97 152.09 17.79
Site Preparation, Fencing, and Ingress/Egress 1.17 10.71 13.57 31.88 3.86
Civil Improvements - Grading/Roads/Earthwork 1.99 17.41 20.90 51.01 6.20
6.4 73.0 62.4 235.0 27.9
ROG CO NOX PM10 PM2.5
BR-1 PV Panel Construction 3.25 44.85 27.97 152.09 17.79
L-1 Civil Improvements - Grading/Roads/Earthwork 1.99 17.41 20.90 51.01 6.20
L-2 Site Preparation, Fencing, and Ingress/Egress 1.17 10.71 13.57 31.88 3.86
6.4 73.0 62.4 235.0 27.9
Unmitigated Criteria Temporal Summary
Month Maximum
Month Maximum
Unmitigated (lbs/day)
Unmitigated (lbs/day)Month 2
Month 1
BR-1
Month Maximum
Month 4
Month Maximum
Month 5
Unmitigated (lbs/day)
Unmitigated (lbs/day)
Unmitigated (lbs/day)
Month 3
BR-1
L-1
Month Maximum
OB-1 Air Analyses Big Rock Cluster - Page 4 of 9 Revised March 2018

Air Quality/Climate Change Calculations Big Rock Cluster Project
ROG CO NOX PM10 PM2.5
BR-1 Testing and Commissioning 0.06 1.73 0.33 12.56 1.37
L-1 PV Panel Construction 3.25 44.85 27.97 152.09 17.79
L-2 Site Preparation, Fencing, and Ingress/Egress 1.17 10.71 13.57 31.88 3.86
4.5 57.3 41.9 196.5 23.0
ROG CO NOX PM10 PM2.5
L-1 PV Panel Construction 3.25 44.85 27.97 152.09 17.79
L-2 Civil Improvements - Grading/Roads/Earthwork 1.99 17.41 20.90 51.01 6.20
Site Preparation, Fencing, and Ingress/Egress 1.17 10.71 13.57 31.88 3.86
Civil Improvements - Grading/Roads/Earthwork 1.99 17.41 20.90 51.01 6.20
8.4 90.4 83.3 286.0 34.1
ROG CO NOX PM10 PM2.5
L-1 Testing and Commissioning 0.06 1.73 0.33 12.56 1.37
L-2 PV Panel Construction 3.25 44.85 27.97 152.09 17.79
L-3 Civil Improvements - Grading/Roads/Earthwork 1.99 17.41 20.90 51.01 6.20
5.3 64.0 49.2 215.7 25.4
ROG CO NOX PM10 PM2.5
L-2 PV Panel Construction 3.25 44.85 27.97 152.09 17.79
L-3 PV Panel Construction 3.25 44.85 27.97 152.09 17.79
6.5 89.7 55.9 304.2 35.6
L-3
Month 6
Month 10
Month Maximum
Month Maximum
Month 8
Month Maximum
L-3
Month Maximum
Unmitigated (lbs/day)
Unmitigated (lbs/day)
Unmitigated (lbs/day)
Month 7Unmitigated (lbs/day)
Month 9Unmitigated (lbs/day)
Month Maximum
OB-1 Air Analyses Big Rock Cluster - Page 5 of 9 Revised March 2018

Air Quality/Climate Change Calculations Big Rock Cluster Project
ROG CO NOX PM10 PM2.5
L-2 PV Panel Construction 3.25 44.85 27.97 152.09 17.79
L-3 PV Panel Construction 3.25 44.85 27.97 152.09 17.79
6.5 89.7 55.9 304.2 35.6
ROG CO NOX PM10 PM2.5
PV Panel Construction 3.25 44.85 27.97 152.09 17.79
Testing and Commissioning 0.06 1.73 0.33 12.56 1.37
L-3 PV Panel Construction 3.25 44.85 27.97 152.09 17.79
6.6 91.4 56.3 316.7 37.0
ROG CO NOX PM10 PM2.5
L-3 PV Panel Construction 3.25 44.85 27.97 152.09 17.79
3.3 44.9 28.0 152.1 17.8
ROG CO NOX PM10 PM2.5
PV Panel Construction 3.25 44.85 27.97 152.09 17.79
Testing and Commissioning 0.06 1.73 0.33 12.56 1.37
3.3 46.6 28.3 164.6 19.2
ROG CO NOX PM10 PM2.5
PV Panel Construction 3.25 44.85 27.97 152.09 17.79
Testing and Commissioning 0.06 1.73 0.33 12.56 1.37
3.3 46.6 28.3 164.6 19.2
8.4 91.4 83.3 316.7 37.0
75 550 100 150
N N N Y
L-3
Month Maximum
Month Maximum
Month 11
Month Maximum
L-2
Unmitigated (lbs/day)
Unmitigated (lbs/day)
N/A
Big Rock Cluster Project Maximun Pounds per Day
ICAPCD Thresholds
Exceeds?
Month 15Unmitigated (lbs/day)
Month 14Unmitigated (lbs/day)
L-3
Month Maximum
Month 13Unmitigated (lbs/day)
Month Maximum
Month 12
OB-1 Air Analyses Big Rock Cluster - Page 6 of 9 Revised March 2018

Air Quality/Climate Change Calculations Big Rock Cluster Project
CO2 CH4 N2O CO2e
Big Rock 1 322.8 0.066 0.015 329.0
Laurel 1 221.9 0.048 0.010 226.0
Laurel 2 143.8 0.040 0.005 146.3
Laurel 3 517.1 0.099 0.025 527.1
Big Rock Cluster Totals 1,206 0.25 0.05 1,228
41
CO2 CH4 N2O CO2e
Big Rock 1 17.5 0.002 0.002 18.2
Laurel 1 17.5 0.002 0.002 18.2
Laurel 2 17.5 0.002 0.002 18.2
Laurel 3 17.5 0.002 0.002 18.2
Big Rock Cluster Totals 70 0.01 0.01 73
114
212,913
-212,799
Solar Farm SiteGHG Emissions (tonnes per year)
Total Annualized Emissions
minus Displaced Emissions
Project Net Emissions
Operations
GHG Emissions Summary
Construction
Solar Farm SiteGHG Emissions (total tonnes)
Amortized over 30 years
OB-1 Air Analyses Big Rock Cluster - Page 7 of 9 Revised March 2018

Air Quality/Climate Change Calculations Big Rock Cluster Project
1 2 3 4 1 2 3 4 1 2 3 4 1 2 3 4
3
2
15 15 15 15
14 14 14 14
13 13 13 13
12 12 12 12
11 11 11 11
10 10 10 10
9 9 9 9
8 8 8 8
7 7 7 7
6 6 6 6
5 5 5 5
4 4 4 4
3 3 3
2
1 1 1 1
Mon
#
Phase #
2 2
Proposed Big Rock Cluster Schedule
Big Rock 1 Laurel 1 Laurel 2 Laurel 3Mon
#
Phase # Mon
#
Phase # Mon
#
Phase #
OB-1 Air Analyses Big Rock Cluster - Page 8 of 9 Revised March 2018
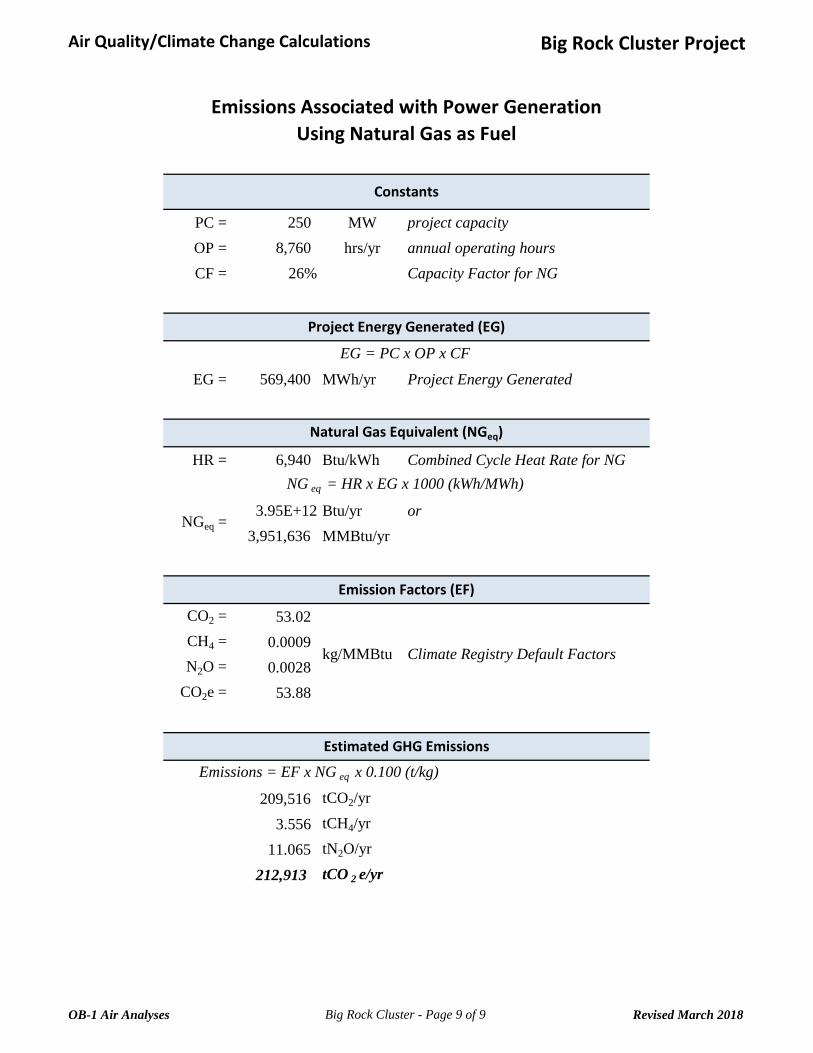
Air Quality/Climate Change Calculations Big Rock Cluster Project
PC = 250 MW project capacity
OP = 8,760 hrs/yr annual operating hours
CF = 26% Capacity Factor for NG
EG = 569,400 MWh/yr Project Energy Generated
HR = 6,940 Btu/kWh Combined Cycle Heat Rate for NG
3.95E+12 Btu/yr or
3,951,636 MMBtu/yr
CO2 = 53.02
CH4 = 0.0009
N2O = 0.0028
CO2e = 53.88
209,516 tCO2/yr
3.556 tCH4/yr
11.065 tN2O/yr
212,913 tCO 2 e/yr
Emissions = EF x NG eq x 0.100 (t/kg)
NG eq = HR x EG x 1000 (kWh/MWh)
NGeq =
Emission Factors (EF)
kg/MMBtu Climate Registry Default Factors
Estimated GHG Emissions
Emissions Associated with Power Generation
Using Natural Gas as Fuel
Constants
Project Energy Generated (EG)
EG = PC x OP x CF
Natural Gas Equivalent (NGeq)
OB-1 Air Analyses Big Rock Cluster - Page 9 of 9 Revised March 2018

Air Quality/Climate Change Calculations Big Rock 1 Solar Farm
ActivityWorkdays
per Year
Trips per
day
Round Trip
(mi)
VMT per
day
Anual VMT
(mi)
Pickup Trucks LDT2 244 0.50 10 5 1,220
Utility/Service Vehicles T6 244 0.17 10 2 415
Water Truck T7 244 0.25 10 3 610
Worker Commute * LDA+ 244 5.00 30 150 36,600
Carpenter Service Vehicle LHD1 244 0.25 30 8 1,830
Electrical Service Vehicle LHD1 244 0.25 30 8 1,830
Equipment/Material Delivery MDV 244 0.07 30 2 512
176 43,017
ROG CO NOX PM10 PM2.5
0.000 0.021 0.002 0.001 0.000
0.000 0.007 0.001 0.000 0.000
0.000 0.010 0.001 0.000 0.000
0.001 0.038 0.004 0.001 0.000
0.013 0.617 0.059 0.015 0.006
0.001 0.031 0.003 0.001 0.000
0.001 0.031 0.003 0.001 0.000
0.000 0.009 0.001 0.000 0.000
0.014 0.687 0.066 0.017 0.007
0.02 0.73 0.07 0.02 0.01
0.1 2.9 0.3 0.1 0.0
CO2 CH4 N2O CO2e
0.53 0.0000 0.0001 0.54
0.44 0.0003 0.0002 0.52
0.65 0.0004 0.0003 0.76
12.80 0.0011 0.0012 13.20
1.38 0.0001 0.0001 1.41
1.38 0.0001 0.0001 1.41
0.30 0.0000 0.0000 0.31
Totals
Operational Criteria Emissions
Activity Vehicle TypePounds per Day
Operational Emissions
Operational Vehicle Activity
Vehicle Type
On
-sit
eO
ff-s
ite
Totals
Operational GHG Emissions
Activity Vehicle TypeTotal Tonnes
Pickup Trucks
Utility/Service Vehicles
Off
-sit
eO
n-s
ite
Water Truck
Worker Commute
Carpenter Service Vehicle
Electrical Service Vehicle
Equipment/Material Delivery
On
-sit
eO
ff-s
ite
On-site Total
Off-site Total
Carpenter Service Vehicle
Electrical Service Vehicle
Equipment/Material Delivery
Pickup Trucks
Utility/Service Vehicles
Water Truck
Worker Commute
OB-1 Air Analyses BR-1 - Page 1 of 32 Revised March 2018

Air Quality/Climate Change Calculations Big Rock 1 Solar Farm
17.5 0.0018 0.0020 18.2
*
Totals
Worker commute trips per day was estimated based on 5 employees
OB-1 Air Analyses BR-1 - Page 2 of 32 Revised March 2018

Air Quality/Climate Change Calculations Big Rock 1 Solar Farm
CO2 CH4 N2O CO2e
Offroad 39.05 0.0122 N/A 39.36
Vendors 2.26 0.0012 0.0011 2.61
Employees 6.13 0.0005 0.0006 6.32
Phase 1 Total 47.4 0.014 0.002 48.3
Offroad 58.35 0.0182 N/A 58.81
Vendors 1.95 0.0008 0.0008 2.20
Employees 13.26 0.0011 0.0013 13.67
Phase 2 Total 73.6 0.020 0.002 74.7
Offroad 107.97 0.0217 N/A 108.51
Vendors 6.31 0.0030 0.0028 7.21
Employees 84.89 0.0070 0.0081 87.49
Phase 3 Total 199.2 0.032 0.011 203.2
Offroad 0.00 0.0000 N/A 0.00
Vendors 0.44 0.0003 0.0002 0.52
Employees 2.21 0.0002 0.0002 2.28
Phase 4 Total 2.7 0.000 0.000 2.8
322.8 0.066 0.015 329.0
11
18
63,906
-63,877
Construction Amortized over 30 Years
Annual Operational Emissions
Minus Annually Displaced Emissions
Net Project GHG Emissions
CategoryGHG Emissions (tonnes)
GHG Emissions Summary
Phase Activity
Grand Total for Construction
Phase 3 - PV Panel
Construction
Phase 4 - Testing and
Commissioning
Phase 2 - Civil Improvements -
Grading/Roads/Earthwork
Phase 1 - Site Preparation,
Fencing, and Ingress/Egress
OB-1 Air Analyses BR-1 - Page 3 of 32 Revised March 2018
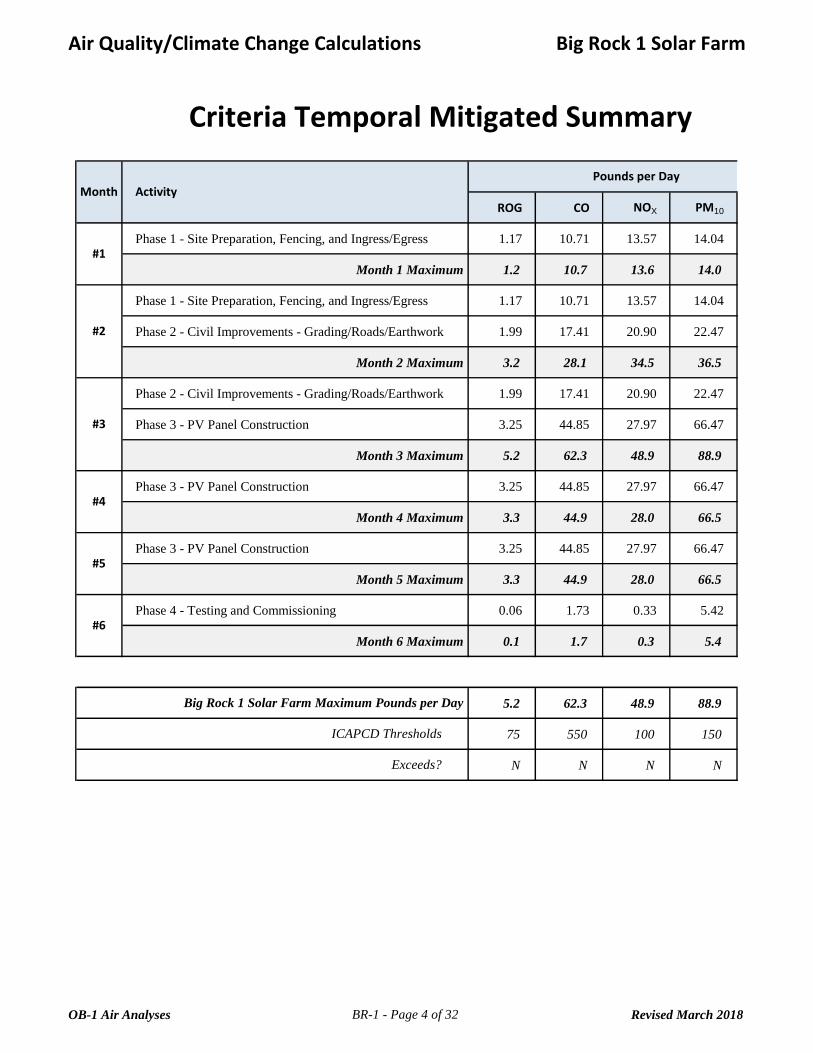
Air Quality/Climate Change Calculations Big Rock 1 Solar Farm
ROG CO NOX PM10
Phase 1 - Site Preparation, Fencing, and Ingress/Egress 1.17 10.71 13.57 14.04
Month 1 Maximum 1.2 10.7 13.6 14.0
Phase 1 - Site Preparation, Fencing, and Ingress/Egress 1.17 10.71 13.57 14.04
Phase 2 - Civil Improvements - Grading/Roads/Earthwork 1.99 17.41 20.90 22.47
Month 2 Maximum 3.2 28.1 34.5 36.5
Phase 2 - Civil Improvements - Grading/Roads/Earthwork 1.99 17.41 20.90 22.47
Phase 3 - PV Panel Construction 3.25 44.85 27.97 66.47
Month 3 Maximum 5.2 62.3 48.9 88.9
Phase 3 - PV Panel Construction 3.25 44.85 27.97 66.47
Month 4 Maximum 3.3 44.9 28.0 66.5
Phase 3 - PV Panel Construction 3.25 44.85 27.97 66.47
Month 5 Maximum 3.3 44.9 28.0 66.5
Phase 4 - Testing and Commissioning 0.06 1.73 0.33 5.42
Month 6 Maximum 0.1 1.7 0.3 5.4
5.2 62.3 48.9 88.9
75 550 100 150
N N N N
ICAPCD Thresholds
Exceeds?
#2
Criteria Temporal Mitigated Summary
Month ActivityPounds per Day
#1
#5
#6
#3
#4
Big Rock 1 Solar Farm Maximum Pounds per Day
OB-1 Air Analyses BR-1 - Page 4 of 32 Revised March 2018
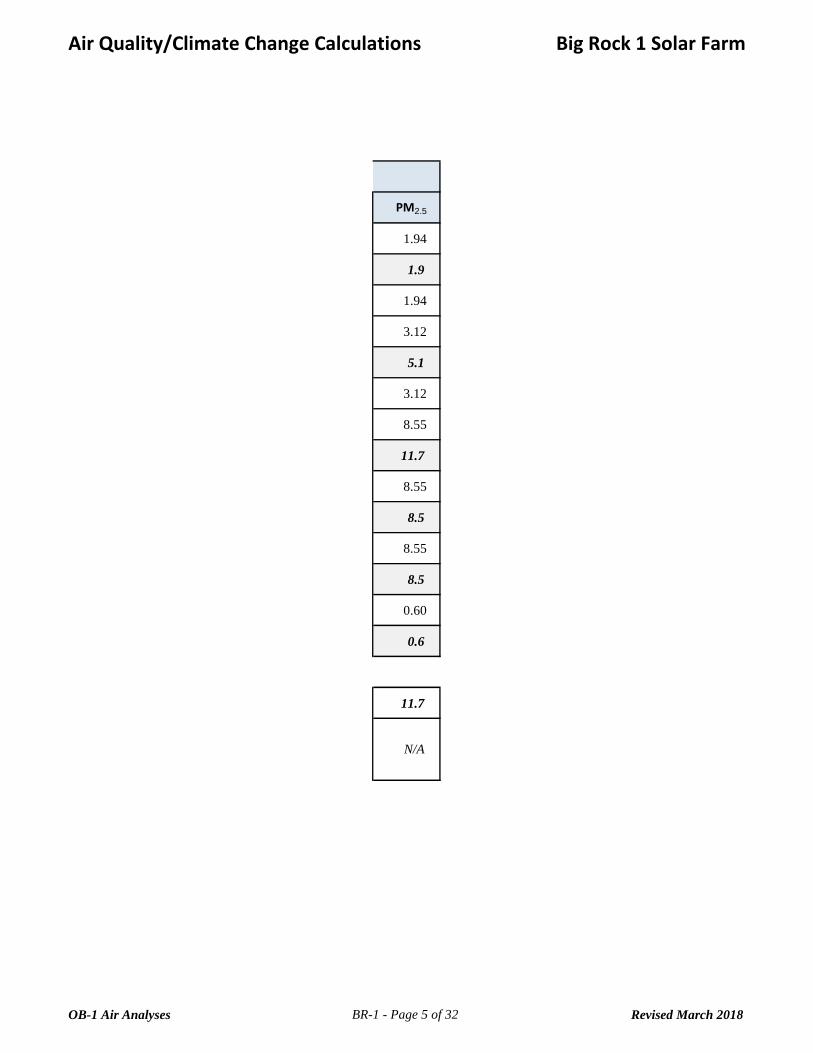
Air Quality/Climate Change Calculations Big Rock 1 Solar Farm
PM2.5
1.94
1.9
1.94
3.12
5.1
3.12
8.55
11.7
8.55
8.5
8.55
8.5
0.60
0.6
11.7
Criteria Temporal Mitigated Summary
Pounds per Day
N/A
OB-1 Air Analyses BR-1 - Page 5 of 32 Revised March 2018
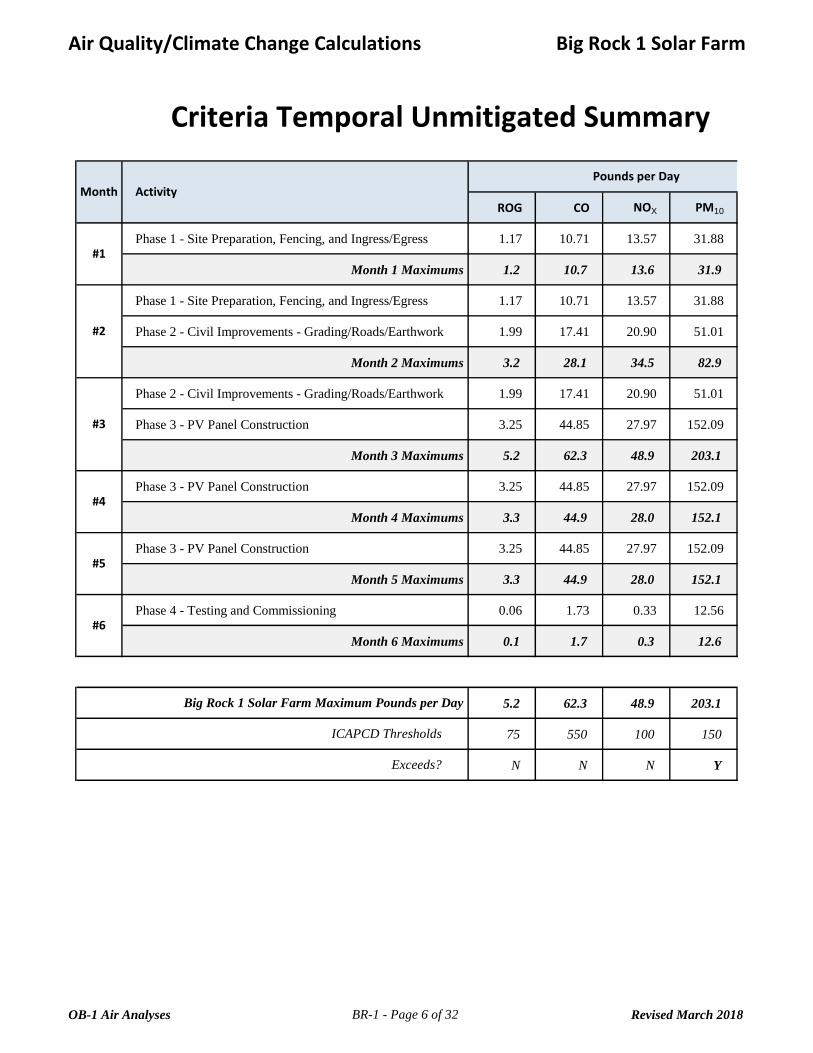
Air Quality/Climate Change Calculations Big Rock 1 Solar Farm
ROG CO NOX PM10
Phase 1 - Site Preparation, Fencing, and Ingress/Egress 1.17 10.71 13.57 31.88
Month 1 Maximums 1.2 10.7 13.6 31.9
Phase 1 - Site Preparation, Fencing, and Ingress/Egress 1.17 10.71 13.57 31.88
Phase 2 - Civil Improvements - Grading/Roads/Earthwork 1.99 17.41 20.90 51.01
Month 2 Maximums 3.2 28.1 34.5 82.9
Phase 2 - Civil Improvements - Grading/Roads/Earthwork 1.99 17.41 20.90 51.01
Phase 3 - PV Panel Construction 3.25 44.85 27.97 152.09
Month 3 Maximums 5.2 62.3 48.9 203.1
Phase 3 - PV Panel Construction 3.25 44.85 27.97 152.09
Month 4 Maximums 3.3 44.9 28.0 152.1
Phase 3 - PV Panel Construction 3.25 44.85 27.97 152.09
Month 5 Maximums 3.3 44.9 28.0 152.1
Phase 4 - Testing and Commissioning 0.06 1.73 0.33 12.56
Month 6 Maximums 0.1 1.7 0.3 12.6
5.2 62.3 48.9 203.1
75 550 100 150
N N N Y
Big Rock 1 Solar Farm Maximum Pounds per Day
ICAPCD Thresholds
Exceeds?
#5
#6
#4
ActivityPounds per Day
Criteria Temporal Unmitigated Summary
#2
Month
#3
#1
OB-1 Air Analyses BR-1 - Page 6 of 32 Revised March 2018

Air Quality/Climate Change Calculations Big Rock 1 Solar Farm
PM2.5
3.86
3.9
3.86
6.20
10.1
6.20
17.79
24.0
17.79
17.8
17.79
17.8
1.37
1.4
24.0
N/A
Pounds per Day
Criteria Temporal Unmitigated Summary
OB-1 Air Analyses BR-1 - Page 7 of 32 Revised March 2018

Air Quality/Climate Change Calculations Big Rock 1 Solar Farm
ROG CO NOX PM10 PM2.5
Off-road 1.02 6.21 12.52 0.46 0.43
Vendors 0.03 0.37 0.64 0.04 0.03
Employees 0.12 4.13 0.41 0.07 0.03
Road Dust -- -- -- 13.46 1.45
Phase 1 Activity Total 1.2 10.7 13.6 14.0 1.9
Off-road 1.78 10.66 19.81 0.80 0.74
Vendors 0.01 0.14 0.43 0.02 0.01
Employees 0.20 6.61 0.65 0.12 0.05
Road Dust -- -- -- 21.53 2.32
Grading Fugitive -- -- -- 1.91 0.21
Phase 2 Activity Total 2.0 17.4 20.9 22.5 3.1
Off-road 2.64 24.69 25.56 1.47 1.40
Vendors 0.03 0.34 0.46 0.04 0.03
Employees 0.59 19.83 1.96 0.36 0.15
Road Dust -- -- -- 64.59 6.97
Phase 3 Activity Total 3.3 44.9 28.0 66.5 8.5
Off-road N/A N/A N/A N/A N/A
Vendors 0.01 0.08 0.17 0.01 0.01
Employees 0.05 1.65 0.16 0.03 0.01
Road Dust -- -- -- 5.38 0.58
Phase 4 Activity Total 0.1 1.7 0.3 5.4 0.6
Phase 2 - Civil
Improvements -
Grading/Roads/
Earthwork
Phase 3 - PV Panel
Construction
Phase 4 - Testing and
Commissioning
Mitigated Criteria Summary
Mitigated
Phase Activity CategoryCriteria Emissions (lbs/d)
Phase 1 - Site
Preparation, Fencing,
and Ingress/Egress
OB-1 Air Analyses BR-1 - Page 8 of 32 Revised March 2018

Air Quality/Climate Change Calculations Big Rock 1 Solar Farm
ROG CO NOX PM10 PM2.5
Off-road 1.02 6.21 12.52 0.46 0.43
Vendors 0.03 0.37 0.64 0.04 0.03
Employees 0.12 4.13 0.41 0.07 0.03
Road Dust -- -- -- 31.30 3.38
Phase 1 Activity Total 1.2 10.7 13.6 31.9 3.9
Off-road 1.78 10.66 19.81 0.80 0.74
Vendors 0.01 0.14 0.43 0.02 0.01
Employees 0.20 6.61 0.65 0.12 0.05
Road Dust -- -- -- 50.07 5.41
Grading Fugitive -- -- -- 1.91 0.21
Phase 2 Activity Total 2.0 17.4 20.9 51.0 6.2
Off-road 2.64 24.69 25.56 1.47 1.40
Vendors 0.03 0.34 0.46 0.04 0.03
Employees 0.59 19.83 1.96 0.36 0.15
Road Dust -- -- -- 150.21 16.22
Phase 3 Activity Total 3.3 44.9 28.0 152.1 17.8
Off-road N/A N/A N/A N/A N/A
Vendors 0.01 0.08 0.17 0.01 0.01
Employees 0.05 1.65 0.16 0.03 0.01
Road Dust -- -- -- 12.52 1.35
Phase 4 Activity Total 0.1 1.7 0.3 12.6 1.4
Phase 2 - Civil
Improvements -
Grading/Roads/
Earthwork
Phase 3 - PV Panel
Construction
Phase 4 - Testing and
Commissioning
Unmitigated Criteria Summary
Phase Activity CategoryCriteria Emissions (lbs/d)
Phase 1 - Site
Preparation, Fencing,
and Ingress/Egress
Unmitigated
OB-1 Air Analyses BR-1 - Page 9 of 32 Revised March 2018

Air Quality/Climate Change Calculations Big Rock 1 Solar Farm
ActivityTotal Work
Days
Trips per
day *
Round Trip
(mi)
VMT per
day
Phase 1 - Site Preparation, Fencing, and Ingress/Egress 24 23 32 727
Phase 2 - Civil Improvements - Grading/Roads/Earthwork 33 36 32 1,164
Phase 3 - PV Panel Construction 70 109 32 3,491
Phase 4 - Testing and Commissioning 22 9 32 291
5,673
ROG CO NOX PM10
Phase 1 - Site Preparation, Fencing, and Ingress/Egress 0.124 4.131 0.408 0.074
Phase 2 - Civil Improvements - Grading/Roads/Earthwork 0.198 6.609 0.652 0.119
Phase 3 - PV Panel Construction 0.593 19.827 1.957 0.357
Phase 4 - Testing and Commissioning 0.049 1.652 0.163 0.030
Totals 0.96 32.22 3.18 0.58
CO2 CH4 N2O CO2e
Phase 1 - Site Preparation, Fencing, and Ingress/Egress 6.13 0.0005 0.0006 6.32
Phase 2 - Civil Improvements - Grading/Roads/Earthwork 13.26 0.0011 0.0013 13.67
Phase 3 - PV Panel Construction 84.89 0.0070 0.0081 87.49
Phase 4 - Testing and Commissioning 2.21 0.0002 0.0002 2.28
Totals 106.5 0.009 0.010 109.8
Construction Employee Commute
Construction Employee GHG Emissions
ActivityTotal Tonnes
Totals
Construction Employee Criteria Emissions
ActivityPounds per Day
Construction Employee Vehicle Activity
* Trips per day modified to reflect a conservative 1.1 persons per vehicle carpool rate
OB-1 Air Analyses BR-1 - Page 10 of 32 Revised March 2018

Air Quality/Climate Change Calculations Big Rock 1 Solar Farm
Total VMT
(mi)
17,539
37,922
242,701
6,320
304,483
PM2.5
0.031
0.049
0.148
0.012
0.24
Construction Employee Commute
Construction Employee Criteria EmissionsPounds per Day
Construction Employee Vehicle Activity
* Trips per day modified to reflect a conservative 1.1 persons per vehicle carpool rate
OB-1 Air Analyses BR-1 - Page 11 of 32 Revised March 2018

Air Quality/Climate Change Calculations Big Rock 1 Solar Farm
Activity Phase Vehicle Type (EMFAC)Days per
Phase
Trips per
day
Round Trip
(mi)
MDV 24 0.50 30
LHD1 24 2.00 30
T6 instate construction small 24 1.50 30
T7 tractor construction 33 0.25 107
T6 instate construction small 33 0.16 30
MDV 33 0.25 30
LHD1 33 0.50 30
T6 instate construction small 70 2.00 30
MDV 70 1.00 30
LHD1 70 0.50 30
T6 instate construction small 22 0.25 30
LHD1 22 0.67 30
ROG CO NOX
MDV 0.003 0.109 0.012
LHD1 0.015 0.213 0.369
T6 instate construction small 0.013 0.048 0.256
Phase 1 Total 0.03 0.37 0.64
T7 tractor construction 0.006 0.025 0.307
T6 instate construction small 0.001 0.005 0.028
MDV 0.001 0.054 0.006
LHD1 0.004 0.053 0.092
Phase 2 Total 0.01 0.14 0.43
T6 instate construction small 0.017 0.064 0.342
MDV 0.005 0.218 0.024
LHD1 0.004 0.053 0.092
Phase 3 Total 0.03 0.34 0.46
T6 instate construction small 0.002 0.008 0.043
LHD1 0.005 0.071 0.123
Phase 3 - PV Panel Construction
Phase 4 - Testing and Commissioning
For trips for PV panel delivery (which come from Port of San Diego), which use T7 trucks, only 1-way mileage was used due to back haul.
Vendor Activity
Activity Phase
Phase 2 - Civil Improvements -
Grading/Roads/Earthwork
Phase 4 - Testing and Commissioning
Phase 1 Total
Phase 2 Total
Phase 3 Total
Phase 4 Total
Pounds per Day
Vendors Vehicle Activity
Vendors Criteria Emissions
Phase 3 - PV Panel Construction
Phase 1 - Site Preparation, Fencing,
and Ingress/Egress
Vehicle Type (EMFAC)
Big Rock 1 Totals
Phase 1 - Site Preparation, Fencing,
and Ingress/Egress
Phase 2 - Civil Improvements -
Grading/Roads/Earthwork
OB-1 Air Analyses BR-1 - Page 12 of 32 Revised March 2018

Air Quality/Climate Change Calculations Big Rock 1 Solar Farm
Phase 4 Total 0.01 0.08 0.17
0.08 0.92 1.69
Phase 4 - Testing and Commissioning
Big Rock 1 Totals
OB-1 Air Analyses BR-1 - Page 13 of 32 Revised March 2018

Air Quality/Climate Change Calculations Big Rock 1 Solar Farm
CO2 CH4 N2O
MDV 0.21 0.0000 0.0000
LHD1 0.89 0.0005 0.0005
T6 instate construction small 1.16 0.0007 0.0006
Phase 1 Total 2.3 0.001 0.001
T7 tractor construction 1.34 0.0005 0.0005
T6 instate construction small 0.17 0.0001 0.0001
MDV 0.14 0.0000 0.0000
LHD1 0.30 0.0002 0.0002
Phase 2 Total 1.9 0.001 0.001
T6 instate construction small 4.45 0.0025 0.0023
MDV 1.23 0.0001 0.0001
LHD1 0.64 0.0004 0.0003
Phase 3 Total 6.3 0.003 0.003
T6 instate construction small 0.17 0.0001 0.0001
LHD1 0.27 0.0002 0.0001
Phase 4 Total 0.4 0.000 0.000
11.0 0.0052 0.0049Big Rock 1 Totals
Vehicle Type (EMFAC)
Phase 4 - Testing and Commissioning
Phase 3 - PV Panel Construction
Phase 2 - Civil Improvements -
Grading/Roads/Earthwork
Phase 1 - Site Preparation, Fencing,
and Ingress/Egress
Activity Phase
Vendors GHG EmissionsTotal Tonnes
OB-1 Air Analyses BR-1 - Page 14 of 32 Revised March 2018

Air Quality/Climate Change Calculations Big Rock 1 Solar Farm
VMT per
day
Total VMT
(mi)
15 362
60 1,447
45 1,085
120 2,894
27 872
5 158
8 244
15 489
54 1,763
60 4,171
30 2,086
15 1,043
105 7,300
8 163
20 435
28 598
307 12,555
PM10 PM2.5
0.002 0.001
0.013 0.007
0.026 0.018
0.04 0.03
0.009 0.005
0.003 0.002
0.001 0.000
0.003 0.002
0.02 0.01
0.035 0.024
0.003 0.001
0.003 0.002
0.04 0.03
0.004 0.003
0.004 0.002
For trips for PV panel delivery (which come from Port of San Diego), which use T7 trucks, only 1-way mileage was used due to back haul.
Vendor Activity
Pounds per Day
Vendors Vehicle Activity
Vendors Criteria Emissions
OB-1 Air Analyses BR-1 - Page 15 of 32 Revised March 2018

Air Quality/Climate Change Calculations Big Rock 1 Solar Farm
0.01 0.01
0.11 0.07
OB-1 Air Analyses BR-1 - Page 16 of 32 Revised March 2018

Air Quality/Climate Change Calculations Big Rock 1 Solar Farm
CO2e
0.21
1.04
1.35
2.6
1.49
0.20
0.16
0.35
2.2
5.20
1.25
0.75
7.2
0.20
0.31
0.5
12.5
Vendors GHG EmissionsTotal Tonnes
OB-1 Air Analyses BR-1 - Page 17 of 32 Revised March 2018

Air Quality/Climate Change Calculations Big Rock 1 Solar Farm
BHPLoad
Factor
Length
(wkday)
hrs/
day
Avg Daily
Number
total
hoursROG CO NOX PM10 PM2.5 CO2
Crawler Tractors 212 0.43 24 5 1.0 121 0.56 3.44 5.89 0.33 0.30 5.44
Graders 187 0.41 24 6 1.0 145 0.39 1.44 5.35 0.17 0.16 5.52
Off-highway Trucks 402 0.38 24 7 1.0 169 0.68 3.68 7.28 0.27 0.25 12.73
Plate Compactor 8 0.43 24 4 0.8 96 0.02 0.08 0.10 0.00 0.00 0.15
Rubber-tired Loaders 203 0.36 24 8 1.0 193 0.43 1.74 5.32 0.18 0.17 6.88
Scrapers 367 0.48 24 5 0.8 121 0.57 4.39 7.10 0.28 0.26 8.34
1.0 6.2 12.5 0.5 0.4 39.1
BHPLoad
Factor
Length
(wkday)
hrs/
day
Avg Daily
Number
total
hoursROG CO NOX PM10 PM2.5 CO2
Crawler Tractors 212 0.43 33 8 1.0 261 0.89 5.50 9.42 0.52 0.48 11.76
Graders 187 0.41 33 6 1.0 196 0.39 1.44 5.35 0.17 0.16 7.46
Off-highway Trucks 402 0.38 33 7 1.0 228 0.68 3.68 7.28 0.27 0.25 17.20
Rollers 80 0.38 33 4 1.0 130 0.13 0.97 0.44 0.09 0.08 1.95
Rubber-tired Loaders 203 0.36 33 5 1.5 163 0.40 1.63 4.99 0.17 0.16 8.72
Scrapers 367 0.48 33 4 1.0 130 0.57 4.39 7.10 0.28 0.26 11.27
1.8 10.7 19.8 0.8 0.7 58.4
Totals
Equipment Type
Activity
Totals
Unmitigated Offroad Equipment Emissions
Criteria Emissions (lbs/d)
Phase 1 - Site Preparation, Fencing, and Ingress/Egress
Equipment Type
Activity Criteria Emissions (lbs/d) GHG Emissions (tonnes)
Phase 2 - Civil Improvements - Grading/Roads/Earthwork
GHG Emissions (tonnes)
OB-1 Air Analyses BR-1 - Page 18 of 32 Revised March 2018

Air Quality/Climate Change Calculations Big Rock 1 Solar Farm
BHPLoad
Factor
Length
(wkday)
hrs/
day
Avg Daily
Number
total
hoursROG CO NOX PM10 PM2.5 CO2
Air Compressors 78 0.48 70 8 1.0 556 0.40 2.47 2.67 0.20 0.20 11.83
Crawler Tractors 212 0.43 70 4 0.6 278 0.27 1.65 2.83 0.16 0.14 7.53
Generator Sets 84 0.74 70 8 2.0 556 1.01 14.07 8.23 0.52 0.52 39.30
Oher construction equipment 172 0.42 70 2 0.6 139 0.08 0.62 0.91 0.05 0.04 2.97
Rough Terrain Forklifts 100 0.40 70 5 1.3 348 0.12 1.80 1.62 0.07 0.07 8.54
Rubber-tired Loaders 203 0.36 70 5 1.3 348 0.34 1.36 4.16 0.14 0.13 15.49
Trenchers 78 0.50 70 5 2.0 348 0.57 3.31 5.09 0.39 0.36 13.39
Vibratory Post Driver 172 0.42 70 4 0.9 278 0.25 1.87 2.73 0.14 0.13 8.92
2.6 24.7 25.6 1.5 1.4 108.0
BHPLoad
Factor
Length
(wkday)
hrs/
day
Avg Daily
Number
total
hoursROG CO NOX PM10 PM2.5 CO2
None 22 0.00 0.00 0.00 0.00 0.00 0.00
0.0 0.0 0.0 0.0 0.0 0.0
CO2
205.4
Equipment Type
Activity
Criteria Emissions (lbs/d)
GHG Emissions (tonnes)
GHG Emissions (tonnes)
Criteria Emissions (lbs/d)
Equipment Type
Activity
GHG Emissions (tonnes)
Phase 3 - PV Panel Construction
Phase 4 - Testing and Commissioning - (no offroad activity)
Totals
Totals
OB-1 Air Analyses BR-1 - Page 19 of 32 Revised March 2018

Air Quality/Climate Change Calculations Big Rock 1 Solar Farm
CH4 CO2e
0.0017 5.48
0.0017 5.56
0.0040 12.83
0.0000 0.15
0.0021 6.93
0.0026 8.40
0.012 39.4
CH4 CO2e
0.0037 11.85
0.0023 7.51
0.0054 17.33
0.0006 1.97
0.0027 8.78
0.0035 11.36
0.018 58.8
Unmitigated Offroad Equipment Emissions
Phase 1 - Site Preparation, Fencing, and Ingress/Egress
GHG Emissions (tonnes)
Phase 2 - Civil Improvements - Grading/Roads/Earthwork
GHG Emissions (tonnes)
OB-1 Air Analyses BR-1 - Page 20 of 32 Revised March 2018

Air Quality/Climate Change Calculations Big Rock 1 Solar Farm
CH4 CO2e
0.0011 11.86
0.0023 7.59
0.0028 39.37
0.0009 3.00
0.0027 8.60
0.0048 15.61
0.0042 13.49
0.0028 8.99
0.022 108.5
CH4 CO2e
0.0000 0.00
0.000 0.0
CH4 CO2e
0.052 206.7
GHG Emissions (tonnes)
GHG Emissions (tonnes)
GHG Emissions (tonnes)
Phase 3 - PV Panel Construction
Phase 4 - Testing and Commissioning - (no offroad activity)
OB-1 Air Analyses BR-1 - Page 21 of 32 Revised March 2018

Air Quality/Climate Change Calculations Big Rock 1 Solar Farm
EF PM15 = 0.051 × S2.0
= 2.571
EF PMTSP = 0.04 × S2.5
= 5.373
S = 7.1
EF PM10 = EFPM15 × FPM10 = 1.5
EF PM2.5 = EFPMTSP × FPM2.5 = 0.167
F PM10 = 0.6
F PM2.5 = 0.031
Emissions (lb) = EF × VMTG 33
lbs/d
PM10 1.910
PM2.5 0.206
where VMT = 40.4
A S = 59
W b = 12Blade width of the grading equipment. (default based on Caterpillar’s 140 Motor
Grader.
The grading dust emissions are calculated by multiplying the emission factors with the total vehicle miles traveled
(VMT) for the grading equipment (i.e., grader). The VMT for grader (VMTG) are estimated based on the dimensions
of the grading area and the blade width of the grading equipment.
Emissions
# of Days =
total lbs
62.25
6.72
Emissions
AS ÷ Wb × ft2 per acre ÷ ft per mile =
Pollutant
mean vehicle speed (mph). The AP-42 default value is
Grading Fugitive Dust
Fugitive dust emissions from grading equipment passes are estimated using the methodology described in Section 11.9,
Western Surface Coal Mining, of the EPA AP-42.
AP-42 estimates the emission factor of PM10 applying a scaling factor to that of PM15. Similarly, the emission factor of
PM2.5 is scaled from that of total suspended particulates (TSP). The equations used to calculate the emission factors for
PM15 and TSP and the scaling factor for those of PM10 and PM2.5 are presented below:
Emission Factors (lbs/day)
PM 10 scaling factor. The AP-42 default value is
PM 2.5 scaling factor. The AP-42 default value is
grading will occur only on approximately 10% of gross acreage for roads
OB-1 Air Analyses BR-1 - Page 22 of 32 Revised March 2018

Air Quality/Climate Change Calculations Big Rock 1 Solar Farm
EF PM10 = 0.000057
Constant Value
k = 0.016
sL = 0.1
W = 2.2
EF PM10 = 0.086
Constant Value
k = 1.8
s = 4.3%
S = 40
M = 0.5%
Entrained Road Dust
(k × (s ÷ 12) × 1.0 × (S ÷ 30) × 0.5 ) ÷ ( (M ÷ 0.5) × 0.2 = lbs PM10/VMT
Description
the fraction of particles less than or equal to the particle size
cutoff of 10 microns
surface material silt content (%)
(allowable range [1.8 - 25.2 %])
Description
particle size multiplier for particle size range and units of
interest
road surface silt loading in g/m2
(allowable range is 0.02 to
400 g/m2
)
average weight of the vehicles traveling the road in
megagrams (mean average fleet vehicle weight ranging from
1.8 - 39 megagrams or 2.0 - 42 tons)
Emission Factors - Unpaved Roads
Entrained road dust emissions are generated by vehicles traveling on both paved and unpaved roads. These
equations are based on the paved and unpaved roads emission factors found in AP-42. Defaults are from
URBEMIS.
Emission Factors - Paved Roadsk × (sL ÷ 2) × 0.65 × (W ÷ 3) × 1.5 = lbs PM10/VMT
the average vehicle speed (mph)
(allowable range [10 - 43 mph])
surface moisture content (%)
(allowable range 0.03 – 13 %)
OB-1 Air Analyses BR-1 - Page 23 of 32 Revised March 2018

Air Quality/Climate Change Calculations Big Rock 1 Solar Farm
(paved) (unpaved) PM10 PM2.5 PM10 PM2.5 PM10 PM2.5 PM10
Employee 364 364 0.021 0.002 31.273 3.377 31.294 3.379 13.456
Vendor 120 0 0.007 0.001 0.000 0.000 0.007 0.001 0.003
TOTAL 484 364 0.03 0.00 31.27 3.38 31.30 3.38 13.46
Employee 582 582 0.033 0.004 50.036 5.403 50.070 5.406 21.530
Vendor 54 0 0.003 0.000 0.000 0.000 0.003 0.000 0.001
TOTAL 636 582 0.04 0.00 50.04 5.40 50.07 5.41 21.53
Employee 1,745 1,745 0.100 0.011 150.109 16.208 150.209 16.219 64.590
Vendor 105 0 0.006 0.001 0.000 0.000 0.006 0.001 0.003
TOTAL 1,850 1,745 0.11 0.01 150.11 16.21 150.21 16.22 64.59
Employee 145 145 0.008 0.001 12.509 1.351 12.517 1.352 5.382
Vendor 28 0 0.002 0.000 0.000 0.000 0.002 0.000 0.001
TOTAL 173 145 0.01 0.00 12.51 1.35 12.52 1.35 5.38
3,143 2,836 0.2 0.0 243.9 26.3 244.1 26.4 105.0
Notes:
Per ICAPCD, vehicular travel in Imperial County is 50% on unpaved roads.
Entrained Road Dust Emissions
Phase/CategoryPaved Roads (lbs/d) Unpaved Roads (lbs/d) Mitigated (lbs/d)
Mitigation of 57% for traffic speed restriction
Total Roads (lbs/d)VMT/d
GRAND TOTAL
Phase 1 - Site Preparation,
Fencing, and
Ingress/Egress
Phase 2 - Civil
Improvements -
Grading/Roads/Earthwork
Phase 3 - PV Panel
Construction
Phase 4 - Testing and
Commissioning
OB-1 Air Analyses BR-1 - Page 24 of 32 Revised March 2018
Air Quality/Climate Change Calculations Big Rock 1 Solar Farm
Entrained Road Dust
OB-1 Air Analyses BR-1 - Page 25 of 32 Revised March 2018

Air Quality/Climate Change Calculations Big Rock 1 Solar Farm
PM2.5
1.453
0.000
1.45
2.325
0.000
2.32
6.974
0.000
6.97
0.581
0.000
0.58
11.3
Entrained Road Dust Emissions
Mitigated (lbs/d)
Mitigation of 57% for traffic speed restriction
OB-1 Air Analyses BR-1 - Page 26 of 32 Revised March 2018

Air Quality/Climate Change Calculations Big Rock 1 Solar Farm
Exhaust TW+BW Total Exhaust TW+BW Total
LDA GAS 2,929,674 0.0878 2.6963 0.2733 0.0014 0.0448 0.0462 0.0013 0.0178 0.0191
LDA DSL 26,370 0.0231 0.2121 0.1369 0.0156 0.0448 0.0603 0.0149 0.0178 0.0327
LDT1 GAS 216,975 0.1122 4.5084 0.3571 0.0033 0.0448 0.0481 0.0030 0.0178 0.0208
LDT1 DSL 285 0.1618 1.0545 1.1484 0.1273 0.0448 0.1721 0.1218 0.0178 0.1395
LDT2 GAS 991,299 0.0390 1.8655 0.1783 0.0016 0.0448 0.0463 0.0014 0.0178 0.0192
LDT2 DSL 1,512 0.0126 0.1077 0.0727 0.0060 0.0448 0.0507 0.0057 0.0178 0.0235
0.077 2.576 0.254 0.002 0.045 0.046 0.002 0.018 0.019
LHD1 GAS 57,787 0.0930 2.5119 0.4813 0.0015 0.0844 0.0859 0.0013 0.0348 0.0361
LHD1 DSL 76,401 0.1279 0.9233 4.5365 0.0295 0.0844 0.1140 0.0282 0.0348 0.0630
0.113 1.607 2.790 0.017 0.084 0.102 0.017 0.035 0.051
MDV GAS 857,127 0.0823 3.2951 0.3584 0.0016 0.0448 0.0464 0.0015 0.0178 0.0192
T6 instate construction small DSL 20,975 0.1282 0.4870 2.5832 0.1246 0.1423 0.2669 0.1192 0.0589 0.1780
T7 tractor construction DSL 11,121 0.1050 0.4205 5.2026 0.0497 0.0977 0.1474 0.0475 0.0355 0.0830
Weighted Average for Employees LDV
Fuel NOX
PM2.5PM10
Weighted Average for LHD1
EMFAC2014 (v1.0.7) Emission Rates
Calendar Year 2018EMFAC2011 Vehicle Categories
Imperial COUNTY
Emission Factor (grams/mile)
VMT ROG CO
Vehicle Info
Type
OB-1 Air Analyses BR-1 - Page 27 of 32 Revised March 2018

Air Quality/Climate Change Calculations Big Rock 1 Solar Farm
Notes: - Criteria and CO 2 factors come from 2014 EMFAC2014 (v1.0.7) and represent Estimated 2018 Annual Emission Rates for Imperial County
OB-1 Air Analyses BR-1 - Page 28 of 32 Revised March 2018
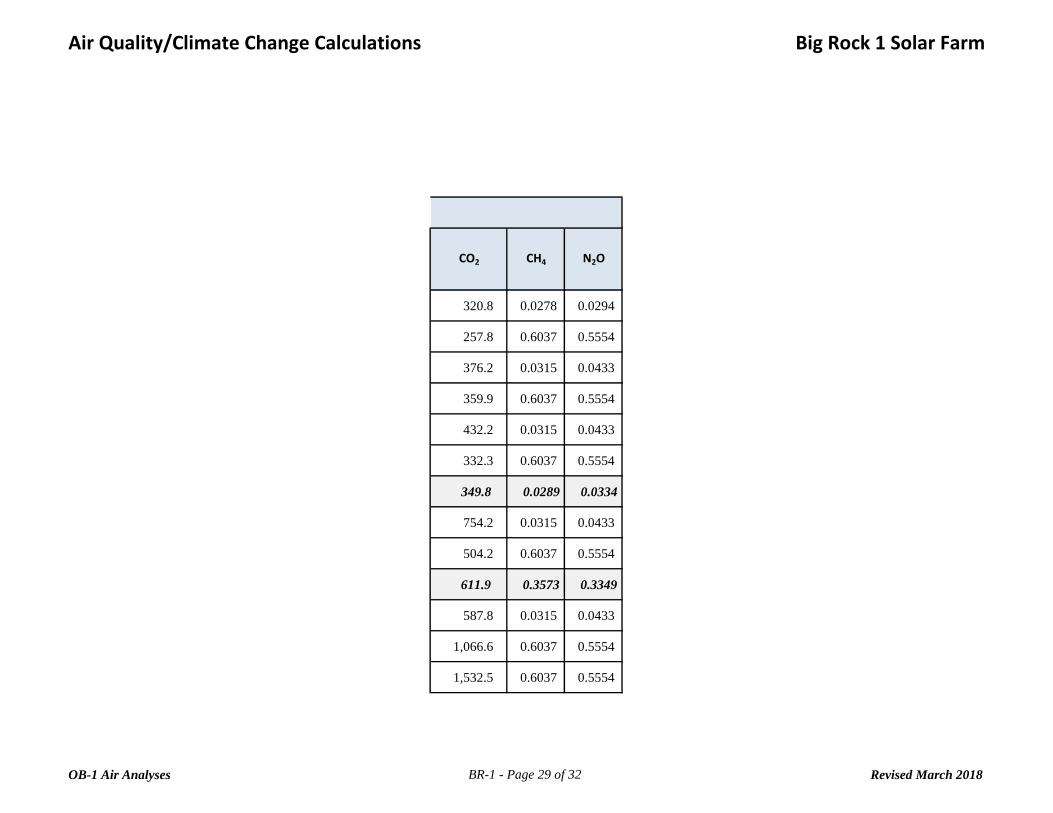
Air Quality/Climate Change Calculations Big Rock 1 Solar Farm
320.8 0.0278 0.0294
257.8 0.6037 0.5554
376.2 0.0315 0.0433
359.9 0.6037 0.5554
432.2 0.0315 0.0433
332.3 0.6037 0.5554
349.8 0.0289 0.0334
754.2 0.0315 0.0433
504.2 0.6037 0.5554
611.9 0.3573 0.3349
587.8 0.0315 0.0433
1,066.6 0.6037 0.5554
1,532.5 0.6037 0.5554
N2O
EMFAC2014 (v1.0.7) Emission Rates
Calendar Year 2018EMFAC2011 Vehicle Categories
Imperial COUNTY
Emission Factor (grams/mile)
CO2 CH4
OB-1 Air Analyses BR-1 - Page 29 of 32 Revised March 2018

Air Quality/Climate Change Calculations Big Rock 1 Solar Farm
Criteria and CO 2 factors come from 2014 EMFAC2014 (v1.0.7) and represent Estimated 2018 Annual Emission Rates for Imperial County
OB-1 Air Analyses BR-1 - Page 30 of 32 Revised March 2018

Air Quality/Climate Change Calculations Big Rock 1 Solar Farm
ROG CO NOX PM10 PM2.5 CO2 CH4
Air Compressors 78 0.48 0.603 3.744 4.050 0.304 0.304 568.3 0.054
Crawler Tractors 212 0.43 0.555 3.421 5.859 0.325 0.299 494.9 0.154
Generator Sets 84 0.74 0.461 6.418 3.752 0.239 0.239 568.3 0.041
Graders 187 0.41 0.384 1.416 5.271 0.171 0.156 497.4 0.155
Off-highway truck 402 0.38 0.287 1.560 3.090 0.113 0.104 493.5 0.154
Other Construction Equipment 172 0.42 0.436 3.263 4.755 0.250 0.230 493.4 0.154
Plate Compactor 8 0.43 0.661 3.469 4.142 0.161 0.161 568.3 0.059
Rollers 80 0.38 0.481 3.610 1.650 0.320 0.294 492.2 0.153
Rough Terrain Forklifts 100 0.40 0.222 3.270 2.945 0.136 0.125 491.2 0.153
Rubber Tired Loaders 203 0.36 0.333 1.346 4.131 0.140 0.129 487.9 0.152
Scrapers 367 0.48 0.369 2.828 4.568 0.180 0.166 490.8 0.153
Trenchers 78 0.50 0.658 3.855 5.915 0.450 0.414 493.7 0.154
Vibratory post driver * 158 0.38 0.273 3.093 2.924 0.142 0.13 490.7 0.153
*
BHP
2018 Offroad Emission Factors
Emission Factor (g/bhp-hr)Equipment Type
Load
Factor
A vibratory post driver is mounted on an excavator, so excavator emission factors are used
OB-1 Air Analyses BR-1 - Page 31 of 32 Revised March 2018

Air Quality/Climate Change Calculations Big Rock 1 Solar Farm
PC = 75 MW project capacity
OP = 8,760 hrs/yr annual operating hours
CF = 26% Capacity Factor for NG
EG = 170,820 MWh/yr Project Energy Generated
HR = 6,940 Btu/kWh Combined Cycle Heat Rate for NG
1.19E+12 Btu/yr or
1,185,491 MMBtu/yr
CO2 = 53.02
CH4 = 0.0009
N2O = 0.0028
CO2e = 53.91
62,855 tCO2/yr
1.067 tCH4/yr
3.319 tN2O/yr
63,906 tCO 2 e/yr
Emissions = EF x NG eq x 0.100 (t/kg)
NG eq = HR x EG x 1000 (kWh/MWh)
NGeq =
Emission Factors (EF)
kg/MMBtu Climate Registry Default Factors
GHG Emissions
Emissions Associated with Power Generation Using
Natural Gas as Fuel
Constants
Project Energy Generated (EG)
EG = PC x OP x CF
Natural Gas Equivalent (NGeq)
OB-1 Air Analyses BR-1 - Page 32 of 32 Revised March 2018

Air Quality/Climate Change Calculations Laurel 1 Solar Farm
ActivityWorkdays
per Year
Trips per
day
Round Trip
(mi)
VMT per
day
Anual VMT
(mi)
Pickup Trucks LDT2 244 0.50 10 5 1,220
Utility/Service Vehicles T6 244 0.17 10 2 415
Water Truck T7 244 0.25 10 3 610
Worker Commute * LDA+ 244 5.00 30 150 36,600
Carpenter Service Vehicle LHD1 244 0.25 30 8 1,830
Electrical Service Vehicle LHD1 244 0.25 30 8 1,830
Equipment/Material Delivery MDV 244 0.07 30 2 512
176 43,017
ROG CO NOX PM10 PM2.5
0.000 0.021 0.002 0.001 0.000
0.000 0.007 0.001 0.000 0.000
0.000 0.010 0.001 0.000 0.000
0.001 0.038 0.004 0.001 0.000
0.013 0.617 0.059 0.015 0.006
0.001 0.031 0.003 0.001 0.000
0.001 0.031 0.003 0.001 0.000
0.000 0.009 0.001 0.000 0.000
0.014 0.687 0.066 0.017 0.007
0.02 0.73 0.07 0.02 0.01
CO2 CH4 N2O CO2e
0.53 0.0000 0.0001 0.54
0.44 0.0003 0.0002 0.52
0.65 0.0004 0.0003 0.76
12.80 0.0011 0.0012 13.20
1.38 0.0001 0.0001 1.41
1.38 0.0001 0.0001 1.41
0.30 0.0000 0.0000 0.31
17.5 0.0018 0.0020 18.2
*
Totals
Operational Criteria Emissions
Activity Vehicle TypePounds per Day
Operational Emissions
Operational Vehicle Activity
Vehicle Type
On
-sit
eO
ff-s
ite
Totals
Operational GHG Emissions
Activity Vehicle TypeTotal Tonnes
Pickup Trucks
Utility/Service Vehicles
Off
-sit
e
Totals
Worker commute trips per day was estimated based on 5 employees
On
-sit
e
Water Truck
Worker Commute
Carpenter Service Vehicle
Electrical Service Vehicle
Equipment/Material Delivery
On
-sit
eO
ff-s
ite
On-site Total
Off-site Total
Carpenter Service Vehicle
Electrical Service Vehicle
Equipment/Material Delivery
Pickup Trucks
Utility/Service Vehicles
Water Truck
Worker Commute
OB-1 Air Analyses L-1 - Page 1 of 24 Revised March 2018

Air Quality/Climate Change Calculations Laurel 1 Solar Farm
CO2 CH4 N2O CO2e
Offroad 28.15 0.0088 N/A 28.37
Vendors 1.63 0.0008 0.0008 1.88
Employees 4.42 0.0004 0.0004 4.56
Phase 1 Total 34.2 0.010 0.001 34.8
Offroad 58.35 0.0182 N/A 58.81
Vendors 1.95 0.0008 0.0008 2.20
Employees 13.26 0.0011 0.0013 13.67
Phase 2 Total 73.6 0.020 0.002 74.7
Offroad 60.73 0.0122 N/A 61.04
Vendors 3.55 0.0017 0.0016 4.05
Employees 47.75 0.0039 0.0046 49.21
Phase 3 Total 112.0 0.018 0.006 114.3
Offroad 0.00 0.0000 N/A 0.00
Vendors 0.35 0.0002 0.0002 0.41
Employees 1.77 0.0001 0.0002 1.82
Phase 4 Total 2.1 0.000 0.000 2.2
221.9 0.048 0.010 226.0
8
18
63,906
-63,880
Construction Amortized over 30 Years
Annual Operational Emissions
Minus Annually Displaced Emissions
Net Project GHG Emissions
CategoryGHG Emissions (tonnes)
GHG Emissions Summary
Phase Activity
Grand Total for Construction
Phase 3 - PV Panel
Construction
Phase 4 - Testing and
Commissioning
Phase 2 - Civil Improvements -
Grading/Roads/Earthwork
Phase 1 - Site Preparation,
Fencing, and Ingress/Egress
OB-1 Air Analyses L-1 - Page 2 of 24 Revised March 2018
Air Quality/Climate Change Calculations Laurel 1 Solar Farm
ROG CO NOX PM10
Phase 1 - Site Preparation, Fencing, and Ingress/Egress 1.17 10.71 13.57 14.04
Month 1 Maxmum 1.2 10.7 13.6 14.0
Phase 2 - Civil Improvements - Grading/Roads/Earthwork 1.99 17.41 20.90 22.47
Month 2 Maximum 2.0 17.4 20.9 22.5
Phase 2 - Civil Improvements - Grading/Roads/Earthwork 1.99 17.41 20.90 22.47
Phase 3 - PV Panel Construction 3.25 44.85 27.97 66.47
Month 3 Maximum 5.2 62.3 48.9 88.9
Phase 3 - PV Panel Construction 3.25 44.85 27.97 66.47
Month 4 Maximum 3.3 44.9 28.0 66.5
Phase 3 - PV Panel Construction 3.25 44.85 27.97 66.47
Phase 4 - Testing and Commissioning 0.06 1.73 0.33 5.42
Month 5 Maximum 3.3 46.6 28.3 71.9
5.2 62.3 48.9 88.9
137 550 137 150
N N N N
#2
Mitigated Criteria Temporal Summary
Month ActivityMitigated Pounds per Day
#1
Laurel 1 Solar Farm Maximum Pounds per Day
ICAPCD Thresholds
Exceeds?
#3
#4
#5
OB-1 Air Analyses L-1 - Page 3 of 24 Revised March 2018

Air Quality/Climate Change Calculations Laurel 1 Solar Farm
PM2.5
1.94
1.9
3.12
3.1
3.12
8.55
11.7
8.55
8.5
8.55
0.60
9.1
11.7
550
N
Mitigated Criteria Temporal Summary
Mitigated Pounds per Day
OB-1 Air Analyses L-1 - Page 4 of 24 Revised March 2018

Air Quality/Climate Change Calculations Laurel 1 Solar Farm
ROG CO NOX PM10
Phase 1 - Site Preparation, Fencing, and Ingress/Egress 1.17 10.71 13.57 31.88
Month 1 Maxmum 1.2 10.7 13.6 31.9
Phase 2 - Civil Improvements - Grading/Roads/Earthwork 1.99 17.41 20.90 51.01
Month 2 Maximum 2.0 17.4 20.9 51.0
Phase 2 - Civil Improvements - Grading/Roads/Earthwork 1.99 17.41 20.90 51.01
Phase 3 - PV Panel Construction 3.25 44.85 27.97 152.09
Month 3 Maximum 5.2 62.3 48.9 203.1
Phase 3 - PV Panel Construction 3.25 44.85 27.97 152.09
Month 4 Maximum 3.3 44.9 28.0 152.1
Phase 3 - PV Panel Construction 3.25 44.85 27.97 152.09
Phase 4 - Testing and Commissioning 0.06 1.73 0.33 12.56
Month 5 Maximum 3.3 46.6 28.3 164.6
5.2 62.3 48.9 203.1
137 550 137 150
N N N Y
Laurel 1 Solar Farm Maximum Pounds per Day
ICAPCD Thresholds
Exceeds?
#5
#4
ActivityPounds per Day
Unmitigated Criteria Temporal Summary
#2
Month
#1
#3
OB-1 Air Analyses L-1 - Page 5 of 24 Revised March 2018
Air Quality/Climate Change Calculations Laurel 1 Solar Farm
PM2.5
3.86
3.9
6.20
6.2
6.20
17.79
24.0
17.79
17.8
17.79
1.37
19.2
24.0
550
N
Pounds per Day
Unmitigated Criteria Temporal Summary
OB-1 Air Analyses L-1 - Page 6 of 24 Revised March 2018

Air Quality/Climate Change Calculations Laurel 1 Solar Farm
ROG CO NOX PM10 PM2.5
Off-road 1.02 6.21 12.52 0.46 0.43
Vendors 0.03 0.37 0.64 0.04 0.03
Employees 0.12 4.13 0.41 0.07 0.03
Road Dust -- -- -- 13.46 1.45
Phase 1 Activity Total 1.2 10.7 13.6 14.0 1.9
Off-road 1.78 10.66 19.81 0.80 0.74
Vendors 0.01 0.14 0.43 0.02 0.01
Employees 0.20 6.61 0.65 0.12 0.05
Road Dust -- -- -- 21.53 2.32
Grading Fugitive -- -- -- 0.42 0.05
Phase 2 Activity Total 2.0 17.4 20.9 22.5 3.1
Off-road 2.64 24.69 25.56 1.47 1.40
Vendors 0.03 0.34 0.46 0.04 0.03
Employees 0.59 19.83 1.96 0.36 0.15
Road Dust -- -- -- 64.59 6.97
Phase 3 Activity Total 3.3 44.9 28.0 66.5 8.5
Off-road N/A N/A N/A N/A N/A
Vendors 0.01 0.08 0.17 0.01 0.01
Employees 0.05 1.65 0.16 0.03 0.01
Road Dust -- -- -- 5.38 0.58
Phase 4 Activity Total 0.1 1.7 0.3 5.4 0.6
Phase 2 - Civil
Improvements -
Grading/Roads/Earthwo
rk
Phase 3 - PV Panel
Construction
Phase 4 - Testing and
Commissioning
Criteria Emissions Summary
Mitigated
Phase Activity CategoryCriteria Emissions (lbs/d)
Phase 1 - Site
Preparation, Fencing,
and Ingress/Egress
OB-1 Air Analyses L-1 - Page 7 of 24 Revised March 2018

Air Quality/Climate Change Calculations Laurel 1 Solar Farm
ROG CO NOX PM10 PM2.5
Off-road 1.02 6.21 12.52 0.46 0.43
Vendors 0.03 0.37 0.64 0.04 0.03
Employees 0.12 4.13 0.41 0.07 0.03
Road Dust -- -- -- 31.30 3.38
Phase 1 Activity Total 1.2 10.7 13.6 31.9 3.9
Off-road 1.78 10.66 19.81 0.80 0.74
Vendors 0.01 0.14 0.43 0.02 0.01
Employees 0.20 6.61 0.65 0.12 0.05
Road Dust -- -- -- 50.07 5.41
Grading Fugitive -- -- -- 0.42 0.05
Phase 2 Activity Total 2.0 17.4 20.9 51.0 6.2
Off-road 2.64 24.69 25.56 1.47 1.40
Vendors 0.03 0.34 0.46 0.04 0.03
Employees 0.59 19.83 1.96 0.36 0.15
Road Dust -- -- -- 150.21 16.22
Phase 3 Activity Total 3.3 44.9 28.0 152.1 17.8
Off-road N/A N/A N/A N/A N/A
Vendors 0.01 0.08 0.17 0.01 0.01
Employees 0.05 1.65 0.16 0.03 0.01
Road Dust -- -- -- 12.52 1.35
Phase 4 Activity Total 0.1 1.7 0.3 12.6 1.4
Phase 2 - Civil
Improvements -
Grading/Roads/Earthwo
rk
Phase 3 - PV Panel
Construction
Phase 4 - Testing and
Commissioning
Criteria Emissions Summary
Phase Activity CategoryCriteria Emissions (lbs/d)
Phase 1 - Site
Preparation, Fencing,
and Ingress/Egress
Unmitigated
OB-1 Air Analyses L-1 - Page 8 of 24 Revised March 2018

Air Quality/Climate Change Calculations Laurel 1 Solar Farm
ActivityTotal Work
Days
Trips per
day *
Round Trip
(mi)
VMT per
day
Total VMT
(mi)
Phase 1 - Site Preparation, Fencing, and Ingress/Egress 17 23 32 727 12,641
Phase 2 - Civil Improvements - Grading/Roads/Earthwork 33 36 32 1,164 37,922
Phase 3 - PV Panel Construction 39 109 32 3,491 136,519
Phase 4 - Testing and Commissioning 17 9 32 291 5,056
5,673 192,139
ROG CO NOX PM10 PM2.5
Phase 1 - Site Preparation, Fencing, and Ingress/Egress 0.124 4.131 0.408 0.074 0.031
Phase 2 - Civil Improvements - Grading/Roads/Earthwork 0.198 6.609 0.652 0.119 0.049
Phase 3 - PV Panel Construction 0.593 19.827 1.957 0.357 0.148
Phase 4 - Testing and Commissioning 0.049 1.652 0.163 0.030 0.012
Totals 0.96 32.22 3.18 0.58 0.24
CO2 CH4 N2O CO2e
Phase 1 - Site Preparation, Fencing, and Ingress/Egress 4.42 0.0004 0.0004 4.56
Phase 2 - Civil Improvements - Grading/Roads/Earthwork 13.26 0.0011 0.0013 13.67
Phase 3 - PV Panel Construction 47.75 0.0039 0.0046 49.21
Phase 4 - Testing and Commissioning 1.77 0.0001 0.0002 1.82
Totals 67.2 0.006 0.006 69.3
Construction Employee Commute
Construction Employee GHG Emissions
ActivityTotal Tonnes
Totals
Construction Employee Criteria Emissions
ActivityPounds per Day
Construction Employee Vehicle Activity
* Trips per day modified to reflect a conservative 1.1 persons per vehicle carpool rate
OB-1 Air Analyses L-1 - Page 9 of 24 Revised March 2018
Air Quality/Climate Change Calculations Laurel 1 Solar Farm
Activity Phase Vehicle Type (EMFAC)Days per
Phase
Trips per
day
Round Trip
(mi)
MDV 17 0.50 30
LHD1 17 2.00 30
T6 instate construction small 17 1.50 30
T7 tractor construction 33 0.25 107
T6 instate construction small 33 0.16 30
MDV 33 0.25 30
LHD1 33 0.50 30
T6 instate construction small 39 2.00 30
MDV 39 1.00 30
LHD1 39 0.50 30
T6 instate construction small 17 0.25 30
LHD1 17 0.67 30
ROG CO NOX
MDV 0.003 0.109 0.012
LHD1 0.015 0.213 0.369
T6 instate construction small 0.013 0.048 0.256
Phase 1 Total 0.03 0.37 0.64
T7 tractor construction 0.006 0.025 0.307
T6 instate construction small 0.001 0.005 0.028
MDV 0.001 0.054 0.006
LHD1 0.004 0.053 0.092
Phase 2 Total 0.01 0.14 0.43
T6 instate construction small 0.017 0.064 0.342
MDV 0.005 0.218 0.024
LHD1 0.004 0.053 0.092
Phase 3 Total 0.03 0.34 0.46
T6 instate construction small 0.002 0.008 0.043
LHD1 0.005 0.071 0.123
Phase 4 Total 0.01 0.08 0.17
0.08 0.92 1.69
Phase 3 - PV Panel Construction
Phase 4 - Testing and Commissioning
For trips for PV panel delivery (which come from Port of San Diego), which use T7 trucks, only 1-way mileage was used due to back haul.
Vendor Activity
Activity Phase
Phase 2 - Civil Improvements -
Grading/Roads/Earthwork
Phase 4 - Testing and Commissioning
Phase 1 Total
Phase 2 Total
Phase 3 Total
Phase 4 Total
Pounds per Day
Vendors Vehicle Activity
Vendors Criteria Emissions
Phase 3 - PV Panel Construction
Phase 1 - Site Preparation, Fencing,
and Ingress/Egress
Vehicle Type (EMFAC)
Big Rock 1 Totals
Big Rock 1 Totals
Phase 1 - Site Preparation, Fencing,
and Ingress/Egress
Phase 2 - Civil Improvements -
Grading/Roads/Earthwork
OB-1 Air Analyses L-1 - Page 10 of 24 Revised March 2018

Air Quality/Climate Change Calculations Laurel 1 Solar Farm
CO2 CH4 N2O
MDV 0.15 0.0000 0.0000
LHD1 0.64 0.0004 0.0003
T6 instate construction small 0.83 0.0005 0.0004
Phase 1 Total 1.6 0.001 0.001
T7 tractor construction 1.34 0.0005 0.0005
T6 instate construction small 0.17 0.0001 0.0001
MDV 0.14 0.0000 0.0000
LHD1 0.30 0.0002 0.0002
Phase 2 Total 1.9 0.001 0.001
T6 instate construction small 2.50 0.0014 0.0013
MDV 0.69 0.0000 0.0001
LHD1 0.36 0.0002 0.0002
Phase 3 Total 3.6 0.002 0.002
T6 instate construction small 0.14 0.0001 0.0001
LHD1 0.21 0.0001 0.0001
Phase 4 Total 0.4 0.000 0.000
7.5 0.0035 0.0033Big Rock 1 Totals
Vehicle Type (EMFAC)
Phase 4 - Testing and Commissioning
Phase 3 - PV Panel Construction
Phase 2 - Civil Improvements -
Grading/Roads/Earthwork
Phase 1 - Site Preparation, Fencing,
and Ingress/Egress
Activity Phase
Vendors GHG EmissionsTotal Tonnes
OB-1 Air Analyses L-1 - Page 11 of 24 Revised March 2018

Air Quality/Climate Change Calculations Laurel 1 Solar Farm
VMT per
day
Total VMT
(mi)
15 261
60 1,043
45 782
120 2,086
27 872
5 158
8 244
15 489
54 1,763
60 2,346
30 1,173
15 587
105 4,106
8 130
20 348
28 478
307 8,434
PM10 PM2.5
0.002 0.001
0.013 0.007
0.026 0.018
0.04 0.03
0.009 0.005
0.003 0.002
0.001 0.000
0.003 0.002
0.02 0.01
0.035 0.024
0.003 0.001
0.003 0.002
0.04 0.03
0.004 0.003
0.004 0.002
0.01 0.01
0.11 0.07
For trips for PV panel delivery (which come from Port of San Diego), which use T7 trucks, only 1-way mileage was used due to back haul.
Vendor Activity
Pounds per Day
Vendors Vehicle Activity
Vendors Criteria Emissions
OB-1 Air Analyses L-1 - Page 12 of 24 Revised March 2018
Air Quality/Climate Change Calculations Laurel 1 Solar Farm
CO2e
0.15
0.75
0.98
1.9
1.49
0.20
0.16
0.35
2.2
2.93
0.71
0.42
4.1
0.16
0.25
0.4
8.5
Vendors GHG EmissionsTotal Tonnes
OB-1 Air Analyses L-1 - Page 13 of 24 Revised March 2018

Air Quality/Climate Change Calculations Laurel 1 Solar Farm
BHPLoad
Factor
Length
(wkday)
hrs/
day
Avg Daily
Number
total
hoursROG CO NOX PM10 PM2.5 CO2 CH4
Crawler Tractors 212 0.43 17 5 1.0 87 0.56 3.44 5.89 0.33 0.30 3.92 0.0012
Graders 187 0.41 17 6 1.0 104 0.39 1.44 5.35 0.17 0.16 3.98 0.0012
Off-highway Trucks 402 0.38 17 7 1.0 122 0.68 3.68 7.28 0.27 0.25 9.17 0.0029
Plate Compactor 8 0.43 17 4 0.8 70 0.02 0.08 0.10 0.00 0.00 0.11 0.0000
Rubber-tired Loaders 203 0.36 17 8 1.0 139 0.43 1.74 5.32 0.18 0.17 4.96 0.0015
Scrapers 367 0.48 17 5 0.8 87 0.57 4.39 7.10 0.28 0.26 6.01 0.0019
1.0 6.2 12.5 0.5 0.4 28.1 0.009
BHPLoad
Factor
Length
(wkday)
hrs/
day
Avg Daily
Number
total
hoursROG CO NOX PM10 PM2.5 CO2 CH4
Crawler Tractors 212 0.43 33 8 1.0 261 0.89 5.50 9.42 0.52 0.48 11.76 0.0037
Graders 187 0.41 33 6 1.0 196 0.39 1.44 5.35 0.17 0.16 7.46 0.0023
Off-highway Trucks 402 0.38 33 7 1.0 228 0.68 3.68 7.28 0.27 0.25 17.20 0.0054
Rollers 80 0.38 33 4 1.0 130 0.13 0.97 0.44 0.09 0.08 1.95 0.0006
Rubber-tired Loaders 203 0.36 33 5 1.5 163 0.40 1.63 4.99 0.17 0.16 8.72 0.0027
Scrapers 367 0.48 33 4 1.0 130 0.57 4.39 7.10 0.28 0.26 11.27 0.0035
1.8 10.7 19.8 0.8 0.7 58.4 0.018
Totals
Equipment Type
Activity
Totals
Unmitigated Offroad Equipment Emissions
Criteria Emissions (lbs/d)
Phase 1 - Site Preparation, Fencing, and Ingress/Egress
Equipment Type
Activity Criteria Emissions (lbs/d) GHG Emissions (tonnes)
Phase 2 - Civil Improvements - Grading/Roads/Earthwork
GHG Emissions (tonnes)
OB-1 Air Analyses L-1 - Page 14 of 24 Revised March 2018

Air Quality/Climate Change Calculations Laurel 1 Solar Farm
BHPLoad
Factor
Length
(wkday)
hrs/
day
Avg Daily
Number
total
hoursROG CO NOX PM10 PM2.5 CO2 CH4
Air Compressors 78 0.48 39 8 1.0 313 0.40 2.47 2.67 0.20 0.20 6.66 0.0006
Crawler Tractors 212 0.43 39 4 0.6 156 0.27 1.65 2.83 0.16 0.14 4.23 0.0013
Generator Sets 84 0.74 39 8 2.0 313 1.01 14.07 8.23 0.52 0.52 22.10 0.0016
Oher construction equipment 172 0.42 39 2 0.6 78 0.08 0.62 0.91 0.05 0.04 1.67 0.0005
Rough Terrain Forklifts 100 0.40 39 5 1.3 196 0.12 1.80 1.62 0.07 0.07 4.80 0.0015
Rubber-tired Loaders 203 0.36 39 5 1.3 196 0.34 1.36 4.16 0.14 0.13 8.72 0.0027
Trenchers 78 0.50 39 5 2.0 196 0.57 3.31 5.09 0.39 0.36 7.53 0.0023
Vibratory Post Driver 172 0.42 39 4 0.9 156 0.25 1.87 2.73 0.14 0.13 5.02 0.0016
2.6 24.7 25.6 1.5 1.4 60.7 0.012
BHPLoad
Factor
Length
(wkday)
hrs/
day
Avg Daily
Number
total
hoursROG CO NOX PM10 PM2.5 CO2 CH4
None 17 0.00 0.00 0.00 0.00 0.00 0.00 0.0000
0.0 0.0 0.0 0.0 0.0 0.0 0.000
CO2 CH4
147.2 0.039
Equipment Type
Activity
Criteria Emissions (lbs/d)
GHG Emissions (tonnes)
GHG Emissions (tonnes)
Criteria Emissions (lbs/d)
Equipment Type
Activity
GHG Emissions (tonnes)
Phase 3 - PV Panel Construction
Phase 4 - Testing and Commissioning - (no offroad activity)
Totals
Totals
OB-1 Air Analyses L-1 - Page 15 of 24 Revised March 2018

Air Quality/Climate Change Calculations Laurel 1 Solar Farm
CO2e
3.95
4.01
9.24
0.11
5.00
6.06
28.4
CO2e
11.85
7.51
17.33
1.97
8.78
11.36
58.8
Unmitigated Offroad Equipment Emissions
Phase 1 - Site Preparation, Fencing, and Ingress/Egress
GHG Emissions (tonnes)
Phase 2 - Civil Improvements - Grading/Roads/Earthwork
GHG Emissions (tonnes)
OB-1 Air Analyses L-1 - Page 16 of 24 Revised March 2018

Air Quality/Climate Change Calculations Laurel 1 Solar Farm
CO2e
6.67
4.27
22.14
1.69
4.84
8.78
7.59
5.06
61.0
CO2e
0.00
0.0
CO2e
148.2
GHG Emissions (tonnes)
GHG Emissions (tonnes)
GHG Emissions (tonnes)
Phase 3 - PV Panel Construction
Phase 4 - Testing and Commissioning - (no offroad activity)
OB-1 Air Analyses L-1 - Page 17 of 24 Revised March 2018

Air Quality/Climate Change Calculations Laurel 1 Solar Farm
EF PM10 = 0.000057
Constant Value
k = 0.016
sL = 0.1
W = 2.2
EF PM10 = 0.086
Constant Value
k = 1.8
s = 4.3%
S = 40
M = 0.5%
Entrained Road Dust
(k × (s ÷ 12) × 1.0 × (S ÷ 30) × 0.5 ) ÷ ( (M ÷ 0.5) × 0.2 = lbs PM10/VMT
Description
the fraction of particles less than or equal to the particle size
cutoff of 10 microns
surface material silt content (%)
(allowable range [1.8 - 25.2 %])
Description
particle size multiplier for particle size range and units of
interest
road surface silt loading in g/m2 (allowable range is 0.02 to
400 g/m2)
average weight of the vehicles traveling the road in
megagrams (mean average fleet vehicle weight ranging from
1.8 - 39 megagrams or 2.0 - 42 tons)
Emission Factors - Unpaved Roads
Entrained road dust emissions are generated by vehicles traveling on both paved and unpaved roads. These
equations are based on the paved and unpaved roads emission factors found in AP-42. Defaults are from
URBEMIS.
Emission Factors - Paved Roadsk × (sL ÷ 2) × 0.65 × (W ÷ 3) × 1.5 = lbs PM10/VMT
the average vehicle speed (mph)
(allowable range [10 - 43 mph])
surface moisture content (%)
(allowable range 0.03 – 13 %)
OB-1 Air Analyses L-1 - Page 18 of 24 Revised March 2018
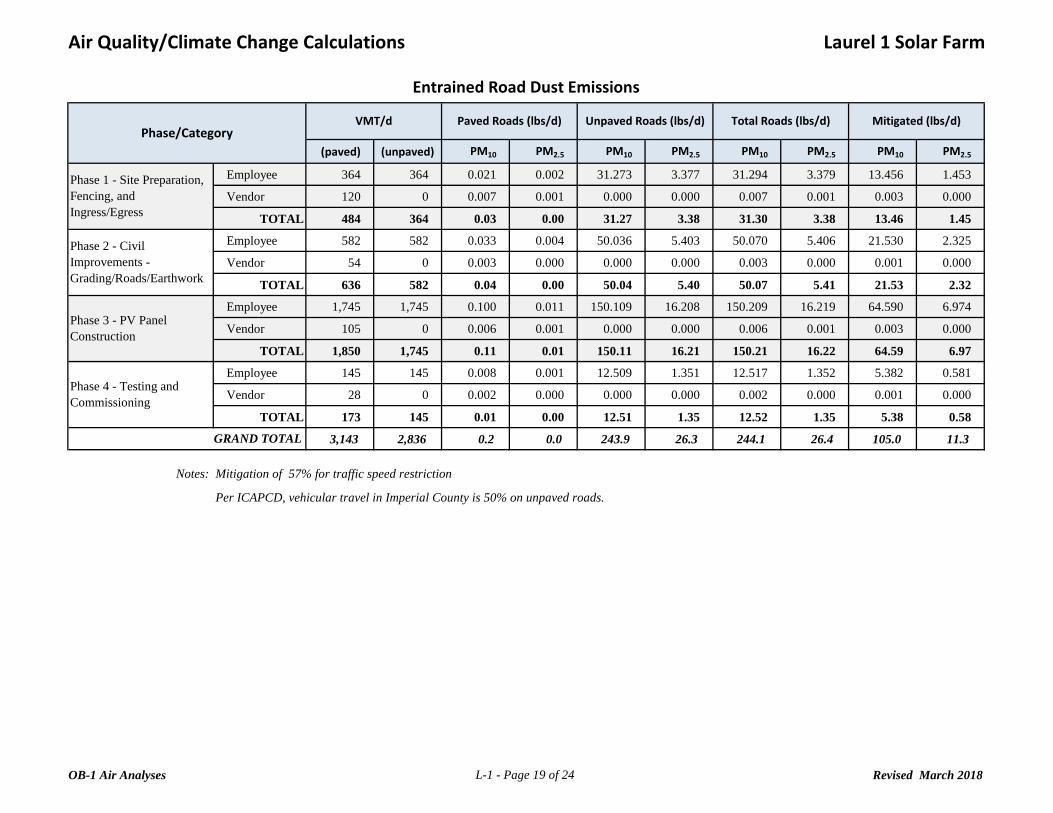
Air Quality/Climate Change Calculations Laurel 1 Solar Farm
(paved) (unpaved) PM10 PM2.5 PM10 PM2.5 PM10 PM2.5 PM10 PM2.5
Employee 364 364 0.021 0.002 31.273 3.377 31.294 3.379 13.456 1.453
Vendor 120 0 0.007 0.001 0.000 0.000 0.007 0.001 0.003 0.000
TOTAL 484 364 0.03 0.00 31.27 3.38 31.30 3.38 13.46 1.45
Employee 582 582 0.033 0.004 50.036 5.403 50.070 5.406 21.530 2.325
Vendor 54 0 0.003 0.000 0.000 0.000 0.003 0.000 0.001 0.000
TOTAL 636 582 0.04 0.00 50.04 5.40 50.07 5.41 21.53 2.32
Employee 1,745 1,745 0.100 0.011 150.109 16.208 150.209 16.219 64.590 6.974
Vendor 105 0 0.006 0.001 0.000 0.000 0.006 0.001 0.003 0.000
TOTAL 1,850 1,745 0.11 0.01 150.11 16.21 150.21 16.22 64.59 6.97
Employee 145 145 0.008 0.001 12.509 1.351 12.517 1.352 5.382 0.581
Vendor 28 0 0.002 0.000 0.000 0.000 0.002 0.000 0.001 0.000
TOTAL 173 145 0.01 0.00 12.51 1.35 12.52 1.35 5.38 0.58
3,143 2,836 0.2 0.0 243.9 26.3 244.1 26.4 105.0 11.3
Notes:
Per ICAPCD, vehicular travel in Imperial County is 50% on unpaved roads.
Entrained Road Dust Emissions
Phase/CategoryPaved Roads (lbs/d) Unpaved Roads (lbs/d) Mitigated (lbs/d)
Mitigation of 57% for traffic speed restriction
Total Roads (lbs/d)VMT/d
GRAND TOTAL
Phase 1 - Site Preparation,
Fencing, and
Ingress/Egress
Phase 2 - Civil
Improvements -
Grading/Roads/Earthwork
Phase 3 - PV Panel
Construction
Phase 4 - Testing and
Commissioning
OB-1 Air Analyses L-1 - Page 19 of 24 Revised March 2018

Air Quality/Climate Change Calculations Laurel 1 Solar Farm
EF PM15 = 0.051 × S2.0
= 2.571
EF PMTSP = 0.04 × S2.5
= 5.373
S = 7.1
EF PM10 = EFPM15 × FPM10 = 1.5
EF PM2.5 = EFPMTSP × FPM2.5 = 0.167
F PM10 = 0.6
F PM2.5 = 0.031
Emissions (lb) = EF × VMTG 33
lbs/d
PM10 0.423
PM2.5 0.046
where VMT = 8.9
A S = 13
W b = 12Blade width of the grading equipment. (default based on Caterpillar’s 140 Motor
Grader.
The grading dust emissions are calculated by multiplying the emission factors with the total vehicle miles traveled
(VMT) for the grading equipment (i.e., grader). The VMT for grader (VMTG) are estimated based on the dimensions
of the grading area and the blade width of the grading equipment.
Emissions
# of Days =
total lbs
13.79
1.49
Emissions
AS ÷ Wb × ft2 per acre ÷ ft per mile =
Pollutant
mean vehicle speed (mph). The AP-42 default value is
Grading Fugitive Dust
Fugitive dust emissions from grading equipment passes are estimated using the methodology described in Section 11.9,
Western Surface Coal Mining, of the EPA AP-42.
AP-42 estimates the emission factor of PM10 applying a scaling factor to that of PM15. Similarly, the emission factor
of PM2.5 is scaled from that of total suspended particulates (TSP). The equations used to calculate the emission factors
for PM15 and TSP and the scaling factor for those of PM10 and PM2.5 are presented below:
Emission Factors (lbs/day)
PM 10 scaling factor. The AP-42 default value is
PM 2.5 scaling factor. The AP-42 default value is
grading will occur only on approximately 10% of gross acreage for roads
OB-1 Air Analyses L-1 - Page 20 of 24 Revised March 2018

Air Quality/Climate Change Calculations Laurel 1 Solar Farm
Exhaust TW+BW Total Exhaust TW+BW Total
LDA GAS 2,929,674 0.0878 2.6963 0.2733 0.0014 0.0448 0.0462 0.0013 0.0178 0.0191
LDA DSL 26,370 0.0231 0.2121 0.1369 0.0156 0.0448 0.0603 0.0149 0.0178 0.0327
LDT1 GAS 216,975 0.1122 4.5084 0.3571 0.0033 0.0448 0.0481 0.0030 0.0178 0.0208
LDT1 DSL 285 0.1618 1.0545 1.1484 0.1273 0.0448 0.1721 0.1218 0.0178 0.1395
LDT2 GAS 991,299 0.0390 1.8655 0.1783 0.0016 0.0448 0.0463 0.0014 0.0178 0.0192
LDT2 DSL 1,512 0.0126 0.1077 0.0727 0.0060 0.0448 0.0507 0.0057 0.0178 0.0235
0.077 2.576 0.254 0.002 0.045 0.046 0.002 0.018 0.019
LHD1 GAS 57,787 0.0930 2.5119 0.4813 0.0015 0.0844 0.0859 0.0013 0.0348 0.0361
LHD1 DSL 76,401 0.1279 0.9233 4.5365 0.0295 0.0844 0.1140 0.0282 0.0348 0.0630
0.113 1.607 2.790 0.017 0.084 0.102 0.017 0.035 0.051
MDV GAS 857,127 0.0823 3.2951 0.3584 0.0016 0.0448 0.0464 0.0015 0.0178 0.0192
T6 instate construction small DSL 20,975 0.1282 0.4870 2.5832 0.1246 0.1423 0.2669 0.1192 0.0589 0.1780
T7 tractor construction DSL 11,121 0.1050 0.4205 5.2026 0.0497 0.0977 0.1474 0.0475 0.0355 0.0830
Notes: -
Weighted Average for Employees LDV
Fuel NOX
PM2.5PM10
Weighted Average for LHD1
EMFAC2014 (v1.0.7) Emission Rates
Calendar Year 2018EMFAC2011 Vehicle Categories
Imperial COUNTY
Emission Factor (grams/mile)
VMT ROG CO
Criteria and CO 2 factors come from 2014 EMFAC2014 (v1.0.7) and represent Estimated 2018 Annual Emission Rates for Imperial County
Vehicle Info
Type
OB-1 Air Analyses L-1 - Page 21 of 24 Revised March 2018
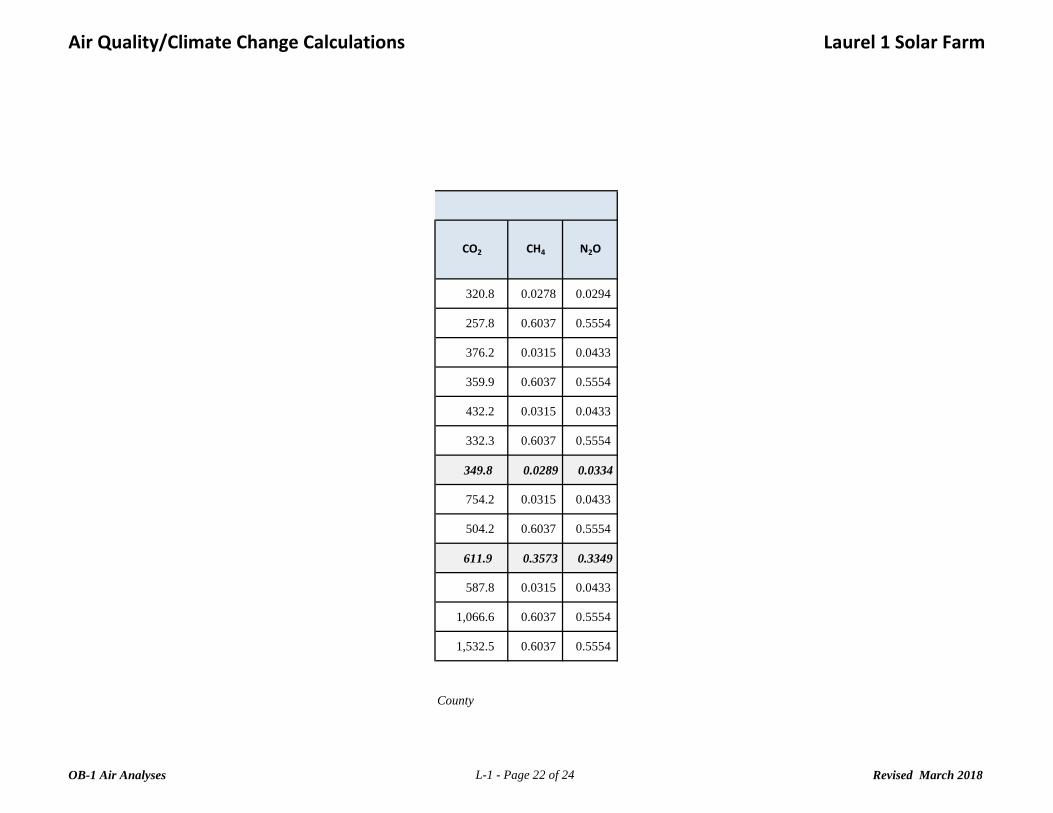
Air Quality/Climate Change Calculations Laurel 1 Solar Farm
320.8 0.0278 0.0294
257.8 0.6037 0.5554
376.2 0.0315 0.0433
359.9 0.6037 0.5554
432.2 0.0315 0.0433
332.3 0.6037 0.5554
349.8 0.0289 0.0334
754.2 0.0315 0.0433
504.2 0.6037 0.5554
611.9 0.3573 0.3349
587.8 0.0315 0.0433
1,066.6 0.6037 0.5554
1,532.5 0.6037 0.5554
N2O
EMFAC2014 (v1.0.7) Emission Rates
Calendar Year 2018EMFAC2011 Vehicle Categories
Imperial COUNTY
Emission Factor (grams/mile)
CO2 CH4
Criteria and CO 2 factors come from 2014 EMFAC2014 (v1.0.7) and represent Estimated 2018 Annual Emission Rates for Imperial County
OB-1 Air Analyses L-1 - Page 22 of 24 Revised March 2018
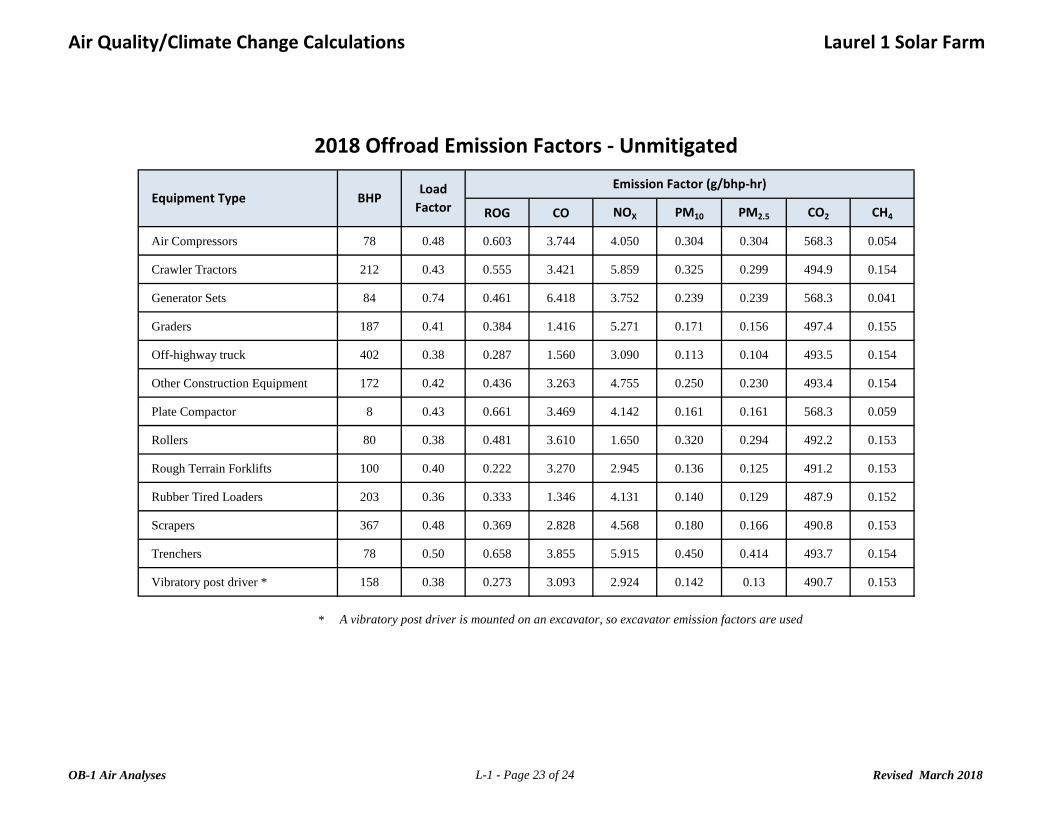
Air Quality/Climate Change Calculations Laurel 1 Solar Farm
ROG CO NOX PM10 PM2.5 CO2 CH4
Air Compressors 78 0.48 0.603 3.744 4.050 0.304 0.304 568.3 0.054
Crawler Tractors 212 0.43 0.555 3.421 5.859 0.325 0.299 494.9 0.154
Generator Sets 84 0.74 0.461 6.418 3.752 0.239 0.239 568.3 0.041
Graders 187 0.41 0.384 1.416 5.271 0.171 0.156 497.4 0.155
Off-highway truck 402 0.38 0.287 1.560 3.090 0.113 0.104 493.5 0.154
Other Construction Equipment 172 0.42 0.436 3.263 4.755 0.250 0.230 493.4 0.154
Plate Compactor 8 0.43 0.661 3.469 4.142 0.161 0.161 568.3 0.059
Rollers 80 0.38 0.481 3.610 1.650 0.320 0.294 492.2 0.153
Rough Terrain Forklifts 100 0.40 0.222 3.270 2.945 0.136 0.125 491.2 0.153
Rubber Tired Loaders 203 0.36 0.333 1.346 4.131 0.140 0.129 487.9 0.152
Scrapers 367 0.48 0.369 2.828 4.568 0.180 0.166 490.8 0.153
Trenchers 78 0.50 0.658 3.855 5.915 0.450 0.414 493.7 0.154
Vibratory post driver * 158 0.38 0.273 3.093 2.924 0.142 0.13 490.7 0.153
*
BHP
2018 Offroad Emission Factors - Unmitigated
Emission Factor (g/bhp-hr)Equipment Type
Load
Factor
A vibratory post driver is mounted on an excavator, so excavator emission factors are used
OB-1 Air Analyses L-1 - Page 23 of 24 Revised March 2018

Air Quality/Climate Change Calculations Laurel 1 Solar Farm
PC = 75 MW project capacity
OP = 8,760 hrs/yr annual operating hours
CF = 26% Capacity Factor for NG
EG = 170,820 MWh/yr Project Energy Generated
HR = 6,940 Btu/kWh Combined Cycle Heat Rate for NG
1.19E+12 Btu/yr or
1,185,491 MMBtu/yr
CO2 = 53.02
CH4 = 0.0009
N2O = 0.0028
CO2e = 53.91
62,855 tCO2/yr
1.067 tCH4/yr
3.319 tN2O/yr
63,906 tCO 2 e/yr
Emissions = EF x NG eq x 0.100 (t/kg)
NG eq = HR x EG x 1000 (kWh/MWh)
NGeq =
Emission Factors (EF)
kg/MMBtu Climate Registry Default Factors
GHG Emissions
Emissions Associated with Power Generation Using
Natural Gas as Fuel
Constants
Project Energy Generated (EG)
EG = PC x OP x CF
Natural Gas Equivalent (NGeq)
OB-1 Air Analyses L-1 - Page 24 of 24 Revised March 2018
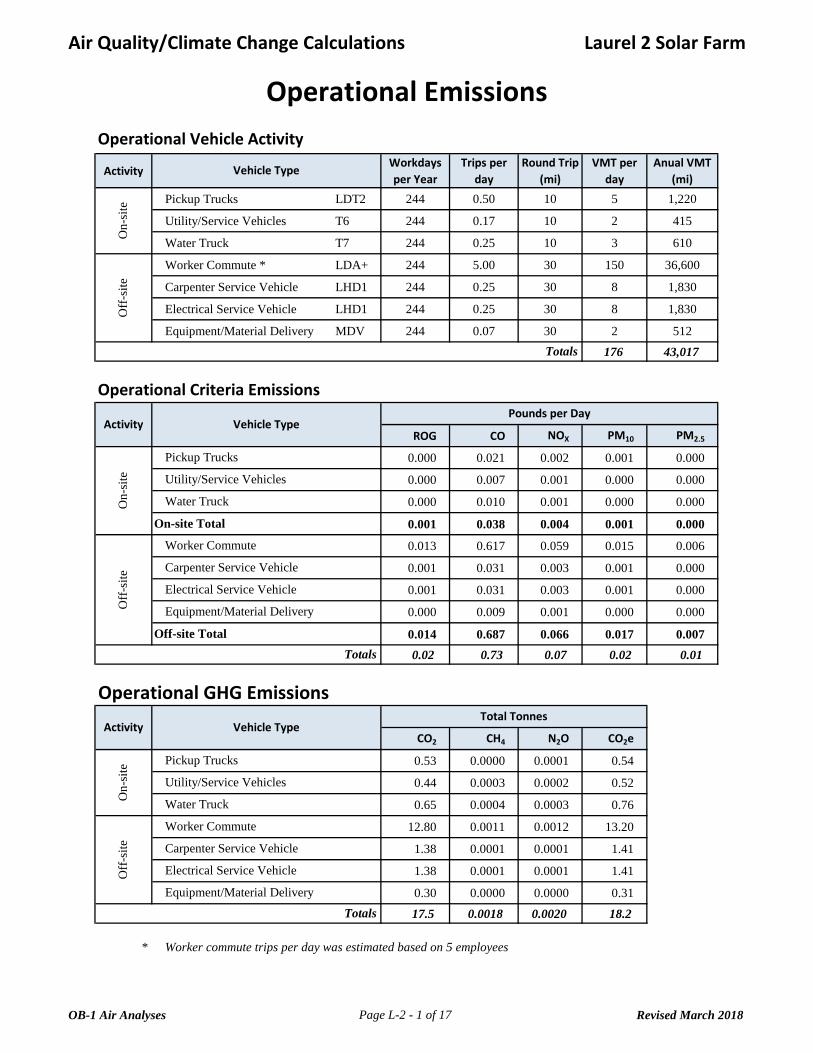
Air Quality/Climate Change Calculations Laurel 2 Solar Farm
ActivityWorkdays
per Year
Trips per
day
Round Trip
(mi)
VMT per
day
Anual VMT
(mi)
Pickup Trucks LDT2 244 0.50 10 5 1,220
Utility/Service Vehicles T6 244 0.17 10 2 415
Water Truck T7 244 0.25 10 3 610
Worker Commute * LDA+ 244 5.00 30 150 36,600
Carpenter Service Vehicle LHD1 244 0.25 30 8 1,830
Electrical Service Vehicle LHD1 244 0.25 30 8 1,830
Equipment/Material Delivery MDV 244 0.07 30 2 512
176 43,017
ROG CO NOX PM10 PM2.5
0.000 0.021 0.002 0.001 0.000
0.000 0.007 0.001 0.000 0.000
0.000 0.010 0.001 0.000 0.000
0.001 0.038 0.004 0.001 0.000
0.013 0.617 0.059 0.015 0.006
0.001 0.031 0.003 0.001 0.000
0.001 0.031 0.003 0.001 0.000
0.000 0.009 0.001 0.000 0.000
0.014 0.687 0.066 0.017 0.007
0.02 0.73 0.07 0.02 0.01
CO2 CH4 N2O CO2e
0.53 0.0000 0.0001 0.54
0.44 0.0003 0.0002 0.52
0.65 0.0004 0.0003 0.76
12.80 0.0011 0.0012 13.20
1.38 0.0001 0.0001 1.41
1.38 0.0001 0.0001 1.41
0.30 0.0000 0.0000 0.31
17.5 0.0018 0.0020 18.2
*
Totals
Operational Criteria Emissions
Activity Vehicle TypePounds per Day
Operational Emissions
Operational Vehicle Activity
Vehicle Type
On
-sit
eO
ff-s
ite
Totals
Operational GHG Emissions
Activity Vehicle TypeTotal Tonnes
Pickup Trucks
Utility/Service Vehicles
Off
-sit
e
Totals
Worker commute trips per day was estimated based on 5 employees
On
-sit
e
Water Truck
Worker Commute
Carpenter Service Vehicle
Electrical Service Vehicle
Equipment/Material Delivery
On
-sit
eO
ff-s
ite
On-site Total
Off-site Total
Carpenter Service Vehicle
Electrical Service Vehicle
Equipment/Material Delivery
Pickup Trucks
Utility/Service Vehicles
Water Truck
Worker Commute
OB-1 Air Analyses Page L-2 - 1 of 17 Revised March 2018

Air Quality/Climate Change Calculations Laurel 2 Solar Farm
CO2 CH4 N2O CO2e
Offroad 45.56 0.0142 N/A 45.92
Vendors 2.63 0.0014 0.0013 3.04
Employees 7.16 0.0006 0.0007 7.38
Phase 1 Total 55.4 0.016 0.002 56.3
Offroad 68.08 0.0212 N/A 68.61
Vendors 2.27 0.0010 0.0009 2.57
Employees 15.48 0.0013 0.0015 15.95
Phase 2 Total 85.8 0.023 0.002 87.1
Offroad 0.00 0.0000 N/A 0.00
Vendors 0.00 0.0000 0.0000 0.00
Employees 0.00 0.0000 0.0000 0.00
Phase 3 Total 0.0 0.000 0.000 0.0
Offroad 0.00 0.0000 N/A 0.00
Vendors 0.44 0.0003 0.0002 0.52
Employees 2.21 0.0002 0.0002 2.28
Phase 4 Total 2.7 0.000 0.000 2.8
143.8 0.040 0.005 146.3
5
18
59,646
-59,623
Construction Amortized over 30 Years
Annual Operational Emissions
Minus Annually Displaced Emissions
Net Project GHG Emissions
CategoryGHG Emissions (tonnes)
GHG Emissions Summary
Phase Activity
Grand Total for Construction
Phase 3 - PV Panel
Construction
Phase 4 - Testing and
Commissioning
Phase 2 - Civil Improvements -
Grading/Roads/Earthwork
Phase 1 - Site Preparation,
Fencing, and Ingress/Egress
OB-1 Air Analyses Page L-2 - 2 of 17 Revised March 2018

Air Quality/Climate Change Calculations Laurel 2 Solar Farm
ROG CO NOX PM10 PM2.5
Phase 1 - Site Preparation, Fencing, and Ingress/Egress 1.17 10.71 13.57 14.04 1.94
Month 1 Maxmum 1.2 10.7 13.6 14.0 1.9
Phase 1 - Site Preparation, Fencing, and Ingress/Egress 1.17 10.71 13.57 14.04 1.94
Month 2 Maximum 1.2 10.7 13.6 14.0 1.9
Phase 2 - Civil Improvements - Grading/Roads/Earthwork 1.99 17.41 20.90 22.47 3.12
Month 3 Maximum 2.0 17.4 20.9 22.5 3.1
Phase 2 - Civil Improvements - Grading/Roads/Earthwork 1.99 17.41 20.90 22.47 3.12
Month 4 Maximum 2.0 17.4 20.9 22.5 3.1
Phase 3 - PV Panel Construction 3.25 44.85 27.97 66.47 8.55
Month 5 Maximum 3.3 44.9 28.0 66.5 8.5
Phase 3 - PV Panel Construction 3.25 44.85 27.97 66.47 8.55
Month 6 Maximum 3.3 44.9 28.0 66.5 8.5
Phase 3 - PV Panel Construction 3.25 44.85 27.97 66.47 8.55
Month 6 Maximum 3.3 44.9 28.0 66.5 8.5
Phase 3 - PV Panel Construction 3.25 44.85 27.97 66.47 8.55
Phase 4 - Testing and Commissioning 0.06 1.73 0.33 5.42 0.60
Month 6 Maximum 3.3 46.6 28.3 71.9 9.1
3.3 46.6 28.3 71.9 9.1
75 550 100 150
N N N N
N/A
Construction Criteria Temporal Summary
Month ActivityPounds per Day
#1
Exceeds?
#2
#3
#4
#5
Laurel 2 Solar Farm Maximum Pounds per Day
ICAPCD Thresholds
#6
#7
#8
OB-1 Air Analyses Page L-2 - 3 of 17 Revised March 2018

Air Quality/Climate Change Calculations Laurel 2 Solar Farm
ROG CO NOX PM10 PM2.5
Phase 1 - Site Preparation, Fencing, and Ingress/Egress 1.17 10.71 13.57 31.88 3.86
Month 1 Maxmum 1.2 10.7 13.6 31.9 3.9
Phase 1 - Site Preparation, Fencing, and Ingress/Egress 1.17 10.71 13.57 31.88 3.86
Month 2 Maximum 1.2 10.7 13.6 31.9 3.9
Phase 2 - Civil Improvements - Grading/Roads/Earthwork 1.99 17.41 20.90 51.01 6.20
Month 3 Maximum 2.0 17.4 20.9 51.0 6.2
Phase 2 - Civil Improvements - Grading/Roads/Earthwork 1.99 17.41 20.90 51.01 6.20
Month 4 Maximum 2.0 17.4 20.9 51.0 6.2
Phase 3 - PV Panel Construction 3.25 44.85 27.97 152.09 17.79
Month 5 Maximum 3.3 44.9 28.0 152.1 17.8
Phase 3 - PV Panel Construction 3.25 44.85 27.97 152.09 17.79
Month 6 Maximum 3.3 44.9 28.0 152.1 17.8
Phase 3 - PV Panel Construction 3.25 44.85 27.97 152.09 17.79
Month 6 Maximum 3.3 44.9 28.0 152.1 17.8
Phase 3 - PV Panel Construction 3.25 44.85 27.97 152.09 17.79
Phase 4 - Testing and Commissioning 0.06 1.73 0.33 12.56 1.37
Month 6 Maximum 3.3 46.6 28.3 164.6 19.2
3.3 46.6 28.3 164.6 19.2
75 550 100 150
N N N Y
N/A
Laurel 2 Solar Farm Maximum Pounds per Day
ICAPCD Thresholds
Exceeds?
#5
#7
#6
#8
#3
#4
ActivityPounds per Day
Construction Criteria Temporal Summary
#2
Month
#1
OB-1 Air Analyses Page L-2 - 4 of 17 Revised March 2018

Air Quality/Climate Change Calculations Laurel 2 Solar Farm
ROG CO NOX PM10 PM2.5
Off-road 1.02 6.21 12.52 0.46 0.43
Vendors 0.03 0.37 0.64 0.04 0.03
Employees 0.12 4.13 0.41 0.07 0.03
Road Dust -- -- -- 13.46 1.45
Phase 1 Activity Total 1.2 10.7 13.6 14.0 1.9
Off-road 1.78 10.66 19.81 0.80 0.74
Vendors 0.01 0.14 0.43 0.02 0.01
Employees 0.20 6.61 0.65 0.12 0.05
Road Dust -- -- -- 21.53 2.32
Grading Fugitive -- -- -- 0.78 0.08
Phase 2 Activity Total 2.0 17.4 20.9 22.5 3.1
Off-road 2.64 24.69 25.56 1.47 1.40
Vendors 0.03 0.34 0.46 0.04 0.03
Employees 0.59 19.83 1.96 0.36 0.15
Road Dust -- -- -- 64.59 6.97
Phase 3 Activity Total 3.3 44.9 28.0 66.5 8.5
Off-road N/A N/A N/A N/A N/A
Vendors 0.01 0.08 0.17 0.01 0.01
Employees 0.05 1.65 0.16 0.03 0.01
Road Dust -- -- -- 5.38 0.58
Phase 4 Activity Total 0.1 1.7 0.3 5.4 0.6
Phase 2 - Civil
Improvements -
Grading/Roads/
Earthwork
Phase 3 - PV Panel
Construction
Phase 4 - Testing and
Commissioning
Criteria Emissions Summary
Mitigated
Phase Activity CategoryCriteria Emissions (lbs/d)
Phase 1 - Site
Preparation, Fencing,
and Ingress/Egress
OB-1 Air Analyses Page L-2 - 5 of 17 Revised March 2018
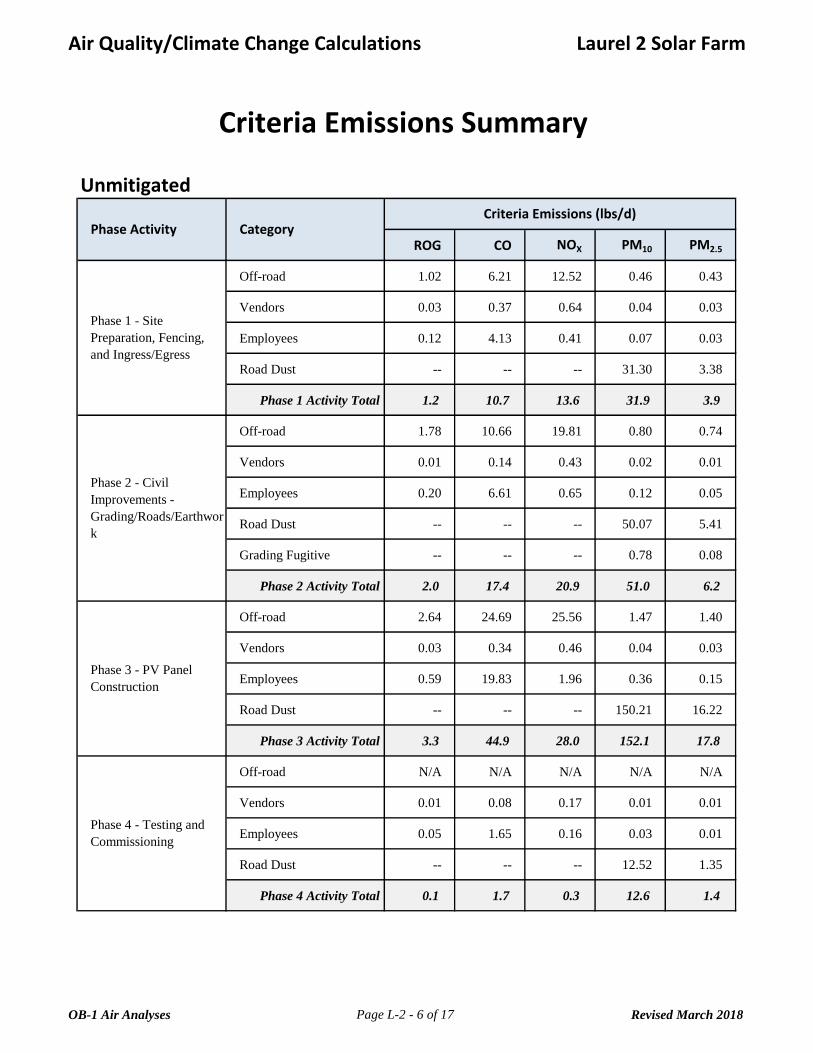
Air Quality/Climate Change Calculations Laurel 2 Solar Farm
ROG CO NOX PM10 PM2.5
Off-road 1.02 6.21 12.52 0.46 0.43
Vendors 0.03 0.37 0.64 0.04 0.03
Employees 0.12 4.13 0.41 0.07 0.03
Road Dust -- -- -- 31.30 3.38
Phase 1 Activity Total 1.2 10.7 13.6 31.9 3.9
Off-road 1.78 10.66 19.81 0.80 0.74
Vendors 0.01 0.14 0.43 0.02 0.01
Employees 0.20 6.61 0.65 0.12 0.05
Road Dust -- -- -- 50.07 5.41
Grading Fugitive -- -- -- 0.78 0.08
Phase 2 Activity Total 2.0 17.4 20.9 51.0 6.2
Off-road 2.64 24.69 25.56 1.47 1.40
Vendors 0.03 0.34 0.46 0.04 0.03
Employees 0.59 19.83 1.96 0.36 0.15
Road Dust -- -- -- 150.21 16.22
Phase 3 Activity Total 3.3 44.9 28.0 152.1 17.8
Off-road N/A N/A N/A N/A N/A
Vendors 0.01 0.08 0.17 0.01 0.01
Employees 0.05 1.65 0.16 0.03 0.01
Road Dust -- -- -- 12.52 1.35
Phase 4 Activity Total 0.1 1.7 0.3 12.6 1.4
Phase 2 - Civil
Improvements -
Grading/Roads/Earthwor
k
Phase 3 - PV Panel
Construction
Phase 4 - Testing and
Commissioning
Criteria Emissions Summary
Phase Activity CategoryCriteria Emissions (lbs/d)
Phase 1 - Site
Preparation, Fencing,
and Ingress/Egress
Unmitigated
OB-1 Air Analyses Page L-2 - 6 of 17 Revised March 2018
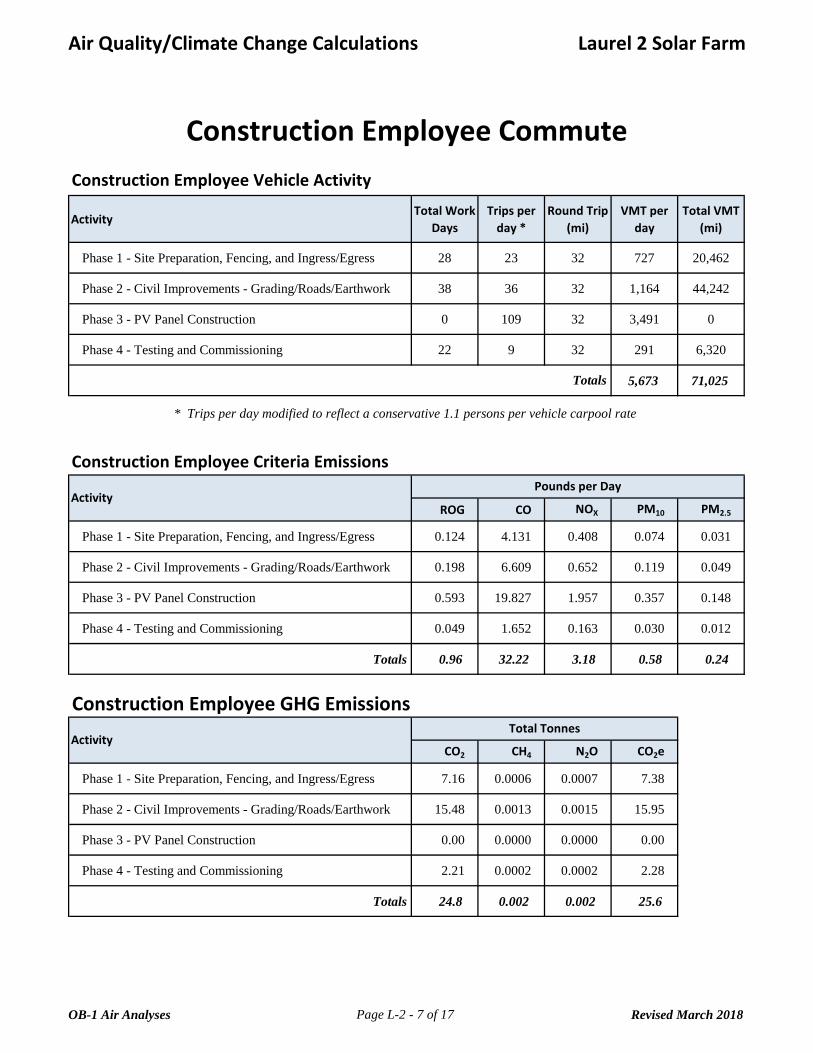
Air Quality/Climate Change Calculations Laurel 2 Solar Farm
ActivityTotal Work
Days
Trips per
day *
Round Trip
(mi)
VMT per
day
Total VMT
(mi)
Phase 1 - Site Preparation, Fencing, and Ingress/Egress 28 23 32 727 20,462
Phase 2 - Civil Improvements - Grading/Roads/Earthwork 38 36 32 1,164 44,242
Phase 3 - PV Panel Construction 0 109 32 3,491 0
Phase 4 - Testing and Commissioning 22 9 32 291 6,320
5,673 71,025
ROG CO NOX PM10 PM2.5
Phase 1 - Site Preparation, Fencing, and Ingress/Egress 0.124 4.131 0.408 0.074 0.031
Phase 2 - Civil Improvements - Grading/Roads/Earthwork 0.198 6.609 0.652 0.119 0.049
Phase 3 - PV Panel Construction 0.593 19.827 1.957 0.357 0.148
Phase 4 - Testing and Commissioning 0.049 1.652 0.163 0.030 0.012
Totals 0.96 32.22 3.18 0.58 0.24
CO2 CH4 N2O CO2e
Phase 1 - Site Preparation, Fencing, and Ingress/Egress 7.16 0.0006 0.0007 7.38
Phase 2 - Civil Improvements - Grading/Roads/Earthwork 15.48 0.0013 0.0015 15.95
Phase 3 - PV Panel Construction 0.00 0.0000 0.0000 0.00
Phase 4 - Testing and Commissioning 2.21 0.0002 0.0002 2.28
Totals 24.8 0.002 0.002 25.6
Construction Employee Commute
Construction Employee GHG Emissions
ActivityTotal Tonnes
Totals
Construction Employee Criteria Emissions
ActivityPounds per Day
Construction Employee Vehicle Activity
* Trips per day modified to reflect a conservative 1.1 persons per vehicle carpool rate
OB-1 Air Analyses Page L-2 - 7 of 17 Revised March 2018

Air Quality/Climate Change Calculations Laurel 2 Solar Farm
Activity Phase Vehicle Type (EMFAC)Days per
Phase
Trips per
day
Round Trip
(mi)
VMT per
day
Total VMT
(mi)
MDV 28 0.50 30 15 422
LHD1 28 2.00 30 60 1,688
T6 instate construction small 28 1.50 30 45 1,266
120 3,376
T7 tractor construction 38 0.25 107 27 1,017
T6 instate construction small 38 0.16 30 5 185
MDV 38 0.25 30 8 285
LHD1 38 0.50 30 15 570
54 2,057
T6 instate construction small 0 2.00 30 60 0
MDV 0 1.00 30 30 0
LHD1 0 0.50 30 15 0
105 0
T6 instate construction small 22 0.25 30 8 163
LHD1 22 0.67 30 20 435
28 598
307 6,031
ROG CO NOX PM10 PM2.5
MDV 0.003 0.109 0.012 0.002 0.001
LHD1 0.015 0.213 0.369 0.013 0.007
T6 instate construction small 0.013 0.048 0.256 0.026 0.018
Phase 1 Total 0.03 0.37 0.64 0.04 0.03
T7 tractor construction 0.006 0.025 0.307 0.009 0.005
T6 instate construction small 0.001 0.005 0.028 0.003 0.002
MDV 0.001 0.054 0.006 0.001 0.000
LHD1 0.004 0.053 0.092 0.003 0.002
Phase 2 Total 0.01 0.14 0.43 0.02 0.01
T6 instate construction small 0.017 0.064 0.342 0.035 0.024
MDV 0.005 0.218 0.024 0.003 0.001
LHD1 0.004 0.053 0.092 0.003 0.002
Phase 3 Total 0.03 0.34 0.46 0.04 0.03
T6 instate construction small 0.002 0.008 0.043 0.004 0.003
LHD1 0.005 0.071 0.123 0.004 0.002
Phase 4 Total 0.01 0.08 0.17 0.01 0.01
0.08 0.92 1.69 0.11 0.07
Phase 3 - PV Panel Construction
Phase 4 - Testing and Commissioning
For trips for PV panel delivery (which come from Port of San Diego), which use T7 trucks, only 1-way mileage was used due to back haul.
Vendor Activity
Activity Phase
Phase 2 - Civil Improvements -
Grading/Roads/Earthwork
Phase 4 - Testing and Commissioning
Phase 1 Total
Phase 2 Total
Phase 3 Total
Phase 4 Total
Pounds per Day
Vendors Vehicle Activity
Vendors Criteria Emissions
Phase 3 - PV Panel Construction
Phase 1 - Site Preparation, Fencing,
and Ingress/Egress
Vehicle Type (EMFAC)
Big Rock 1 Totals
Big Rock 1 Totals
Phase 1 - Site Preparation, Fencing,
and Ingress/Egress
Phase 2 - Civil Improvements -
Grading/Roads/Earthwork
OB-1 Air Analyses Page L-2 - 8 of 17 Revised March 2018

Air Quality/Climate Change Calculations Laurel 2 Solar Farm
CO2 CH4 N2O CO2e
MDV 0.25 0.0000 0.0000 0.25
LHD1 1.03 0.0006 0.0006 1.22
T6 instate construction small 1.35 0.0008 0.0007 1.58
Phase 1 Total 2.6 0.001 0.001 3.0
T7 tractor construction 1.56 0.0006 0.0006 1.74
T6 instate construction small 0.20 0.0001 0.0001 0.23
MDV 0.17 0.0000 0.0000 0.18
LHD1 0.35 0.0002 0.0002 0.41
Phase 2 Total 2.3 0.001 0.001 2.6
T6 instate construction small 0.00 0.0000 0.0000 0.00
MDV 0.00 0.0000 0.0000 0.00
LHD1 0.00 0.0000 0.0000 0.00
Phase 3 Total 0.0 0.000 0.000 0.0
T6 instate construction small 0.17 0.0001 0.0001 0.20
LHD1 0.27 0.0002 0.0001 0.31
Phase 4 Total 0.4 0.000 0.000 0.5
5.3 0.0026 0.0024 6.1Big Rock 1 Totals
Vehicle Type (EMFAC)
Phase 4 - Testing and Commissioning
Phase 3 - PV Panel Construction
Phase 2 - Civil Improvements -
Grading/Roads/Earthwork
Phase 1 - Site Preparation, Fencing,
and Ingress/Egress
Activity Phase
Vendors GHG EmissionsTotal Tonnes
OB-1 Air Analyses Page L-2 - 9 of 17 Revised March 2018

Air Quality/Climate Change Calculations Laurel 2 Solar Farm
BHPLoad
Factor
Length
(wkday)
hrs/
day
Avg Daily
Number
total
hoursROG CO NOX PM10 PM2.5 CO2 CH4 CO2e
Crawler Tractors 212 0.43 28 5 1.0 141 0.56 3.44 5.89 0.33 0.30 6.35 0.0020 6.40
Graders 187 0.41 28 6 1.0 169 0.39 1.44 5.35 0.17 0.16 6.44 0.0020 6.49
Off-highway Trucks 402 0.38 28 7 1.0 197 0.68 3.68 7.28 0.27 0.25 14.85 0.0046 14.96
Plate Compactor 8 0.43 28 4 0.8 113 0.02 0.08 0.10 0.00 0.00 0.18 0.0000 0.18
Rubber-tired Loaders 203 0.36 28 8 1.0 225 0.43 1.74 5.32 0.18 0.17 8.03 0.0025 8.09
Scrapers 367 0.48 28 5 0.8 141 0.57 4.39 7.10 0.28 0.26 9.73 0.0030 9.81
1.0 6.2 12.5 0.5 0.4 45.6 0.014 45.9
BHPLoad
Factor
Length
(wkday)
hrs/
day
Avg Daily
Number
total
hoursROG CO NOX PM10 PM2.5 CO2 CH4 CO2e
Crawler Tractors 212 0.43 38 8 1.0 304 0.89 5.50 9.42 0.52 0.48 13.72 0.0043 13.83
Graders 187 0.41 38 6 1.0 228 0.39 1.44 5.35 0.17 0.16 8.70 0.0027 8.77
Off-highway Trucks 402 0.38 38 7 1.0 266 0.68 3.68 7.28 0.27 0.25 20.06 0.0063 20.22
Rollers 80 0.38 38 4 1.0 152 0.13 0.97 0.44 0.09 0.08 2.28 0.0007 2.29
Rubber-tired Loaders 203 0.36 38 5 1.5 190 0.40 1.63 4.99 0.17 0.16 10.17 0.0032 10.25
Scrapers 367 0.48 38 4 1.0 152 0.57 4.39 7.10 0.28 0.26 13.15 0.0041 13.25
1.8 10.7 19.8 0.8 0.7 68.1 0.021 68.6
Totals
Equipment Type
Activity
Totals
Offroad Equipment Emissions
Criteria Emissions (lbs/d)
Phase 1 - Site Preparation, Fencing, and Ingress/Egress
Equipment Type
Activity Criteria Emissions (lbs/d) GHG Emissions (tonnes)
Phase 2 - Civil Improvements - Grading/Roads/Earthwork
GHG Emissions (tonnes)
OB-1 Air Analyses Page L-2 - 10 of 17 Revised March 2018

Air Quality/Climate Change Calculations Laurel 2 Solar Farm
BHPLoad
Factor
Length
(wkday)
hrs/
day
Avg Daily
Number
total
hoursROG CO NOX PM10 PM2.5 CO2 CH4 CO2e
Air Compressors 78 0.48 0 8 1.0 0 0.40 2.47 2.67 0.20 0.20 0.00 0.0000 0.00
Crawler Tractors 212 0.43 0 4 0.6 0 0.27 1.65 2.83 0.16 0.14 0.00 0.0000 0.00
Generator Sets 84 0.74 0 8 2.0 0 1.01 14.07 8.23 0.52 0.52 0.00 0.0000 0.00
Oher construction equipment 172 0.42 0 2 0.6 0 0.08 0.62 0.91 0.05 0.04 0.00 0.0000 0.00
Rough Terrain Forklifts 100 0.40 0 5 1.3 0 0.12 1.80 1.62 0.07 0.07 0.00 0.0000 0.00
Rubber-tired Loaders 203 0.36 0 5 1.3 0 0.34 1.36 4.16 0.14 0.13 0.00 0.0000 0.00
Trenchers 78 0.50 0 5 2.0 0 0.57 3.31 5.09 0.39 0.36 0.00 0.0000 0.00
Vibratory Post Driver 172 0.42 0 4 0.9 0 0.25 1.87 2.73 0.14 0.13 0.00 0.0000 0.00
2.6 24.7 25.6 1.5 1.4 0.0 0.000 0.0
BHPLoad
Factor
Length
(wkday)
hrs/
day
Avg Daily
Number
total
hoursROG CO NOX PM10 PM2.5 CO2 CH4 CO2e
None 22 0.00 0.00 0.00 0.00 0.00 0.00 0.0000 0.00
0.0 0.0 0.0 0.0 0.0 0.0 0.000 0.0
CO2 CH4 CO2e
113.6 0.035 114.5
Equipment Type
Activity
Criteria Emissions (lbs/d)
GHG Emissions (tonnes)
GHG Emissions (tonnes)
Criteria Emissions (lbs/d)
Equipment Type
Activity
GHG Emissions (tonnes)
Phase 3 - PV Panel Construction
Phase 4 - Testing and Commissioning - (no offroad activity)
Totals
Totals
OB-1 Air Analyses Page L-2 - 11 of 17 Revised March 2018

Air Quality/Climate Change Calculations Laurel 2 Solar Farm
EF PM10 = 0.000057
Constant Value
k = 0.016
sL = 0.1
W = 2.2
EF PM10 = 0.086
Constant Value
k = 1.8
s = 4.3%
S = 40
M = 0.5%
Entrained Road Dust
(k × (s ÷ 12) × 1.0 × (S ÷ 30) × 0.5 ) ÷ ( (M ÷ 0.5) × 0.2 = lbs PM10/VMT
Description
the fraction of particles less than or equal to the particle size
cutoff of 10 microns
surface material silt content (%)
(allowable range [1.8 - 25.2 %])
Description
particle size multiplier for particle size range and units of
interest
road surface silt loading in g/m2 (allowable range is 0.02 to
400 g/m2)
average weight of the vehicles traveling the road in
megagrams (mean average fleet vehicle weight ranging from
1.8 - 39 megagrams or 2.0 - 42 tons)
Emission Factors - Unpaved Roads
Entrained road dust emissions are generated by vehicles traveling on both paved and unpaved roads. These
equations are based on the paved and unpaved roads emission factors found in AP-42. Defaults are from
URBEMIS.
Emission Factors - Paved Roadsk × (sL ÷ 2) × 0.65 × (W ÷ 3) × 1.5 = lbs PM10/VMT
the average vehicle speed (mph)
(allowable range [10 - 43 mph])
surface moisture content (%)
(allowable range 0.03 – 13 %)
OB-1 Air Analyses Page L-2 - 12 of 17 Revised March 2018
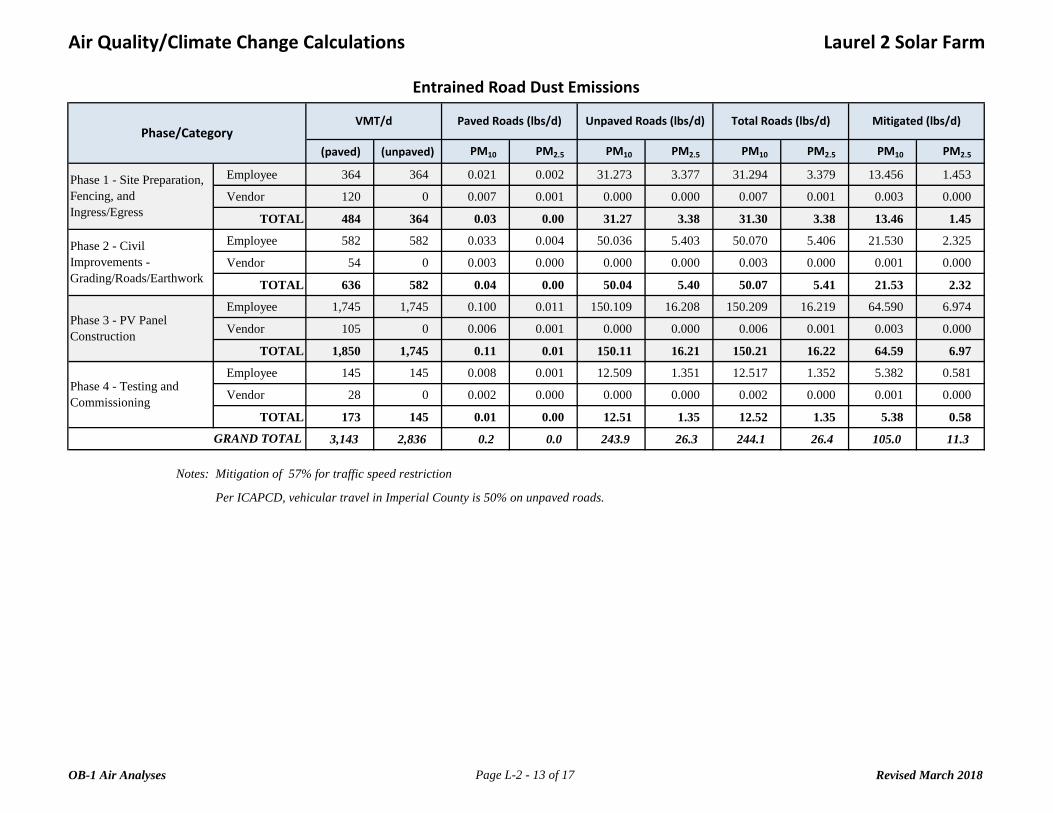
Air Quality/Climate Change Calculations Laurel 2 Solar Farm
(paved) (unpaved) PM10 PM2.5 PM10 PM2.5 PM10 PM2.5 PM10 PM2.5
Employee 364 364 0.021 0.002 31.273 3.377 31.294 3.379 13.456 1.453
Vendor 120 0 0.007 0.001 0.000 0.000 0.007 0.001 0.003 0.000
TOTAL 484 364 0.03 0.00 31.27 3.38 31.30 3.38 13.46 1.45
Employee 582 582 0.033 0.004 50.036 5.403 50.070 5.406 21.530 2.325
Vendor 54 0 0.003 0.000 0.000 0.000 0.003 0.000 0.001 0.000
TOTAL 636 582 0.04 0.00 50.04 5.40 50.07 5.41 21.53 2.32
Employee 1,745 1,745 0.100 0.011 150.109 16.208 150.209 16.219 64.590 6.974
Vendor 105 0 0.006 0.001 0.000 0.000 0.006 0.001 0.003 0.000
TOTAL 1,850 1,745 0.11 0.01 150.11 16.21 150.21 16.22 64.59 6.97
Employee 145 145 0.008 0.001 12.509 1.351 12.517 1.352 5.382 0.581
Vendor 28 0 0.002 0.000 0.000 0.000 0.002 0.000 0.001 0.000
TOTAL 173 145 0.01 0.00 12.51 1.35 12.52 1.35 5.38 0.58
3,143 2,836 0.2 0.0 243.9 26.3 244.1 26.4 105.0 11.3
Notes:
Per ICAPCD, vehicular travel in Imperial County is 50% on unpaved roads.
Entrained Road Dust Emissions
Phase/CategoryPaved Roads (lbs/d) Unpaved Roads (lbs/d) Mitigated (lbs/d)
Mitigation of 57% for traffic speed restriction
Total Roads (lbs/d)VMT/d
GRAND TOTAL
Phase 1 - Site Preparation,
Fencing, and
Ingress/Egress
Phase 2 - Civil
Improvements -
Grading/Roads/Earthwork
Phase 3 - PV Panel
Construction
Phase 4 - Testing and
Commissioning
OB-1 Air Analyses Page L-2 - 13 of 17 Revised March 2018

Air Quality/Climate Change Calculations Laurel 2 Solar Farm
EF PM15 = 0.051 × S2.0
= 2.571
EF PMTSP = 0.04 × S2.5
= 5.373
S = 7.1
EF PM10 = EFPM15 × FPM10 = 1.5
EF PM2.5 = EFPMTSP × FPM2.5 = 0.167
F PM10 = 0.6
F PM2.5 = 0.031
Emissions (lb) = EF × VMTG 38
lbs/d
PM10 0.781
PM2.5 0.084
where VMT = 19.3
A S = 28
W b = 12Blade width of the grading equipment. (default based on Caterpillar’s 140 Motor
Grader.
The grading dust emissions are calculated by multiplying the emission factors with the total vehicle miles traveled
(VMT) for the grading equipment (i.e., grader). The VMT for grader (VMTG) are estimated based on the dimensions
of the grading area and the blade width of the grading equipment.
Emissions
# of Days =
total lbs
29.69
3.21
Emissions
AS ÷ Wb × ft2 per acre ÷ ft per mile =
Pollutant
mean vehicle speed (mph). The AP-42 default value is
Grading Fugitive Dust
Fugitive dust emissions from grading equipment passes are estimated using the methodology described in Section 11.9,
Western Surface Coal Mining, of the EPA AP-42.
AP-42 estimates the emission factor of PM10 applying a scaling factor to that of PM15. Similarly, the emission factor of
PM2.5 is scaled from that of total suspended particulates (TSP). The equations used to calculate the emission factors for
PM15 and TSP and the scaling factor for those of PM10 and PM2.5 are presented below:
Emission Factors (lbs/day)
PM 10 scaling factor. The AP-42 default value is
PM 2.5 scaling factor. The AP-42 default value is
grading will occur only on approximately 10% of gross acreage for roads
OB-1 Air Analyses Page L-2 - 14 of 17 Revised March 2018
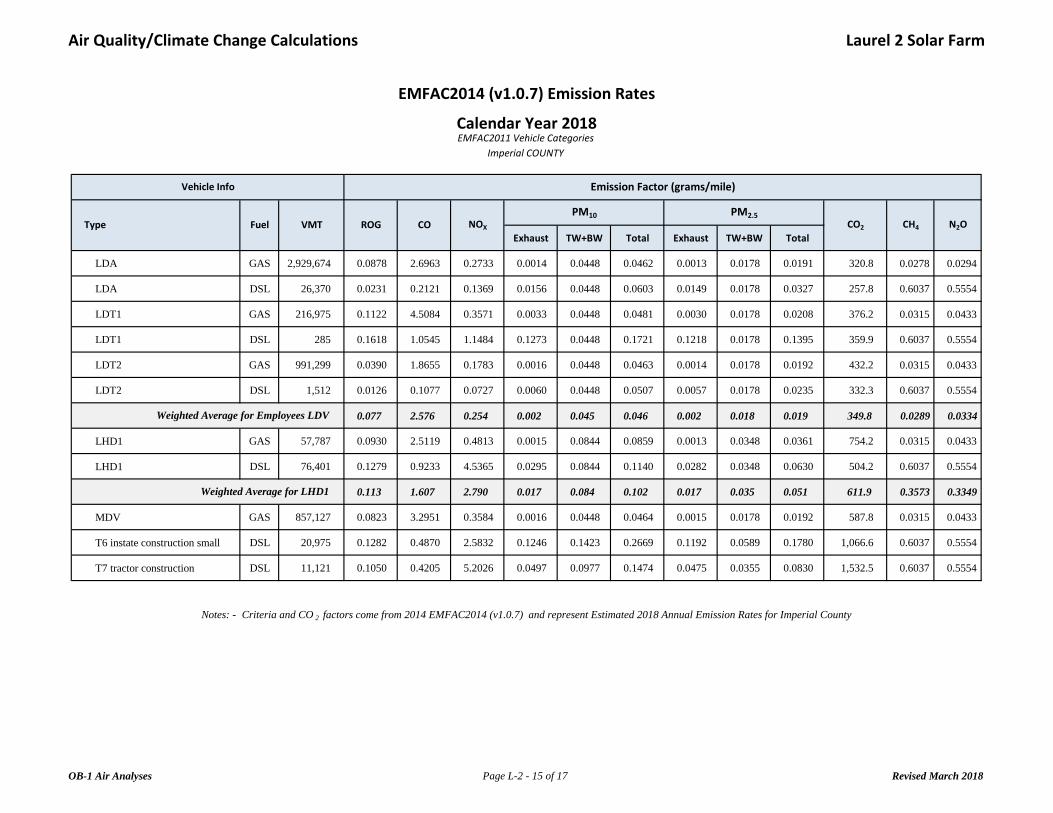
Air Quality/Climate Change Calculations Laurel 2 Solar Farm
Exhaust TW+BW Total Exhaust TW+BW Total
LDA GAS 2,929,674 0.0878 2.6963 0.2733 0.0014 0.0448 0.0462 0.0013 0.0178 0.0191 320.8 0.0278 0.0294
LDA DSL 26,370 0.0231 0.2121 0.1369 0.0156 0.0448 0.0603 0.0149 0.0178 0.0327 257.8 0.6037 0.5554
LDT1 GAS 216,975 0.1122 4.5084 0.3571 0.0033 0.0448 0.0481 0.0030 0.0178 0.0208 376.2 0.0315 0.0433
LDT1 DSL 285 0.1618 1.0545 1.1484 0.1273 0.0448 0.1721 0.1218 0.0178 0.1395 359.9 0.6037 0.5554
LDT2 GAS 991,299 0.0390 1.8655 0.1783 0.0016 0.0448 0.0463 0.0014 0.0178 0.0192 432.2 0.0315 0.0433
LDT2 DSL 1,512 0.0126 0.1077 0.0727 0.0060 0.0448 0.0507 0.0057 0.0178 0.0235 332.3 0.6037 0.5554
0.077 2.576 0.254 0.002 0.045 0.046 0.002 0.018 0.019 349.8 0.0289 0.0334
LHD1 GAS 57,787 0.0930 2.5119 0.4813 0.0015 0.0844 0.0859 0.0013 0.0348 0.0361 754.2 0.0315 0.0433
LHD1 DSL 76,401 0.1279 0.9233 4.5365 0.0295 0.0844 0.1140 0.0282 0.0348 0.0630 504.2 0.6037 0.5554
0.113 1.607 2.790 0.017 0.084 0.102 0.017 0.035 0.051 611.9 0.3573 0.3349
MDV GAS 857,127 0.0823 3.2951 0.3584 0.0016 0.0448 0.0464 0.0015 0.0178 0.0192 587.8 0.0315 0.0433
T6 instate construction small DSL 20,975 0.1282 0.4870 2.5832 0.1246 0.1423 0.2669 0.1192 0.0589 0.1780 1,066.6 0.6037 0.5554
T7 tractor construction DSL 11,121 0.1050 0.4205 5.2026 0.0497 0.0977 0.1474 0.0475 0.0355 0.0830 1,532.5 0.6037 0.5554
Notes: -
Weighted Average for Employees LDV
Fuel NOX N2OPM2.5PM10
Weighted Average for LHD1
EMFAC2014 (v1.0.7) Emission Rates
Calendar Year 2018EMFAC2011 Vehicle Categories
Imperial COUNTY
Emission Factor (grams/mile)
VMT ROG CO CO2 CH4
Criteria and CO 2 factors come from 2014 EMFAC2014 (v1.0.7) and represent Estimated 2018 Annual Emission Rates for Imperial County
Vehicle Info
Type
OB-1 Air Analyses Page L-2 - 15 of 17 Revised March 2018

Air Quality/Climate Change Calculations Laurel 2 Solar Farm
ROG CO NOX PM10 PM2.5 CO2 CH4
Air Compressors 78 0.48 0.603 3.744 4.050 0.304 0.304 568.3 0.054
Crawler Tractors 212 0.43 0.555 3.421 5.859 0.325 0.299 494.9 0.154
Generator Sets 84 0.74 0.461 6.418 3.752 0.239 0.239 568.3 0.041
Graders 187 0.41 0.384 1.416 5.271 0.171 0.156 497.4 0.155
Off-highway truck 402 0.38 0.287 1.560 3.090 0.113 0.104 493.5 0.154
Other Construction Equipment 172 0.42 0.436 3.263 4.755 0.250 0.230 493.4 0.154
Plate Compactor 8 0.43 0.661 3.469 4.142 0.161 0.161 568.3 0.059
Rollers 80 0.38 0.481 3.610 1.650 0.320 0.294 492.2 0.153
Rough Terrain Forklifts 100 0.40 0.222 3.270 2.945 0.136 0.125 491.2 0.153
Rubber Tired Loaders 203 0.36 0.333 1.346 4.131 0.140 0.129 487.9 0.152
Scrapers 367 0.48 0.369 2.828 4.568 0.180 0.166 490.8 0.153
Trenchers 78 0.50 0.658 3.855 5.915 0.450 0.414 493.7 0.154
Vibratory post driver * 158 0.38 0.273 3.093 2.924 0.142 0.13 490.7 0.153
*
BHP
2018 Offroad Emission Factors
Emission Factor (g/bhp-hr)Equipment Type
Load
Factor
A vibratory post driver is mounted on an excavator, so excavator emission factors are used
OB-1 Air Analyses Page L-2 - 16 of 17 Revised March 2018

Air Quality/Climate Change Calculations Laurel 2 Solar Farm
PC = 70 MW project capacity
OP = 8,760 hrs/yr annual operating hours
CF = 26% Capacity Factor for NG
EG = 159,432 MWh/yr Project Energy Generated
HR = 6,940 Btu/kWh Combined Cycle Heat Rate for NG
1.11E+12 Btu/yr or
1,106,458 MMBtu/yr
CO2 = 53.02
CH4 = 0.0009
N2O = 0.0028
CO2e = 53.91
58,664 tCO2/yr
0.996 tCH4/yr
3.098 tN2O/yr
59,646 tCO 2 e/yr
Emissions = EF x NG eq x 0.100 (t/kg)
NG eq = HR x EG x 1000 (kWh/MWh)
NGeq =
Emission Factors (EF)
kg/MMBtu Climate Registry Default Factors
GHG Emissions
Emissions Associated with Power Generation Using
Natural Gas as Fuel
Constants
Project Energy Generated (EG)
EG = PC x OP x CF
Natural Gas Equivalent (NGeq)
OB-1 Air Analyses Page L-2 - 17 of 17 Revised March 2018

Air Quality/Climate Change Calculations Laurel 3 Solar Farm
ActivityWorkdays
per Year
Trips per
day
Round Trip
(mi)
VMT per
day
Anual VMT
(mi)
Pickup Trucks LDT2 244 0.50 10 5 1,220
Utility/Service Vehicles T6 244 0.17 10 2 415
Water Truck T7 244 0.25 10 3 610
Worker Commute * LDA+ 244 5.00 30 150 36,600
Carpenter Service Vehicle LHD1 244 0.25 30 8 1,830
Electrical Service Vehicle LHD1 244 0.25 30 8 1,830
Equipment/Material Delivery MDV 244 0.07 30 2 512
176 43,017
ROG CO NOX PM10 PM2.5
0.000 0.021 0.002 0.001 0.000
0.000 0.007 0.001 0.000 0.000
0.000 0.010 0.001 0.000 0.000
0.001 0.038 0.004 0.001 0.000
0.013 0.617 0.059 0.015 0.006
0.001 0.031 0.003 0.001 0.000
0.001 0.031 0.003 0.001 0.000
0.000 0.009 0.001 0.000 0.000
0.014 0.687 0.066 0.017 0.007
0.02 0.73 0.07 0.02 0.01
CO2 CH4 N2O CO2e
0.53 0.0000 0.0001 0.54
0.44 0.0003 0.0002 0.52
0.65 0.0004 0.0003 0.76
12.80 0.0011 0.0012 13.20
1.38 0.0001 0.0001 1.41
1.38 0.0001 0.0001 1.41
0.30 0.0000 0.0000 0.31
17.5 0.0018 0.0020 18.2
*
Totals
Operational Criteria Emissions
Activity Vehicle TypePounds per Day
Operational Emissions
Operational Vehicle Activity
Vehicle Type
On
-sit
eO
ff-s
ite
Totals
Operational GHG Emissions
Activity Vehicle TypeTotal Tonnes
Pickup Trucks
Utility/Service Vehicles
Off
-sit
e
Totals
Worker commute trips per day was estimated based on 5 employees
On
-sit
e
Water Truck
Worker Commute
Carpenter Service Vehicle
Electrical Service Vehicle
Equipment/Material Delivery
On
-sit
eO
ff-s
ite
On-site Total
Off-site Total
Carpenter Service Vehicle
Electrical Service Vehicle
Equipment/Material Delivery
Pickup Trucks
Utility/Service Vehicles
Water Truck
Worker Commute
OB-1 Air Analyses Page L-3 - 1 of 17 Revised March 2018

Air Quality/Climate Change Calculations Laurel 3 Solar Farm
CO2 CH4 N2O CO2e
Offroad 45.56 0.0142 N/A 45.92
Vendors 2.63 0.0014 0.0013 3.04
Employees 7.16 0.0006 0.0007 7.38
Phase 1 Total 55.4 0.016 0.002 56.3
Offroad 68.08 0.0212 N/A 68.61
Vendors 2.27 0.0010 0.0009 2.57
Employees 15.48 0.0013 0.0015 15.95
Phase 2 Total 85.8 0.023 0.002 87.1
Offroad 202.44 0.0406 N/A 203.46
Vendors 11.84 0.0055 0.0052 13.52
Employees 159.17 0.0131 0.0152 164.03
Phase 3 Total 373.5 0.059 0.020 381.0
Offroad 0.00 0.0000 N/A 0.00
Vendors 0.41 0.0002 0.0002 0.48
Employees 2.06 0.0002 0.0002 2.13
Phase 4 Total 2.5 0.000 0.000 2.6
517.1 0.099 0.025 527.1
18
18
119,291
-119,256
Construction Amortized over 30 Years
Annual Operational Emissions
Minus Annually Displaced Emissions
Net Project GHG Emissions
CategoryGHG Emissions (tonnes)
GHG Emissions Summary
Phase Activity
Grand Total for Construction
Phase 3 - PV Panel
Construction
Phase 4 - Testing and
Commissioning
Phase 2 - Civil Improvements -
Grading/Roads/Earthwork
Phase 1 - Site Preparation,
Fencing, and Ingress/Egress
OB-1 Air Analyses Page L-3 - 2 of 17 Revised March 2018

Air Quality/Climate Change Calculations Laurel 3 Solar Farm
ROG CO NOX PM10 PM2.5
Phase 1 - Site Preparation, Fencing, and Ingress/Egress 1.17 10.71 13.57 14.04 1.94
Phase 2 - Civil Improvements - Grading/Roads/Earthwork 1.99 17.41 20.90 22.47 3.12
Month 1 Maxmum 3.2 28.1 34.5 36.5 5.1
Phase 1 - Site Preparation, Fencing, and Ingress/Egress 1.17 10.71 13.57 14.04 1.94
Phase 2 - Civil Improvements - Grading/Roads/Earthwork 1.99 17.41 20.90 22.47 3.12
Month 2 Maximum 3.2 28.1 34.5 36.5 5.1
Phase 2 - Civil Improvements - Grading/Roads/Earthwork 1.99 17.41 20.90 22.47 3.12
Month 3 Maximum 2.0 17.4 20.9 22.5 3.1
Phase 3 - PV Panel Construction 3.25 44.85 27.97 66.47 8.55
Month 4 Maximum 3.3 44.9 28.0 66.5 8.5
Phase 3 - PV Panel Construction 3.25 44.85 27.97 66.47 8.55
Month 5 Maximum 3.3 44.9 28.0 66.5 8.5
Phase 3 - PV Panel Construction 3.25 44.85 27.97 66.47 8.55
Month 6 Maximum 3.3 44.9 28.0 66.5 8.5
Phase 3 - PV Panel Construction 3.25 44.85 27.97 66.47 8.55
Month 7 Maximum 3.3 44.9 28.0 66.5 8.5
Phase 3 - PV Panel Construction 3.25 44.85 27.97 66.47 8.55
Phase 4 - Testing and Commissioning 0.06 1.73 0.33 5.42 0.60
Month 9 Maximum 3.3 46.6 28.3 71.9 9.1
Phase 3 - PV Panel Construction 3.25 44.85 27.97 66.47 8.55
Phase 4 - Testing and Commissioning 0.06 1.73 0.33 5.42 0.60
Month 9 Maximum 3.3 46.6 28.3 71.9 9.1
3.3 46.6 34.5 71.9 9.1
75 550 100 150
N N N N
#7
N/A
#2
#3
#4
#5
#6
Mitigated Construction Temporal Summary
Month ActivityPounds per Day
#1
#9
Laurel 2 Solar Farm Maximum Pounds per Day
ICAPCD Thresholds
Exceeds?
#8
OB-1 Air Analyses Page L-3 - 3 of 17 Revised March 2018

Air Quality/Climate Change Calculations Laurel 3 Solar Farm
ROG CO NOX PM10 PM2.5
Phase 1 - Site Preparation, Fencing, and Ingress/Egress 1.17 10.71 13.57 31.88 3.86
Phase 2 - Civil Improvements - Grading/Roads/Earthwork 1.99 17.41 20.90 51.01 6.20
Month 1 Maxmum 3.2 28.1 34.5 82.9 10.1
Phase 1 - Site Preparation, Fencing, and Ingress/Egress 1.17 10.71 13.57 31.88 3.86
Phase 2 - Civil Improvements - Grading/Roads/Earthwork 1.99 17.41 20.90 51.01 6.20
Month 2 Maximum 3.2 28.1 34.5 82.9 10.1
Phase 2 - Civil Improvements - Grading/Roads/Earthwork 1.99 17.41 20.90 51.01 6.20
Month 3 Maximum 2.0 17.4 20.9 51.0 6.2
Phase 3 - PV Panel Construction 3.25 44.85 27.97 152.09 17.79
Month 4 Maximum 3.3 44.9 28.0 152.1 17.8
Phase 3 - PV Panel Construction 3.25 44.85 27.97 152.09 17.79
Month 5 Maximum 3.3 44.9 28.0 152.1 17.8
Phase 3 - PV Panel Construction 3.25 44.85 27.97 152.09 17.79
Month 6 Maximum 3.3 44.9 28.0 152.1 17.8
Phase 3 - PV Panel Construction 3.25 44.85 27.97 152.09 17.79
Month 7 Maximum 3.3 44.9 28.0 152.1 17.8
Phase 3 - PV Panel Construction 3.25 44.85 27.97 152.09 17.79
Phase 4 - Testing and Commissioning 0.06 1.73 0.33 12.56 1.37
Month 9 Maximum 3.3 44.9 28.0 152.1 17.8
Phase 3 - PV Panel Construction 3.25 44.85 27.97 152.09 17.79
Phase 4 - Testing and Commissioning 0.06 1.73 0.33 12.56 1.37
Month 9 Maximum 3.3 46.6 28.3 164.6 19.2
3.3 46.6 34.5 164.6 19.2
75 550 100 150
N N N Y
N/A
Laurel 2 Solar Farm Maximum Pounds per Day
ICAPCD Thresholds
Exceeds?
#5
#8
ActivityPounds per Day
Unmitigated Construction Temporal Summary
#2
Month
#1
#3
#4
#7
#6
#9
OB-1 Air Analyses Page L-3 - 4 of 17 Revised March 2018

Air Quality/Climate Change Calculations Laurel 3 Solar Farm
ROG CO NOX PM10 PM2.5
Off-road 1.02 6.21 12.52 0.46 0.43
Vendors 0.03 0.37 0.64 0.04 0.03
Employees 0.12 4.13 0.41 0.07 0.03
Road Dust -- -- -- 13.46 1.45
Phase 1 Activity Total 1.2 10.7 13.6 14.0 1.9
Off-road 1.78 10.66 19.81 0.80 0.74
Vendors 0.01 0.14 0.43 0.02 0.01
Employees 0.20 6.61 0.65 0.12 0.05
Road Dust -- -- -- 21.53 2.32
Grading Fugitive -- -- -- 1.64 0.18
Phase 2 Activity Total 2.0 17.4 20.9 22.5 3.1
Off-road 2.64 24.69 25.56 1.47 1.40
Vendors 0.03 0.34 0.46 0.04 0.03
Employees 0.59 19.83 1.96 0.36 0.15
Road Dust -- -- -- 64.59 6.97
Phase 3 Activity Total 3.3 44.9 28.0 66.5 8.5
Off-road N/A N/A N/A N/A N/A
Vendors 0.01 0.08 0.17 0.01 0.01
Employees 0.05 1.65 0.16 0.03 0.01
Road Dust -- -- -- 5.38 0.58
Phase 4 Activity Total 0.1 1.7 0.3 5.4 0.6
Phase 2 - Civil
Improvements -
Grading/Roads/
Earthwork
Phase 3 - PV Panel
Construction
Phase 4 - Testing and
Commissioning
Criteria Emissions Summary
Mitigated
Phase Activity CategoryCriteria Emissions (lbs/d)
Phase 1 - Site
Preparation, Fencing,
and Ingress/Egress
OB-1 Air Analyses Page L-3 - 5 of 17 Revised March 2018

Air Quality/Climate Change Calculations Laurel 3 Solar Farm
ROG CO NOX PM10 PM2.5
Off-road 1.02 6.21 12.52 0.46 0.43
Vendors 0.03 0.37 0.64 0.04 0.03
Employees 0.12 4.13 0.41 0.07 0.03
Road Dust -- -- -- 31.30 3.38
Phase 1 Activity Total 1.2 10.7 13.6 31.9 3.9
Off-road 1.78 10.66 19.81 0.80 0.74
Vendors 0.01 0.14 0.43 0.02 0.01
Employees 0.20 6.61 0.65 0.12 0.05
Road Dust -- -- -- 50.07 5.41
Grading Fugitive -- -- -- 1.64 0.18
Phase 2 Activity Total 2.0 17.4 20.9 51.0 6.2
Off-road 2.64 24.69 25.56 1.47 1.40
Vendors 0.03 0.34 0.46 0.04 0.03
Employees 0.59 19.83 1.96 0.36 0.15
Road Dust -- -- -- 150.21 16.22
Phase 3 Activity Total 3.3 44.9 28.0 152.1 17.8
Off-road N/A N/A N/A N/A N/A
Vendors 0.01 0.08 0.17 0.01 0.01
Employees 0.05 1.65 0.16 0.03 0.01
Road Dust -- -- -- 12.52 1.35
Phase 4 Activity Total 0.1 1.7 0.3 12.6 1.4
Phase 2 - Civil
Improvements -
Grading/Roads/
Earthwork
Phase 3 - PV Panel
Construction
Phase 4 - Testing and
Commissioning
Criteria Emissions Summary
Phase Activity CategoryCriteria Emissions (lbs/d)
Phase 1 - Site
Preparation, Fencing,
and Ingress/Egress
Unmitigated
OB-1 Air Analyses Page L-3 - 6 of 17 Revised March 2018

Air Quality/Climate Change Calculations Laurel 3 Solar Farm
ActivityTotal Work
Days
Trips per
day *
Round Trip
(mi)
VMT per
day
Total VMT
(mi)
Phase 1 - Site Preparation, Fencing, and Ingress/Egress 28 23 32 727 20,462
Phase 2 - Civil Improvements - Grading/Roads/Earthwork 38 36 32 1,164 44,242
Phase 3 - PV Panel Construction 130 109 32 3,491 455,065
Phase 4 - Testing and Commissioning 20 9 32 291 5,899
5,673 525,668
ROG CO NOX PM10 PM2.5
Phase 1 - Site Preparation, Fencing, and Ingress/Egress 0.124 4.131 0.408 0.074 0.031
Phase 2 - Civil Improvements - Grading/Roads/Earthwork 0.198 6.609 0.652 0.119 0.049
Phase 3 - PV Panel Construction 0.593 19.827 1.957 0.357 0.148
Phase 4 - Testing and Commissioning 0.049 1.652 0.163 0.030 0.012
Totals 0.96 32.22 3.18 0.58 0.24
CO2 CH4 N2O CO2e
Phase 1 - Site Preparation, Fencing, and Ingress/Egress 7.16 0.0006 0.0007 7.38
Phase 2 - Civil Improvements - Grading/Roads/Earthwork 15.48 0.0013 0.0015 15.95
Phase 3 - PV Panel Construction 159.17 0.0131 0.0152 164.03
Phase 4 - Testing and Commissioning 2.06 0.0002 0.0002 2.13
Totals 183.9 0.015 0.018 189.5
Construction Employee Commute
Construction Employee GHG Emissions
ActivityTotal Tonnes
Totals
Construction Employee Criteria Emissions
ActivityPounds per Day
Construction Employee Vehicle Activity
* Trips per day modified to reflect a conservative 1.1 persons per vehicle carpool rate
OB-1 Air Analyses Page L-3 - 7 of 17 Revised March 2018

Air Quality/Climate Change Calculations Laurel 3 Solar Farm
Activity Phase Vehicle Type (EMFAC)Days per
Phase
Trips per
day
Round Trip
(mi)
VMT per
day
Total VMT
(mi)
MDV 28 0.50 30 15 422
LHD1 28 2.00 30 60 1,688
T6 instate construction small 28 1.50 30 45 1,266
120 3,376
T7 tractor construction 38 0.25 107 27 1,017
T6 instate construction small 38 0.16 30 5 185
MDV 38 0.25 30 8 285
LHD1 38 0.50 30 15 570
54 2,057
T6 instate construction small 130 2.00 30 60 7,821
MDV 130 1.00 30 30 3,911
LHD1 130 0.50 30 15 1,955
105 13,688
T6 instate construction small 20 0.25 30 8 152
LHD1 20 0.67 30 20 406
28 558
307 19,679
ROG CO NOX PM10 PM2.5
MDV 0.003 0.109 0.012 0.002 0.001
LHD1 0.015 0.213 0.369 0.013 0.007
T6 instate construction small 0.013 0.048 0.256 0.026 0.018
Phase 1 Total 0.03 0.37 0.64 0.04 0.03
T7 tractor construction 0.006 0.025 0.307 0.009 0.005
T6 instate construction small 0.001 0.005 0.028 0.003 0.002
MDV 0.001 0.054 0.006 0.001 0.000
LHD1 0.004 0.053 0.092 0.003 0.002
Phase 2 Total 0.01 0.14 0.43 0.02 0.01
T6 instate construction small 0.017 0.064 0.342 0.035 0.024
MDV 0.005 0.218 0.024 0.003 0.001
LHD1 0.004 0.053 0.092 0.003 0.002
Phase 3 Total 0.03 0.34 0.46 0.04 0.03
T6 instate construction small 0.002 0.008 0.043 0.004 0.003
LHD1 0.005 0.071 0.123 0.004 0.002
Phase 4 Total 0.01 0.08 0.17 0.01 0.01
0.08 0.92 1.69 0.11 0.07
Phase 3 - PV Panel Construction
Phase 4 - Testing and Commissioning
For trips for PV panel delivery (which come from Port of San Diego), which use T7 trucks, only 1-way mileage was used due to back haul.
Vendor Activity
Activity Phase
Phase 2 - Civil Improvements -
Grading/Roads/Earthwork
Phase 4 - Testing and Commissioning
Phase 1 Total
Phase 2 Total
Phase 3 Total
Phase 4 Total
Pounds per Day
Vendors Vehicle Activity
Vendors Criteria Emissions
Phase 3 - PV Panel Construction
Phase 1 - Site Preparation, Fencing,
and Ingress/Egress
Vehicle Type (EMFAC)
Big Rock 1 Totals
Big Rock 1 Totals
Phase 1 - Site Preparation, Fencing,
and Ingress/Egress
Phase 2 - Civil Improvements -
Grading/Roads/Earthwork
OB-1 Air Analyses Page L-3 - 8 of 17 Revised March 2018

Air Quality/Climate Change Calculations Laurel 3 Solar Farm
CO2 CH4 N2O CO2e
MDV 0.25 0.0000 0.0000 0.25
LHD1 1.03 0.0006 0.0006 1.22
T6 instate construction small 1.35 0.0008 0.0007 1.58
Phase 1 Total 2.6 0.001 0.001 3.0
T7 tractor construction 1.56 0.0006 0.0006 1.74
T6 instate construction small 0.20 0.0001 0.0001 0.23
MDV 0.17 0.0000 0.0000 0.18
LHD1 0.35 0.0002 0.0002 0.41
Phase 2 Total 2.3 0.001 0.001 2.6
T6 instate construction small 8.34 0.0047 0.0043 9.75
MDV 2.30 0.0001 0.0002 2.35
LHD1 1.20 0.0007 0.0007 1.41
Phase 3 Total 11.8 0.006 0.005 13.5
T6 instate construction small 0.16 0.0001 0.0001 0.19
LHD1 0.25 0.0001 0.0001 0.29
Phase 4 Total 0.4 0.000 0.000 0.5
17.2 0.0081 0.0076 19.6Big Rock 1 Totals
Vehicle Type (EMFAC)
Phase 4 - Testing and Commissioning
Phase 3 - PV Panel Construction
Phase 2 - Civil Improvements -
Grading/Roads/Earthwork
Phase 1 - Site Preparation, Fencing,
and Ingress/Egress
Activity Phase
Vendors GHG EmissionsTotal Tonnes
OB-1 Air Analyses Page L-3 - 9 of 17 Revised March 2018

Air Quality/Climate Change Calculations Laurel 3 Solar Farm
BHPLoad
Factor
Length
(wkday)
hrs/
day
Avg Daily
Number
total
hoursROG CO NOX PM10 PM2.5 CO2 CH4 CO2e
Crawler Tractors 212 0.43 28 5 1.0 141 0.56 3.44 5.89 0.33 0.30 6.35 0.0020 6.40
Graders 187 0.41 28 6 1.0 169 0.39 1.44 5.35 0.17 0.16 6.44 0.0020 6.49
Off-highway Trucks 402 0.38 28 7 1.0 197 0.68 3.68 7.28 0.27 0.25 14.85 0.0046 14.96
Plate Compactor 8 0.43 28 4 0.8 113 0.02 0.08 0.10 0.00 0.00 0.18 0.0000 0.18
Rubber-tired Loaders 203 0.36 28 8 1.0 225 0.43 1.74 5.32 0.18 0.17 8.03 0.0025 8.09
Scrapers 367 0.48 28 5 0.8 141 0.57 4.39 7.10 0.28 0.26 9.73 0.0030 9.81
1.0 6.2 12.5 0.5 0.4 45.6 0.014 45.9
BHPLoad
Factor
Length
(wkday)
hrs/
day
Avg Daily
Number
total
hoursROG CO NOX PM10 PM2.5 CO2 CH4 CO2e
Crawler Tractors 212 0.43 38 8 1.0 304 0.89 5.50 9.42 0.52 0.48 13.72 0.0043 13.83
Graders 187 0.41 38 6 1.0 228 0.39 1.44 5.35 0.17 0.16 8.70 0.0027 8.77
Off-highway Trucks 402 0.38 38 7 1.0 266 0.68 3.68 7.28 0.27 0.25 20.06 0.0063 20.22
Rollers 80 0.38 38 4 1.0 152 0.13 0.97 0.44 0.09 0.08 2.28 0.0007 2.29
Rubber-tired Loaders 203 0.36 38 5 1.5 190 0.40 1.63 4.99 0.17 0.16 10.17 0.0032 10.25
Scrapers 367 0.48 38 4 1.0 152 0.57 4.39 7.10 0.28 0.26 13.15 0.0041 13.25
1.8 10.7 19.8 0.8 0.7 68.1 0.021 68.6
Totals
Equipment Type
Activity
Totals
Unmitigated Offroad Equipment Emissions
Criteria Emissions (lbs/d)
Phase 1 - Site Preparation, Fencing, and Ingress/Egress
Equipment Type
Activity Criteria Emissions (lbs/d) GHG Emissions (tonnes)
Phase 2 - Civil Improvements - Grading/Roads/Earthwork
GHG Emissions (tonnes)
OB-1 Air Analyses Page L-3 - 10 of 17 Revised March 2018

Air Quality/Climate Change Calculations Laurel 3 Solar Farm
BHPLoad
Factor
Length
(wkday)
hrs/
day
Avg Daily
Number
total
hoursROG CO NOX PM10 PM2.5 CO2 CH4 CO2e
Air Compressors 78 0.48 130 8 1.0 1,043 0.40 2.47 2.67 0.20 0.20 22.19 0.0021 22.24
Crawler Tractors 212 0.43 130 4 0.6 521 0.27 1.65 2.83 0.16 0.14 14.12 0.0044 14.22
Generator Sets 84 0.74 130 8 2.0 1,043 1.01 14.07 8.23 0.52 0.52 73.68 0.0053 73.81
Oher construction equipment 172 0.42 130 2 0.6 261 0.08 0.62 0.91 0.05 0.04 5.58 0.0017 5.62
Rough Terrain Forklifts 100 0.40 130 5 1.3 652 0.12 1.80 1.62 0.07 0.07 16.01 0.0050 16.13
Rubber-tired Loaders 203 0.36 130 5 1.3 652 0.34 1.36 4.16 0.14 0.13 29.05 0.0091 29.28
Trenchers 78 0.50 130 5 2.0 652 0.57 3.31 5.09 0.39 0.36 25.10 0.0078 25.30
Vibratory Post Driver 172 0.42 130 4 0.9 521 0.25 1.87 2.73 0.14 0.13 16.73 0.0052 16.86
2.6 24.7 25.6 1.5 1.4 202.4 0.041 203.5
BHPLoad
Factor
Length
(wkday)
hrs/
day
Avg Daily
Number
total
hoursROG CO NOX PM10 PM2.5 CO2 CH4 CO2e
None 20 0.00 0.00 0.00 0.00 0.00 0.00 0.0000 0.00
0.0 0.0 0.0 0.0 0.0 0.0 0.000 0.0
CO2 CH4 CO2e
316.1 0.076 318.0
Equipment Type
Activity
Criteria Emissions (lbs/d)
GHG Emissions (tonnes)
GHG Emissions (tonnes)
Criteria Emissions (lbs/d)
Equipment Type
Activity
GHG Emissions (tonnes)
Phase 3 - PV Panel Construction
Phase 4 - Testing and Commissioning - (no offroad activity)
Totals
Totals
OB-1 Air Analyses Page L-3 - 11 of 17 Revised March 2018

Air Quality/Climate Change Calculations Laurel 3 Solar Farm
EF PM10 = 0.000057
Constant Value
k = 0.016
sL = 0.1
W = 2.2
EF PM10 = 0.086
Constant Value
k = 1.8
s = 4.3%
S = 40
M = 0.5%
Entrained Road Dust
(k × (s ÷ 12) × 1.0 × (S ÷ 30) × 0.5 ) ÷ ( (M ÷ 0.5) × 0.2 = lbs PM10/VMT
Description
the fraction of particles less than or equal to the particle size
cutoff of 10 microns
surface material silt content (%)
(allowable range [1.8 - 25.2 %])
Description
particle size multiplier for particle size range and units of
interest
road surface silt loading in g/m2 (allowable range is 0.02 to
400 g/m2)
average weight of the vehicles traveling the road in
megagrams (mean average fleet vehicle weight ranging from
1.8 - 39 megagrams or 2.0 - 42 tons)
Emission Factors - Unpaved Roads
Entrained road dust emissions are generated by vehicles traveling on both paved and unpaved roads. These
equations are based on the paved and unpaved roads emission factors found in AP-42. Defaults are from
URBEMIS.
Emission Factors - Paved Roadsk × (sL ÷ 2) × 0.65 × (W ÷ 3) × 1.5 = lbs PM10/VMT
the average vehicle speed (mph)
(allowable range [10 - 43 mph])
surface moisture content (%)
(allowable range 0.03 – 13 %)
OB-1 Air Analyses Page L-3 - 12 of 17 Revised March 2018

Air Quality/Climate Change Calculations Laurel 3 Solar Farm
(paved) (unpaved) PM10 PM2.5 PM10 PM2.5 PM10 PM2.5 PM10 PM2.5
Employee 364 364 0.021 0.002 31.273 3.377 31.294 3.379 13.456 1.453
Vendor 120 0 0.007 0.001 0.000 0.000 0.007 0.001 0.003 0.000
TOTAL 484 364 0.03 0.00 31.27 3.38 31.30 3.38 13.46 1.45
Employee 582 582 0.033 0.004 50.036 5.403 50.070 5.406 21.530 2.325
Vendor 54 0 0.003 0.000 0.000 0.000 0.003 0.000 0.001 0.000
TOTAL 636 582 0.04 0.00 50.04 5.40 50.07 5.41 21.53 2.32
Employee 1,745 1,745 0.100 0.011 150.109 16.208 150.209 16.219 64.590 6.974
Vendor 105 0 0.006 0.001 0.000 0.000 0.006 0.001 0.003 0.000
TOTAL 1,850 1,745 0.11 0.01 150.11 16.21 150.21 16.22 64.59 6.97
Employee 145 145 0.008 0.001 12.509 1.351 12.517 1.352 5.382 0.581
Vendor 28 0 0.002 0.000 0.000 0.000 0.002 0.000 0.001 0.000
TOTAL 173 145 0.01 0.00 12.51 1.35 12.52 1.35 5.38 0.58
3,143 2,836 0.2 0.0 243.9 26.3 244.1 26.4 105.0 11.3
Notes:
Per ICAPCD, vehicular travel in Imperial County is 50% on unpaved roads.
Entrained Road Dust Emissions
Phase/CategoryPaved Roads (lbs/d) Unpaved Roads (lbs/d) Mitigated (lbs/d)
Mitigation of 57% for traffic speed restriction
Total Roads (lbs/d)VMT/d
GRAND TOTAL
Phase 1 - Site Preparation,
Fencing, and
Ingress/Egress
Phase 2 - Civil
Improvements -
Grading/Roads/Earthwork
Phase 3 - PV Panel
Construction
Phase 4 - Testing and
Commissioning
OB-1 Air Analyses Page L-3 - 13 of 17 Revised March 2018
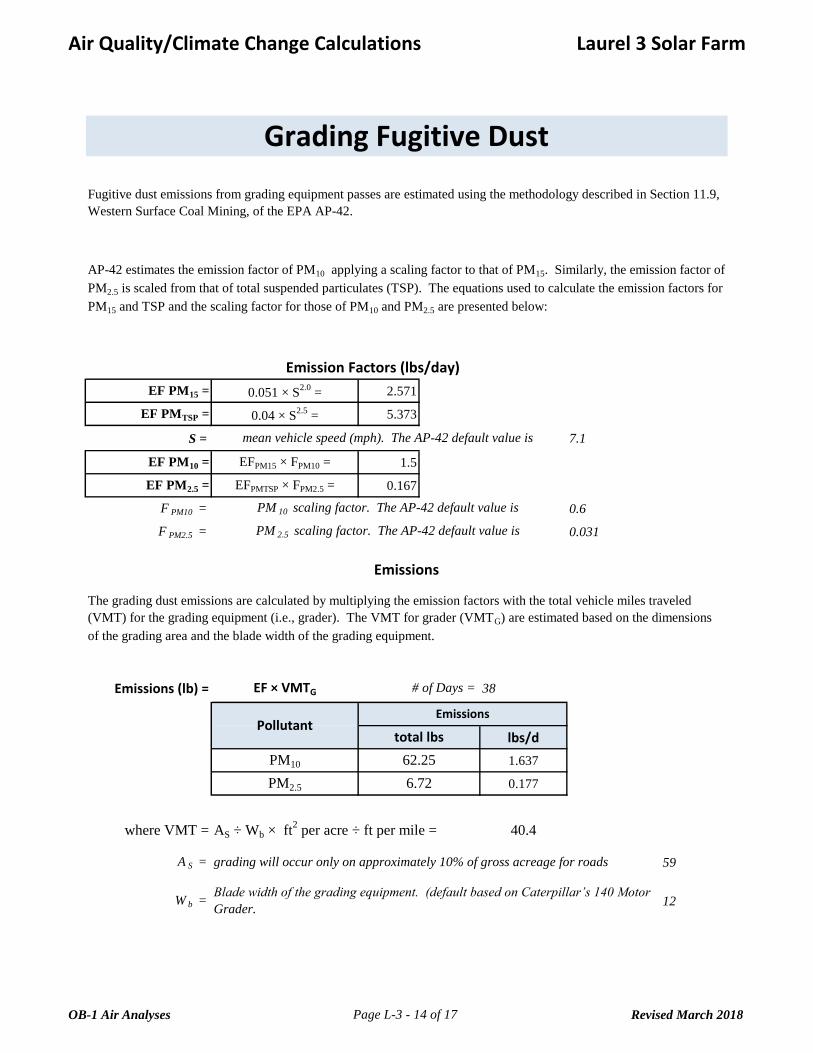
Air Quality/Climate Change Calculations Laurel 3 Solar Farm
EF PM15 = 0.051 × S2.0
= 2.571
EF PMTSP = 0.04 × S2.5
= 5.373
S = 7.1
EF PM10 = EFPM15 × FPM10 = 1.5
EF PM2.5 = EFPMTSP × FPM2.5 = 0.167
F PM10 = 0.6
F PM2.5 = 0.031
Emissions (lb) = EF × VMTG 38
lbs/d
PM10 1.637
PM2.5 0.177
where VMT = 40.4
A S = 59
W b = 12Blade width of the grading equipment. (default based on Caterpillar’s 140 Motor
Grader.
The grading dust emissions are calculated by multiplying the emission factors with the total vehicle miles traveled
(VMT) for the grading equipment (i.e., grader). The VMT for grader (VMTG) are estimated based on the dimensions
of the grading area and the blade width of the grading equipment.
Emissions
# of Days =
total lbs
62.25
6.72
Emissions
AS ÷ Wb × ft2 per acre ÷ ft per mile =
Pollutant
mean vehicle speed (mph). The AP-42 default value is
Grading Fugitive Dust
Fugitive dust emissions from grading equipment passes are estimated using the methodology described in Section 11.9,
Western Surface Coal Mining, of the EPA AP-42.
AP-42 estimates the emission factor of PM10 applying a scaling factor to that of PM15. Similarly, the emission factor of
PM2.5 is scaled from that of total suspended particulates (TSP). The equations used to calculate the emission factors for
PM15 and TSP and the scaling factor for those of PM10 and PM2.5 are presented below:
Emission Factors (lbs/day)
PM 10 scaling factor. The AP-42 default value is
PM 2.5 scaling factor. The AP-42 default value is
grading will occur only on approximately 10% of gross acreage for roads
OB-1 Air Analyses Page L-3 - 14 of 17 Revised March 2018

Air Quality/Climate Change Calculations Laurel 3 Solar Farm
Exhaust TW+BW Total Exhaust TW+BW Total
LDA GAS 2,929,674 0.0878 2.6963 0.2733 0.0014 0.0448 0.0462 0.0013 0.0178 0.0191 320.8 0.0278 0.0294
LDA DSL 26,370 0.0231 0.2121 0.1369 0.0156 0.0448 0.0603 0.0149 0.0178 0.0327 257.8 0.6037 0.5554
LDT1 GAS 216,975 0.1122 4.5084 0.3571 0.0033 0.0448 0.0481 0.0030 0.0178 0.0208 376.2 0.0315 0.0433
LDT1 DSL 285 0.1618 1.0545 1.1484 0.1273 0.0448 0.1721 0.1218 0.0178 0.1395 359.9 0.6037 0.5554
LDT2 GAS 991,299 0.0390 1.8655 0.1783 0.0016 0.0448 0.0463 0.0014 0.0178 0.0192 432.2 0.0315 0.0433
LDT2 DSL 1,512 0.0126 0.1077 0.0727 0.0060 0.0448 0.0507 0.0057 0.0178 0.0235 332.3 0.6037 0.5554
0.077 2.576 0.254 0.002 0.045 0.046 0.002 0.018 0.019 349.8 0.0289 0.0334
LHD1 GAS 57,787 0.0930 2.5119 0.4813 0.0015 0.0844 0.0859 0.0013 0.0348 0.0361 754.2 0.0315 0.0433
LHD1 DSL 76,401 0.1279 0.9233 4.5365 0.0295 0.0844 0.1140 0.0282 0.0348 0.0630 504.2 0.6037 0.5554
0.113 1.607 2.790 0.017 0.084 0.102 0.017 0.035 0.051 611.9 0.3573 0.3349
MDV GAS 857,127 0.0823 3.2951 0.3584 0.0016 0.0448 0.0464 0.0015 0.0178 0.0192 587.8 0.0315 0.0433
T6 instate construction small DSL 20,975 0.1282 0.4870 2.5832 0.1246 0.1423 0.2669 0.1192 0.0589 0.1780 1,066.6 0.6037 0.5554
T7 tractor construction DSL 11,121 0.1050 0.4205 5.2026 0.0497 0.0977 0.1474 0.0475 0.0355 0.0830 1,532.5 0.6037 0.5554
Notes: -
Weighted Average for Employees LDV
Fuel NOX N2OPM2.5PM10
Weighted Average for LHD1
EMFAC2014 (v1.0.7) Emission Rates
Calendar Year 2018EMFAC2011 Vehicle Categories
Imperial COUNTY
Emission Factor (grams/mile)
VMT ROG CO CO2 CH4
Criteria and CO 2 factors come from 2014 EMFAC2014 (v1.0.7) and represent Estimated 2018 Annual Emission Rates for Imperial County
Vehicle Info
Type
OB-1 Air Analyses Page L-3 - 15 of 17 Revised March 2018

Air Quality/Climate Change Calculations Laurel 3 Solar Farm
ROG CO NOX PM10 PM2.5 CO2 CH4
Air Compressors 78 0.48 0.603 3.744 4.050 0.304 0.304 568.3 0.054
Crawler Tractors 212 0.43 0.555 3.421 5.859 0.325 0.299 494.9 0.154
Generator Sets 84 0.74 0.461 6.418 3.752 0.239 0.239 568.3 0.041
Graders 187 0.41 0.384 1.416 5.271 0.171 0.156 497.4 0.155
Off-highway truck 402 0.38 0.287 1.560 3.090 0.113 0.104 493.5 0.154
Other Construction Equipment 172 0.42 0.436 3.263 4.755 0.250 0.230 493.4 0.154
Plate Compactor 8 0.43 0.661 3.469 4.142 0.161 0.161 568.3 0.059
Rollers 80 0.38 0.481 3.610 1.650 0.320 0.294 492.2 0.153
Rough Terrain Forklifts 100 0.40 0.222 3.270 2.945 0.136 0.125 491.2 0.153
Rubber Tired Loaders 203 0.36 0.333 1.346 4.131 0.140 0.129 487.9 0.152
Scrapers 367 0.48 0.369 2.828 4.568 0.180 0.166 490.8 0.153
Trenchers 78 0.50 0.658 3.855 5.915 0.450 0.414 493.7 0.154
Vibratory post driver * 158 0.38 0.273 3.093 2.924 0.142 0.13 490.7 0.153
*
BHP
2018 Offroad Emission Factors - Unmitigated
Emission Factor (g/bhp-hr)Equipment Type
Load
Factor
A vibratory post driver is mounted on an excavator, so excavator emission factors are used
OB-1 Air Analyses Page L-3 - 16 of 17 Revised March 2018

Air Quality/Climate Change Calculations Laurel 3 Solar Farm
PC = 140 MW project capacity
OP = 8,760 hrs/yr annual operating hours
CF = 26% Capacity Factor for NG
EG = 318,864 MWh/yr Project Energy Generated
HR = 6,940 Btu/kWh Combined Cycle Heat Rate for NG
2.21E+12 Btu/yr or
2,212,916 MMBtu/yr
CO2 = 53.02
CH4 = 0.0009
N2O = 0.0028
CO2e = 53.91
117,329 tCO2/yr
1.992 tCH4/yr
6.196 tN2O/yr
119,291 tCO 2 e/yr
Emissions = EF x NG eq x 0.100 (t/kg)
NG eq = HR x EG x 1000 (kWh/MWh)
NGeq =
Emission Factors (EF)
kg/MMBtu Climate Registry Default Factors
GHG Emissions
Emissions Associated with Power Generation Using
Natural Gas as Fuel
Constants
Project Energy Generated (EG)
EG = PC x OP x CF
Natural Gas Equivalent (NGeq)
OB-1 Air Analyses Page L-3 - 17 of 17 Revised March 2018