air-summary template
TRANSCRIPT

2
AIR-summary template Lic No: P0973-01 Year 2016
Answer all questions and complete all tables where relevant
2
Yes
3Basic air
monitoring
checklist AGN2 Yes
Table A1: Licensed Mass Emissions/Ambient data-periodic monitoring (non-continuous)
Emission
reference no: Parameter/ Substance
Frequency of
Monitoring
ELV in licence or
any revision
therof Licence Compliance criteria Measured value
Unit of
measurement
Compliant with
licence limit Method of analysis
Annual mass
load (kg)
Comments -
reason for
change in %
mass load
from
previous
year if
applicable
A3-16Total Organic Carbon (as
C)Biannually 75
The average of all readings in
one monitoring exercise shall
not exceed the emission limit
values and no hourly average
shall exceed 1.5 times the ELV
6.43 mgC/Nm3 yes IS EN 12619:2013 20.45
A3-16 Volumetric Flow Biannually 4,300
No hourly or daily mean value,
calculated on the basis of
appropriate spot readings, shall
exceed the relevant limit value
1351.41 Nm3/hour yes ISO 16911-1:2013
A3-26Total Organic Carbon (as
C)Biannually 75
The average of all readings in
one monitoring exercise shall
not exceed the emission limit
values and no hourly average
shall exceed 1.5 times the ELV
3.65 mgC/Nm3 yes IS EN 12619:2013 2.84
Annual Mass
load for Air
emisisons was
calculated
based on 2353
hours of
operation per
year (45.25
hours of
operation per
week)
Additional information
1
Does your site have licensed air emissions? If yes please complete table A1 and A2 below for the current
reporting year and answer further questions. If you do not have licenced emissions and do not complete a
solvent management plan (table A4 and A5) you do not need to complete the tables
Yes
Periodic/Non-Continuous Monitoring
Are there any results in breach of licence requirements? If yes please provide brief details in the comment section of
TableA1 below
Was all monitoring carried out in accordance with EPA guidance
note AG2 and using the basic air monitoring checklist?
Air Emission Bi-Annual Monitoring 17/07/2016
Emissions to air monitoring carried out on behalf of the Agency on 20/06/2016 gave
results for emission points A3-23 and A3-24 which exceeded the emission limit values set
out in the licence. Self Monitoring carried out on the 22/09/2016, again, showed these
emission points to be in exceedance
Refer to compliance investigation CI001375 P0973-01 Cook Ireland Ltd, Emissions to air
exceedances for details of the investigation into VOC emissions exceedances. A project to
design and install a VOC abatement system to treat these emissions points is on-going.

3
AIR-summary template Lic No: P0973-01 Year 2016
A3-26 Volumetric Flow Biannually 1,500
No hourly or daily mean value,
calculated on the basis of
appropriate spot readings, shall
exceed the relevant limit value
330.89 m3/hour yes ISO 16911-1:2013
A3-25Total Organic Carbon (as
C)Biannually 75
The average of all readings in
one monitoring exercise shall
not exceed the emission limit
values and no hourly average
shall exceed 1.5 times the ELV
10.1 mgC/Nm3 yes IS EN 12619:2013 4.12
A3-25 Volumetric Flow Biannually 1,500
No hourly or daily mean value,
calculated on the basis of
appropriate spot readings, shall
exceed the relevant limit value
173.43 m3/hour yes ISO 16911-1:2013
A3-24Total Organic Carbon (as
C)Biannually 75
The average of all readings in
one monitoring exercise shall
not exceed the emission limit
values and no hourly average
shall exceed 1.5 times the ELV
7.76 mgC/Nm3 yes IS EN 12619:2013 8.94
A3-24 Volumetric Flow Biannually 1,500
No hourly or daily mean value,
calculated on the basis of
appropriate spot readings, shall
exceed the relevant limit value
489.77 m3/hour yes ISO 16911-1:2013
A3-23Total Organic Carbon (as
C)Biannually 75
The average of all readings in
one monitoring exercise shall
not exceed the emission limit
values and no hourly average
shall exceed 1.5 times the ELV
21.45 mgC/Nm3 yes IS EN 12619:2013 4.63
A3-23 Volumetric Flow Biannually 1,500
No hourly or daily mean value,
calculated on the basis of
appropriate spot readings, shall
exceed the relevant limit value
91.81 Nm3/hour yes ISO 16911-1:2013
A3-23Total Organic Carbon (as
C)EPA Monitoring 75
The average of all readings in
one monitoring exercise shall
not exceed the emission limit
values OR no hourly average
shall exceed 1.5 times the ELV
191.55 mg/Nm3 No IS EN 12619:2013 227.30
EPA Air Emission Monitoring -20/06/2016

4
AIR-summary template Lic No: P0973-01 Year 2016
A3-23 Volumetric Flow EPA Monitoring 1500
No hourly or daily mean value,
calculated on the basis of
appropriate spot readings, shall
exceed the relevant limit value
504.3 Nm3/h yes ISO 16911-1:2013
A3-24Total Organic Carbon (as
C)EPA Monitoring 75
The average of all readings in
one monitoring exercise shall
not exceed the emission limit
values OR no hourly average
shall exceed 1.5 times the ELV
191.64 mg/Nm3 no IS EN 12619:2013 226.37
A3-24 Volumetric Flow EPA Monitoring 1500
No hourly or daily mean value,
calculated on the basis of
appropriate spot readings, shall
exceed the relevant limit value
502 Nm3/h yes ISO 16911-1:2013
A3-24Total Organic Carbon (as
C)Self Monitoring 75
The average of all readings in
one monitoring exercise shall
not exceed the emission limit
values and no hourly average
shall exceed 1.5 times the ELV
117.48 mg/Nm3 no IS EN 12619:2013 124.92
A3-24 Volumetric Flow Self Monitoring 1,500
No hourly or daily mean value,
calculated on the basis of
appropriate spot readings, shall
exceed the relevant limit value
451.89 Nm3/h yes ISO 16911-1:2013
A3-23Total Organic Carbon (as
C)Self Monitoring 75
The average of all readings in
one monitoring exercise shall
not exceed the emission limit
values and no hourly average
shall exceed 1.5 times the ELV
188.7 mg/Nm3 no IS EN 12619:2013 215.45
A3-23 Volumetric Flow Self Monitoring 1,500
No hourly or daily mean value,
calculated on the basis of
appropriate spot readings, shall
exceed the relevant limit value
485.24 Nm3/h yes ISO 16911-1:2013
A3-16Total Organic Carbon (as
C)Biannually 75
The average of all readings in
one monitoring exercise shall
not exceed the emission limit
values and no hourly average
shall exceed 1.5 times the ELV
9.57 mgC/Nm3 yes IS EN 12619:2013 26.61
A3-16 Volumetric Flow Biannually 4,300
No hourly or daily mean value,
calculated on the basis of
appropriate spot readings, shall
exceed the relevant limit value
1181.84 Nm3/hour yes ISO 16911-1:2013
A3-26Total Organic Carbon (as
C)Biannually 75
The average of all readings in
one monitoring exercise shall
not exceed the emission limit
values and no hourly average
shall exceed 1.5 times the ELV
212.02 mgC/Nm3 No IS EN 12619:2013 191.35
Additional Self Monitoring 22/09/2016
Air Emissions Monitoring 06/12/2016
5
AIR-summary template Lic No: P0973-01 Year 2016
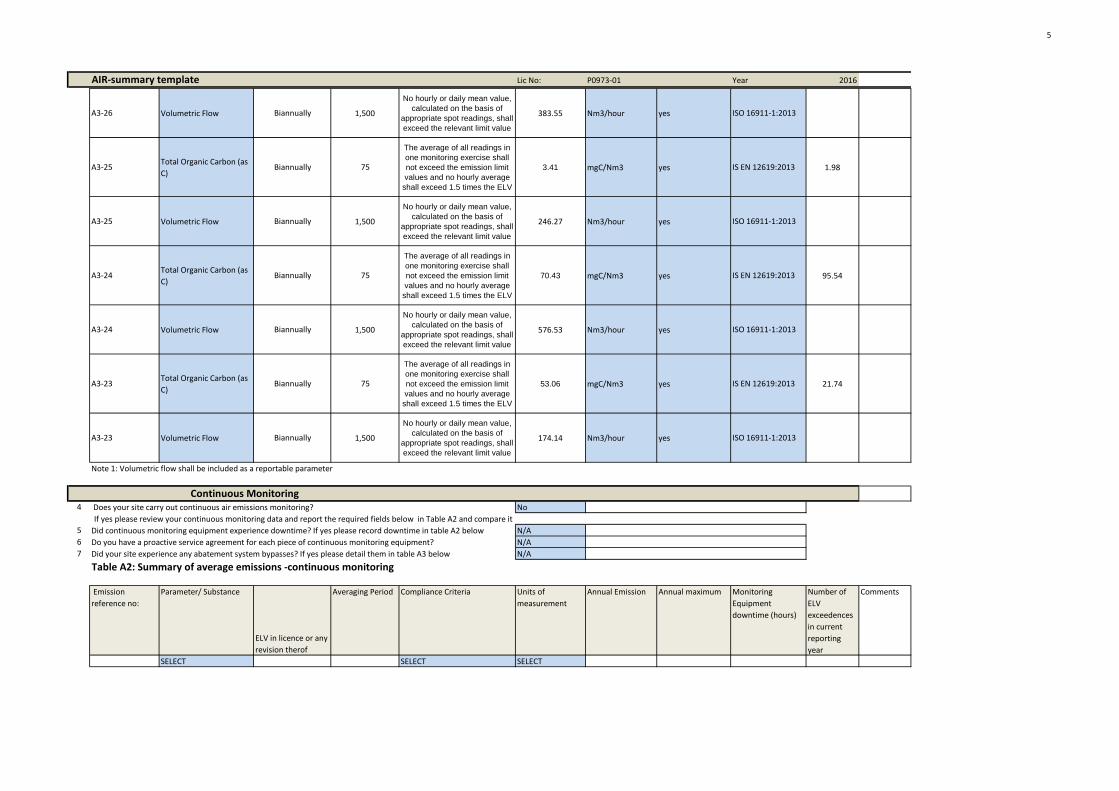
A3-26 Volumetric Flow Biannually 1,500
No hourly or daily mean value,
calculated on the basis of
appropriate spot readings, shall
exceed the relevant limit value
383.55 Nm3/hour yes ISO 16911-1:2013
A3-25Total Organic Carbon (as
C)Biannually 75
The average of all readings in
one monitoring exercise shall
not exceed the emission limit
values and no hourly average
shall exceed 1.5 times the ELV
3.41 mgC/Nm3 yes IS EN 12619:2013 1.98
A3-25 Volumetric Flow Biannually 1,500
No hourly or daily mean value,
calculated on the basis of
appropriate spot readings, shall
exceed the relevant limit value
246.27 Nm3/hour yes ISO 16911-1:2013
A3-24Total Organic Carbon (as
C)Biannually 75
The average of all readings in
one monitoring exercise shall
not exceed the emission limit
values and no hourly average
shall exceed 1.5 times the ELV
70.43 mgC/Nm3 yes IS EN 12619:2013 95.54
A3-24 Volumetric Flow Biannually 1,500
No hourly or daily mean value,
calculated on the basis of
appropriate spot readings, shall
exceed the relevant limit value
576.53 Nm3/hour yes ISO 16911-1:2013
A3-23Total Organic Carbon (as
C)Biannually 75
The average of all readings in
one monitoring exercise shall
not exceed the emission limit
values and no hourly average
shall exceed 1.5 times the ELV
53.06 mgC/Nm3 yes IS EN 12619:2013 21.74
A3-23 Volumetric Flow Biannually 1,500
No hourly or daily mean value,
calculated on the basis of
appropriate spot readings, shall
exceed the relevant limit value
174.14 Nm3/hour yes ISO 16911-1:2013
Note 1: Volumetric flow shall be included as a reportable parameter
4 No
5 N/A
6 N/A
7 N/A
Table A2: Summary of average emissions -continuous monitoring
Emission
reference no:
Parameter/ Substance
ELV in licence or any
revision therof
Averaging Period Compliance Criteria Units of
measurement
Annual Emission Annual maximum Monitoring
Equipment
downtime (hours)
Number of
ELV
exceedences
in current
reporting
year
Comments
SELECT SELECT SELECT
Continuous Monitoring Does your site carry out continuous air emissions monitoring?
If yes please review your continuous monitoring data and report the required fields below in Table A2 and compare it
Did continuous monitoring equipment experience downtime? If yes please record downtime in table A2 below
Do you have a proactive service agreement for each piece of continuous monitoring equipment?
Did your site experience any abatement system bypasses? If yes please detail them in table A3 below

6
AIR-summary template Lic No: P0973-01 Year 2016
SELECT SELECT
SELECT SELECT
SELECT SELECT
SELECT SELECT
note 1: Volumetric flow shall be included as a reportable parameter.
Table A3: Abatement system bypass reporting table Bypass protocol
Date* Duration** (hours) Location
8 Do you have a total Emission Limit Value of direct and fugitive emissions on site? if yes please fill out tables A4 and A5
Yes
Solvent
regulations
Reporting year Total solvent input on
site (kg)
Total VOC emissions
to Air from entire
site (direct and
fugitive)
Total VOC
emissions as %of
solvent input Total Emission Limit Value
(ELV) in licence or any revision
therof (kg)*
Compliance
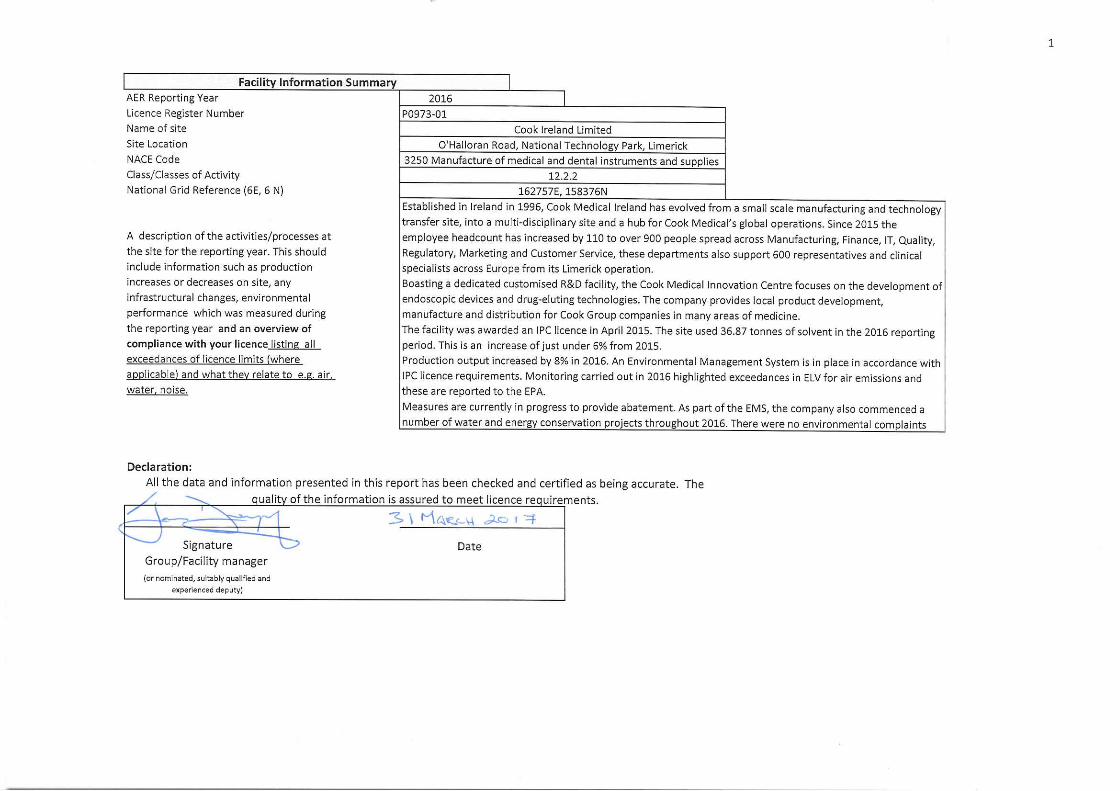
2016 36868.9 6017.0 16 14909.8Yes
(I) Inputs (kg)
Solvent
(I) Inputs (kg)
Organic solvent
emission in waste
gases(kg)
Solvents lost in
water (kg)
Collected waste solvent (kg) Fugitive Organic
Solvent (kg)
Solvent released in
other ways e.g. by-
passes (kg)
Solvents destroyed
onsite through
physical reaction
e.g.
incineration(kg)
Total emission of
Solvent to air (kg)
Ethanol 31255.3 622.0 0.0 26022.8 4610.5 5232.5
IPA 2657.6 0.0 0.0 2206.8 450.8 450.8
Reason for bypass Impact magnitude Corrective action
*based on TOC ELV's from Schedule B.1 of the site's IEL and
Condition 5.4.3 on Fugitive emissions of solvents
Table A5: Solvent Mass Balance summary
(O) Outputs (kg)
* this should include all dates that an abatement system bypass occurred
** an accurate record of time bypass beginning and end should be logged on site and maintained for future Agency
Solvent use and management on site
Table A4: Solvent Management Plan Summary
Total VOC Emission limit value
Please refer to linked solvent regulations to
complete table 5 and 6

7
AIR-summary template Lic No: P0973-01 Year 2016
Acetonitrile 2956.0 0.0 0.0 2622.2 333.8 333.8
Total 6017.1

8
AER Monitoring returns summary template-WATER/WASTEWATER(SEWER) Lic No: P0973-01 Year 2016
2
Yes
Location
reference
Location relative to
site activitiesPRTR Parameter Licenced Parameter
Monitoring
date
ELV or trigger level
in licence or any
revision thereof*
Licence
Compliance
criteria
Measured valueUnit of
measurement
Compliant with
licenceComments
SW-1 onsite N/A pH Weekly N/A N/A 7.3 pH units yes
SW-1 onsite N/A COD Weekly (55mg/l) / (75 mg/l) N/A 28.74 mg/L yes
SW-2 onsite N/A pH Weekly N/A N/A 7.5 pH units yes
SW-2 onsite N/A COD Weekly (55mg/l) / (75 mg/l) N/A 17.83 mg/L yes
*trigger values may be agreed by the Agency outside of licence conditions
Location
Reference Date of inspection Source of
contamination
SELECT
SELECT
3No
4
External /Internal Lab
Quality checklist
Assessment of
results checklist Yes
Table W3: Licensed Emissions to water and /or wastewater (sewer)-periodic monitoring (non-continuous)
Emission
reference no: Emission released to Parameter/ SubstanceNote 1 Type of sample
Frequency of
monitoring Averaging period
ELV or trigger
values in licence or
any revision
therofNote 2 Licence Compliance criteria Measured value
Unit of
measurement Compliant with licence Method of analysis
Procedural
reference source
Procedural
reference
standard
number Comments
SE-1 Wastewater/Sewer Temperature composite Quarterly 24 hour 30No temperature shall exceed the
limit value11.1 Degrees C yes Standard Methods SELECT
US EPA
SE-1 Wastewater/Sewer Temperature composite Quarterly 24 hour 30No temperature shall exceed the
limit value14.4 Degrees C yes Standard Methods SELECT
US EPA
SE-1 Wastewater/Sewer Temperature composite Quarterly 24 hour 30No temperature shall exceed the
limit value20.4 Degrees C yes Standard Methods SELECT
US EPA
SE-1 Wastewater/Sewer Temperature composite Quarterly 24 hour 30No temperature shall exceed the
limit value16 Degrees C yes Standard Methods SELECT
US EPA
SE-1 Wastewater/Sewer pH composite Quarterly 24 hour 6.0 - 9.0No pH value shall deviate from
the specified range.7.2 N/A yes pH Meter (Electrode)
APHA / AWWA
''Standard
Methods''
SE-1 Wastewater/Sewer pH composite Quarterly 24 hour 6.0 - 9.0No pH value shall deviate from
the specified range.8.5 N/A yes pH Meter (Electrode)
APHA / AWWA
''Standard
Methods''
SE-1 Wastewater/Sewer pH composite Quarterly 24 hour 6.0 - 9.0No pH value shall deviate from
the specified range.7.5 N/A yes pH Meter (Electrode)
APHA / AWWA
''Standard
Methods''
SE-1 Wastewater/Sewer pH composite Quarterly 24 hour 6.0 - 9.0No pH value shall deviate from
the specified range.7.1 N/A yes pH Meter (Electrode)
APHA / AWWA
''Standard
Methods''
SE-1 Wastewater/Sewer BOD composite Quarterly 24 hour 410
8 out of 10 consectutive
composite results, based on flow
proportional composite
sampling, shall not exceed the
ELV. No individual results
similarly calculated shall exceed
1.2 times the ELV.
412 mg/L yes Standard MethodsAPHA / AWWA
''Standard
Methods''
Licensed Emissions to water and /or wastewater(sewer)-periodic monitoring (non-continuous)
Was there any result in breach of licence requirements? If yes please provide brief details in the comment section of Table W3 below
Was all monitoring carried out in accordance with EPA guidance and checklists for Quality of Aqueous Monitoring Data
Reported to the EPA? If no please detail what areas require improvement in additional information box
Monitoring data is available for both SE1 and SE3 for the whole year. SE1 is required to be sampled and tested quarterly. SE3 is required
to be sampled and tested monthly.
Monitoring data is for 52 weeks. An
average value is included in Table W1.
COD trigger levels were approved in
July 2016. Warning level was set at 55
mg/l (COD), Action level was set at 75
mg/l (COD) for both SW1 and SW2.
Table W2 Visual inspections-Please only enter details where contamination was observed.
Description of contamination Corrective action Comments
Was it a requirement of your licence to carry out visual inspections on any surface water discharges or watercourses on or near your site? If yes please
complete table W2 below summarising only any evidence of contamination noted during visual inspections
Table W1 Storm water monitoring
Additional information
1
Does your site have licensed emissions direct to surface water or direct to sewer? If yes please complete table W2 and W3 below for the current
reporting year and answer further questions. If you do not have licenced emissions you only need to complete table W1 and or W2 for storm water
analysis and visual inspections
Yes

9
AER Monitoring returns summary template-WATER/WASTEWATER(SEWER) Lic No: P0973-01 Year 2016
Additional information
SE-1 Wastewater/Sewer BOD composite Quarterly 24 hour 410
8 out of 10 consectutive
composite results, based on flow
proportional composite
sampling, shall not exceed the
ELV. No individual results
similarly calculated shall exceed
1.2 times the ELV.
125 mg/L yes Standard MethodsAPHA / AWWA
''Standard
Methods''
SE-1 Wastewater/Sewer BOD composite Quarterly 24 hour 410
8 out of 10 consectutive
composite results, based on flow
proportional composite
sampling, shall not exceed the
ELV. No individual results
similarly calculated shall exceed
1.2 times the ELV.
41 mg/L yes Standard MethodsAPHA / AWWA
''Standard
Methods''
SE-1 Wastewater/Sewer BOD composite Quarterly 24 hour 410
8 out of 10 consectutive
composite results, based on flow
proportional composite
sampling, shall not exceed the
ELV. No individual results
similarly calculated shall exceed
1.2 times the ELV.
2 mg/L yes Standard MethodsAPHA / AWWA
''Standard
Methods''
SE-1 Wastewater/Sewer COD composite Annually 24 hour 860
8 out of 10 consectutive
composite results, based on flow
proportional composite
sampling, shall not exceed the
ELV. No individual results
similarly calculated shall exceed
1.2 times the ELV.
284 mg/L yes Standard MethodsUK SCA ''Blue
Book'' series
SE-1 Wastewater/Sewer COD composite Annually 24 hour 860
8 out of 10 consectutive
composite results, based on flow
proportional composite
sampling, shall not exceed the
ELV. No individual results
similarly calculated shall exceed
1.2 times the ELV.
426 mg/L yes Standard MethodsUK SCA ''Blue
Book'' series
SE-1 Wastewater/Sewer Suspended Solids composite Annually 24 hour 430
8 out of 10 consectutive
composite results, based on flow
proportional composite
sampling, shall not exceed the
ELV. No individual results
similarly calculated shall exceed
1.2 times the ELV.
146.75 mg/L yes Standard MethodsHach Procedures
Manual 9th Edition
1999
SE-1 Wastewater/Sewer Fats, Oils and Greases composite Quarterly 24 hour 100
8 out of 10 consectutive
composite results, based on flow
proportional composite
sampling, shall not exceed the
ELV. No individual results
similarly calculated shall exceed
1.2 times the ELV.
<5 mg/L yes Standard Methods US EPA

10
AER Monitoring returns summary template-WATER/WASTEWATER(SEWER) Lic No: P0973-01 Year 2016
Additional information
SE-3 Wastewater/Sewer pH composite Monthly 24 hour 6.0-9.0No pH value shall deviate from
the specified range.7.7 N/A yes pH Meter (Electrode)
APHA / AWWA
''Standard
Methods''
SE-3 Wastewater/Sewer pH composite Monthly 24 hour 6.0-9.0No pH value shall deviate from
the specified range.7.8 N/A yes pH Meter (Electrode)
APHA / AWWA
''Standard
Methods''
SE-3 Wastewater/Sewer pH composite Monthly 24 hour 6.0-9.0No pH value shall deviate from
the specified range.7.6 N/A yes pH Meter (Electrode)
APHA / AWWA
''Standard
Methods''
SE-3 Wastewater/Sewer pH composite Monthly 24 hour 6.0-9.0No pH value shall deviate from
the specified range.7.5 N/A yes pH Meter (Electrode)
APHA / AWWA
''Standard
Methods''
SE-3 Wastewater/Sewer pH composite Monthly 24 hour 6.0-9.0No pH value shall deviate from
the specified range.7.6 N/A yes pH Meter (Electrode)
APHA / AWWA
''Standard
Methods''
SE-3 Wastewater/Sewer pH composite Monthly 24 hour 6.0-9.0No pH value shall deviate from
the specified range.7.8 N/A yes pH Meter (Electrode)
APHA / AWWA
''Standard
Methods''
SE-3 Wastewater/Sewer pH composite Monthly 24 hour 6.0-9.0No pH value shall deviate from
the specified range.7.8 N/A yes pH Meter (Electrode)
APHA / AWWA
''Standard
Methods''
SE-3 Wastewater/Sewer pH composite Monthly 24 hour 6.0-9.0No pH value shall deviate from
the specified range.7.5 N/A yes pH Meter (Electrode)
APHA / AWWA
''Standard
Methods''
SE-3 Wastewater/Sewer pH composite Monthly 24 hour 6.0-9.0No pH value shall deviate from
the specified range.7.5 N/A yes pH Meter (Electrode)
APHA / AWWA
''Standard
Methods''
SE-3 Wastewater/Sewer pH composite Monthly 24 hour 6.0-9.0No pH value shall deviate from
the specified range.7.2 N/A yes pH Meter (Electrode)
APHA / AWWA
''Standard
Methods''
SE-3 Wastewater/Sewer pH composite Monthly 24 hour 6.0-9.0No pH value shall deviate from
the specified range.7.5 N/A yes pH Meter (Electrode)
APHA / AWWA
''Standard
Methods''
SE-3 Wastewater/Sewer pH composite Monthly 24 hour 6.0-9.0No pH value shall deviate from
the specified range.7 N/A yes pH Meter (Electrode)
APHA / AWWA
''Standard
Methods''
SE-3 Wastewater/Sewer BOD composite Monthly 24 hour 860
8 out of 10 consectutive
composite results, based on flow
proportional composite
sampling, shall not exceed the
ELV. No individual results
similarly calculated shall exceed
1.2 times the ELV.
<2 mg/L yes Standard MethodsAPHA / AWWA
''Standard
Methods''
SE-3 Wastewater/Sewer BOD composite Monthly 24 hour 860
8 out of 10 consectutive
composite results, based on flow
proportional composite
sampling, shall not exceed the
ELV. No individual results
similarly calculated shall exceed
1.2 times the ELV.
19 mg/L yes Standard MethodsAPHA / AWWA
''Standard
Methods''
SE-3 Wastewater/Sewer BOD composite Monthly 24 hour 860
8 out of 10 consectutive
composite results, based on flow
proportional composite
sampling, shall not exceed the
ELV. No individual results
similarly calculated shall exceed
1.2 times the ELV.
<2 mg/L yes Standard MethodsAPHA / AWWA
''Standard
Methods''
SE-3 Wastewater/Sewer BOD composite Monthly 24 hour 860
8 out of 10 consectutive
composite results, based on flow
proportional composite
sampling, shall not exceed the
ELV. No individual results
similarly calculated shall exceed
1.2 times the ELV.
<2 mg/L yes Standard MethodsAPHA / AWWA
''Standard
Methods''

11
AER Monitoring returns summary template-WATER/WASTEWATER(SEWER) Lic No: P0973-01 Year 2016
Additional information
SE-3 Wastewater/Sewer BOD composite Monthly 24 hour 860
8 out of 10 consectutive
composite results, based on flow
proportional composite
sampling, shall not exceed the
ELV. No individual results
similarly calculated shall exceed
1.2 times the ELV.
4 mg/L yes Standard MethodsAPHA / AWWA
''Standard
Methods''
SE-3 Wastewater/Sewer BOD composite Monthly 24 hour 860
8 out of 10 consectutive
composite results, based on flow
proportional composite
sampling, shall not exceed the
ELV. No individual results
similarly calculated shall exceed
1.2 times the ELV.
22 mg/L yes Standard MethodsAPHA / AWWA
''Standard
Methods''
SE-3 Wastewater/Sewer BOD composite Monthly 24 hour 860
8 out of 10 consectutive
composite results, based on flow
proportional composite
sampling, shall not exceed the
ELV. No individual results
similarly calculated shall exceed
1.2 times the ELV.
<2 mg/L yes Standard MethodsAPHA / AWWA
''Standard
Methods''
SE-3 Wastewater/Sewer COD composite Monthly 24 hour 2100
8 out of 10 consectutive
composite results, based on flow
proportional composite
sampling, shall not exceed the
ELV. No individual results
similarly calculated shall exceed
1.2 times the ELV.
105 mg/L yes Standard MethodsUK SCA ''Blue
Book'' series
SE-3 Wastewater/Sewer COD composite Monthly 24 hour 2100
8 out of 10 consectutive
composite results, based on flow
proportional composite
sampling, shall not exceed the
ELV. No individual results
similarly calculated shall exceed
1.2 times the ELV.
147 mg/L yes Standard MethodsUK SCA ''Blue
Book'' series

12
AER Monitoring returns summary template-WATER/WASTEWATER(SEWER) Lic No: P0973-01 Year 2016
Additional information
SE-3 Wastewater/Sewer COD composite Monthly 24 hour 2100
8 out of 10 consectutive
composite results, based on flow
proportional composite
sampling, shall not exceed the
ELV. No individual results
similarly calculated shall exceed
1.2 times the ELV.
291 mg/L yes Standard MethodsUK SCA ''Blue
Book'' series
SE-3 Wastewater/Sewer COD composite Monthly 24 hour 2100
8 out of 10 consectutive
composite results, based on flow
proportional composite
sampling, shall not exceed the
ELV. No individual results
similarly calculated shall exceed
1.2 times the ELV.
257 mg/L yes Standard MethodsUK SCA ''Blue
Book'' series
SE-3 Wastewater/Sewer COD composite Monthly 24 hour 2100
8 out of 10 consectutive
composite results, based on flow
proportional composite
sampling, shall not exceed the
ELV. No individual results
similarly calculated shall exceed
1.2 times the ELV.
214 mg/L yes Standard MethodsUK SCA ''Blue
Book'' series
SE-3 Wastewater/Sewer COD composite Monthly 24 hour 2100
8 out of 10 consectutive
composite results, based on flow
proportional composite
sampling, shall not exceed the
ELV. No individual results
similarly calculated shall exceed
1.2 times the ELV.
234 mg/L yes Standard MethodsUK SCA ''Blue
Book'' series
SE-3 Wastewater/Sewer COD composite Monthly 24 hour 2100
8 out of 10 consectutive
composite results, based on flow
proportional composite
sampling, shall not exceed the
ELV. No individual results
similarly calculated shall exceed
1.2 times the ELV.
212 mg/L yes Standard MethodsUK SCA ''Blue
Book'' series
SE-3 Wastewater/Sewer COD composite Monthly 24 hour 2100
8 out of 10 consectutive
composite results, based on flow
proportional composite
sampling, shall not exceed the
ELV. No individual results
similarly calculated shall exceed
1.2 times the ELV.
140 mg/L yes Standard MethodsUK SCA ''Blue
Book'' series
SE-3 Wastewater/Sewer COD composite Monthly 24 hour 2100
8 out of 10 consectutive
composite results, based on flow
proportional composite
sampling, shall not exceed the
ELV. No individual results
similarly calculated shall exceed
1.2 times the ELV.
253 mg/L yes Standard MethodsUK SCA ''Blue
Book'' series
SE-3 Wastewater/Sewer COD composite Monthly 24 hour 2100
8 out of 10 consectutive
composite results, based on flow
proportional composite
sampling, shall not exceed the
ELV. No individual results
similarly calculated shall exceed
1.2 times the ELV.
274 mg/L yes Standard MethodsUK SCA ''Blue
Book'' series
SE-3 Wastewater/Sewer COD composite Monthly 24 hour 2100
8 out of 10 consectutive
composite results, based on flow
proportional composite
sampling, shall not exceed the
ELV. No individual results
similarly calculated shall exceed
1.2 times the ELV.
82 mg/L yes Standard MethodsUK SCA ''Blue
Book'' series

13
AER Monitoring returns summary template-WATER/WASTEWATER(SEWER) Lic No: P0973-01 Year 2016
Additional information
SE-3 Wastewater/Sewer COD composite Monthly 24 hour 2100
8 out of 10 consectutive
composite results, based on flow
proportional composite
sampling, shall not exceed the
ELV. No individual results
similarly calculated shall exceed
1.2 times the ELV.
143 mg/L yes Standard MethodsUK SCA ''Blue
Book'' series
SE-3 Wastewater/Sewer Suspended Solids composite Monthly 24 hour 430
8 out of 10 consectutive
composite results, based on flow
proportional composite
sampling, shall not exceed the
ELV. No individual results
similarly calculated shall exceed
1.2 times the ELV.
<2 mg/L yes Standard MethodsHach Procedures
Manual 9th Edition
1999

14
AER Monitoring returns summary template-WATER/WASTEWATER(SEWER) Lic No: P0973-01 Year 2016
Additional information
SE-3 Wastewater/Sewer Suspended Solids composite Monthly 24 hour 430
8 out of 10 consectutive
composite results, based on flow
proportional composite
sampling, shall not exceed the
ELV. No individual results
similarly calculated shall exceed
1.2 times the ELV.
<2 mg/L yes Standard MethodsHach Procedures
Manual 9th Edition
1999
SE-3 Wastewater/Sewer Suspended Solids composite Monthly 24 hour 430
8 out of 10 consectutive
composite results, based on flow
proportional composite
sampling, shall not exceed the
ELV. No individual results
similarly calculated shall exceed
1.2 times the ELV.
7 mg/L yes Standard MethodsHach Procedures
Manual 9th Edition
1999
SE-3 Wastewater/Sewer Suspended Solids composite Monthly 24 hour 430
8 out of 10 consectutive
composite results, based on flow
proportional composite
sampling, shall not exceed the
ELV. No individual results
similarly calculated shall exceed
1.2 times the ELV.
10 mg/L yes Standard MethodsHach Procedures
Manual 9th Edition
1999
SE-3 Wastewater/Sewer 1,2-Dichloroethane composite Monthly 24 hour N/A N/A 0.108 µg/L N/A Standard Methods US EPA Annual average
value used
SE-3 Wastewater/Sewer MTBE (Methyl Tert-Butyl Ether) by GCMS composite Monthly 24 hour N/A N/A 1.833 µg/L N/A Standard Methods US EPA Annual average
value used
SE-3 Wastewater/Sewer Chloroform (Trichloromethane) composite Monthly 24 hour N/A N/A 29.69 µg/L N/A Standard Methods US EPA Annual average
value used
SE-3 Wastewater/SewerBromoform (Tribromomethane)
composite Monthly 24 hour N/A N/A0.225
µg/L N/A Standard Methods US EPA Annual average
value used
SE-3 Wastewater/SewerDibromochloromethane
composite Monthly 24 hour N/A N/A3.991
µg/L N/A Standard Methods US EPA Annual average
value used
SE-3 Wastewater/SewerBenzene (0.1ug/l) by GCMS
composite Monthly 24 hour N/A N/A0.116
µg/L N/A Standard Methods US EPA Annual average
value used
SE-3 Wastewater/SewerTetrachloroethene
composite Monthly 24 hour N/A N/A0.1083
µg/L N/A Standard Methods US EPA Annual average
value used
SE-3 Wastewater/SewerVinyl Chloride
composite Monthly 24 hour N/A N/A0.083
µg/L N/A Standard Methods US EPA Annual average
value used
SE-3 Wastewater/SewerChlorodifluoromethane (CFC-22)
composite Monthly 24 hour N/A N/A0.2916
µg/L N/A Standard Methods US EPA Annual average
value used
SE-3 Wastewater/SewerDichlorodifluoromethane (CFC-12)
composite Monthly 24 hour N/A N/A0.375
µg/L N/A Standard Methods US EPA Annual average
value used
SE-3 Wastewater/Sewer1,3-Butadiene
composite Monthly 24 hour N/A N/A0.2916
µg/L N/A Standard Methods US EPA Annual average
value used
SE-3 Wastewater/SewerBromomethane (methyl bromide)
composite Monthly 24 hour N/A N/A0.2916
µg/L N/A Standard Methods US EPA Annual average
value used
SE-3 Wastewater/SewerTrichlorofluoromethane (CFC-11)
composite Monthly 24 hour N/A N/A0.4583
µg/L N/A Standard Methods US EPA Annual average
value used
SE-3 Wastewater/SewerDiethyl Ether (Ethyl Ether)
composite Monthly 24 hour N/A N/A0.5833
µg/L N/A Standard Methods US EPA Annual average
value used
SE-3 Wastewater/Sewer1,1-Dichloroethene
composite Monthly 24 hour N/A N/A0.333
µg/L N/A Standard Methods US EPA Annual average
value used

15
AER Monitoring returns summary template-WATER/WASTEWATER(SEWER) Lic No: P0973-01 Year 2016
Additional informationSE-3 Wastewater/Sewer
Iodomethane (Methyl Iodide)composite Monthly 24 hour N/A N/A
0.0916µg/L N/A Standard Methods US EPA
Annual average
value used
SE-3 Wastewater/SewerCarbon Disulfide
composite Monthly 24 hour N/A N/A0.75
µg/L N/A Standard Methods US EPA Annual average
value used
SE-3 Wastewater/Sewertrans-1,2-Dichloroethene
composite Monthly 24 hour N/A N/A0.4166
µg/L N/A Standard Methods US EPA Annual average
value used
SE-3 Wastewater/Sewer1,1-Dichloroethane
composite Monthly 24 hour N/A N/A0.25
µg/L N/A Standard Methods US EPA Annual average
value used
SE-3 Wastewater/SewerDIPE (Diisopropyl Ether)
composite Monthly 24 hour N/A N/A0.4583
µg/L N/A Standard Methods US EPA Annual average
value used
SE-3 Wastewater/Sewercis-1,2-Dichloroethene
composite Monthly 24 hour N/A N/A0.4583
µg/L N/A Standard Methods US EPA Annual average
value used
SE-3 Wastewater/SewerBromochloromethane
composite Monthly 24 hour N/A N/A3.5833
µg/L N/A Standard Methods US EPA Annual average
value used
SE-3 Wastewater/SewerETBE (Ethyl Tert-Butyl Ether)
composite Monthly 24 hour N/A N/A0.4583
µg/L N/A Standard Methods US EPA Annual average
value used
SE-3 Wastewater/SewerTetrahydrofuran
composite Monthly 24 hour N/A N/A4.583
µg/L N/A Standard Methods US EPA Annual average
value used
SE-3 Wastewater/Sewer1,1,1-Trichloroethane
composite Monthly 24 hour N/A N/A0.4583
µg/L N/A Standard Methods US EPA Annual average
value used
SE-3 Wastewater/Sewer1-Chlorobutane (n-Butyl Chloride)
composite Monthly 24 hour N/A N/A0.4583
µg/L N/A Standard Methods US EPA Annual average
value used
SE-3 Wastewater/Sewer1,1-Dichloropropene
composite Monthly 24 hour N/A N/A0.4583
µg/L N/A Standard Methods US EPA Annual average
value used
SE-3 Wastewater/SewerCarbon Tetrachloride (Tetrachloromethane)
composite Monthly 24 hour N/A N/A0.4583
µg/L N/A Standard Methods US EPA Annual average
value used
SE-3 Wastewater/SewerTAME (Tert-Amyl Methyl Ether) (1,1Dimethylpropylmethylether)
composite Monthly 24 hour N/A N/A0.9166
µg/L N/A Standard Methods US EPA Annual average
value used
SE-3 Wastewater/Sewer1,2-Dichloropropane
composite Monthly 24 hour N/A N/A0.4583
µg/L N/A Standard Methods US EPA Annual average
value used
SE-3 Wastewater/SewerTrichloroethene
composite Monthly 24 hour N/A N/A0.1083
µg/L N/A Standard Methods US EPA Annual average
value used
SE-3 Wastewater/SewerBromodichloromethane
composite Monthly 24 hour N/A N/A11.85
µg/L N/A Standard Methods US EPA Annual average
value used
SE-3 Wastewater/SewerTAEE (Tert-Amyl Ethyl Ether)
composite Monthly 24 hour N/A N/A4.583
µg/L N/A Standard Methods US EPA Annual average
value used
SE-3 Wastewater/Sewercis-1,3-Dichloropropene
composite Monthly 24 hour N/A N/A0.9166
µg/L N/A Standard Methods US EPA Annual average
value used
SE-3 Wastewater/Sewertrans-1,3-Dichloropropene
composite Monthly 24 hour N/A N/A0.875
µg/L N/A Standard Methods US EPA Annual average
value used
SE-3 Wastewater/Sewer1,1,2-Trichloroethane
composite Monthly 24 hour N/A N/A0.4583
µg/L N/A Standard Methods US EPA Annual average
value used
SE-3 Wastewater/SewerToluene by GCMS
composite Monthly 24 hour N/A N/A1.833
µg/L N/A Standard Methods US EPA Annual average
value used
SE-3 Wastewater/Sewer1,3-Dichloropropane
composite Monthly 24 hour N/A N/A0.0916
µg/L N/A Standard Methods US EPA Annual average
value used
SE-3 Wastewater/Sewer1,2-Dibromoethane (EDB)
composite Monthly 24 hour N/A N/A0.066
µg/L N/A Standard Methods US EPA Annual average
value used
SE-3 Wastewater/Sewer1,1,1,2-Tetrachloroethane
composite Monthly 24 hour N/A N/A0.4166
µg/L N/A Standard Methods US EPA Annual average
value used
SE-3 Wastewater/SewerEthylbenzene by GCMS
composite Monthly 24 hour N/A N/A1.833
µg/L N/A Standard Methods US EPA Annual average
value used
SE-3 Wastewater/Sewerm/p-Xylene by GCMS
composite Monthly 24 hour N/A N/A3
µg/L N/A Standard Methods US EPA Annual average
value used
SE-3 Wastewater/SewerStyrene
composite Monthly 24 hour N/A N/A1.833
µg/L N/A Standard Methods US EPA Annual average
value used
SE-3 Wastewater/Sewer1,1,2,2-Tetrachloroethane
composite Monthly 24 hour N/A N/A0.4583
µg/L N/A Standard Methods US EPA Annual average
value used
SE-3 Wastewater/Sewero-Xylene by GCMS
composite Monthly 24 hour N/A N/A1.833
µg/L N/A Standard Methods US EPA Annual average
value used
SE-3 Wastewater/Sewer1,2,3-Trichloropropane
composite Monthly 24 hour N/A N/A0.4583
µg/L N/A Standard Methods US EPA Annual average
value used
SE-3 Wastewater/SewerBromobenzene
composite Monthly 24 hour N/A N/A0.9166
µg/L N/A Standard Methods US EPA Annual average
value used
SE-3 Wastewater/Sewern-Propylbenzene
composite Monthly 24 hour N/A N/A0.9166
µg/L N/A Standard Methods US EPA Annual average
value used
SE-3 Wastewater/SewerPentachloroethane
composite Monthly 24 hour N/A N/A0.4583
µg/L N/A Standard Methods US EPA Annual average
value used
SE-3 Wastewater/Sewer1,3,5-Trimethylbenzene (Mesitylene)
composite Monthly 24 hour N/A N/A1.833
µg/L N/A Standard Methods US EPA Annual average
value used
SE-3 Wastewater/Sewer1,2,4-Trimethylbenzene (Pseudocumene)
composite Monthly 24 hour N/A N/A1.833
µg/L N/A Standard Methods US EPA Annual average
value used
SE-3 Wastewater/SewerHexachloroethane
composite Monthly 24 hour N/A N/A0.4583
µg/L N/A Standard Methods US EPA Annual average
value used
SE-3 Wastewater/Sewer1,2,4-Trichlorobenzene
composite Monthly 24 hour N/A N/A0.4583
µg/L N/A Standard Methods US EPA Annual average
value used
SE-3 Wastewater/SewerNaphthalene by GCMS
composite Monthly 24 hour N/A N/A0.875
µg/L N/A Standard Methods US EPA Annual average
value used
SE-3 Wastewater/SewerHexachlorobutadiene
composite Monthly 24 hour N/A N/A0.5
µg/L N/A Standard Methods US EPA Annual average
value used
SE-3 Wastewater/Sewer1,2,3-Trichlorobenzene
composite Monthly 24 hour N/A N/A0.4583
µg/L N/A Standard Methods US EPA Annual average
value used

16
AER Monitoring returns summary template-WATER/WASTEWATER(SEWER) Lic No: P0973-01 Year 2016
Additional informationSE-3 Wastewater/Sewer
1,2-Dichlorobenzenecomposite Monthly 24 hour N/A N/A
0.2083µg/L N/A Standard Methods US EPA
Annual average
value used
Note 1: Volumetric flow shall be included as a reportable parameter
Note 2: Where Emission Limit Values (ELV) do not apply to your licence please compare results against EQS for Surface water or relevant receptor quality standards
17
AER Monitoring returns summary template-WATER/WASTEWATER(SEWER) Lic No: P0973-01 Year 2016
Additional information
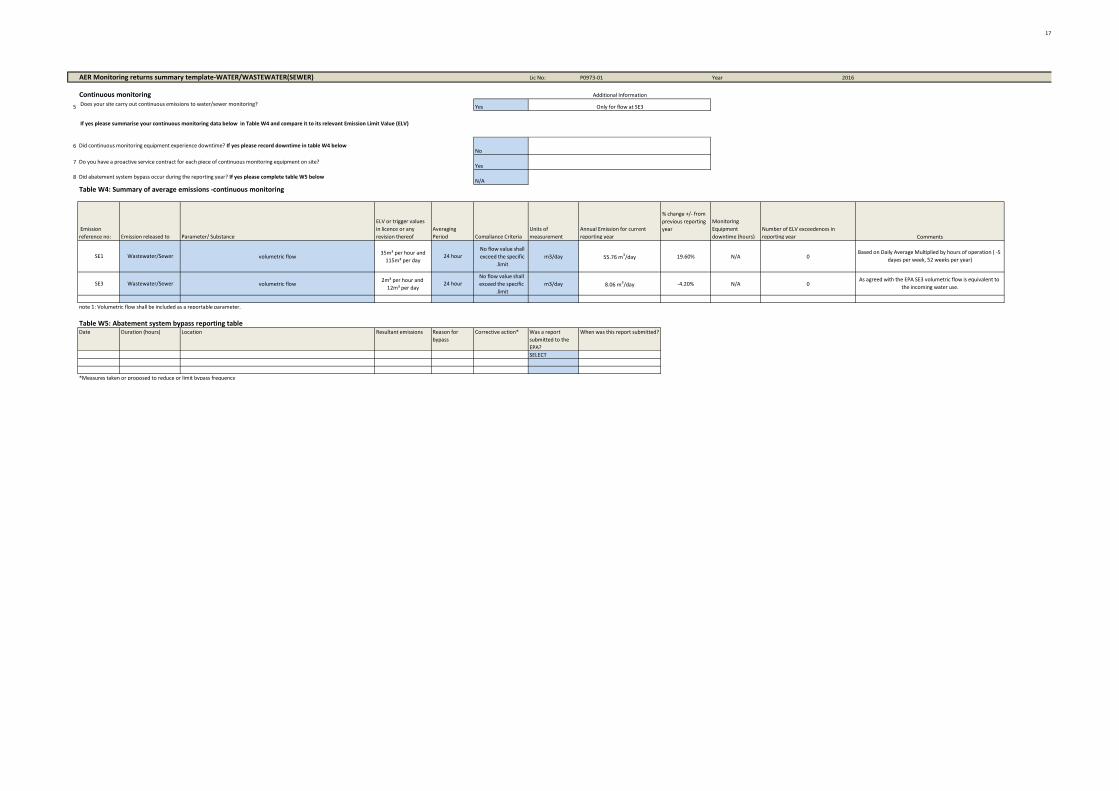
5 Yes
6No
7Yes
8N/A
Table W4: Summary of average emissions -continuous monitoring
Emission
reference no: Emission released to Parameter/ Substance
ELV or trigger values
in licence or any
revision thereof
Averaging
Period Compliance Criteria
Units of
measurement
Annual Emission for current
reporting year
% change +/- from
previous reporting
year
Monitoring
Equipment
downtime (hours)
Number of ELV exceedences in
reporting year
SE1 Wastewater/Sewer volumetric flow35m³ per hour and
115m³ per day24 hour
No flow value shall
exceed the specific
limit .
m3/day 55.76 m3/day 19.60% N/A 0
SE3 Wastewater/Sewer volumetric flow2m³ per hour and
12m³ per day24 hour
No flow value shall
exceed the specific
limit .
m3/day 8.06 m3/day -4.20% N/A 0
note 1: Volumetric flow shall be included as a reportable parameter.
Table W5: Abatement system bypass reporting tableDate Duration (hours) Location Resultant emissions Reason for
bypass
Corrective action* Was a report
submitted to the
EPA?
When was this report submitted?
SELECT
*Measures taken or proposed to reduce or limit bypass frequency
As agreed with the EPA SE3 volumetric flow is equivalent to
the incoming water use.
Did continuous monitoring equipment experience downtime? If yes please record downtime in table W4 below
Do you have a proactive service contract for each piece of continuous monitoring equipment on site?
Did abatement system bypass occur during the reporting year? If yes please complete table W5 below
Comments
Based on Daily Average Multiplied by hours of operation ( -5
dayes per week, 52 weeks per year)
Continuous monitoring Additional Information
Does your site carry out continuous emissions to water/sewer monitoring? Only for flow at SE3
If yes please summarise your continuous monitoring data below in Table W4 and compare it to its relevant Emission Limit Value (ELV)

18
Bund/Pipeline testing template Lic No: P0973-01 Year 2016
Bund testing Additional information
1 Yes
2 Please provide integrity testing frequency period 3 years
3 Yes
4 How many bunds are on site? 8
5 How many of these bunds have been tested within the required test schedule? All
6 How many mobile bunds are on site? 2
7 Are the mobile bunds included in the bund test schedule? Yes
8 How many of these mobile bunds have been tested within the required test schedule? All
9 N/A
10 N/A
Please list any sump integrity failures in table B1
11 N/A
12 N/A
13 Is the Fire Water Retention Pond included in your integrity test programme? N/A
Bund/Containment structure
ID Type Specify Other type Product containment Actual capacity Capacity required* Type of integrity test Other test type Test date
Integrity reports
maintained on
site? Results of test
Integrity test failure
explanation <50 words Corrective action taken
Scheduled date
for retest
Results of
retest(if in
current
reporting year)
1- Diesel Generator general purpose concrete/masonry N/A Diesel 2400L 330L Hydraulic test N/A 07/04/2014 Yes Pass N/A N/A N/A N/A
2- Haz Waste Bund 1 general purpose concrete/masonry N/A Haz Waste - various 1930L 1100L Hydraulic test N/A 25/06/2014 Yes Pass N/A N/A N/A N/A
3- Haz Waste Bund 2 other (please specify) Stainless steel Haz Waste - various 260L 440L Hydraulic test N/A 07/04/2014 Yes Pass N/A N/A N/A N/A
4 - Waste Ethanol prefabricated Mild steel Ethanol and Extran 1100L 1100L Hydraulic test N/A 25/06/2014 Yes Pass N/A N/A N/A N/A
5- Sprinkler Pump House general purpose concrete/masonry N/A Diesel 500L 155L Hydraulic test N/A 07/04/2014 Yes Pass N/A N/A N/A N/A
6- Oil / Coolant Bund prefabricated Plastic mobile bund Lubricating oil and coolant 30L 22L Hydraulic test N/A 30/04/2014 Yes Pass N/A N/A N/A N/A
7- Phase 3 Plant Room prefabricated Plastic mobile bund Ethanol / Other Haz Waste 2280L 1100L Hydraulic test N/A 02/07/2015 Yes Pass N/A N/A N/A N/A
8- Waste Ethanol IBC
Chemstore other (please specify) Stainless steel
Extran/Water,
Ethanol/Paclitaxel mixture 2100L 1500L Hydraulic test N/A 17/11/2015 Yes Pass N/A N/A N/A N/A* Capacity required should comply with 25% or 110% containment rule as detailed in your licence Commentary
15 bunding and storage guidelines Yes
16 Are channels/transfer systems to remote containment systems tested? SELECT Not applicable
17 Are channels/transfer systems compliant in both integrity and available volume? SELECT Not applicable
1 Yes
2 Please provide integrity testing frequency period 3 years
*please note integrity testing means water tightness testing for process and foul pipelines (as required under your licence)
Structure ID Type system Material of construction:
Does this structure have
Secondary containment?
Type of secondary
containment
Type integrity testing
Integrity reports
maintained on site? Results of test
Integrity test
failure explanation
<50 words
Corrective action
taken
Scheduled date
for retest
Results of retest(if in current
reporting year)
Storm pvc No Combination Yes Pass
Foul pvc No Combination Yes Pass
Process polypropylene Yes Double walled piping Combination Yes Pass
Please use commentary for additional details not answered by tables/ questions above
Does the site maintain a register of bunds, underground pipelines (including stormwater and foul), Tanks, sumps and containers? (containers refers to "Chemstore" type units and mobile bunds)
Has integrity testing been carried out in accordance with licence requirements and are all structures tested in line with BS8007/EPA Guidance?
Do all sumps and chambers have high level liquid alarms?
If yes to Q11 are these failsafe systems included in a maintenance and testing programme?
Pipeline/underground structure testing
dropdown menu click to see options
Are you required by your licence to undertake integrity testing on bunds and containment structures ? if yes please fill out table B1 below listing all new bunds and containment structures on site,
in addition to all bunds which failed the integrity test-all bunding structures which failed including mobile bunds must be listed in the table below, please include all bunds outside the licenced
testing period (mobile bunds and chemstore included)
Are you required by your licence to undertake integrity testing* on underground structures e.g. pipelines or sumps etc ? if yes please fill out table 2 below listing all underground structures and
pipelines on site which failed the integrity test and all which have not been tested withing the integrity test period as specified
Table B2: Summary details of pipeline/underground structures integrity test
How many sumps on site are included in the integrity test schedule?
How many of these sumps are integrity tested within the test schedule?
Table B1: Summary details of bund /containment structure integrity test

19
Groundwater/Soil monitoring template Lic No: P0973-01 Year 2016
Comments
1 yes
2 no
3 no
4Groundwater
monitoring
template
no
5 no
6
7 N/A
8 yes
9 yes
10 yes
11 yes
12 no
Table 1: Upgradient Groundwater monitoring results
Date of sampling
Sample
location
reference
Parameter/
SubstanceMethodology
Monitoring
frequency
Maximum
Concentration++
Average
Concentration+unit GTV's* SELECT**
Upward trend in
pollutant
concentration
over last 5 years
of monitoring data
21/06/2016 GW-1 pH Standard Annually 6.88 pH 6.5-9.5 - data not available
21/06/2016 GW-1 Potassium Standard 1.2 mg/l 6.5-9.5 5 data not available
21/06/2016 GW-1 Sodium Standard 14.4 mg/l 150 150 data not available
21/06/2016 GW-1 Sulphate Standard 45.41 mg/l 187.5 200 data not available
21/06/2016 GW-1 Chloride Standard 26.8 mg/l 187.5 30 data not available
21/06/2016 GW-1 Nitrate as NO3 Standard 0.8 mg/l 37.5 25 data not available
21/06/2016 GW-1Ammoniacal
Nitrogen as NStandard 0.03 mg/l 0.175 - data not available
Please provide an interpretation of groundwater monitoring data in the
interpretation box below or if you require additional space please include
a groundwater/contaminated land monitoring results interpretaion as an
additional section in this AER
See additional tab for interpretation of Grounwater Monitoring Results
for 2016.
Are you required to carry out groundwater monitoring as part of your licence
requirements?
Are you required to carry out soil monitoring as part of your licence requirements?
Have actions been taken to address contamination issues?If yes please summarise
remediation strategies proposed/undertaken for the site
Do monitoring results show that groundwater generic assessment
criteria such as GTVs or IGVs are exceeded or is there an upward
trend in results for a substance? If yes, please complete the
Groundwater Monitoring Guideline Template Report (link in cell G8)
and submit separately through ALDER as a licensee return AND
answer questions 5-12 below.
Do you extract groundwater for use on site? If yes please specify use in comment section
Has any type of risk assesment been carried out for the site?
N/A
Please specify the proposed time frame for the remediation strategy
Is there a licence condition to carry out/update ELRA for the site?
Is there evidence that contamination is migrating offsite?
Is the contamination related to operations at the facility (either current and/or historic)
Have potential receptors been identified on and off site?
Has a Conceptual Site Model been developed for the site?
20
Groundwater/Soil monitoring template Lic No: P0973-01 Year 2016
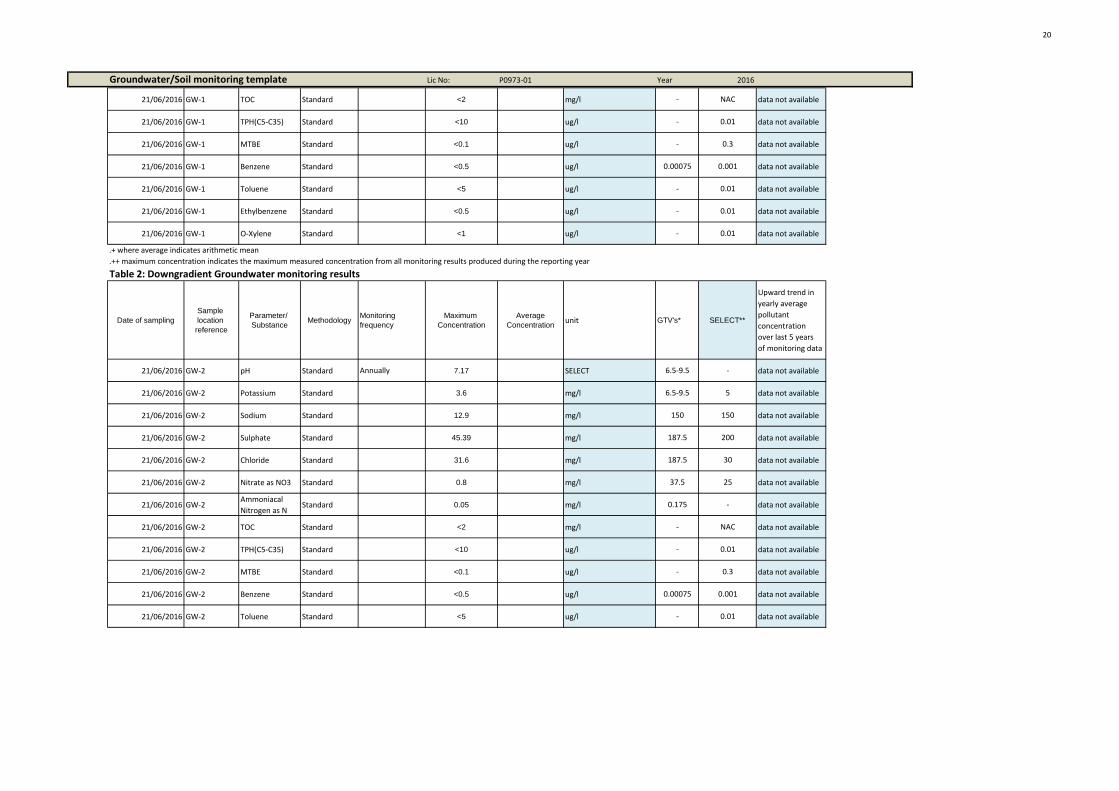
21/06/2016 GW-1 TOC Standard <2 mg/l - NAC data not available
21/06/2016 GW-1 TPH(C5-C35) Standard <10 ug/l - 0.01 data not available
21/06/2016 GW-1 MTBE Standard <0.1 ug/l - 0.3 data not available
21/06/2016 GW-1 Benzene Standard <0.5 ug/l 0.00075 0.001 data not available
21/06/2016 GW-1 Toluene Standard <5 ug/l - 0.01 data not available
21/06/2016 GW-1 Ethylbenzene Standard <0.5 ug/l - 0.01 data not available
21/06/2016 GW-1 O-Xylene Standard <1 ug/l - 0.01 data not available
.+ where average indicates arithmetic mean
.++ maximum concentration indicates the maximum measured concentration from all monitoring results produced during the reporting year
Table 2: Downgradient Groundwater monitoring results
Date of sampling
Sample
location
reference
Parameter/
SubstanceMethodology
Monitoring
frequency
Maximum
Concentration
Average
Concentrationunit GTV's* SELECT**
Upward trend in
yearly average
pollutant
concentration
over last 5 years
of monitoring data
21/06/2016 GW-2 pH Standard Annually 7.17 SELECT 6.5-9.5 - data not available
21/06/2016 GW-2 Potassium Standard 3.6 mg/l 6.5-9.5 5 data not available
21/06/2016 GW-2 Sodium Standard 12.9 mg/l 150 150 data not available
21/06/2016 GW-2 Sulphate Standard 45.39 mg/l 187.5 200 data not available
21/06/2016 GW-2 Chloride Standard 31.6 mg/l 187.5 30 data not available
21/06/2016 GW-2 Nitrate as NO3 Standard 0.8 mg/l 37.5 25 data not available
21/06/2016 GW-2Ammoniacal
Nitrogen as NStandard 0.05 mg/l 0.175 - data not available
21/06/2016 GW-2 TOC Standard <2 mg/l - NAC data not available
21/06/2016 GW-2 TPH(C5-C35) Standard <10 ug/l - 0.01 data not available
21/06/2016 GW-2 MTBE Standard <0.1 ug/l - 0.3 data not available
21/06/2016 GW-2 Benzene Standard <0.5 ug/l 0.00075 0.001 data not available
21/06/2016 GW-2 Toluene Standard <5 ug/l - 0.01 data not available
21
Groundwater/Soil monitoring template Lic No: P0973-01 Year 2016
21/06/2016 GW-2 Ethylbenzene Standard <0.5 ug/l - 0.01 data not available
21/06/2016 GW-2 O-Xylene Standard <1 ug/l - 0.01 data not available
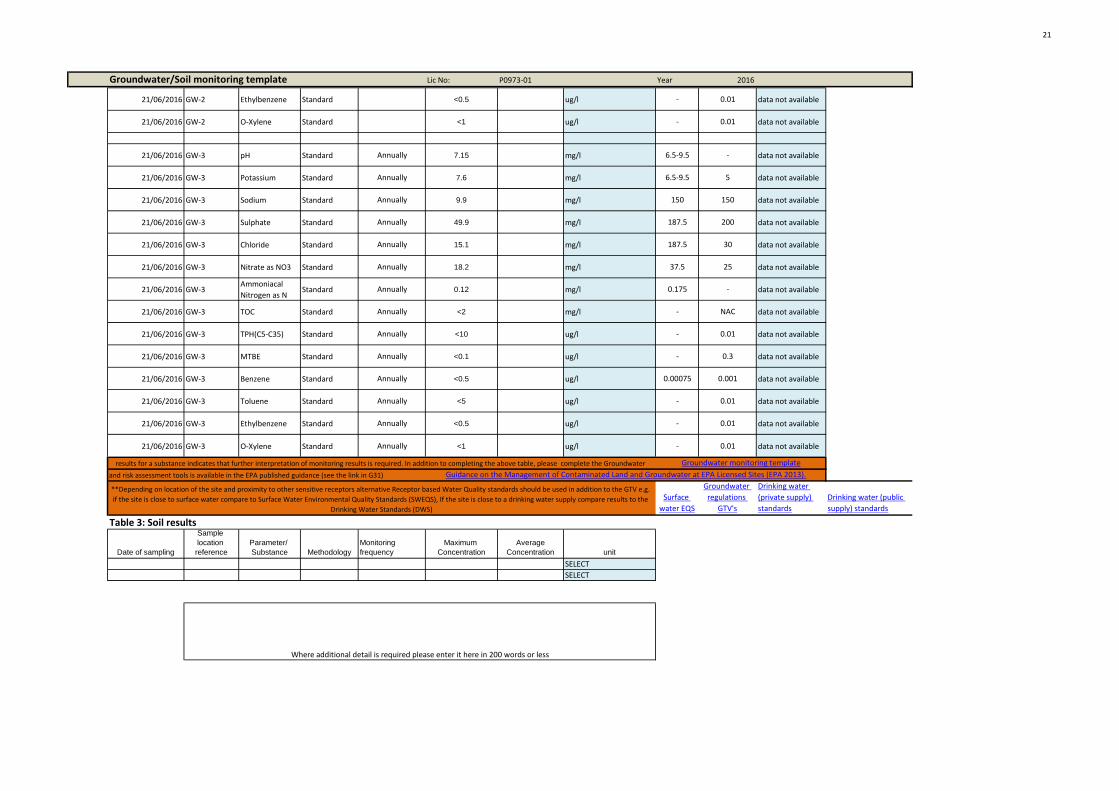
21/06/2016 GW-3 pH Standard Annually 7.15 mg/l 6.5-9.5 - data not available
21/06/2016 GW-3 Potassium Standard Annually 7.6 mg/l 6.5-9.5 5 data not available
21/06/2016 GW-3 Sodium Standard Annually 9.9 mg/l 150 150 data not available
21/06/2016 GW-3 Sulphate Standard Annually 49.9 mg/l 187.5 200 data not available
21/06/2016 GW-3 Chloride Standard Annually 15.1 mg/l 187.5 30 data not available
21/06/2016 GW-3 Nitrate as NO3 Standard Annually 18.2 mg/l 37.5 25 data not available
21/06/2016 GW-3Ammoniacal
Nitrogen as NStandard Annually 0.12 mg/l 0.175 - data not available
21/06/2016 GW-3 TOC Standard Annually <2 mg/l - NAC data not available
21/06/2016 GW-3 TPH(C5-C35) Standard Annually <10 ug/l - 0.01 data not available
21/06/2016 GW-3 MTBE Standard Annually <0.1 ug/l - 0.3 data not available
21/06/2016 GW-3 Benzene Standard Annually <0.5 ug/l 0.00075 0.001 data not available
21/06/2016 GW-3 Toluene Standard Annually <5 ug/l - 0.01 data not available
21/06/2016 GW-3 Ethylbenzene Standard Annually <0.5 ug/l - 0.01 data not available
21/06/2016 GW-3 O-Xylene Standard Annually <1 ug/l - 0.01 data not available
Surface
water EQS
Groundwater
regulations
GTV's
Drinking water
(private supply)
standards
Drinking water (public
supply) standards
Table 3: Soil results
Date of sampling
Sample
location
reference
Parameter/
Substance Methodology
Monitoring
frequency
Maximum
Concentration
Average
Concentration unit
SELECT
SELECT
*please note exceedance of generic assessment criteria (GAC) such as a Groundwater Threshold Value (GTV) or an Interim Guideline Value (IGV) or an upward trend in
results for a substance indicates that further interpretation of monitoring results is required. In addition to completing the above table, please complete the Groundwater Groundwater monitoring templateMore information on the use of soil and groundwater standards/ generic assessment criteria (GAC)
and risk assessment tools is available in the EPA published guidance (see the link in G31) Guidance on the Management of Contaminated Land and Groundwater at EPA Licensed Sites (EPA 2013).
**Depending on location of the site and proximity to other sensitive receptors alternative Receptor based Water Quality standards should be used in addition to the GTV e.g.
if the site is close to surface water compare to Surface Water Environmental Quality Standards (SWEQS), If the site is close to a drinking water supply compare results to the
Drinking Water Standards (DWS)
Where additional detail is required please enter it here in 200 words or less

Groundwater Monitoring 2016 Interpretation Results indicate that, Dissolved Sodium, Sulphate, Nitrate as NO3, and Ammoniacal Nitrogen as N are all below the IGV and GTV referred to in the report. Comparison of results indicates similar levels for potassium at GW1 and GW2 over the 2015 and 2016 monitoring period. The results at GW3 show a decreased level in potassium at GW3 from 11.2 mg/l to 7.6 mg/l. Sodium levels have remained constant with little change at each of the monitoring locations. Chloride levels at GW1 and GW3 have remained similar, showing levels of 25 mg/l in 2015 and 26.8 mg/l in 2016 from GW1 and le vels of 13.3 mg/l in 2015 and 15.1 mg/l in 2016 from GW3. Chloride levels in GW2 have varied slightly from 21.9 mg/l in 2015 to 31.6 mg/l in 2016. Nitrate levels at GW1 showed a marginal increase from 0.5 mg/l in 2015 to 0.8 mg/l in 2016. At GW2 nitrate levels decreased from 2.6 mg/l to 0.8 mg/l and at GW3 the level of nitrate increased from 16.6 mg/l to 18.2 mg/l. Ammoniacal Nitrogen at GW1 showed a marginal increase from <0.02 mg/l in 2015 to 0.03 mg/l in 2016. Decreases in ammoniacal nitrogen were noted at GW2 and GW3 ranging from 0.12 mg/l to 0.05 mg/l from 2015 to 2016 and 0.48 mg/l to 0.12 mg/l 2015 to 2016 respectively. Total Organic Carbon was not detected above the method limits of detection in either the 2015 or the 2016 sampling events. Methyl Tertiary Butyl Ether was not detected above the method limits of detection in either the 2015 or the 2016 sampling eve nts. Benzene, Toluene, Ethylbenzene, p/m-Xylene (BTEX) was not detected above the method limits of detection in either the 2015 or the 2016 sampling events. With the exception of Dissolved Potassium concentration of 7.6 mg/l at GW3 which is above the IGV of 5 mg/l. Chloride level of 31.6 mg/l was detected at GW2 which is above the IGV of 30 mg/l but below the GTV of 187.5 mg/l. Benzene, Toluene, Ethylbenzene, p/m-Xylene (BTEX) were not detected above the method limits of detection. No Total Aliphatics or Aromatics in the range C5-35 were detected above the method limits of detection. Phenols, PAH’s (Polyaromatic Hydrocarbons) or Phthalates were not detected above the method limits of detection. It is also noted that no VOC or SVOC (Semi-Volatile and Volatile Organic Carbons) were detected at any of the groundwater monitoring wells. In comparsion to the results detected in 2015 with those detected in 2016, the following is noted; Comparison of results indi cates similar levels for potassium at GW1 and GW2 over the 2015 and 2016 monitoring period. The results at GW3 show a decreased level in potassium at GW3 from 11.2 mg/l to 7.6 mg/l. Sodium levels have remained constant with little change at each of the monitoring locations. Chloride levels at GW1 and GW3 have remained similar, showing levels of 25 mg/l in 2015 and 26.8 mg/l in 2016 from GW1 and le vels of 13.3 mg/l in 2015 and 15.1 mg/l in 2016 from GW3. Chloride levels in GW2 have varied slightly from 21.9 mg/l in 2015 to 31.6 mg/l in 2016. Nitrate levels at GW1 showed a marginal increase from 0.5 mg/l in 2015 to 0.8 mg/l in 2016. At GW2 nitrate levels decreased from 2.6 mg/l to 0.8 mg/l and at GW3 the level of nitrate increased from 16.6 mg/l to 18.2 mg/l. Ammoniacal Nitrogen at GW1 showed a marginal increase from <0.02 mg/l in 2015 to 0.03 mg/l in 2016. Decreases in ammoniacal nitrogen were noted at GW2 and GW3 ranging from 0.12 mg/l to 0.05 mg/l from 2015 to 2016 and 0.48 mg/l to 0.12 mg/l 2015 to 2016 respectively.

23
Environmental Liabilities template Lic No: P0973-01 Year 2016
Commentary
1
Submitted and not agreed by EPA;
2 N/A
First ELRA for the site
submitted in 2015 and
yet to be agreed by
the EPA
3
€1,082,340
(including 40%
contingency and ex
VAT)
4
Not yet agreed with EPA
5Not yet agreed with EPA
6Not yet agreed with EPA
7 N/A
8
Closure plan submitted and not
agreed by EPA
9 Review required and not completed
10 Submitted and not agreed by EPA;
11
€675,729(including 25%
contingency, one year
of aftercare security /
maintenance, ex VAT)
12
Not yet agreed with EPA
13 N/AFinancial provision for Closure expiry date
Financial Provision for Closure - type
Click here to access EPA guidance on Environmental Liabilities and Financial
provision
Financial provision for ELRA expiry date
Closure plan initial agreement status
Closure plan review status
Financial Provision for Closure status
Financial Provision for Closure - amount of cover
ELRA initial agreement status
ELRA review status
Amount of Financial Provision cover required as determined by the latest ELRA
Financial Provision for ELRA status
Financial Provision for ELRA - amount of cover
Financial Provision for ELRA - type

24
Environmental Management Programme/Continuous Improvement Programme template Lic No: P0973-01 Year 2016
Additional Information
1
Yes
2 Yes
3 Yes
4 Yes
Environmental Management Programme (EMP) reportObjective Category Target Status (% completed) How target was progressed Responsibility Intermediate outcomes
Water and Wastewater Management
Review potential to reuse
permeate water from high
purity water system
100
Review completed Q4 2016,
Not feasible to reuse
permeate water.
Facilities EngineerImproved Environmental
Management Practices
Water and Wastewater Management
Access to Interceptor No. 1
to be modified for safe
operational/maintenance
access. De-sludge and
carry out maintenance on
interceptor when access
provided.
100Safe access provided and de-
sludged, May 16Facilities Engineer N/A
Water and Wastewater Management
Set and agree COD trigger
levels for surface water
management in
accordance with IPC licence
100
Actions completed and
trigger levels agreed with the
EPA
EHS Specialist / AssociateIncreased compliance with
licence conditions
Water and Wastewater Management
Develop company
procedure for sewer
emissions monitoring in
accordance with IPC
licence conditions
95Procedure developed and to
be signed off internally.EHS Specialist / Associate N/A
Energy and Resource Use
Implement lighting energy
efficiency project for the
site
100 Completed May 2016 Facilities EngineerImproved Environmental
Management Practices
Energy and Resource Use
Investigate a project
related to the automatic
shutdown of all personal
computers at the facility
100
Investigation complete,
desktops pre programmed
to enter stand by after a
period of non use.
IT N/A
Energy and Resource Use
Complete energy efficiency
audit for the facility in
accordance with IPC
licence conditions
100
Audit completed October
2015 & received February
2016
Facilities Engineer / EHSImproved Environmental
Management Practices
Energy and Resource Use
Review setting printers to
default to double sided
printing. Measure the
reduction in paper use
when/if implemented.
100
Reviewed 2016, not feasible,
quality requirement to use
single sided print only.
IT N/A
Energy and Resource Use
Measure paper
consumption on an annual
basis and record trends
50 Ongoing measure EHS N/A
Improve Contractor Management
Examine existing
contractor permit to work
system for adequacy, to
include for potential
environmental risks
associated with contractor
works.
60
Target for Q4 2016
Contractors requested to
provide and track waste
generated, reviewed through
the method statement
review process. Contractor
management system
currently in review,
additional of permit system
to include waste tracking &
introduction of
environmental awareness as
part of contractor induction.
EHSImproved Environmental
Management Practices
Raw Material and Waste Management
Implement further bunding
requirements for
hazardous waste storage
in waste storage yard.
100
New chemstore bund
provided for chemical waste
IBCs in waste storage yard
Facilities Engineer / EHSIncreased compliance with
licence conditions
Raw Material and Waste Management
Roll out Delta Streams
across the facility for all
wastes managed on-site
95
Target for Q4 2016
All waste streams identified
for each location, streams
developed & posters fitted
to 95% of locations, supplier
issue on final posters.
EHSImproved Environmental
Management Practices
Raw Material and Waste Management
Procure purpose built
trolleys for solvent
transport within the
building
100Trolleys purchased and
operationalFacilities Engineer / EHS N/A
IPC Licence Compliance
Draft and submit Firewater
Retention Risk Assessment
to the EPA for agreement
100
Firewater Retention Risk
Assessment report
submitted to the EPA for
approval in 2015
EHSIncreased compliance with
licence conditions
EMS was developed within the first six months of the licence
being issued to Cook Medical in accordance with IPC licence
requirements
Register of environmental aspects and impacts developed
EMP developed as part of EMS
Procedure set up within the EMS regarding external
communicationDo you maintain an environmental documentation/communication system to inform the public on
environmental performance of the facility, as required by the licence
Highlighted cells contain dropdown menu click to view
Does the EMS reference the most significant environmental aspects and associated impacts on-site
Does the EMS maintain an Environmental Management Programme (EMP) as required in accordance
with the licence requirements
Do you maintain an Environmental Mangement System (EMS) for the site. If yes, please detail in
additional information

25
Environmental Management Programme/Continuous Improvement Programme template Lic No: P0973-01 Year 2016
Highlighted cells contain dropdown menu click to view
IPC Licence Compliance
Draft and submit Closure
Plan and Environmental
Liabilities Risk Assessment
to the EPA for agreement
(agree Financial Provision
subsequently)
100
Closure Plan and
Environmental Liabilities Risk
Assessment submitted to the
EPA for approval in 2015
EHSIncreased compliance with
licence conditions
IPC Licence Compliance
Develop company
operating procedure for
IPC licence air emissions
monitoring requirements
100 implemented 2016 EHSIncreased compliance with
licence conditions
IPC Licence Compliance
Complete pipeline integrity
testing in accordance with
IPC licence
100 Completed December 2016 Facilities Engineer N/A
IPC Licence Compliance
Draft and agree Accident
Prevention and Emergency
Response Plan and
communicate to relevant
persons
100Implemented with site
management.EHS
Increased compliance with
licence conditions
Employee Travel (Commuting)
Consider and investigate
other proposed hard and
soft measures of the Cook
Limerick Smarter Travel
Plan for inclusion in EMP
70
Target for Q4 2017
1. Limerick Smarter Travel
route opened Feb 2017
2. Onsite Cycle workshops
carried out in 2016
3. Ongoing communications
on cycle to work schemes,
car pooling, etc.
EHS / Facilities Engineer N/A
IPC Licence Compliance Air emissions abatement 20 Q2 2018Environmental Consultant /
FacilitiesInstallation of infrastructure
Raw Material and Waste Management
Audit Solvent usage to
determine areas where
reductions in usage can be
applied.
20
Q3 2017
Trials ongoing, commenced
February 2017.
Engineering Reduced emissions
Energy and Resource Use
installation of Occupancy
Sensors for lighting where
areas are not constantly in
use.
100
Q4 16
Sensors installed in low
occupancy areas in 2016
Facilities EngineerImproved Environmental
Management Practices
Energy and Resource Use
Consider simple colour
coding of switching in
office areas with a colour
coded map to allow
personnel know simply
what switches relate to
what area.
10
Q2 2018
Mapping & colour coding of
areas in progress
Facilities EngineerImproved Environmental
Management Practices
Energy and Resource Use
Consider automation of
the control of air pressures
in the clean manufacturing
areas to allow easier air
flow reduction when areas
out of use.
100
Night set back mode on AHU
Fan speed controllers
implemented
Facilities EngineerImproved Environmental
Management Practices

26
Lic No: P0973-01 Year 2016
1 Yes
2
Noise
Guidance
note NG4
Yes
3 No
4 Not applicable
5 No
Date of
monitoring Time period
Noise location
(on site)
Noise
sensitive
location -NSL
(if applicable) LAeq LA90 LA10 LAmax
Tonal or Impulsive
noise* (Y/N)
If tonal /impulsive noise was identified was
5dB penalty applied?
Comments (ex. main noise sources
on site, & extraneous noise ex.
road traffic)
Is site compliant with
noise limits
(day/evening/night)?
18/10/2016
19/10/2016 Daytime (1 of 3) N/A NSL1 48 40 51 68No No Local traffic, trees rustling, birds.
Plant not audible.Yes
18/10/2016
19/10/2016 Daytime (2 of 3) N/A NSL1 48 41 50 68No No
Local traffic, trees rustling, birds.
Plant not audible.Yes
18/10/2016
19/10/2016 Daytime (3 of 3) N/A NSL1 47 37 51 70
No No Cars idling. Local traffic, trees
rustling, birds. Plant not audible.
Yes
18/10/2016
19/10/2016 Daytime (1 of 3) N/A NSL2 61 53 65 85
No No Traffic noise main road and side
road, trees rustling, birds singing.
Yes
18/10/2016
19/10/2016 Daytime (2 of 3) N/A NSL2 62 54 66 77
No No Traffic noise main road and side
road, trees rustling, birds singing.
Yes
18/10/2016
19/10/2016 Daytime (3 of 3) N/A NSL2 62 54 64 77
No No Traffic noise main road and side
road, trees rustling, birds singing.
Yes
18/10/2016
19/10/2016 Evening (1 of 1) N/A NSL1 47 37 49 67No No
Playing fields UL, traffic, bin users,
plant not audible.Yes
18/10/2016
19/10/2016 Evening (1 of 1) N/A NSL2 55 43 58 67
No No Traffic main and side road, distant
music, plant not audible.
Yes
18/10/2016
19/10/2016 Night (1 of 2) N/A NSL1 41 33 39 64
No No Local and distant traffic, voices,
local stream, plant not audible.
Yes
18/10/2016
19/10/2016 Night (2 of 2) N/A NSL1 40 34 42 56
No No Local and distant traffic, voices,
local stream, plant not audible.
Yes
18/10/2016
19/10/2016 Night (1 of 2) N/A NSL2 53 43 57 65
No NoTraffic , music from neighbouring
house, voices from passing
pedestrians. Plant not audible.
Yes
Was noise monitoring a licence requirement for the AER period?
If yes please fill in table N1 noise summary below
Was noise monitoring carried out using the EPA Guidance note, including completion of the "Checklist
for noise measurement report" included in the guidance note as table 6?
Does your site have a noise reduction plan
When was the noise reduction plan last updated?
Noise monitoring summary report
Have there been changes relevant to site noise emissions (e.g. plant or operational changes) since the last noise
survey?
Table N1: Noise monitoring summary

27
18/10/2016
19/10/2016 Night (2 of 2) N/A NSL2 52 41 55 65
No No Music stopped from neighbouring
house. Traffic, voices from passing
pedestrians. Plant not audible.
Yes
*Please ensure that a tonal analysis has been carried out as per guidance note NG4. These records must be maintained onsite for future inspection
SELECT
Throughout the noise survey the Cook facility was not detectable at the noise sensitive locations. Noise from other sources close to the noise sensitive locations were the
sources contributing to the levels at the monitoring points. The noise sensitive locations are NSL1 (Outside Kilmurry Village, facility side of vegetation along path way)
and NSL2 (Outside Oaklawns residential estate, at Plassey Park Road / Milford Road junction). NSL1 and NSL2 are approximately 540m and 580m from the Cook Ireland
Limited facility, respectively.
If noise limits exceeded as a result of noise attributed to site activities, please choose the corrective action from the following options?
** please explain the reason for not taking action/resolution of noise issues?

28
Resource Usage/Energy efficiency summary Lic No: P0973-01 Year 2016
Additional information
1 Oct-15
Completed October
15, report submitted
2
SEAI - Large
Industry Energy
Network (LIEN) No
3 Yes
Energy Use Previous year Current year
Production +/- %
compared to
previous reporting
year**
Energy
Consumption +/- %
vs overall site
production*
Total Energy Used (MWHrs) 8398.93 8952.21 6.59%
Total Energy Generated (MWHrs) N/A N/A N/A
Total Renewable Energy Generated (MWHrs) N/A N/A N/A
Electricity Consumption (MWHrs) 4440.29 4879.79 9.9%
Fossil Fuels Consumption: N/A N/A N/A
Heavy Fuel Oil (m3) N/A N/A N/A
Light Fuel Oil (m3) 2.60 5.49 111.3%
Natural gas (m3) 375625.84 388693.26 3.5%
Coal/Solid fuel (metric tonnes) N/A N/A N/A
Peat (metric tonnes) N/A N/A N/A
Renewable Biomass N/A N/A N/A
Renewable energy generated on site N/A N/A N/A
* where consumption of energy can be compared to overall site production please enter this information as percentage increase or decrease compared to the previous reporting year.
** where site production information is available please enter percentage increase or decrease compared to previous year
Water Emissions Water Consumption
Water use
Water extracted
Previous year m3/yr.
Water extracted
Current year m3/yr.
Production +/- %
compared to
previous reporting
year**
Energy
Consumption +/- %
vs overall site
production*
Volume Discharged
back to
environment(m3yr):
Volume used i.e not
discharged to
environment e.g.
released as steam
m3/yr Unaccounted for Water:
Groundwater
Surface water
Public supply 11663 14497 8.29% 14497 14497 0
Recycled water
Total 11663 14497 8.29% 14497 14497 0
* where consumption of water can be compared to overall site production please enter this information as percentage increase or decrease compared to the previous reporting year.
** where site production information is available please enter percentage increase or decrease compared to previous year
Total Landfill Incineration Recycled Other
Hazardous (Tonnes) 133.746
Non-Hazardous (Tonnes) 130.8
Date of audit Recommendations
Description of
Measures proposed Origin of measures
Predicted energy
savings % Implementation date Responsibility Completion date
Status and
comments
Table R5: Power Generation: Where power is generated onsite (e.g. power generation facilities/food and drink industry)please complete the following information
Unit ID Unit ID Unit ID Unit ID Station Total
Technology
Primary Fuel
Thermal Efficiency
Unit Date of Commission
Total Starts for year
Total Running Time
Total Electricity Generated (GWH)
House Load (GWH)
KWH per Litre of Process Water
KWH per Litre of Total Water used on Site
Table R3 Waste Stream Summary
Table R2 Water usage on site
Table R4: Energy Audit finding recommendations
When did the site carry out the most recent energy efficiency audit? Please list the recommendations in table 3 below
Is the site a member of any accredited programmes for reducing energy usage/water conservation such as the SEAI
programme linked to the right? If yes please list them in additional information
Where Fuel Oil is used in boilers on site is the sulphur content compliant with licence conditions? Please state percentage in additional
information
Table R1 Energy usage on site

29
Complaints and Incidents summary template Lic No: P0973-01 Year 2016
Additional information
SELECT
Date Category Other type (please specify)
Brief description of
complaint (Free txt <20
words)
Corrective action< 20
words Resolution status Resolution date
Further
information
SELECT SELECT
SELECT SELECT
SELECT SELECT
SELECT SELECT
SELECT SELECT
Total complaints
open at start of
reporting year
Total new
complaints
received during
reporting year
Total complaints
closed during
reporting year
Balance of
complaints end of
reporting year
Additional information
SELECT
What is an incident
Table 2 Incidents summary
Date of occurrence Incident nature Location of occurrence
Incident category*please
refer to guidance Receptor Cause of incident
Other
cause(please
specify)
Activity in
progress at time
of incident Communication Occurrence
Corrective action<20
words
Preventative action
<20 words Resolution status
Resolution
date
Likelihood of
reoccurence
28 June 2016 Breach of ELV
Licenced discharge point
(P0973-A3-23 ) 1. Minor Air
Plant or
equipment issues Normal activities EPA Recurring
Internal investigation
commenced,
Appointment of
environmental
consultancy group to
determine appropriate
controls to reduce TOC
Emissions below ELV.
Ongoing, target date
to completion not
determined. Ongoing SELECT
SELECT SELECT SELECT SELECT SELECT SELECT SELECT SELECT SELECT SELECT
SELECT SELECT SELECT SELECT SELECT SELECT SELECT SELECT SELECT SELECT
SELECT SELECT SELECT SELECT SELECT SELECT SELECT SELECT SELECT SELECT
Total number of
incidents current
year 1
Total number of
incidents previous
year 0
% reduction/
increase 100% Increase
Complaints
Have you received any environmental complaints in the current reporting year? If yes please complete summary
details of complaints received on site in table 1 below
Table 1 Complaints summary
Incidents
Have any incidents occurred on site in the current reporting year? Please list all incidents for current reporting
year in Table 2 below
*For information on how to report and what
constitutes an incident

30
WASTE SUMMARY Lic No: P0973-01 Year 2016
PRTR facility logon
Additional Information
1 SELECT
2 SELECT
3 SELECT
Table 1 Details of waste accepted onto your site for recovery, disposal or treatment (do not include wastes generated at your site, as these will have been reported in your PRTR workbook)EWC code Description of waste
accepted
Please enter an accurate
and detailed description
- which applies to
relevant EWC code
Quantity of waste
accepted in current
reporting year (tonnes)
Reason for
reduction/ increase
from previous
reporting year
Packaging Content (%)-
only applies if the waste
has a packaging
component
European Waste Catalogue EWC codes European Waste
Catalogue EWC codes
4 SELECT
5 SELECT
6 SELECT
7 Do you have an odour management system in place for your facility? If no why? SELECT
8 Do you maintain a sludge register on site? SELECT
Table 2 Waste type and tonnage-landfill only
Waste types permitted
for disposal
Authorised/licenced annual intake for
disposal (tpa)
Actual intake for disposal in
reporting year (tpa)
Remaining licensed
capacity at end of
reporting year (m3) Comments
Table 3 General information-Landfill only
Total disposal
area occupied by
waste
Lined disposal
area occupied by
waste
Unlined area
SELECT UNIT SELECT UNIT SELECT UNIT
SECTION A-PRTR ON SITE WASTE TREATMENT AND WASTE TRANSFERS TAB- TO BE COMPLETED BY ALL IPPC AND WASTE FACILITIES dropdown list click to see options
SECTION B- WASTE ACCEPTED ONTO SITE-TO BE COMPLETED BY ALL IPPC AND WASTE FACILITIES
Were any wastes accepted onto your site for recovery or disposal or treatment prior to recovery or disposal within the boundaries of your facility ?; (waste generated within your boundaries is
to be captured through PRTR reporting)
If yes please enter details in table 1 below
Did your site have any rejected consignments of waste in the current reporting year? If yes please give a brief explanation in the additional information
Was waste accepted onto your site that was generated outside the Republic of Ireland? If yes please state the quantity in tonnes in additional information
Licenced annual
tonnage limit for your
site (total
tonnes/annum)
Source of waste accepted Quantity of waste accepted in previous
reporting year (tonnes)
Reduction/
Increase over
previous year +/ -
%
Disposal/Recovery or treatment
operation carried out at your
site and the description of this
operation
Quantity of
waste remaining
on site at the
end of reporting
year (tonnes)
Comments -
SECTION C-TO BE COMPLETED BY ALL WASTE FACILITIES (waste transfer stations, Composters, Material recovery facilities etc) EXCEPT LANDFILL SITES
Is all waste processing infrastructure as required by your licence and approved by the Agency in place? If no please list waste processing infrastructure required onsite
Is all waste storage infrastructure as required by your licence and approved by the Agency in place? If no please list waste storage infrastructure required on site
Does your facility have relevant nuisance controls in place?
SECTION D-TO BE COMPLETED BY LANDFILL SITES ONLY
Area ID Date landfilling commenced Date landfilling ceased Currently landfilling Private or Public
OperatedInert or non-hazardous
Predicted date to
cease landfilling
Licence permits
asbestos
Is there a separate cell
for asbestos?
Accepted asbestos in reporting
year
Comments on
liner type
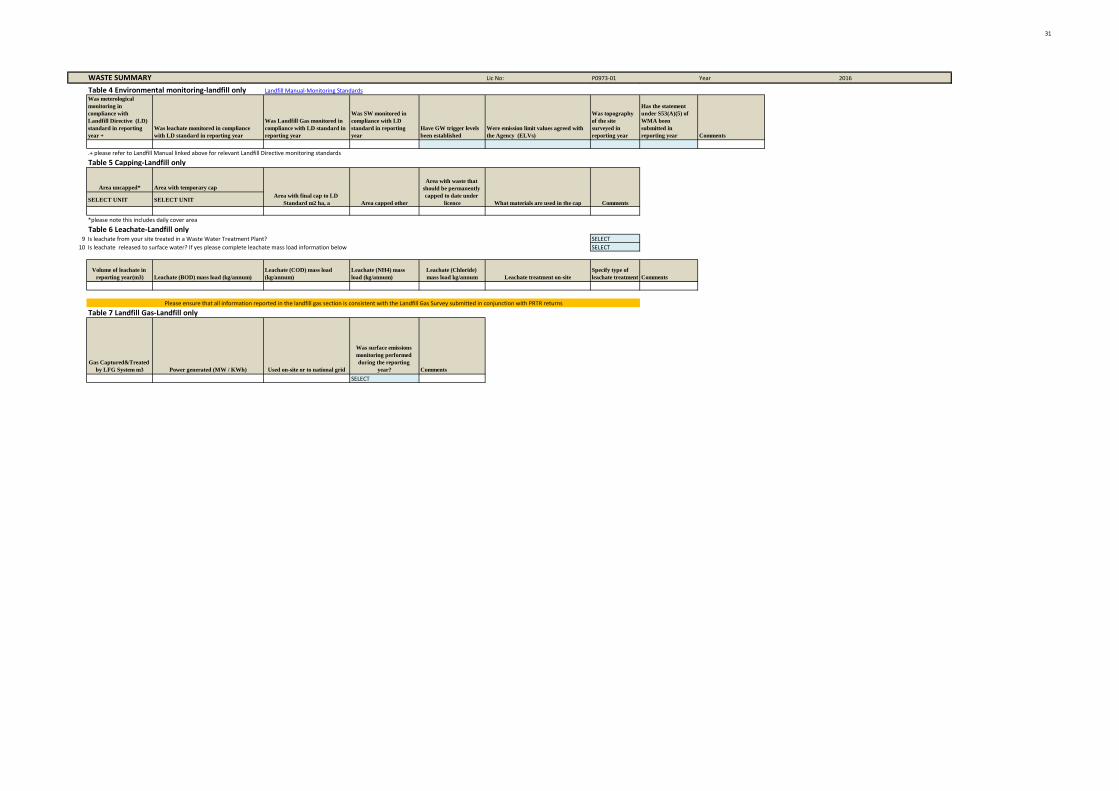
31
WASTE SUMMARY Lic No: P0973-01 Year 2016
SECTION A-PRTR ON SITE WASTE TREATMENT AND WASTE TRANSFERS TAB- TO BE COMPLETED BY ALL IPPC AND WASTE FACILITIES dropdown list click to see optionsTable 4 Environmental monitoring-landfill only Landfill Manual-Monitoring Standards
Was meterological
monitoring in
compliance with
Landfill Directive (LD)
standard in reporting
year +
Was leachate monitored in compliance
with LD standard in reporting year
Was Landfill Gas monitored in
compliance with LD standard in
reporting year
Was SW monitored in
compliance with LD
standard in reporting
year
Have GW trigger levels
been established
Were emission limit values agreed with
the Agency (ELVs)
Was topography
of the site
surveyed in
reporting year
Has the statement
under S53(A)(5) of
WMA been
submitted in
reporting year Comments
.+ please refer to Landfill Manual linked above for relevant Landfill Directive monitoring standards
Table 5 Capping-Landfill only
Area uncapped* Area with temporary cap
SELECT UNIT SELECT UNIT
*please note this includes daily cover area
Table 6 Leachate-Landfill only9 Is leachate from your site treated in a Waste Water Treatment Plant? SELECT
10 Is leachate released to surface water? If yes please complete leachate mass load information below SELECT
Volume of leachate in
reporting year(m3) Leachate (BOD) mass load (kg/annum)
Leachate (COD) mass load
(kg/annum)
Leachate (NH4) mass
load (kg/annum)
Leachate (Chloride)
mass load kg/annum Leachate treatment on-site
Specify type of
leachate treatment Comments
Table 7 Landfill Gas-Landfill only
Gas Captured&Treated
by LFG System m3 Power generated (MW / KWh) Used on-site or to national grid
Was surface emissions
monitoring performed
during the reporting
year? Comments
SELECT
Area with final cap to LD
Standard m2 ha, a Area capped other
Area with waste that
should be permanently
capped to date under
licence What materials are used in the cap Comments
Please ensure that all information reported in the landfill gas section is consistent with the Landfill Gas Survey submitted in conjunction with PRTR returns

| PRTR# : P0973 | Facility Name : Cook Ireland Ltd | Filename : P0973_PRTR_2016.xls |
Return Year : 2016 | 6232 30/03/2017 16:25
Guidance to completing the PRTR workbook
Version 1.1.19
REFERENCE YEAR 2016
1. FACILITY IDENTIFICATION
Parent Company Name Cook Ireland Ltd
Facility Name Cook Ireland Ltd
PRTR Identification Number P0973
Licence Number P0973-01
Classes of Activity
No. class_name
- Refer to PRTR class activities below
Address 1 O' Halloran Road
Address 2 National Technology Park
Address 3
Address 4 Limerick
Limerick
Country Ireland
Coordinates of Location -8.55131487452.67564715
River Basin District IEGBNISH
NACE Code 3250
Main Economic Activity Manufacture of medical and dental instruments and supplies
AER Returns Contact Name Cormac Bergin
AER Returns Contact Email Address [email protected]
AER Returns Contact Position EHS Specialist
AER Returns Contact Telephone Number 061334440
AER Returns Contact Mobile Phone Number
AER Returns Contact Fax Number
Production Volume 0.0
Production Volume Units
Number of Installations 0
Number of Operating Hours in Year 0
Number of Employees 0
User Feedback/Comments Production volumes, hours of operation & number of employees is
commercially sensitive information, records will be retained onsite and
can be inspected during an agency inspection when requested.
Web Address
2. PRTR CLASS ACTIVITIES
Activity Number Activity Name
50.1 General
3. SOLVENTS REGULATIONS (S.I. No. 543 of 2002)
Is it applicable? Yes
Have you been granted an exemption ? No
If applicable which activity class applies (as per
Schedule 2 of the regulations) ?
5. Other Surface Cleaning
8. Other Coating, including metal, plastic, textile(5), fabric, film and
paper coating (>5)
Is the reduction scheme compliance route being
used ? N/A
4. WASTE IMPORTED/ACCEPTED ONTO SITE Guidance on waste imported/accepted onto site
Do you import/accept waste onto your site for on-
site treatment (either recovery or disposal
activities) ? No
This question is only applicable if you are an IPPC or Quarry site
PRTR Returns Workbook

4.1 RELEASES TO AIR Link to previous years emissions data | PRTR# : P0973 | Facility Name : Cook Ireland Ltd | Filename : P0973_PRTR_2016.xls | Return Year : 2016 | 30/03/2017 16:25
8 9 17 18 26 26 6 6 6 6 6 10 23
SECTION A : SECTOR SPECIFIC PRTR POLLUTANTS
Please enter all quantities in this section in KGs
QUANTITY
No. Annex II Name M/C/E Method Code Designation or Description Emission Point 1 T (Total) KG/Year A (Accidental) KG/Year F (Fugitive) KG/Year
0.0 0.0 0.0 0.0
0.0 0.0 0.0 0.0
* Select a row by double-clicking on the Pollutant Name (Column B) then click the delete button
SECTION B : REMAINING PRTR POLLUTANTS
Please enter all quantities in this section in KGs
QUANTITY
No. Annex II Name M/C/E Method Code Designation or Description Emission Point 1 T (Total) KG/Year A (Accidental) KG/Year F (Fugitive) KG/Year
0.0 0.0 0.0 0.0
0.0 0.0 0.0 0.0
* Select a row by double-clicking on the Pollutant Name (Column B) then click the delete button
SECTION C : REMAINING POLLUTANT EMISSIONS (As required in your Licence)
Please enter all quantities in this section in KGs
QUANTITY
A3-16 A3-23 A3-24 A3-25 A3-26
Pollutant No. Name M/C/E Method Code Designation or Description Emission Point 1 Emission Point 2 Emission Point 3 Emission Point 4 Emission Point 5 T (Total) KG/Year
A (Accidental)
KG/Year
F (Fugitive)
KG/Year
351 Total Organic Carbon (as C) M OTH IS EN 12619:2013 23.5 70.82 136.23 3.34 90.64 324.53 0.0 0.0
* Select a row by double-clicking on the Pollutant Name (Column B) then click the delete button
Additional Data Requested from Landfill operators
Landfill: Cook Ireland Ltd
Please enter summary data on the
quantities of methane flared and / or utilised
additional_pollutant_no T (Total) kg/Year M/C/E Method Code
Designation or
Description
Facility Total Capacity m3
per hour
Total estimated methane generation (as per site
model) 0.0 N/A
Methane flared 0.0 0.0 (Total Flaring Capacity)
Methane utilised in engine/s 0.0 0.0 (Total Utilising Capacity)
Net methane emission (as reported in Section A
above) 0.0 N/A
RELEASES TO AIR
METHOD
POLLUTANT METHOD
Method Used
For the purposes of the National Inventory on Greenhouse Gases, landfill operators are requested to provide summary data on landfill gas (Methane)
flared or utilised on their facilities to accompany the figures for total methane generated. Operators should only report their Net methane (CH4)
emission to the environment under T(total) KG/yr for Section A: Sector specific PRTR pollutants above. Please complete the table below:
Method Used
Method Used
RELEASES TO AIR
POLLUTANT METHOD
Method Used
POLLUTANT
RELEASES TO AIR
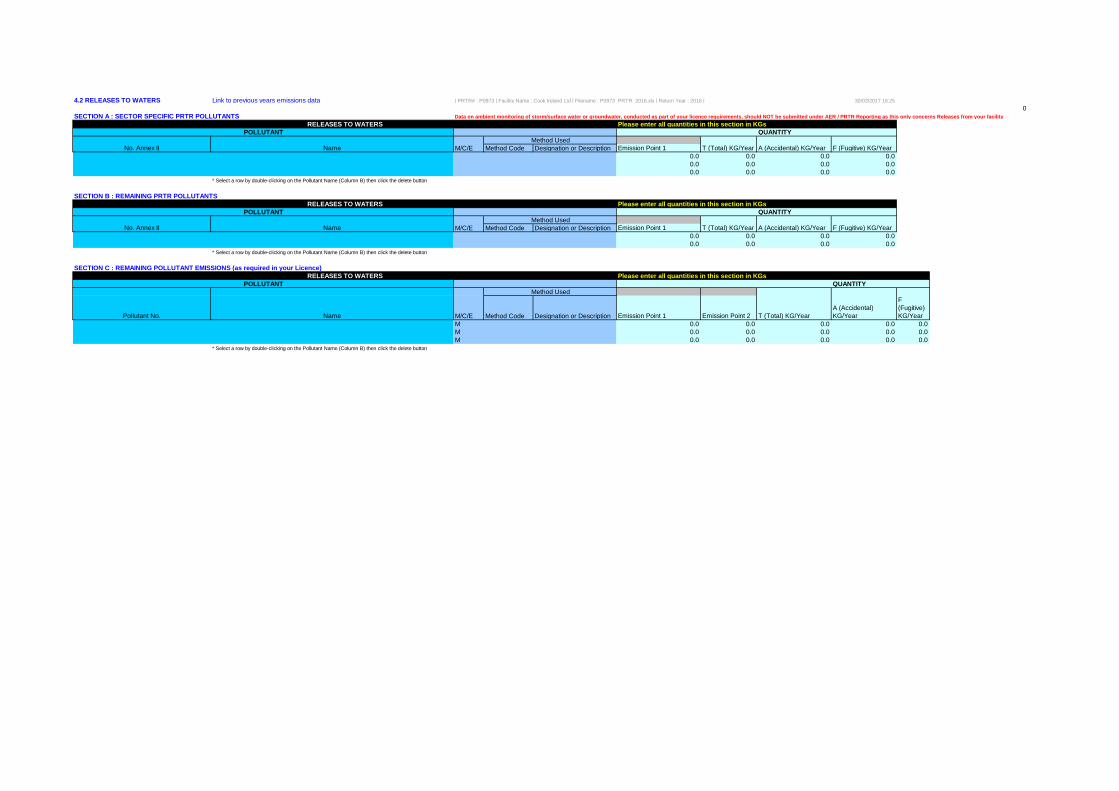
4.2 RELEASES TO WATERS Link to previous years emissions data | PRTR# : P0973 | Facility Name : Cook Ireland Ltd | Filename : P0973_PRTR_2016.xls | Return Year : 2016 | 30/03/2017 16:25
8 10 18 19 27 29 6 6 6 6 6 7 0
SECTION A : SECTOR SPECIFIC PRTR POLLUTANTS Data on ambient monitoring of storm/surface water or groundwater, conducted as part of your licence requirements, should NOT be submitted under AER / PRTR Reporting as this only concerns Releases from your facility
Please enter all quantities in this section in KGs
QUANTITY
No. Annex II Name M/C/E Method Code Designation or Description Emission Point 1 T (Total) KG/Year A (Accidental) KG/Year F (Fugitive) KG/Year
0.0 0.0 0.0 0.0
0.0 0.0 0.0 0.0
0.0 0.0 0.0 0.0
* Select a row by double-clicking on the Pollutant Name (Column B) then click the delete button
SECTION B : REMAINING PRTR POLLUTANTS
Please enter all quantities in this section in KGs
QUANTITY
No. Annex II Name M/C/E Method Code Designation or Description Emission Point 1 T (Total) KG/Year A (Accidental) KG/Year F (Fugitive) KG/Year
0.0 0.0 0.0 0.0
0.0 0.0 0.0 0.0
* Select a row by double-clicking on the Pollutant Name (Column B) then click the delete button
SECTION C : REMAINING POLLUTANT EMISSIONS (as required in your Licence)
Please enter all quantities in this section in KGs
QUANTITY
Pollutant No. Name M/C/E Method Code Designation or Description Emission Point 1 Emission Point 2 T (Total) KG/Year
A (Accidental)
KG/Year
F
(Fugitive)
KG/Year
M 0.0 0.0 0.0 0.0 0.0
M 0.0 0.0 0.0 0.0 0.0
M 0.0 0.0 0.0 0.0 0.0
* Select a row by double-clicking on the Pollutant Name (Column B) then click the delete button
Method Used
POLLUTANT
Method Used
POLLUTANT
POLLUTANT
RELEASES TO WATERS
Method Used
RELEASES TO WATERS
RELEASES TO WATERS
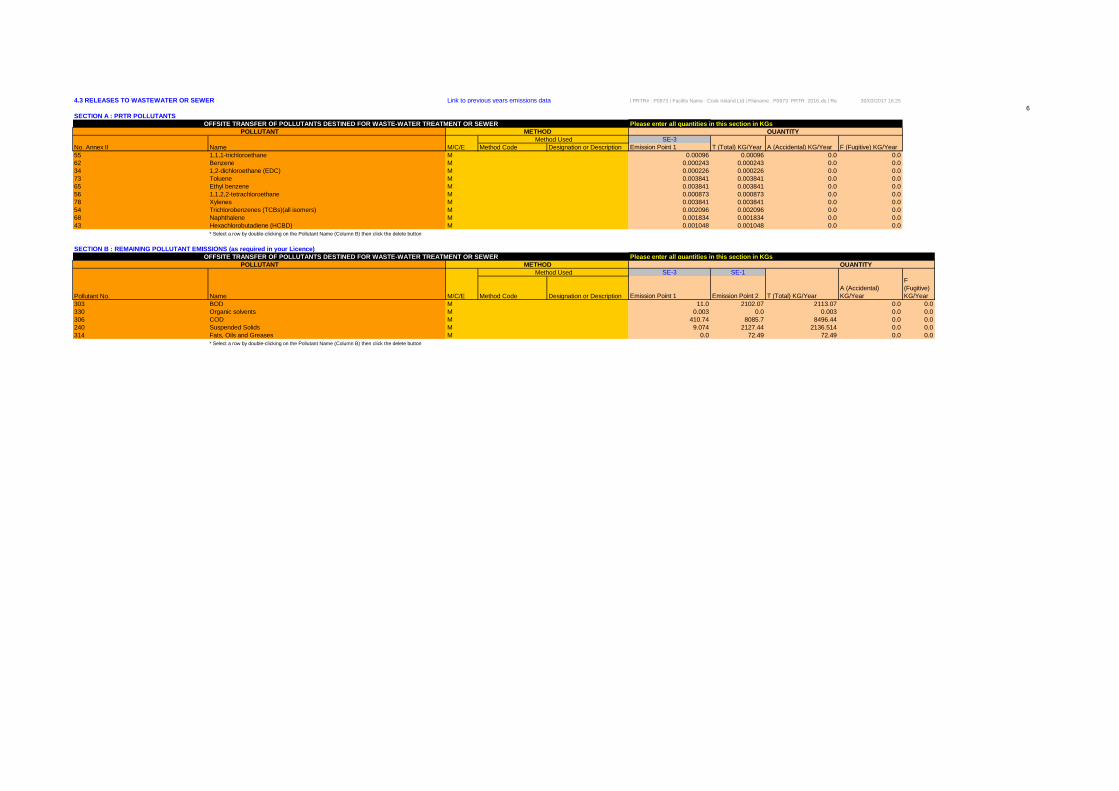
4.3 RELEASES TO WASTEWATER OR SEWER Link to previous years emissions data | PRTR# : P0973 | Facility Name : Cook Ireland Ltd | Filename : P0973_PRTR_2016.xls | Return Year : 2016 |30/03/2017 16:25
8 17 25 29 6 6 6 7 6
SECTION A : PRTR POLLUTANTS
Please enter all quantities in this section in KGs
QUANTITY
SE-3
No. Annex II Name M/C/E Method Code Designation or Description Emission Point 1 T (Total) KG/Year A (Accidental) KG/Year F (Fugitive) KG/Year
55 1,1,1-trichloroethane M 0.00096 0.00096 0.0 0.0
62 Benzene M 0.000243 0.000243 0.0 0.0
34 1,2-dichloroethane (EDC) M 0.000226 0.000226 0.0 0.0
73 Toluene M 0.003841 0.003841 0.0 0.0
65 Ethyl benzene M 0.003841 0.003841 0.0 0.0
56 1,1,2,2-tetrachloroethane M 0.000873 0.000873 0.0 0.0
78 Xylenes M 0.003841 0.003841 0.0 0.0
54 Trichlorobenzenes (TCBs)(all isomers) M 0.002096 0.002096 0.0 0.0
68 Naphthalene M 0.001834 0.001834 0.0 0.0
43 Hexachlorobutadiene (HCBD) M 0.001048 0.001048 0.0 0.0
* Select a row by double-clicking on the Pollutant Name (Column B) then click the delete button
SECTION B : REMAINING POLLUTANT EMISSIONS (as required in your Licence)
Please enter all quantities in this section in KGs
QUANTITY
SE-3 SE-1
Pollutant No. Name M/C/E Method Code Designation or Description Emission Point 1 Emission Point 2 T (Total) KG/Year
A (Accidental)
KG/Year
F
(Fugitive)
KG/Year
303 BOD M 11.0 2102.07 2113.07 0.0 0.0
330 Organic solvents M 0.003 0.0 0.003 0.0 0.0
306 COD M 410.74 8085.7 8496.44 0.0 0.0
240 Suspended Solids M 9.074 2127.44 2136.514 0.0 0.0
314 Fats, Oils and Greases M 0.0 72.49 72.49 0.0 0.0
* Select a row by double-clicking on the Pollutant Name (Column B) then click the delete button
OFFSITE TRANSFER OF POLLUTANTS DESTINED FOR WASTE-WATER TREATMENT OR SEWER
OFFSITE TRANSFER OF POLLUTANTS DESTINED FOR WASTE-WATER TREATMENT OR SEWER
Method Used
Method Used
POLLUTANT METHOD
POLLUTANT METHOD
4.4 RELEASES TO LAND Link to previous years emissions data | PRTR# : P0973 | Facility Name : Cook Ireland Ltd | Filename : P0973_PRTR_2016.xls | Return Year : 2016 | 30/03/2017 16:25
8 8 16 16 6 6 6 6
SECTION A : PRTR POLLUTANTS
Please enter all quantities in this section in KGs
QUANTITY
No. Annex II Name M/C/E Method Code Designation or Description Emission Point 1 T (Total) KG/Year A (Accidental) KG/Year
0.0 0.0 0.0
* Select a row by double-clicking on the Pollutant Name (Column B) then click the delete button
SECTION B : REMAINING POLLUTANT EMISSIONS (as required in your Licence)
Please enter all quantities in this section in KGs
QUANTITY
Pollutant No. Name M/C/E Method Code Designation or Description Emission Point 1 T (Total) KG/Year A (Accidental) KG/Year
0.0 0.0 0.0
* Select a row by double-clicking on the Pollutant Name (Column B) then click the delete button
POLLUTANT METHOD
Method Used
RELEASES TO LAND
RELEASES TO LAND
POLLUTANT METHOD
Method Used

Sheet : Treatment Transfers of Waste AER Returns Workbook 14/3/2017 8:37
5. ONSITE TREATMENT & OFFSITE TRANSFERS OF WASTE | PRTR# : P0973 | Facility Name : Cook Ireland Ltd | Filename : P0973_PRTR_2016.xls | Return Year : 2016 | 30/03/2017 16:25
5 46 Please enter all quantities on this sheet in Tonnes 25
Quantity
(Tonnes per
Year)
Haz Waste : Name and
Licence/Permit No of Next
Destination Facility Non
Haz Waste: Name and
Licence/Permit No of
Recover/Disposer
Haz Waste : Address of Next
Destination Facility
Non Haz Waste: Address of
Recover/Disposer
Name and License / Permit No. and
Address of Final Recoverer /
Disposer (HAZARDOUS WASTE
ONLY)
Actual Address of Final Destination
i.e. Final Recovery / Disposal Site
(HAZARDOUS WASTE ONLY)
Transfer Destination
European Waste
Code Hazardous Quantity T/Year Description of Waste
Waste
Treatment
Operation M/C/E Method Used
Location of
Treatment Name and Licence / Permit No. of Recoverer / Disposer / Broker Address of Recoverer / Disposer / Broker Name and Address of Final Destination i.e. Final Recovery / Disposal Site (HAZARDOUS WASTE ONLY) Licence / Permit No. of Final Destination i.e. Final Recovery / Disposal Site (HAZARDOUS WASTE ONLY)
Within the Country 06 02 05 Yes 1.01 other bases R2 M Weighed Offsite in Ireland
Veolia Environmental
Services,W0050-02
Corrin
,Fermoy,Co.Cork,P61FD74,I
reland
Veolia Environmental
Services,W0050-
02,Corrin,Fermoy,Co.
Cork,P61FD74,Ireland
Corrin,Fermoy,Co.
Cork,P61FD74,Ireland
Within the Country 06 02 05 Yes 7.531 other bases R12 M Weighed Offsite in Ireland
Veolia Environmental
Services,W0050-02
Corrin
,Fermoy,Co.Cork,P61FD74,I
reland
Veolia Environmental
Services,W0050-
02,Corrin,Fermoy,Co.
Cork,P61FD74,Ireland
Corrin,Fermoy,Co.
Cork,P61FD74,Ireland
Within the Country 07 05 01 Yes 11.963833 aqueous washing liquids and mother liquors R12 M Weighed Offsite in Ireland
Veolia Environmental
Services,W0050-02
Corrin
,Fermoy,Co.Cork,P61FD74,I
reland
Veolia Environmental
Services,W0050-
02,Corrin,Fermoy,Co.
Cork,P61FD74,Ireland
Corrin,Fermoy,Co.
Cork,P61FD74,Ireland
To Other Countries 07 05 04 Yes 0.217
other organic solvents, washing liquids and
mother liquors D10 M Weighed Abroad
Veolia Environmental
Services,W0050-02
Corrin
,Fermoy,Co.Cork,P61FD74,I
reland
Sava GmbH & Co.
KG.,15HRo03002,Ostertweu
te 1,25541
Brunsbutel,Germany,NA,Ger
many
Ostertweute 1,25541
Brunsbutel,Germany,NA,Ger
many
Within the Country 07 05 04 Yes 2.239166
other organic solvents, washing liquids and
mother liquors R12 M Weighed Offsite in Ireland
Veolia Environmental
Services,W0050-02
Corrin
,Fermoy,Co.Cork,P61FD74,I
reland
Veolia Environmental
Services,W0050-
02,Corrin,Fermoy,Co.
Cork,P61FD74,Ireland
Corrin,Fermoy,Co.
Cork,P61FD74,Ireland
Within the Country 07 05 04 Yes 9.7275
other organic solvents, washing liquids and
mother liquors R13 M Weighed Offsite in Ireland
Veolia Environmental
Services,W0050-02
Corrin
,Fermoy,Co.Cork,P61FD74,I
reland
Veolia Environmental
Services,W0050-
02,Corrin,Fermoy,Co.
Cork,P61FD74,Ireland
Corrin,Fermoy,Co.
Cork,P61FD74,Ireland
To Other Countries 07 05 13 Yes 8.5875
solid wastes containing dangerous
substances D10 M Weighed Abroad
Veolia Environmental
Services,W0050-02
Corrin
,Fermoy,Co.Cork,P61FD74,I
reland
Sava GmbH & Co.
KG.,15HRo03002,Ostertweu
te 1,25541
Brunsbutel,Germany,NA,Ger
many
Ostertweute 1,25541
Brunsbutel,Germany,NA,Ger
many
Within the Country 14 06 03 Yes 15.545 other solvents and solvent mixtures R12 M Weighed Offsite in Ireland
Veolia Environmental
Services,W0050-02
Corrin
,Fermoy,Co.Cork,P61FD74,I
reland
Veolia Environmental
Services,W0050-
02,Corrin,Fermoy,Co.
Cork,P61FD74,Ireland
Corrin,Fermoy,Co.
Cork,P61FD74,Ireland
Within the Country 14 06 03 Yes 29.582 other solvents and solvent mixtures R2 M Weighed Offsite in Ireland
Veolia Environmental
Services,W0050-02
Corrin
,Fermoy,Co.Cork,P61FD74,I
reland
Veolia Environmental
Services,W0050-
02,Corrin,Fermoy,Co.
Cork,P61FD74,Ireland
Corrin,Fermoy,Co.
Cork,P61FD74,Ireland
Within the Country 15 01 01 No 25.0279 paper and cardboard packaging R13 M Weighed Offsite in Ireland
Mr BINMAN,W0082-03
NWCPO-12-11056-02
Dock
Road,Limerick,Limerick,V94
EHW9,Ireland
Within the Country 15 01 02 No 10.2042 plastic packaging R13 M Weighed Offsite in Ireland
Mr BINMAN,W0082-03
NWCPO-12-11056-02
Dock
Road,Limerick,Limerick,V94
EHW9,Ireland
To Other Countries 15 01 10 Yes 0.497001
packaging containing residues of or
contaminated by dangerous substances D10 M Weighed Abroad
Veolia Environmental
Services,W0050-02
Corrin
,Fermoy,Co.Cork,P61FD74,I
reland
Sava GmbH & Co.
KG.,15HRo03002,Ostertweu
te 1,25541
Brunsbutel,Germany,NA,Ger
many
Ostertweute 1,25541
Brunsbutel,Germany,NA,Ger
many
To Other Countries 15 02 02 Yes 21.8505
absorbents, filter materials (including oil
filters not otherwise specified), wiping
cloths, protective clothing contaminated by
dangerous substances D10 M Weighed Abroad
Veolia Environmental
Services,W0050-02
Corrin
,Fermoy,Co.Cork,P61FD74,I
reland
Sava GmbH & Co.
KG.,15HRo03002,Ostertweu
te 1,25541
Brunsbutel,Germany,NA,Ger
many
Ostertweute 1,25541
Brunsbutel,Germany,NA,Ger
many
Method Used
| PRTR# : P0973 | Facility Name : Cook Ireland Ltd | Filename : P0973_2016.xls | Return Year : 2016 | Page 6 of 9

Sheet : Treatment Transfers of Waste AER Returns Workbook 14/3/2017 8:37
Quantity
(Tonnes per
Year)
Haz Waste : Name and
Licence/Permit No of Next
Destination Facility Non
Haz Waste: Name and
Licence/Permit No of
Recover/Disposer
Haz Waste : Address of Next
Destination Facility
Non Haz Waste: Address of
Recover/Disposer
Name and License / Permit No. and
Address of Final Recoverer /
Disposer (HAZARDOUS WASTE
ONLY)
Actual Address of Final Destination
i.e. Final Recovery / Disposal Site
(HAZARDOUS WASTE ONLY)
Transfer Destination
European Waste
Code Hazardous Quantity T/Year Description of Waste
Waste
Treatment
Operation M/C/E Method Used
Location of
Treatment Name and Licence / Permit No. of Recoverer / Disposer / Broker Address of Recoverer / Disposer / Broker Name and Address of Final Destination i.e. Final Recovery / Disposal Site (HAZARDOUS WASTE ONLY) Licence / Permit No. of Final Destination i.e. Final Recovery / Disposal Site (HAZARDOUS WASTE ONLY)
Method Used
To Other Countries 16 05 07 Yes 0.058
discarded inorganic chemicals consisting of
or containing dangerous substances D10 M Weighed Abroad
Veolia Environmental
Services,W0050-02
Corrin
,Fermoy,Co.Cork,P61FD74,I
reland
Sava GmbH & Co.
KG.,15HRo03002,Ostertweu
te 1,25541
Brunsbutel,Germany,NA,Ger
many
Ostertweute 1,25541
Brunsbutel,Germany,NA,Ger
many
To Other Countries 16 05 07 Yes 0.004
discarded inorganic chemicals consisting of
or containing dangerous substances D10 M Weighed Abroad
Veolia Environmental
Services,W0050-02
Corrin
,Fermoy,Co.Cork,P61FD74,I
reland
Veolia Ellesmere Port
,QB3839DT,Bridges Rd
,Ellesmere
Port,Merseyside,CH65
4EQ,United Kingdom
Ellesmere
Port,Merseyside,CH65
4EQ,.,United Kingdom
Within the Country 16 05 08 Yes 0.016
discarded organic chemicals consisting of
or containing dangerous substances R12 M Weighed Offsite in Ireland
Veolia Environmental
Services,W0050-02
Corrin
,Fermoy,Co.Cork,P61FD74,I
reland
Veolia Environmental
Services,W0050-
02,Corrin,Fermoy,Co.
Cork,P61FD74,Ireland
Corrin,Fermoy,Co.
Cork,P61FD74,Ireland
To Other Countries 16 05 08 Yes 0.248
discarded organic chemicals consisting of
or containing dangerous substances D10 M Weighed Abroad
Veolia Environmental
Services,W0050-02
Corrin
,Fermoy,Co.Cork,P61FD74,I
reland
Sava GmbH & Co.
KG.,15HRo03002,Ostertweu
te 1,25541
Brunsbutel,Germany,NA,Ger
many
Ostertweute 1,25541
Brunsbutel,Germany,NA,Ger
many
Within the Country 20 01 21 Yes 0.148
fluorescent tubes and other mercury-
containing waste R4 M Weighed Offsite in Ireland
Veolia Environmental
Services,W0050-02
Corrin
,Fermoy,Co.Cork,P61FD74,I
reland
KMK Metals Recycling
Limited,W0113-
04,Cappincur Industrial
Estate,Daingean
Road,Tullamore Co.
Offaly,R35NY29,Ireland
Cappincur Industrial
Estate,Daingean
Road,Tullamore Co.
Offaly,R35NY29,Ireland
To Other Countries 20 01 27 Yes 0.078
paint, inks, adhesives and resins containing
dangerous substances D10 M Weighed Abroad
Veolia Environmental
Services,W0050-02
Corrin
,Fermoy,Co.Cork,P61FD74,I
reland
Sava GmbH & Co.
KG.,15HRo03002,Ostertweu
te 1,25541
Brunsbutel,Germany,NA,Ger
many
Ostertweute 1,25541
Brunsbutel,Germany,NA,Ger
many
Within the Country 20 01 25 No 6.0 edible oil and fat R3 M Weighed Offsite in Ireland
Ecojet Drain Service,WCP-
LK-12-685-01
Bay M1A,Raheen Business
Park,Limerick,N/A,Ireland
Within the Country 20 01 25 No 1.65 edible oil and fat R3 M Volume Calculation Offsite in Ireland Frylite,WFP-G-10-0007 Galway,.,.,.,Ireland
Within the Country 20 01 01 No 19.1 paper and cardboard R12 M Weighed Offsite in Ireland
Rehab Recycle,WFP-CC-12-
2015
Monahan
Road,.,Cork,.,Ireland
Within the Country 20 01 40 No 0.635 metals R4 M Weighed Offsite in Ireland
Rehab Recycle,WFP-CC-12-
2015
Monahan
Road,.,Cork,.,Ireland
Within the Country 20 01 39 No 0.32 plastics R12 M Weighed Offsite in Ireland
Rehab Recycle,WFP-CC-12-
2015
Monahan
Road,.,Cork,.,Ireland
Within the Country 20 01 35 Yes 4.975
discarded electrical and electronic
equipment other than those mentioned in
20 01 21 and and 20 01 23 containing
hazardous components R12 M Weighed Offsite in Ireland
Rehab Recycle,WFP-CC-12-
2015
Monahan
Road,.,Cork,.,Ireland
Within the Country 13 05 07 Yes 17.56 oily water from oil/water separators D9 M Weighed Offsite in Ireland
Rilta Environmental ,W0192-
03
Block 402 Greenogue
Business Park ,Rathcoole
,Dublin ,.,Ireland
Rilta Environmental ,W0192-
03,Block 402 Greenogue
Business Park
,Rathcoole,Dublin,.,Ireland
Block 402 Greenogue
Business Park
,Rathcoole,Dublin,.,Ireland
Within the Country 13 02 08 Yes 0.2265 other engine, gear and lubricating oils R2 M Weighed Offsite in Ireland
Veolia Environmental
Services,W0050-02
Corrin
,Fermoy,Co.Cork,P61FD74,I
reland
Veolia Environmental
Services,W0050-
02,Corrin,Fermoy,Co.
Cork,P61FD74,Ireland
Corrin,Fermoy,Co.
Cork,P61FD74,Ireland
Within the Country 15 01 10 Yes 0.456
packaging containing residues of or
contaminated by dangerous substances R12 M Weighed Offsite in Ireland
Veolia Environmental
Services,W0050-02
Corrin
,Fermoy,Co.Cork,P61FD74,I
reland
Veolia Environmental
Services,W0050-
02,Corrin,Fermoy,Co.
Cork,P61FD74,Ireland
Corrin,Fermoy,Co.
Cork,P61FD74,Ireland
| PRTR# : P0973 | Facility Name : Cook Ireland Ltd | Filename : P0973_2016.xls | Return Year : 2016 | Page 7 of 9

Sheet : Treatment Transfers of Waste AER Returns Workbook 14/3/2017 8:37
Quantity
(Tonnes per
Year)
Haz Waste : Name and
Licence/Permit No of Next
Destination Facility Non
Haz Waste: Name and
Licence/Permit No of
Recover/Disposer
Haz Waste : Address of Next
Destination Facility
Non Haz Waste: Address of
Recover/Disposer
Name and License / Permit No. and
Address of Final Recoverer /
Disposer (HAZARDOUS WASTE
ONLY)
Actual Address of Final Destination
i.e. Final Recovery / Disposal Site
(HAZARDOUS WASTE ONLY)
Transfer Destination
European Waste
Code Hazardous Quantity T/Year Description of Waste
Waste
Treatment
Operation M/C/E Method Used
Location of
Treatment Name and Licence / Permit No. of Recoverer / Disposer / Broker Address of Recoverer / Disposer / Broker Name and Address of Final Destination i.e. Final Recovery / Disposal Site (HAZARDOUS WASTE ONLY) Licence / Permit No. of Final Destination i.e. Final Recovery / Disposal Site (HAZARDOUS WASTE ONLY)
Method Used
Within the Country 15 01 10 Yes 0.01
packaging containing residues of or
contaminated by dangerous substances R13 M Weighed Offsite in Ireland
Veolia Environmental
Services,W0050-02
Corrin
,Fermoy,Co.Cork,P61FD74,I
reland
Veolia Environmental
Services,W0050-
02,Corrin,Fermoy,Co.
Cork,P61FD74,Ireland
Corrin,Fermoy,Co.
Cork,P61FD74,Ireland
Within the Country 16 05 04 Yes 0.595
gases in pressure containers (including
halons) containing dangerous substances R13 M Weighed Offsite in Ireland
Veolia Environmental
Services,W0050-02
Corrin
,Fermoy,Co.Cork,P61FD74,I
reland
Veolia Environmental
Services,W0050-
02,Corrin,Fermoy,Co.
Cork,P61FD74,Ireland
Corrin,Fermoy,Co.
Cork,P61FD74,Ireland
To Other Countries 16 05 06 Yes 0.03
laboratory chemicals, consisting of or
containing dangerous substances, including
mixtures of laboratory chemicals D10 M Weighed Abroad
Veolia Environmental
Services,W0050-02
Corrin
,Fermoy,Co.Cork,P61FD74,I
reland
Sava GmbH & Co.
KG.,15HRo03002,Ostertweu
te 1,25541
Brunsbutel,Germany,NA,Ger
many
Ostertweute 1,25541
Brunsbutel,Germany,NA,Ger
many
Within the Country 16 05 07 Yes 0.003
discarded inorganic chemicals consisting of
or containing dangerous substances R12 M Weighed Offsite in Ireland
Veolia Environmental
Services,W0050-02
Corrin
,Fermoy,Co.Cork,P61FD74,I
reland
Veolia Environmental
Services,W0050-
02,Corrin,Fermoy,Co.
Cork,P61FD74,Ireland
Corrin,Fermoy,Co.
Cork,P61FD74,Ireland
Within the Country 16 05 08 Yes 0.149
discarded organic chemicals consisting of
or containing dangerous substances R13 M Weighed Offsite in Ireland
Veolia Environmental
Services,W0050-02
Corrin
,Fermoy,Co.Cork,P61FD74,I
reland
Veolia Environmental
Services,W0050-
02,Corrin,Fermoy,Co.
Cork,P61FD74,Ireland
Corrin,Fermoy,Co.
Cork,P61FD74,Ireland
To Other Countries 20 01 14 Yes 0.005 acids D10 M Weighed Abroad
Veolia Environmental
Services,W0050-02
Corrin
,Fermoy,Co.Cork,P61FD74,I
reland
Sava GmbH & Co.
KG.,15HRo03002,Ostertweu
te 1,25541
Brunsbutel,Germany,NA,Ger
many
Ostertweute 1,25541
Brunsbutel,Germany,NA,Ger
many
Within the Country 20 02 01 No 13.1355 biodegradable waste R3 M Weighed Offsite in Ireland
Mr BINMAN,W0082-03
NWCPO-12-11056-02
Dock
Road,Limerick,Limerick,V94
EHW9,Ireland
Within the Country 20 03 01 No 17.5919 mixed municipal waste R12 M Weighed Offsite in Ireland
Mr BINMAN,W0082-03
NWCPO-12-11056-02
Dock
Road,Limerick,Limerick,V94
EHW9,Ireland
Within the Country 20 03 01 No 25.07 mixed municipal waste R12 M Weighed Offsite in Ireland
Mr BINMAN,W0082-03
NWCPO-12-11056-02
Dock
Road,Limerick,Limerick,V94
EHW9,Ireland
Within the Country 18 01 03 Yes 0.4342
wastes whose collection and disposal is
subject to special requirements in order to
prevent infection R1 M Weighed Offsite in Ireland
Initial Rentokil,WFP-DS-10-
0001-01
Hazel House,Milennium
Business Park,Naas
East,Kildare,Ireland
SRLC,W0055-02,430,Beech
Road,Dublin,D12 ,Ireland
430,Beech Road,Dublin,D12
,Ireland
Within the Country 20 03 01 No 11.977 mixed municipal waste D5 M Weighed Offsite in Ireland
Security in Shredding
,NWCPO-08-02502
Ballyartella,Ballycommon,Ne
nagh,Co. Tipperary,Ireland
Within the Country 20 01 02 No 0.075 glass R5 M Weighed Offsite in Ireland
Mr BINMAN,W0082-03
NWCPO-12-11056-02
Dock
Road,Limerick,Limerick,V94
EHW9,Ireland
* Select a row by double-clicking the Description of Waste then click the delete button
Link to previous years waste data
Link to previous years waste summary data & percentage change
| PRTR# : P0973 | Facility Name : Cook Ireland Ltd | Filename : P0973_2016.xls | Return Year : 2016 | Page 8 of 9

Sheet : Treatment Transfers of Waste AER Returns Workbook 14/3/2017 8:37
Quantity
(Tonnes per
Year)
Haz Waste : Name and
Licence/Permit No of Next
Destination Facility Non
Haz Waste: Name and
Licence/Permit No of
Recover/Disposer
Haz Waste : Address of Next
Destination Facility
Non Haz Waste: Address of
Recover/Disposer
Name and License / Permit No. and
Address of Final Recoverer /
Disposer (HAZARDOUS WASTE
ONLY)
Actual Address of Final Destination
i.e. Final Recovery / Disposal Site
(HAZARDOUS WASTE ONLY)
Transfer Destination
European Waste
Code Hazardous Quantity T/Year Description of Waste
Waste
Treatment
Operation M/C/E Method Used
Location of
Treatment Name and Licence / Permit No. of Recoverer / Disposer / Broker Address of Recoverer / Disposer / Broker Name and Address of Final Destination i.e. Final Recovery / Disposal Site (HAZARDOUS WASTE ONLY) Licence / Permit No. of Final Destination i.e. Final Recovery / Disposal Site (HAZARDOUS WASTE ONLY)
Method Used
Link to Waste Guidance
| PRTR# : P0973 | Facility Name : Cook Ireland Ltd | Filename : P0973_2016.xls | Return Year : 2016 | Page 9 of 9