al in retail we trust nanc results · 2017-06-13 · management report 5 0.introduction 6 ......
TRANSCRIPT
In retaIl we trust
2014
-201
5 h
al
f-
ye
ar
ly f
Ina
nc
Ial
r
esu
lts

REAL ESTATE PORTFOLIO 30/09/14 31/03/14
Total retail properties 562 548
Total lettable area in m² 591,195 570,870
Estimated fair value in EUR 767,815,000 745,916,000
Estimated investment value in EUR 786,514,000 764,193,000
Average rent prices per m² 91.56 90.78
Occupancy rate 98.50% 98.17%
BALANCE SHEET INFORMATION 30/09/14 31/03/14
Shareholders' equity 346,697,000 356,524,000
Debt ratio (RREC legislation*, max. 65%) 51.72% 49.10%
RESULTS 30/09/14 30/09/13
Net rental income 25,541,000 22,294,000
Property result 25,367,000 22,169,000
Property charges -1,638,000 -1,432,000
General costs and other operating costs and income -1,545,000 -1,147,000
Operating result before result on the portfolio 22,183,000 19,589,000
Result on the portfolio 1,291,000 2,281,000
Operating result 23,474,000 21,871,000
Financial result -8,514,000 -7,894,000
Net result 14,737,000 13,608,000
Net current result (excl. result on the portfolio) 13,446,000 11,327,000
INFORMATION PER SHARE 30/09/14 31/03/14
Number of shares 7,290,411 7,290,411
Net asset value IFRS 47.56 48.90
Net asset value EPRA 51.12 52.18
Net asset value (investment value) excl. dividend excl. IAS 39 52.16 51.70
Closing price on closing date 61.50 58.92
Over-/undervaluation compared to net asset value IFRS 29.31% 20.49%
*The R.D. of 13 July 2014 in execution of the Law of 12 May 2014 on regulated real estate companies (Belgian REITs).
Key figures table of contents
Key figures
ManageMent report 50. Introduction 61. Report on activities for the first half of the 2013-2014 financial year, closed on 30 September 2014 62. Amendments to articles of association of Retail Estates nv 93. Analysis of the results 104. Prospects 115. Changes to the composition of the board of directors 116. Future-oriented statements 11 financial report 131. Condensed consolidated income statement 142. Condensed consolidated balance sheet 163. Condensed statement of changes in shareholders’ equity 184. Condensed, non-audited consolidated cashflow statement 225. Notes on the condensed consolidated interim figures 246. Limited review report on the consolidated interim financial information
for the six-month period ended 30 September 2014 36 share perforMance report 391. Stock market performance 402 Stock market capitalisation 413. Dividend and yield 414. Financial calendar 42 real estate report 451. Real estate expert’s report 462. Note 473. Commercial activities of tenants 484. Subdivision by type of building 48 general inforMation 51 Lexicon 52 Information sheet 55

> Management report• Financial report
• Share perFormance report
• real eState report
• General inFormation
ManageMent report
Retail Estates is a leading market player thanks to a portfolio that has been built up in a consistent manner, based on its market
knowledge.
5
leaDIng role
> Management report• Financial report
• Share perFormance report
• real eState report
• General inFormation
2014 - 2015Retail Estates
6 7
EUR 767.81 million fair value
properties of the real estate certificates amounts
to EUR 13.10 million.
As at 30 September 2014, the real estate portfolio
consists of 562 properties with a lettable area of
591,195 m².
1.3. investMents2 - retail parKs
Beringen (Mijn Retail nv)
On 10 April 2014, Retail Estates nv and be-MINE
nv concluded a cooperation agreement for the
development of a retail park, with a total built-up
area of 18,000 m². On 27 May 2014, the partners
established a special purpose company “Mijn
Retail nv”. Except for unforeseen circumstances,
the retail park is expected to be delivered before
the end of 2015. The required building permit
and socio-economic authorisation were already
granted.
2 The purchase and sale values of the investments and disposals are in line with the investment values as appraised by the real estate experts.
Bruges
On 6 May 2014, an agreement was signed
regarding the purchase of the piece of land
onto which the retail park Bruges V-Mart was
built, for an amount of EUR 3.32 million (excl.
registration fees). In 2012, Retail Estates nv
concluded a superficies agreement regarding
this parcel and constructed the retail park on this
ground. The purchase will be completed as soon
as the required formalities relative to the OVAM
regulation will be realised, expected before the
end of the current financial year.
Erembodegem
On 1 June 2014, the extension and transformation
of the distribution centre of Brantano nv in
Erembodegem, was delivered. The additional
investment realised by Retail Estates nv amounts
to EUR 5.08 million. For the renewed site, a lease
agreement for a new, fixed term of 10 years was
concluded, at a rental price of EUR 1.12 million.
Wetteren – Oudenaarde
On 14 July 2014, Retail Estates nv acquired
the exclusive control of the companies Frunpark
Wetteren nv and Gentpoort nv. These companies
own retail parks situated respectively in Wetteren
and Oudenaarde.
Since its opening in 2008, the retail park in
Wetteren is a well-known, frequently visited
location in the region between Ghent and
Alost and owes this to its strategic position
on the intersection Gentsesteenweg –
Oosterzelesteenweg, in the immediate proximity of
the E40 highway’s exit ‘Wetteren’. The retail park
consists of 14 retail properties with a total area of
10,423 m² and generates a gross rental income of
EUR 1.30 million. All retail properties are leased.
0. IntroductIon
general
Retail Estates nv is one of Belgium’s largest real
estate companies, specialised in peripheral
retail properties. Its property portfolio consists
of 562 retail properties in Belgium, representing
a total lettable area of 591,195 m² and an
investment value of EUR 786.51 million (including
a participating interest of 85.28 % in Immobilière
Distri-Land nv property certificates).
Retail Estates nv manages its property portfolio
itself and has a proven track record in real estate
development and redevelopment for its own
account.
Retail Estates nv is a listed company (Euronext
Brussels), with a market capitalisation
of approximately EUR 448.36 million on
30 September 2014.
risK ManageMent
Although management endeavours to limit the
risk factors to a minimum, careful account still has
to be taken of a certain number of risks. For an
overview of these risks, reference is made to pages
4 to 11 of the annual report 2013-2014.
1. report on actIvItIes for the fIrst half of the 2014-2015 fInancIal year, closed on 30 september 2014
1.1. rental incoMe and occupancy rate
Rental income during the first half of the financial
year amounts to EUR 25.80 million, 13.76 %
up on the figure for the comparable half of the
2013-2014 financial year (EUR 22.68 million).
This increase is almost entirely attributable to the
growth of the real estate portfolio.
The occupancy rate1 on 30 September 2014
remains at a high 98.50 %, compared with 98.17 %
on 31 March 2014.
1.2. fair value of the real estate portfolio
The fair value of the real estate portfolio amounts
to EUR 767.81 million. The rental yield (in
relation to the investment value) on this portfolio
established by the real estate experts is 6.92 %
based on the actual rent.
The stability of the value of peripheral retail
properties is explained mainly by continuing
interest on the part of wealthy private individuals
in this type of investment. Retail Estates nv
noticed this when carrying out its annual ongoing
divestment programme.
Retail Estates nv also holds a significant interest
of 85.28 % in the real estate certificates issued
by Immobilière Distri-Land nv. The fair value of
this property portfolio as at 30 September 2014
amounts to EUR 16.60 million. Retail Estates nv’s
share in the total fair value of the real estate
1 The occupancy rate is calculated as the effective leased area versus the lettable area, expressed in m2.

2014 - 2015Retail Estates
> Management report• Financial report
• Share perFormance report
• real eState report
• General inFormation
8 9
The mergers of these subsidiaries facilitate the
administrative management and lead to a decrease
of the taxable income of Retail Estates nv’s
subsidiaries.
2. status of a publIc regulated real estate company (‘rrec’ - belgIan reIt)
On 1 September 2014, Retail Estates nv was
granted by the FSMA (Belgian Financial Services
and Markets Authority) a license as a public
Regulated Real Estate Company (‘RREC’), under
specific conditions precedent pursuant to the
12 May 2014 Law on regulated real estate
companies (the ‘RREC Law’).
The extraordinary general meeting of
shareholders of Retail Estates nv that was held
on 24 October 2014 (the ‘EGM’), approved with
unanimity the change of status from a public real
estate investment company into a public RREC
(Belgian REIT) in accordance with the RREC Law.
As no exit right has been exercised, and all
conditions precedent to which the modification
of the articles of association by the EGM and
the authorisation granted by the FSMA were
subject, have thus been fulfilled, Retail Estates
nv benefits from the public RREC status as from
24 October 2014.
For more information, please check our website
www.retailestates.com, under Investor Relations
(www.retailestates.com/en/investor/general-
assembly/2014-2015).
On 26 September 2014, the EGM of Retail
Warehousing Invest nv decided to amend the
company statutes to the regulations regarding the
regulated real estate companies and in particular,
to the stipulations pursuant to the RREC Law and
the R.D. of 13 July 2014 on regulated real estate
companies. The status amendment was approved
under the condition of the former status of Retail
Estates nv of vastgoedbevak/sicafi being actually
changed into the status of public RREC.
As a result of the above-mentioned approval of
the change of status of Retail Estates nv by the
EGM of 24 October 2014, the condition for the
entry into force of the change of status of Retail
Warehousing Invest nv, approved by the EGM of
26 September 2014, has thus been fulfilled. The
amendment has entered into force and Retail
Warehousing Invest benefits from the institutional
RREC status as from 24 October 2014.
It is a typical “out-of-town” location, with non-food
retailers with a large area of coverage.
The retail park in Oudenaarde is situated in the
outskirts of the city Oudenaarde, on a former
industrial site. It is an example of an “edge-of-
town” location, aiming at a local, urban area of
coverage. This park’s retailers focus on the daily
needs of the consumer. The most important tenants
are Albert Heijn, Kruidvat, Blokker and C&A. The
retail park consists of 10 retail properties with a
total area of 7,963 m² and generates a gross rental
income of EUR 0.67 million. All retail properties are
leased, with the exception of a 300 m² surface, for
which negotiations are ongoing.
1.4. disposals2 On 4 April 2014, the Luxembourgian company
Belgium Retail 1 Luxembourg sàrl was sold, for
an amount of EUR 8.22 million. On the buildings
in this company, a net added value of EUR 0.19
million was realised (after deduction of the real
estate agent’s fees).
Over the past six months, four retail properties
were sold for a net selling price of EUR 4.43
million. On these buildings, a net added value of
EUR 0.26 million was realised. The retail properties
sold are situated in Genval (Délitraiteur), Wanze
(Action), Tienen (Brantano) and Gosselies (Charles
Vögele). The fair value of these properties at the
time of sale amounted to EUR 3.61 million.
These sales are part of an annual reoccurring sales
programme concerning individual retail properties
that, due to their location or retail size and/or the
business activity practiced therein, do not fit within
the core portfolio of Retail Estates nv.
1.5. private placeMent of bonds
On 2 April 2014, Retail Estates nv proceeded to
a private placement of bonds for a total amount
of EUR 30 million. The bonds have a 7-year term
and are due in 2021. They represent a fixed annual
gross yield of 3.566 %. The bonds were placed
with institutional investors. The net proceeds
of the bond issue will be used for the further
growth of the portfolio and will contribute to the
diversification of the financial resources. The bonds
also contribute to the increase of the average
maturity of the total debt and to the decrease of
the average interest rate.
1.6. Merger by absorption of subsidiaries
On 11 June 2014, the merger proposal regarding
the merger by absorption of the companies SDW
Invest bvba and Ducova bvba was submitted.
The board of directors established the merger
by notarial deed on 26 September 2014, with
effect on respectively 30 September 2014 and
31 October 2014.

2014 - 2015Retail Estates
> Management report• Financial report
• Share perFormance report
• real eState report
• General inFormation
10 11
The debt ratio amounts to 51.72 % as at
30 September 2014 compared to 49.10 % on
31 March 2014.
4. prospects
The macro-economic uncertainties do not enable
predictions to be made as to the evolution of the
fair value of property or the negative variations in
the fair value of financial hedging instruments. The
evolution of the net asset value of the share, which
is sensitive to such variations and uncertainties, is
therefore uncertain. On 30 September 2014, the
weak consumer confidence and the lower retail
turnover of some retail firms have not resulted in
an increase of unoccupied premises or collection
issues at Retail Estates nv. This is probably the
result of the discount character of the peripheral
retail formulas.
It is estimated that the net current result per
share for the financial year 2014-2015 will exceed
3.10 EUR per share. The expected dividend
(EUR 3.10 gross per share) is confirmed. This
represents a 3.33 % increase in the dividend
compared with 2013-2014. These expectations
were filled in the hypothesis of stable consumer
spending and provided a positive evolution of
rents. However, it has been identified that at the
moment, contrary to previous financial years, the
inflation by rent indexation hardly has its role in the
rental increase.
5. changes to the composItIon of the board of dIrectors
At the annual shareholders’ meeting of 4 July
2014, the resignation of Mr Luc Geuten as a
non-executive director, effective 4 July 2014, was
acknowledged. During the previous financial year,
Mr Geuten has reached the age limit of 70 years.
He will not be replaced so that henceforth, the
board of directors will consist of 10 directors.
6. future-orIented statements
This half-yearly report contains a number of future-
oriented statements. Such statements are subject to
risks and uncertainties which means that the actual
results can differ significantly from those expected
on the basis of such future-oriented statements
in this interim statement. Significant factors that
can influence such results include changes in the
economic situation and commercial, fiscal and
environmental factors.
3. analysIs of the results
Interim results as at 30 September 2014: net
current result of the Group up by 18.71 %
compared to 30 September 2013 - fair value
of the real estate portfolio up to EUR 767.81
million.
For the six months to 30 September 2014, the
net current result (i.e. profit before the results on
the portfolio) amounts to EUR 13.45 million, an
increase of 18.71 % compared to the same period
in the previous year.
Net rental income rose from EUR 22.29 million
to EUR 25.54 million. This is mainly due to
the acquisition of additional properties in the
current financial year and the contribution of
retail properties purchased during the previous
financial year and which are contributing 100 %
for the first time this financial year. Compared with
30 September 2013, the real estate portfolio grew
by EUR 64.54 million. With respect to 31 March
2014, the portfolio grew by EUR 21.90 million.
After deduction of property charges, this gives
an operating property result of EUR 23.73 million
compared to EUR 20.74 million last year.
Property charges amount to EUR 1.64 million
compared to EUR 1.43 million the year before.
The increase is thus in line with the increase in
rental income. The general costs amount to EUR
1.54 million, an increase with EUR 0.40 million
compared to the previous year. This is mainly due
to the non-recurrent cost within the framework of
the change of status from vastgoedbevak/sicafi
to regulated real estate company (see chapter
2, p. 9). After deduction of general costs, the
regulated real estate company posts an operating
result before result on the portfolio of EUR 22.18
million. The operating margin is 86.85 %.
Net earnings from disposals of investment
properties amount to EUR 0.45 million out of
total sales of EUR 4.06 million. Variations in the
fair value of investment properties amount to
EUR 0.84 million, representing the net surplus of
various positive and negative variations.
The financial result is EUR - 8.51 million, a rise in
costs of EUR 0.62 million compared with the same
period last year. Retail Estates nv finances its real
estate portfolio mainly with long-term bank debts
at fixed interest rates. The average interest rate as
at 30 September 2014 is 4.50 %.
The net result (share Group) for the first half of
the year is EUR 14.74 million, consisting of the
net current result of EUR 13.45 million and the
result on the portfolio of EUR 1.29 million. Per
share this represents a net current result available
for distribution of EUR 1.84 for the first half of
the year (on the basis of the weighted average
number of shares).
The fair value of the property portfolio,
including assets held for sale, amounts to
EUR 773.61 million as at 30 September 2014,
compared to EUR 750.30 million on 31 March
2014.
The net asset value (fair value) per share amounts
to EUR 46.01 (excluding 50 % of the expected
dividend) as at 30 September 2014. As of
31 March 2014 this was EUR 45.90 (excl. dividend).

• manaGement report
> Financial report• Share perFormance report
• real eState report
• General inFormation
13
The reinforcement of the company’s registered capital and the recently issued private bond loan
allow further growth of the company.
fInancIal report
sustaInabIlIty

2014 - 2015Retail Estates
• ManageMent report
> Financial report• Share perforMance report
• real eState report
• general inforMation
14 15
1. a. condensed consolIdated Income statement
INCOME STATEMENT (in € 000) 30.09.14 30.09.13
Rental income 25,797 22,678
Rental related expenses -256 -384
Net rental income 25,541 22,294
Recovery of property expenses
Recovery of rental charges and taxes normally payable by tenants on let properties
2,750 2,363
Rental charges and taxes normally payable by tenants on let properties -2,916 -2,479
Other rental related income and expenses -9 -9
Property result 25,367 22,169
Technical costs -720 -522
Commercial costs -103 -126
Charges and taxes on unlet properties -111 -62
Property management costs -701 -721
Property charges -1,638 -1,433
Operating property result 23,728 20,736
Operating corporate costs -1,545 -1,146
Other current operating income and expenses
Operating result before result on portfolio 22,183 19,589
Result on disposals of investment properties 451 28
Result on sales of other non-financial assets
Changes in fair value of investment properties 840 2,253
Operating result 23,474 21,871
Financial income 76 562
Interest charges -8,569 -8,430
Other financial charges -21 -26
Financial result -8,514 -7,894
3 The net current result is calculated as follows: net result excluding changes in fair value of investment properties and exclusive the result on disposal of investment properties.
4 Based on the number of shares in circulation.
5 The net current result per share is calculated from the weighted average number of shares, counted from the time of issue (which does not necessarily coincide with first dividend entitlement date). As at 30.09.2014, the weighted average number of shares is equal to the total number of shares.
INCOME STATEMENT (in € 000) 30.09.14 30.09.13
Result before taxes 14,960 13,977
Taxes -223 -368
Net result 14,737 13,608
Attributable to:Shareholders of the Group 14,737 13,608
Minority interests
Note:Net current result (share Group)3 13,446 11,327
Result on portfolio 1,291 2,281
RESULT PER SHARE 30.09.14 30.09.13
Number of ordinary shares in circulation 7,290,411 7,290,411
Weighted average number of shares 7,290,411 6,571,948
Net profit per ordinary share (in EUR) 2.02 2.07
Diluted net profit per share (in EUR) 2.02 2.07
Profit available for distribution per share (in EUR)4 1.86 1.56
Net current result per share (in EUR)5 1.84 1.72
1. b. statement of other comprehensIve Income
Statement of other comprehensive income (in € 000) 30.09.14 30.09.13
Net result 14,737 13,608
Other components of other comprehensive income, recyclable in income statements:
Impact on the fair value of estimated transaction rights and costs resulting from the hypothetical disposal of investment properties
-457 -1,074
Changes in the fair value of cash-flow hedges -2,134 5,775
COMPREHENSIVE INCOME 12,146 18,309

2014 - 2015Retail Estates
• ManageMent report
> Financial report• Share perforMance report
• real eState report
• general inforMation
16 17
2. condensed consolIdated balance sheet
ASSETS (in € 000) 30.09.14 31.03.14
Non-current assets 768,140 746,245
GoodwillIntangible non-current assets 37 26
Investment properties6 767,815 745,916
Other tangible non-current assets 284 297
Financial non-current assets
Trade receivables and other non-current assets 5 5
Current assets 14,287 9,620
Non-current assets or groups of assets held for sale 5,800 4,385
Trade receivables 2,311 725
Tax receivables and other current assets 1,479 1,899
Cash and cash equivalents 2,561 2,189
Deferred charges and accrued income 2,136 421
TOTAL ASSETS 782,427 755,865
SHAREHOLDERS’ EQUITY AND LIABILITIES (in € 000) 30.09.14 31.03.14
Shareholders’ equity 346,697 356,524
Shareholders’ equity attributable to the shareholders of the parent company
346,697 356,524
Capital 160,962 160,962
Issue premiums 93,095 93,095
Reserves 77,904 73,900
Net result of the financial year 14,737 28,568
Minority interests
Liabilities 435,730 399,341
Non-current liabilities 370,196 365,825
Provisions 87 102
Non-current financial debts 329,015 327,677
Credit institutions 299,255 327,677
Other non-current financial liabilities 29,760
Other non-current liabilities 41,094 38,046
SHAREHOLDERS’ EQUITY AND LIABILITIES (in € 000) 30.09.14 31.03.14
Current liabilities 65,534 33,516
Current financial debts 51,797 22,421
Credit institutions 51,797 22,421
Trade debts and other current debts 9,074 7,992
Other current liabilities 77 86
Accrued charges and deferred income 4,586 3,017
TOTAL SHAREHOLDERS’ EQUITY AND LIABILITIES 782,427 755,865
DEBT RATIO 30.09.14 31.03.14
Debt ratio7 51.72% 49.10%
NET ASSET VALUE PER SHARE (in €) - SHARE GROUP 30.09.14 31.03.14
Net asset value per share IFRS8 47.56 48.90
Net asset value per share EPRA9 51.12 52.18
Net asset value per share excl. dividend excl. IAS 3910 52.16 51.70
6 Including project developments (IAS 40).
7 The debt ratio is calculated as follows: obligations (excluding provisions, accrued charges and deferred income, financial instruments and deferred taxes), divided by the total assets (excluding financial instruments).
8 The net asset value per share IFRS (fair value) is calculated as follows: shareholders’ equity (attributable to shareholders of the parent company) divided by the number of shares.
9 The net asset value per share EPRA (fair value) is calculated as follows: shareholders‘ equity (excluding changes in the effective part of the fair value of the permitted hedging instruments in a cash flow hedge as defined in IFRS) divided by the number of shares.
10 The net asset value per share excl. dividend excl. IAS 39 (investment value) is calculated as follows: shareholders‘ equity (excluding the impact on the fair value of estimated transfer rights and costs resulting from the hypothetical disposal of investment properties, exclusive changes in the effective part of the fair value of the permitted hedging instruments in a cash flow hedge as defined in IFRS and exclusive dividend) divided by the number of shares.

2014 - 2015Retail Estates
• ManageMent report
> Financial report• Share perforMance report
• real eState report
• general inforMation
18 19
STATEMENT OF CHANGES IN SHAREHOLDERS’ EQUITY
(in € 000)
capital
ordinary shares
Issue
premiums reserves*
net result of the
financial year
Minority
interests
total
shareholders’ equity
Balance according to IFRS on 31 March 2013 129,389 52,857 57,760 29,582 0 269,588
- Net appropriation of profits 2012-2013
- Transfer of portfolio result to reserves 8,579 -8,579 0
- Transfer of net current result to reserves 4,145 -4,145 0
- Reclassification between reserves
- Dividends of the financial year 2012-2013 -16,858 -16,858
- Capital increase 32,699 39,601 72,300
- Capital increase through contribution in kind 540 636 1,176
- Minority interests
- Costs of capital increase -1,667 -1,667
- Other 40 40
- Total result 30/09/2013 4,701 13,608 18,309
Balance according to IFRS on 30 September 2013 160,962 93,095 75,225 13,608 0 342,890
Balance according to IFRS on 31 March 2014 160,962 93,095 73,900 28,568 0 356,524
- Net appropriation of profits 2013-2014
- Transfer of portfolio result to reserves 3,260 -3,260 0
- Transfer of net current result to reserves 3,437 -3,437 0
- Reclassification between reserves 0
- Dividends of the financial year 2013-2014 -21,871 -21,871
- Capital increase
- Capital increase through contribution in kind
- Minority interests
- Costs of capital increase
- Other -102 -102
- Total result 30/09/2014 -2,591 14,737 12,146
Balance according to IFRS on 30 September 2014 160,962 93,095 77,904 14,737 0 346,697
3. condensed consolIdated statement of changes In shareholders’ equIty

2014 - 2015Retail Estates
• ManageMent report
> Financial report• Share perforMance report
• real eState report
• general inforMation
20 21
* Detail of the reserves (in € 000)
legal reserve
reserve for
the positive/
negative
balance of
changes in the
fair value of real
estate properties
available
reserves
Impact on the fair
value of estimated
transfer rights and
costs resulting from
the hypothetical
disposal of investment
properties
reserve for the balance
of changes in the fair
value of authorised
hedging instruments
qualifying for hedge
accounting as defined
by Ifrs
results carried
forward from
previous
financial years total
Balance according to IFRS on 31 March 2013 420 76,775 9,431 -15,763 -30,092 16,989 57,760
- Net appropriation of profits 2012-2013
- Transfer of portfolio result to reserves 8,579 8,579
- Transfer of net current result to reserves 4,145 4,145
- Reclassification between reserves -248 248 -64 64 0
- Capital increase through contribution in kind
- Minority interests
- Costs of capital increase
- Other 1 1,810 -1,820 64 -15 40
- Total result 30/09/2013 -1,074 5,775 4,701
Balance according to IFRS on 30 September 2013 421 86,916 7,859 -16,837 -24,317 21,183 75,225
Balance according to IFRS on 31 March 2014 437 86,926 7,859 -18,386 -23,882 20,946 73,900
- Net appropriation of profits 2013-2014
- Transfer of portfolio result to reserves 3,260 3,260
- Transfer of net current result to reserves 3,437 3,437
- Reclassification between reserves -1,429 1,429 102 -102 0
- Capital increase through contribution in kind
- Minority interests
- Costs of capital increase
- Other -29 -102 29 -102
- Total result 30/09/2014 -457 -2,134 -2,591
Balance according to IFRS on 30 September 2014 408 88,757 9,288 -18,843 -26,016 24,310 77,904

2014 - 2015Retail Estates
• ManageMent report
> Financial report• Share perforMance report
• real eState report
• general inforMation
22 23
4. condensed consolIdated cash-flow statement
CASH-FLOW STATEMENT (in € 000) 30.09.14 30.09.13
CASH AND CASH EQUIVALENTS AT THE BEGINNING OF THE SEMESTER
2,188 1,879
1. Cash-flow from operating activities -365 4,006
Operating result 23,474 21,871
Interest paid -8,297 -8,305
Interest received 42 27
Dividends receivedCorporate taxes paid -3,164 -36
Estimated corporate taxOther -474 78
Non-cash elements to be added to / deducted from the result: -1,182 -2,262
* Depreciations and write-downs - Depreciation / Write-downs (or write-backs) on tangible and
intangible assets66 79
- Depreciation / Write-downs (or write-backs) on trade receivables
58 -30
* Other non-cash elements - Changes in the fair value of investment properties -840 -2,253
- Profit on disposal of investment properties -451 -28
* Other -15 -29
Change in working capital requirements: -10,764 -7,341
* Movement of assets - Trade receivables and other receivables -1,628 -2,043
- Tax receivables and other current assets 422 106
- Deferred charges and accrued income -1,699 -922
* Movement of liabilities - Trade debts and other current debts -9,152 -1,647
- Other current liabilities 4 -4,541
- Accrued charges and deferred income 1,289 1,705
(in € 000) 30.09.14 30.09.13
2. Cash-flow from investment activities -9,018 -13,002
Purchase of intangible assets -21 -9
Purchase of investment properties -4,732 -6,412
Disposal of investment properties and assets held for sale 4,167 2,569
Acquisition of shares of real estate companies -15,081 -9,106
Disposal of shares of real estate companies 6,691
Purchase of other tangible assets -42 -42
Disposal of non-current financial assetsIncome from trade receivables and other non-current assets -2
Disposal of assets held for sale
3. Cash-flow from financing activities 9,756 50,105
* Change in financial liabilities and financial debts - Increase in financial debts 52,757 69,663
- Decrease in financial debts -22,044 -63,324
* Change in other liabilities - Increase (+) / Decrease (-) in other liabilities 914 -10,009
- Increase (+) / Decrease (-) in minority interests
* Change in shareholders' equity - Capital increase and issue premiums 72,300
- Costs of capital increase -1,667
- Other
* Dividend -21,871 -16,858
- Dividend for the previous financial year
CASH AND CASH EQUIVALENTS AT THE END OF THE SEMESTER 2,561 42,987
Rounding up or down to the nearest thousand can lead to rounding-off differences between the balance
sheet and income statement and the attached details.

• ManageMent report
> Financial report• Share perforMance report
• real eState report
• general inforMation
2014 - 2015Retail Estates
24 25
86.85 % operating margin
the first six months of the current financial
year, their influence on the condensed interim
financial statements, the main risk factors and
uncertainties for the remaining months of
the financial year, and the main transactions
between related parties and their possible
impact on the condensed interim financial
statements if these transactions are of significant
importance and were not concluded under
normal market conditions.
5.4 segMented inforMation
IFRS 8 defines an operating segment as follows:
an operating segment is a component of the
company (IFRS 8.2):
• that engages in economic activities from which it
may earn revenues and incur expenses (including
revenues and expenses relating to transactions
with other components of the same company);
• whose operating results are reviewed regularly
by the ‘chief operating decision maker’ with a
view to taking decisions concerning allocation of
available resources and assessing the segment’s
performance; and
• for which separate financial information is
available.
Given that peripheral retail properties account for
more than 90 % of the Retail Estates nv’s portfolio,
a breakdown of activities by operating segment is
not relevant. The board of directors does not use
any other segment in its decision-making process.
5.5 valuation of projects
In accordance with the modified IAS 40 standard,
project developments are included under
investment properties. On purchase they are
valued at purchase cost, including incidental
expenses and non-deductible VAT.
After initial recognition, projects are valued at
fair value once contractors have been found,
the necessary licences are acquired, and the
properties are let. This fair value valuation is based
on the valuation by the real estate expert, after
deduction of work still to be done.
A project can relate to a plot of land, a building
to be demolished, or an existing building whose
purpose is to be changed, requiring considerable
renovation work to realise the desired purpose.
5.6 additional coMMents on the debt ratio developMent
Principle
Article 24 of the R.D. of 13 July 2014 on regulated
real estate companies (the so-called GVV / SIR
or ‘Belgian REIT’) requires public regulated real
estate companies to establish a financial plan with
an implementation schedule when its consolidated
debt ratio exceeds 50 % of consolidated assets.
The financial plan describes the measures to be
taken to prevent the consolidated debt ratio from
exceeding 65 % of consolidated assets.
A separate report on the financial plan is prepared
by the auditor, confirming that the latter has
verified the method of drawing up the plan,
particularly as regards the economic bases, and
that the figures contained in this plan concur with
5.1 basis for preparation
The interim financial report for the first six-month
period ending on 30 September 2014 has been
prepared using accounting standards consistent
with International Financial Reporting Standards
as implemented by the Belgian Royal Decree
of 13 July 2014 on the accounting, annual
accounts and consolidated annual accounts of
public regulated real estate companies, and
in accordance with IAS 34 ”Interim Financial
Reporting”.
In determining the fair value of investment
properties in accordance with IAS 40 ”Property
Investments”, an estimated amount of transfer
rights and costs is deducted by the independent
property expert. The impact on the fair value of
investment properties of these estimated transfer
rights and costs on the hypothetical disposal of
investment properties is recorded directly in the
shareholders’ equity under the heading ”lmpact
on fair value of estimated transfer rights and
costs resulting from the hypothetical disposal of
investment properties” expressly provided for
in the above R.D. In the first six-month periods
ending on 30 September 2014 and 30 September
2013, amounts of, EUR - 0.46 million and EUR
- 1.07 million, respectively, were directly recorded
in the shareholders’ equity under this account.
In these condensed interim financial statements
the same accounting principles and calculation
methods are applied as in the consolidated
financial statements for the year ending on
31 March 2014.
5.2 application of ifrs 3 business coMbinations
Corporate transactions of the past semester
were not processed as business combinations
such as required under IFRS 3 definition, based
on the conclusion that this definition is not
applicable, given the nature and the size of the
acquired companies. The companies in question
own a limited number of properties which are
not intended to be kept on as an independent
businesses. The companies are fully consolidated
through the application of IAS 40.
5.3 declaration by the person responsible within retail estates nv
In accordance with article 13 § 2 of the R.D.
of 14 November 2007, Jan De Nys, managing
director, declares that, to his knowledge,
a) the condensed interim financial statements
prepared on the basis of financial reporting
principles consistent with IFRS and with IAS 34
‘Interim Financial Reporting’ as adopted by the
European Union, give a true and fair view of the
net equity, financial position and results of Retail
Estates nv and of the companies included in the
consolidation.
b) the interim report presents an accurate
description of the main events occurred during
5. notes on the condensed consolIdated InterIm fIgures

2014 - 2015Retail Estates
• ManageMent report
> Financial report• Share perforMance report
• real eState report
• general inforMation
26 27
• results of the second semester 2014-2015
The results of the second semester as indicated in
the budget for 2014-2015, approved by the board
of directors.
• planned investments in the second semester
2014-2015
Investments amounting to EUR 46.50 million are
planned, of which EUR 12.40 million in the fourth
quarter of the financial year 2014-2015.
Considering the additional planned investments
and the earnings expectations for the full year,
the debt ratio at 31 March 2015 would amount to
50.55 %.
The projection of the debt ratio only takes into
account acquisitions and disposals in respect of
which a private agreement has been signed and
investments that are planned and contracted out.
Other elements that influence the debt ratio
The valuation of the real estate portfolio also has an
impact on the debt ratio. Considering the current
capital basis, the maximum debt ratio of 65 %
would be exceeded in the event of a reduction
in the fair value of real estate investments of EUR
159.86 million. This reduction in value could be the
result of an increase in the yield (if the rental values
remain unchanged, the yield would have to increase
by 1.86 % in order to exceed the debt ratio) or a
reduction in rents (if the yields remain unchanged,
the rents would have to drop by EUR 11.06 million).
Historically, the fair value of the real estate portfolio
has always risen or was at least stable since the
regulated real estate company (Belgian REIT) was set
up. There are currently no indications in the market
to assume an increase in the yield.
In the event that substantial value reductions occur
that cause the debt ratio to exceed 65 %, Retail
Estates nv can sell a number of its properties.
Retail Estates nv has a solid track record with
regard to selling properties at their estimated
investment value. In the 2011-2012 financial year,
12 retail properties were sold for a net selling price
of EUR 17.87 million. In the 2012-2013 financial
year, 14 retail properties, 2 carcass apartments,
1 food service building, 3 plots of land, 1 small
and middle-sized building and 1 villa were sold
for a net selling price of EUR 19.25 million. In the
2013-2014 financial year, 4 retail properties and
2 carcass apartments were sold for a net selling
price of EUR 5.07 million. Globally speaking, these
properties were sold at the estimated investment
value. At 30 September 2014, 4 retail properties
were sold for a net selling price of EUR 4.43 million
and the company Belgium Retail 1 Luxembourg sàrl
was sold for an amount of EUR 8.22 million.
Conclusion
Retail Estates nv is of the opinion that, based on
• the historical evolution of the regulated real
estate company (Belgian REIT) and
• the track record of disposals,
no additional measures need to be taken to
prevent the debt ratio exceeding 65 %. As a result
of the capital increase on 28 June 2013, the debt
ratio declined. It is the intention of the regulated
real estate company (Belgian REIT) to maintain
the debt ratio between 50 % and 55 %. This level
is evaluated regularly and will be reviewed by the
board of directors if deemed necessary in the light
of changing market and influencing factors.
the accounts of the public regulated real estate
company.
The general guidelines of the financial plan are
included in the annual and half-yearly financial
reports. The annual and half-yearly financial
reports will describe and justify how the financial
plan has been implemented during the period
under review and how the public regulated real
estate company will implement the plan in the
future.
Notes 2014-2015
Historical evolution of the debt ratio
Since 2008-2009, the debt ratio of Retail Estates
nv has risen above 50 %. In the aforementioned
financial year, the debt ratio was 56 %,
subsequently remaining stable at around 53 %. In
2014, the debt ratio decreased at a level under
50 % as a result of the capital increase, to rise
above 50 % again as from 30 September 2014.
Throughout its history, the Retail Estates nv’s debt
ratio has never exceeded 65 %.
Long-term evolution of the debt ratio
The board of directors considers a debt ratio of
+ 55 % ideal for the shareholders of the regulated
real estate company (Belgian REIT) in terms of
the return and the current earnings per share.
The impact of every investment on the debt ratio
is reviewed and if necessary the investment is
not carried out if it has a negative influence on
the debt ratio. Based on the current debt ratio
of 51.72 %, Retail Estates nv has an investment
potential of EUR 296.88 million without exceeding
as such a debt ratio of 65 %, and an investment
potential of EUR 161.96 million without exceeding
a debt ratio of 60 %.
Short-term evolution of the debt ratio
Every quarter, the board of directors is presented
with a prognosis of how the debt ratio will evolve
during the following quarter. The board also
discusses any deviations which may have occurred
between the estimated and actual debt ratio
during the previous quarter.
The projection of the debt ratio as at 31 December
2014 takes into account the following assumptions:
• disposals in the third quarter 2014-2015
Disposals amounting to EUR 0.73 million are
planned.
• results of the third quarter 2014-2015
The results of the third quarter as indicated in the
budget for 2014-2015, approved by the board of
directors.
• planned investments in the third quarter
2014-2015
Investments amounting to EUR 34.10 million are
planned for the third quarter of the financial year
2014-2015. EUR 14.80 million will be invested
through a contribution in kind (see 5.12.1, p. 34).
Considering the aforementioned assumptions, the
debt ratio as at 31 December 2014 will amount to
51.01 %.
A projection is also made of the debt ratio as
at 31 March 2015 (end of the financial year).
This projection takes into account the following
assumptions:
• disposals in the second semester 2014-2015
Disposals amounting to EUR 2.93 million are planned,
of which EUR 2.20 million in the fourth quarter.

2014 - 2015Retail Estates
• ManageMent report
> Financial report• Share perforMance report
• real eState report
• general inforMation
28 29
Type of lease
The Group concludes commercial rental contracts
for its buildings, for a minimum period of 9 years,
which can usually be terminated upon expiry
of the third and sixth year, subject to 6 months’
notice prior to the expiry date. Rents are usually
paid monthly in advance (sometimes quarterly).
They are indexed annually on the anniversary of
the lease.
Taxes and levies, including the advance levy on
income derived from real estate, the insurance
premium and the communal charges, are in theory
borne by the lessee. To guarantee compliance
with the obligations imposed on the lessee by
virtue of the agreement, the lessee must provide
a rental guarantee, usually in the form of a bank
guarantee amounting to three months’ rent.
At the start of the lease an inventory of fixtures
and fittings is drawn up between the parties by an
independent real estate expert. On expiry of the
lease the lessee must return the rented premises
in the state described in the inventory of fixtures
and fittings drawn up when it took up occupancy,
subject to normal wear and tear.
The lessee may not transfer the lease or sublet
the premises wholly or in part, other than subject
to prior written permission from the lessor. The
lessee is obliged to register the lease at its own
expense.
5.7 rental incoMe
During the first half of this financial year, Retail
Estates nv expanded its property portfolio with
25 retail properties. These represent a rental income
of EUR 2.00 million. In the consolidated figures as of
30 September 2014 these new properties represent
a rental flow of EUR 0.43 million.
Four properties and the company Belgium Retail 1
Luxembourg sàrl were also divested in the first six-
month period of the financial year. These represent
a rental income of EUR 0.75 million. In the
consolidated figures as of 30 September 2014,
these properties represent EUR 0.084 million.
Rental income (in € 000) 30.09.14 30.09.13
Rent 25,247 22,220
Guaranteed incomeOperational lease income 550 458
Rental discountsRental benefits ('incentives')Fees for early terminated rental agreements
Total rental income 25,797 22,678
(in € 000) 30.09.14 30.09.13
Within one year 53,056 47,685
Between one and five year(s) 218,752 203,916
Within more than five years 254,338 257,344
The rise in rental income is mainly due to the
growth of the real estate portfolio and the
indexation of the rents.
The following table uses a theoretical exercise to
show the amount of rental income Retail Estates
nv will actually collect, based on the current
lease agreements. This does not detract from the
theoretical risk of all tenants exercising their legal
right of termination at the end of the current three-
year period. In this case, all retail properties will by
definition be vacant within 3 years and 6 months.
2014 - 2015Retail Estates
• ManageMent report
> Financial report• Share perforMance report
• real eState report
• general inforMation
30 31
Of all loans, EUR 282.92 million have a variable
interest rate. These are all long-term loans.
97.51 % of the outstanding loans are hedged via
interest rate swap contracts that swap variable
interest rates for fixed interest rates or have a fixed
interest rate. The average interest rate of the loans
is 4.50 %. Retail Estates nv has agreed in principle
on a debt ratio of 60 % with its banks.
The ‘other non-current financial liabilities’ concern
the bond loan, emitted on 23 April 2014 with a
7-year term and an interest rate of 3.556 %.
5.10 financial instruMents
The most important financial instruments of the
Group are financial and trade receivables and
debts, investments, cash and cash equivalents and
financial instruments such as ‘Interest Rate Swaps’
(IRS).
During the first half of the financial year control was
acquired of three real estate companies for a total
amount of EUR 15.08 million. The acquisition of the
companies was paid for in cash. This resulted in a
EUR 28.89 million increase of investment properties
and a EUR 13.81 million variation of working capital.
Investment
properties
assets
held for sale
total
Investment and revaluation
table (in € 000)30.09.14 31.03.14 30.09.14 31.03.14 30.09.14 31.03.14
Balance at the end of the previous financial year
745,916 675,593 4,385 7,488 750,301 683,081
Acquisition through purchase orcontribution real estate companies
28,383 42,787 28,383 42,787
Capitalised interest cost 168 624 168 624
Acquisition and contribution of investment properties
4,290 27,476 4,290 27,476
Disposal through sale of real estate companies
-6,874 -6,874
Disposal of investment properties -2,319 -3,635 -1,848 -3,579 -4,167 -7,214
Transfers to assets held for sale -3,262 -301 3,262 301 0 0
Change in fair value (+/-) 1,512 3,372 175 1,512 3,547
At the end of the financial year 767,815 745,916 5,800 4,385 773,613 750,301
OTHER INFORMATIONS
Investment value of the property 786,514 764,193 5,945 4,495 792,459 768,688
5.9 long- and short-terM financial debts
Breakdown by due date of credit lines (in € 000) 30.09.14 31.03.14
Non-currentBilateral loans - variable or fixed rate 299,255 327,677
Other non-current financial liabilities 29,760
Subtotal 329,015 327,677
CurrentBilateral loans - variable or fixed rate 51,797 22,422
Subtotal 51,797 22,422
Total 380,812 350,098
Breakdown by maturity of non-current financial debts (in € 000) 30.09.14 31.03.14
Between one and two year(s) 49,794 49,917
Between two and five years 201,394 199,794
More than five years 77,827 77,966
5.8 investMent properties
Project developments (in € 000) 30.09.14 31.03.14
Balance at the end of the previous financial year 8,077 5,734
Increase during the financial year 4,613 6,318
Reception during the financial year -834 -3,975
At the end of the financial year 11,856 8,077

2014 - 2015Retail Estates
• ManageMent report
> Financial report• Share perforMance report
• real eState report
• general inforMation
32 33
The categories correspond with the following
financial instruments:
A. Financial assets or liabilities (including
receivables and loans) held until maturity, at the
amortised cost.
B. Investments held until maturity, at the amortised
cost.
C. Assets or liabilities, held at the fair value
through the profit and loss account, except for
financial instruments determined as hedging
instruments.
The aggregate financial instruments of the Group
correspond with level 2 in the fair values hierarchy.
Fair value valuation is carried out regularly.
Level 2 in the fair values hierarchy includes the
other financial assets and liabilities, in respect of
which the fair value is based on other information,
which can, directly or indirectly, be determined for
the relevant assets or liabilities.
The valuation techniques regarding the fair
value of the level 2 financial instruments are the
following:
- The categories ‘other financial liabilities’ and
‘financial fixed assets’ concern Interest Rate
Swaps (IRS), in respect of which the fair value
is determined by means of interest rates
applicable in active markets, and generally
provided by financial institutions.
- The fair value of the other level 2 financial assets
and liabilities is almost equal to their book
value:
• either because they have a short-term maturity
(like trade receivables and debts),
• or because they have a variable interest rate.
The fair value of debts having a fixed interest rate
is estimated by means of an actualisation of their
future cash flows, taken into account the Group’s
credit risk.
5.11 Minority interests
On 30 September 2014, Retail Estates nv holds a
62.50 % interest in Retail Warehousing Invest nv.
According to the agreement entered into with a
view to acquiring the controlling interest in Retail
Warehousing Invest nv, Retail Estates nv shall, at the
latest effective 1 July 2016, acquire all shares of this
company that are not yet held by it, on the basis
of the same valuation formula used to gain control
on 4 July 2012. Upon acquisition of the minority
interest, the underlying real estate value used in this
formula will be checked against the value applicable
at that time as determined by the real estate expert
and, as the case may be, be limited to such value
in accordance with article 37 of the Belgian Law of
12 May 2014 on regulated real estate companies.
On 30 September 2014, Retail Estates nv holds a
51 % interest in the shares of the company Mijn
Retail nv, as a result of the cooperation agreement
concluded between Retail Estates nv and be-MINE
nv on 10 April 2014, regarding the realisation of a
retail park in Beringen with a total built-up area of
18,000 m².
As of 31 December 2012, the balance sheet was
drawn up based on the assumption that all minority
interests would be acquired (in accordance with
IFRS), irrespective of the timing of the acquisition
and assuming that these would be paid for in cash.
Below is an overview of the financial instruments as at 30 September 2014:
Summary of financial instruments as at
closing date 30.09.14 (in € 000)
categories book value fair value level
I. Non-current assetsFinancial non-current assets C 0 0 2
Loans and receivables A 5 5 2
II. Current assetsTrade receivables and other receivables A 3,790 3,790 2
Cash and cash equivalents B 2,561 2,561 2
Total financial instruments on the assets side of the balance sheet
6,356 6,356
I. Non-current liabilitiesInterest-bearing liabilities A 329,015 334,704 2
Credit institutions A 299,255 301,556 2
Other non-current financial liabilities A 29,760 33,148 2
Other non-current liabilities A 15,078 15,078 2
Other financial liabilities C 26,016 26,016 2
II. Current liabilitiesInterest-bearing liabilities A 51,797 51,797 2
Current trade debts and other debts A 9,151 9,151 2
Total financial instruments on the liabilities side of the balance sheet
431,057 436,746

2014 - 2015Retail Estates
• ManageMent report
> Financial report• Share perforMance report
• real eState report
• general inforMation
34 35
5.12.2 Disposals
Maasmechelen
On 18 November 2014, a vacant retail property
at a solitary location was sold to a local SME.
The net selling price amounts to EUR 0.50 million.
Compared to the fair value of this property,
EUR 0.63 million as at 30 September 2014, Retail
Estates nv sustained a loss of EUR 0.13 million.
Huy
An agreement has been signed regarding the
disposal of two retail properties in Huy, located
in an SME area. The retail properties are let to
Van Marcke (sanitary equipment) and Carglass
(automobile repairs). The expected net selling
price amounts to EUR 1.87 million.
5.12.3 Merger by absorption of subsidiary
On 11 June 2014, the merger proposal with a view
to completing a merger by absorption of Ducova
bvba was submitted. This merger has become
effective on 31 October 2014.
5.12.4 Change of status
On 24 October 2014, the EGM of shareholders
of Retail Estates nv approved unanimously the
change of status of public vastgoedbevak/sicafi
into the status of public regulated real estate
company (‘RREC’, Belgian REIT), in accordance
with the Law of 12 May 2014. Since no exit right
has been exercised and all conditions have been
fulfilled, Retail Estates nv benefits from the public
RREC status as from 24 October 2014.
By the approved change of status of Retail Estates
nv, the condition of the change of status of the
company Retail Warehousing Invest nv has also
been fulfilled. On 26 September 2014, the EGM
of Retail Warehousing Invest nv had approved the
amendment of the institutional vastgoedbevak/
sicafi status into the status of institutional RREC
(Belgian REIT) under this condition. Therefore,
Retail Warehousing Invest nv benefits from the
institutional RREC status as from 24 October 2014.
This reflects the maximum debt ratio on the basis of
available information and the development stage of
the projects.
The impact on the non-current liabilities amounts to
EUR 14.71 million.
5.12 events occurring after the balance sheet date
5.12.1 Investments – capital increase
Acquisition 14 retail properties
On 14 October 2014, Retail Estates nv entered
into a framework agreement with Orchestra-
Prémaman Belgium nv with a view to acquiring
the ownership of 14 retail properties11 for an
investment value of EUR 34.59 million and an
expected rental income of EUR 2.18 million. This
transaction is two-fold: (i) the purchase of 8 retail
properties and (ii) the contribution in kind of 6
retail properties.
In execution of the first part of the transaction,
7 retail properties were purchased on 29 October
2014. This acquisition represents an investment of
EUR 12.95 million.
On 28 November 2014, the second part of the
transaction has been completed partially by
transferring 5 retail properties as part of a capital
increase by means of a contribution in kind. For
this contribution in kind the board of directors of
Retail Estates nv issued 269,062 new shares, within
the framework of powers granted to it regarding
11 For more information we refer to the press release of 15 October 2014.
the authorised capital. The total investment value
for these five properties is EUR 14.80 million and
this represents a capital increase of approximately
EUR 6.05 million (the balance, approximately EUR
8.74 million, is assigned to the balance sheet item
“issue premium”).
Regarding 12 of the 14 retail properties to acquire,
the transaction is thus executed in accordance with
the framework agreement of 14 October 2014,
as announced in the press release of 15 October
2014. Two retail properties are not yet acquired
due to obligations relative to the OVAM regulation,
which are not yet fulfilled. In expectation of this
fulfilment, the transfer of these properties has been
postponed.
As regards the property that will be part of a
second contribution in kind in the Retail Estates
nv’s capital, the issue price of the new shares to
be issued will be adapted if this contribution does
not take place by 31 December 2014 ultimately.
As a result of this, the total number of new shares,
referred to in the press release of 15 October
2014, can be amended.
Wilrijk
On 27 October 2014, Retail Estates nv
acquired a retail property in Wilrijk, along the
Boomsesteenweg, for a total investment of EUR
4.24 million. This property is let at a rental price of
EUR 0.26 million and is used as a retail subsidiary
with the brand name GAMMA (DIY).

2014 - 2015Retail Estates
• ManageMent report
> Financial report• Share perforMance report
• real eState report
• general inforMation
36 37
To the board of directors
We have performed a limited review of the
accompanying consolidated condensed balance
sheet, condensed income statement, condensed
statement of comprehensive income, condensed
cash flow statement, condensed statement of
changes in equity and selective notes 5.1 to 5.12
(jointly the “interim financial information”) of Retail
Estates nv/sa (“the company”) and its subsidiaries
(jointly “the group”) for the six-month period
ended 30 September 2014. The board of directors
of the company is responsible for the preparation
and fair presentation of this interim financial
information. Our responsibility is to express a
conclusion on this interim financial information
based on our review.
The interim financial information has been
prepared in accordance with IAS 34, “Interim
Financial Reporting” as adopted by the EU and
implemented by the Royal Decree of 13 July 2014
with respect to regulated real estate companies.
Our limited review of the interim financial
information was conducted in accordance with
international standard ISRE 2410 – Review of
interim financial information performed by the
independent auditor of the entity. A limited review
consists of making inquiries of group management
and applying analytical and other review
procedures to the interim financial information and
underlying financial data. A limited review is
substantially less in scope than an audit performed
in accordance with the International Standards on
Auditing (ISA). Accordingly, we do not express an
audit opinion on the interim financial information.
Based on our limited review, nothing has come
to our attention that causes us to believe that the
interim financial information for the six-month
period ended 30 September 2014 is not prepared,
in all material respects, in accordance with IAS
34 “Interim Financial Reporting” as adopted by
the EU and implemented by the Royal Decree of
13 July 2014 with respect to regulated real estate
companies.
Diegem, 28 November 2014
The statutory auditor
DELOITTE Bedrijfsrevisoren / Réviseurs
d’entreprises
BV o.v.v.e. CVBA / SC s.f.d. SCRL
Represented by Kathleen De Brabander
6. lImIted revIew report on the consolIdated InterIm fInancIal InformatIon for the sIx-month perIod ended 30 september 2014

• manaGement report
• Financial report
> Share performance report• real eState report
• General inFormation
39
Since its listing on Euronext Brussels, Retail Estates’ results and portfolio have been
growing continuously and consistently.
share perforMance report
establIsheD coMpany

• ManageMent report
• Financial report
> Share performance report• real estate report
• general inForMation
2014 - 2015Retail Estates
40 41
3.10 EUR expected dividend
During the first six months of the 2014-2015
financial year, the stock market price fluctuated
between EUR 56.99 and EUR 66.00. The graph
above shows the share performance of the Retail
Estates share in comparison with the BEL 20 since
the stock exchange listing. The Retail Estates
share has increased in value over the period by
95.05 % while the BEL 20 has increased by 8.20 %.
The average closing price during this period was
EUR 61.02.
Share performance
Retail Estates NV - Bel 20
98 99 00 01 02 03 04 05 06 07 08 09 10 11 12 13 14
0
20
40
60
80
100
120
140
160
180
200
220
0
10
20
30
40
50
60
70
Retail Estates NV
BEL 20
1. stock market performance
NET ASSET VALUE PER SHARE (in €) 30.09.14 31.03.14 30.09.13
Net asset value per share IFRS 12 47.56 48.90 47.03
Net asset value per share EPRA13 51.12 52.18 50.37
Net asset value per share excl. dividend excl. IAS 39 14 52.16 51.70 51.18
Gross dividend 3.00
Net dividend 2.25
Share price on closing date 61.50 58.92 54.00
12 The net asset value per share IFRS (fair value) is calculated as follows: shareholders’ equity (attributable to shareholders of the parent company) divided by the number of shares.
13 The net asset value per share EPRA (fair value) is calculated as follows: shareholders‘ equity (excluding changes in the effective part of the fair value of the permitted hedging instruments in a cash flow hedge as defined in IFRS) divided by the number of shares.
14 The net asset value per share excl. dividend excl. IAS 39 (investment value) is calculated as follows: shareholders‘ equity (excluding the impact on the fair value of estimated transfer rights and costs resulting from the hypothetical disposal of investment properties, exclusive changes in the effective part of the fair value of the permitted hedging instruments in a cash flow hedge as defined in IFRS and exclusive dividend) divided by the number of shares.
3. dIvIdend and yIeld
Stock market capitalisation in EUR million
0
100
200
300
400
500
2. stock market capItalIsatIon
Retail Estates nv is listed on the Euronext continuous market. As of 30 September 2014, the market
capitalisation of Retail Estates nv amounts to EUR 448.36 million.
2014 - 2015Retail Estates
• ManageMent report
• Financial report
> Share performance report• real estate report
• general inForMation
42 43
0
20
40
60
80
100
120
140
160
180
200
220
0
10
20
30
40
50
60
70
The net asset value (NAV) of the share in the case
of a property valuation at fair value is EUR 47.56.
The change in net asset value is explained by
the further decline in market value of interest
rate hedging instruments and the payment of a
dividend for the 2013-2014 financial year.
Retail Estates NV
NAV (incl. div.)
4. fInancIal calendar
Announcement results third quarter 2014-2015 13 February 2015
Announcement annual results financial year 2014-2015 22 May 2015
Dividend made available for payment 10 July 2015
98 99 00 01 02 03 04 05 06 07 08 09 10 11 12 13 14
Retail Estates NV - NAV

44
• ManageMent report
• Financial report
• Share perForMance report
> Real estate report• general inForMation
45
real estate report
Retail Estates’ cluster strategy results in an optimisation of the management costs.
econoMIes of scale

• manaGement report
• Financial report
• Share perFormance report
> Real estate report• General inFormation
2014 - 2015Retail Estates
46 47
retail area
591,195 m²
Real estate report Valuation as at 30 September 2014
1. real estate expert’s report
Retail Estates nv enlists the services of Cushman &
Wakefield and CBRE as its real estate experts. In
practice, each real estate expert values a part of
the real estate portfolio.
report by cushMan & waKefield Cushman & Wakefield’s report dated 30
September 2014 covers a portion of the property
of Retail Estates nv and its subsidiaries. This
reports mentions amongst others:
“We have the pleasure to give you our valuation
update as at 30 September 2014 of the Retail
Estates portfolio and Immobilière Distri-Land nv.
We confirm that we carried out this task as
independent expert. We also confirm that our
valuation was carried out in accordance with the
national and international standards and their
application procedures, amongst other in the
valuation of regulated real estate companies
(Belgian REITs) – (According to the present
decisions. We preserve ourselves the right to
review our valuation in case of modified decisions).
The investment value is defined as the estimated
amount for which a property should exchange
on the date of valuation between a willing buyer
and a willing seller in an arm’s-length transaction
after proper marketing wherein the parties had
each acted knowledgeably, prudently and without
compulsion. This definition corresponds to our
definition of the market value.
The sale of a building is in theory subject to
transfer rights collected by the government. This
amount depends amongst other on the transfer
manner, the profile of the purchaser and the
geographical situation of the building. The first
two conditions and the amount to pay for the
rights is only known when the sale has been
concluded. As independent experts, we confirm
that on the basis of a representative sample of the
market (between 2002 and 2005) the weighted
average of the rights (average transfer costs)
is 2.50 % (for goods with a higher value than
EUR 2.50 million).
The properties are here considered as a portfolio.
Our “investment value” is based on the
capitalisation with a Gross Yield of the passing
rent, taking into account possible corrections
like vacancy, step-rents, rent-free periods, etc.
The Gross yield is depending on current output
on the investment market, taking into account the
location, the suitability of the site, the quality of
the tenant and the building on the moment of the
valuation.
In order to calculate the investment value of
the retail park in Tongeren, we have capitalised
its adjusted market rent. It is standard market
practice to take into account that no more than
60 % of the gap between the actual passing
rent and the estimated rental value (ERV) can be
bridged in renegotiations. This is the case when
the market rent is higher than the actual rent paid.
This is mainly due to the high legal protection for
sitting tenants under Belgian commerce law.
When now the market rent (ERV) is under the
passing rent however, the highest rent a landlord
should hope to achieve is the market rent. Since,
being prudent, one should assume that the sitting
tenant will use the break to negotiate his rent
downward and bring it in line with the market.
The portfolio of Immobilière Distri-Land nv has as
at 30.09.2014 an investment value (corrections
incl.) of EUR 17.01 million and a fair value of
EUR 16.60 million. The investment value, in
absolute terms, remained stable. This gives a yield
of 7.40 % for Immobilière Distri-Land nv.
We obtain an investment value (corrections incl.)
as at 30.09.2014 for the portfolio1 of EUR 448.97
million and a fair value of EUR 438.02 million.
On the basis of the investment value, the
portfolio increases in absolute terms with 7.95 %
compared to 30.06.2014, due to the purchase
of the Frunparks in Oudenaarde and Wetteren.
This gives a yield of 6.89 % to the portfolio. If we
would leave out both Frunparks from the evolution
1 Portfolio : Retail Estates nv + Immobilière Distri-Land nv + Tongeren + Ducova bvba + Wetteren + Oudenaarde
comparison, then we could establish that the
portfolio increases with 1.07 % in comparison with
the last quarter.”
Report by CBRE
The report by CBRE dated 30 September 2014
covers a portion of the property of Retail Estates nv
and its subsidiaries. The investment value of this
real estate is herewith estimated at EUR 332.60
million and the fair value at EUR 324.49 million.
These properties account for a rent collection of
EUR 23.15 million, representing a gross yield of
6.81 %.
2. note
The investment market is evolving in different
directions under the influence of the world-
wide economic uncertainties. On the one hand
a number of foreign institutional investors have
realised their investments faster than originally
intended, in order to secure their capital gains and
reinvest in their home markets where the credit
crunch is offering new purchase opportunities. On
the other hand the private market remains active,
with wealthy private investors showing continuing
interest in transactions of between EUR 1 and
5 million. The rental market remains active, but
is more sensitive than in the past to quality of
location, with a preference for retail properties on
multi-shop sites (retail parks) or along major city
access roads with strong concentrations of similar
properties (retail clusters). Isolated buildings in
well-populated residential areas are popular with
food supermarkets.

2014 - 2015Retail Estates
• ManageMent report
• Financial report
• Share perForMance report
> Real estate report• general inForMation
48 49
in conjunction with other shops, form part of an
integrated commercial complex. All properties
use a central car park with a shared entrance
and exit road. This enables consumers to go to
several shops without having to move their cars.
A location of this kind will typically have at least
five properties.
Other real estate consists mainly of offices,
residential dwellings, hospitality establishments
and a logistics complex at Erembodegem.
The Erembodegem site was leased in its totality
to Brantano nv under a 10-year lease agreement
that ends on 31 May 2024. Retail Estates nv
only invests in real estate properties used for
the aforementioned purposes if they are already
embedded in a retail property or are part of a real
estate portfolio that can only be acquired as a
whole.
Retail premises under development are
premises that form part of a new-build project or a
renovation project.
3. coMMercial activities of tenants
Retailers selling clothing and footwear (30.51 %
compared with 29.26 % as at 31 March 2014)
together with food, electrical goods and toy
retailers, account for more than 55 % of the
leased surface area. Both categories provide a
stable basis, because they are the least sensitive
to economic fluctuations. Moreover, the socio-
economic permits for these activities are the most
difficult to obtain. This is conducive to an increase
in the value of the properties on the one hand and
a stronger loyalty to the location on the other.
The larger margins in the interior decoration and
home furnishings sector make it possible to obtain
sizeable rent increases in favourable economic
climates, but it is this sector that is hardest hit
by any downturn in consumer confidence. This
segment represents 19.98 % of Retail Estates nv’s
property portfolio (compared with 19.57 % as at
31 March 2014).
4. subdivision by type of building
Individual peripheral retail properties are
individual retail properties adjacent to the public
highway. Every outlet has its own car park and
entrance and exit roads, connecting it to the public
highway, and making it easily recognisible. In the
immediate vicinity, there are, in principle, no retail
properties of the same kind.
Retail clusters are a collection of peripheral retail
properties, located along the same traffic axis and,
from the consumer’s point of view, they form a self-
contained whole, although they do not possess a
joint infrastructure other than the traffic axis. This is
the most typical concentration of peripheral retail
properties in Belgium.
Retail parks are made up of retail properties that,
COMMERCIAL ACTIVITIES OF TENANTS
DIYDrugstoreElectrical goodsFitness Restaurant/barInterior/decorationOf�ce/paper
Garden/animalVacancyMiscellaneousFood
Clothing/footwearToy retailers
6.49 1.556.66
0.472.13
19.98
1.8130.51
8.55
2.59
1.50
7.79
9.97
Individual peripheral retail propertiesRetail clusters and retail parks
Other
7.23
24.46
68.31
TyPE OF BUILDING Key figures
RETAIL ESTATES
30.09.14 31.03.14
Estimated fair value 767,815,000 745,916,000
Yield in % (investment value) 6.92% 6.93%
Contractual rents 53,377,504 51,144,211
Contractual rents incl. rental value of vacant buildings 54,130,090 51,823,578
Total m² in portfolio 591,195 570,870
Number of properties 562 548
Occupancy rate in % 98.50% 98.17%
Total m² under development 20,100 1,800

50
• ManageMent report
• Financial report
• Share perForMance report
• real eState report
> General information
51
The Retail Estates expert team is at your service.
QualIty
general InforMatIon

• manaGement report
• Financial report
• Share perFormance report
• real eState report
> General information
2014 - 2015Retail Estates
52 53
562
retail properties
General informationlexIcon
Acquisition value
This is the term to be used for the purchase of
a building. Any conveyance fees payable are
included in the acquisition price.
Book value of a company
The book value of a company means the totality
of its equity. The book value can be found in the
company’s balance sheet.
Book value of a share
NAV (Net Asset Value) means equity divided by the
number of shares.
Chain stores
These are companies that have a central
purchasing department and operate at least five
different retail outlets.
Contractual rents
The index-linked basic rents as provided in the
lease agreements as of 30 September 2014, before
deduction of gratuities or other benefits granted to
tenants.
Debt ratio
The debt ratio is calculated as follows: liabilities
(excluding provisions, accrued charges and
deferred income, hedging instruments and
deferred taxes), divided by the total assets
(excluding hedging instruments).
Dividend yield
The ratio of the most recently paid gross dividend
to the final share price of the financial year over
which the dividend is payable.
Estimated investment value
This is the value of the real estate portfolio,
including costs, registration charges, fees and
VAT, as estimated each quarter by an independent
expert.
Exit tax
The exit tax is a special corporate tax rate applied
to the difference between the fair value of the
registered capital of companies and the book
value of its capital at the time that a company is
recognised as a regulated real estate company, or
merges with a regulated real estate company.
Fair value
This value is equal to the amount for which a
building could be swapped between properly
informed parties, consenting and acting under
normal competitive conditions. From the point of
view of the seller, it must be construed minus the
registration charges.
Gross dividend
The gross dividend per share is the operating
profit distributed.
IAS standards
The International Accounting Standards (IAS)/
International Financial Reporting Standards (IFRS)
were drawn up by the International Accounting
Standards Board (IASB), defining international
standards for the preparation of annual accounts.
European listed companies are required to apply
the rules in their consolidated accounts for financial
years starting from 1 January 2005.
IFRS standards
The International Financial Reporting Standards
are a set of accounting principles and valuation
rules prepared by the International Accounting
Standards Board. The aim is to simplify
international comparison between European listed
companies.
Listed companies are required to prepare their
consolidated accounts according to these
standards starting from the first financial year
beginning after 1 January 2005.
Intrinsic value
The intrinsic value of a share is the actual estimated
value of the share, assuming that the company was
to cash in all of its assets.
Investment value of a property
This is the value of a building as estimated by
the independent real estate expert, including
the conveyance charges after deduction of the
registration charges. This value corresponds with
what was formerly called ‘value after costs paid by
the vendor’ or ‘value in hand’.
IRS
An Interest Rate Swap (IRS) is an agreement between
parties to exchange interest rate cash flows during a
predetermined period of time on an amount agreed
beforehand. This concerns only the interest rate cash
flows. The amount itself is not swapped. IRS is often
used to hedge interest rate increases. In this case, a
fixed interest rate will be swapped for a variable one.
Net dividend
The net dividend is equal to the gross dividend
after retention of 25 % withholding tax.
Net inventory value
Revalued net assets.
Occupancy rate
The occupancy rate is calculated as the ratio of the
surface area actually leased out to the surface area
available for leasing, expressed in m².
Peripheral retail properties
Retail premises grouped along roads leading into
and out of cities and towns. Each peripheral retail
property has its own car park and an entrance and
exit road connecting to the public highway.
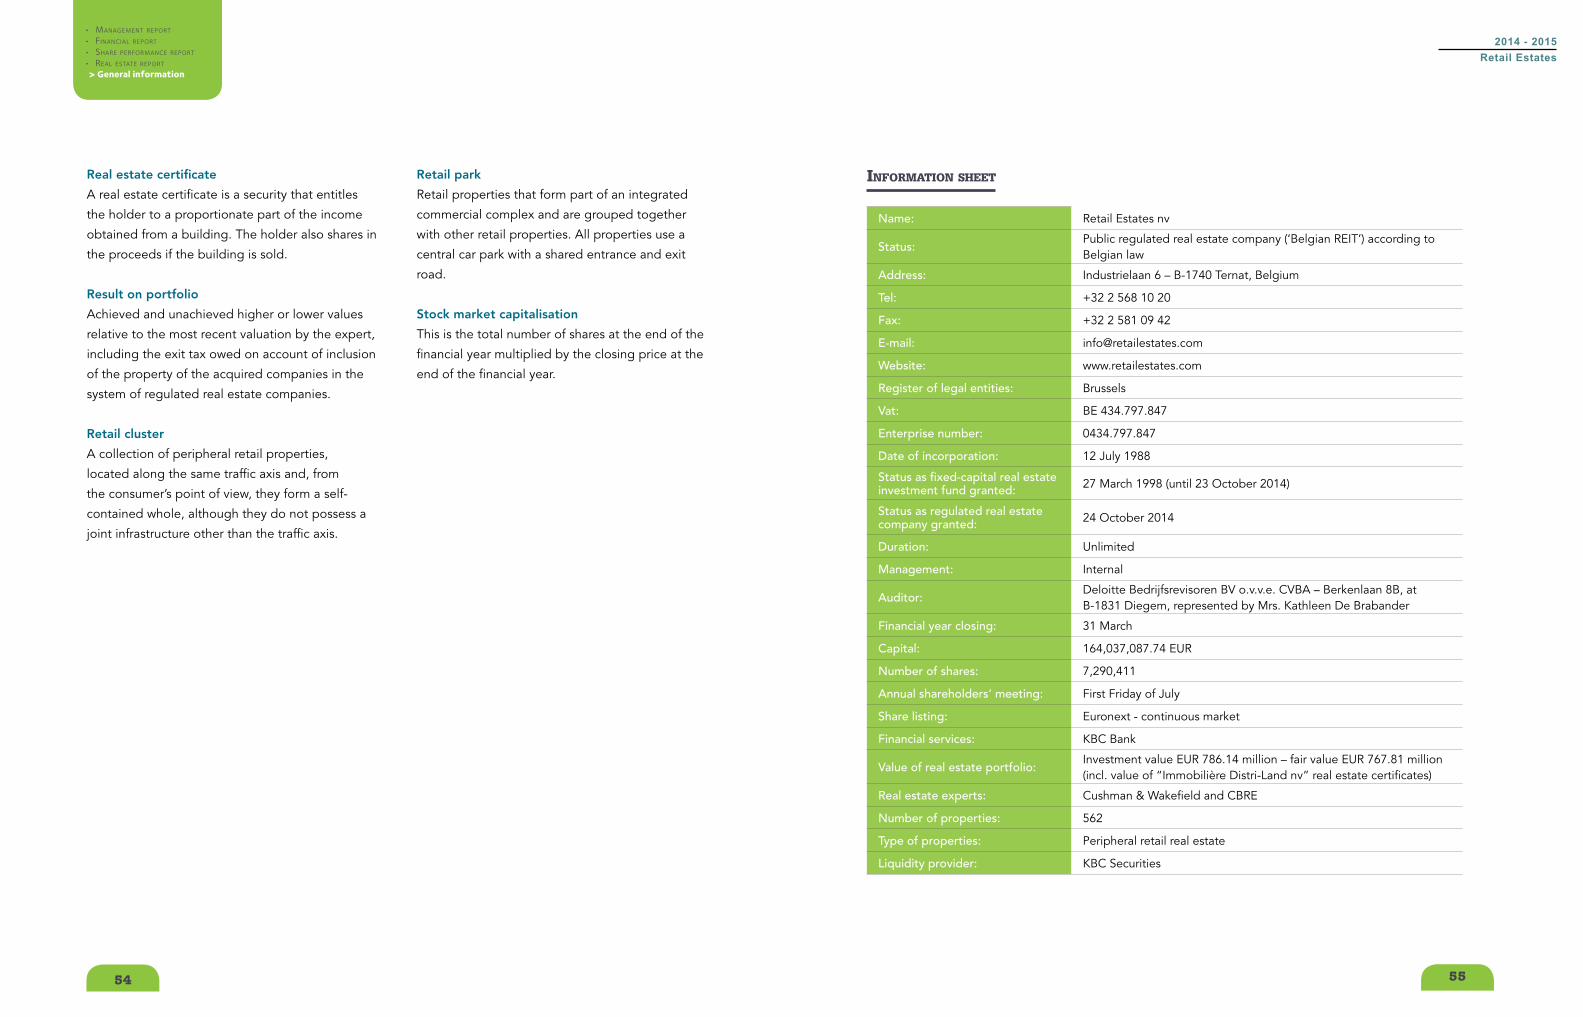
2014 - 2015Retail Estates
• ManageMent report
• Financial report
• Share perForMance report
• real eState report
> General information
54 55
Real estate certificate
A real estate certificate is a security that entitles
the holder to a proportionate part of the income
obtained from a building. The holder also shares in
the proceeds if the building is sold.
Result on portfolio
Achieved and unachieved higher or lower values
relative to the most recent valuation by the expert,
including the exit tax owed on account of inclusion
of the property of the acquired companies in the
system of regulated real estate companies.
Retail cluster
A collection of peripheral retail properties,
located along the same traffic axis and, from
the consumer’s point of view, they form a self-
contained whole, although they do not possess a
joint infrastructure other than the traffic axis.
Retail park
Retail properties that form part of an integrated
commercial complex and are grouped together
with other retail properties. All properties use a
central car park with a shared entrance and exit
road.
Stock market capitalisation
This is the total number of shares at the end of the
financial year multiplied by the closing price at the
end of the financial year.
Name: Retail Estates nv
Status: Public regulated real estate company (‘Belgian REIT’) according to Belgian law
Address: Industrielaan 6 – B-1740 Ternat, Belgium
Tel: +32 2 568 10 20
Fax: +32 2 581 09 42
E-mail: [email protected]
Website: www.retailestates.com
Register of legal entities: Brussels
Vat: BE 434.797.847
Enterprise number: 0434.797.847
Date of incorporation: 12 July 1988
Status as fixed-capital real estate investment fund granted: 27 March 1998 (until 23 October 2014)
Status as regulated real estate company granted: 24 October 2014
Duration: Unlimited
Management: Internal
Auditor: Deloitte Bedrijfsrevisoren BV o.v.v.e. CVBA – Berkenlaan 8B, at B-1831 Diegem, represented by Mrs. Kathleen De Brabander
Financial year closing: 31 March
Capital: 164,037,087.74 EUR
Number of shares: 7,290,411
Annual shareholders’ meeting: First Friday of July
Share listing: Euronext - continuous market
Financial services: KBC Bank
Value of real estate portfolio:Investment value EUR 786.14 million – fair value EUR 767.81 million (incl. value of “Immobilière Distri-Land nv” real estate certificates)
Real estate experts: Cushman & Wakefield and CBRE
Number of properties: 562
Type of properties: Peripheral retail real estate
Liquidity provider: KBC Securities
InformatIon sheet
