alan s. dornfest property tax policy, bureau chief ... s. dornfest property tax policy, bureau chief...
TRANSCRIPT

Idaho Property Taxes
Alan S. Dornfest Property Tax Policy,
Bureau Chief Property Tax Division
Idaho State Tax Commission January 19, 2015

2
Objectives • Understand property tax
– How is property assessed? • Who is responsible? • What is the role of the Tax Commission
– What types of property are there? – Who pays how much? – Who spends property tax? – How are property taxes determined? – How do we control / relieve property tax? – What are the recent trends?
• Learn about how property tax fits into Idaho’s taxes
• Understand tax burden
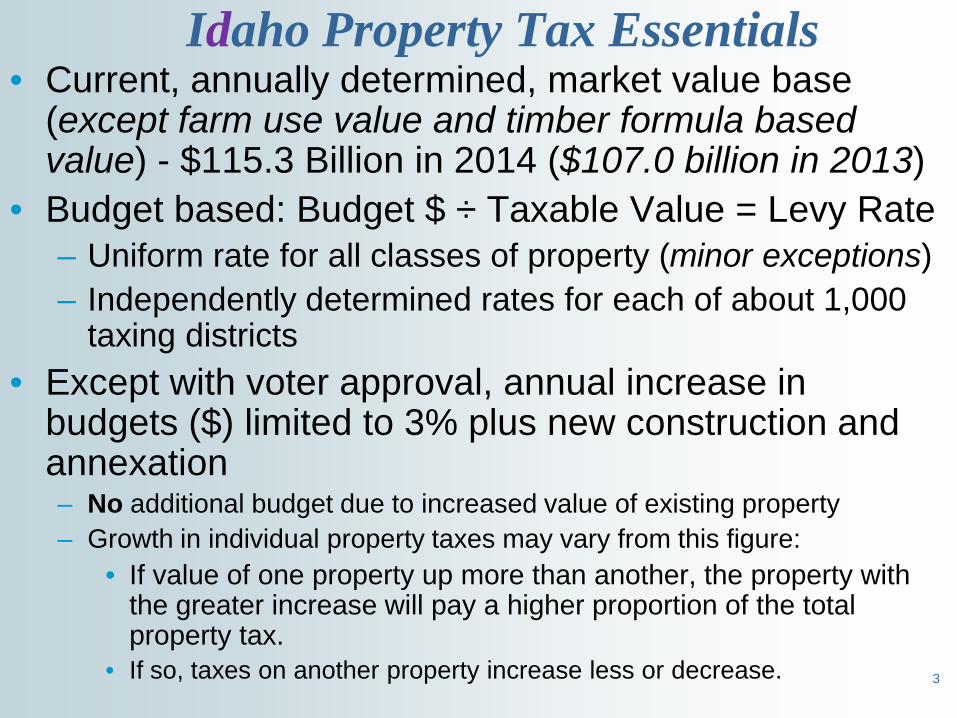
• Current, annually determined, market value base (except farm use value and timber formula based value) - $115.3 Billion in 2014 ($107.0 billion in 2013)
• Budget based: Budget $ ÷ Taxable Value = Levy Rate – Uniform rate for all classes of property (minor exceptions) – Independently determined rates for each of about 1,000
taxing districts • Except with voter approval, annual increase in
budgets ($) limited to 3% plus new construction and annexation – No additional budget due to increased value of existing property – Growth in individual property taxes may vary from this figure:
• If value of one property up more than another, the property with the greater increase will pay a higher proportion of the total property tax.
• If so, taxes on another property increase less or decrease. 3
Idaho Property Tax Essentials

4
Property Tax Essentials (cont.)
• Tax is levied on most real and business personal property
• Tax is generated and used locally: – ~$46,124 (2014) to state public school income fund
(taxes on small railcar companies paid directly to state) – $1,552 Million (2014) to local units of government – $ 59.3 Million (2014) to urban renewal agencies
• Many varieties of tax relief are available – Exemptions partial and full – Circuit Breaker (state pays part (sometimes all) of
property tax)

5
The Personal Property Tax • Personal property taxes in Idaho were between
$104* and $137* million out of $1,552 million in total property taxes in 2014 (7% - 9% statewide, but much higher in some counties).
• In addition to furniture, fixtures, machinery, and equipment, the above figure for personal property tax includes rail cars and certain other portions of operating property.
• Amounts shown reflect 2014 partial exemption
*Includes $13 - $14 million tax on personal property paid to urban renewal agencies.

6
Assessment of Property – System of Valuation
• General requirement – Idaho Code (IC)§ 63-205 requires annually
updated current market value – Exceptions apply through full or partial exemptions
or property brought into the state for part of the year
• Recognized appraisal methods to be employed in determining assessed value (Rule 217)
• All property taxable unless expressly exempt

7
Frequency of Assessment • “All real, personal and operating property subject to
property taxation must be assessed annually….” (IC 63-205)
– County assesses real and personal property – STC assesses operating property - (utilities and railroads)
• “Taxable property shall be appraised or indexed annually to reflect current market value.” (IC 63-314) – Appraisal includes field inspection (required at least every
5 years). – Property not appraised in given year must be indexed to
current market value. – Current market value this year is the value of the property
as of January 1, 2014

Variations from Sale Price as Indicator of Market Value
• Farmland – based on productivity value, including long term income and interest rates
• Timberland – based on legislated formula • Operating property – appraised as operating
unit, with value apportioned to each taxing district based on legislated formula
• Low income section 42 housing – based on legislated formula
8

STC Property Tax Roles
• Division Structure • Major Functions
9


STC Property Tax Functions • Develop administrative rules
– Clarify statutory provisions – Provide process for uniform administration of statutes
• Recommend and develop technical correction legislation • Appraise operating property – public utilities and railroads
– Commissioners hear appeals – Value is apportioned to each taxing district
• Basis is usually mile of track or lines in district • Small rail car fleets are billed by STC, with money deposited in the Public School
Income fund; values are not apportioned. • Provide guidance to counties on appraisal
– Timberland (statutory formula) – Farmland – capitalization rate development – General guidance – 7 consulting appraisers assigned regionally
• Coordinate appraisal training and education program – conduct classes regionally and locally
• Provide software support – Assessment administration – Property tax billing
• Compile statistical information and develop reports analyzing property tax burden 11
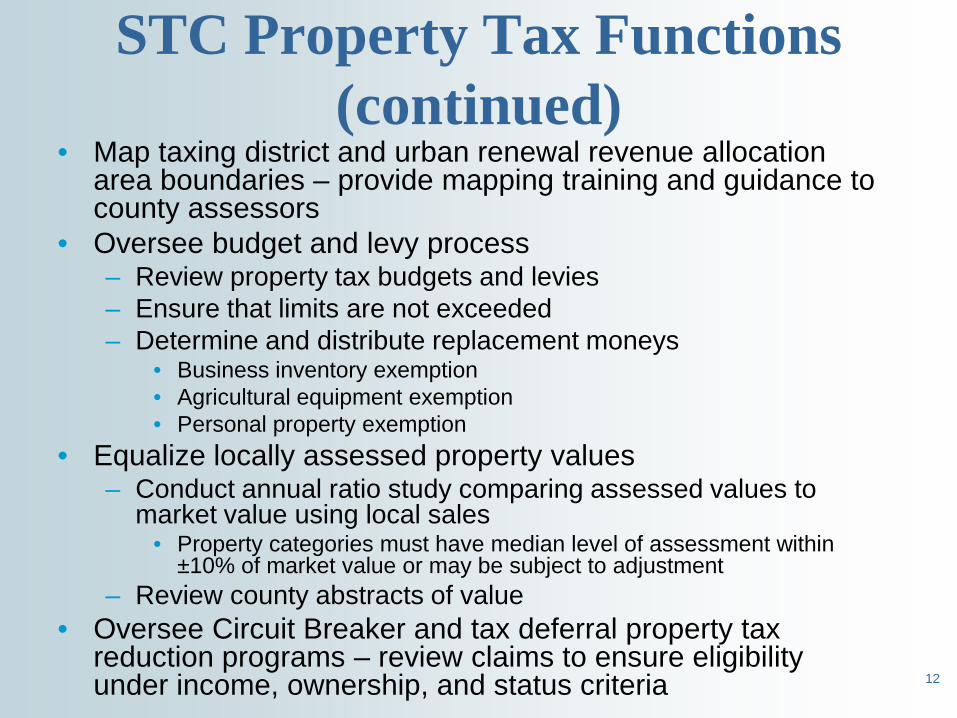
STC Property Tax Functions (continued)
• Map taxing district and urban renewal revenue allocation area boundaries – provide mapping training and guidance to county assessors
• Oversee budget and levy process – Review property tax budgets and levies – Ensure that limits are not exceeded – Determine and distribute replacement moneys
• Business inventory exemption • Agricultural equipment exemption • Personal property exemption
• Equalize locally assessed property values – Conduct annual ratio study comparing assessed values to
market value using local sales • Property categories must have median level of assessment within
±10% of market value or may be subject to adjustment – Review county abstracts of value
• Oversee Circuit Breaker and tax deferral property tax reduction programs – review claims to ensure eligibility under income, ownership, and status criteria
12
STC Investigatory Authority IC 63-105A(11); Rule 120
• Examine issues when complaints are filed – Not the same as an appeal, which must be
taken through county channels (unless operating property is involved)
– Generally broad allegations of improper assessment of many properties
13
Recent Property Tax Developments and Historical
Perspective
14
Personal Property Legislation – Main Issues HB 315 (2013) and 441 (2014)
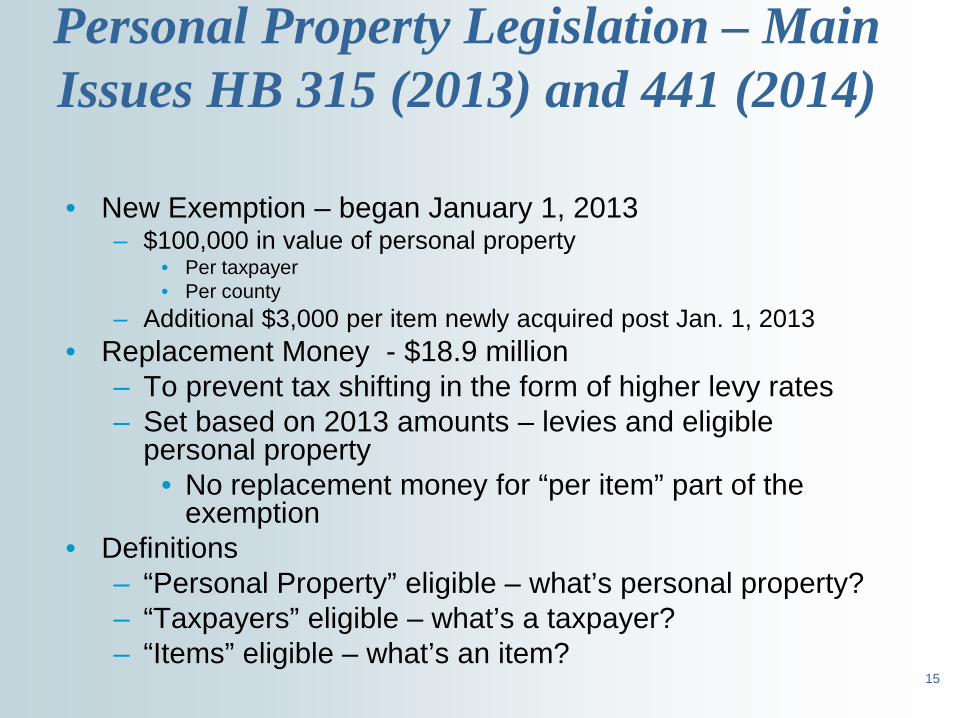
• New Exemption – began January 1, 2013
– $100,000 in value of personal property • Per taxpayer • Per county
– Additional $3,000 per item newly acquired post Jan. 1, 2013 • Replacement Money - $18.9 million
– To prevent tax shifting in the form of higher levy rates – Set based on 2013 amounts – levies and eligible
personal property • No replacement money for “per item” part of the
exemption • Definitions
– “Personal Property” eligible – what’s personal property? – “Taxpayers” eligible – what’s a taxpayer? – “Items” eligible – what’s an item?
15
$100,000 Personal Property Exemption – Definition of Fixtures (redefined in 2014)
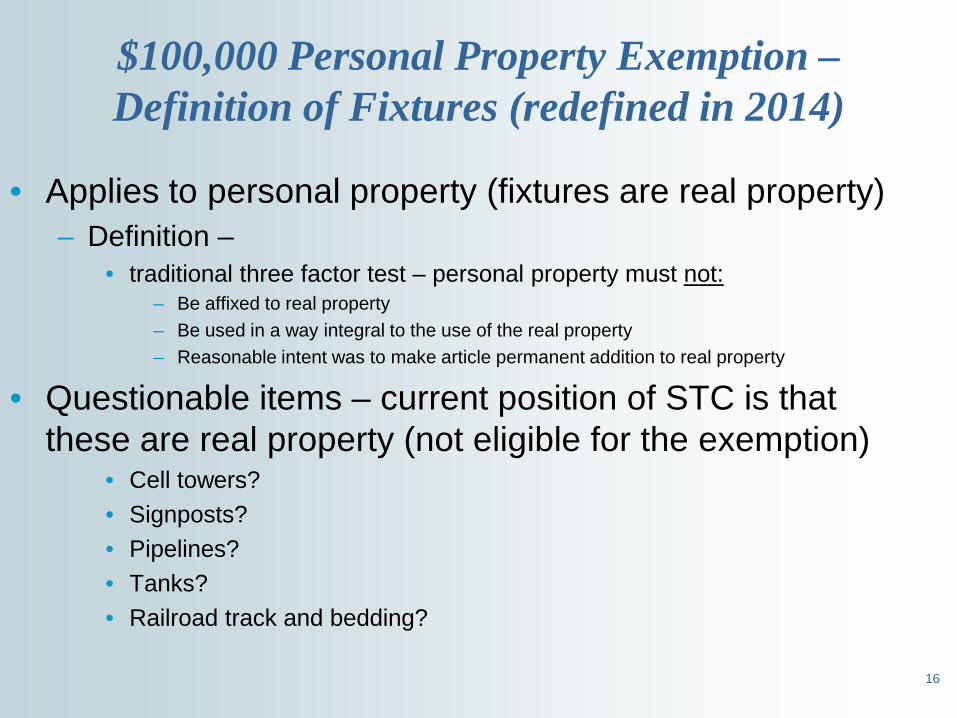
• Applies to personal property (fixtures are real property) – Definition –
• traditional three factor test – personal property must not: – Be affixed to real property – Be used in a way integral to the use of the real property – Reasonable intent was to make article permanent addition to real property
• Questionable items – current position of STC is that these are real property (not eligible for the exemption)
• Cell towers? • Signposts? • Pipelines? • Tanks? • Railroad track and bedding?
16

Growth of Idaho Personal Property Exemptions Description Year Passed / Implemented
Crops, tools, libraries, surgical and scientific instruments ($ limit)
1863 – 1913
Household goods ($ limit) 1901
Motor vehicles, expanded to include RVs and boats
1933, expanded in 1975 and 1978
Stored or shipped 1955, 1963 Pollution control equipment 1963
Business inventory and livestock 1968 – 1971 (phase out)
Insurers and credit unions 1961 and 1977
Agricultural equipment 2001

18
Significant Changes in Idaho Property Values and Taxes beginning in 2006
• Homeowner’s exemption increased – 50% not to exceed upper limit – Was locked at 50%, up to $50,000 from 1983 – 2006 – Upper limit changed to $75,000 in 2006 and tied to HPI for future
• $89,250 in 2007 • $100,938 in 2008 • $104,471 for 2009 • $101,153 for 2010 (given decline in HPI for Idaho) • $92,040 for 2011 (given larger decline in HPI for Idaho) • $83,974 for 2012 • $81,000 for 2013 • $83,920 for 2014 • $89,580 for 2015
• School general property tax eliminated in most school districts – beginning in 2006 – Typically had been about 19% of tax – Lowered total (net) property taxes by 11% average from 2005 – 2006
• Effective 2014 average tax rate: – Homes: 0.91% (of full mv before homeowner’s exemption) – Business: 1.52%
$50,000
$60,000
$70,000
$80,000
$90,000
$100,000
$110,000
2005 2006 2007 2008 2009 2010 2011 2012 2013 2014 2015
Homeowner’s Exemption
19
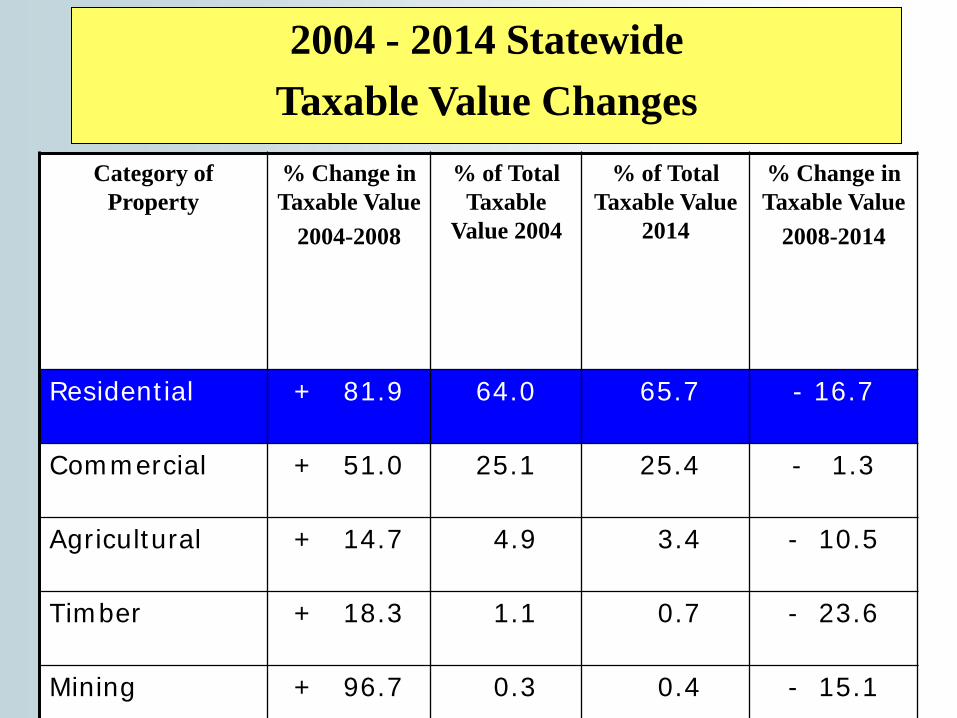
Category of Property
% Change in Taxable Value
2004-2008
% of Total Taxable
Value 2004
% of Total Taxable Value
2014
% Change in Taxable Value
2008-2014
Residential + 81.9 64.0 65.7 - 16.7
Commercial + 51.0 25.1 25.4 - 1.3
Agricultural + 14.7 4.9 3.4 - 10.5
Timber + 18.3 1.1 0.7 - 23.6
Mining + 96.7 0.3 0.4 - 15.1
2004 - 2014 Statewide Taxable Value Changes

20
10 Year Chart of Taxable Value Changes by Major Property Category (est.)
-
10,000.0
20,000.0
30,000.0
40,000.0
50,000.0
60,000.0
70,000.0
80,000.0
90,000.0
100,000.0
2005 2006 2007 2008 2009 2010 2011 2012 2013 2014
Millions of Dollars
Residential
Commercial
Agricultural
Timber
Mining
Public Utilities
21
What about primary residential property (homes)?
• Subset of residential class as a whole (shown on previous slide)
• Through 2014: – Represents the largest share of property value in
Idaho 42.3% in 2014 (up from 41.1% in 2013) – Total assessed value (net of homeowner’s
exemption) increased 63.8% from 2004 to 2014 – Decreased 3.4% from 2011 – 2012 – Increased 2.7% from 2012 – 2013 – Increased 8.0% from 2013 - 2014
22
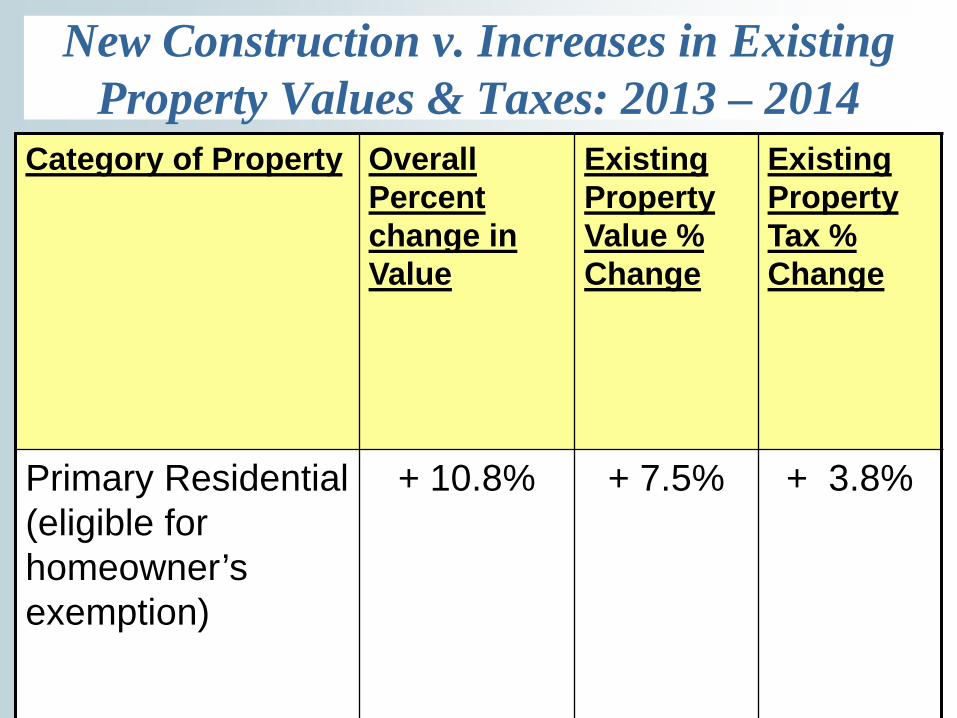
New Construction v. Increases in Existing Property Values & Taxes: 2013 – 2014
Category of Property Overall Percent change in Value
Existing Property Value % Change
Existing Property Tax % Change
Primary Residential (eligible for homeowner’s exemption)
+ 10.8% + 7.5% + 3.8%

23
Causes & effects of taxable value changes • Economic conditions change demand or supply of properties
– can increase or decrease values (lakeshore v. deteriorating area)
• Exemptions – increase or new (such as Housing Price Index (HPI) application to homeowner’s exemption, which tends to negate inflation driven increases in home values).
• Appeals that lower value after determination that initial value exceeded market value
• Depreciation – most obvious for business machinery and equipment (personal property)
• New construction that adds to totals in each sector • Assessment changes affect the distribution, not the overall
amount, of the property tax – given a budget driven system.
24
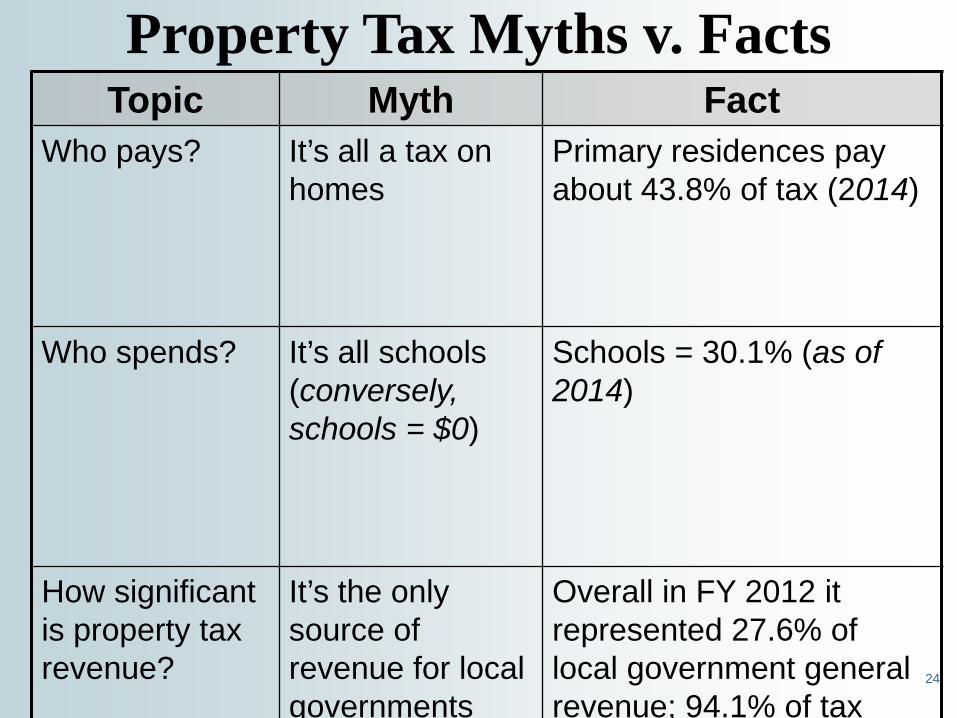
Property Tax Myths v. Facts Topic Myth Fact
Who pays? It’s all a tax on homes
Primary residences pay about 43.8% of tax (2014)
Who spends? It’s all schools (conversely, schools = $0)
Schools = 30.1% (as of 2014)
How significant is property tax revenue?
It’s the only source of revenue for local governments
Overall in FY 2012 it represented 27.6% of local government general revenue; 94.1% of tax

25
Fiscal Year 2012 State and Local Government Finances – www2.census.gov/gov/state/10_methodology.pdf

26
There are 1,112 taxing districts and 964 levied property tax in 2014.
Property Tax by District Type 2013-2014
10/28/204
District Name
2013 Number of Districts
2013 District Levying
2014 Number of Districts
2014 Districts Levying
Ambulance 26 25 26 26 Auditorium 3 2 3 2 Cemetery 182 180 183 180 Cities 201 191 201 191 Community Colleges 3 3 3 3 Counties 44 44 44 44 Drainage 1 - 1 - Fire 158 157 159 157 Flood Control 15 11 14 11 Highway-County Road & Bridge 98 77 98 77 Hospital 17 16 17 16 Infrastructure 2 1 2 1 Levee 1 - 1 - Library 56 55 56 55 Abatement (Mosquito) 23 22 23 22 Pest Control 5 5 5 5 Port 1 1 1 1 Recreation 34 29 35 30 Regional Airport - - - - School 115 114 115 114 Sewer 36 11 34 10 Sewer & Water 54 13 55 12 Water 26 5 26 5 Watershed Improvements 9 1 10 2
Totals: 1,110 963 1,112 964
Comparison of Total Taxing DistrictsAgainst Totally Taxing Districts That Levy
for Years 2013 - 20143

2014 Property Tax Use
Highway 6.4% $ 98.8 Million
School 30.1% $ 466.7 Million
City 26.8% $ 416.7 Million
County 26.0% $ 404.3 Million
Other 10.7% $ 165.5 Mill
3.2% $ 5.3 Mill Cemetery
15.7% $ 26.0 Mill Jr. College
37.3% $61.8 Mill Fire
43.8% $72.4 Mill Miscellaneous
TOTAL
OTHER 10.7%
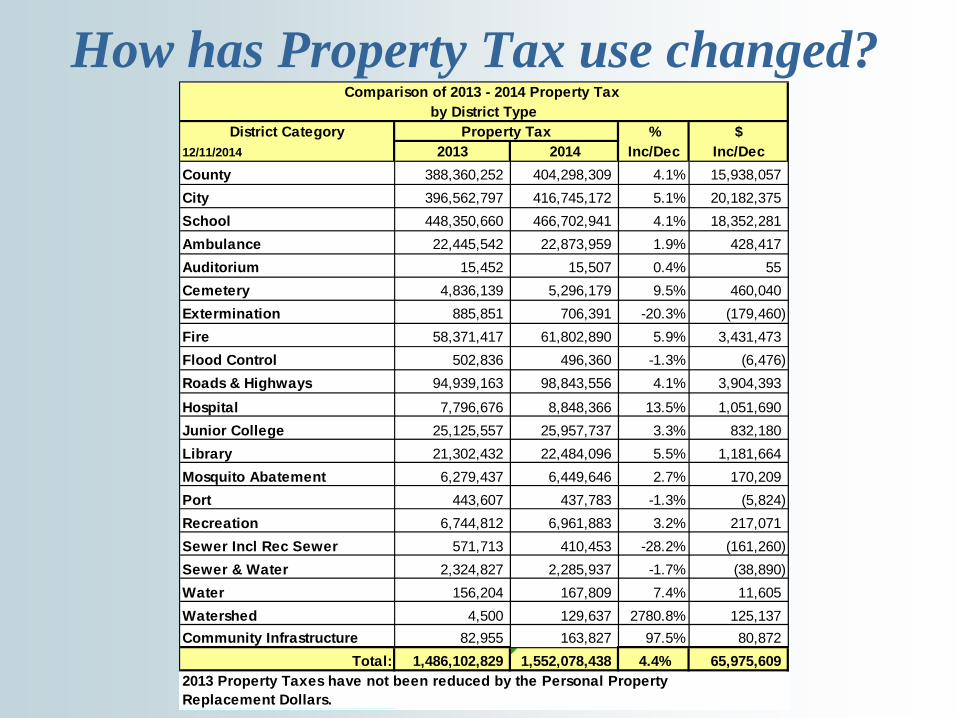
How has Property Tax use changed? Comparison of 2013 - 2014 Property Tax
by District TypeDistrict Category Property Tax % $
12/11/2014 2013 2014 Inc/Dec Inc/DecCounty 388,360,252 404,298,309 4.1% 15,938,057 City 396,562,797 416,745,172 5.1% 20,182,375 School 448,350,660 466,702,941 4.1% 18,352,281 Ambulance 22,445,542 22,873,959 1.9% 428,417 Auditorium 15,452 15,507 0.4% 55 Cemetery 4,836,139 5,296,179 9.5% 460,040 Extermination 885,851 706,391 -20.3% (179,460) Fire 58,371,417 61,802,890 5.9% 3,431,473 Flood Control 502,836 496,360 -1.3% (6,476) Roads & Highways 94,939,163 98,843,556 4.1% 3,904,393
Hospital 7,796,676 8,848,366 13.5% 1,051,690 Junior College 25,125,557 25,957,737 3.3% 832,180 Library 21,302,432 22,484,096 5.5% 1,181,664 Mosquito Abatement 6,279,437 6,449,646 2.7% 170,209 Port 443,607 437,783 -1.3% (5,824) Recreation 6,744,812 6,961,883 3.2% 217,071 Sewer Incl Rec Sewer 571,713 410,453 -28.2% (161,260) Sewer & Water 2,324,827 2,285,937 -1.7% (38,890) Water 156,204 167,809 7.4% 11,605 Watershed 4,500 129,637 2780.8% 125,137 Community Infrastructure 82,955 163,827 97.5% 80,872
Total: 1,486,102,829 1,552,078,438 4.4% 65,975,609 2013 Property Taxes have not been reduced by the Personal Property Replacement Dollars.
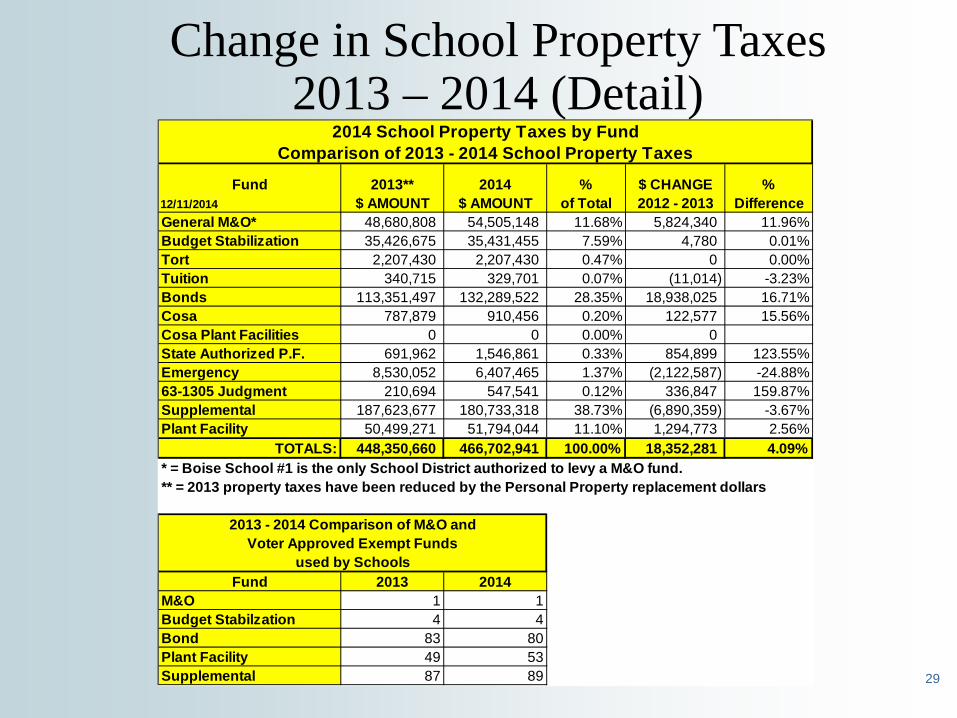
Change in School Property Taxes 2013 – 2014 (Detail)
29
2014 School Property Taxes by FundComparison of 2013 - 2014 School Property Taxes
Fund 2013** 2014 % $ CHANGE %12/11/2014 $ AMOUNT $ AMOUNT of Total 2012 - 2013 DifferenceGeneral M&O* 48,680,808 54,505,148 11.68% 5,824,340 11.96%Budget Stabilization 35,426,675 35,431,455 7.59% 4,780 0.01%Tort 2,207,430 2,207,430 0.47% 0 0.00%Tuition 340,715 329,701 0.07% (11,014) -3.23%Bonds 113,351,497 132,289,522 28.35% 18,938,025 16.71%Cosa 787,879 910,456 0.20% 122,577 15.56%Cosa Plant Facilities 0 0 0.00% 0State Authorized P.F. 691,962 1,546,861 0.33% 854,899 123.55%Emergency 8,530,052 6,407,465 1.37% (2,122,587) -24.88%63-1305 Judgment 210,694 547,541 0.12% 336,847 159.87%Supplemental 187,623,677 180,733,318 38.73% (6,890,359) -3.67%Plant Facility 50,499,271 51,794,044 11.10% 1,294,773 2.56%
TOTALS: 448,350,660 466,702,941 100.00% 18,352,281 4.09%* = Boise School #1 is the only School District authorized to levy a M&O fund.** = 2013 property taxes have been reduced by the Personal Property replacement dollars
2013 - 2014 Comparison of M&O andVoter Approved Exempt Funds
used by SchoolsFund 2013 2014
M&O 1 1Budget Stabilzation 4 4Bond 83 80Plant Facility 49 53Supplemental 87 89
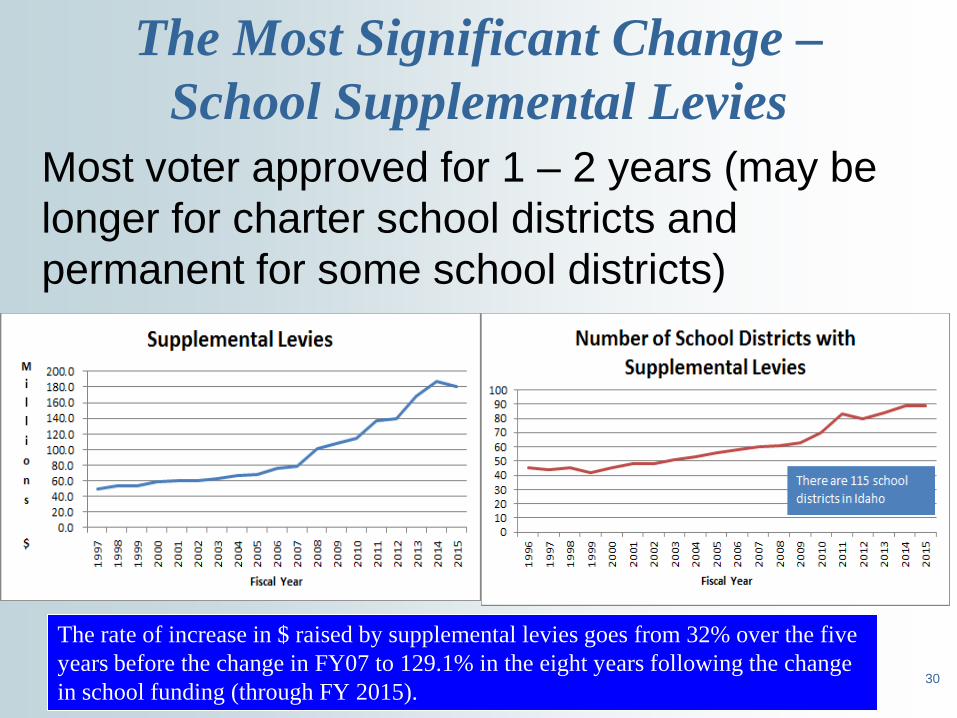
The Most Significant Change – School Supplemental Levies
Most voter approved for 1 – 2 years (may be longer for charter school districts and permanent for some school districts)
30
The rate of increase in $ raised by supplemental levies goes from 32% over the five years before the change in FY07 to 129.1% in the eight years following the change in school funding (through FY 2015).
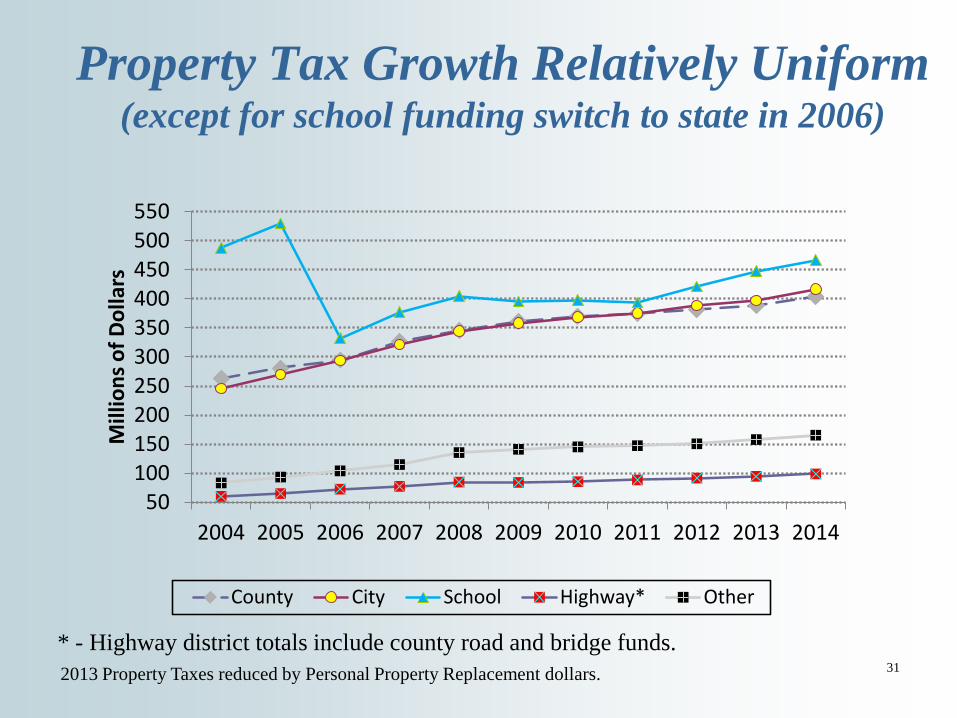
Property Tax Growth Relatively Uniform (except for school funding switch to state in 2006)
50 100 150 200 250 300 350 400 450 500 550
2004 2005 2006 2007 2008 2009 2010 2011 2012 2013 2014
Mill
ions
of D
olla
rs
County City School Highway* Other
* - Highway district totals include county road and bridge funds. 31 2013 Property Taxes reduced by Personal Property Replacement dollars.
32
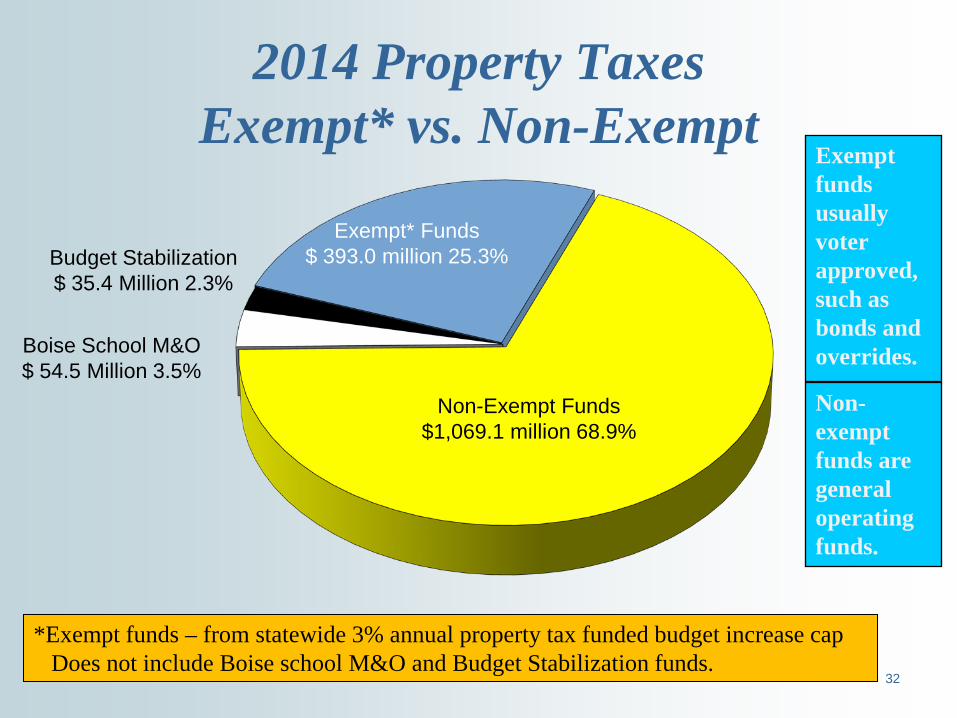
2014 Property Taxes Exempt* vs. Non-Exempt
Non-Exempt Funds $1,069.1 million 68.9%
Exempt* Funds $ 393.0 million 25.3%
Non-exempt funds are general operating funds.
Exempt funds usually voter approved, such as bonds and overrides.
*Exempt funds – from statewide 3% annual property tax funded budget increase cap Does not include Boise school M&O and Budget Stabilization funds.
Budget Stabilization $ 35.4 Million 2.3%
Boise School M&O $ 54.5 Million 3.5%

Non-Exempt Property Tax Funds Generally Grow Uniformly
0 50
100 150 200 250 300 350 400 450
2004 2005 2006 2007 2008 2009 2010 2011 2012 2013 2014
Mill
ions
of D
olla
rs
County City School Highway Other
33 School Funds do not include Boise M&O and Budget Stabilization Funds.
Total 2013 Property Taxes have been reduced by the State Personal Property replacement dollars.

School $ 374.6 Million
County $8.3 million
All Other $ 18.4 million
City $7.3 million
34
Schools are the Predominant Users of Exempt Funds (bonds, overrides, etc.)
2014 Exempt Funds School funds do not include Boise M&O and Budget
Stabilization funds.

Patterns of Use of Exempt Funds
0
50
100
150
200
250
300
350
400
2004 2005 2006 2007 2008 2009 2010 2011 2012 2013 2014
Mill
ions
of D
olla
rs
Year
Non-School Taxing Districts School 35
School Exempt funds do not include Boise M&O and Budget Stabilization funds
36
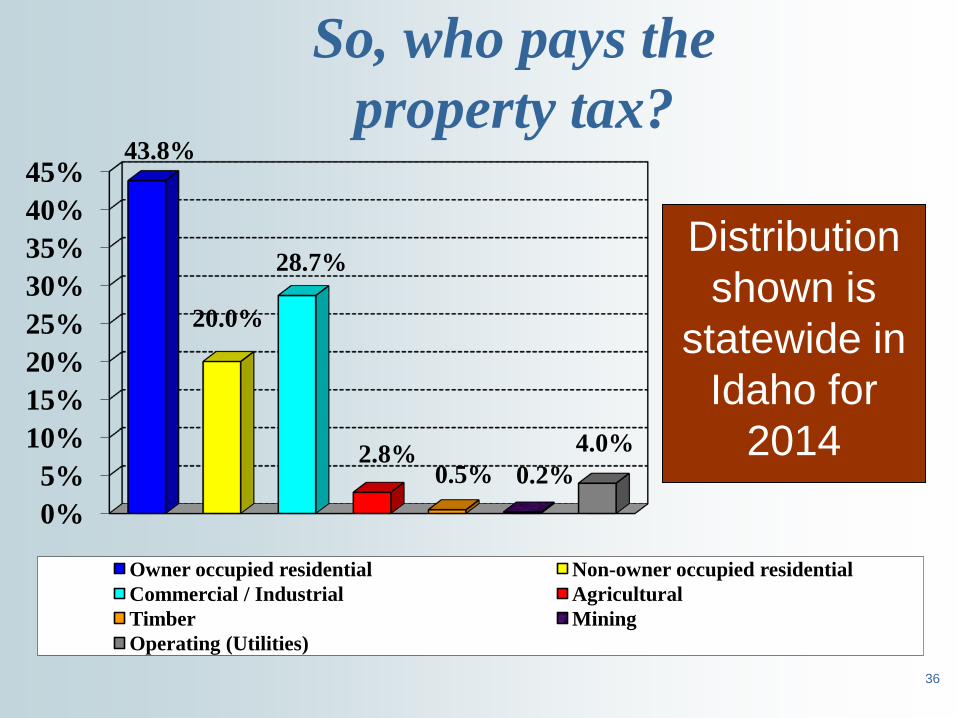
So, who pays the property tax?
0% 5%
10% 15% 20% 25% 30% 35% 40% 45%
43.8%
20.0%
28.7%
2.8% 0.5% 0.2%
4.0%
Owner occupied residential Non-owner occupied residential Commercial / Industrial Agricultural Timber Mining Operating (Utilities)
Distribution shown is
statewide in Idaho for
2014

37
Measuring General Property Tax Burden in Idaho
• Comparisons between states and localities – Accounting for differences in income – Accounting for differences in population
• Comparisons over income ranges • Comparisons with other Idaho taxes

38
Estimated 2013 Taxes Per Family of three - various incomes
1,324
2,748
4,306
811 1,147 1,283 1,439
2,860
4,280
0 500
1,000 1,500 2,000 2,500 3,000 3,500 4,000 4,500 5,000
$50,000 $75,000 $100,000
$ Income
Income Sales Property
Percentages show Boise compared to U.S. average of 51 cities.
Estimates for Boise, based on District of Columbia study of largest cities in each state.
5% -44% 13% 10% -28% 4% 37% -20% 10%
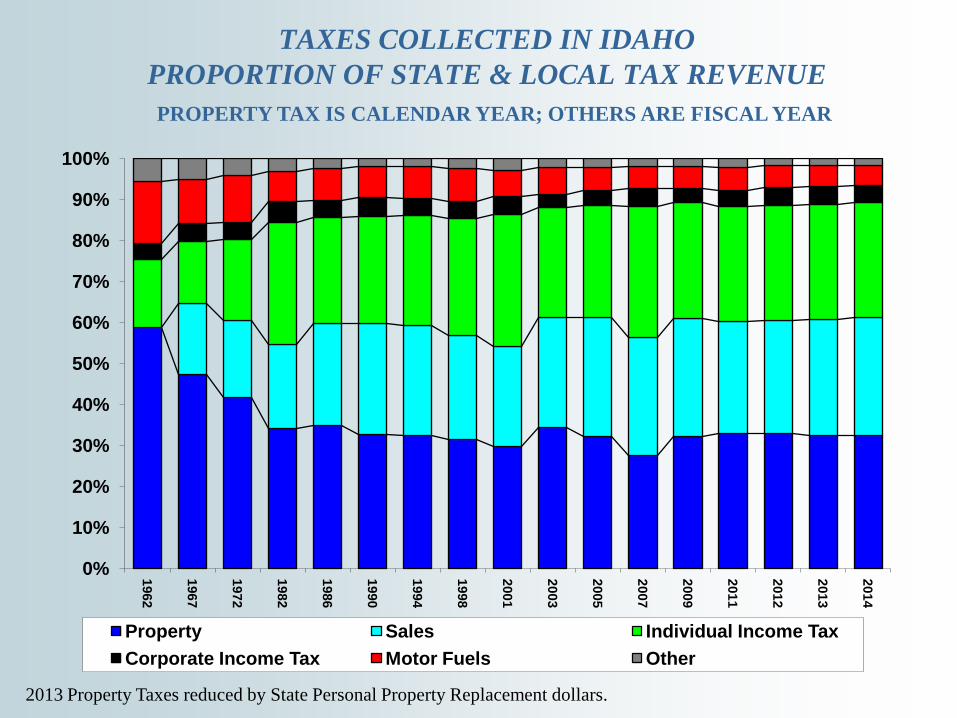
TAXES COLLECTED IN IDAHO PROPORTION OF STATE & LOCAL TAX REVENUE
0%
10%
20%
30%
40%
50%
60%
70%
80%
90%
100%
1962
1967
1972
1982
1986
1990
1994
1998
2001
2003
2005
2007
2009
2011
2012
2013
2014
Property Sales Individual Income Tax Corporate Income Tax Motor Fuels Other
PROPERTY TAX IS CALENDAR YEAR; OTHERS ARE FISCAL YEAR
2013 Property Taxes reduced by State Personal Property Replacement dollars.
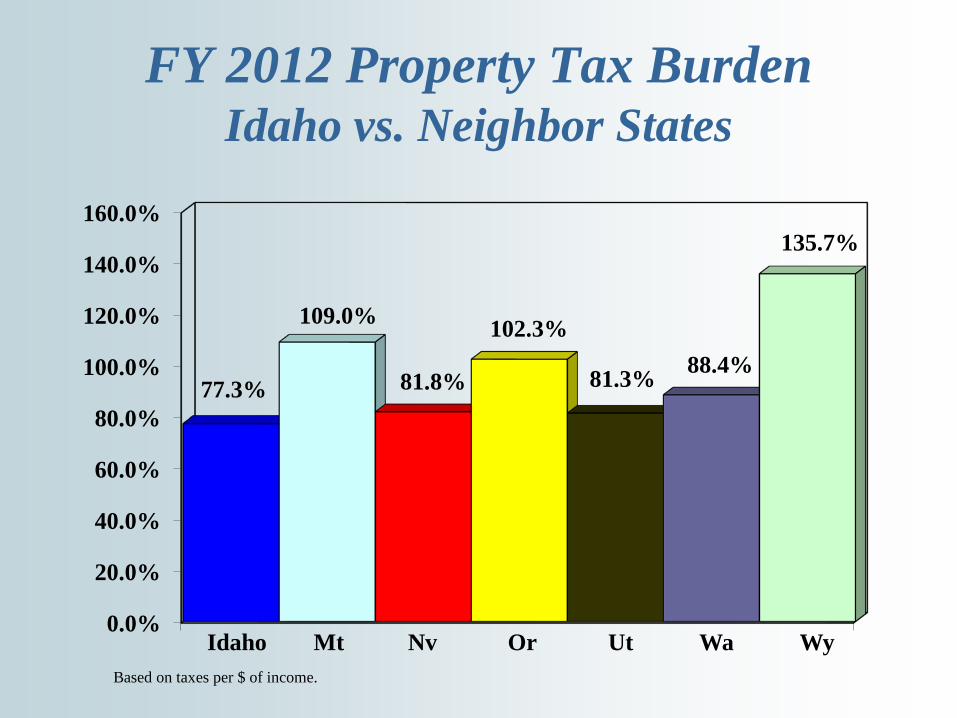
FY 2012 Property Tax Burden Idaho vs. Neighbor States
0.0%
20.0%
40.0%
60.0%
80.0%
100.0%
120.0%
140.0%
160.0%
77.3%
109.0%
81.8%
102.3%
81.3% 88.4%
135.7%
Idaho Wy Wa Ut Or Nv Mt Based on taxes per $ of income.

FY 2012 Overall Tax Burden Idaho vs. Neighbor States
0.0%
20.0%
40.0%
60.0%
80.0%
100.0%
120.0%
140.0%
160.0%
86.5% 92.0% 98.2% 96.5% 93.2% 90.7%
127.0%
Idaho Wy Wa Ut Or Nv Mt Based on taxes per $ of income.
42
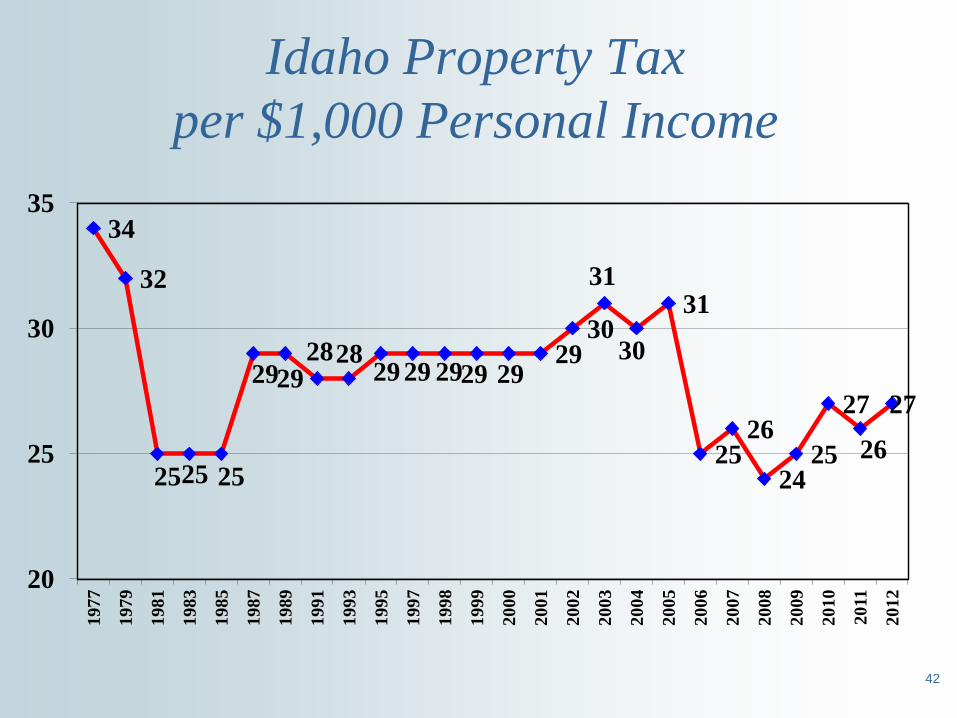
Idaho Property Tax per $1,000 Personal Income
34
32
25 25 25
29 29 28 28
29 29 29 29 29 29
30
31
30
31
25 26
24 25
27
26
27
20
25
30
35
1977
1979
1981
1983
1985
1987
1989
1991
1993
1995
1997
1998
1999
2000
2001
2002
2003
2004
2005
2006
2007
2008
2009
2010
2011
2012

43
Per Capita Property Taxes Idaho vs U.S.
$289
$246 $220 $233
$246 $267
$281 $301 $304 $308 $311 $308 $312
$307 $320
$343
$348
$355 $368 $373 $373
$385 $380
$367
$205 $204 $154 $145
$159
$180 $189
$193 $194 $202 $221 $224 $232
$232
$236 $246 $248
$250
$215
$214
$219
$225 $222 $225
$0
$50
$100
$150
$200
$250
$300
$350
$400
$450
$500
1977 1979 1981 1983 1985 1987 1989 1991 1992 1995 1997 1998 1999 2000 2002 2004 2005 2006 2007 2008 2009 2010 2011 2012
US Average Idaho
Adjusted for Inflation
Based on U.S. Census Information Amounts adjusted to January 1977
44
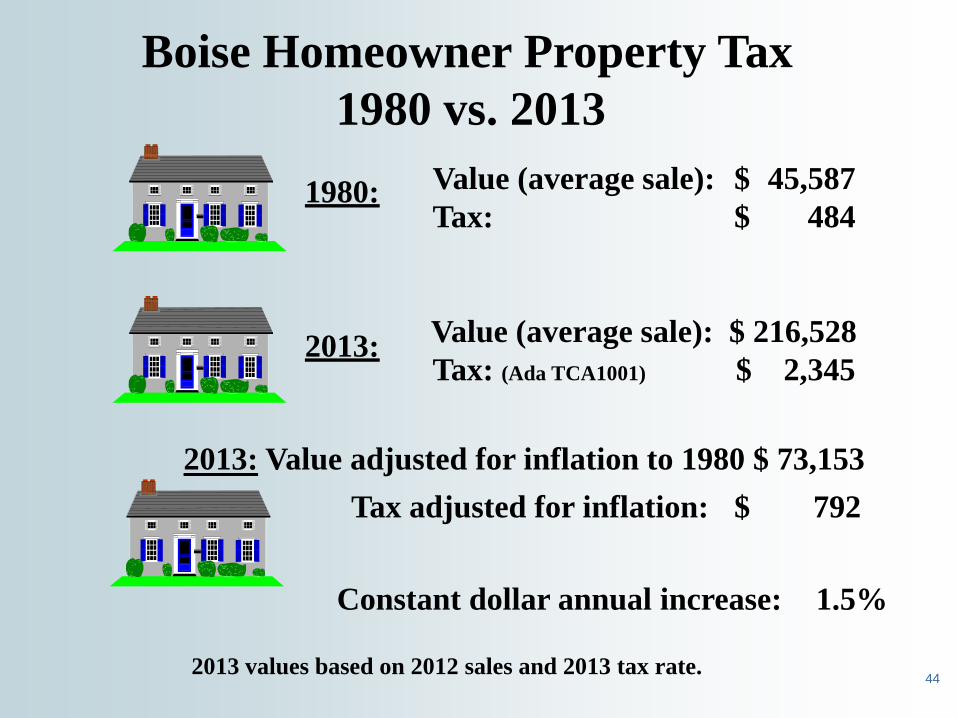
Boise Homeowner Property Tax 1980 vs. 2013
Value (average sale): $ 45,587 Tax: $ 484
Value (average sale): $ 216,528 Tax: (Ada TCA1001) $ 2,345
2013: Value adjusted for inflation to 1980 $ 73,153 Tax adjusted for inflation: $ 792
Constant dollar annual increase: 1.5%
1980:
2013:
2013 values based on 2012 sales and 2013 tax rate.
45
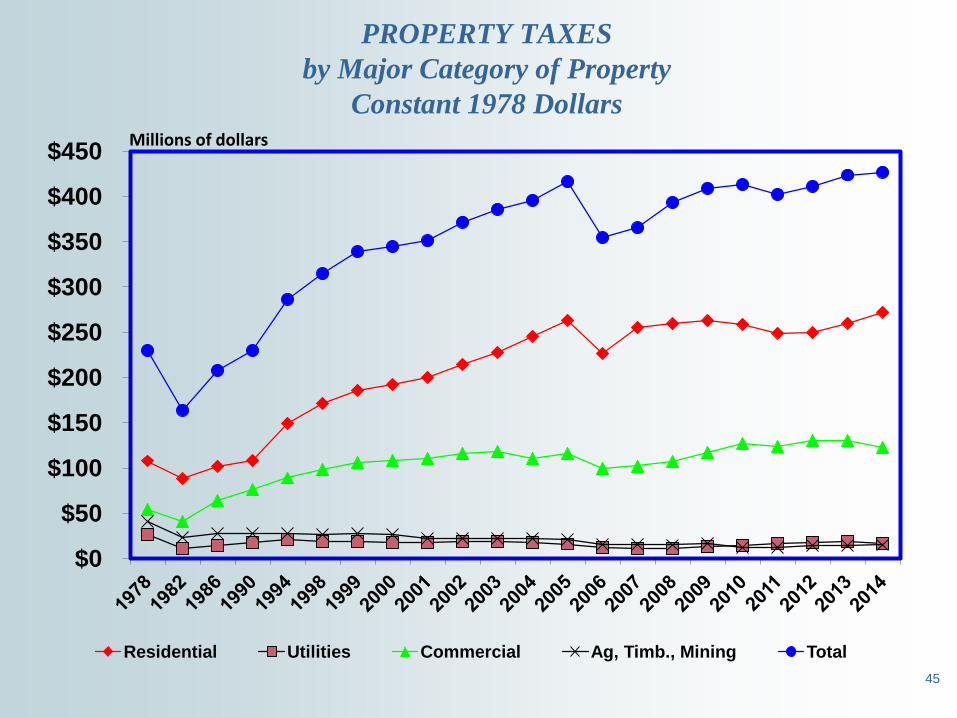
PROPERTY TAXES by Major Category of Property
Constant 1978 Dollars
$0
$50
$100
$150
$200
$250
$300
$350
$400
$450
Residential Utilities Commercial Ag, Timb., Mining Total
Millions of dollars
46
Determining Property Taxes
• Individual taxpayers • Taxing districts • Relief mechanisms
47
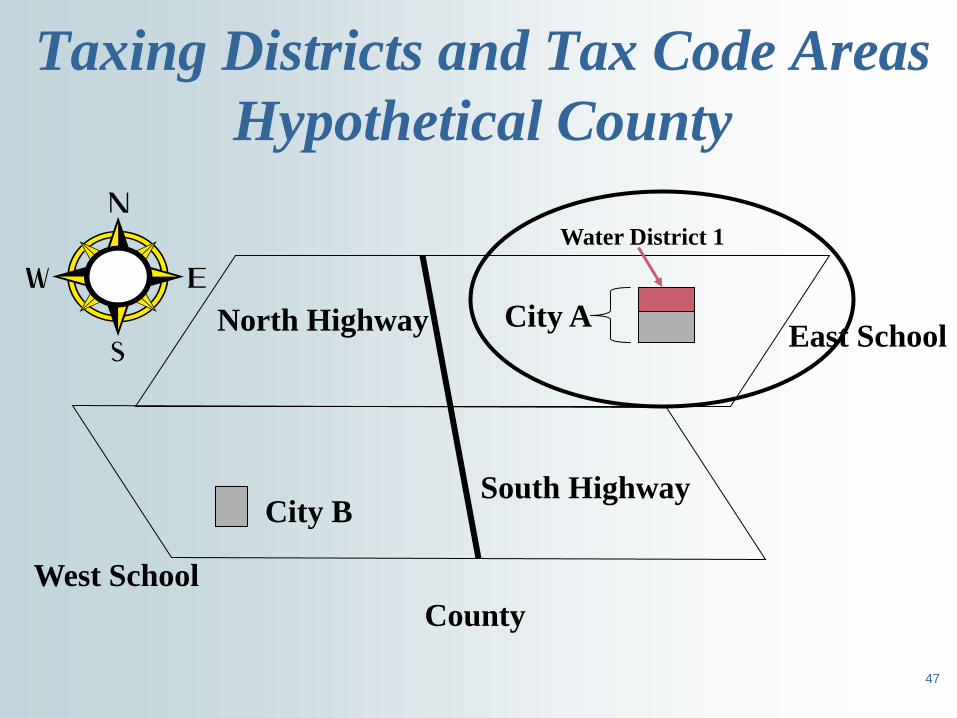
Taxing Districts and Tax Code Areas Hypothetical County
South Highway
East School City A
City B
West School
North Highway
County
Water District 1
48
Tax Code Area Detail • In the north half of City A taxpayers pay property
tax to the following taxing districts: – County – City A – East School District – North Highway District – Water District 1
• In the south half of City A taxpayers pay to the same group of districts except for Water District 1 so the property tax levy (rate) will be different.

49
How are Levy Rates Calculated? • Each property is appraised to find its market value. • All values within a taxing district (school, city, etc.) are summed. • Homeowner’s exemptions are subtracted. • The taxing district computes its property tax budget, subtracting other revenue sources. • Levy rates are required to be uniform by taxing district.
.80%or 0.008 10,000,000 $
80,000 $ :Example =
56)(0.0001234 ratelevy ($) Value Taxable
($)Budget Tax Property : =Example

50
YOUR PROPERTY TAXES How are they Calculated?
1. Levies for your taxing districts are added together: a) County b) School c) City d) Special Districts 2. The total of these levies is multiplied by your taxable value to determine your tax. Example of Computation Assume levy rate = 0.01627 (average urban primary residential rate in 2014) House Value: $ 185,000 Lot Value: $ 45,000 Total Value: $ 230,000 Less Homeowner’s Exemption: <$ 83,920> Taxable Value: $ 146,080 $ 146,080 x 0.01627 = $ 2,377
Effective tax rate (levy): $ 2,377 ÷ $ 230,000 = 1.03%
51
Limits on Property Tax • Budgets ($) • Levies (rates) • Exemptions • Tax relief measures

How do Property Tax Budget Limits Work? • Apply only to property taxes used for non-
exempt funds (mostly general operations) • Permit increases in property tax $:
– Up to 3% over highest of last three years • Including ag. equipment and other replacement
monies – Plus new construction value X 2013 non-
exempt levy rate – Plus foregone amount (ie: amount of
previously allowable increases not taken) • Allowed only if result does not create levy
rate that exceeds statutory limit 52
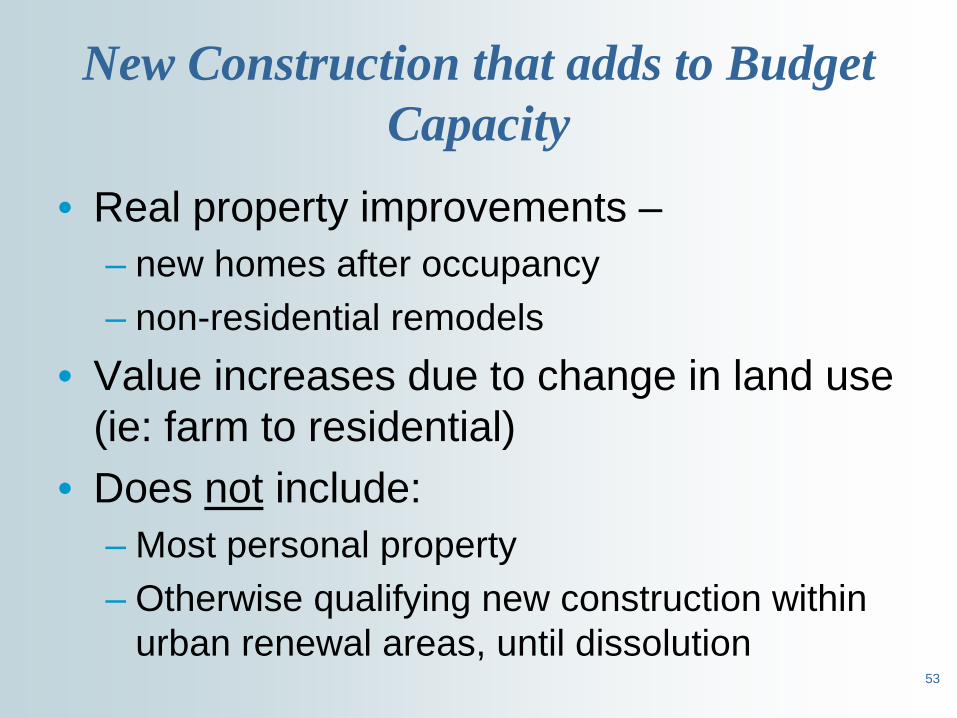
• Real property improvements – – new homes after occupancy – non-residential remodels
• Value increases due to change in land use (ie: farm to residential)
• Does not include: – Most personal property – Otherwise qualifying new construction within
urban renewal areas, until dissolution
53
New Construction that adds to Budget Capacity
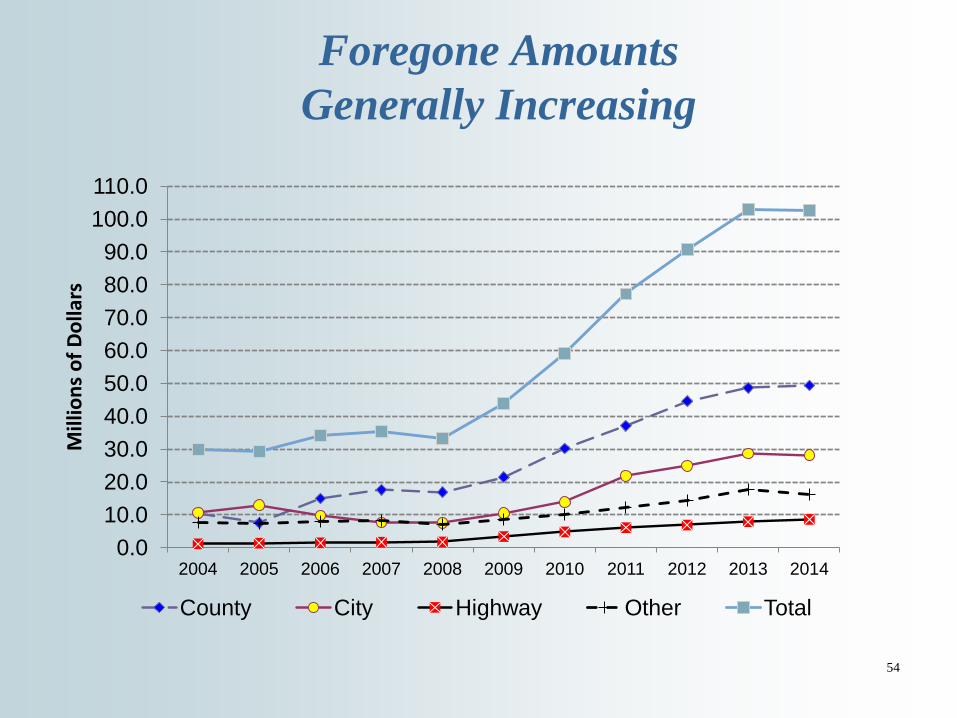
Foregone Amounts Generally Increasing
0.0 10.0 20.0 30.0 40.0 50.0 60.0 70.0 80.0 90.0
100.0 110.0
2004 2005 2006 2007 2008 2009 2010 2011 2012 2013 2014
Mill
ions
of D
olla
rs
County City Highway Other Total
54

55
So, What Happens When Values of Existing Property Increase?
Value $ Value $
56
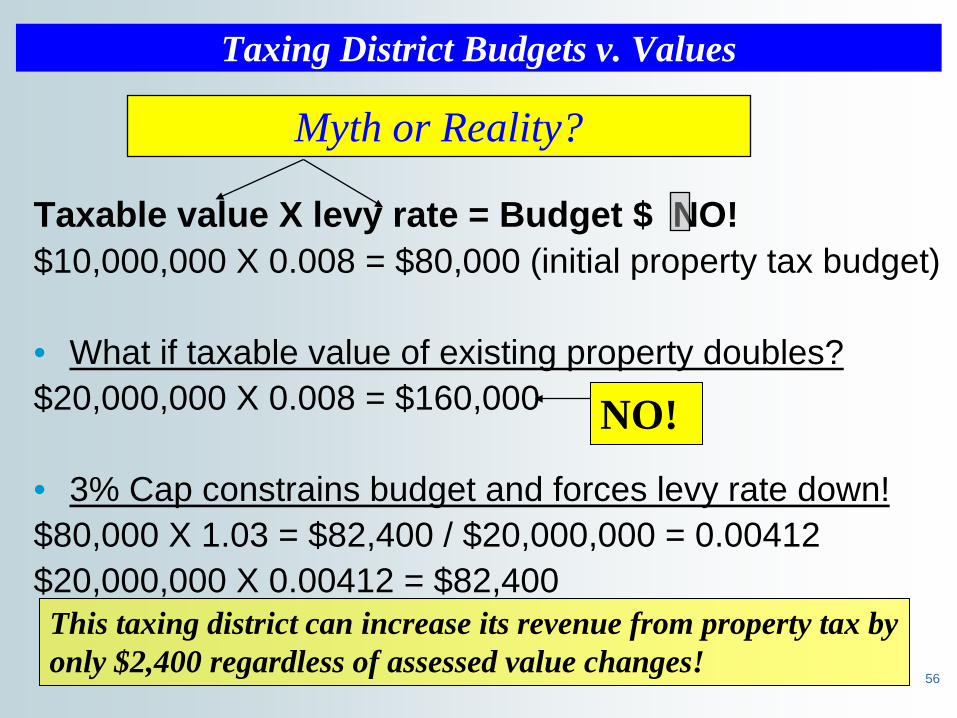
Taxing District Budgets v. Values
Taxable value X levy rate = Budget $ NO! $10,000,000 X 0.008 = $80,000 (initial property tax budget) • What if taxable value of existing property doubles? $20,000,000 X 0.008 = $160,000 • 3% Cap constrains budget and forces levy rate down! $80,000 X 1.03 = $82,400 / $20,000,000 = 0.00412 $20,000,000 X 0.00412 = $82,400
NO!
This taxing district can increase its revenue from property tax by only $2,400 regardless of assessed value changes!
Myth or Reality?

57
So what does this mean for an individual taxpayer?
• Given $100,000 in taxable value before values increased: – $100,000 X 0.008 = $800
• Possibilities: – Each property value doubles
• $200,000 X 0.00412 = $824 (a three percent increase)
– Some properties increase more in value than others • The new levy rate (0.00412) applies to all equally. • Properties with more rapidly increasing values will have
more than a three percent increase in taxes; properties with less value increase will have less than a three percent increase in taxes

58
What happens to individual taxpayers in this system?
• Valuation system determines proportion of property tax paid by each
• Increases and decreases in valuation change these proportions
• Exemptions alter proportions, shifting property tax between taxpayers, unless replacement money is provided • Agricultural equipment exemption • Future partial personal property exemption
59
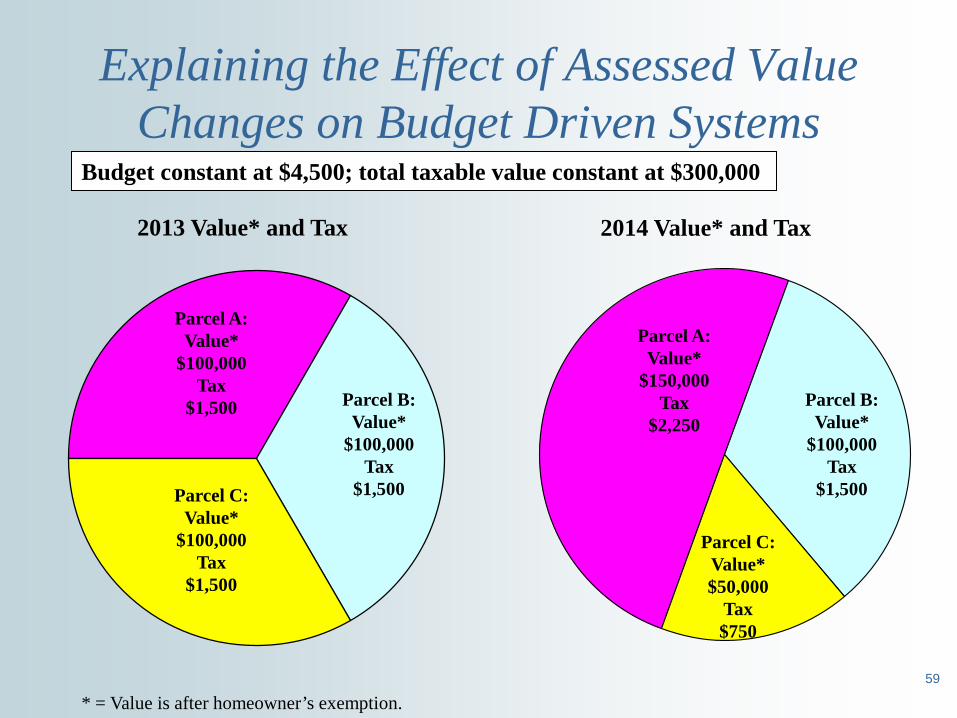
Explaining the Effect of Assessed Value Changes on Budget Driven Systems
Parcel A: Value*
$100,000 Tax
$1,500
Budget constant at $4,500; total taxable value constant at $300,000
2013 Value* and Tax 2014 Value* and Tax
Parcel B: Value*
$100,000 Tax
$1,500 Parcel C: Value*
$100,000 Tax
$1,500
Parcel A: Value*
$150,000 Tax
$2,250 Parcel B:
Value* $100,000
Tax $1,500
Parcel C: Value* $50,000
Tax $750
* = Value is after homeowner’s exemption.
60
The Economy and its Effect on Property Tax Budgets and Levies
• Foreclosure related sales may be considered (cautiously) in setting market value for assessment purposes: – May influence general market – May not be representative due to deteriorated
property condition • If values decline and property tax budget is unchanged
tax levy rate will go up. However, the rate cannot exceed levy rate limits.
• Timing: – Values set to reflect January 1, 2014 market value. – If values have declined during 2014, effects will be seen
with respect to 2015 market value and levy rates.
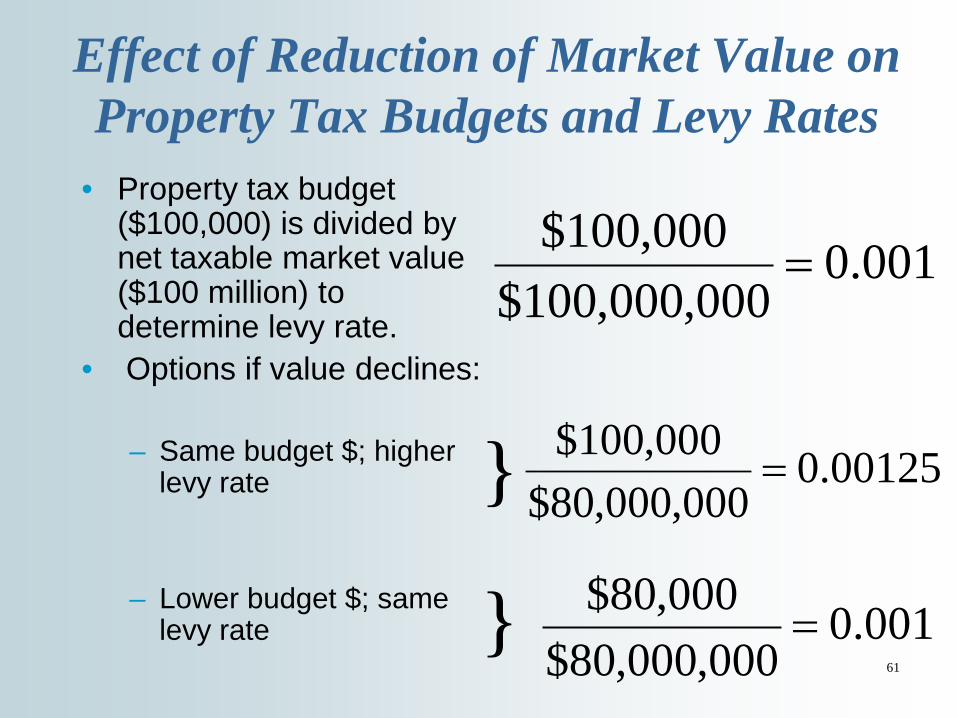
Effect of Reduction of Market Value on Property Tax Budgets and Levy Rates
• Property tax budget ($100,000) is divided by net taxable market value ($100 million) to determine levy rate.
• Options if value declines:
– Same budget $; higher levy rate
– Lower budget $; same
levy rate
001.0000,000,100$
000,100$=
00125.0000,000,80$
000,100$=
001.0000,000,80$
000,80$=
}
} 61

62
Tax Shifting Between Categories (assuming $ amount levied unchanged)
Type of Property
2013 Taxes ($million)
2014 Taxes ($million)
% change in Value
% change in Taxes
Residential 10.0 9.680 - 12.0 - 3.20
Commercial 10.0 10.175 - 7.5 + 1.75
Farmland 2.0 2.145 - 2.5 + 7.25
Total 22.0 22.000 - 10.0 ± 0.0
Given: 2013 tax rate = 1% for total property taxes of $22 million
Same $ amount certified from property tax in 2014; levy rate changes to 1.1%

63
Property Tax Levies and Tax Effects - Individual Taxpayers
Budget ÷ Value = Levy (rate) $22 Million tax ÷ $2,200 Million value = 0.01 levy Tax on $100,000 value property: 0.01 X $100,000 = $1,000 If total value declines to $2,000 Million: $22 Million tax ÷$2,000 Million value = 0.011 Tax on $100,000 (2013) given different value changes for
2014: Value stays same: 0.011 X $100,000 = $1,100 Value down 10%: 0.011 X $ 90,000 = $ 990

64
Altering the Burden of Property Taxes – Exemptions, Incentives, and Property
Tax Relief • Exemptions –
– Grant relief to particular type of taxpayer based on ownership (government, religious foundation, etc.) or use (non-profit educational, agricultural equipment, etc.)
– May be funded if state replaces revenue – Otherwise taxes shift to non-exempt property through
higher levy rates
65
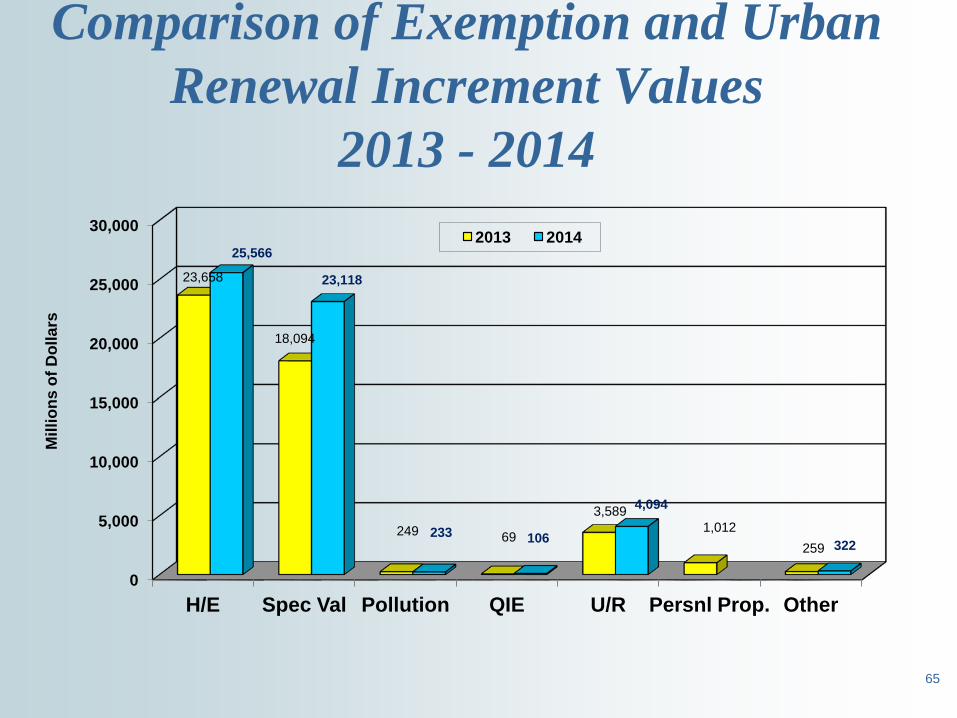
Comparison of Exemption and Urban Renewal Increment Values
2013 - 2014
0
5,000
10,000
15,000
20,000
25,000
30,000
H/E Spec Val Pollution QIE U/R Persnl Prop. Other
23,658
18,094
249 69
3,589 1,012
259
25,566
23,118
233 106
4,094
322
Mill
ions
of D
olla
rs
2013 2014

66
Tax Increment Financing an economic incentive involving property tax
• Permits allocation of property taxes to urban renewal agency (URA) in specified areas
• Often used to help provide infrastructure: – Parking garages – Sewer and water lines – Street improvements
• Properties within these areas still pay taxes at prevailing rate, but money is not passed on to local taxing districts – Beginning in 2008, URAs no longer derive
revenue from most voter approved levies and certain judgments against taxing districts.
67
The Exemption Spiral
Exemptions lead to high property tax rates, which in turn results in new pressure for exemptions, which in turn…
Tax Base: Tax Rate:

68
Tax Shifting Through Exemption
• Given: Tax Base originally $500 Million – $200 Million residential taxable value – $50 Million farmland taxable value – $150 Million commercial taxable value – $100 Million industrial taxable value
• Tax Revenue needed by taxing districts – $5 Million – Levy Rate = $5 Million / $500 Million = 0.01 = 1%

69
Tax Shifting Through Exemption (continued)
• Hypothetical new exemption – Will reduce industrial property value by 50% – Will not change any other property taxable
value • Taxing districts budgets increase 3% to
$5,150,000 in year 2 (following implementation of new exemption)
• There is no new construction or any other value or exemption amount change

70
Tax Shifting Through Exemption (continued)
• Tax Base (taxable value) in year 2 (following implementation of new exemption) = $450 Million – $200 Million residential taxable value – $ 50 Million farmland taxable value – $150 Million commercial taxable value – $ 50 Million industrial taxable value
• Tax Rate in year 2 – $5,150,000 / $450 Million = .0114 = 1.14% – Without new exemption tax rate in year 2
• $5,150,000 / $500 Million = .0103 = 1.03%
71
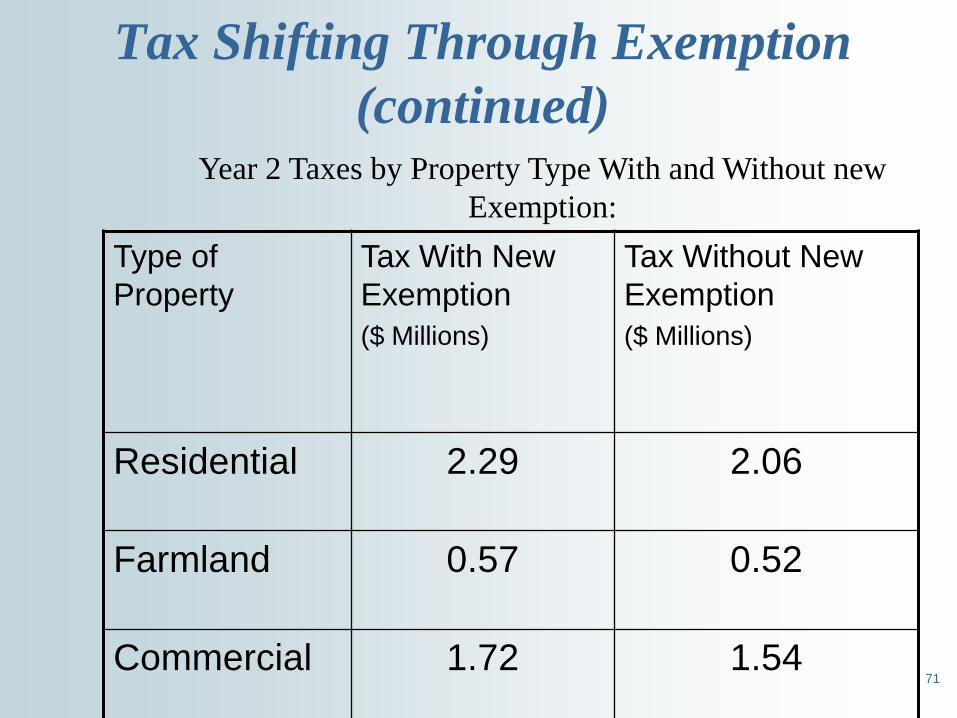
Tax Shifting Through Exemption (continued)
Type of Property
Tax With New Exemption ($ Millions)
Tax Without New Exemption ($ Millions)
Residential 2.29 2.06
Farmland 0.57 0.52
Commercial 1.72 1.54
Year 2 Taxes by Property Type With and Without new Exemption:

72
Property Tax Relief Measures
• State or local funds dedicated to reducing property tax – May be related to use – ie: appropriation to community
colleges including statement of reduction of property tax; – May be related to taxpayer circumstances – ie: circuit
breaker property tax relief for lower income, elderly, and disabled.
– May be indirectly related – distribution of state sales tax partly based on business inventory property values existing prior to business inventory exemption.
– In past, may have been related to local option sales taxes - 1/2 of $ raised had to be for property tax replacement (last one has expired along with authorizing legislation)

73
Circuit Breaker (Property Tax Reduction Program)
• Up to $1,320 credit for eligible homeowners: – Over age 65, disabled, widows and widowers – Income up to $28,700. (received in 2013, after medical expenses) – Income limit increases for 2015 program to $29,100 rec’d. 2014
• Must annually apply with county assessor by April 15th. • 2014 claims
– 27,365 approved in 2014 – $ 596 tax relief per claim average (2014) – $ 16.3 Million paid by state to counties for taxing districts (2014) – Many more eligible based on Census data
• State funded, so no loss of revenue to any taxing district. • Not an exemption, so no property tax shifted to other property
taxpayers. • Not subject to repayment!
74
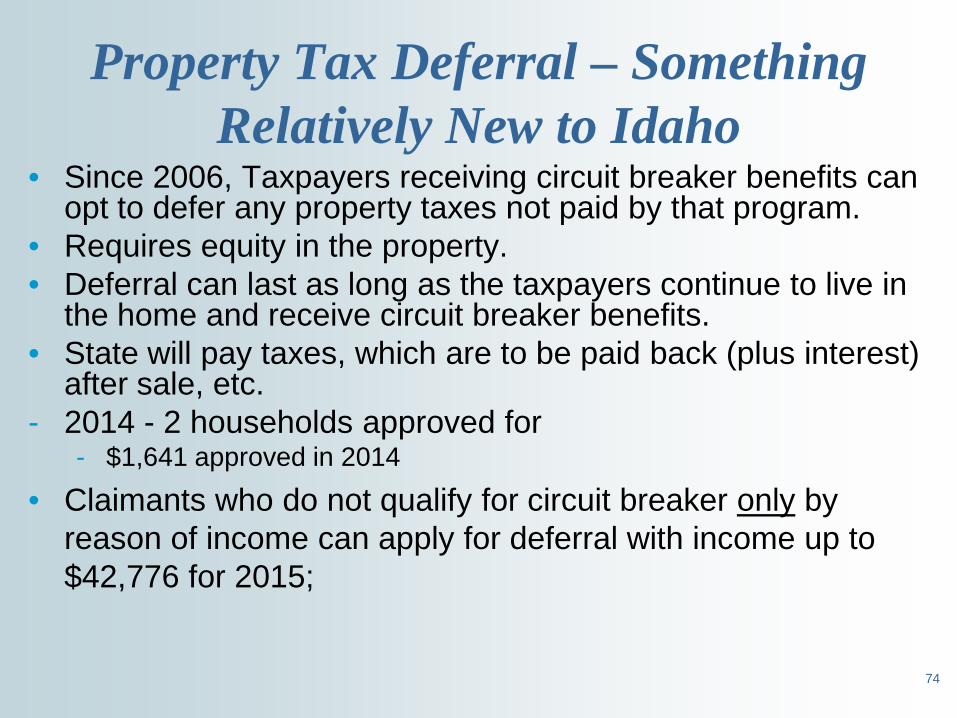
Property Tax Deferral – Something Relatively New to Idaho
• Since 2006, Taxpayers receiving circuit breaker benefits can opt to defer any property taxes not paid by that program.
• Requires equity in the property. • Deferral can last as long as the taxpayers continue to live in
the home and receive circuit breaker benefits. • State will pay taxes, which are to be paid back (plus interest)
after sale, etc. - 2014 - 2 households approved for
- $1,641 approved in 2014
• Claimants who do not qualify for circuit breaker only by reason of income can apply for deferral with income up to $42,776 for 2015;
Glossary
75
Common definitions adapted from the Glossary for Property and Assessment published by the IAAO (International Association of Assessing Officers) • “Property” – Is an aggregate of things or rights to
things. These rights are protected by law so property is the legal interest of an owner in a parcel or thing. There are two basic types of property: real and personal.
• “Real Property” – land plus anything permanently attached to the land; (by Idaho law, includes improvements, buildings and structures).
• “Personal Property” - every kind of property that is not real property and is moveable without damage to itself or the real property. There are two basic types of personal property: tangible and intangible.
76

Common definitions adapted from the Glossary for Property and Assessment published by the IAAO
• “Tangible Personal Property” – Personal property that has a substantial physical presence beyond merely representational. Common examples are automobiles, boats, and jewelry.
• “Intangible Personal Property” – Property that has no physical presence beyond merely representational. Its value lies chiefly in what it represents. Examples include corporate stock, bonds, money on deposit, goodwill, patents and trademarks, and franchises. Intangible personal property generally is exempt.
77
Definition from Idaho’s Property Tax Code "Operating property" means real and personal property operated in connection with any public utility, railroad or private railcar fleet, wholly or partly within this state, and which property is necessary to the maintenance and operation of the public utility, railroad or private railcar fleet, and the roads or lines thereof, and includes all rights-of-way accompanied by title; roadbeds; tracks; pipelines; bargelines; equipment and docks; terminals; rolling stock; equipment; power stations; power sites; lands; reservoirs, generating plants, transmission lines, distribution lines and substations; and all title and interest in such property, as owner, lessee or otherwise.
78
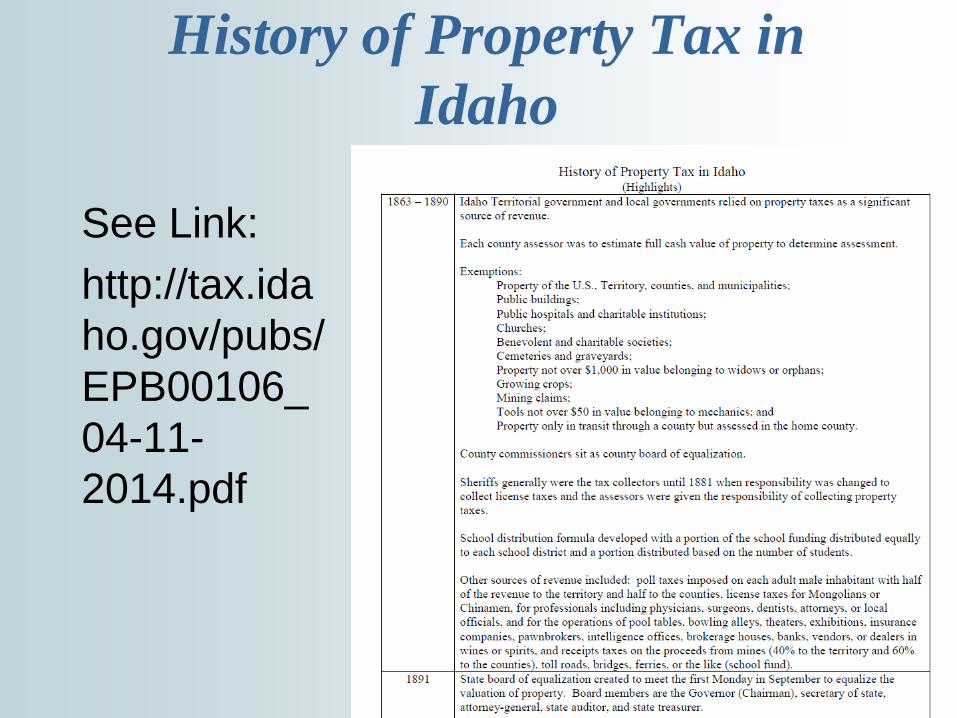
History of Property Tax in Idaho
See Link: http://tax.idaho.gov/pubs/EPB00106_04-11-2014.pdf
79