alaska obesity facts reportdhss.alaska.gov/.../documents/obesity/pubs/2017alaskaobesityfact… ·...
TRANSCRIPT

Alaska Obesity Facts
Published October 2017
Publication Date: October 2017
State of Alaska Bill Walker, Governor
Department of Health and Social Services Valerie Davidson, Commissioner
Section of Chronic Disease Prevention and Health Promotion Obesity Prevention and Control Program
3601 C Street, Suite 722, Anchorage AK 99503 907.269.2020
[email protected]/dph/chronic/obesity/
Copyright Information: All material in this document is in the public domain and may be reproduced or copied without permission; citation as
to source, however, is appreciated.
Suggested Citation: http://www.hss.state.ak.us/dph/chronic/obesity/pubs/2017AlaskaObesityFacts.pdf
Cover Photo Credits: Center image of a bowl of blueberries freshly picked, credit: Steve Hillebrand/USFWS. Top left image of young elementary age girl in cafeterria eating a healthy lunch, credit: CDC/Amanda Mills.
Bottom center image of boys on bikes and bottom right image of family snowshoeing Hatcher Pass are used with permission from Play Every Day.
ALASKA DIVISION OFPublic Health
Preve
ntion Promotion Protection
STATE of ALASKA
Department of Health and So
cia
l Ser
vice
s
Alaska Obesity Prevention & Control Program
Alaska
Obesity Facts
Report
2017
Bill Walker, Governor Valerie Davidson, Commissioner, Department of Health and Social Services Jay C. Butler, Director, Division of Public Health Tari O’Connor, MSW, Section Chief, Chronic Disease Prevention & Health Promotion
Suggested Citation: Alaska Department of Health and Social Services. Alaska Obesity Facts Report – 2017. Anchorage, Alaska: Section of Chronic Disease Prevention and Health Promotion, Division of Public Health, Alaska Department of Health and Social Services; October 2017.
Copyright Information: All material in this document is in the public domain and may be reproduced or copied without permission; citation as to source, however, is appreciated.
Alaska Obesity Facts Report
Alaska Obesity Facts Report Page 2
Acknowledgements
The Alaska Obesity Facts Report was produced for the Obesity Prevention and Control Program, Section of Chronic Disease Prevention and Health Promotion, Division of Public Health, Alaska Department of Health and Social Services by Program Design and Evaluation Services, Multnomah County Health Department and Oregon Public Health Division.
Major contributors to the development of this report include:
Lindsay Hixson, PhD, Program Design and Evaluation Services Myde Boles, PhD, Program Design and Evaluation Services Andrea Fenaughty, PhD, Deputy Section Chief, Chronic Disease Prevention and Health
Promotion Karol Fink, MS, RDN, Program Manager, Obesity Prevention and Control Program Lauren Kelsey, MPH, School Partnership Coordinator, Obesity Prevention and Control Program We would like to acknowledge the following individuals and organizations for their contributions to this report:
Alaska Department of Health and Social Services Division of Public Health Section of Chronic Disease Prevention and Health Promotion
Wendy Hamilton, Alaska School Health Program Manager Diane Peck, MPH, RDN, Public Health Nutritionist, Obesity Prevention and
Control Program Aulasa Liendo, MA, MPH, Alaska BRFSS Coordinator Kate Oliver, Alaska YRBS Coordinator Charles Utermohle, PhD, Programmer/Analyst
Section of Women’s Children’s and Family Health Kathy Perham-Hester, MS, MPH, PRAMS Coordinator Margaret B. Young, MPH, CUBS Coordinator

Alaska Obesity Facts Report Page 3
Alaska School Districts
Anchorage School District Deena Bishop, Superintendent John Garrity, Senior Director, Health Services All the ASD school nurses
Dillingham City School District
Danny Frazier, Superintendent Gina Carpenter, Public Health Nurse
Kenai Peninsula School District
Sean Dusek, Superintendent Carmen Magee, Health Services Coordinator All the KPBSD school nurses
Ketchikan Gateway Borough School District
Robert Boyle, Superintendent Emily Henry, Wellness Coordinator All the KGBSD school nurses and public health nurses
Kodiak Island Borough School District
Larry LeDoux, Superintendent Christy Kinter, School Nurse All the KIBSD school nurses
Matanuska-Susitna Borough School District Monica Goyette, Superintendent Krista Grilliot, Health Services Coordinator All the MSBSD school nurses
Nome Public Schools
Shawn Arnold, Superintendent All the Nome public health nurses
North Slope Borough School District
Peggy Cowan, Superintendent Brian Freeman, Coordinator of Grants and Partnerships All the NSBSD school nurses and public health nurses
Petersburg School District
Erica Kludt-Painter, Superintendent Ginger Evens, Wellness Coordinator All the Petersburg public health nurses
Sitka School District
Mary Wegner, Superintendent Cassee Olin, Business Manager All the SSD school nurses

Alaska Obesity Facts Report Page 4
Contents
Acknowledgements ........................................................................................................................................ 2
Table of Figures .............................................................................................................................................. 6
I. INTRODUCTION ................................................................................................................................................... 8
Report Highlights ........................................................................................................................................ 9
Classifying Overweight and Obesity ......................................................................................................... 10
II. ECONOMIC COSTS OF OBESITY ....................................................................................................................11
III. ADULTS ..................................................................................................................................................................12
A. Adult Weight Status ................................................................................................................................. 12
B. Adult Physical Inactivity ............................................................................................................................ 16
C. Adult Nutrition .......................................................................................................................................... 18
D. Healthcare Provider Advice ...................................................................................................................... 23
IV. CHILDREN AND ADOLESCENTS .....................................................................................................................25
A. Weight Status of Children and Adolescents ............................................................................................. 25
B. Physical Inactivity among Children and Adolescents ............................................................................... 31
C. Nutrition among Children and Adolescents ............................................................................................. 34
V. BREASTFEEDING ................................................................................................................................................38 VI. ATTITUDES AND OPINIONS .............................................................................................................................40
VII. SCHOOL-BASED STRATEGIES/INTERVENTIONS ......................................................................................43
VIII. DISPARITIES IN OBESITY, NUTRITION, AND PHYSICAL ACTIVITY ..................................................44
Race .......................................................................................................................................................... 44
Markers of Socio-Economic Status ........................................................................................................... 44
A. Disparities by Race Groups ....................................................................................................................... 45
B. Disparities by Socioeconomic Factors ...................................................................................................... 50
IX. DATA SOURCES ...................................................................................................................................................55
Behavioral Risk Factor Surveillance System (BRFSS) .................................................................................... 55
Selection of BRFSS Survey Participants .................................................................................................... 55
Data Weighting and Methods .................................................................................................................. 56
Reporting by Socio-Economic Status (SES) ............................................................................................... 57
Reporting by Race Group .......................................................................................................................... 57
Regional Reporting ................................................................................................................................... 58
Alaska Obesity Facts Report Page 5
Childhood Understanding Behaviors Survey (CUBS) .................................................................................... 59
Pregnancy Risk Assessment Monitoring System (PRAMS) ........................................................................... 60
School Health Profiles ................................................................................................................................... 60
Student Weight Status Surveillance System (SWSSS) .................................................................................. 60
Youth Risk Behavior Survey (YRBS) ............................................................................................................... 61
Selection of YRBS Survey Participants ...................................................................................................... 61
Data Weighting and Methods .................................................................................................................. 61
Reporting by Race Group .......................................................................................................................... 62
Women, Infants and Children (WIC) Nutrition Program .............................................................................. 63

Alaska Obesity Facts Report Page 6
Table of Figures
Figure 1: Alaska Medicaid Spending Projection Attributable to Obesity (in Millions), Assuming Increase in Obesity Prevalence ..................................................................................................................................... 11
Figure 2: Trend in Prevalence of Overweight/Obesity (BMI ≥ 25.0), by Sex, Alaska Adults, 1991-2015 . 12
Figure 3: Trend in Prevalence of Obesity (BMI ≥ 30.0), Alaska Adults, 1991-2015 .................................. 13
Figure 4: Trend in Prevalence of Overweight (BMI 25.0-<30.0), Alaska Adults, 1991-2015 ..................... 14
Figure 5: Weight Status, Alaska Adults, 2015 ............................................................................................ 15
Figure 6: Prevalence of Not Meeting Physical Activity Recommendations, by Sex, Alaska Adults, 2015 . 16
Figure 7: Number of Hours of Screen Time* Per Day, Alaska Adults, 2015 .............................................. 17
Figure 8: Prevalence of Consuming Less Than 2 Fruit Servings and 3 Vegetable Servings Daily, Alaska Adults, 2015 ................................................................................................................................................ 18
Figure 9: Number of Sugary Drinks (Cans/Glasses) Consumed Per Day, Alaska Adults, 2015 ................... 19
Figure 10: Prevalence of Local Food Activities, Alaska Adults, 2014 ......................................................... 21
Figure 11: Percentage of Alaska Adults Advised by a Healthcare Provider about Their Eating Habits, Alaska Adults, 2014 ................................................................................................................................................ 23
Figure 12: Percentage of Alaska Adults Advised by a Healthcare Provider about Their Physical Activity, Alaska Adults, 2015 .................................................................................................................................... 24
Figure 13: Trend in Prevalence of Overweight/Obesity (≥85th percentile) Alaska High School Students, 2003-2015 ................................................................................................................................................... 25
Figure 14: Trend in Prevalence of Obesity (≥95th percentile) Alaska High School Students, 2003-2015 .. 26
Figure 15: Trend in Prevalence of Overweight (85th to 95th percentile), Alaska High School Students, 2003-2015 ............................................................................................................................................................ 27
Figure 16: Weight Status, Alaska High School Students, 2015 .................................................................. 28
Figure 17: Prevalence of Overweight and Obese Alaska Students K-8th (BMI ≥ 85th percentile), by School District and Healthy Alaskans 2020 Indicator, 2014-15 & 2015-16 ............................................................ 29
Figure 18: Prevalence of Early Childhood Obesity (BMI ≥ 95th Percentile) and Overweight/Obesity (BMI ≥ 85th Percentile), Young Alaska Children, by Select Programs/Surveys, 2014 & 2015 ............................... 30
Figure 19: Prevalence of Not Meeting Physical Activity Recommendations (60 Minutes Daily), by Sex, Alaska High School Students, 2015............................................................................................................. 31
Figure 20: Number of Hours of Screen Time* per Day not for School Work, Alaska High School Students, 2015 ........................................................................................................................................................... 32
Figure 21: Amount of TV, Videos, Movies, or Playing Video Games On a Given Day among 3-Year-Olds, Alaska, 2015 ................................................................................................................................................ 33
Alaska Obesity Facts Report Page 7
Figure 22: Prevalence of Consuming Less Than 2 Fruit Servings and 3 Vegetable Servings Daily, Alaska High School Students, 2015 ................................................................................................................................ 34
Figure 23: Prevalence of Drinking 1 or More Sugary Drinks Daily, by Sex, Alaska High School Students, 2015 .................................................................................................................................................................... 35
Figure 24: Any Consumption of Various Sugary Drinks by 3-YearOlds on a Given Day, by Region, Alaska, 2013-2015 ................................................................................................................................................... 36
Figure 25: Usual Type of Milk Drank, Alaska 3-Year-Olds, 2015 ................................................................ 37
Figure 26: Trend in Prevalence of Breastfeeding Initiation and Duration at 4-Weeks and 8-Weeks Postpartum, Alaska Women Delivering a Live Birth, 1991-2014 ............................................................... 38
Figure 27: Alaska Adults’ Opinions on the #1 Health Issue for Alaska’s Children, 2014 ............................ 40
Figure 28: Percentage Who Believe Each Source Has Some or a Lot of Responsibility for Addressing Obesity in the US, Alaska Adults, 2012 .................................................................................................................... 41
Figure 29: Percentage Who Strongly or Somewhat Support Each Obesity-Prevention Strategy, Alaska Adults, 2012 and 2014 ............................................................................................................................................ 42
Figure 30: Trend in Percentage of Schools in Which Students Can Purchase Chocolate, Candy and Salty Snacks, Alaska Secondary Schools, 2002-2016 ........................................................................................... 43
Figure 31: Trend in Prevalence of Obesity (BMI ≥ 30.0), by Race, Alaska Adults, 1991-2015 .................. 45
Figure 32: Obesity and Selected Nutrition Indicators by Race, Alaska Adults, 2015 ................................ 46
Figure 33: Obesity and Selected Nutrition Indicators by Race, Alaska High School Students, 2015 ........ 47
Figure 34: Obesity and Selected Physical Activity Indicators by Race, Alaska Adults, 2015 .................... 48
Figure 35: Obesity and Selected Physical Activity Indicators by Race, Alaska High School Students 201549
Figure 36: Obesity by Education and Household Percent of Poverty Guideline Status (PGL), Alaska Adults, 2015 ............................................................................................................................................................ 50
Figure 37: Obesity and Selected Nutrition Indicators by Education Status, Alaska Adults, 2015 ............. 51
Figure 38: Obesity and Selected Nutrition Indicators by Household Percent of Poverty Guideline Status, Alaska Adults, 2015 .................................................................................................................................... 52
Figure 39: Obesity and Selected Physical Activity Indicators by Education Status, Alaska Adults, 2015 .. 53
Figure 40: Obesity and Selected Physical Activity Indicators by Household Percent of Poverty Guideline Status, Alaska Adults, 2015 ........................................................................................................................ 54
Alaska Obesity Facts Report Page 8
I. Introduction
Overweight and obesity continue to be a serious health concern in Alaska. About 2 out of every 3 Alaska adults are now overweight or obese. Overweight and obesity affect individuals of all ages, from all areas of the state, of all racial and ethnic backgrounds, and with all levels of education and income. Both conditions increase the risk for a number of health problems, including chronic diseases, which can lead to reduced quality of life and premature death.1
The causes for the rapid rise of overweight and obesity are multiple and varied, and no single strategy alone will reduce obesity and its associated health consequences. Meaningful reduction of obesity prevalence will only occur when a set of sustained, comprehensive prevention strategies are implemented by schools, the health care sector, private industry, NGOs, governmental agencies, and individual families. These strategies will need to address policy issues; alter the environment in which we live, play and eat; modify the systems to make the healthy choice the easy choice; and increase the knowledge and change the behaviors of families, children and adults.1,2
In an effort to support obesity prevention efforts statewide, we have created this report as a way of succinctly communicating the most commonly requested information regarding obesity and overweight in Alaska. Data are presented on obesity prevalence as well as markers for physical activity and nutrition risk behaviors identified by the Centers for Disease Control and Prevention (CDC). Data also include information on behavior, attitudes and strategies that could support healthy living and help prevent obesity.
Healthy Alaskans 2020 is the comprehensive health improvement plan aligning public health partners around 25 health priorities and promoting improvement of health status and systems. Healthy Alaskans 2020 targets are included in this report for reference when they relate to obesity or obesity-related behaviors.
Those interested in more information are encouraged to access the Obesity Prevention and Control Program’s Publications and Materials webpage http://dhss.alaska.gov/dph/Chronic/Pages/Obesity/resources.aspx, which houses additional data reports, fact sheets, contacts, and other resources.
1 U.S. Department of Health and Human Services. The Surgeon General’s call to action to prevent and decrease overweight and obesity. [Rockville, MD]: U.S. Department of Health and Human Services, Public Health Service, Office of the Surgeon General; [2001]. Available from: U.S. GPO, Washington. Accessed at https://www.ncbi.nlm.nih.gov/books/NBK44206/, June 2017. 2 U.S. Department of Health and Human Services. The Surgeon General's Vision for a Healthy and Fit Nation. Rockville, MD: U.S. Department of Health and Human Services, Office of the Surgeon General, January 2010. Accessed at https://www.ncbi.nlm.nih.gov/books/NBK44660/, June 2017.

Alaska Obesity Facts Report Page 9
Report Highlights
• Obesity costs Alaska almost $460 million each year for just the direct medical healthcare costs. This financial burden will only increase as Alaska’s population ages and healthcare costs increase.
• Among Alaska adults: o The prevalence of obesity has more than doubled from 13% in 1991 to 30% in 2015 o 1% are underweight, 32% are at a healthy weight, 37% are overweight, and 30% are
obese; 67% are either overweight or obese o 76% do not get the recommended amount of physical activity o 71% spend 2 or more hours in front of a screen each day o 88% are eating less than 2 daily servings of fruit and 3 daily servings of vegetables o 23% drink 1 or more sugary drinks each day o 96% of mothers initiate breastfeeding upon birth; 81% continue through 8 weeks
postpartum o 41% of Alaska adults identify obesity and related risk factors as the most important
health issue facing Alaska’s youth o A majority believe government has some responsibility for addressing obesity, and 76%
support a government-funded obesity prevention media campaigns o Alaska Native adults and adults with less education are more likely to be obese and less
likely to meet nutrition and physical activity recommendations for good health • Among Alaska high school students:
o 14% are obese and 17% are overweight; about one-third of high school students (31%) are either overweight or obese
o 79% do not get the recommended 60 minutes of daily physical activity o 90% are eating less than the recommended daily servings of fruit and vegetables o 46% drink 1 or more sugary drinks per day o 53% spend 3 or more hours per day watching TV, playing video or computer games
• Among Alaska Students in Kindergarten through 8th grade: o The prevalence of overweight and obesity ranges from 32% to 53% in 10 school districts
across the state • Among Alaska 3-Year-Olds:
o 21% are obese and 36% are either overweight or obese o 44% watch more than 2 hours of TV, videos, movies, or play video games daily o Only 13% are drinking the recommended types of milk: 1% (low fat) or skim
Alaska Obesity Facts Report Page 10
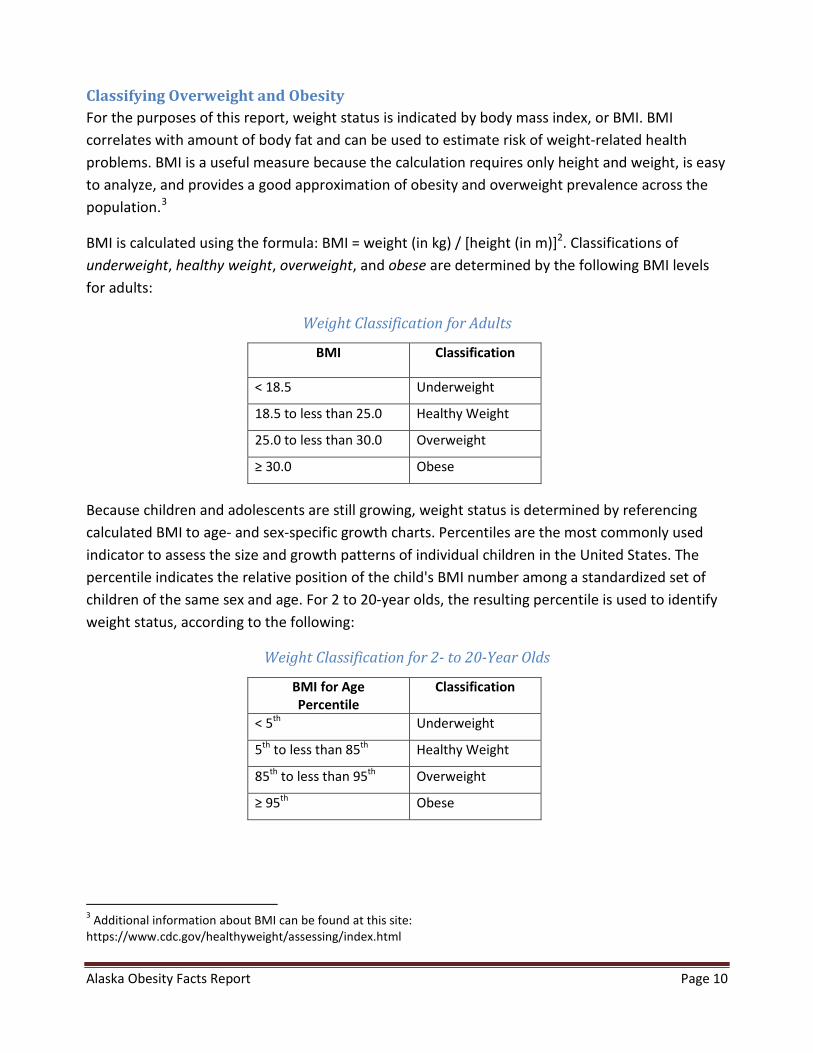
Classifying Overweight and Obesity For the purposes of this report, weight status is indicated by body mass index, or BMI. BMI correlates with amount of body fat and can be used to estimate risk of weight-related health problems. BMI is a useful measure because the calculation requires only height and weight, is easy to analyze, and provides a good approximation of obesity and overweight prevalence across the population.3
BMI is calculated using the formula: BMI = weight (in kg) / [height (in m)]2. Classifications of underweight, healthy weight, overweight, and obese are determined by the following BMI levels for adults:
Weight Classification for Adults
BMI Classification
< 18.5 Underweight
18.5 to less than 25.0 Healthy Weight
25.0 to less than 30.0 Overweight
≥ 30.0 Obese
Because children and adolescents are still growing, weight status is determined by referencing calculated BMI to age- and sex-specific growth charts. Percentiles are the most commonly used indicator to assess the size and growth patterns of individual children in the United States. The percentile indicates the relative position of the child's BMI number among a standardized set of children of the same sex and age. For 2 to 20-year olds, the resulting percentile is used to identify weight status, according to the following:
Weight Classification for 2- to 20-Year Olds
BMI for Age Percentile
Classification
< 5th Underweight
5th to less than 85th Healthy Weight
85th to less than 95th Overweight
≥ 95th Obese
3 Additional information about BMI can be found at this site: https://www.cdc.gov/healthyweight/assessing/index.html
Alaska Obesity Facts Report Page 11
II. Economic Costs of Obesity
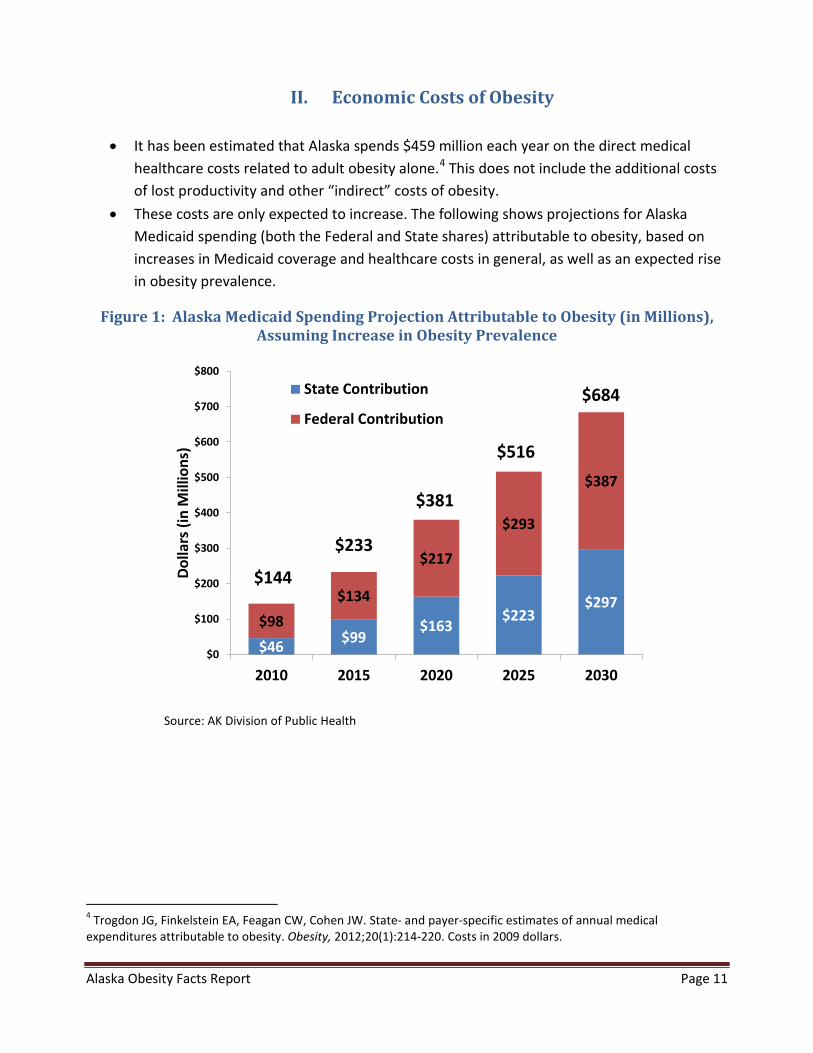
• It has been estimated that Alaska spends $459 million each year on the direct medical healthcare costs related to adult obesity alone.4 This does not include the additional costs of lost productivity and other “indirect” costs of obesity.
• These costs are only expected to increase. The following shows projections for Alaska Medicaid spending (both the Federal and State shares) attributable to obesity, based on increases in Medicaid coverage and healthcare costs in general, as well as an expected rise in obesity prevalence.
Figure 1: Alaska Medicaid Spending Projection Attributable to Obesity (in Millions), Assuming Increase in Obesity Prevalence
$46 $99$163
$223$297
$98$134
$217
$293
$387
$0
$100
$200
$300
$400
$500
$600
$700
$800
2010 2015 2020 2025 2030
Dolla
rs (i
n M
illio
ns)
State Contribution
Federal Contribution
$144
$233
$381
$516
$684
Source: AK Division of Public Health
4 Trogdon JG, Finkelstein EA, Feagan CW, Cohen JW. State- and payer-specific estimates of annual medical expenditures attributable to obesity. Obesity, 2012;20(1):214-220. Costs in 2009 dollars.
Alaska Obesity Facts Report Page 12
III. Adults
A. Adult Weight Status
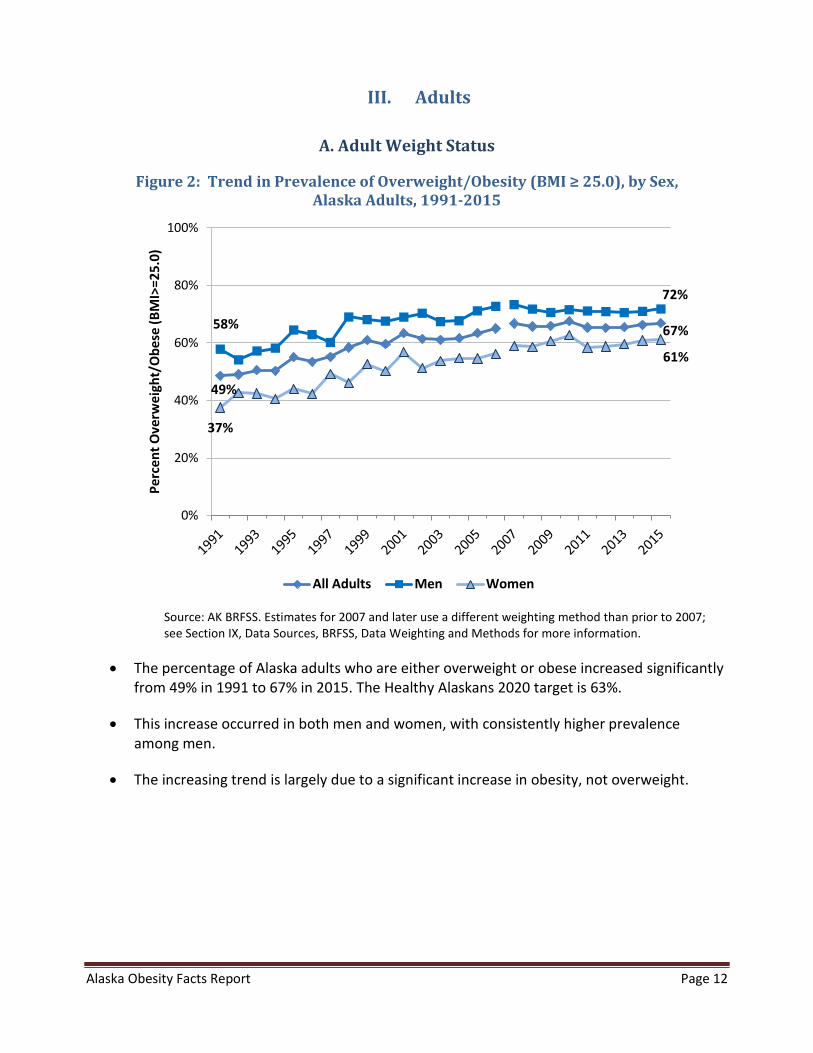
Figure 2: Trend in Prevalence of Overweight/Obesity (BMI ≥ 25.0), by Sex, Alaska Adults, 1991-2015
49%
67% 58%
72%
37%
61%
0%
20%
40%
60%
80%
100%
Perc
ent O
verw
eigh
t/O
bese
(BM
I>=2
5.0)
All Adults Men Women
Source: AK BRFSS. Estimates for 2007 and later use a different weighting method than prior to 2007; see Section IX, Data Sources, BRFSS, Data Weighting and Methods for more information.
• The percentage of Alaska adults who are either overweight or obese increased significantly from 49% in 1991 to 67% in 2015. The Healthy Alaskans 2020 target is 63%.
• This increase occurred in both men and women, with consistently higher prevalence among men.
• The increasing trend is largely due to a significant increase in obesity, not overweight.
Alaska Obesity Facts Report Page 13
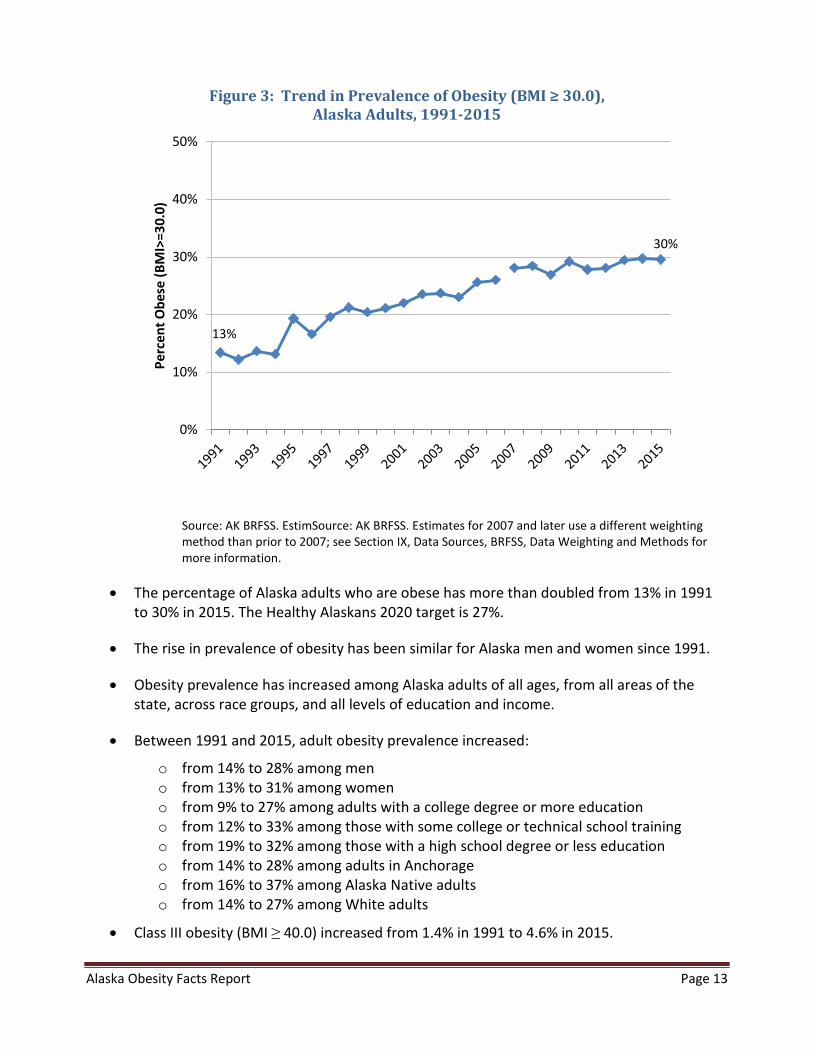
Figure 3: Trend in Prevalence of Obesity (BMI ≥ 30.0), Alaska Adults, 1991-2015
13%
30%
0%
10%
20%
30%
40%
50%Pe
rcen
t Obe
se (B
MI>
=30.
0)
Source: AK BRFSS. EstimSource: AK BRFSS. Estimates for 2007 and later use a different weighting method than prior to 2007; see Section IX, Data Sources, BRFSS, Data Weighting and Methods for more information.
• The percentage of Alaska adults who are obese has more than doubled from 13% in 1991 to 30% in 2015. The Healthy Alaskans 2020 target is 27%.
• The rise in prevalence of obesity has been similar for Alaska men and women since 1991.
• Obesity prevalence has increased among Alaska adults of all ages, from all areas of the state, across race groups, and all levels of education and income.
• Between 1991 and 2015, adult obesity prevalence increased:
o from 14% to 28% among men o from 13% to 31% among women o from 9% to 27% among adults with a college degree or more education o from 12% to 33% among those with some college or technical school training o from 19% to 32% among those with a high school degree or less education o from 14% to 28% among adults in Anchorage o from 16% to 37% among Alaska Native adults o from 14% to 27% among White adults
• Class III obesity (BMI ≥ 40.0) increased from 1.4% in 1991 to 4.6% in 2015.
Alaska Obesity Facts Report Page 14
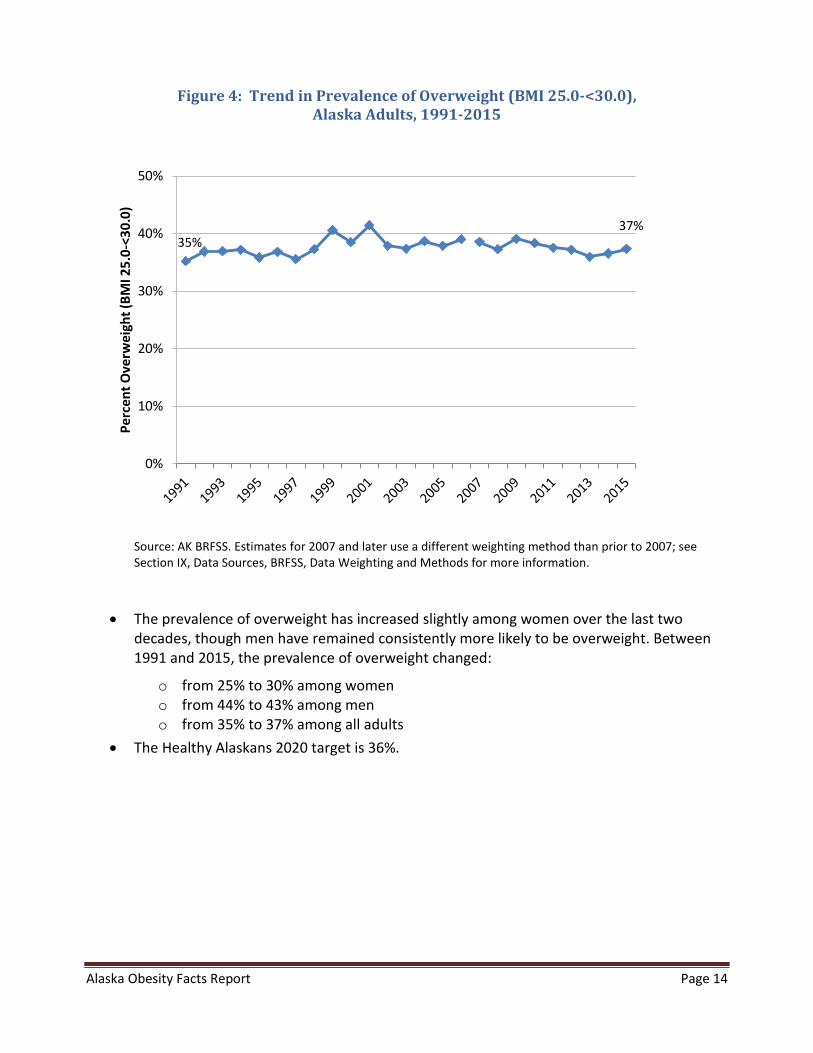
Figure 4: Trend in Prevalence of Overweight (BMI 25.0-<30.0), Alaska Adults, 1991-2015
35% 37%
0%
10%
20%
30%
40%
50%
Perc
ent O
verw
eigh
t (BM
I 25.
0-<3
0.0)
Source: AK BRFSS. Estimates for 2007 and later use a different weighting method than prior to 2007; see Section IX, Data Sources, BRFSS, Data Weighting and Methods for more information.
• The prevalence of overweight has increased slightly among women over the last two decades, though men have remained consistently more likely to be overweight. Between 1991 and 2015, the prevalence of overweight changed:
o from 25% to 30% among women o from 44% to 43% among men o from 35% to 37% among all adults
• The Healthy Alaskans 2020 target is 36%.
Alaska Obesity Facts Report Page 15
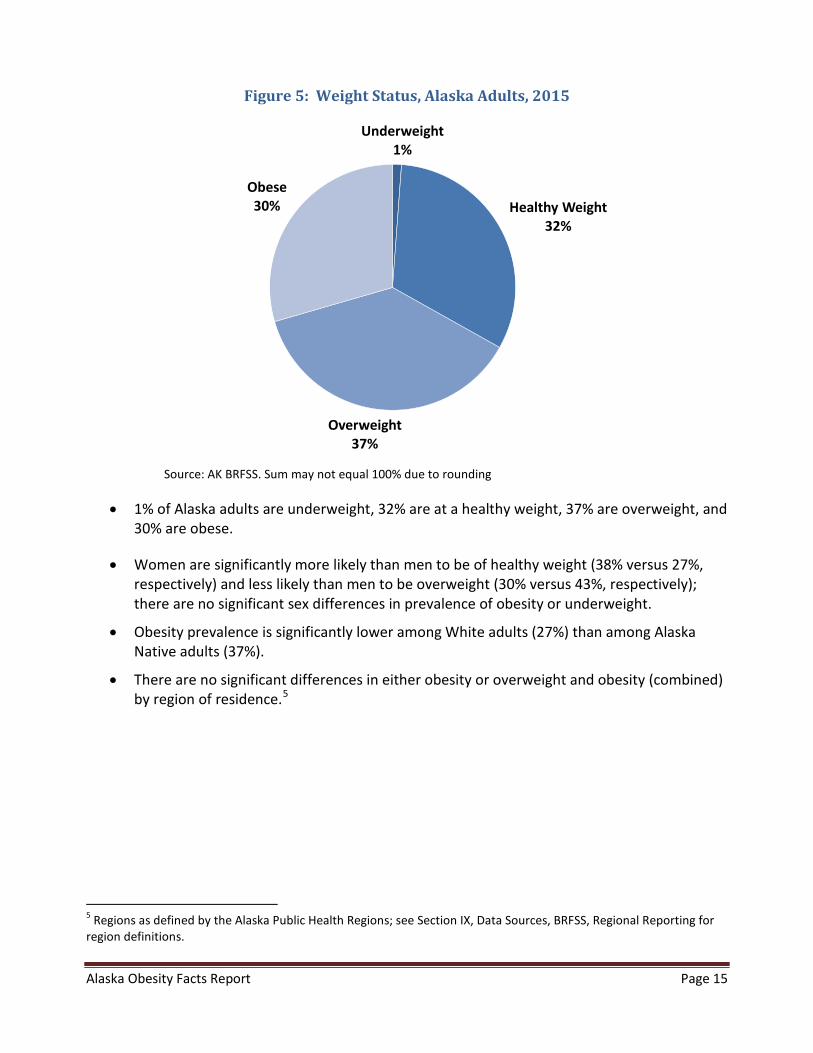
Figure 5: Weight Status, Alaska Adults, 2015
Underweight
1%
Healthy Weight32%
Overweight37%
Obese30%
Source: AK BRFSS. Sum may not equal 100% due to rounding
• 1% of Alaska adults are underweight, 32% are at a healthy weight, 37% are overweight, and 30% are obese.
• Women are significantly more likely than men to be of healthy weight (38% versus 27%, respectively) and less likely than men to be overweight (30% versus 43%, respectively); there are no significant sex differences in prevalence of obesity or underweight.
• Obesity prevalence is significantly lower among White adults (27%) than among Alaska Native adults (37%).
• There are no significant differences in either obesity or overweight and obesity (combined) by region of residence.5
5 Regions as defined by the Alaska Public Health Regions; see Section IX, Data Sources, BRFSS, Regional Reporting for region definitions.
Alaska Obesity Facts Report Page 16
B. Adult Physical Inactivity
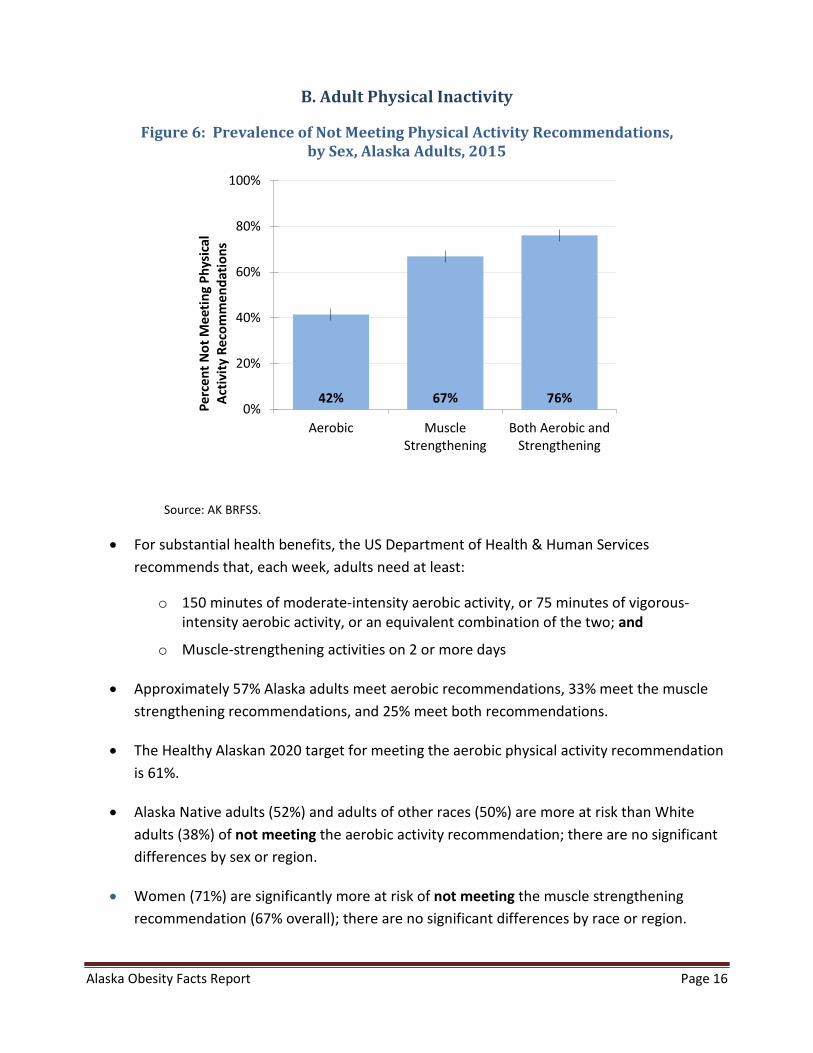
Figure 6: Prevalence of Not Meeting Physical Activity Recommendations, by Sex, Alaska Adults, 2015
0%
20%
40%
60%
80%
100%
Aerobic MuscleStrengthening
Both Aerobic andStrengthening
Perc
ent N
ot M
eetin
g Ph
ysic
alAc
tivity
Rec
omm
enda
tions
Source: AK BRFSS.
• For substantial health benefits, the US Department of Health & Human Services recommends that, each week, adults need at least:
o 150 minutes of moderate-intensity aerobic activity, or 75 minutes of vigorous-intensity aerobic activity, or an equivalent combination of the two; and
o Muscle-strengthening activities on 2 or more days
• Approximately 57% Alaska adults meet aerobic recommendations, 33% meet the muscle strengthening recommendations, and 25% meet both recommendations.
• The Healthy Alaskan 2020 target for meeting the aerobic physical activity recommendation is 61%.
• Alaska Native adults (52%) and adults of other races (50%) are more at risk than White adults (38%) of not meeting the aerobic activity recommendation; there are no significant differences by sex or region.
• Women (71%) are significantly more at risk of not meeting the muscle strengthening recommendation (67% overall); there are no significant differences by race or region.
Alaska Obesity Facts Report Page 17
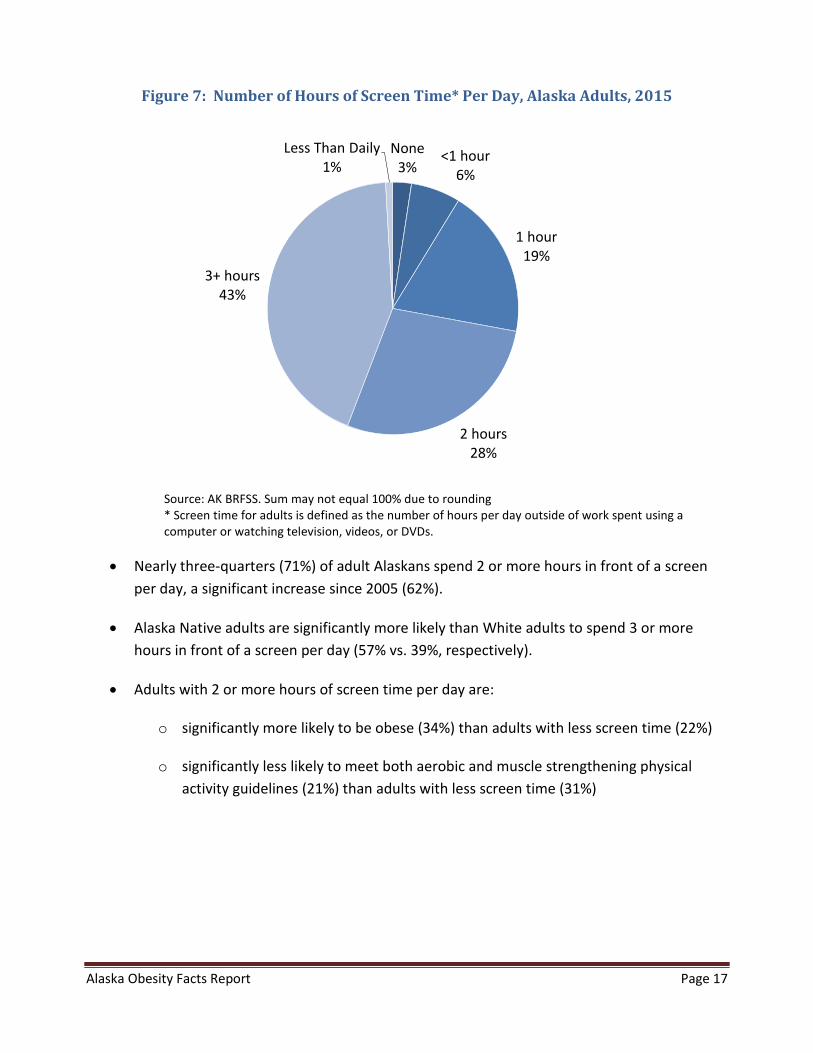
Figure 7: Number of Hours of Screen Time* Per Day, Alaska Adults, 2015
None
3%<1 hour
6%
1 hour19%
2 hours28%
3+ hours43%
Less Than Daily1%
Source: AK BRFSS. Sum may not equal 100% due to rounding * Screen time for adults is defined as the number of hours per day outside of work spent using a computer or watching television, videos, or DVDs.
• Nearly three-quarters (71%) of adult Alaskans spend 2 or more hours in front of a screen per day, a significant increase since 2005 (62%).
• Alaska Native adults are significantly more likely than White adults to spend 3 or more hours in front of a screen per day (57% vs. 39%, respectively).
• Adults with 2 or more hours of screen time per day are:
o significantly more likely to be obese (34%) than adults with less screen time (22%)
o significantly less likely to meet both aerobic and muscle strengthening physical activity guidelines (21%) than adults with less screen time (31%)

Alaska Obesity Facts Report Page 18
C. Adult Nutrition
Figure 8: Prevalence of Consuming Less Than 2 Fruit Servings and 3 Vegetable Servings Daily, Alaska Adults, 2015
70% 79% 88%0%
20%
40%
60%
80%
100%
Fruit Vegetables Both fruit andvegetables
Perc
ent C
onsu
min
g Le
ss T
han
Reco
mm
ende
d D
aily
Ser
ving
s
Source: AK BRFSS.
• Approximately 9 in 10 (88%) Alaska adults do not consume the recommended daily servings of fruit (two a day) and vegetables (three a day), and the prevalence of not meeting this nutritional recommendation has remained near this level over the past 20 years.
• Men are more likely than women to not meet the fruit (74% vs. 65%) and vegetable (83% vs. 75%) recommendations.
• There are no significant differences by region.
• Research supports a connection between access to healthy food and increased consumption of fruits and vegetables.6 Among adults who say they do not eat enough fruits and vegetables, 58% agree that expense is a reason, 36% agree that lack of availability is a reason, and 27% agree that inconvenience is a reason (2009 AK BRFSS).
6 Centers for Disease Control and Prevention. Strategies to Prevent Obesity and Other Chronic Diseases: The CDC Guide to Strategies to Increase the Consumption of Fruits and Vegetables. Atlanta: U.S. Department of Health and Human Services; 2011.
Alaska Obesity Facts Report Page 19
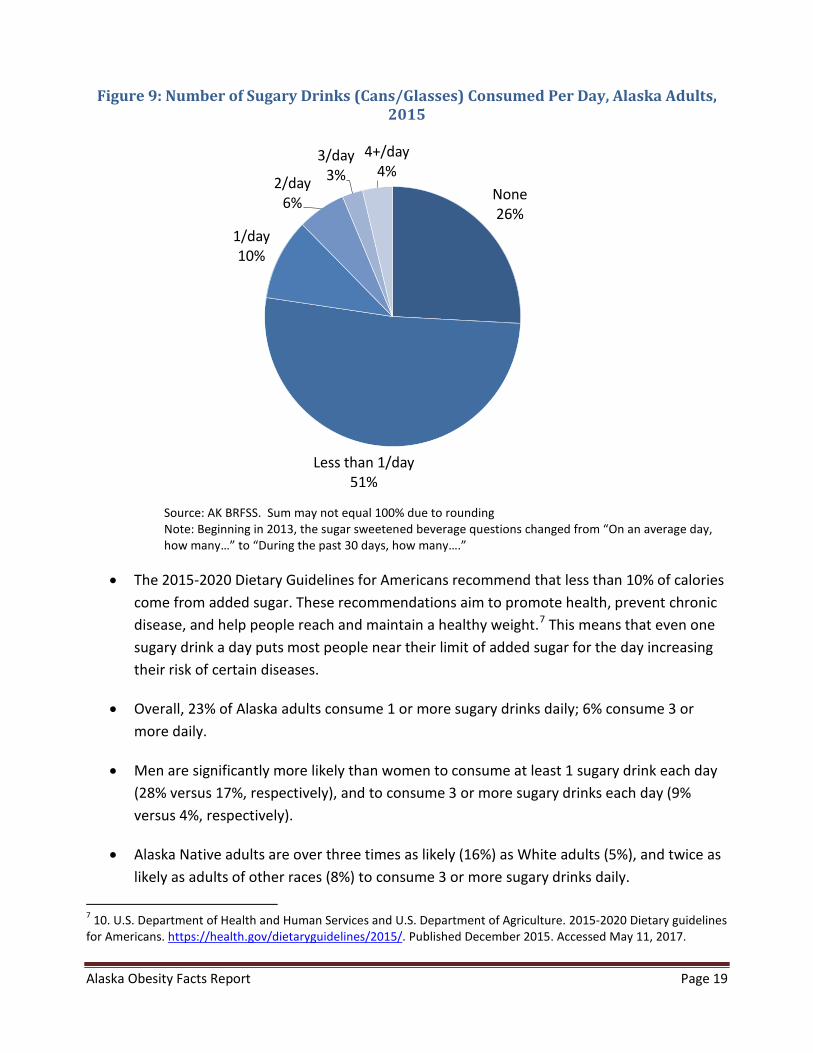
Figure 9: Number of Sugary Drinks (Cans/Glasses) Consumed Per Day, Alaska Adults, 2015
None26%
Less than 1/day51%
1/day10%
2/day6%
3/day3%
4+/day4%
Source: AK BRFSS. Sum may not equal 100% due to rounding Note: Beginning in 2013, the sugar sweetened beverage questions changed from “On an average day, how many…” to “During the past 30 days, how many….”
• The 2015-2020 Dietary Guidelines for Americans recommend that less than 10% of calories come from added sugar. These recommendations aim to promote health, prevent chronic disease, and help people reach and maintain a healthy weight.7 This means that even one sugary drink a day puts most people near their limit of added sugar for the day increasing their risk of certain diseases.
• Overall, 23% of Alaska adults consume 1 or more sugary drinks daily; 6% consume 3 or more daily.
• Men are significantly more likely than women to consume at least 1 sugary drink each day (28% versus 17%, respectively), and to consume 3 or more sugary drinks each day (9% versus 4%, respectively).
• Alaska Native adults are over three times as likely (16%) as White adults (5%), and twice as likely as adults of other races (8%) to consume 3 or more sugary drinks daily.
7 10. U.S. Department of Health and Human Services and U.S. Department of Agriculture. 2015-2020 Dietary guidelines for Americans. https://health.gov/dietaryguidelines/2015/. Published December 2015. Accessed May 11, 2017.

Alaska Obesity Facts Report Page 20
• Alaska Native adults living in the BRFSS Northern region8 of the state are significantly more likely to consume 3 or more sugary drinks each day (17%) than are Alaska Native adults living in other regions (4%-11%).
8 Regions as defined by the Alaska Public Health Regions; see Section IX, Data Sources, BRFSS, Regional Reporting for region definitions.
Alaska Obesity Facts Report Page 21
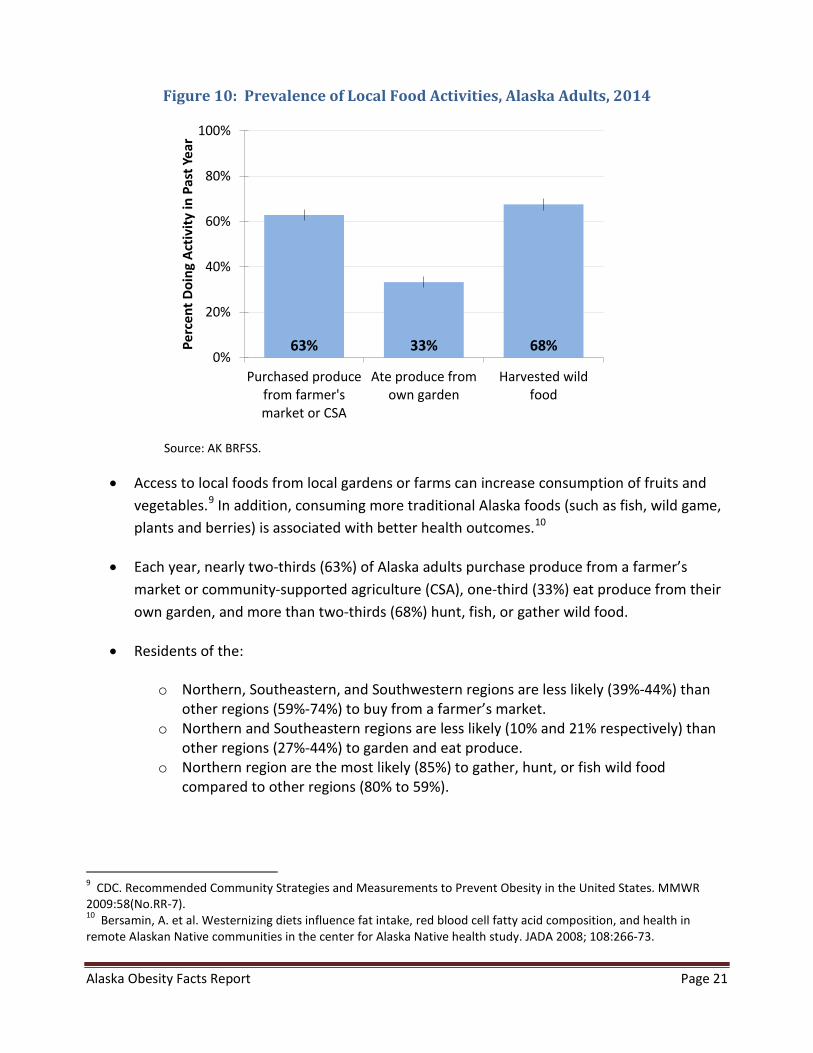
Figure 10: Prevalence of Local Food Activities, Alaska Adults, 2014
63% 33% 68%0%
20%
40%
60%
80%
100%
Purchased producefrom farmer'smarket or CSA
Ate produce fromown garden
Harvested wildfood
Perc
ent D
oing
Act
ivity
in P
ast Y
ear
Source: AK BRFSS.
• Access to local foods from local gardens or farms can increase consumption of fruits and vegetables.9 In addition, consuming more traditional Alaska foods (such as fish, wild game, plants and berries) is associated with better health outcomes.10
• Each year, nearly two-thirds (63%) of Alaska adults purchase produce from a farmer’s market or community-supported agriculture (CSA), one-third (33%) eat produce from their own garden, and more than two-thirds (68%) hunt, fish, or gather wild food.
• Residents of the:
o Northern, Southeastern, and Southwestern regions are less likely (39%-44%) than other regions (59%-74%) to buy from a farmer’s market.
o Northern and Southeastern regions are less likely (10% and 21% respectively) than other regions (27%-44%) to garden and eat produce.
o Northern region are the most likely (85%) to gather, hunt, or fish wild food compared to other regions (80% to 59%).
9 CDC. Recommended Community Strategies and Measurements to Prevent Obesity in the United States. MMWR 2009:58(No.RR-7). 10 Bersamin, A. et al. Westernizing diets influence fat intake, red blood cell fatty acid composition, and health in remote Alaskan Native communities in the center for Alaska Native health study. JADA 2008; 108:266-73.
Alaska Obesity Facts Report Page 22
• Similarly, Alaska Native adults are:
o Less likely (51%) than White adults (65%) to buy produce from a farmer’s market/CSA
o Less likely (20%) than White adults (39%) to eat produce from their own garden o More likely (80%) than White adults (69%) to gather, hunt, or fish wild food
Alaska Obesity Facts Report Page 23
D. Healthcare Provider Advice
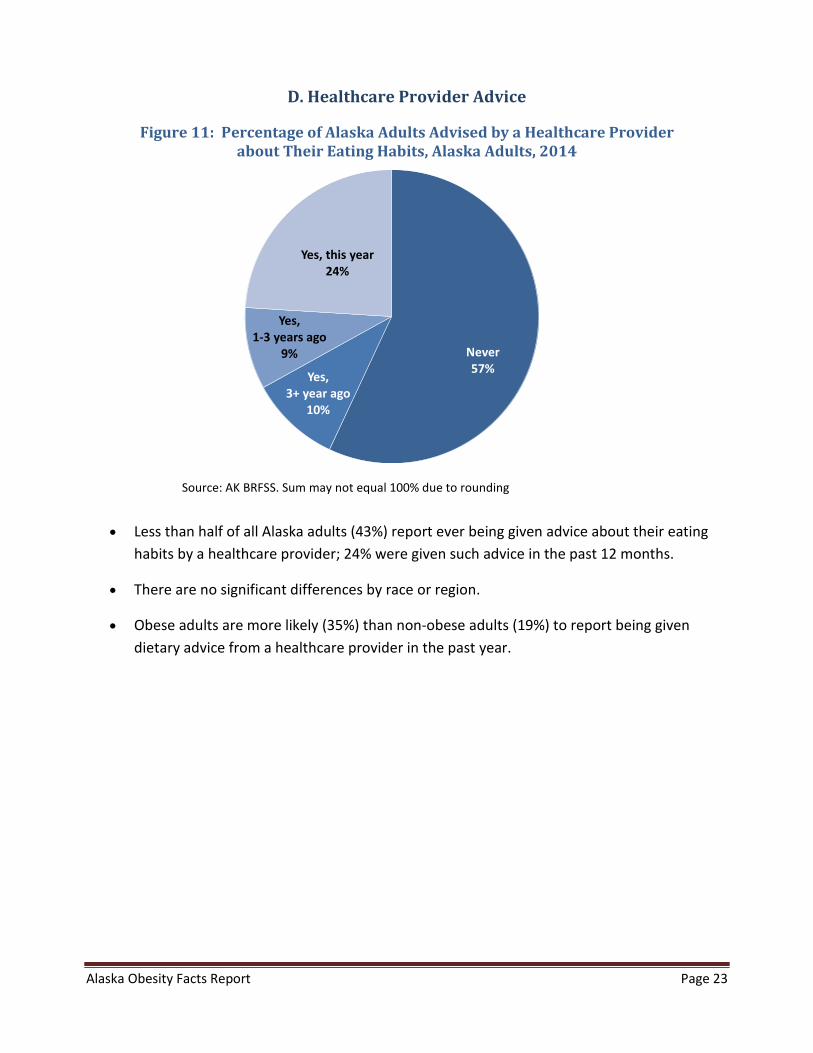
Figure 11: Percentage of Alaska Adults Advised by a Healthcare Provider about Their Eating Habits, Alaska Adults, 2014
Never57%Yes,
3+ year ago10%
Yes, 1-3 years ago
9%
Yes, this year24%
Source: AK BRFSS. Sum may not equal 100% due to rounding
• Less than half of all Alaska adults (43%) report ever being given advice about their eating habits by a healthcare provider; 24% were given such advice in the past 12 months.
• There are no significant differences by race or region.
• Obese adults are more likely (35%) than non-obese adults (19%) to report being given dietary advice from a healthcare provider in the past year.
Alaska Obesity Facts Report Page 24
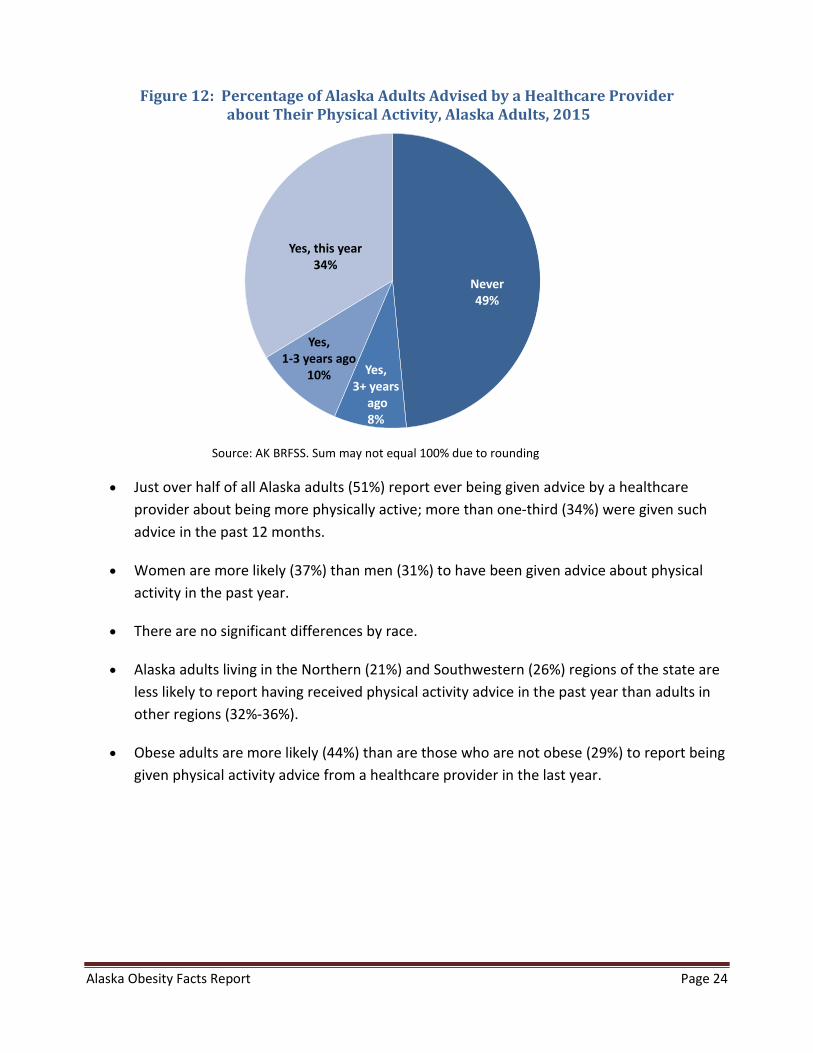
Figure 12: Percentage of Alaska Adults Advised by a Healthcare Provider about Their Physical Activity, Alaska Adults, 2015
Never49%
Yes, 3+ years
ago8%
Yes, 1-3 years ago
10%
Yes, this year34%
Source: AK BRFSS. Sum may not equal 100% due to rounding
• Just over half of all Alaska adults (51%) report ever being given advice by a healthcare provider about being more physically active; more than one-third (34%) were given such advice in the past 12 months.
• Women are more likely (37%) than men (31%) to have been given advice about physical activity in the past year.
• There are no significant differences by race.
• Alaska adults living in the Northern (21%) and Southwestern (26%) regions of the state are less likely to report having received physical activity advice in the past year than adults in other regions (32%-36%).
• Obese adults are more likely (44%) than are those who are not obese (29%) to report being given physical activity advice from a healthcare provider in the last year.
Alaska Obesity Facts Report Page 25
IV. Children and Adolescents
A. Weight Status of Children and Adolescents
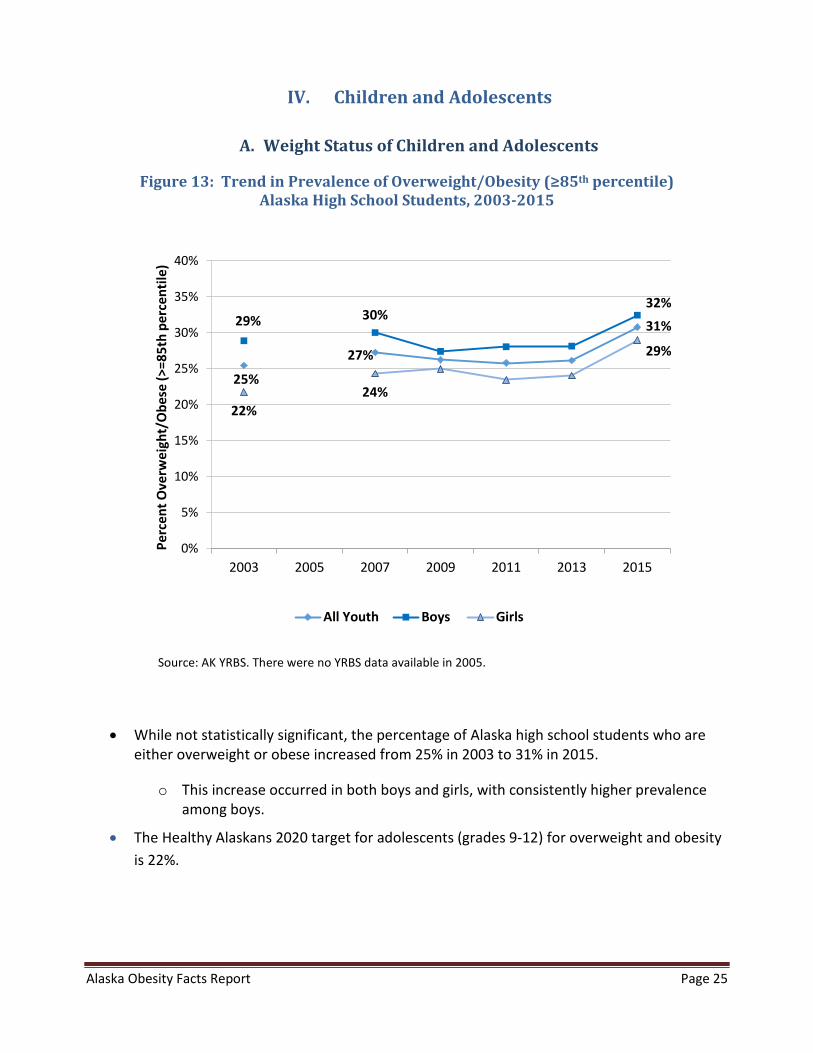
Figure 13: Trend in Prevalence of Overweight/Obesity (≥85th percentile) Alaska High School Students, 2003-2015
25%
27%
31% 29% 30% 32%
22% 24%
29%
0%
5%
10%
15%
20%
25%
30%
35%
40%
2003 2005 2007 2009 2011 2013 2015
Perc
ent O
verw
eigh
t/O
bese
(>=8
5th
perc
entil
e)
All Youth Boys Girls
Source: AK YRBS. There were no YRBS data available in 2005.
• While not statistically significant, the percentage of Alaska high school students who are either overweight or obese increased from 25% in 2003 to 31% in 2015.
o This increase occurred in both boys and girls, with consistently higher prevalence among boys.
• The Healthy Alaskans 2020 target for adolescents (grades 9-12) for overweight and obesity is 22%.
Alaska Obesity Facts Report Page 26
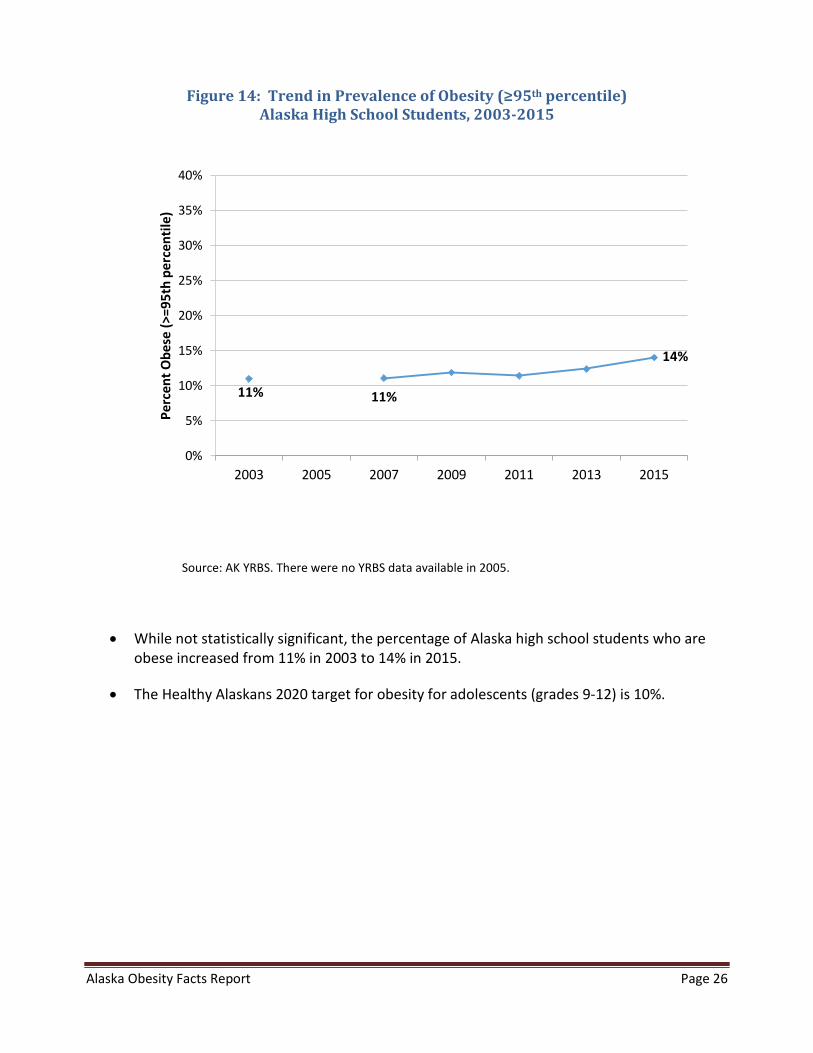
Figure 14: Trend in Prevalence of Obesity (≥95th percentile) Alaska High School Students, 2003-2015
11% 11%
14%
0%
5%
10%
15%
20%
25%
30%
35%
40%
2003 2005 2007 2009 2011 2013 2015
Perc
ent O
bese
(>=9
5th
perc
entil
e)
Source: AK YRBS. There were no YRBS data available in 2005.
• While not statistically significant, the percentage of Alaska high school students who are obese increased from 11% in 2003 to 14% in 2015.
• The Healthy Alaskans 2020 target for obesity for adolescents (grades 9-12) is 10%.
Alaska Obesity Facts Report Page 27
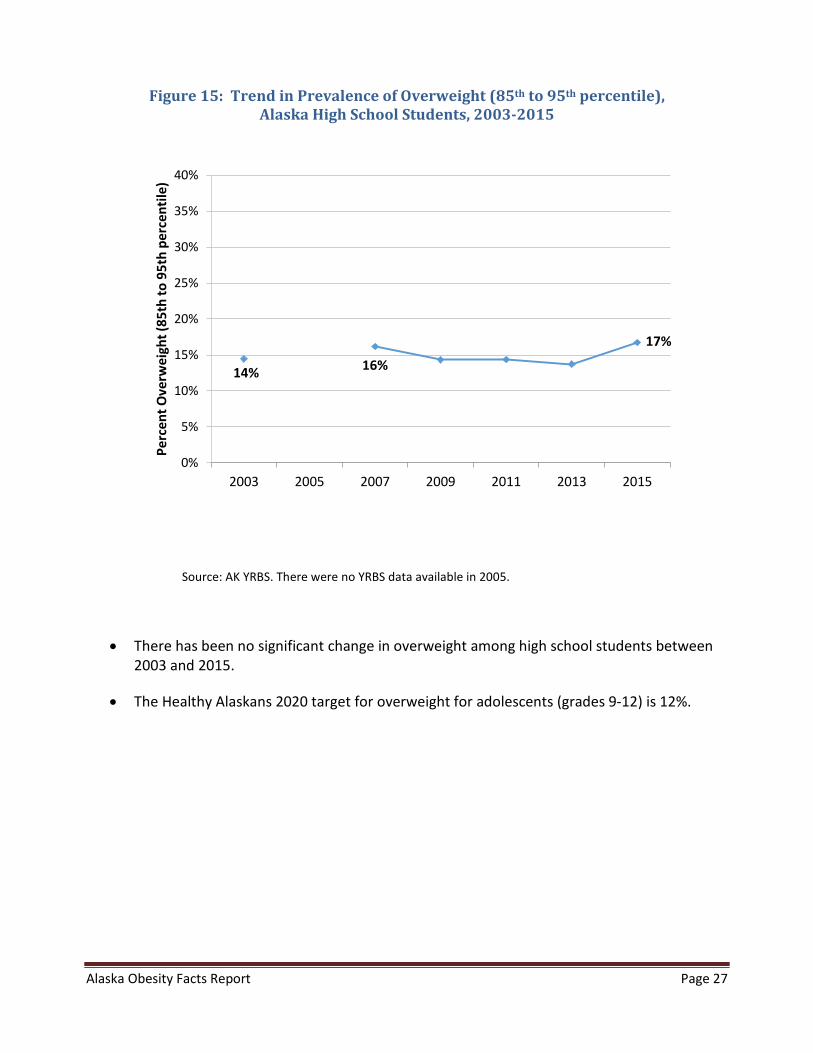
Figure 15: Trend in Prevalence of Overweight (85th to 95th percentile), Alaska High School Students, 2003-2015
14% 16%
17%
0%
5%
10%
15%
20%
25%
30%
35%
40%
2003 2005 2007 2009 2011 2013 2015
Perc
ent O
verw
eigh
t (85
th to
95t
h pe
rcen
tile)
Source: AK YRBS. There were no YRBS data available in 2005.
• There has been no significant change in overweight among high school students between 2003 and 2015.
• The Healthy Alaskans 2020 target for overweight for adolescents (grades 9-12) is 12%.

Alaska Obesity Facts Report Page 28
Figure 16: Weight Status, Alaska High School Students, 2015
Underweight
2%
Healthy Weight67%
Overweight17%
Obese14%
Source: AK YRBS. Sum may not equal 100% due to rounding
• Nearly one-third of Alaska high school students (in grades 9-12 in traditional high schools) are either overweight or obese; this prevalence has increased over the 10-year period during which it has been measured, with a low of 25% in 2003 and a high of 31% in 2015.
• 5% of Alaska high school students qualify as “severely obese,” defined for adolescents as a BMI over 120% of the 95th percentile.
• White high school students are significantly less likely to be obese (11%) than are students of other races (20%).
Alaska Obesity Facts Report Page 29
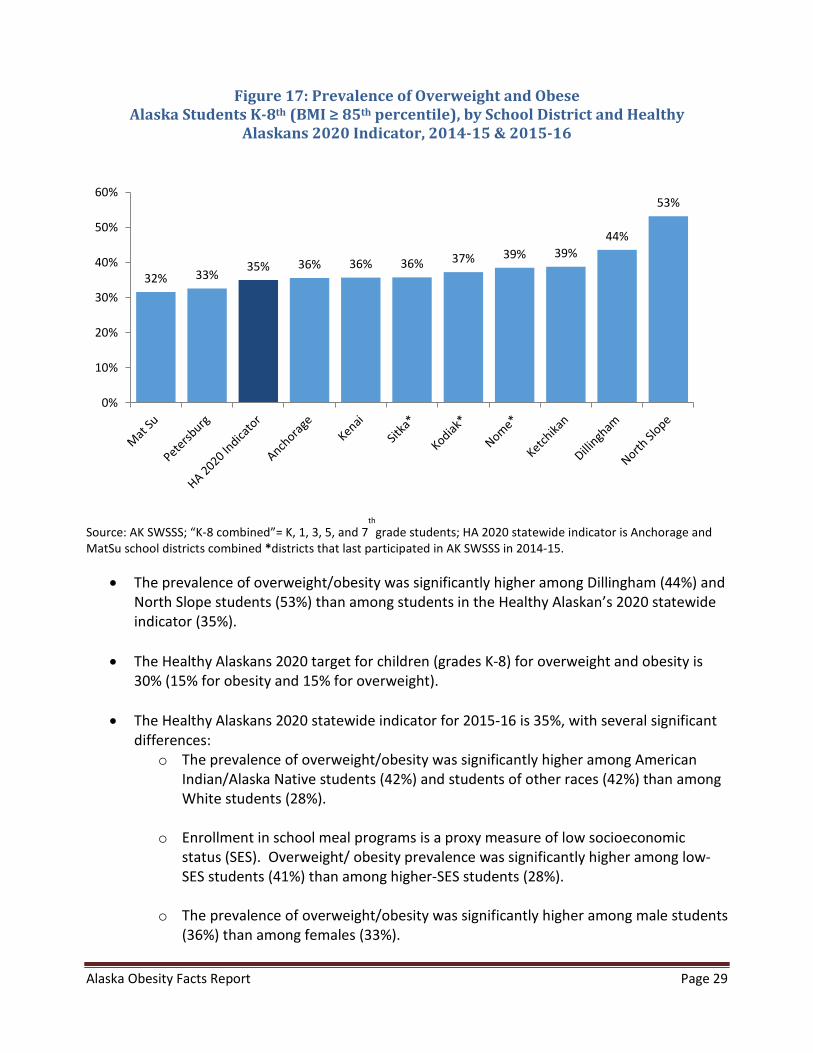
Figure 17: Prevalence of Overweight and Obese Alaska Students K-8th (BMI ≥ 85th percentile), by School District and Healthy
Alaskans 2020 Indicator, 2014-15 & 2015-16
32% 33% 35% 36% 36% 36% 37% 39% 39%
44%
53%
0%
10%
20%
30%
40%
50%
60%
Source: AK SWSSS; “K-8 combined”= K, 1, 3, 5, and 7th
grade students; HA 2020 statewide indicator is Anchorage and MatSu school districts combined *districts that last participated in AK SWSSS in 2014-15.
• The prevalence of overweight/obesity was significantly higher among Dillingham (44%) and North Slope students (53%) than among students in the Healthy Alaskan’s 2020 statewide indicator (35%).
• The Healthy Alaskans 2020 target for children (grades K-8) for overweight and obesity is 30% (15% for obesity and 15% for overweight).
• The Healthy Alaskans 2020 statewide indicator for 2015-16 is 35%, with several significant differences:
o The prevalence of overweight/obesity was significantly higher among American Indian/Alaska Native students (42%) and students of other races (42%) than among White students (28%).
o Enrollment in school meal programs is a proxy measure of low socioeconomic status (SES). Overweight/ obesity prevalence was significantly higher among low-SES students (41%) than among higher-SES students (28%).
o The prevalence of overweight/obesity was significantly higher among male students (36%) than among females (33%).
Alaska Obesity Facts Report Page 30
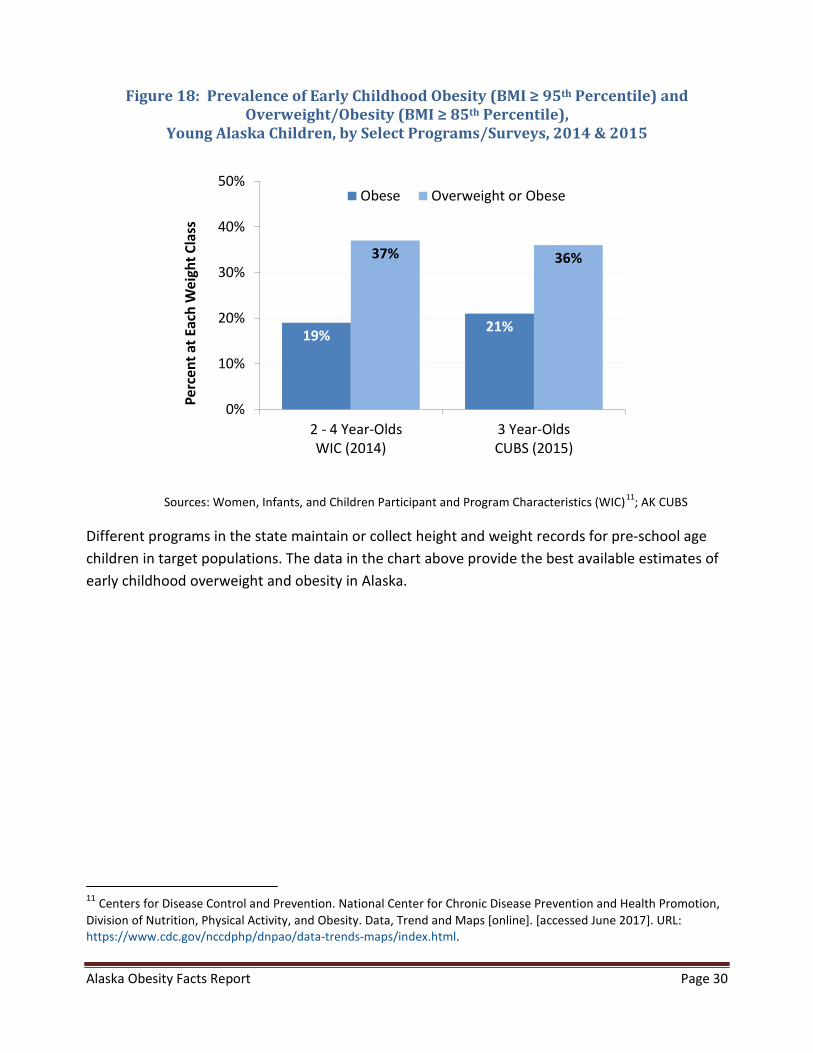
Figure 18: Prevalence of Early Childhood Obesity (BMI ≥ 95th Percentile) and Overweight/Obesity (BMI ≥ 85th Percentile),
Young Alaska Children, by Select Programs/Surveys, 2014 & 2015
19% 21%
37% 36%
0%
10%
20%
30%
40%
50%
2 - 4 Year-OldsWIC (2014)
3 Year-OldsCUBS (2015)
Perc
ent a
t Eac
h W
eigh
t Cla
ssObese Overweight or Obese
Sources: Women, Infants, and Children Participant and Program Characteristics (WIC)11; AK CUBS
Different programs in the state maintain or collect height and weight records for pre-school age children in target populations. The data in the chart above provide the best available estimates of early childhood overweight and obesity in Alaska.
11 Centers for Disease Control and Prevention. National Center for Chronic Disease Prevention and Health Promotion, Division of Nutrition, Physical Activity, and Obesity. Data, Trend and Maps [online]. [accessed June 2017]. URL: https://www.cdc.gov/nccdphp/dnpao/data-trends-maps/index.html.
Alaska Obesity Facts Report Page 31
B. Physical Inactivity among Children and Adolescents
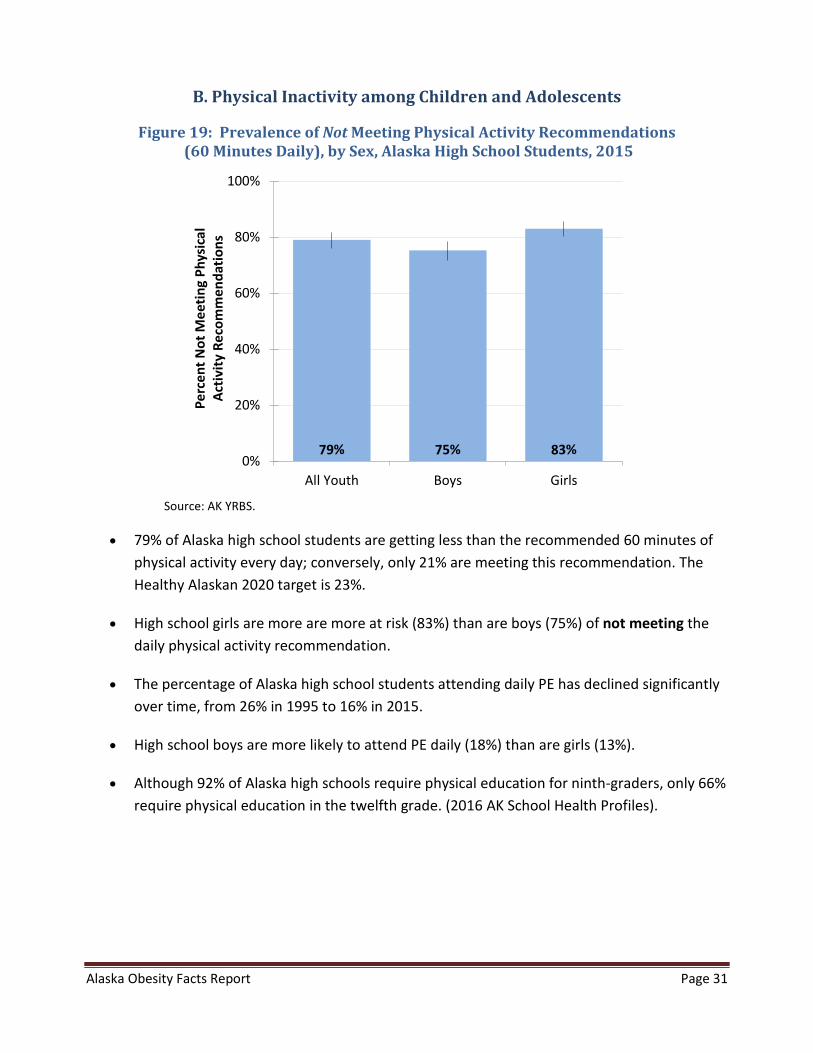
Figure 19: Prevalence of Not Meeting Physical Activity Recommendations (60 Minutes Daily), by Sex, Alaska High School Students, 2015
0%
20%
40%
60%
80%
100%
All Youth Boys Girls
Perc
ent N
ot M
eetin
g Ph
ysic
alAc
tivity
Rec
omm
enda
tions
Source: AK YRBS.
• 79% of Alaska high school students are getting less than the recommended 60 minutes of physical activity every day; conversely, only 21% are meeting this recommendation. The Healthy Alaskan 2020 target is 23%.
• High school girls are more are more at risk (83%) than are boys (75%) of not meeting the daily physical activity recommendation.
• The percentage of Alaska high school students attending daily PE has declined significantly over time, from 26% in 1995 to 16% in 2015.
• High school boys are more likely to attend PE daily (18%) than are girls (13%).
• Although 92% of Alaska high schools require physical education for ninth-graders, only 66% require physical education in the twelfth grade. (2016 AK School Health Profiles).
Alaska Obesity Facts Report Page 32
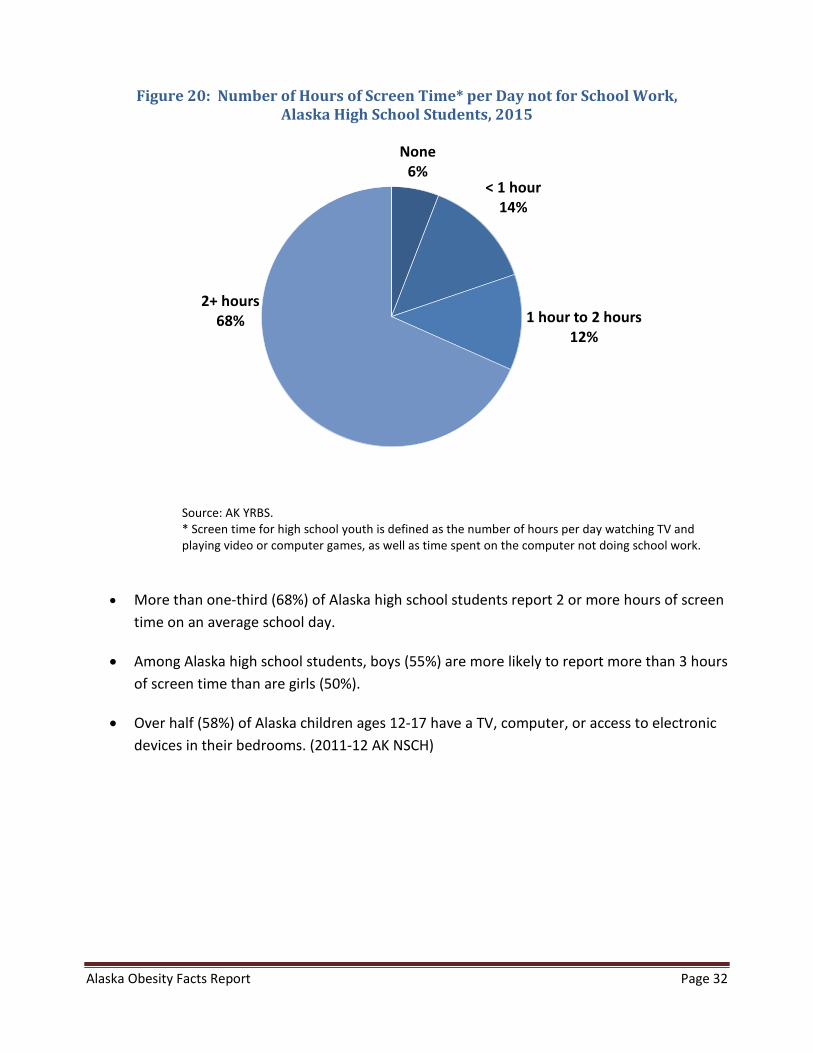
Figure 20: Number of Hours of Screen Time* per Day not for School Work, Alaska High School Students, 2015
None
6%< 1 hour
14%
1 hour to 2 hours12%
2+ hours68%
Source: AK YRBS. * Screen time for high school youth is defined as the number of hours per day watching TV and playing video or computer games, as well as time spent on the computer not doing school work.
• More than one-third (68%) of Alaska high school students report 2 or more hours of screen time on an average school day.
• Among Alaska high school students, boys (55%) are more likely to report more than 3 hours of screen time than are girls (50%).
• Over half (58%) of Alaska children ages 12-17 have a TV, computer, or access to electronic devices in their bedrooms. (2011-12 AK NSCH)
Alaska Obesity Facts Report Page 33
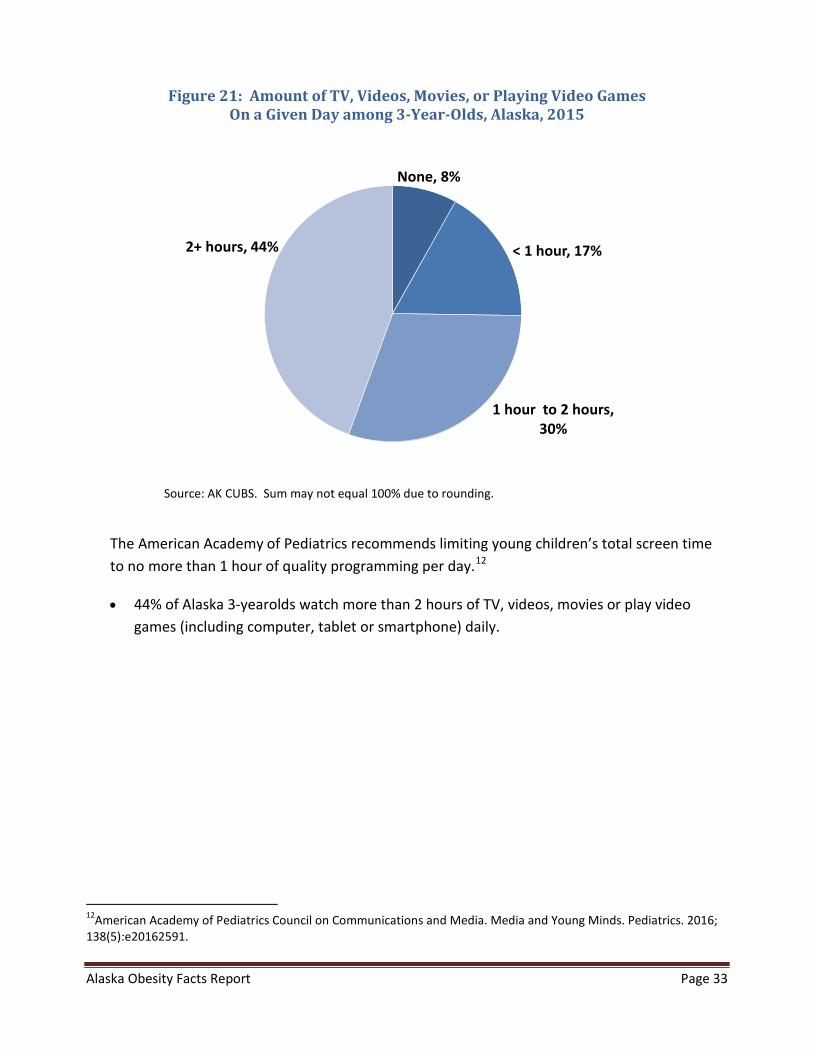
Figure 21: Amount of TV, Videos, Movies, or Playing Video Games On a Given Day among 3-Year-Olds, Alaska, 2015
None, 8%
< 1 hour, 17%
1 hour to 2 hours, 30%
2+ hours, 44%
Source: AK CUBS. Sum may not equal 100% due to rounding.
The American Academy of Pediatrics recommends limiting young children’s total screen time to no more than 1 hour of quality programming per day.12
• 44% of Alaska 3-yearolds watch more than 2 hours of TV, videos, movies or play video games (including computer, tablet or smartphone) daily.
12American Academy of Pediatrics Council on Communications and Media. Media and Young Minds. Pediatrics. 2016; 138(5):e20162591.
Alaska Obesity Facts Report Page 34
C. Nutrition among Children and Adolescents
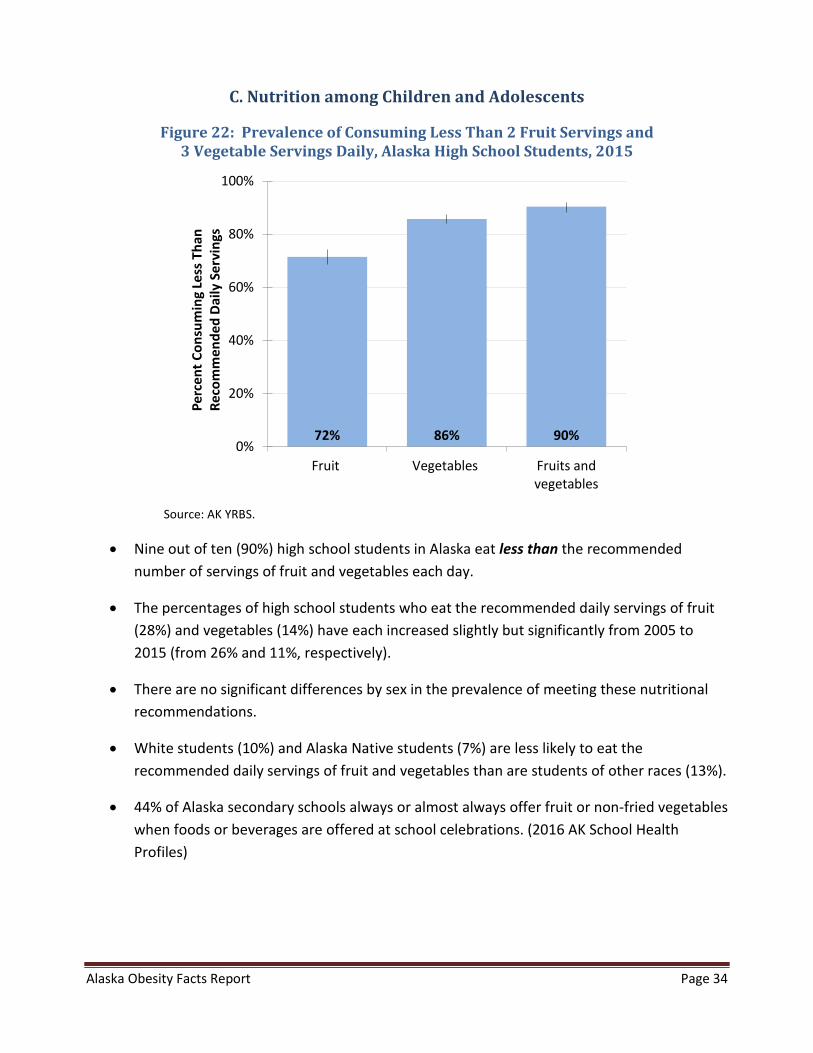
Figure 22: Prevalence of Consuming Less Than 2 Fruit Servings and 3 Vegetable Servings Daily, Alaska High School Students, 2015
72% 86% 90%0%
20%
40%
60%
80%
100%
Fruit Vegetables Fruits andvegetables
Perc
ent C
onsu
min
g Le
ss T
han
Reco
mm
ende
d D
aily
Ser
ving
s
Source: AK YRBS.
• Nine out of ten (90%) high school students in Alaska eat less than the recommended number of servings of fruit and vegetables each day.
• The percentages of high school students who eat the recommended daily servings of fruit (28%) and vegetables (14%) have each increased slightly but significantly from 2005 to 2015 (from 26% and 11%, respectively).
• There are no significant differences by sex in the prevalence of meeting these nutritional recommendations.
• White students (10%) and Alaska Native students (7%) are less likely to eat the recommended daily servings of fruit and vegetables than are students of other races (13%).
• 44% of Alaska secondary schools always or almost always offer fruit or non-fried vegetables when foods or beverages are offered at school celebrations. (2016 AK School Health Profiles)
Alaska Obesity Facts Report Page 35
Figure 23: Prevalence of Drinking 1 or More Sugary Drinks Daily, by Sex, Alaska High School Students, 2015
0%
20%
40%
60%
80%
All Youth Boys Girls
Perc
ent D
rinki
ng 1
or M
ore
Suga
ry
Drin
k ea
ch d
ay
Source: AK YRBS.
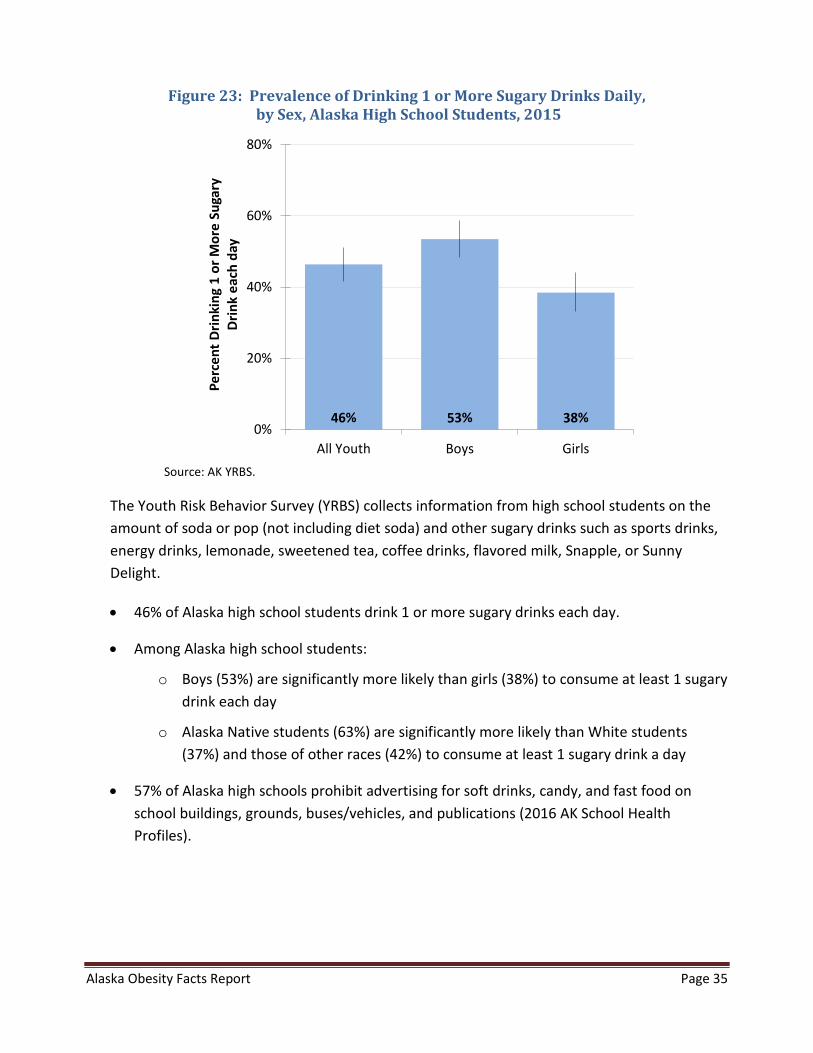
The Youth Risk Behavior Survey (YRBS) collects information from high school students on the amount of soda or pop (not including diet soda) and other sugary drinks such as sports drinks, energy drinks, lemonade, sweetened tea, coffee drinks, flavored milk, Snapple, or Sunny Delight.
• 46% of Alaska high school students drink 1 or more sugary drinks each day.
• Among Alaska high school students:
o Boys (53%) are significantly more likely than girls (38%) to consume at least 1 sugary drink each day
o Alaska Native students (63%) are significantly more likely than White students (37%) and those of other races (42%) to consume at least 1 sugary drink a day
• 57% of Alaska high schools prohibit advertising for soft drinks, candy, and fast food on school buildings, grounds, buses/vehicles, and publications (2016 AK School Health Profiles).
Alaska Obesity Facts Report Page 36
Figure 24: Any Consumption of Various Sugary Drinks by 3-Year Olds on a Given Day, by Region13, Alaska, 2013-2015
14% 14%10% 12%
37%
13%
39%
22% 23% 23%17%
76%
25%
75%
0%
20%
40%
60%
80%
100%
Anchorage Mat-Su Gulf Coast Interior Northern Southeast Southwest
Perc
ent C
onsu
min
g An
ySoda Other Sugary Drinks
Source: AK CUBS.
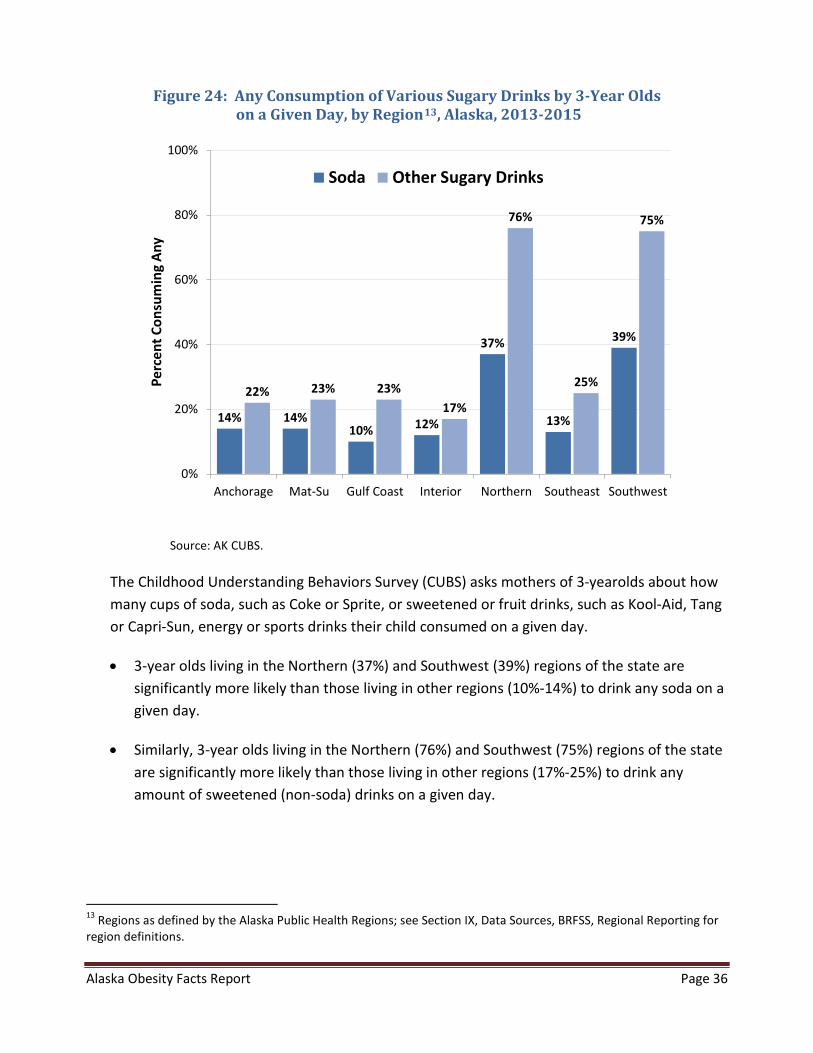
The Childhood Understanding Behaviors Survey (CUBS) asks mothers of 3-yearolds about how many cups of soda, such as Coke or Sprite, or sweetened or fruit drinks, such as Kool-Aid, Tang or Capri-Sun, energy or sports drinks their child consumed on a given day.
• 3-year olds living in the Northern (37%) and Southwest (39%) regions of the state are significantly more likely than those living in other regions (10%-14%) to drink any soda on a given day.
• Similarly, 3-year olds living in the Northern (76%) and Southwest (75%) regions of the state are significantly more likely than those living in other regions (17%-25%) to drink any amount of sweetened (non-soda) drinks on a given day.
13 Regions as defined by the Alaska Public Health Regions; see Section IX, Data Sources, BRFSS, Regional Reporting for region definitions.
Alaska Obesity Facts Report Page 37
Figure 25: Usual Type of Milk Drank, Alaska 3-Year-Olds, 2015
Whole or Regular Milk35%
Reduced Fat (2%) Milk33%
Low Fat (1%) or Fat Free (Skim) Milk
13%
Non-dairy Milk7%
Powdered, Canned, or Evaporated Milk
3%Other
7%
Does Not Drink Any Type of Milk
2%
Source: AK CUBS. Sum may not equal 100% due to rounding.
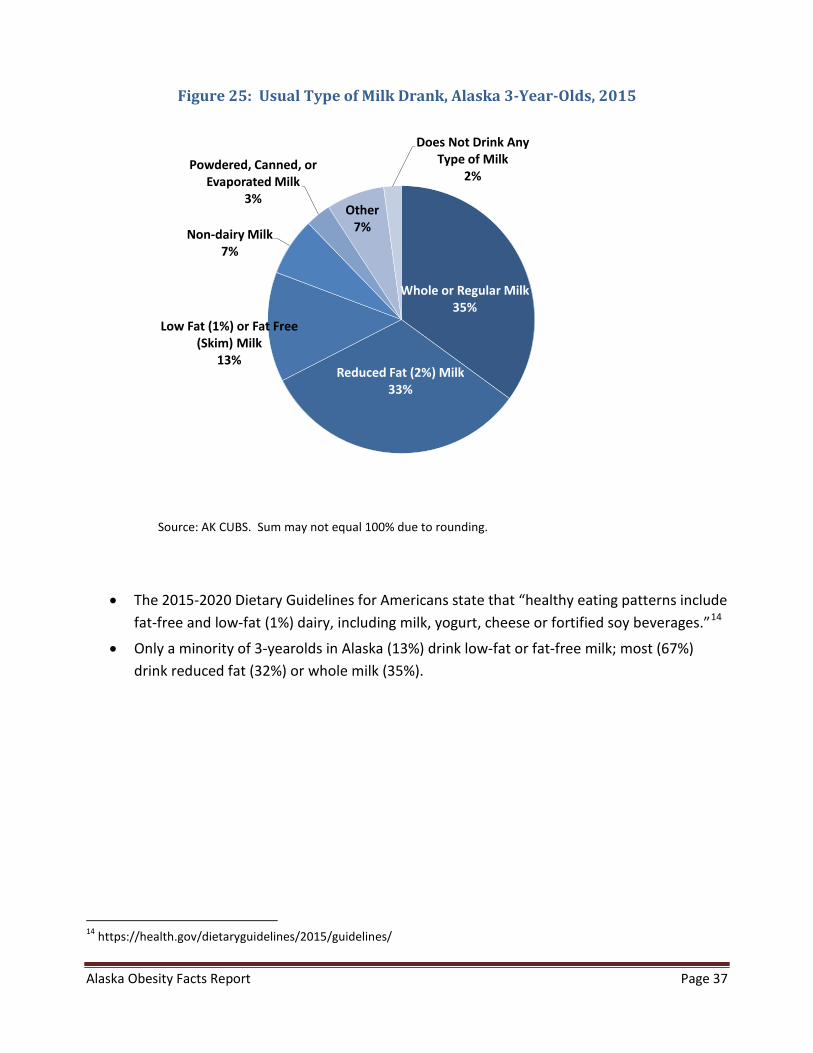
• The 2015-2020 Dietary Guidelines for Americans state that “healthy eating patterns include fat-free and low-fat (1%) dairy, including milk, yogurt, cheese or fortified soy beverages.”14
• Only a minority of 3-yearolds in Alaska (13%) drink low-fat or fat-free milk; most (67%) drink reduced fat (32%) or whole milk (35%).
14 https://health.gov/dietaryguidelines/2015/guidelines/
Alaska Obesity Facts Report Page 38
V. Breastfeeding
Figure 26: Trend in Prevalence of Breastfeeding Initiation and Duration at 4-Weeks and 8-Weeks Postpartum,
Alaska Women Delivering a Live Birth, 1991-2014
79%
96%
68%
88%
58%
81%
0%
20%
40%
60%
80%
100%
Perc
ent E
ngag
ing
in B
reas
tfee
ding
Initiation 4 Weeks 8 Weeks
Source: AK PRAMS.
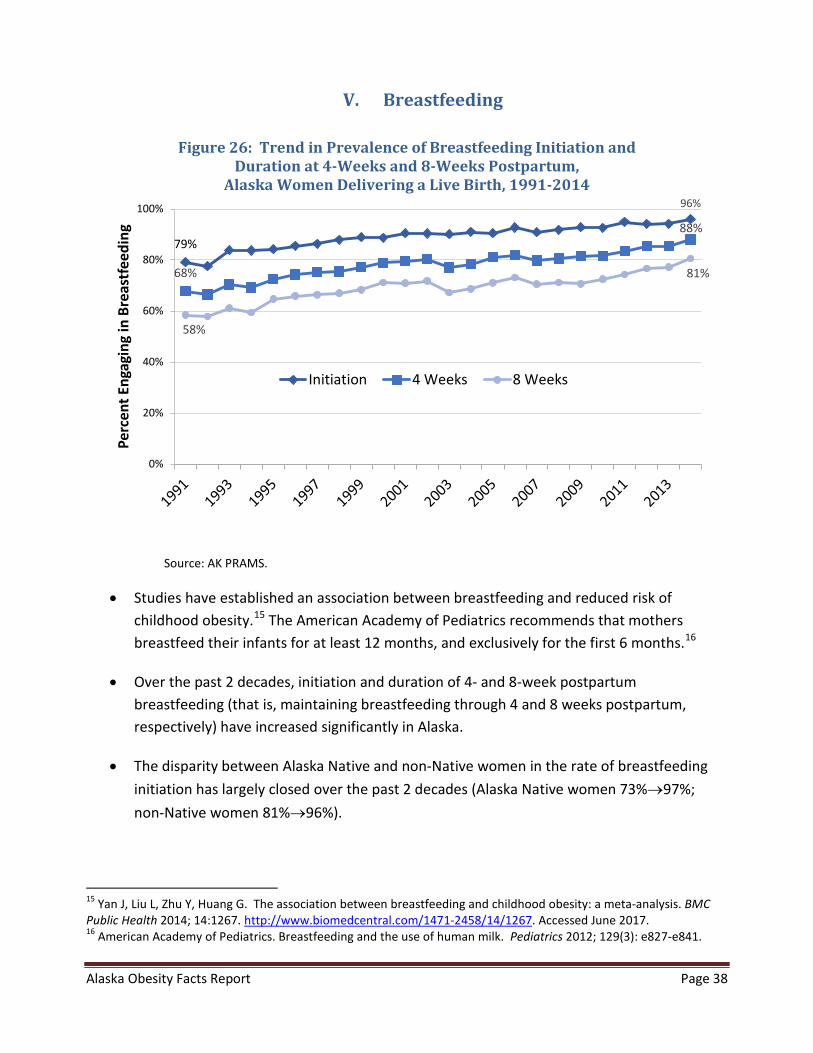
• Studies have established an association between breastfeeding and reduced risk of childhood obesity.15 The American Academy of Pediatrics recommends that mothers breastfeed their infants for at least 12 months, and exclusively for the first 6 months.16
• Over the past 2 decades, initiation and duration of 4- and 8-week postpartum breastfeeding (that is, maintaining breastfeeding through 4 and 8 weeks postpartum, respectively) have increased significantly in Alaska.
• The disparity between Alaska Native and non-Native women in the rate of breastfeeding initiation has largely closed over the past 2 decades (Alaska Native women 73%→97%; non-Native women 81%→96%).
15 Yan J, Liu L, Zhu Y, Huang G. The association between breastfeeding and childhood obesity: a meta-analysis. BMC Public Health 2014; 14:1267. http://www.biomedcentral.com/1471-2458/14/1267. Accessed June 2017. 16 American Academy of Pediatrics. Breastfeeding and the use of human milk. Pediatrics 2012; 129(3): e827-e841.
Alaska Obesity Facts Report Page 39
• 22% of Alaska newborns are fed breast milk exclusively until 6 months of age (2011-12 AK NSCH); commonly cited reasons for stopping breastfeeding include mom not producing enough milk, baby had difficulty latching or nursing, and baby not satisfied with only breast milk (2014 AK PRAMS).
Alaska Obesity Facts Report Page 40
VI. Attitudes and Opinions
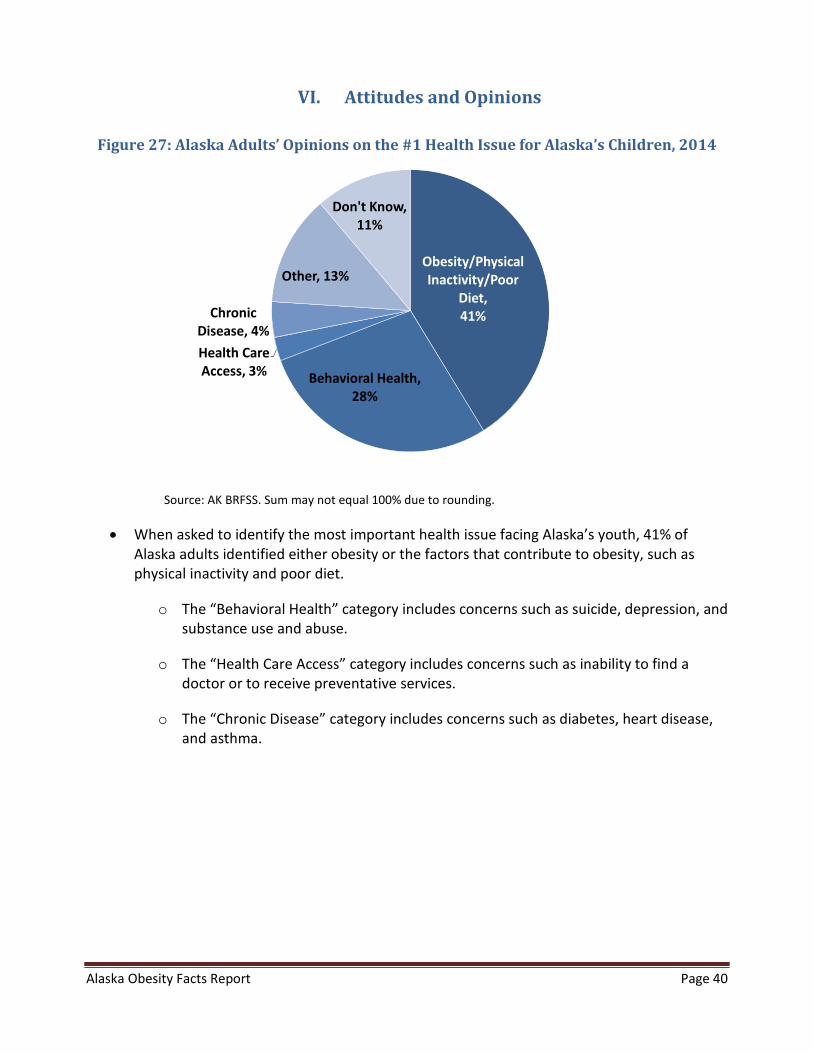
Figure 27: Alaska Adults’ Opinions on the #1 Health Issue for Alaska’s Children, 2014
Obesity/Physical Inactivity/Poor
Diet,41%
Behavioral Health, 28%
Health Care Access, 3%
Chronic Disease, 4%
Other, 13%
Don't Know, 11%
Source: AK BRFSS. Sum may not equal 100% due to rounding.
• When asked to identify the most important health issue facing Alaska’s youth, 41% of Alaska adults identified either obesity or the factors that contribute to obesity, such as physical inactivity and poor diet.
o The “Behavioral Health” category includes concerns such as suicide, depression, and substance use and abuse.
o The “Health Care Access” category includes concerns such as inability to find a doctor or to receive preventative services.
o The “Chronic Disease” category includes concerns such as diabetes, heart disease, and asthma.
Alaska Obesity Facts Report Page 41
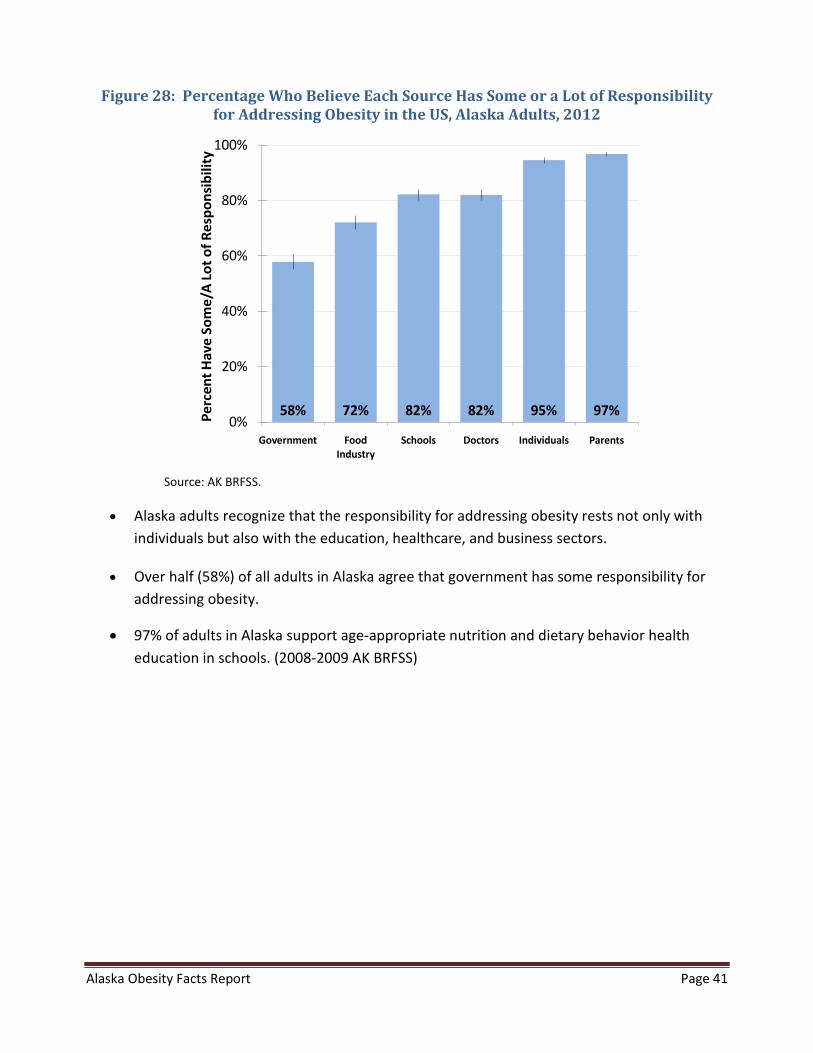
Figure 28: Percentage Who Believe Each Source Has Some or a Lot of Responsibility for Addressing Obesity in the US, Alaska Adults, 2012
58% 72% 82% 82% 95% 97%0%
20%
40%
60%
80%
100%
Government Food Industry
Schools Doctors Individuals Parents
Perc
ent H
ave
Som
e/A
Lot o
f Res
pons
ibili
ty
Source: AK BRFSS.
• Alaska adults recognize that the responsibility for addressing obesity rests not only with individuals but also with the education, healthcare, and business sectors.
• Over half (58%) of all adults in Alaska agree that government has some responsibility for addressing obesity.
• 97% of adults in Alaska support age-appropriate nutrition and dietary behavior health education in schools. (2008-2009 AK BRFSS)

Alaska Obesity Facts Report Page 42
Figure 29: Percentage Who Strongly or Somewhat Support Each Obesity-Prevention Strategy, Alaska Adults, 2012 and 2014
42% 55% 41% 60%0%
20%
40%
60%
80%
100%
Junk Food Tax Junk Food TaxFunding Obesity
Prevention
Soda Tax Soda Tax FundingObesity
Prevention
Perc
ent S
uppo
rt
Source: AK BRFSS.
• A majority of Alaska adults support the idea of taxes on junk food (55%) or soda (60%) as long as the revenue generated would be used to fund childhood obesity prevention efforts (2012 AK BRFSS and 2014 AK BRFSS).
• The percentages of Alaska adults who support taxes on junk food (42%) and soda (41%) regardless of revenue usage have each significantly increased since 2010 (from 34% and 28%, respectively) (2012 AK BRFSS and 2014 AK BRFSS) .
• In addition:
o 65% support requiring restaurants to provide nutritional information on their menus (2012 AK BRFSS)
o 76% support government-funded media campaigns that promote eating right and exercising (2014 AK BRFSS)
o 61% believe schools should not be able to sell soda and other sugar-sweetened beverages on campus (2012 AK BRFSS)
o 68% believe that schools should not be able to sell junk food (such as candy, salty snacks, cookies, or cakes) on campus (2012 AK BRFSS)
Alaska Obesity Facts Report Page 43
VII. School-Based Strategies/Interventions
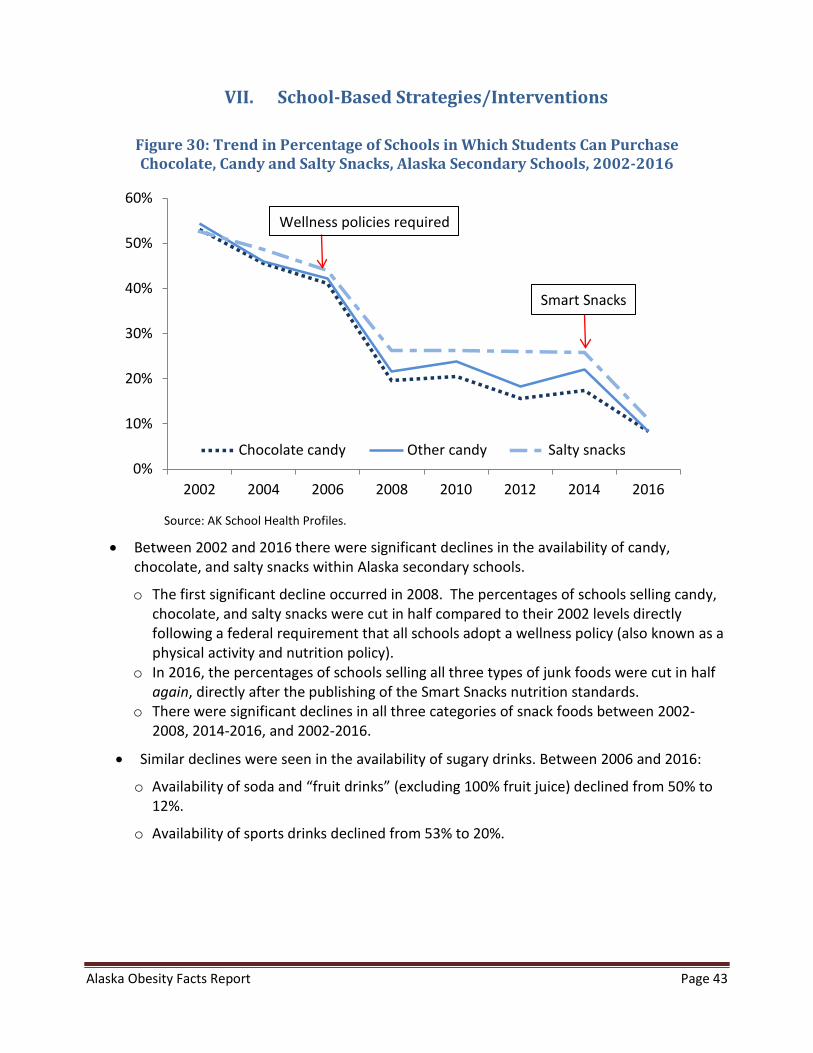
Figure 30: Trend in Percentage of Schools in Which Students Can Purchase Chocolate, Candy and Salty Snacks, Alaska Secondary Schools, 2002-2016
0%
10%
20%
30%
40%
50%
60%
2002 2004 2006 2008 2010 2012 2014 2016
Chocolate candy Other candy Salty snacks
Source: AK School Health Profiles.
• Between 2002 and 2016 there were significant declines in the availability of candy,chocolate, and salty snacks within Alaska secondary schools.
o The first significant decline occurred in 2008. The percentages of schools selling candy,chocolate, and salty snacks were cut in half compared to their 2002 levels directlyfollowing a federal requirement that all schools adopt a wellness policy (also known as aphysical activity and nutrition policy).
o In 2016, the percentages of schools selling all three types of junk foods were cut in halfagain, directly after the publishing of the Smart Snacks nutrition standards.
o There were significant declines in all three categories of snack foods between 2002-2008, 2014-2016, and 2002-2016.
• Similar declines were seen in the availability of sugary drinks. Between 2006 and 2016:
o Availability of soda and “fruit drinks” (excluding 100% fruit juice) declined from 50% to12%.
o Availability of sports drinks declined from 53% to 20%.
Wellness policies required
Smart Snacks
Alaska Obesity Facts Report Page 44
VIII. Disparities in Obesity, Nutrition, and Physical Activity
While the overall prevalence of obesity in Alaska has remained relatively stable in recent years, differences remain among various populations of Alaskans. Disparities in key indicators related to obesity exist across race groups and markers of socioeconomic status like education. Adults with lower education levels and Alaska Native adults are disproportionately at risk for obesity and are less likely to meet nutrition and physical activity guidelines, even after adjusting for differences in sex, age, region, and other demographic characteristics (including race and education).
In this section, we present data on disparities among adults and high school youth by race group, and among adults by education status and household percent of poverty guideline.
Race
In this section we report by three race groups where possible. “Alaska Native” includes respondents who reported being Alaska Native or American Indian, alone or in combination with another race. “White” includes those who reported White as their only race group. “All other races” includes respondents who reported being African American, Asian, Hawaiian/Pacific Islander, or Other (and not Alaska Native), because respondent numbers are generally too low for stable estimates to be reported by individual race groups (other than White and Alaska Native).
Markers of Socio-Economic Status
In the AK BRFSS data, formal education level is strongly associated with obesity, but there is a mixed association for obesity and household percent of Federal Poverty Guideline (PGL). We include household percent of PGL in this report because it is used in determining financial eligibility for certain federal and state assistance programs. The cutpoint of 185% PGL is used in Alaska for WIC and some parts of Medicaid. Working with these assistance and health programs can provide opportunities to address risks associated with obesity and thus help address the burden of obesity more effectively among people of lower socioeconomic status. Additional information about the poverty guideline status measure is included in Section IX, Data Sources, BRFSS, Reporting by Socio-Economic Status (SES). There are notable associations among race, formal education status, and poverty guideline status.
Alaska Obesity Facts Report Page 45
A. Disparities by Race Groups
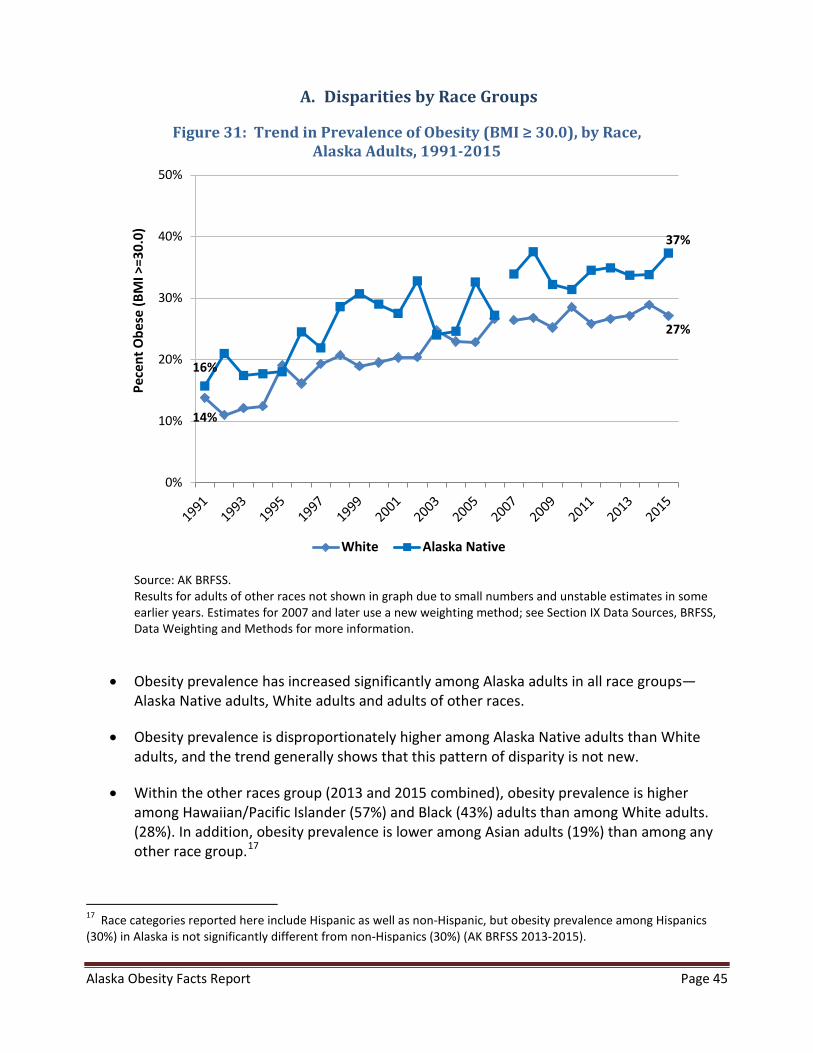
Figure 31: Trend in Prevalence of Obesity (BMI ≥ 30.0), by Race, Alaska Adults, 1991-2015
14%
27%
16%
37%
0%
10%
20%
30%
40%
50%
Pece
nt O
bese
(BM
I >=3
0.0)
White Alaska Native
Source: AK BRFSS. Results for adults of other races not shown in graph due to small numbers and unstable estimates in some earlier years. Estimates for 2007 and later use a new weighting method; see Section IX Data Sources, BRFSS, Data Weighting and Methods for more information.
• Obesity prevalence has increased significantly among Alaska adults in all race groups—Alaska Native adults, White adults and adults of other races.
• Obesity prevalence is disproportionately higher among Alaska Native adults than White adults, and the trend generally shows that this pattern of disparity is not new.
• Within the other races group (2013 and 2015 combined), obesity prevalence is higher among Hawaiian/Pacific Islander (57%) and Black (43%) adults than among White adults. (28%). In addition, obesity prevalence is lower among Asian adults (19%) than among any other race group.17
17 Race categories reported here include Hispanic as well as non-Hispanic, but obesity prevalence among Hispanics (30%) in Alaska is not significantly different from non-Hispanics (30%) (AK BRFSS 2013-2015).
Alaska Obesity Facts Report Page 46
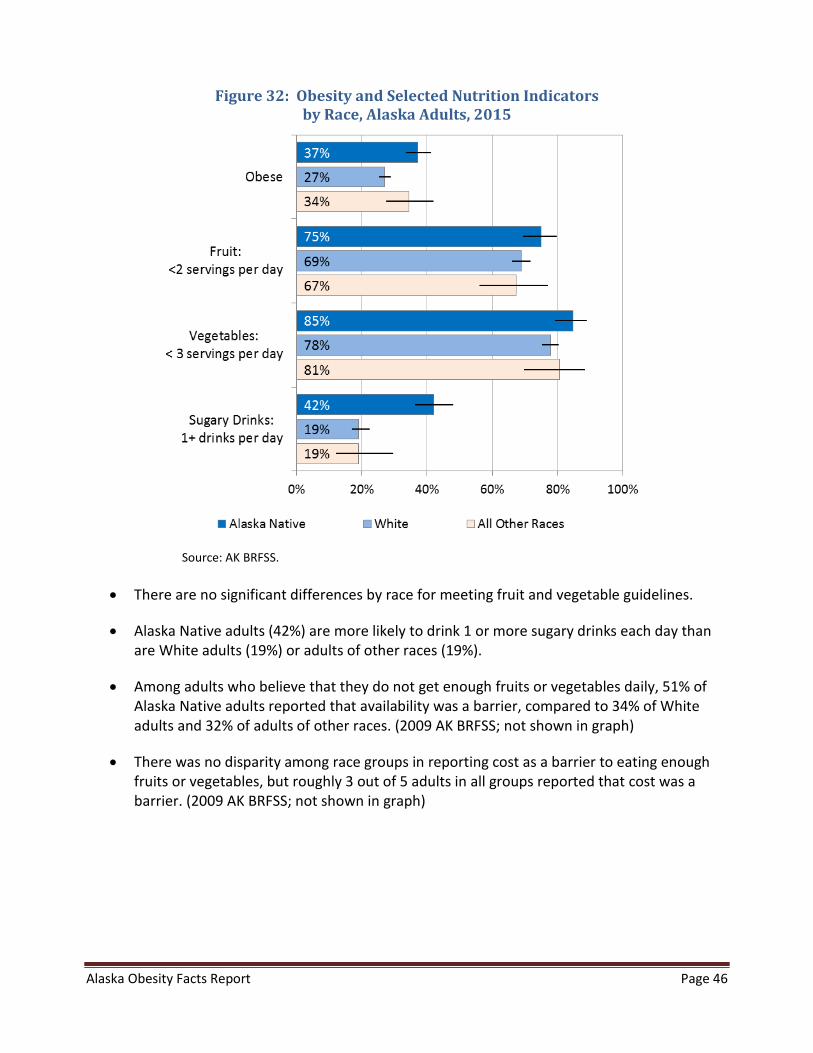
Figure 32: Obesity and Selected Nutrition Indicators by Race, Alaska Adults, 2015
Source: AK BRFSS.
• There are no significant differences by race for meeting fruit and vegetable guidelines.
• Alaska Native adults (42%) are more likely to drink 1 or more sugary drinks each day than are White adults (19%) or adults of other races (19%).
• Among adults who believe that they do not get enough fruits or vegetables daily, 51% of Alaska Native adults reported that availability was a barrier, compared to 34% of White adults and 32% of adults of other races. (2009 AK BRFSS; not shown in graph)
• There was no disparity among race groups in reporting cost as a barrier to eating enough fruits or vegetables, but roughly 3 out of 5 adults in all groups reported that cost was a barrier. (2009 AK BRFSS; not shown in graph)
Alaska Obesity Facts Report Page 47
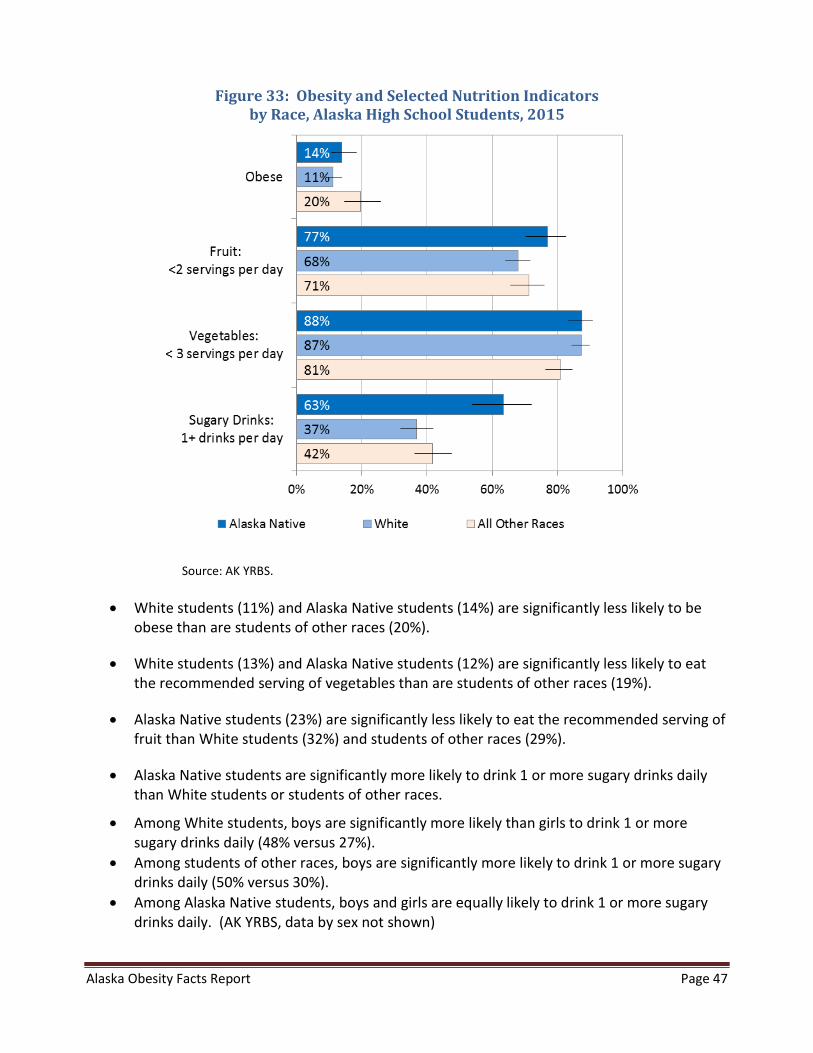
Figure 33: Obesity and Selected Nutrition Indicators by Race, Alaska High School Students, 2015
Source: AK YRBS.
• White students (11%) and Alaska Native students (14%) are significantly less likely to be obese than are students of other races (20%).
• White students (13%) and Alaska Native students (12%) are significantly less likely to eat the recommended serving of vegetables than are students of other races (19%).
• Alaska Native students (23%) are significantly less likely to eat the recommended serving of fruit than White students (32%) and students of other races (29%).
• Alaska Native students are significantly more likely to drink 1 or more sugary drinks daily than White students or students of other races.
• Among White students, boys are significantly more likely than girls to drink 1 or more sugary drinks daily (48% versus 27%).
• Among students of other races, boys are significantly more likely to drink 1 or more sugary drinks daily (50% versus 30%).
• Among Alaska Native students, boys and girls are equally likely to drink 1 or more sugary drinks daily. (AK YRBS, data by sex not shown)
Alaska Obesity Facts Report Page 48
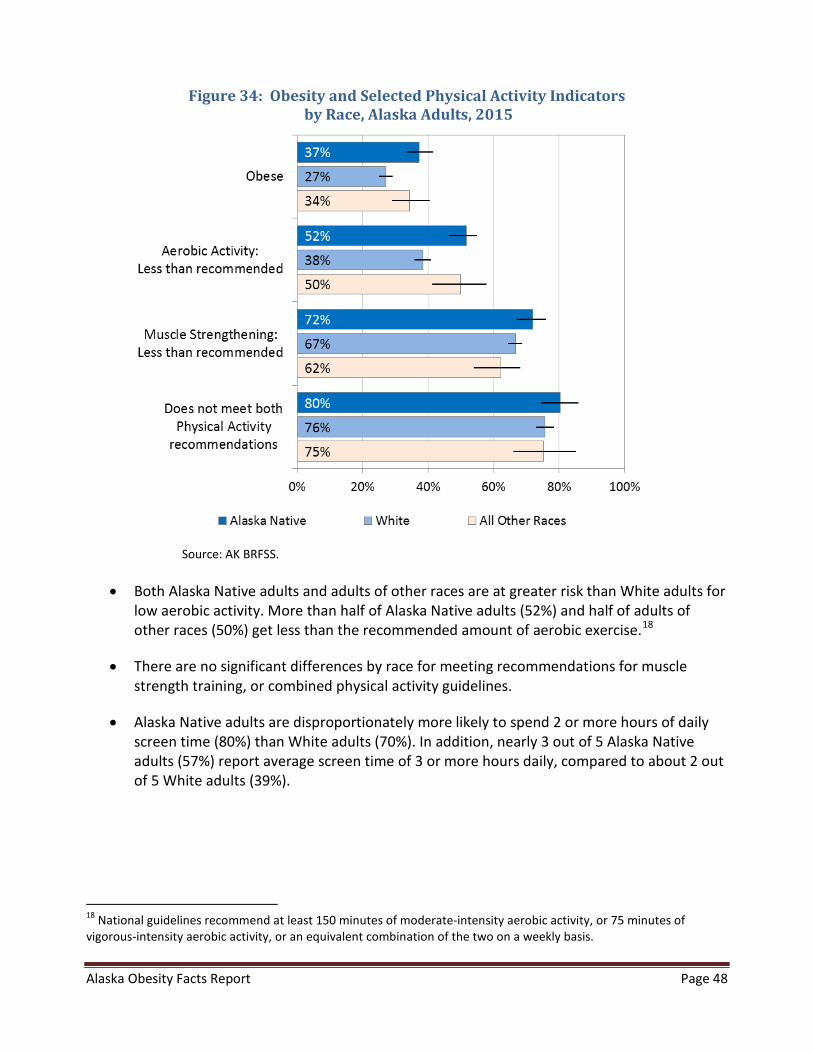
Figure 34: Obesity and Selected Physical Activity Indicators by Race, Alaska Adults, 2015
Source: AK BRFSS.
• Both Alaska Native adults and adults of other races are at greater risk than White adults for low aerobic activity. More than half of Alaska Native adults (52%) and half of adults of other races (50%) get less than the recommended amount of aerobic exercise.18
• There are no significant differences by race for meeting recommendations for muscle strength training, or combined physical activity guidelines.
• Alaska Native adults are disproportionately more likely to spend 2 or more hours of daily screen time (80%) than White adults (70%). In addition, nearly 3 out of 5 Alaska Native adults (57%) report average screen time of 3 or more hours daily, compared to about 2 out of 5 White adults (39%).
18 National guidelines recommend at least 150 minutes of moderate-intensity aerobic activity, or 75 minutes of vigorous-intensity aerobic activity, or an equivalent combination of the two on a weekly basis.
Alaska Obesity Facts Report Page 49
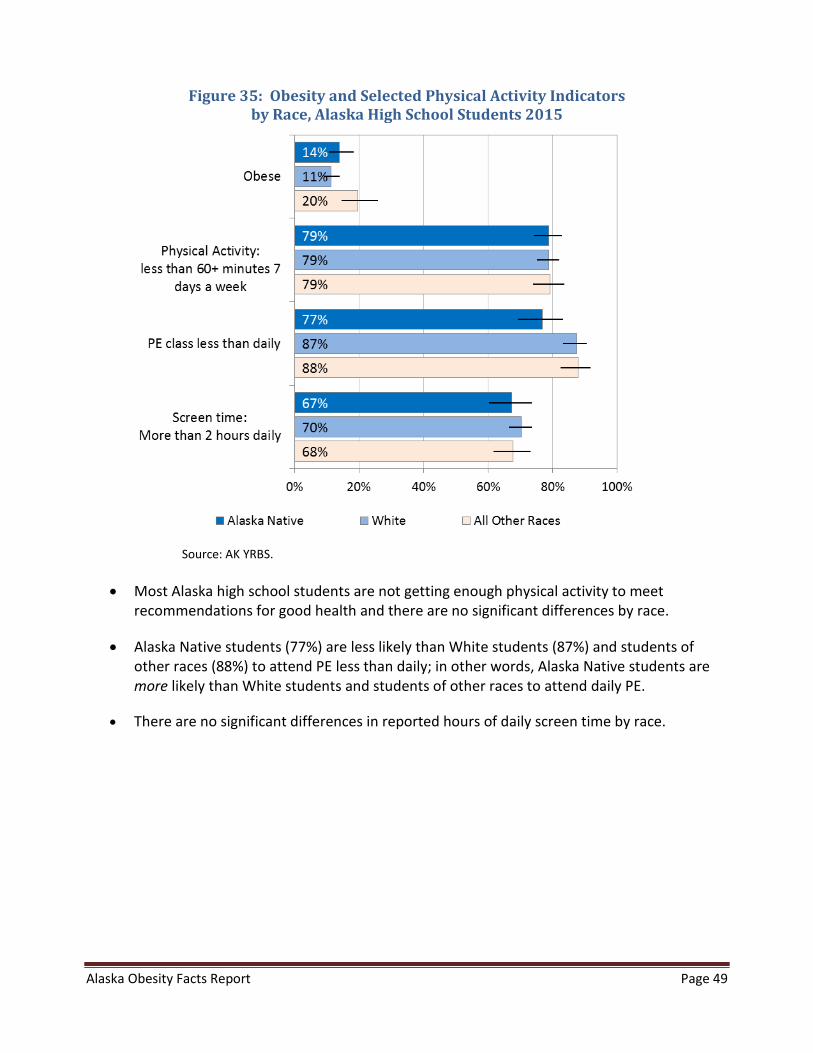
Figure 35: Obesity and Selected Physical Activity Indicators by Race, Alaska High School Students 2015
Source: AK YRBS.
• Most Alaska high school students are not getting enough physical activity to meet recommendations for good health and there are no significant differences by race.
• Alaska Native students (77%) are less likely than White students (87%) and students of other races (88%) to attend PE less than daily; in other words, Alaska Native students are more likely than White students and students of other races to attend daily PE.
• There are no significant differences in reported hours of daily screen time by race.

Alaska Obesity Facts Report Page 50
B. Disparities by Socioeconomic Factors
Figure 36: Obesity by Education and Household Percent of Poverty Guideline Status (PGL), Alaska Adults, 2015
Source: AK BRFSS. Note: Figure 36 shows expanded categories for education, but information in Figures 37 and 39 is reported by 3 categories because multiple health indicators are included in those graphs. The bar colors used above correspond to the collapsed categories used in subsequent figures.
• There are no significant differences in obesity by education level.
• There are no significant differences in obesity by poverty guideline (PGL) status.
Alaska Obesity Facts Report Page 51
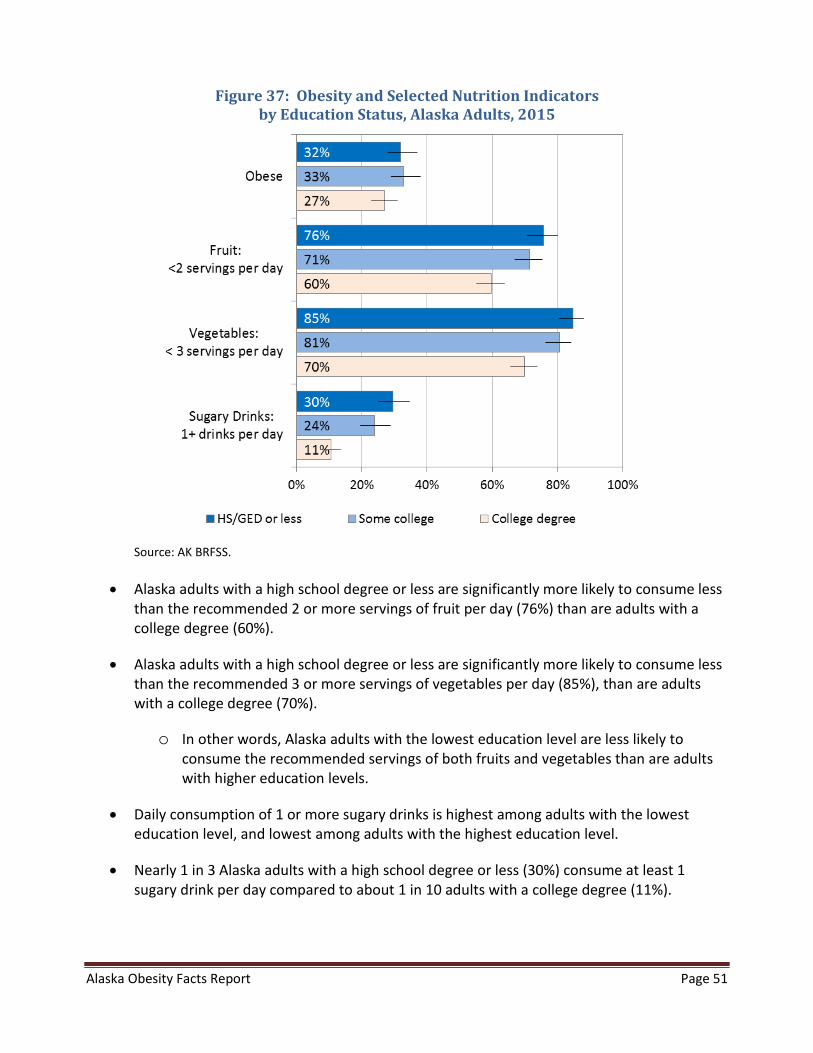
Figure 37: Obesity and Selected Nutrition Indicators by Education Status, Alaska Adults, 2015
Source: AK BRFSS.
• Alaska adults with a high school degree or less are significantly more likely to consume less than the recommended 2 or more servings of fruit per day (76%) than are adults with a college degree (60%).
• Alaska adults with a high school degree or less are significantly more likely to consume less than the recommended 3 or more servings of vegetables per day (85%), than are adults with a college degree (70%).
o In other words, Alaska adults with the lowest education level are less likely to consume the recommended servings of both fruits and vegetables than are adults with higher education levels.
• Daily consumption of 1 or more sugary drinks is highest among adults with the lowest education level, and lowest among adults with the highest education level.
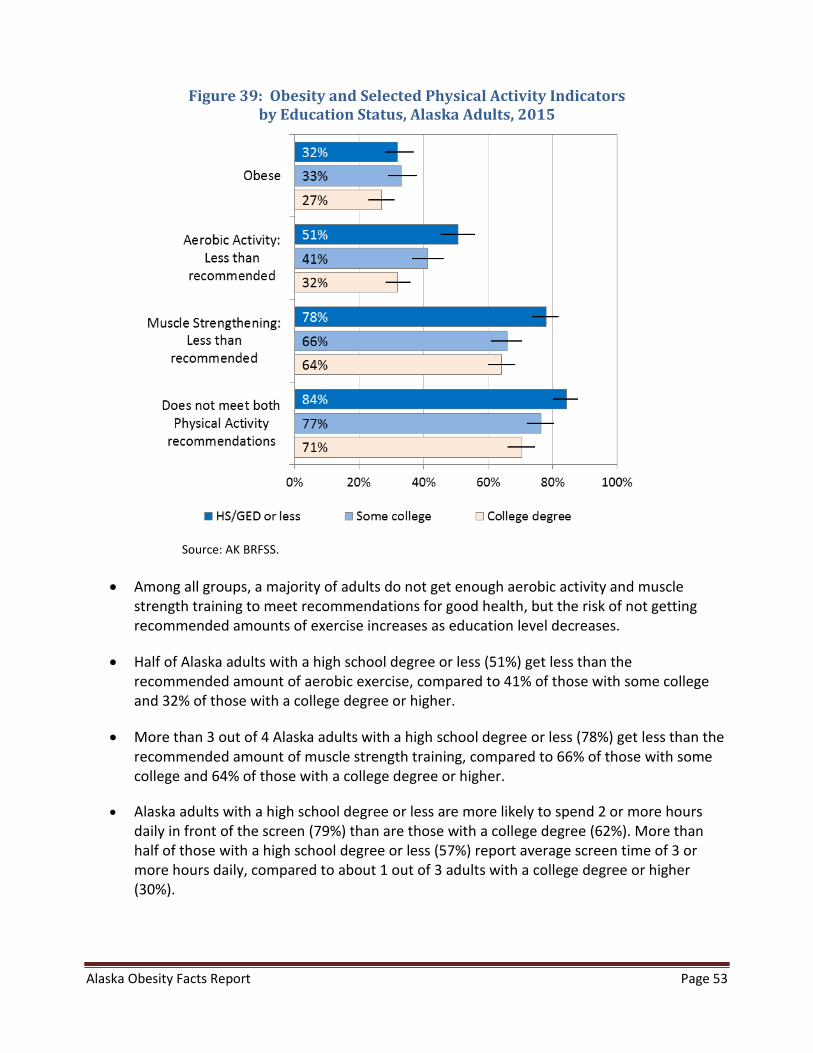
• Nearly 1 in 3 Alaska adults with a high school degree or less (30%) consume at least 1 sugary drink per day compared to about 1 in 10 adults with a college degree (11%).
Alaska Obesity Facts Report Page 52
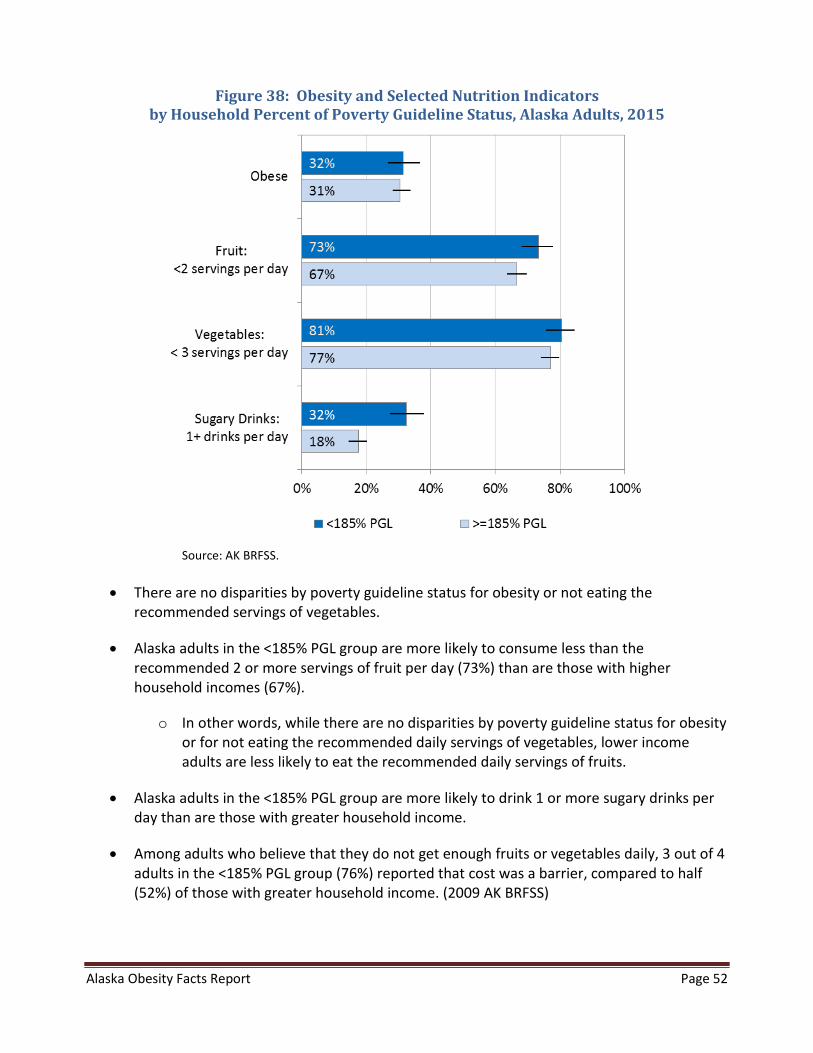
Figure 38: Obesity and Selected Nutrition Indicators by Household Percent of Poverty Guideline Status, Alaska Adults, 2015
Source: AK BRFSS.
• There are no disparities by poverty guideline status for obesity or not eating the recommended servings of vegetables.
• Alaska adults in the <185% PGL group are more likely to consume less than the recommended 2 or more servings of fruit per day (73%) than are those with higher household incomes (67%).
o In other words, while there are no disparities by poverty guideline status for obesity or for not eating the recommended daily servings of vegetables, lower income adults are less likely to eat the recommended daily servings of fruits.
• Alaska adults in the <185% PGL group are more likely to drink 1 or more sugary drinks per day than are those with greater household income.
• Among adults who believe that they do not get enough fruits or vegetables daily, 3 out of 4 adults in the <185% PGL group (76%) reported that cost was a barrier, compared to half (52%) of those with greater household income. (2009 AK BRFSS)
Alaska Obesity Facts Report Page 53
Figure 39: Obesity and Selected Physical Activity Indicators by Education Status, Alaska Adults, 2015
Source: AK BRFSS.
• Among all groups, a majority of adults do not get enough aerobic activity and muscle strength training to meet recommendations for good health, but the risk of not getting recommended amounts of exercise increases as education level decreases.
• Half of Alaska adults with a high school degree or less (51%) get less than the recommended amount of aerobic exercise, compared to 41% of those with some college and 32% of those with a college degree or higher.
• More than 3 out of 4 Alaska adults with a high school degree or less (78%) get less than the recommended amount of muscle strength training, compared to 66% of those with some college and 64% of those with a college degree or higher.
• Alaska adults with a high school degree or less are more likely to spend 2 or more hours daily in front of the screen (79%) than are those with a college degree (62%). More than half of those with a high school degree or less (57%) report average screen time of 3 or more hours daily, compared to about 1 out of 3 adults with a college degree or higher (30%).
Alaska Obesity Facts Report Page 54
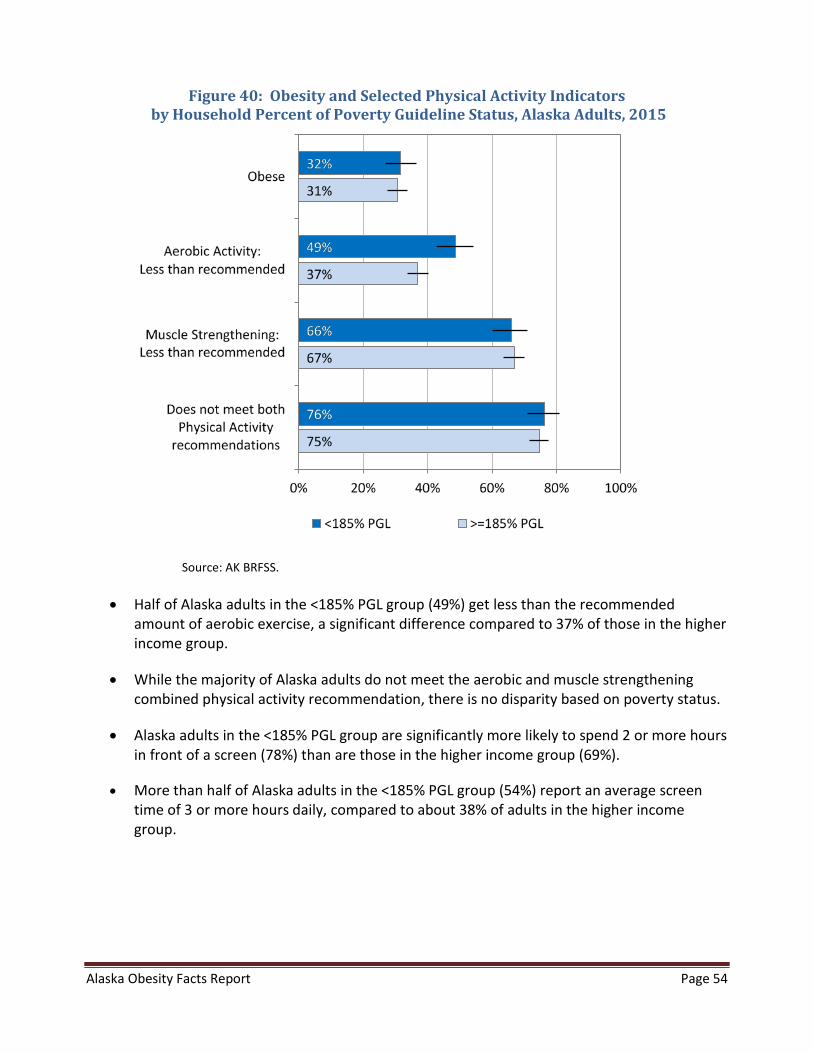
Figure 40: Obesity and Selected Physical Activity Indicators by Household Percent of Poverty Guideline Status, Alaska Adults, 2015
Source: AK BRFSS.
• Half of Alaska adults in the <185% PGL group (49%) get less than the recommended amount of aerobic exercise, a significant difference compared to 37% of those in the higher income group.
• While the majority of Alaska adults do not meet the aerobic and muscle strengthening combined physical activity recommendation, there is no disparity based on poverty status.
• Alaska adults in the <185% PGL group are significantly more likely to spend 2 or more hours in front of a screen (78%) than are those in the higher income group (69%).
• More than half of Alaska adults in the <185% PGL group (54%) report an average screen time of 3 or more hours daily, compared to about 38% of adults in the higher income group.
Alaska Obesity Facts Report Page 55
IX. Data Sources
Behavioral Risk Factor Surveillance System (BRFSS)
The BRFSS is an anonymous telephone survey conducted by the Alaska Division of Public Health in cooperation with the Centers for Disease Control (CDC). It aims to estimate the prevalence of behavioral risk factors in the general population that are known to be associated with the leading causes of morbidity and mortality in adults. The BRFSS has operated continuously in Alaska since 1991.
Alaska presently conducts two BRFSS surveys: the standard BRFSS and a separately funded supplemental BRFSS. Both surveys are conducted throughout the year, using separate samples drawn using the same methodology. In 2015, approximately 690 Alaska adults were interviewed each month for the two BRFSS surveys combined. The 2015 sample includes 2,520 respondents reached by cell phone and 5,721 respondents reached by their residential landline phone. Because sample size is lower for some subpopulation reporting groups, data years have occasionally been combined to report some key indicators.
Selection of BRFSS Survey Participants
The BRFSS uses a probability (or random) sample in which all Alaska households with landline telephones have a known, nonzero chance of selection. Respondents are randomly selected from among the adult members of each household reached through a series of telephone calls. Historically, those living in institutional housing (i.e., nursing homes and barracks) are not surveyed. The sample is stratified into geographic regions, with roughly equal numbers of interviews conducted in each region. This method deliberately oversamples rural areas of the state. The sample was stratified into six geographic regions in 2011—Anchorage, Mat-Su, Gulf, Southeast, Fairbanks North Star, and Rural. Where possible, the rural region is divided into two regions: Southwest and Northern/Interior.
In addition, the sampling frame has been expanded to include cell phones as well as landline or household phones. This step was important because the proportion of households served only by cell phones has increased rapidly. By June 2010, about 20% of Alaska households were cell-only. Starting in 2011, Alaska’s cell phone sample was large enough to include it in weighting and reporting of data.
Interviews are conducted by trained interviewers during weekdays, evenings, and weekends throughout the year. In addition to obesity and related risk factors, the BRFSS questionnaire covers such topics as general health status, health care access, tobacco use, diabetes, alcohol use,

Alaska Obesity Facts Report Page 56
women’s health, injury prevention, and HIV/AIDS awareness. There are also questions on the demographic characteristics of respondents.
Data Weighting and Methods
BRFSS data are weighted to adjust the distribution of the sample data so that it reflects the total population of the sampled area, and to compensate for the over-representation or under-representation of persons in various subgroups.
Changes in both the weighting and sampling methods are reflected in the estimates reported in this update of Obesity Facts. These changes help ensure that the BRFSS can continue to be a valuable source of information for health planning and improvement. The first change is a new weighting method known as iterative proportional fitting, or raking. Raking allows for the inclusion of several key demographic factors in adjusting survey data to the adult population totals. To provide additional context for interpretation about changes in prevalence estimates over time, raking was applied to data from 2007 forward, and therefore the estimates listed for 2007 through 2010 may be slightly different from estimates reported in earlier publications.
As noted above, starting in 2011 survey participants include people who only have cell phones, in addition to those who have a traditional landline phone. Therefore, 2011 and future data will reflect the population of cell-only Alaska adults as well as those who have landline only or landline and cell phones. More information about the changes in BRFSS methods can be found in the January 2013 issue of Chronicles: http://dhss.alaska.gov/dph/Chronic/Documents/Publications/assets/ChroniclesV5-1.pdf .
Both the standard and supplemental BRFSS are weighted (separately) for analysis of items that occur only in one version. In addition, a combined dataset (standard plus supplemental) is created and weighted for analysis of questions that occur in both versions. In recent years, the combined sample has included more respondents (about 6,100 in 2011), and between 8,000 and 9,000 each year from 2012 to 2015, but prior years included fewer respondents. Between 1996 and 2003 annual sample size ranged from about 1,500 to 2,900 respondents, and from 2004 to 2010, the annual combined sample size averaged about 4,750 respondents. The larger sample sizes allow for more precision in the estimates for obesity. Most other indicators for adult physical activity and nutrition measures came from questions asked only on one version of the questionnaire, for which sample sizes were about half of the combined total.
In this report, we used chi-square tests in our comparisons between groups of Alaskans. Chi-square tests are tests of association between group and outcome variables (for example, meets
Alaska Obesity Facts Report Page 57
physical activity recommendation [yes, no] and sex [male, female]). For trend analyses, we used logistic regression models that tested for a statistically significant linear change over time.
Reporting by Socio-Economic Status (SES)
Household percent of Federal Poverty Guideline (as calculated by income and number of people in the household) and education are identified as indicators of socio-economic status (SES) in the BRFSS data. Formal education status is categorized in four groups—less than high school, high school degree or GED, some college (or less than 4-year program degree) and 4-year college degree or higher.
The poverty guidelines, issued each year in the Federal Register by the Department of Health and Human Services (HHS), are a simplified version of the federal poverty thresholds and are used for administrative purposes — for instance, determining financial eligibility for certain federal programs.19 The Alaska-specific guideline totals were used to create a cut-point of household incomes at or below the 185% poverty guideline20 for this report, because this percent corresponds with eligibility criteria for the Supplemental Nutrition Assistance Program (SNAP), the Special Supplemental Nutrition Program for Women, Infants, and Children (WIC), and some parts of Medicaid, among other programs.
There are limitations in using income or percent of poverty guideline in the BRFSS. Income information is reported in range categories in the BRFSS, and therefore the correspondence to categories for percent of poverty guideline is sometimes approximate. In 2015, the dollar amounts for 185% poverty level guideline is higher than the income levels we ask about for households of 6 or more people. Because the highest income category asked is $75,000 or more, we use $85,000 as the estimated household income for 6 or 7 people who reported incomes of $75,000 or more. We set records to missing for households with 8 or more people and reported income of $75,000 or more (n=19). In addition, household income is often missing, as many respondents either decline to answer the question or report that they do not know their household income level. In 2015, about 11% of Alaska BRFSS respondents were missing information about income – about 5% reported that they did not know. We were unable to calculate household percent of poverty guideline for respondents with missing information about income.
Reporting by Race Group
“Alaska Native” includes all survey respondents who report being Alaska Native/American Indian, alone or in combination with another race. Comparison groups are those who report their race as
19 More information about the poverty guideline can be found here: https://aspe.hhs.gov/poverty-guidelines 20 In Alaska in 2017, a family of three with a household income of $47,212 would be at 185% of the HHS poverty guideline.
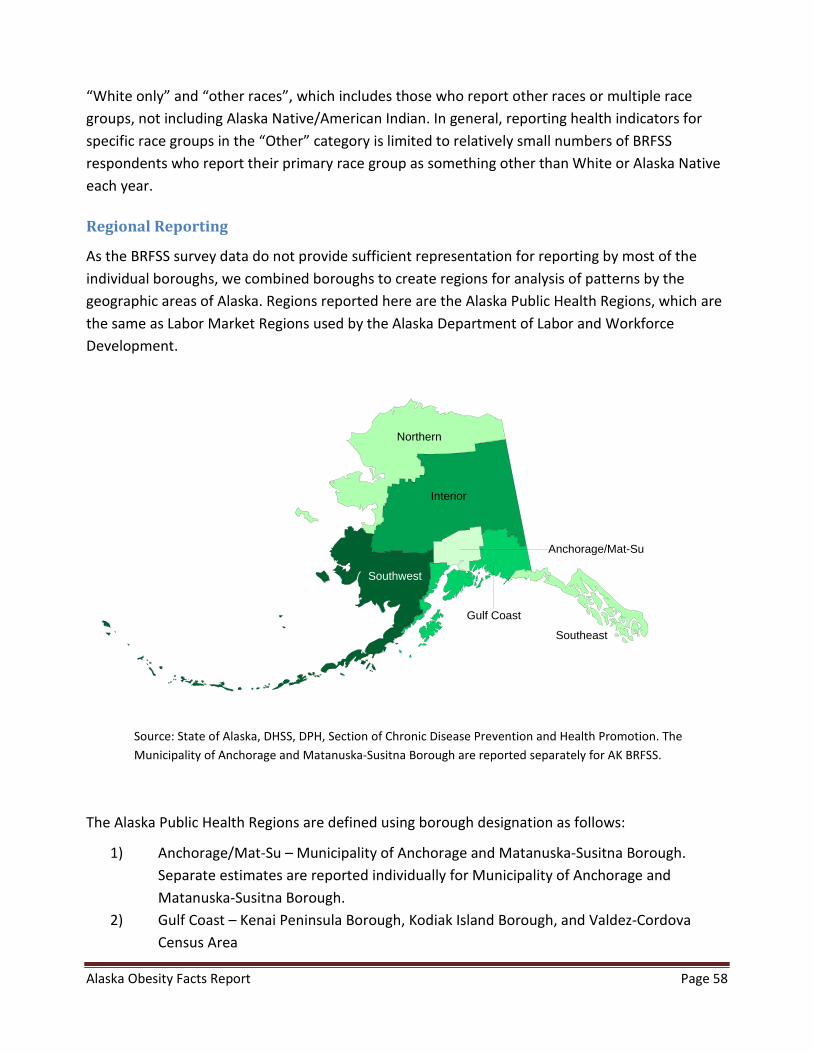
Alaska Obesity Facts Report Page 58
“White only” and “other races”, which includes those who report other races or multiple race groups, not including Alaska Native/American Indian. In general, reporting health indicators for specific race groups in the “Other” category is limited to relatively small numbers of BRFSS respondents who report their primary race group as something other than White or Alaska Native each year.
Regional Reporting
As the BRFSS survey data do not provide sufficient representation for reporting by most of the individual boroughs, we combined boroughs to create regions for analysis of patterns by the geographic areas of Alaska. Regions reported here are the Alaska Public Health Regions, which are the same as Labor Market Regions used by the Alaska Department of Labor and Workforce Development.
Source: State of Alaska, DHSS, DPH, Section of Chronic Disease Prevention and Health Promotion. The Municipality of Anchorage and Matanuska-Susitna Borough are reported separately for AK BRFSS.
The Alaska Public Health Regions are defined using borough designation as follows:
1) Anchorage/Mat-Su – Municipality of Anchorage and Matanuska-Susitna Borough. Separate estimates are reported individually for Municipality of Anchorage and Matanuska-Susitna Borough.
2) Gulf Coast – Kenai Peninsula Borough, Kodiak Island Borough, and Valdez-Cordova Census Area
Gulf Coast
Anchorage/Mat-Su
Southwest
Northern
Southeast
Interior
Alaska Obesity Facts Report Page 59
3) Interior – Denali Borough, Fairbanks North Star Borough, Southeast Fairbanks Census Area, and Yukon-Koyukuk Census Area
4) Northern – Nome Census Area, North Slope Borough, and Northwest Arctic Borough 5) Southeast – Haines Borough, Hoonah-Angoon Census Area, Juneau City and Borough,
Ketchikan Gateway Borough, Petersburg Census Area, Prince of Wale-Hyder Census Area, Sitka City and Borough, Skagway Municipality, Wrangell City and Borough, and Yakutat City and Borough
6) Southwest – Aleutians East Borough, Aleutians West Census Area, Bethel Census Area, Bristol Bay Borough, Dillingham Census Area, Lake and Peninsula Borough, and Kusilvak Census Area
Childhood Understanding Behaviors Survey (CUBS)
Alaska CUBS is a program designed to find out more about the health and early childhood experiences of young children in Alaska. CUBS collects information by conducting a follow-up survey to the Alaska Pregnancy Risk Assessment Monitoring System (PRAMS). PRAMS sends a survey to approximately one of every 6 mothers of newborns in Alaska, and CUBS sends a follow-up survey three years later to all mothers who completed PRAMS and are still living in Alaska. CUBS asks questions about both the mother and her child. About 90 Alaskan mothers are sent a CUBS survey every month.
The purpose of CUBS is to provide information on health conditions, health care utilization, child development and other health related behaviors of young children and to evaluate the association between prenatal and immediate postnatal factors with early childhood health and welfare. The CUBS asks questions about both the mother and her child. Survey responses are weighted so that reported prevalence accurately describe all mothers of 3-year old children born in Alaska in a single calendar year. Both the CUBS and PRAMS data (described below) can be presented regionally, using the same public health regions shown in the map for BRFSS (see Regional Reporting above). See http://dhss.alaska.gov/dph/wcfh/Pages/mchepi/cubs/CUBS_main.aspx for more information about CUBS questionnaires and methodology.
Alaska Obesity Facts Report Page 60
Pregnancy Risk Assessment Monitoring System (PRAMS)
The PRAMS is a population-based survey of Alaska women who have recently delivered a live-born infant. Administered since 1990 by the Alaska Division of Public Health, PRAMS is conducted in collaboration with the CDC to gather information on the health risk behaviors and circumstances of pregnant and postpartum women. Forty-seven states, New York City, Puerto Rico, the District of Columbia and the Great Plains Tribal Chairmen’s Health Board (GPTCHB) currently participate in PRAMS. A systematic stratified sample is drawn each month from the state’s live birth records for infants between 2 and 6 months of age. Sampled mothers receive a series of mailed questionnaires, and since 1997 telephone follow-up has been initiated among those who do not respond to the third mailed request. The PRAMS questionnaire addresses such topics as content and source of prenatal care, breastfeeding, maternal alcohol and tobacco consumption, contraceptive use, economic status, maternal stress, physical abuse, and infant care. Survey responses are weighted so that reported prevalence estimates accurately describe Alaska women delivering a live-born infant during the year of the survey. The weighted response rate was 65% in 2012, 69% in 2013, and 65% in 2014. See http://dhss.alaska.gov/dph/wcfh/Pages/mchepi/prams/default.aspx for more information about PRAMS questionnaires and methodology.
School Health Profiles
The School Health Profiles (Profiles) is a system of surveys assessing school health policies and practices in states, territories, and large urban school districts. Profiles surveys are conducted biennially among representative samples of middle and high school principals and lead health education teachers. Profiles Reports can be found on the School Health Program website: http://dhss.alaska.gov/dph/Chronic/Pages/SchoolHealth/profiles.aspx.
Student Weight Status Surveillance System (SWSSS)
SWSSS is comprised of Alaska student weight status data obtained voluntarily from partner school districts that have contributed their data as a means of monitoring obesity trends. Participating school districts provide the Department of Health and Social Services (DHSS) de-identified student data (i.e., measured height and weight, age, and sex). DHSS conducts the analysis to generate body mass index (BMI) percentile, and the associated weight status classifications of underweight, healthy weight, overweight and obese, as described in Section I, Introduction. SWSSS data differs slightly from other data sources by reporting ‘American Indian/Alaska Native’ on breakdowns by race because that is how the data is shared with OPCP.

Alaska Obesity Facts Report Page 61
School districts across the state vary in the grades for which they routinely collect height and weight data. Some districts aim to measure and weigh every student, every year, while other districts target only students in Kindergarten, 1st, 3rd, 5th and 7th grades. The following school districts have participated in SWSSS in various years since its inception: Anchorage, Dillingham, Kenai Peninsula Borough, Ketchikan Gateway Borough, Kodiak Island Borough, Matanuska-Susitna Borough, Nome, North Slope Borough, Petersburg, and Sitka. Individual school district weight status reports are available at http://dhss.alaska.gov/dph/Chronic/Pages/Obesity/weightstatus.aspx .
Youth Risk Behavior Survey (YRBS)
The YRBS is a systematic survey of high school students that assesses behaviors related to the leading causes of mortality, morbidity and social problems among youth. The Centers for Disease Control and Prevention (CDC) sponsors national and state surveys every 2 years, most recently in 2017. Data are currently available through 2015.
Selection of YRBS Survey Participants
The statewide Alaska YRBS uses a two-stage sampling design. The CDC randomly selects schools for inclusion in the survey, taking into account school size. Once a school is chosen, classes are selected, with each student having an equal opportunity for inclusion. From 2003 through 2017, active parental consent was required for each student participating in the YRBS. On the appointed survey day students completed written questionnaires without any identifying information and returned them in class in unmarked, sealed envelopes.
In addition to the statewide survey, all Alaska school districts have the opportunity to conduct a local survey, which employs the same questionnaire and data analysis methods as the statewide survey. If a district conducts a local survey and one of its classrooms was selected for the statewide survey, additional classrooms will be surveyed as part of the local survey. Districts that conduct a local survey and meet the YRBS program’s minimum threshold of student responses receive a district level report based on results of all classrooms surveyed.
Data Weighting and Methods
In a typical YRBS administration, about 1,300 to 1,400 students are surveyed from about 40 to 45 high schools that are scientifically selected to represent all public high schools (excluding alternative schools, correspondence and home study schools, and correctional schools) in Alaska. These results are considered to be representative of Alaska’s more than 30,000 high school students in grades 9-12 in traditional public high schools. Data are weighted to reflect the true
Alaska Obesity Facts Report Page 62
distribution of Alaska high school students by sex and grade level, but not by region of the state, since the CDC’s sampling method for YRBS does not stratify by region.
Alaska first conducted a statewide YRBS in 1995. Although Alaska participation rates met CDC standards in 1999, this sample did not include Anchorage schools and so the 1999 YRBS data are generally not included in multi-year analyses. To assure statistical validity for weighting, the CDC requires a response rate of at least 60% for the statewide survey. In addition to the 1995 survey, Alaska achieved a representative sample on the statewide survey in 2003, and 2007 through 2015.
Analyses used for YRBS data are similar to those used for BRFSS. We used chi-square tests in our comparisons between groups of Alaskans, and for trend analyses we used logistic regression models that tested for a statistically significant linear change over time. P-values less than 0.05 indicate that a difference seen between percentages or across years is statistically significant at the 95% confidence level.
School-based surveys do not estimate risk behaviors associated with youth who drop out of school or do not attend school. However, for the first time in 2009, about 1,000 students from 15 alternative high schools in Alaska were surveyed to evaluate and address the health risks of this unique population. This process was repeated in subsequent surveys in 2011, 2013, and 2015 (with 16 alternative high schools). High school-age youth in correctional institutions have also been surveyed since 2009. Further information about the Alaska YRBS surveys and health information from those surveys is available at http://dhss.alaska.gov/dph/Chronic/Pages/yrbs/yrbs.aspx.
Reporting by Race Group
All YRBS survey participants who report being Alaska Native, either alone or in combination with other race groups or Hispanic ethnicity, are categorized in this report as being Alaska Native. Survey participants who report being White (non-Hispanic) are categorized as White, and all other race groups are combined to report as “other races”. This category includes students who report being Hispanic, African American, Asian, Hawaiian or Other Pacific Islander, or who report multiple race groups (except for Alaska Native). Those who did not report a race and ethnicity are not included in the race group reporting.
Alaska Obesity Facts Report Page 63
Women, Infants and Children (WIC) Nutrition Program
WIC is a supplemental food and nutrition program for pregnant and breastfeeding women and their children from birth to age 5. Alaska WIC provides nutrition information, counseling, breastfeeding support, and periodic health screening, along with supplemental food vouchers for infant formula and healthy foods. Children’s height and weight are measured and recorded at clinics as part of the application and renewal process. Alaska data are available at the United States Department of Agriculture, Food and Nutrition Service website: https://www.fns.usda.gov/pd/wic-program.

Alaska Obesity Prevention & Control Program
www.hss.state.ak.us/dph/chronic/obesity/

www.hss.state.ak.us/dph/chronic/obesity/ALASKA DIVISION OFPublic Health
Preve
ntion Promotion Protection
STATE of ALASKA
Department of Health and So
cia
l Ser
vice
s