the burden of overweight and obesity in alaska
TRANSCRIPT

STATE of ALASKA
Department of Health and So
cia
l Ser
vice
s
State of AlaskaDepartment of Health and Social Services
February 2010
Overweight & Obesityin Alaska
The Burden of

Sean Parnell, GovernorState of Alaska
William H. Hogan, MSW, CommissionerDepartment of Health and Social Services
Ward B. Hurlburt, M.D., MPH, Chief Medical OfficerDirector, Division of Public Health
Kathy Allely, MPH, Section ChiefSection of Chronic Disease Prevention and Health Promotion
Obesity Prevention and Control ProgramPhone: 907.269.2020
Email: [email protected]
Available from: www.hss.state.ak.us/dph/chronic/pubs/
Suggested CitationFenaughty A, Fink K, Peck D, Wells R, Utermohle C, Peterson E. The Burden of Overweight and Obesity in Alaska.
February 2010. Anchorage, AK: Section of Chronic Disease Prevention and Health Promotion, Division of Public Health, Alaska Department of Health and Social Services.

Executive Summary………………………………………………………….1
Introduction…………………………………………………………………..4
Health Consequences of Overweight and Obesity ............................................................ 5
Economic Consequences of Overweight and Obesity....................................................... 5
Causes of Overweight and Obesity ................................................................................... 5
Purpose and Organization of Report ................................................................................. 5
Measuring Overweight, Obesity, Contributing Factors and Consequences ...................... 6
Weight Status in Alaska……………………………………………………...8
Adults ................................................................................................................................. 8
Trends ............................................................................................................................. 8
Current Status ............................................................................................................... 12
Youth - High School Students .......................................................................................... 20
Trends ........................................................................................................................... 20
Current Status ............................................................................................................... 21
Other Youth Populations .................................................................................................. 24
Women, Infant, and Children’s Program (WIC) .......................................................... 24
Resource Patient Management System (RPMS) .......................................................... 24
Anchorage School District ........................................................................................... 26
Other Youth Populations: Summary ........................................................................... 28
The Impact of Obesity………………………………………………………29
Health Status .................................................................................................................... 29
Academic Performance ................................................................................................... 33
Contributing Factors………………………………………………………..34
Physical Inactivity ............................................................................................................ 35
Adults ........................................................................................................................... 35
High School Youth ....................................................................................................... 54
TV and Screen Time ......................................................................................................... 62
Adults ........................................................................................................................... 62
High School Youth ....................................................................................................... 64
Nutrition ........................................................................................................................... 68
Fruit and Vegetable Consumption ................................................................................ 68
Sugar-Sweetened Beverage Consumption ................................................................... 72

Milk Consumption ........................................................................................................ 80
Nutrition Knowledge - Adults ...................................................................................... 82
Nutrition Environment.................................................................................................. 87
Breastfeeding ................................................................................................................ 89
Strategies to Reduce Obesity……………………………………………….91
Individual Strategies: Weight Management ..................................................................... 91
Adults ........................................................................................................................... 91
High School Youth ....................................................................................................... 96
Policy and Systems Strategies ........................................................................................ 100
Recommendations…………………………………………………………102
Appendix…………………………………………………………………...104
Description of Data Sources ........................................................................................... 104
Anchorage School District (ASD) .............................................................................. 104
Behavioral Risk Factor Surveillance System (BRFSS).............................................. 104
Childhood Understanding Behaviors Survey (CUBS) ............................................... 105
Pregnancy Risk Assessment Monitoring System (PRAMS) ...................................... 105
Resource and Patient Management System (RPMS) ................................................. 105
Youth Risk Behavior Survey (YRBS) ........................................................................ 106
Women, Infants, and Children (WIC) Nutrition Program .......................................... 106
References………………………………………………………………….107

Overweight and obesity are on the rise in Alaska, affecting individuals of all ages, from all
areas of the state, of all racial and ethnic backgrounds, and with all levels of education and
income. This relatively rapid increase in obesity rates will have lasting impacts on the health
and quality of life of Alaskans, as well as on the healthcare system long into the future. Two
out of 3 Alaska adults are overweight or obese, and many of these adults are already or will
soon be dealing with obesity-related health issues, such as diabetes, heart disease, cancer and
high blood pressure. Alaska’s youth are affected by obesity as well, and they too will be
facing significant obesity-related chronic diseases in their future.
The Burden of Overweight and Obesity in Alaska provides a comprehensive review of existing
data that describe the extent of overweight and obesity in Alaska, and related nutrition and
physical activity factors. The following are key findings from the report.
Between 1991 and 2007, the percentage of adults above a normal weight (i.e.,
overweight or obese) went from about half (49%) to nearly two-thirds (66%) of the
adult population. During this time obesity rates doubled (from 13% to 27%); rates of
overweight remained relatively flat.
27% of high school youth are above a normal weight, with 11% obese.
36% of K-12 students in the largest school district in Alaska are above a normal
weight, including 33% of Kindergartners and first graders.
Overweight and obesity are seen in all demographic subgroups in Alaska; however,
disparities do exist. Adults with the highest rates of obesity are:
o American Indians/Alaska Natives (31%) compared to White Alaskans (25%)
o Older Alaskans (e.g., 55- to 64-year-olds (33%) compared to 18- to 24-year-
olds (13%))
o Women with low household incomes (less than $15,000 annually; 39%)
compared to women with incomes over $75,000 (22%)
o Women with little educational attainment (less than high school; 33%)
compared to women who have graduated from college (22%)
o Alaskans living in rural Alaska (30%) compared to all other regions (25%-
26%)
Obesity is associated with a number of poor health outcomes among Alaska adults.
For example, compared to those who are normal weight or underweight, obese
Alaskans are:
o twice as likely to report their health status as fair or poor (21% vs.10%)

o more than twice as likely to have high blood pressure (37% vs. 15%)
o 6 times more likely to have diabetes (13% vs. 2%)
Obesity and its contributors are linked to poor academic performance among Alaska
high school youth. For example, 72% of normal weight students report getting mostly
A’s and B’s, compared to only 56% of obese students.
27% of Alaska adults are not getting the recommended levels of physical activity.
There are many disparities associated with meeting these recommendations, and the
most common reason cited for not getting more physical activity is ―not enough time.‖
Only 19% of high school students are getting the recommended 60 minutes of physical
activity daily. Almost half (46%) of boys and 61% of girls reported having no PE class
in the previous week.
One-third of adults and half of high school students have 3 or more hours of screen
time (television time plus computer time not for work or school) daily.
75% of adults and 84% of high school students eat less than the recommended
amounts of fruits and vegetables daily.
22% of high school youth drink 1 or more non-diet soda per day; American Indian/
Alaska Native girls are significantly more likely to do so (35%) than are White girls
(11%). Consumption of soda and other sugar-sweetened beverages is even common
among 2-year-olds—29% of toddlers statewide and 58% in the northern and southwest
parts of Alaska consumed some in the previous day.
Awareness of the recommendations regarding fruit and vegetable consumption is
associated with sex, race, income, education, and region of the state.
Access to healthy food in local stores is judged to be difficult or impossible for 15% of
Alaska adults; 30% rate access to healthy food in local restaurants as difficult or
impossible.
Breastfeeding initiation and duration have increased significantly in Alaska over the
past 15 years.
Many adults have an inaccurate perception of their weight status. For example, 55% of
those who are overweight identify themselves as such, and only 20% of those who are
obese see themselves that way.
Most adults (75%) and high school youth (63%) are trying to lose weight or maintain
their current weight. Exercise is the most commonly reported strategy for weight

management among both adults (76%) and youth (81%), followed closely by changes
to diet (adults, 69%; youth, 53%).
Over 90% of adults believe that parents and individuals have some or a lot of
responsibility for addressing obesity; 62% believe government has some
responsibility.
A majority of Alaska adults support school policies that would limit the availability of
unhealthy foods in schools. In addition, 79% of Alaska adults support or strongly
support a government-funded obesity prevention media campaign, and 55% support a
law requiring restaurants to include nutrition information on their menus.
Reversing the increasing trend of obesity will require time and a comprehensive obesity
prevention program model that combines educational, clinical, environmental, and social
strategies. This is the only approach that will help Alaskans address the many factors that
contribute to overweight and obesity, chronic illness and even premature death. Intervention
efforts must help children, adolescents and adults develop lifelong healthy habits and also
ensure that the environments in which they live, attend school, work and play support healthy
activity and eating choices.

In the United States, the increase in overweight and obesity has been so substantial and
dramatic that it is commonly described as epidemic.1 The epidemic has spread through all 50
states, within all racial and ethnic subgroups, and among all socioeconomic and age groups.
According to the Institute of Medicine, ―…we have learned that excess weight has significant
and troublesome health consequences‖, yet ―we nevertheless see our population, in general,
and our children, in particular, gaining weight to a dangerous degree and at an alarming rate.‖2
As is the case nationally, overweight and obesity are on the rise in Alaska, affecting
individuals of all ages, from all areas of the state, of all racial and ethnic backgrounds, and
with all levels of education and income. Increases in obesity have occurred rapidly, and the
changes in weight that have occurred over the past 15 years will have lasting impacts on the
health of individuals and of the healthcare system for decades to come.
Nationally, between 1980 and 2002, obesity prevalence doubled in adults aged 20 years or
older and overweight prevalence tripled in children and adolescents aged 6 to 19 years.3,4
Recent prevalence estimates show that rates of obesity remain high but may be leveling off.5,6
Figure 1. Obesity Trends* Among U.S. Adults,7 BRFSS, 1990, 1998, 2007
1998
2007
1990
No Data <10% 10%–14% 15%–19% 20%–24% 25%–29% ≥30%
Source: US BRFSS; *BMI 30, or about 30 lbs . overweight for 5’4” person

Adults who are overweight or obese have a higher risk of premature death than those with a
normal weight. Obesity and overweight are also associated with an increased risk of coronary
heart disease, type 2 diabetes, musculoskeletal disorders, sleep apnea, asthma, and
psychological disorders, as well as cancer of the endometrium, colon, kidney, gallbladder, and
breast (postmenopausal).1 Children and adolescents who are overweight are more likely to be
overweight or obese as adults, while high blood pressure, high cholesterol, orthopedic
disorders, type 2 diabetes, and psychosocial disorders are more common among overweight
youth than among those with a healthy body weight.1
The economic costs of treating the medical conditions associated with overweight and obesity
are substantial. Direct medical expenditures alone for obesity are estimated to total $147
billion each year in the United States, or roughly 9% of total spending on health care.8
Applying this fraction to total health care costs in Alaska9 yields an estimate of $477 million
spent annually in Alaska for direct medical expenditures related to obesity (Eric Finkelstein,
personal communication, 7/9/2009). This is surely an underestimate of the true economic
costs of obesity in Alaska, as obesity also contributes to reduced life-expectancy, lost
productivity, and reduced earning potential, each of which have significant economic
ramifications beyond just direct medical costs.
Individual body weight is determined by a variety of inter-related genetic, physiological,
behavioral, cultural, environmental, and socioeconomic factors.1 An imbalance between
energy (caloric) intake and energy expenditure is the underlying cause of overweight and
obesity in most individuals.
On a societal level, poor diet and physical inactivity accounted for approximately 365,000
U.S. deaths in 2000, up from 300,000 in 1990.10
If this trend continues, physical inactivity and
poor diet are likely to overtake tobacco as the leading causes of preventable death in the
United States.10
The Burden of Overweight & Obesity in Alaska report is a comprehensive collection of
existing data from a variety of sources that provides the best estimates we have currently of
the burden of overweight and obesity in the state. This report contains data on the extent of
overweight and obesity in children, adolescents and adults, as well as the impact overweight
and obesity has in Alaska. Data are presented on key physical activity and nutrition behaviors
identified by the Centers for Disease Control and Prevention (CDC) that contribute to obesity,
such as sugar-sweetened beverage consumption, energy-dense foods consumption, and screen

(television and computer) time; and behaviors that contribute to obesity prevention, such as
breastfeeding, fruit and vegetable consumption, and physical activity.11,12
A companion brief
report, The Burden of Overweight and Obesity in Alaska: Summary Report, can be found at:
http://www.hss.state.ak.us/dph/chronic/obesity/pubs/obesityburden_2009.pdf.
The body mass index (BMI) is used to estimate a person’s risk of weight-related health
problems and is calculated using weight and height (BMI = weight [kg]/height [m]2).
13
Although BMI does not measure body fat directly, research has shown that BMI is correlated
with directly measured body fat.13
The BMI is used as a screening tool to identify possible
weight problems for adults, but it is important to remember that BMI is only one factor related
to risk for disease. Body mass index surveillance data are a reliable tool used to describe
trends in weight status over time among populations and subpopulations. The BMI is the most
widely used measure because it is relatively easy, inexpensive, noninvasive, and quick to
obtain.
Table 1. BMI Classification for Adults 20 Years of Age and Older13
Because children and adolescents, ages
2 to 20 years, are still growing and have
differences in body composition, their
BMI is compared to the BMI’s of other
youth of the same sex and age in a
reference population. The BMI’s for
children and adolescents are plotted by
age on a sex-specific growth chart14
to
find percentile for sex and age.15
It is
important to note that BMI should not
be used alone to diagnose an individual
child as overweight or obese. Rather,
BMI should be used to identify children
and adolescents who need to be
examined further by a medical care provider to obtain an informed diagnosis.16
BMI Weight Status
Below 18.5 Underweight
18.5 – 24.9 Normal Weight
25.0 – 29.9 Overweight
30.0 and Above Obese
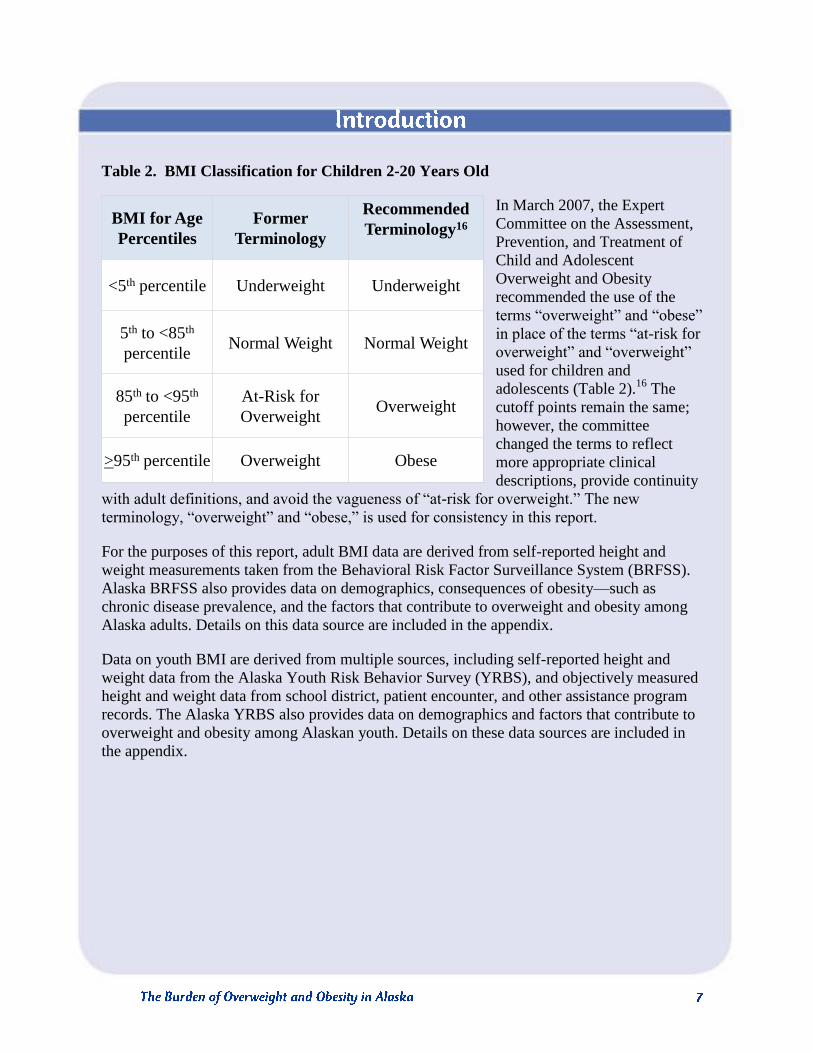
Table 2. BMI Classification for Children 2-20 Years Old
In March 2007, the Expert
Committee on the Assessment,
Prevention, and Treatment of
Child and Adolescent
Overweight and Obesity
recommended the use of the
terms ―overweight‖ and ―obese‖
in place of the terms ―at-risk for
overweight‖ and ―overweight‖
used for children and
adolescents (Table 2).16
The
cutoff points remain the same;
however, the committee
changed the terms to reflect
more appropriate clinical
descriptions, provide continuity
with adult definitions, and avoid the vagueness of ―at-risk for overweight.‖ The new
terminology, ―overweight‖ and ―obese,‖ is used for consistency in this report.
For the purposes of this report, adult BMI data are derived from self-reported height and
weight measurements taken from the Behavioral Risk Factor Surveillance System (BRFSS).
Alaska BRFSS also provides data on demographics, consequences of obesity—such as
chronic disease prevalence, and the factors that contribute to overweight and obesity among
Alaska adults. Details on this data source are included in the appendix.
Data on youth BMI are derived from multiple sources, including self-reported height and
weight data from the Alaska Youth Risk Behavior Survey (YRBS), and objectively measured
height and weight data from school district, patient encounter, and other assistance program
records. The Alaska YRBS also provides data on demographics and factors that contribute to
overweight and obesity among Alaskan youth. Details on these data sources are included in
the appendix.
BMI for Age
Percentiles
Former
Terminology
Recommended
Terminology16
<5th percentile Underweight Underweight
5th to <85th
percentileNormal Weight Normal Weight
85th to <95th
percentile
At-Risk for
OverweightOverweight
>95th percentile Overweight Obese

Figure 2. Trend in Prevalence of Overweight/Obesity (BMI ≥ 25.0), by Sex, Alaska
Adults, 1991-2007
Since 1991, the prevalence of
overweight and obesity among
Alaska adults has increased
steadily, as shown in Figure 2
Source: AK BRFSS
Figure 3. Trend in Prevalence of Obesity (BMI ≥ 30.0), by Sex, Alaska Adults, 1991-2007
The upward trend in weight has
been driven primarily by an
increase in obesity, which more
than doubled between 1991 and
2007.
Source: AK BRFSS
49%
66%58%
73%
38%
58%
0%
20%
40%
60%
80%
100%
19
91
19
92
19
93
19
94
19
95
19
96
19
97
19
98
19
99
20
00
20
01
20
02
20
03
20
04
20
05
20
06
20
07
Pe
rce
nt
Ove
rwe
igh
t o
r O
be
se
All Adults Men Women
13%
27%
14%
26%
13%
29%
0%
5%
10%
15%
20%
25%
30%
35%
40%
19
91
19
92
19
93
19
94
19
95
19
96
19
97
19
98
19
99
20
00
20
01
20
02
20
03
20
04
20
05
20
06
20
07
Pe
rce
nt
Ob
ese
All Adults Men Women
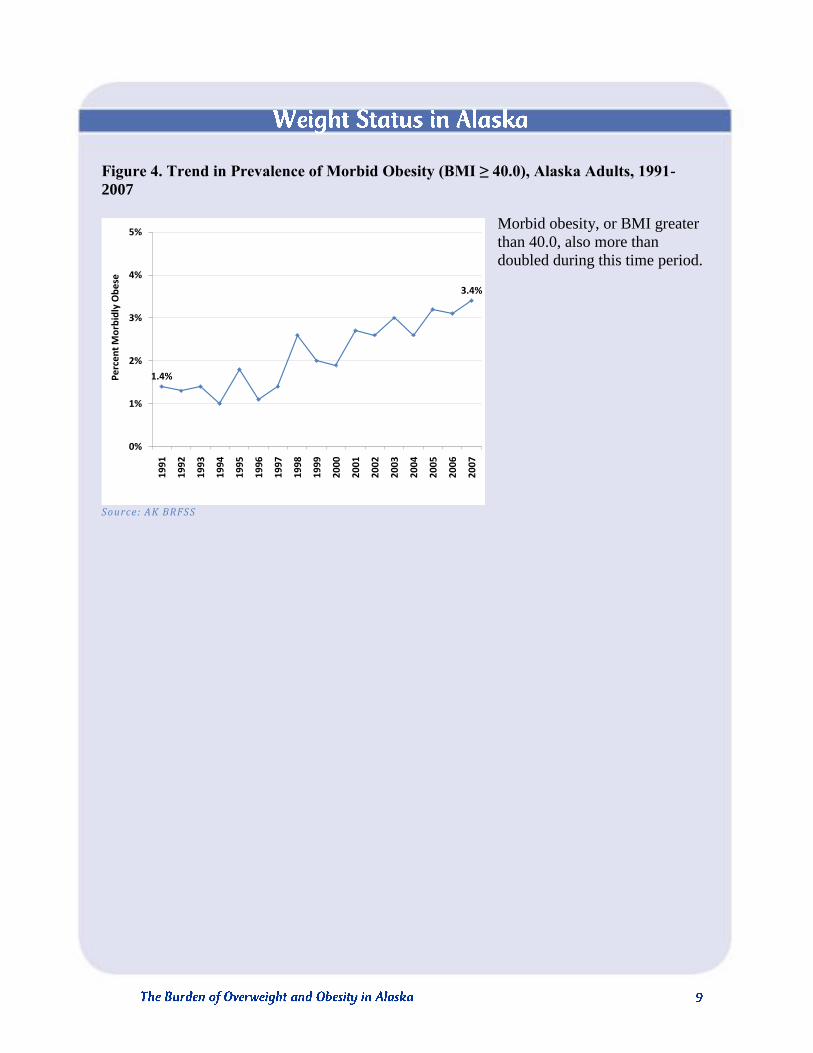
Figure 4. Trend in Prevalence of Morbid Obesity (BMI ≥ 40.0), Alaska Adults, 1991-
2007
Morbid obesity, or BMI greater
than 40.0, also more than
doubled during this time period.
Source: AK BRFSS
1.4%
3.4%
0%
1%
2%
3%
4%
5%
19
91
19
92
19
93
19
94
19
95
19
96
19
97
19
98
19
99
20
00
20
01
20
02
20
03
20
04
20
05
20
06
20
07
Pe
rce
nt
Mo
rbid
ly O
be
se

Table 3. Prevalence of Obesity (BMI ≥ 30.0), by Population Subgroup, Alaska Adults
1991 and 2007
Obesity prevalence
has increased
among individuals
of all ages,
education levels,
income brackets,
racial and ethnic
backgrounds, and
regions. Table 3
shows obesity
prevalence for all
major population
subgroups in 1991
and in 2007.
Source: AK BRFSS
Figure 5. Trend in Prevalence of Overweight (25.0 ≤ BMI < 30.0), by Sex, Alaska Adults,
1991-2007
Rates of overweight have
remained relatively constant
since 1991, as shown in Figure
5.
Source: AK BRFSS
35%
39%
44%
48%
25%29%
0%
10%
20%
30%
40%
50%
60%
19
91
19
92
19
93
19
94
19
95
19
96
19
97
19
98
19
99
20
00
20
01
20
02
20
03
20
04
20
05
20
06
20
07
Pe
rce
nt
Ove
rwe
igh
t
All Adults Men Women
1991 2007
Percent LCL UCL Percent LCL UCL
Age
18-34 10.7 7.4 15.3 20.1 15.6 25.5
35-64 15.6 12.3 19.5 32.1 28.7 35.6
65 and older 17.0 10.7 26.0 33.4 26.6 40.9
Race
White 13.6 10.9 16.9 27.3 24.3 30.6
Alaska Native 15.5 11.7 20.2 34.8 28.3 42.0
Other Race 8.6 3.3 20.8 24.7 16.7 34.9
Annual Household Income
Less than $25,000 14.5 9.6 21.3 30.4 24.0 37.8
$25,000 or more 12.0 8.6 16.5 28.7 25.6 32.0
Education Level
High school or less 19.4 12.1 29.8 29.6 25.5 34.1
At least some college 12.8 10.4 15.6 27.5 24.1 31.1
Region of Residence
Anchorage/Fairbanks 13.3 10.0 17.5 27.0 23.4 30.9
Gulf Coast 12.8 9.6 17.0 29.8 25.4 34.6
Southeast 15.2 11.7 19.4 28.8 24.5 33.7
Rural 13.1 10.0 17.0 34.5 29.4 39.9

Table 4. Prevalence of Overweight (25.0 ≤ BMI < 30.0), by Population Subgroup, Alaska
Adults, 1991 and 2007
The prevalence of
overweight did
not change
substantially
between 1991 and
2007 for any
population
subgroup. Table 4
lists rates of
overweight for all
major population
subgroups in 1991
and 2007.
Source: AK BRFSS
1991 2007
Percent LCL UCL Percent LCL UCL
Age
18-34 27.1 22.4 32.5 33.0 26.7 39.9
35-64 42.1 37.2 47.1 39.5 35.8 43.3
65 and older 41.3 29.6 54.1 35.4 28.6 42.7
Race
White 35.8 31.8 39.9 37.1 33.6 40.7
Alaska Native 36.1 29.7 43.1 36.1 28.0 45.0
Other Race 29.6 18.5 43.7 36.2 26.7 47.0
Annual Household Income
Less than $25,000 35.2 27.9 43.3 36.9 28.4 46.3
$25,000 or more 34.0 28.3 40.2 39.0 35.5 42.7
Education Level
High school or less 29.6 21.1 39.8 33.2 28.1 38.8
At least some college 35.9 32.2 39.7 39.1 35.3 43.0
Region of Residence
Anchorage/Fairbanks 34.5 29.6 39.8 38.1 33.8 42.6
Gulf Coast 35.1 30.1 40.6 32.6 28.0 37.5
Southeast 36.5 31.2 42.1 36.6 31.8 41.6
Rural 37.9 31.9 44.4 34.4 29.5 39.7

Figure 6. Weight Status, Alaska Adults, 2005-2007 (combined)
The percentage of Alaska adults
in each weight category for
2005-2007 is given in Figure 6.
Sixty-five percent of adults are
above a normal weight, a
percentage that is similar to the
United States during 2006,
where 62% of adults were
above a normal weight.
Source: AK BRFSS
Figure 7. Prevalence of Obesity (BMI ≥ 30.0) and Overweight/Obesity (BMI ≥ 25.0), by
Sex, Alaska Adults, 2005-2007 (combined)
Seventy-two percent of men and
56% of women are above a
normal weight. Men are
significantly more likely to be
above a normal weight than
women. The difference in
weight status results from higher
rates of overweight among men;
rates of obesity are similar for
men (26%) and women (27%).
Source: AK BRFSS
Underweight1%
Normal weight34%
Overweight 39%
Obese23%
Morbidly Obese 3%
0%
20%
40%
60%
80%
100%
Pe
rce
nt
at E
ach
We
igh
t C
lass
All Adults Men Women
Obese Obese or Overweight

Figure 8. Prevalence of Obesity (BMI ≥ 30.0) and Overweight/Obesity (BMI ≥ 25.0), by
Race, Alaska Adults, 2005-2007 (combined)
In the United States more men
than women were above a
normal weight as well, with
69% of men and 54% of women
having a BMI of 25 or more. As
is the case in Alaska, men are
more likely to be overweight
(44%) than are women (30%);
obesity rates are similar among
the two groups. In 2006, 26% of
men in the United States were
obese, compared to 25% of
women.17
Source: AK BRFSS
American Indian/Alaska Native adults are significantly more likely to be both obese and
above a normal weight compared to White Alaskans. Alaskans of other race groups are not
significantly different than either White or American Indian/Alaska Natives in terms of
obesity or overweight.
0%
20%
40%
60%
80%
100%
Pe
rce
nt
at E
ach
We
igh
t C
lass
White American Indian/Alaska Native
Other
Obese Obese or Overweight

Figure 9. Prevalence of Obesity (BMI ≥ 30.0) and Overweight/Obesity (BMI ≥ 25.0), by
Age, Alaska Adults, 2005-2007 (combined)
Adults ages 35 and above are
significantly more likely to be
above a normal weight
(overweight or obese) than
adults under age 35. Obesity
rates are significantly higher
among adults above age 24 than
those in the 18-24 age category.
Source: AK BRFSS
Figure 10. Prevalence of Overweight/Obesity (BMI ≥ 25.0), by Age and Sex, Alaska
Adults, 2005-2007 (combined)
At least half of the men and
women in all age categories
over 25 years are above a
normal weight, and combined
rates of overweight and obesity
reach 80% in some age ranges.
Men of all ages are more likely
to be above a normal weight
than women, with significant
differences in some age groups.
Only men younger than 25 have
rates of overweight/obesity
below that of women in any age
group.
Source: AK BRFSS
13
%
47
%
26
%
62
%
27
%
68
%
30
%
69
%
33
%
73
%
29
%
68
%0%
20%
40%
60%
80%
100%
Pe
rce
nt
at E
ach
We
igh
t C
lass
18-24 45-5435-44 65+55-6425-34
Obese Obese or Overweight
49
%
72
%
79
%
78
%
80
%
72
%
44
%
50
%
56
%
59
%
66
%
64
%
0%
20%
40%
60%
80%
100%
Pe
rce
nt
Ove
rwe
igh
t o
r O
be
se
Men Women

Figure 11. Prevalence of Obesity (BMI ≥ 30.0), by Age and Sex, Alaska Adults, 2005-
2007 (combined)
As is the case with overall
combined rates of overweight
and obesity, men in each age
group are more likely to be
overweight than women (data
not shown), while obesity rates
are not significantly different by
sex in any age category.
Source: AK BRFSS
Figure 12. Prevalence of Obesity (BMI ≥ 30.0) and Overweight/Obesity (BMI ≥ 25.0), by
Income Level, Alaska Adults, 2005-2007 (combined)
Statewide, the percentage of
adults above a normal weight
(BMI > 25.0) varies little by
income category.
Source: AK BRFSS
12
%
27
%
26
%
31
%
33
%
25
%
16
%
25
%
28
%
28
%
33
%
33
%0%
10%
20%
30%
40%
50%
Pe
rce
nt
Ob
ese
Men Women
33
%
69
%
29
%
63
%
28
%
63
%
25
%
62
%
27
%
69
%
25
%
67
%
0%
20%
40%
60%
80%
100%
Pe
rce
nt
at E
ach
We
igh
t C
lass
<$15K $35-$50K$25-$35K $75K+$50-$75K$15-$25K
Obese Obese or Overweight

Figure 13. Prevalence of Overweight/Obesity (BMI ≥ 25.0), by Income Level and Sex,
Alaska Adults, 2005-2007 (combined)
Patterns in overweight and
obesity emerge across income
groups when men and women
are looked at separately,
however. Women are less likely
to be above a normal weight as
household income level
increases. Among men, those in
the highest income brackets
(over $50,000 per year) are the
most likely to be above a normal
weight.
Source: AK BRFSS
Figure 14. Prevalence of Obesity (BMI ≥ 30.0), by Income Level and Sex, Alaska Adults,
2005-2007 (combined)
When overweight and obesity
are examined separately,
different patterns also emerge
among men and women. Among
women, the prevalence of
obesity appears to decrease as
income increases, although the
difference is not significant
between all age categories. No
significant differences in obesity
appear among men of different
income categories.
Source: AK BRFSS
72
%
66
%
67
%
67
%
76
%
79
%
66
%
60
%
59
%
56
%
61
%
51
%
0%
20%
40%
60%
80%
100%
Pe
rce
nt
Ove
rwe
igh
t o
r O
be
se
Men Women
26
%
30
%
25
%
22
%
26
%
28
%
39
%
29
%
31
%
28
%
28
%
22
%
0%
10%
20%
30%
40%
50%
Pe
rce
nt
Ob
ese
Men Women

Figure 15. Prevalence of Overweight (25.0 ≤ BMI < 30.0), by Income Level and Sex,
Alaska Adults, 2005-2007 (combined)
In contrast, level of overweight
appears unrelated to income
among women, whereas among
men, overweight appears largely
to increase as income increases,
with the exception of the under
$15,000 category.
Source: AK BRFSS
Figure 16. Prevalence of Obesity (BMI ≥ 30.0) and Overweight/Obesity (BMI ≥ 25.0), by
Employment Status, Alaska Adults, 2005-2007 (combined)
Adults who report that they are
unable to work are significantly
more likely to be obese than
employed adults. Employed
adults have significantly higher
levels of combined overweight
and obesity compared to those
unemployed or not in the
workforce.
Source: AK BRFSS
46
%
37
%
42
%
46
%
50
%
52
%
28
%
32
%
29
%
28
%
33
%
28
%
0%
10%
20%
30%
40%
50%
60%
70%
Pe
rce
nt
Ove
rwe
igh
t
Men Women
26% 67% 23% 60% 25% 59% 38% 67%0%
20%
40%
60%
80%
100%
Pe
rce
nt
at E
ach
We
igh
t C
lass
Employed Unemployed Unable to Work
Not inWorkforce
Obese Obese or Overweight

Figure 17. Prevalence of Obesity (BMI ≥ 30.0) and Overweight/Obesity (BMI ≥ 25.0), by
Education Level, Alaska Adults, 2005-2007 (combined)
As is the case with income,
overall the percentage of all
adults above a normal weight
does not vary by level of
educational attainment.
Source: AK BRFSS
Figure 18. Prevalence of Obesity (BMI ≥ 30.0), by Education Level and Sex, Alaska
Adults, 2005-2007 (combined)
Among just women, however,
obesity prevalence decreases
with increasing levels of
education. The pattern among
men is less clear.
Source: AK BRFSS
26% 61% 28% 65% 28% 67% 24% 63%0%
20%
40%
60%
80%
100%
Pe
rce
nt
at E
ach
We
igh
t C
lass
Less ThanHigh School
High School/GED
CollegeGraduate
Some College
Obese Obese or Overweight
21% 25% 28% 26% 33% 31% 27% 22%0%
10%
20%
30%
40%
50%
Pe
rce
nt
Ob
ese
Men Women

Figure 19. Prevalence of Overweight/Obesity (BMI ≥ 25.0), by Education Level and Sex,
Alaska Adults, 2005-2007 (combined)
A different pattern appears for
overweight and obesity
combined. Men are more likely
to be above a normal weight as
educational attainment
increases, whereas women are
less likely to be above a normal
weight as education increases.
Source: AK BRFSS
The Alaska BRFSS provides data in 5 regional aggregations, as well as statewide. The BRFSS
regions are: (1) Anchorage and vicinity, (2) Gulf Coast, (3) Southeast, (4) Fairbanks and
vicinity, and (5) all other parts of the state, or ―Rural.‖
Figure 20. Prevalence of Obesity (BMI ≥ 30.0) and Overweight/Obesity (BMI ≥ 25.0), by
Race, Alaska Adults, 2005-2007 (combined)
As shown in Figure 20,
although the prevalence of adult
overweight and obesity
combined is similar in all
geographic regions in Alaska,
the rate of obesity in the rural
region of the state is
significantly higher than rates in
the Fairbanks or Southeast
regions, and marginally higher
than rates in the Anchorage or
Gulf Coast regions.
Source: AK BRFSS
58% 70% 76% 75% 65% 58% 59% 51%0%
20%
40%
60%
80%
100%
Pe
rce
nt
Ove
rwe
igh
t o
r O
be
se Men Women
26
%
65
%
26
%
65
%
25
%
65
%
30
%
67
%
25
%
63
%
0%
20%
40%
60%
80%
100%
Pe
rce
nt
at E
ach
We
igh
t C
lass
Anchorage &Vicinity
Obese Obese or Overweight
Fairbanks &Vicinity
Gulf Coast Southeast Rural

Figure 21. Weight Status,
Alaska High School Youth,
2003 & 2007
Statewide representative data on
weight status of high school
students come from the Youth
Risk Behavior Survey (YRBS),
and are available for 2003 and
2007 only. Between 2003 and
2007, the prevalence of obesity
and overweight/obesity among
high school youth did not
change. No significant trends in
overweight or obesity were
found when examined by sex,
grade, or race group.
Source: AK YRBS; Percentages may not sum to 100% due to rounding
11% 11%
14% 16%
73% 70%
2% 2%
0%
20%
40%
60%
80%
100%
2003 2007
Pe
rce
nt
Obese Overweight Normal Weight Underweight

Figure 22. Weight Status, Alaska High School Youth, 2007
The most recent YRBS data
show that 27% of students are
above a normal weight. Sixteen
percent are overweight and an
additional 11% are classified as
obese.
Source: AK YRBS
Figure 23. Prevalence of Obesity (BMI ≥ 95th
percentile) and Overweight/Obesity (BMI
≥ 85th
percentile), by Sex, Alaska High School Youth, 2007
Although boys appear to be
slightly more likely to be
overweight and obese than girls,
this difference is not significant;
30% of boys are either
overweight or obese compared
to 24% among girls.
Source: AK YRBS
Underweight2%
Normal weight71%
Overweight16%
Obese11%
0%
10%
20%
30%
40%
Pe
rce
nt
at E
ach
We
igh
t C
lass
All Youth Boys Girls
Obese Obese or Overweight

Figure 24. Prevalence of Obesity (BMI ≥ 95th
percentile) and Overweight/Obesity (BMI
≥ 85th
percentile), by Grade, Alaska High School Youth, 2007
The prevalence of overweight
and obesity combined decreases
slightly in higher grade levels;
significantly more 9th
graders
(34%) than 12th
graders (20%)
are either overweight or obese.
Source: AK YRBS
Figure 25. Prevalence of Overweight/Obesity (BMI ≥ 85th
percentile), by Grade and Sex,
Alaska High School Youth, 2007
This association is largely
driven by the steep decline in
overweight and obesity seen
among girls as they reach higher
grades.
Source: AK YRBS
0%
10%
20%
30%
40%
50%
Pe
rce
nt
at E
ach
We
igh
t C
lass
9th 10th 12th
Obese Obese or Overweight
11th
31% 33% 27% 28% 37% 24% 23% 11%0%
10%
20%
30%
40%
50%
60%
9th 10th 11th 12th 9th 10th 11th 12th
Pe
rce
nt
Ove
rwe
igh
t o
r O
be
se
Boys Girls

Figure 26. Prevalence of Obesity (BMI ≥ 95th
percentile) and Overweight/Obesity (BMI
≥ 85th
percentile), by Race, Alaska High School Youth, 2007
There are no statistically
significant differences in the
prevalence of overweight or
overweight and obesity
combined by racial group.
Source: AK YRBS
0%
10%
20%
30%
40%
50%
60%
Pe
rce
nt
at E
ach
We
igh
t C
lass
White American Indian/Alaska Native
Other
Obese Obese or Overweight

The YRBS provides statewide, representative data for the high school population. Statewide,
representative data for children younger than high school age are not available, as there is no
survey or data collection system for these younger populations. However, several different
programs or organizations in the state maintain or collect height and weight records for
children served by their programs. Data from many of these programs were analyzed and the
results are presented according to data source.
One source of height and weight information is the Women, Infants, and Children (WIC)
Program, a supplemental food and nutrition program for pregnant and breastfeeding women
and their children from birth to age 5. Records for Federal fiscal year 2007 (10/2006 - 9/2007)
show that 22% of children ages 2 to 4 enrolled in WIC are obese.18
Rates of obesity are
similar for boys and girls, and across age. The Alaska WIC program does not monitor youth
overweight.
An additional data source that maintains height and weight records for youth is the Resource
Patient Management System (RPMS).19
Data in this system come from medical records of
children who visit public health centers, regional Alaska Native hospitals, community health
centers, and village clinics. Height and weight data for children ages 3 to 19 in 2008 were
analyzed for inclusion in this report.
Figure 27. Weight Status, Alaska Youth (3 to 19 Years), 2008
Analyzed data show that 61% of
all children 3 to 19 years of age
are at a normal weight. Thirty-
seven percent of children are
above a normal weight, with
19% considered overweight and
an additional 18% considered
obese.
Source: AK RPMS
Underweight2%
Normal Weight61%
Overweight19%
Obese18%

Figure 28. Weight Status, by Age, Alaska Youth (3 to 19 Years), 2008
Rates of overweight are similar
among boys and girls. Twenty
percent of girls and 17% of boys
are overweight; 16% of girls
and 22% of boys are obese.
The percentage of students who
are above a normal weight is
consistent across age categories
as well.
Source: AK RPMS; Percentages may not sum to 100% due to rounding
21% 19% 23%14%
19% 17%19%
20%
58% 61%58%
64%
2% 3% 1% 1%
0%
20%
40%
60%
80%
100%
3 to 6 7 to 10 11 to 14 15 to 19
Pe
rce
nt
Age Group (in Years)
Obese Overweight Normal Weight Underweight

The Anchorage School District (ASD) collects height and weight measurements from students
as part of the school health screening process. Health information, including height and
weight measurements, is recorded in an electronic database. In 2003, the ASD began a
collaborative project with the State of Alaska Division of Public Health to analyze height and
weight data and monitor trends in the weight status of the student population.20
The most
recent analysis of height and weight data included measurements representing 46,658 students
over the ten-year period from 1998-1999 to 2007-2008.21
Figure 29. Prevalence of Overweight/Obesity (BMI > 85th
percentile), Anchorage School
District Students, 1998-1999 to 2007-2008
As Figure 29 shows, the
percentage of students that were
above a normal weight
increased from 30% to 38%
through 2002-2003 then leveled
off.
Source: Anchorage School District health records
30%
38%36%
0%
10%
20%
30%
40%
50%
1998-1999
1999-2000
2000-2001
2001-2002
2002-2003
2003-2004
2004-2005
2005-2006
2006-2007
2007-2008
Pe
rce
nt
Ove
rwe
igh
t o
r O
be
se

Figure 30. Weight Status, Anchorage School District Students (All Grades), 2007-2008
In 2007-2008, 2% of students
were underweight, 62% were at
a normal weight, 18% were
overweight, and 19% were
obese.
Source: Anchorage School District health records
Figure 31. Prevalence of Overweight/Obesity (BMI > 85th
percentile), by Sex and Age,
Anchorage School District Students, 2007-2008
Students 12 and older were
significantly more likely than
those under 6 years of age to be
above a normal weight.
Source: Anchorage School District health records
Underweight2%
Normal weight62%
Overweight18%
Obese19%
0%
10%
20%
30%
40%
50%
Boys Girls 3-5 6-11 12-19
Pe
rce
nt
Ove
rwe
igh
t o
r O
be
se
Age Group (in Years)

Figure 32. Weight Status, Anchorage School District Kindergarten and First Grade
Students, 2007-2008
However, one-third of children
entering kindergarten or first
grade were above a normal
weight, with 18% considered
overweight and 15% obese.
Source: Anchorage School District health records
Although statewide, representative data for children younger than high school age are not
available, existing data on a variety of youth populations indicate that there is reason to be
concerned about overweight among young children. In 2007-2008, one-third of children in the
Anchorage School District, the largest district in the state, entered school above a normal
weight. More than 1 in 5 (22%) young children enrolled in WIC in 2007 were obese, and 37%
of children seen by a public health nurse during visits to public health centers, regional Alaska
Native hospitals, community health centers, or village clinics in 2008 were either overweight
or obese. Trends in these data should be monitored closely, and efforts should be made to
obtain statewide representative data for young children.
Underweight2%
Normal weight65%
Overweight18%
Obese15%

Obesity is an important health concern because it increases the risk of numerous debilitating
health conditions. BRFSS data indicate that adults who are overweight and/or obese are also
more likely to report an array of other health problems than are adults who are at a normal
weight.
Figure 33. Ratings of General Health Status, by Weight Class, Alaska Adults, 2005-2007
(Combined)
Compared to normal weight
adults, obese adults are twice as
likely to report their health
status as fair or poor, but only
one-third as likely to report
being in excellent health.
Source: AK BRFSS
31%
60%
10%
23%
67%
11% 10%
69%
21%
Normal Weight/Underweight(BMI < 25.0)
Overweight(25.0 < BMI < 30.0)
Obese (BMI > 30.0)
My general health status is:
Excellent
Very good or good
Fair or poor

Figure 34. Mean Number of Days of Poor Physical Health, Mental Health, and Limited
Activities in Past 30 Days, by Weight Class, Alaska Adults, 2005-2007 (combined)
Obese adults report significantly
more days of poor physical or
mental health than do normal or
overweight adults. Adults who
are obese also report having
approximately 50% more days
in which their activities are
limited by their health compared
to normal and overweight
adults.
Source: AK BRFSS
In addition to reporting lower levels of overall health, overweight and obese adults are more
likely to report diagnoses with specific health problems.
Figure 35. Prevalence of High Cholesterol, by Weight Class, Alaska Adults, 2005 and
2007 (combined)
Obese adults are nearly twice as
likely to have high cholesterol
and 6 times more likely to have
diabetes than adults of a normal
weight. They are significantly
more likely to have either
diabetes or high cholesterol than
are overweight adults.
Overweight adults, in turn, are
significantly more likely to have
high cholesterol or diabetes than
adults with normal weights.
Source: AK BRFSS
2.8 3.2 4.9 3.2 2.8 3.9 1.9 1.9 2.90
1
2
3
4
5
6
7
Ave
rage
Nu
mb
er
of
Day
s (M
ean
)
Poor Physical Health
Poor Mental Health
Limited Activities
Normal Weight/
Underweight
Overweight Obese
0%
10%
20%
30%
40%
50%
Normal Weight/ Underweight
Overweight Obese
Pe
rce
nt
Told
Had
Hig
h C
ho
lest
ero
l

Figure 36. Prevalence of Non-Gestational Diabetes, by Weight Class, Alaska Adults,
2005-2007 (combined)
0%
5%
10%
15%
20%
Normal Weight/ Underweight
Overweight Obese
Pe
rce
nt
Told
Had
Dia
bet
es*
Source: AK BRFSS
Figure 37. Prevalence of High Blood Pressure, by Weight Class, Alaska Adults, 2005-
2007 (combined)
Obese Alaskans are nearly twice
as likely as overweight adults to
report being diagnosed with
high blood pressure; overweight
adults, in turn, are more likely
than normal weight adults to
have had such a diagnosis.
Source: AK BRFSS
0%
10%
20%
30%
40%
50%
Normal Weight/ Underweight
Overweight Obese
Pe
rce
nt
Told
Had
Hig
h B
loo
d P
ress
ure

Figure 38. Prevalence of Arthritis, by Weight Class, Alaska Adults, 2005 and 2007
(combined)
The prevalence of both arthritis
and asthma appear to increase as
weight increases, although the
differences in prevalence are
significant only between obese
adults and those who are not
obese (i.e., normal weight and
overweight adults).
Source: AK BRFSS
Figure 39. Prevalence of Asthma, by Weight Class, Alaska Adults, 2005-2007 (combined)
Source: AK BRFSS
And the association between obesity and health is well understood by Alaskans. In the 2005
BRFSS respondents were asked whether overweight and obesity were linked with a series of
health outcomes. The vast majority correctly indicated that diabetes (85%), heart disease
(88%), high blood pressure (90%), and premature death (84%) were associated with
overweight and obesity.
0%
10%
20%
30%
40%
Normal Weight/ Underweight
Overweight Obese
Pe
rce
nt
Told
Had
Art
hri
tis
0%
10%
20%
30%
Normal/ Underweight Overweight Obese
Pe
rce
nt
Told
Had
Ast
hm
a

Student nutrition and physical activity have a direct link with academic performance, as
evidenced by increased academic test scores, improved daily attendance and better class
participation.22-24
Research also suggests an association between obesity and lower academic
abilities, lower teacher ratings of social-emotional well-being, and increased absenteeism.25,26
Figure 40. Prevalence of Getting Mostly A’s or B’s, by Select Risk Factor Groups,
Alaska High School Youth, 2007
Data from the 2007 Alaska
YRBS show that, compared to
their normal weight peers, obese
students are significantly less
likely to report receiving mostly
A’s and B’s. Higher grades are
reported by students who watch
fewer than 3 hours of TV, spend
fewer than 3 hours on the
computer or playing video
games, play on at least 1 team
sport, and do not drink soda.
While these associations do not
prove causation, the data do
suggest an important link
between healthy behaviors and
academic achievement. Source: AK YRBS
72%
74%
73%
72%
72%
0% 20% 40% 60% 80% 100%
Soda Consumption
Team Sports
Computer/Game Use
TV Watching
Weight Status
Percent Get Mostly A’s and B’s
Normal WeightObese
<3 hours/day3+ hours/day
0 soda/week
1+ team sport
<3 hours/day
0 team sports
Any soda
3+ hours/day

Although individual weight status is determined by many factors, the primary causes of
overweight and obesity in most individuals is an imbalance between nutrition and physical
activity.1 The Centers for Disease Control and Prevention (CDC), Division of Nutrition,
Physical Activity and Obesity recommends that efforts to prevent and control obesity target
the following areas based on the best available evidence:11,12
increase physical activity
decrease television viewing
increase the consumption of fruits and vegetables
decrease the consumption of sugar-sweetened beverages
reduce the consumption of high energy-dense foods (high calorie foods)
increase breastfeeding initiation, duration and exclusivity
Each person’s physical activity and nutrition behaviors are influenced by a variety of
personal, social and environmental factors. An individual’s food choices, for example, are
shaped by a) personal preference, b) family, cultural, and community norms, c) cost, d)
knowledge and concern about nutritional content, and e) what is available in grocery stores,
restaurants, worksite cafeterias, or vending machines. Similar factors affect individual
decisions about physical activity.
The BRFSS and YRBS surveys collect information on adult and high school student nutrition
and physical activity behaviors, while the BRFSS provides information on some of the social
and environmental factors that contribute to physical inactivity and poor nutrition.

On the BRFSS survey, adults are asked whether they participate in leisure time physical
activity, as well as a series of questions about the duration and intensity of physical activity
they participate in.
Figure 41. Trend in Prevalence of No Leisure Time Physical Activity, Alaska Adults,
1991-2007 (for years available)
Although data are not available
for all years since the BRFSS
began in 1991, throughout the
years in which data have been
collected on this question,
consistently one-fifth of adults
have reported that they
participate in no physical
activity in their spare time.
Source: AK BRFSS
22%20%
0%
10%
20%
30%
40%
19
91
19
92
19
93
19
94
19
95
19
96
19
97
19
98
19
99
20
00
20
01
20
02
20
03
20
04
20
05
20
06
20
07
Pe
rce
nt
Had
No
Le
isu
re T
ime
Ph
ysic
al A
ctiv
ity

Figure 42. Prevalence of No Leisure Time Physical Activity, by Race, Alaska Adults,
2005-2007 (combined)
American Indian/Alaska Native
adults are significantly more
likely to participate in no leisure
time physical activity than are
White adults; there is no sex
difference in prevalence of
inactivity.
Source: AK BRFSS
Figure 43. Prevalence of No Leisure Time Physical Activity, by Age, Alaska Adults,
2005-2007 (combined)
Physical inactivity is associated
with age. The percentage of
adults who do not participate in
any leisure time physical
activity increases from the
youngest to oldest age
categories.
Source: AK BRFSS
0%
10%
20%
30%
40%
White American Indian/ Alaska Native
Other
Pe
rce
nt
Had
No
Le
isu
re T
ime
Ph
ysic
al A
ctiv
ity
0%
10%
20%
30%
40%
18-24 25-34 35-44 45-54 55-64 65+
Pe
rce
nt
Had
No
Le
isu
re T
ime
Ph
ysic
al A
ctiv
ity

Figure 44. Prevalence of No Leisure Time Physical Activity, by Age and Sex, Alaska
Adults, 2005-2007 (combined)
Among women, levels of
inactivity are similar in all age
groups with the exception of the
65 and older group, which sees
a big increase in inactivity. In
contrast, among men inactivity
increases with age in a more
linear fashion.
Source: AK BRFSS
Figure 45. Prevalence of No Leisure Time Physical Activity, by Income Level, Alaska
Adults, 2005-2007 (combined)
Physical activity levels also vary
among individuals in different
income groups. As household
income decreases, the
prevalence of physical inactivity
increases. Adults with a
household income of less than
$25,000 per year are
significantly more likely to be
physically inactive than those
making over $25,000.
Source: AK BRFSS
10
%
15
%
19
%
24
%
25
%
32
%
20
%
20
%
19
%
23
%
23
%
34
%0%
10%
20%
30%
40%
50%
Pe
rce
nt
Had
No
Le
isu
re T
ime
Ph
ysic
al A
ctiv
ity
Men Women
0%
10%
20%
30%
40%
50%
< $15K $15-25K $25-35K $35-50K $50-75K $75K+
Pe
rce
nt
Had
No
Le
isu
re T
ime
Ph
ysic
al A
ctiv
ity

Figure 46. Prevalence of No Leisure Time Physical Activity, by Income Level and Sex,
Alaska Adults, 2005-2007 (combined)
The relationship between
income and leisure time
physical activity is seen in both
men and women.
Source: AK BRFSS
Figure 47. Prevalence of No Leisure Time Physical Activity, by Employment Status,
Alaska Adults, 2005-2007 (combined)
Levels of leisure time physical
activity are also related to
employment status. Adults who
are unable to work are more
than twice as likely to be
inactive as employed or
unemployed adults, or those not
in the workforce (e.g., students,
homemakers, retired Alaskans).
Eighty-five percent of those in
the ―unable to work‖ category
are disabled, that is, report
having a condition that limits
their daily activities or causes
them to rely upon special
equipment (data not shown). Source: AK BRFSS
33
%
32
%
24
%
22
%
16
%
14
%
43
%
33
%
21
%
20
%
18
%
14
%
0%
10%
20%
30%
40%
50%
60%
Pe
rce
nt
Had
No
Le
isu
re T
ime
Ph
ysic
al A
ctiv
ity
Men Women
0%
10%
20%
30%
40%
50%
60%
70%
Employed Unemployed Not in Workforce Unable to Work
Pe
rce
nt
Had
No
Le
isu
re T
ime
Ph
ysic
al A
ctiv
ity

Figure 48. Prevalence of No Leisure Time Physical Activity, by Education Level, Alaska
Adults, 2005-2007 (combined)
Physical inactivity increases as
education level decreases.
Adults who have less than a
high school education are about
3 times as likely to be physically
inactive as adults who have
completed college.
Source: AK BRFSS
Figure 49. Prevalence of No Leisure Time Physical Activity, by Education Level and Sex,
Alaska Adults, 2005-2007 (combined)
The pattern of education and
physical activity is slightly more
pronounced among women
compared to men: nearly half of
women who did not graduate
high school are physically
inactive.
Source: AK BRFSS
0%
10%
20%
30%
40%
50%
Less than high school
High school/GED Some college College graduate
Pe
rce
nt
Had
No
Le
isu
re T
ime
Ph
ysic
al A
ctiv
ity
28% 23% 22% 13% 45% 30% 21% 12%0%
10%
20%
30%
40%
50%
60%
Pe
rce
nt
Had
No
Le
isu
re T
ime
Ph
ysic
al A
ctiv
ity
Men Women

Figure 50. Prevalence of No Leisure Time Physical Activity, by Region, Alaska Adults,
2005-2007 (combined)
Levels of leisure time physical
activity vary by region. Alaska
adults who live in rural areas are
significantly more likely to be
physically inactive in their spare
time than adults in all other
regions of the state.
Source: AK BRFSS
Figure 51. Prevalence of Obesity (BMI ≥ 30.0), Among Alaskans Who Do and Do Not
Engage in Leisure Time Physical Activity, Alaska Adults, 2005-2007 (combined)
Not surprisingly, leisure-time
physical activity is associated
with weight status. Overall,
adults who do not engage in
physical activity are
significantly more likely to be
obese than adults who do
engage in physical activity.
Source: AK BRFSS
0%
10%
20%
30%
40%
Anchorage & Vicinity
Gulf Coast Southeast Rural Fairbanks & Vicinity
Pe
rce
nt
Had
No
Le
isu
re T
ime
Ph
ysic
al A
ctiv
ity
25% 33%0%
10%
20%
30%
40%
Individuals Who Engage in Physical Activity
Individuals Who Do Not Engage in Physical Activity
Pe
rce
nt
Ob
ese

Figure 52. Prevalence of Obesity (BMI ≥ 30.0), Among Alaskans Who Do and Do Not
Engage in Leisure Time Physical Activity, by Sex, Alaska Adults, 2005-2007 (combined)
This association is significant
only among women.
Source: AK BRFSS
0%
10%
20%
30%
40%
50%
Pe
rce
nt
Ob
ese
Men Women
Engage in Physical Activity
Do Not Engage in Physical Activity

In October 2008, the US Department of Health and Human Services released the first
comprehensive physical activity recommendations published by the federal government.27
The 2008 Physical Activity Guidelines for Americans recommends adults ages 18-64 get
either 150 minutes per week of moderate intensity activity, or 75 minutes per week of
vigorous activity, or a combination of the two, to receive substantial health benefits.
Figure 53. Prevalence of Physical Activity per 2008 USDHHS Physical Activity
Recommendations, Alaska Adults, 2005 & 2007 (combined)
In Alaska, 73% of adults meet
these new physical activity
recommendations; 27% do
not—including 9% who are
virtually inactive. Note that this
does not correspond directly to
the percentage of Alaska adults
who report no leisure time
physical activity (20% in 2007).
This is likely due to differences
in the wording of the two sets of
questions.
Source: AK BRFSS
Meets recommendation
73%
Insufficient physical activity
18%
No physical activity
9%

Figure 54. Prevalence of Not Meeting Physical Activity Recommendations, by Sex,
Alaska Adults, 2005 & 2007 (combined)
Women are significantly more
likely than men to not get
enough physical activity to meet
these recommendations.
Source: AK BRFSS
Figure 55. Prevalence of Not Meeting Physical Activity Recommendations, by Race,
Alaska Adults, 2005 & 2007 (combined)
American Indian/Alaska Native
adults are significantly more
likely to fail to meet the
recommendations than White
adults.
Source: AK BRFSS
0%
10%
20%
30%
40%
All Adults Men Women
Pe
rce
nt
Do
No
t M
eet
Ph
ysic
al A
ctiv
ity
Re
com
me
nd
atio
ns
0%
10%
20%
30%
40%
50%
White American Indian/ Alaska Native
Other
Pe
rce
nt
Do
No
t M
eet
Ph
ysic
al A
ctiv
ity
Re
com
me
nd
atio
ns

Figure 56. Prevalence of Not Meeting Physical Activity Recommendations, by Age,
Alaska Adults, 2005 & 2007 (combined)
As is the case with leisure time
physical inactivity, the
percentage of adults who fail to
meet physical activity
recommendations appears to
increase with age.
Source: AK BRFSS
Figure 57. Prevalence of Not Meeting Physical Activity Recommendations, by Age and
Sex, Alaska Adults, 2005 & 2007 (combined)
This pattern is much clearer
among men than among women:
men over 64 are twice as likely
as men under 25 to not get the
recommended level of physical
activity.
Source: AK BRFSS
0%
10%
20%
30%
40%
50%
18-24 25-34 35-44 45-54 55-64 65+
Pe
rce
nt
Do
No
t M
eet
P
hys
ical
Act
ivit
y R
eco
mm
en
dat
ion
s
13
%
13
%
21
%
25
%
27
%
31
%
34
%
24
%
33
%
28
%
40
%
46
%
0%
10%
20%
30%
40%
50%
60%
Pe
rce
nt
Do
No
t M
eet
Ph
ysic
al A
ctiv
ity
Re
com
me
nd
atio
ns
Men Women

Figure 58. Prevalence of Not Meeting Physical Activity Recommendations, by Income
Level, Alaska Adults, 2005 & 2007 (combined)
The percentage of adults who
fail to meet physical activity
recommendations appears to
decrease with income.
Source: AK BRFSS
Figure 59. Prevalence of Not Meeting Physical Activity Recommendations, by
Employment Status, Alaska Adults, 2005 & 2007 (combined)
Compared to those in other
employment status categories,
Alaska adults who are unable to
work are not only more likely to
be inactive in their leisure time,
but are also more likely to not
meet the physical activity
recommendations overall.
Source: AK BRFSS
0%
10%
20%
30%
40%
50%
60%
< $15K $15-25K $25-35K $35-50K $50-75K $75K+
Pe
rce
nt
Do
No
t M
eet
Ph
ysic
al A
ctiv
ity
Re
com
me
nd
atio
ns
0%
10%
20%
30%
40%
50%
60%
70%
Employed Unemployed Not in Workforce Unable to Work
Pe
rce
nt
Do
No
t M
eet
Ph
ysic
al A
ctiv
ity
Re
com
me
nd
atio
ns

Figure 60. Prevalence of Not Meeting Physical Activity Recommendations, by Education
Level, Alaska Adults, 2005 & 2007 (combined)
There is some association
between educational attainment
and meeting physical activity
recommendations among adults
overall, but drilling down it is
clear that this association holds
among women only.
Source: AK BRFSS
Figure 61. Prevalence of Not Meeting Physical Activity Recommendations, by Education
Level and Sex, Alaska Adults, 2005 & 2007 (combined)
Women who have less than a
high school education are more
than twice as likely compared to
those who have a attended at
least some college to fail to
meet physical activity
recommendations.
Source: AK BRFSS
0%
10%
20%
30%
40%
50%
Less than high school
High school/GED Some college College graduate
Pe
rce
nt
Do
No
t M
eet
Ph
ysic
al A
ctiv
ity
Re
com
me
nd
atio
ns
22% 20% 25% 19% 53% 39% 31% 25%0%
10%
20%
30%
40%
50%
60%
70%
Pe
rce
nt
Do
No
t M
eet
Ph
ysic
al A
ctiv
ity
Re
com
me
nd
atio
ns
Men Women

Figure 62. Prevalence of Not Meeting Physical Activity Recommendations, by Region,
Alaska Adults, 2005 & 2007 (combined)
The percentage of adults who
meet physical activity
recommendations also varies by
region. Adults who live in rural
Alaska are significantly more
likely than adults in all other
regions of Alaska to fail to meet
physical activity
recommendations.
Source: AK BRFSS
Figure 63. Prevalence of Obesity (BMI ≥ 30.0), Among Those Who Do and Do Not Meet
Physical Activity Recommendations, Alaska Adults, 2005 & 2007 (combined)
Adults who do not meet
physical activity
recommendations are
significantly more likely to be
obese than adults who do meet
the recommendations
Source: AK BRFSS
0%
10%
20%
30%
40%
50%
Anchorage & Vicinity
Gulf Coast Southeast Rural Fairbanks & Vicinity
Pe
rce
nt
Do
No
t M
eet
Ph
ysic
al A
ctiv
ity
Re
com
me
nd
atio
ns
24% 38%0%
10%
20%
30%
40%
50%
Individuals Who Meet Recommendation
Individuals Who Do Not Meet Recommendations
Pe
rce
nt
Ob
ese

Figure 64. Prevalence of Obesity (BMI ≥ 30.0), Among Those Who Do and Do Not Meet
Physical Activity Recommendations, by Sex, Alaska Adults, 2005 & 2007 (combined)
This association exists among
both men and women.
Source: AK BRFSS
0%
10%
20%
30%
40%
50%
Pe
rce
nt
Ob
ese
Men Women
Meet Recommendations
Do Not Meet Recommendations

In 2005 the BRFSS asked adults if they are aware of recommendations on how much physical
activity they should get.
Figure 65. Prevalence of Being Aware of Physical Activity Recommendations, by Sex,
Alaska Adults, 2005
Nearly three-quarters of adults
say they are aware of physical
activity recommendations.i
Women are significantly more
likely to be aware of
recommendations than men are.
Source: AK BRFSS
i As these data were collecte d only in 2005, they ref lect awareness with the prior set of physical activ ity recommendations , not those released in 2008 .
0%
20%
40%
60%
80%
100%
All Adults Men Women
Pe
rce
nt
Aw
are
of
Ph
ysic
al A
ctiv
ity
Re
com
me
nd
atio
ns

Figure 66. Prevalence of Being Aware of Physical Activity Recommendations, by Race,
Alaska Adults, 2005
White adults are significantly
more likely to report awareness
of recommendations than non-
White adults, with lowest levels
of awareness among American
Indian/Alaska Natives.
Source: AK BRFSS
Figure 67. Prevalence of Being Aware of Physical Activity Recommendations, by Age,
Alaska Adults, 2005
Alaskans between ages 35 and
64 are most likely to report
being aware of the physical
activity recommendations.
Source: AK BRFSS
0%
20%
40%
60%
80%
100%
White American Indian/ Alaska Native
Other
Pe
rce
nt
Aw
are
of
Ph
ysic
al A
ctiv
ity
Re
com
me
nd
atio
ns
0%
20%
40%
60%
80%
100%
18-24 25-34 35-44 45-54 55-64 65+
Pe
rce
nt
Aw
are
of
Ph
ysic
al A
ctiv
ity
Re
com
me
nd
atio
ns

Figure 68. Prevalence of Being Aware of Physical Activity Recommendations, by Income
Level, Alaska Adults, 2005
Individuals with higher levels of
income and education are also
more likely to report that they
are aware of physical activity
recommendations. As shown in
Figures 68 and 69, adults who
make more than $25,000 per
year or have completed at least
some college are more likely to
report that they are aware of
physical activity
recommendations than those
who make less than $25,000 or
have a high school education or
less, respectively.
Source: AK BRFSS
Figure 69. Prevalence of Being Aware of Physical Activity Recommendations, by
Education Level, Alaska Adults, 2005
Source: AK BRFSS
0%
20%
40%
60%
80%
100%
Less Than $25K $25K Or More
Pe
rce
nt
Aw
are
of
Ph
ysic
al A
ctiv
ity
Re
com
me
nd
atio
ns
0%
20%
40%
60%
80%
100%
High School Or Less At Least Some College
Pe
rce
nt
Aw
are
of
Ph
ysic
al A
ctiv
ity
Re
com
me
nd
atio
ns

Figure 70. Prevalence of Being Aware of Physical Activity Recommendations, by Region,
Alaska Adults, 2005
Adults who live in rural areas
are significantly less likely to
report being aware of physical
activity recommendations than
adults in all other regions of the
state. Awareness of physical
activity recommendations is not
associated with whether adults
meet the recommendations.
Source: AK BRFSS
0%
20%
40%
60%
80%
100%
Anchorage & Vicinity
Gulf Coast Southeast Rural Fairbanks & Vicinity
Pe
rce
nt
Aw
are
of
Ph
ysic
al A
ctiv
ity
Re
com
me
nd
atio
ns

In 2005 the Alaska BRFSS gathered information on the reasons adults do not participate in
more physical activity. When asked why they are not more physically active, 19% of adults
said that they exercise enough already.
Figure 71. Reasons for Not Being More Physically Active, Alaska Adults*, 2005
Among just those who do not
feel they get enough exercise,
half cite time constraints as their
main reason for not being more
physically active, 18% reported
physical challenges (including
illness or medical condition and
older age) that keep them from
being physically active, and
20% lack the motivation to
engage in more physical
activity. Only 6% report that
environmental or access
concerns prevent them from
being more physically active.
Source: AK BRFSS; *Excluding those who say they already exercise enough
Figure 72. Prevalence of Not Meeting Physical Activity Recommendations by Belief that
“I do/do not exercise enough already”, Alaska Adults, 2005
Adults who report that they do
not get enough physical activity
are significantly more likely to
fail to meet physical activity
recommendations than adults
who think that they already get
enough physical activity.
Source: AK BRFSS
0%
10%
20%
30%
40%
Exercise Enough Do Not Exercise Enough
Pe
rce
nt
Do
No
t M
eet
Ph
ysic
al A
ctiv
ity
Re
com
me
nd
atio
ns
Time Constraints50%
Motivational Issues20%
Physical Challenges18%
Other Issues
7%
Environment/ Access Issues
6%

According to the US DHSS 2008 Physical Activity Guidelines for Americans, children and
adolescents (6 to 17 years old) are recommended to get 60 or more minutes of moderate to
vigorous activity every day, with vigorous activity at least 3 days per week to promote a
healthy body weight and achieve overall health benefits. Data on the physical activity levels
of Alaska high school youth are available from the 2007 YRBS.
Figure 73. Number of Days in Past Week Engaged Physical Activity for at Least 60
Minutes, Alaska High School Youth, 2007
Eighty-one percent of Alaskan
high school students failed to
meet the new guideline of 60 or
more minutes every day, with
16% reporting not a single day
in the past week when they were
active for at least 60 minutes.
Source: AK YRBS
0 days16%
1 day8%
2 days11%
3 days10%
4 days12%
5 days15%
6 days9%
7 days19%

Figure 74. Prevalence of Not Meeting Physical Activity Recommendations (60 minutes
daily), by Sex, Alaska High School Youth, 2007
Girls (88%) are significantly
more likely to fail to meet the
recommendation than are boys
(75%).
Source: AK YRBS
Figure 75. Prevalence of Not Meeting Physical Activity Recommendations (60 minutes
daily), by Grade, Alaska High School Youth, 2007
The percentage of high school
students who do not meet the
physical activity
recommendations increases
slightly as grade level increases.
Source: AK YRBS
0%
20%
40%
60%
80%
100%
All Youth Boys Girls
Pe
rce
nt
Do
No
t M
eet
Ph
ysic
al A
ctiv
ity
Re
com
me
nd
atio
ns
0%
20%
40%
60%
80%
100%
9th 10th 11th 12th
Pe
rce
nt
Do
No
t M
eet
Ph
ysic
al A
ctiv
ity
Re
com
me
nd
atio
ns

Figure 76. Prevalence of Not Meeting Physical Activity Recommendations (60 minutes
daily), by Race, Alaska High School Youth, 2007
American Indian/Alaska Native
students are significantly more
likely than their peers to fail to
meet physical activity
recommendations.
Source: AK YRBS
Figure 77. Prevalence of Not Meeting Physical Activity Recommendations (60 minutes
daily), by Race and Sex, Alaska High School Youth, 2007
This disparity, compounded by
the sex difference already noted,
translates to very little physical
activity among American
Indian/Alaska Native girls; only
5% of American Indian/Alaska
Native girls are active at the
recommended levels.
Source: AK YRBS
0%
20%
40%
60%
80%
100%
White American Indian/ Alaska Native
Other
Pe
rce
nt
Do
No
t M
eet
Ph
ysic
al A
ctiv
ity
Re
com
me
nd
atio
ns
71% 86% 72% 86% 95% 81%0%
20%
40%
60%
80%
100%
White American Indian/ Alaska Native
Other White American Indian/ Alaska Native
Other
Pe
rce
nt
Do
No
t M
eet
Ph
ysic
al A
ctiv
ity
Re
com
me
nd
atio
ns
Boys Girls

Physical education class, or PE, not only provides an opportunity for students to be physically
active during the school day, it also gives students the tools they need to become individuals
who incorporate physical activity into their lives, throughout their lifespan. The CDC
recommends implementing programs that increase the length of, or activity levels in, school-
based physical education classes based on strong evidence of their effectiveness in improving
both physical activity levels and physical fitness among school-aged children and
adolescents.28
The YRBS assesses how many days per week high school students participate
in PE class, as well as how many ―active minutes‖ they have while in those classes.
Figure 78. Prevalence of Participating in 0 Days of Physical Education Class in the Past
Week, by Sex, Alaska High School Youth, 1995, 2003 & 2007
Consistently over the past 12-
year period for which data are
available, about half of Alaska
high school students report
having not participated in any
PE in the past week. Girls are
significantly more likely than
boys to have no PE. In fact,
boys (23%) are twice as likely
as girls (12%) to report having
daily PE (data not shown, 2007
Alaska YRBS).
Source: AK YRBS
49% 55% 53% 45% 49% 46% 54% 62% 61%0%
20%
40%
60%
80%
All youth Boys Girls
Pe
rce
nt
Had
0 D
ays
of
PE
1995 2003 2007

Figure 79. Prevalence of Participating in 0 Days of Physical Education Class in the Past
Week, by Grade, Alaska High School Youth, 2007
Similar to the pattern seen with
not meeting physical activity
recommendations, students in
older grades are the most likely
to have not participated in PE in
the past week. There are no
differences by race, either
overall or by sex.
Source: AK YRBS
Figure 80. Prevalence of Not Meeting Physical Activity Recommendations*, by
Participation in Daily Physical Education Class in the Past Week, Alaska High School
Youth, 2007
Students who do not participate
in daily PE are more likely than
those who have do to fail to
meet the recommendations for
physical activity.
Source: AK YRBS *60 minutes/7 days per week
Overall, 87% of high school students who participate in PE for 1 or more days per week say
they are active for at least 20 minutes during each PE class. Sample size precludes analysis by
sex, race, or grade level.
0%
20%
40%
60%
80%
9th 10th 11th 12th
Pe
rce
nt
Had
0 D
ays
of
PE
0%
20%
40%
60%
80%
100%
Daily PE Less than daily PE
Pe
rce
nt
Do
No
t M
eet
Ph
ysic
al A
ctiv
ity
Re
com
me
nd
atio
ns

Participation in team sports provides another opportunity for students to be physically active
during the school day. There is evidence that physical education and extracurricular physical
activities during adolescence may contribute to the prevention of adulthood overweight.29
Since 1995, the Alaska YRBS has collected data on student participation in team sports.
Figure 81. Number of Sports Teams Involved with in Past Year, Alaska High School
Youth, 1995, 2003 & 2007
Between 1995 and 2007 there
has been little change in Alaska
high school students’
involvement in team sports;
consistently around 38% are not
involved in any team sports.
Source: AK YRBS
38% 37% 38%
19% 24% 24%
19%21% 19%
26% 18% 19%
0%
20%
40%
60%
80%
100%
1995 2003 2007
Pe
rce
nt
0 teams 1 team 2 teams 3+ teams

Figure 82. Prevalence of No Involvement in Sports Teams During the Past Year, by
Race, Alaska High School Youth, 2007
There are no significant sex or
grade level differences in sports
team participation; however,
non-White, non-American
Indian/Alaska Native students
are significantly more likely
than White students to have no
involvement in sports teams in
the prior year.
Source: AK YRBS
Figure 83. Prevalence of Not Meeting Physical Activity Recommendations*, by
Participation in 1 or More Sports Teams During the Past Year, Alaska High School
Youth, 2007
Alaska high school students
who have no involvement in
sports teams are more likely
than their peers to both (a) fail
to meet physical activity
recommendations (Figure 83)
and (b) be obese (Figure 84).
Source: AK YRBS
0%
10%
20%
30%
40%
50%
60%
White American Indian/ Alaska Native
Other
Pe
rce
nt
on
0 S
po
rts
Team
s
0%
20%
40%
60%
80%
100%
1+ Sports Team No Sports Teams
Pe
rce
nt
Did
No
t M
eet
Ph
ysic
alA
ctiv
ity
reco
mm
en
dat
ion
s

Figure 84. Prevalence of Obesity (BMI ≥ 95th percentile), by Participation in Team
Sports, Alaska High School Youth, 2007
Source: AK YRBS
0%
5%
10%
15%
20%
25%
1+ Sports Team No Sports Teams
Pe
rce
nt
Ob
ese

Television viewing and computer/video game playing (i.e., ―screen time‖) have been
identified as a contributor to obesity, particularly among children.30
The American Academy
of Pediatrics recommends limiting television and other screen time to no more than 2 hours
per day for children ages 2 to 18.31
Both the BRFSS and YRBS provide information on the
amount of time adults and high school students spend watching television and DVDs, and also
using the computer for purposes other than work (for adults) and school work (for youth). The
BRFSS uses a single question to assess screen time, whereas the YRBS has separate questions
for TV viewing and non-academic computer use.
Figure 85. Number of Hours of Screen Time per Day, Alaska Adults, 2005
Over 80% of Alaskan adults
spend at least 1 hour each day
on screen time. Over 60%
spend two or more hours each
day, and one-third of adults
spend 3 or more hours on
screen time each day.
Source: AK BRFSS
None3%
<1 hour13%
1 hour21%
2 hours29%
3+ hours33%
Not sure1%

Figure 86. Prevalence of Not Meeting Physical Activity Recommendations, by TV/Screen
Time, Alaska Adults, 2005
One of the pathways by which
screen time is thought to
contribute to obesity is by
acting as a replacement for
physical activity. Television
viewing is a sedentary activity
and the time spent watching TV
could otherwise be used for
physical activity. In Alaska,
adults who have 3 or more
hours of screen time each day
are significantly more likely to
fail to meet physical activity
recommendations than those
who have less screen time.
Source: AK BRFSS
0%
10%
20%
30%
40%
50%
<3 hours/day 3+ hours/day
Pe
rce
nt
Do
No
t M
eet
Ph
ysic
al A
ctiv
ity
Re
com
me
nd
atio
ns

Figure 87. Number of Hours of TV Watched during Average School Day, Among High
School Youth, Alaska (2007)
Nearly two-thirds (63%) of high
school students watch an hour
or more of TV on an average
school day. Nearly 1 in 4 high
school students (23%) watch 3
or more hours, and 6% watch 5
or more hours of television per
school day. There are no
significant sex, racial, or grade
level differences in the
prevalence of watching 3 or
more hours of TV per day.
Source: AK BRFSS
Figure 88. Prevalence of Obesity (BMI ≥ 95th
percentile), by Amount of TV Viewing,
Alaska High School Youth, 2007
Those students who watch 3 or
more hours of television per day
are twice as likely as those who
watch less TV to be obese (18%
and 9%, respectively).
Source: AK YRBS
None17%
<1 hr20%
1 hr15%
2 hrs25%
3 hrs12%
4 hrs5%
5+ hrs6%
0%
5%
10%
15%
20%
25%
<3 hours/day 3+ hours/day
Pe
rce
nt
Ob
ese

Figure 89. Number of Hours Used a Computer (Not for School Work) during Average
School Day, Alaska High School Youth, 2007
In addition to watching
television, a significant amount
of sedentary time is spent by
youth playing computer games
and doing other non-academic
work on the computer. Fifty-
seven percent of Alaska high
school students spend an hour or
more on the computer in an
average day, over and above any
time intended to meet academic
needs.
Source: AK YRBS
Figure 90. Prevalence of Using a Computer for 3 or More Hours During the Average
School Day*, by Sex, Alaska High School Youth, 2007
Boys (29%) are significantly
more likely than girls (18%) to
spend 3 or more hours on the
computer.
Source: AK YRBS; *Not for sch ool work
None19%
<1 hr24%
1 hr17%
2 hrs17%
3 hrs11%
4 hrs5% 5+ hrs
7%
0%
10%
20%
30%
40%
All Youth Boys Girls
Pe
rce
nt
on
Co
mp
ute
r 3
+ H
ou
rs

Figure 91. Prevalence of Obesity (BMI ≥ 95th percentile), by Amount of Computer
Usage,* Alaska High School Youth, 2007
As with television viewing,
there is an association between
hours of computer usage and
obesity among youth, though it
is only marginally significant.
High school students who play
video games or otherwise use a
computer for non-academic
work for 3 or more hours a day
are more likely than their peers
to be obese (16% compared to
10%, respectively).
Source: AK YRBS; *Not for sch ool work
Figure 92. Number of Hours of “Screen Time” (Watched TV or Used a Computer, Not
for School Work) during Average School Day, Alaska High School Youth, 2007
When time spent watching
television and using a computer
(for non-academic work) are
combined, it becomes clear that
many of Alaska’s youth are
spending considerable time each
school day in sedentary
behavior. One out of every 2
high school students is watching
TV or on the computer for 3 or
more hours daily; 1 out of 4 are
doing so for 5 or more hours per
day.
Source: AK YRBS
0%
5%
10%
15%
20%
25%
< 3 Hours Daily 3+ Hours Daily
Pe
rce
nt
Ob
ese
None6%
<1 hour13%
1 hour13%
2 hours18%
3 hours15%
4 hours10%
5+ hours25%

The Childhood Understanding Behaviors Survey (CUBS) surveyed mothers of 2-year-old
children born in Alaska in 2004 and still living in Alaska in 2006.32
The mothers were asked
about the number of hours of television ―screen time‖ their toddlers had on the day prior to the
interview.
Figure 93. Number of Hours of Television “Screen Time” (Including Videos and DVDs),
Alaska 2-Year- Olds, 2006
The reports indicate that only
9% of toddlers did not watch
any TV or videos that day. Most
watched an hour or less, but
19% had more than 2 hours of
―screen time‖.
Source: AK CUBS; *Computer use not included
0%
10%
20%
30%
40%
50%
None ≤1 Hour >1 to ≤2 Hours >2 Hours
Pe
rce
nt

The primary measure of adult nutrition status is fruit and vegetable consumption. Fruits and
vegetables are promoted for the prevention of obesity because
of their high water and fiber
content, low fat content and low energy density, all effectively reducing energy (caloric)
intake.33
The Dietary Guidelines for Americans, 2005 recommends at least 5 servings of
fruits and vegetables each day.34
Figure 94. Trend in Prevalence of Consuming Less Than 5 Daily Servings of Fruits and
Vegetables, Alaska Adults, 1991-2007 (for years available)
In Alaska, however, 3 of every
4 adults eats less than the
recommended 5 or more
servings of fruits and vegetables
per day; this percentage has
varied little over the past 17
years.
Source: AK BRFSS
79%76%
0%
20%
40%
60%
80%
100%
19
91
19
92
19
93
19
94
19
95
19
96
19
97
19
98
19
99
20
00
20
01
20
02
20
03
20
04
20
05
20
06
20
07
Pe
rce
nt
Co
nsu
me
d L
ess
Th
an
5 D
aily
Se
rvin
gs

Figure 95. Prevalence of Consuming Less Than 5 Daily Servings of Fruits and
Vegetables, by Sex, Alaska Adults, 2005 & 2007 (combined)
Men are more likely than
women to fail to meet this
nutritional recommendation.
Source: AK BRFSS
Figure 96. Prevalence of Consuming Less Than 5 Daily Servings of Fruits and
Vegetables, by Education Level, Alaska Adults, 2005 & 2007 (combined)
Fruit and vegetable consumption
does not differ significantly by
age, income, or race and
ethnicity; slight differences are
seen by education level and
employment status, however.
Alaska adults with less than a
college degree are the most
likely to fail to meet the
nutrition recommendations.
Source: AK BRFSS
0%
20%
40%
60%
80%
100%
All Adults Men Women
Pe
rce
nt
Co
nsu
me
d L
ess
Th
an5
Dai
ly S
erv
ings
0%
20%
40%
60%
80%
100%
Less than high school
High school/GED Some college College graduate
Pe
rce
nt
Co
nsu
me
d L
ess
Th
an5
Dai
ly S
erv
ings

Figure 97. Prevalence of Consuming Less Than 5 Daily Servings of Fruits and
Vegetables, by Employment Status, Alaska Adults, 2005 & 2007 (combined)
Employed adults are also
significantly more likely to eat
less than the recommended
levels of fruits and vegetables
compared to those not in the
workforce.
Source: AK BRFSS
Figure 98. Prevalence of Consuming Less Than 5 Daily Servings of Fruits and
Vegetables, by Region, Alaska Adults, 2005 & 2007 (combined)
Adults in rural Alaska are
significantly more likely than
those in Anchorage or Southeast
Alaska to consume less than 5
daily servings of fruits and
vegetables. No other regional
differences in fruit and
vegetable consumption are
significant.
Source: AK BRFSS
0%
20%
40%
60%
80%
100%
Employed Unemployed Not in Workforce Unable to Work
Pe
rce
nt
Co
nsu
me
d L
ess
Th
an5
Dai
ly S
erv
ings
0%
20%
40%
60%
80%
100%
Anchorage & Vicinity
Gulf Coast Southeast Rural Fairbanks & Vicinity
Pe
rce
nt
Co
nsu
me
d L
ess
Th
an5
Dai
ly S
erv
ings

Figure 99. Prevalence of Consuming Less Than 5 Daily Servings of Fruits and
Vegetables, by Sex, Alaska High School Youth, 2003 & 2007
Fruit and vegetable consumption
is also low among high school
students. As evidenced by
YRBS data from both 2003 and
2007, only 16% of high school
students eat 5 or more servings
of fruits and vegetables per day.
Fruit and vegetable consumption
does not differ significantly by
grade, age, gender, or
race/ethnicity.
Source: AK YRBS
0%
20%
40%
60%
80%
100%
Pe
rce
nt
Co
nsu
me
d le
ss T
han
5 D
aily
Se
rvin
gs
All Youth
2003 2007
GirlsBoys

Beverage consumption is also an indication of nutrition behavior. Sugar-sweetened beverages
(carbonated and non-carbonated beverages sweetened with sugar, high-fructose corn syrup or
other caloric sweeteners) are now a significant source of added sugars and calories in the diet
of Americans.35
Soda consumption has recently been identified as a contributing factor to
weight gain.35
The 2005 BRFSS survey asked adults how many cans or glasses of soda they
consume each day.
Figure 100. Number of Cans/Glasses of Soda (Excluding Diet) Consumed Per Day,
Alaska Adults, 2005
Nearly one-third (29%) of adults
report drinking 1 or more cans
of regular soda each day, with
14% of adults drinking 2 or
more cans.
Source: AK BRFSS
None61%< 1/Day
11%
1/Day15%
2/Day7%
3+/Day6%
Don't Know<1%

Figure 101. Number of Cans/Glasses of Sugar-Sweetened, Non-Carbonated Beverages
Consumed Per Day, Alaska Adults, 2005
The percentage of adults who
consume sweetened non-
carbonated beverages (e.g.,
sports drinks, powdered drinks,
or sugar-sweetened fruit drinks)
is similar to the percentage that
consume regular soda. Twenty-
four percent of adults drink 1 or
more can or glass of a
sweetened beverage each day,
with 12% consuming 2 or more
cans or glasses each day.
Source: AK BRFSS
Figure 102. Number of Cans/Glasses of Diet Soda Consumed Per Day, Alaska Adults,
2005
Consumption of diet drinks is
lower than that of sweetened
beverages; with 16% of adults
drinking more than 1 diet soda
each day. Seven percent drink 2
or more diet sodas each day.
Source: AK BRFSS
None70%
< 1/Day6%
1/Day12%
2/Day6%
3+/Day5%
Don't Know<1%
None75%
< 1/Day9%
1/Day9%
2/Day4%
3+/Day3%
Don't Know<1%

Figure 103. Number of Cans/Glasses of Non-Diet, Sugar-Sweetened* Beverages
Consumed Per Day, Alaska Adults, 2005
If carbonated (i.e., soda) and
non-carbonated sugar-sweetened
beverages are considered
together, we see that nearly half
(44%) of adults drink at least 1
can or glass of a non-diet
sweetened beverage each day,
with a quarter consuming 2 or
more cans or glasses.
Source: AK BRFSS; *Non-Diet Soda and sweetened, non -carbonated beverages
Figure 104. Prevalence of Prevalence of Drinking 1 or More Cans/Glasses of Non-Diet,
Sugar-Sweetened Beverages Daily, by Sex, Alaska Adults, 2005
Men, American Indian/Alaska
Natives, adults living in rural
parts of the state, and adults
under the age of 25 are those
most likely to consume at least 1
sugar-sweetened beverage per
day.
Source: AK BRFSS
None49%
< 1/Day8%
1/Day19%
2/Day11%
3+/Day13%
Don't Know<1%
0%
10%
20%
30%
40%
50%
60%
All Adults Men Women
Pe
rce
nt
Co
nsu
me
1+
Gla
sse
sSw
eet
en
ed
Be
vera
ges
Dai
ly

Figure 105. Prevalence of Prevalence of Drinking 1 or More Cans/Glasses of Non-Diet,
Sugar-Sweetened Beverages Daily, by Race, Alaska Adults, 2005
Source: AK BRFSS
Figure 106. Prevalence of Prevalence of Drinking 1 or More Cans/Glasses of Non-Diet,
Sugar-Sweetened Beverages Daily, by Age, Alaska Adults, 2005
Source: AK BRFSS
0%
10%
20%
30%
40%
50%
60%
70%
80%
White American Indian/ Alaska Native
Other
Pe
rce
nt
Co
nsu
me
1+
Gla
sse
sSw
eet
en
ed
Be
vera
ges
Dai
ly
0%
20%
40%
60%
80%
100%
18-24 25-34 35-44 45-54 55-64 65+
Pe
rce
nt
Co
nsu
me
1+
Gla
sse
sSw
eet
en
ed
Be
vera
ges
Dai
ly

Figure 107. Prevalence of Prevalence of Drinking 1 or More Cans/Glasses of Non-Diet,
Sugar-Sweetened Beverages Daily, by Region, Alaska Adults, 2005
Source: AK BRFSS
Figure 108. Prevalence of Prevalence of Drinking 1 or More Cans/Glasses of Non-Diet,
Sugar-Sweetened Beverages Daily, by Income Level, Alaska Adults, 2005
Adults with household incomes
of $75,000 or more and those
who graduated from college are
among those with the lowest
prevalence of daily sugar-
sweetened beverage
consumption.
Source: AK BRFSS
0%
20%
40%
60%
80%
Anchorage & Vicinity
Gulf Coast Southeast Rural Fairbanks & Vicinity
Pe
rce
nt
Co
nsu
me
1+
Gla
sse
sSw
eet
en
ed
Be
vera
ges
Dai
ly
0%
20%
40%
60%
80%
Less than $15K
$15-25K $25-35K $35-50K $50-75K $75K+
Pe
rce
nt
Co
nsu
me
1+
Gla
sse
sSw
eet
en
ed
Be
vera
ges
Dai
ly

Figure 109. Prevalence of Prevalence of Drinking 1 or More Cans/Glasses of Non-Diet,
Sugar-Sweetened Beverages Daily, by Education Level, Alaska Adults, 2005
Source: AK BRFSS
0%
20%
40%
60%
80%
Less than high school
High school/GED Some college College graduate
Pe
rce
nt
Co
nsu
me
1+
Gla
sse
sSw
eet
en
ed
Be
vera
ges
Dai
ly

Figure 110. Number of Cans/Glasses Consumed by Youth per day, Alaska 2007
The 2007 YRBS included a question about consumption of soda, excluding diet soda. Those
data show that more than 3 in 4
students (78%) had at least 1
soda in the previous week; 15%
had 2 or more sodas every
single day in the past week. It
should be noted that these data
underestimate the total amount
of sugar-sweetened beverage
consumption by youth as it
excludes non-carbonated
beverages (e.g., sports drinks,
sweetened powdered drinks and
sugar-sweetened fruit drinks)
and other sweetened carbonated
beverages (e.g., energy drinks
and carbonated fruit drinks).
Source: AK YRBS
Figure 111. Prevalence of Drinking 1 or More Cans/Glasses of Soda (Excluding Diet)
Daily, by Sex, Alaska High School Youth, 2007
Boys are marginally more likely
than girls to drink 1 or more
sodas per day.
Source: AK YRBS
None, 23%
1-3/Week, 38%
4-6/Week, 18%
1/Day, 7%
2/Day, 7%
3+/Day, 8%
0%
10%
20%
30%
40%
All Youth Boys Girls
Pe
rce
nt
Co
nsu
me
1+
Gla
sse
s o
f So
da
Dai
ly

Figure 112. Prevalence of Drinking 1 or More Cans/Glasses of Soda (Excluding Diet)
Daily, by Race and Sex, Alaska High School Youth, 2007
American Indian/Alaska Native
girls are more than 3 times as
likely as White girls to consume
at least 1 soda daily; there is no
significant difference among
boys.
Source: AK YRBS
The CUBS also surveyed mothers of 2-year-olds about their child’s consumption of soda.
According to these mothers’ reports, 15% of toddlers consumed 1 or more cups of soda or
other sweetened beverages the day prior to the interview.
Figure 113. Prevalence of Drinking Any Soda or Sweetened Beverages, by Region,
Alaska 2-Year-Olds, 2006
Prevalence of any soda
consumption among toddlers is
highest in the Northern and
Southwest regions of Alaska,
with over half (58%) of the 2-
year-olds in those regions
consuming some amount (versus
none) of a sweetened beverage
on an average day compared to
21%-26% of toddlers living in
other regions of the state.
Source: AK CUBS
25% 27% 21% 11% 35% 16%0%
10%
20%
30%
40%
50%
White American Indian/
Alaska Native
Other White American Indian/
Alaska Native
Other
Pe
rce
nt
Co
nsu
me
1+
Gla
sse
s o
f So
da
Dai
ly
Boys Girls
29% 26% 21% 24% 58%0%
20%
40%
60%
80%
Statewide Anchorage/ Mat-Su
Interior Gulf Coast and Southeast
Northern and Southwest
Pe
rce
nt
Co
nsu
me
An
y A
mo
un
to
f A
ny
Swe
ete
ne
d B
eve
rage

There is concern that sugar-sweetened beverages are replacing milk as the main beverage for
children, thereby reducing their intake of important nutrients, such as calcium, vitamin A and
vitamin D.36
Some evidence suggests that lower intakes of dairy products and/or calcium are
associated with obesity in children.37
Figure 114. Number of Glasses of Milk Consumed in Past Week, Alaska High School
Youth, 2007
According to the 2003 and 2007
YRBS, reported levels of milk
consumption have remained
stable over that 5-year time
period (data not shown). In
2007, 18% of students report
that they have not consumed any
milk in the past week; the
overwhelming majority (89%)
report drinking fewer than the 3
or more glasses per day that
would allow them to meet the
recommended 3 daily servings
of dairy.
Source: AK YRBS
None, 18%
≤1/Day, 59%
2/Day, 12%
3/Day, 7%
4+/Day, 4%

Figure 115. Prevalence of Drinking Fewer Than 3 Glasses of Milk Daily, by Sex, Alaska
High School Youth, 2007
Girls are more likely than boys
to drink fewer than 3 glasses of
milk a day; milk consumption
does not vary by grade level or
race.
Source: AK YRBS
The CUBS survey includes questions that assess milk consumption among 2-year-olds. The
Dietary Guidelines for Americans, 2005 recommends 2 cups of fat-free or low-fat (1%) milk,
or equivalent milk products, every day for children ages 2 to 8.34
Fat-free or low-fat milk is
recommended to reduce calorie and saturated fat intake.
Figure 116. Usual Type of Milk Consumed, Alaska 2-Year-Olds, 2006
According to the CUBS survey,
80% of Alaska toddlers drink 2
or more cups of milk daily;
however, only usually7% drink
fat-free or low-fat milk and 45%
drink whole milk.
Source: AK CUBS
0%
20%
40%
60%
80%
100%
All Youth Boys Girls
Pe
rce
nt
Co
nsu
me
<3
Gla
sse
s o
f M
ilk D
aily
Whole or Regular Milk, 45%
Reduced-fat (2%) Milk, 37%
Low-fat (1%) or Fat-free Milk, 7%
Other, 9%
None, 2%

One reason that so many people fail to meet nutrition recommendations may be that they are
unaware of those recommendations. To examine this, we included a question on the 2005
BRFSS regarding recommendation awareness.
Figure 117. Prevalence of Being Aware of Nutrition Recommendations, by Sex, Alaska
Adults, 2005
Nearly 80% of adults say that
they are aware of
recommendations, with women
significantly more likely than
men to report awareness.
Source: AK BRFSS
0%
20%
40%
60%
80%
100%
All Adults Men Women
Pe
rce
nt
Aw
are
of
Nu
trit
ion
Re
com
me
nd
atio
ns

Figure 118. Prevalence of Being Aware of Nutrition Recommendations, by Race, Alaska
Adults, 2005
White adults are significantly
more likely to report awareness
of nutrition recommendations
than adults of other racial and
ethnic groups.
Source: AK BRFSS
Figure 119. Prevalence of Being Aware of Nutrition Recommendations, by Income
Level, Alaska Adults, 2005
Adults with household incomes
of $25,000 or more per year are
significantly more likely to
report awareness of nutrition
recommendations than those
making less than that amount.
Source: AK BRFSS
0%
20%
40%
60%
80%
100%
White American Indian/ Alaska Native
Other
Pe
rce
nt
Aw
are
of
Nu
trit
ion
Re
com
me
nd
atio
ns
0%
20%
40%
60%
80%
100%
Less Than $25K $25K or More
Pe
rce
nt
Aw
are
of
Nu
trit
ion
Re
com
me
nd
atio
ns

Figure 120. Prevalence of Being Aware of Nutrition Recommendations, by Education
Level, Alaska Adults, 2005
Adults who have completed at
least some college are also
significantly more likely to
report awareness of nutrition
recommendations than those
with a high school education or
less.
Source: AK BRFSS
Figure 121. Prevalence of Being Aware of Nutrition Recommendations, by Region,
Alaska Adults, 2005
Adults in rural Alaska are
significantly less likely to report
awareness of nutrition
recommendations than adults in
other regions of the state.
Source: AK BRFSS
0%
20%
40%
60%
80%
100%
High School or Less At Least Some College
Pe
rce
nt
Aw
are
of
Nu
trit
ion
Re
com
me
nd
atio
ns
0%
20%
40%
60%
80%
100%
Anchorage & Vicinity
Gulf Coast Southeast Rural Fairbanks & Vicinity
Pe
rce
nt
Aw
are
of
Nu
trit
ion
Re
com
me
nd
atio
ns

Figure 122. Prevalence of Consuming Less Than 5 Daily Servings of Fruits and
Vegetables, by Awareness of Nutrition Recommendations, Alaska Adults, 2005
Adults who are not aware of
nutrition recommendations are
significantly more likely than
those who are aware of them to
fail to meet recommended fruit
and vegetable consumption
levels.
Source: AK BRFSS
Figure 123. Perceived Level of Fruit and Vegetable Consumption Needed to Meet
Recommendations, Alaska Adults, 2005
When adults who report being
aware of nutrition
recommendations are asked how
many servings of fruits and
vegetables should be consumed
each day, half of them correctly
report that 5 or more servings
are recommended.
Source: AK BRFSS
0%
20%
40%
60%
80%
100%
Aware Not aware
Pe
rce
nt
Co
nsu
me
d L
ess
Th
an 5
Dai
ly S
erv
ings
12%
26%
313%
412%
5-1150%
12+1%
Not Sure16%

The 2005 BRFSS also asked adults to identify issues that keep them from eating more fruits
and vegetables. Over one-fifth (22%) say that they eat enough fruits and vegetables already.
Figure 124. Main Reason Do Not Eat More Fruits and Vegetables, Alaska Adults*, 2005
Of those who responded with a
reason for not eating fruits and
vegetables, many Alaska adults
cited either inconvenience in
obtaining or preparing fruits and
vegetables (25%), lack of
availability (21%), or cost
(20%) as their main reason.
Source: AK BRFSS; *Excluding those who say they already eat enough fruits and vegetables Percentages may not sum to 100% due to rounding .
Figure 125. Prevalence of Consuming Less Than 5 Daily Servings of Fruits and
Vegetables, by Belief that “I do/do not eat enough already”, Alaska Adults, 2005
Adults who report that they
believe they eat enough fruits
and vegetables already are less
likely to fail to meet the
nutrition recommendations
(50%; according to their self-
reported daily fruit and
vegetable consumption)
compared to their peers (85%).
Source: AK BRFSS
Inconvenient25%
Unavailable21%
Other21%
Expensive20%
Unappealing13%
0%
20%
40%
60%
80%
100%
Eat Enough Do Not Eat Enough
Pe
rce
nt
Co
nsu
me
d L
ess
Th
an 5
Dai
ly S
erv
ings

Lack of access to local grocery stores and full-services restaurants (as opposed to fast-food
restaurants) contributes to poor dietary patterns and obesity. Disparities in food access are
greatest in lower income, minority, urbanized neighborhoods, as well as less populated rural
areas.38
The BRFSS includes a series of questions asking adults to rate how easy or difficult it
is to obtain healthy food in various places within their communities.
Figure 126. Ratings of Access to Healthy Food in Local Stores, Alaska Adults, 2005
Over 80% report that it is easy
to obtain healthy foods in local
grocery stores, while only 13%
say that it is difficult to find
healthy foods in their local
stores.
Source: AK BRFSS
Impossible2%
Difficult13%
Easy56%
Very Easy28%
Don't Know1%

Figure 127. Ratings of Access to Healthy Food in Local Restaurants, Alaska Adults, 2005
Adults are less likely to report
that healthy food is easy to
access in local restaurants,
however. Nearly one-third
(30%) say that it is difficult or
impossible to access healthy
food in local restaurants.
Source: AK BRFSS
Figure 128. Ratings of Access to Healthy Food in Local Vending Machines, Alaska
Adults, 2005
Access to healthy food in
vending machines is even more
challenging, with over 80% of
adults reporting that it is
difficult or impossible to access
healthy food in vending
machines.
Source: AK BRFSS
Impossible5%
Difficult25%
Easy53%
Very Easy14%
Don't Know3%
Impossible31%
Difficult51%
Easy10%
Very Easy2%
Don't Know6%

Breastfeeding has many documented benefits for mothers and babies, including evidence to
suggest that any breastfeeding and breastfeeding for longer durations may protect against
obesity in childhood.39
The American Academy of Pediatrics recommends breastfeeding for
obesity prevention.40
Alaska currently has higher breastfeeding initiation and duration rates
than the nation.41
The Alaska Pregnancy Risk Assessment Monitoring System (PRAMS) is an
ongoing population-based survey that collects self-reported information on maternal attitudes
and experiences before, during, and after delivery of a liveborn infant. 42
Figure 129. Trends in Breastfeeding Initiation, at 4 Weeks Postpartum and at 8 Weeks
Postpartum, Women Delivering in Alaska, 1991-2005
PRAMS data from 1991
through 2005 show increases in
the prevalences of breastfeeding
initiation and duration.
Source: AK PRAMS
79%
91%
68%
81%
59%
71%
40%
50%
60%
70%
80%
90%
100%
19
91
19
92
19
93
19
94
19
95
19
96
19
97
19
98
19
99
20
00
20
01
20
02
20
03
20
04
20
05
Pe
rce
nt
Bre
astf
ee
din
g
Initiation 4 weeks 8 weeks

Figure 130. Trends in Breastfeeding Initiation by Race, Women Delivering in Alaska,
1991-2005
Non-Native mothers have
traditionally been significantly
more likely than American
Indian/Alaska Native mothers to
initiate and continue to
breastfeed. In recent years this
disparity has diminished, and
during 2005 there was no racial
disparity in the prevalence of
women who initiated
breastfeeding.
Source: AK PRAMS
79%
91%
81%
91%
73%
90%
40%
50%
60%
70%
80%
90%
100%
19
91
19
92
19
93
19
94
19
95
19
96
19
97
19
98
19
99
20
00
20
01
20
02
20
03
20
04
20
05
Pe
rce
nt
Bre
astf
ee
din
g
Overall Non-Native Alaska Native

The epidemic of obesity in Alaska must be addressed. When asked to name the number one
health issue facing Alaskans today, obesity was the number one response (26% of Alaska
adults; 2005 BRFSS). When responses for lack of exercise and poor diet are added in, that
figure increases to 40%.
As noted by the Surgeon General, the Institute of Medicine, and other prominent health and
science organizations, reducing obesity will require action on the part of individuals,
organizations, and policy-makers in a wide variety of settings.1,31
The Surgeon General’s Call
to Action to Prevent and Decrease Overweight and Obesity states that ―successful efforts [to
prevent overweight and obesity], must focus not only on individual behavioral change, but
also on group influences, institutional and community influences, and public policy.‖1 The
BRFSS and YRBS collect information on what individuals are doing to manage their own
weight, and also on support for more broad-based strategies.
Figure 131. Perceived Weight Status, Alaska Adults, 2007
On the 2007 BRFSS, adults
were asked to report their
perceptions of their own weight.
Just over half of adults in
Alaska (51%) believe they are
of a normal weight—neither
under nor overweight. Forty-
five percent say they are
overweight or obese.
Source: AK BRFSS
Underweight3%
Normal Weight51%
Overweight39%
Obese6%
Don't Know1%

Figure 132. Perceived Weight Status, By Actual Weight Status, Alaska Adults, 2005
Although perceived weight and
actual weight status based on
self-reported height and weight
are associated, this association
is not perfect. The vast majority
of Alaskans (89%) whose BMI
puts them in the ―normal or
underweight‖ category view
themselves as normal or
underweight. In contrast, only
20% of Alaskans classified as
―obese‖ based on their BMI
report that they consider
themselves obese.
Source: AK BRFSS
Figure 133. Weight Change from Last Year, Alaska Adults, 2007
About half of Alaska adults
(49%) report that their weight is
unchanged from one year ago;
the remainder is evenly split
between those who report
having lost or gained weight in
the past year.
Source: AK BRFSS
11%
45%
67%89%
55%
13%
0%
20%
40%
60%
80%
100%
Normal/Under Weight Overweight Obese
Pe
rce
nt
Actual Weight Status
Obese Overweight Normal/Underweight
I think I am…
Lost Weight27%
Gained Weight24%
Stayed the Same49%

Figure 134. Intentionality of Weight Change from Last Year, by Direction of Change,
Alaska Adults, 2007
Just over two-thirds of those
who say they lost weight in the
past year report doing so
intentionally; in contrast only
17% of those who gained
weight said this weight change
had been intended.
Source: AK BRFSS
Figure 135. Weight Management Efforts, Alaska Adults, 2003 & 2007 (combined)
In 2003 and 2007 combined,
three-quarters of Alaska adults
were trying to either lose weight
or maintain their current weight.
Source: AK BRFSS
69%
30%
1%
17%
79%
4%
Among Those Who
Lost WeightAmong Those Who
Gained Weight
Intentional Unintentional Not Sure
Trying to Lose44%
Trying to Maintain31%
Not Trying to Lose or Maintain
25%

Figure 136. Health Professional Advice in Past 12 Months Regarding Weight, Alaska
Adults, 2003 & 2007 (combined)
Only 15% of Alaska adults
report that a health care provider
advised them to lose or maintain
their weight during the past 12
months.
Source: AK BRFSS
Figure 137. Weight Management Efforts, by Health Professional Advice, Alaska Adults,
2003 & 2007 (combined)
Those who reported receiving
such advice were much more
likely than those who did not to
report trying to lose or maintain
their weight.
Source: AK BRFSS
Advised to Lose13%
Advised to Maintain2%
Advised to Gain1%
No Weight Advice Given84%
98%
2%
72%
28%
Trying to Lose/Maintain Not Trying to Lose/Maintain
Among Those AdvisedTo Lose/Maintain
Among Those Not AdvisedTo Lose/Maintain

Figure 138. Use of Diet-Related Weight Management Strategies, Alaska Adults Trying to
Lose or Maintain Their Weight, 2003 & 2007 (combined)
Adult Alaskans report using a
variety of strategies to either
lose or maintain their weight.
Among Alaska adults who say
they are trying to either lose
weight or maintain their current
weight, more than two-thirds
say they are doing so, at least in
part, through changes to their
diet.
Source: AK BRFSS
Figure 139. Use of Exercise as a Weight Management Strategy, Alaska Adults Trying to
Lose or Maintain Their Weight, 2003 & 2007 (combined)
Three-quarters of adults report
increasing their level of physical
activity as a way to lose or
maintain weight.
Source: AK BRFSS
Eating Fewer Calories
17%
Eating Less Fat19%
Eating Fewer Calories AND Less Fat
33%
No Diet Changes31%
Exercising to lose or maintain
76%
Not exercising to lose or maintain
24%

Figure 140. Perceived Weight Status, Alaska High School Youth, 2007
In the 2007 YRBS, high school
students were asked to report
their perceptions of their own
weight status. Just over half
(54%) believe their weight is
―about right‖; over one-quarter
(27%) believe they are ―slightly
overweight‖ and an additional
4% say they are ―very
overweight‖.
Source: AK YRBS
Figure 141. Perceived Weight Status, by Sex, Alaska High School Youth, 2007
As might be expected, girls are
less likely than boys to view
themselves as either
―underweight‖ or ―about right‖,
and more likely than boys to
view themselves as
―overweight‖.
Source: AK YRBS
Very Underweight3%
Slightly Underweight
12%
About Right54%
Slightly Overweight27%
Very Overweight4%
3%
15%
58%
21%
3%1%
7%
52%
34%
6%
Boys Girls
Very Underweight Slightly Underweight About Right
Slightly Overweight Very Overweight

Figure 142. Weight Status, by Sex, Alaska High School Youth, 2007
For comparison, note that the
sex differences in actual weight
status (albeit based on self-
report) are relatively minor.
Source: AK YRBS
Figure 143. Perceived Weight Status, By Actual Weight Status, Alaska High School
Youth, 2003 & 2007 (combined)
Although perceived and actual
weight status are not identical,
they are associated. As Figure
143 shows, the majority (66%)
of normal weight youth view
themselves as being ―about
right‖ in terms of weight;
conversely, the majority (84%)
of obese youth identify
themselves as being either
―slightly‖ or ―very overweight‖.
Small numbers preclude an
analysis by sex.
Source: AK YRBS
2%
68%
18%
12%
2%
73%
15%
10%
Boys Girls
Underweight Normal Weight
Overweight Obese
17%
56%
62%82%
40%
16%
0%
20%
40%
60%
80%
100%
Normal/Underweight Overweight Obese
Pe
rce
nt
Actual Weight Status
Very Overweight Slightly Overweight Underweight/ About Right
I think I am…

Figure 144. Weight Management Efforts, Alaska High School Youth, 2007
Over half of Alaska high school
students (63%) say they are
trying to either lose or maintain
their weight.
Source: AK YRBS
Figure 145. Weight Management Efforts, by Sex, Alaska High School Youth, 2007
Girls are twice as likely as boys
to report trying to lose weight
(60% and 29%, respectively),
and boys are 4 times as likely as
girls to report trying to gain
weight.
Source: AK YRBS
Trying to Lose44%
Trying to Maintain19%
Trying to Gain13%
Doing Nothing24%
Trying to Lose 29%
Trying to Maintain
20%
Trying to Gain 22%
Doing Nothing
29%
Trying to Lose 60%
Trying to Maintain
16%
Trying to Gain 5% Doing
Nothing19%
Boys Girls

Figure 146. Prevalence of Trying to Lose or Maintain Weight, by Weight Class, Alaska
High School Youth, 2007
Prevalence of trying to lose or
maintain weight is unrelated to
race or grade level, but is
associated with weight status.
Overweight and obese youth are
significantly more likely to
report trying to lose or maintain
their weight than youth in the
normal weight category.
Source: AK YRBS
Figure 147. Prevalence of Various Weight Management Strategies Used in the Past 30
Days, Alaska High School Youth Reporting Trying to Lose or Maintain their Weight,
2007
Alaska’s high school students
are significantly more likely to
use exercise to manage their
weight than any other strategy,
including dietary changes.
Unhealthy weight loss strategies
are not as common as exercise
or positive dietary changes, but
some students report using
behaviors symptomatic of eating
disorders to manage their
weight.
Source: AK YRBS; *ate less food or food lower in calories or fat; +vomited or used laxatives
0%
20%
40%
60%
80%
100%
Normal/Underweight Overweight Obese
Pe
rce
nt
Tryi
ng
to L
ose
or
Mai
nta
in W
eig
ht
0%
20%
40%
60%
80%
100%
Exercised Changed Diet* Fasted Diet Pills Purged+
Pe
rce
nt
Use
d E
ach
Str
ate
gy

Numerous organizations and individuals will need to play a role in addressing obesity, and a
series of BRFSS questions asks adults to identify how much responsibility they believe
various segments of society have for addressing obesity in the United States.
Figure 148. Percentage Who Believe Each Source Has Some or A Lot of Responsibility
for Addressing Obesity in the US, Alaska Adults, 2005
Obesity and weight management are commonly portrayed as issues to be dealt with by
individuals1, and that perception
is common in Alaska as well,
with over 90% of adults stating
that parents and individuals
have some or a lot of
responsibility for addressing
obesity. Recognition that other
entities have a role to play in
addressing obesity is also high,
however, with well over half of
adults reporting that
government, the food industry,
doctors, and schools had some
or a lot of responsibility for
addressing obesity.
Source: AK BRFSS
0%
20%
40%
60%
80%
100%
Government Food Industry
Doctors Schools Individuals Parents
Pe
rce
nt
Hav
e S
om
e/A
Lo
t o
f R
esp
on
sib
ility

Figure 149. Percentage Who Say Vending Machines, Soda Machines, and Fast Food
Should Not Be Allowed in Schools, Alaska Adults, 2005
As far as support for specific
strategies, a majority of
Alaskans support school
policies that would limit the
availability of unhealthy foods
in schools.
Source: AK BRFSS
Figure 150. Percentage Who Support or Strongly Support Each Policy, Alaska Adults,
2005
In addition, 79% of Alaska
adults support or strongly
support a government-funded
obesity prevention media
campaign, and 55% support a
law requiring restaurants to
include nutrition information on
their menus.
Source: AK BRFSS
0%
20%
40%
60%
80%
100%
Vending Machines Soda Machines Fast Food
Pe
rce
nt
0%
20%
40%
60%
80%
100%
Junk Food Tax Restaurant Nutrition Information
Gov't-Funded Media Campaign
Pe
rce
nt

In Alaska overall, 1 in 3 adults is obese and more than 1 in 4 adolescents is above a normal
weight; however, not every Alaskan is equally likely to be obese or to engage in obesity-
related risk behaviors. The information presented in this report reveals disparities related to
sex, age, region, race, and socioeconomic status. The high and increasing rate of obesity in
Alaska, coupled with alarming data on disparities, calls for a comprehensive obesity
prevention approach containing both population-wide and more targeted components.
Obesity is a public health problem. To address it effectively, local and statewide public and
private partners must collaboratively implement public health strategies, such as:
Monitor the status of obesity through data collection and community health
assessments. Identify populations who are the most at-risk for developing obesity.
o Direct resources to increase qualitative and quantitative data collection,
interpretation and evaluation of obesity and obesity risk behaviors in disparate
populations, and for those population subgroups (i.e., school-aged children) for
whom representative data are scarce.
Inform, educate, and empower people about obesity issues.
o Design and implement culturally appropriate educational campaigns based on
the social marketing model to include multiple components, such as
community events, health screenings and mass media, to raise individual and
community awareness and knowledge among disparate populations.
Mobilize community partnerships to identify and address obesity issues through local
organizations, systems and networks.
o Partner with and support disparate communities to develop, implement, and
maintain effective programs to prevent and reduce obesity.
o Strengthen and increase partnerships in multiple settings (school, healthcare
systems, workplace, governments), organizations not usually associated with
health (faith-based organizations, labor unions), all age groups (youth, adults,
and seniors), and non-traditional partner organizations to maximize the impact
of stakeholder efforts to prevent and reduce obesity and obesity risk behaviors
in disparate populations.
Develop policies and plans based on current best practices that support individual and
community efforts to address obesity. Identify and provide funding for communities to
organize, develop and implement their plans.
o Secure funding that will adequately address obesity disparities within a
comprehensive obesity prevention plan.

Advocate for state and local policy and environmental change strategies that promote
good nutrition and increased physical activity.
o Engage disparate populations to promote obesity prevention policy,
environmental, and systems change.
Link people to needed obesity prevention and control services and assure the provision
of health care when otherwise unavailable.
Assure a competent public health and personal health workforce that is trained in the
current prevention, diagnosis and treatment of obesity.
Evaluate effectiveness of intervention efforts, including within disparate populations,
to determine what works and merits further resources and efforts.
Conduct and/or support research on new evidence-based obesity prevention
interventions and innovative solutions to obesity.
Numerous obesity prevention strategies for worksites, schools, healthcare, and communities
can be found in Alaska in Action: Statewide Physical Activity and Nutrition Plan43
, which was
developed by a statewide coalition of state, municipal, educational, tribal and community
health organizations concerned about Alaska’s growing obesity crisis.
To achieve the desired population-wide impact and reduce disparities, Alaskans must work
together to address the many factors that contribute to overweight and obesity. These efforts
must help children, adolescents and adults develop lifelong healthy habits and also ensure that
the environments in which they live, attend school, work and play support healthy activity and
eating choices.

The Anchorage School District and the Alaska Division of Public Health collaborated to
assess the prevalence of overweight among children in the Anchorage School District. Height
and weight measurements are routinely collected by school nurses for students in grades K-
12. The data were used to classify student weight status using BMI-for-age values within each
gender according to categories defined by the National Center for Health Statistics. These data
were summarized in a jointly released State of Alaska Epidemiology Bulletin in 2004 entitled,
―Prevalence of Overweight Among Anchorage Children: A Study of Anchorage School
District Data: 1998-2003.‖ These data were augmented by measurements through the 2005-
2006 academic year.
The BRFSS is an anonymous telephone survey conducted by the Alaska Division of Public
Health in cooperation with the Centers for Disease Control and Prevention (CDC). It aims to
estimate the prevalence of behavioral risk factors in the general population that are known to
be associated with the leading causes of morbidity and mortality in adults. The BRFSS has
operated continuously in Alaska since it began in 1991.
The BRFSS uses a probability (or random) sample in which all Alaska households have a
known, nonzero chance of selection. The sample is stratified into 5 geographic regions, with
roughly equal numbers of interviews conducted in each region. This method deliberately over-
samples rural areas of the state. Respondents are randomly selected from among the adult (age
18 and older) members of each household reached through a series of random telephone calls.
Those living in institutions (i.e., nursing homes, dormitories) are not surveyed. The BRFSS
questionnaire covers such topics as general health status, health care access, nutrition,
physical activity, tobacco use, diabetes, alcohol use, women’s health, injury prevention,
HIV/AIDS awareness. There are also questions on the demographic characteristics of
respondents.
Alaska presently conducts 2 BRFSS surveys: the standard BRFSS (sponsored by the CDC)
and a modified BRFSS (sponsored by the State of Alaska). Both surveys are conducted
throughout the year, using separate samples drawn using the same methodology. Both the
standard and modified BRFSS are weighted (separately) to compensate for the over-
representation or under-representation of persons in various subgroups. The data are further
weighted to adjust the distribution of the sample data so that it reflects the total population of
the sampled area.

The CUBS provides population-based data on preschool aged children in Alaska. During
2006, data were collected on 2-year-olds (however starting in 2008, data collection switched
to focus on 3-year-olds). The CUBS uses the methodology of re-interviewing mothers who
responded to the Alaska Pregnancy Risk Assessment Monitoring System (PRAMS) survey
soon after their child was born. Although PRAMS is conducted in almost 37 states, Alaska is
1 of only 4 states that have a follow-up survey to PRAMS. The purpose of CUBS is to provide
information on health conditions, health care utilization, child development and other health-
related behaviors of young children and to evaluate the association between prenatal and
immediate postnatal factors with early childhood health and welfare. The CUBS asks
questions about both the mother and her child. About 115 mothers are sent a CUBS survey in
the mail every month. In 2006, the response rate was 2006.
The PRAMS is a population-based survey of Alaska women who have recently delivered a
live-born infant. Administered since 1990 by the Alaska Division of Public Health, PRAMS is
conducted in collaboration with the CDC in 37 states to gather information on the health risk
behaviors and circumstances of pregnant and postpartum women. A systematic stratified
sample is drawn each month from the state’s live birth records for infants between 2 and 6
months of age. Sampled mothers receive a series of mailed questionnaires, and since 1997
telephone follow-up has been initiated among those who do not respond to the third mailed
request. The PRAMS questionnaire addresses such topics as access to prenatal care, obstetric
history, maternal use of alcohol, maternal tobacco use, nutrition, economic status, maternal
stress, and early infant development and health status. Survey responses are weighted so that
reported prevalences accurately describe Alaska women delivering a live-born infant during
the year of the survey. In recent years the survey has had a response rate of approximately
77%.
The RPMS is the statewide information system used by the Section of Public Health Nursing,
Alaska Division of Public Health for patient services data. This is a medical database of
selected patient visit information originating from visits to public health centers, regional
Alaska Native hospitals, community health centers, and village clinics. Management
information taken from the data can be used for program planning and evaluation. Height and
weight are measured and recorded during clinic visits. The system includes demographic and
patient health encounter data. The RPMS is located at 23 public health nursing sites and is
shared by the Indian Health Service.

The YRBS is a systematic survey of high school students investigating behaviors related to
the leading causes of mortality, morbidity and social problems among youth. The Centers for
Disease Control and Prevention sponsors national and state surveys every 2 years in odd
years. Alaska first participated in the YRBS in 1995. The statewide survey obtained a
statistically valid, representative sample in 1995, 1999, 2003, and 2007. Alaska was
unsuccessful in its attempt to obtain a statewide representative sample in 2001 and 2005. The
Alaska YRBS is conducted using a 2-stage sampling design. Schools are selected first with a
probability of inclusion proportional to the size of their enrollment. Once a school is chosen,
classes are selected, with each student having an equal opportunity for inclusion. Since 2003,
active parental consent was required for each student participating in the YRBS. On the
appointed survey day students completed written questionnaires and returned them in class in
unmarked, sealed envelopes. Data were weighted to reflect the true distribution of Alaska high
school students by sex and grade level. Following CDC guidelines for YRBS data reporting,
data are suppressed in subgroup analyses for which the actual number of respondents is fewer
than 100.
WIC is a supplemental food and nutrition program for pregnant and breastfeeding women and
their children from birth to age 5. Alaska WIC provides nutrition information, counseling,
breastfeeding support, and periodic health screening, along with supplemental food vouchers
for infant formula and healthy foods. Children’s height and weight are measured and recorded
at clinics as part of the application and renewal process.

1. US Department of Health and Human Services. The Surgeon General’s Call to Action
to Prevent and Decrease Overweight and Obesity. Rockville, MD: HHS, Public
Health Service, Office of the Surgeon General; 2001.
2. Koplan JP, Liverman CT, Kraak VA, eds. Committee on Prevention of Obesity in
Children and Youth. Food and Nutrition Board. Board on Health Promotion and
Disease Prevention. Institute of Medicine. Preventing Childhood Obesity: Health in
the Balance. Washington D.C.: The National Academies Press; 2004.
3. Flegal KM, Carroll MD, Ogden CL, and Johnson CL. Prevalence and trends in obesity
among US adults, 1999-2000. JAMA. 2002;288:1723-1727.
4. Ogden CL, Flegal KM, Carroll MD, and Johnson CL. Prevalence and trends in
overweight among US children and adolescents, 1999–2000. JAMA. 2002;288:1728–
1732.
5. Hedley AA, Ogden CL, Johnson CL, Carroll MD, Curtin LR, Flegal KM. Prevalence
of overweight and obesity among US children, adolescents, and adults, 1999-2002.
JAMA. 2004;291:2847-2850.
6. Ogden CL, Carroll MD, Flegal KM. High body mass index for age among US children
and adolescents, 2003-2006. JAMA. 2008; 299: 2401-2405.
7. Centers for Disease Control and Prevention. US Obesity Trends 1985 – 2007(selected
years). Available at: http://www.cdc.gov/nccdphp/dnpa/obesity/trend/maps/, Accessed
5/12/2009.
8. Finkelstein EA, Trogdon JG, Cohen JW, Dietz W. Annual medical spending
attributable to obesity: payer- and service-specific estimates. Health Aff.
2009;28(5):W822-W831.
9. Foster M, Goldsmith S. Alaska’s $5 billion health care bill—who’s paying? UA
Research Summary No.6. March 2006.
10. Mokdad AH, Marks JS, Stroup DF, Gerberding JL. Correction: actual causes of death
in the United States, 2000. JAMA. 2005; 293(3):293-294.
11. Dietz WH. Division of Nutrition, Physical Activity and Obesity Annual Update.
Centers for Disease Control and Prevention, Division of Nutrition, Physical Activity
and Obesity Teleconference, December 11, 2008.
12. Centers for Disease Control and Prevention. Preventing Chronic Diseases: Investing
Wisely in Health. Preventing Obesity and Chronic Diseases through Good Nutrition
and Physical Activity. Revised August 2008. Available at:
http://www.cdc.gov/nccdphp/publications/factsheets/Prevention/pdf/obesity.pdf.
Accessed 5/22/2009.
13. National Institutes of Health, National Heart, Lung, and Blood Institute. Clinical
Guidelines on the Identification, Evaluation, and Treatment of Overweight and
Obesity in Adults. September 1998; NIH Publication No. 98-4083.
14. Centers for Disease Control and Prevention. Stature for Age and Weight for Age
Percentiles (Growth Charts). Developed by the National Center for Health Statistics in
collaboration with the National Center for Chronic Disease Prevention and Health
Promotion. Published May 30, 2000 (modified 11/21/00). Available at:
http://www.cdc.gov/growthcharts. Accessed 5/22/2009.

15. Dietz WH, Bellizi CM. Introduction: the use of body mass index to assess obesity in
children. Am J Clin Nutr. 1999; 70(suppl):123S-125S.
16. Barlow SE, the Expert Committee. Expert committee recommendations regarding the
prevention, assessment, and treatment of child and adolescent overweight and obesity:
summary report. Pediatrics. 2007; 120(suppl):S164-S192.
17. Behavioral Risk Factor Surveillance System, Centers for Disease Control and
Prevention. Prevalence and Trends Data (Nationwide, 2006, Overweight and Obesity,
by sex). Available at: http://apps.nccd.cdc.gov/BRFSS/. Accessed 5/5/2009.
18. Alaska Department of Health and Social Services, Division of Public Assistance,
Family Nutrition Programs, height and weight data extract from the AKWIC
Management Information System Nutrition Report, 2007.
19. Alaska Department of Health and Social Services, Division of Public Health, Section
of Public Health Nursing, height and weight data extract from the Alaska Resource
Patient Management System, 2008.
20. Alaska Section of Epidemiology. Prevalence of Overweight Among Anchorage
Children: A Study of Anchorage School District Data: 1998-2003. Bulletin No. 8(9).
November 10, 2004.
21. Alaska Department of Health and Social Services, Division of Public Health, Section
of Chronic Disease Prevention and Health Promotion, Prevalence of Overweight and
Obesity among Anchorage School District Students, 1998-2008. Chronicles, Volume
2, Issue 1, February 2009. Available at: www.hss.state.ak.us/dph/chronic/.
22. Florence MD, Asbridge M, Veugelers PJ. Diet quality and academic performance. J
Sch Health. 2008; 78: 209-215.
23. Carlson SA, Fulton JE, Lee SM, Maynard M, Brown DR, Kohl HW and Dietz WH.
Physical education and academic achievement in elementary school: data from the
early childhood longitudinal study. Am J Public Health. 2008;98:721-727
24. Trudeau F and Shephard RJ. Physical education, school physical activity, school
sports and academic performance. Int J Behav Nutr Phys Act. 2008;5:10.
25. Gable S, Britt-Rankin J, Krull JL. Ecological Predictors and Developmental Outcomes
of Persistent Childhood Overweight. University of Missouri, Columbus; June 2008.
USDA, Economic Research Service Contractor and Cooperator Report No. 42.
26. Action for Healthy Kids. The Learning Connection: The Value of Improving Nutrition
and Physical Activity in Our Schools. October 2004.
27. US Department of Health and Human Services. 2008 Physical Activity Guidelines for
Americans. October 2008; ODPHP Publication No. U0036.
28. Guide to Community Preventive Services. Promoting Physical Activity: Behavioral
and Social Approaches. Available at:
http://www.thecommunityguide.org/pa/behavioral.html. Accessed 3/20/2009.
29. Menschik D, Ahmed S, Alexander MH, Blum RW. Adolescent physical activities as
predictors of young adult weight. Arch Pediatr Adolesc Med. 2008;162:29-33.
30. Meyer A, Evenson KR, Couper DJ, Stevens J, Pereria MA and Heiss G. Television,
physical activity, diet, and body weight status: the ARIC cohort. Int J Behav Nutr Phys
Act. 2008; 5:68.

31. Davis MM, Gance-Cleveland B, Hassink S, Johnson R, Paradis G, Resnicow K.
Recommendations for prevention of childhood obesity. Pediatrics. 2007; 120
(suppl):S229-S253.
32. Alaska Department of Health and Social Services, Alaska Division of Public Health,
Maternal and Child Health Epidemiology Unit. Alaska Childhood Understanding
Behavior Survey (CUBS). 2006.
33. National Center for Chronic Disease Prevention and Health Promotion Division of
Nutrition and Physical Activity. Can Eating Fruits and Vegetables Help People to
Manage Their Weight? Research to Practice Series, No. 1. September 2006.
34. US Department of Health and Human Services and US Department of Agriculture.
Dietary Guidelines for Americans, 2005. 6th
ed. Washington, DC: US Government
Printing Office; January 2005.
35. National Center for Chronic Disease Prevention and Health Promotion Division of
Nutrition and Physical Activity. Does Drinking Beverages with Added Sugars Increase
the Risk of Overweight? Research to Practice Series, No. 3. September 2006.
36. Mrdjenovic G, Levitsky DA. Nutritional and energetic consequences of sweetened
drink consumption in 6- to 13-year-old children. J Pediatr. 2003;142:604-610.
37. American Dietetic Association. Childhood Overweight Evidence Analysis Project.
Available at: http://www.adaevidencelibrary.com. Accessed 3/30/2009.
38. Larson NI, Story MT, Nelson MC. Neighborhood environments: disparities in access
to healthy foods in the U.S. Am J Prev Med 2009;36:74–81.
39. Owen CG, Martin RM, Whincup PH, Smith GD, Cook DG. Effect of infant feeding on
the risk of obesity across the life course: a quantitative review of published evidence.
Pediatrics. 2005;115:1367-1377.
40. Krebs NF, Jacobson MS, and the American Academy of Pediatrics Committee on
Nutrition. Prevention of pediatric overweight and obesity. Pediatrics. 2003;112:424-
430.
41. Alaska Department of Health and Social Services, Women’s Children’s and Family
Health. Title V Needs Assessment: Special Series Fact Sheet. Breastfeeding in Alaska.
March 2005;1(16).
42. Alaska Department of Health and Social Services, Alaska Division of Public Health,
Maternal and Child Health Epidemiology Unit. Alaska Maternal and Child Health
Data Book 2008. December 2008.
43. Alaska Department of Health and Social Services. Alaska in Action: Statewide
Physical Activity and Nutrition Plan. November 2005.

STATE of ALASKA
Department of Health and So
cia
l Ser
vice
s
www.hss.state.ak.us/dph/chronic/