alberta municipal spending watch report...october 31, 2019 alberta municipal spending watch report...
TRANSCRIPT

\\\\\
October 31, 2019
Alberta Municipal Spending Watch Report 10th Edition: Trends in Operating Spending, 2007 – 2017
Aaron Aerts, Western Economist Keyli Kosiorek, Policy Analyst, Alberta Amelia Radke, Policy Intern
Executive Summary
This year’s edition of the Alberta Municipal Spending Watch
Report marks the 10-year anniversary of the Canadian
Federation of Independent Business (CFIB) tracking and
analyzing spending trends of Alberta’s municipalities.
After a decade of examining municipal spending, there are
some trends which have remained constant. For instance, real
operating spending growth has consistently remained above
the sustainable level of population growth.
This edition of the Alberta Municipal Spending Watch Report
also places municipal spending trends in context with
another trend that has emerged —that of municipal hiring.
Municipal spending and hiring are intertwined, and therefore
reviewing municipal hiring as an area for improvement is an
effective way to review overall municipal operating spending.
For the past 10 years, CFIB has seen how municipal operating
spending has decreased, stagnated or increased. This report
acknowledges some of Alberta’s municipalities that are
worthy of recognition for reducing spending growth, while
also highlighting a large number of municipalities that must
improve operating spending to protect taxpayers from future
tax hikes.
Outline
1. Introduction
2. Key Findings
3. Ranking Alberta’s 17 Largest
Municipalities
4. Municipal Employee Growth
5. Top Performers
6. Conclusion
7. Recommendations
Appendix A – Methodology
Appendix B – Municipal Breakouts
for Top 17
Appendix C – Individual Spending
Statistics for each
Alberta municipality

AB MUNICIPAL SPENDING WATCH 10TH EDITION – Trends in Operating Spending, 2007-2017
© Canadian Federation of Independent Business 2
Figure 1.1 Alberta Real Operating Spending and Population Growth, 2007-2017
Figure 1.2 Alberta’s 17 Largest Municipalities Real Operating Spending and Population Growth, 2007-2017
1. Introduction
Municipal governments provide many services that benefit citizens and create an economic
environment that supports small and medium-sized businesses (SMEs). When local
governments have unsustainable spending SMEs often feel the most impact because the
disproportionate share of property taxes they pay.1
This report analyzes operating spending of Alberta municipalities, with a focus on the 17
largest by population (containing at least 25,000 people in 2017).2 These 17 largest
municipalities are ranked according to their operating spending between 2007 and 2017 and by
2017 per capita spending. Operating spending refers to municipal expenses associated with
day-to-day functions, including things such as: employee salaries and benefits, utilities, and
interest on long-term debt. Operating expenditures excludes capital expenditures and
amortization.
On average, real municipal operating spending across all Alberta municipalities, and within the
17 largest ones, more than double the rate of population growth from 2007-2017 (see Figures
1.1 and 1.2).
1 Truscott, Richard, Aaron Aerts, & Muriel Protzer. CFIB, 2019. Alberta Tax Gap Report. 2 Medicine Hat was excluded from the analysis because of its unique history of producing gas and electricity its residents. Due to the large amount of expenditures and revenues generated from Medicine Hat’s gas and electricity distribution, direct comparisons with other municipalities using the province’s municipal statistics is problematic. For that reason, Medicine Hat is excluded in all charts and figures.
56.1%
22.6%
0%
10%
20%
30%
40%
50%
60%
2007 2009 2011 2013 2015 2017
Real OperatingExpenditure Growth
Population Growth
66.6%
26.8%
0%
10%
20%
30%
40%
50%
60%
70%
2007 2009 2011 2013 2015 2017
Real OperatingExpenditureGrowth
Population Growth
Source: CFIB calculations, Municipal Affairs, Alberta Government, 2007-2017
Source: CFIB calculations, Municipal Affairs, Alberta Government, 2007-2017

AB MUNICIPAL SPENDING WATCH 10TH EDITION – Trends in Operating Spending, 2007-2017
© Canadian Federation of Independent Business 3
2. Key Findings – 17 Largest Alberta Municipalities Spending, 2007 to 2017
• In Alberta’s 17 largest municipalities, unsustainable municipal spending cost an additional
$4,400 per resident over the 2007-2017 period.
• For Alberta’s 17 largest municipalities, population increased by 26.8 per cent from 2007-
2017, while real municipal operating expenditure grew by 66.6 per cent.
• Cochrane, Okotoks, and Lloydminster were the three best performing municipalities in
terms of sustainable spending patterns.
• Of Alberta’s 17 largest municipalities, Cochrane was the only one to keep real operating
spending growth at a sustainable level below the rate of population growth, from 2007-
2017.
• The Regional Municipality of Wood Buffalo (Fort McMurray), Strathcona County, and Grande
Prairie are the worst performing in terms of apending patterns.
• Edmonton and Calgary ranked as 10th and 11th worst, respectively.
• In 2017, the cumulative operating spending per capita for Alberta’s 17 largest
municipalities was $2,596. Operating spending in the Regional Municipality of Wood Buffalo
was the highest at $5,002 per capita. Operating spending in Cochrane was the lowest at
$1,538 per capita.
• For many municipalities, part of their over-spending problem is the result of expanding the
municipal workforce much faster than population growth and increasing municipal wages
well beyond the private sector average.
The Benchmark: Inflation and Population Growth Why compare inflation-adjusted operating spending to population growth? In order to analyze the trends in a municipality’s operating spending, the expenditures must first be adjusted for inflation to account for any increases in prices that occur over time. While there are a number of different ways to measure to inflation, this report uses the most common one: The Consumer Price Index (CPI). Unlike alternative inflation measures, CPI reflects the prices that consumers pay and does not place an emphasis on factors that municipalities have a greater degree of control over, such as employee wages and salaries. This inflation-adjusted operating spending is then compared to population growth. If a municipality’s population grows, it is reasonable for municipalities to increase their operating spending by an incremental amount so that they can provide the same services to a greater number of people. Small business owners accept municipal governments may need to increase their spending over time — but only if it does not increase beyond the sustainable spending threshold of inflation plus population growth.3
3 When asked “Which of the following actions would you like to see your local government take to help your business?”, 81 per cent of small business owners said that municipalities should keep operating spending increases at or under population growth plus inflation in order to keep property taxes reasonable. CFIB, 2017, Municipal Issues Survey, n=697

AB MUNICIPAL SPENDING WATCH 10TH EDITION – Trends in Operating Spending, 2007-2017
© Canadian Federation of Independent Business 4
Table 1.1
Alberta’s 17 Largest Municipalities Listed from best to worst by overall rank
Source: CFIB calculations, Municipal Affairs, Alberta Government, 2007-2017. Red indicates worst in category; green indicates best.
3. Ranking Alberta’s 17 Largest Municipalities
Alberta’s largest 17 municipalities were ranked according to the sustainability patterns of their
spending from 2007-2017.4 The rankings assigned to each municipality are based equally and
entirely on two distinct metrics: real operating spending per capita growth from 2007-2017,
and 2017 operating spending per capita. These rankings are relative rather than absolute—they
represent how spending tendencies in each of Alberta’s 17 largest municipalities compare to
one another and are not representative of how sustainable a municipality’s spending might be
in general.
4 The 10th edition of the Alberta Municipal Spending Watch Report differs in its analysis from previous editions of the report, and rankings from this report are not necessary directly comparable to those of previous reports (see Appendix A: Methodology).
Municipality Rank 1=Best
17=Worst
2007-2017 Real Operating
Spending Growth per Capita (%)
2007-2017 Real
Operating Spending
Growth (%)
2007-2017 Population Growth (%)
2017 Operating Spending per Capita
($)
COCHRANE 1 -9.6% 72.9% 91.3% 1,538
OKOTOKS 2 6.3% 79.1% 68.5% 1,591
LLOYDMINSTER 3 6.3% 98.8% 87.1% 1,818
AIRDRIE 4 15.2% 137.4% 106.0% 1,691
SPRUCE GROVE 5 18.6% 112.2% 78.9% 1,989
FORT SASKATCHEWAN 6 15.0% 81.9% 58.1% 2,379
ROCKY VIEW COUNTY 7 23.3% 40.5% 13.9% 2,262
PARKLAND COUNTY 8 26.8% 37.1% 8.1% 2,243
LETHBRIDGE 9 27.7% 53.6% 20.2% 2,443
EDMONTON 10 23.4% 57.6% 27.7% 2,573
CALGARY 11 28.6% 57.2% 22.2% 2,561
LEDUC 12 29.6% 137.8% 83.5% 2,558
ST. ALBERT 13 38.3% 57.2% 13.6% 2,373
RED DEER 14 39.3% 63.2% 17.2% 2,471
GRANDE PRAIRIE 15 50.0% 88.6% 25.8% 2,470
STRATHCONA COUNTY 16 37.5% 63.4% 18.8% 2,902
WOOD BUFFALO, Regional Municipality of 17 147.4% 222.0% 30.1% 5,002
17 largest - 31.4% 66.6% 26.8% 2,596

AB MUNICIPAL SPENDING WATCH 10TH EDITION – Trends in Operating Spending, 2007-2017
© Canadian Federation of Independent Business 5
Table 1.1 lists Alberta’s 17 largest municipalities according to their rank, from best (most
sustainable spending) to worst (least sustainable spending). Cumulative operating spending per
capita growth from 2007-2017 for Alberta’s 17 largest municipalities was 31.4 per cent, while
the operating spending per capita in 2017 was $2,596. The three best performing municipalities
were Cochrane, Okotoks, and Lloydminster, respectively. The three worst performing
municipalities were the Regional Municipality of Wood Buffalo (Fort McMurray), Strathcona
County, and Grande Prairie.
The Best
Cochrane was found to be the best-ranked municipality, and its operating spending patterns
have a few unique characteristics that distinguish it from the other municipalities. With a 2007-
2017 real operating spending growth per capita of negative 9.6 per cent, Cochrane is the only
municipality to experience a decrease in 2007-2017 real operating spending growth per capita.
Cochrane also had the lowest 2017 operating spending per capita, at $1,538. Additionally,
Cochrane was the only municipality examined to have a 2007-2017 real operating spending
growth that is at a sustainable level, significantly lower than population growth. Cochrane’s
2007-2017 real operating spending growth was 72.9 per cent, while it experienced a 91.3 per
cent growth in population during that same period.
The second-best performing municipality was Okotoks, which experienced a 6.3 per cent
growth in real operating spending per capita from 2007-2017 and an operating spending per
capita of $1,591 in 2017. Lloydminster, the third best performing municipality, also only
increased real operating spending per capita by 6.3 per cent but had a higher per capita
spending level of $1,818 in 2017.
The Worst
The worst-ranked municipality was the Regional Municipality of Wood Buffalo (which includes
the city of Fort McMurray), which also exhibited unique spending patterns that differentiated it
from other municipalities. From 2007-2017, the Regional Municipality of Wood Buffalo grew its
real operating spending per capita by 147.4 per cent, which is much higher than any of the
other municipalities examined. Additionally, the Regional Municipality of Wood Buffalo had a
substantially higher operating spending per capita in 2017 at $5,002—the next highest for this
metric was Strathcona County, at $2,902.
The second worst performing municipality was Strathcona County, which experienced a 37.5
per cent growth in real operating spending per capita from 2007-2017 and operating spending
per capita of $2,902 in 2017.
The third worst performing municipality of Grande Prairie experienced a 50.0 per cent growth
in real operating spending per capita from 2007-2017, and operating spending per capita of
$2,470 in 2017.

AB MUNICIPAL SPENDING WATCH 10TH EDITION – Trends in Operating Spending, 2007-2017
© Canadian Federation of Independent Business 6
The Regional Municipality of Wood Buffalo The Regional Municipality of Wood Buffalo has faced a bevy of extenuating circumstances in recent years
that have undoubtedly affected its ability to keep operating spending under control. Most notably, the
Regional Municipality of Wood Buffalo was devastated by the 2016 Fort McMurray wildfire. This was a big
factor as to why the Regional Municipality of Wood Buffalo is the worst-ranked municipality.
However, just how big a factor is not as clear. Prior to this event, the Regional Municipality of Wood
Buffalo’s operating spending trends were far from sustainable. The 5th edition of the Alberta Spending
Report, released in 2014, examines municipal spending trends from 2000-2012. In that report, the
Regional Municipality of Wood Buffalo is ranked as third worst (179 out of 171 municipalities).5 For more
information on the Regional Municipality of Wood Buffalo’s operating spending trends over time, refer to
Appendix B.
Calgary and Edmonton
Alberta’s two biggest metropolitan centres, Calgary and Edmonton, ranked similarly to one
another and are 11th and 10th out of 17, respectively. Calgary’s real operating spending per
capita grew by 28.6 per cent from 2007-2017, and Calgary had operating spending per capita of
$2,561 in 2017. Edmonton’s real operating spending per capita grew by 23.4 per cent from
2007-2017, and Edmonton had operating spending per capita of $2,573.
Calgary’s Property Tax-astrophe: Lessons for Alberta This past June, businesses in Calgary were shocked when they received their property tax bills for 2019:
two-thirds of commercial property tax owners saw an increase of at least 10%, while the remaining one-
third saw an increase of over 30 per cent. The small business community voiced their outrage over these
property tax increases, culminating in a rally on the steps of City Hall. In response, Calgary’s city council
put together a plan: use $131 million to reduce non-residential property tax bills by 10 per cent, with $60
million of this coming from cuts to the 2019 city budget.
There are a few lessons to be learned from Calgary’s tax disaster. First, its an example of the
consequences associated with years of uncontrolled municipal spending. Second, it shows with a
concerted effort municipal government can control spending. Third, it highlights the risk of relying too
heavily on local business owners to pay for municipal government spending increases.
4. Municipal Hiring
The budget item that forms the largest percentage of municipal operating spending is, by far,
the category of “wages, salaries, and benefits”. If municipalities reduce their spending in this
category it would have a significant effect on its overall operating spending level.
Compensation
Employee wages are generally determined by collective bargaining and arbitration systems,
which constrains a municipality’s ability to determine wages and compensation for its
5 Moline, Zack. CFIB, 2014. Alberta Municipal Spending Report, 2014.

AB MUNICIPAL SPENDING WATCH 10TH EDITION – Trends in Operating Spending, 2007-2017
© Canadian Federation of Independent Business 7
unionized employees. Current collective bargaining methods lead to situations where a
municipality might not be able to control compensation costs.
Municipalities often encounter situations where they do not have complete decision-making
authority. For instance, if a municipality is negotiating salaries and benefits with a union and no
agreement can be reached, then they enter arbitration. In this case, a third-party arbitrator will
make the decision independently and the municipality is bound to it. These arbitrators may not
consider a municipality’s (i.e. the taxpayers’) ability to fund wage and compensation increases.
Furthermore, little transparency and ability to access information regarding wages and benefits,
negotiations, and arbitrations make it difficult to hold municipalities accountable.
Once an arborator’s decision has been made regarding wages, salaries, and benefits for one
municipality, a precedent is set for other municipalities to do the same. The current arbitration
system appears broken and work needs to be done to better balance the needs of municipal
employees with that of local taxpayers.
Municipal Hiring
While municipalities might be somewhat constrained in their decision-making abilities
surrounding the level of compensation that they pay to unionized employees, they do have
more freedom when it comes to the other half of the equation—the number of employees. The
problem of overspending is further compounded by municipalities engaging in unsustainable
levels of hiring.
Figure 4.1 shows how many residents each municipality had per full-time municipal worker
employed in 2017, with Alberta’s largest 17 municipalities ordered by rank. This figure reveals
a strong connection between a municipality’s ranking and the number of full-time employees it
has relative to its population. Generally, municipalities that have a lower resident per municipal
worker ratio have much higher operating spending.6 The best ranked municipality of Cochrane
had one full-time municipal worker for approximately every 162 people, while the worst ranked
Regional Municipality of Wood Buffalo had one full-time municipal worker for approximately
every 85 people.
Airdrie had the highest population to full-time municipal worker ratio in 2017, and therefore
employed the fewest amount of full-time municipal workers relative to its population. Airdrie,
ranked 4th best at sustainable spending, employed one full-time municipal worker for
approximately every 167 people. In contrast, the municipality that had the lowest population to
full-time municipal worker ratio in 2017 was Strathcona County. That municipality, which was
ranked as second worst in this report, employed one full-time municipal worker for every 61
people.
This shows that while municipal governments might not be able to control every aspect of their
employee compensation system, they are able to mitigate problems by limiting the number of
municipal workers employed.
6 It is important to note that this data does not capture every aspect of a municipality’s hiring habits. For instance, municipalities may contract services out, and this is not reflected in the data presented in this report.

AB MUNICIPAL SPENDING WATCH 10TH EDITION – Trends in Operating Spending, 2007-2017
© Canadian Federation of Independent Business 8
Figure 4.1 Residents per municipal worker 2017, by municipality ranking
Source: CFIB calculations, Municipal Affairs, Alberta Government, 2017.
Inconsistent Definitions – Full-time Equivalents The Ministry of Municipal Affairs requires municipalities to provide information on the number of full-
time equivalents (FTEs) employed by the city on an annual basis. This data is reflected in Figure 4.1.
However, there is a mismatch between how some municipalities define FTEs and how the province defines
FTEs for reporting purposes. This can make comparisons difficult, as the number of FTEs may differ
between how a municipality reports it and how the province reports it.
Further, directly comparing provincial data is difficult as some FTEs may not be counted. For example, the
employee count published by Municipal Affairs for Edmonton is much lower than their own count. This is
because Edmonton defines and analyses FTEs differently, focusing more on employees captured by their
collective bargaining agreement.
CFIB strongly believes the Alberta government should work with municipalities to establish a single
definition of full-time equivalents.
trend line

AB MUNICIPAL SPENDING WATCH 10TH EDITION – Trends in Operating Spending, 2007-2017
© Canadian Federation of Independent Business 9
5. Top Performers
In honour of the 10th anniversary of the Alberta Municipal Spending Report, CFIB would like to
recognize some municipalities that have consistent sustainable municipal spending. Out of
Alberta’s largest 17 municipalities, the following three are recognized as top performers.
MOST CONSISTENT: AIRDRIE
Airdrie has consistently done well in the rankings year after year. In the 4th edition of the
Alberta Municipal Spending Report released in 2013, Airdrie ranked at 26 out of 181
municipalities for the 2000-2011 period.7 While this doesn’t seem impressive in comparison to
the 10th edition that only examines the 17 largest municipalities, this ranking of 26 means that
out of the 17 municipalities analyzed in this report, only two of them (Okotoks and
Lloydminster) ranked better than Airdrie.8 For every subsequent report, Airdrie is ranked in the
top three municipalities examined in the 10th edition report.
Figure 5.1 Airdrie Real Operating Spending and Population Growth, 2007-2017
Source: CFIB calculations, Municipal Affairs, Alberta Government, 2007-2017
Figure 5.1 shows Airdrie’s real operating spending and population growth have remained
consistent over time. The two measures remain roughly parallel to one another from 2007-
2017, with a relatively narrow gap between them.
MOST IMPROVED: COCHRANE
Throughout the years, many municipalities have changed where they place in municipal
rankings. It is important to acknowledge and congratulate municipalities that have improved
7 The 4th edition of the Alberta Municipal Spending Report used a reversed ranking system, where 1 was worst and 181 was best. Therefore, Airdrie was ranked at 156th worst municipality. This has been changed to 26th best municipality to allow for direct comparison to more current editions of the report. 8 Karamanis, Samuel. CFIB, 2013. Alberta Municipal Spending Watch 2013.
137%
106%
0%
20%
40%
60%
80%
100%
120%
140%
160%
2007 2008 2009 2010 2011 2012 2013 2014 2015 2016 2017
Real Operating Expenditure Growth Population Growth

AB MUNICIPAL SPENDING WATCH 10TH EDITION – Trends in Operating Spending, 2007-2017
© Canadian Federation of Independent Business 10
their operational spending and climbed in the rankings. The municipality of Cochrane has
successfully been able to do this.
In the 4th edition of the Alberta Municipal Spending Report released in 2013, Cochrane was
ranked 122 out of 171 municipalities for the 2000-2011 period.9 Since then, Cochrane has
improved in the rankings in every new edition of the report. In the 9th edition of the report,
released in 2018, Cochrane ranked third out of 182 municipalities for the 2006-2016 period.10
In the 10th edition, Cochrane is the best out of Alberta’s 17 biggest municipalities for the 2007-
2017 period, and is the only municipality examined that kept 2007-2017 real operating
spending growth at a sustainable level.
Figure 5.2 Cochrane Real Operating Spending and Population Growth, 2007-2017
Source: CFIB calculations, Municipal Affairs, Alberta Government, 2007-2017
Figure 5.2 shows Cochrane’s real operating spending habits over time. While population growth
has increased over the years, with a sharp increase beginning in 2011, real operating spending
has become flatter relative to population growth. This means that Cochrane was able to
gradually decrease the gap between real operating expenditure growth and population growth,
eventually achieving sustainable levels of real operating spending growth after 2015.
Additionally, over time Cochrane has managed to improve their full-time municipal worker to
population ratio. In 2009, Cochrane employed one full-time municipal worker for
approximately every 123 people. In 2017, there was one full-time municipal worker for every
162 people.
MOST RESILIANT: OKOTOKS
There are some factors that influence a municipality’s operating spending that are outside their
control. Natural disasters can often force municipalities to spend more than they planned to,
9 The 4th edition of the Alberta Municipal Spending Report used a reversed ranking system, where 1 was worst and 181 was best. Therefore, Cochrane was ranked at 60th worst municipality. This has been changed to 122nd best municipality to allow for direct comparison to more current editions of the report. 10 Hazlett, Shannon. CFIB, 2018. Alberta Municipal Spending Watch Report.
73%
91%
0%
10%
20%
30%
40%
50%
60%
70%
80%
90%
100%
2007 2008 2009 2010 2011 2012 2013 2014 2015 2016 2017
Real Operating Expenditure Growth Population Growth

AB MUNICIPAL SPENDING WATCH 10TH EDITION – Trends in Operating Spending, 2007-2017
© Canadian Federation of Independent Business 11
especially when they are destructive such as, the 2013 floods which devastated much of
southern Alberta.
The 6th edition of the Alberta Municipal Spending Watch Report released in 2015 examines
operating spending trends of Alberta’s municipalities from 2003-2013. That edition of the
report lists municipalities that saw a significant spike in spending because of the 2013 Alberta
floods.11 Okotoks, saw real operating expenditure increase 38 per cent in six years from 2007-
2012. In the year following the 2013 floods operating expenditures spiked up 75 per cent as the
city put resources towards clean-up and reconstruction efforts.
Figure 5.3 Okotoks Real Operating Spending and Population Growth, 2007-2017
Source: CFIB calculations, Municipal Affairs, Alberta Government, 2007-2017
Figure 5.3 shows just how severely Okotoks’ real operating spending was affected by the 2013
floods—real operating expenditure growth increased at a relatively stable level until 2012,
where it spiked significantly until 2014. However, in 2014, Okotoks experienced a decrease in
real operating expenditure growth which brought it closer in line with population growth. There
was another minor spike in 2015, followed by another subsequent decrease in real operating
expenditure growth. Okotoks is an example of how municipalities over time can control real
operating expenditure growth a natural disaster.
6. Conclusion
From 2007-2017, the majority of Alberta’s 17 largest municipalities grew operating spending
well above the sustainable benchmark of inflation and population growth. Cochrane was the
only municipality that kept operating spending growth at a sustainable level in this period.
Although some municipal governments have made substantial efforts to reduce operating
spending, much more needs to be done to rein in spending. Excessively high municipal
11 Stedman, Ashley. CFIB, 2015. Alberta Municipal Spending Report, 2015.
79%
68%
0%
10%
20%
30%
40%
50%
60%
70%
80%
90%
100%
2007 2008 2009 2010 2011 2012 2013 2014 2015 2016 2017
Real Operating Expenditure Growth Population Growth

AB MUNICIPAL SPENDING WATCH 10TH EDITION – Trends in Operating Spending, 2007-2017
© Canadian Federation of Independent Business 12
operating spending leads to a combination of lower infrastructure spending and/or increased
taxation, both of which dampen economic development and job creation. If municipalities do
not control their operating spending, taxpayers bear higher costs. For small businesses owners,
this reduces the ability to expand, thrive, and create jobs. Small businesses are particularly
impacted by property tax increases because as they are taxed at a rate two to four times higher
than residents with the same property valuation.12
7. Recommendations
CFIB makes the following recommendations to municipal governments:
Limit operating spending growth to not exceed inflation plus population growth.
Engage in sustainable spending practises. This includes adopting strategies such as
reviewing core services and contracting services to the private sector, to ensure that
services are being delivered in an efficient way.
Implement appropriate contingency funds in case of natural disasters. Alberta’s
municipalities are at risk of being impacted by natural disasters and often forced to
increase operating spending following the event. Emergency natural disaster funds should
be assessed regularly to ensure they are available for clean-up and reconstruction efforts.
Pursue reforms to employee compensation systems. Municipalities should cooperate on
collective bargaining best practices to ensure settlements on wages and benefits are
affordable for local taxpayers, including small business. Municipal governments should
implement sustainable compensation systems and wage growth policies and call for
reforms to collective bargaining and arbitration systems.
Better control the number of municipal employees. A lower ratio of full-time municipal
employees to population growth ensures that real operating spending is more in line with
population growth and inflation.
Develop consistent definitions of full-time municipal workers. The province mandates
municipalities provide information on their full-time municipal staffing levels. However, the
definition differs because of how some municipalities calculate their staffing levels, which
leads to inconsistent reporting. The province should work with municipalities to establish a
single method of counting full-time municipal employees.
12 Truscott, Richard, Aaron Aerts, & Muriel Protzer. CFIB, 2019. Alberta Tax Gap Report.

AB MUNICIPAL SPENDING WATCH 10TH EDITION – Trends in Operating Spending, 2007-2017
© Canadian Federation of Independent Business 13
Sources
Government of Alberta, Municipal Affairs, Municipal Financial and Statistical Data. 2013-2017.
http://www.municipalaffairs.alberta.ca/municipal_financial_statistical_data
Government of Alberta, Municipal finance – Overview, Archived Financial Data and Statistics.
2007-2012. https://www.alberta.ca/municipal-finance-overview.aspx
`Government of Alberta, Municipal Affairs, Municipal Profiles. 2007-2017.
http://www.municipalaffairs.gov.ab.ca/mc_municipal_profiles?fuseaction=Advanced
Hazlett, Shannon. Canadian Federation of Independent Business. 2018. Alberta Municipal
Spending Watch Report. https://www.cfib-fcei.ca/sites/default/files/2019-
01/cfib_alberta_municipal_spending_watch_report_2018_revised.pdf
Kaisaris, Gavin & Sennyah, Andrew. Canadian Federation of Independent Business. 2017.
Alberta Municipal Spending Watch Report. https://www.cfib-fcei.ca/sites/default/files/2017-
12/rr3449.pdf
Karamanis, Samuel. Canadian Federation of Independent Business. 2013. Alberta Municipal
Spending Watch 2013. https://www.cfib-fcei.ca/sites/default/files/pdf/rr3302.pdf
Moline, Zack. Canadian Federation of Independent Business. 2014. Alberta Municipal Spending
Report, 2014. https://www.cfib-fcei.ca/sites/default/files/pdf/ab0718.pdf
Statistics Canada. Table 18-10-0005-01. Consumer Price Index, annual average, not seasonally
adjusted. https://www150.statcan.gc.ca/t1/tbl1/en/tv.action?pid=1810000501
Stedman, Ashley. Canadian Federation of Independent Business. 2015. Alberta Municipal
Spending Report, 2015. https://www.cfib-fcei.ca/sites/default/files/2017-12/ab0725.pdf
Truscott, Richard, Aerts, Aaron, & Protzer, Muriel. Canadian Federation of Independent
Business. 2019. Alberta Tax Gap Report. https://www.cfib-fcei.ca/sites/default/files/2019-
02/ab-property-tax-gap-report-2019-final.pdf

AB MUNICIPAL SPENDING WATCH 10TH EDITION – Trends in Operating Spending, 2007-2017
© Canadian Federation of Independent Business 14
Appendix A: Methodology
This report analyzes Alberta municipal operating spending from 2007 to 2017. A ten-year
rolling average for operational spending analysis is used because elected municipal officials
serving consecutive terms have control over budgets during that time period.
The 10th edition of the Alberta Municipal Spending Watch Report differs in its analysis from
previous editions of the report. Previous editions included a comprehensive provincial ranking
of all municipalities with populations greater than 1,000 and included a subsidiary analysis of
Alberta’s 17 most densely populated areas. The 10th edition of the Alberta Municipal Spending
Watch Report only analyzes 17 Alberta municipalities with a population greater than 25,000 in
2017. Therefore, the municipality rankings in this year’s report cannot be directly compared to
the rankings in previous editions of this report.
Unless otherwise indicated, the data in this report on municipal revenues, expenditures, and
population was obtained from the Ministry of Municipal Affairs, and the Alberta government.
To calculate inflation, Statistics Canada CPI measures were used. This report used city-specific
measures where available (i.e. Calgary and Edmonton), while the provincial figure was used for
all other municipalities.
The City of Lloydminster is uniquely located along the border of Alberta and Saskatchewan. As
a result, their financial data was not available on the Alberta Municipal Affairs website, CFIB
manually imputed the financial data from Lloydminster's audited financial statements and
incorporated the numbers into this report. Although there were some line item classification
differences in the financial statements, the overall final operational expenditure amount per
year was comparable to the other municipalities.
To isolate operating spending, capital related costs were carefully subtracted from each
municipality’s spending totals. Prior to 2009, capital spending was reported separately from
operating spending. However, from 2009 to 2013 there was an accounting change and capital
costs were identified as amortization of capital assets. As only a few municipalities operate
their own gas and electric utilities, any spending on these items after 2009 was also excluded
from the operating spending calculations to allow for consistency.
Municipal rankings are based on two factors: real operating spending per capita growth from
2007-2017, and 2017 operating spending per capita which are equally weighted. Alberta’s
largest 17 municipalities were first ranked on each factor independently, then were given a
score from 0 to 100 for each factor based on this ranking. These two scores are then equally
weighted to create a total score that is ranked against the other municipalities and determines
each municipality’s ranking.
Previous editions of Alberta spending reports used real operating spending per capita for
current year (i.e. adjusting 2017 per capita spending data for inflation). This year’s report uses
nominal per capita spending for current year (i.e. not adjusted for inflation) to better reflect
what the actual cost per resident was for that year. Therefore, comparisons between this year’s
spending per capita in the current year and previous year’s reports are not directly comparable.

AB MUNICIPAL SPENDING WATCH 10TH EDITION – Trends in Operating Spending, 2007-2017
© Canadian Federation of Independent Business 15
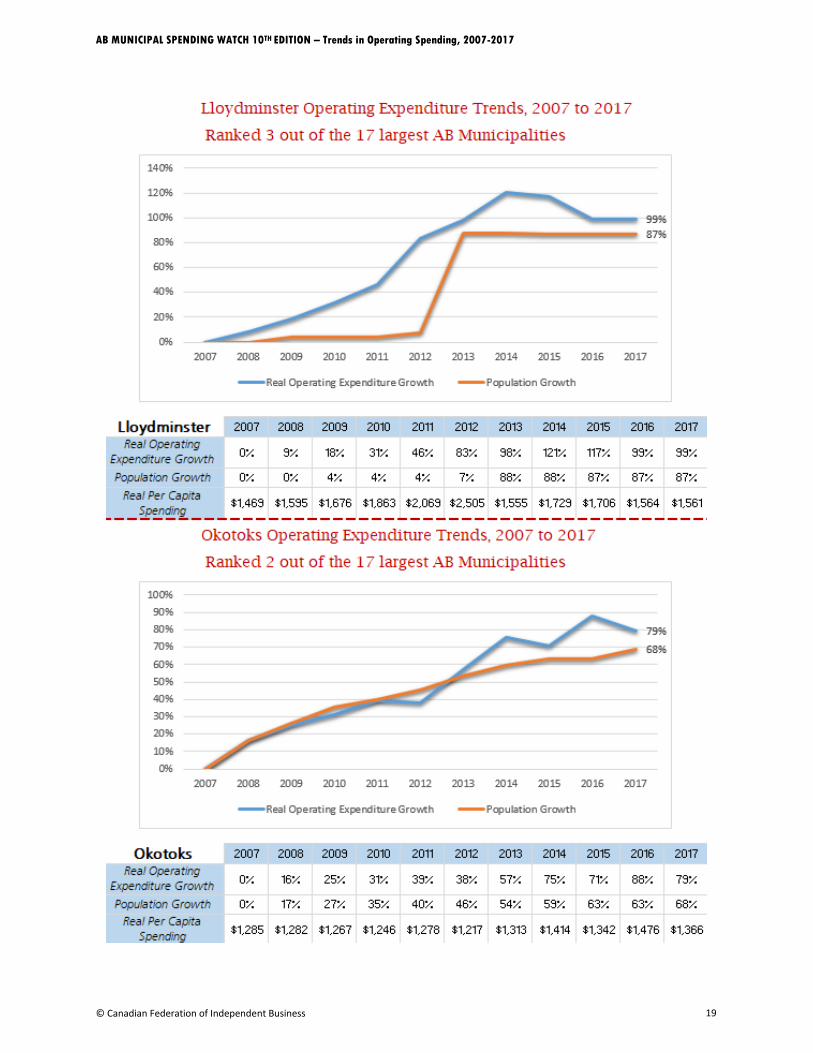
Appendix B: Real Operating Spending and Population Growth of Alberta’s 17 Largest Municipalities, 2007-2017

AB MUNICIPAL SPENDING WATCH 10TH EDITION – Trends in Operating Spending, 2007-2017
© Canadian Federation of Independent Business 16

AB MUNICIPAL SPENDING WATCH 10TH EDITION – Trends in Operating Spending, 2007-2017
© Canadian Federation of Independent Business 17

AB MUNICIPAL SPENDING WATCH 10TH EDITION – Trends in Operating Spending, 2007-2017
© Canadian Federation of Independent Business 18
AB MUNICIPAL SPENDING WATCH 10TH EDITION – Trends in Operating Spending, 2007-2017
© Canadian Federation of Independent Business 19

AB MUNICIPAL SPENDING WATCH 10TH EDITION – Trends in Operating Spending, 2007-2017
© Canadian Federation of Independent Business 20

AB MUNICIPAL SPENDING WATCH 10TH EDITION – Trends in Operating Spending, 2007-2017
© Canadian Federation of Independent Business 21

AB MUNICIPAL SPENDING WATCH 10TH EDITION – Trends in Operating Spending, 2007-2017
© Canadian Federation of Independent Business 22

AB MUNICIPAL SPENDING WATCH 10TH EDITION – Trends in Operating Spending, 2007-2017
© Canadian Federation of Independent Business 23

AB MUNICIPAL SPENDING WATCH 10TH EDITION – Trends in Operating Spending, 2007-2017
© Canadian Federation of Independent Business 24
Appendix C: Albertan Municipalities, Population and Spending Growth, 2007-2017 and Per Capita Operating Spending
2007-2017 Population
Growth
2007-2017 Growth in Real
Operating Spending
Per Capita Operational
Spending
AIRDRIE 106% 137% $1,691
ALBERTA BEACH 15% 31% $2,394
ATHABASCA 15% 40% $2,449
ATHABASCA COUNTY 4% 42% $2,829
BANFF 2% 51% $4,000
BARRHEAD 9% 99% $2,137
BARRHEAD NO. 11, COUNTY OF 8% 25% $1,371
BASSANO -13% 23% $1,842
BEAUMONT 88% 127% $1,691
BEAVER COUNTY 4% 8% $2,200
BEAVERLODGE 9% 18% $2,086
BENTLEY 0% 6% $1,842
BIG LAKES COUNTY 8% -9% $5,109
BIGHORN NO. 8, M.D. OF 6% 108% $5,891
BIRCH HILLS COUNTY 6% 19% $4,057
BLACK DIAMOND 36% 56% $1,908
BLACKFALDS 105% 151% $1,688
BON ACCORD 0% 19% $1,728
BONNYVILLE 9% 36% $2,391
BONNYVILLE NO. 87, M.D. OF 29% 59% $3,812
BOW ISLAND 9% 53% $1,499
BOWDEN 3% 25% $1,815
BRAZEAU COUNTY 10% 57% $2,734
BROOKS 6% 67% $1,669
BRUDERHEIM 8% 59% $1,988
CALGARY 22% 57% $2,561
CALMAR 12% 29% $2,176
CAMROSE 18% 7% $2,015
CAMROSE COUNTY 18% 14% $2,195
CANMORE 16% 40% $2,780
CARDSTON 0% 4% $1,527
CARDSTON COUNTY 11% 21% $1,427
CARSTAIRS 54% 67% $1,682
CHESTERMERE 81% 91% $1,361

AB MUNICIPAL SPENDING WATCH 10TH EDITION – Trends in Operating Spending, 2007-2017
© Canadian Federation of Independent Business 25
2007-2017 Population
Growth
2007-2017 Growth in Real
Operating Spending
Per Capita Operational
Spending
CLARESHOLM 2% 50% $1,646
CLEAR HILLS COUNTY 11% -15% $4,515
CLEARWATER COUNTY 1% 40% $2,651
COALDALE 33% 77% $1,676
COALHURST 75% 162% $1,523
COCHRANE 91% 73% $1,538
COLD LAKE 16% 106% $2,665
CROSSFIELD 15% 37% $1,782
CROWSNEST PASS, Municipality of -3% 11% $2,256
CYPRESS COUNTY 14% 3% $2,560
DEVON 3% 45% $1,814
DIDSBURY 23% 36% $1,648
DRAYTON VALLEY 5% 61% $3,058
DRUMHELLER 1% 26% $1,978
DUCHESS 11% 64% $1,434
ECKVILLE 12% 23% $1,994
EDMONTON 28% 58% $2,573
EDSON 1% 34% $2,371
ELK POINT -4% 43% $2,046
FAIRVIEW -9% 22% $1,963
FAIRVIEW NO. 136, M.D. OF 12% 17% $3,534
FALHER 11% 26% $2,666
FLAGSTAFF COUNTY 7% 23% $4,636
FOOTHILLS NO. 31, M.D. OF 15% -16% $1,570
FORT MACLEOD -3% 40% $2,017
FORT SASKATCHEWAN 58% 82% $2,379
FORTY MILE NO. 8, COUNTY OF 5% 8% $2,679
FOX CREEK -13% 77% $3,895
GIBBONS 11% 88% $1,688
GRANDE CACHE -6% -1% $3,018
GRANDE PRAIRIE 26% 89% $2,470
GRANDE PRAIRIE NO. 1, COUNTY OF 24% 2% $3,102
GREENVIEW NO. 16, M.D. OF 2% 70% $9,454
GRIMSHAW 7% 43% $1,556
HANNA -10% 34% $2,328
HIGH LEVEL 3% 9% $2,441
HIGH PRAIRIE -10% 7% $2,545

AB MUNICIPAL SPENDING WATCH 10TH EDITION – Trends in Operating Spending, 2007-2017
© Canadian Federation of Independent Business 26
2007-2017 Population
Growth
2007-2017 Growth in Real
Operating Spending
Per Capita Operational
Spending
HIGH RIVER 27% 63% $2,062
HINTON 1% 44% $2,367
I.D. NO. 09 (BANFF) 10% 77% $1,944
INNISFAIL 2% 60% $1,890
IRRICANA -2% 25% $1,720
JASPER, Municipality of -1% 42% $3,176
KNEEHILL COUNTY -4% 2% $3,945
LAC LA BICHE COUNTY 4% 41% $4,173
LAC STE. ANNE COUNTY 15% -5% $1,796
LACOMBE 13% 54% $1,935
LACOMBE COUNTY -1% 7% $2,402
LAMONT 7% -5% $1,698
LAMONT COUNTY -1% 69% $4,198
LEDUC 83% 138% $2,558
LEDUC COUNTY 8% 11% $3,688
LEGAL 13% 30% $1,483
LESSER SLAVE RIVER NO. 124, M.D. OF -1% 53% $5,131
LETHBRIDGE 20% 54% $2,443
LETHBRIDGE COUNTY 0% -10% $1,910
LLOYDMINSTER 87% 99% $1,818
MACKENZIE COUNTY 12% 7% $2,453
MAGRATH 17% 27% $1,220
MANNING -21% 42% $2,885
MAYERTHORPE -10% 46% $2,459
MILLET -8% 52% $1,614
MINBURN NO. 27, COUNTY OF -4% 20% $4,687
MORINVILLE 46% 78% $1,750
MOUNTAIN VIEW COUNTY 4% -6% $1,931
NANTON 6% 72% $1,998
NEWELL, COUNTY OF 10% 108% $6,748
NOBLEFORD 85% 83% $853
NORTHERN LIGHTS, COUNTY OF 3% 4% $4,391
NORTHERN SUNRISE COUNTY -26% 60% $12,668
OKOTOKS 68% 79% $1,591
OLDS 27% 74% $2,175
ONOWAY 18% 23% $2,221

AB MUNICIPAL SPENDING WATCH 10TH EDITION – Trends in Operating Spending, 2007-2017
© Canadian Federation of Independent Business 27
2007-2017 Population
Growth
2007-2017 Growth in Real
Operating Spending
Per Capita Operational
Spending
OPPORTUNITY NO. 17, M.D. OF -2% 83% $15,880
OYEN -7% 38% $2,537
PAINTEARTH NO. 18, COUNTY OF -1% 80% $6,456
PARKLAND COUNTY 8% 37% $2,243
PEACE NO. 135, M.D. OF 17% 15% $1,863
PEACE RIVER 8% 47% $2,681
PENHOLD 67% 152% $1,993
PICTURE BUTTE 14% 26% $1,414
PINCHER CREEK 0% 56% $2,439
PINCHER CREEK NO. 9, M.D. OF -10% 70% $4,082
PONOKA 10% 45% $1,923
PONOKA COUNTY 13% -12% $1,492
PROVOST -4% 25% $2,180
PROVOST NO. 52, M.D. OF -13% 27% $5,565
RAYMOND 20% 74% $1,890
RED DEER 17% 63% $2,471
RED DEER COUNTY 2% 7% $2,156
REDCLIFF 10% 33% $1,491
REDWATER -6% 28% $2,329
RIMBEY 14% -3% $1,605
ROCKY VIEW COUNTY 14% 40% $2,262
SADDLE HILLS COUNTY -9% 78% $11,650
SEXSMITH 16% 55% $1,300
SLAVE LAKE -5% 69% $2,600
SMOKY LAKE COUNTY -9% 30% $4,408
SMOKY RIVER NO. 130, M.D. OF -17% -9% $3,539
SPECIAL AREAS BOARD -12% 21% $11,065
SPRUCE GROVE 79% 112% $1,989
ST. ALBERT 14% 57% $2,373
ST. PAUL 10% 71% $2,559
ST. PAUL NO. 19, COUNTY OF 9% 25% $3,163
STARLAND COUNTY -13% 13% $5,133
STETTLER 10% 52% $2,149
STETTLER NO. 6, COUNTY OF 6% 4% $2,757
STIRLING 33% 4% $1,291
STONY PLAIN 39% 72% $1,989
STRATHCONA COUNTY 19% 63% $2,902

AB MUNICIPAL SPENDING WATCH 10TH EDITION – Trends in Operating Spending, 2007-2017
© Canadian Federation of Independent Business 28
2007-2017 Population
Growth
2007-2017 Growth in Real
Operating Spending
Per Capita Operational
Spending
STRATHMORE 24% 69% $1,720
STURGEON COUNTY 10% -13% $2,225
SUNDRE 8% 63% $2,469
SWAN HILLS -21% 25% $2,800
SYLVAN LAKE 38% 107% $1,865
TABER 11% 45% $2,239
TABER, M.D. OF 14% 14% $2,346
THORHILD COUNTY 7% 76% $3,637
THORSBY 7% 21% $2,776
THREE HILLS -3% 10% $1,962
TOFIELD 11% 21% $2,036
TROCHU 0% 36% $2,229
TURNER VALLEY 34% 106% $2,546
TWO HILLS 17% 45% $1,677
TWO HILLS NO. 21, COUNTY OF 30% 31% $3,118
VALLEYVIEW -1% 57% $3,794
VAUXHALL 14% 16% $1,914
VEGREVILLE 3% 63% $3,125
VERMILION -7% 70% $2,531
VERMILION RIVER, COUNTY OF 11% -10% $2,563
VIKING 0% 44% $3,491
VULCAN -1% 38% $2,583
VULCAN COUNTY 4% -9% $3,572
WAINWRIGHT 16% 33% $1,879
WAINWRIGHT NO. 61, M.D. OF 9% -7% $4,250
WARNER NO. 5, COUNTY OF 2% 22% $2,137
WEMBLEY 5% 134% $1,688
WESTLOCK 2% 88% $2,377
WESTLOCK COUNTY 4% -7% $1,670
WETASKIWIN 8% 44% $1,866
WETASKIWIN NO. 10, COUNTY OF 6% 9% $1,972
WHEATLAND COUNTY 8% 61% $3,384
WHITECOURT 14% 93% $2,607
WILLOW CREEK NO. 26, M.D. OF -3% 18% $2,096
WOOD BUFFALO, Regional Municipality of 30% 222% $5,002
WOODLANDS COUNTY 14% -36% $3,500
YELLOWHEAD COUNTY 9% -4% $3,949