algeco group q3 fy19 investor presentation · 2019-11-26 · 6dih +dueru 5hfrqfloldwlrq iurp 86...
TRANSCRIPT

Q3 FY19 ResultsInvestor Conference Call
26 November 2019

2
Safe Harbor
Basis of PresentationUnless otherwise noted or unless the context otherwise requires, all references to “we,” “us,” “our,” “Algeco,” the “Group” and the “Company” refer to Algeco Investments 2 S.à r.l., a limited liability company incorporated under the laws of Luxembourg, together with its subsidiaries. As used in this presentation, “Europe” means our operations within various countries in Europe and “Asia Pacific” or “APAC” means Australia, New Zealand, and China. Unless otherwise noted or unless the context otherwise requires, all amounts are presented in Euros (“€”).
Use of Non-GAAP Financial MeasuresThis presentation includes certain financial measures not calculated and presented in accordance with International Financial Reporting Standards (“IFRS”), including, but not limited to, EBITDA, Underlying EBITDA, and certain ratios and other metrics derived therefrom. These non-GAAP (‘Generally Accepted Accounting Principles’) financial measures are not measures of financial performance in accordance with GAAP or IFRS and may exclude items that are significant in understanding and assessing our financial condition and results. Therefore, these measures should not be considered in isolation or as substitutes to net profit, cash flow from operations or other measures of profitability, liquidity or performance under GAAP or IFRS. These measures may not be comparable to similarly-titled measures used by other companies. A reconciliation of Underlying EBITDA to net profit (loss) is included in an appendix to this presentation.
Use of Constant Currency ResultsWe believe that currency exchange rates are an important factor in understanding period-to-period comparisons of our financial results. Accordingly, in certain places we present financial results on a constant currency basis in addition to our reported actual currency results. Constant currency information compares results between periods as if exchange rates had remained constant period-over-period. Unless stated otherwise, in this presentation, we calculate constant currency results by calculating prior year results using current-year currency exchange rates. We generally refer to such amounts as excluding or adjusting for the impact of foreign currency or being on a constant currency basis. These constant currency results should be considered in addition to, as opposed to as a substitute for, our actual currency results. Constant currency results, as we present them, may not be comparable to similarly titled measures used by other companies and are not measures of performance presented in accordance with GAAP or IFRS.
Note Regarding Parent Entity Financial Statements and Reconciliations.As permitted by the indentures governing Algeco Global Finance plc’s €685,000,000 6 1/2% Senior Secured Fixed Rate Notes due 2023, $520,000,000 8% Senior Secured Fixed Rate Notes due 2023 and €190,000,000 Senior Secured Floating Rate Notes due 2023 (the “Senior Secured Notes”) and Algeco Global Finance 2 plc’s $305,000,000 10% Senior Notes due 2023 (the “Senior Notes” and, together with the Senior Secured Notes, the “Notes”), Algeco Investments B.V. has elected to provide in this report consolidated financial information of Algeco Investments 2 S.à r.l., as a parent entity, in lieu of consolidated financial statements of Algeco Investments B.V. There are no material differences in terms of EBITDA or operating profit between the consolidated financial statements of Algeco Investments 2 S.à r.l. and Algeco Investments B.V.

3
Safe Harbor
Reconciliation from US GAAP to IFRSThe Group’s consolidated financial information presented in this report are presented in accordance with IFRS and reflect the application of IFRS for all periods presented. The Group’s consolidated financial statements were previously prepared in accordance with US GAAP until the quarter ended 30 September 2018. The reconciliations for the first time adoption of IFRS are set out in note 25 to our 31 December 2018 consolidated financial statements.
Disposal of Target LodgingsOn 15 March 2019, the Group disposed of Target Lodging and its subsidiaries (“Target”, our former US remote accommodation division). Unless otherwise indicated, all financial information is presented pro-forma for the sale, with Target presented as a discontinued operation.
Forward-Looking StatementsThis presentation contains forward-looking statements, which reflect industry outlook, our expectations regarding our future growth, results of operations, operational and financial performance, liquidity and capital resources, capital expenditures and investments, strategic transactions, business prospects and opportunities, challenges and future events. All statements other than statements of historical fact are forward-looking statements. Words such as, but not limited to, “anticipate,” “continue,” “estimate,” “expect,” “may,” “might,” “will,” “project,” “should,” “would,” “believe,” “intend,” “continue,” “could,” “currently,” “plan,” “predict,” and negatives of these words and similar expressions are intended to identify forward-looking statements. In particular, statements about our expectations, beliefs, plans, objectives, assumptions or future events or performance contained in this presentation are forward-looking statements. Although the forward-looking statements contained in this presentation reflect management’s current beliefs based upon information currently available to management and upon assumptions which management believes to be reasonable, actual results or events may differ materially from those stated in or implied by these forward-looking statements.
A number of factors could cause actual results, performance, events or achievements to differ materially from the results expressed or implied in the forward-looking statements. Readers should not place undue reliance on the forward-looking statements. Forward-looking statements necessarily involve significant known and unknown risks, assumptions and uncertainties that may cause our actual results, performance, events and achievements in the future periods to differ materially from those expressed or implied by such forward-looking statements. There can be no assurance that the results, performance, events or achievements contemplated in the forward-looking statements will be realized.
We cannot assure you that forward-looking statements will prove to be accurate, as actual actions, results and future events could differ materially from those anticipated or implied by such statements. All future written and oral forward-looking statements attributable to us or any person acting on our behalf are expressly qualified in their entirety by the cautionary statements contained or referred to in this section. These forward-looking statements are made only as of the date of this presentation and, except as required by law, we undertake no obligation, and specifically decline any obligation, to publicly update or revise any forward-looking statements, whether as a result of new information, future events or otherwise. This presentation should be read together with our 30 September 2019 consolidated financial statements and the notes thereto, and the risk factors described therein.

4
Creating smart placesfor people to live, work
and learn

5
EBITDA by SBULTM Sep-19
Sector diversity
LTM Q3 Revenue by customer sector
FY19 Q3 Performance(1)
Cash conversion remains strong
• YTD Q3 FY19: 53% cash conversion(2)
Financial position
• €347m total liquidity comprising €275m cash on balance sheet and €72m ABL availability
• A further €104m of cash held outside the Restricted Group in Algeco Investments 1 Sarl
• Net leverage 5.5x(3) in line with 5.6x a year ago.
Resilient Q3 FY19 EBITDA performance despite some markets remaining soft
• €67m EBITDA is €2m (2.9%) lower than Q3-18
• 6% (12,000) fewer units on rent compared to Q3 FY18 offset by +6% revenue per unit on rent from price and VAPS focus
• +19% unit sales growth
• Focus on branch level performance
(1) Presented in IFRS at actual forex rates. All EBITDA figures are Underlying EBITDA before Non-Recurring Project costs(2) (EBITDA – Net Capex) / EBITDA(3) Net of cash and liquid securities using Underlying EBITDA and debt before IFRS 16
€195mUnderlying
€194mUnderlying

6
Clear priorities for driving profitability
2) Optimise balance of volume versus price• Focus on sales effectiveness – weekly tracking of
branch quotes, orders, deliveries and idle fleet to increase UoR
• Active pricing to address local markets and customer requirements
• Granular management of branch level performance to maximise gross margin from existing fleet
1) Efficient cost base• Corporate costs streamlined – €4m p.a. saving
• Investing in sales activities – total sales force has increased by 10% during FY19
• UK - announced restructuring is underway
• Germany - review of overhead & branch structure
• Australia – review of overheads and sales activity to harmonise rental & sales products
4) Mergers & Acquisitions• Strategy to be Top 3 in chosen markets
• 31 Oct-19 acquisition of Buko’s modular building activities in Netherlands to achieve #1 position
o 12,000 units, €60m of revenue and 195 FTEs (see Appendix for further details)
o Expect to be deleveraging after synergies
• Pipeline of opportunities
3) Effective capital investment• Prioritise high margin refurbishment, e.g.
o ex-Touax fleet in France and Germany
o Renovation of Anti-Vandal fleet in UK
• Growth capex only being deployed into VAPS and premium end markets including education and fire-rated
7
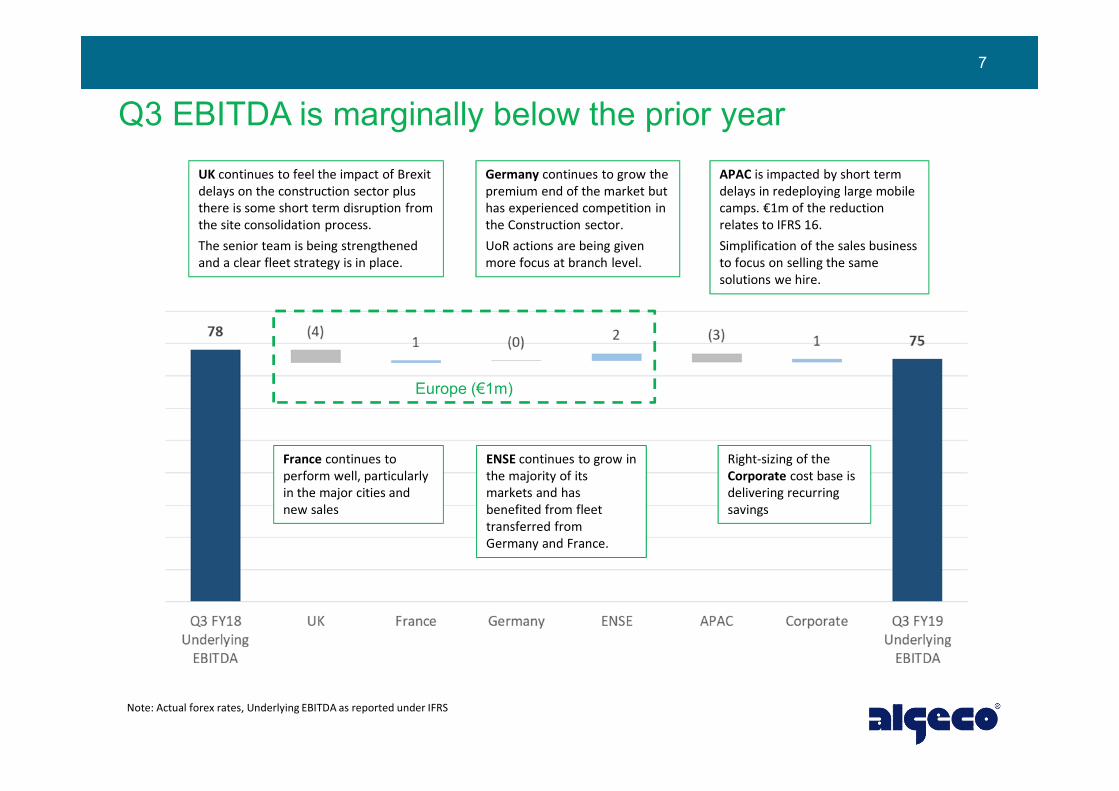
Q3 EBITDA is marginally below the prior year
Europe (€1m)
Note: Actual forex rates, Underlying EBITDA as reported under IFRS
Right-sizing of the Corporate cost base is delivering recurring savings
UK continues to feel the impact of Brexit delays on the construction sector plus there is some short term disruption from the site consolidation process.The senior team is being strengthened and a clear fleet strategy is in place.
ENSE continues to grow in the majority of its markets and has benefited from fleet transferred from Germany and France.
APAC is impacted by short term delays in redeploying large mobile camps. €1m of the reduction relates to IFRS 16.Simplification of the sales business to focus on selling the same solutions we hire.
Germany continues to grow the premium end of the market but has experienced competition in the Construction sector.UoR actions are being given more focus at branch level.
France continues to perform well, particularly in the major cities and new sales

8
Summary P&L – Q3 FY19 Underlying EBITDA €2m (-2.9%) lower than Q3 FY18 (pre IFRS 16)
• Total revenue was €8m (3.2%) above Q3 FY18
• Modular space leasing marginally down on prior year with revenue per unit growth of 5.5% (1.0% average price and 15.6% VAPS offsetting 6.2% fewer units on rent)
• Remote Accommodation benefited from a large short term project in the prior year
• Sales revenue was €13m (18.9%) higher mainly in APAC (+€5m), ENSE (+€3m) and France (+€2.5m)
• GM% was 3.4ppt lower than Q3 FY18 due to non-recurrence of a large high margin used unit sale in Q3 FY18 and short term disruption in the UK during the site consolidation programme
• SG&A was €2m (4.0%) below the prior year
• EBITDA% was 2.1ppt lower than Q3 FY18.
Note: Presented at actual forex rates (constant current impact <€1m)Underlying EBITDA is before non-recurring project costs
€'m Q3 FY18 Q3 FY19 Q-o-Q Q-o-Q %
- Modular Space Leasing 127 126 (1) -0,6% - Delivery & Installation 45 43 (3) -5,5% - Remote Accommodations 10 8 (2) -19,7%Leasing & Services Revenue 182 177 (5) -2,8%
- New Units 63 80 17 27,5% - Rental Units 8 4 (4) -51,2%Sales Revenue 70 84 13 18,9%
Total Revenue 252 260 8 3,2%
Cost of Sales (125) (138) (13) 10,3%Gross Profit 127 122 (5) -3,8%
SG&A (49) (47) 2 -4,0%Underlying EBITDA 78 75 (3) -3,6%
Impact of IFRS 16 (9) (9) 1 -9,2%Underlying EBITDA pre IFRS 16 69 67 (2) -2,9%
GM% 50,3% 46,9% -3.4pptUnderlying EBITDA % 31,0% 28,9% -2.1ppt
Units on Rent 196 184 (12) -6,2%Utilisation 82% 79% -2ppt
Average Rental Rate 147 148 1 1,0%VAPS revenue per unit 67 77 10 15,6%Revenue per unit 213 225 12 5,5%

9
6% lease revenue per unit growth driven by improving VAPS penetration
Note: Actual forex rates Note: Q4 FY17 to Q4 FY18 excluding Touax
Q-on-Q+€8m+3.2%
Q-on-Q +€12m (+5.5%)ARR: +€1.5 (+1.0%)
VAPS: +€10.4 (+15.6%)

Europe

11
Europe – EBITDA €2m (3%) lower in Q3 FY19
• Revenue growth in France and ENSE, softer markets in UK and Germany
• Units on rent shortfall brought forward from Q2 (11,000 fewer units on rent compared to Q3 FY18)
• Focus on lease revenue per unit has offset majority of lower volume
• Sales 8m (15%) higher in France and ENSE
• GM% 4.6bps lower mainly due to large high margin used unit sale in the prior year and mix
• Capex was managed to maintain cash conversion
+€10m5%
+€2m-7%
Note: Actual forex rates, Underlying EBITDA as reported under IFRS
(€2m)-3%

12
Europe – Revenue per unit on rent grew 7% over prior year and utilisation remains at 80% in the year to date
Note: Actual forex rates

APAC

14
APAC – lower EBITDA mainly due to timing of large project returns
(€3m)(22%)
(€2m)(4%)
• Nearly half of the EBITDA reduction was due to IFRS 16 (EBITDA before IFRS 16 declined by €1.8m)
• APAC Q3 FY19 revenue was €2m (4%) lower than Q3 FY18
• Off-hires of two large Australian mobile camps in Q4 FY18 and a large short term remote accommodation project in 2018
• APAC excluding Australian mobile camps grew lease revenue per unit by 4%
• Review of Australian manufacturing footprint underway
• New Zealand grew UoR, ARR, VAPS and EBITDA
• Capex consistent with prior year
Note: Actual forex rates, Underlying EBITDA as reported under IFRS
(€0.3m)+11%

15
APAC – Income per unit growth, UoR and utilisation stable
Note: Actual forex rates
+€12 (4%)ARR €6 (3%)
VAPS +€5 (6%)
Note: ARR and VAPS are presented excluding mobile camps that are low volume but high value and so the mix effect distorts underlying trends

Capex, cash flow and debt
17
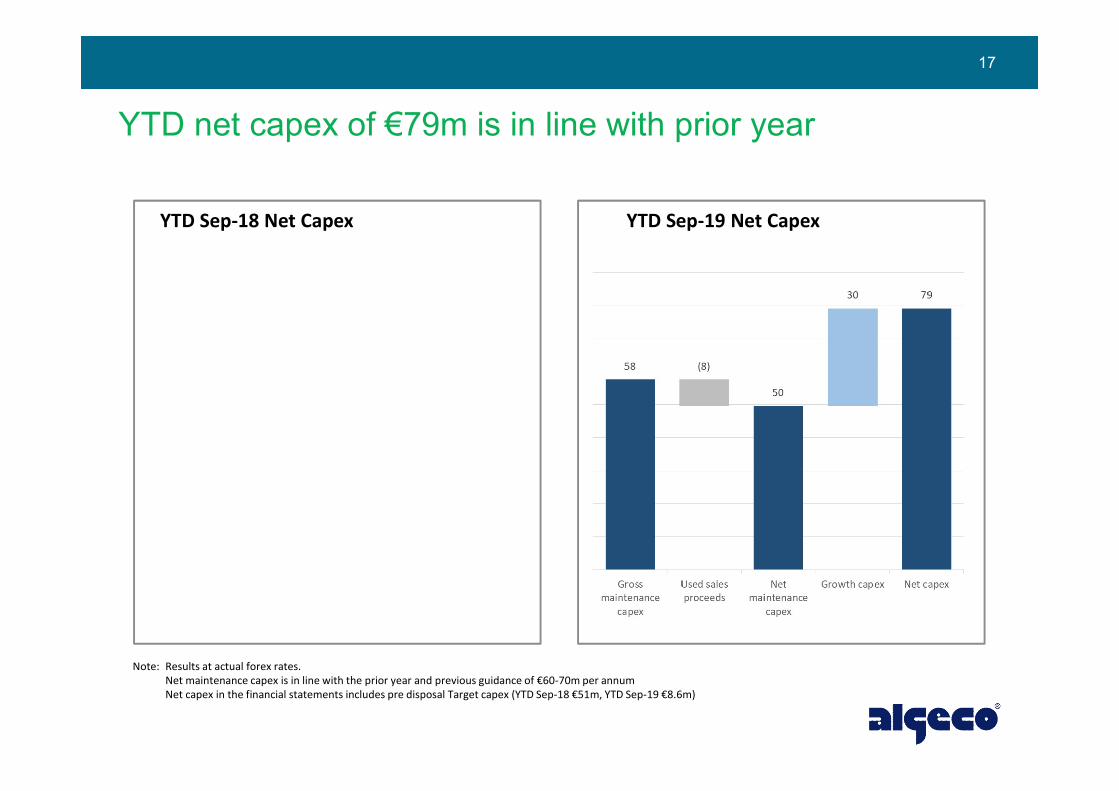
YTD net capex of €79m is in line with prior year
Note: Results at actual forex rates.Net maintenance capex is in line with the prior year and previous guidance of €60-70m per annumNet capex in the financial statements includes pre disposal Target capex (YTD Sep-18 €51m, YTD Sep-19 €8.6m)
YTD Sep-18 Net Capex YTD Sep-19 Net Capex

18
Cash conversion continues to be above 50%
Note: Cash conversion = (Underlying EBITDA – net capex) / Underlying EBITDA (before non-cash IFRS 16 adjustments)Results at actual forex rates
YTD Sep-18 Cash impact YTD Sep-19
Underlying EBITDA €165m €169m
Net Capex (€79m) = (€79m)
Underlying EBITDA – Net Capex €86m €90m
Cash conversion % 52% 53%
+€4m
+€4m
EBITDA –Maintenance Capex €115m €119m
Cash conversion % 70% 71%
+€4m

19
Net leverage at 30 Sep 2019 is 5.5x which is in line with 5.6x a year ago
• €347m total liquidity at 30 Sep 2019
• €275m of cash
• €72m ABL availability as of 30 Sep 2019
• During Q3 €154m of cash was loaned up the Group to Algeco Investments 1 Sarl using permitted baskets:
• €50m repurchase of preference shares
• €104m held as cash, available for transfer back to Algeco Investments BV with 35 days notice
• Pro-forma annual cash interest cost is c.€110m (all USD interest payments are hedged)
• IFRS net leverage is 5.1x
• No impact on net leverage from Buko acquisition at completion, but expect to be deleveraging over time
Note: - The table presents gross debt repayable (see the appendix for a reconciliation to net borrowings under IFRS)- Target Hospitality equity is the value at 30 Sep 2019- Net leverage before €98m of liquid securities is 6.0x pre IFRS 16 (5.5x under IFRS)- Net debt reported under IFRS includes €85m of IFRS 16 lease liabilities
€'m30 Sep-19
ActualAsset Based Loan Revolver (L+275) 658.0% $ Senior Secured FXN 445E + 6.25% € Senior Secured FRN 1906.5% € Senior Secured FXN 685Total Senior Secured Debt 1,38510.0% $ Senior Unsecured FXN 242Other debt (excl. IFRS 16 lease liabilities) 41Gross total debt 1,668Cash and Cash Equivalents (275)Equity in Target Hospitality (98)Total Net Debt 1,295
Cash held outside Restricted Group (104)
LTM Sep-19 Underlying EBITDA pre IFRS 16 233Net leverage 5.5x
Total Net Debt under IFRS 1,380LTM Sep-19 Underlying EBITDA 269Net leverage 5.1x
Questions & Answers QUESTIONS & ANSWERS

21
Appendix

22
Leading business services company specialising in modular space
• Operations in 22 countries in Europe & Asia Pacific
• 160 depots* and branches including 21 design and assembly facilities*
• Fleet of c. 240,000 modular units* providing a ‘mission critical’ service to a client base that is well-diversified by sector as well as geography*pro-forma for Buko acquisition
€956m
Corporate Headquarters
Operational Headquarters
Depot
Assembly Facility
Key

23
Product range
Transformational acquisition in the Dutch market
On 31 October 2019 we completed the acquisition of Buko’s modular buildings activities.
Consideration approximately 5x post cost synergies
€60m revenue
60% leasing40% sales
Market sectors: Construction, schools, public sector, industry
Fleet of 12,000 units plus rental and sales products new to Algeco
5 depots in The Netherlands
195 FTEs
Units
Wooden Element Systems
Semi Permanent
Hangars
Stores
SL

24
Summary P&L – YTD Q3 FY19 Underlying EBITDA €4m (+2.4%) higher than YTD Q3 FY18 (pre IFRS 16)
• Forex movements are not material to the YTD trends (€1m EBITDA)
• Total revenue increased by €2m (0.2%)
• Modular space leasing marginally up on prior year with revenue per unit growth of 6.2% (comprising 1.5% ARR and 13.7% VAPS) offset by 5.5% fewer units on rent.
• Delivery & installation revenue lower due to fewer deliveries, albeit with little gross margin impact.
• Sales revenue grew €18m (4.3%) mainly in the UK, France, ENSE and APAC.
• SG&A €5m (3.3%) lower than the prior year.
• GM% was 0.7ppt lower than the prior year mainly due to mix or sales versus leasing
• EBITDA% is flat comparing to the prior year.
Note: Actual forex ratesUnderlying EBITDA is before non-recurring project costs
€'mYTD Sep-
18YTD Sep-
19Y-o-Y Y-o-Y %
- Modular Space Leasing 371 368 (2) -0,6% - Delivery & Installation 122 115 (7) -5,8% - Remote Accommodations 28 21 (7) -25,6%Leasing & Services Revenue 521 505 (16) -3,2%
- New Units 171 193 22 12,9% - Rental Units 12 8 (4) -32,7%Sales Revenue 183 201 18 9,9%
Total Revenue 704 706 2 0,2%
Cost of Sales (355) (360) (6) 1,6%Gross Profit 350 346 (4) -1,1%
SG&A (156) (151) 5 -3,3%Underlying EBITDA 194 195 1 0,6%
Impact of IFRS 16 (29) (26) 3 -9,4%Underlying EBITDA pre IFRS 16 165 169 4 2,4%
GM% 49,6% 49,0% -0.7pptUnderlying EBITDA % 27,5% 27,6% 0.1ppt
Units on Rent 195 185 (11) -5,5%Utilisation 81% 79% -1ppt
Average Rental Rate 145 147 2 1,5%VAPS revenue per unit 62 70 8 13,7%Revenue per unit 207 217 11 5,1%

25
YTD Q3 EBITDA is flat
Europe +€1m
Note: Actual forex rates, Underlying EBITDA as reported under IFRS
26
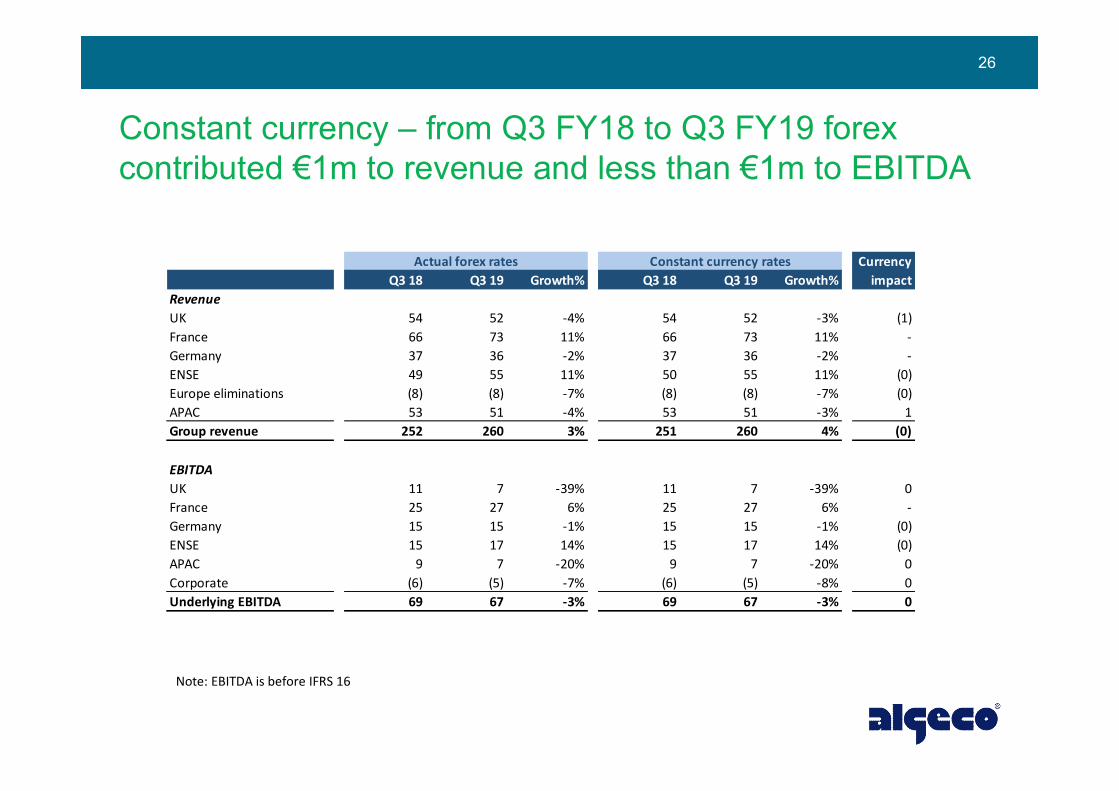
Constant currency – from Q3 FY18 to Q3 FY19 forex contributed €1m to revenue and less than €1m to EBITDA
Note: EBITDA is before IFRS 16
CurrencyQ3 18 Q3 19 Growth% Q3 18 Q3 19 Growth% impact
RevenueUK 54 52 -4% 54 52 -3% (1)France 66 73 11% 66 73 11% -Germany 37 36 -2% 37 36 -2% -ENSE 49 55 11% 50 55 11% (0)Europe eliminations (8) (8) -7% (8) (8) -7% (0)APAC 53 51 -4% 53 51 -3% 1Group revenue 252 260 3% 251 260 4% (0)
EBITDAUK 11 7 -39% 11 7 -39% 0France 25 27 6% 25 27 6% -Germany 15 15 -1% 15 15 -1% (0)ENSE 15 17 14% 15 17 14% (0)APAC 9 7 -20% 9 7 -20% 0Corporate (6) (5) -7% (6) (5) -8% 0Underlying EBITDA 69 67 -3% 69 67 -3% 0
Actual forex rates Constant currency rates

27
Constant currency – from YTD Q3 FY18 to YTD Q3 FY19 forex contributed €1m to EBITDA growth
Note: EBITDA is before IFRS 16
CurrencyYTD Sep-18 YTD Sep-19 Growth% YTD Sep-18 YTD Sep-19 Growth% impact
RevenueUK 140 146 4% 140 146 4% 0France 180 185 3% 180 185 3% -Germany 112 100 -10% 112 100 -10% -ENSE 131 143 9% 131 143 9% 0Europe eliminations (18) (15) -17% (18) (15) -17% (0)APAC 160 147 -8% 158 147 -7% 2Group revenue 704 706 0% 702 706 1% 3
EBITDAUK 25 19 -26% 25 19 -26% (0)France 55 66 21% 55 66 21% -Germany 39 37 -4% 39 37 -4% 0ENSE 36 42 16% 36 42 17% 0APAC 24 22 -7% 23 22 -6% 0Corporate (14) (18) 26% (15) (18) 22% 1Underlying EBITDA 165 169 2% 164 169 3% 1
Actual forex rates Constant currency rates

28
Europe fleet statistics
Note: Actual forex rates
€'m Avg. UoR Util. % ARR Avg. UoR Util. % ARRUK 28 265 68% 185 25 162 73% 178France 56 985 86% 139 52 717 81% 151Germany 40 210 84% 137 37 594 80% 137ENSE 56 028 85% 113 55 033 82% 118Europe 181 488 82% 137 170 506 80% 141
Fleet StatisticsQ3 FY18 Q3 FY19

29
Note: Actual forex rates
• Camps supporting the East Coast coking coal and the West Coast LNG are stable
• Capacity increased in Q3 FY18 when a camp was re-activated for short term contracts.
• Capacity reduced in Q2 FY19 when an existing facility was placed into care and maintenance upon the completion of a large project.
• Average Daily Rate has increased during FY19
APAC - Remote Accommodation is less than 4% of Group revenue

30
Gross Debt to Total Borrowings reconciliation
€m Q3 FY19 Notes
Gross total debt 1 668 Net debt analysis in this presentation
Deferred issue costs (44)
Lease liability (IFRS 16) 85
Hedge 71
Total borrowings, gross 1 780 Financial statements
Issue costs are capitalised, netted off the principle balance and amortised over the length of the debt in the accounts
Operating lease liability calculated for IFRS 16 which is in addition to €7m of finance leases included within other debt in Total Gross Debt
Gain on foreign exchange hedge on the principal values of the hedged portion of the USD bonds

31
Optimise current fleet
Opportunistic Debt
repaymentNew units
Disciplined accretive
M&A
Considered versus other returns if economically rational
Strengthen position in existing markets
Cost synergies
Commercial synergies
Adjacent products & services
SBUs compete for capital
Only considered if the demand can’t be met by refurbishing and/or relocating existing fleet.
Maintenance / refurbishment only performed when the unit is required for a contract
Geographic redeployment
Capital is allocated dynamically to maximise returns
Growth investment
Cash generated by operations
Debt servicing
Interest payments

www.algeco.com/[email protected]