algorithms and representations for supporting online music...
TRANSCRIPT

Algorithms and representationsfor supporting online music creationwith large-scale audio databases
Gerard Roma Trepat
TESI DOCTORAL UPF / 2015
Director de la tesi
Prof. Dr. Xavier Serra CasalsDepartment of Information and Communication Technologies


To Anna


Acknowledgements
This thesis is obviously as much of a collective creation as the ones it hopesto enable. I have been very fortunate to meet and collaborate with a numberof people during this journey. Thanks in the first place to Xavier Serra forthe opportunity to work at the MTG, as well as for his inspiring vision andadvice. I am also deeply indebted to Perfecto Herrera who has patientlyguided and supervised my progress. Who knows where this would haveended without him holding the lamp. Very special thanks also for all thistime to all the people who I have had the privilege to work with at thePhonondip, Metaverse and Freesound projects. In no particular order andsurely with some omission Bram de Jong, Jordi Funollet, Frederic Font,Vincent Akkermans, Stelios Togias, Sergio Oramas, Alastair Porter, MartınHaro, Jordi Janer, Stefan Kersten, Mattia Schirosa and Nuno Hespanhol.Thanks also to Robin Laney, who allowed me to make a research stay at theOpen University, as well as Chris Dobbyn and all the vibrant community Imet there.
Thanks to everyone who I have met and chatted with at the MTG, alsoin random order, Graham Coleman, Nicolas Wack, Dmitry Bogdanov, En-ric Aylon, Ricard Marxer, Tan Hakan Ozaslan, Oscar Mayor, FerdinandFuhrman, Cyril Laurier, Hendrik Purwins, Justin Salamon, Mohamed Sordo,Piotr Holonowicz, Ines Salselas, Sergi Jorda, Carles F. Julia, Daniel Gal-lardo, Sebastian Mealla, Emilia Gomez, Enric Guaus, Jordi Bonada, Mer-lijn Blaauw, Marius Miron, Agustın Martorell, Juan Jose Bosch, SankalpGulati, Gopala Kuduri, Rafael Caro, Dara Dabiri, Georgi Dzhambazov,Angel Faraldo, Carthach O Nuanain, Martin Hermant, Mathieu Bosi, Ser-tan Senturk, Ajay Srinivasamurthy, Julio Carabias, Martı Umbert, Rafael
v

vi
Ramırez, Julian Urbano, Alvaro Sarasua, Zacharias Vamvakousis, Oriol Ro-manı, Hector Parra, Nadine Kroher, Panos Papiotis, Alfonso Perez, EstebanMaestre, Cristina Garrido, Alba Rosado, Sonia Espı, Andres Lewin-Richter,and everyone I forgot. Also thanks to Lydia Garcıa for her endless patience.A special mention should go also to researchers from different places withwhom I had the opportunity to collaborate: Waldo Nogueira, MassimilianoZanin, Sergio Toral.
Finally, infinite thanks to Anna Xambo, who helped me in more ways thanI would ever be able to write.

AbstractThe rapid adoption of Internet and web technologies has created an op-portunity for making music collaboratively by sharing information online.However, current applications for online music making do not take advan-tage of the potential of shared information. The goal of this dissertation isto provide and evaluate algorithms and representations for interacting withlarge audio databases that facilitate music creation by online communities.This work has been developed in the context of Freesound, a large-scale,community-driven database of audio recordings shared under Creative Com-mons (CC) licenses. The diversity of sounds available through this kind ofplatform is unprecedented. At the same time, the unstructured nature ofcommunity-driven processes poses new challenges for indexing and retriev-ing information to support musical creativity. In this dissertation we pro-pose and evaluate algorithms and representations for dealing with the mainelements required by online music making applications based on large-scaleaudio databases: sound files, including time-varying and aggregate rep-resentations, taxonomies for retrieving sounds, music representations andcommunity models. As a generic low-level representation for audio signals,we analyze the framework of cepstral coefficients, evaluating their perfor-mance with example classification tasks. We found that switching to morerecent auditory filter such as gammatone filters improves, at large scales, ontraditional representations based on the mel scale. We then consider com-mon types of sounds for obtaining aggregated representations. We showthat several time series analysis features computed from the cepstral co-efficients complement traditional statistics for improved performance. Forinteracting with large databases of sounds, we propose a novel unsupervisedalgorithm that automatically generates taxonomical organizations based onthe low-level signal representations. Based on user studies, we show thatour approach can be used in place of traditional supervised classification
vii

viii abstract
approaches for providing a lexicon of acoustic categories suitable for cre-ative applications. Next, a computational representation is described formusic based on audio samples. We demonstrate through a user experimentthat it facilitates collaborative creation and supports computational analy-sis using the lexicons generated by sound taxonomies. Finally, we deal withrepresentation and analysis of user communities. We propose a method formeasuring collective creativity in audio sharing. By analyzing the activityof the Freesound community over a period of more than 5 years, we showthat the proposed creativity measures can be significantly related to socialstructure characterized by network analysis.

Resumen
La rapida adopcion de Internet y de las tecnologıas web ha creado unaoportunidad para hacer musica colaborativa mediante el intercambio deinformacion en lınea. Sin embargo, las aplicaciones actuales para hacermusica en lınea no aprovechan el potencial de la informacion compartida.El objetivo de esta tesis es proporcionar y evaluar algoritmos y representa-ciones para interactuar con grandes bases de datos de audio que facilitenla creacion de musica por parte de comunidades virtuales. Este trabajo hasido desarrollado en el contexto de Freesound, una base de datos de graba-ciones sonoras compartidos bajo licencia Creative Commons (CC) a granescala, impulsada por la comunidad de usuarios. La diversidad de sonidosdisponibles a traves de este tipo de plataforma no tiene precedentes. Almismo tiempo, la naturaleza desestructurada de los procesos impulsadospor comunidades plantea nuevos retos para la indexacion y recuperacion deinformacion en apoyo de la creatividad musical. En esta tesis proponemos yevaluamos algoritmos y representaciones para tratar con los principales ele-mentos requeridos por las aplicaciones de creacion musical en lınea basadasen bases de datos de audio a gran escala: archivos de sonido, incluyendorepresentaciones temporales y agregadas, taxonomıas para buscar sonidos,representaciones musicales y modelos de comunidad. Como representacionde bajo nivel generica para senales de audio, se analiza el marco de loscoeficientes cepstrum, evaluando su rendimiento en tareas de clasificacion.Encontramos que el cambio a un filtro auditivo mas reciente como los filtrosde gammatonos mejora, a gran escala, respecto de las representaciones tradi-cionales basadas en la escala mel. Despues consideramos tres tipos comunesde sonidos para la obtencion de representaciones agregadas. Se demuestra
ix

x resumen
que varias funciones de analisis de series temporales calculadas a partir de loscoeficientes cepstrum complementan las estadısticas tradicionales para unmejor rendimiento. Para interactuar con grandes bases de datos de sonidos,se propone un nuevo algoritmo no supervisado que genera automaticamenteorganizaciones taxonomicas basadas en las representaciones de senal de bajonivel. En base a estudios con usuarios, mostramos que nuestro enfoque sepuede utilizar en lugar de los sistemas tradicionales de clasificacion super-visada para proporcionar un lexico de categorıas acusticas adecuadas paraaplicaciones creativas. A continuacion, se describe una representacion com-putacional para musica creada a partir de muestras de audio. Demostramos,a traves de un experimento con usuarios, que facilita la creacion colabora-tiva y posibilita el analisis computacional usando los lexicos generados porlas taxonomıas de sonido. Finalmente, nos centramos en la representaciony analisis de comunidades de usuarios. Proponemos un metodo para medirla creatividad colectiva en el intercambio de audio. Mediante un analisis dela actividad de la comunidad Freesound durante un periodo de mas de 5anos, se muestra que las medidas propuestas de creatividad se pueden rela-cionar significativamente con la estructura social descrita mediante analisisde redes.

Resum
La rapida adopcio d’Internet i de les tecnologies web ha creat una oportu-nitat per fer musica col·laborativa mitjancant l’intercanvi d’informacio enlınia. No obstant aixo, les aplicacions actuals per fer musica en lınia noaprofiten el potencial de la informacio compartida. L’objectiu d’aquestatesi es proporcionar i avaluar algorismes i representacions per a interactuaramb grans bases de dades d’audio que facilitin la creacio de musica per partde comunitats virtuals. Aquest treball ha estat desenvolupat en el contextde Freesound, una base de dades d’enregistraments sonors compartits sotallicencia Creative Commons (CC) a gran escala, impulsada per la comu-nitat d’usuaris. La diversitat de sons disponibles a traves d’aquest tipusde plataforma no te precedents. Alhora, la naturalesa desestructurada delsprocessos impulsats per comunitats planteja nous reptes per a la indexacioi recuperacio d’informacio que dona suport a la creativitat musical. Enaquesta tesi proposem i avaluem algorismes i representacions per tractaramb els principals elements requerits per les aplicacions de creacio musi-cal en lınia basades en bases de dades d’audio a gran escala: els arxiusde so, incloent representacions temporals i agregades, taxonomies per acercar sons, representacions musicals i models de comunitat. Com a rep-resentacio de baix nivell generica per a senyals d’audio, s’analitza el marcdels coeficients cepstrum, avaluant el seu rendiment en tasques de classifi-cacio d’exemple. Hem trobat que el canvi a un filtre auditiu mes recent comels filtres de gammatons millora, a gran escala, respecte de les representa-cions tradicionals basades en l’escala mel. Despres considerem tres tipuscomuns de sons per a l’obtencio de representacions agregades. Es demostraque diverses funcions d’analisi de series temporals calculades a partir dels
xi

xii resum
coeficients cepstrum complementen les estadıstiques tradicionals per a unmillor rendiment. Per interactuar amb grans bases de dades de sons, esproposa un nou algorisme no supervisat que genera automaticament or-ganitzacions taxonomiques basades en les representacions de senyal de baixnivell. Em base a estudis amb usuaris, mostrem que el sistema proposat espot utilitzar en lloc dels sistemes tradicionals de classificacio supervisadaper proporcionar un lexic de categories acustiques adequades per a aplica-cions creatives. A continuacio, es descriu una representacio computacionalper a musica creada a partir de mostres d’audio. Demostrem a traves d’unexperiment amb usuaris que facilita la creacio col·laborativa i dona suportl’analisi computacional usant els lexics generats per les taxonomies de so.Finalment, ens centrem en la representacio i analisi de comunitats d’usuaris.Proposem un metode per mesurar la creativitat col·lectiva en l’intercanvid’audio. Mitjancant l’analisi de l’activitat de la comunitat Freesound du-rant un perıode de mes de 5 anys, es mostra que les mesures proposadesde creativitat es poden relacionar significativament amb l’estructura socialdescrita mitjancant l’analisi de xarxes.

Contents
Abstract vii
Resumen ix
Resum xi
List of Figures xv
List of Tables xviii
1 Introduction 1
1.1 Motivation . . . . . . . . . . . . . . . . . . . . . . . . . . . . 1
1.2 Aim of this thesis . . . . . . . . . . . . . . . . . . . . . . . . . 7
1.3 Thesis outline . . . . . . . . . . . . . . . . . . . . . . . . . . . 8
2 Background 11
2.1 Overview . . . . . . . . . . . . . . . . . . . . . . . . . . . . . 11
2.2 Network and web music . . . . . . . . . . . . . . . . . . . . . 12
2.3 Freesound and audio clip sharing . . . . . . . . . . . . . . . . 14
2.4 Content-based audio retrieval . . . . . . . . . . . . . . . . . . 15
2.5 Music representation . . . . . . . . . . . . . . . . . . . . . . . 21
2.6 Models of creative communities . . . . . . . . . . . . . . . . . 25
2.7 Open issues . . . . . . . . . . . . . . . . . . . . . . . . . . . . 27
3 Audio description in unstructured data 29
3.1 Introduction . . . . . . . . . . . . . . . . . . . . . . . . . . . . 29
xiii

xiv contents
3.2 Generic low-level description . . . . . . . . . . . . . . . . . . 303.3 Feature aggregation . . . . . . . . . . . . . . . . . . . . . . . 333.4 Experiments . . . . . . . . . . . . . . . . . . . . . . . . . . . . 503.5 Conclusions . . . . . . . . . . . . . . . . . . . . . . . . . . . . 72
4 Automatic taxonomical organization of audio 734.1 Introduction . . . . . . . . . . . . . . . . . . . . . . . . . . . . 734.2 Taxonomical organization . . . . . . . . . . . . . . . . . . . . 744.3 Content-based indexing . . . . . . . . . . . . . . . . . . . . . 754.4 Unsupervised indexing . . . . . . . . . . . . . . . . . . . . . . 774.5 Supervised indexing . . . . . . . . . . . . . . . . . . . . . . . 804.6 Experiments . . . . . . . . . . . . . . . . . . . . . . . . . . . . 834.7 Conclusions . . . . . . . . . . . . . . . . . . . . . . . . . . . . 108
5 Representing music as work in progress 1115.1 Introduction . . . . . . . . . . . . . . . . . . . . . . . . . . . . 1115.2 Grammar framework . . . . . . . . . . . . . . . . . . . . . . . 1135.3 Tree representation . . . . . . . . . . . . . . . . . . . . . . . . 1155.4 Lexical generality level . . . . . . . . . . . . . . . . . . . . . . 1165.5 Finding patterns . . . . . . . . . . . . . . . . . . . . . . . . . 1195.6 Experiments . . . . . . . . . . . . . . . . . . . . . . . . . . . . 1225.7 Conclusions . . . . . . . . . . . . . . . . . . . . . . . . . . . . 131
6 Understanding networked creativity 1336.1 Introduction . . . . . . . . . . . . . . . . . . . . . . . . . . . . 1336.2 Implicit networks in audio sharing . . . . . . . . . . . . . . . 1346.3 Network analysis . . . . . . . . . . . . . . . . . . . . . . . . . 1366.4 Creativity measures . . . . . . . . . . . . . . . . . . . . . . . 1396.5 Experiments . . . . . . . . . . . . . . . . . . . . . . . . . . . . 1406.6 Conclusions . . . . . . . . . . . . . . . . . . . . . . . . . . . . 154
7 Conclusions 1577.1 Summary of contributions . . . . . . . . . . . . . . . . . . . . 1597.2 Future directions . . . . . . . . . . . . . . . . . . . . . . . . . 160
Bibliography 163
Appendix A: Publications by the author 179Book Chapters . . . . . . . . . . . . . . . . . . . . . . . . . . . . . 179Journal Articles . . . . . . . . . . . . . . . . . . . . . . . . . . . . . 179Conference Papers . . . . . . . . . . . . . . . . . . . . . . . . . . . 180

List of Figures
2.1 Elements involved in web-based music creation . . . . . . . . . . 27
3.1 Mel scale filterbank (with constant area) . . . . . . . . . . . . . . 34
3.2 Bark scale filterbank . . . . . . . . . . . . . . . . . . . . . . . . . 35
3.3 ERB scale gammatone filterbank . . . . . . . . . . . . . . . . . . 36
3.4 Duration of sounds tagged as “field-recording” in Freesound . . . 37
3.5 Steps in the construction of the recurrence plot . . . . . . . . . . 39
3.6 Example of onset detection functions . . . . . . . . . . . . . . . . 44
3.7 Example of the different behaviour of the VAD and the HFCfbfunctions . . . . . . . . . . . . . . . . . . . . . . . . . . . . . . . 45
3.8 Similarity matrix and beat spectrum from a rhythmic sample . . 48
3.9 Classification accuracy using raw filterbank features for the smallerdatasets: d case scenes (a), dares scenes (b), inhouse scenes (c),d case events (d) and indaba (e), as a function of the number offilters . . . . . . . . . . . . . . . . . . . . . . . . . . . . . . . . . 55
3.10 Classification accuracy using raw filterbank features for the largerdatasets: looperman (a),freesound packs (b), freesound tags (c)and gaver events (d) datasets, as a function of the number offilters . . . . . . . . . . . . . . . . . . . . . . . . . . . . . . . . . 56
3.11 Classification accuracy using cepstral coefficients computed from40 bands for the smaller datasets: d case scenes (a), dares scenes(b), inhouse scenes (c), d case events (d) and indaba (e), as afunction of the number of filters . . . . . . . . . . . . . . . . . . . 57
xv

xvi list of figures
3.12 Classification accuracy using cepstral coefficients computed from40 bands for the larger datasets: looperman (a),freesound packs(b), freesound tags (c) and gaver events (d) datasets, as a func-tion of the number of coeficients . . . . . . . . . . . . . . . . . . 58
3.13 Classification accuracy using RQA features without whitening,as a function of parameters W and r for the scenes datasets . . . 59
3.14 Classification accuracy using RQA features with whitening, as afunction of parameters W and r for the scenes datasets . . . . . . 60
3.15 Classification accuracy using global mean (gm), global variance(gv), local variance (lv) RQA (rqa), and combinations for thescenes datasets . . . . . . . . . . . . . . . . . . . . . . . . . . . . 61
3.16 Classification accuracy using mean (m), variance (v), deriva-tive mean(dm), derivative variance (dv), envelope features (env),RQA (rqa), and combinations for the events datasets . . . . . . . 64
3.17 Frame level F-measure for event detection using different seg-mentation algorithms and feature sets . . . . . . . . . . . . . . . 66
3.18 Loop detection accuracy using either the harmonic method andthe SVM classifier for the looperman and indaba datasets . . . . 67
3.19 Classification accuracy using mean (m), variance (v), derivativemean(dm), derivative variance (dv) and combinations for theloop datasets: looperman (a) and indaba (b) . . . . . . . . . . . 69
3.20 Distribution of the error in detecting labelled tempo harmonicswith the looperman dataset . . . . . . . . . . . . . . . . . . . . . 70
3.21 Screenshot of the prototype . . . . . . . . . . . . . . . . . . . . . 71
4.1 Gaver’s proposed taxonomy of sounds . . . . . . . . . . . . . . . 76
4.2 Picture of the prototype . . . . . . . . . . . . . . . . . . . . . . . 85
4.3 Comparison of graph-based clustering to classic clustering algo-rithms for the smaller datasets, as a function of the number offeatures . . . . . . . . . . . . . . . . . . . . . . . . . . . . . . . . 93
4.4 Comparison of graph-based clustering to classic clustering algo-rithms using raw filterbank features for the larger datasets, as afunction of the number of features . . . . . . . . . . . . . . . . . 94
4.5 Comparison of graph-based clustering to classic clustering algo-rithms using cepstral coefficients for the smaller datasets, as afunction of the number of features . . . . . . . . . . . . . . . . . 95
4.6 Comparison of modularity clustering to classic clustering algo-rithms using cepstral coefficients for the larger datasets, as afunction of the number of features . . . . . . . . . . . . . . . . . 96
4.7 Flat vs. hierarchical classification (F-measure) . . . . . . . . . . 99

list of figures xvii
4.8 Row-normalized confusion matrices . . . . . . . . . . . . . . . . . 1004.9 Screenshot of the prototype . . . . . . . . . . . . . . . . . . . . . 1014.10 Box plots for the experiment variables with respect to the two
taxonomies . . . . . . . . . . . . . . . . . . . . . . . . . . . . . . 1044.11 Box plots for the relative change in experiment variables with
respect to the two taxonomies . . . . . . . . . . . . . . . . . . . . 106
5.1 Markup plus audio representation . . . . . . . . . . . . . . . . . 1125.2 Two representations for the same drum pattern using horizontal
rooted trees . . . . . . . . . . . . . . . . . . . . . . . . . . . . . . 1175.3 Bass/snare drum pattern represented as a vertical tree . . . . . . 1175.4 Loop represented as repetitions of the contracted subgraph . . . 1185.5 Illustration of the process of embedding a patch into another patch1205.6 Screenshots of the user interface of the prototype: a) edit panel
b) search panel c) composition panel . . . . . . . . . . . . . . . . 1235.7 Examples of a) using / b) not using nested structures . . . . . . 1255.8 Rules defined by the patches of 3 different users . . . . . . . . . . 1275.9 Repeated patterns found using VF2 . . . . . . . . . . . . . . . . 1285.10 Number of identified subgraphs as a function of the lexical gen-
erality level for different graph sizes . . . . . . . . . . . . . . . . 1295.11 Frequent subgraphs identified by Subdue with minsize=4 . . . . 130

List of Tables
3.1 Datasets used for evaluation . . . . . . . . . . . . . . . . . . . . . 53
3.2 Jaccard distance of different onset detection functions with theground truth segmentation . . . . . . . . . . . . . . . . . . . . . 63
4.1 Variables obtained from the experiment . . . . . . . . . . . . . . 87
4.2 Themes and classification criteria followed by users extractedfrom the questionnaire and paper notes (italics indicate verbatimquotes) . . . . . . . . . . . . . . . . . . . . . . . . . . . . . . . . 89
4.3 Regression analysis for cluster-level variables . . . . . . . . . . . 90
4.4 Results of the ANOVA tests with the cost variables and thebinary found variable . . . . . . . . . . . . . . . . . . . . . . . . 105
4.5 Results of the ANOVA tests with the relative change in variables 107
5.1 Clusters from sounds used in the experiment . . . . . . . . . . . 126
6.1 Global structure of the download network: Strongly ConnectedComponent (SCC), nodes with zero in-degree (IN) and nodeswith zero out-degree (OUT) . . . . . . . . . . . . . . . . . . . . . 142
6.2 Main properties of the download network (in parenthesis, valuesfor the equivalent ER graph) . . . . . . . . . . . . . . . . . . . . 143
6.3 Number of communities, modularity, entropy and average en-tropy of equivalent random partition in download network . . . . 144
6.4 Characteristic tags in communities of download network (prob-ability ratio) . . . . . . . . . . . . . . . . . . . . . . . . . . . . . 145
6.5 Main properties of the semantic network (values for the equiva-lent ER graph) . . . . . . . . . . . . . . . . . . . . . . . . . . . . 146
xviii
list of tables xix
6.6 Number of communities, modularity, entropy and average en-tropy of equivalent random partition in semantic network . . . . 146
6.7 Characteristic tags (probability ratio) in communities of seman-tic network (communities with less than 10 nodes are omitted) . 147
6.8 Confusion matrix: count of nodes in the detected communitiesof the download (rows) and semantic (columns) networks . . . . 148
6.9 Mean (standard deviation) of the described properties for thedifferent networks: degree correlation (dc), strength correlation(sc), modularity (m), clustering coefficient ratio(cc), efficiencyratio (ef), small-world coefficient (swc) and density (den) . . . . 149
6.10 Regression analysis coefficients for the downloads network. Sig-nificance codes: * (p < 0.5), **(p < 0.1), ***(p < 0.01) . . . . . 150
6.11 Regression analysis coefficients for the semantic network . . . . . 1506.12 Regression analysis coefficients for the shared interest network . 1516.13 Regression analysis coefficients for the forum network . . . . . . 151


Chapter 1
Introduction
Information and communication technologies keep rapidly transforming theway we create and enjoy music. Current usage patterns make it possibleto support online collective creation of music based on large-scale audiodatabases. This thesis aims to provide the computational framework tomodel and support this practice, making it available to people with themost diverse backgrounds.
1.1 Motivation
Our approach is motivated first in the current context of change in the socialhabits and structures related with music creation and appreciation. Second,we analyze the continued shift towards networked technologies, which re-flects in the increased support for connectivity in music creation tools. Inthis context, we consider the existing practice of sharing audio clips underCreative Commons (CC) licenses as an opportunity for supporting collabo-rative music creation based on information sharing.
1.1.1 Social context
During the last decades, the music business has changed dramatically. Therecording industry had emerged from technical advances that allowed musicto be recorded, packaged and distributed. These technological advances in-troduced many changes in how music was produced. For one, they changedthe distribution of roles in music production, introducing new ones such asthe producer or the engineer, and modifying the concept of authorship in
1

2 introduction
popular music. For another, they fostered the evolution of new forms of mu-sic that would not have been possible before, and radically changed existingones. In the same way, the evolution and adoption of new technologies,mainly the generalization of Internet access, rendered the business of physi-cal distribution of recorded music obsolete. While in the past cassette tapesallowed music listeners to duplicate and distribute music recordings, a turn-ing point occurred when home duplication of digital CDs became cheaper(and then much cheaper) than the acquisition of commercial copies. Oncemost people connected to the Internet, the cost of duplication of digital mu-sic files became virtually zero. Thus, business models that try to continuewith the idea of assigning a value to copies of the original recording aregenerally disappearing. At the same time, the renewed popularity of vinylsignals the loss in tangibility that music lovers have perceived in the newregime, which seems to indicate that the revolution has not finished.
It can be expected that these technology-driven changes will also result in anew distribution of roles in music creation, as well as in new forms of music.Given the large amount of people interested in music creation, the divisionbetween professionals and amateurs, which was mainly supported by thebusiness model of the recording industry, has become blurry. This changecan also be observed in other media, where participatory genres have be-come increasingly successful. Many television programs now involve and/orfocus on common people rather than professional actors or journalists. Inthis context, it may be expected that, in a foreseeable future, music pro-duction and music consumption will be more intermingled. As the audiencebecomes more active and participatory, an opportunity exists for music thatis no longer delivered as a finished product, but is created and appreciatedcollectively as it evolves. This idea can be seen as a (perhaps less solitary)reminiscence of Jaques Attali’s utopian concept of Composition, as the stage(network) that follows Repetition (the period dominated by the recordingindustry):
Finally, we can envision one last network, beyond exchange, inwhich music could be lived as composition, in other words, inwhich it would be performed for the musician’s own enjoyment,as self-communication, with no other goal than his own pleasure,as something fundamentally outside all communication, as self-transcendence, a solitary, egotistical, noncommercial act. In thisnetwork, what is heard by others would be a by-product of whatthe composer or interpreter wrote or performed for the sake of

1.1. motivation 3
hearing it, just as a book is never more than a by-product ofwhat the writer wrote for the sake of writing it. (Attali, 1985)
1.1.2 Technological context
The idea of using Internet connections to enhance collaboration in musicproduction is certainly not new. It has been tested in many ways both inengineering and artistic domains. During the 90s, Digital Audio Worksta-tions (DAWs) took over the task of recording and producing music, andhard disks replaced analog and digital tapes. The interface of these DAWscombined the “piano roll” interface, that had been used for editing MIDIscores, with the multi-track digital audio editor inspired by tapes. Virtualinstruments and effects could be added to each track, and an interface re-sembling hardware mixers was used for mixing tracks to the delivery format.This common environment allowed different levels of involvement with thepossibilities of computer music, from the recording and mixing of acous-tic instruments to music that was generated exclusively by computationalmeans. However, computer workstations were designed for a single user.When Internet connections became available, attempts to add connectiv-ity to DAWs were made, but failed to attract a significant user base. Anexample of it is the history of the company Rocket Networks1.
As Internet has become more and more prevalent in most people’s daily life,such attempts have re-emerged. Examples include the addition of networkedcollaboration to Ableton Live2, a very popular DAW for audio-based cre-ation, or the recently released Ohm studio3. One common feature of theseprograms is that they preserve the same interface and representation thatserved the single-user case. Social organization in collaborative DAWs isoften limited to having tracks contributed by different authors. Also, someof the mentioned programs can render sections to non-editable clips thatcan be shared. However, the general idea of enforcing tracks limits the pos-sibilities for sharing music fragments, for instance, by forcing that all effectsand instruments are assigned to a given track for the whole project. Thus,the notion of tracks perpetuates the division of labour inherited from tradi-tional instrument-based music, where each musician is expected to producea sound stream. In this thesis, we propose a greater emphasis on supportingmultiple hierarchical levels in music composition, allowing different levels of
1http://www.jamwith.us/about_us/rocket_history.shtml2http://www.ableton.com3http://http://www.ohmstudio.com

4 introduction
collaboration. Large-scale online information sharing and remixing (alsoknown as “peer production” (Benkler, 2006)) is a relatively recent practicethat has not been fully studied. Thus, our work does not focus on specificcollaboration workflows, but on algorithms and representations that can beused to support many different models of collaborative music creation.
Another trend has been the development of web-based music creation. Dur-ing many years, web browsers have been very limited with respect to audioand video, and relied on third-party plug-ins. The situation contrasts withthe level of standardization of HTML and Javascript, which supported therapid evolution of web application development. More recently, some func-tionality for low level audio processing (necessary for the development ofmusic creation applications) was added to the Adobe Flash platform. Amore comprehensive API for audio has been developed by the W3C stan-dards body during the development of this thesis, and an implementationis already available in several web browsers (Adenot et al., 2013). Thesedevelopments will allow leveraging the specific affordances of web applica-tions that have become prevalent (e.g. relying on shared storage, as well associal and collaborative functionalities) for music creation.
Finally the potential of smartphones and tablets for music creation hasgenerated great expectations. In these platforms, programs that rely onnetwork services behave similarly to web applications: interaction is oftendetermined by the rhythm of the HTTP requests and responses. Mobileapps take advantage of multi-touch screens and other sensors available incurrent smartphones. However, since it is generally simpler to sell client-only products, sharing is often limited to emailing your creations. In somecases, music creations can be shared through centralized storage, but thepossibility of remixing existing compositions is rare. Due to the limitationsin current mobile interfaces, mobile music applications are still regarded asmere toys by some users, but this situation is rapidly changing.
One important factor in the increased usage of Internet technology has beenreliance on centralized storage. In recent times, the storage aspect of “cloudcomputing” has become mainstream and accepted to some extent by a largeportion of computer (and especially smartphone and tablet) users. The op-position of centralized vs distributed (e.g. peer-to-peer) storage can be seenas a political one. This is especially true when centralized storage givesone party (typically a big company) the power to control and leverage thedata. However, few people doubt about the need of centralized storage formany applications, especially for sharing data asynchronously. It would be
1.1. motivation 5
very difficult to imagine the world today without commodities such as websearch engines. In this thesis, we focus on a specific model of centralizedstorage inspired by CC licenses, as implemented in Freesound. This site,created in 2005 in the context of the International Computer Music Con-ference (ICMC) has grown to become perhaps the most popular source ofaudio clips for music and media creators. Users from around the worldupload recordings of the most diverse kind, along with textual descriptionsthat allow other users to easily find any sound they can imagine. Freesoundwas developed and keeps to be maintained at the Music Technology Groupof Universitat Pompeu Fabra, where this thesis has been developed. Thecommunity of the site has always been at the center of any policy, and usersretain the intellectual property of the content they upload (as per the CClicense). It should be noted that many possibilities of social organizationexist for centralized storage technologies. Some centralized resources suchas web forums, emerge in a bottom-up fashion, and some achieve very largescales. Others are supported by start-up or established companies. Largeaudio repositories can also be used privately by music groups or collectives.
Our point of departure is then a large, shared database of audio clips. Inthis thesis we propose algorithms and data representations that allow ex-ploring the possibilities of such resource for collective music creation. Per-haps the most useful developments that can be exploited for this purposecome from Information Retrieval, and particularly Audio Information Re-trieval. However, the focus on music creation requires attention to manyaspects that are not usually considered in this discipline. We will then use amultidisciplinary approach, with inputs from Human-Computer Interaction,Computer Music, and Computational Creativity research.
1.1.3 Audio as music material
The idea of using recordings as material for music creation was formu-lated by many artists and composers shortly after the popularization of thephonograph. As an example, hungarian artist Lazslo Moholy-Nagy specu-lated about producing music by direct inscription on wax discs as early as1922 (Cox and Warner, 2004). Shortly after, in 1932, Rudolph Pfenningerhad developed a technique for drawing sound waves on film (Levin, 2003).In 1936, Rudolph Amheim wrote:
The rediscovery of the musicality of sound in noise and in lan-guage, and the reunification of music, noise and language in or-

6 introduction
der to obtain a unity of material: that is one of the chief artistictasks of radio (Battier, 2007).
The actual implementation of a music based on recordings is usually at-tributed to Pierre Schaeffer and the development of Musique Concrete. Bycutting and splicing magnetic tape, the idea of making music out of existingrecordings became practical. However, as demonstrated by Schaefer’s writ-ings, a systematic account of the new possibilities comparable to existingmusical theory proved to be a complex issue (Chion, 1983).
Perhaps the most characteristic aspect of making music with existing record-ings is that, unlike with other electronic means, such as synthesizers, onedeals with a rigid medium, which tends to preserve its own acoustic quali-ties. At the same time, the recording affords the perception of a “unity ofmaterial”, which allows thinking of music as a discourse, not unlike text or,nowadays, digital video4. The specific affordances and constraints of au-dio as a material have characterized many musical genres, such as hip-hopor plunderphonics. With the evolution of digital technologies, audio sam-pling has become just another tool in the palette of the electronic musician.However, the use of audio keeps signaling a certain change with respect toauthorship and creativity. The different attitudes of musicians that facethe authorship dilemma in the use of recorded audio (particularly whenrecorded by someone else or including sounds produced by someone else)could be classified in the following categories:
• Solipsism: the musician refuses to use any work that is not producedby herself. This attitude can be associated to a romantic view ofcreativity, where the artist is a creator that produces music out ofnothing.
• Extreme transformations: the musician processes the samples up tothe point that the original would be impossible to recognize. Theresult can be considered her own work by the choice of the transfor-mations.
• Collage/citation: the use of recognizable samples with some degree ofmusical elaboration is accepted and the original author credited. Thisattitude is often associated with collage aesthetics.
4The idea of Remix as discourse has been recently investigated in the context of digitalhumanities (Navas, 2012)
1.2. aim of this thesis 7
• Anti-copyright activism: recognizable copyrighted music samples areused very explicitly as a way to criticize copyright law.
• Plagiarism: another author’s work is used without credit or publicity,sometimes as a way to obtain an economic benefit.
In the end, the use of audio affords, perhaps more than other music creationtechniques, a certain social perspective on musical creativity. A musicianusing a digital drum machine is effectively using a sample designed by some-one else. This can extend to more sophisticated presets in digital instru-ments. Thus, the difference between using a digital instrument and using asound downloaded from a website such as Freesound is not a difference inauthorship but merely a licensing issue.
1.2 Aim of this thesis
The concept of “Remix Culture” has been proposed notably, among others,by Lawrence Lessig as a framework that permits and encourages derivativeworks. With the design of CC licenses, Lessig provided the tools for suchculture to coexist with the current dominant culture, based on strict copy-right laws. In Remix (Lessig, 2008), the concept was generalized to the ideaof Read-Write (RW) culture, as opposed to Read-Only (RO) culture, andthe world wide web, as originally designed by Tim Berners-Lee for sharingtext documents, is described as an example of RW culture. Our aim isto help towards achieving a similar support for RW culture in the case ofaudio-based music.
Remix based on audio affords an inclusive framework, where very little back-ground is necessary in order to start being creative. This contrasts withclassical music training, where the student needs several years of trainingin order to be considered a valid interpreter of the work of established com-posers. While the democratization of composition may seem an aberrationto some, this idea is hardly new, and can be easily related to evolution ofpopular music. The perspective depends probably (once more) on what oneconsiders as “composition”:
In the Andaman Islands everyone composes songs, and childrenbegin to practice themselves in the art of composition when theyare still young. A man composes his as he cuts a canoe or a bowor as he paddles a canoe, singing it over softly to himself, until

8 introduction
he is satisfied with it. He then awaits an opportunity to sing itin public, and for this he has to wait for a dance. . . . He singshis song, and if it is successful he repeats it several times, andthereafter it becomes a part of his repertory. If the song is notsuccessful, the composer abandons it and does not repeat it.(Radcliffe-Brown, 1948) ap. (Attali, 1985)
Current practices in sharing recordings, such as in Freesound, provide anopportunity for online, audio-based, collective composition. An online com-munity dedicated to composing and sharing music creations can be seen asa Community of Practice (Lave and Wenger, 1991; Johnson, 2001), wherenovices progress by learning from experts based on a shared interest.
Our aim is then to use and adapt techniques from information retrieval tothe case of creative applications under this perspective. This includes differ-ent levels of musical elaboration, as well as user information. Particularlywe distinguish three levels of information:
• Sound objects are samples that can be used as musical building blocks.
• Music fragments are, in the context of this thesis, groups of soundobjects organized using some specific computational representation.
• Music creation communities are groups of users who create and sharesounds and music fragments.
1.3 Thesis outline
The structure of this thesis follows the different kinds of information re-quired for the aim of supporting online remix communities.
Chapter 2 reviews existing literature related with the aims of the thesis.First, it introduces the field of network music, with an emphasis on the webas a music creation platform. After an introduction to audio clip databasesit summarizes relevant developments in audio retrieval that are relevantin order to leveragie these platforms for online music creation. Then itdiscusses existing approaches to music representation in computers, withan emphasis on grammars and support for nested structures. The chapterends with a review of some models of collective creativity that have appearedin different domains.

1.3. thesis outline 9
In Chapter 3, we describe several approaches for indexing and retrievalof different kinds of audio samples. We deal specifically with the case of“unstructured” data, this is, audio data accumulated collectively without apredefined editorial process. We analyze representations based on analysisof the audio spectrum, and their summarization for dealing with the threemain kinds of recordings that can be found in online databases: long fieldrecordings, sound events and musical loops.
In Chapter 4, we describe both supervised and unsupervised machine learn-ing approaches that can automatically produce taxonomical organizationsof sounds with little or no textual information about what they contain.The described technologies can be used for leveraging large audio databasesin online music creation.
In Chapter 5, we propose a representation for music artifacts as assemblagesof audio samples, suitable for analysis and generation of music in web envi-ronments. We describe the framework of graph grammars as the foundationfor this representation, and the algorithms that can be used for detectingfrequent patterns.
In Chapter 6 we describe initial work towards designing for collective cre-ativity in communities of practice based on sharing audio. We present astudy based on the Freesound community that demonstrates the potentialof complex network analysis for understanding the creative outcome of acommunity. We propose automatic measures derived from computationalcreativity models as guidance for the design and evaluation of softwareintended to support music creation communities, and show they can bepredicted by analyzing their activities.
Chapter 7 concludes with some reflections about the potential and chal-lenges involved in the proposed use case, and enumerates the novel contri-butions of this thesis.


Chapter 2
Background
2.1 Overview
The aim of supporting collective music creation on the basis of shared audiorequires input from a number of disciplines. This chapter reviews prior workthat is relevant for this purpose.
Online music creation can be seen as a form of network music, a field thathas been investigated over the last decades. We start by introducing networkmusic and reviewing prior work on web-based music creation.
We then focus on the potential of large audio databases originated fromthe established practice of sharing audio clips. The first requirement isthen finding suitable sounds. We consider developments in content-basedaudio retrieval, which affords intuitive, non-verbal interaction with audiodatabases.
Storage and retrieval of musical artifacts based on those sounds should bebased on some computational representation. We briefly review some rep-resentations relevant to our project that have been proposed in the contextof computer music composition and musicological analysis.
Finally, we consider the challenge of designing systems for collective usage.Such systems require the specification of collective goals, as individual goalscan be different and conflicting. We propose the notion of collective creativ-ity, and describe some models that have been proposed for understandingsuch a complex process.
11

12 background
2.2 Network and web music
Network music is a small research area in computer music, which encom-passes efforts to use computer networks in music creation. This work startedas soon as it was feasible to set up a computer network on stage. Barbosa(2006) surveyed the field and proposed a classification space employed bythe Computer-Supported Cooperative Work (CSCW) community to clas-sify different works, according to the type of interaction (synchronous orasynchronous) and the spatial proximity (co-located vs remote interaction).Another classification was proposed by Weinberg (2005) depending on thelevel of interconnectivity. Rohrhuber (2007) distinguished two main modesof sharing information: shared objects vs distributed objects.
In practice, a broad distinction can be traced between networked music per-formance (potentially at different levels of improvisation) and networkedcreation. Most work has been done in the former problem, mostly froman artistic perspective, including co-located performers (e.g. laptop ensem-bles) and remote performers (often using general purpose video-conferencingsoftware). Technically speaking, both synchronous and asynchronous inter-action can be (and are) used in a performance.
In this thesis, we focus on the possibilities of the web as a platform fornetworked music creation. Web technologies afford concurrent interactionwith large quantities of data in an asynchronous framework involving usersfrom different locations and time zones. In this context, the border betweenperformance and creation can be sometimes difficult to draw, particularly inprojects where there is no more audience than the performers themselves. Inpractical terms, we can associate performance with quasi-synchronous inter-action, when participants need to be using the system at the same absolutetime. In the case of web-based environments this is necessarily an approx-imation, given the potentially long latencies and inherently asynchronoustechnologies. In turn, when participants are not required to interact at thesame time, we can think of the system as a composition tool, allowing theuser more time for thinking, revising and evolving a musical artifact beforeothers have the chance to listen to it. However, because of the potentialfor conceptual continuity between both cases, it is worth to review previouswork in both areas.

2.2. network and web music 13
2.2.1 Web-based music performance
Web browsers are an atypical tool for music performance, but even more inthe case of public performances. Many projects have explored performanceon web environments, most of the time relaxing the requirement for strictsynchronization, which often results in “jamming” style interfaces. Mostof the systems are more oriented towards the collective experience of theperformers than to public performances.
TransJam (Burk, 2000) is an early example of a web-based architecture.A generic http server allows multiple applications, each one is assigned avirtual room with chat capabilities. Applications make use of the Jsynjava library so they can be embedded in web pages as applets. An exampleapplication is webdrum, a drum sequencer that can be edited collaborativelyin real-time. Also using transjam, auracle (Freeman et al., 2005) allowscasual web users to control the music generation with their voice.
In DaisyPhone (Bryan-Kinns, 2004), a music loop is shared among par-ticipants who collectively add and remove notes with a choice of four dif-ferent timbres. The initial project stressed HCI concepts such as localiza-tion, mutual awareness, mutual modifiability and shared representation. Ithas later been used to investigate decay (contributions of users that fadeover time) (Bryan-Kinns and Healey, 2006) and mutual engagement (Bryan-Kinns, 2012).
In Jam On (Rosselet and Renaud, 2013) remote performers with no assumedmusic background interact asynchronously in real time by drawing lines ona canvas. Lines and their updates are distributed to HTML5 clients by aserver.
2.2.2 Web-based music creation
While web-based performance usually relies on servers that support real-time messaging between clients, in web-based creation the role of the serveris extended to storing the productions of users, which can then be re-usedin collaborative workflows. Approaches to using the web as a platform formusic creation can be drawn on in two main groups: on one hand, some com-posers have become interested in the web for involving web users in theirown open compositions. Examples of this include William Duckworth’sCathedral (Duckworth, 2005), or Jason Freeman’s Graph Theory (Freeman,2008). Other projects have focused on analyzing the potential for collabo-ration in a more open setting. These are more related to the goal of this

14 background
thesis. However, the number of projects reported in an academic context isscarce.
FaustMusicOnline (Jorda and Wust, 2001) was a pioneer project which ex-plored collective composition over internet in 2001. An emphasis was put onallowing casual internet users and enforcing collaboration. The project wasbased on a native browser plug-in that allowed music creation by graphicalinteraction with a set of virtual vibrating strings. Compositions could beevolved from others, and a composition tree was used to store and browsethe available compositions.
The CODES project (Miletto et al., 2005) proposed the concept of MusicPrototype, an analogy of music with software prototyping that aims at facili-tating music creation for people with different musical backgrounds throughcollaboration. Through the analogy with software development, several fea-tures that improve collaboration were imported, such as revision historiesand logs. The system has been further used to understand how to supportnovices in music creation (Miletto et al., 2011).
CC-Remix and Malleable Mobile music (Tanaka et al., 2005) were twoprojects that explored the potential for bridging between music receptionand social creativity using CC licenses. The first project was a web appli-cation that allowed a group of up to four users to engage in a collectiveremix session by choosing among previously segmented loops of a collectionof CC-licensed songs. In the second project, the possibilities of portable de-vices for social interaction were explored, along with their sensors as sourcesfor music control. Online chats were used to allow users forming groups.Content generation was also based on re-organization of segmented songs.The authors enumerate several HCI design concepts for analysis and eval-uation of collective music creation: shared goals, reciprocity, engagement,awareness and belonging.
2.3 Freesound and audio clip sharing
Community-driven databases for sharing audio clips have become a resourcewith great potential for online music making. As an example, Freesound1
now provides an HTTP API available to developers for accessing a largedatabase of sounds, currently holding more than 200.000 audio files. Thenumber of usable sounds could grow into much larger numbers if we consider
1http://freesound.org

2.4. content-based audio retrieval 15
existing methods for audio segmentation, such as the one we describe inchapter 3. On the other hand, the diversity that results from the activity ofusers around the world would be very difficult to achieve by other means.Other sites where one can find Creative Commons (CC) or royalty-freesamples include Looperman2 or Soundsnap3. Since the promotion of the CClicenses, sites like CC-mixter4 or indaba-music5 have focused on enablingcollaboration mainly through sharing audio tracks. As we have mentioned,this can be seen as a direct affordance of the multi-track audio editor/sequencer interface for traditional music workflows. However, the potentialfor applying existing research on content-based audio retrieval to this kindof resources remains largely unexplored.
2.4 Content-based audio retrieval
The concept or content-based audio retrieval can be seen as a general termencompassing different developments related with audio signals sharing acommon framework. The objective is being able to find relevant audio filesfor a given task. To this aim, the audio signal is analyzed for obtainingmeaningful representations. This process can be seen as “recognition” ofhigh level concepts in the raw signal. In this sense, many of the develop-ments in audio retrieval can be traced back to work on representation ofspeech signals, either for Automatic Speech Recognition (ASR) (Rabinerand Juang, 1993), speaker identification or even coding and transmission.Another field that has greatly developed audio recognition is content-basedMusic Information Retrieval (MIR) (Casey et al., 2008), usually dealingwith polyphonic music signals available to consumers. On the other hand,indexing or recognition of environmental sounds can be seen from the pointof view of Computational Auditory Scene Analysis (CASA) (Brown andCooke, 1994). In the end, CASA can be seen as the most general case,as auditory scenes can contain any type of sound including environmentalsounds, music and speech. In this thesis, we deal with the type of soundsthat are most commonly shared for re-using, as opposed to files containingfinished music or long speeches. This was the principle behind sites likeFreesound, where finished songs are explicitly discouraged. The sounds inthis site are still widely diverse, and a very general approach is necessary.
2http://www.looperman.com3http://www.soundsnap.com4http://ccmixter.org5http://www.indabamusic.com

16 background
In this section, we analyze prior work dealing with three main classes ofsounds, which can be associated with established practices in audio-basedmusic creation. Long recordings are frequently used in soundscape composi-tion. From a perceptual point of view, these recordings can be regarded asauditory scenes. Events occurring in such recordings, and all sorts of shortrecordings of any kind of sounds, can be related to the practice of samplingand musique concrete. Finally, it is very common to share music loops.Music loops can of course be seen as auditory scenes composed of manymusical events, but we will consider them separately in order to account fortheir specific musical features.
2.4.1 Sound scenes
Since the popularization of flash-based digital recorders, obtaining reason-able quality recordings of environmental sounds has become easy and afford-able. Thus, it is not surprising that long field recordings are among the mostcommon type of audio files shared in sites like Freesound. From a music cre-ation perspective, such recordings can be used in soundscape composition, amusical practice originated by Murray Schafer (Schafer, 1977) influenced byacoustic ecology. Soundscapes can be used for acousmatic music, but alsoin narrative or interactive audiovisual content such as video games, vir-tual environments, or movies. From a CASA perspective, such recordingswould be defined as auditory scenes where several sound sources are usu-ally combined into one perceptual stream or, sometimes, into a backgroundand foreground. In recent times, research efforts on recognition of audi-tory scenes have grown, mostly inspired by potential applications in mobileplatforms. Two tasks can be broadly identified across different applicationsand fields: one is the segmentation of long recordings into consistent scenes,and the other is the classification of scenes into distinct categories. Seg-mentation of long recordings into distinct scenes as been analyzed mainlyin the context of movies and TV (Cai, 2005), and personal logs (Ellis andLee, 2006). In this thesis, we focus on recordings that are shared by inter-net users, and assume a minimal manual segmentation to produce alreadyconsistent scenes.
The idea of classifying scenes into discrete categories has met growing in-terest with potential applications in robotics (Chu et al., 2006) and ubiq-uitous computing (Eronen et al., 2006). Most approaches can be classifiedin two groups: in the first case, some descriptors are computed from theaudio signal using short overlapping windows. The most common are Mel

2.4. content-based audio retrieval 17
Frequency Cepstral Coefficients (MFCCs), which aim at capturing the spec-tral envelope in a compact way to approximate timbre sensations. Then,some statistical model is trained directly from the frame-level features. Onehelpful assumption is that scenes are mainly stationary signals, since theiridentification does not rely so much on long-term temporal evolution of au-dio features. Thus, in this case Gaussian Mixture Models (GMMs) are acommon choice (Aucouturier et al., 2007) (Dargie, 2009). Low-order HiddenMarkov Models (which become a GMM in the single-state case) have alsobeen used (Eronen et al., 2006). The second approach consists in summariz-ing the entire recording into a single feature vector, and training the classi-fication model with these vectors. Again, given the stationarity assumptionit is common to use simple statistics of MFCC features. Support Vector Ma-chines (SVM), K-Nearest neighbor (KNN) and GMMs are popular choicesfor the classification model (Chu et al., 2006). Other than traditional MFCCfeatures, promising results (although very different depending on the class)have been obtained with matching-pursuit features (Chu et al., 2009), how-ever, their computational cost may make them unpractical in the context oflarge audio databases. Methods based on vector-quantization of frame-leveldescriptors have also been tried in the context of consumer videos (Lee andEllis, 2010).
One general problem in comparing different methods is the lack of com-mon datasets and benchmarks. During the development of this thesis,the AASP D-CASE challenge (Giannoulis et al., 2013) was proposed andconducted for benchmarking different methods for recognition of auditoryscenes and events. The baseline system proposed by the organisers wasbased on MFCCs and a frame-level GMM classifier, while systems withbest performance used SVMs. The best score was achieved by our system(described in chapter 3) using a novel set of features for summarizing theevolution of MFCCs in intermediate windows of 400ms. Another approachachieved similar performance using a wavelet variant of MFCCs and otherfeatures averaged over windows of 4s, with an extra classifier to decidefor the class of the whole recording (Geiger et al., 2013). Such intermedi-ate “texture windows” are commonly used in MIR (Tzanetakis and Cook,2002).
2.4.2 Sound Events
Zooming into scenes, we can decompose them into background and soundevents. Sound is always the result of an interaction between objects or ma-

18 background
terials, and conveys information about some physical event (Gaver, 1993).Since the first experiments of Pierre Schaeffer, the idea of a “Sound Object”was central to the theory of Musique Concrete. However, it is difficult tofind a clear definition in Schaeffer’s work. At one point, the sound objectsis simply defined as an “energetic event” (Schaeffer, 1966). From an acous-tic ecology point of view, the distinction between background and eventswas proposed by Schafer (Schafer, 1977). The distinction has also beensupported from experimental psychology (Guastavino, 2007). In CASAit is also customary to distinguish between auditory scenes and auditoryevents, the later being related with the theory of auditory streams (Breg-man, 1994). Here, the problem is understanding how do we group simpleelements resulting from the analysis of our hearing system, such as har-monic structures, clicks and modulations, so that they represent distinctevents. This process is influenced by subjective learning, which makes itdifficult to define precisely what is an auditory event. However, in practiceshort samples representing different “sounds” have been used for many ap-plications. Intuitively, the idea of “a sound” can be related with a certainaction performed on a resonant object, such as a musical instrument. Thus,sound events can often be recognized by a consistent spectral pattern anda time-varying energy envelope.
Like in the case of field recordings, two main tasks can be identified: de-tection of events and classification into discrete categories. In the case ofsound events, both tasks can be carried on simultaneously. However, inthis thesis, we will look at both tasks separately. The advantage is thatthis allows unsupervised indexing of segmented but unidentified events, i.e.,finding consistent groups of sounds that can be used in the context of musiccreation, even if no labels are available. Joint detection and classification isusually done either using HMMs, or running a generic classifier such as anSVM over sliding windows (Xu et al., 2003).
The task of segmentation, this is, finding the location of sound events inlonger recordings, has been approached from several disciplines. In speechrecognition, effective techniques have been developed for Voice Activity De-tection (VAD) (Ramirez et al., 2007), which have many applications incommunication technologies. In MIR, a long tradition exists for the de-tection of either pitched or percussive events. From the perspective of en-vironmental sound, systems have been developed for applications such assurveillance (Clavel et al., 2005), or indexing of video content (Xu et al.,2003). An important issue is whether the system can detect sound eventsthat overlap in time. Literature on detection of overlapping events is scarce,

2.4. content-based audio retrieval 19
as this is a much more complex problem. In the context of this thesis, we as-sume non-overlapping events, on the basis that multiple simultaneous events(such as e.g. musical chords) can be usefully considered as individual soundobjects for music creation.
The task of classification of sound events can be traced back to early ex-periments with audio indexing, mainly in the context of sound effects li-braries. Initial works focused on small datasets assigned to a handful ofconcepts (Wold et al., 1996). Very high classification accuracies were ob-tained using HMMs (Zhang and Kuo, 1999). For larger scales, it is morecommon to aggregate features at the file level and use generic machine learn-ing models. For example, statistics of a large set of features have been usedalong with K-NN classifiers for large scale applications (Cano et al., 2005).While SVMs are perhaps the most established generic classifiers, some con-cerns have been raised about their cost. For very large scales, this can bemitigated by using sparse features and linear kernels. Vector quantizationcan be a simple yet effective way to obtain such sparse features (Chechiket al., 2008) (Lee and Ellis, 2010).
Most of the described approaches are supervised, this is, aimed at recog-nizing pre-specified classes of events. Some work has been devoted to theproblem of unsupervised discovery of short sound clips. In this case, mostprojects explored the use of Self-Organizing Maps (SOM) for clustering andpresenting large collections of sounds. For example Pampalk et al. (2004)used a SOM for visualizing drum sample collections. An application to mu-sic files was described in (Pampalk et al., 2002). In (Brazil et al., 2002) asystem for browsing sound effects using SOMs is described.
Finally, an important body of work has dealt with music creation usinglarge databases of small audio fragments, in the tradition of corpus-basedoncatenative synthesis (Schwarz, 2007) and musical mosaicing (Zils and Pa-chet, 2001). These systems work by defining a target sound or score, orany data that can be described as a sequence of audio descriptors, andretrieve an optimal sequence to reconstruct the target from a database ofsound segments. Segmentation is usually done either by fix intervals (usu-ally short segments in the tradition of granular synthesis), score alignmentor note onset detection. The problem of finding the optimal sequence ofunits (samples in the database) that match the target as closely as possible,is seen as a Constraint Satisfaction Problem (CSP). Although the originalapplication was realistic instrument and voice synthesis, many approacheshave been described for real-time operation (Schwarz et al., 2007). Ulti-

20 background
mately, the corpus-based paradigm affords a general perspective on the useof audio as a material for music (Schwarz, 2006).
2.4.3 Music loops
Music loops are very popular for music creation in many genres. During the1990s a market emerged for CDs of audio loops. Currently, online stores forDJs such as Beatport6 offer catalogs of loop packs. Community-supportedsites like Looperman or Freesound also contain thousands of loops. Litera-ture on indexing and retrieval of loops is, however, relatively scarce. Oncemore, we can distinguish between the task of identifying loops, and indexingthem for retrieval.
With respect to identification of music loops, there has been work on theisolation of loops in polyphonic music (Ong and Streich, 2008). Here, fre-quently repeated patterns in music files are identified through the autocorre-lation of chroma features. Detection of loops in polyphonic music, however,is a different problem from indexing databases of (already cut) loop files.The former is more related to music structure and to an interpretation ofwhat constitutes a “relevant” loop in the context of repetitive music, al-though from a practical point of view, an infinite number of loops couldbe extracted from the same track. In this thesis, we deal with sound clipswhich may have been cut as loops or not. Our problem, then, is identifyloopable material in the context of unstructured and possibly unlabeleddata. This opens the possibility to find rhythmic patterns in all kinds ofsounds, including environmental sound recordings.
Some works have explored indexing and retrieval of music loops. Au-diocycle (Dupont et al., 2009) was a prototype that implemented analy-sis of musical loops, restricted to 4/4 rhythm meters and specific instru-ment classes. Although the dataset size is not explained, scaling to largedatabases is reported as future work. Other projects have focused specif-ically on drum loops, which affords a transcription approach (Gillet andRichard, 2004). Most of the mentioned works describe some kind of in-terface, either by using information visualization techniques to map thesounds to a 2D plane (Dupont et al., 2009; Ong and Streich, 2008) or us-ing a Query-by-Example(QbE) approach (Kapur, 2004; Gillet and Richard,2005). In general, research on indexing and retrieval of music loops lackspublic datasets and evaluation metrics that facilitate comparison of differentapproaches.
6http://www.beatport.com

2.5. music representation 21
2.5 Music representation
The idea of music representation can be linked primitively to the need ofmemorizing music. In this sense, several cultures developed music notationsystems in parallel to writing. These notations abstract and encode themusic experience, and need to be interpreted by a performer. In a similarway, the phonograph and the magnetic tape provided more accurate waysof storing and reproducing music. Computers allow for many different waysof representing music.
In the 1990s, the issue of music representation on computers was extensivelyresearched. Wiggins et al. (1993) surveyed the field while proposing anevaluation framework based on two dimensions: expressive completeness(where ultimately the most complete representation would be the waveform)and structural generality, which is better achieved by symbolic notations.Dannemberg (Dannenberg, 1993) surveyed a number of issues related withrepresentation of different aspects of music. Here, waveform and symbolicrepresentations such as scores are viewed as different abstraction levels, eachone containing different information.
With the popularization of music programming languages, a general distinc-tion can be made between “process-oriented” representations, i.e. when thecomputer program is itself a music piece, and “data-oriented” representa-tions, when the musical information is encoded in some data structure thatthe program will use. In this thesis, we focus on on data-oriented represen-tations, under the assumption that, as a natural fit for audio-based musicthey can lead to simple and easily understandable tools for casual web usersthat leverage the potential of large-scale audio databases.
2.5.1 Hierarchical representations and music grammars
Music often contains repetitions and hierarchical structures or groupings.Representation of these aspects is particularly required for enabling differentparticipants to collaborate in the creation process. The simplest represen-tation used for audio-based music creation, a list of time-stamped events,contains no hierarchy. Therefore, it stores no information on the differentparts that may form a musical composition, including e.g. repeated partsor motifs. The piano-roll representation used in most audio sequencers canbe considered as a collection of event lists. Thus, hierarchical informationis limited to distinguishing between parallel tracks. A representation that

22 background
includes hierarchical information can be used for analyzing music pieces inaddition to composition (Smaill et al., 1993).
Representation of hierarchical relationships is especially important for sup-porting collaborative creation, which requires division of labor and the ex-change of parts of a musical composition. In this sense, many hierarchicalrepresentations have been proposed based on formal grammars. Formalgrammars were introduced by Noam Chomsky in the 1950’s as a meansfor formal analysis of natural language (Chomsky, 1957). The view ofgrammars as mathematical devices has since then remained at the foun-dation of formal languages and computer science. From the point of viewof linguistics it was an important revolution that introduced a generativeperspective: grammars served as language theories that could explain andpredict linguistic phenomena by generating them from a formally definedset of laws. Chomsky classified grammars into four classes according tothe level of restriction and generative power, from the most comprehensivetype 0 (unrestricted), to the smallest subclass, type 3, which can parse onlyregular languages. Context-free grammars (type 2) are the basis of mostprogramming languages, including those used to create music. In the 1970sand 1980s, the idea of modeling music with grammars became very popular.In web environments, traditionally with limited interaction capabilities butwith access to shared data storage, analysis and generation can be used forcomputer-aided composition. Thus, reviewing these classic works can shednew light on the design of systems for representing sample-based music inweb environments.
One of the first documented efforts to use formal grammars in music com-position is due to researcher and composer Curtis Roads. In ComposingGrammars (Roads, 1978) he described a system for music composition basedon context-free grammars augmented with control procedures. The systemprovided the composer with a workflow for experimenting with structuraland semantic aspects of composition. First, the composer would specifya grammar using a specialized language (Tree) and an associated compiler(Gram). The program would generate a compiler for the specified grammar.The composer would then work on valid derivations according to the gram-mar to create the “syntactic surface”. A second language (CoTree), andits corresponding compiler (GnGram), would aid in the generation of thescore. A final task, the “lexical mapping”, consisted in pairing the termi-nals of the grammar with sound objects previously created by the composer.Such amount of relatively low-level tasks reflects the kind of interaction thatcomputers supported at that time. Still, the use of concrete sound objects

2.5. music representation 23
and focus on nested structures makes this pioneering work relevant in thecontext of this thesis, so we will adopt part of this terminology.
In Grammars as representations for music, Roads and Wieneke (1979) pre-sented a synthesis of formal grammar theory and surveyed the use of gram-mars for music analysis. Perhaps more importantly, they summarized thepowers and limitations of the grammar approach. Considering iconic (i.e.based on analogies) and symbolic (based on convention) representations, itis quite obvious that, as symbolic representations, grammars rely on a dis-cretization of the sound material. This limitation is however less restrictivefor compositional purposes (where discrete symbols can be associated toarbitrary sounds) than for analysis of existing audio. A second limitation isthe compromise in complexity, as the most complex types of grammars areoften too complex to parse, while simple grammars can be too trivial andless effective than other models. A third limitation is that grammars arepurely structural and hence they don’t deal with the semantic and socialimplications of music. Despite these limitations, grammars have continuedto be used in a number of computer music projects and studies, both foranalysis and generation. Perhaps the best known is the system developedby Jackendoff and Lerdahl for the analysis of tonal music (Jackendoff andLerdahl, 1981).
Holtzman’s Generative Grammar Definition Language (GGDL) was devel-oped as a tool for investigation of structural aspects of music using a com-puter (Holtzman, 1980). The language could be used both by composersand musicologists. GGDL supported “phrase structure rules” (standardstring rewriting rules) and “transformational rules” (transformations suchas transposition or inversion). It also provided a means for mapping ab-stract symbols to actual sounds synthesized with the possibilities offered bycomputers of the time. The system focused on unrestricted (type 0) gram-mars, and as a consequence it encouraged manual experimentation, offeringlimited automation capabilities.
Kippen and Bel’s development of the Bol processor system (Bel and Kip-pen, 1992) has been extensively documented along different phases. Thesystem was originally conceived for linguistic analysis of north-indian tablamusic, where bol mnemonic syllables are used. Tabla music is usually im-provised, typically involving permutations of a reference pattern. Expertmusicians can assess whether a given permutation is correct or not. On thisbasis, the authors tailored several formal grammars that reflected correctvariations. A second iteration of the Bol processor, named BP2 targeted

24 background
grammar-based music composition from a more general perspective, allow-ing composers to specify their grammars to generate compositions with ar-bitrary sound objects. Because of this focus on composition, BP2 omittedthe parser mechanism and allowed a more free approach to grammar spec-ification, subordinating the issue of correctness to aesthetic considerations.
Finally, one of the most well-known uses of grammars for music compositionis David Cope’s Experiments in Music Intelligence (EMI) (Cope, 2004).Over the years, Cope has refined a database-driven system that imitates thecompositional style of classic composers. The works of the target composersare segmented and described in a database, and each fragment is assignedto a category according to a system called SPEAC: Statement, Preparation,Extension, Antecedent and Consequent. Such categories attempt to definea basic formalization of the dynamics of tension and relaxation in westerntonal music. Thus, the system defines a set of rules that make a sequenceof patterns of different categories correct. The music generation engine isbased on an Augmented Transition Network (Woods, 1970), which allowsfor faster parsing and generation of context-sensitive rules.
In more recent times, many projects have explored the application of L-Systems (Lindenmayer, 1968) to music generation. L-Systems are formalgrammars where the derivation is done in parallel (i.e. derivation rules areapplied to a string of symbols simultaneously, so not taking into accounttheir respective outputs). This feature was originally used to model thegrowth of algae, and has since been applied to the generation of realis-tic fractal images of different kinds of plants (Prusinkiewicz and Linden-mayer, 1996). Initial applications to music were based on these graphicalinterpretations, applied to scores (Prusinkiewicz, 1986). From there, mostwork has focused on how to interpret the strings produced by the algorithmto generate melodies or rhythms, either from pre-defined schemes (Worthand Stepney, 2005), interactive systems (McCormack, 1996) or evolutionarytechniques (Lourenco et al., 2009) (Kaliakatsos-Papakostas et al., 2012).
2.5.2 Representations for the web
As more and more people got connected to the Internet, interest has grownon music representations that support the exchange of music information.After the success of HTML as the base language of the web, eXtensibleMarkup Language (XML) was developed as a more general and formalmarkup language for exchanging information between different programsand web services. Many XML representations have been proposed for

2.6. models of creative communities 25
traditional western notation. Because of its hierarchical structure, musicscores can be represented naturally in XML as hierarchies. Popular ex-amples include MusicXML (Good, 2001) and Music Description Language(MDL) (Hewlett and Selfridge-Field, 2001). Still, there is a wide varietyof musical practices that cannot be represented with western notation. Anaudio-oriented representation can be used in some cases. For example, theMPEG-7 standard (Salembier and Sikora, 2002) included the definition ofthe Segment Descriptor Scheme (DS), a description scheme for multime-dia objects that allows defining them as compositions of segments. TheMPEG-7 Segment DS allows the definition of hierarchies and arbitrary re-lationships between media segments such as audio. Still, the standard ismore oriented to the description of existing content (e.g. for indexing andnavigation) than to the creation of the new content. On the other hand, thestandard addresses all kinds of multimedia content, including video, imagesand 3D. This generality adds a lot of overhead (which may be the cause thathas precluded the standard from being generally adopted) and introducesseveral complexity layers that are not needed for music composition.
In the last few years, JavaScript Object Notation (JSON) has gained pop-ularity as a simpler data representation for web applications, becoming thede-facto standard for JavaScript-centric applications. However, the use ofJSON has been less prone to standardization than in the case of XML. Asan example, MusicJSON, a JSON-based music representation has been pro-posed (Alvaro and Barros, 2012). Like MusicXML, MusicJSON focuses ontraditional western music notation. Another trend has been the develop-ment of javascript-based music programming languages that take advantageof the web audio API (Roberts and Kuchera-Morin, 2012).
2.6 Models of creative communities
Applications for supporting collaborative work need to deal with collectiveobjectives. The notion of collective creativity may be useful for modelingcommunities of online music creators and defining unified design criteria.Creativity is usually defined as the human ability to ‘create’ things thatare new and have some sort of relevance. Beyond this definition there isgenerally little agreement. A general trend is to consider at least two lev-els (personal and historical creativity) at which novelty and relevance areevaluated. Personal creativity refers to ideas that are new and interest-ing to their author, while historical creativity refers to ideas or productsthat are considered innovative by a larger audience (Boden, 2003). While

26 background
the traditional discourse focuses on individuals and their mental processes,some researchers have emphasized the social dimension of creativity (Csik-szentmihalyi, 1999) (Montuori and Purser, 1995). During the last decade,networks (mathematically formalized as graphs) have become widely usedfor formal analysis of social groups. Some researchers have analyzed collab-oration and social networks in an attempt of gaining a better understandingof collective creativity.
A common hypothesis is that small-world network structures favor creativ-ity and innovation (Cowan and Jonard, 2003). This idea has been testedempirically in different domains (Verspagen and Duysters, 2004) (Uzzi andSpiro, 2005) (Fleming et al., 2007). Small-world networks were formallydefined by Watts and Strogatz (Watts and Strogatz, 1998), who character-ized them as a crossover between a regular lattice (a graph where nodes areconnected uniformly) and a random graph (where nodes are connected witha certain probability). Their model captured a property of many real worldnetworks, where the average distance between any two nodes (computedfrom the shortest path length, i.e. the smallest number of edges connectingtwo given nodes) tends to be as low as in a random graph, while the clus-tering coefficient (in this case defined as the average of the fraction of nodeswithin the neighborhood of each node that are connected among them) ismuch higher. The general assumption when judging the small-world struc-ture is that short path lengths benefit innovation by allowing the flow ofinformation. The effects of high clustering are less obvious. Clustering isgenerally associated with the flow of redundant information, but also togrouping of similar agents which may improve collaboration (Cowan andJonard, 2003). When analyzing the network of teams that produced Broad-way musicals in the 50s, Uzzi and Spiro considered both short path lengthsand clustering to impact creativity following a U-shape, in the sense thatboth properties are beneficial up to a certain point, from which they becomedetrimental due to homogenization (Uzzi and Spiro, 2005). Here, clusteringis associated to the formation of conventions, and hence more related to therelevance than to the innovation component of creativity. A study basedon collaboration networks in a patent database (Fleming et al., 2007) foundno significant effect of clustering, and discussed the potential detrimentaleffects of clustering on innovation. A similar trend is observed for the inter-action between high clustering and short path length, which is only shownto have an impact when clustering is relevant.
While coming from very disparate domains, studies of network creativityseem to coincide in that small-world network properties, especially short

2.7. open issues 27
path lengths, have an influence in the development of creativity. This ideacan be used in the design of collaborative music creation applications basedon networks of collaborators. We further develop this idea in chapter 6.
2.7 Open issues
1
4
Audio�les
2Sound taxonomies
3
Onlineusers
Musicalartifacts
Figure 2.1: Elements involved in web-based music creation
In this chapter, we have reviewed existing research that is relevant for en-abling the web as a medium for music creation based on shared audio data.We now recap the main issues involved in this use case and how we will dealwith them in the following chapters (Figure 2.1).
The first problem is accessing audio databases. Content-based retrieval of-fers an opportunity for automatically indexing unstructured audio such aswhat we can currently find in sites like Freesound, without the need of man-ually labeling sound clips. In order to deal with general audio, this is, withany kind of recording that can be uploaded to a website, we consider threegeneral classes of sounds: field recordings, sound events, and music loops.Also, in order to deal with this uncertainty about the type of uploaded au-dio, we follow a generic approach with separate steps for feature extractionand indexing. Chapter 3 covers strategies for automatic description of eachof these three kinds of signals. In Chapter 4, we analyze generic strategiesfor indexing sounds based on these low-level descriptors.

28 background
A second problem is representing music during the creation process. In thecase of music based on audio, this involves defining sequences and superpo-sitions of audio clips. One open issue is how to represent different levels ofmusic structure in order to allow sharing intermediate music products. Wepropose a suitable representation in Chapter 5.
Finally, designing applications for collaborative music making at a largescale requires representing and understanding user communities. We explorethe notion of collective creativity as a global property that can be computedfrom data in existing audio sharing sites. In Chapter 6, we analyze how thisproperty can be related to measures computed from user networks, whichmay in turn be determined by the design of web applications.

Chapter 3
Audio description inunstructured data
3.1 Introduction
In this chapter we explore the automatic extraction of content-based de-scriptors from unstructured audio data. In Chapter 2 we have reviewedcontent-based audio retrieval and its potential for audio-based music cre-ation. By extracting low-level representations of audio signals, we can au-tomatically index audio recordings and interact with them based on theiracoustic properties, bypassing the need of manual annotation. This allowsapplications to integrate access to large audio repositories without breakingthe creative flow.
Perhaps the main problem with this idea in the case of user-driven applica-tions is the unstructured nature of the resulting database. Particularly inFreesound we can find almost any kind of recording that can be imagined.In order to deal with this diversity, we propose extracting a generic low-levelrepresentation that allows us to distinguish three main kinds of audio files:long field recordings, sound events and music loops. From the same low-leveldescriptor we can then adopt different strategies for obtaining summarizeddescriptions that can be used by indexing and retrieval algorithms.
Parts of this chapter have been published as (Roma et al., 2013)
29
30 audio description in unstructured data
3.2 Generic low-level description
Content-based audio retrieval relies on features computed from the sampledaudio signal. Many features have been devised in the ASR, CASA, and MIRliterature. Our aim is to work with completely unrestricted audio data,thus potentially containing music, speech, and environmental sounds. Thismeans that a generic low-level representation is needed in order to learn atleast what kind of sounds we are dealing with.
Probably the most common generic low-level representations are based onMel Frequency Cepstral Coefficients (MFCC). MFCCs were initially definedby Mermelstein (1976) citing ideas from Bridle and Brown (1974) in the1970s, in the context of ASR. However, they have also been extensively ap-plied in the classification and clustering of both music (as a representationof monophonic or polyphonic timbre) and environmental sounds. MFCCswere based on the Mel scale, a logarithmic map of frequency defined in 1937based on psychoacoustic experiments of pitch perception. While MFCCshave become standard in many disciplines, it is common to find low-levelfeatures inspired in more recent frequency scales. From a signal processingpoint of view, many of these proposals can be considered in the same frame-work defined by MFCCs. In this framework, a frequency domain, frame-level representation is first obtained from the Short-time Fourier Transform(STFT). This implies slicing the audio waveform into overlapping segmentsof equal length, to which a windowing function is applied for smoothing theboundary discontinuities. The length of the segment determines a trade-offbetween time and frequency resolution. The magnitude spectrum obtainedfrom the Fourier transform of the windowed segment (usually using the FastFourier Transform, FFT) is then quantized by passing it through a bank ofband-pass filters, with center frequencies distributed according to some per-ceptual scale. Applying the filter bank requires merely a multiplication inthe frequency domain. The result can already be used as an audio feature,which can be easily interpreted visually as a spectrogram. In order to im-prove the performance of further computations, Mermelstein introduced acompression step, by computing the log of the filtered magnitudes. Finally,the Discrete Cosine Transform (DCT) is computed in order to de-correlatethe log magnitudes. The result is defined as the cepstrum, which has theproperty of telling apart fast oscillations in the spectrum, usually associ-ated with pitch in the case of voiced sounds, from its envelope associatedwith timbre. Thus, the first DCT coefficient represents energy (DC of thespectrum), and successive ones represent progressively faster oscillations.

3.2. generic low-level description 31
A common configuration is taking the first 13 coefficients of a 40 bandsfilterbank. This representation of the spectral shape gives a very genericand efficient description of audio. The de-correlated features allow more ac-curate computation of distance measures, which are needed for most tasksrelated with indexing and retrieval. Several descriptors can be describedunder the MFCC framework depending on the frequency scale and shapeof the filters, and whether the raw filterbank or cepstral features are used.We now describe three commonly used approaches.
3.2.1 Mel Frequency Cepstral Coefficients
MFCCs were developed in Mermelstein’s original framework. The scaleused for the center frequencies of the filterbank is the Mel scale, which wasdeveloped from experiments involving judgments of distance among pitchedtones. These follow a logarithmic curve. While several formulas have beenproposed to approximate this scale, one of the most commonly used is:
fmel = 1127log(1 + f
700) (3.1)
The filters follow a triangular shape with centers uniformly spaced alongthe mel scale, reaching the max in its own center frequency and endingin the next one. Hence, in theory, bandwidth depends on the number offilters, although it can also modified by some factor. The triangles arecalculated to have either constant height or constant area. All of this can betrivially implemented from the result of the DFT. One advantage of MFCCsis that a plethora of implementations is available for any platform. At thesame time, these introduce many details and parameters that may have animpact depending on the task at hand. For example, the rastamat matlabpackage (Ellis, 2005) used in our experiments can be used to reproduce theresults of several implementations. A comparative evaluation for the taskof speaker identification found small variations in results (Ganchev, 2005).As we have seen in Chapter 2, MFCCs are probably the most ubiquitousfeatures in speech, music and environmental sound recognition.
3.2.2 Bark bands
Another frequency scale, the Bark scale, was proposed by Zwicker, afterthe initial experiment by Fletcher defining critical bands of hearing (Fastland Zwicker, 2001). In short, such experiments determined the bandwidthat which a noise signal is able to mask a pure tone at a given frequency.
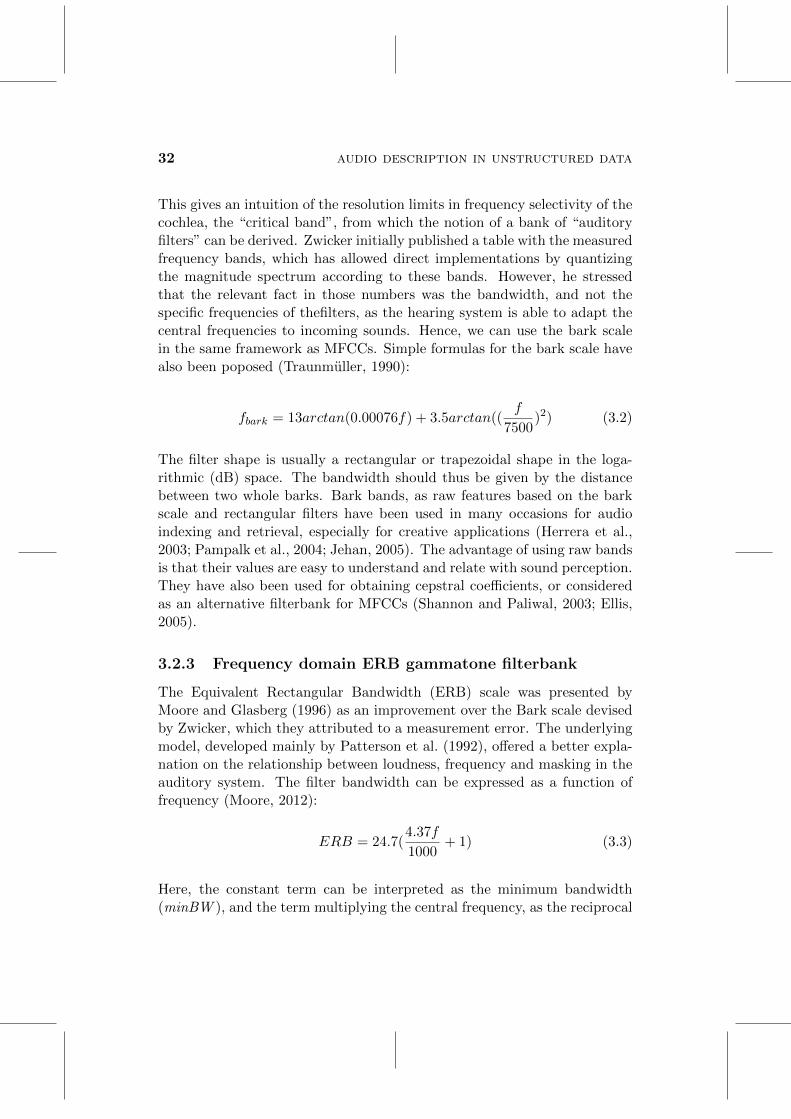
32 audio description in unstructured data
This gives an intuition of the resolution limits in frequency selectivity of thecochlea, the “critical band”, from which the notion of a bank of “auditoryfilters” can be derived. Zwicker initially published a table with the measuredfrequency bands, which has allowed direct implementations by quantizingthe magnitude spectrum according to these bands. However, he stressedthat the relevant fact in those numbers was the bandwidth, and not thespecific frequencies of thefilters, as the hearing system is able to adapt thecentral frequencies to incoming sounds. Hence, we can use the bark scalein the same framework as MFCCs. Simple formulas for the bark scale havealso been poposed (Traunmuller, 1990):
fbark = 13arctan(0.00076f) + 3.5arctan((f
7500)2) (3.2)
The filter shape is usually a rectangular or trapezoidal shape in the loga-rithmic (dB) space. The bandwidth should thus be given by the distancebetween two whole barks. Bark bands, as raw features based on the barkscale and rectangular filters have been used in many occasions for audioindexing and retrieval, especially for creative applications (Herrera et al.,2003; Pampalk et al., 2004; Jehan, 2005). The advantage of using raw bandsis that their values are easy to understand and relate with sound perception.They have also been used for obtaining cepstral coefficients, or consideredas an alternative filterbank for MFCCs (Shannon and Paliwal, 2003; Ellis,2005).
3.2.3 Frequency domain ERB gammatone filterbank
The Equivalent Rectangular Bandwidth (ERB) scale was presented byMoore and Glasberg (1996) as an improvement over the Bark scale devisedby Zwicker, which they attributed to a measurement error. The underlyingmodel, developed mainly by Patterson et al. (1992), offered a better expla-nation on the relationship between loudness, frequency and masking in theauditory system. The filter bandwidth can be expressed as a function offrequency (Moore, 2012):
ERB = 24.7(4.37f
1000+ 1) (3.3)
Here, the constant term can be interpreted as the minimum bandwidth(minBW ), and the term multiplying the central frequency, as the reciprocal

3.3. feature aggregation 33
of the auditory filter’s Q (EarQ) (Slaney, 1993):
ERB =f
EarQ+minBW (3.4)
A frequency mapping scale analogous to the mel and bark scales can be alsoderived:
fERB = 21.4log10(4.37f
1000+ 1) (3.5)
Patterson’s model also included the gammatone filter of nth order, withimpulse response
gt(t) = at(n− 1)e(−2πbt)cos(2πft+ Φ) (3.6)
for a given carrier signal with frequency f , phase φ and amplitude a, where bis the bandwidth of the filter. This is generally considered to be a better ap-proximation of the auditory filter shape. Features based in the time-domaingammatone filterbank have been used in several works, e.g. (McKinney andBreebaart, 2003). On the other hand, gammatone filters can also be ap-proximated by multiplication in the frequency domain (Ellis, 2009). Thisapproximation can be fit in the MFCC framework to provide a more ac-curate version with respect to the psychoacoustic model, while providing acomputationally cheaper representation than time-domain filters. Such fea-tures, which can be named GFCC have also been used in speech recognition(Shao and Wang, 2008)(here, the authors use the acronym for GammatoneFrequency Cepstral Coefficients, but Gammatone Filterbank Cepstral Co-efficients would equally work).
Figures 3.1, 3.2 and 3.3 show the magnitude response of the filter bank foreach of the three commonly used features. In this thesis, we adopt GFCCas a generic low-level audio representation. Thus, from here on, we useG to denote the sequence of spectral frames G1, G2, G3... that make thefrequency domain gammatone spectrogram, and Gc to denote the sequenceof cepstral coefficients derived from G.
3.3 Feature aggregation
One general problem for content-based indexing of audio files is featureaggregation. Most common set-ups require the integration of frame-level

34 audio description in unstructured data
0.012
0.01
0.008
0.006
0.004
0.002
0 0.5 1 1.5 2
mag
nitude
frequency x104
Figure 3.1: Mel scale filterbank (with constant area)
features over some period of time in order to obtain a single vector thatcan be fed in to algorithms for classification and clustering. The typicalapproach consists on averaging the frame-level features, a process in whichinformation about the temporal evolution and distribution of the featuresis lost. The development of features that describe the temporal evolutionof the sound is still an open issue. In this thesis, we adopt a differentperspective for the three general classes of sounds mentioned in Chapter 2.It is clear that summarizing the temporal evolution of frame-level featuresmust be done differently for field recordings, sound events, and music loops.
In the case of field recordings, summarization can be done statistically,as the signal may be considered stationary. Field recordings may containdifferent events, but the identification of the context, typically associatedwith locations (a busy street, a park, a beach . . . ) is done in the long term.Contrastingly, recognition of events can be done by analyzing the temporalevolution of the frame-level features, for example in the energy envelope.Finally, summarizing music loops will be more useful if the regularitiesin the evolution of the features are taken into account. In order to applydifferent summarization strategies to each kind of sound, it will be necessary

3.3. feature aggregation 35
0.6
0.7
0.8
0.9
1
0.5
0.4
0.3
0.2
0.1
0 0.5 1 1.5 2
mag
nitude
frequency x104
Figure 3.2: Bark scale filterbank
to identify them first. We now describe our strategies for recognizing andthen summarizing each type of sound.
Sound scenes
Recognition Field recordings are the longest and most diverse type ofrecordings that we consider in this thesis. This type of recording is tradi-tionally performed in locations where interesting sounds can be captured.Traditionally, the recording equipment stays in the same place for all ofthe recording. However nowadays it easy to make continuous recordingswhere the equipment (e.g. a mobile phone) moves around locations. Froma CASA point of view, an ensemble of sounds recorded in a given locationcan be regarded as an auditory scene. However, in order to refer to therecording (and not to its perception), we will refer to sound scenes. Recog-nition of different sound scenes in the same recording has been consideredin the context of TV audio or personal logs, as described in chapter 2. Inthe first case, a movie or a long video recording of TV programs can containdifferent scenes. In the second, a recording of a person moving through the

36 audio description in unstructured data
0.6
0.7
0.8
0.9
1
0.5
0.4
0.3
0.2
0.1
0 0.5 1 1.5 2
mag
nitude
frequency x104
Figure 3.3: ERB scale gammatone filterbank
day with a portable recorder may contain audio from different locations.Here, we analyze sounds that users contribute to a database because theyregard them as reusable material for music or audiovisual creation. Thus,we assume that in the worst case they will contain a consistent sound scene.
Telling apart long environmental recordings from other sounds in an un-structured database can be done simply based on heuristics. We takeFreesound as a case in point. Since finished songs are not allowed in thesite, it is unlikely that long recordings will contain music (note that even so,music could be considered a type of sound scene, and methods for indexingthem based on statistics would still work in some way, although criticallyfailing to take into account music features). Also, recordings of a singlesound event will be generally limited in time by the ability of the resonatingobject to preserve energy. Thus, duration can already be a valid heuristic.To illustrate this, we may consider the field-recording tag in Freesound. Fig-ure 3.4 shows the probability that a sound contains this tag as a function ofits duration (quantized to seconds). This probability quickly grows for fileslasting more than a few seconds. Considering that tags are freely assigned,even the probabilities of at least 30% are a high value (“field recording” is
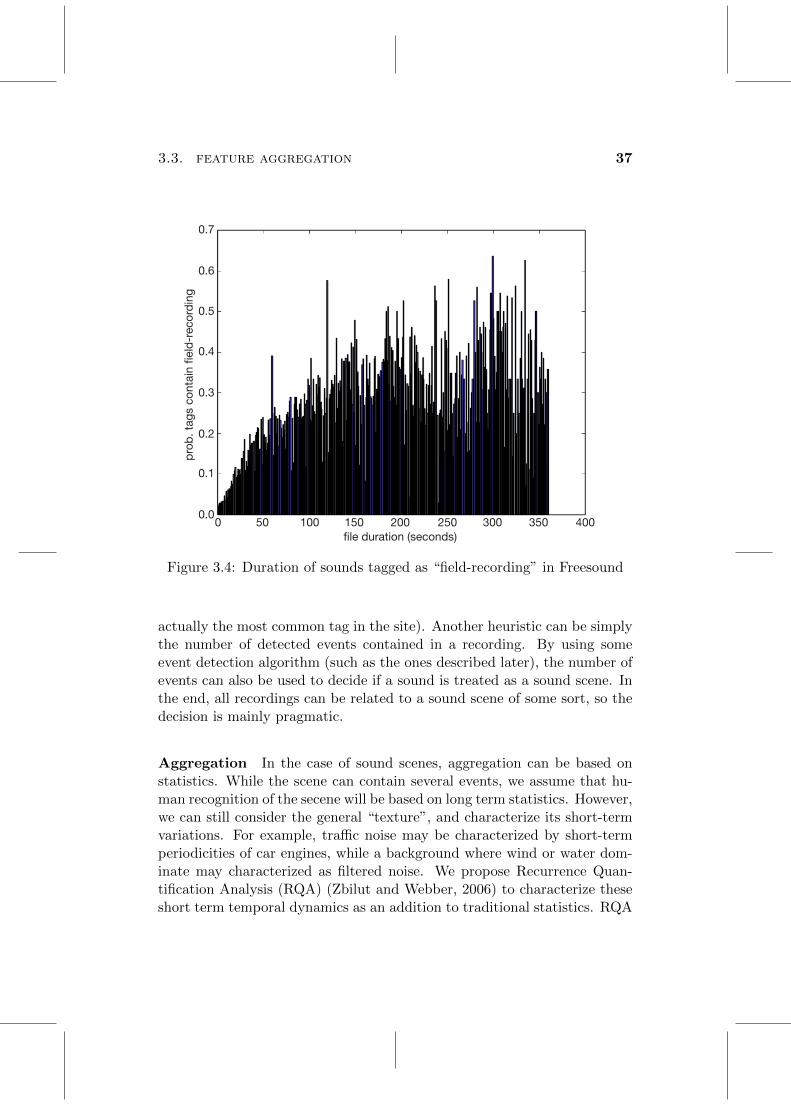
3.3. feature aggregation 37
0.7
0.6
0.5
0.4
0.3
0.2
0.1
0.0
pro
b. t
ags
cont
ain
�eld
-rec
ord
ing
0 50 100 150 200 250 300 350 400�le duration (seconds)
Figure 3.4: Duration of sounds tagged as “field-recording” in Freesound
actually the most common tag in the site). Another heuristic can be simplythe number of detected events contained in a recording. By using someevent detection algorithm (such as the ones described later), the number ofevents can also be used to decide if a sound is treated as a sound scene. Inthe end, all recordings can be related to a sound scene of some sort, so thedecision is mainly pragmatic.
Aggregation In the case of sound scenes, aggregation can be based onstatistics. While the scene can contain several events, we assume that hu-man recognition of the secene will be based on long term statistics. However,we can still consider the general “texture”, and characterize its short-termvariations. For example, traffic noise may be characterized by short-termperiodicities of car engines, while a background where wind or water dom-inate may characterized as filtered noise. We propose Recurrence Quan-tification Analysis (RQA) (Zbilut and Webber, 2006) to characterize theseshort term temporal dynamics as an addition to traditional statistics. RQA

38 audio description in unstructured data
is a set of techniques developed during the last decade in the study of chaosand complex systems. The basic idea is to quantify patterns that emergein recurrence plots. RQA has been applied in a wide variety of disciplines,although applications to audio recognition are scarce. To the best of ourknowledge there has been no prior work using RQA on time series of spec-tral or cepstral coefficients. RQA features derived from frame-level chromafeatures have been tested in the cross-recurrence setting, where two differentseries are compared, for cover song detection (Serra et al., 2009). The orig-inal technique starts from one-dimensional time series which are assumedto result from a process involving several variables. This multidimension-ality is recovered by delaying the time series and embedding it in a phasespace. The distance matrix of the series is then computed and thresholdedto a certain radius r. The radius represents the maximum distance of twoobservations of the series that will still be considered as belonging to thesame state of the system. In our case, we already have a multivariate signalto represent the audio spectrum via cepstral coefficients. Hence, we adaptthe technique by computing and thresholding the distance matrix obtainedfrom the GFCC representation using cosine distance. Thus, if we denotethe series of feature vectors as the multivariate time series Gc of length Nas Gc = Gc1, Gc2, Gc3...GcN , then the recurrence plot R is defined as
Ri,j =
{1 if (1− Gci·Gcj
||Gci||||Gcj ||) < r
0 otherwise(3.7)
Figure 3.5 shows the different steps of the process from the gammatonespectrogram up to the recurrence plot. The main intuition is that diagonallines represent periodicities in the signal, i.e. repeated (or quasi-repeated,depending on the chosen radius) sequences of frames, while vertical lines(or horizontal, since the plot is symmetric) represent stationarities, i.e. thesystem remains in the same state. From this idea, several metrics have beendeveloped that quantify the amount and length of lines of contiguous pointsin the matrix. Most features were developed by Webber and Zbilut (1994).We extract the most commonly used ones and add some more variables inorder to obtain more features for classification and clustering.
• Recurrence rate (REC) is just the percentage of points in the recur-rence plot.
REC = (1/N2)N∑
i,j=1
Ri,j (3.8)

3.3. feature aggregation 39
40
35
30
25
20
15
10
5
ban
d
frequency domain gammatone spectogram
time(s)5 10 15 20 25 30 35 40 45 50 55
40
35
30
25
20
15
10
5
ban
d
window of 128 frames (1.28s)
time(s)0.2 0.4 0.6 0.8 1 1.2
20
40
60
80
100
120
fram
e (1
0ms)
similarity matrix of cepstral coef�cients
frame (10ms)20 40 60 80 100 120
20
40
60
80
100
120
fram
e (1
0ms)
normalized similarity matrix
frame (10ms)20 40 60 80 100 120
20
40
60
80
100
120
fram
e (1
0ms)
recurrence plot (r=0.5)
frame (10ms)20 40 60 80 100 120
Figure 3.5: Steps in the construction of the recurrence plot

40 audio description in unstructured data
• Determinism (DET ) is measured as the percentage of points that arein diagonal lines.
DET =
∑Nl=lmin
lP (l)∑Ni,j=1Ri,j
(3.9)
where P (l) is the histogram of diagonal line lengths l
• Laminarity (LAM) is the percentage of points that form vertical lines.
LAM =
∑Nv=vmin
vP (v)∑Nv=1 vP (v)
(3.10)
where P (v) is the histogram of vertical line lengths v
• The ratio between DET and REC is often used. We also use the ratiobetween LAM and REC, so we define them as
DRATIO = N2
∑Nl=lmin
lP (l)
(∑N
l=1 lP (l))2(3.11)
V RATIO = N2
∑Nv=vmin
vP (v)
(∑N
v=1 vP (v))2(3.12)
• LEN and Trapping Time TT are the average diagonal and verticalline lengths
LEN =
∑Nl=lmin
lP (l)∑Nl=lmin
P (l)(3.13)
TT =
∑Nv=vmin
vP (v)∑Nv=vmin
P (v)(3.14)
• Another common feature is the length of the longest diagonal andvertical lines. The inverse of the maximum diagonal (called Diver-gence) is also used. We use the inverse of both vertical and diagonalmaximum lengths
DDIV =1
max(l)(3.15)
V DIV =1
max(v)(3.16)

3.3. feature aggregation 41
• Finally, the Shannon entropy of the diagonal line lengths is commonlyused. We also compute the entropy for vertical line lengths.
DENT = −N∑
l=lmin
P (l)ln(P (l)) (3.17)
V ENT = −N∑
v=vmin
P (v)ln(P (v)) (3.18)
In order to analyze long series, a windowed version is often used, whichconsists in computing the recurrence plots from overlapping windows offix size. This is computationally much more efficient, while giving similarresults in our case. As will be seen in the experiments section, differentwindow sizes can actually be used to obtain good results. Our hypothesisabout this result is that, in the case of scenes, relevant recurrences happen ata short time scale. These diagonal and horizontal lines will also be countedin larger recurrence plots.
In general audio recognition, the most useful feature aggregation is usually avector composed of the global mean and variance of the frame-level features.In some cases, statistics of the derivative, which reflects the rate of changeof the frame-level features, are also used. In this case, since we look at longseries, the average rate of change does not help in recognition. However,since we look at short windows, it may be expected that other statisticscan be computed, particularly the local variance of the features inside thewindow (the local means will obviously average to the global mean). Asthe experiments will show, both local variance and RQA features providecomplementary descriptions of the short-term evolution of the spectrum,which can be used to increase accuracy with respect to using only globalstatistics.
Sound events
Segmentation As we have mentioned earlier, the distinction betweenevents and background in sound scenes can be supported from a psychoa-coustic perspective (Bregman, 1994). We view the physical world as a com-position of objects that vibrate and produce sound as a result of differentinteractions. When large quantities of events overlap, we are no longerable to identify them, and we perceive them as background noise. Froma musical perspective, sound events found in recordings are particularly

42 audio description in unstructured data
useful, as they can be used in a similar way as samples from traditionalmusical instrument notes. For example, any event resulting from an impactcan be used as a percussive sound to make rhythms. However, while theeffort required to record a scene is small, manually identifying and annotat-ing different events is a tedious task. For this reason, blind segmentationof scenes to find events can be especially useful. While the identificationof sound events has been investigated in several disciplines, from the per-spective just described it has some different and specific requirements. Forinstance in MIR, many onset detection methods have been developed, eitherfor analysis of polyphonic or monophonic signals. However, in MIR offsetsare usually ignored, since the rate of onsets is typically fast (at least in thetypes of music that are commonly analyzed in MIR), and offsets are maskedby reverberation and subsequent onsets. In speech recognition, Voice Ac-tivity Detection (VAD) (Ramirez et al., 2007) is usually performed by abinary probabilistic model that considers events and background. Whilethis coincides with the perspective we have described, these models maynot generalize beyond speech, as a weak sound can produce the probabilityto jump to a high level. This can be useful for a telephone conversation,where the background noise is suppressed but it is preferable to include itif there is any possibility of an informational event. However, in the case offishing events for music in long recordings, it may be preferable to be morerestrictive and select only the most salient events. Moreover, some VADsystems focus exclusively on voiced events by exploiting the pitched qualityof the human voice (Tucker, 1992). Finally, most systems for environmentalsound detection have been developed to recognize specific kinds of soundsin a supervised fashion (i.e., a machine learning model is trained for everykind of sound), which restricts their use for blind segmentation. Withinthe framework of cepstral coefficients, a simple but effective approach is toadapt the High Frequency Content (HFC) onset detection function that isoften used in MIR. Among several versions, the simple weighted sum of thespectrum magnitudes proposed by Brossier (2006) performed best in ourexperiments. One of the main advantages of this function is that, since itfollows the energy envelope it has a smoother decay and can be used to de-tect offsets better than other common functions. Our modification consistssimply in approximating it from the output of the frequency domain gam-matone filterbank described above. This reduces the computational cost,and actually results in better performance. Thus, from the matrix G of raw

3.3. feature aggregation 43
filterbank features, we define the fliterbank-based HFC measure as:
HFCfb(j) =∑i
iGi,j (3.19)
Following Bello et al. (2005), we post-process the onset detection functionin the following way: first, the function is z-scored, then smoothed witha 5 point moving average filter, and then a long term (400 point) movingmedian filter is subtracted from the resulting signal. Figure 3.6 shows thismeasure computed on a short indoor sound recording, (which is used forevaluation in section 3.4.4) compared to energy (obtained from the mag-nitude spectrum and post-processed in the same way) and a classic VADimplementation (Sohn et al., 1999)(in this case, post-processing is not per-formed since the function is a probabilistic measure). While the VAD algo-rithm performs best in our evaluation with this simple case, this algorithmis problematic for more complex cases, as shown in Figure 3.7 (a short clipof a recording in a bus). Clearly, the VAD function will tend to jump alsofor very low energy events.
From the HFCfb, events can be isolated simply by cutting above somethreshold (close to 0). This contrasts with standard practice in MIR, whereonsets are detected as peaks in the onset detection function.
Aggregation Identified segments corresponding to events can be ex-tracted from the sequence of frame level descriptors of the recording anddescribed as separate entities. Like in the case of scenes, obtaining a fixed-length vector representation is especially useful for indexing sounds in largedatabases, as generic machine learning algorithms can be applied. In thecase of sound events, aggregation can be regarded as a simpler task. If wethink about the case of pitched musical instrument timbres, it is traditionalto describe their sound in terms of the spectrum corresponding to the stablepart. Thus, the average of the spectrum (or its compression in the cepstralcoefficients) can be a starting point for describing the sound coming out of aresonant body. Classic studies on timbre (Grey, 1977) proposed the embed-ding of musical instrument timbre into a space composed of the log attacktime (i.e. the logarithm of the time it takes for the signal to reach its maxi-mum), the spectral centroid (the baricentre of the spectrum for one frame)and the spectral flux (the difference between two consecutive spectra). Ageneric description for sound events can be obtained by simple statistics ofthe cepstral coefficients with the addition of some measures of the energyenvelope, which can be obtained from the first cepstral coefficient. Clearly,

44 audio description in unstructured data
gammatone spectogram
energy(z-scored)
hfc(z-scored)
vad
1000 2000 3000 4000 5000 6000 7000 8000 9000 10000 11000
0 2000 4000 6000 8000 10000 12000
0 2000 4000 6000 8000 10000 12000
0 2000 4000 6000 8000 10000 12000
102030405060
0.80.60.40.2
0-0.2-0.4
0.80.60.40.2
0-0.2-0.4
1
0.8
0.6
0.4
0.2
frame (10ms)
frame (10ms)
frame (10ms)
frame (10ms)
Figure 3.6: Example of onset detection functions
as in the case of the HFC measure, the spectral centroid could be approxi-mated from the filterbank, and its cepstral coefficients can be seen as a moredetailed description of the spectrum shape, where the centroid reduces itto one dimension. In a similar way, the statistics of the first derivative ofthe cepstral coefficients, which is often used in many recognition tasks, willprovide more detailed information on the rate of change than the spectralflux. Hence, in addition to common statistics of the cepstral coefficients, weextract more detailed measures of the energy envelope, representd by the0th GFCC: log attack time, temporal centroid, strong decay and tempo-ral kurtosis and skewness(Herrera et al., 2002; Haro, 2008). Finally, RQAfeatures can also be used for describing the temporal evolution of audio inshort events. These features are more robust than envelope measures todifferent segmentation situations, which can be very varied in unstructureddata.

3.3. feature aggregation 45
gammatone spectogram
hfc_fb
vad
500 1000 1500 2000 2500
5000 1000 1500 2000 2500 3000
5000 1000 1500 2000 2500 3000
10
20
30
40
50
60
10
8
6
2
4
0
-2
0.80.9
1
0.70.60.50.40.30.2
frame (10ms)
frame (10ms)
frame (10ms)
Figure 3.7: Example of the different behaviour of the VAD and the HFCfbfunctions
Pitched events For music creation applications, the presence of pitch insound events is obviously a very relevant aspect for many people. In thisthesis, we focus on timbre, as the most general property of events, and thefeature space that allows us to distinguish different sound sources (includ-ing musical instruments). Timbre is commonly represented using cepstralcoefficients. However, by integrating the spectrum into filter bands of largerbandwidth, we loose the detail on the finer oscillations of the spectrum thatcorrespond to the fundamental frequency and its harmonics. This may beregarded as a compromise: in order to describe timbre we must discardpitch and focus on the general spectral shape. Thus, for describing thepitch of events, we should go back to the spectrum. In our experience withthe Freesound database, the spectral-domain version of the YIN algorithm,YIN-FFT (Brossier, 2006) can be useful for dealing with pitched events.This algorithm provides a measure of confidence that can be used as pitched-

46 audio description in unstructured data
ness, which is essential when dealing with unstructured data. Since pitchis already a musical feature, sounds with a stable pitch (such as musicalnotes) can be directly queried by their pitch value. In order to determine ifa sound has a stable pitch, the variance of the evolution of pitch (computedin logarithmic pitch space) can be used along with pitch confidence fromYIN-FFT. Apart from sounds with stable pitch, many sounds can exhibitcharacteristic pitch movements, such as vibrato, or glissandi. A systematiccategorization of this kind of sounds is outside the scope of this thesis. Theinterested reader is referred to existing literature on morphological descrip-tion of sound (Ricard, 2004; Peeters and Deruty, 2010). Finally, we mayconsider acoustic events containing multiple harmonic pitches, also knownas chords. Indexing polyphonic tonality is also relevant in the case of musicloops, as many loops shared by internet users have some defined tonality.Description of polyphonic tonality has been developed in the form of chromafeatures and Harmonic Pitch Class Profile (HPCP) features (Gomez, 2006).However these are generally applied in MIR, where tonality is assumed. Inour case, a measure of tonal strength is crucial. A measure of key strengthis the correlation of a HPCP vector with a tonality profile. However, thisis not necessarily a good measure of tonal strength, since HPCP vectorsof environmental sounds may correlate by chance. In our experience, in-dicators of peakiness of a probability mass function, such as Entropy, orCrest (commonly used to describe the peakiness of the raw spectrum) canbe applied to HPCP vectors to identify chords, as these will display strongpeaks. Since all pitched sounds will have some peak in the HPCP vector,the number of peaks can be used to distinguish chords from single notes.In general, features derived from HPCP vectors work well for unstructuredaudio where one may find all sorts of sounds, including monophonic andpolyphonic melodies, notes, chords and chord sequences. However, a formalevaluation for this kind of sounds is out of the scope of this thesis.
Music loops
Loops are samples that can be played repeatedly to create rhythm. If weleave aesthetic considerations aside, anything could be a loop, as any au-dio sample will produce some sort of pulse when repeated. In practice,though, loops are popular in many electronic music styles, and for thisreason it is common to find samples created with synthesizers and drummachines (and also traditional musical instruments) in online collaborativedatabases. Loops can be seen as monophonic or polyphonic segments thatthe author considers appropriate for repeating in a musical composition.

3.3. feature aggregation 47
Compared to environmental sounds, loops are more complex and usuallyare based on musical features. Hence, many MIR techniques developed forbeat and tempo tracking can be used to analyze loops. However, becauseof the traditional focus of MIR on music, there are several problems thatcomplicate the use of many of these techniques: some require longer dura-tions than what can be assumed for reusable fragments. On the other hand,many MIR techniques for rhythm analysis are based on onset detection sothey rely on percussive or pitched events.
Foote’s Beat Spectrum (Foote and Uchihashi, 2001) is a rather “classic”method for rhythm analysis. However, it has many interesting qualitiesthat justify its use in the context of unstructured audio. First, like therest of features that we have analyzed, it can be computed from the matrixof cepstral coefficients Gc (it could also be computed from the matrix ofraw filterbank features G, but since it is based on distance computations itmakes more sense to use cepstral coefficients). Thus, it allows us to detectand describe loops from the same base generic feature that we use for scenesand events. Second, since it is obtained from the similarity matrix of thesequence of cepstral coefficients vector, it does not make assumptions aboutthe musicality of the sound, and it actually can be used to detect patterns inother feature domains such as HPCP. Similarly to the case of RQA features,we first compute the similarity matrix using cosine distance:
Di,j =Gci ·Gcj||Gci||||Gcj ||
(3.20)
From this matrix, the beat spectrum can be obtained by summing all thediagonals in the matrix:
B(l) =M−1∑k=0
D(k, k + l) (3.21)
where M is the length of the Gc time series and l is the time lag in frames.Recall that diagonals represent pairs of time points in the sequence of de-scriptors that share the same time lag, so a peak in the beat spectrum rep-resents a typical repetition period in the underlying feature (in this case,timbre).
Figure 3.8 shows an example similarity matrix and the corresponding beatspectrum. From this base representation we can accomplish two important

48 audio description in unstructured data
100
50
150
200
250
300
350
400
450
fram
e (1
0ms)
frame (10ms)
50 100 150 200 250 300 350 400 450
2.115
2.11
2.105
2.21
2.095
2.09
2.085
2.08
x10-3
fram
e (1
0ms)
frame (10ms)
beat spectrum1st harmonic
2nd harmonic
500 100 150 200 250 300 350 400 450 500
Figure 3.8: Similarity matrix and beat spectrum from a rhythmic sample
tasks in dealing with loops: we can identify them from other non-loopablesamples in unstructured databases, and we can index them according totheir most common repetition periods for rhythmic music creation applica-tions.
Identification
Since the decision about what is and what is not a loop can easily becomecomplicated, we propose a pragmatic heuristic to identify loops in unstruc-tured data: we assume that loops will have some rhythmic content, and thatthey have been devised so that the duration of the sound has a harmonicrelation with the main pulse of this rhythm. This is in practice what definesloops in electronic music creation since it will create the rhythm sensationwhen repeating the sound. Thus, we analyze the main N peaks in the beatspectrum and look for a peak whose position is harmonic with the totalduration of the file (this is, the position of the peak is related to the dura-tion by an integer ratio), with some error threshold. Note that in the casethat there are silences at the beginning or end of the file, the file may notloop properly unless it is clipped, and it will be discarded by this method.These files can be preprocessed in order to remove silence. If we find sucha peak among the most prominent ones, we can decide that the sound is aloop. Both parameters (the number of peaks and the threshold) can thenbe used to adjust the sensitivity and so that we are more or less strict inthe selection of loops. As will be shown in the experiments section, slightlybetter detection can be achieved by using a SVM classifier with some fea-

3.3. feature aggregation 49
tures extracted from the beat spectrum: in addition to the presence of aharmonic peak, the value of that peak (the spectrum is normalized by thepeak at zero lag), and the entropy of the beat spectrum (Lartillot et al.,2008): since loops contain rhythmic pulses, the spectrum will be peaky,while environmental sounds with no clear pulse will tend to be flat. Thesemeasures retain the advantage of not being directly related with timbre orother musical features that could be used to distinguish between “typical”loop sounds (e.g. with timbres associated to drum or synthetic sounds) andenvironmental sounds, so that classification is purely based in rhythmic as-pects of the sound, and any loopable sound (at least with regularities in theGFCC sequence) can be identified, regardless of its source.
Timbre classification
While defining discrete classes of loops may be a tricky issue, timbre classifi-cation is a common way to index them, often based on the description of theinstruments used to produce the loop. Here, we use general statistics fromthe matrix of cepstral coefficients, like in the case of general scenes, withthe difference that derivatives do provide useful information for classifyingloops, while RQA features do not (from the set of RQA features described,we could be interested in the recurrence rate from a rhythmic perspective,but the beat spectrum already uses the diagonals in the similarity matrixwith more detail than the quantized version of the recurrence plot). Resultsfor timbe classification of loops are shown in the experiments section.
Tempo indexing
One of the most important aspects of music loops is the possibility to syncthem to a given music context. Tempo in BPM is the most used measure.Here, we explore an alternative approach based on the beat spectrum. Theidea is that since this analysis does not focus on percussive or specific in-strumental sounds, it can be used to detect unexpectedly loopable materialin recordings not originally intended for music creation. However, detectingthe exact tempo may be tricky unless the beat spectrum reveals a very clearstructure. Given the method used for detecting loops based on harmonicpeaks, our approach simply focuses on finding loops that can be playedtogether in sync. The intuition is that if two sounds are repetitive withthe same repetition period, they will produce some coherent rhythm sensa-tion when played in sync. An experimental prototype based on this idea isdescribed in section 3.4.4.

50 audio description in unstructured data
3.4 Experiments
3.4.1 Overview
In this chapter we have described our framework for content-based indexingof community-contributed sounds based on audio descriptors. First, we havedescribed the cepstral coefficients framework as the most ubiquitous frame-level description generally used for content-based retrieval of all kinds ofaudio. Then, for each kind of sound (sound scenes, sound events and musicloops) we have described aggregation strategies, extracting the features thatare most relevant for applications dealing with each kind of sounds.
This section presents several experiments to evaluate and compare the dif-ferent possibilities and parameter sets in the described approaches. First,we describe several datasets used in our experiments. Then we comparethe different types of bands, and their cepstral coefficients, to establish ageneric base frame-level descriptor that can be used for all kinds of sounds.The advantage of this is obvious, as it allows analyzing large scale databaseswithout knowing the types of sounds that they contain. In the followingsections, we evaluate our approaches for identifying and summarizing soundscenes, sound events, and music loops.
Both supervised unsupervised indexing can be evaluated with datasets thatrepresent different classes of sounds. Obtaining ground truth data is diffi-cult, since consistently labelling recordings of different sounds with sufficientscale requires effort. However, it is essential to validate methods with asmany datasets as possible in order to avoid overfitting specific characteris-tics of one dataset. We now describe several datasets obtained from differentsources that are later used to evaluate the different proposed descriptors andalgorithms. The purpose is to reflect the different use cases and types ofdata mentioned, so mainly they contain field recordings, sound events andmusic loops. Table 3.1 provides a summary.
d case scenes
This dataset was distributed to participants in the D-CASE challenge forscene classification (Giannoulis et al., 2013). It contains 100 30s. recordingscorresponding to different environments: busy street, quiet street, super-market/store, restaurant, office, park, bus, tube/metro, tube station andopen market. The recordings were done using a binaural micophone during2 months in the same geographical area.

3.4. experiments 51
in house scenes
This dataset was created by one of the authors of the publication where wefirst demonstrated the use of RQA features for sound scene classificationin the context of the D-CASE challenge (Roma et al., 2013). The classesare the same as for the previous dataset, but recordings were obtained fromdifferent commercial CDs and online sources, and sound quality and bit ratevaries between files.
dares scenes
This dataset was collected by a team at the university of Groningen (Nether-lands), using the same equipment for all recordings (van Grootel et al.,2009). The concepts are very similar to the d case scenes dataset, but thenumber of examples for each class is very variable. We selected the classesthat had a minimum of 9 examples each.
d case events
The D-CASE challenge included an event detection task. The dataset sup-plied to participants for development of their own detection/classificationalgorithms consisted of two parts: a labelled database of events for training,and a set of three scenes with annotated events of the same classes of thetraining set. As explained in the previous sections, our system considerssegmentation and classification separately, so the training dataset can alsobe used to evaluate classification of sound events. We then use the test filesto evaluate the joint segmentation/classification framework.
gaver events
This dataset was compiled from several sample CDs and sounds fromFreesound by a team of 4 people (Roma et al., 2010). Sounds are classifiedaccording to the sound event taxonomy proposed by William Gaver (Gaver,1993).
looperman
This dataset was crawled from the popular loop sharing site looperman.comfor research purposes. The original dataset containing more than 20.000sounds was sampled to a more manageable size so that different descriptorsand parameter sets could be compared. All loops in the site are labelledaccording to “category”, “genre”, key and tempo. Categories describe the

52 audio description in unstructured data
main or single instrument in the loop, so we use these categories to evaluatetimbre-based classification of loops. Tempo is used to evaluate the systemdescribed for rhythm indexing.
indaba
This dataset was downloaded from the music mixing site indaba-music.com.This site originally included an online, flash-based, DAW-style interface,which allowed basic multi-track audio editing, and promoted communityactivity mainly through remix contests. Recently the activity seems to befocused on the contests and challenges, and the DAW interface has been re-moved. The site includes a library of sound clips, although the descriptionsare very sparse. The dataset contains only a few loops that are describedaccording to instrument classes, like in the case of the looperman dataset,but much smaller in size. The loops also have a tempo annotation that weuse to validate our rhythm indexing approach.
freesound tags
Sounds in Freesound are generally required to have a textual descriptionand a set of at least three tags. Over the years, this has resulted on a richfolksonomy, in which some tags have become very popular. We sampled the6 most popular tags: field-recording, drum, voice, noise, loop and ambient.The number was chosen as to avoid clear overlaps, as the next most populartag is percussion. By definition, this dataset contains scenes, events andloops, and so it is only useful for the first experiments analyzing genericaudio features.
freesound packs
In addition to the description and tags, sounds in freesound.org can beassigned to packs, which authors can use to group related files. These packscan then be downloaded as zip files. It can be expected that packs containconsistent similar sounds, not only because the author has followed somecriterion, but also because the recording equipment or procedure will usuallybe the same or very similar. This dataset contains sounds from the 15 largestpacks in Freesound. Like in the case of tags, it contains mixed sounds so itis only used to evaluate generic features.

3.4. experiments 53
Table 3.1: Datasets used for evaluation
Name Classes Instances
d case scenes 10 100
in house scenes 10 150
dares scenes 8 72
d case events 16 320
gaver events 9 1608
looperman 20 2000
indaba 3 371
freesound tags 6 1034
freesound packs 15 2164
3.4.2 Generic features
In this chapter we have described MFCCs as the most widely used descriptorfor audio analysis. We have also seen that within the same framework thereare several variants that have been used in other works. In this experiment,we compare mel bands, bark bands and erb bands for obtaining a genericrepresentation. We also analyze the performance of raw filterbank featuresand cepstral coefficients for classification tasks.
Methodology
We compare the different feature sets using an SVM classifier for all thedescribed datasets. In order to find optimal parameters for the base features,we first evaluate by averaging the raw filter bank features over time (i.e. the“bag of features”) and analyze the performance with different numbers ofbands, ranging from 10 to 128, for each type of band and for all datasets.Then we fix the number of bands and test in the same way for differentnumbers of cepstral coefficients. We then choose the number of bands andcoefficients for the feature aggregation experiments.
In all classification experiments, we evaluate using a 10-fold cross-validation.For each fold, we run a grid search to optimize the γ and C parameters ofthe RBF kernel, training each parameter set on 20% of the training data.In order to account for the variability in the results, each classificationtask is run 10 times. We report the mean and standard deviation of theclassification accuracy of the 10 runs.

54 audio description in unstructured data
Results and discussion
Figures 3.9 and 3.10 show the classification results for each dataset withthe raw filter bank features. Shaded areas indicate standard deviation ofthe 10 runs. The first observation that can be made is about the differentclassification performances achieved with each dataset, with the most basicaggregation method - the average of the frame-level features. This indicateshow easy is to discriminate each type of sound (given the number of trainingexamples) on the basis of the average spectral shape. Thus, we can seethat the indaba dataset (where classes correspond to musical instruments- hence timbre) can be easily classified. Also, the classifier achieves goodperformance with the freesound packs dataset, which is expected to be aconsistent division. Contrastingly, it is very difficult to discriminate amongthe main freesound tags. This is due to the mentioned problems with freetags. With respect to the type of band, results indicate that the differencebetween the three types of band is not significant in the smaller datasets (i.e.less than 1000 sounds). However, in the larger datasets, the erb-gammatonebands tend to perform better. Finally, it is easy to notice a saturation effectat about 40 bands, the standard number of bands used in the most commonMFCC implementations.
We then repeat the test using cepstral coefficients computed from 40bands. Figures 3.11 and 3.12 show classification accuracy for both groups ofdatasets. In comparison with the raw bands, by using cepstral coefficientsresults improve very noticeably. This is to be expected from their orthogo-nality, which results in more accurate distances. With respect to the typeof band, again the slight improvement of erb bands can be observed onlyfor larger datasets, with the exception of the more difficult freesound tagsdataset.
Finally, and perhaps surprisingly, there seem to be little or no significantgain in adding cepstral coefficients, in many cases from the very start. Asafe choice seems to be around 25 coefficients. After this there is generallylittle improvement.
From these experiments we conclude that a generic descriptor of 25 coef-ficients computed from 40 ERB bands is a reasonable choice for generalclassification within the general framework of cepstral coefficients.
We now describe our experiments with respect to feature aggregation foreach of the three types of sounds described: sound scenes, sound events,and music loops.

3.4. experiments 55cl
assi
�cat
ion
accu
racy
number of bands
melbarkerb46
40
44
38
36
34
32
42
20 40 100 12060 80
(a)
clas
si�c
atio
n ac
cura
cynumber of bands
melbarkerb
76
74
68
72
66
64
62
60
70
20 40 100 12060 80
(b)
clas
si�c
atio
n ac
cura
cy
number of bands
melbarkerb40
30
25
35
20 40 100 12060 80
(c)
clas
si�c
atio
n ac
cura
cy
number of bands
melbarkerb
58
56
50
54
48
46
44
42
52
20 40 100 12060 80
(d)
clas
si�c
atio
n ac
cura
cy
number of bands
melbarkerb96
98
90
94
88
86
84
82
92
20 40 100 12060 80
(e)
Figure 3.9: Classification accuracy using raw filterbank features for thesmaller datasets: d case scenes (a), dares scenes (b), inhouse scenes (c),d case events (d) and indaba (e), as a function of the number of filters

56 audio description in unstructured datacl
assi
�cat
ion
accu
racy
number of bands
melbarkerb
46
40
44
38
36
34
32
42
20 40 100 12060 80
(a)
clas
si�c
atio
n ac
cura
cy
number of bands
melbarkerb
76
74
68
72
66
64
80
78
70
20 40 100 12060 80
(b)
clas
si�c
atio
n ac
cura
cy
number of bands
melbarkerb50
40
35
45
20 40 100 12060 80
(c)
clas
si�c
atio
n ac
cura
cy
number of bands
melbarkerb
46
40
44
38
36
34
48
50
42
20 40 100 12060 80
(d)
Figure 3.10: Classification accuracy using raw filterbank features for thelarger datasets: looperman (a),freesound packs (b), freesound tags (c) andgaver events (d) datasets, as a function of the number of filters

3.4. experiments 57cl
assi
�cat
ion
accu
racy
number of ceptstral coef�cients
melbarkerb56
58
50
54
48
46
44
42
52
5 10 30 35 4015 20 25
(a)
clas
si�c
atio
n ac
cura
cynumber of ceptstral coef�cients
melbarkerb
92
90
84
88
82
80
78
76
86
5 10 30 35 4015 20 25
(b)
clas
si�c
atio
n ac
cura
cy
number of ceptstral coef�cients
melbarkerb32
34
22
24
26
18
20
28
30
5 10 30 35 4015 20 25
(c)
clas
si�c
atio
n ac
cura
cy
number of ceptstral coef�cients
melbarkerb
70
60
55
65
5 10 30 35 4015 20 25
(d)
clas
si�c
atio
n ac
cura
cy
number of ceptstral coef�cients5 10 30 35 4015 20 25
melbarkerb
96
98
90
94
88
86
84
82
92
(e)
Figure 3.11: Classification accuracy using cepstral coefficients computedfrom 40 bands for the smaller datasets: d case scenes (a), dares scenes (b),inhouse scenes (c), d case events (d) and indaba (e), as a function of thenumber of filters

58 audio description in unstructured datacl
assi
�cat
ion
accu
racy
number of ceptstral coef�cients
melbarkerb
50
40
35
45
5 10 30 35 4015 20 25
(a)
clas
si�c
atio
n ac
cura
cy
number of ceptstral coef�cients
melbarkerb
96
90
94
88
86
84
82
92
5 10 30 35 4015 20 25
(b)
clas
si�c
atio
n ac
cura
cy
number of ceptstral coef�cients
melbarkerb
65
55
50
60
5 10 30 35 4015 20 25
(c)
clas
si�c
atio
n ac
cura
cy
number of ceptstral coef�cients
melbarkerb
56
58
50
54
48
46
44
60
62
64
52
5 10 30 35 4015 20 25
(d)
Figure 3.12: Classification accuracy using cepstral coefficients computedfrom 40 bands for the larger datasets: looperman (a),freesound packs (b),freesound tags (c) and gaver events (d) datasets, as a function of the numberof coeficients
.

3.4. experiments 59
16
8
4
32
64
128
256
512
1024
2048
30
35
25
20
15
100.1 0.2 0.3 0.4 0.5 0.6 0.7 0.8 0.9
d_case_scenes
w
r
16
8
4
32
64
128
256
512
1024
2048
60
55
50
45
40
0.1 0.2 0.3 0.4 0.5 0.6 0.7 0.8 0.9
dares_scenes
wr
16
8
4
32
64
128
256
512
1024
2048
36
38
40
34
28
30
32
2424
26
20
22
0.1 0.2 0.3 0.4 0.5 0.6 0.7 0.8 0.9
w
r
in_house_scenes
Figure 3.13: Classification accuracy using RQA features without whitening,as a function of parameters W and r for the scenes datasets
3.4.3 Sound Scenes
As we have described in previous sections, our approach to describing soundscenes is based on both their long term and short term statistics. To thebest of our knowledge, the RQA features described for analysis of audiospectra have not been previously used for audio recognition (RQA featureshave been used with raw audio waveforms for pathological analysis of thevoice (de A Costa et al., 2012), which is a very different case). For thisreason, an analysis of the main parameters used for RQA may be relevant.The most important ones are the radius r (the distance threshold used totransform the distance matrix in the binary recurrence plot) and W, thesize of the window within which the features are computed. Webber andZbilut (1994) provide some hints for the choice of suitable parameters.
Methodology
We analyze the accuracy of a classification task using different setsof features and parameters for the datasets containing sound scenes(d case scenes, in house scenes and dares scenes). The classification ap-proach is the same as in the previous experiment. In order to find appro-priate values for the parameters, we first perform a grid search for windowsizes from 4 to 2048 spectral frames (we generally use 10ms hops betweenframes, so this means 40ms to 20s) and radius values between 0 and 1. Wethen compare the different sets of features for summarizing sound scenes.
Results and discussion
In the implementation of these features, we noted that z-scoring the featuresof each window to zero mean and unit standard deviation could produce

60 audio description in unstructured data
16
8
4
32
64
128
256
512
1024
2048
30
35
25
20
15
100.1 0.2 0.3 0.4 0.5 0.6 0.7 0.8 0.9
d_case_scenes
w
r
16
8
4
32
64
128
256
512
1024
2048
60
55
50
45
40
0.1 0.2 0.3 0.4 0.5 0.6 0.7 0.8 0.9
dares_scenes
wr
16
8
4
32
64
128
256
512
1024
2048
35
40
25
30
20
150.1 0.2 0.3 0.4 0.5 0.6 0.7 0.8 0.9
w
r
in_house_scenes
Figure 3.14: Classification accuracy using RQA features with whitening, asa function of parameters W and r for the scenes datasets
some small improvements. In the original RQA theory, the multivariatefeature used for the distance matrix is obtained from an embedding of aone-dimensional feature, and this step is not used. The distance matrix isnormalized by the maximum distance value, which we apply after computingthe matrix from standardized features. One interesting aspect of this step,in our case, is that it makes it easier to choose a a fix set of parametersfor all datasets. Figure 3.13 shows a color map of classification acuracyfor a grid search of W and r using the three scenes datasets, where colorrepresents the average classification accuracy over 24 runs. In this caseonly the standard normalization was used. Figure 3.14 represents the samesearch, using the feature whitening step. In the second case, the maximumclassification accuracies are slightly better, and the areas formed by goodparameter combinations tend to be larger. Also, the pattern seems to bemore uniform across datasets. In general, by z-scoring features it is possibleto select larger window sizes, as the resulting distances are not so dependenton the size of the window, and longer term recurrences can be counted. Inthe non-whitened case, the optimal window sizes are very small (in the orderof 160 milliseconds).
The values for W and r can generally set to 128 frames and 0.6 respectively,for sound scenes. We now analyze classification accuracy using different fea-ture aggregation sets: global mean (gm), global variance (gv), local variance(lv), RQA (rqa), and several combinations (gm + gv, gm+ gv + lv, gm+gv + rqa, gm+ gv + lv + rqa). Figure 3.15 shows the results for each set offeatures. It can be seen that, with the exception of the dares scenes dataset,local statistics can be used to improve accuracy when added to global statis-tics, and that lv and rqa increast the overall accuracy when added together,which indicates that they provide complementary information. In the case

3.4. experiments 61
60
70
50
40
30
20
10
0
d_case_scenes
gm gv lv rqagm
+gv
gm+gv
+lv
gm+gv
+rqa
gm+gv
+lv+rq
a
(a)
80
90
70
60
50
40
30
10
20
0
dares_scenes
gm gv lv rqagm
+gv
gm+gv
+lv
gm+gv
+rqa
gm+gv
+lv+rq
a
(b)
50
40
30
20
10
0
in_house_scenes
gm gv lv rqagm
+gv
gm+gv
+lv
gm+gv
+rqa
gm+gv
+lv+rq
a
(c)
Figure 3.15: Classification accuracy using global mean (gm), global variance(gv), local variance (lv) RQA (rqa), and combinations for the scenes datasets

62 audio description in unstructured data
of dares scenes, relatively good results are already obtained only by averag-ing the frame-level features, and no significant improvement is made by anyother feature set, which seems to indicate a ceiling effect. Unlike the otherscenes datasets, this dataset contains several classes of indoor scenes, whichcan be seen as a very different problem to recognizing outdoor recordings,as the background is usually not so relevant when identifying indoor scenes.The overall set of features, computed over 25 cepstral coefficients, amountsto a vector of 86 features for describing sound scenes.
3.4.4 Sound Events
We have described a method for identifying sound events in longer record-ings, as well as different aggregation features based on cepstral coefficients.In the following set of experiments, we analye the tasks of blind identifica-tion and classification, and the recognition task combining both.
Methodology
The methodology follows the taks proposed in the D-CASE challenge (Gi-annoulis et al., 2013). We first focus on segmentation, comparing differentalgorithms for VAD and onset detection. We then focus on the classificationof discrete events into classes, analyzing the performance of different featuresets. Finally, we perform both steps within the evaluation framework of thechallenge.
Segmentation
For evaluating segmentation algorithms, we used the scripts provided in theoffice live task of the D-CASE challenge. These are 1 minute recordings ofan office environment that contain several non-overlapping events. Whilethe audio is not synthetic, it is not a completely realistic case, since it hasbeen devised to avoid overlapping events and to ensure that all events corre-spond to classes in the ground truth. We convert the ground truth annota-tion, containing the locations and classes of the events, into a binary signalof the same length of the waveform, where 1 signals the presence of an eventand 0 background. We then approximate the same signal using the differentalgorithms, and compute the jaccard distance between both signals. Thisdistance measures the overlap between binary variables. Hence, the lowestthe distance, the better the algorithm is approximating the ground truth.Table 3.2 shows the results for several common onset detection functions.

3.4. experiments 63
Clearly, HFC tends to perform better than the other onset detection func-tions because of the longer decay. Also it can be noted that the filterbankversion performs even better than using the raw spectrum. Finally, theVAD algorithm generally gives good results in two of the scripts. It seemsthat for this task, using VAD would be the best option. However, this maybe probably due to the simplicity of the evaluation data, since the scriptscontain very sparse and recognizable events.
Table 3.2: Jaccard distance of different onset detection functions with theground truth segmentation
Algorithm script 1 script 2 script 3
HFC 0.2725 0.3478 0.2754
HFCfb 0.2207 0.3030 0.2766
energy 0.4048 0.4900 0.5953
spectral flux 0.4394 0.5228 0.6252
vad 0.2224 0.2553 0.3194
Classification
We now analyze several features for classification of events. We use thetraining set provided for the D-CASE challenge, and the gaver eventsdataset. The following descriptor sets are compared: mean (m), variance(v), mean derivative (dm), variance of the derivative (dv), envelope descrip-tors (env), RQA (rqa), and several combinations of these (mv+dm+dv,mv+rqa, mv+env, all).
Figure 3.16 shows classification accuracy for each set of features with thetwo events datasets. It can be clearly seen for both databases that theenvelope features provide relevant information, achieving greater accuracythan the derivatives and the RQA features. The derivatives only seemto work for the d case events dataset, but not for the larger gaver eventsdataset. Aggregating all these statistics results in accuracies above 70%, farabove the corresponding random baseline in both cases.
Recognition
We now combine both tasks into a recognition task. In this task, we seg-ment the same scripts as in the previous section, and classify the resulting

64 audio description in unstructured data
80
70
60
50
40
30
10
20
0m v dm dv rqa env mv
mvdmdvmvrqa
mvenv all
gaver_events
(a)
80
90
70
60
50
40
30
10
20
0m v dm dv rqa env mv
mvdmdvmvrqa
mvenv all
d_case_events
(b)
Figure 3.16: Classification accuracy using mean (m), variance (v), derivativemean(dm), derivative variance (dv), envelope features (env), RQA (rqa),and combinations for the events datasets
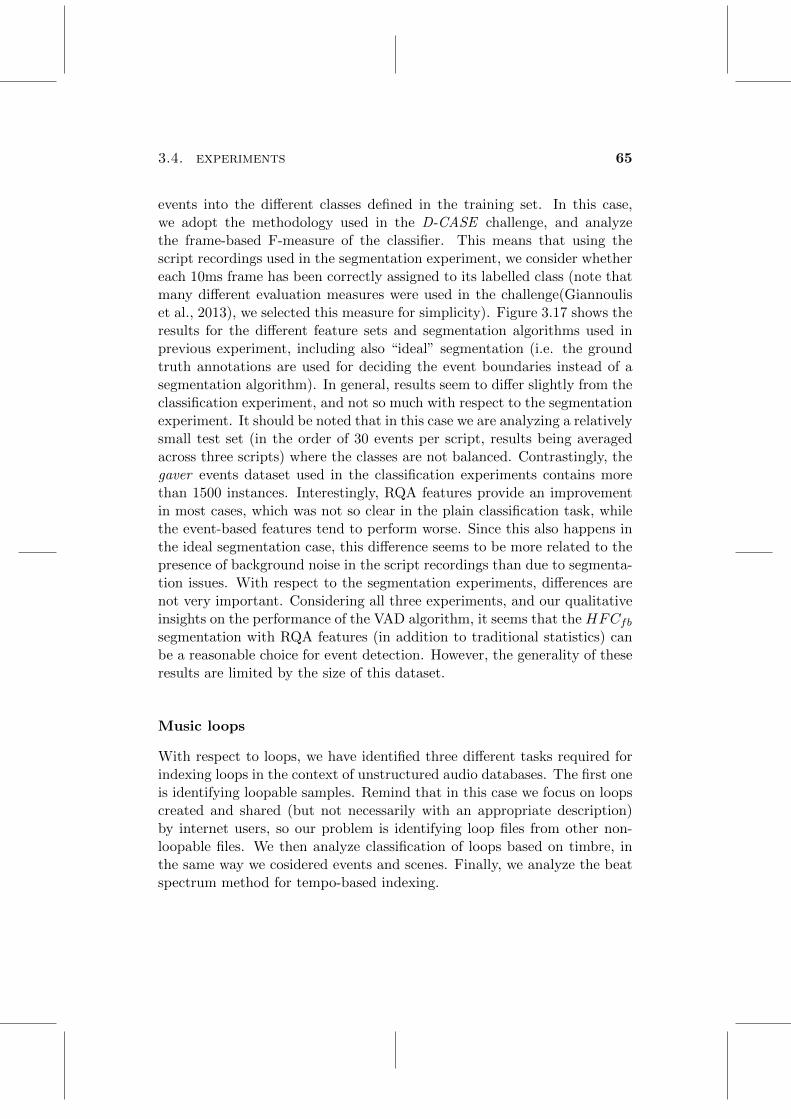
3.4. experiments 65
events into the different classes defined in the training set. In this case,we adopt the methodology used in the D-CASE challenge, and analyzethe frame-based F-measure of the classifier. This means that using thescript recordings used in the segmentation experiment, we consider whethereach 10ms frame has been correctly assigned to its labelled class (note thatmany different evaluation measures were used in the challenge(Giannouliset al., 2013), we selected this measure for simplicity). Figure 3.17 shows theresults for the different feature sets and segmentation algorithms used inprevious experiment, including also “ideal” segmentation (i.e. the groundtruth annotations are used for deciding the event boundaries instead of asegmentation algorithm). In general, results seem to differ slightly from theclassification experiment, and not so much with respect to the segmentationexperiment. It should be noted that in this case we are analyzing a relativelysmall test set (in the order of 30 events per script, results being averagedacross three scripts) where the classes are not balanced. Contrastingly, thegaver events dataset used in the classification experiments contains morethan 1500 instances. Interestingly, RQA features provide an improvementin most cases, which was not so clear in the plain classification task, whilethe event-based features tend to perform worse. Since this also happens inthe ideal segmentation case, this difference seems to be more related to thepresence of background noise in the script recordings than due to segmenta-tion issues. With respect to the segmentation experiments, differences arenot very important. Considering all three experiments, and our qualitativeinsights on the performance of the VAD algorithm, it seems that the HFCfbsegmentation with RQA features (in addition to traditional statistics) canbe a reasonable choice for event detection. However, the generality of theseresults are limited by the size of this dataset.
Music loops
With respect to loops, we have identified three different tasks required forindexing loops in the context of unstructured audio databases. The first oneis identifying loopable samples. Remind that in this case we focus on loopscreated and shared (but not necessarily with an appropriate description)by internet users, so our problem is identifying loop files from other non-loopable files. We then analyze classification of loops based on timbre, inthe same way we cosidered events and scenes. Finally, we analyze the beatspectrum method for tempo-based indexing.

66 audio description in unstructured data
0.6
0.7
0.5
0.4
0.3
0.2
0.1
0ideal vad fb_hfc hfc
m v dm dv rqa env m+v m+v+dm+dv m+v+rqa m+v+env m+v+rqa+env
Figure 3.17: Frame level F-measure for event detection using different seg-mentation algorithms and feature sets
Methodology We evaluate the proposed algorithms in a set of experi-ments. While the classification task is based in the same methodology ofthe previous experiments, we followed different approaches for the case ofidentification and rhythm indexing. We describe the methodology in thecorresponding sections.
Identification of music loops In order to evaluate our method for iden-tification of loops, we created two ad hoc datasets divided in 100 loopsand 100 non-loopable files. The first dataset was obtained by querying thefreesound database for sounds tagged as loop, and then using a general queryand avoiding sounds that have this tag for the negative class. In addition,the “group by pack” of Freesound’s search engine is used to avoid soundsfrom the same pack, and in each case, 100 sounds are randomly sampledfrom a larger result set to eliminate any effects of the order of search results.The second dataset consists of 100 sounds from the looperman dataset and100 from the in house scenes dataset. We compare two different strategies:in the first case, classification is purely based on the first harmonic heuris-tic: if one of the 20 top peaks in the beat spectrum is a harmonic of thefile duration (with an error threshold of 0.1), then the sound considered aloop. In the second case we add the beat spectrum entropy and the value

3.4. experiments 67
harmonic svm
freesound looperman
80
90
100
70
60
50
40
30
10
20
0
Figure 3.18: Loop detection accuracy using either the harmonic methodand the SVM classifier for the looperman and indaba datasets
of the harmonic peak (along with the former binary variable) as featuresto a SVM classifier, and evaluate via 10-fold cross-validation. Results areshown in figure 3.18. It can be seen that this simple approach gives verygood results in the case of the looperman vs in house scenes dataset, witha significant improvement when using the SVM classifier. In the case ofthe freesound dataset it should be noted that labels are noisier: a soundnot labelled as “loop” may be actually loopable even if it’s not describedas such, and sounds labelled as loops may be incorrectly cut. This methodshould give good results in practice, as false positives (sounds that were notintended to be loops) will generally be loopable material, and false nega-tives (discarded loops) will possibly lack rhythmic clarity, at least in thetimbre domain. Further improvements can be done by analyzing the beatspectrum of other features, such as HPCP.
Timbre classification While defining discrete classs of loops may be atricky issue, timbre classification (i.e. often based on the instruments orsounds they contain) is perhaps the most common way. Both the loop-erman and the indaba datasets contain non-overlapping labels related tomusical instruments. We analyze the potential for classification in the sameway we did for the scenes and events datasets. Results are shown in figure

68 audio description in unstructured data
3.19. Clearly (as can also be understood by listening to some examples), thelabels in the looperman dataset are not as consistent with the actual soundsas it may seem. This suggests that the problems inherent in free taggingare not necessarily solved by imposing a set of fixed categories in the siteinterface. In the case of the indaba dataset, both the number of classes andthe number of instances are much smaller. Unlike in the case of scenes andevents, statistics from the derivative of the cepstral coefficients seem to addrelevant information in both cases, which is consistent with their extendeduse in MIR. Since loops contain mixtures of different instruments or sounds,unsupervised classification could provide more interesting results than su-pervised classification based on single-instrument labels. Another commonapproach that could be automated would be electronic music genres, whichwould require a large and consistent training dataset and joint analysis oftimbre and rhythmic features.
Rhythm indexing As we have described, the beat spectrum does not di-rectly give BPM values, but the harmonic peaks used to identify loops willvery likely be physically related to the main rhythmic pulse perceived inthe loop. Here, instead of focusing on BPM values, we can just index loopsaccording to their characteristic repetition periods. The following experi-ment can help showing the potential of this method. The main assumptionis that, as long as loops can be played together, in a creative context oc-tave errors do not matter much. This is, a loop labelled at 60 BPM canbe perfectly played with another one labelled as 120 BPM. Since we searchfor harmonics of the file duration (which can contain one or several bars),the first harmonic (typically one half or one third of the file duration) willbe a period containing several beats. We analyzed 200 sounds from thelooperman dataset and computed the ratio between the duration of this pe-riod and the duration of one beat according to the labelled tempo in BPM.We then computed the error as the decimal part of this ratio. Figure 3.20shows the distribution of the error for 500 sounds, with most sounds below0.05 (mean 0.09, sd 0.12). This indicates that the periods are generally re-lated to the labelled tempo. Typically the ratio between the beat spectrumharmonic and the duration of one beat derived from the BPM is 2, 4 or 8.
Experimental prototype We implemented a web-based prototype inorder to test the proposed method for rhythm indexing, using loops fromFreesound. While we didn’t conduct a formal evaluation, the developmentof the prototype helped clarifying the potential and limitations of the pro-

3.4. experiments 69
60
50
40
30
10
20
0m v dm dv mv all
(a)
80
90
100
70
60
50
40
30
10
20
0m v dm dv mv all
(b)
Figure 3.19: Classification accuracy using mean (m), variance (v), derivativemean(dm), derivative variance (dv) and combinations for the loop datasets:looperman (a) and indaba (b)

70 audio description in unstructured data
60
50
40
30
10
20
0 0.05 0.1 0.15 0.2 0.25 0.3 0.35 0.4 0.45 0.5
Figure 3.20: Distribution of the error in detecting labelled tempo harmonicswith the looperman dataset
posed approach. The index, computed as described above, contains about30.000 loops. We used several information visualization techniques in orderto present loops in a web environment. First, we computed a histogram ofall the harmonic periods of loops in the database. Since the beat spectrumis computed from frame-level descriptors, harmonic periods are measured inframes, and the histogram is discrete. Peaks in this histogram correspond tofrequent periods related with typical tempo values (e.g. 120BPM). This is aconsequence of the social nature of the database. The histogram is used asan interaction device, so that selecting one bar from the histogram wouldload all sounds that share the same harmonic period. When queried forsounds with a given period, the server creates a k-nearest neighbors graphof the sounds according to their timbre similarity, as computed by cosinedistance over the average of MFCC features. The graph is returned to theclient, where a force-directed layout is used to display all the sounds in thepage. Since the graph is built according to timbre similarity, the layoutwill tend to group similar sounds together, which helps in the explorationprocess. It should be noted that this is an approximation to our clusteringapproach described in chapter 4, as modulartiy has been shown to be re-lated to force-directed layout (Noack, 2009). This kind of layout has beenused in the context of corpus-based synthesis for large databases (Schwarz

3.4. experiments 71
Figure 3.21: Screenshot of the prototype
et al., 2009). Loops are represented via the small spectrogram thumbnailsavailable for all sounds in Freesound. This allows the user to quickly iden-tify sounds with a strong pulse, as they will contain vertical lines. Soundswith melodies are also easily identified. Playback of the loops is quantizedto the selected loop period.
While the prototype is still in development, reactions in initial demonstra-tions were very positive. The interface allows maintaining a certain creativeflow, as all sounds and can be used as a musical instrument, as well as anexploration of the sounds uploaded by the Freesound community. The mainlimitation is that some sounds are indexed according to harmonic periodsthat do not necessarily start at the beginning of the file. Foote proposedthat the ”phase” of the beat spectrum can be computed as a novelty curvefrom the similarity matrix (Foote, 2000), which can be seen as an onsetdetection function. This feature could be used to improve the index.

72 audio description in unstructured data
3.5 Conclusions
In this chapter we have faced the problem of low level audio representationin the context of user-driven databases without a pre-defined editorial pro-cess. In such platforms it is possible to find any kind of sound, includingspeech, music, environmental audio, and all possible mixes of these. Amongthe literature of the respective disciplines that study each kind of sounds,perhaps the most ubiquitous low-level representation are MFCCs. Othercommon descriptions, based on more recent studies of the auditory filter,such as bark or ERB bands, can be incorporated in the same frameworkto obtain cepstral representations. Our experiments show that swappingthe filter bank does make a difference, although not very large, especiallywith larger datasets. This seems to imply that more accurate filterbanksmotivated by psychoacoustic studies allow for better generalization. Wehave then proposed to distinguish three main kinds of sound files that arecommon in online audio databases: sound scenes (usually field recordings),sound events, and music loops. Within the framework of cepstral coeffi-cients, we have proposed a way to identify each kind of sound, and for eachkind, we have analyzed different ways to aggregate the time series of cepstralcoefficients in order to obtain a summary representation. These representa-tions can be used for indexing and retrieval for creative applications, suchas described in Chapter 4. At the same time, we hope that these results canbe useful in different fields, particularly in analysis of environmental soundrecordings, where it is also possible to find all kinds of sounds.

Chapter 4
Automatic taxonomicalorganization of audio
4.1 Introduction
During the last decades, many web applications have allowed users to shareinformation generated or captured by themselves. These applications aretypically less structured than traditional media with well defined editorialprocesses, curated by companies with well defined role hierarchies. Thisfeature can be related to the success of the decentralized design of the In-ternet and its protocols. The notion of unstructured data is commonlyassociated with text. It can be argued that web search engines have helpedpeople to become accustomed to interacting with unstructured and diverseinformation by way of short text queries. Most popular social media ap-plications, such as flickr or youtube, are rather laid-back with respect toinformation organization. Free tags have become a popular way to organizecontent, even for private use. From the content creation perspective, anemphasis on structure may be problematic: most web users who create andshare content usually do it for fun and are not likely to commit themselvesto the tedious work of labeling their data in a very detailed or repetitiveway. Moreover, decisions about the global information structure may bequestioned and subject to debate. Wikipedia can be seen as an intermedi-ate model, which works according to an elaborate governance system. It isquite obvious that the possibility of indexing and retrieving unstructureddata has boosted Internet adoption and thus helped disrupting the way weuse information. At the same time, a bit of agreement and coordination are
73

74 automatic taxonomical organization of audio
helpful for making sense of information on the web. Very often, the use andmis-use of unstructured data services call for something more elaborate. Asan example, Freesound.org heavily relies on free tags. Describing soundsis usually a tedious task, and many users try to minimize their efforts byrepeating the same tags and descriptions for many sounds. Some populartags include ‘A’, ‘120’ and ‘Zoom H2’, which refer respectively to a musicalnote or key, a musical tempo, and a portable audio recorder model. Theseand many similar examples suggest that a more structured model wouldhelp to describe the sounds. The Semantic Web vision (Berners-Lee et al.,2001) has received a great deal of attention in academic Information Re-trieval. One core idea of the Semantic Web was that if information wasdescribed in compatible ways across different web services, we would beable to make programs that automatically relate information from differentsources and process it in intelligent ways. For this purpose, labels shouldconform to web ontologies, which allow to formally describe relationshipsbetween concepts in an application domain. The adoption of Semantic Webtechnologies, however, has been slow. In a way, the irruption of users intocontent creation and the generalization of unstructured processes conflictswith the complex formalisms proposed by Semantic Web researchers. Inthis chapter we explore taxonomical organization as an intermediate solu-tion that is well known to most users and can be seen as a simple form ofontology.
4.2 Taxonomical organization
Taxonomical organization is perhaps one of the oldest ways of structuringknowledge, and is central to most scientific disciplines. Any computer useris accustomed to organize files in a hierarchical fashion. Taxonomies may beunnecessary for some applications. For example, current mobile operatingsystems (which are increasingly used by people with little or no experiencewith personal computers) tend to deliberately hide the file system from theuser, and applications such as gmail offer free tags as opposed to traditionalfolder structures. In this sense, taxonomies can be thought as a compromisebetween the complexity of semantic web ontologies and the randomness offree tags. Taxonomies are, of course, a simple form of ontology, but onethat all computer users can easily understand, and that can be created bydomain specialists without a computer science background. Taxonomicalorganization of sound has been studied from many different perspectives.Before electronic means of sound production existed, the sounds used in

4.3. content-based indexing 75
music were limited to traditional instruments, and musical timbre was asso-ciated to instruments. Musical instruments were organized into taxonomiesusually according to their production mechanism, which influences the kindof sounds that the instrument can produce (Kartomi, 1990). An example isthe Hornbostel-Sachs taxonomy, which is widely accepted in Western coun-tries. At the beginning of the 20th century, avant-garde artists started tosee that technological progress would allow creating music with differentsounds. In his manifesto for a Futurist Music, Russolo (Russolo, 1986) de-scribed a taxonomy of urban sounds that suited the futurist aesthetics, andinvented a number of instruments (the intonarumori) that could producethose sounds. In his Traite des Objets Musicaux, Schaeffer (1966) discussedhow sounds could be described and categorized, but from a more open per-spective which included many different criteria. In the 1970s, Schafer (1977)also proposed a taxonomy of sounds in The tuning of the world. Like Rus-solo’s, Schaffer’s taxonomy is heavily influenced by aesthetics, and includesimpossible or unheard sounds (such as the sound of creation or the sound ofapocalypse). In the 1990s, while researching on sound icons, Gaver (1993)proposed a general taxonomy of sounds motivated by acoustic ecology. Thegeneral idea is that in everyday listening (as opposed to musical listening)we use sound to extract information from the environment, and so we tryto understand the mechanism of sound production. Thus, he proposed ageneral division of sound according to interactions between basic materials(Figure 4.1). While in theory his idea is to cover all kinds of sounds, thetaxonomy is especially suited for environmental sounds, as it does not dealwith the specific significance of pitched sounds such as human and animalvoices, musical instruments or alarms and signals. Although a universaltaxonomy of sounds seems an impossible task, Gaver’s proposed taxon-omy is simple enough and has been widely adopted in sound design (VanDen Doel et al., 2001; Rocchesso and Fontana, 2003; Hermann et al., 2011).In this chapter, we adopt this taxonomy as a paradigmatic example of top-down approaches for labeling audio, which can be supported by supervisedalgorithms for content-based audio indexing. In general, taxonomies canbe devised specifically depending on the application, including instrumenttaxonomies, electronic genres for loops, sound effects, and so on.
4.3 Content-based indexing
Text (or more specifically hypertext) is the original and still most promi-nent type of content of the web. Text in web pages is used by most search

76 automatic taxonomical organization of audio
AERODYNAMIC SOUNDSVIBRATING SOUNDS
INTERACTING MATERIALS
WIND
WHOOSH EXPLOSIONSCRAPING DEFORMATION
LIQUID SOUNDS
DRIP
POUR SPLASH
RIPPLEIMPACT ROLLING
MUSICALSOUNDS
HUMAN & ANIMALVOICES
Figure 4.1: Gaver’s proposed taxonomy of sounds
engines for indexing all kinds of content. However, there are several prob-lems with using textual descriptions in unstructured, user-contributed sounddatabases, such as Freesound, for music creation. Textual descriptions, forinstance in the form of social tags or keywords, are always incomplete andinconsistent. The same word is used by different people in different ways.Sounds obtained in radically different ways and with very different seman-tics may have very similar perceptual qualities, while sounds with the samedescription may be completely different. As an example, a query for “car”will retrieve the sounds of car horns, engines, doors and crashes. Percep-tual qualities of sounds, rather than text, are usually considered as themain musical material. This was, after all, the first observation of PierreSchaeffer when considering the use of recordings for music creation. Scha-effer proposed the concept of “reduced listening” in order to abstract andisolate the perceptual aspects of sound from the semantic references to thesound source (Schaeffer, 1966). For these reasons, in this thesis we focus oncontent-based approaches to audio retrieval. Content-based audio retrievaland discovery is based on automatic descriptions obtained from the audiosignal. Such descriptions are intended to represent perceived qualities ofthe recorded sound. On top of signal descriptors, it is common to use ma-chine learning techniques to label sounds with higher-level concepts. In thecase of creative applications, simple and abstract labels can be used. Ananalogy can be drawn with traditional musical theories, where some con-cepts (such as e.g. notes in western music or bols in indian music) are usedmerely as indicators of some perceptual sound quality that has been parti-

4.4. unsupervised indexing 77
tioned into discrete classes. The distinction between this kind of classes andmore complex semantic categories can be related to the distinction betweenperceptual and categorical learning in psychology (Mandler, 2000). Our ap-proach consists in grouping user-contributed sounds in discrete classes thatcan be assigned simple text labels for reference. From a machine learn-ing perspective, these groupings can be obtained using two main types ofmethods: supervised and unsupervised.
Supervised approaches are implemented as top-down processes: they startfrom an already established set of labels and try to assign some of theselabels to audio fragments. This requires the availability of a training set ofalready labeled sounds, from which the algorithm must learn how to labelthe rest. The amount and quality of training data has a critical impact onthe result. However, obtaining large quantities of training data can be acomplex and time-consuming task.
Unsupervised approaches can be seen as bottom-up processes, where thegroupings are assumed to be present in the distribution of the data. Thus,they don’t require additional training data. However, the quality of theresult will also depend on the amount of data and their distribution (e.g.whether sounds are evenly spread with respect to a certain quality). Itcan also be challenging to interact with a set of sound clusters withoutreferencing any specific theory or model.
4.4 Unsupervised indexing
Unsupervised indexing is useful for analyzing data that has not been la-beled or classified. As we have mentioned, bottom-up, collaboratively-builtdatabases can be seen as “unstructured data”, which are not organized orcurated according to a predefined structure. In these cases, even when labelssuch as free tags are used, noise appears as a consequence of different pointsof view, expertise levels, goals and attitudes. A data clustering algorithm,able to find inherent structures that are not explicit, can be especially usefulin such situation. When derived from content-based descriptors, partitionsgenerated by data clustering can be especially suited for music creation, assounds are grouped according to their acoustic similarity, which seems anatural way to conceptualize and manipulate sound collections. Clusteringalgorithms can also be used to automatically index long recordings withdifferent events and/or sections that have not been labeled, in combinationwith the event detection methods proposed in chapter 3.

78 automatic taxonomical organization of audio
Classic algorithms are usually divided between partitional (such as K-means) and hierarchical (e.g. agglomerative clustering) (Jain and Dubes,1988). However, classic hierarchical clustering algorithms are impractica-ble for large datasets due to their computational cost. On the other hand,many algorithms are not well suited for noisy data, especially when thefeature space has very different densities. As an example, in a collaborativeaudio database, it is quite likely that many users will upload a particularkind of sound (e.g. bass drum), while other types of sound are scarce. Forsuch data it is common to use graph-based algorithms. Graphs based onthe number of Nearest Neighbors (k Nearest Neighbors or kNN graphs) canadapt to areas of different densities, since no fixed distance is assumed.This approach also helps with the Curse of dimensionality related with thesize of the feature space, as features are not directly used in the clusteringstep. In recent years, the concept of modularity has originated a number ofgraph partitioning algorithms, each with different characteristics, and forwhich open source implementations are available. These algorithms can beused to automatically index sounds according to different needs, includingtaxonomical organization.
4.4.1 Construction of the kNN graph
As mentioned, a common approach in document clustering is to construct agraph that links each document to its k nearest neighbors. Clusters can thenbe identified by partitioning the graph. The advantage of the kNN approachis that it allows identifying clusters of different densities. In an area withhigh density, neighbors will be chosen among very close documents, whilein areas of low density, the nearest neighbors of a given point may not beso close.
One common problem for large datasets is that the construction of thegraph may require computing the whole distance matrix, which becomesquickly prohibitive in both space and time complexity. One solution isto use some Approximate Nearest Neighbors (ANN) data structure, suchas a Kd-tree (Bentley, 1975) or a Cover tree (Beygelzimer et al., 2006).Such strategies have also been applied to direct navigation of large audiodatabases for creative applications (Schwarz et al., 2009). In early experi-ments, we found that this approach provided similar results to computingthe whole matrix with euclidean or cosine distance. Another problem isthat for many dimensions, the distance measure may become meaningless.This may be partially alleviated by using the cosine or Jaccard distance in-

4.4. unsupervised indexing 79
stead of euclidean. Another solution, used in the Shared Nearest Neighbors(SNN) algorithm (Ertoz et al., 2002) is using the number of neighbors asa distance measure. However, in our preliminary experiments this did notimprove the results in the case of audio clustering.
There are several variants: the constructed graph may be directed or undi-rected, weighted or unweighted. For weighted graphs, the original distanceor the number of shared neighbors can be used. In our experiments, ignor-ing weight tended to give best results. With respect of the directedness ofthe graph, the choice depends on the algorithm used for partitioning thegraph. For example when using algorithms based on random walks, such aswalktrap (Pons and Latapy, 2005), directed edges are important.
4.4.2 Clustering
Once built, the kNN graph can be treated as a complex network, and com-munity detection algorithms can be used to find clusters. The most com-mon methods are based on modularity optimization. Modularity evaluatesa given partition of the network by counting the number of links betweennodes in the same partition compared to their total degree. Here we considermodularity of an undirected multigraph. Given the adjacency matrix A ofa graph where Aij is the number of links between nodes i and j, modularityis defined as
Q =1
2m
∑ij
[Aij −kikj2m
]δ(vivj) (4.1)
where ki is the degree of node i, m is the total number of edges in thenetwork, and δ(vivj) is a function that returns 1 if node i and node j are inthe same group and 0 otherwise.
While direct optimization of modularity is computationally hard (Brandeset al., 2006), many approximate algorithms have been proposed. Some ofthem (such as Walktrap) can output a dendrogram and thus can be usedlike traditional hierarchical clustering algorithms. A very fast modularityoptimization method that specifically searches for hierarchical communitystructures is the so-called Louvain method (Blondel et al., 2008). Thisalgorithm works as follows: each node in the network is initially a com-munity on its own. Then each iteration is divided in two phases. In thefirst one, each node is moved to its neighboring community that producesthe highest modularity. In the second phase, communities are simplifiedinto nodes. The iterations continue until no further gain in modularityis obtained. This produces a multi-level community structure that is not

80 automatic taxonomical organization of audio
restricted to a binary tree, and thus can be used as a taxonomical organi-zation without further processing. While the complexity of the algorithmis not known, the authors assess that it “seems to run in O(n log n)”1. TheWaltrap algorithm depends on the sparsity of the graph, but it is expectedto run in O(n2 log n). In our experience, the Louvain method can be usedto cluster the whole of the Freesound database (200.000 sounds) in a fewseconds (in addition to computing the graph). Walktrap can be used forsmaller subsets but it is limited by space complexity (expected to be O(n2).Other modularity optimization algorithms are not so well suited for thesescales. In all, clustering audio by modularity optimization of kNN graphs isa very versatile method: it is almost parameter-free (except for the numberof neighbors), it can be used to generate full dendrogram (from which anarbitrary number of clusters can be obtained), and it can also be used tofind the most likely division of the data (i.e without specifying the numberof clusters in advance) by using the division with maximum modularity.
4.5 Supervised indexing
4.5.1 Automatic classification
Supervised Machine Learning algorithms have seen great development inrecent years. With the evolution of computer hardware and the possibil-ities for accumulating large quantities of information, such algorithms arebecoming crucial to facilitate automatic organization of information. Wefocus on automatic classification algorithms, which aim to predict the class(or label) of some piece of information, in our case audio recordings. Su-pervised algorithms learn from a set of training examples that have beenmanually labeled, and are able to predict the labels for unlabeled signals.Labeling the training examples is a labour-intensive task, and the qualityof a supervised system depends critically on the size of the training set forapplications with high variability and dimensionality such as audio indexing.
Classification algorithms have been extensively applied to musical audio sig-nals in MIR, for tasks where some sort of consensus is assumed. Examplesinclude musical genres (Guaus, 2009) or mood (Laurier, 2011). A similar ap-proach can be used when indexing audio recordings for the purpose of musiccreation. For example, supervised techniques have been applied to classi-fication of musical instrument sound samples (Herrera et al., 2002; Martinand Kim, 1998). However, outside of musical instruments, it may be diffi-
1http://perso.uclouvain.be/vincent.blondel/research/louvain.html

4.5. supervised indexing 81
cult to find a social agreement on how to classify sounds. As mentioned, thiscan be observed by analyzing the use of free tagging in communities such asFreesound. In general, the choice of a classification scheme can be regardedas an application-dependent decision. As an example, the Looperman com-munity does rely on a fixed set of mutually-exclusive labels that allow classi-fying music loops into categories where one instrument dominates (i.e. bassloops, piano loops, and so on). For such cases, the use of supervised classi-fication algorithms could significantly lower the cost of labeling sounds, asthe categories could be automatically learnt and suggested by the systemby training a classifier on an initial set of labels. While a number of ma-chine learning classification algorithms exist, we adopt a generally acceptedintuition in the MIR community: that most development is needed in thearea of features, as opposed to new or more specialized classification algo-rithms (Herrera-Boyer et al., 2006). During the last decade Support VectorMachines (SVM) have become overwhelmingly popular, proving very effec-tive in many domains, including text (Joachims, 1998), images (Chapelleet al., 1999), video (Schuldt et al., 2004) and audio (Guo and Li, 2003).In each area, researchers need to find an appropriate set of features thatthe SVM can use. In this sense, we have already evaluated different setsof features through SVM classification in chapter 3. A detailed descriptionof the base SVM algorithm is outside the scope of this thesis, but a basicdescription can be useful to introduce the different options and parametersin our experiments.
SVM is a linear classification technique, which is extended by the so-called“kernel trick” to non-linear feature spaces. In SVM classification a trainingexample is represented using a vector of features xi and a label yi ∈ {1,−1}.The algorithm tries to find the optimal separating hyperplane that predictsthe labels from the training examples. A hyperplane with parameters wand b that separates two classes is defined as:
yi(wTxi + b) ≥ 1 (4.2)
Since data is often not linearly separable, it is mapped to an infinite dimen-sion space by a kernel function where such separation is possible. The mostcommon choice is a Radial Basis Function (RBF) kernel with parameter γ:
K(xi, xj) = e(−γ|xi−xj |2), γ > 0 (4.3)

82 automatic taxonomical organization of audio
Using the kernel function, the C-SVC SVM algorithm finds the optimalhyperplane by solving the dual optimization problem:
minα
1
2αTQα− eTα (4.4)
subject to
0 ≤ αi ≤ C, i = 1, ....N (4.5)
yTα = 0
where Q is a N×N matrix defined as Qij ≡ yiyjK(xi, xj) and e is the vectorof all ones. C is a cost parameter that controls the penalty of misclassifiedinstances given linearly non-separable data.
This binary classification problem can be extended to multi-class using ei-ther the one vs. one or the one vs. all approach. In the former approach aclassifier is trained for each pair of classes, while in the later the classifier istrained for each class using examples from all the other classes as negativeexamples. The one vs. one method has been found to perform generallybetter for many problems (Hsu et al., 2001). In the experiments section,we use the libsvm (Chang and Lin, 2001) implementation, which uses onevs. one classification. Suitable values for C and γ are found through gridsearch with a portion of training examples for each experiment.
4.5.2 Hierarchical classification
With the extension of the classification problem to multi-class classifica-tion, there are two straightforward possibilities for obtaining hierarchicalclassifications. Perhaps the most intuitive approach is to train a classifierfor each ramification. Taking Gaver’s taxonomy as an example, this wouldimply having a model to discriminate sounds from solids, liquids and gases,and then three more models to distinguish the different types of interac-tions within each level. The main problem with this approach is that whenpredicting the class of a given unlabeled sound, errors produced at the firstlevel will add up to errors in the second level. Hence, an alternative ap-proach suitable for small taxonomies is to train a single model for the lowestlevel, and simply infer the location of the sound in the other levels from thedefinition of the taxonomy. In our experiments with Gaver’s taxonomy, thisapproach tends to give better results.

4.6. experiments 83
4.6 Experiments
4.6.1 Human vs. computational factors
As we have discussed, in this chapter we explore the use of content-basedtechniques to organize large databases of sounds for music creation. Ourfocus is not necessarily obtaining semantic labels, in the sense of describingthe source of the sound, but obtaining abstract categories that are consistentwith respect to their acoustic properties.
We performed a preliminary user experiment in order to test this ideaof abstract audio lexicons as content-based groupings of sounds generatedthrough machine learning (in this case graph-based clustering). Our aimwas to understand what are the factors that influence the ability of users tolearn a particular lexicon. To this end, we analyzed the task of predicting towhich grouping does a given sound belong. Particularly, we expected thatqualitiy measures from the clustering solution would be determinant for thistask. We were also interested in what human factors would influence theresult.
Most of this work was published in (Roma et al., 2012b).
Methodology
Clustering The experiment was carried out before the developmentof the modularity-based approach described in section 4.4. We usedChameleon (Karypis et al., 1999), an algorithm based on kNN graphs thatoptimizes the minimum cut of the graph. Roughly speaking, a minimumcut is a partition of the graph that crosses the minimum possible number ofedges. A partial implementation is available in the closed-source CLUTOpackage (Karypis, 2002). In contrast, open source implementations of sev-eral modularity optimization algorithms are available for different platforms.In order to obtain a test dataset, we first clustered a large database of 10.000sounds obtained from Freesound, all shorter than one second in order toavoid sounds with many sound events and timbre variation.
Internal quality measures are often used to evaluate the obtained clusteringsolution. One common approach is to analyze the similarities within eachcluster to understand how compact it is, and the similarities between pointsof each cluster and all points in the others to measure how well separatedare the different clusters in the solution. For this purpose, the vcluster pro-gram in the CLUTO package outputs z-scored values of the similarity (in
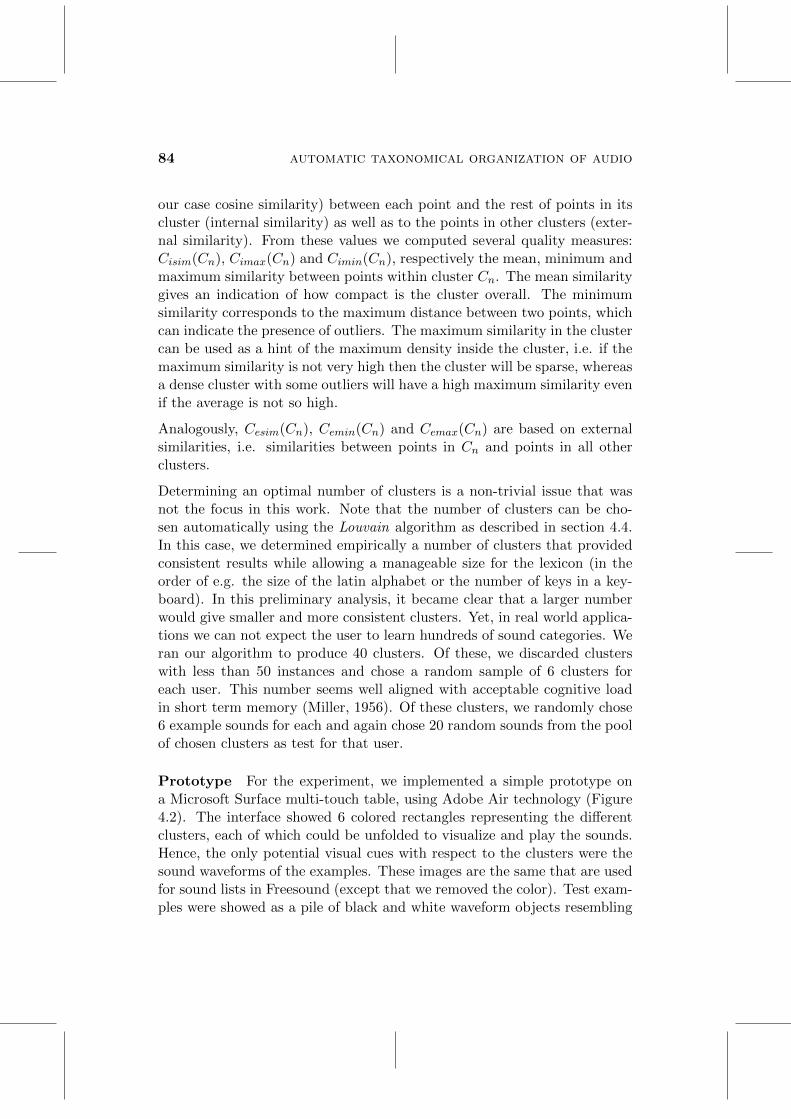
84 automatic taxonomical organization of audio
our case cosine similarity) between each point and the rest of points in itscluster (internal similarity) as well as to the points in other clusters (exter-nal similarity). From these values we computed several quality measures:Cisim(Cn), Cimax(Cn) and Cimin(Cn), respectively the mean, minimum andmaximum similarity between points within cluster Cn. The mean similaritygives an indication of how compact is the cluster overall. The minimumsimilarity corresponds to the maximum distance between two points, whichcan indicate the presence of outliers. The maximum similarity in the clustercan be used as a hint of the maximum density inside the cluster, i.e. if themaximum similarity is not very high then the cluster will be sparse, whereasa dense cluster with some outliers will have a high maximum similarity evenif the average is not so high.
Analogously, Cesim(Cn), Cemin(Cn) and Cemax(Cn) are based on externalsimilarities, i.e. similarities between points in Cn and points in all otherclusters.
Determining an optimal number of clusters is a non-trivial issue that wasnot the focus in this work. Note that the number of clusters can be cho-sen automatically using the Louvain algorithm as described in section 4.4.In this case, we determined empirically a number of clusters that providedconsistent results while allowing a manageable size for the lexicon (in theorder of e.g. the size of the latin alphabet or the number of keys in a key-board). In this preliminary analysis, it became clear that a larger numberwould give smaller and more consistent clusters. Yet, in real world applica-tions we can not expect the user to learn hundreds of sound categories. Weran our algorithm to produce 40 clusters. Of these, we discarded clusterswith less than 50 instances and chose a random sample of 6 clusters foreach user. This number seems well aligned with acceptable cognitive loadin short term memory (Miller, 1956). Of these clusters, we randomly chose6 example sounds for each and again chose 20 random sounds from the poolof chosen clusters as test for that user.
Prototype For the experiment, we implemented a simple prototype ona Microsoft Surface multi-touch table, using Adobe Air technology (Figure4.2). The interface showed 6 colored rectangles representing the differentclusters, each of which could be unfolded to visualize and play the sounds.Hence, the only potential visual cues with respect to the clusters were thesound waveforms of the examples. These images are the same that are usedfor sound lists in Freesound (except that we removed the color). Test exam-ples were showed as a pile of black and white waveform objects resembling

4.6. experiments 85
Figure 4.2: Picture of the prototype
a deck of cards. Dragging each card to the vertical area below the colorshape corresponding to each cluster colored the object to the cluster color,which signaled that the sound was assigned to that cluster.
The experiment was divided in two main tasks. In task 1, participants wereasked to listen to the sound examples of each cluster. In addition, theywere asked to annotate any words or tags needed to identify and remembereach cluster in sticky paper notes that were attached to the table aboveeach cluster area. This allowed us to analyze how the users understoodthe clusters. In task 2, participants were asked to classify the stack of testsounds into the clusters according to their similarity by dragging them tothe appropriate area.
The use of a large multi-touch table provided a more embodied interactionthat allowed us to observe and analyze participants movements and strate-gies. Video was recorded with two cameras positioned non-intrusively: gen-eral view and close-up view. Video output from the device was also capturedfor complementing the analysis.
Finally, a questionnaire was filled in with basic demographic information,as well as some questions about their own confidence in the performed taskand the criteria they followed for the classification.

86 automatic taxonomical organization of audio
The study took part in the Computing department of the Open Univer-sity (UK). Most of the participants were familiar with computers, althoughnot necessarily with music or audio-related topics. In total there were 14participants (9 males, 5 females) with ages from 21 to 50 and a diversityof nationalities and cultural backgrounds. Most had some kind of musicaltraining: 4 reported no training at all, 4 some degree of music training and6 of them more than five years. With respect to familiarity with electronicmusic creation, 8 of them reported no previous experience, 5 of them hadsome familiarity, and one of them was a regular user of electronic musiccreation tools.
Data analysis After the experiment, we had several sources of data foranalysis. The prototype logged the classification choices performed by users,and kept the information about the clusters that were presented. On theother hand, the footage from the cameras was used for video analysis, whichis a common tool in human-computer interaction studies (Jordan and Hen-derson, 1995). This technique allows for a great deal of detail if comparedto more traditional HCI methods, but requires time and a clear focus withrespect to the problem at hand. We followed observations made during theexperiment and an initial overview of the video to define our target variables(described in the next section). The Elan2 software was used for the videoanalysis. The main advantage of this program is that it allows hierarchicalspecification of the code for annotating the video. We used the annotations,along with the data from the questionnaire, for qualitative and quantitativeanalysis of user-related factors. Finally, we used the data from the cluster-ing and the logged results for quantitative analysis of factors related withthe clusters.
Results and discussion
We analyzed both qualitative and quantitative aspects of the experiment inorder to understand which factors could determine the correct assignmentof sounds to their own cluster as computed by the clustering algorithm.This assignment was encoded as a binary variable for each of the testedsounds. Each participant was given 20 sounds, so in total there were 280assignments. We aggregated the results in order to analyze the data fromthe point of view of the user and from the point of view of the clusteringalgorithm. In the first case, the target variable was the fraction of correctly
2 http://www.lat-mpi.eu/tools/elan, developed at the Max Planck Institute for Psy-cholinguistics, Nijmegen, The Netherlands Sloetjes and Wittenburg (2008)

4.6. experiments 87
Table 4.1: Variables obtained from the experiment
Cluster level
Csize Cluster size (|Cn|)Cimean Average internal similarity
Cimax Maximum internal similarity
Cimin Minimum internal similarity
Cemean Average external similarity
Cemax Maximum external similarity
Cemin Minimum external similarity
User level
St1s1 Pre-listening of all table
St1s2 Listening to neighbor clusters
St2s1 Listening to examples again
assigned sounds by each user, and in the second, the fraction of correctlyassigned sounds for each cluster. Table 4.1 shows a summary of all variablesresulting from the experiment. To understand human factors related tothe proposed task, we did a qualitative analysis of the responses to thequestionnaire, as well as an analysis of the video footage. The fraction ofsuccessfully assigned sounds in each user oscillated around 40% (mean =0.44, sd = 0.5).
We found several recurrent themes in the analysis of the questionnaire andpaper notes, as well as the responses referring to the criteria used to classifythe sounds. They are summarized in Table 4.2. Most popular criteria couldbe classified as Sound sources and Sound properties.
In the video analysis we observed some relevant aspects related with thebehavior of participants. Our main observation was that participants fol-lowed different strategies in both tasks. In task 1, there were 3 participantswho started by pre-listening to all or most of the sounds on the table beforestarting. This group devoted more time in the two tasks, and one of themscored the best result. Another difference was found between those partici-pants who explored neighbor clusters before labeling a given one, and thosewho did not. In task 2, we observed that some participants tended to relyon their written notes, while others went back to listening to the exampleswhen deciding to which cluster they would assign the sound. All but one

88 automatic taxonomical organization of audio
of the participants who correctly assigned more than 50% of the soundsfollowed this strategy of constantly comparing the test sound with exam-ples. We confirmed the significance of these differences through two-samplet-tests over the three binary variables: users who followed strategy St1s1(pre-listening to the whole table) took longer (p < 1e−15) and did better(p < 1e−04), as well as users who followed strategy St1s2 (looking at contigu-ous clusters) (p < 1e−07). The result for St2s2 showed that the group thatkept listening to sounds performed better (p < 0.02). We further countedthe number of times the example sounds and test sounds were played forthe first 10 test sounds (after that, users tended to classify without playingthe examples again). The overall count of plays of the examples in task2 for each user correlates with the recognition rate (r = 0.64), while thecorrelation of number of plays of the test sound was very small (r = 0.122).In all, we were able to extract more significant variables from the learningphase (task 1), and the relevant outcomes in the classification phase stillseemed to refer to learning strategies, which reflects the importance of thisstep.
We focused with some more detail on the three participants that scoredbest. All of them referenced concepts related to sound sources as theircriteria in the questionnaire. Their notes taken during task 1 tended tobe more consistent and easier to compare. During each classification task,they tended to maintain attention until they located the target cluster. Onetechnique that was particular to these users was fast pre-listening of severalexample sounds in a cluster, which produced a quick audio summary of thatcluster. After some iterations, the different clusters had been learned andpre-listening was no longer necessary.
When looking at the results aggregated from the point of view of clusters,recognition rate was similar but with less variation (mean = 0.48, sd = 0.2).In order to understand the importance of different measures of cluster qual-ity defined above, we built a multiple linear regression model using thesemeasures as independent variables and the recognition rate as dependentvariable. One common problem with linear regression is multicollinearitydue to correlation of the independent variables, which can give mislead-ing results. We checked the Variable Inflation Factor (VIF), for controllingmulticollinearity problems, and ensured that it was below 10, which is theusually recommended threshold (Hair et al., 2010). This forced us to re-move the Cimin and Cemin variables, which represent the maximal internal/external distance (minimal similarity) and thus are highly related to thecorresponding mean variables. We also removed Cemax, as it didn’t make

4.6. experiments 89
Table 4.2: Themes and classification criteria followed by users extractedfrom the questionnaire and paper notes (italics indicate verbatim quotes)
Themes Classification criteria
Source of the sound (16)
· instruments (5): e.g., bass (2), drums (3)
· onomatopoeias (1): e.g., click click (1)
· speech/vocal (2)
· non-speech (1)
· physical source (2): physical phenomena(1) / physical objects (1)
· electronic sounds (4): e.g., synthesizerbanks (1), base/moog (1), sound effect (1)/ synthetic or futuristic sounds (1)
· everyday sounds (1)
Sound properties (10)
· pitch/brightness (2) / tone (2)
· length (3)
· dichotomies (2): e.g., hard/soft (1),loud/low (1)
· sound envelope (1)
Experiential (5)
· general feel (1)
· instinct/intuition (2)
· stories (1)
· music experience/knowledge (1)
Acoustic / visual similarity (5)
· sound similarity (2): e.g., similar soundfeatures (2)
· similarity (1)
· visual similarity (2): e.g., waveform (1) /waveform icons (1)
Sound description (3)· categories/tags (3): e.g., my own postits(1), categories (2)
Overall sound (1) · mainly the sound (1)

90 automatic taxonomical organization of audio
any significant contribution to the model. Table 4.3 shows the coefficientsof the model. Perhaps surprisingly, Cimax, the maximum similarity withinthe cluster, has the highest significant impact over the recognition rate,much higher than the average similarity. This means that clusters withhigh maximum similarity were easy to learn while clusters with low maxi-mum similarity were difficult. In relation with the lower weight of the meansimilarity, this suggests that clusters containing high-density areas allowan easier association of acoustic features with a single label, while sparseclusters, where the closest two points are not particularly close (even if theaverage similarity stays high) should be avoided. The rest of coefficients aremore or less predictable. The size of the cluster has a small but significantnegative effect, which suggests that smaller clusters are to be preferred.
Table 4.3: Regression analysis for cluster-level variables
Variable Estimate Std. Error t value p
Cimean 1.1229 0.6682 1.68 0.1048
Cimax 22.5082 9.6593 2.33 0.0278
Csize -0.0009 0.0004 -2.19 0.0378
Cemean -2.1158 0.8856 -2.39 0.0244
R2R2R2 0.3666
In all, the experiment provided valuable insights with respect to the possi-bility of using automatic indexing of sounds into abstract lexicons definedby acoustic properties.
From the point of view of users, the result of our experiment stressed theimportance of the learning phase, where most significant differences betweenusers were observed. This suggests that interfaces for applications based onclustering could make use of a specialized interface for learning the clusters.Also, interfaces should make it easy to compare the sounds of differentclusters. Finally, it seems that both references to sound sources and keyacoustic properties in each cluster are common labels that users associatewith the partitions.
From the point of view of the clustering algorithm, the experiment highlightsthe ability of clustering algorithms to find areas of high density. Still, this isnot a trivial issue with heterogeneous data such as the sounds in Freesound,as preserving diversity is also important for creative applications.

4.6. experiments 91
4.6.2 Clustering through modularity optimization
As introduced in section 4.4, modularity-based clustering of knn graphs canbe used for automatically indexing large audio databases in musical applica-tions. In this experiment, we compare this approach to common clusteringalgorithms. While finding datasets labelled with hierarchical structure isdifficult, the datasets described in chapter 3 allow us to evaluate the mod-ularity clustering scheme to some extent with flat partitions (note that thedares scenes dataset was obtained after completing this experiment, so itis not included). It should be noted that the idea of graph clustering is es-pecially suited for unstructured and unevenly distributed data, where otheralgorithms fail. Among the available datasets, the ones extracted fromcommunity-driven sites (Freesound, Looperman and Indaba) are the mostinteresting in this case.
Methodology
Evaluation of clustering is always a tricky issue, as whether the groupingsfound by the algorithm are a good representation of the data may be verysubjective. However, when labels are available, several measures can beused to compare the partition found by the algorithm with the originalset of labels. These are called external validity measures, as opposed tointernal validity measures, which require no labels. Internal measures area bad choice for comparing algorithms, since many algorithms are actu-ally based on optimization of some of these measures. The adjusted Randindex (Hubert and Arabie, 1985) is a commonly used external clustering va-lidity measure. Given two partitions (the ground truth and the clusteringsolution) of the same set of elements, if a is the number of pairs of objectsthat are in the same set in both partitions, b the number of pairs that arein different sets in both partitions, and c, d, the number of pairs that are indifferent sets in one partition and in the same in the other and vice-versa,the rand index is defined as
R =a+ b
a+ b+ c+ d(4.6)
The adjusted-for-chance version (with E(R) as the expected value of R) isthen:
AR =R− E(R)
Max(R)− E(R)(4.7)
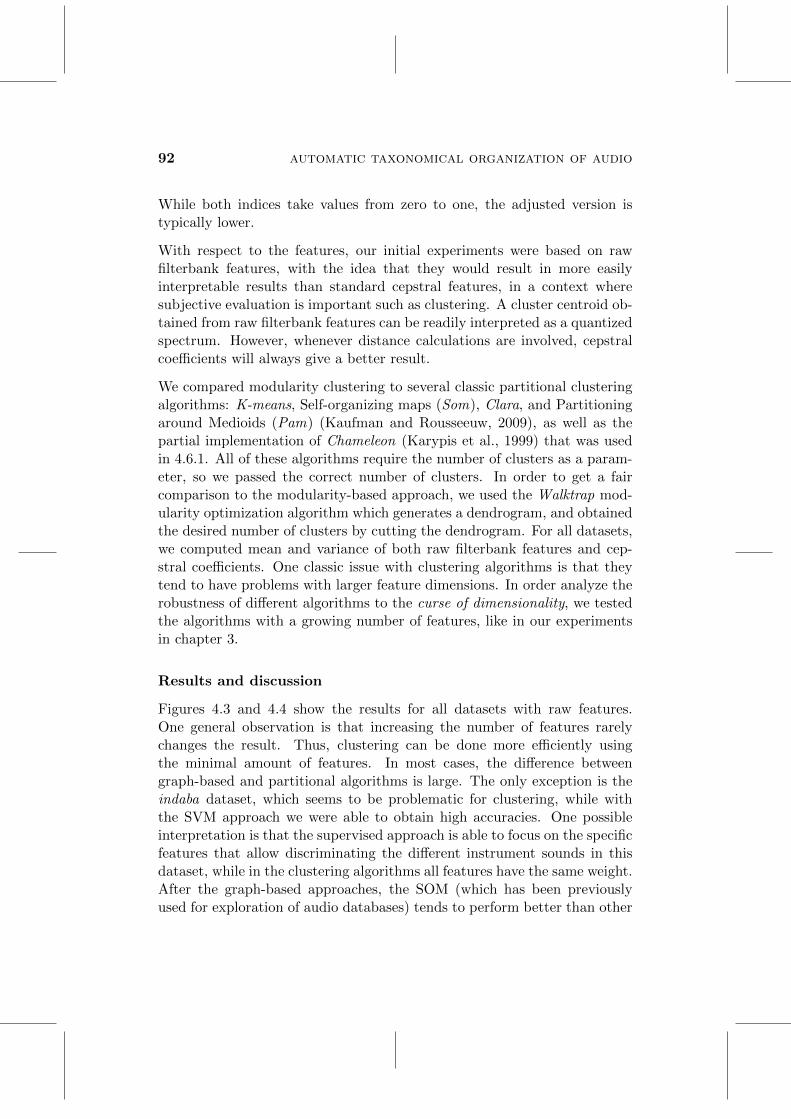
92 automatic taxonomical organization of audio
While both indices take values from zero to one, the adjusted version istypically lower.
With respect to the features, our initial experiments were based on rawfilterbank features, with the idea that they would result in more easilyinterpretable results than standard cepstral features, in a context wheresubjective evaluation is important such as clustering. A cluster centroid ob-tained from raw filterbank features can be readily interpreted as a quantizedspectrum. However, whenever distance calculations are involved, cepstralcoefficients will always give a better result.
We compared modularity clustering to several classic partitional clusteringalgorithms: K-means, Self-organizing maps (Som), Clara, and Partitioningaround Medioids (Pam) (Kaufman and Rousseeuw, 2009), as well as thepartial implementation of Chameleon (Karypis et al., 1999) that was usedin 4.6.1. All of these algorithms require the number of clusters as a param-eter, so we passed the correct number of clusters. In order to get a faircomparison to the modularity-based approach, we used the Walktrap mod-ularity optimization algorithm which generates a dendrogram, and obtainedthe desired number of clusters by cutting the dendrogram. For all datasets,we computed mean and variance of both raw filterbank features and cep-stral coefficients. One classic issue with clustering algorithms is that theytend to have problems with larger feature dimensions. In order analyze therobustness of different algorithms to the curse of dimensionality, we testedthe algorithms with a growing number of features, like in our experimentsin chapter 3.
Results and discussion
Figures 4.3 and 4.4 show the results for all datasets with raw features.One general observation is that increasing the number of features rarelychanges the result. Thus, clustering can be done more efficiently usingthe minimal amount of features. In most cases, the difference betweengraph-based and partitional algorithms is large. The only exception is theindaba dataset, which seems to be problematic for clustering, while withthe SVM approach we were able to obtain high accuracies. One possibleinterpretation is that the supervised approach is able to focus on the specificfeatures that allow discriminating the different instrument sounds in thisdataset, while in the clustering algorithms all features have the same weight.After the graph-based approaches, the SOM (which has been previouslyused for exploration of audio databases) tends to perform better than other

4.6. experiments 93
traditional clustering algorithms. With respect to graph-based algorithms,modullarity works generally better than Chameleon as implemented in theCLUTO package (Karypis, 2002).
d_case_scenes
adju
sted
Ran
d in
dex
number of features
in_house_scenes
adju
sted
Ran
d in
dex
number of features
d_case_events
adju
sted
Ran
d in
dex
number of features
indaba
adju
sted
Ran
d in
dex
number of features
Figure 4.3: Comparison of graph-based clustering to classic clustering algo-rithms for the smaller datasets, as a function of the number of features

94 automatic taxonomical organization of audio
looperman
adju
sted
Ran
d in
dex
number of features
freesound_packs
adju
sted
Ran
d in
dex
number of features
freesound_tags
adju
sted
Ran
d in
dex
number of features
gaver_events
adju
sted
Ran
d in
dex
number of features
Figure 4.4: Comparison of graph-based clustering to classic clustering algo-rithms using raw filterbank features for the larger datasets, as a function ofthe number of features

4.6. experiments 95
d_case_scenes
adju
sted
Ran
d in
dex
number of features
in_house_scenes
adju
sted
Ran
d in
dex
number of features
d_case_events
adju
sted
Ran
d in
dex
number of features
indaba
adju
sted
Ran
d in
dex
number of features
Figure 4.5: Comparison of graph-based clustering to classic clustering algo-rithms using cepstral coefficients for the smaller datasets, as a function ofthe number of features

96 automatic taxonomical organization of audio
looperman
adju
sted
Ran
d in
dex
number of features
freesound_packs
adju
sted
Ran
d in
dex
number of features
freesound_tags
adju
sted
Ran
d in
dex
number of features
gaver_events
adju
sted
Ran
d in
dex
number of features
Figure 4.6: Comparison of modularity clustering to classic clustering algo-rithms using cepstral coefficients for the larger datasets, as a function of thenumber of features

4.6. experiments 97
With respect to using cepstral coefficients, the results are not so clear (Fig-ures 4.5 and 4.6). Graph-based algorithms still provide a better result inmost cases, but the difference in many cases is small. This can be dueto some ceiling effect, since all algorithms generally achieve good scores.The difference in the case of the freesound tags dataset (which was par-ticularly difficult also for supervised classification) supports the idea thatin the other datasets classes have an homogeneous distribution of cepstralcoefficients, which makes them an easy task for clustering. On the otherhand, partitional algorithms heavily rely on distance computations, whichare more reliable when using cepstral coefficients, so the difference betweenboth cases is larger. Graph-based algorithms only rely on distance com-putations for constructing the kNN graph, and in that case only the rankof distances (for selecting the nearest neighbors) is relevant, and not theactual distance values. Another noticeable difference can be apprecaitedbetween Chameleon and modularity in the in house scenes dataset, whichis composed of very diverse recordings. The difference is likely related withthe fact that Chameleon removes some outliers (even if we tried to minimizethis effect through the parameters, following the documentation, to ensurea fair comparison). Outlier removal could hence be applied to improvemodularity clustering.
In all, our results indicate that graph-based clustering works better thantraditional partitional algorithms for clustering audio, particularly in dif-ficult situations such as unstructured data. The freesound tags dataset isa good example of this, as the same tag may be applied in different waysby users, and distances between sounds can be different for each tag de-pending on the generality of the term. In addition, the Louvain method formodularity clustering can be used to automatically find non-binary hierar-chical structures. This is uncommon in hierarchical clustering algorithms,which usually output a dendrogram. We compare this approach to a parti-tion obtained via supervised classification on a large dataset in experiment4.6.4.
4.6.3 Flat vs. hierarchical supervised classification
In the supervised case, we have described the use of SVM classifiers forautomatic taxonomical indexing. As we have mentioned before, SVMs arealready ubiquitous for audio classification, so it is not necessary to evaluatethem for audio classification in general. For application to taxonomicalclassification, we have mentioned two straightforward approaches: we may

98 automatic taxonomical organization of audio
train a hierarchy of multi-class classifiers, or we may just train one singlemulti-class classifier at the lowest level, and infer the higher levels from thetaxonomy itself. In this experiment we compared both approaches with thegaver taxonomy described in section 4.2.
Methodology
The methodology is similar to the experiments of chapter 3. In this case,to compare both approaches, we randomly partitioned the database into atraining and a test set (80% and 20% respectively) and repeated the process10 times. In each round, we trained either the flat classifier or the set ofhierarchical classifiers with the training set, and computed the predictionsfor the test set. We extracted mean, variance and RQA features, computedfrom GFCC coefficients, from the gaver dataset, in this case taking intoaccount the two levels of the taxonomy for the labels. The flat classifierwas trained using the one-to-one approach with the 11 base classes of thetaxonomy. For the hierarchical classification approach, we trained one one-to-one classifier for the three kinds of material (solid, liquid and gas), andthen another classifier for each one, using only the training examples of thecorresponding material. For each test sound in the hierarchical approach,we first predicted the top class with the first classifier, and then appliedthe second-level classifier depending on the result. Because of the randompartition, the number of examples per class was not balanced. In bothcases, we computed the average F-measure, which is more appropriate thanaccuracy for dealing with unbalanced datasets. We averaged the F-measurebetween classes, and again for each round.
Results and discussion
Figure 4.7 shows the F-measure for the flat and the hierarchical approach.Both classifiers tend to choose the correct class about 70% of the times,which is not a bad result considering the generality of the concept of gaver’staxonomy and the number of classes, which implies a baseline of 9% for arandom classifier. Particularly in the case of music creation applications,some the errors may be acceptable as they are still based on content de-scriptors. A more detailed view is provided by (row-normalized) confusionmatrices for both levels (Figure 4.8). Here, numbers indicate the fraction ofcorrectly classified sounds for each class. In the case of the top level, bothapproaches perform very well, and the flat approach (where the top levellabel is inferred from the lower level label) can perform even better than di-
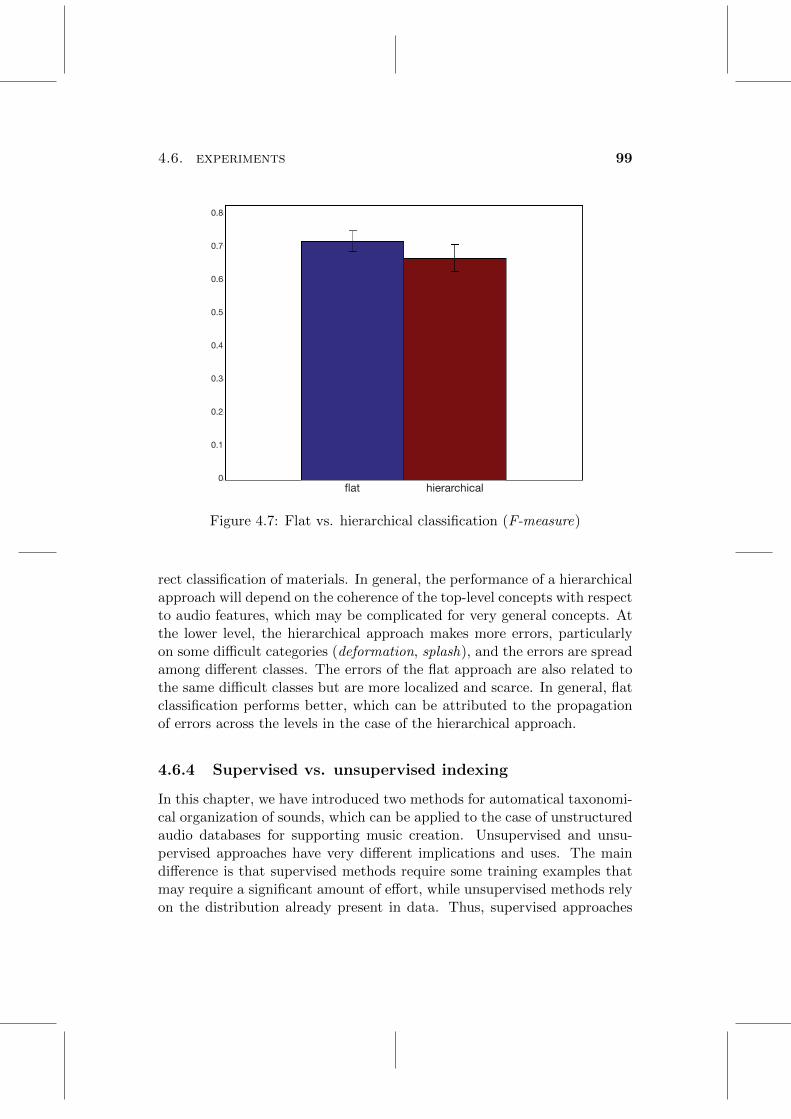
4.6. experiments 99
0.7
0.8
0.6
0.5
0.4
0.3
0.2
0.1
0�at hierarchical
Figure 4.7: Flat vs. hierarchical classification (F-measure)
rect classification of materials. In general, the performance of a hierarchicalapproach will depend on the coherence of the top-level concepts with respectto audio features, which may be complicated for very general concepts. Atthe lower level, the hierarchical approach makes more errors, particularlyon some difficult categories (deformation, splash), and the errors are spreadamong different classes. The errors of the flat approach are also related tothe same difficult classes but are more localized and scarce. In general, flatclassification performs better, which can be attributed to the propagationof errors across the levels in the case of the hierarchical approach.
4.6.4 Supervised vs. unsupervised indexing
In this chapter, we have introduced two methods for automatical taxonomi-cal organization of sounds, which can be applied to the case of unstructuredaudio databases for supporting music creation. Unsupervised and unsu-pervised approaches have very different implications and uses. The maindifference is that supervised methods require some training examples thatmay require a significant amount of effort, while unsupervised methods relyon the distribution already present in data. Thus, supervised approaches

100 automatic taxonomical organization of audio
gas
liquid
solid
solid liquid gas
0.100.99 0.07
1.000.08 0.00
0.030.17 0.98
0.120.99 0.08
0.980.20 0.08
0.000.20 0.98gas
liquid
solid
solid liquid gas
w
w
e
s
r
p
d
i
d
s
r
r s d i d p r s e w ww
w
e
s
r
p
d
i
d
s
r
r s d i d p r s e w w
Figure 4.8: Row-normalized confusion matrices
can be seen as top-down, in the sense that somebody (typically an expert)has to devise the taxonomy that will be used to index sounds. Unsuper-vised approaches can be seen as bottom-up and, particularly in the case ofcommunity-driven databases, reflect groupings that emerge from differentviews, so in a way they depend on self-organization of the community. Inorder to compare both approaches for the case of unstructured audio data,we performed a user experiment, where we asked users to find sounds usinga visual representation of a taxonomy without labels. The idea was to testthe usefulness of the supervised and the unsupervised indexing approachesfor interacting with large audio databases in an intuitive way, for classes ofsounds that are derived from content descriptors, and not from semanticdescriptions. Our hypothesis is that bottom-up clustering based on modu-larity optimization can at least match the results of a top-down classificationapproach for indexing sounds in unstructured databases, without the needof labelling training examples. The experiment focused on sound events,

4.6. experiments 101
extracted from the Freesound database.
Methodology
We analyzed all of the Freesound database, and identified all sounds con-taining a single event using the HFCfb onset detection function describedin chapter 3. However, we did not segment the original sounds but re-tained just the ones containing a single event. This resulted in a databaseof 28.295 sounds, which were analyzed in the same way as in the previousexperiment. We then used the gaver taxonomy dataset to train a flat classi-fier, and indexed all sounds according to the gaver taxonomy. The classifierwas trained with probability estimates, which allowed us to know, for eachsound, the probability that it belongs to a given category in the taxonomy.In order to obtain a comparable taxonomy using the modularity clusteringapproach, we used the Louvain algorithm to obtain a multi-level partition,and then discarded the nodes containing less sounds, allowing a maximumof 4 children for each taxonomy node.
Figure 4.9: Screenshot of the prototype
We developed a web prototype where the taxonomies were displayed graph-ically (Figure 4.9). Nodes in the taxonomy could be unfolded and foldedto display or hide their children. For each node in the taxonomy, 10 ex-ample sounds were selected as “previews”. The examples were selected atthe lowest level of the taxonomy and then, for higher levels, examples weresampled uniformly from children nodes. In the case of the SVM-based ap-proach, examples were the sounds with maximum probability estimates. In

102 automatic taxonomical organization of audio
the unsupervised approach, we computed the centroid of each cluster andsorted the sounds according to their distance to the centroid. Rolling themouse over the taxonomy nodes allowed the user to listen to the examplesfor each class, in the same fast-skipping style that some participants usedin the first experiment. When a final node (with no children) was selected,a list of 20 sounds corresponding to that node was presented. These weresorted using the same criteria as the examples described above. The pro-tocol was as follows: each user was presented a series of 20 challenges, 10for each taxonomy (in random order). For each challenge, a target soundwas presented, and the task was to locate the sound among the final lists of20 sounds by navigating through the tree and playing/listening to sounds.Sounds could be played as many times as needed. The taxonomy was meantto help in the process of finding a sound in a sample of the database (thesample size was adapted to so that the user could do the task in about 20minutes). In order to keep the duration of the experiment to a manageablerange, users were instructed to find the most similar sound they could findto the target sound, so that they would not spend to much time finding theexact sound.
With this set-up, we measured several variables corresponding to the cost ofnavigating the taxonomy: the number of visited nodes (V N), the numberof unfolded nodes (UN), the number of times that the target sound wasplayed (TP ), and the number of candidates played (CP ). We also computedthe distance between the target and the chosen sound in the taxonomy(as the number of common ancestors, TD) and the content-based distancebetween both (CD). We then performed several ANOVA tests using thesemeasures as dependent variables, in order to see if their variances could beexplained significantly depending on the type of taxonomy. Perhaps morethan the cost of navigation, we were interested in the users ability to learnthe taxonomical organization, in the light of the findings in experiment 4.6.1.In order to understand how users were able to learn each taxonomy, wedivided the 10 trials in two groups and computed the mean of each variablefor each group of 5 trials. For each user and taxonomy, we computed thedifference between the first and the second group of trials. The hypothesiswas that users would require each time less visits to the different nodesin the taxonomy in order to find the target sound (with some fluctuationgiven the different relative difficulties of the random target sounds). Wealso analyzed the user as a potentially relevant factor, and whether theexact sound had been found or not (which can help understanding why auser spends a lot of time browsing the taxonomy). The experiment also

4.6. experiments 103
included a final questionnaire with some demographic information and aquestion about what part of the experiment was found to be easier.
After a pilot test, the experiment was completed by 16 participants, onlyone of them female. Ages ranged from 20 to 50. Most of them (12) had morethan 5 years of music training, and the same number considered themselvesexperts in music technology.
Results and discussion
Figure 4.10 shows box plots to summarize the distribution of each of theaforementioned variables with respect to each of the taxonomies. The valuesfor the corresponding ANOVA tests are shown in table 4.4. Clearly, thereis a significant effect of the taxonomy over the navigation costs, with thesupervised approach requiring less user interaction, which indicates thatusers spent less time navigating the taxonomy. Also, the number of cor-rectly identified sounds was higher for the supervised approach. However,this approach also required significantly more time to be spent on the listof candidate files. This is precisely what the taxonomical indexing tries toavoid: to have users listen to the sounds one by one. Instead, they areexpected to learn the taxonomy in order to find sounds. After listening tothe sounds selected by each approach, it seems clear that the unsupervisedapproach tends to find clusters of very similar sounds. This seems to be thereason that users allowed themselves to settle on a similar sound instead ofthe original sound. Hence, with respect to the content-based distance, thesounds selected using the unsupervised taxonomy were in the end signifi-cantly closer to the original. Also, with respect to the direct question ofwhich part was easier, 44% of users opted for the unsupervised taxonomy,25% for the supervised taxonomy and 31% found them equally difficult (notethat the order of the parts was randomized, users were asked if they hadfound part 1 or part 2 easier). Thus, the cost of listening to the candidatesounds seems to be what relates to the perception of difficulty of the task.
Figure 4.11 and the corresponding table (4.5) show the box plots andANOVA tests for the difference between the first and the second half ofthe trials of each taxonomy, with respect to all of the cost variables. Inmost cases, the type of taxonomy is shown to be relevant for explainingthe variance in the cost variables, with a higher weight than the user vari-able. In general, the unsupervised approach tends to have positive values,indicating that the costs decreased between the first and the second part ofeach round for each user. Thus, the results indicate that the longer time

104 automatic taxonomical organization of audio0
5010
015
020
0
supervised unsupervised
VN
510
1520
2530
35supervised unsupervised
UN
010
2040
3050
supervised unsupervised
TP
010
020
030
040
0
supervised unsupervised
CP
020
4060
80
supervised unsupervised
CD
Figure 4.10: Box plots for the experiment variables with respect to the twotaxonomies

4.6. experiments 105
Table 4.4: Results of the ANOVA tests with the cost variables and thebinary found variable
Df Sum Sq Mean Sq F value p
taxonomy 1 1.51 1.51 6.37 0.0121
user 1 1.38 1.38 5.82 0.0164
Residuals 317 75.30 0.24
FOUND
taxonomy 1 12115.50 12115.50 22.60 0.0000
user 1 5813.63 5813.63 10.84 0.0011
found 1 806.02 806.02 1.50 0.2211
Residuals 316 169416.34 536.13
VN
taxonomy 1 70.31 70.31 1.88 0.1713
user 1 9.64 9.64 0.26 0.6120
found 1 11.80 11.80 0.32 0.5746
Residuals 316 11815.73 37.39
UN
taxonomy 1 784.38 784.38 15.55 0.0001
user 1 611.10 611.10 12.11 0.0006
found 1 15.44 15.44 0.31 0.5805
Residuals 316 15941.33 50.45
TP
taxonomy 1 14311.25 14311.25 3.10 0.0793
user 1 4266.03 4266.03 0.92 0.3373
found 1 8868.18 8868.18 1.92 0.1668
Residuals 316 1459632.02 4619.09
CP
taxonomy 1 63.90 63.90 96.81 0.0000
user 1 4.43 4.43 6.71 0.0101
found 1 129.58 129.58 196.30 0.0000
Residuals 316 208.59 0.66
TD
taxonomy 1 1710.93 1710.93 9.79 0.0019
user 1 3038.52 3038.52 17.38 0.0000
found 1 46960.03 46960.03 268.65 0.0000
Residuals 316 55236.65 174.80
CD

106 automatic taxonomical organization of audio-40
-20
020
40
unsupervised supervised
VN1-VN2
-10
-50
5unsupervised supervised
UN1-UN2
-50
5
unsupervised supervised
TP1-TP2
-200
-150
-100
-50
050
unsupervised supervised
CP1-CP2
-1.0
-0.5
0.0
1.0
0.5
1.5
unsupervised supervised
TD1-TD2
-20
-10
010
unsupervised supervised
CD1-CD2
Figure 4.11: Box plots for the relative change in experiment variables withrespect to the two taxonomies

4.6. experiments 107
Table 4.5: Results of the ANOVA tests with the relative change in variables
Df Sum Sq Mean Sq F value p
taxonomy 1 2051.20 2051.20 6.70 0.0148
Residuals 30 9190.01 306.33
VN1-VN2
taxonomy 1 84.50 84.50 4.07 0.0526
Residuals 30 622.46 20.75
UN1-UN2
taxonomy 1 52.53 52.53 6.56 0.0157
Residuals 30 240.32 8.01
TP1-TP2
taxonomy 1 8450.00 8450.00 2.91 0.0986
Residuals 30 87218.56 2907.29
CP1-CP2
taxonomy 1 0.06 0.06 0.11 0.7420
Residuals 30 16.65 0.55
TD1-TD2
taxonomy 1 0.16 0.16 0.00 0.9688
Residuals 30 3060.83 102.03
CD1-CD2
spent pre-listening to the taxonomy examples was associated to a betterunderstanding of the taxonomy, which resulted in less time spent playingthe candidate examples. Our general interpretation of the experiment isthat a top-down approach provides easily understandable concepts, whichrequire less time to understand, but leave no room for improvement. Partof this success can be attributed to the strategy of selecting the best ex-amples with the probability estimates of the SVM classifier. However whenreaching down to the last level, sounds are less uniform and users need toplay more sounds in order to find what they are looking for. Contrastingly,the bottom-up approach does not require labeling training examples andis based on the existing groupings in the data. Interacting with this typeof taxonomical organization may require some learning, and the choice ofappropriate strategies for selecting examples will be critical. However in the

108 automatic taxonomical organization of audio
end searching sounds using the unsupervised approach is perceived as aneasier task, as when the final sounds are reached, the groupings are moreconsistent.
4.7 Conclusions
In this chapter we have analyzed automatic organization of sounds intotaxonomies, using machine learning methods with the low-level representa-tions described in the previous chapter. The main ways to obtain such tax-onomies are either top-down classification, based on predefined categories,or bottom-up clustering based on the data distribution. We have presenteda novel method for clustering audio by modularity optimizattion on kNNgraphs. Graph-based clustering helps adapting to different densities foundin user-driven databases. Many algorithms based on modularity optimiza-tion exist, some of which can deal with large scales such as currently foundin online audio databases. This provides a flexible framework that can es-timate the number of clusters, find a partition for a user-specified number,or even compute a non-binary hierarchical partition. We have also shownthat modularity-based clustering tends to perform better than traditionalpartitional clustering algorithms. With respect to supervised classification,we have analyzed the use of conventional SVM classifiers with a generalenvironmental sound taxonomy. We have seen that direct classification ofthe last level in the taxonomy tends to perform slightly better than usingdifferent classifiers at each level. Finally, we have conducted a user ex-periment comparing top-down and bottom-up methods for generating tax-onomies. The results indicate that top-down classification, as described inthis chapter, helps in finding representative sounds that make taxonomiesunderstandable. However, at lower levels they do not provide consistentgroupings as clustering algorithms for large databases. Taxonomies basedon clustering, again using our proposed method, are more easily learnt sothey seem more appropiate for long-term users.
In all, the techniques described in this chapter should be useful for inter-acting with large databases, affording a different interaction style than textsearch or Query by Example (QbE). In this case, users can learn soundtaxonomies that are created without the need of manually annotating allthe sounds, and find interesting sounds by memory. However, there is stillwork to do in order to understand how this kind of taxonomies could workin practice for very large datasets. Particularly of interest is choosing ap-propriate representatives for clustering-based taxonomies. Bottom-up and

4.7. conclusions 109
top-down approaches could be combined in order to otain the benefits ofeach method. In addition to navigating databases, these taxonomies canalso be used for obtaining symbolic representations of music based on audiosamples. We analyze this possibility in chapter 5.


Chapter 5
Representing music as work inprogress
5.1 Introduction
In chapter 1, we have commented on the opportunities that shared storageopens for music creation based on audio. Practically any audible soundcan be captured into an audio recording, and thus audio samples can po-tentially be used in any musical genre, at the expense of flexibility. Mostmusic produced nowadays involves at some point editing digital audio, sothe boundaries between specifically audio-based musical practices and otherkinds of music have become fuzzy.
In this thesis we analyze audio-based music creation on the web. In this con-text, separation of musical structure from the audio samples allows the useof hosting services and shared databases for the audio data, while musicalstructure can be represented and exchanged using text markup formats suchas XML or JSON (Figure 5.1). In creative activities, music structure can betypically stored in lightweight documents that may change frequently, andtransmitted through established text communication channels, such as stan-dard web technologies or email, including environments with constrained orexpensive bandwidth (e.g. mobile connections). Multiple revisions of textdocuments can also be managed using existing revision control systems,including WebDAV (Whitehead Jr and Wiggins, 1998). The use of ver-sion control for music collaboration has been investigated in the CODESproject (Miletto et al., 2009). Version control is also obviously used oftenfor music represented as computer programs. In this chapter, we propose
111

112 representing music as work in progress
a music representation based on text markup, where each text documentmay make reference to a number of bigger sized audio files. Transmissionand local caching of these files can be managed independently between eachparticipant and the remote location through standard web technologies andservices, which avoids the need of potentially complex specialized p2p toolsfor the synchronization of audio collections among different participants.
<txt>
v1
v2
v2b
Figure 5.1: Markup plus audio representation
In recent times, JSON has generally replaced XML as the de facto repre-sentation for exchanging data in web applications and services, althoughwithout the emphasis on interoperable standards. On the other hand Mu-sicXML has become a successful standard for applications using classicalwestern music notation, including online tools such as Noteflight1. How-ever, there are many musical practices that cannot be represented usingclassic western notation. In this chapter we propose a representation foraudio-based music that can be easily encoded as JSON or XML, and af-fords the definition of simple grammars for organizing collaboration. Wedescribe a proof-of-concept experiment where this representation was usedin a collaborative music creation prototype. The proposed approach allows
1http://www.noteflight.com

5.2. grammar framework 113
the identification of common patterns in user-submitted musical artifactsbased on audio samples.
Part of this chapter was published in (Roma and Herrera, 2010b) and (Romaand Herrera, 2013).
5.2 Grammar framework
For the case of collaborative music composition, grammars provide a suit-able framework for sharing, reusing and assembling parts of music compo-sitions. In this sense, a grammar can serve as the formal representation ofnested musical fragments, and eventually support the metaphor of a com-mon language. As an example, a group of users or a program could establishsome rules with respect to music compositions, such as defining a fixed setof instruments for all pieces, or some common structural elements. Thiscould be interpreted as a set of grammar rules for music creation. From thepoint of view of analysis, grammars can be used for computational modelingof the style of different participants or groups in collaborative applications.From the perspective of generation, they can serve to facilitate creativityby producing new combinations of sounds, or to assist the search of suitablesounds for a given musical context. Thus, while the main concepts of for-mal grammars can be found in any textbook, we now provide a summary inorder to introduce the idea of using grammars for audio-based online musiccreation.
5.2.1 Formal grammars
A formal grammar is usually defined as a 4-tuple (V,Σ, S, P ), where:
Σ is a terminal alphabet, a set of symbols that are used to form sentences inthe language. In common music notation, terminals could be note pitches,note durations or chords, while in sample-based music they can be soundobjects (Roads, 1978), or specific sound object classes. V is an alphabet ofnon-terminal symbols or variables. Variables represent strings of terminalor non-terminal symbols in intermediate stages of the generation. In amusic composition process, variables can be used, for example, to representgroups of terminals that are often used together, such as chords or rhythmicpatterns. S is the start symbol, a special variable that is used to begin thegeneration process. P is a set of production rules that allow a given stringto be replaced by another string. For example they can specify how a partof a musical piece can be replaced by its subparts.

114 representing music as work in progress
In summary, a formal grammar can be described as a set of rules that rewritea string of symbols with another one. For example the rule A →AB definesthat a string composed of the symbol “A” can be replaced (rewritten) bythe string “AB”. This rule can be used to generate the string “AB” inpresence of string “A”. Thus, the rule could be applied recursively to “AB”to produce “AAB”, and so on. Also, it can give one possible explanation ofhow the string “AB” (or “AAB” for that matter) was produced in a givenlanguage.
Intuitively, grammars can be understood as a formal way to specify struc-tural groupings of a language. For example we can state that all sentencesin a natural language are composed of a “noun”’ sub-sentence and a “verb”sub-sentence, and then define a rule that describes this decomposition us-ing abstract symbols (say S → NV). The application to common structuressuch as typical pop song structures is straightforward.
5.2.2 Graph Grammars
One issue of music grammars that is not covered by linguistics or formallanguages literature is parallelism (Baffioni et al., 1984). Some of the ex-periments with grammars for music generation in the 70s and 80s involvedthe use of parallel rules, where two parallel tokens are meant to start at thesame time (Roads, 1978; Holtzman, 1980). However, parallel rules in stringgrammars introduce some ambiguity. For example if we have a musical se-quence “AB” and a parallel rewriting rule “A → D/E” (meaning that Dand E start at the same time), it is not clear, upon replacement of A, if Bwill follow after D or after E. Graph grammars provide a general frameworkthat allow us to deal explicitly with sequential and parallel structures.
Graph grammars were introduced by Pfaltz and Rosenfeld in the late1960s (Pfaltz and Rosenfeld, 1969) as an extension of traditional gram-mars to languages of directed graphs. A directed graph is defined as a tuple(N,E) where N is a set of nodes and E a set of edges that connect nodesin a certain direction. Clearly, strings are a class of directed graphs wheresymbols are nodes and edges define the sequence of symbols. In this sense,edges of a string define a total order relation. For acyclic graphs, the setof edges defines a partial order relation on the nodes, which allowed thegeneralization of string grammars to acyclic directed graphs.
A graph grammar can be defined in similar terms to string grammars. How-ever, graph rewriting productions are more complex than string rewritingproductions as they have to define how to connect the result of the pro-

5.3. tree representation 115
duction to the enclosing graph. Thus, productions are defined as triples(α, β,E) where α is the (sub)graph to be replaced and β is the replacement,while E defines the embedding of β in the host graph. Graph grammarscan be categorized in the same way as string grammars. In addition, graphgrammars can focus in nodes or edges in different ways. For example, nodereplacement grammars (Engelfriet and Rozenberg, 1997) are context-freegraph grammars where the left hand of each production is restricted to asingle node.
Development of graph grammars has continued over the years both at atheoretical and at a practical level, fostered by applications in very diversefields such as image recognition or graphical languages for engineering (An-dries et al., 1999). The extension of strings to graphs seems naturally suitedfor music representation by explicitly dealing with parallelism. However, ex-periments with graph grammars for music are rare in the literature. Someworks (Holder and Cook, 2009; Madsen and Jørgensen, 2003) have usedthem for mining classical music scores represented as graphs with multiplepossible connections between consecutive notes. Since these connections arenot specified in the score, accounting for all potential connections bears acomplexity that may be avoided in the context of music creation.
5.3 Tree representation
For the case of online creation, graphs can be used to represent music struc-tures where nodes represent sounds from a shared database. We namethese musical artifacts as “sample patches”. A simple representation forsuch patches is a rooted tree. A rooted tree can be defined as a directedacyclic graph with a root node where there is a unique path from the rootnode to any node. Vertical rooted trees are commonly used to representmonophonic melodies or rhythms, as well as music structure. An exam-ple of music representation with a vertical hierarchy is MusicXML (Good,2001). On the other hand, a horizontal tree allows representing multipletracks and can be used to encode music in real-time, when the end of thepiece is not known, without backtracking. In this chapter, we explore theuse of horizontal rooted trees for audio-based music representation. Fig-ure 5.2 shows two example representations for a drum pattern. Figure 5.3shows an example of a vertical tree to represent the drum/snare pattern forcomparison.
The use of horizontal rooted trees affords an intuitive playback model but

116 representing music as work in progress
implies two main limitations. On one hand, no cycles can exist in thegraph. This means that edges define a partial order relation, which allowsthem to represent unambiguous time sequences. Also acyclic graphs arecontractable (Pfaltz and Rosenfeld, 1969), which allows the definition ofgrammar expansion rules. One limitation of this approach is that it isquite common in music to use cyclic structures. This means that musicalcycles should be understood as repetitions of a single node, potentiallyrepresenting a contracted subgraph (Figure 5.4). A second restriction ofthis representation is that a given node can only be the target of one edge.Two edges arriving at the same target would imply the scheduling of thesame node (and all the following structure) at two different moments intime, which has the effect of creating multiple audible tracks from the samegraph specification, and breaking the intuition of the temporal sequenceof the representation. Given these restrictions, reproducing music encodedin the graph can be thought as a tape head spawning copies of itself atthe bifurcations of the tree. The main issue is how to generate the linksbetween samples, since in traditional sequencer representations, links arenot specified. The two alternatives are either to get the user to specifythe links as part of the music creation process, or to create them in theinterface according to some predefined rule. For example in a drum machineinterface, the rule could be to generate always a string for each type of sound(i.e example a in Figure 5.2).
5.4 Lexical generality level
Historically, the interest in formal grammars for music composition wasinfluenced by their success with natural language. In natural languages,the meaning of words has generally nothing to do with their written orphonetic representation, it is defined by convention. The same happens withmany musical symbols such as notes, which refer to a discretized accousticproperty in an abstract manner. This parallelism in the use and articulationof discrete symbol systems has been related to a more general principle ofself-diverifying systems, which enables music creativity (Merker, 2002).
The concept of a lexical map between terminal tokens of a grammar andactual sound objects was investigated by Roads (1978). Roads defined threegeneral forms of lexical mapping: arbitrary, injective and polymorphic. Inthe first case, a symbol was arbitrarily mapped to a sound object. The twoother types required a lexicon of sound objects that is grouped accordingto some acoustic features. In injective mapping each terminal mapped to
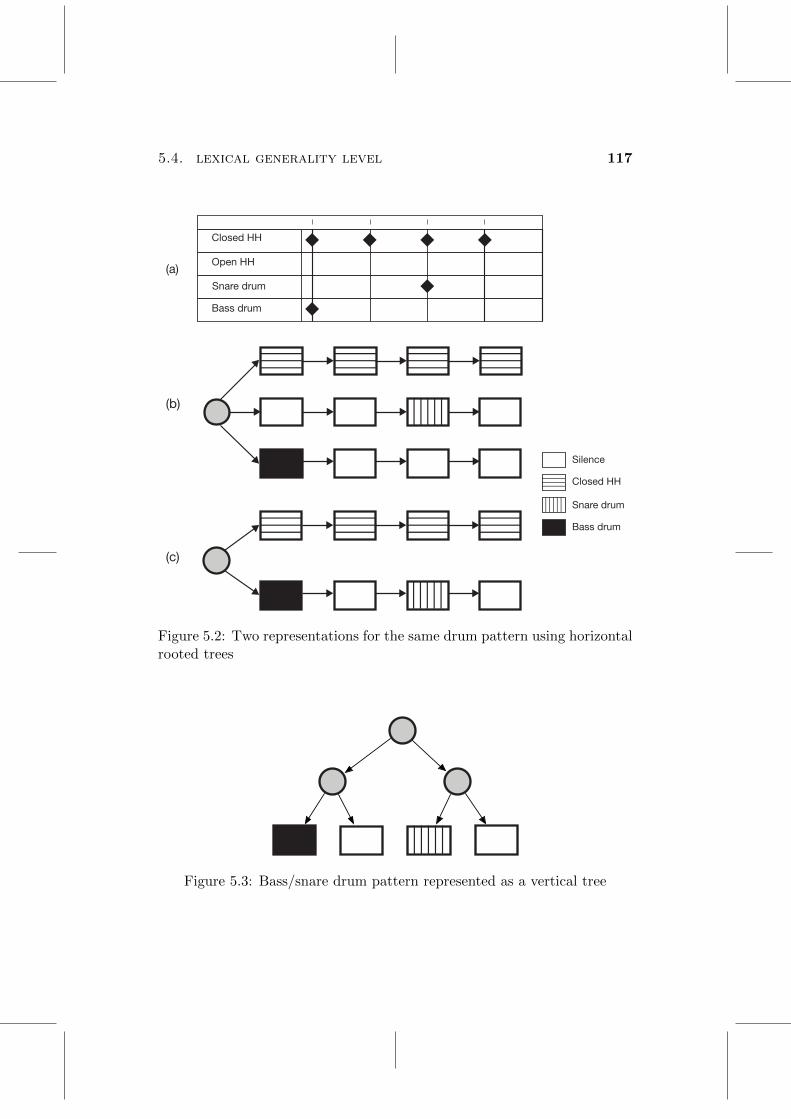
5.4. lexical generality level 117
Silence
Closed HH
Snare drum
Bass drum
Closed HH
Open HH
Bass drum
(a)
(b)
(c)
Snare drum
Figure 5.2: Two representations for the same drum pattern using horizontalrooted trees
Figure 5.3: Bass/snare drum pattern represented as a vertical tree

118 representing music as work in progress
ABC ABC ABC
A B C
(a)
(b)
Figure 5.4: Loop represented as repetitions of the contracted subgraph
one sound from the ordered lexicon. Polymorphic mappings were regardedas a complex situation (equivalent to context-sensitive rules), allowing one-to-many and many-to-one correspondences with the lexicon.
Using current content-based audio analysis techniques, these ideas can beapplied for symbolic representation of audio-based music. In this sensewe may consider the alphabet of symbols used for grammar rules to be apartition of a collection of sound objects, so that all elements of the databaseare mapped to some symbol of the alphabet. If the partition is hard (i.e.,each sound belongs to only one group), the mapping is equivalent to apolymorphic “one-to-many” mapping in Roads’ terminology (“injective”mapping being a particular case when there is one sound per group). Softpartitions, such as fuzzy or overlapping partitions would pose additionalproblems. For example mining patterns in musical graphs where each nodecan have more than one label would result in a combinatorial explosion.A perhaps more sensible approach is to consider different perceptual facets(e.g. pitch, timbre, loudness) where hard partitions can be used to obtaina discrete symbol system, and use different grammars for each facet.
As we have seen in chapter 4, one way of dealing with large databases is toautomatically compute taxonomies from content descriptors. This meansthat the same sound will belong to different (hard) classes depending on thelevel of the taxonomy. Thus, for dealing with large audio databases, it isconvenient to define different lexical generality levels, corresponding to setsof nodes that are considered to be at the same height in the taxonomy. Atthe top level, all sounds would be labelled with the same label, which definespurely structural patterns. As we descend in the taxonomy, we obtain larger

5.5. finding patterns 119
alphabets, and more specific patterns. This approach allows the extractionof patterns with different levels of detail.
5.5 Finding patterns
We have described how grammars are commonly used both to parse oranalyze the structure of musical compositions and to generate new compo-sitions. In the context of online music making, grammar rules can be usedto analyze and model the style of different users or groups, and suggest po-tential interesting combinations of sounds. Grammars can also be seen asan agreement between remote collaborators working in different parts of amusical work, and they can be implicitly or explicitly enforced or supportedthrough music creation interfaces.
A graph grammar rewriting rule defines that a node of the host graph can bereplaced by a subgraph. In Node Label Controlled (NLC) grammars (En-gelfriet and Rozenberg, 1997) embedding rules are defined globally for allrules as relations among nodes with some specific labels. This mechanismcan be used as a simple approach to define musical grammars for collabora-tion. For example, one may concede that any music fragment (representedas a horizontal tree) has a starting point and an ending point, representedby virtual terminating nodes. A node replacement grammar can then bedefined so that when a node is replaced by a graph, the starting point in-herits incoming edges of the replaced node, and the ending point inherits itsoutgoing edges. The ending node does not need be the one that ends last,but the node that conceptually ends a given pattern. This strategy doesnot allow maintaining parallel connections among “tracks” in each patch.Still, it can be argued that the need of such parallel connections implies theneed of separate rules.
In this simplified setting, grammar expansion rules consist in trees that canbe collapsed and contained in other trees. There are two main alternativesfor defining such rules: user-defined groupings, and automatic groupings.User-defined groupings allow sharing sample patches for embedding intoother patches. This can be done by defining virtual start and end nodes forthe embedding (Figure 5.5). In addition, automatic groupings can be foundinside patches for analysis purposes.

120 representing music as work in progress
A
B
C
A
D
start end
X Y
patch_1 patch_2
start
end
X Y
patch_2
(a)
(b)
(c)
start end
A
B
C
A
D patch _1
Figure 5.5: Illustration of the process of embedding a patch into anotherpatch

5.5. finding patterns 121
5.5.1 User-defined groupings
In the first case, groupings can be supported by the interface as part of thecreation activity, so that parts can be exchanged between participants. Inthis case, expansion rules are defined structurally by these groupings, andgrammars can be inferred at different lexical levels. Here, frequent patternscan be identified as isomorphic trees. Two trees are considered isomorphicif there exists a mapping between the nodes and the edges of both treesthat preserves the structure. In practice, it can be said that they are thesame tree but can be drawn in different layouts. Isomorphic labelled treescan be found using algorithms such as VF2 (Cordella et al., 2004), whichbuilds and explores a search space of partial mappings between two graphs.Also, for user-defined groupings it is possible to use edit distances to definesimilarities between sample patches. Tree edit distances (Bille, 2005) workin the same way as string edit distances, by defining a set of operations forconverting one tree into another (node addition, node removal, and noderelabeling). Ideally, different costs can be defined for these operations. Inour case, since labels are generated by content-based audio analysis, relabel-ing cost can be defined by distances between content-based representationsof clusters or classes, such as the distance between cluster centroids. Themost classic algorithm for computing tree-edit distances was based on thesimplification of assuming that the order between siblings in trees is mean-ingful (Zhang and Shasha, 1989). However, this limitation does not makesense for sample patches. More recently, the distance for unordered treeshas been related to the problem of isomorphic subgraph matching (Bunke,1997) which has allowed the definition of unordered tree edit distance algo-rithms (Torsello and Hancock, 2003).
5.5.2 Automatic groupings
Another use case for defining grammar rules is assuming larger trees gen-erated by user activity, such as in real-time music performance sessionswhere users do not explicitly define groupings in the generation of the tree,although they may be implicitly repeating patterns. In this case, the iden-tification of frequent patterns can be done through Frequent Subgraph Dis-covery (Kuramochi and Karypis, 2001) algorithms. Several algorithms havebeen defined that can deal with rooted trees: gSpan (Yan and Han, 2002),Sleuth (Zaki, 2005) or Subdue (Holder et al., 1994).

122 representing music as work in progress
5.6 Experiments
Evaluation of music representations is complicated, especially by the factthat many are proposed on aesthetic grounds. Early experiments with gram-mars for music composition, and particularly the idea of mapping grammaralphabets to sound objects Roads (1978) were motivated by aesthetic fac-tors. With respect to the framework proposed by Wiggins et al. (1993), therepresentation proposed in this chapter would achieve a level of structuralgenerality comparable to symbolic notations, and the maximum level of ex-pressive completeness, attributed to waveform representations. Ultimately,fully evaluating the potential of the possibilities for finding patterns enabledby the approach proposed in this chapter would require larges quantities ofuser-generated data. However, development and support of a large scale webapplication are out of the scope of this thesis. As a proof of concept, we im-plemented a basic prototype that allows the creation of musical works usingthe described representation on top of Freesound. The user experiment wasdone before the development of content-based indexing approaches definedin Chapters 3 and 4, and thus search was based on text queries. Analysisof user creations was done at a later stage using content-based indexing.The interface consisted of a flash application that connected to a pythonback-end. This interface was based on three panels that describe a cre-ative workflow, and a tray shared by all panels to keep a palette of samples(Figure 5.6):
• Sample tray: By default, the tray contained a blank node that repre-sents silence. The tray allowed duplicating any object and particularlysilence objects of different durations could be created.
• Search panel: The search panel allowed retrieving samples and ex-isting patches from the database. Sounds could be searched by tag,file name or user name, and a sound duration limit was specified (bydefault 10 seconds). Patches could be searched by file name or username. Selected objects were dragged to the tray.
• Edit panel: The edit panel allowed the user to modify the start andend points of a sample, thus creating a new clip. This operation pro-duced a new entry in the global alphabet of terminal nodes. Since theuser might be interested in adding several instances of this terminalto the patch, the edit settings modified a master copy represented bythe visual element in the tray.

5.6. experiments 123
(a)
(b)
(c)
Figure 5.6: Screenshots of the user interface of the prototype: a) edit panelb) search panel c) composition panel

124 representing music as work in progress
• Composition panel: In the composition panel the user could edit asample patch with the samples and patches in the tray. Two rectan-gles in this panel represented the start and end terminal nodes. Theuser was then asked to create a composition where a path existedfrom the start to the end. When saving the patch the user decidedwhether to share it with the community or to keep it for herself.Users could continue to edit their own patches as long as they werenot shared. When loading a patch to the tray, all the sounds and sub-patches used in that patch were also loaded. Shared patches could nolonger be modified (although new versions could be created throughduplication). The reason was that modifying a shared patch couldunexpectedly modify someone else’s patch. Given more communica-tion features, modification of shared patches could have been enabledin some cases for faster collaborative creation.
When the user saved a patch, the object structure was encoded in a JSONfile, the patch was rendered to an audio waveform, and a thumbnail ofthe composition panel was generated. All files were sent and stored in theserver.
5.6.1 Case study
In order to test the idea of rooted tree grammars for undirected collabo-ration, we put the prototype online with some baisc usage explanations.During the initial trial period, we collected about 65 patches from 15 users.Of these users, most generated one or two patches, and two went on tocreate 16 and 21 patches respectively. We will call these users “A” and“B”. The first one recognized himself as an expert using music productiontools, but didn’t have any programming or computer science background,while user B is a music technology graduate student. During this informaltest, it was clear that people understood and used the possibility of nestingcompositions at different levels. However we also found that more intensiveuse of this feature would require a pre-existing motivation for collaborating,for example an already established team. For example, Figure 5.7 shows apatch created by user A, who reportedly forgot about the possibility of nest-ing patches. Editing this kind of patch quickly becomes tedious, althoughadding some features to the interface could help. As a comparison, thepatch below exploited this feature conveniently, which allows concentratingon the higher level structure and, in the case of individual use, the modifi-cation of the repeated portions of the piece at once. It became clear that

5.6. experiments 125
this may require some practice. With the data collected during the test,69% of patches contained no nested structures, 18% contained one level andthe remaining 8% more than one level. Almost half of the patches with asyntactic level higher than zero were generated by user B. On the otherhand, some users nested other patches in their first creations. In all, 54%of all patches participated in some nesting relation, either contained or ascontainers. These tend to have a lower number of nodes (mean 6.9,sd 4.8)than patches with no nesting relation (mean 10.5,sd 7.6).
(a)
(b)
Figure 5.7: Examples of a) using / b) not using nested structures
5.6.2 Data analysis
In order to test the ideas about pattern detection based on sample patchesexplained in this chapter, we labelled the sample patches by applying theLouvain modularity clustering algorithm described in chapter 4. In to-tal, 356 samples were used, which represents a very small fraction of theFreesound database. Also, the experiment was previous to our work on the

126 representing music as work in progress
identification of different kinds of sounds reviewed in chapter 3, and theprototype did not focus on any specific type of sound. In order to adaptto this situation, we restricted the clustering to the sounds that were usedin the experiment. The same ideas could be applied at a larger scale toapplications based, for example, on music loops. The clustering done withmean and variance of 13 MFCC coefficients available at the time from theFreesound database. Using a value of 5 neighbors for k resulted in a taxon-omy of 2 levels with 8 and 19 clusters respectively. For the sake of simplicity,we use the first level in our diagrams. Table 5.1 shows the size and the threemost representative tags from Freesound for each of the clusters. Label 0 isreserved for start and end nodes, and 1 for silence, while -1 means that asound had been deleted (by its author) from the database.
Table 5.1: Clusters from sounds used in the experiment
Label N sounds Tags (occurrences)
2 50 voice (7), horror (6), scream (6)
3 10 talk (7), vocal (7), female (7)
4 47 synth (9), pad (7), clarinet (6)
5 33 barcelona (10), boqueria (5), market (5)
6 53 loop (10), kick (7), drum (6)
7 49 hit (7), processed (6), noise (5)
8 38 echo (4), loop (4), noise (4)
9 41 percussion (7), loop (5), effect (5)
10 15 loop (7), street (3), ambient (3)
User-defined groupings
As we have seen, the restrictions imposed by the representation imply thatsample patches can be directly interpreted as the rules of a grammar, atdifferent levels defined by the lexical mapping. Figure 5.8 shows severalnested patterns labelled at the first lexical level defined by the modularityclustering. The nested structures reflect the unorganized collaboration ofthree different users, authors of the 5 patches, as well as the authors of allsounds involved. In this case, different music pieces could be generated bychoosing different sounds from the same clusters. On the other hand, char-acterization of users and groups could be done based on frequent isomorphicpatches, which could also be automatically exchanged. We checked the pos-

5.6. experiments 127
Figure 5.8: Rules defined by the patches of 3 different users

128 representing music as work in progress
Figure 5.9: Repeated patterns found using VF2
sibility for finding isomophic patches using the VF2 algorithm to compareall terminal patches (this is, without nested subpatches) between them. Inthis case, there were only some basic repeated isomorphic patches the toplexical level (figure 5.9). Clearly, finding isomorphic patches would require amuch larger quantity of user-generated data. In this sense, the experimentserves as a proof of concept. On the other hand, it is also possible to findautomatic groupings as frequent subgraphs inside user-generated patches.We explored this possibility in the next experiment.
Automatic groupings
In order to analyze the possibility of finding sub-patch level patterns, weran the Subdue program (Holder et al., 1994) on a file with all the patcheslabelled according to different lexical levels. Subdue accepts a minsize op-tion to specify the minimum number of nodes of the identified subgraph.Obviously, the larger this number, the harder it will be to find frequentpatches. By using several lexical generality levels (the top level that la-bels all sounds with the same value, two clustering levels, and the lowestlevel where each sound is labelled with its own node id) we could test theintuition that this number makes it possible to adjust the number of pat-

5.6. experiments 129
terns that are identified. Figure 5.10 shows the results for different minsizevalues on a logarithmic scale. Clearly, the number of detected subgraphsdecreases monotonically for all sizes with the lexical level. This impliesthat this technique can be used to adjust for detecting patterns at differentlevels, potentially controlling for the number of sounds and users involved.For example characterizing individual users could be done by finding fre-quent patterns at lower levels, while large user groups would require higherlevels. Figure 5.11 shows the most frequent subgraphs identified by Subduewith minsize=4. Considering that clusters 4 and 9 contain typically loopsand electronic sounds (table 5.1), it seems clear that at larger scales thiskind of analysis would allow to characterize the music style and compositionstrategies of users, in this case predominantly repetitive electronic music.
log(
inst
ance
s)
lexical level
103
102
101
100
0 1 2 3
minisize=2
minisize=3
minisize=4
minisize=5
Figure 5.10: Number of identified subgraphs as a function of the lexicalgenerality level for different graph sizes

130 representing music as work in progress
Figure 5.11: Frequent subgraphs identified by Subdue with minsize=4

5.7. conclusions 131
5.7 Conclusions
The idea of music creation based solely on audio recordings should not besurprising for anyone familiar with electronic music tools. Considering anascent medium with important limitations such as web audio, there aresome specific affordances that can be exploited. One is taking advantageof large audio databases in traditional web development architecture mod-els. Another is enabling collaboration. In this chapter we have presented arepresentation that can be used in web-based environments to create con-catenations of audio samples. We proposed “sample patches”, defined asrooted trees where nodes represent audio samples, as horizontal represen-tations that are easy to understand and can be manipulated by computerprograms. By defining an embedding mechanism for sample patches, itis possible to specify grammars that organize colaborative music making.While we have not analyzed specific workflows, it is clear that this repre-sentation would enable different musical practices with different levels ofagreement between internet users. We conducted a proof-of-concept ex-periment that shows how this idea can be used to represent collaborativework. At the same time, it was clear that further investigation of spe-cific workflows would be necessary in order to create engaging experiences.With data generated by users, we could also validate the idea of findingpatterns in rooted trees using available implementations of graph miningalgorithms. The notion of lexical generality level can be used for adjustingthe generality of identified patterns using the approaches for taxonomicalorganization described in chapter 3. We expect that representations such asthe one presented in this chapter can play an important role in collaborativeapplications by allowing them to take advantage of information sharing.


Chapter 6
Understanding networkedcreativity
6.1 Introduction
Social networks have become a very prominent usage of the web. Manyflavors of social networking applications are frequently used by millions ofusers, many of them related to professional or hobby activities. It can beexpected that, in a near future, user networks will play an important rolein any activity based on computers, including music production. Socialnetworks, and social phenomena in general are, however, complex and hardto understand. This makes it difficult to foresee the consequences of aparticular feature or design in an application driven by social interaction.In addition, different users may have different goals and requirements, whichchallenges the definition of a general guiding principle for such applications.In this chapter, we experiment with the concept of collective creativityas a tool for understanding and devising applications for collective musicmaking based on shared data. As reviewed in chapter 2, several authorshave worked on the hypothesis that collective creativity is influenced bynetwork topologies, particularly small-world network structures.
At the time of this writing, social networks for music creation are still inearly development. Data on music creation networks (i.e. where the net-work facilitates the creation process) is generally not available. However,some analysis can already be done on communities for sharing audio clipsthat have been running for several years. Some already mentioned examplesare Freesound or Looperman. Sharing audio can be seen as an initial step
133

134 understanding networked creativity
towards audio-based collaborative music production. Audio clip sharingwebsites offer an interesting example of a collective process which producesa value that goes beyond individuals. The motivations that lead people torecord and upload sounds for free are clearly related to social factors. Thenotion of creativity, as a concept that involves both innovation and rele-vance, can serve as a measure of the success of this process. We hypothesizethat the analysis of several implicit user networks that can be extractedfrom audio sharing sites can give an insight on how this collective creativeprocess works, and test these ideas analyzing data from Freesound. Mostof the information used in our experiments is generally accessible throughthe website and could be extracted automatically from the web pages or,in many cases from the web API available for developers. For a user, thisincludes the sounds she has downloaded, the tags used for her own sounds,comments and ratings assigned to sounds, and the posts in Forums. InFreesound, all this information is publicly shared, which can be related tothe open philosophy of the site, especially with respect to content licensing.For the case of music creation, it may be possible that users are interested ingreater privacy, at least in some phases of the creation process. In any case,the analyses described in this chapter are based on statistics of anonymizeddata, and can be applied without compromising user privacy.
Most of the chapter was published in (Roma and Herrera, 2010a) and(Roma et al., 2012a).
6.2 Implicit networks in audio sharing
The three main entities that are stored in repositories of audio clips areaudio files, users, and textual descriptions of audio files. Most sites use freetags as textual descriptions of the audio content. This structure is verysimilar, although not equal, to general tagging systems, which are tradi-tionally studied as tripartite hypergraphs (Mika, 2005). In tagging systems,an annotation is seen as a link between a user, a resource and a label. Fromthis representation, several networks can be extracted, for example betweenusers on the basis of their shared resources or on the basis of shared tags.Audio clip sharing sites are different in that users normally describe the filesthey create and not those of other users. For example in Freesound, tagsare mainly generated as part of the file uploading process and, while it ispossible for any user to tag sounds, 99% of the tags are assigned by the au-thor of a sound. A possible explanation may be that, while in tagging sitessuch as delicio.us or music radios like last.fm users act as active receivers

6.2. implicit networks in audio sharing 135
of information and their main activity is consuming and describing thatinformation, in audio clip sharing there is a more practical motivation inusing these files (i.e, the creation of music or audiovisual content) and lessin directly enjoying them online. Following the idea that the communitymotivates and influences users in their contributions, we hypothesize thatimplicit user networks contain valuable information in order to understandthe dynamics of audio clip file sharing.
6.2.1 Download networks
We define the download network of an audio clip sharing system as a graphwhere each node is a user and each edge represents a file that has beendownloaded between two users. A user may download many files from thesame other user, and thus the network is a multigraph. This network canbe seen as an analogy to directed citation networks (White et al., 2004).However, for consistency with the rest of networks and with most of thesmall-world literature, we convert this graph to an undirected one. In thiscase, downloads between two users in both directions become a number ofundirected edges that represent the strength of the similarity between bothusers.
6.2.2 Semantic networks
The semantic network of users of an audio clip sharing site can be derivedfrom the concepts they employ to describe their sounds. In this case, nodesare also users, but edges represent the similarity between two users basedon their tags. Thus, if we represent a user with the vector vi = vi0...vinwhere vij is the number of files that the user i has annotated with tag j,the adjacency matrix can be defined using cosine similarity:
ai,j =vi · vj||vi||||vj ||
(6.1)
This network can also be seen as a multigraph by considering a minimumweight unit (Newman, 2004) so that similarity is expressed in integer values.
6.2.3 Shared interest networks
Another kind of network can be extracted by counting the number of soundsthat two users have downloaded in common. This type of co-occurrencetie can be thought of as an analogy to tagging systems (Mika, 2005). A
136 understanding networked creativity
user is represented by a sparse vector that represents the sounds she hasdownloaded. We define the shared interest network by computing cosinedistances between these vectors.
6.2.4 Forum and communication networks
Yet another way to represent the community can be made by measuringthe amount of communication between users, for example analyzing theactivity in a Forum. Forums are a common feature of online communitysites for sharing content. We follow standard practice by linking users thathave participated in the same threads. Hence again cosine similarity can becomputed using the vector of threads.
6.3 Network analysis
Several properties can be used to characterize the described networks. Wenow describe some of the properties that can be related to creativity mea-sures.
Density
The density of a network measures the number of links with respect to theamount of possible links given by the number of nodes. Thus it is simplydefined as
D =nmd
n(n− 1)(6.2)
where md is the mean degree and n the number of nodes. Thus, density re-flects the level of activity in networks that represent or involve interactions,regardless of the number of nodes.
Assortativity
Assortative mixing refers to the tendency of nodes to connect to similarnodes, which can be measured by different criteria (Newman, 2003). Onecommon measure is degree correlation, this is, the Pearson correlation ofnode degrees. In weighted networks, another possible measure is strengthcorrelation, where strength is the sum of the weights of the edges connectedto a node.

6.3. network analysis 137
Efficiency
The traditional small-world network model defines that the average shortestpath length is similar to the random graph. The average shortest pathlength measures the minimum number of edges that join any two nodes inthe network,
SPL =1
n(n− 1)
∑i,j
d(vi, vj) (6.3)
where d(vi, vj) is the length of the shortest path between nodes vi and vj .The problem with this property is that when the network includes discon-nected components, the distance between disconnected nodes is theoreticallyinfinite. A solution is to compute Efficiency, defined as the average of theinverse of the shortest path lengths:
Eff =1
n(n− 1)
∑i,j
1
d(vi, vj)(6.4)
When no path exists between two nodes, the efficiency is simply zero. Effi-ciency obviously grows with the number of edges of a network. In order todetermine the significance of a certain efficiency value, it must be comparedto an equivalent random graph. This graph is usually built according tothe Erdos-Renyi (ER) model, which randomly wires a specified number ofnodes given a probability p. Following the standard practice (Humphriesand Gurney, 2008) with the average shortest path length, we compute theratio of efficiency with that of the random graph:
Effr =Eff
Effrand(6.5)
Clustering coefficient
In the original model by Watts and Strogatz, the clustering coefficient wascomputed as the average fraction of neighbors of a vertex that are connectedbetween them. This is now usually known as the local clustering coefficient.For undirected graphs this is defined as
Ci =2Ei
ki(ki − 1)(6.6)
where ki is the degree of node i, and Ei counts the number of edges betweenthe nodes connected to node i. The clustering of the network is then com-

138 understanding networked creativity
puted as the average of the local clustering for all nodes. Like in the caseof efficiency, we compute the ratio CCr with the equivalent ER graph.
Small-world coefficient
Clustering and average path length are usually combined to give a measureof “small-worldness”, defined as the quotient of CC
SPL . Here we follow theconvention but using efficiency, so we define the small-world coefficient as
SWC = CCrEffr (6.7)
Modularity
We have already described modularity for clustering networks of similarsounds in chapter 4. This measure was originally developed for partitioningsocial and complex networks. Here, we use modularity clustering for findinggroups of users, and modularity value obtained for the best partition as ameasure of how divided is the network. For the case of user networks, weuse modularity as defined for undirected multigraphs, which means thatwe take into account the strength of the edges as an integer representingthe number of connections (e.g. downloads) between two nodes. Given theadjacency matrix A of a graph where Aij is the number of links betweennodes i and j, modularity is defined as
Q =1
2m
∑ij
[Aij −kikj2m
]δ(vivj) (6.8)
where m is the total number of edges in the network, and δ(vivj) is afunction that returns 1 if the group of node i and node j are the same and0 otherwise. Values above 0.3 are usually considered to indicate a modularstructure (Newman and Girvan, 2004)
Given this definition, many algorithms have been described for partition-ing a network by directly optimizing modularity. We use the Louvainmethod (Blondel et al., 2008) described in chapter 4.
6.3.1 Static vs dynamic analysis
All of the described measures can be extracted from networks that are stud-ied as static entities. Complex networks analyzed in many disciplines can beseen as a snapshot of a given state of a complex system, or as the final state

6.4. creativity measures 139
of some process. Analysis of the evolution of the network through differentstates is also common (Carley, 2003). In the case of audio clip sharing sites,the network can change significantly over time as new users register andupload more files, while other users stop visiting the site. In order to cap-ture the interactions of active users, in addition to traditional static analysiswe consider a dynamic approach where we extract the networks using onlyinformation about events happening in a given time period. In the case ofthe downloads network, this sample will include users that have uploadedsounds but not logged in that time frame. For the rest of networks, onlyactive users appear as nodes in the network. For the purposes of this study,initial experiments with “accumulated” networks (where all past events areconsidered at each sample) yielded similar results at much higher computa-tional cost, but the extracted measures suffered from high multicollinearity,which made them unfeasible for regression analysis. Hence, only interac-tions happening within one sample period are considered.
6.4 Creativity measures
The concept of creativity can be helpful in understanding online behaviorin online audio clip sharing. This notion is commonly considered to becomposed of a novelty aspect and a relevance aspect. These properties canbe attributed to creative artifacts in the context of a given community. Onesound can be more novel and/or relevant for the community regardless ofwho has uploaded it, and the same individuals can be more or less creativedepending on the moment and the community who judges their creations.For accounting the novelty component, in the next section we consider anautomatic approach that objectively describes the originality of a givensound. Since no user is assumed to have listened to all of the sounds in thedatabase, it would be difficult for anyone to judge the originality of a soundfor the whole community. Whether a sound is relevant or not seems a muchmore difficult question for a computer so we consider feedback measuresprovided by the community.
Novelty
The issue of determining the novelty of a document has been considered intext retrieval (Tsai, 2010). A simple approach to document level assessmentof novelty is to simply consider the distance to the closest neighbor of adocument. In the context of audio clips, the distance can be computedusing content-based descriptors as described in previous chapters. This

140 understanding networked creativity
allows us to compute the originality of a sound in a dataset as the distanceto its closest neighbor. In order to obtain a novelty value for a given timeframe, we use a KD-tree data structure (Bentley, 1975), where we add allsounds of the first time frame. For each subsequent time frame, we averagethe distance of each sound introduced in that time frame with the closestone in the tree. This average gives us an estimate of the amount of novelinformation introduced in the database for that period. After all sounds ina given time frame have been processed, they are added to the tree ad thenext time frame is processed.
Relevance
A common feature in web applications is to allow users to participate at leastin the form of comments and ratings. Depending on the sites, some of thesefunctionalities may be available. On the other hand, an objective measureof the success of a sound is the number of times it has been downloaded.In the case of comments and ratings, the situation may vary. In the case ofFreesound.org, comments and ratings are sparse and always very positive,so their mere presence is always an indicator of value of a sound. Thus,in this case we can use three measures: number of downloads, number ofcomments and number of ratings as indicators of the relevance of a clip tothe community. Since the number of people who download, comment orrate sounds is much larger (by a factor of 500) than that of the users whoupload sounds, we can consider these measures as measures of the successof the community of uploaders among their audience. The value for a giventime frame is obtained in the following way: for the sounds that are addedin that time frame, we consider the number of downloads, comments andratings that the sound gets during its life since then until the last date of theanalysis. Since the probability of getting feedback and downloads increaseswith the age of a sound, we normalize these values by the number of daysthat sound have been in the database. We then average for all sounds inthe time frame to obtain an indicator of the creative performance of thecommunity for that month.
6.5 Experiments
6.5.1 Community structure in Freesound
In recent years, networks have been increasingly studied as a means forunderstanding complex phenomena such as social groups and processes.

6.5. experiments 141
Several characteristics have been observed in real world networks as op-posed to basic mathematical models such as regular lattices or randomgraphs. Particularly, many real world networks can be characterized assmall worlds, and it is also common to find modular structures. Groupingsin these networks are usually referred as “communities” in the complex net-work litterature. Thus, from this point we will have to use this concept ina more technical way, signifying a group of nodes in a user network thathave more connections between them than they have with the rest of thenetwork. An early experiment with the Downloads and Semantic networksextracted from Freesound revealed that the social structure of the site re-produces these common findings, and provided some hints about the kindof social organization that can emerge from audio sharing tools. In order tocharacterize the user communities identified by network analysis, we usedthe tags employed by users to describe their sounds. As expected, the se-mantic network, built using those tags, shows more clearly defined themesin this respect, but it is also interesting to see whether the communities ofthe download network are related with different semantic topics. We use theprobability of a tag in a community Pi|Ck
=ni|CknCk
(the number of documents
annotated by tag i in community k divided by the total number of docu-ments in that community) and the analogue for the whole network Pi = ni
n .The ratio PC/PG indicates if a tag is commonly used in the community withrespect to its normal use in the whole site. Values above 1 indicate a morespecific use in this community, and tags with large values are used to char-acterize the community. On the other hand, the entropy of a communitywith respect to tags can be described using the local probabilities:
SCk= −
∑i∈Ck
Pi|CklogPi|Ck
, (6.9)
in the same sense as the genre entropy used in studies of music communities(Jacobson et al., 2008). An average of this quantity over all communities(SC) provides a hint about the quality of the partition with respect totags. A low value of the entropy of tags in the community indicates agreater homogeneity with respect to tags. Note that, usually, tags are notnecessarily as general and comprehensive as genres are in music. However,for this measures we limited tags to the most popular ones, with a frequencyof more than 1000 in the database. On the other hand, since the value ofentropy depends on the size of the community, we computed the entropy ofa proportional random partition of the network as a baseline.

142 understanding networked creativity
Download network
One thing that stands out when building the download network ofFreesound, is that a vast majority of users are only interested in down-loading files. The reason is that, in order to download files at their originalquality, the site requires people to sign in. These users could be representedby nodes with zero in-degree. However, the purpose of this study was tocharacterize the network of users who upload sounds, and we discardedusers who did not upload sounds. This gives us a reduced network of 2234nodes (out of the more than a million of registered users) and 60342 edges.In this reduced network, we find a strongly connected component of 1836nodes, about 80% of people who have uploaded some sound. The remaining20% is mainly split among users who have zero in-degree (this is, peoplewhose sounds have not been downloaded by any other author) or zero out-degree (users who have uploaded sounds but that have not downloaded anysound), with a remainder of nodes that mostly have either one incomingor one outgoing link. This structure mimics the bow tie structure that hasbeen found to characterize the World Wide Web (Broder et al., 2000)(Table6.1).
Table 6.1: Global structure of the download network: Strongly ConnectedComponent (SCC), nodes with zero in-degree (IN) and nodes with zeroout-degree (OUT)
Average Average
Part N of nodes Percent in-degree out-degree
SCC 1836 82% 32.33 31.68
IN 145 6.5% 0 21.04
OUT 187 8.4% 11.24 0
Other 66 2.9% 10.47 14.32
On the other hand, the network of authors can be characterized as a smallworld. Table 6.2 shows the average shortest path length and clustering co-efficient of the network compared to the equivalent ER graph. While theaverage distance between nodes is roughly the same than for the randomgraph, the clustering coefficient is an order of magnitude larger. Interest-ingly, assortativity is negative, which means that nodes tend to associatewith nodes of different degree.
The application of the Louvain method for community detection to this net-

6.5. experiments 143
Table 6.2: Main properties of the download network (in parenthesis, valuesfor the equivalent ER graph)
Download network properties Values
Nodes 2234
Edges 61697
Mean degree 27.62
Diameter 5
Assortativity -0.181
SPL 2.23 (2.22)
Clustering Coefficient 0.28 ( 0.024)
work reveals a structure dominated by a large community with a modularityof 0.29. Table 6.3 shows the different communities and their characteristictags. While this structure may seem similar to the global structure de-scribed by the component analysis, as a matter of fact the proportion ofnodes of each community that belong to the strongly connected compo-nent is very similar (around 80% for all communities). This discards thatthe modularity partition merely replicates the division between the giantcomponent and the rest. At the second level, this large component losessome nodes to small sibling communities, but the trend is preserved. Ananalysis of the most characteristic tags in the top level (Table 6.4) shows,however, that there are some differences in the topics preferred by eachcommunity. The main community, while more heterogeneous in the tags,is characterized by one of the most popular tags of the site: field recording,and generally concepts related to environmental sounds. Contrastingly, inthe smaller communities, concepts related with musical uses of sounds aremore salient. However, the general entropy of the partition is not muchlower than the entropy of the equivalent random partition.
Semantic network
The semantic network is itself an undirected, weakly connected component,although it contains less nodes (2161) than the download network. Themissing 27 users are disconnected from this network because they use fewand very specific tags that nobody else uses. On the other hand, the numberof edges is higher (75607) which makes a very dense network.
An analysis of the average shortest path length and the clustering coefficient

144 understanding networked creativity
Table 6.3: Number of communities, modularity, entropy and average en-tropy of equivalent random partition in download network
Download network tags Values
Communities 5
Modularity 0.29
SC 3.02
SC (random) 3.17
shows that this network can also be characterized as a small world (Table6.5). This feature is even more pronounced than in the download network.Again, assortativity is strongly negative, which is understandable from theconstruction of the network: users who use many words to describe theirsounds will be linked to users who use less (but similar) words and thereforehave a smaller degree.
Modularity-based community detection reveals a more pronounced and alsomore balanced division of the network with respect to the download net-work, with a modularity of 0.35 (Table 6.6). Here, the distribution of topicsis clearer among the different communities (Table 6.7), as could be expectedfrom the construction of the network (for example, techno appears in a com-munity with related topics, while in the download network it appeared inthe larger community along with concepts related to environmental sounds).Also, the average entropy is significantly lower than the value for the equiv-alent random partition. Several groups are related to percussive soundsused for creating rhythms in electronic music, while others seem more re-lated with voice (another popular tag of the site) or environmental sounds.The case of voice samples is characteristic: a tradition exists in Freesoundto provide recordings of voices with specific utterances upon request. Thiscommunity could be considered to reflect this activity. Some of the detectedcommunities are very small and do not contain any of the more popular tags,so they are omitted from Table 6.7.
Confusion of communities in both networks
Table 6.8 shows the amount of users in each community of both the semanticand download networks. Row and column indexes correspond to indexes ofthe communities in each network. Both partitions seem to be related, withthe main group of the download network splitting equally into two of the

6.5. experiments 145
Table 6.4: Characteristic tags in communities of download network (prob-ability ratio)
Download network communities Probability ratio Characteristic tags
Community 0, Size: 33, Entropy: 2.58
5.49 human
8.67 acoustic
2.92 short
2.01 percussion
1.55 field-recording
1.28 noise
Community 1, Size: 294, Entropy: 3.26
5.26 analog
2.52 drums
2.10 percussion
1.91 drum
1.80 beat
1.80 glitch
Community 2, Size: 32, Entropy: 2.38
6.90 percussion
6.18 metal
5.45 drum
4.66 hit
2.45 guitar
2.30 drums
Community 3, Size: 1644, Entropy: 3.48
1.59 birds
1.59 nature
1.53 male
1.50 ambience
1.42 field-recording
1.37 techno
Community 4, Size: 231, Entropy: 3.41
2.84 reaktor
2.76 multisample
2.22 drone
2.08 space
1.61 fx
1.54 electronic

146 understanding networked creativity
Table 6.5: Main properties of the semantic network (values for the equiva-lent ER graph)
Semantic network properties Values
Nodes 2161
Edges 75607
Mean degree 69.97
Diameter 5
Assortativity -0.25
SPL 2.07 (2.07)
Clustering Coefficient 0.54 ( 0.032)
Table 6.6: Number of communities, modularity, entropy and average en-tropy of equivalent random partition in semantic network
Semantic network tags Values
Communities 6
Modularity 0.36
SC 1.94
SC (random) 2.79
semantic communities. For the rest, a majority of users of a community inone network belongs to a community of the other. A χ2 test on this matrix,as a contingency table with 20 degrees of freedom returns a very small value(p = 9.5 · 10−24) which gives support to the rejection of the null hypothesisstating that both assignments are independent.
Conclusions about network structure
This first study analyzed two implicit user networks with data accumulatedover time in the Freesound database. The analysis allowed us to learnabout the structures that emerge from the community based on the rulesfor sharing audio under CC licenses (note that we now switch back to themore general concept of community). Both networks can be characterizedas small worlds with a modular structure, as commonly observed in real-world networks and related with complex social phenomena. The downloadsnetwork allowed us to have a general understanding of the structure of the
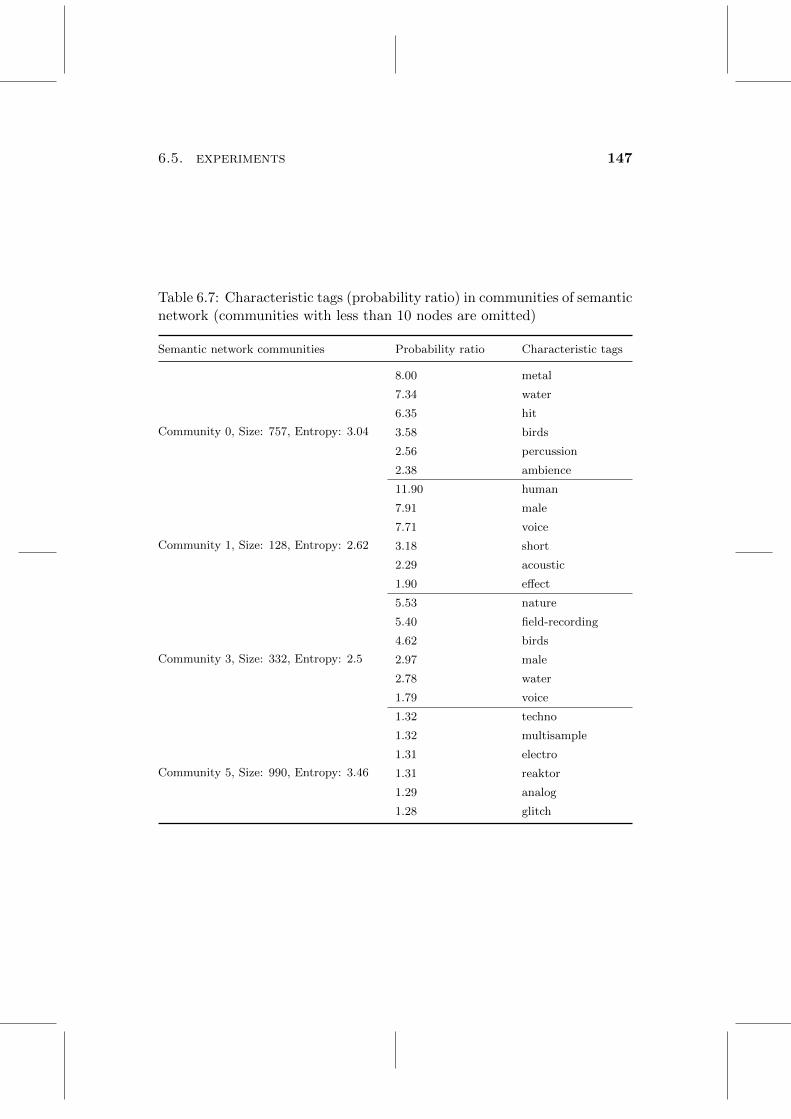
6.5. experiments 147
Table 6.7: Characteristic tags (probability ratio) in communities of semanticnetwork (communities with less than 10 nodes are omitted)
Semantic network communities Probability ratio Characteristic tags
Community 0, Size: 757, Entropy: 3.04
8.00 metal
7.34 water
6.35 hit
3.58 birds
2.56 percussion
2.38 ambience
Community 1, Size: 128, Entropy: 2.62
11.90 human
7.91 male
7.71 voice
3.18 short
2.29 acoustic
1.90 effect
Community 3, Size: 332, Entropy: 2.5
5.53 nature
5.40 field-recording
4.62 birds
2.97 male
2.78 water
1.79 voice
Community 5, Size: 990, Entropy: 3.46
1.32 techno
1.32 multisample
1.31 electro
1.31 reaktor
1.29 analog
1.28 glitch

148 understanding networked creativity
Table 6.8: Confusion matrix: count of nodes in the detected communitiesof the download (rows) and semantic (columns) networks
0 1 2 3 4 5
0 5 3 0 7 0 17
1 61 12 1 36 2 171
2 5 2 0 1 0 24
3 640 98 6 268 3 601
4 34 11 0 19 0 162
site as a giant component with appended IN and OUT components. On theother hand, the semantic network allowed a better identification of groupsof users interested in different topics, which intuitively can be expected fromthe wide variety of sounds in the site. Another interesting fact is that thesenetworks tend to show negative assortativity, which reflects that users donot group according to their degree (which can be related with social statusin social networks), but tend to interact or share concepts with users thatare different in this respect.
6.5.2 Predicting creativity
Beyond structural analysis, we were interested in the relation of these struc-tural aspects with the ability of the community to provide increasinglynovel and good quality sounds. We computed all of the described implicitnetworks, as well as the described creativity measures, by sampling thedatabase monthly over a period of 66 months, from April 2005 to October2010. We then related network properties with creativity measures throughregression analysis. Table 6.9 shows the mean and standard deviations ofthe different properties of these one-month networks averaged over time.All of the described networks exhibit similar characteristics. With a few ex-ceptions, they have negative assortativity in both degree and strength. Alsowith one exception (the shared interest network) they have high modularity,above the empirical threshold of 0.3 commonly considered to indicate thepresence of modular structure (Newman and Girvan, 2004). The clusteringcoefficient ratios show that the networks tend to be much more clusteredthan the equivalent random graph, while the efficiencies are similar to ran-dom graphs, and so the efficiency ratios revolve around 1. Hence, the small-world coefficients (the product of efficiency and clustering) generally followthe clustering coefficient. This reflects that the measured networks follow

6.5. experiments 149
the small-world network model. Since the evolution of small-world coeffi-cient is strongly tied to the clustering coefficient, and it does not make senseto include it in the same models as its factors, we omitted this property fromthe regression analysis.
Table 6.9: Mean (standard deviation) of the described properties for thedifferent networks: degree correlation (dc), strength correlation (sc), mod-ularity (m), clustering coefficient ratio(cc), efficiency ratio (ef), small-worldcoefficient (swc) and density (den)
Variable Downloads Semantic Shared Forum
dc -0.13 (0.05) -0.17 (0.06) 0.33 (0.31) -0.22 (0.15)
sc -0.01 (0.00) -0.01 (0.01) -0.01 (0.02) 0.04 (0.10)
m 0.45 (0.06) 0.40 (0.05) 0.17 (0.16) 0.55 (0.16)
cc 5.17 (1.52) 3.33 (0.73) 7.31 (2.55) 4.87 (2.07)
ef 1.14 (0.05) 0.97 (0.02) 0.85 (0.08) 0.71 (0.16)
swc 5.91 (1.86) 3.22 (0.68) 6.19 (2.16) 3.66 (2.19)
den 0.01 (0.02) 0.21 (0.05) 0.09 (0.05) 0.10 (0.14)
Regression analysis
In order to test the influence of the small-world properties of all four net-works on the creativity measures we performed ordinary least squares re-gression analysis with the described variables for each of the networks. Ouraim is to understand to which extent the properties of each network canmodel the creative outcome of the community. In order to account for po-tential causal relationships, we introduce a lag of one time period betweenthe predictors and the dependent variables. For each model, we checkedthe variance inflation factor (VIF) to ensure that there are no collinear-ity problems. All of the VIF values were below 10, which is the usuallyrecommended threshold (Hair et al., 2010) with the single exception ofmodularity in the shared interest network which went up to 10.8.
Tables 6.10 - 6.13 show the main regression data for predicting either nov-elty, downloads, ratings or comments, using the 4 different networks wehave studied (downloads, semantic, shared interest and forum). For eachdependent variable, the coefficients of the predictors are listed. Sign indi-cates the direction of the relationship (direct or inverse) and high absolutevalues indicate that the factor is relevant to predict that target variable.

150 understanding networked creativity
Statistical significance is indicated with the usual asterisk coding (see cap-tion for details). The bottom cell presents the determination coefficient R2
which indicates the predictive accuracy of each regression function.
Table 6.10: Regression analysis coefficients for the downloads network. Sig-nificance codes: * (p < 0.5), **(p < 0.1), ***(p < 0.01)
Variable Novelty Downloads Ratings Comments
dc -26.36 ∗ -0.08 -0.01 0.00
sc -62.72 8.09 ∗∗ 0.29 ∗∗ 0.05 ∗∗
m -20.01 0.53 ∗∗∗ 0.02 ∗∗∗ 0.00 ∗∗
cc 0.41 0.002 ∗∗∗ 0.00 0.00 ∗∗
ef 7.44 0.008 0.00 0.00
den 450.05 ∗∗∗ 5.86 ∗∗∗ 0.15 ∗∗∗ 0.03 ∗∗∗
R2R2R2 0.85 0.41 0.25 0.19
Table 6.11: Regression analysis coefficients for the semantic network
Variable Novelty Downloads Ratings Comments
dc -38.18 ∗∗∗ -0.24 ∗ 0.00 0.00
sc -731.71 ∗∗∗ 2.92 ∗∗ 0.15 0.02
m 20.82 0.20 0.01 0.00
cc 3.78 ∗ 0.00 0.00 0.00
ef -15.07 -1.48 ∗∗ -0.05 0.00
den 111.23 ∗∗∗ 1.51 ∗∗∗ 0.04 0.00
R2R2R2 0.76 0.49 0.36 0.09
Discussion
The results show similar patterns with respect to the accuracy of the models,as measured byR2. Novelty can be predicted with better accuracy in most ofthe networks. This seems more understandable if one takes into account thatnovelty is calculated using information from the same time period (exceptfor the introduced lag) than the predictors. The rest of variables count thenumbers of downloads, ratings and comments that sounds have receivedover time, which is a rough indicator of their quality but can obviously beinfluenced by other factors. On the other hand, network density appears to

6.5. experiments 151
Table 6.12: Regression analysis coefficients for the shared interest network
Variable Novelty Downloads Ratings Comments
dc 1.50 -0.11 0.00 0.00
sc -87.23 -1.91 ∗ -0.02 0.00
m 20.08 ∗ -0.24 -0.01 0.00
cc -0.03 -0.01 0.00 0.00
ef -5.11 0.18 0.01 0.00
den 114.30 ∗∗ -0.28 -0.01 0.00
R2R2R2 0.76 0.40 0.24 0.05
Table 6.13: Regression analysis coefficients for the forum network
Variable Novelty Downloads Ratings Comments
dc -21.45 ∗∗∗ -0.17 ∗∗ 0.00 0.00
sc 32.11 ∗∗ 0.04 0.00 0.00
m -6.97 -0.20 ∗∗ -0.01 0.00
cc -0.92 ∗ -0.01 ∗ 0.00 0.00
ef 4.06 0.00 0.00 0.00
den 52.69 ∗∗∗ -0.19 -0.01 0.00
R2R2R2 0.60 0.36 0.27 0.05
be a generally dominant factor, along with strength correlation as a negativefactor.
Novelty
The downloads network shows the highest accuracy with respect to thenovelty variable, explaining almost 85% of its variance. The most importantfactor in this model is network density. This indicates that a higher numberof downloading interactions between users may have a positive effect oninnovation (recall that the network is computed only for active users whoupload sounds). However, in the case of novelty, there is no reason to thinkthat such potential causality would not go in the opposite direction. On theother hand, degree correlation has a negative impact, which could indicatethat interactions among different users (in terms of degree) are positivelyrelated to novelty. This tendency is reinforced in those of the other networks

152 understanding networked creativity
that best predict novelty. In the semantic network model, the strengthcorrelation appears also as a negative significant factor. Modularity andclustering coefficient appear as small positive contributions in the semanticand shared networks. On the contrary, the effect of clustering of forum postsseems to be negative. In summary, novelty of uploaded sounds seems to bepositively correlated with high connectivity, in some cases with a small biastowards clustering, and disassortative mixing.
Relevance
With respect to the relevance measures, the semantic network seems to havethe greatest predictive power, followed by networks based on downloads(downloads and shared interest). For example almost 50% of the variancein the average number of downloads of a sound can be explained by thesemantic network properties. In all of the networks, strength correlationappears along with density as an important positive factor. Also noticeableare the significant correlations of modularity and clustering in the downloadsnetwork. In contrast, degree correlation has a significant negative contribu-tion in the semantic and also in the forum networks. This seems to pointtowards connectivity among active users (who should have higher strengthregardless of the degree) as a factor for the relevance measures. Particularlyin the semantic network, strength reflects the level of agreement of a userwith other users in the tags that they use for the sounds. This describesan important connection between the people who upload sounds, which willaffect the findability of sounds in the database. In contrast, efficiency (i.e.the harmonic mean of the average shortest path length) in the semantic net-work has a negative effect, which could mean that connecting remote users,who could be interested in different topics, with respect to text descriptions,is not beneficial. In conclusion, relevance seems to be also very related tonetwork density in general and slightly with local density. Moreover, theagreement between users when describing sounds, reflected by strength cor-relation and density of the semantic network, seems to be among the mostimportant factors for predicting relevance.
Relation to the small-world hypotheses
While the studied networks have shown to follow the small-world networkmodel, our results show some differences with respect to the hypothesesreviewed in chapter2. The referenced works all analyzed real world socialnetworks, which may follow different rules than networks mediated by in-

6.5. experiments 153
formation technology. In real world social networks, connections betweendistant clusters seem more difficult to achieve and therefore more valuablefor diffusing information. In contrast, in internet-based communities, find-ing different people is very usual. In these communities, the difficulty liesin finding people with similar interests. In the context of the Freesoundcommunity this seems a reasonable explanation, since the site poses no re-strictions or biases with respect to the kinds of sounds that can be uploaded,which results in a melting pot of many different cultures. Given networkdensity as a general factor for the creative outcome, it would seem that lo-cal density and clustering, as reflected by the clustering coefficient ratio andmodularity, are to be preferred to short path lengths. Our study also pointstowards the importance of assortative mixing, which is not usually coveredin the small-world creativity literature. An interesting pattern in the ana-lyzed data is that, while degree correlation (i.e. assortative mixing amongnodes of similar number of connections to different users) is negatively cor-related to creativity measures, strength correlation (which better reflectsthe level of activity of users in valued networks) has a positive influence insome cases.
Conclusions about networked creativity
It is often difficult to define the goals of a community based system, whereeach user may have different motivations.This makes it difficult to designand develop software for community usage. For the case of audio clip shar-ing, we have proposed a set of indicators of the creative outcome of theactive community (users who create, or record, and upload sounds) us-ing data from the larger community of information consumers. We havehypothesized that these measures partly depend on the dynamics of thecommunity, which can be measured using the different networks of inter-actions in a given time frame. Our results show that part of the varianceof these measures can in fact be explained by network measures. The pro-posed method, as well as the results of our empirical study, can be used toimprove the design and functionalities of audio clip sharing sites. In thissense, it seems that features that try to maximize the density of the differ-ent networks, i.e. by facilitating actions that connect users, would impacton the quality and novelty of sounds that are uploaded. Similarly, featuresthat promote connectivity among most active users, which would reflecton strength correlation, and features that promote clustering of users withsimilar interests are to be preferred.
As future work, the relationship between assortative mixing and creativity

154 understanding networked creativity
could be further explored using other measures of similarity between users(beyond degree and strength), such as similarities between the sounds theydownload. Another possibility is analyzing the outcomes of individuals orsmaller communities and their relationship to their network positions andcentralities.
With respect to music creation based on audio, the described experimentsshould be a useful starting point, in the sense that collaborative audio-basedmusic making is in itself at least an exchange of audio clips. However, musiccreation can be considered, in general terms, as a more complex activitythan recording sounds (this obviously depends on the kind of music andthe kind of recording). It may be expected that more complex relationshipscan be observed by considering similarities in music strucutre. In this sense,music representations such as the one proposed in chapter 4 could be usedfor computing novelty in the sense of music structure, detecting commonpatterns and similarities between users, and analyzing music collaborationnetworks using the methodology described in this chapter.
6.6 Conclusions
In this chapter we have analyzed users, as the last major type of entityimplied in the use case of online music making communities. These com-munities can be seen as networks of users that create music by sharinginformation. By applying network analysis techniques, it is possible togain a better understanding of the structure and dynamic behavior of thecommunity. While users in online applications have diverse goals, we haveproposed the concept of social creativity as a potential collective goal, thatcan be seen as the ability of the community to innovate with respect tothe information stored in the database. We have tested these ideas by us-ing information from the Freesound database, by defining user networksthat are implicit to the activity of sharing sounds. While we hope thatthese methods can be applied to music creation communities in the future,the popularity of Freesound allowed us to test our ideas with a large-scaledataset. Our preliminary experiment showed that the proposed implicitnetworks exhibit characteristics found in other real world networks. Onthe other hand common network analysis measures can be used to describethe general structure of the audio sharing activity. We then performed alarge scale experiment analyzing the dynamics of the implicit networks ofthe Freesound community. We analyzed how the proposed measures foranalyzing creativity (an automatic content-based measure of novelty and

6.6. conclusions 155
mesures of relevance based on downloading users) depend on properties ofthe networks. Our results indicate that high connectivity, represented bygraph density, and negative assortativity (the tendency of nodes to interactwith nodes of different degree) are indeed positively correlated with the cre-ativity measures. This result should be of interest for supporting creativecommunities in general, and points towards a different behavior of onlinesmall-world creative networks with respect to existing literature analyzingnetworks of companies or teams creating musicals.


Chapter 7
Conclusions
During the last few years, the Internet, and particularly the web, has becomeeven more of a crucial part of people’s lives. Especially mobile platforms,basically smartphones and tablets, have contributed to fulfill the idea thateveryone needs access to the web. At the same time, perhaps fostered bythese developments, the adoption of new capabilities in web browsers hasaccelerated. At the time of this writing, the first edition of the first WebAudio Conference is about to start. The Web Audio API has been incorpo-rated into most browsers. While audio software has traditionally remainedin computer desktops, the specific affordances of the web are based on col-laboration and information sharing. Advances in browser technologies, in-cluding mobile browsers, will necessarily improve our ability to collaboratein computer-based music creation. In recent news, the owners of the popu-lar ProTools DAW software are announcing a new version with support forcloud-based storage. The general reliance on cloud computing may signala second coming of efforts for developing internet-connected music creationtools.
This thesis explores the idea of using web applications based on large-scaleshared data stores, particularly containing audio recordings, for music cre-ation. This idea is backed by the success of existing platforms for sharingaudio using CC licenses, such as Freesound. In this context, sharing audioaffords a great potential for facilitating the creative development of userswith diverse backgrounds on the basis of a long tradition of music based onaudio recordings.
We started with the aim of adapting information retrieval techniques tosupport the use case of audio-based music creation by online communities.
157

158 conclusions
In order to fulfill this goal, we analyzed three main entities that intervenein our use case: sounds, music fragments or pieces, and users. Providingand evaluating suitable representations and algorithms for this purpose hasproved to be a challenge, particularly because of the unstructured nature ofuser-driven processes. One important axis of this work has been dealing withtwo opposite poles: at one side, we are interested in diversity, as a majorcomponent of creativity and innovation. At the other end, uniformity andconsistency allow us to learn and efficiently take advantage of large-scaledatabases. Another important aspect of this thesis has been the cross-pollination resulting from the need to confront the different subjects inthe use case of collective music-making based on shared data. The use ofnetworks for modeling user communities has been applied to the soundsproduced by these communities. Clearly, the distribution of audio featuresis derived from a certain social and cultural structure of users that share agiven resource, such as Freesound. We have found that network analysis,and especially the concept of modularity, are particularly useful for dealingwith this tension between uniformity and diversity.
In face of the complexity of the task, the development of this work hasnot necessarily followed the order of the dissertation. The later has beenstructured to follow the logic that can be used to design future applicationsfor fostering musical creativity on top of shared audio. First, we have de-signed a framework that allows compact representations of different kindsof sounds, in a way that is useful for content-based retrieval. We expectthat different kind of applications can be developed on the basis of differentkinds of sounds commonly contributed by online users such as sound scenes,sound events and music loops. At the same time, we have provided algo-rithms for identifying these general kinds of sounds. We have then analyzedthe two main machine learning paradigms (supervised and unsupervised al-gorithms) for facilitating access to large-scale audio databases in form ofsound taxonomies. Both approaches can be used depending on the applica-tion, but for the case of unsupervised processes, a bottom-up approach suchas modularity clustering shows promise for music creation applications. Wehave then proposed a representation for audio-based music that is simpleenough for browser-based applications. We have shown that the grammar-based approach affords collaborative music-making based solely on the es-tablished practice of audio remix. At the same time, we have shown thatin combination with taxonomical sound classifications, this representationallows the identification of common patterns in users creations. Finally, wehave analyzed the structure of online communities currently sharing audio

7.1. summary of contributions 159
files. In order to deal with the struggle between agreement and diversity,we have proposed the use of automatic measures of creativity, derived fromcomputational creativity research, as a guide for applications that aim atfostering online music creativity based on shared audio.
Addressing this challenge lead us to investigate both existing and novel ap-proaches to indexing and retrieval of each of the entities involved in theaddressed use case. We now summarize the novel contributions of this the-sis, which can be useful for information retrieval research and developmentfocusing on large audio databases and audio sharing platforms.
7.1 Summary of contributions
7.1.1 Evaluation of low level generic features
MFCC features are very widespread and are commonly used without ques-tion alongside other frequency domain representations inspired by auditoryfilters. Our experiments with 9 different datasets showed that a change inthe filterbank model can lead to some improvements in audio classification,which may not be visible with smaller datasets. This result should be ofinterest to content-based audio retrieval in general beyond our target usecase.
7.1.2 Novel methods for feature aggregation
We have also shown methods for identification and summarization of differ-ent types of audio signals commonly found in online sharing sites, mainlyenvironmental sounds and loops. We have adapted Recurrence Quantifica-tion Analysis features from research on nonlinear time series analysis andshown that they allow improving in audio classification tasks when addedto traditional feature statistics.
7.1.3 Modularity-based audio clustering
The concept of graph modularity is often used for finding communities insocial networks. We have shown that it is also useful for clustering audioin community-driven databases, where nearest neighbor graphs can be usedto adapt to the uneven densities of the feature space. Using the Louvainmultilevel modularity optimization algorithm allows creating automatic tax-onomies of audio files. Comparing this method to a traditional supervised

160 conclusions
method for taxonomical classification has shown that users find it easier tolearn automatic unsupervised taxonomies.
7.1.4 Formal representation of audio-based musicfragments
We have proposed a novel representation for music fragments defined bysequences and superpositions of audio files. The proposed representationspecifically affords nesting music fragments at different levels using a graphembedding mechanism. We have shown that this representation supportsthe identification of frequent patterns in user creations by labelling similarsounds with content-based approaches such as modularity-based clustering.
7.1.5 Evaluation of sharing communities by creativeoutcome
Finally, we have proposed a method for measuring the creative outcome ofan audio sharing community, using ratings from a larger audience commu-nity and an automatic content-based novelty measure. We have shown thatthese measures correlate significantly with measures extracted from analy-sis of user activity networks, particularly graph density and disassortativemixing. These results should be of interest for the design of applicationsaimed at fostering creativity such as online music creation platforms.
Some of these contributions have been published in conference proceedingsand peer-reviewed journals. A list of the author’s publications is availablein Appendix A.
7.2 Future directions
With respect to the algorithms and representations proposed in this the-sis, many possibilities remain for exploration. In dealing with a real worldscenario such as the sounds existing in Freesound, we have faced the com-plexity of environmental audio, and proposed a segmentation approach. Inaddition to temporal segmentation, current research in source separation(which can be seen as spectral segmentation) could be used to expand thecreative potential of audio contributed by internet users for music creation.From an implementation perspective, we haven’t dealt with the issues ofexpanding a large database like Freesound using the event detection scheme

7.2. future directions 161
we have proposed. At larger scales, indexing approaches used for music suchas locality-sensitive hashing should be investigated.
Regarding automatic taxonomies, we have generally avoided the analysisof labels used for audio collections. We have dealt with the generality oflabels from a purely content-based perspective, but clearly a semantic anal-ysis informed by natural language processing could help developing systemsthat are easily understandable to users. Also, in the case of unsupervisedtaxonomical organization, there are two important aspects that remain tobe explored: one is choosing appropriate exemplars for each class in thetaxonomy. Another is automatically finding intuitive labels, which couldbe helped by existing labels in sounds, or using automatic classifiers. Ingeneral combining bottom-up with top-down approaches could help deal-ing with data generated by unorganized user activity. In the case of musicrepresentation, we have dealt with the most basic case for enabling col-laboration based on audio files. We have not investigated a way to deriveprobabilistic grammars that can be used for computer-aided composition.Also we have not dealt with more complex mappings potentially includingtransformations of audio files. Finally with respect to user communities,this thesis has only scratched the surface. We are in general still very farin understanding social behavior, particularly with respect to creative ac-tivities such as music. We hope that this thesis has contributed to thegeneral objective of understanding music as a social phenomenon. Our con-tributions for defining similarities and groupings of user creations, and theirrelationship with social interaction, could be useful for future research onthe social dimension of music creation.


Bibliography
Adenot, P., Wilson, C., and Rogers, C. (2013). W3C Web Audio API. W3CWorking Draft, W3C. http://www.w3.org/TR/webaudio/.
Alvaro, J. L. and Barros, B. (2012). Musicjson: A representation for thecomputer music cloud. In Proceedings of the Sound and Music ComputingConference (SMC ’12), Barcelona.
Andries, M., Engels, G., Habel, A., Hoffmann, B., Kreowski, H.-J., Kuske,S., Plump, D., Schurr, A., and Taentzer, G. (1999). Graph transformationfor specification and programming. Science of Computer Programming,34(1):1–54.
Attali, J. (1985). Noise: The Political Economy of Music. ManchesterUniversity Press, Manchester.
Aucouturier, J.-J., Defreville, B., and Pachet, F. (2007). The bag-of-framesapproach to audio pattern recognition: A sufficient model for urbansoundscapes but not for polyphonic music. The Journal of the Acous-tical Society of America, 122(2):881.
Baffioni, C., Guerra, F., and Lalli, L. T. (1984). The theory of stochasticprocesses and dynamical systems as a basis for models of musical struc-tures. In Baroni, M. and Callegari, L., editors, Musical Grammars andComputer Analysis, pages 317–324. Leo S. Olschki, Florence.
Barbosa, A. (2006). Computer-Supported Cooperative Work for Music Ap-plications. PhD thesis, Universitat Pompeu Fabra, Barcelona.
Battier, M. (2007). What the GRM brought to music: from musiqueconcrete to acousmatic music. Organised Sound, 12(3):189–202.
Bel, B. and Kippen, J. (1992). Modelling music with grammars: formal
163

164 bibliography
language representation in the Bol Processor. In Marsden, A. and Pople,A., editors, Computer Representations and Models in Music, pages 207–238. Academic Press, London.
Bello, J. P., Daudet, L., Abdallah, S., Duxbury, C., Davies, M., and Sandler,M. B. (2005). A tutorial on onset detection in music signals. IEEETransactions on Speech and Audio Processing, 13(5):1035–1047.
Benkler, Y. (2006). The Wealth of Networks: How Social Production Trans-forms Markets and Freedom. Yale University Press, New Haven, CT,USA.
Bentley, J. L. (1975). Multidimensional binary search trees used for asso-ciative searching. Communications of the ACM, 18(9):509–517.
Berners-Lee, T., Hendler, J., Lassila, O., et al. (2001). The semantic web.Scientific American.
Beygelzimer, A., Kakade, S., and Langford, J. (2006). Cover trees for nearestneighbor. In Proceedings of the 23rd International Conference on MachineLearning, pages 97–104, Pittsburgh.
Bille, P. (2005). A survey on tree edit distance and related problems. The-oretical Computer Science, 337(1-3):217–239.
Blondel, V. D., Guillaume, J.-L., Lambiotte, R., and Lefebvre, E. (2008).Fast unfolding of communities in large networks. Journal of StatisticalMechanics: Theory and Experiment, 2008(10):P10008.
Boden, M. (2003). The Creative Mind: Myths and Mechanisms. Routledge,London, 2nd edition.
Brandes, U., Delling, D., Gaertler, M., Gorke, R., Hoefer, M., Nikoloski, Z.,and Wagner, D. (2006). Maximizing modularity is hard. arXiv preprintphysics/0608255.
Brazil, E., Fernstroem, M., Tzanetakis, G., and Cook, P. (2002). Enhancingsonic browsing using audio information retrieval. In Proceedings of theInternational Conference on Auditory Display (ICAD-02), pages 132–135,Kyoto.
Bregman, A. S. (1994). Auditory Scene Analysis: The Perceptual Organi-zation of Sound. A Bradford Book, Cambridge, MA.
Bridle, J. and Brown, M. (1974). An experimental automatic word recog-nition system. JSRU Report, 1003(5).
Broder, A., Kumar, R., Maghoul, F., Raghavan, P., Rajagopalan, S., Stata,R., Tomkins, A., and Wiener, J. (2000). Graph structure in the web.Computer Networks, 33(1-6):309–320.

bibliography 165
Brossier, P. (2006). Automatic Annotation of Musical Audio for InteractiveApplications. PhD thesis, Queen Mary, University of London, London.
Brown, G. J. and Cooke, M. (1994). Computational auditory scene analysis.Computer Speech & Language, 8(4):297–336.
Bryan-Kinns, N. (2004). Daisyphone: the design and impact of a novelenvironment for remote group music improvisation. In Proceedings of the5th conference on Designing Interactive Systems: Processes, Practices,Methods, and Techniques (DIS ’04), pages 135–144, Brisbane.
Bryan-Kinns, N. (2012). Mutual engagement in social music making. InIntelligent Technologies for Interactive Entertainment, pages 260–266.Springer.
Bryan-Kinns, N. and Healey, P. G. (2006). Decay in collaborative musicmaking. In Proceedings of the 2006 Conference on New Interfaces forMusical Expression (NIME ’06), pages 114–117, Paris.
Bunke, H. (1997). On a relation between graph edit distance and maximumcommon subgraph. Pattern Recognition Letters, 18(8):689–694.
Burk, P. L. (2000). Jammin’ on the web – a new client/server architecturefor multi-user musical performance. In Proceedings of the InternationalComputer Music Conference (ICMC 2000), pages 117–120, Berlin.
Cai, R. (2005). Unsupervised content discovery in composite audio. InProceedings of the 13th Annual ACM International Conference on Multi-media, pages 628–637, Singapore.
Cano, P., Koppenberger, M., and Wack, N. (2005). An industrial-strengthcontent-based music recommendation system. In Proceedings of the 28thAnnual International ACM SIGIR Conference on Research and Develop-ment in Information Retrieval, page 673, Salvador.
Carley, K. M. (2003). Dynamic network analysis. Committee on HumanFactors, National Research Council, National Research Council.
Casey, M. A., Veltkamp, R., Goto, M., Leman, M., Rhodes, C., and Slaney,M. (2008). Content-based music information retrieval: Current directionsand future challenges. In Proceedings of the IEEE, volume 96, pages 668–696.
Chang, C.-C. and Lin, C.-J. (2001). LIBSVM: a library for support vectormachines. Software available at http://www.csie.ntu.edu.tw/~cjlin/libsvm.
Chapelle, O., Haffner, P., and Vapnik, V. N. (1999). Support vector ma-chines for histogram-based image classification. IEEE Transactions onNeural Networks, 10(5):1055–1064.

166 bibliography
Chechik, G., Ie, E., Rehn, M., Bengio, S., and Lyon, D. (2008). Large-scalecontent-based audio retrieval from text queries. In Proceedings of the1st ACM International Conference on Multimedia Information Retrieval(MIR ’08), page 105, Beijing.
Chion, M. (1983). Guide des Objets Sonores: Pierre Schaffer et la RechercheMusicale.
Chomsky, N. (1957). Syntactic Structures. Mouton and Co.
Chu, S., Narayanan, S., and Kuo, C.-C. J. (2009). Environmental soundrecognition with time-frequency audio features. IEEE Transactions onSpeech, Audio, and Language Processing, 17(6):1142–1158.
Chu, S., Narayanan, S., Kuo, C.-C. J., and Mataric, M. J. (2006). Wheream I? Scene recognition for mobile robots using audio features. In 2006IEEE International Conference on Multimedia and Expo, pages 885–888.
Clavel, C., Ehrette, T., and Richard, G. (2005). Events detection for anaudio-based surveillance system. In IEEE International Conference onMultimedia and Expo (ICME 2005), pages 1306–1309.
Cope, D. (2004). Virtual Music: Computer Synthesis of Musical Style. MitPress.
Cordella, L. P., Foggia, P., Sansone, C., and Vento, M. (2004). A (sub) graphisomorphism algorithm for matching large graphs. IEEE Transactions onPattern Analysis and Machine Intelligence, 26(10):1367–1372.
Cowan, R. and Jonard, N. (2003). The dynamics of collective invention.Journal of Economic Behavior & Organization, 52(4):513–532.
Cox, C. and Warner, D., editors (2004). Audio Culture: Readings in ModernMusic. Continuum International Publishing Group.
Csikszentmihalyi, M. (1999). Implications of a systems perspective for thestudy of creativity. In Sternberg, R., editor, Handbook of Creativity.Cambridge University Press.
Dannenberg, R. B. (1993). A brief survey of music representation issues,techniques, and systems.
Dargie, W. (2009). Adaptive audio-based context recognition. IEEE Trans-actions on Systems, Man and Cybernetics, Part A: Systems and Humans,39(4):715–725.
de A Costa, W., Assis, F. M., Neto, B. G. A., Costa, S. C., and Vieira, V.J. D. (2012). Pathological voice assessment by recurrence quantificationanalysis. In Proceedings of Biosignals and Biorobotics Conference (BRC),2012 ISSNIP, pages 1–6.

bibliography 167
Duckworth, W. (2005). Virtual Music: How the Web Got Wired for Sound.Routledge.
Dupont, S., Dubuisson, T., Urbain, J., Sebbe, R., d’Alessandro, N., andFrisson, C. (2009). AudioCycle: Browsing musical loop libraries. InSeventh International Workshop on Content-based Multimedia Indexing(CBMI ’09), volume 0, pages 73–80, Los Alamitos, CA, USA. IEEE Com-puter Society.
Ellis, D. P. and Lee, K. (2006). Accessing minimal-impact personal audioarchives. IEEE Multimedia, 13(4):30–38.
Ellis, D. P. W. (2005). PLP and RASTA (andMFCC, and inversion) in Matlab. Technical report.http://www.ee.columbia.edu/ dpwe/resources/matlab/rastamat/.
Ellis, D. P. W. (2009). Gammatone-like spectrograms. Technical report.http://www.ee.columbia.edu/dpwe/resources/matlab/gammatonegram.
Engelfriet, J. and Rozenberg, G. (1997). Node replacement graph grammars.European School on Graph Transformation.
Eronen, A., Peltonen, V., Tuomi, J., Klapuri, A., Fagerlund, S., Sorsa,T., Lorho, G., and Huopaniemi, J. (2006). Audio-based context recog-nition. IEEE Transactions on Audio, Speech, and Language Processing,14(1):321–329.
Ertoz, L., Steinbach, M., and Kumar, V. (2002). A new shared nearestneighbor clustering algorithm and its applications. In Workshop on Clus-tering High Dimensional Data and its Applications at 2nd SIAM Inter-national Conference on Data Mining, pages 105–115.
Fastl, H. and Zwicker, E. (2001). Psychoacoustics: facts and models.
Fleming, L., King, C., and Juda, A. I. (2007). Small worlds and regionalinnovation. Organization Science, 18(6):938–954.
Foote, J. (2000). Automatic audio segmentation using a measure of audionovelty. In 2000 IEEE International Conference on Multimedia and Expo(ICME 2000), volume 1, pages 452–455.
Foote, J. and Uchihashi, U. (2001). The beat spectrum: a new approach torhythm analysis. In IEEE International Conference on Multimedia andExpo (ICME 2001), pages 881–884.
Freeman, J. (2008). Graph theory: linking online musical exploration toconcert hall performance. Leonardo, 4(1).
Freeman, J., Ramakrishnan, S., Varnik, K., Neuhaus, M., Burk, P., andBirchfield, D. (2005). The architecture of auracle: a voice-controlled,

168 bibliography
networked sound instrument. Network, 5(6):7.
Ganchev, T. (2005). Comparative evaluation of various MFCC implemen-tations on the speaker verification task. In Proceedings of the SPECOM,pages 191–194.
Gaver, W. (1993). What in the world do we hear?: An ecological approachto auditory event perception. Ecological Psychology, 5(1):1–29.
Geiger, J. T., Schuller, B., and Rigoll, G. (2013). Recognising acousticscenes with large-scale audio feature extraction and SVM. Technical re-port.
Giannoulis, D., Benetos, E., Stowell, D., Rossignol, M., Lagrange, M., andPlumbley, M. D. (2013). IEEE AASP Challenge: Detection and Classifi-cation of Acoustic Scenes and Events. online web resource.
Gillet, O. and Richard, G. (2004). Automatic transcription of drum loops.In Proceedings of the 2004 IEEE Conference on Acoustics, Speech andSignal Processings (ICASSP ’04).
Gillet, O. and Richard, G. (2005). Drum loops retrieval from spoken queries.Journal of Intelligent Information Systems, 24(2-3):159–177.
Gomez, E. (2006). Tonal Description of Music Audio Signals. PhD thesis,Universitat Pompeu Fabra, Barcelona.
Good, M. (2001). MusicXML for notation and analysis. In Hewlett, W. B.and Selfridge-Field, E., editors, The Virtual Score: Representation, Re-trieval, Restoration, volume 12, pages 113–124. MIT Press, Cambridge,MA.
Grey, J. M. (1977). Multidimensional perceptual scaling of musical timbres.The Journal of the Acoustical Society of America, 61(5):1270–1277.
Guastavino, C. (2007). Categorization of environmental sounds. CanadianJournal of Experimental Psychology, 61:54–63.
Guaus, E. (2009). Audio content processing for automatic music genre clas-sification: descriptors, databases, and classifiers. PhD thesis, UniversitatPompeu Fabra.
Guo, G. and Li, S. Z. (2003). Content-based audio classification and retrievalby support vector machines. IEEE Transactions on Neural Networks,14(1):209–215.
Hair, J. F., Black, W. C., Babin, B. J., and Anderson, R. E. (2010). Multi-variate Data Analysis: A Global Perspective. Pearson Education, London,7th edition.
Haro, M. (2008). Detecting and describing percussive events in polyphonic
bibliography 169
music. Master’s thesis, Universitat Pompeu Fabra.
Hermann, T., Hunt, A., and Neuhoff, J. G. (2011). The Sonification Hand-book. Logos Verlag Berlin.
Herrera, P., Dehamel, A., and Gouyon, F. (2003). Automatic labeling ofunpitched percussion sounds. In Audio Engineering Society Convention114.
Herrera, P., Yeterian, A., and Gouyon, F. (2002). Automatic classificationof drum sounds: A comparison of feature selection methods and clas-sification techniques. In Music and Artificial Intelligence, pages 69–80.Springer Berlin Heidelberg.
Herrera-Boyer, P., Klapuri, A., and Davy, M. (2006). Automatic classifica-tion of pitched musical instrument sounds. In Signal Processing Methodsfor Music Transcription, pages 163–200. Springer.
Hewlett, W. and Selfridge-Field, E. (2001). The Virtual Score: Represen-tation, Retrieval, Restoration. MIT Press.
Holder, L. B. and Cook, D. J. (2009). Graph-based data mining. Encyclo-pedia of Data Warehousing and Mining, 2:943–949.
Holder, L. B., Cook, D. J., Djoko, S., et al. (1994). Substucture discoveryin the SUBDUE system. In KDD workshop, pages 169–180.
Holtzman, S. R. (1980). A generative grammar definition language formusic. Interface, 9(1):1–48.
Hsu, J., Liu, C., and Chen, A. (2001). Discovering nontrivial repeatingpatterns in music data. IEEE Transactions on Multimedia, 3(3):311–325.
Hubert, L. and Arabie, P. (1985). Comparing partitions. Journal of Clas-sification, 2:193–218.
Humphries, M. D. and Gurney, K. (2008). Network ‘small-world-ness’: Aquantitative method for determining canonical network equivalence. PLoSONE, 3(4):e0002051.
Jackendoff, R. and Lerdahl, F. (1981). Generative music theory and itsrelation to psychology. Journal of Music Theory, pages 45–90.
Jacobson, K., Fields, B., and Sandler, M. (2008). Using audio analysisand network structure to identify communities in online social networksof artists. In Proceedings of the 9th International Conference on MusicInformation Retrieval (ISMIR 2008).
Jain, A. K. and Dubes, R. C. (1988). Algorithms for Clustering Data.Prentice-Hall, Inc., Upper Saddle River, NJ, USA.
Jehan, T. (2005). Creating Music by Listening. PhD thesis, Massachusetts
170 bibliography
Institute of Technology, Boston.
Joachims, T. (1998). Text categorization with support vector machines:Learning with many relevant features. In ECML ’98 Proceedings of the10th European Conference on Machine Learning, pages 137–142.
Johnson, C. M. (2001). A survey of current research on online communitiesof practice. The Internet and Higher Education, 4(1):45–60.
Jorda, S. and Wust, O. (2001). FMOL: A system for collaborative musiccomposition over the web. Proceedings of the 12th International Workshopon Database and Expert Systems Applications (DEXA 2001).
Jordan, B. and Henderson, A. (1995). Interaction analysis: Foundationsand practice. The Journal of the Learning Sciences, 4(1):39–103.
Kaliakatsos-Papakostas, M. A., Floros, A., Kanellopoulos, N., and Vrahatis,M. N. (2012). Genetic evolution of L and FL-systems for the production ofrhythmic sequences. In Proceedings of the 14th Annual Conference Com-panion on Genetic and Evolutionary Computation, GECCO ’12, pages461–468, Philadelphia, Pennsylvania, USA.
Kapur, A. (2004). Query-by-beat-boxing: Music retrieval for the dj. InProceedings of the 5th International Conference on Music InformationRetrieval (ISMIR 2004).
Kartomi, M. J. (1990). On Concepts and Classifications of Musical Instru-ments. University of Chicago Press Chicago.
Karypis, G. (2002). CLUTO - A Clustering Toolkit. Technical Report#02-017, University of Minnesota, Department of Computer Science.
Karypis, G., Han, E.-H., and Kumar, V. (1999). Chameleon: hierarchicalclustering using dynamic modeling. Computer, 32(8):68–75.
Kaufman, L. and Rousseeuw, P. J. (2009). Finding groups in data: anintroduction to cluster analysis, volume 344. John Wiley & Sons.
Kuramochi, M. and Karypis, G. (2001). Frequent subgraph discovery.In Proceedings IEEE International Conference on Data Mining (ICDM2001), pages 313–320.
Lartillot, O., Eerola, T., Toiviainen, P., and Fornari, J. (2008). Multi-feature modeling of pulse clarity: Design, validation and optimization. InProceedings of the International Symposium on Music Information Re-trieval (ISMIR 2008), pages 521–526.
Laurier, C. (2011). Automatic Classification of Musical Mood by Content-Based Analysis. PhD thesis, Universitat Pompeu Fabra.
Lave, J. and Wenger, E. (1991). Situated Learning: Legitimate Peripheral

bibliography 171
Participation. Cambridge University Press, 1 edition.
Lee, K. and Ellis, D. P. W. (2010). Audio-based semantic concept clas-sification for consumer video. IEEE Transactions on Audio, Speech &Language Processing, 18(6):1406–1416.
Lessig, L. (2008). Remix: Making Art and Commerce Thrive in the HybridEconomy. Penguin Press HC, The.
Levin, T. Y. (2003). “Tones from out of nowhere”: Rudolph Pfenningerand the archaeology of synthetic sound. Grey Room, pages 32–79.
Lindenmayer, A. (1968). Mathematical models for cellular interaction indevelopment: Parts I and II. Journal of Theoretical Biology, 18:280—315.
Lourenco, B. F., Ralha, J. C., and Brandao, M. C. (2009). L-systems,scores, and evolutionary techniques. In Proceedings of the 6th Sound andMusic Computing Conference (SMC’ 09), pages 113–118.
Madsen, S. T. and Jørgensen, M. E. (2003). Automatic Discovery of Paral-lelism and Hierarchy in Music. PhD thesis, Aarhus Universitet, Datalo-gisk Institut, Aarhus.
Mandler, J. M. (2000). Perceptual and conceptual processes in infancy.Journal of Cognition and Development, 1(1):3–36.
Martin, K. D. and Kim, Y. E. (1998). Musical instrument identification: Apattern-recognition approach. The Journal of the Acoustical Society ofAmerica, 104(3):1768–1768.
McCormack, J. (1996). Grammar based music composition. Complex Sys-tems, 96:321–336.
McKinney, M. F. and Breebaart, J. (2003). Features for audio and musicclassification. In Proceedings of the 4th International Conference on MusicInformation Retrieval (ISMIR 2003), volume 3, pages 151–158.
Merker, B. (2002). Music: the missing Humboldt system. Musicae Scientiae,6(1):3–21.
Mermelstein, P. (1976). Distance measures for speech recognition, psycho-logical and instrumental. In Chen, C., editor, Pattern Recognition andArtificial Intelligence, volume 116, pages 374–388. Academic, New York.
Mika, P. (2005). Ontologies are us: A unified model of social networksand semantics. In Proceedings of the 4th International Semantic WebConference (ISWC 2005), pages 522–536, Galway, Ireland.
Miletto, E. M., Pimenta, M. S., Bouchet, F., Sansonnet, J.-P., and Keller,D. (2011). Principles for music creation by novices in networked music

172 bibliography
environments. Journal of New Music Research, 40(3):205–216.
Miletto, E. M., Pimenta, M. S., Hoppe, A. F., and Flores, L. V. (2009). Whoare the web composers? In Online Communities and Social Computing,pages 381–390. Springer.
Miletto, E. M., Pimenta, M. S., Vicari, R. M., and Flores, L. V. (2005).CODES: a Web-based environment for cooperative music prototyping.Organised Sound, 10(3):243–253.
Miller, G. (1956). The magical number seven, plus or minus two: Some lim-its on our capacity for processing information. The Psychological Review,63:81–97.
Montuori, A. and Purser, R. (1995). Deconstructing the lone genius myth:Toward a contextual view of creativity. Journal of Humanistic Psychol-ogy, 35(3):69–112.
Moore, B. C. (2012). An Introduction to the Psychology of Hearing. Brill.
Moore, B. C. and Glasberg, B. (1996). A revision of Zwicker’s loudnessmodel. Acustica – Acta Acustica, 82(2):335–345.
Navas, E. (2012). Remix theory: the aesthetics of sampling. Springer,Vienna.
Newman, M. E. (2004). Analysis of weighted networks. Physical Review E,70(5):056131.
Newman, M. E. J. (2003). Mixing patterns in networks. Physical ReviewE, 67(2):026126.
Newman, M. E. J. and Girvan, M. (2004). Finding and evaluating commu-nity structure in networks. Physical Review E, 69(2):026113.
Noack, A. (2009). Modularity clustering is force-directed layout. PhysicalReview E, 79(2):026102.
Ong, B. and Streich, S. (2008). Music loop extraction from digital audio sig-nals. In Proceedings of the IEEE International Conference on Multimedia& Expo (ICME), pages 681–684, Hannover.
Pampalk, E., Hlavac, P., and Herrera, P. (2004). Hierarchical organizationand visualization of drum sample libraries. In Proceedings of the 7thInternational Conference on Digital Audio Effects (DAFx’04), pages 378–383, Naples.
Pampalk, E., Rauber, A., and Merkl, D. (2002). Content-based organizationand visualization of music archives. In Proceedings of the 10th ACMInternational Conference on Multimedia (ACM-MM ’02), pages 570–579.
Patterson, R. D., Robinson, K., Holdsworth, J., McKeown, D., Zhang, C.,

bibliography 173
and Allerhand, M. (1992). Complex sounds and auditory images. Audi-tory physiology and perception, 83:429–446.
Peeters, G. and Deruty, E. (2010). Sound indexing using morphologicaldescription. IEEE Transactions on Audio, Speech, and Language Pro-cessing, 18(3):675–687.
Pfaltz, J. L. and Rosenfeld, A. (1969). Web grammars. In Proceedingsof the 1st international joint conference on Artificial intelligence, pages609–619. Morgan Kaufmann Publishers Inc.
Pons, P. and Latapy, M. (2005). Computing communities in large networksusing random walks. In Computer and Information Sciences-ISCIS 2005,pages 284–293. Springer.
Prusinkiewicz, P. (1986). Score generation with L-systems. Ann Arbor, MI:MPublishing, University of Michigan Library.
Prusinkiewicz, P. and Lindenmayer, A. (1996). The Algorithmic Beauty ofPlants. Springer-Verlag New York, Inc., New York, NY, USA.
Rabiner, L. R. and Juang, B.-H. (1993). Fundamentals of Speech Recogni-tion. Book.
Radcliffe-Brown, A. R. (1948). The Andaman Islanders. Cambridge Uni-versity Press.
Ramirez, J., Gorriz, J. M., and Segura, J. C. (2007). Voice Activity Detec-tion. Fundamentals and Speech Recognition System Robustness. INTECHOpen Access Publisher.
Ricard, J. (2004). Towards Computational Morphological Description ofSound. PhD thesis, DEA pre-thesis research work, Universitat PompeuFabra, Barcelona.
Roads, C. (1978). Composing grammars. In International Computer MusicConference.
Roads, C. and Wieneke, P. (1979). Grammars as Representations for Music.Computer Music Journal, 3(1).
Roberts, C. and Kuchera-Morin, J. (2012). Gibber: Live coding audio in thebrowser. In Proceedings of the International Computer Music Conference(ICMC 2012), Ljubljana, Slovenia.
Rocchesso, D. and Fontana, F. (2003). The Sounding Object. Mondo es-tremo.
Rohrhuber, J. (2007). Network music. In Collins, N. and d’Escrivan, J.,editors, The Cambridge Companion to Electronic Music, pages 140–170.Cambridge University Press, Cambridge, 4th edition.

174 bibliography
Roma, G. and Herrera, P. (2010a). Community structure in audio clipsharing. In 2010 2nd International Conference on Intelligent Networkingand Collaborative Systems (INCOS), pages 200–205.
Roma, G. and Herrera, P. (2010b). Graph grammar representation for col-laborative sample-based music creation. In Proceedings of the 5th AudioMostly Conference: A Conference on Interaction with Sound, pages 17:1–17:8, Pitea, Sweden.
Roma, G. and Herrera, P. (2013). Representing music as work in progress. InStructuring Music through Markup Language: Designs and Architectures,pages 119–134. IGI Global Snippet.
Roma, G., Herrera, P., Zanin, M., Toral, S. L., Font, F., and Serra, X.(2012a). Small world networks and creativity in audio clip sharing. In-ternational Journal of Social Network Mining, 1(1):112–127.
Roma, G., Janer, J., Kersten, S., Schirosa, M., Herrera, P., and Serra,X. (2010). Ecological acoustics perspective for content-based retrieval ofenvironmental sounds. EURASIP Journal on Audio, Speech, and MusicProcessing, pages 1–11.
Roma, G., Nogueira, W., and Herrera, P. (2013). Recurrence quantificationanalysis features for environmental sound recognition. In 2013 IEEEWorkshop on Applications of Signal Processing to Audio and Acoustics(WASPAA), pages 1–4.
Roma, G., Xambo, A., and Laney, R. (2012b). Factors in human recognitionof timbre lexicons generated by data clustering. In Proceedings of theSound and Music Computing Conference (SMC ’12).
Rosselet, U. and Renaud, A. B. (2013). Jam on: a new interface for web-based collective music performance. In Proceedings of the 2013 Conferenceon New Interfaces for Musical Expression (NIME ’13), pages 394–399.
Russolo, L. (1986). The Art of Noises. Pendragon Press, New York.
Salembier, P. and Sikora, T. (2002). Introduction to MPEG-7: MultimediaContent Description Interface. John Wiley & Sons, Inc., New York.
Schaeffer, P. (1966). Traite des Objets Musicaux. Seuil, Paris.
Schafer, R. M. (1977). The Soundscape: Our Sonic Environment and theTuning of the World. Inner Traditions/Bear.
Schuldt, C., Laptev, I., and Caputo, B. (2004). Recognizing human actions:a local svm approach. In Proceedings of the 17th International Conferenceon Pattern Recognition (ICPR 2004), volume 3, pages 32–36. IEEE.
Schwarz, D. (2006). Concatenative Sound Synthesis: The Early Years.

bibliography 175
Journal of New Music Research, 35(1):3–22.
Schwarz, D. (2007). Corpus-based concatenative synthesis. IEEE SignalProcessing Magazine, 24(2):92–104.
Schwarz, D., Britton, S., Cahen, R., and Goepfer, T. (2007). Musical ap-plications of real-time corpus-based concatenative synthesis. In Interna-tional Computer Music Conference (ICMC 2007).
Schwarz, D., Schnell, N., and Gulluni, S. (2009). Scalability in content-based navigation of sound databases. In International Computer MusicConference (ICMC 2009), Montreal, Canada.
Serra, J., Serra, X., and Andrzejak, R. G. (2009). Cross recurrence quan-tification for cover song identification. New Journal of Physics, 11.
Shannon, B. J. and Paliwal, K. K. (2003). A comparative study of filter bankspacing for speech recognition. In Microelectronic Engineering ResearchConference, volume 41.
Shao, Y. and Wang, D. (2008). Robust speaker identification using auditoryfeatures and computational auditory scene analysis. In IEEE Interna-tional Conference on Acoustics, Speech and Signal Processing (ICASSP2008), pages 1589–1592.
Slaney, M. (1993). An efficient implementation of the Patterson-Holdsworthauditory filter bank. Technical report, Apple Computer, PerceptionGroup, Tech. Rep.
Sloetjes, H. and Wittenburg, P. (2008). Annotation by category: ELANand ISO DCR. In Proceedings of the 6th International Conference onLanguage Resources and Evaluation (LREC ’08), pages 816–820.
Smaill, A., Wiggins, G., and Harris, M. (1993). Hierarchical music repre-sentation for composition and analysis. Computers and the Humanities,27(1):7–17.
Sohn, J., Kim, N. S., and Sung, W. (1999). A statistical model-based voiceactivity detection. IEEE Signal Processing Letters, 6(1):1–3.
Tanaka, A., Tokui, N., and Momeni, A. (2005). Facilitating collective mu-sical creativity. In Proceedings of the 13th annual ACM InternationalConference on Multimedia (MULTIMEDIA ’05), pages 191–198, Singa-pore.
Torsello, A. and Hancock, E. R. (2003). Computing approximate treeedit distance using relaxation labeling. Pattern Recognition Letters,24(8):1089–1097.
Traunmuller, H. (1990). Analytical expressions for the tonotopic sensory

176 bibliography
scale. The Journal of the Acoustical Society of America, 88(1):97–100.
Tsai, F. S. (2010). Review of techniques for intelligent novelty mining.Information Technology Journal, 9(6):1255–1261.
Tucker, R. (1992). Voice activity detection using a periodicity measure. IEEProceedings I (Communications, Speech and Vision), 139(4):377–380.
Tzanetakis, G. and Cook, P. (2002). Musical genre classification of audiosignals. IEEE Transactions on Speech and Audio Processing, 10(5):293–302.
Uzzi, B. and Spiro, J. (2005). Collaboration and creativity: The small worldproblem. American Journal of Sociology, 111(2):447–504.
Van Den Doel, K., Kry, P. G., and Pai, D. K. (2001). FoleyAutomatic:physically-based sound effects for interactive simulation and animation.In Proceedings of the 28th Annual Conference on Computer Graphics andInteractive Techniques, pages 537–544.
van Grootel, M., Andringa, T. C., and Krijnders, J. (2009). DARES-G1:database of annotated real-world everyday sounds. In Proceedings of theNAG/DAGA Meeting 2009, pages 996–999.
Verspagen, B. and Duysters, G. (2004). The small worlds of strategic tech-nology alliances. Technovation, 24(7):563–571.
Watts, D. J. and Strogatz, S. H. (1998). Collective dynamics of ‘small-world’networks. Nature, 393(6684):440–442.
Webber, C. L. and Zbilut, J. P. (1994). Dynamical assessment of physi-ological systems and states using recurrence plot strategies. Journal ofApplied Physiology, 76(2):965–973.
Weinberg, G. (2005). Interconnected musical networks: Toward a theoreti-cal framework. Computer Music Journal, 29(2):23–39.
White, H. D., Wellman, B., and Nazer, N. (2004). Does citation reflect socialstructure?: longitudinal evidence from the “Globenet” interdisciplinaryresearch group. Journal of the American Society for Information Scienceand Technology, 55(2):111–126.
Whitehead Jr, E. J. and Wiggins, M. (1998). WebDAV: IEFT standard forcollaborative authoring on the Web. IEEE Internet Computing, 2(5):34–40.
Wiggins, G., Miranda, E., Smaill, A., and Harris, M. (1993). A frameworkfor the evaluation of music representation systems. Computer Music Jour-nal, 17(3):31–42.
Wold, E., Blum, T., Keislar, D., and Wheaton, J. (1996). Content-based

bibliography 177
classification, search, and retrieval of audio. IEEE MultiMedia, 3(3):27–36.
Woods, W. A. (1970). Transition network grammars for natural languageanalysis. Communications of the ACM, 13(10):591–606.
Worth, P. and Stepney, S. (2005). Growing music: Musical interpretationsof L-Systems. In Rothlauf, F., Branke, J., Cagnoni, S., Corne, D. W.,Drechsler, R., Jin, Y., Machado, P., Marchiori, E., Romero, J., Smith,G. D., and Squillero, G., editors, Applications of Evolutionary Computing,volume 3449, pages 545–550. Springer.
Xu, M., Maddage, N., Xu, C., Kankanhalli, M., and Tian, Q. (2003). Creat-ing audio keywords for event detection in soccer video. In Proceedings ofthe 2003 IEEE International Conference on Multimedia and Expo (ICME’03), volume 2, pages II–281.
Yan, X. and Han, J. (2002). gspan: Graph-based substructure patternmining. In Proceedings of the 2002 IEEE International Conference onData Mining (ICDM 2003), pages 721–724.
Zaki, M. J. (2005). Efficiently mining frequent embedded unordered trees.Fundamenta Informaticae, 66(1):33–52.
Zbilut, J. P. and Webber, C. L. J. (2006). Recurrence quantification anal-ysis. In Akay, M., editor, Wiley Encyclopedia of Biomedical Engineering.John Wiley and Sons, Hoboken.
Zhang, K. and Shasha, D. (1989). Simple fast algorithms for the editing dis-tance between trees and related problems. SIAM Journal on Computing,18(6):1245–1262.
Zhang, T. and Kuo, C.-C. (1999). Classification and retrieval of soundeffects in audiovisual data management. In Conference Record of theThirty-Third Asilomar Conference on Signals, Systems, and Computers,volume 1, pages 730–734.
Zils, A. and Pachet, F. (2001). Musical mosaicing. In Proceedings of theCOST G-6 Conference on Digital Audio Effects (DAFx-01), volume 2,pages 730–734, Limerick, Ireland.


Appendix A: Publications bythe author
Book Chapters
Roma, G., and Herrera P. (2013). Representing Music as Work in Progress.In: Steyn, J., ed. Structuring Music through Markup Language: Designsand Architectures. IGI Global, 2013, pp. 119–134.
Journal Articles
Bogdanov, D., Wack N., Gomez E., Gulati S., Herrera P., Mayor O., etal. (2014). ESSENTIA: an open source library for audio analysis. ACMSIGMM Records. 6(1).
Roma, G., Zanin M., Herrera P., S. L., Font F., and Serra X. (2012). Smallworld networks and creativity in audio clip sharing. International Journalof Social Network Mining (IJSNM), 2012, 1(1), pp. 112 - 127.
Roma, G., Janer J., Kersten S., Schirosa M., Herrera P., and Serra X.(2010). Ecological acoustics perspective for content-based retrieval of envi-ronmental sounds. EURASIP Journal on Audio, Speech, and Music Pro-cessing. (2010).
Janer, J., Finney N., Roma G., Kersten S., and Serra X. (2009). Support-ing Soundscape Design in Virtual Environments with Content-based AudioRetrieval. Journal of Virtual Worlds Research, 2009, 2(3).
179

180 appendix a: publications by the author
Conference Papers
Xambo, A., Roma G., Laney R., Dobbyn C., and Jorda S. SoundXY4:Supporting Tabletop Collaboration and Awareness with Ambisonics Spa-tialisation. In: Proceedings of the 14th International Conference on NewInterfaces for Musical Expression, 2014. pp. 40 - 45.
Bogdanov, D., Wack N., Gomez E., Gulati S., Herrera P., Mayor O., etal. ESSENTIA: an Open-Source Library for Sound and Music Analysis. In:Proceedings of the ACM International Conference on Multimedia (MM’13),2013. Font, F., Roma G., and Serra X. Freesound Technical Demo. In:Proceedings of the ACM International Conference on Multimedia (MM’13),2013. pp. 411–412.
Roma, G., Nogueira W., and Herrera P. Recurrence Quantification Analy-sis Features for Environmental Sound Recognition. In: Proceedings of theIEEE Workshop on Applications of Signal Processing to Audio and Acous-tics (WASPAA), 2013.
Mayor O., et al. ESSENTIA: an Audio Analysis Library for Music Infor-mation Retrieval. In: Proceedings of the International Society for MusicInformation Retrieval Conference (ISMIR’13), 2013. pp. 493–498.
Font, F., Roma G., Herrera P., and Serra X. Characterization of theFreesound Online Community. In: Proceedings of the Third InternationalWorkshop on Cognitive Information Processing, 2012. pp. 279–284.
Roma, G., Xambo A., Herrera P., and Laney R. Factors in human recogni-tion of timbre lexicons generated by data clustering. In: Proceedings of theSound and Music Computing Conference (SMC2012), 2012.
Janer, J., Roma G., and Kersten S. Authoring augmented soundscapes withuser-contributed content. In: Proceedings of the ISMAR Workshop onAuthoring Solutions for Augmented Reality, 2011.
Akkermans, V., Font F., Funollet J., De Jong, B, Roma G., Togias S.,et al. Freesound 2: An Improved Platform for Sharing Audio Clips. In:Proceedings of the International Society for Music Information RetrievalConference (ISMIR 2011), 2011.
Janer, J., Kersten S., Schirosa M., and Roma G. An online platform forinteractive soundscapes with user-contributed content. In: Proceedings ofthe AES 41st International Conference on Audio for Games, 2011.

conference papers 181
Roma, G., and Herrera P. Community structure in audio clip sharing. In:Proceedings of the International Conference on Intelligent Networking andCollaborative Systems (INCoS 2010), 2010.
Roma, G., and Herrera P. Graph grammar representation for collaborativesample-based music creation. In: Proceedings of the 5th Audio MostlyConference, 2010. Schirosa, M., Janer J., Kersten S., and Roma G. Asystem for soundscape generation, composition and streaming. XVII CIM-Colloquium of Musical Informatics, 2010.
Roma, G., Janer J., Kersten S., Schirosa M., and Herrera P. Content-basedretrieval from unstructured databases using an ecological acoustics taxon-omy. In: Proceedings of the International Community for the AuditoryDisplay (ICAD), 2010.
Janer, J., Haro M., Roma G., Fujishima T., and Kojima N. Sound Ob-ject Classification for Symbolic Audio Mosaicing: A Proof-of-Concept. In:Proceedings of the Sound and Music Computing Conference, 2009. pp.297–302.
Roma, G., and Xambo A. A tabletop waveform editor for live performance.In: Proceedings of the 8th International Conference on New Interfaces forMusical Expression, NIME08, 2008.