alief independent school district · alief independent school district has a population of...
TRANSCRIPT
Alief Independent School District – 12302 High Star – Houston, TX 77072
Alief Independent School District
Comprehensive Annual Financial Report
For the Year Ended August 31, 2003
Prepared by the Administrative Service Division: Johnny Tates
Deputy Superintendent for Administration Deanna Wentz, CPA
Assistant Superintendent for Finance Anne Faichtinger, CPA
Controller Julee Patterson, CPA
Accountant
Alief Independent School District Comprehensive Annual Financial Report
For the Year Ended August 31, 2003 Table of Contents
Exhibit Page
Introductory Section Title Page Table of Contents Principal Officials and Advisors 1 Organization Chart 2 Letter of Transmittal 3 Certificate of Achievement for Excellence in Financial Reporting 8 Certificate of Excellence in Financial Reporting 9 Certificate of Board 10
Financial Section Independent Auditors' Report 11
Management’s Discussion and Analysis 13 Basic Financial Statements Government-Wide Financial Statements Statement of Net Assets A-1 22 Statement of Activities B-1 23 Fund Financial Statements Governmental Funds Balance Sheet – Governmental Funds C-1 24 Reconciliation of the Governmental Funds Balance Sheet To the Statement of Net Assets C-2 25 Statement of Revenues, Expenditures, and Changes in Fund Balances – Governmental Funds C-3 26 Reconciliation of the Statement of Revenues, Expenditures, and Changes in Fund Balances of Governmental Funds to the Statement of Activities C-4 27 Proprietary Funds Statement of Net Assets – Proprietary Funds D-1 29 Statement of Revenues, Expenses, and Changes in Fund Net Assets - Proprietary Funds D-2 30 Statement of Cash Flows - Proprietary Funds D-3 31 Fiduciary Fund Statement of Assets and Liabilities E-1 32 Notes to Financial Statements 33 Required Supplementary Information: Schedule of Revenues, Expenditures, and Changes in Fund Balances - Original Budget, Amended Final, and Actual – General Fund F-1 55 Notes to Required Supplementary Information 56
Alief Independent School District
Comprehensive Annual Financial Report For the Year Ended August 31, 2003
Table of Contents
Exhibit Page
Financial Section (continued) Other Supplementary Information: Comparative Statements, Combining Statements, and Budget Comparisons: General Fund Comparative Balance Sheet G-1 57 Schedule of Revenues - Budget and Actual G-2 58 Schedule of Expenditures - Budget and Actual G-3 59 Debt Service Fund Comparative Balance Sheet H-1 65 Schedule of Revenues, Expenditures, and Changes in Fund Balance - Original Budget, Amended Budget, and Actual H-2 66 Capital Projects Fund Comparative Balance Sheet I-1 67 Comparative Schedule of Revenues, Expenditures, and Changes in Fund Balance I-2 68 Non-Major Governmental Funds Combining Balance Sheet J-1 69 Combining Statement of Revenues, Expenditures, and Changes in Fund Balance J-2 77 Schedule of Revenues, Expenditures, and Changes in Fund Balance – Original Budget, Amended Budget, and Actual – Food Service Fund J-3 85 Internal Service Funds Combining Statement of Net Assets K-1 86 Combining Statement of Revenues, Expenses, and Changes in Fund Net Assets K-2 87 Combining Statement of Cash Flows K-3 88 Agency Fund Statement of Changes in Assets and Liabilities L-1 89 Capital Assets Used in the Operation of Governmental Funds Comparative Schedule of General Fixed Assets by Source M-1 90 Schedule by Function and Activity M-2 91 Schedule of Changes by Function and Activity M-3 92 General Long-Term Debt on Governmental Funds Bond Schedule N-1 93 Debt Service Requirements to Maturity by Issue N-2 97
Alief Independent School District Comprehensive Annual Financial Report
For the Year Ended August 31, 2003 Table of Contents
Exhibit Page
Financial Section (continued)
Other Supplementary Information (continued): Compliance Schedules Schedule of Delinquent Taxes Receivable O-1 99 Schedule of Expenditures for Computation of Indirect Costs for 2004-05 O-2 101 Fund Balance and Cash Flow Calculation Worksheet (Unaudited) - General Fund O-3 103
Unaudited Statistical Data Government-Wide Information: Government-Wide Expenses by Function I 104 Government-Wide Revenues II 105 Fund Information: Governmental Funds Expenditures by Major Function III 106 Governmental Funds Revenues by Source IV 108 Property Tax Levies and Collections V 110 Assessed and Estimated Actual Value of Taxable Property VI 112 Property Tax Rates - Direct and Overlapping VII 113 Ratio of Net General Bonded Debt to Assessed Value and Net Bonded Debt per Average Daily Attendance and Per Capita VIII 114 Computation of Legal Debt Margin IX 116 Ratio of Annual Debt Service Expenditures for General Bonded Debt to Total Expenditures X 117 Computation of Direct and Overlapping Debt XI 118 Twenty Largest Taxpayers XII 119 Expenditures per Average Daily Attendance XIII 120 Demographic Data XIV 121 Assessed and Estimated Actual Property Values and Construction within the District XV 122 Miscellaneous Statistical Data XVI 123 Location Map XVII 125
1
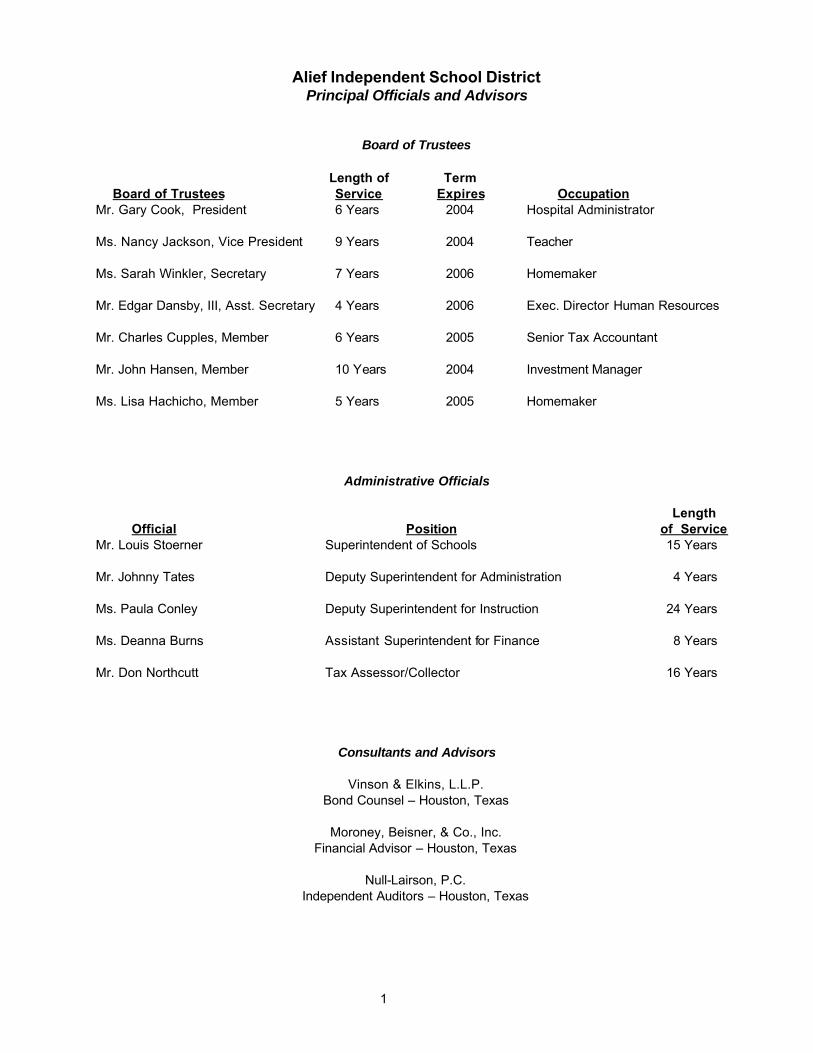
Alief Independent School District Principal Officials and Advisors
Board of Trustees Length of Term Board of Trustees Service Expires Occupation Mr. Gary Cook, President 6 Years 2004 Hospital Administrator Ms. Nancy Jackson, Vice President 9 Years 2004 Teacher Ms. Sarah Winkler, Secretary 7 Years 2006 Homemaker Mr. Edgar Dansby, III, Asst. Secretary 4 Years 2006 Exec. Director Human Resources Mr. Charles Cupples, Member 6 Years 2005 Senior Tax Accountant Mr. John Hansen, Member 10 Years 2004 Investment Manager Ms. Lisa Hachicho, Member 5 Years 2005 Homemaker
Administrative Officials Length Official Position of Service Mr. Louis Stoerner Superintendent of Schools 15 Years Mr. Johnny Tates Deputy Superintendent for Administration 4 Years Ms. Paula Conley Deputy Superintendent for Instruction 24 Years Ms. Deanna Burns Assistant Superintendent for Finance 8 Years Mr. Don Northcutt Tax Assessor/Collector 16 Years
Consultants and Advisors
Vinson & Elkins, L.L.P. Bond Counsel – Houston, Texas
Moroney, Beisner, & Co., Inc.
Financial Advisor – Houston, Texas
Null-Lairson, P.C. Independent Auditors – Houston, Texas
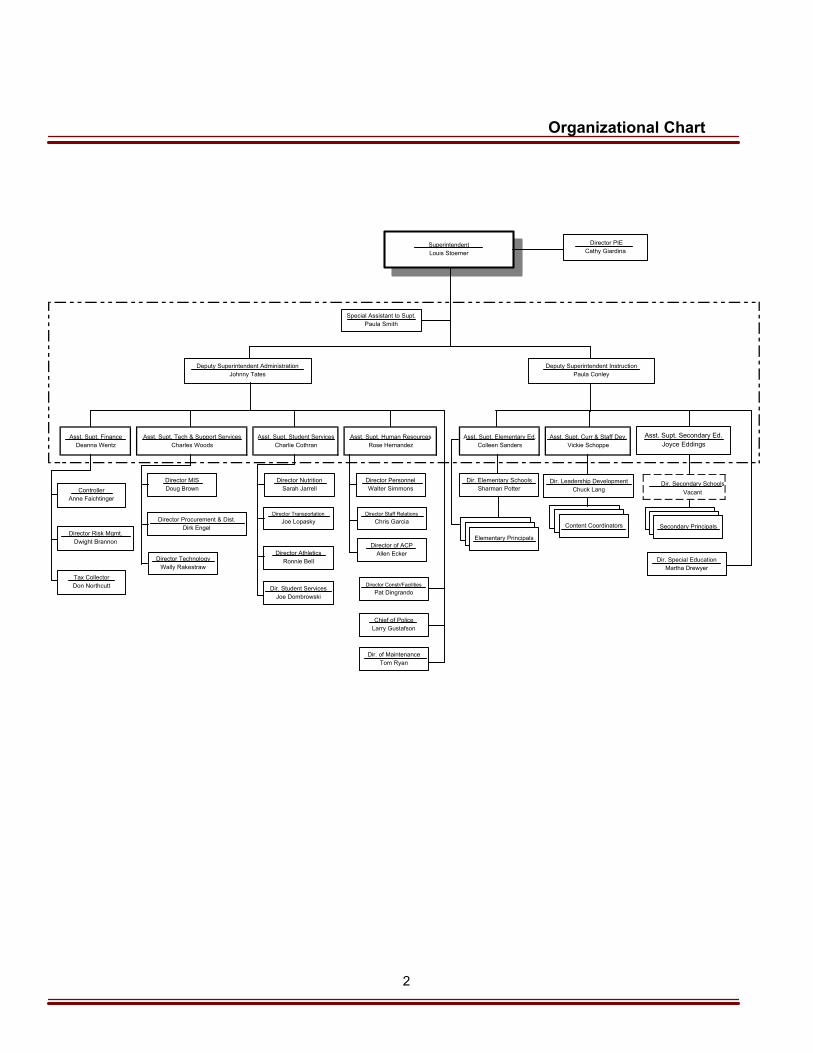
Organizational Chart
Asst. Supt. Finance Deanna Wentz
Asst. Supt. Tech & Support Services Charles Woods
Asst. Supt. Student Services Charlie Cothran
Asst. Supt. Human Resources Rose Hernandez
Asst. Supt. Elementary Ed. Colleen Sanders
Asst. Supt. Curr & Staff Dev. Vickie Schoppe
Dir. Secondary SchoolsVacant
Deputy Superintendent AdministrationJohnny Tates
Deputy Superintendent InstructionPaula Conley
Special Assistant to Supt.Paula Smith
SuperintendentLouis Stoerner
Director PIECathy Giardina
Director MISDoug Brown
Director Procurement & Dist.Dirk Engel
Director TechnologyWally Rakestraw
Director NutritionSarah Jarrell
Director TransportationJoe Lopasky
Director AthleticsRonnie Bell
Dir. Student ServicesJoe Dombrowski
Director PersonnelWalter Simmons
Director Staff RelationsChris Garcia
Director Constr/FacilitiesPat Dingrando
Chief of PoliceLarry Gustafson
Dir. of MaintenanceTom Ryan
Dir. Elementary SchoolsSharman Potter
Dir. Leadership Development Chuck Lang
Content Coordinators Secondary Principals
Elementary Principals
Dir. Special EducationMartha Drewyer
ControllerAnne Faichtinger
Director Risk Mgmt.Dwight Brannon
Asst. Supt. Secondary Ed.Joyce Eddings
Director of ACPAllen Ecker
Tax CollectorDon Northcutt
2
3
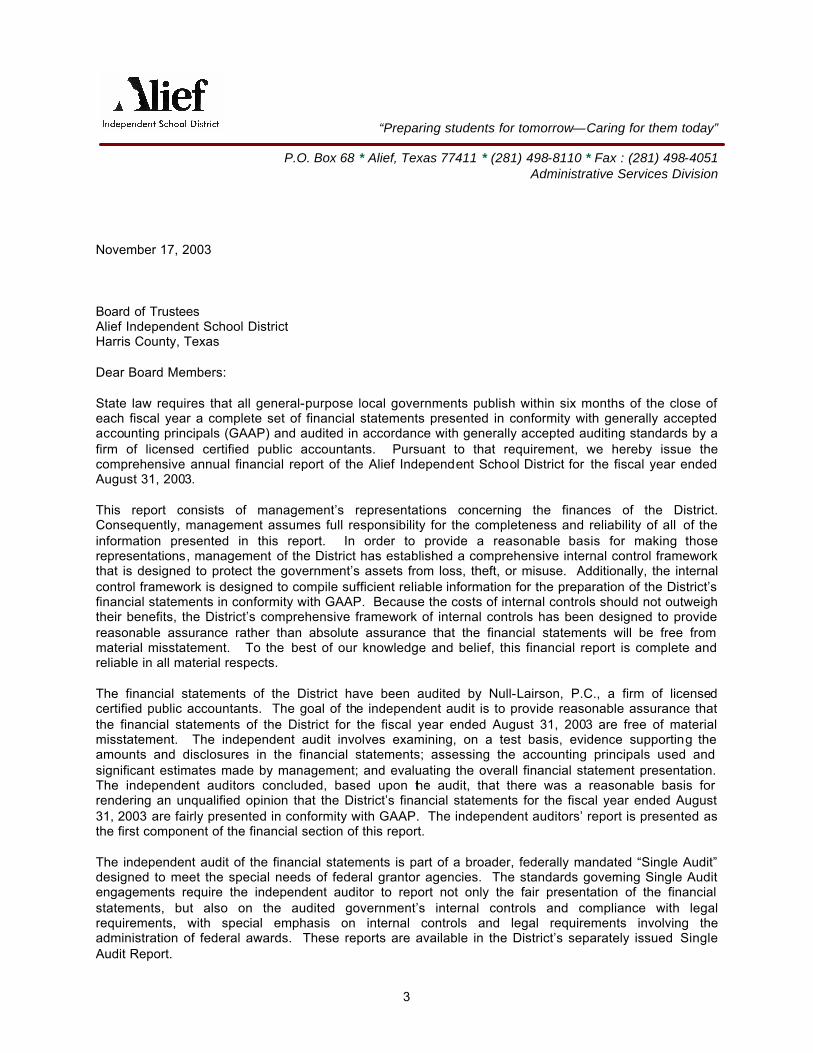
“Preparing students for tomorrow—Caring for them today”
P.O. Box 68 * Alief, Texas 77411 * (281) 498-8110 * Fax : (281) 498-4051
Administrative Services Division November 17, 2003 Board of Trustees Alief Independent School District Harris County, Texas Dear Board Members: State law requires that all general-purpose local governments publish within six months of the close of each fiscal year a complete set of financial statements presented in conformity with generally accepted accounting principals (GAAP) and audited in accordance with generally accepted auditing standards by a firm of licensed certified public accountants. Pursuant to that requirement, we hereby issue the comprehensive annual financial report of the Alief Independent School District for the fiscal year ended August 31, 2003. This report consists of management’s representations concerning the finances of the District. Consequently, management assumes full responsibility for the completeness and reliability of all of the information presented in this report. In order to provide a reasonable basis for making those representations, management of the District has established a comprehensive internal control framework that is designed to protect the government’s assets from loss, theft, or misuse. Additionally, the internal control framework is designed to compile sufficient reliable information for the preparation of the District’s financial statements in conformity with GAAP. Because the costs of internal controls should not outweigh their benefits, the District’s comprehensive framework of internal controls has been designed to provide reasonable assurance rather than absolute assurance that the financial statements will be free from material misstatement. To the best of our knowledge and belief, this financial report is complete and reliable in all material respects. The financial statements of the District have been audited by Null-Lairson, P.C., a firm of licensed certified public accountants. The goal of the independent audit is to provide reasonable assurance that the financial statements of the District for the fiscal year ended August 31, 2003 are free of material misstatement. The independent audit involves examining, on a test basis, evidence supporting the amounts and disclosures in the financial statements; assessing the accounting principals used and significant estimates made by management; and evaluating the overall financial statement presentation. The independent auditors concluded, based upon the audit, that there was a reasonable basis for rendering an unqualified opinion that the District’s financial statements for the fiscal year ended August 31, 2003 are fairly presented in conformity with GAAP. The independent auditors’ report is presented as the first component of the financial section of this report. The independent audit of the financial statements is part of a broader, federally mandated “Single Audit” designed to meet the special needs of federal grantor agencies. The standards governing Single Audit engagements require the independent auditor to report not only the fair presentation of the financial statements, but also on the audited government’s internal controls and compliance with legal requirements, with special emphasis on internal controls and legal requirements involving the administration of federal awards. These reports are available in the District’s separately issued Single Audit Report.
4
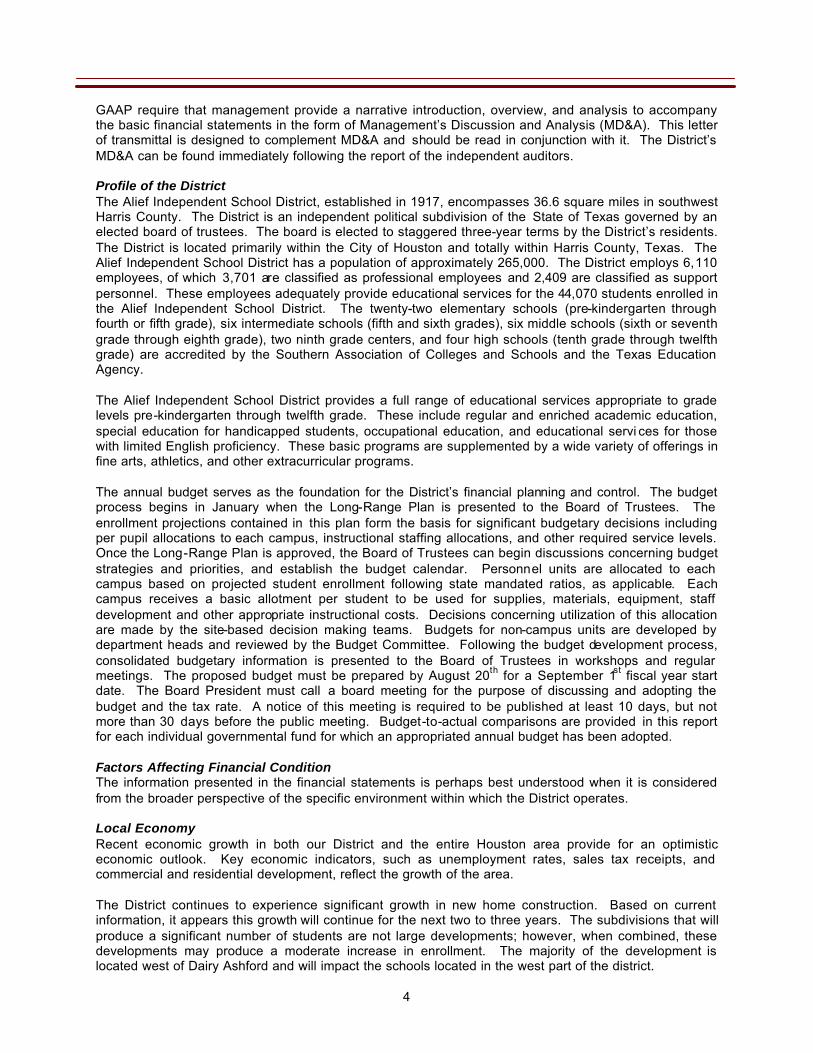
GAAP require that management provide a narrative introduction, overview, and analysis to accompany the basic financial statements in the form of Management’s Discussion and Analysis (MD&A). This letter of transmittal is designed to complement MD&A and should be read in conjunction with it. The District’s MD&A can be found immediately following the report of the independent auditors. Profile of the District The Alief Independent School District, established in 1917, encompasses 36.6 square miles in southwest Harris County. The District is an independent political subdivision of the State of Texas governed by an elected board of trustees. The board is elected to staggered three-year terms by the District’s residents. The District is located primarily within the City of Houston and totally within Harris County, Texas. The Alief Independent School District has a population of approximately 265,000. The District employs 6,110 employees, of which 3,701 are classified as professional employees and 2,409 are classified as support personnel. These employees adequately provide educational services for the 44,070 students enrolled in the Alief Independent School District. The twenty-two elementary schools (pre-kindergarten through fourth or fifth grade), six intermediate schools (fifth and sixth grades), six middle schools (sixth or seventh grade through eighth grade), two ninth grade centers, and four high schools (tenth grade through twelfth grade) are accredited by the Southern Association of Colleges and Schools and the Texas Education Agency. The Alief Independent School District provides a full range of educational services appropriate to grade levels pre-kindergarten through twelfth grade. These include regular and enriched academic education, special education for handicapped students, occupational education, and educational servi ces for those with limited English proficiency. These basic programs are supplemented by a wide variety of offerings in fine arts, athletics, and other extracurricular programs. The annual budget serves as the foundation for the District’s financial planning and control. The budget process begins in January when the Long-Range Plan is presented to the Board of Trustees. The enrollment projections contained in this plan form the basis for significant budgetary decisions including per pupil allocations to each campus, instructional staffing allocations, and other required service levels. Once the Long-Range Plan is approved, the Board of Trustees can begin discussions concerning budget strategies and priorities, and establish the budget calendar. Personnel units are allocated to each campus based on projected student enrollment following state mandated ratios, as applicable. Each campus receives a basic allotment per student to be used for supplies, materials, equipment, staff development and other appropriate instructional costs. Decisions concerning utilization of this allocation are made by the site-based decision making teams. Budgets for non-campus units are developed by department heads and reviewed by the Budget Committee. Following the budget development process, consolidated budgetary information is presented to the Board of Trustees in workshops and regular meetings. The proposed budget must be prepared by August 20th for a September 1st fiscal year start date. The Board President must call a board meeting for the purpose of discussing and adopting the budget and the tax rate. A notice of this meeting is required to be published at least 10 days, but not more than 30 days before the public meeting. Budget-to-actual comparisons are provided in this report for each individual governmental fund for which an appropriated annual budget has been adopted. Factors Affecting Financial Condition The information presented in the financial statements is perhaps best understood when it is considered from the broader perspective of the specific environment within which the District operates. Local Economy Recent economic growth in both our District and the entire Houston area provide for an optimistic economic outlook. Key economic indicators, such as unemployment rates, sales tax receipts, and commercial and residential development, reflect the growth of the area. The District continues to experience significant growth in new home construction. Based on current information, it appears this growth will continue for the next two to three years. The subdivisions that will produce a significant number of students are not large developments; however, when combined, these developments may produce a moderate increase in enrollment. The majority of the development is located west of Dairy Ashford and will impact the schools located in the west part of the district.
5
Local Economy (continued) This will somewhat reverse the trend of student growth, which for several years was in the eastern part of the district, primarily along the Sam Houston Tollway. The homes prices vary, with the average in the mid $100,000 range This revitalization of our area is encouraging. The District’s property values, which peaked in the early 1980’s, are continuing to rebound, with growth rates over 7.5% for the last five years. State Funding Continued increases in enrollment are projected for the foreseeable future in the District. The current system in the State of Texas provides funding for public education via a financing formula which weights student attendance levels, property value per student, the District’s tax effort, and regional variations in payroll and other costs. The District is considered a “property-poor” school district because the assessed value of property per student is lower than the statewide average. The statewide taxable value per student for 2002-03 was $242,809, while the comparable value for the District was $174,157. Cash Management Cash available in excess of cash requirements was invested in the one of three investment pools used by the District and government agency securities. The District participates in Texpool, the Local Government Investment Cooperative (LOGIC), and Lone Star investment pools. The average yield on investments was 2.00% while the average yield on the one year U.S. Treasury bill was 1.29% for the year ended August, 31, 2003. The District’s investment policy is to minimize risk while maintaining a competitive yield on its portfolio. The District’s deposits were entirely covered by Federal Deposit Insurance Corporation (FDIC) insurance and pledged collateral for the year ended August 31, 2003. Risk Management The District’s risk management program encompasses various means of protecting the District against loss. Property and casualty insurance is provided by commercial carriers and liability insurance coverage is provided by participation in a public entity risk pool administered by the Texas Association of School Boards. The Risk Management Department of the District strives to ensure the safety and health of the students and employees through its accident prevention programs, safety education programs, and safety inspections. In addition, the District strives to maintain employee benefit programs designed to retain and attract qualified personnel. To achieve this, the District operates a self-funded health insurance program and is covered by an excess loss insurance policy for claims exceeding a specified limit. Various types of insurance coverages are made available to employees. Portions of the coverages available, such as medical and life insurance, are partially paid by the District. The District also operates a self-funded workers compensation program with an emphasis on cost control of claims. Major Initiatives and Accomplishments In September 2003, the voters in the Alief Independent School District approved a $175 million bond referendum. The bonds will begin to be issued in the spring, 2004. These proceeds will be used to support construction of new facilities, including Elementary #23, Elementary #24, Intermediate #7, and Middle School #7 as well as purchase land for future schools. The proceeds will also be used for renovations, additions, and maintenance to existing campuses including enclosing classrooms at the elementary schools. Implementation of the Long-Range Technology Plan is still in effect, which will enable children to experience hands on learning utilizing leading edge technologies. New computer labs are being installed to improve academic success through computer-assisted learning. The success of these and many other programs is evident in the continued improvement of TAAS scores recently released by the Texas Education Agency.
6
Major Initiatives and Accomplishments (continued) The 2002-03 financial structure of the Alief Independent School District provided support to work toward or accomplish the following goals: 1. Provided competitive salary and benefit increases to District employees. A $1,346 across the
board increase was approved for all employees paid from the teacher salary schedule. For all other personnel, a 3% of the midpoint increase was approved by the Board of Trustees. Additionally, all employees will receive an additional $80/month for benefits. As a result of both of these changes, most employees will see significant increases in their net pay.
2. The successful continuation of the Special Campus Instructional Grant Program which began in
fiscal year 1998-99. Each campus is allocated an additional $25 per pupil based on enrollment estimates. The purpose of these funds is to supplement the basic campus allocation in a manner that enhances the educational program through the implementation of new programs or projects.
3. Structured fiscally responsible debt retirement schedules. When compared with other “fast
growth” districts, Alief continues to retire debt at a much faster pace. Within the next 10 years, Alief will retire approximately 69.41% of the currently issued debt compared to the state average of 43.2%.
Awards and Acknowledgements The Association of School Business Officials International (ASBO) awarded a Certificate of Excellence in Financial Reporting to the Alief Independent School District for its Comprehensive Annual Financial Report for the fiscal year ended August 31, 2002. We believe that our current report continues to conform to the high standards of the certificate of excellence program, and we are submitting it to ASBO. In addition, the Government Finance Officers Association of the United States and Canada (GFOA) awarded a Certificate of Achievement for Excellence in Financial Reporting to Alief Independent School District for its Comprehensive Annual Financial Report for the fiscal year ended August 31, 2002. In order to be awarded a Certificate of Achievement, a government unit must publish an easily readable and efficiently organized Comprehensive Annual Financial Report, whose contents conform to program standards. Such reports must satisfy both accounting principles generally accepted in the United States of America and applicable legal requirements. A Certificate of Achievement is valid for a period of one year only. We believe our current report continues to conform to the Certificate of Achievement Program requirements, and we are submitting it to the GFOA. The District also received the GFOA’s Distinguished Budget Presentation Award and the ASBO’s Meritorious Budget Award for its annual budget document. In order to qualify for these budget awards the budget document was judged to be proficient in several categories as specified by these two organizations.
7
Awards and Acknowledgements (continued) The financial management staff of the Alief Independent School District wishes to express its appreciation to the Board of Trustees for their concern in providing fiscal accountability to the patrons of the District and thereby contributing their full support in the development of one of the best educational financial operations within the State of Texas. The preparation of this report could not have been accomplished without the dedicated services of the District’s Accounting Department as well as the technical support provided by the independent auditing firm of Null-Lairson, P.C. Sincere appreciation is extended to those personnel who assisted and contributed to the preparation of the Comprehensive Annual Financial Report. Sincerely, Mr. Louis B. Stoerner Mr. Johnny Tates Superintendent Deputy Superintendent, Administrative Services Division
Ms. Deanna Wentz Assistant Superintendent for Finance
8
9

This page intentionally blank.
10

This page intentionally blank.
11 Greenway Plaza, Suite 1515 Houston, TX 77046
(713) 621-1515 Fax: (713) 621-1570
One Sugar Creek Blvd., Suite 920 Sugar Land, TX 77478
(281) 242-8600 Fax: (281) 242-7333
11
Independent Auditors’ Report To the Board of Trustees Alief Independent School District Alief, Texas We have audited the accompanying financial statements of the governmental activities, the business- type activities, each major fund, and the aggregate remaining fund information of Alief Independent School District as of August 31, 2003, and for the year then ended, which collectively comprise the District’s basic financial statements as listed in the table of contents. These financial statements are the responsibility of Alief Independent School District’s management. Our responsibility is to express opinions on these financial statements based on our audit. We conducted our audit in accordance with auditing standards generally accepted in the United States of America and the standards applicable to financial audits contained in Government Auditing Standards issued by the Comptroller General of the United States, the provisions of the Office of Management and Budget (OMB) Circular A-133, Audits of States, Local Governments, and Non-Profit Organizations; and applicable provisions of the Texas Education Agency’s “Financial Accountability System Resource Guide”. Those standards require that we plan and perform the audit to obtain reasonable assurance about whether the financial statements are free of material misstatement. An audit includes examining, on a test basis, evidence supporting the amounts and disclosures in the financial statements. An audit also includes assessing the accounting principles used and significant estimates made by management, as well as evaluating the overall financial statement presentation. We believe that our audit provides a reasonable basis for our opinions. In our opinion, the financial statements referred to above present fairly, in all material respects, the respective financial position of the governmental activities, the business-type activities, each major fund and the aggregate remaining fund information of Alief Independent School District, as of August 31, 2003, and the respective changes in financial position results and cash flows, where applicable, thereof for the year then ended in conformity with accounting principles generally accepted in the United States of America. In accordance with Government Auditing Standards, we have also issued reports dated October 30, 2003, on our consideration of Alief Independent School District’s internal control over financial reporting and our tests of its compliance with certain provisions of laws, regulations, contracts, and grants. That report, which has been issued separately from this document, is an integral part of an audit performed in accordance with Government Auditing Standards and should be read in conjunction with this report in considering the results of our audit. The Management’s Discussion and Analysis, on page 13 through 21, and the Schedule of Revenues, Expenditures and Changes in Fund Balances Original Budget, Amended Final and Actual – General Fund, on pages 55 through 56, are not a required part of the basic financial statements but are supplementary information required by accounting principles generally accepted in the United States of America. We have applied certain limited procedures, which consisted principally of inquiries of management regarding the methods of measurement and presentation of the required supplementary information. However, we did not audit the information and express no opinion on it.
12
Our audit was conducted for the purpose of forming opinions on the financial statements that collectively comprise the District’s basic financial statements. The Comparative Statements, Combining Statements and Budget Comparisons, Capital Assets used in the Operation of Governmental Funds, Compliance Schedules, and other schedules listed under Other Supplementary Information in the Table of Contents are presented for purposes of additional analysis and are not a required part of the basic financial statements. The Comparative Statements, Combining Statements and Budget Comparisons, Capital Assets used in the Operation of Governmental Funds, Compliance Schedules, and other schedules listed under Other Supplementary Information in the Table of Contents have been subjected to the auditing procedures applied in the audit of the basic financial statements and in our opinion are fairly stated in all material respects in relation to the basic financial statements taken as a whole. The Introductory Section and Statistical Data Section listed in the foregoing Table of Contents are presented for the purpose of additional analysis and are not a required part of the basic financial statements of the District. Such additional information has not been subjected to the auditing procedures applied in our audit of the basic financial statements and, accordingly, we express no opinion on them.
Houston, Texas October 30, 2003

Alief
Basic Financial Statements

This page intentionally blank.
13
Management's Discussion and Analysis In this section of the Annual Financial and Compliance Report, we offer readers of the District’s financial statements a narrative overview and analysis of the financial activities of the District for the fiscal year ended August 31, 2003. Please read it in conjunction with the independent auditors' report and the District's financial statements, which follow this section.
Financial Highlights · The assets of the District exceeded its liabilities at the close of the fiscal year by $189,237,911 (net
assets). Of this amount, $64,247,773 (unrestricted net assets) may be used to meet the District’s ongoing obligations.
· The District’s net assets increased by $19,391,598 as a result of this year’s operations. · The District’s governmental funds reported combined ending fund balances of $86,782,237.
Approximately 66% of this total amount, $57,001,529, is available for spending at the government’s discretion (unreserved, undesignated fund balance).
· The combined ending fund balances for the District’s governmental funds decreased $3,869,317 due
to normal operations. Offsetting this decrease in fund balances is an increase of $1,344,550 created by a prior period adjustment.
· The General Fund ended the year with an unreserved, undesignated fund balance of $57,001,529, or
22% of the total general fund expenditures.
Overview of the Financial Statements This annual report consists of a series of financial statements plus additional supplemental information as required by its state oversight agency, the Texas Education Agency. The District’s basic financial statements consist of three sections: 1) government-wide financial statements, 2) fund financial statements, and 3) notes to the financial statements. The following sections describe the measurement focus of the two types of statements and the significant differences in the information they provide. Government-wide Financial Statements The focus of government-wide financial statements is on the overall financial position and activities of the District. The District’s government-wide financial statements include the statement of net assets and the statement of activities (on pages 22 and 23), which are prepared using accounting principles that are similar to commercial enterprises. These statements provide information about the activities of the District as a whole and present a longer-term view of the District's property and debt obligations and other financial matters. The statement of net assets includes all the District's assets and liabilities at the end of the year, with the difference between the two reported as net assets. This difference is similar to the total owners’ equity presented by a commercial enterprise. All the District's assets are reported, whether they serve the current year or future years. Liabilities are considered regardless of whether they must be paid in the current or future years. Although the purpose of the District is not to accumulate net assets, in general, as the amount increases, it may indicate that the financial position of the District is improving over time. To fully assess the overall health of the District, however, you should consider other factors as well, such as changes in the District's average daily attendance or its property tax base and the condition of the District's facilities.
14
Management’s Discussion and Analysis (continued) The purpose of the statement of activities is to present the revenues and expenses of the District. Again, the items presented on the statement of activities are measured in a manner similar to the approach used by a commercial enterprise in that revenues are recognized when earned or established criteria are satisfied, and expenses are reported when incurred by the District. Thus, revenues are reported even when they may not be collected for several months or years after the end of the accounting period, and expenses are recorded even though they may not have used cash during the current period. The District's revenues are divided into those provided by outside parties who share the costs of some programs, such as tuition received for summer school and grants provided by the U.S. Department of Education to assist children with disabilities or from disadvantaged backgrounds (program revenues), and revenues provided by the taxpayers or by TEA in the equalization funding processes (general revenues). Although the statement of activities looks different from a commercial enterprise’s income statements, the financial statement is different only in format, not substance. The financial information for the year ended August 31, 2003 includes start up costs for the District’s new day care facility. The facility will offer child care services to employees. The costs associated with the day care are accounted for as a business-type activity. Once the facility becomes operational, fees charged to employees are intended to recover all or a significant portion of costs incurred. The District has no component units for which it is financially accountable. Fund Financial Statements Fund financial statements (starting on page 24) report the District's operations in more detail than the government-wide statements by providing information about the District's most significant funds – not the District as a whole. For governmental activities, these statements tell how services were financed in the short term, as well as what resources remain for future spending. They reflect the flow of current financial resources, and supply the basis for tax levies and the appropriations budget. For proprietary activities, fund financial statements tell how goods or services of the District were sold to departments within the District or outside parties and how the sales revenues covered the expenses of the goods or services. The remaining statements, fiduciary statements, provide financial information about activities for which the District acts solely as a trustee or agent for the benefit of those outside of the district. Laws and contracts require the District to establish some funds, such as the debt service fund. The District's administration establishes many other funds to help it control and manage money for particular purposes. All of the District’s funds can be divided into three categories: governmental funds, proprietary funds, and fiduciary funds.
· Governmental funds – Governmental funds are used to account for essentially the same functions reported as governmental activities in the government-wide financial statements. However, unlike the government-wide financial statements, governmental fund financial statements focus on near-term inflows and outflows of spendable resources, as well as on balances of spendable resources available at the end of the fiscal year. Such information may be useful in evaluating a government’s near-term financing requirements. Because the focus of governmental funds is narrower than that of the government-wide financial statements, it is useful to compare the information presented for governmental funds with similar information presented for governmental activities in the government-wide financial statements. By doing so, readers may better understand the long-term impact of the government’s near-term financing decisions. Both the governmental fund balance sheet and the governmental fund statement of revenues, expenditures, and changes in fund balances provide a reconciliation to facilitate this comparison between governmental funds and governmental activities.
15
Management’s Discussion and Analysis (continued) The District maintains 45 governmental funds. Information is presented separately in fund financial statements for the general fund, debt service fund, and the capital projects fund, all of which are considered to be major funds. Data from the other 42 non-major governmental funds are combined into a single, aggregated presentation. Individual fund data for each of the non-major governmental funds is provided in the form of combining statements elsewhere in this report. The District adopts an annual appropriated budget for its general fund, debt service fund, and food service fund. Budgetary comparison schedules have been provided to demonstrate compliance with these budgets. · Proprietary funds – Proprietary funds provide the same type of information as the government-wide financial statements, only in more detail. There are two proprietary fund types – enterprise and internal service funds. The District’s enterprise fund is used to account for its business-type activity, a day care facility. The internal service funds are an accounting device used to accumulate and allocate costs internally among the various functions. The District uses the internal service fund to report activities for its self-funded insurance program. The basic proprietary fund financial statements can be found on pages 29-31 of this report. · Fiduciary funds – Fiduciary funds are used to account for resources held for the benefit of parties outside the government. The District is the trustee, or fiduciary, for money raised by student activities. All of the District’s fiduciary activities are reported in a separate Statement of Assets and Liabilities on page 32. We exclude these resources from the District’s other financial statements because the District cannot use these assets to finance its operations. The district is only responsible for ensuring that the assets reported in these funds are used for their intended purposes.
Notes to the financial statements The notes to the financial statements (starting on page 33) provide narrative explanations or additional data needed for full disclosure in the government-wide statements or the fund financial statements. Other information In addition to the basic financial statements and accompanying notes, this report also presents certain required supplementary information that further explains and supports the information in the financial statements. Required supplementary information can be found on page 55 of this report. The combining statements referred to earlier in connection with nonmajor governmental funds are presented following the required supplementary information. Comparative statements, combining statements, budget comparisons, and compliance schedules can be found on pages 57-103 of this report.
Government-Wide Financial Analysis The government-wide financial statements for the fiscal year ended August 31, 2003 are the second annual financial statements presented under new governmental accounting standards. The District’s overall financial position and operations for the past year two years are summarized as follows, based on the information included in the government-wide financial statements.
16
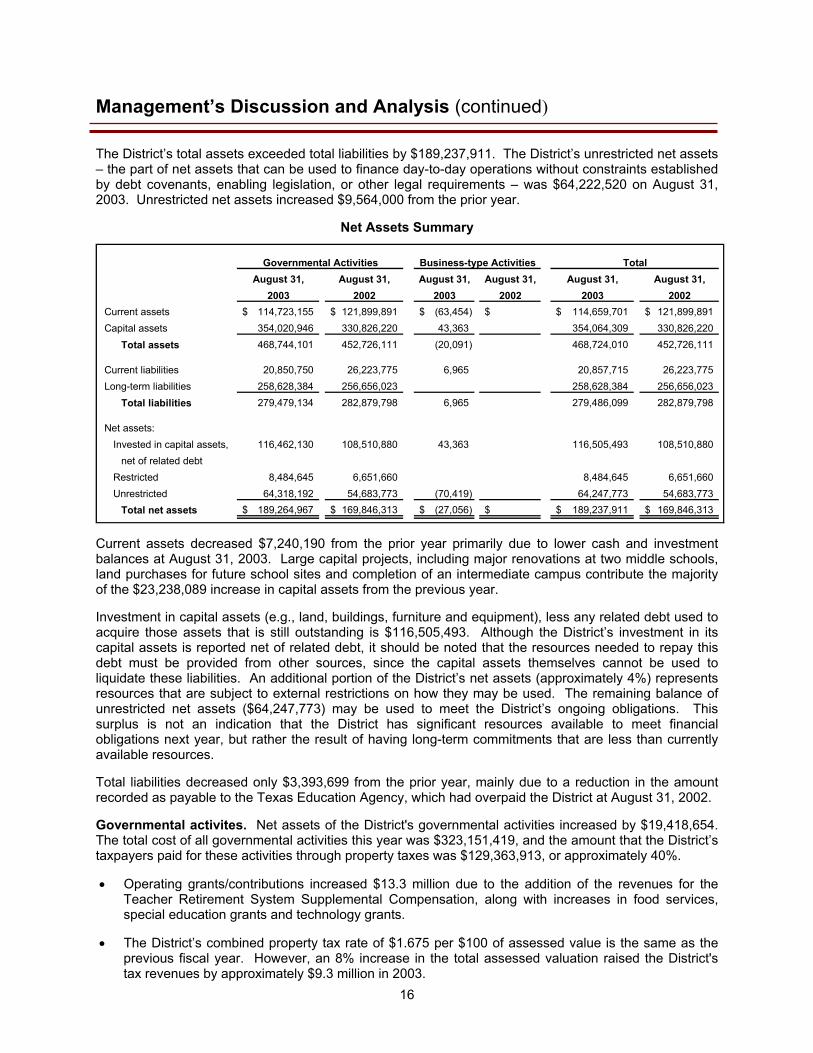
Management’s Discussion and Analysis (continued) The District’s total assets exceeded total liabilities by $189,237,911. The District’s unrestricted net assets – the part of net assets that can be used to finance day-to-day operations without constraints established by debt covenants, enabling legislation, or other legal requirements – was $64,222,520 on August 31, 2003. Unrestricted net assets increased $9,564,000 from the prior year.
Net Assets Summary
Governmental Activities Business-type Activities TotalAugust 31, August 31, August 31, August 31, August 31, August 31,
2003 2002 2003 2002 2003 2002Current assets 114,723,155$ 121,899,891$ (63,454)$ $ 114,659,701$ 121,899,891$ Capital assets 354,020,946 330,826,220 43,363 354,064,309 330,826,220
Total assets 468,744,101 452,726,111 (20,091) 468,724,010 452,726,111
Current liabilities 20,850,750 26,223,775 6,965 20,857,715 26,223,775 Long-term liabilities 258,628,384 256,656,023 258,628,384 256,656,023
Total liabilities 279,479,134 282,879,798 6,965 279,486,099 282,879,798
Net assets:Invested in capital assets, 116,462,130 108,510,880 43,363 116,505,493 108,510,880
net of related debtRestricted 8,484,645 6,651,660 8,484,645 6,651,660 Unrestricted 64,318,192 54,683,773 (70,419) 64,247,773 54,683,773
Total net assets 189,264,967$ 169,846,313$ (27,056)$ $ 189,237,911$ 169,846,313$
Current assets decreased $7,240,190 from the prior year primarily due to lower cash and investment balances at August 31, 2003. Large capital projects, including major renovations at two middle schools, land purchases for future school sites and completion of an intermediate campus contribute the majority of the $23,238,089 increase in capital assets from the previous year. Investment in capital assets (e.g., land, buildings, furniture and equipment), less any related debt used to acquire those assets that is still outstanding is $116,505,493. Although the District’s investment in its capital assets is reported net of related debt, it should be noted that the resources needed to repay this debt must be provided from other sources, since the capital assets themselves cannot be used to liquidate these liabilities. An additional portion of the District’s net assets (approximately 4%) represents resources that are subject to external restrictions on how they may be used. The remaining balance of unrestricted net assets ($64,247,773) may be used to meet the District’s ongoing obligations. This surplus is not an indication that the District has significant resources available to meet financial obligations next year, but rather the result of having long-term commitments that are less than currently available resources. Total liabilities decreased only $3,393,699 from the prior year, mainly due to a reduction in the amount recorded as payable to the Texas Education Agency, which had overpaid the District at August 31, 2002. Governmental activites. Net assets of the District's governmental activities increased by $19,418,654. The total cost of all governmental activities this year was $323,151,419, and the amount that the District’s taxpayers paid for these activities through property taxes was $129,363,913, or approximately 40%. • Operating grants/contributions increased $13.3 million due to the addition of the revenues for the
Teacher Retirement System Supplemental Compensation, along with increases in food services, special education grants and technology grants.
• The District’s combined property tax rate of $1.675 per $100 of assessed value is the same as the
previous fiscal year. However, an 8% increase in the total assessed valuation raised the District's tax revenues by approximately $9.3 million in 2003.
17
Management’s Discussion and Analysis (continued)
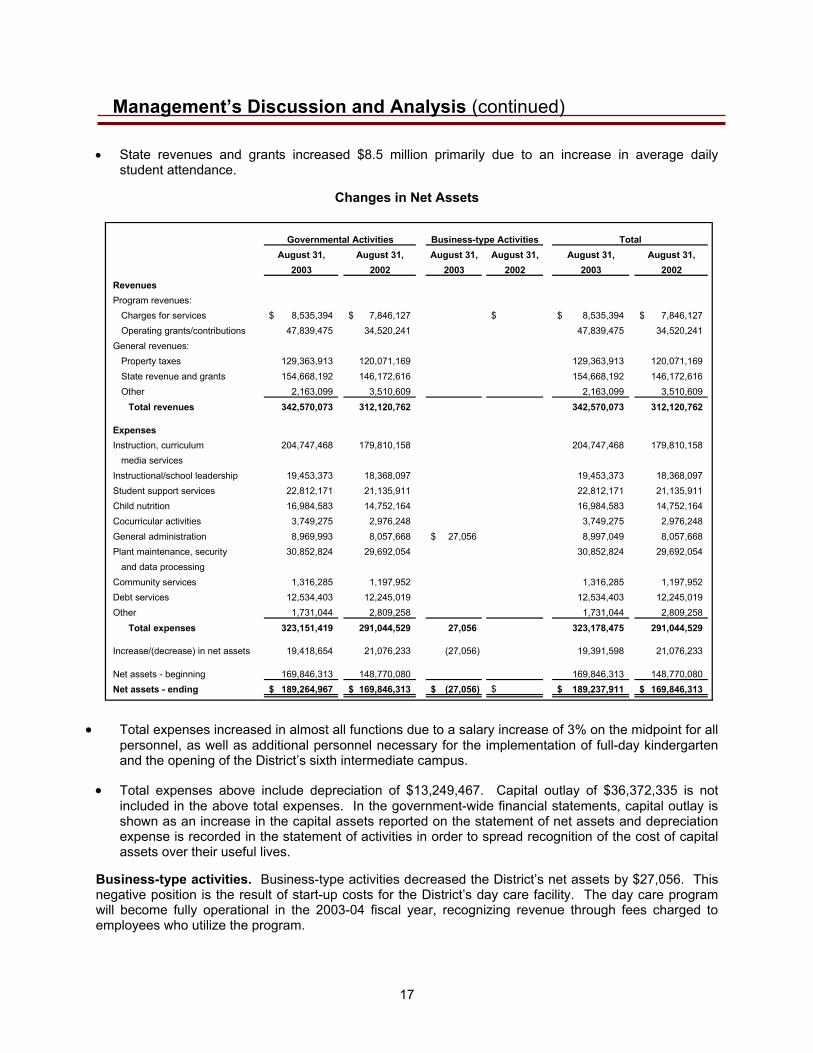
• State revenues and grants increased $8.5 million primarily due to an increase in average daily
student attendance.
Changes in Net Assets
Governmental Activities Business-type Activities TotalAugust 31, August 31, August 31, August 31, August 31, August 31,
2003 2002 2003 2002 2003 2002RevenuesProgram revenues:
Charges for services 8,535,394$ 7,846,127$ $ 8,535,394$ 7,846,127$ Operating grants/contributions 47,839,475 34,520,241 47,839,475 34,520,241
General revenues:Property taxes 129,363,913 120,071,169 129,363,913 120,071,169 State revenue and grants 154,668,192 146,172,616 154,668,192 146,172,616 Other 2,163,099 3,510,609 2,163,099 3,510,609
Total revenues 342,570,073 312,120,762 342,570,073 312,120,762
ExpensesInstruction, curriculum 204,747,468 179,810,158 204,747,468 179,810,158
media servicesInstructional/school leadership 19,453,373 18,368,097 19,453,373 18,368,097 Student support services 22,812,171 21,135,911 22,812,171 21,135,911 Child nutrition 16,984,583 14,752,164 16,984,583 14,752,164 Cocurricular activities 3,749,275 2,976,248 3,749,275 2,976,248 General administration 8,969,993 8,057,668 27,056$ 8,997,049 8,057,668 Plant maintenance, security 30,852,824 29,692,054 30,852,824 29,692,054
and data processingCommunity services 1,316,285 1,197,952 1,316,285 1,197,952 Debt services 12,534,403 12,245,019 12,534,403 12,245,019 Other 1,731,044 2,809,258 1,731,044 2,809,258
Total expenses 323,151,419 291,044,529 27,056 323,178,475 291,044,529
Increase/(decrease) in net assets 19,418,654 21,076,233 (27,056) 19,391,598 21,076,233
Net assets - beginning 169,846,313 148,770,080 169,846,313 148,770,080 Net assets - ending 189,264,967$ 169,846,313$ (27,056)$ $ 189,237,911$ 169,846,313$
• Total expenses increased in almost all functions due to a salary increase of 3% on the midpoint for all
personnel, as well as additional personnel necessary for the implementation of full-day kindergarten and the opening of the District’s sixth intermediate campus.
• Total expenses above include depreciation of $13,249,467. Capital outlay of $36,372,335 is not
included in the above total expenses. In the government-wide financial statements, capital outlay is shown as an increase in the capital assets reported on the statement of net assets and depreciation expense is recorded in the statement of activities in order to spread recognition of the cost of capital assets over their useful lives.
Business-type activities. Business-type activities decreased the District’s net assets by $27,056. This negative position is the result of start-up costs for the District’s day care facility. The day care program will become fully operational in the 2003-04 fiscal year, recognizing revenue through fees charged to employees who utilize the program.
18
Management’s Discussion and Analysis (continued)
Financial Analysis of the District’s Funds As noted earlier, the District uses fund accounting to ensure and demonstrate compliance with finance-related legal requirements. Governmental funds. The focus of the District’s governmental funds is to provide information on near-term inflows, outflows, and balances of spendable resources. Such information is useful in assessing the District’s financing requirements. In particular, unreserved fund balance may serve as a useful measure of a government’s net resources available for spending at the end of the fiscal year. As of the end of the current fiscal year, the District’s governmental funds reported combined ending fund balances of $86,782,237, a decrease of $3,869,317. Approximately 66% of this total amount ($57,001,529) constitutes unreserved, undesignated fund balance. The remainder of fund balance is reserved or designated to indicate that it is not available for new spending because it has already been committed 1) for inventory - $1,607,424, 2) to pay debt service - $2,613,826, 3) to liquidate purchase orders of the prior period - $322,603, 4) for food service - $5,105,670, and 5) for capital projects -$20,131,185. Offsetting the operating decrease in fund balance is an increase created by a prior period adjustment. This increase of $1,344,550 is the result of the District’s implementation of Governmental Accounting Standards Board Interpretation No. 6. Compensated absences not currently due and payable, which were previously accrued within the governmental funds will now be reported only in the government-wide statements. The general fund is the primary operating fund of the District. At the end of the current fiscal year, unreserved, undesignated fund balance of the general fund was $57,001,529, while the total fund balance was $62,076,216. As a measure of the general fund’s liquidity, it may be useful to compare unreserved, undesignated fund balance to the total fund expenditures. Unreserved, undesignated fund balance represents 22.2% of the total general fund expenditures. During the current fiscal year, the fund balance of the general fund increased by $10,629,201, exclusive of the prior period adjustment. Key factors related to this change are as follows:
• The District’s taxable value increased over $6.7 million providing approximately $113 million of tax revenue, or 42% of total general fund revenue.
• State funding of $150 million, or 56.1% of total general fund revenue, is earned based primarily
on average daily attendance (ADA). ADA increased by approximately 6% over the prior fiscal year.
• The majority (88.7%) of the District’s expenditures are for personnel costs. Personnel costs grew
during the current fiscal year due to a salary increase of 3% on the midpoint for all employees as well as an increase in the number of employees due to growth.
The debt service fund has a total fund balance of $2,613,826, all of which is reserved for the payment of debt service. The District’s goal is to maintain this fund balance at a fairly constant level; therefore, the tax rate for this fund was left unchanged at $0.215, resulting in revenues exceeding expenditures by only $7,418. Fund balance for the capital projects fund at August 31, 2003 was $16,431,185. As a result of unspent bond proceeds in previous years, the funds began the year with $31,929,660 in fund balance. The District received $19,750,000 in bond proceeds and spent $35,496,674 in the current year on capital outlay. The remaining fund balance is designated for future construction projects, including building additions at several elementary campuses and miscellaneous other campus projects.
19
Management’s Discussion and Analysis (continued)
Proprietary Funds. The District’s proprietary funds provide the same type of information found in the government-wide financial statements, but in more detail. Unrestricted net assets of the District’s enterprise fund (day care facility) at the end of the year were negative in the amount of $70,419. As discussed earlier, this deficit position is the result of start up costs charged to the program, while operating fees will not be charged until the next fiscal year. The internal service fund used to account for the District’s self-funded insurance programs experienced a slight decrease in net assets from $2,700,547 to a balance of $2,315,382 at August 31, 2003.
General Fund Budgetary Highlights
Over the course of the year, District personnel recommended, and the Board of Trustees approved, several revisions to budgeted revenue and appropriations. Revisions to the revenue budget are necessary due to changes in estimates for local and state revenue, based on updated information concerning student attendance and tax collections. Revisions to appropriations are necessary due to staffing adjustments based on actual enrollment, changes in spending needs over the course of the year, and other unexpected occurrences. The District’s major budget amendments during the year are summarized as follows:
• The local revenue budget was decreased by $2.35 million due to an anticipated decline in the tax collection rate and a decrease in the estimated interest revenue because of falling interest rates.
• The state revenue budget was increased by approximately $5 million due primarily to an
increase in average daily attendance. The original budget was based on an ADA of 40,972. The final budget was based on an ADA of 41,369.
• The expenditure budget was decreased by a net of $1.8 million. This was due primarily to
decreased estimates for instructional payroll costs and reduced electrical costs realized as a result of the District’s participation in a local utility consortium.
After revenue budgets and appropriations were adjusted as described above, the District’s general fund balance of $62,076,216 differs from the final budgetary fund balance of $54,551,795 reported in the budgetary comparison schedule on page 55. This is primarily due to the following factors:
• Payroll costs were $2.1 million, or approximately 1%, less than the final budget. Factors such as unfilled positions and high turnover, resulting in hiring of less experienced teachers (at a lower than projected salary), caused this variance.
• Utilities were $1.75 million less than the final budget. In January 2002 the District entered
into a new contract through Region IV for energy services. The billing pattern was fairly erratic during the first few months as the new system was put into place. Although cost savings were realized in the second half of the 2001-2002 school year, savings surpassed estimates in 2002-2003.
Capital Asset and Debt Administration
Capital Assets The District’s investment in capital assets for its governmental and business-type activities as of August 31, 2003, amounts to $354,064,309 (net of accumulated depreciation of $196,389,274). This investment in capital assets includes facilities and equipment for instruction, transportation, athletics, administration, and maintenance. The total increase in the District’s investment in capital assets for the current year was 8 percent.
20
Management’s Discussion and Analysis (continued)
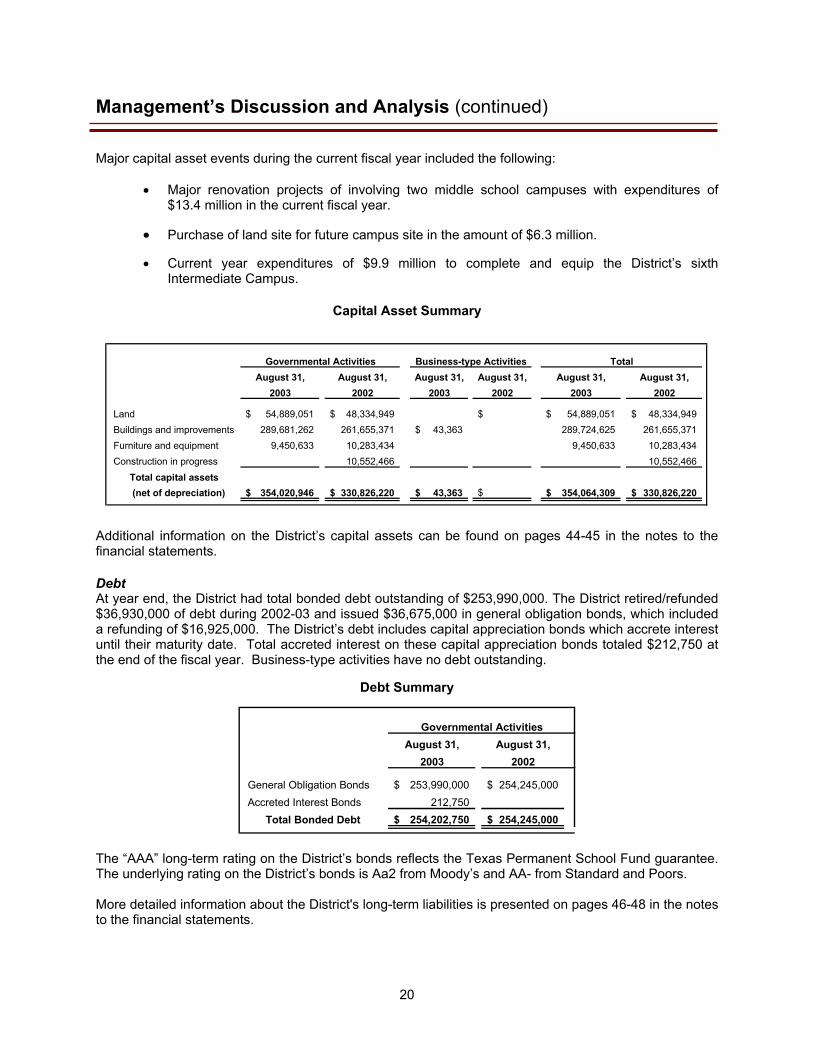
Major capital asset events during the current fiscal year included the following:
• Major renovation projects of involving two middle school campuses with expenditures of $13.4 million in the current fiscal year.
• Purchase of land site for future campus site in the amount of $6.3 million.
• Current year expenditures of $9.9 million to complete and equip the District’s sixth
Intermediate Campus.
Capital Asset Summary
Governmental Activities Business-type Activities TotalAugust 31, August 31, August 31, August 31, August 31, August 31,
2003 2002 2003 2002 2003 2002
Land 54,889,051$ 48,334,949$ $ 54,889,051$ 48,334,949$ Buildings and improvements 289,681,262 261,655,371 43,363$ 289,724,625 261,655,371 Furniture and equipment 9,450,633 10,283,434 9,450,633 10,283,434 Construction in progress 10,552,466 10,552,466
Total capital assets (net of depreciation) 354,020,946$ 330,826,220$ 43,363$ $ 354,064,309$ 330,826,220$
Additional information on the District’s capital assets can be found on pages 44-45 in the notes to the financial statements. Debt At year end, the District had total bonded debt outstanding of $253,990,000. The District retired/refunded $36,930,000 of debt during 2002-03 and issued $36,675,000 in general obligation bonds, which included a refunding of $16,925,000. The District’s debt includes capital appreciation bonds which accrete interest until their maturity date. Total accreted interest on these capital appreciation bonds totaled $212,750 at the end of the fiscal year. Business-type activities have no debt outstanding.
Debt Summary
Governmental ActivitiesAugust 31, August 31,
2003 2002
General Obligation Bonds 253,990,000$ 254,245,000$ Accreted Interest Bonds 212,750
Total Bonded Debt 254,202,750$ 254,245,000$
The “AAA” long-term rating on the District’s bonds reflects the Texas Permanent School Fund guarantee. The underlying rating on the District’s bonds is Aa2 from Moody’s and AA- from Standard and Poors. More detailed information about the District's long-term liabilities is presented on pages 46-48 in the notes to the financial statements.
21
Management’s Discussion and Analysis (continued)
Economic Factors and Next Year's Budgets and Rates
Economic factors can have a significant impact on the District’s finances. The unemployment rate for this region is 6.1% while the state and national rates are 6.0% and 6.5% percent, respectively. Increases in the unemployment rate could result in a reduction in the District’s tax collections. Inflationary trends in the region tend to be somewhat lower than the national consumer price index (CPI). This positive factor helps the District keep costs low, in general. However, two specific trends have required significant increases in school district expenditures. First, property insurance rates in the State have increased dramatically. Second, the teacher shortage in this area has mandated significant salary and benefit increases as Districts attempt to attract and retain the most qualified personnel. The District's elected and appointed officials considered many factors when setting the fiscal year 2004 general fund budget and tax rate. The adopted budget is based on the following significant assumptions:
• The District’s enrollment was projected to increase to 45,513, or approximately 1,443 students, at the time the budget was adopted. This estimate still appears reasonable based on a current enrollment (as of October 31, 2003) of 45,472.
• General fund expenditures are budgeted to increase by $12.6 million over the final 2002-03
budget. Major factors causing this increase include:
o Salary increase of 4% on the midpoint for all personnel, costing approximately $8.5 million.
o The addition of other new personnel units, due primarily to the opening of Budewig Intermediate, are estimated to cost approximately $4.1 million.
If these estimates are realized, the District's budgetary General Fund balance is expected to remain fairly constant at the close of 2004.
Requests for Information This financial report is designed to provide our citizens, taxpayers, customers, investors, and creditors with a general overview of the District's finances and to show the District's accountability for the money it receives. Questions concerning any of the information provided in this report, or requests for additional information, should be addressed to the Office of the Assistant Superintendent for Finance, Alief I.S.D., 12302 High Star, Houston, Texas, 77072.
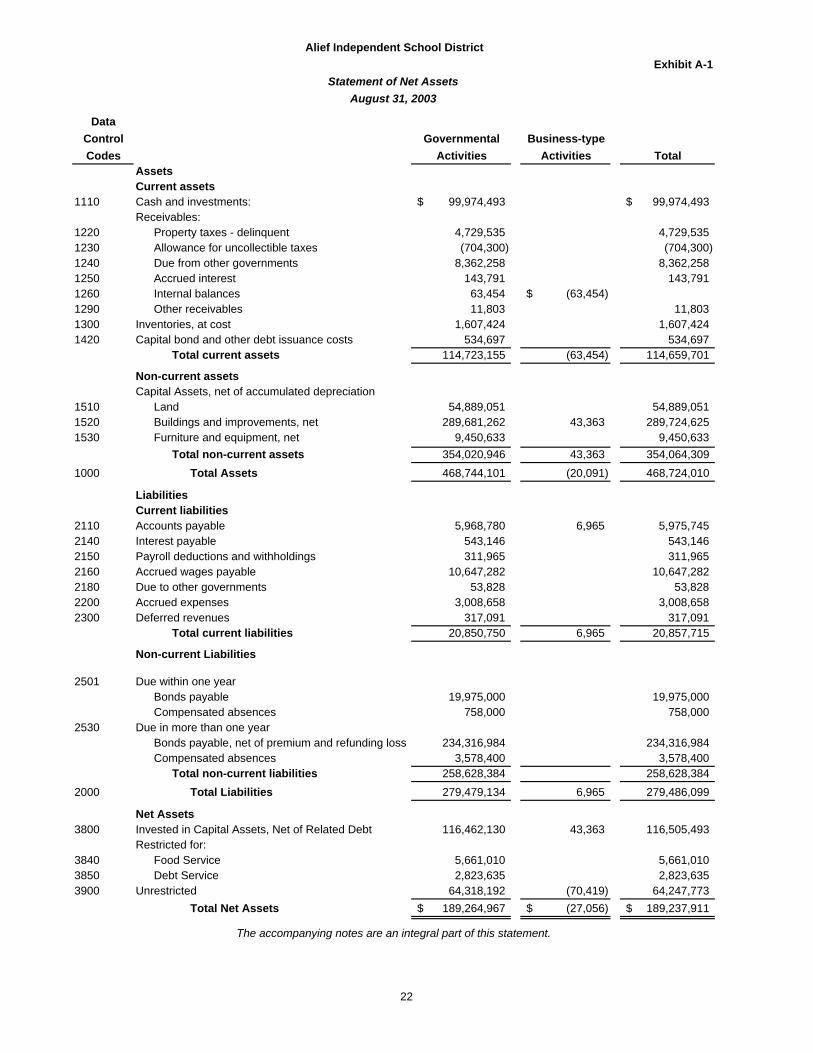
Exhibit A-1
DataControl Governmental Business-typeCodes Activities Activities Total
Current assets1110 Cash and investments: 99,974,493$ 99,974,493$
Receivables:1220 Property taxes - delinquent 4,729,535 4,729,535 1230 Allowance for uncollectible taxes (704,300) (704,300)1240 Due from other governments 8,362,258 8,362,258 1250 Accrued interest 143,791 143,791 1260 Internal balances 63,454 (63,454)$ 1290 Other receivables 11,803 11,803 1300 Inventories, at cost 1,607,424 1,607,424 1420 Capital bond and other debt issuance costs 534,697 534,697
Total current assets 114,723,155 (63,454) 114,659,701
Non-current assetsCapital Assets, net of accumulated depreciation
1510 Land 54,889,051 54,889,051 1520 Buildings and improvements, net 289,681,262 43,363 289,724,625 1530 Furniture and equipment, net 9,450,633 9,450,633
Total non-current assets 354,020,946 43,363 354,064,309 1000 Total Assets 468,744,101 (20,091) 468,724,010
Current liabilities2110 Accounts payable 5,968,780 6,965 5,975,745 2140 Interest payable 543,146 543,146 2150 Payroll deductions and withholdings 311,965 311,965 2160 Accrued wages payable 10,647,282 10,647,282 2180 Due to other governments 53,828 53,828 2200 Accrued expenses 3,008,658 3,008,658 2300 Deferred revenues 317,091 317,091
Total current liabilities 20,850,750 6,965 20,857,715
Non-current Liabilities
2501 Due within one yearBonds payable 19,975,000 19,975,000 Compensated absences 758,000 758,000
2530 Due in more than one yearBonds payable, net of premium and refunding loss 234,316,984 234,316,984 Compensated absences 3,578,400 3,578,400
Total non-current liabilities 258,628,384 258,628,384 2000 Total Liabilities 279,479,134 6,965 279,486,099
Net Assets3800 Invested in Capital Assets, Net of Related Debt 116,462,130 43,363 116,505,493
Restricted for:3840 Food Service 5,661,010 5,661,0103850 Debt Service 2,823,635 2,823,635 3900 Unrestricted 64,318,192 (70,419) 64,247,773
Total Net Assets 189,264,967$ (27,056)$ 189,237,911$
The accompanying notes are an integral part of this statement.
Assets
Liabilities
Alief Independent School District
Statement of Net AssetsAugust 31, 2003
22
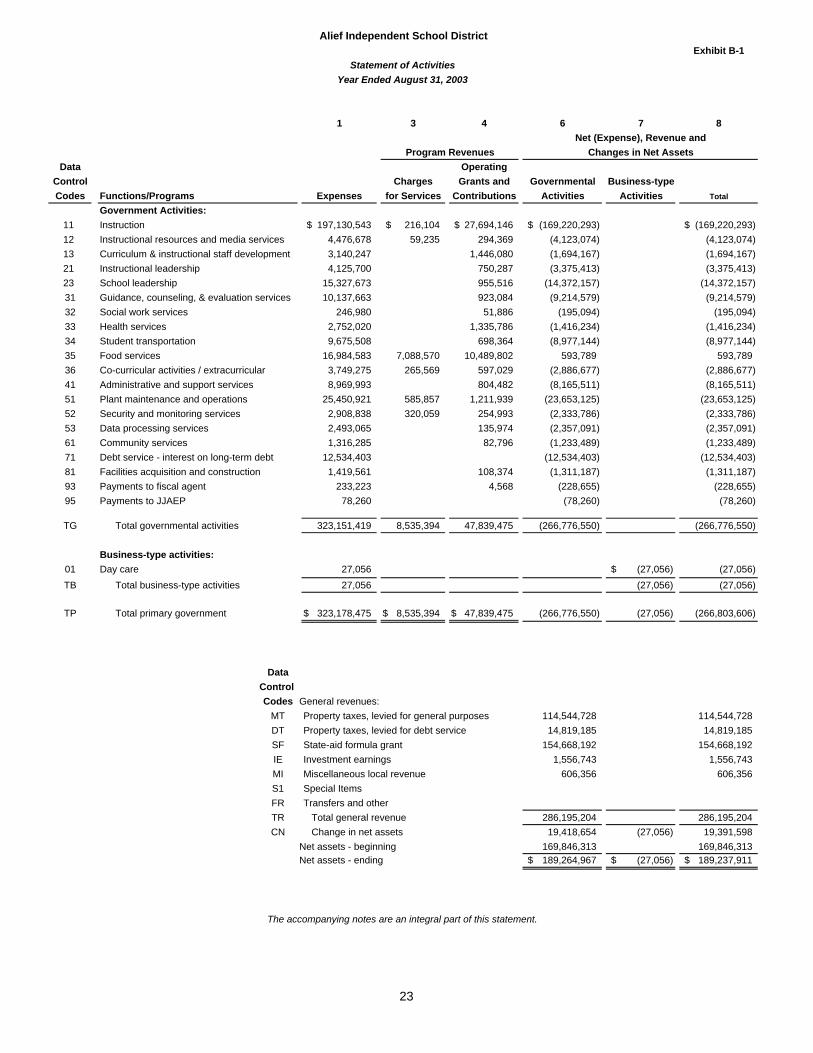
Exhibit B-1
1 3 4 6 7 8Net (Expense), Revenue and
Changes in Net AssetsData Operating
Control Charges Grants and Governmental Business-typeCodes Functions/Programs Expenses for Services Contributions Activities Activities Total
11 Instruction 197,130,543$ 216,104$ 27,694,146$ (169,220,293)$ (169,220,293)$ 12 Instructional resources and media services 4,476,678 59,235 294,369 (4,123,074) (4,123,074) 13 Curriculum & instructional staff development 3,140,247 1,446,080 (1,694,167) (1,694,167) 21 Instructional leadership 4,125,700 750,287 (3,375,413) (3,375,413) 23 School leadership 15,327,673 955,516 (14,372,157) (14,372,157) 31 Guidance, counseling, & evaluation services 10,137,663 923,084 (9,214,579) (9,214,579) 32 Social work services 246,980 51,886 (195,094) (195,094) 33 Health services 2,752,020 1,335,786 (1,416,234) (1,416,234) 34 Student transportation 9,675,508 698,364 (8,977,144) (8,977,144) 35 Food services 16,984,583 7,088,570 10,489,802 593,789 593,789 36 Co-curricular activities / extracurricular 3,749,275 265,569 597,029 (2,886,677) (2,886,677) 41 Administrative and support services 8,969,993 804,482 (8,165,511) (8,165,511) 51 Plant maintenance and operations 25,450,921 585,857 1,211,939 (23,653,125) (23,653,125) 52 Security and monitoring services 2,908,838 320,059 254,993 (2,333,786) (2,333,786) 53 Data processing services 2,493,065 135,974 (2,357,091) (2,357,091) 61 Community services 1,316,285 82,796 (1,233,489) (1,233,489) 71 Debt service - interest on long-term debt 12,534,403 (12,534,403) (12,534,403) 81 Facilities acquisition and construction 1,419,561 108,374 (1,311,187) (1,311,187) 93 Payments to fiscal agent 233,223 4,568 (228,655) (228,655) 95 Payments to JJAEP 78,260 (78,260) (78,260)
TG Total governmental activities 323,151,419 8,535,394 47,839,475 (266,776,550) (266,776,550)
Business-type activities:01 Day care 27,056 (27,056)$ (27,056)TB Total business-type activities 27,056 (27,056) (27,056)
TP Total primary government 323,178,475$ 8,535,394$ 47,839,475$ (266,776,550) (27,056) (266,803,606)
DataControl Codes General revenues:
MT Property taxes, levied for general purposes 114,544,728 114,544,728 DT Property taxes, levied for debt service 14,819,185 14,819,185SF State-aid formula grant 154,668,192 154,668,192IE Investment earnings 1,556,743 1,556,743MI Miscellaneous local revenue 606,356 606,356S1 Special ItemsFR Transfers and otherTR Total general revenue 286,195,204 286,195,204 CN Change in net assets 19,418,654 (27,056) 19,391,598
Net assets - beginning 169,846,313 169,846,313 Net assets - ending 189,264,967$ (27,056)$ 189,237,911$
Alief Independent School District
Statement of ActivitiesYear Ended August 31, 2003
The accompanying notes are an integral part of this statement.
Program Revenues
Government Activities:
23
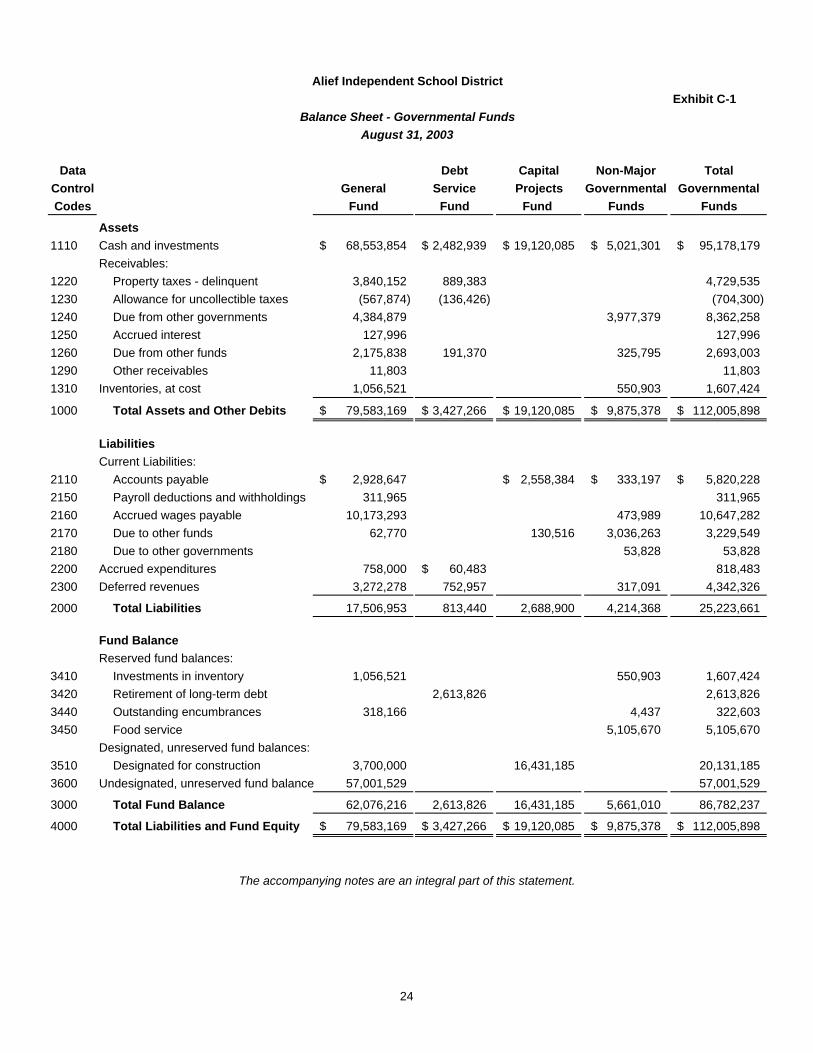
Exhibit C-1
Data Debt Capital Non-Major TotalControl General Service Projects Governmental GovernmentalCodes Fund Fund Fund Funds Funds
1110 Cash and investments 68,553,854$ 2,482,939$ 19,120,085$ 5,021,301$ 95,178,179$ Receivables:
1220 Property taxes - delinquent 3,840,152 889,383 4,729,5351230 Allowance for uncollectible taxes (567,874) (136,426) (704,300)1240 Due from other governments 4,384,879 3,977,379 8,362,2581250 Accrued interest 127,996 127,9961260 Due from other funds 2,175,838 191,370 325,795 2,693,0031290 Other receivables 11,803 11,8031310 Inventories, at cost 1,056,521 550,903 1,607,424
1000 Total Assets and Other Debits 79,583,169$ 3,427,266$ 19,120,085$ 9,875,378$ 112,005,898$
Current Liabilities:2110 Accounts payable 2,928,647$ 2,558,384$ 333,197$ 5,820,228$ 2150 Payroll deductions and withholdings 311,965 311,965 2160 Accrued wages payable 10,173,293 473,989 10,647,282 2170 Due to other funds 62,770 130,516 3,036,263 3,229,549 2180 Due to other governments 53,828 53,828 2200 Accrued expenditures 758,000 60,483$ 818,483 2300 Deferred revenues 3,272,278 752,957 317,091 4,342,326
2000 Total Liabilities 17,506,953 813,440 2,688,900 4,214,368 25,223,661
Fund BalanceReserved fund balances:
3410 Investments in inventory 1,056,521 550,903 1,607,424 3420 Retirement of long-term debt 2,613,826 2,613,826 3440 Outstanding encumbrances 318,166 4,437 322,603 3450 Food service 5,105,670 5,105,670
Designated, unreserved fund balances:3510 Designated for construction 3,700,000 16,431,185 20,131,185 3600 Undesignated, unreserved fund balance 57,001,529 57,001,529
3000 Total Fund Balance 62,076,216 2,613,826 16,431,185 5,661,010 86,782,237
4000 Total Liabilities and Fund Equity 79,583,169$ 3,427,266$ 19,120,085$ 9,875,378$ 112,005,898$
The accompanying notes are an integral part of this statement.
Assets
Liabilities
Alief Independent School District
Balance Sheet - Governmental FundsAugust 31, 2003
24
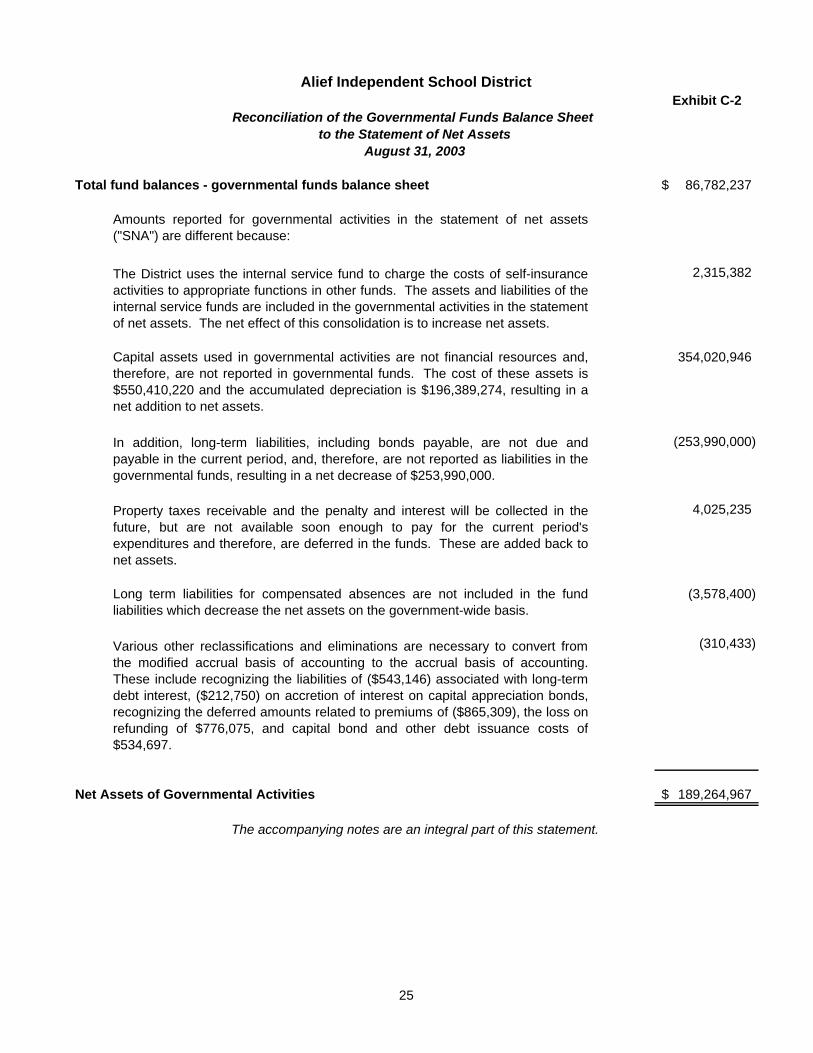
Exhibit C-2
Total fund balances - governmental funds balance sheet 86,782,237$
2,315,382
354,020,946
(253,990,000)
4,025,235
(3,578,400)
(310,433)
Net Assets of Governmental Activities 189,264,967$
The accompanying notes are an integral part of this statement.
Capital assets used in governmental activities are not financial resources and,therefore, are not reported in governmental funds. The cost of these assets is$550,410,220 and the accumulated depreciation is $196,389,274, resulting in anet addition to net assets.
In addition, long-term liabilities, including bonds payable, are not due andpayable in the current period, and, therefore, are not reported as liabilities in thegovernmental funds, resulting in a net decrease of $253,990,000.
Property taxes receivable and the penalty and interest will be collected in thefuture, but are not available soon enough to pay for the current period'sexpenditures and therefore, are deferred in the funds. These are added back tonet assets.
Long term liabilities for compensated absences are not included in the fundliabilities which decrease the net assets on the government-wide basis.
The District uses the internal service fund to charge the costs of self-insuranceactivities to appropriate functions in other funds. The assets and liabilities of theinternal service funds are included in the governmental activities in the statementof net assets. The net effect of this consolidation is to increase net assets.
Various other reclassifications and eliminations are necessary to convert fromthe modified accrual basis of accounting to the accrual basis of accounting.These include recognizing the liabilities of ($543,146) associated with long-termdebt interest, ($212,750) on accretion of interest on capital appreciation bonds,recognizing the deferred amounts related to premiums of ($865,309), the loss onrefunding of $776,075, and capital bond and other debt issuance costs of$534,697.
Alief Independent School District
Reconciliation of the Governmental Funds Balance Sheet to the Statement of Net Assets
August 31, 2003
Amounts reported for governmental activities in the statement of net assets("SNA") are different because:
25

This page intentionally blank.
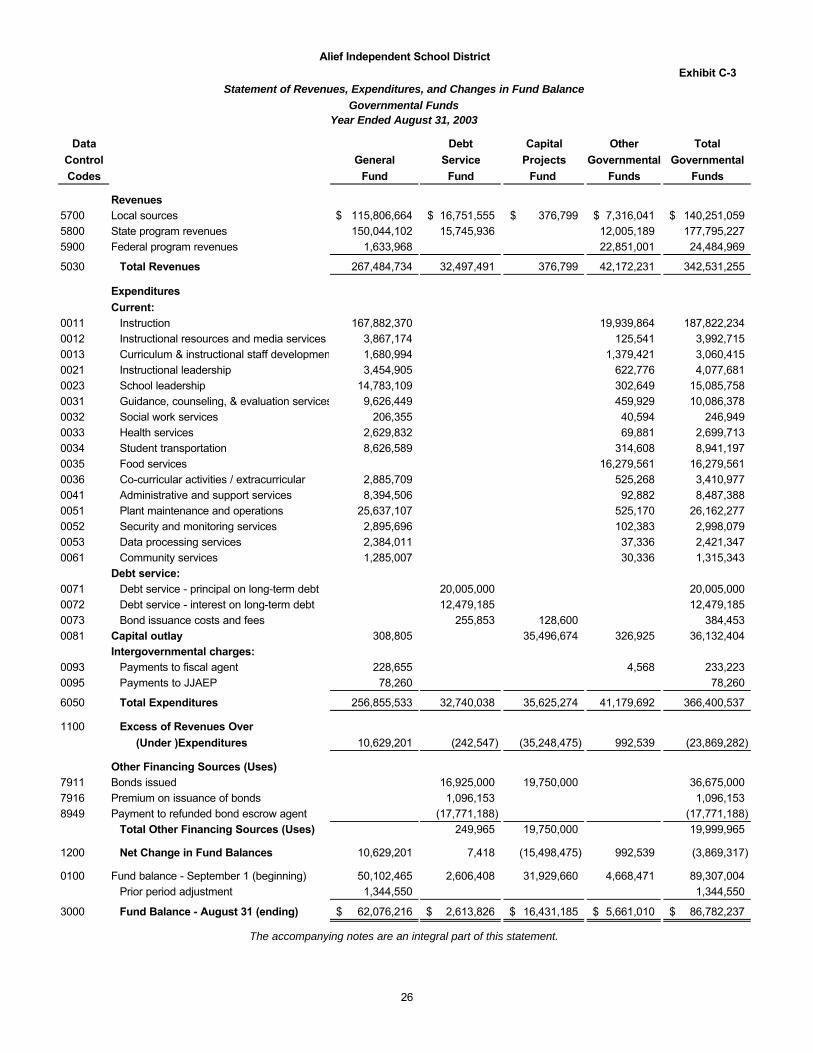
Exhibit C-3
Data Debt Capital Other TotalControl General Service Projects Governmental GovernmentalCodes Fund Fund Fund Funds Funds
Revenues5700 Local sources 115,806,664$ 16,751,555$ 376,799$ 7,316,041$ 140,251,059$ 5800 State program revenues 150,044,102 15,745,936 12,005,189 177,795,2275900 Federal program revenues 1,633,968 22,851,001 24,484,969
5030 Total Revenues 267,484,734 32,497,491 376,799 42,172,231 342,531,255
ExpendituresCurrent:
0011 Instruction 167,882,370 19,939,864 187,822,2340012 Instructional resources and media services 3,867,174 125,541 3,992,7150013 Curriculum & instructional staff development 1,680,994 1,379,421 3,060,4150021 Instructional leadership 3,454,905 622,776 4,077,6810023 School leadership 14,783,109 302,649 15,085,7580031 Guidance, counseling, & evaluation services 9,626,449 459,929 10,086,3780032 Social work services 206,355 40,594 246,9490033 Health services 2,629,832 69,881 2,699,7130034 Student transportation 8,626,589 314,608 8,941,1970035 Food services 16,279,561 16,279,5610036 Co-curricular activities / extracurricular 2,885,709 525,268 3,410,9770041 Administrative and support services 8,394,506 92,882 8,487,3880051 Plant maintenance and operations 25,637,107 525,170 26,162,2770052 Security and monitoring services 2,895,696 102,383 2,998,0790053 Data processing services 2,384,011 37,336 2,421,3470061 Community services 1,285,007 30,336 1,315,343
Debt service:0071 Debt service - principal on long-term debt 20,005,000 20,005,0000072 Debt service - interest on long-term debt 12,479,185 12,479,1850073 Bond issuance costs and fees 255,853 128,600 384,4530081 Capital outlay 308,805 35,496,674 326,925 36,132,404
Intergovernmental charges:0093 Payments to fiscal agent 228,655 4,568 233,2230095 Payments to JJAEP 78,260 78,260
6050 Total Expenditures 256,855,533 32,740,038 35,625,274 41,179,692 366,400,537
1100 Excess of Revenues Over(Under )Expenditures 10,629,201 (242,547) (35,248,475) 992,539 (23,869,282)
Other Financing Sources (Uses)7911 Bonds issued 16,925,000 19,750,000 36,675,0007916 Premium on issuance of bonds 1,096,153 1,096,1538949 Payment to refunded bond escrow agent (17,771,188) (17,771,188)
Total Other Financing Sources (Uses) 249,965 19,750,000 19,999,965
1200 Net Change in Fund Balances 10,629,201 7,418 (15,498,475) 992,539 (3,869,317)
0100 Fund balance - September 1 (beginning) 50,102,465 2,606,408 31,929,660 4,668,471 89,307,004Prior period adjustment 1,344,550 1,344,550
3000 Fund Balance - August 31 (ending) 62,076,216$ 2,613,826$ 16,431,185$ 5,661,010$ 86,782,237$
The accompanying notes are an integral part of this statement.
Alief Independent School District
Statement of Revenues, Expenditures, and Changes in Fund BalanceGovernmental Funds
Year Ended August 31, 2003
26
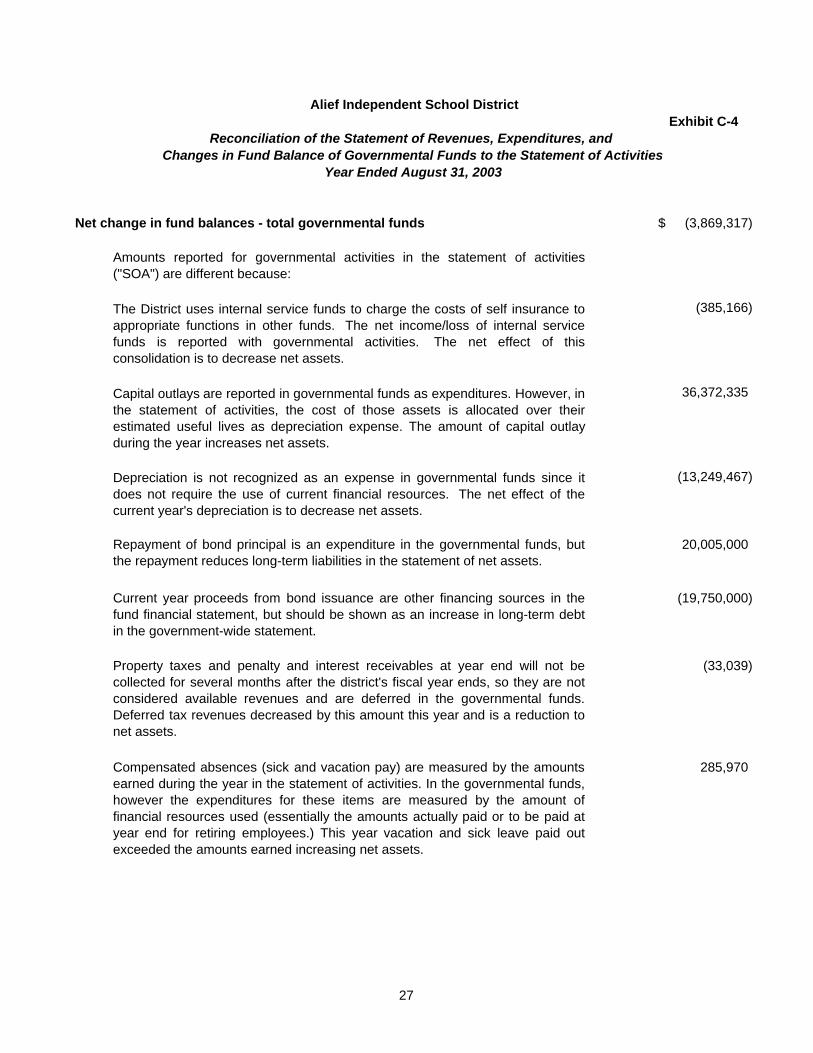
Exhibit C-4
Net change in fund balances - total governmental funds (3,869,317)$
(385,166)
36,372,335
(13,249,467)
20,005,000
(19,750,000)
(33,039)
285,970
Alief Independent School District
Reconciliation of the Statement of Revenues, Expenditures, and Changes in Fund Balance of Governmental Funds to the Statement of Activities
Year Ended August 31, 2003
Property taxes and penalty and interest receivables at year end will not becollected for several months after the district's fiscal year ends, so they are notconsidered available revenues and are deferred in the governmental funds.Deferred tax revenues decreased by this amount this year and is a reduction tonet assets.
Compensated absences (sick and vacation pay) are measured by the amountsearned during the year in the statement of activities. In the governmental funds,however the expenditures for these items are measured by the amount offinancial resources used (essentially the amounts actually paid or to be paid atyear end for retiring employees.) This year vacation and sick leave paid outexceeded the amounts earned increasing net assets.
Amounts reported for governmental activities in the statement of activities("SOA") are different because:
The District uses internal service funds to charge the costs of self insurance toappropriate functions in other funds. The net income/loss of internal servicefunds is reported with governmental activities. The net effect of thisconsolidation is to decrease net assets.
Capital outlays are reported in governmental funds as expenditures. However, inthe statement of activities, the cost of those assets is allocated over theirestimated useful lives as depreciation expense. The amount of capital outlayduring the year increases net assets.
Depreciation is not recognized as an expense in governmental funds since itdoes not require the use of current financial resources. The net effect of thecurrent year's depreciation is to decrease net assets.
Repayment of bond principal is an expenditure in the governmental funds, butthe repayment reduces long-term liabilities in the statement of net assets.
Current year proceeds from bond issuance are other financing sources in thefund financial statement, but should be shown as an increase in long-term debtin the government-wide statement.
27

Net change in fund balances - total governmental funds (continued)
13,844
270,426
(205,000)
(36,932)
Change in Net Assets of Governmental Activities 19,418,654$
Bond issuance costs, deferred charges on bond refunding, and other debtcharges which are treated as expenditures in the fund basis are set up as assets and amortized in the statement of net assets. The net change for bond issuancecosts, deferred charges, and amortization is an increase in net assets.
Various other reclassifications and eliminations are necessary to convert fromthe modified accrual basis of accounting to the accrual basis of accounting.Amounts recognized in the governmental fund basis and the statement of netassts differ due to sales and retirement of assets.
The accompanying notes are an integral part of this statement.
An accrual for interest expense is not recognized in the governmental fund basisbut is in the statement of activities. Interest accrual includes interest on longterm debt and accreted interest on capital appreciation bonds. The interestaccrual was lower this year than last year thereby increasing net assets.
Proceeds on capital appreciation bonds are included in other sources in the fundfinancials, but are set up as a long term liability in statement of net assets.
28
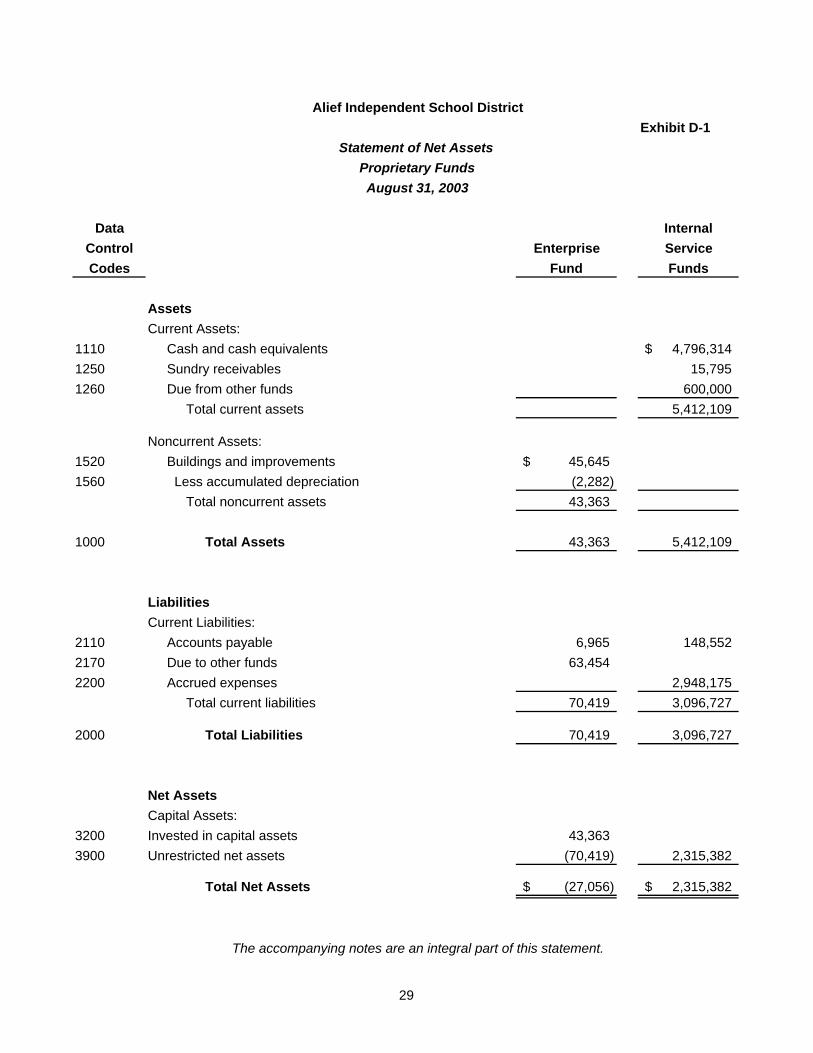
Exhibit D-1
Data InternalControl Enterprise ServiceCodes Fund Funds
AssetsCurrent Assets:
1110 Cash and cash equivalents 4,796,314$ 1250 Sundry receivables 15,795 1260 Due from other funds 600,000
Total current assets 5,412,109
Noncurrent Assets:1520 Buildings and improvements 45,645$ 1560 Less accumulated depreciation (2,282)
Total noncurrent assets 43,363
1000 Total Assets 43,363 5,412,109
LiabilitiesCurrent Liabilities:
2110 Accounts payable 6,965 148,552 2170 Due to other funds 63,4542200 Accrued expenses 2,948,175
Total current liabilities 70,419 3,096,727
2000 Total Liabilities 70,419 3,096,727
Net AssetsCapital Assets:
3200 Invested in capital assets 43,363 3900 Unrestricted net assets (70,419) 2,315,382
Total Net Assets (27,056)$ 2,315,382$
The accompanying notes are an integral part of this statement.
Alief Independent School District
Statement of Net Assets
August 31, 2003Proprietary Funds
29
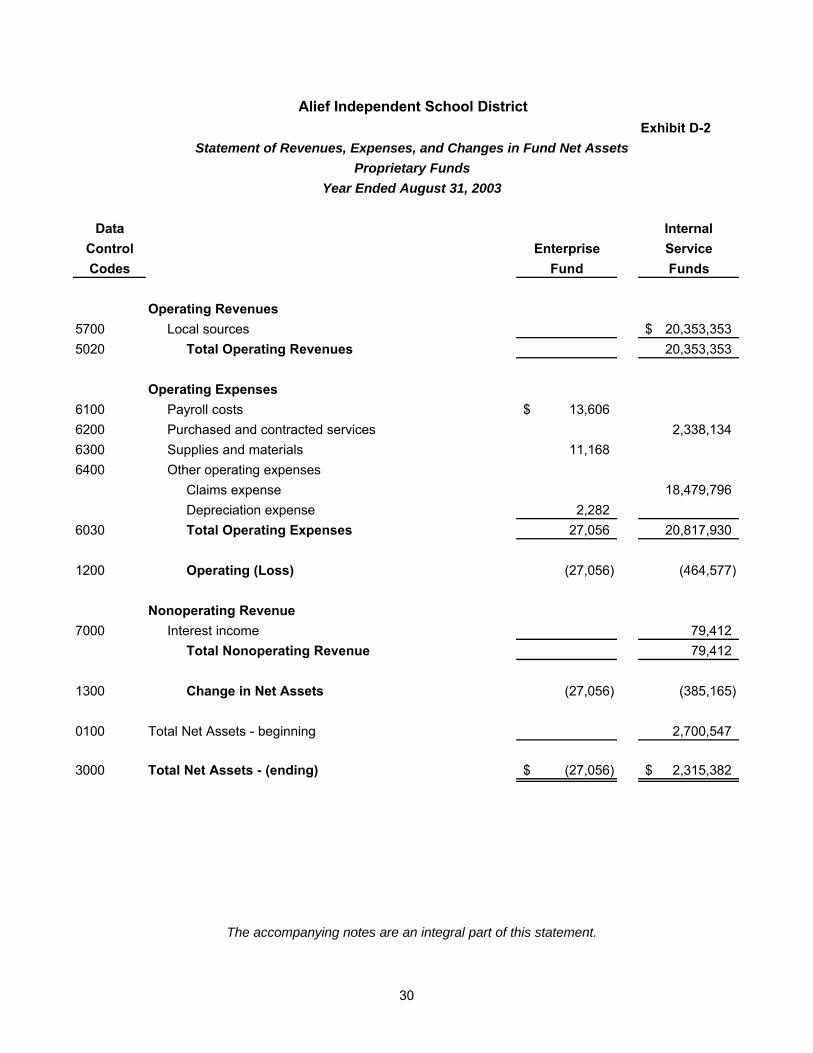
Exhibit D-2
Data InternalControl Enterprise ServiceCodes Fund Funds
Operating Revenues5700 Local sources 20,353,353$ 5020 Total Operating Revenues 20,353,353
Operating Expenses6100 Payroll costs 13,606$ 6200 Purchased and contracted services 2,338,1346300 Supplies and materials 11,1686400 Other operating expenses
Claims expense 18,479,796Depreciation expense 2,282
6030 Total Operating Expenses 27,056 20,817,930
1200 Operating (Loss) (27,056) (464,577)
Nonoperating Revenue7000 Interest income 79,412
Total Nonoperating Revenue 79,412
1300 Change in Net Assets (27,056) (385,165)
0100 Total Net Assets - beginning 2,700,547
3000 Total Net Assets - (ending) (27,056)$ 2,315,382$
The accompanying notes are an integral part of this statement.
Alief Independent School District
Statement of Revenues, Expenses, and Changes in Fund Net AssetsProprietary Funds
Year Ended August 31, 2003
30
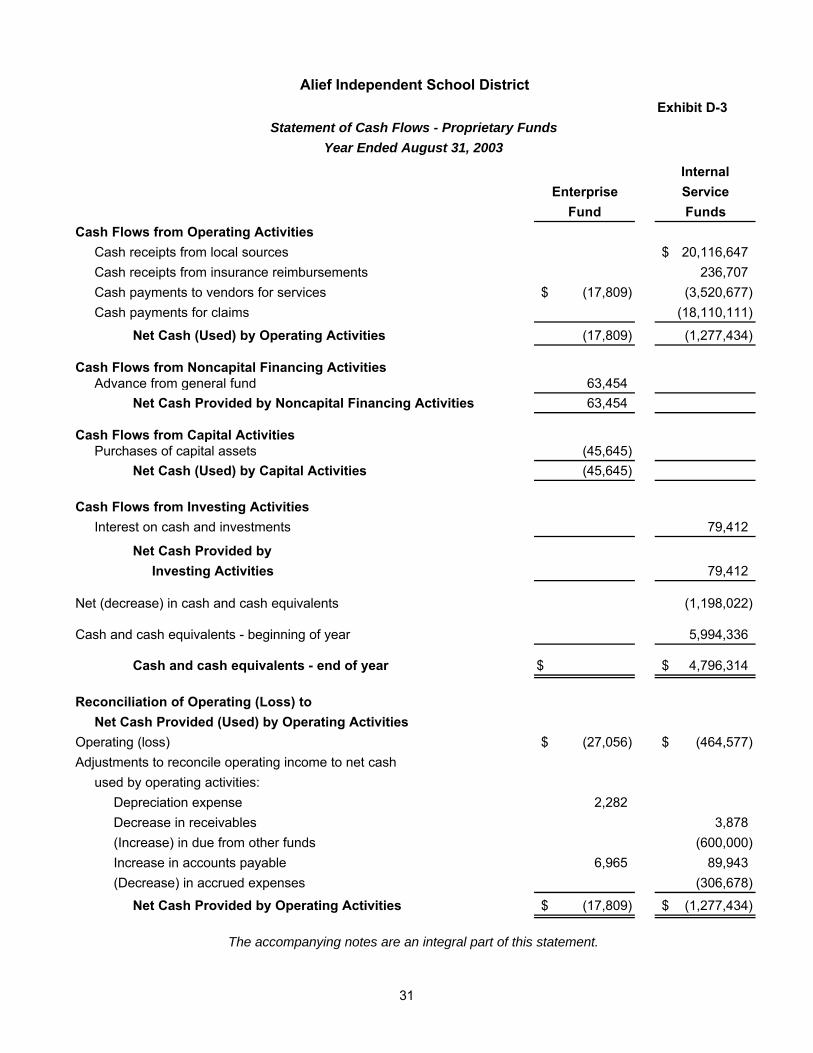
Exhibit D-3
InternalEnterprise Service
Fund FundsCash Flows from Operating Activities
Cash receipts from local sources 20,116,647$ Cash receipts from insurance reimbursements 236,707 Cash payments to vendors for services (17,809)$ (3,520,677)Cash payments for claims (18,110,111)
Net Cash (Used) by Operating Activities (17,809) (1,277,434)
Cash Flows from Noncapital Financing ActivitiesAdvance from general fund 63,454
Net Cash Provided by Noncapital Financing Activities 63,454
Cash Flows from Capital ActivitiesPurchases of capital assets (45,645)
Net Cash (Used) by Capital Activities (45,645)
Cash Flows from Investing ActivitiesInterest on cash and investments 79,412
Net Cash Provided byInvesting Activities 79,412
Net (decrease) in cash and cash equivalents (1,198,022)
Cash and cash equivalents - beginning of year 5,994,336
Cash and cash equivalents - end of year $ 4,796,314$
Reconciliation of Operating (Loss) to Net Cash Provided (Used) by Operating Activities
Operating (loss) (27,056)$ (464,577)$ Adjustments to reconcile operating income to net cash
used by operating activities:Depreciation expense 2,282Decrease in receivables 3,878(Increase) in due from other funds (600,000)Increase in accounts payable 6,965 89,943(Decrease) in accrued expenses (306,678)
Net Cash Provided by Operating Activities (17,809)$ (1,277,434)$
The accompanying notes are an integral part of this statement.
Alief Independent School District
Statement of Cash Flows - Proprietary FundsYear Ended August 31, 2003
31
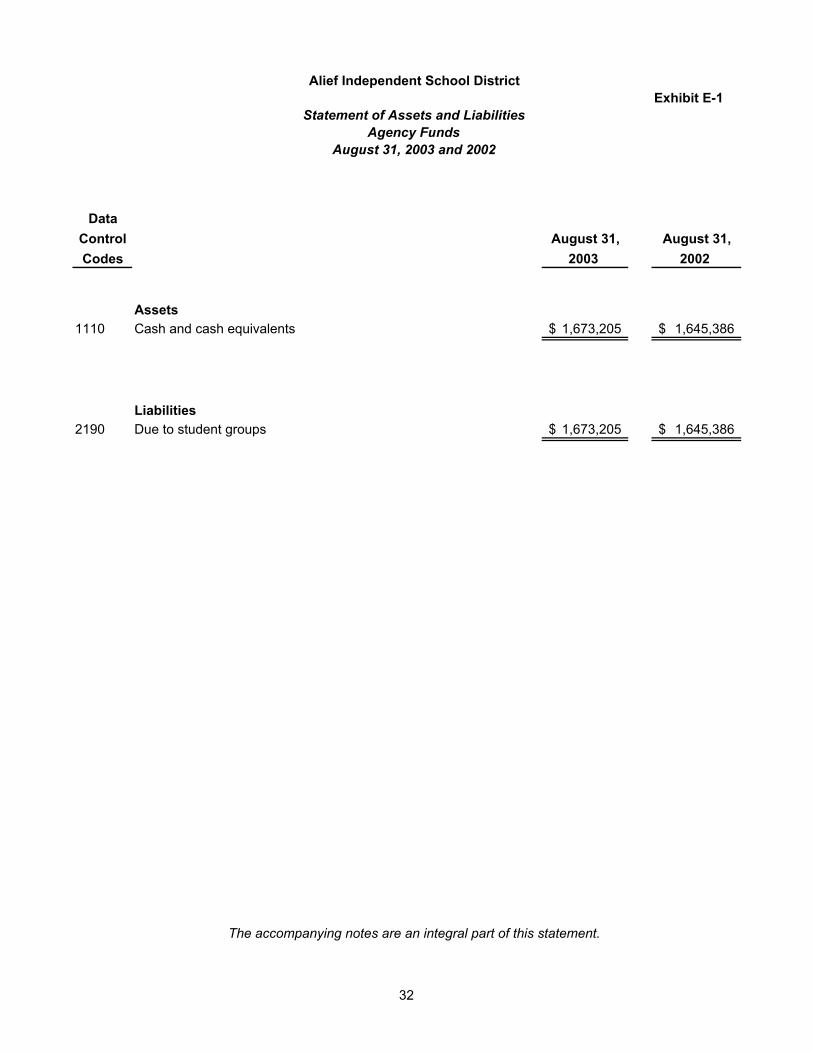
Exhibit E-1
DataControl August 31, August 31,Codes 2003 2002
1110 Cash and cash equivalents 1,673,205$ 1,645,386$
2190 Due to student groups 1,673,205$ 1,645,386$
Assets
Liabilities
The accompanying notes are an integral part of this statement.
Alief Independent School District
Statement of Assets and LiabilitiesAgency Funds
August 31, 2003 and 2002
32
33
Alief Independent School District Notes to the Financial Statements Note 1 - Summary of Significant Accounting Policies
The Alief Independent School District (the "District") is an independent public educational agency operating under applicable laws and regulations of the State of Texas. The District is autonomously governed by a seven member Board of Trustees elected to staggered three-year terms by the District's residents.
The accounting policies of the District substantially comply with the rules prescribed in the Texas Education Agency's Financial Accountability System Resources Guide (“the Resource Guide”). The accounting policies included in the Resource Guide conform to generally accepted accounting principles applicable to governmental units. The following is a summary of the most significant policies:
In 2002 the District implemented GASB Statement No. 34, Basic Financial Statements - and Management’s Discussion and Analysis – for State and Local Governments (GASB Statement No. 34), GASB Statement No. 37, Basic Financial Statements – and Management’s Discussion and Analysis – for State and Local Governments: Omnibus, which provides additional guidance for the implementation of GASB Statement No. 34, and GASB Statement No. 38, Certain Financial Statement Note Disclosures, which changes note disclosure requirements for governmental entities. GASB Statement No. 34 established a new financial reporting model for state and local governments that included the addition of management’s discussion and analysis, government-wide financial statements, required supplementary information, and the elimination of the effects of internal service activities and the use of account groups to the already required fund financial statements and notes. The GASB determined that fund accounting has and will continue to be, essential in helping governments to achieve fiscal accountability and should, therefore, be retained. The GASB also determined that government-wide financial statements are needed to allow users of financial reports to assess a government’s operational accountability. The new GASB model integrates fund-based financial reporting and government-wide financial reporting as complementary components of a single comprehensive financial reporting model.
A. Reporting Entity
The District is an independent political subdivision of the State of Texas governed by an elected board of trustees and is considered a primary government. As required by generally accepted accounting principles, these financial statements have been prepared based on considerations regarding the potential for inclusion of other entities, organizations, or functions as part of the District's financial reporting entity. Based on these considerations, no other entities have been included in the District's reporting entity. Additionally, as the District is considered a primary government for financial reporting purposes, its activities are not considered a part of any other governmental or other type of reporting entity.
Considerations regarding the potential for inclusion of other entities, organizations, or functions in the District's financial reporting entity are based on criteria prescribed by generally accepted accounting principles. These same criteria are evaluated in considering whether the District is a part of any other government or other type of reporting entity. The overriding elements associated with prescribed criteria considered in determining that the District’s financial reporting entity status is that of a primary government are: that it has a separately elected governing body; it is legally separate; and it is fiscally independent of other state and local governments. Additional prescribed criteria under generally accepted accounting principles include considerations pertaining to organizations for which the primary government is financially accountable; and considerations pertaining to other organizations for which the nature and significance of their relationship with the primary government are such that exclusion would cause the reporting entity's financial statements to be misleading or incomplete.
34
Alief Independent School District Notes to the Financial Statements Note 1 - Summary of Significant Accounting Policies (continued) B. Government Wide and Fund Financial Statements
The government-wide financial statements (i.e., the statements of net assets and the statement of changes in net assets) report information on all of the nonfiduciary activities of the primary government. For the most part, the effect of interfund activity has been removed from these statements. Governmental activities, which are supported by taxes and intergovernmental revenues, are reported separately from business-type activities which rely on fees and charges for support. The statement of activities demonstrates the degree to which the direct expenses of a given function are offset by program revenues. Direct expenses are those that are clearly identifiable with a specific function. Program revenues include 1) charges to customers or applicants who purchase, use, or directly benefit from goods, services, or privileges provided by a given function and 2) grants and contributions that are restricted to meeting operational or capital requirements of a particular function. Taxes and other items not properly included among program revenues are reported instead as general revenues. Separate financial statements are provided for governmental funds, proprietary funds, and fiduciary funds, even though the latter are excluded in the government-wide financial statements. Major individual governmental funds are reported as separate columns in the fund financial statements.
C. Measurement Focus, Basis of Accounting, and Financial Statement Presentation
The accounting and financial reporting treatment applied to a fund is determined by its measurement focus. The government-wide financial statements are reported using the economic resources measurement focus and the accrual basis of accounting, as are the proprietary fund and fiduciary fund financial statements. Revenues are recorded when earned and expenses are recorded when a liability is incurred, regardless of the timing of related cash flows. Property taxes are recognized as revenues in the year for which they are levied. Grants and similar items are recognized as revenue as soon as all eligibility requirements imposed by the provider have been met. Governmental fund financial statements are reported using the current financial resources measurement focus and the modified accrual basis of accounting. With this measurement focus, only current assets and current liabilities generally are included on the balance sheet. Operating statements of these funds present increases (i.e., revenues and other financing sources) and decreases (i.e., expenditures and other financing uses) in net current assets. Revenues are recognized in the accounting period in which they become both measurable and available. Revenues are considered to be available when they are collectible within the current period or soon enough thereafter to pay liabilities of the current period. For this purpose, the government considers revenues to be available if they are collected within 60 days of the end of the current fiscal period. Revenues susceptible to accrual include state cost reimbursements and interest on temporary investments. Property tax levies collected after the fiscal year-end which would be available to finance current operations are immaterial and remain deferred. Under modified accrual accounting, expenditures are recognized in the accounting period in which the fund liability is incurred, if measurable, except for principal and interest on general long-term debt, which is recognized when due.
Revenues from grants accounted for in the Special Revenue Funds are recognized as soon as all eligibility requirements imposed by the provider have been met. Any excess of revenues or expenditures at fiscal year-end is recorded as deferred revenue or due from the granting agencies, respectively.
35
Alief Independent School District Notes to the Financial Statements Note 1 - Summary of Significant Accounting Policies (continued)
D. Fund Accounting The District reports the following major governmental funds.
General Fund
The General Fund is the government’s primary operating fund. It is used to account for all financial transactions not properly includable in other funds. The principal sources of revenues include local property taxes, state reimbursement for professional salaries and other operating expenditures, interest on fund investments, and indirect cost revenues from federal grants. Expenditures include all costs associated with the daily operations of the schools.
Debt Service Fund
The Debt Service Fund is used to account for the payment of interest and principal on all bonds of the District. Primary sources of revenue for debt service are local property taxes and the state existing debt and instructional facilities allotments.
Capital Projects Fund
The Capital Projects Fund includes funds that are used to account for the expenditures of resources accumulated from sales of bonds and related interest earnings for the acquisition and construction of school facilities and other capital asset acquisitions.
Additionally, the District reports the following fund types:
Governmental Funds: Special Revenue Funds
The Special Revenue Fund is used to account for various funds. Specifically, this type of fund is used to account for the District’s Food Service Program, including local, state, and federal revenue sources, for federally financed programs (grants) where unused balances are returned to the grantor at the close of specified projects periods and other revenue specific programs. The Food Service Fund is the only required budgeted fund. For all other funds in this fund type, project accounting is employed to maintain integrity for the various sources of the funds. Resources accounted for in these funds are awarded to the District for the purpose of accomplishing specific educational tasks as defined by the grantors in contracts or other agreements.
Proprietary Funds:
Private-sector standards of accounting and financial reporting issued on or before November 30, 1989, generally are followed in both the government-wide and proprietary fund financial statements to the extent that those standards do not conflict with or contradict guidance of the Governmental Accounting Standards Board. The government has elected not to follow subsequent private-sector guidance. Proprietary funds distinguish operating revenues and expenses from nonoperating items. Operating revenues and expenses generally result from providing services and producing and delivering goods in connection with a proprietary fund’s principal ongoing operations.
Enterprise Fund
The Enterprise Fund is used to account for revenues and expenditures of the District’s daycare facility. Revenues in this fund are primarily from fees paid by participants in the program. This is the first year of operation for this program.
Internal Service Fund
The District’s two internal service funds are used to account for the operations of the District's employee health insurance plan and workers’ compensation plan, which are supported by employer and/or employee contributions. Expenses include plan benefit payments to employees and charges incurred in administering the plan. The estimated amount due for claims incurred, but not reported at year-end, are included as fund liabilities.
36
Alief Independent School District Notes to the Financial Statements Note 1 - Summary of Significant Accounting Policies (continued) D. Fund Accounting (continued)
Additionally, the District reports the following fiduciary fund:
Agency Fund The Agency Fund is used to account for the cash receipts and disbursements of the school activity funds of the individual schools. These funds have no revenues, expenditures, or equity, and the District does not budget for them.
E. Cash and Cash Equivalents
The District considers the following items cash and cash equivalents for financial reporting purposes (including the statement of cash flows for the Proprietary Funds): cash on hand, demand deposits, money market mutual funds, balances in private-managed public funds investment pools, and short-term investments with original maturities of three months or less from the date of acquisition.
F. Investments
Investments consist primarily of U.S. Government Agency Securities which are stated at fair value based on quoted market prices. The net increase or decrease in the fair value of investments is netted with investment income in local sources of revenue. Investments are generally held to maturity.
G. Inventories
Inventory is stated at weighted average cost. The costs are recorded as expenditures as the individual inventory items are consumed. Inventory consists of general and food service supplies and commodities. Although commodities are received at no cost, they are recorded in the inventory and deferred revenue at market values as supplied by the Texas Department of Human Services. When consumed, commodities are recorded as both revenue and expenditures.
H. Interfund Activity
Interfund activity results from loans, services provided, reimbursements, or transfers between funds. Loans are reported as interfund receivables and payables as appropriate and are subject to elimination upon consolidation.
I. Capital Assets
Capital assets, which include land, buildings, furniture and equipment, and construction in progress are reported in the applicable governmental activities columns in the government-wide financial statements. Capital assets are defined by the government as assets with an initial, individual cost of more than $5,000 and an estimated useful life in excess of two years. Such assets are recorded at historical cost or estimated historical cost if purchased or constructed. Donated capital assets are recorded at estimated fair market value at the date of donation.
The costs of normal maintenance and repairs that do not add to the value of the assets or materially extend assets lives are not capitalized. Major outlays for capital assets and improvements are capitalized as projects are constructed.
37
Alief Independent School District Notes to the Financial Statements Note 1 - Summary of Significant Accounting Policies (continued) I. Capital Assets (continued)
Buildings and furniture and equipment of the District are depreciated using the straight line method over the following estimated useful lives:
Assets Years
Building & improvements 40Vehicles 7-10Computer Equipment 7Other Equipment 5-15
J. Long-Term Debt
In the government-wide financial statements and proprietary fund types in the fund financial statements, long-term debt and other long-term obligations are reported as liabilities in the applicable governmental activities or proprietary fund type statement of net assets. Bond premiums and discounts, as well as issuance costs, are deferred and amortized over the life of the bonds using the straight line method. Bonds payable are reported net of the applicable bond premium or discount. Bonds issuance costs are reported as deferred charges and amortized over the term of the related debt. In the fund financial statements, governmental fund types recognize the face amount of debt issued as other financing sources. Issuance costs, whether or not withheld from the actual debt proceeds received, are reported as debt service expenditures.
K. Compensated Absences
The District maintains a policy allowing employees meeting established requirements to be compensated for unused sick leave at retirement. Estimated amounts accrued by the District’s employees meeting the requirements for compensation for unused sick leave are recorded as either current or long-term liabilities, depending on the amount that was due to employees at year-end. Due means that the employee has applied for the leave but has not received payment at year-end and it will be paid from current financial resources. Annual vacation time is granted to eligible noncontractual employees on the first day of July of each year and all unused vacation time lapses after eighteen months. At year end, the portion due to employees who had terminated employment is considered a current liability and the remainder is recorded as long-term.
L. Fund Equity
In the fund financial statements, governmental funds report reservations of fund balance for amounts that are not available for appropriation or are legally restricted for a specific use or to indicate that a portion of the fund balance is not available for expenditures. Designations of fund balance represent tentative management plans that are subject to change.
M. Use of Estimates
The preparation of financial statements, in conformity with generally accepted accounting principles, requires management to make estimates and assumptions that affect the reported amounts of assets and liabilities and disclosure of contingent assets and liabilities at the date of the financial statements and the reported amounts of revenues and expenditures during the reporting period. Actual results could differ from those estimates.
N. Data Control Codes Data control codes refer to the account structure prescribed by the TEA in the Resource Guide.
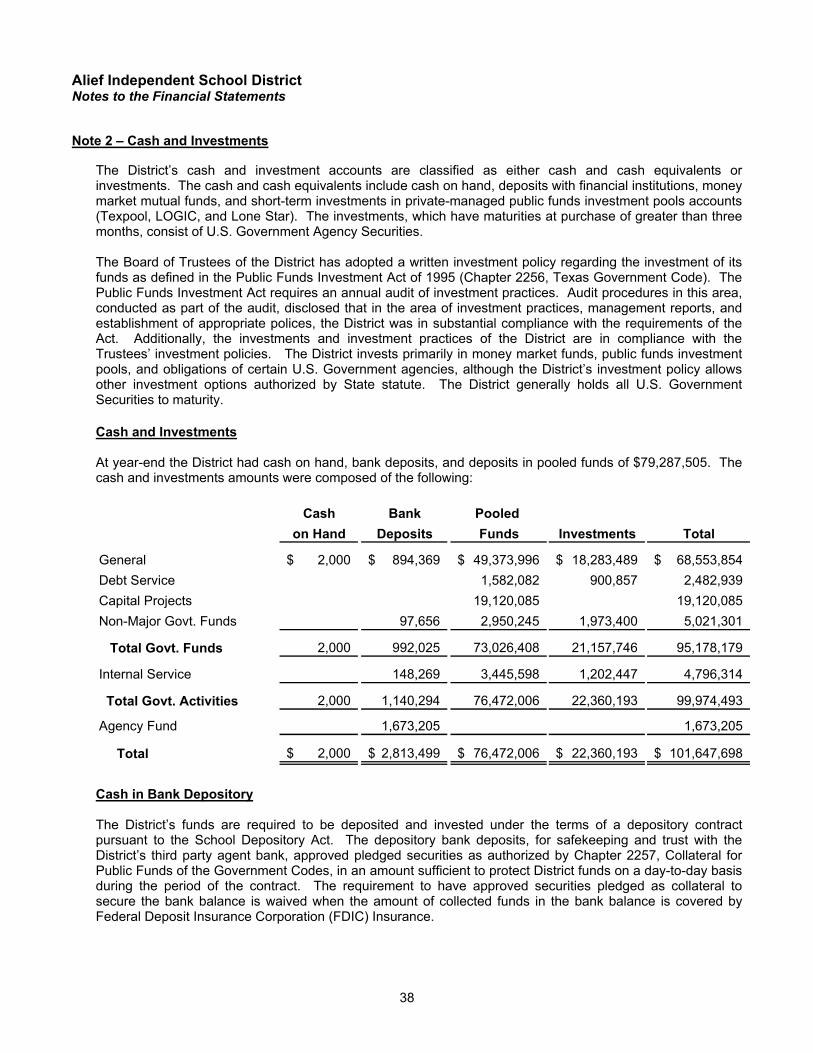
38
Alief Independent School District Notes to the Financial Statements Note 2 – Cash and Investments
The District’s cash and investment accounts are classified as either cash and cash equivalents or investments. The cash and cash equivalents include cash on hand, deposits with financial institutions, money market mutual funds, and short-term investments in private-managed public funds investment pools accounts (Texpool, LOGIC, and Lone Star). The investments, which have maturities at purchase of greater than three months, consist of U.S. Government Agency Securities.
The Board of Trustees of the District has adopted a written investment policy regarding the investment of its funds as defined in the Public Funds Investment Act of 1995 (Chapter 2256, Texas Government Code). The Public Funds Investment Act requires an annual audit of investment practices. Audit procedures in this area, conducted as part of the audit, disclosed that in the area of investment practices, management reports, and establishment of appropriate polices, the District was in substantial compliance with the requirements of the Act. Additionally, the investments and investment practices of the District are in compliance with the Trustees’ investment policies. The District invests primarily in money market funds, public funds investment pools, and obligations of certain U.S. Government agencies, although the District’s investment policy allows other investment options authorized by State statute. The District generally holds all U.S. Government Securities to maturity. Cash and Investments
At year-end the District had cash on hand, bank deposits, and deposits in pooled funds of $79,287,505. The cash and investments amounts were composed of the following:
Cash Bank Pooled on Hand Deposits Funds Investments Total
General 2,000$ 894,369$ 49,373,996$ 18,283,489$ 68,553,854$ Debt Service 1,582,082 900,857 2,482,939 Capital Projects 19,120,085 19,120,085 Non-Major Govt. Funds 97,656 2,950,245 1,973,400 5,021,301
Total Govt. Funds 2,000 992,025 73,026,408 21,157,746 95,178,179
Internal Service 148,269 3,445,598 1,202,447 4,796,314
Total Govt. Activities 2,000 1,140,294 76,472,006 22,360,193 99,974,493
Agency Fund 1,673,205 1,673,205
Total 2,000$ 2,813,499$ 76,472,006$ 22,360,193$ 101,647,698$
Cash in Bank Depository
The District’s funds are required to be deposited and invested under the terms of a depository contract pursuant to the School Depository Act. The depository bank deposits, for safekeeping and trust with the District’s third party agent bank, approved pledged securities as authorized by Chapter 2257, Collateral for Public Funds of the Government Codes, in an amount sufficient to protect District funds on a day-to-day basis during the period of the contract. The requirement to have approved securities pledged as collateral to secure the bank balance is waived when the amount of collected funds in the bank balance is covered by Federal Deposit Insurance Corporation (FDIC) Insurance.
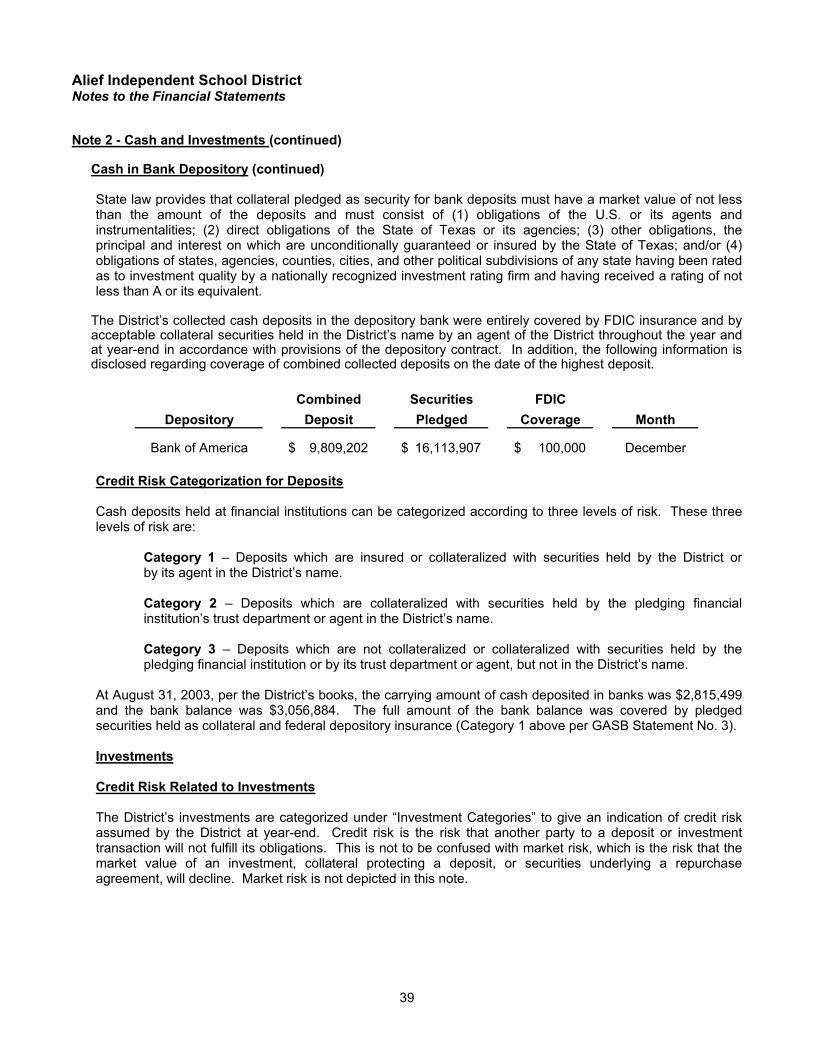
39
Alief Independent School District Notes to the Financial Statements Note 2 - Cash and Investments (continued) Cash in Bank Depository (continued)
State law provides that collateral pledged as security for bank deposits must have a market value of not less than the amount of the deposits and must consist of (1) obligations of the U.S. or its agents and instrumentalities; (2) direct obligations of the State of Texas or its agencies; (3) other obligations, the principal and interest on which are unconditionally guaranteed or insured by the State of Texas; and/or (4) obligations of states, agencies, counties, cities, and other political subdivisions of any state having been rated as to investment quality by a nationally recognized investment rating firm and having received a rating of not less than A or its equivalent.
The District’s collected cash deposits in the depository bank were entirely covered by FDIC insurance and by acceptable collateral securities held in the District’s name by an agent of the District throughout the year and at year-end in accordance with provisions of the depository contract. In addition, the following information is disclosed regarding coverage of combined collected deposits on the date of the highest deposit.
Combined Securities FDICDepository Deposit Pledged Coverage Month
Bank of America 9,809,202$ 16,113,907$ 100,000$ December
Credit Risk Categorization for Deposits
Cash deposits held at financial institutions can be categorized according to three levels of risk. These three levels of risk are:
Category 1 – Deposits which are insured or collateralized with securities held by the District or by its agent in the District’s name.
Category 2 – Deposits which are collateralized with securities held by the pledging financial institution’s trust department or agent in the District’s name.
Category 3 – Deposits which are not collateralized or collateralized with securities held by the pledging financial institution or by its trust department or agent, but not in the District’s name.
At August 31, 2003, per the District’s books, the carrying amount of cash deposited in banks was $2,815,499 and the bank balance was $3,056,884. The full amount of the bank balance was covered by pledged securities held as collateral and federal depository insurance (Category 1 above per GASB Statement No. 3).
Investments
Credit Risk Related to Investments
The District’s investments are categorized under “Investment Categories” to give an indication of credit risk assumed by the District at year-end. Credit risk is the risk that another party to a deposit or investment transaction will not fulfill its obligations. This is not to be confused with market risk, which is the risk that the market value of an investment, collateral protecting a deposit, or securities underlying a repurchase agreement, will decline. Market risk is not depicted in this note.
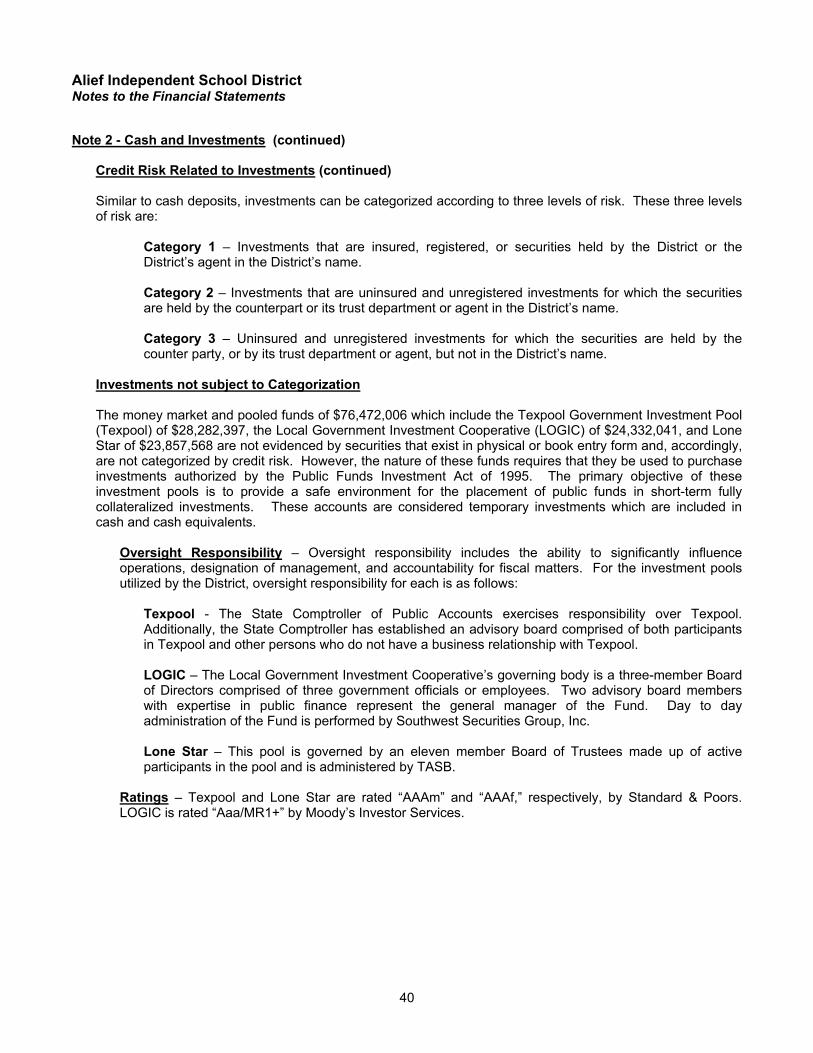
40
Alief Independent School District Notes to the Financial Statements Note 2 - Cash and Investments (continued)
Credit Risk Related to Investments (continued) Similar to cash deposits, investments can be categorized according to three levels of risk. These three levels of risk are:
Category 1 – Investments that are insured, registered, or securities held by the District or the District’s agent in the District’s name. Category 2 – Investments that are uninsured and unregistered investments for which the securities are held by the counterpart or its trust department or agent in the District’s name. Category 3 – Uninsured and unregistered investments for which the securities are held by the counter party, or by its trust department or agent, but not in the District’s name.
Investments not subject to Categorization
The money market and pooled funds of $76,472,006 which include the Texpool Government Investment Pool (Texpool) of $28,282,397, the Local Government Investment Cooperative (LOGIC) of $24,332,041, and Lone Star of $23,857,568 are not evidenced by securities that exist in physical or book entry form and, accordingly, are not categorized by credit risk. However, the nature of these funds requires that they be used to purchase investments authorized by the Public Funds Investment Act of 1995. The primary objective of these investment pools is to provide a safe environment for the placement of public funds in short-term fully collateralized investments. These accounts are considered temporary investments which are included in cash and cash equivalents.
Oversight Responsibility – Oversight responsibility includes the ability to significantly influence operations, designation of management, and accountability for fiscal matters. For the investment pools utilized by the District, oversight responsibility for each is as follows:
Texpool - The State Comptroller of Public Accounts exercises responsibility over Texpool. Additionally, the State Comptroller has established an advisory board comprised of both participants in Texpool and other persons who do not have a business relationship with Texpool. LOGIC – The Local Government Investment Cooperative’s governing body is a three-member Board of Directors comprised of three government officials or employees. Two advisory board members with expertise in public finance represent the general manager of the Fund. Day to day administration of the Fund is performed by Southwest Securities Group, Inc. Lone Star – This pool is governed by an eleven member Board of Trustees made up of active participants in the pool and is administered by TASB.
Ratings – Texpool and Lone Star are rated “AAAm” and “AAAf,” respectively, by Standard & Poors. LOGIC is rated “Aaa/MR1+” by Moody’s Investor Services.
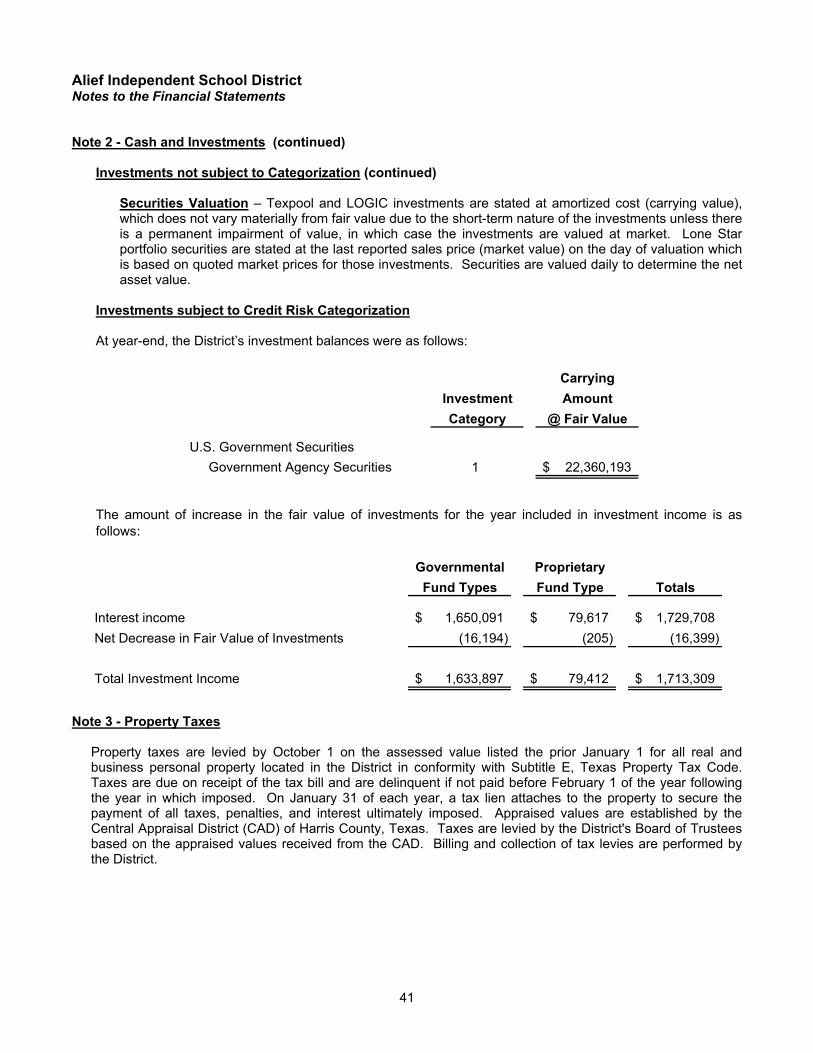
41
Alief Independent School District Notes to the Financial Statements Note 2 - Cash and Investments (continued)
Investments not subject to Categorization (continued)
Securities Valuation – Texpool and LOGIC investments are stated at amortized cost (carrying value), which does not vary materially from fair value due to the short-term nature of the investments unless there is a permanent impairment of value, in which case the investments are valued at market. Lone Star portfolio securities are stated at the last reported sales price (market value) on the day of valuation which is based on quoted market prices for those investments. Securities are valued daily to determine the net asset value.
Investments subject to Credit Risk Categorization
At year-end, the District’s investment balances were as follows:
CarryingInvestment AmountCategory @ Fair Value
U.S. Government SecuritiesGovernment Agency Securities 1 22,360,193$
The amount of increase in the fair value of investments for the year included in investment income is as follows:
Governmental ProprietaryFund Types Fund Type Totals
Interest income 1,650,091$ 79,617$ 1,729,708$ Net Decrease in Fair Value of Investments (16,194) (205) (16,399)
Total Investment Income 1,633,897$ 79,412$ 1,713,309$
Note 3 - Property Taxes
Property taxes are levied by October 1 on the assessed value listed the prior January 1 for all real and business personal property located in the District in conformity with Subtitle E, Texas Property Tax Code. Taxes are due on receipt of the tax bill and are delinquent if not paid before February 1 of the year following the year in which imposed. On January 31 of each year, a tax lien attaches to the property to secure the payment of all taxes, penalties, and interest ultimately imposed. Appraised values are established by the Central Appraisal District (CAD) of Harris County, Texas. Taxes are levied by the District's Board of Trustees based on the appraised values received from the CAD. Billing and collection of tax levies are performed by the District.
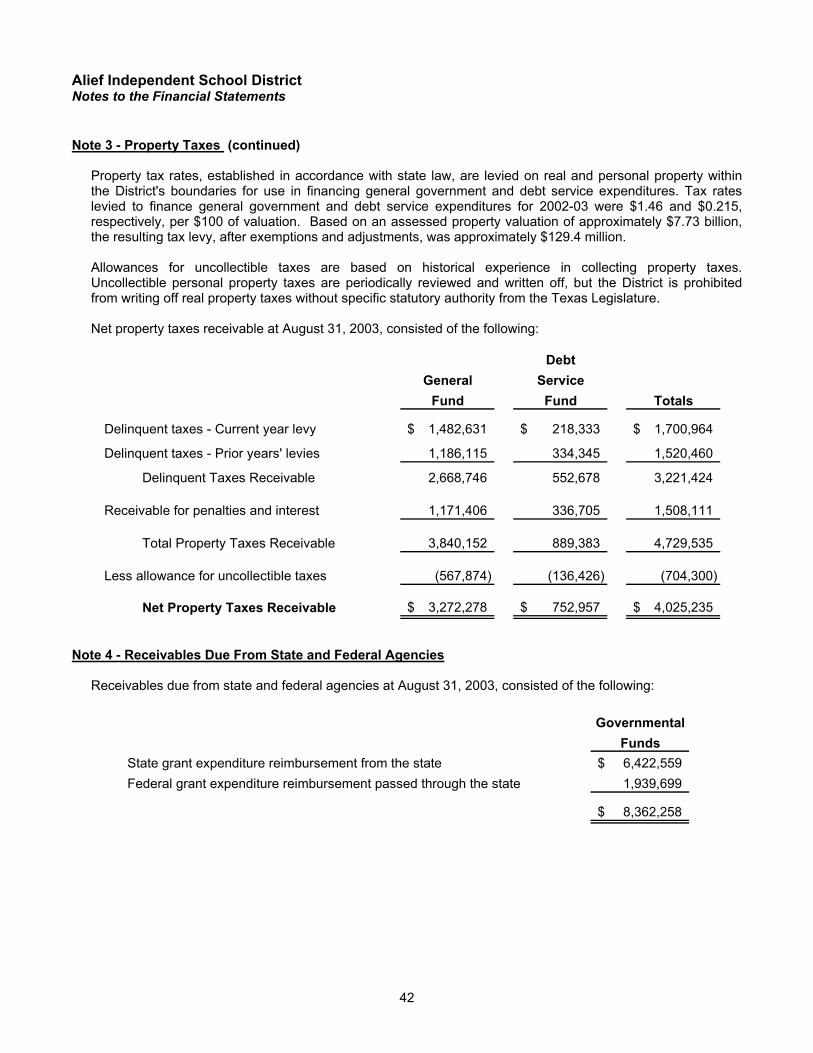
42
Alief Independent School District Notes to the Financial Statements
Note 3 - Property Taxes (continued) Property tax rates, established in accordance with state law, are levied on real and personal property within the District's boundaries for use in financing general government and debt service expenditures. Tax rates levied to finance general government and debt service expenditures for 2002-03 were $1.46 and $0.215, respectively, per $100 of valuation. Based on an assessed property valuation of approximately $7.73 billion, the resulting tax levy, after exemptions and adjustments, was approximately $129.4 million. Allowances for uncollectible taxes are based on historical experience in collecting property taxes. Uncollectible personal property taxes are periodically reviewed and written off, but the District is prohibited from writing off real property taxes without specific statutory authority from the Texas Legislature. Net property taxes receivable at August 31, 2003, consisted of the following:
Note 4 - Receivables Due From State and Federal Agencies
Receivables due from state and federal agencies at August 31, 2003, consisted of the following:
GovernmentalFunds
State grant expenditure reimbursement from the state 6,422,559$ Federal grant expenditure reimbursement passed through the state 1,939,699
8,362,258$
DebtGeneral Service
Fund Fund Totals
Delinquent taxes - Current year levy 1,482,631$ 218,333$ 1,700,964$
Delinquent taxes - Prior years' levies 1,186,115 334,345 1,520,460
Delinquent Taxes Receivable 2,668,746 552,678 3,221,424
Receivable for penalties and interest 1,171,406 336,705 1,508,111
Total Property Taxes Receivable 3,840,152 889,383 4,729,535
Less allowance for uncollectible taxes (567,874) (136,426) (704,300)
Net Property Taxes Receivable 3,272,278$ 752,957$ 4,025,235$
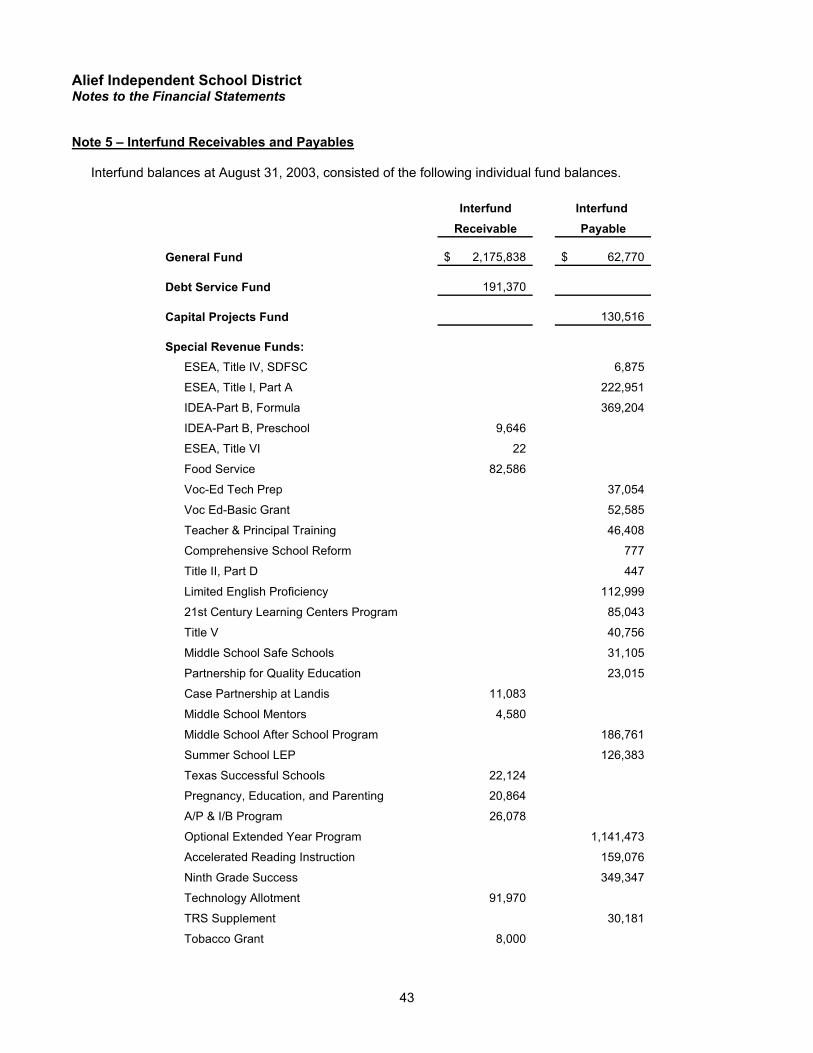
43
Alief Independent School District Notes to the Financial Statements Note 5 – Interfund Receivables and Payables Interfund balances at August 31, 2003, consisted of the following individual fund balances.
Interfund Interfund Receivable Payable
General Fund 2,175,838$ 62,770$
Debt Service Fund 191,370
Capital Projects Fund 130,516
Special Revenue Funds:ESEA, Title IV, SDFSC 6,875
ESEA, Title I, Part A 222,951
IDEA-Part B, Formula 369,204
IDEA-Part B, Preschool 9,646
ESEA, Title VI 22
Food Service 82,586
Voc-Ed Tech Prep 37,054
Voc Ed-Basic Grant 52,585
Teacher & Principal Training 46,408
Comprehensive School Reform 777
Title II, Part D 447
Limited English Proficiency 112,999
21st Century Learning Centers Program 85,043
Title V 40,756
Middle School Safe Schools 31,105
Partnership for Quality Education 23,015
Case Partnership at Landis 11,083
Middle School Mentors 4,580
Middle School After School Program 186,761
Summer School LEP 126,383
Texas Successful Schools 22,124
Pregnancy, Education, and Parenting 20,864
A/P & I/B Program 26,078
Optional Extended Year Program 1,141,473
Accelerated Reading Instruction 159,076
Ninth Grade Success 349,347
Technology Allotment 91,970
TRS Supplement 30,181
Tobacco Grant 8,000
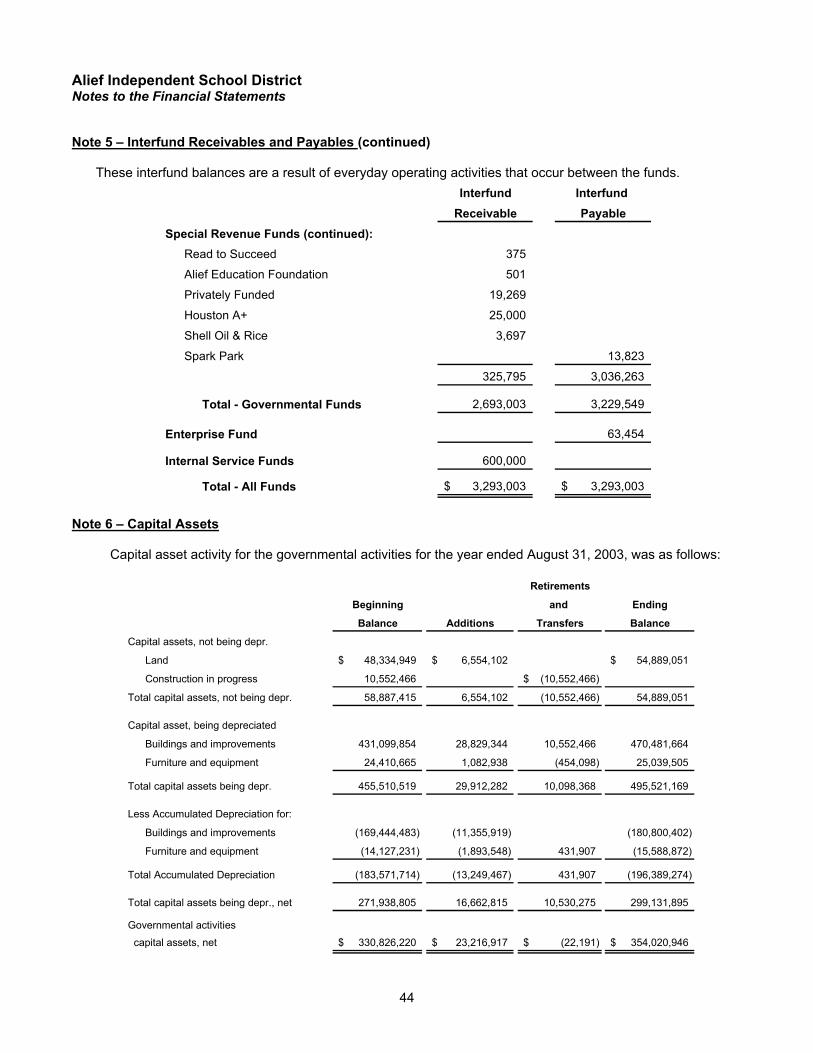
44
Alief Independent School District Notes to the Financial Statements Note 5 – Interfund Receivables and Payables (continued) These interfund balances are a result of everyday operating activities that occur between the funds.
Interfund Interfund Receivable Payable
Special Revenue Funds (continued):Read to Succeed 375
Alief Education Foundation 501
Privately Funded 19,269
Houston A+ 25,000
Shell Oil & Rice 3,697
Spark Park 13,823
325,795 3,036,263
Total - Governmental Funds 2,693,003 3,229,549
Enterprise Fund 63,454
Internal Service Funds 600,000
Total - All Funds 3,293,003$ 3,293,003$
Note 6 – Capital Assets
Capital asset activity for the governmental activities for the year ended August 31, 2003, was as follows:
Retirements
Beginning and Ending
Balance Additions Transfers Balance
Capital assets, not being depr.
Land 48,334,949$ 6,554,102$ 54,889,051$
Construction in progress 10,552,466 (10,552,466)$
Total capital assets, not being depr. 58,887,415 6,554,102 (10,552,466) 54,889,051
Capital asset, being depreciated
Buildings and improvements 431,099,854 28,829,344 10,552,466 470,481,664
Furniture and equipment 24,410,665 1,082,938 (454,098) 25,039,505
Total capital assets being depr. 455,510,519 29,912,282 10,098,368 495,521,169
Less Accumulated Depreciation for:
Buildings and improvements (169,444,483) (11,355,919) (180,800,402)
Furniture and equipment (14,127,231) (1,893,548) 431,907 (15,588,872)
Total Accumulated Depreciation (183,571,714) (13,249,467) 431,907 (196,389,274)
Total capital assets being depr., net 271,938,805 16,662,815 10,530,275 299,131,895
Governmental activities
capital assets, net 330,826,220$ 23,216,917$ (22,191)$ 354,020,946$
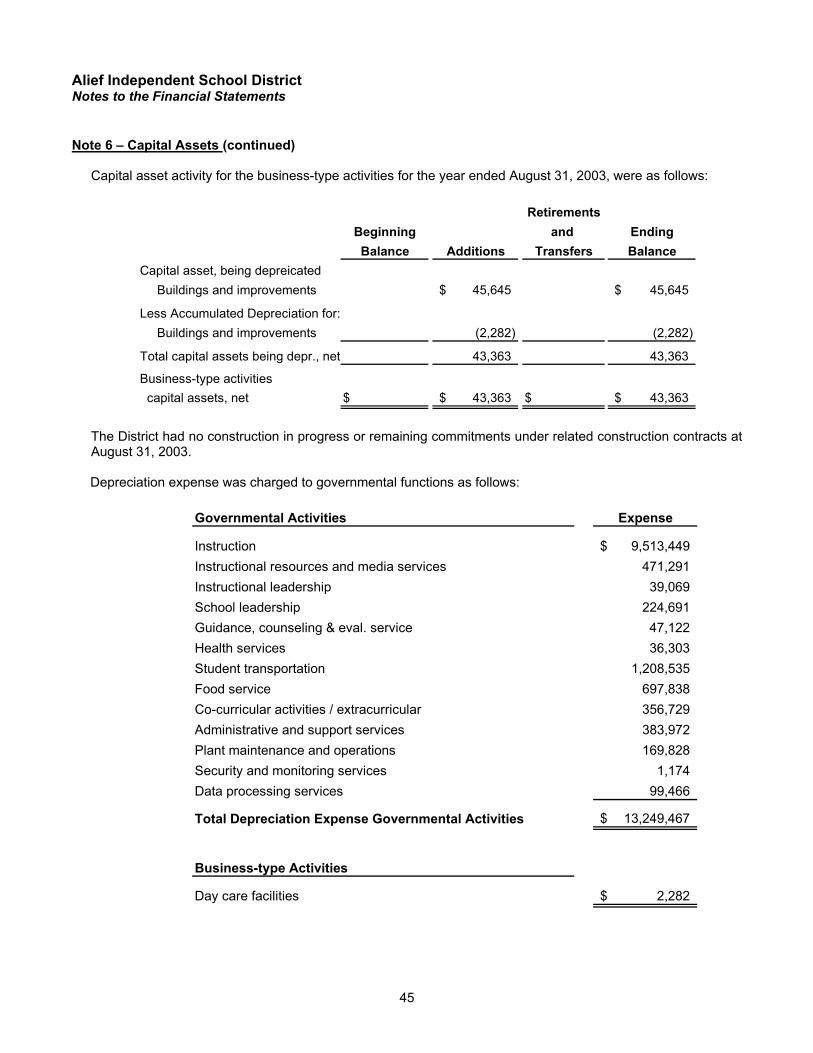
45
Alief Independent School District Notes to the Financial Statements Note 6 – Capital Assets (continued) Capital asset activity for the business-type activities for the year ended August 31, 2003, were as follows:
RetirementsBeginning and EndingBalance Additions Transfers Balance
Capital asset, being depreicatedBuildings and improvements 45,645$ 45,645$
Less Accumulated Depreciation for:Buildings and improvements (2,282) (2,282)
Total capital assets being depr., net 43,363 43,363
Business-type activities capital assets, net $ 43,363$ $ 43,363$
The District had no construction in progress or remaining commitments under related construction contracts at August 31, 2003.
Depreciation expense was charged to governmental functions as follows:
Governmental Activities Expense
Instruction 9,513,449$ Instructional resources and media services 471,291Instructional leadership 39,069School leadership 224,691Guidance, counseling & eval. service 47,122Health services 36,303Student transportation 1,208,535Food service 697,838Co-curricular activities / extracurricular 356,729Administrative and support services 383,972Plant maintenance and operations 169,828Security and monitoring services 1,174Data processing services 99,466
Total Depreciation Expense Governmental Activities 13,249,467$
Business-type Activities
Day care facilities 2,282$
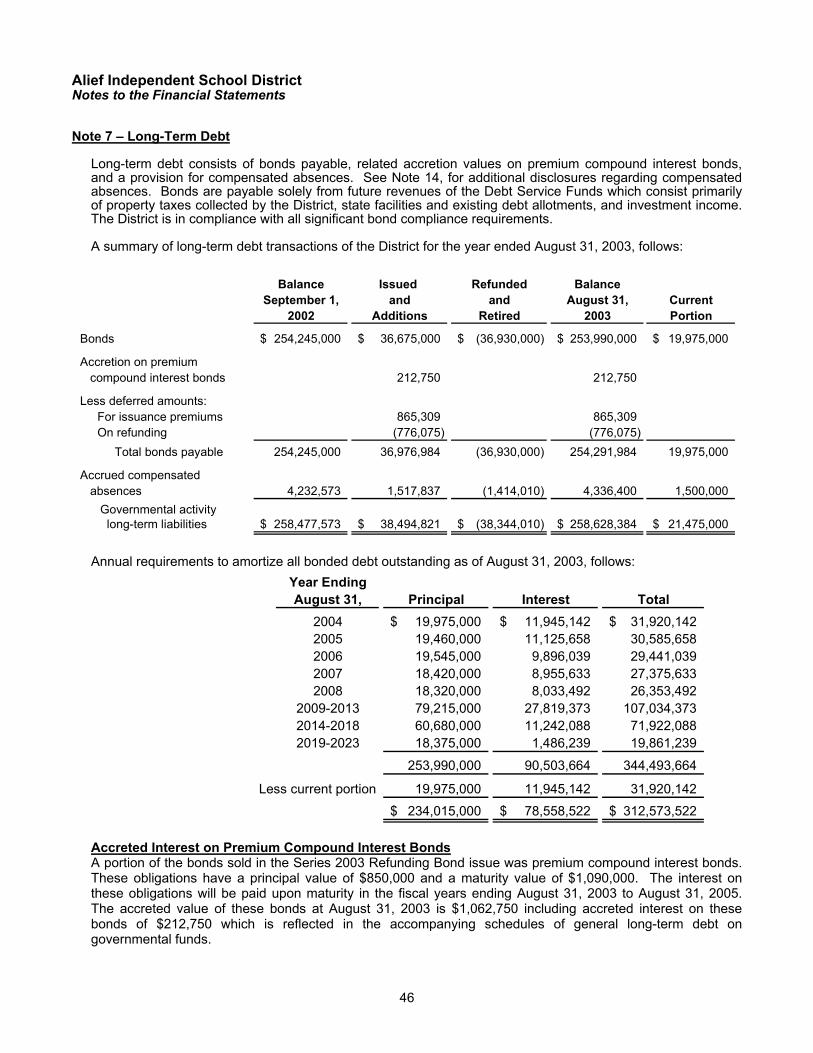
46
Alief Independent School District Notes to the Financial Statements Note 7 – Long-Term Debt
Long-term debt consists of bonds payable, related accretion values on premium compound interest bonds, and a provision for compensated absences. See Note 14, for additional disclosures regarding compensated absences. Bonds are payable solely from future revenues of the Debt Service Funds which consist primarily of property taxes collected by the District, state facilities and existing debt allotments, and investment income. The District is in compliance with all significant bond compliance requirements.
A summary of long-term debt transactions of the District for the year ended August 31, 2003, follows:
Annual requirements to amortize all bonded debt outstanding as of August 31, 2003, follows:
Accreted Interest on Premium Compound Interest Bonds A portion of the bonds sold in the Series 2003 Refunding Bond issue was premium compound interest bonds. These obligations have a principal value of $850,000 and a maturity value of $1,090,000. The interest on these obligations will be paid upon maturity in the fiscal years ending August 31, 2003 to August 31, 2005. The accreted value of these bonds at August 31, 2003 is $1,062,750 including accreted interest on these bonds of $212,750 which is reflected in the accompanying schedules of general long-term debt on governmental funds.
Balance Issued Refunded BalanceSeptember 1, and and August 31, Current
2002 Additions Retired 2003 Portion
Bonds 254,245,000$ 36,675,000$ (36,930,000)$ 253,990,000$ 19,975,000$
Accretion on premium compound interest bonds 212,750 212,750
Less deferred amounts:For issuance premiums 865,309 865,309 On refunding (776,075) (776,075)
Total bonds payable 254,245,000 36,976,984 (36,930,000) 254,291,984 19,975,000
Accrued compensated absences 4,232,573 1,517,837 (1,414,010) 4,336,400 1,500,000 Governmental activity long-term liabilities 258,477,573$ 38,494,821$ (38,344,010)$ 258,628,384$ 21,475,000$
Year EndingAugust 31, Principal Interest Total
2004 19,975,000$ 11,945,142$ 31,920,142$ 2005 19,460,000 11,125,658 30,585,658 2006 19,545,000 9,896,039 29,441,039 2007 18,420,000 8,955,633 27,375,633 2008 18,320,000 8,033,492 26,353,492
2009-2013 79,215,000 27,819,373 107,034,373 2014-2018 60,680,000 11,242,088 71,922,088 2019-2023 18,375,000 1,486,239 19,861,239
253,990,000 90,503,664 344,493,664
19,975,000 11,945,142 31,920,142
234,015,000$ 78,558,522$ 312,573,522$
Less current portion
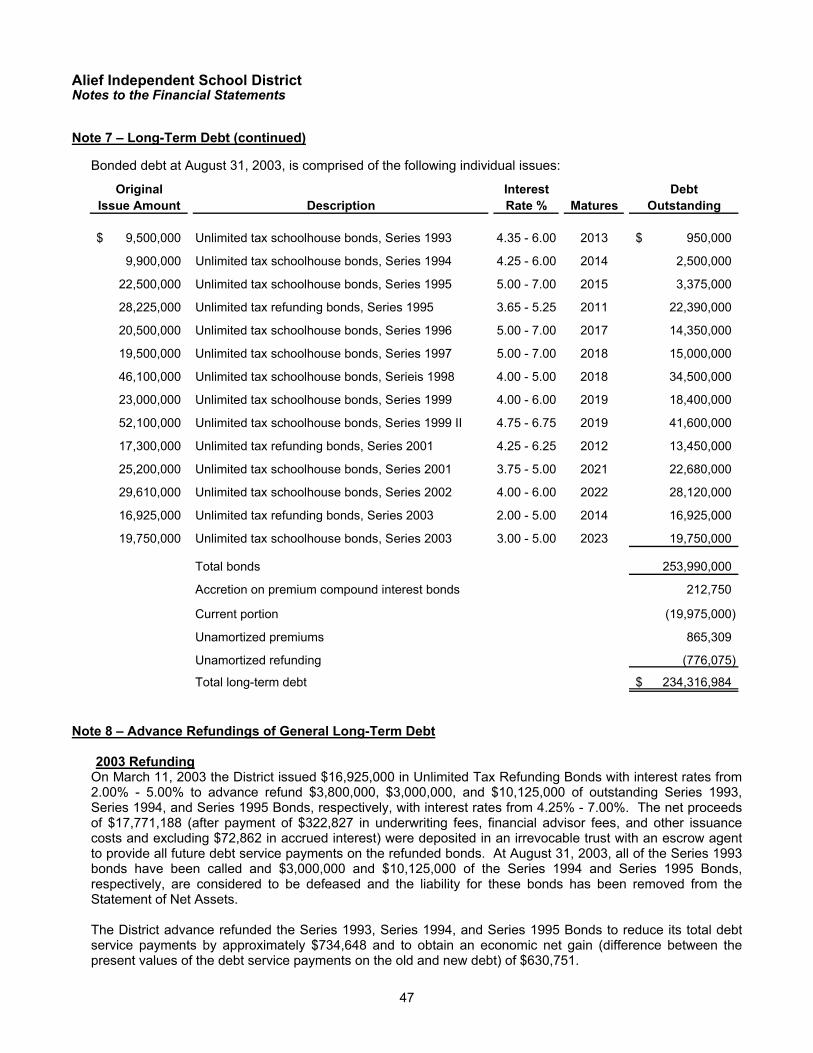
47
Alief Independent School District Notes to the Financial Statements Note 7 – Long-Term Debt (continued)
Bonded debt at August 31, 2003, is comprised of the following individual issues:
Note 8 – Advance Refundings of General Long-Term Debt
2003 Refunding On March 11, 2003 the District issued $16,925,000 in Unlimited Tax Refunding Bonds with interest rates from 2.00% - 5.00% to advance refund $3,800,000, $3,000,000, and $10,125,000 of outstanding Series 1993, Series 1994, and Series 1995 Bonds, respectively, with interest rates from 4.25% - 7.00%. The net proceeds of $17,771,188 (after payment of $322,827 in underwriting fees, financial advisor fees, and other issuance costs and excluding $72,862 in accrued interest) were deposited in an irrevocable trust with an escrow agent to provide all future debt service payments on the refunded bonds. At August 31, 2003, all of the Series 1993 bonds have been called and $3,000,000 and $10,125,000 of the Series 1994 and Series 1995 Bonds, respectively, are considered to be defeased and the liability for these bonds has been removed from the Statement of Net Assets.
The District advance refunded the Series 1993, Series 1994, and Series 1995 Bonds to reduce its total debt service payments by approximately $734,648 and to obtain an economic net gain (difference between the present values of the debt service payments on the old and new debt) of $630,751.
Original Interest DebtIssue Amount Description Rate % Matures Outstanding
9,500,000$ Unlimited tax schoolhouse bonds, Series 1993 4.35 - 6.00 2013 950,000$
9,900,000 Unlimited tax schoolhouse bonds, Series 1994 4.25 - 6.00 2014 2,500,000
22,500,000 Unlimited tax schoolhouse bonds, Series 1995 5.00 - 7.00 2015 3,375,000
28,225,000 Unlimited tax refunding bonds, Series 1995 3.65 - 5.25 2011 22,390,000
20,500,000 Unlimited tax schoolhouse bonds, Series 1996 5.00 - 7.00 2017 14,350,000
19,500,000 Unlimited tax schoolhouse bonds, Series 1997 5.00 - 7.00 2018 15,000,000
46,100,000 Unlimited tax schoolhouse bonds, Serieis 1998 4.00 - 5.00 2018 34,500,000
23,000,000 Unlimited tax schoolhouse bonds, Series 1999 4.00 - 6.00 2019 18,400,000
52,100,000 Unlimited tax schoolhouse bonds, Series 1999 II 4.75 - 6.75 2019 41,600,000
17,300,000 Unlimited tax refunding bonds, Series 2001 4.25 - 6.25 2012 13,450,000
25,200,000 Unlimited tax schoolhouse bonds, Series 2001 3.75 - 5.00 2021 22,680,000
29,610,000 Unlimited tax schoolhouse bonds, Series 2002 4.00 - 6.00 2022 28,120,000
16,925,000 Unlimited tax refunding bonds, Series 2003 2.00 - 5.00 2014 16,925,000
19,750,000 Unlimited tax schoolhouse bonds, Series 2003 3.00 - 5.00 2023 19,750,000
Total bonds 253,990,000
Accretion on premium compound interest bonds 212,750
Current portion (19,975,000)
Unamortized premiums 865,309
Unamortized refunding (776,075)
Total long-term debt 234,316,984$
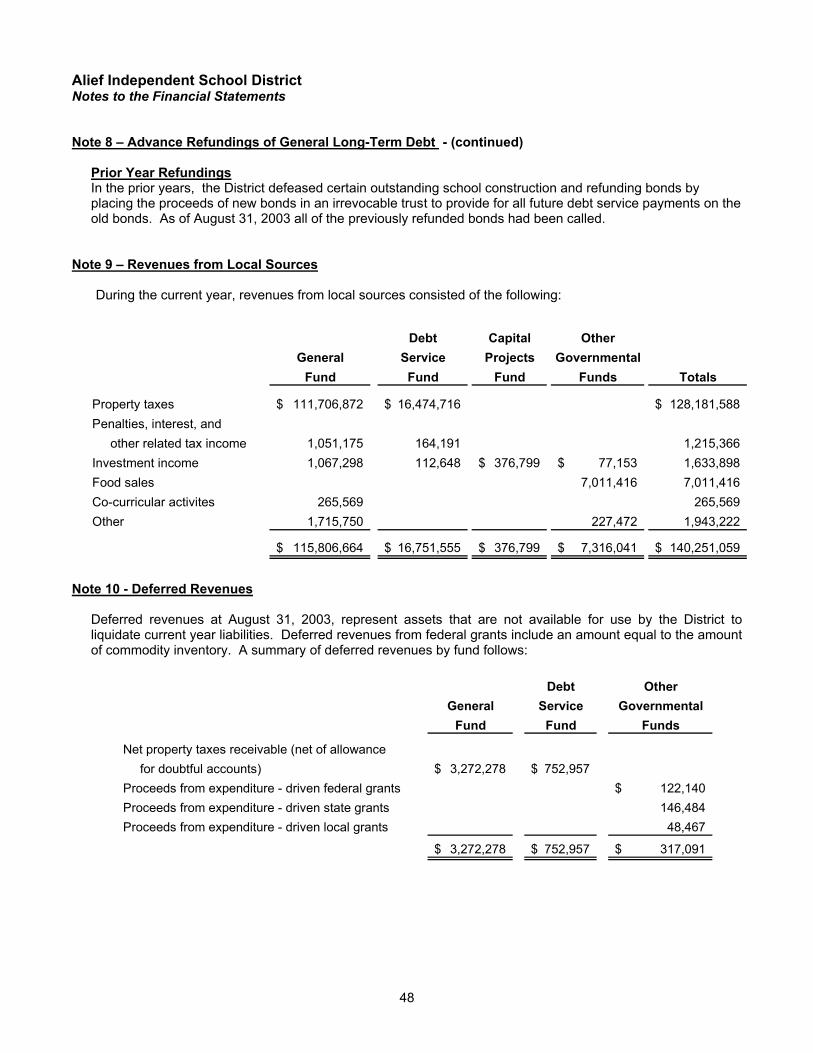
48
Alief Independent School District Notes to the Financial Statements Note 8 – Advance Refundings of General Long-Term Debt - (continued)
Prior Year Refundings In the prior years, the District defeased certain outstanding school construction and refunding bonds by placing the proceeds of new bonds in an irrevocable trust to provide for all future debt service payments on the old bonds. As of August 31, 2003 all of the previously refunded bonds had been called.
Note 9 – Revenues from Local Sources During the current year, revenues from local sources consisted of the following:
Note 10 - Deferred Revenues
Deferred revenues at August 31, 2003, represent assets that are not available for use by the District to liquidate current year liabilities. Deferred revenues from federal grants include an amount equal to the amount of commodity inventory. A summary of deferred revenues by fund follows:
Debt OtherGeneral Service Governmental
Fund Fund Funds
Net property taxes receivable (net of allowancefor doubtful accounts) 3,272,278$ 752,957$
Proceeds from expenditure - driven federal grants 122,140$ Proceeds from expenditure - driven state grants 146,484Proceeds from expenditure - driven local grants 48,467
3,272,278$ 752,957$ 317,091$
Debt Capital OtherGeneral Service Projects Governmental
Fund Fund Fund Funds Totals
Property taxes 111,706,872$ 16,474,716$ 128,181,588$ Penalties, interest, and
other related tax income 1,051,175 164,191 1,215,366 Investment income 1,067,298 112,648 376,799$ 77,153$ 1,633,898 Food sales 7,011,416 7,011,416 Co-curricular activites 265,569 265,569 Other 1,715,750 227,472 1,943,222
115,806,664$ 16,751,555$ 376,799$ 7,316,041$ 140,251,059$
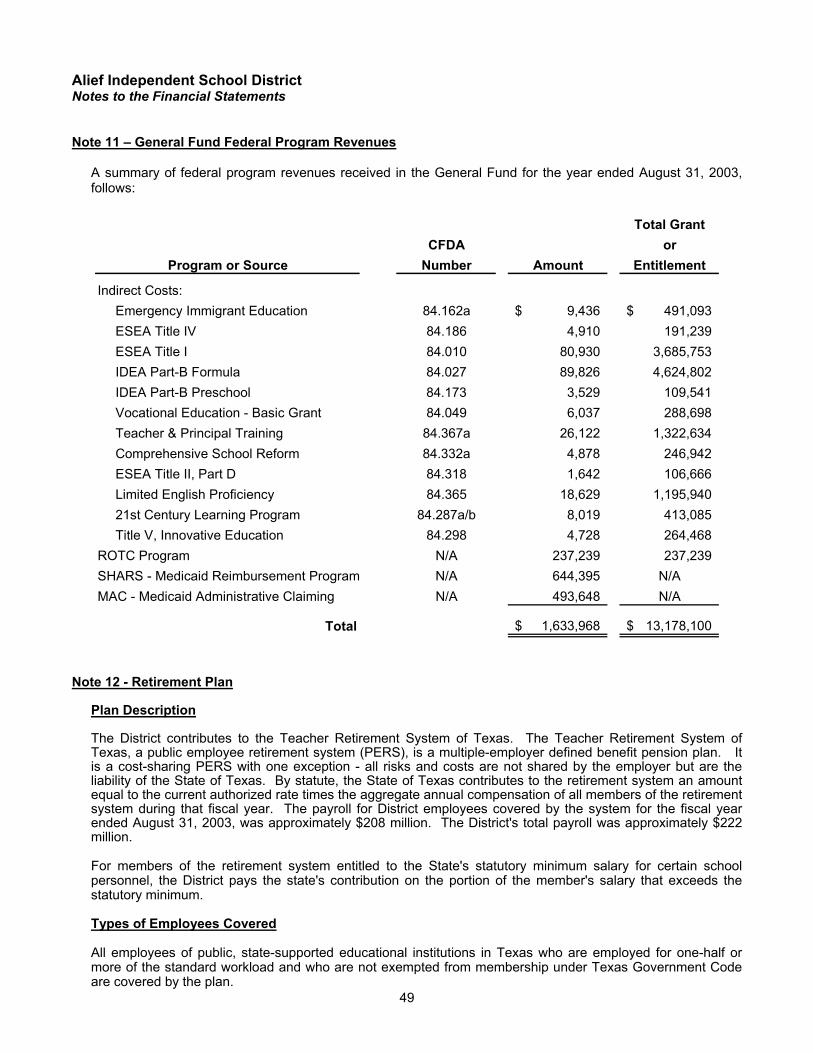
49
Alief Independent School District Notes to the Financial Statements Note 11 – General Fund Federal Program Revenues
A summary of federal program revenues received in the General Fund for the year ended August 31, 2003, follows:
Note 12 - Retirement Plan Plan Description
The District contributes to the Teacher Retirement System of Texas. The Teacher Retirement System of Texas, a public employee retirement system (PERS), is a multiple-employer defined benefit pension plan. It is a cost-sharing PERS with one exception - all risks and costs are not shared by the employer but are the liability of the State of Texas. By statute, the State of Texas contributes to the retirement system an amount equal to the current authorized rate times the aggregate annual compensation of all members of the retirement system during that fiscal year. The payroll for District employees covered by the system for the fiscal year ended August 31, 2003, was approximately $208 million. The District's total payroll was approximately $222 million.
For members of the retirement system entitled to the State's statutory minimum salary for certain school personnel, the District pays the state's contribution on the portion of the member's salary that exceeds the statutory minimum.
Types of Employees Covered
All employees of public, state-supported educational institutions in Texas who are employed for one-half or more of the standard workload and who are not exempted from membership under Texas Government Code are covered by the plan.
Total GrantCFDA or
Number Amount Entitlement
Indirect Costs:Emergency Immigrant Education 84.162a 9,436$ 491,093$ ESEA Title IV 84.186 4,910 191,239ESEA Title I 84.010 80,930 3,685,753IDEA Part-B Formula 84.027 89,826 4,624,802IDEA Part-B Preschool 84.173 3,529 109,541Vocational Education - Basic Grant 84.049 6,037 288,698Teacher & Principal Training 84.367a 26,122 1,322,634Comprehensive School Reform 84.332a 4,878 246,942ESEA Title II, Part D 84.318 1,642 106,666Limited English Proficiency 84.365 18,629 1,195,94021st Century Learning Program 84.287a/b 8,019 413,085Title V, Innovative Education 84.298 4,728 264,468
ROTC Program N/A 237,239 237,239SHARS - Medicaid Reimbursement Program N/A 644,395 N/AMAC - Medicaid Administrative Claiming N/A 493,648 N/A
Total 1,633,968$ 13,178,100$
Program or Source
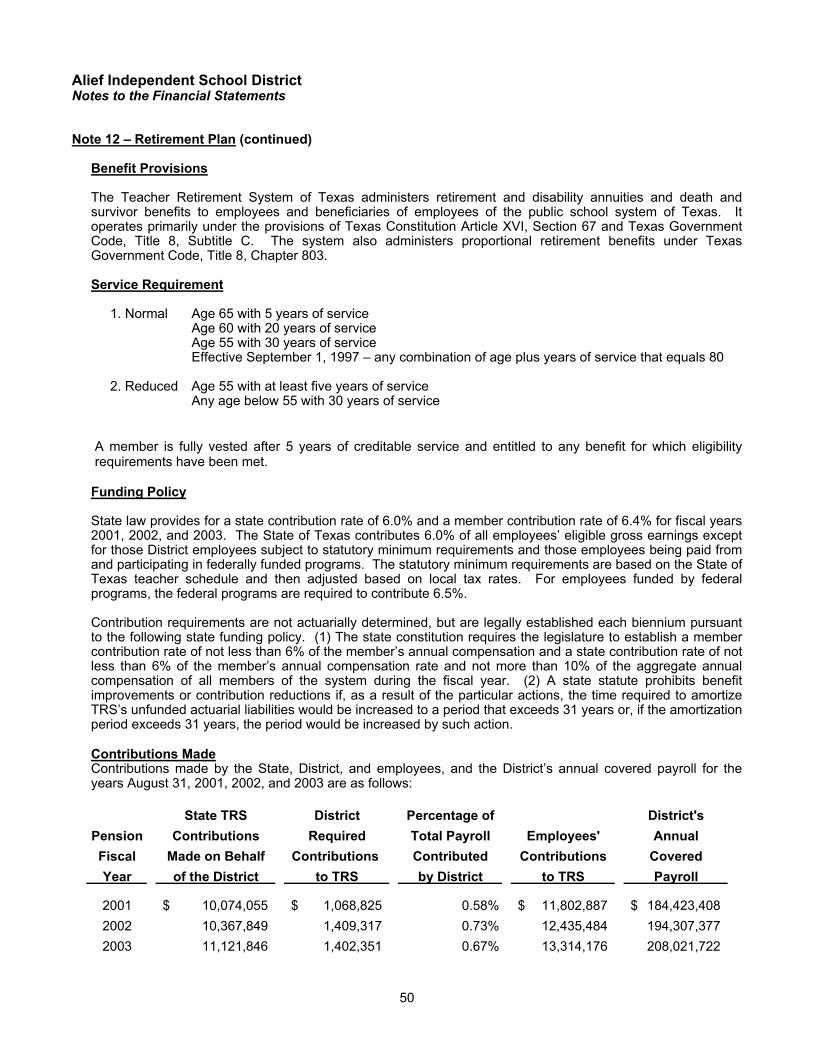
50
Alief Independent School District Notes to the Financial Statements Note 12 – Retirement Plan (continued) Benefit Provisions
The Teacher Retirement System of Texas administers retirement and disability annuities and death and survivor benefits to employees and beneficiaries of employees of the public school system of Texas. It operates primarily under the provisions of Texas Constitution Article XVI, Section 67 and Texas Government Code, Title 8, Subtitle C. The system also administers proportional retirement benefits under Texas Government Code, Title 8, Chapter 803.
Service Requirement 1. Normal Age 65 with 5 years of service Age 60 with 20 years of service Age 55 with 30 years of service Effective September 1, 1997 – any combination of age plus years of service that equals 80 2. Reduced Age 55 with at least five years of service Any age below 55 with 30 years of service
A member is fully vested after 5 years of creditable service and entitled to any benefit for which eligibility requirements have been met.
Funding Policy
State law provides for a state contribution rate of 6.0% and a member contribution rate of 6.4% for fiscal years 2001, 2002, and 2003. The State of Texas contributes 6.0% of all employees’ eligible gross earnings except for those District employees subject to statutory minimum requirements and those employees being paid from and participating in federally funded programs. The statutory minimum requirements are based on the State of Texas teacher schedule and then adjusted based on local tax rates. For employees funded by federal programs, the federal programs are required to contribute 6.5%. Contribution requirements are not actuarially determined, but are legally established each biennium pursuant to the following state funding policy. (1) The state constitution requires the legislature to establish a member contribution rate of not less than 6% of the member’s annual compensation and a state contribution rate of not less than 6% of the member’s annual compensation rate and not more than 10% of the aggregate annual compensation of all members of the system during the fiscal year. (2) A state statute prohibits benefit improvements or contribution reductions if, as a result of the particular actions, the time required to amortize TRS’s unfunded actuarial liabilities would be increased to a period that exceeds 31 years or, if the amortization period exceeds 31 years, the period would be increased by such action.
Contributions Made
Contributions made by the State, District, and employees, and the District’s annual covered payroll for the years August 31, 2001, 2002, and 2003 are as follows:
State TRS District Percentage of District'sPension Contributions Required Total Payroll Employees' AnnualFiscal Made on Behalf Contributions Contributed Contributions CoveredYear of the District to TRS by District to TRS Payroll
2001 10,074,055$ 1,068,825$ 0.58% 11,802,887$ 184,423,408$ 2002 10,367,849 1,409,317 0.73% 12,435,484 194,307,377 2003 11,121,846 1,402,351 0.67% 13,314,176 208,021,722
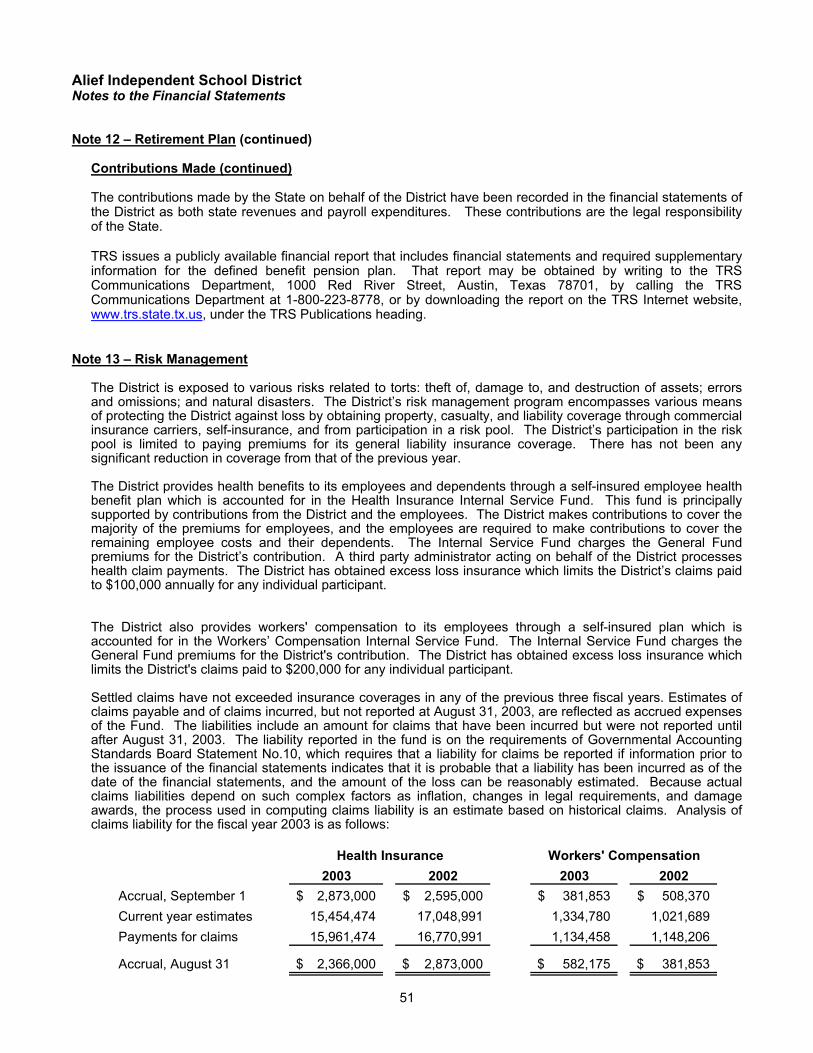
51
Alief Independent School District Notes to the Financial Statements Note 12 – Retirement Plan (continued)
Contributions Made (continued) The contributions made by the State on behalf of the District have been recorded in the financial statements of the District as both state revenues and payroll expenditures. These contributions are the legal responsibility of the State.
TRS issues a publicly available financial report that includes financial statements and required supplementary information for the defined benefit pension plan. That report may be obtained by writing to the TRS Communications Department, 1000 Red River Street, Austin, Texas 78701, by calling the TRS Communications Department at 1-800-223-8778, or by downloading the report on the TRS Internet website, www.trs.state.tx.us, under the TRS Publications heading.
Note 13 – Risk Management
The District is exposed to various risks related to torts: theft of, damage to, and destruction of assets; errors and omissions; and natural disasters. The District’s risk management program encompasses various means of protecting the District against loss by obtaining property, casualty, and liability coverage through commercial insurance carriers, self-insurance, and from participation in a risk pool. The District’s participation in the risk pool is limited to paying premiums for its general liability insurance coverage. There has not been any significant reduction in coverage from that of the previous year.
The District provides health benefits to its employees and dependents through a self-insured employee health benefit plan which is accounted for in the Health Insurance Internal Service Fund. This fund is principally supported by contributions from the District and the employees. The District makes contributions to cover the majority of the premiums for employees, and the employees are required to make contributions to cover the remaining employee costs and their dependents. The Internal Service Fund charges the General Fund premiums for the District’s contribution. A third party administrator acting on behalf of the District processes health claim payments. The District has obtained excess loss insurance which limits the District’s claims paid to $100,000 annually for any individual participant. The District also provides workers' compensation to its employees through a self-insured plan which is accounted for in the Workers’ Compensation Internal Service Fund. The Internal Service Fund charges the General Fund premiums for the District's contribution. The District has obtained excess loss insurance which limits the District's claims paid to $200,000 for any individual participant. Settled claims have not exceeded insurance coverages in any of the previous three fiscal years. Estimates of claims payable and of claims incurred, but not reported at August 31, 2003, are reflected as accrued expenses of the Fund. The liabilities include an amount for claims that have been incurred but were not reported until after August 31, 2003. The liability reported in the fund is on the requirements of Governmental Accounting Standards Board Statement No.10, which requires that a liability for claims be reported if information prior to the issuance of the financial statements indicates that it is probable that a liability has been incurred as of the date of the financial statements, and the amount of the loss can be reasonably estimated. Because actual claims liabilities depend on such complex factors as inflation, changes in legal requirements, and damage awards, the process used in computing claims liability is an estimate based on historical claims. Analysis of claims liability for the fiscal year 2003 is as follows:
2003 2002 2003 2002Accrual, September 1 2,873,000$ 2,595,000$ 381,853$ 508,370$ Current year estimates 15,454,474 17,048,991 1,334,780 1,021,689 Payments for claims 15,961,474 16,770,991 1,134,458 1,148,206
Accrual, August 31 2,366,000$ 2,873,000$ 582,175$ 381,853$
Health Insurance Workers' Compensation
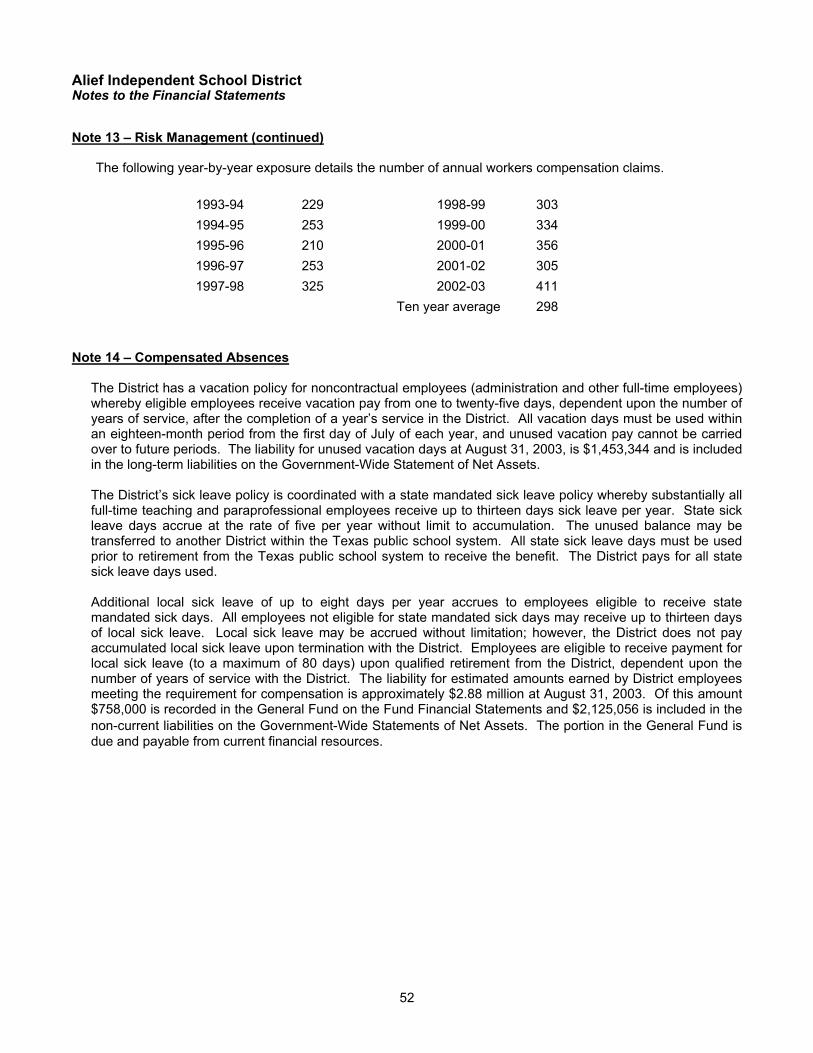
52
Alief Independent School District Notes to the Financial Statements Note 13 – Risk Management (continued) The following year-by-year exposure details the number of annual workers compensation claims.
1993-94 229 1998-99 3031994-95 253 1999-00 3341995-96 210 2000-01 3561996-97 253 2001-02 3051997-98 325 2002-03 411
Ten year average 298 Note 14 – Compensated Absences
The District has a vacation policy for noncontractual employees (administration and other full-time employees) whereby eligible employees receive vacation pay from one to twenty-five days, dependent upon the number of years of service, after the completion of a year’s service in the District. All vacation days must be used within an eighteen-month period from the first day of July of each year, and unused vacation pay cannot be carried over to future periods. The liability for unused vacation days at August 31, 2003, is $1,453,344 and is included in the long-term liabilities on the Government-Wide Statement of Net Assets. The District’s sick leave policy is coordinated with a state mandated sick leave policy whereby substantially all full-time teaching and paraprofessional employees receive up to thirteen days sick leave per year. State sick leave days accrue at the rate of five per year without limit to accumulation. The unused balance may be transferred to another District within the Texas public school system. All state sick leave days must be used prior to retirement from the Texas public school system to receive the benefit. The District pays for all state sick leave days used.
Additional local sick leave of up to eight days per year accrues to employees eligible to receive state mandated sick days. All employees not eligible for state mandated sick days may receive up to thirteen days of local sick leave. Local sick leave may be accrued without limitation; however, the District does not pay accumulated local sick leave upon termination with the District. Employees are eligible to receive payment for local sick leave (to a maximum of 80 days) upon qualified retirement from the District, dependent upon the number of years of service with the District. The liability for estimated amounts earned by District employees meeting the requirement for compensation is approximately $2.88 million at August 31, 2003. Of this amount $758,000 is recorded in the General Fund on the Fund Financial Statements and $2,125,056 is included in the non-current liabilities on the Government-Wide Statements of Net Assets. The portion in the General Fund is due and payable from current financial resources.
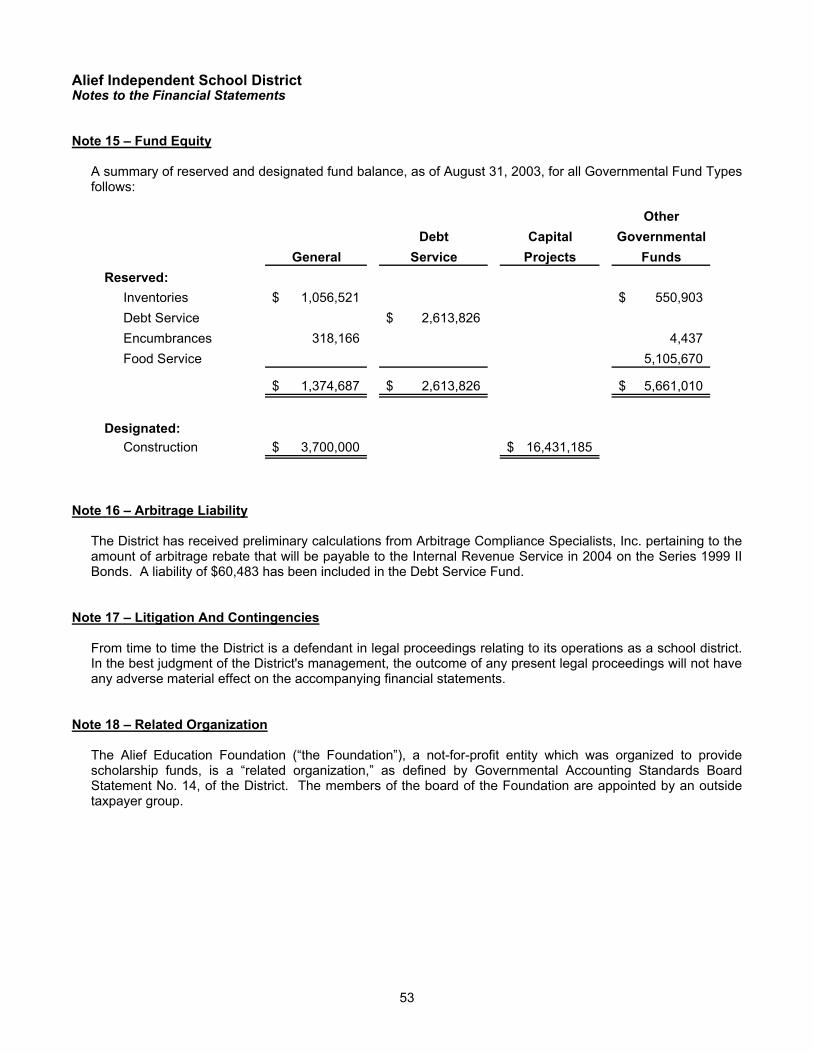
53
Alief Independent School District Notes to the Financial Statements Note 15 – Fund Equity
A summary of reserved and designated fund balance, as of August 31, 2003, for all Governmental Fund Types follows:
Note 16 – Arbitrage Liability
The District has received preliminary calculations from Arbitrage Compliance Specialists, Inc. pertaining to the amount of arbitrage rebate that will be payable to the Internal Revenue Service in 2004 on the Series 1999 II Bonds. A liability of $60,483 has been included in the Debt Service Fund.
Note 17 – Litigation And Contingencies
From time to time the District is a defendant in legal proceedings relating to its operations as a school district. In the best judgment of the District's management, the outcome of any present legal proceedings will not have any adverse material effect on the accompanying financial statements.
Note 18 – Related Organization
The Alief Education Foundation (“the Foundation”), a not-for-profit entity which was organized to provide scholarship funds, is a “related organization,” as defined by Governmental Accounting Standards Board Statement No. 14, of the District. The members of the board of the Foundation are appointed by an outside taxpayer group.
OtherDebt Capital Governmental
General Service Projects FundsReserved:
Inventories 1,056,521$ 550,903$ Debt Service 2,613,826$ Encumbrances 318,166 4,437 Food Service 5,105,670
1,374,687$ 2,613,826$ 5,661,010$
Designated:Construction 3,700,000$ 16,431,185$
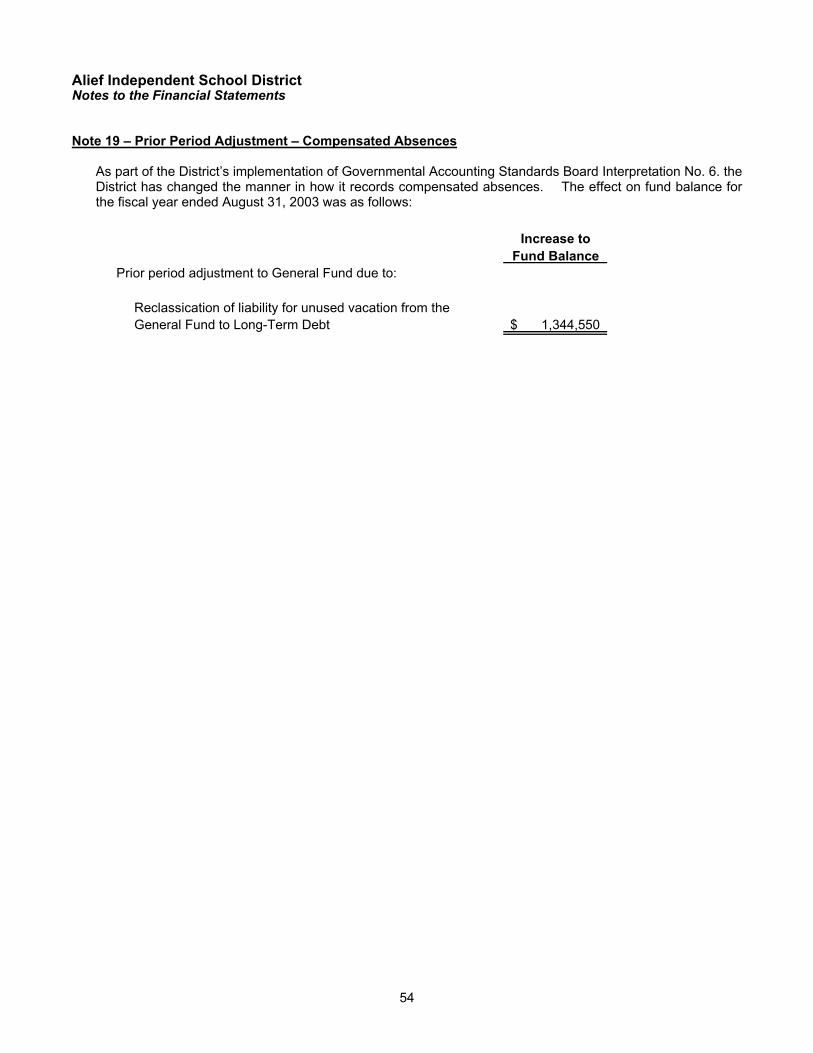
54
Alief Independent School District Notes to the Financial Statements Note 19 – Prior Period Adjustment – Compensated Absences
As part of the District’s implementation of Governmental Accounting Standards Board Interpretation No. 6. the District has changed the manner in how it records compensated absences. The effect on fund balance for the fiscal year ended August 31, 2003 was as follows: Increase to
Fund BalancePrior period adjustment to General Fund due to:
Reclassication of liability for unused vacation from the General Fund to Long-Term Debt 1,344,550$

This page intentionally blank.

Alief
Required Supplementary Information
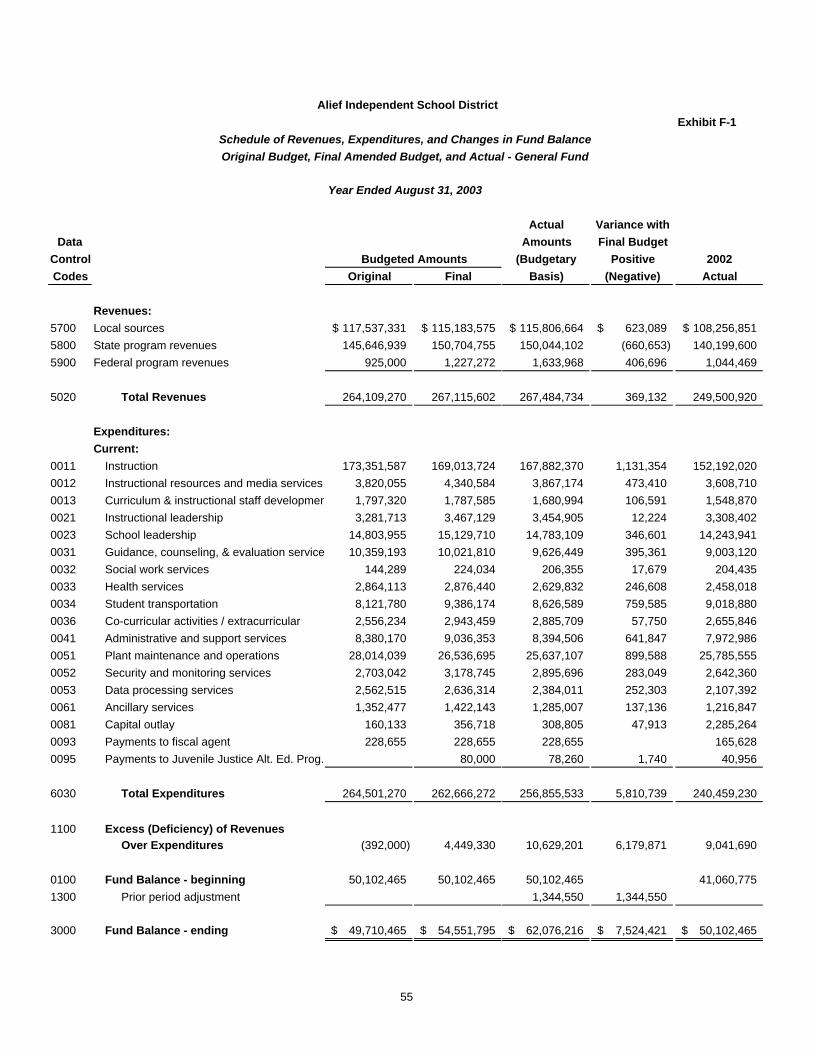
Exhibit F-1
Actual Variance withData Amounts Final Budget
Control (Budgetary Positive 2002Codes Original Final Basis) (Negative) Actual
Revenues:5700 Local sources 117,537,331$ 115,183,575$ 115,806,664$ 623,089$ 108,256,851$ 5800 State program revenues 145,646,939 150,704,755 150,044,102 (660,653) 140,199,600 5900 Federal program revenues 925,000 1,227,272 1,633,968 406,696 1,044,469
5020 Total Revenues 264,109,270 267,115,602 267,484,734 369,132 249,500,920
Expenditures:Current:
0011 Instruction 173,351,587 169,013,724 167,882,370 1,131,354 152,192,020 0012 Instructional resources and media services 3,820,055 4,340,584 3,867,174 473,410 3,608,7100013 Curriculum & instructional staff developmen 1,797,320 1,787,585 1,680,994 106,591 1,548,8700021 Instructional leadership 3,281,713 3,467,129 3,454,905 12,224 3,308,4020023 School leadership 14,803,955 15,129,710 14,783,109 346,601 14,243,9410031 Guidance, counseling, & evaluation service 10,359,193 10,021,810 9,626,449 395,361 9,003,1200032 Social work services 144,289 224,034 206,355 17,679 204,4350033 Health services 2,864,113 2,876,440 2,629,832 246,608 2,458,0180034 Student transportation 8,121,780 9,386,174 8,626,589 759,585 9,018,8800036 Co-curricular activities / extracurricular 2,556,234 2,943,459 2,885,709 57,750 2,655,8460041 Administrative and support services 8,380,170 9,036,353 8,394,506 641,847 7,972,9860051 Plant maintenance and operations 28,014,039 26,536,695 25,637,107 899,588 25,785,5550052 Security and monitoring services 2,703,042 3,178,745 2,895,696 283,049 2,642,3600053 Data processing services 2,562,515 2,636,314 2,384,011 252,303 2,107,3920061 Ancillary services 1,352,477 1,422,143 1,285,007 137,136 1,216,8470081 Capital outlay 160,133 356,718 308,805 47,913 2,285,2640093 Payments to fiscal agent 228,655 228,655 228,655 165,6280095 Payments to Juvenile Justice Alt. Ed. Prog. 80,000 78,260 1,740 40,956
6030 Total Expenditures 264,501,270 262,666,272 256,855,533 5,810,739 240,459,230
1100 Excess (Deficiency) of Revenues Over Expenditures (392,000) 4,449,330 10,629,201 6,179,871 9,041,690
0100 Fund Balance - beginning 50,102,465 50,102,465 50,102,465 41,060,7751300 Prior period adjustment 1,344,550 1,344,550
3000 Fund Balance - ending 49,710,465$ 54,551,795$ 62,076,216$ 7,524,421$ 50,102,465$
Budgeted Amounts
Alief Independent School District
Schedule of Revenues, Expenditures, and Changes in Fund BalanceOriginal Budget, Final Amended Budget, and Actual - General Fund
Year Ended August 31, 2003
55
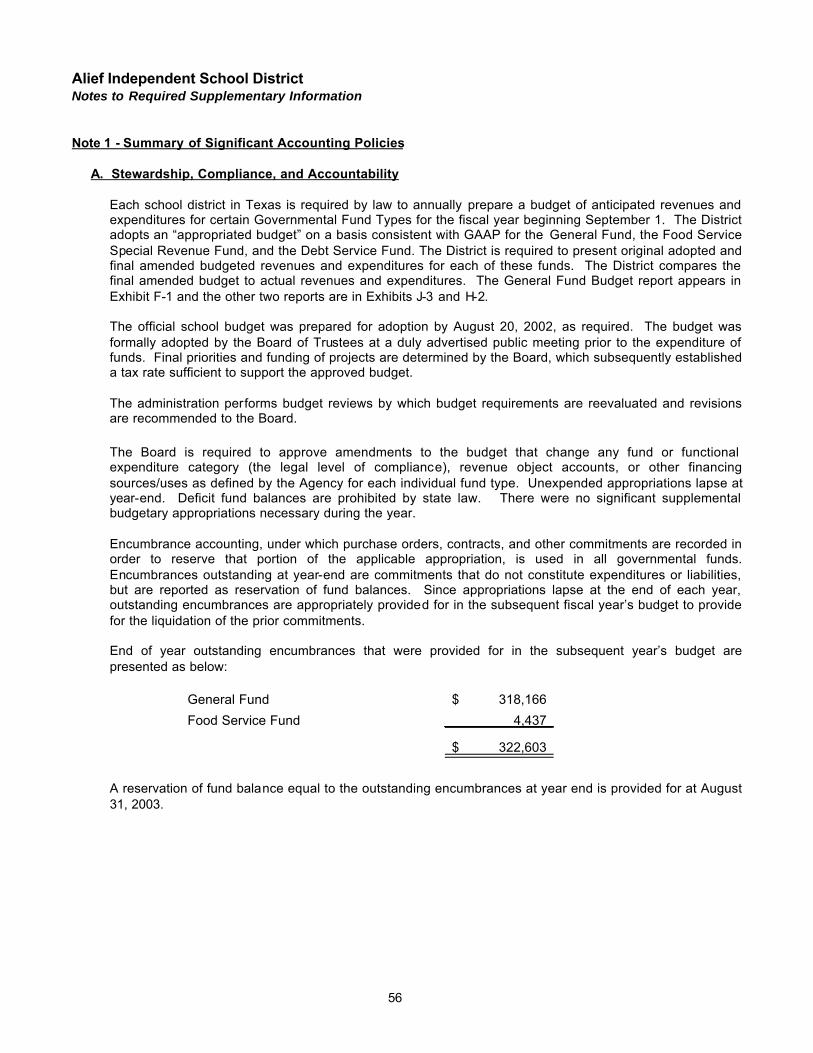
56
Alief Independent School District Notes to Required Supplementary Information Note 1 - Summary of Significant Accounting Policies A. Stewardship, Compliance, and Accountability
Each school district in Texas is required by law to annually prepare a budget of anticipated revenues and expenditures for certain Governmental Fund Types for the fiscal year beginning September 1. The District adopts an “appropriated budget” on a basis consistent with GAAP for the General Fund, the Food Service Special Revenue Fund, and the Debt Service Fund. The District is required to present original adopted and final amended budgeted revenues and expenditures for each of these funds. The District compares the final amended budget to actual revenues and expenditures. The General Fund Budget report appears in Exhibit F-1 and the other two reports are in Exhibits J-3 and H-2. The official school budget was prepared for adoption by August 20, 2002, as required. The budget was formally adopted by the Board of Trustees at a duly advertised public meeting prior to the expenditure of funds. Final priorities and funding of projects are determined by the Board, which subsequently established a tax rate sufficient to support the approved budget. The administration performs budget reviews by which budget requirements are reevaluated and revisions are recommended to the Board.
The Board is required to approve amendments to the budget that change any fund or functional expenditure category (the legal level of compliance), revenue object accounts, or other financing sources/uses as defined by the Agency for each individual fund type. Unexpended appropriations lapse at year-end. Deficit fund balances are prohibited by state law. There were no significant supplemental budgetary appropriations necessary during the year. Encumbrance accounting, under which purchase orders, contracts, and other commitments are recorded in order to reserve that portion of the applicable appropriation, is used in all governmental funds. Encumbrances outstanding at year-end are commitments that do not constitute expenditures or liabilities, but are reported as reservation of fund balances. Since appropriations lapse at the end of each year, outstanding encumbrances are appropriately provided for in the subsequent fiscal year’s budget to provide for the liquidation of the prior commitments. End of year outstanding encumbrances that were provided for in the subsequent year’s budget are presented as below:
A reservation of fund balance equal to the outstanding encumbrances at year end is provided for at August 31, 2003.
General Fund 318,166$ Food Service Fund 4,437
322,603$

This page intentionally blank.

Alief
Other Supplementary Information

This page intentionally blank.

Alief
General Fund
The General Fund is used to account for all financial transactions not properly includable in other funds. The principal sources of revenues include local property taxes, state reimbursement for professional salaries and other operating expenditures, and earnings on investments. Expenditures include all costs associated with the daily operations of the schools.
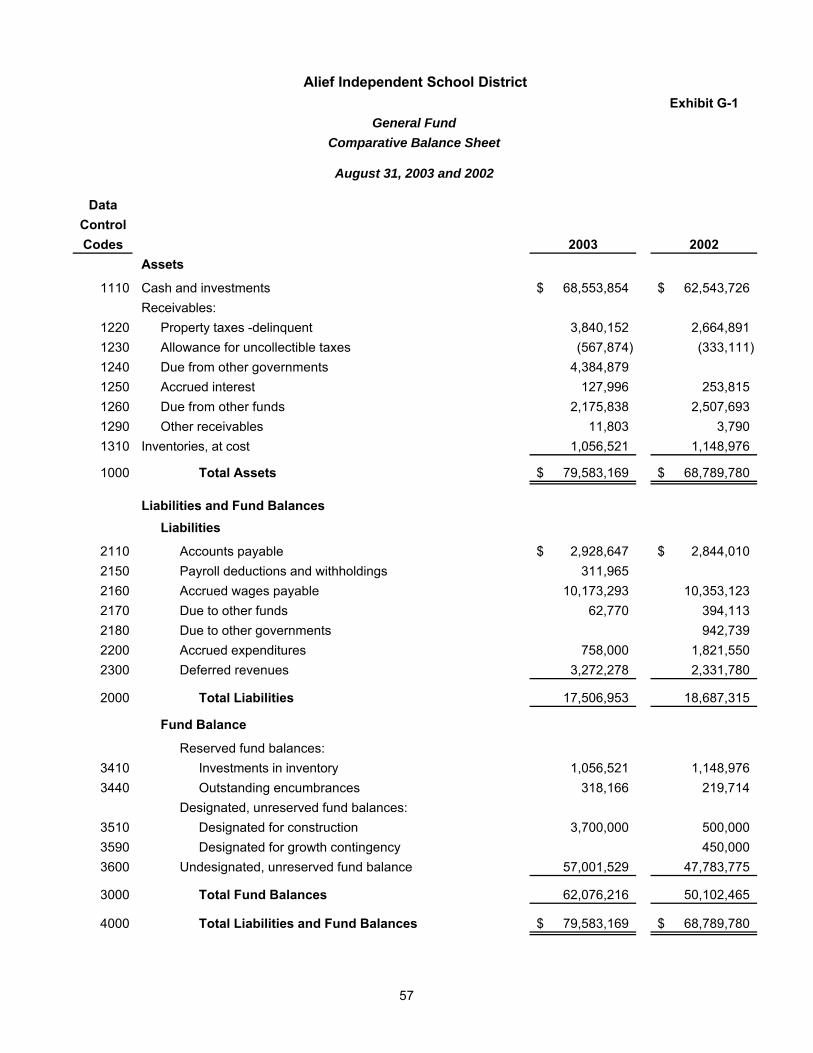
Exhibit G-1
DataControlCodes 2003 2002
1110 Cash and investments 68,553,854$ 62,543,726$ Receivables:
1220 Property taxes -delinquent 3,840,152 2,664,8911230 Allowance for uncollectible taxes (567,874) (333,111)1240 Due from other governments 4,384,8791250 Accrued interest 127,996 253,8151260 Due from other funds 2,175,838 2,507,6931290 Other receivables 11,803 3,7901310 Inventories, at cost 1,056,521 1,148,976
1000 Total Assets 79,583,169$ 68,789,780$
Liabilities
2110 Accounts payable 2,928,647$ 2,844,010$ 2150 Payroll deductions and withholdings 311,9652160 Accrued wages payable 10,173,293 10,353,1232170 Due to other funds 62,770 394,1132180 Due to other governments 942,7392200 Accrued expenditures 758,000 1,821,5502300 Deferred revenues 3,272,278 2,331,780
2000 Total Liabilities 17,506,953 18,687,315
Fund Balance
Reserved fund balances:3410 Investments in inventory 1,056,521 1,148,9763440 Outstanding encumbrances 318,166 219,714
Designated, unreserved fund balances:3510 Designated for construction 3,700,000 500,0003590 Designated for growth contingency 450,0003600 Undesignated, unreserved fund balance 57,001,529 47,783,775
3000 Total Fund Balances 62,076,216 50,102,465
4000 Total Liabilities and Fund Balances 79,583,169$ 68,789,780$
Assets
Liabilities and Fund Balances
Alief Independent School District
General FundComparative Balance Sheet
August 31, 2003 and 2002
57
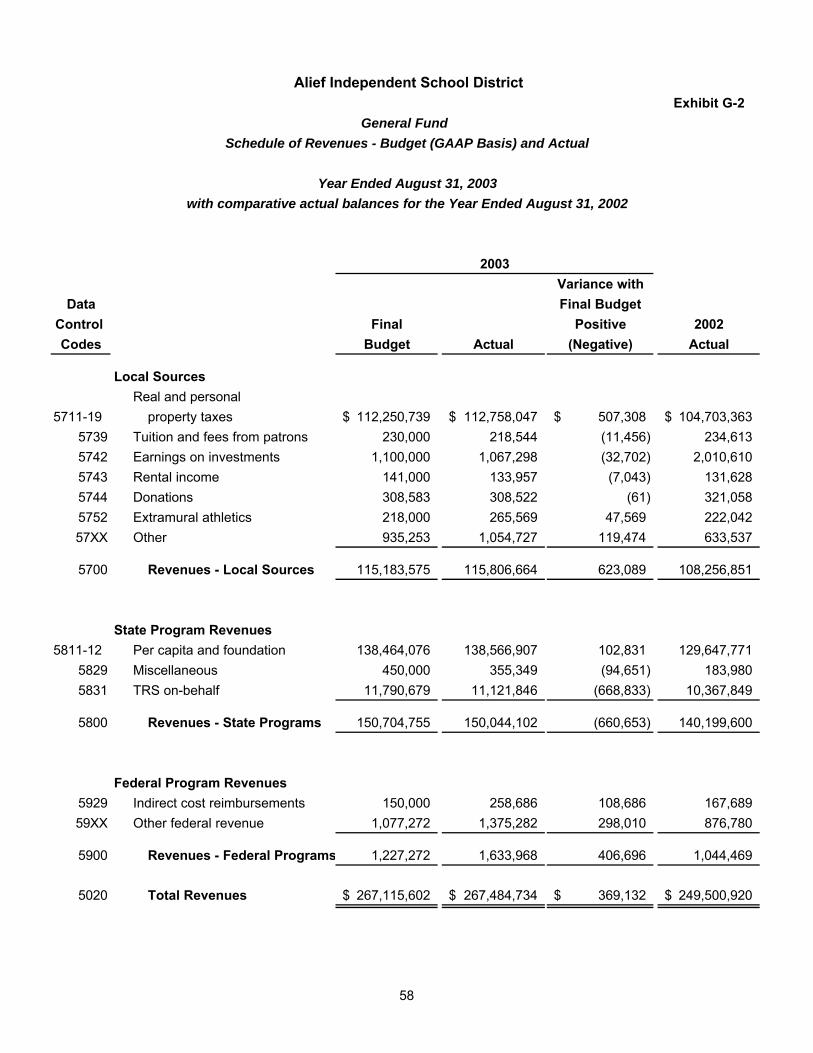
Exhibit G-2
2003Variance with
Data Final BudgetControl Final Positive 2002Codes Budget Actual (Negative) Actual
Local SourcesReal and personal
5711-19 property taxes 112,250,739$ 112,758,047$ 507,308$ 104,703,363$ 5739 Tuition and fees from patrons 230,000 218,544 (11,456) 234,6135742 Earnings on investments 1,100,000 1,067,298 (32,702) 2,010,6105743 Rental income 141,000 133,957 (7,043) 131,6285744 Donations 308,583 308,522 (61) 321,0585752 Extramural athletics 218,000 265,569 47,569 222,04257XX Other 935,253 1,054,727 119,474 633,537
5700 Revenues - Local Sources 115,183,575 115,806,664 623,089 108,256,851
State Program Revenues5811-12 Per capita and foundation 138,464,076 138,566,907 102,831 129,647,771
5829 Miscellaneous 450,000 355,349 (94,651) 183,9805831 TRS on-behalf 11,790,679 11,121,846 (668,833) 10,367,849
5800 Revenues - State Programs 150,704,755 150,044,102 (660,653) 140,199,600
Federal Program Revenues5929 Indirect cost reimbursements 150,000 258,686 108,686 167,68959XX Other federal revenue 1,077,272 1,375,282 298,010 876,780
5900 Revenues - Federal Programs 1,227,272 1,633,968 406,696 1,044,469
5020 Total Revenues 267,115,602$ 267,484,734$ 369,132$ 249,500,920$
with comparative actual balances for the Year Ended August 31, 2002
Alief Independent School District
General FundSchedule of Revenues - Budget (GAAP Basis) and Actual
Year Ended August 31, 2003
58
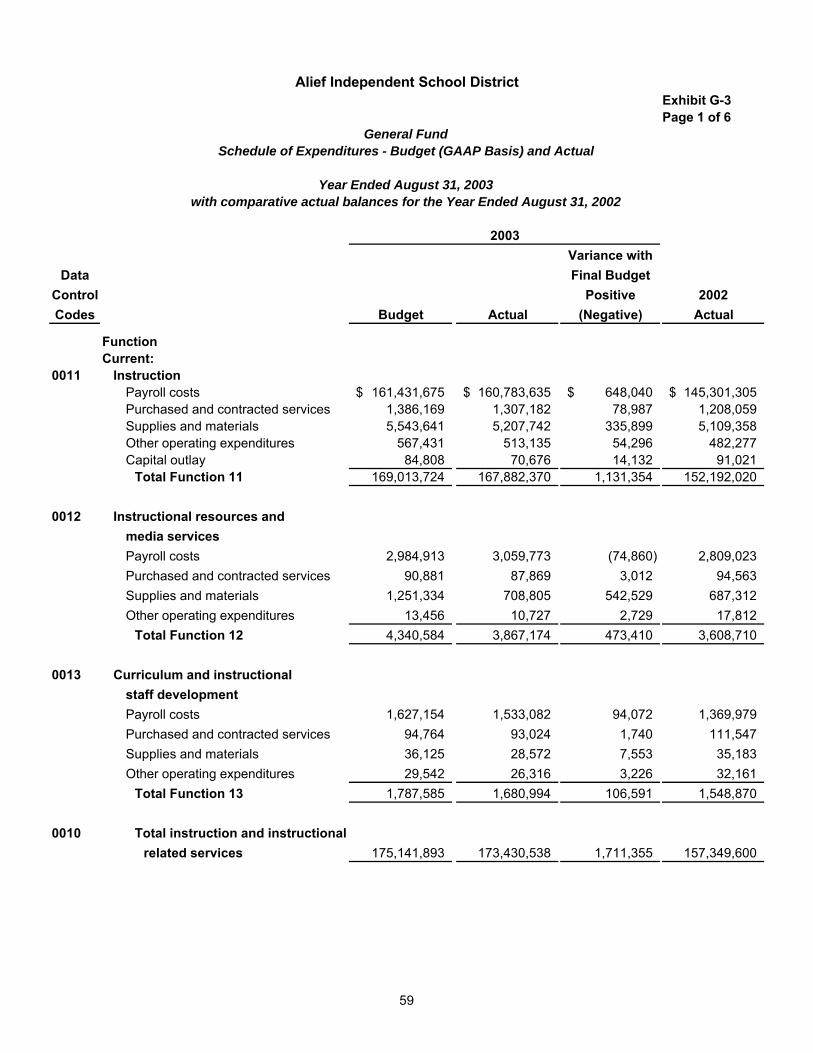
Exhibit G-3Page 1 of 6
2003Variance with
Data Final BudgetControl Positive 2002Codes Budget Actual (Negative) Actual
FunctionCurrent:
0011 InstructionPayroll costs 161,431,675$ 160,783,635$ 648,040$ 145,301,305$ Purchased and contracted services 1,386,169 1,307,182 78,987 1,208,059Supplies and materials 5,543,641 5,207,742 335,899 5,109,358Other operating expenditures 567,431 513,135 54,296 482,277Capital outlay 84,808 70,676 14,132 91,021
Total Function 11 169,013,724 167,882,370 1,131,354 152,192,020
0012 Instructional resources andmedia servicesPayroll costs 2,984,913 3,059,773 (74,860) 2,809,023Purchased and contracted services 90,881 87,869 3,012 94,563Supplies and materials 1,251,334 708,805 542,529 687,312Other operating expenditures 13,456 10,727 2,729 17,812
Total Function 12 4,340,584 3,867,174 473,410 3,608,710
0013 Curriculum and instructionalstaff development Payroll costs 1,627,154 1,533,082 94,072 1,369,979Purchased and contracted services 94,764 93,024 1,740 111,547Supplies and materials 36,125 28,572 7,553 35,183Other operating expenditures 29,542 26,316 3,226 32,161
Total Function 13 1,787,585 1,680,994 106,591 1,548,870
0010 Total instruction and instructionalrelated services 175,141,893 173,430,538 1,711,355 157,349,600
Alief Independent School District
General FundSchedule of Expenditures - Budget (GAAP Basis) and Actual
Year Ended August 31, 2003with comparative actual balances for the Year Ended August 31, 2002
59

Exhibit G-3Page 2 of 6
2003Variance with
Data Final BudgetControl Positive 2002Codes Budget Actual (Negative) Actual
FunctionCurrent (continued):
0021 Instructional leadershipPayroll costs 2,820,785 2,953,545 (132,760) 2,694,309Purchased and contracted services 215,826 164,719 51,107 101,881Supplies and materials 273,600 206,946 66,654 391,968Other operating expenditures 156,918 129,695 27,223 120,244
Total Function 21 3,467,129 3,454,905 12,224 3,308,402
0023 School leadershipPayroll costs 14,794,534 14,465,433 329,101 14,009,011Purchased and contracted services 85,137 93,187 (8,050) 5,913Supplies and materials 163,707 153,710 9,997 146,900Other operating expenditures 81,132 65,579 15,553 76,622Capital outlay 5,200 5,200 5,495
Total Function 23 15,129,710 14,783,109 346,601 14,243,941
0020 Total instructional and school leadership 18,596,839 18,238,014 358,825 17,552,343
0031 Guidance, counseling, andevaluation servicesPayroll costs 9,079,679 8,719,552 360,127 8,147,460Purchased and contracted services 687,317 671,187 16,130 672,177Supplies and materials 226,490 217,224 9,266 163,005Other operating expenditures 28,324 18,486 9,838 20,478
Total Function 31 10,021,810 9,626,449 395,361 9,003,120
Year Ended August 31, 2003
Alief Independent School District
General FundSchedule of Expenditures - Budget (GAAP Basis) and Actual
with comparative actual balances for the Year Ended August 31, 2002
60
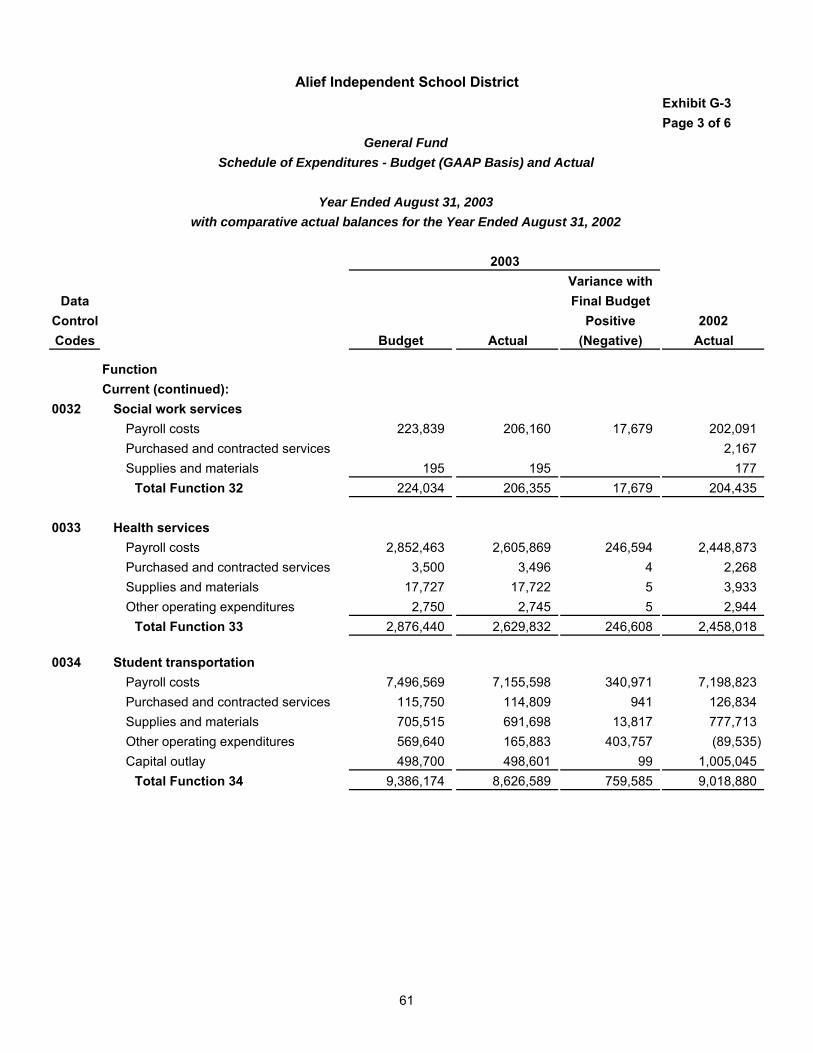
Exhibit G-3Page 3 of 6
2003Variance with
Data Final BudgetControl Positive 2002Codes Budget Actual (Negative) Actual
FunctionCurrent (continued):
0032 Social work servicesPayroll costs 223,839 206,160 17,679 202,091Purchased and contracted services 2,167Supplies and materials 195 195 177
Total Function 32 224,034 206,355 17,679 204,435
0033 Health servicesPayroll costs 2,852,463 2,605,869 246,594 2,448,873Purchased and contracted services 3,500 3,496 4 2,268Supplies and materials 17,727 17,722 5 3,933Other operating expenditures 2,750 2,745 5 2,944
Total Function 33 2,876,440 2,629,832 246,608 2,458,018
0034 Student transportationPayroll costs 7,496,569 7,155,598 340,971 7,198,823Purchased and contracted services 115,750 114,809 941 126,834Supplies and materials 705,515 691,698 13,817 777,713Other operating expenditures 569,640 165,883 403,757 (89,535)Capital outlay 498,700 498,601 99 1,005,045
Total Function 34 9,386,174 8,626,589 759,585 9,018,880
Year Ended August 31, 2003
Alief Independent School District
General FundSchedule of Expenditures - Budget (GAAP Basis) and Actual
with comparative actual balances for the Year Ended August 31, 2002
61
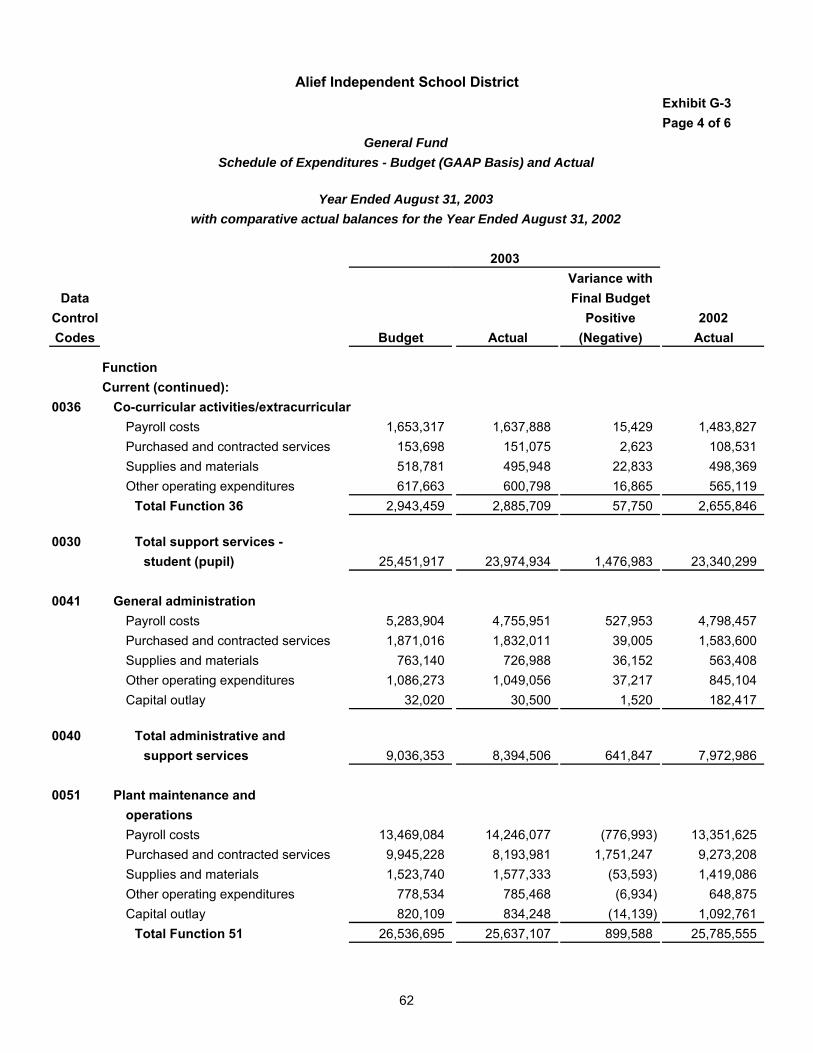
Exhibit G-3Page 4 of 6
2003Variance with
Data Final BudgetControl Positive 2002Codes Budget Actual (Negative) Actual
FunctionCurrent (continued):
0036 Co-curricular activities/extracurricularPayroll costs 1,653,317 1,637,888 15,429 1,483,827Purchased and contracted services 153,698 151,075 2,623 108,531Supplies and materials 518,781 495,948 22,833 498,369Other operating expenditures 617,663 600,798 16,865 565,119
Total Function 36 2,943,459 2,885,709 57,750 2,655,846
0030 Total support services - student (pupil) 25,451,917 23,974,934 1,476,983 23,340,299
0041 General administrationPayroll costs 5,283,904 4,755,951 527,953 4,798,457Purchased and contracted services 1,871,016 1,832,011 39,005 1,583,600Supplies and materials 763,140 726,988 36,152 563,408Other operating expenditures 1,086,273 1,049,056 37,217 845,104Capital outlay 32,020 30,500 1,520 182,417
0040 Total administrative andsupport services 9,036,353 8,394,506 641,847 7,972,986
0051 Plant maintenance andoperationsPayroll costs 13,469,084 14,246,077 (776,993) 13,351,625Purchased and contracted services 9,945,228 8,193,981 1,751,247 9,273,208Supplies and materials 1,523,740 1,577,333 (53,593) 1,419,086Other operating expenditures 778,534 785,468 (6,934) 648,875Capital outlay 820,109 834,248 (14,139) 1,092,761
Total Function 51 26,536,695 25,637,107 899,588 25,785,555
Year Ended August 31, 2003with comparative actual balances for the Year Ended August 31, 2002
Alief Independent School District
General FundSchedule of Expenditures - Budget (GAAP Basis) and Actual
62
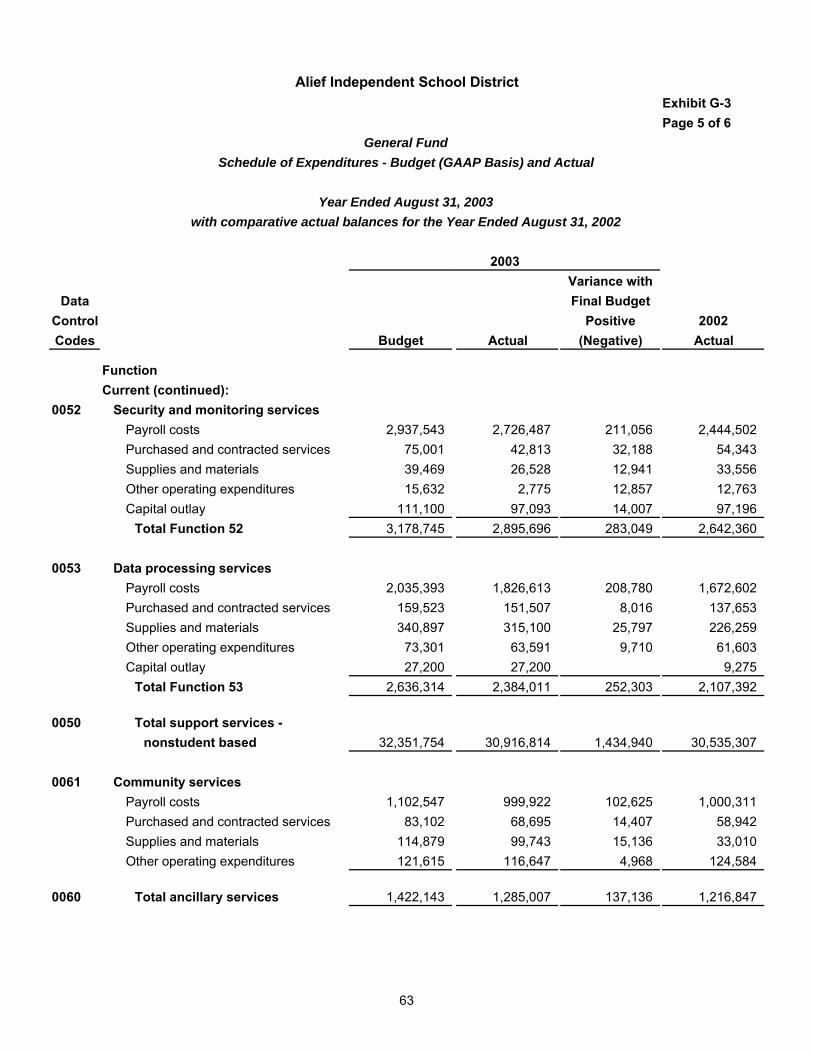
Exhibit G-3Page 5 of 6
2003Variance with
Data Final BudgetControl Positive 2002Codes Budget Actual (Negative) Actual
FunctionCurrent (continued):
0052 Security and monitoring servicesPayroll costs 2,937,543 2,726,487 211,056 2,444,502Purchased and contracted services 75,001 42,813 32,188 54,343Supplies and materials 39,469 26,528 12,941 33,556Other operating expenditures 15,632 2,775 12,857 12,763Capital outlay 111,100 97,093 14,007 97,196
Total Function 52 3,178,745 2,895,696 283,049 2,642,360
0053 Data processing servicesPayroll costs 2,035,393 1,826,613 208,780 1,672,602Purchased and contracted services 159,523 151,507 8,016 137,653Supplies and materials 340,897 315,100 25,797 226,259Other operating expenditures 73,301 63,591 9,710 61,603Capital outlay 27,200 27,200 9,275
Total Function 53 2,636,314 2,384,011 252,303 2,107,392
0050 Total support services -nonstudent based 32,351,754 30,916,814 1,434,940 30,535,307
0061 Community servicesPayroll costs 1,102,547 999,922 102,625 1,000,311Purchased and contracted services 83,102 68,695 14,407 58,942Supplies and materials 114,879 99,743 15,136 33,010Other operating expenditures 121,615 116,647 4,968 124,584
0060 Total ancillary services 1,422,143 1,285,007 137,136 1,216,847
Alief Independent School District
General FundSchedule of Expenditures - Budget (GAAP Basis) and Actual
Year Ended August 31, 2003with comparative actual balances for the Year Ended August 31, 2002
63
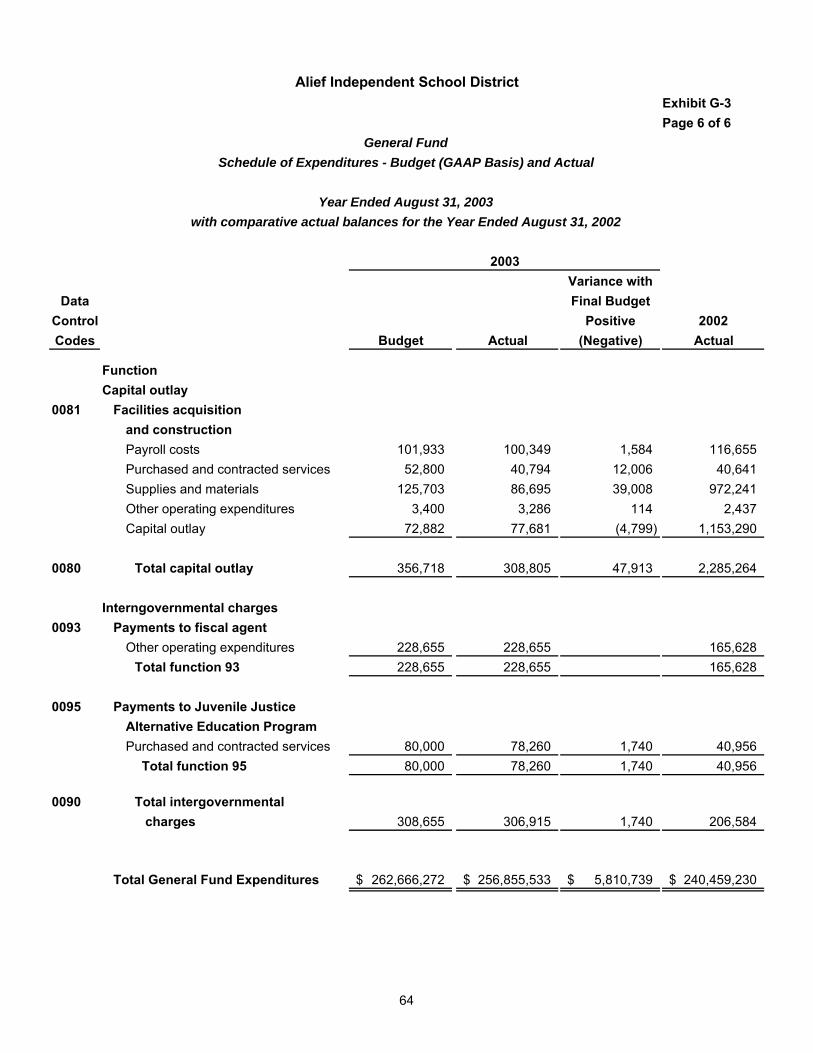
Exhibit G-3Page 6 of 6
2003Variance with
Data Final BudgetControl Positive 2002Codes Budget Actual (Negative) Actual
FunctionCapital outlay
0081 Facilities acquisitionand constructionPayroll costs 101,933 100,349 1,584 116,655Purchased and contracted services 52,800 40,794 12,006 40,641Supplies and materials 125,703 86,695 39,008 972,241Other operating expenditures 3,400 3,286 114 2,437Capital outlay 72,882 77,681 (4,799) 1,153,290
0080 Total capital outlay 356,718 308,805 47,913 2,285,264
Interngovernmental charges0093 Payments to fiscal agent
Other operating expenditures 228,655 228,655 165,628Total function 93 228,655 228,655 165,628
0095 Payments to Juvenile JusticeAlternative Education ProgramPurchased and contracted services 80,000 78,260 1,740 40,956
Total function 95 80,000 78,260 1,740 40,956
0090 Total intergovernmental charges 308,655 306,915 1,740 206,584
Total General Fund Expenditures 262,666,272$ 256,855,533$ 5,810,739$ 240,459,230$
Year Ended August 31, 2003with comparative actual balances for the Year Ended August 31, 2002
Alief Independent School District
General FundSchedule of Expenditures - Budget (GAAP Basis) and Actual
64

This page intentionally blank.

Alief
Debt Service Fund The Debt Service Fund is used to account for revenues from debt service property taxes, earnings on investments, and state funding for existing debt and instructional facilities allotments which are used for the payment of principal and interest on the District’s bonded indebtedness.
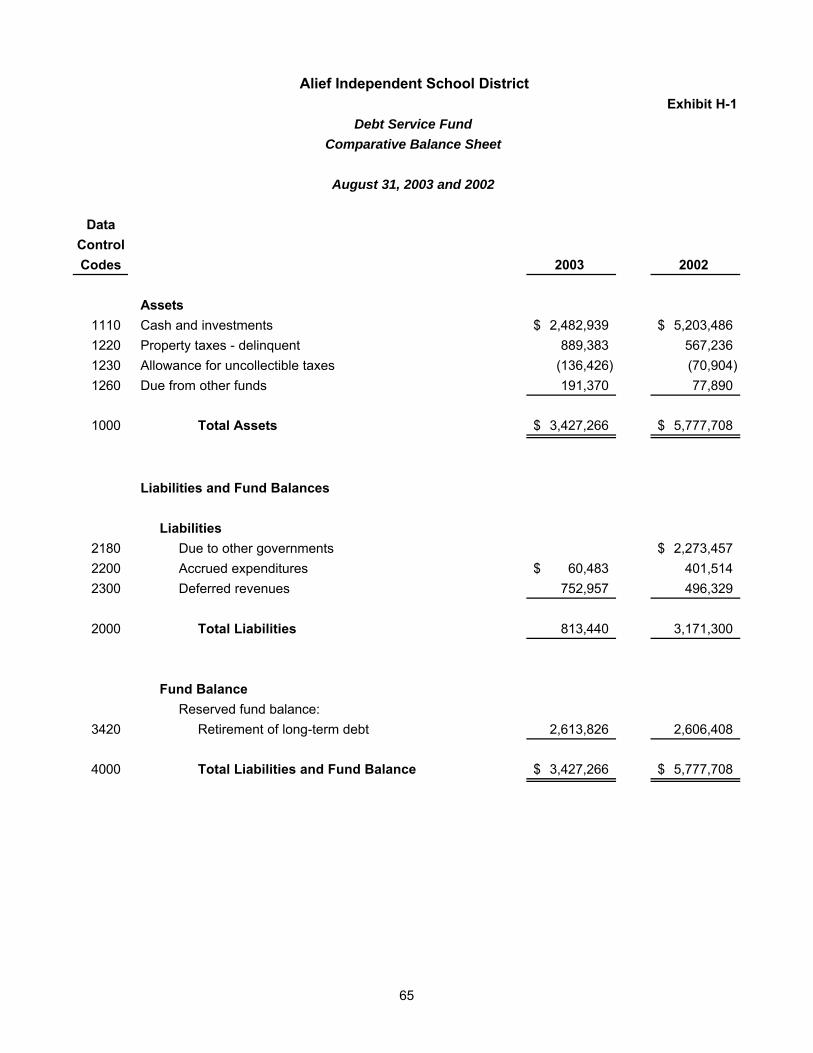
Exhibit H-1
DataControlCodes 2003 2002
1110 Cash and investments 2,482,939$ 5,203,486$ 1220 Property taxes - delinquent 889,383 567,2361230 Allowance for uncollectible taxes (136,426) (70,904)1260 Due from other funds 191,370 77,890
1000 Total Assets 3,427,266$ 5,777,708$
Liabilities2180 Due to other governments 2,273,457$ 2200 Accrued expenditures 60,483$ 401,514 2300 Deferred revenues 752,957 496,329
2000 Total Liabilities 813,440 3,171,300
Fund BalanceReserved fund balance:
3420 Retirement of long-term debt 2,613,826 2,606,408
4000 Total Liabilities and Fund Balance 3,427,266$ 5,777,708$
Assets
Liabilities and Fund Balances
Alief Independent School District
Debt Service FundComparative Balance Sheet
August 31, 2003 and 2002
65
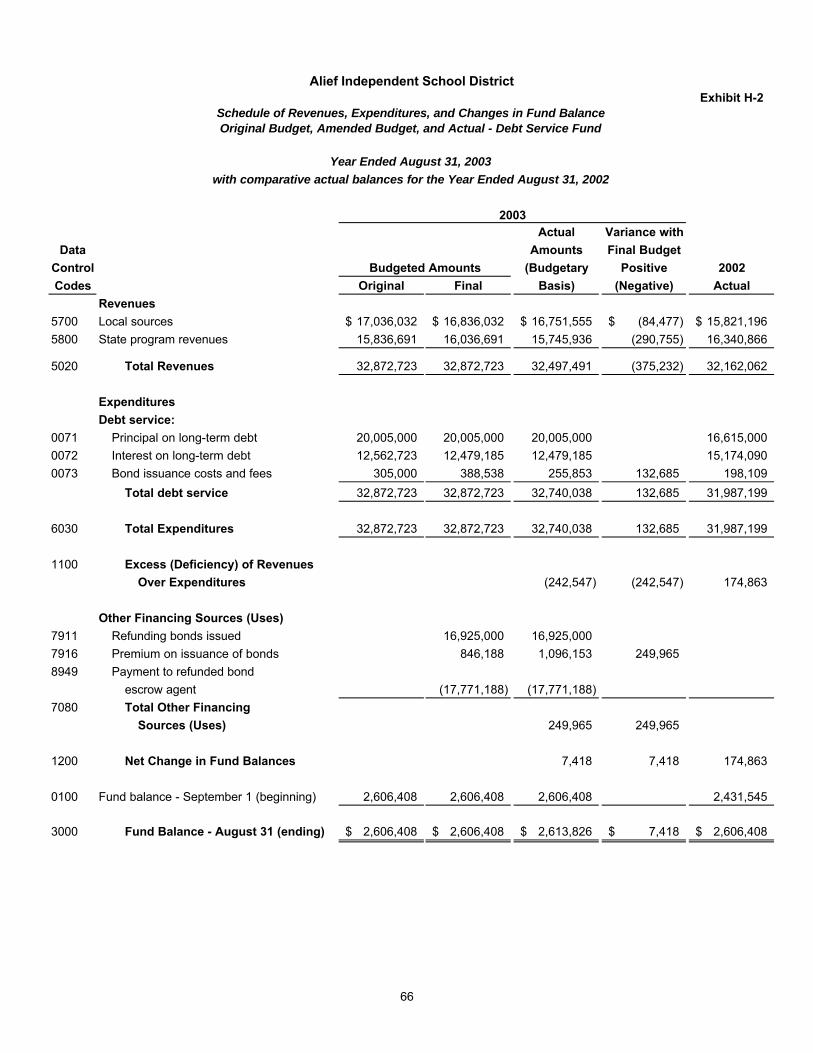
Exhibit H-2
Actual Variance withData Amounts Final Budget
Control (Budgetary Positive 2002Codes Original Final Basis) (Negative) Actual
Revenues5700 Local sources 17,036,032$ 16,836,032$ 16,751,555$ (84,477)$ 15,821,196$ 5800 State program revenues 15,836,691 16,036,691 15,745,936 (290,755) 16,340,866
5020 Total Revenues 32,872,723 32,872,723 32,497,491 (375,232) 32,162,062
Expenditures Debt service:
0071 Principal on long-term debt 20,005,000 20,005,000 20,005,000 16,615,000 0072 Interest on long-term debt 12,562,723 12,479,185 12,479,185 15,174,090 0073 Bond issuance costs and fees 305,000 388,538 255,853 132,685 198,109
Total debt service 32,872,723 32,872,723 32,740,038 132,685 31,987,199
6030 Total Expenditures 32,872,723 32,872,723 32,740,038 132,685 31,987,199
1100 Excess (Deficiency) of RevenuesOver Expenditures (242,547) (242,547) 174,863
Other Financing Sources (Uses)7911 Refunding bonds issued 16,925,000 16,925,0007916 Premium on issuance of bonds 846,188 1,096,153 249,965 8949 Payment to refunded bond
escrow agent (17,771,188) (17,771,188)7080 Total Other Financing
Sources (Uses) 249,965 249,965
1200 Net Change in Fund Balances 7,418 7,418 174,863
0100 Fund balance - September 1 (beginning) 2,606,408 2,606,408 2,606,408 2,431,545
3000 Fund Balance - August 31 (ending) 2,606,408$ 2,606,408$ 2,613,826$ 7,418$ 2,606,408$
Budgeted Amounts
Alief Independent School District
Schedule of Revenues, Expenditures, and Changes in Fund BalanceOriginal Budget, Amended Budget, and Actual - Debt Service Fund
Year Ended August 31, 2003with comparative actual balances for the Year Ended August 31, 2002
2003
66

This page intentionally blank.

Alief
Capital Projects Fund The Capital Projects Fund is used to account for proceeds from the sale of general obligation bonds and the expenditures of these funds for the construction and equipping of new school facilities, to purchase school sites, and renovation or repair of existing facilities. The Capital Projects Fund is a major fund for financial reporting purposes but is composed of several sub-funds.
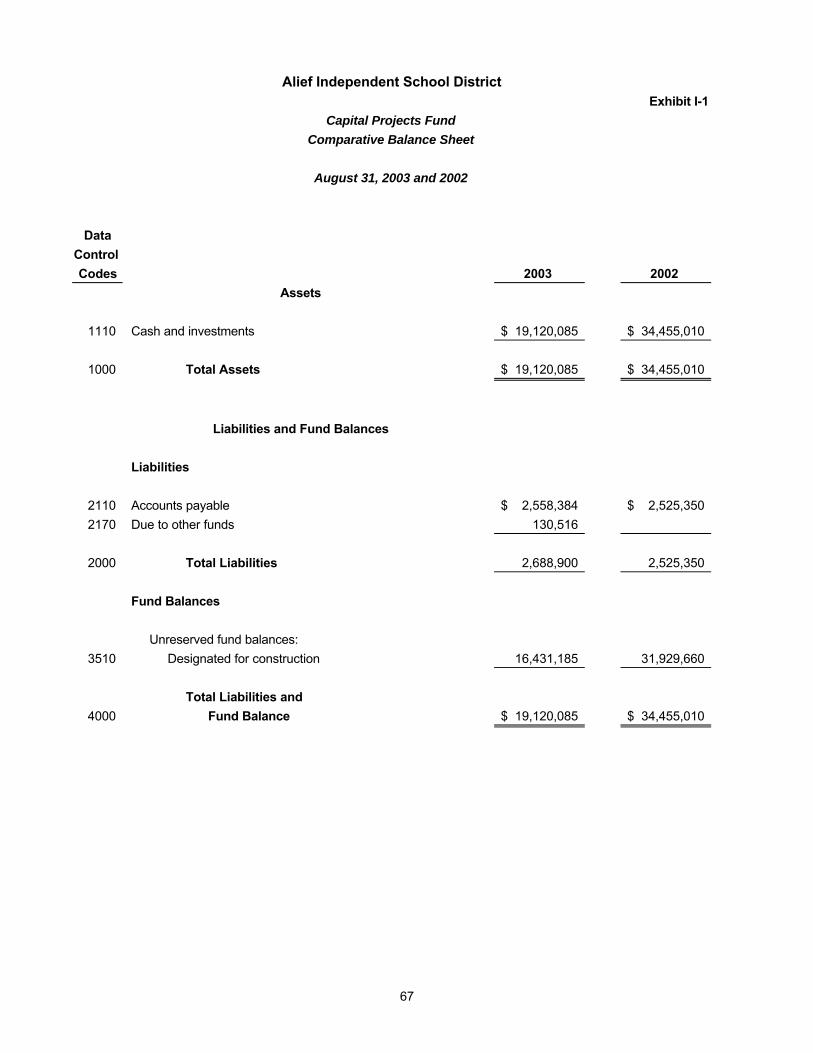
Exhibit I-1
DataControl Codes 2003 2002
1110 Cash and investments 19,120,085$ 34,455,010$
1000 Total Assets 19,120,085$ 34,455,010$
Liabilities
2110 Accounts payable 2,558,384$ 2,525,350$ 2170 Due to other funds 130,516
2000 Total Liabilities 2,688,900 2,525,350
Fund Balances
Unreserved fund balances:3510 Designated for construction 16,431,185 31,929,660
Total Liabilities and4000 Fund Balance 19,120,085$ 34,455,010$
Liabilities and Fund Balances
Assets
Capital Projects Fund
Alief Independent School District
Comparative Balance Sheet
August 31, 2003 and 2002
67
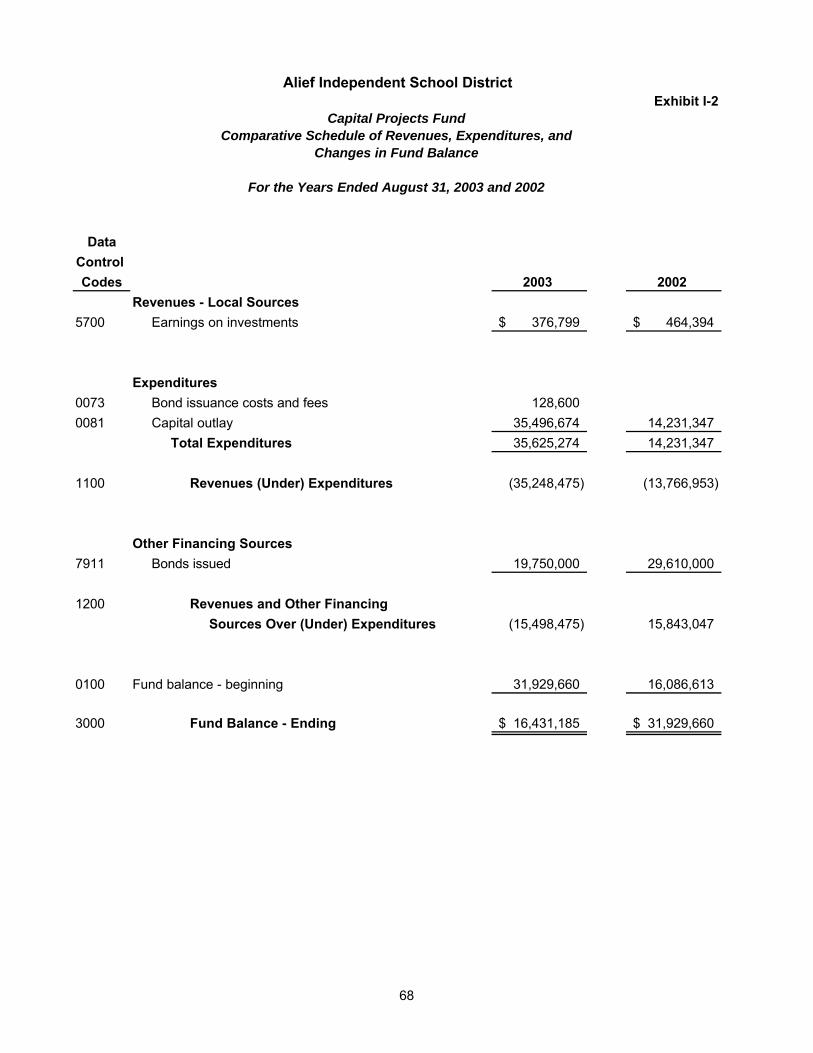
Exhibit I-2
DataControl Codes 2003 2002
Revenues - Local Sources5700 investmentsEarnings on investments 376,799$ 464,394$
Expenditures0073 Bond issuance costs and fees 128,6000081 installationCapital outlay 35,496,674 14,231,347
Total Expenditures 35,625,274 14,231,347
1100 Revenues (Under) Expenditures (35,248,475) (13,766,953)
Other Financing Sources7911 Bonds issued 19,750,000 29,610,000
1200 Revenues and Other Financing Sources Over (Under) Expenditures (15,498,475) 15,843,047
0100 Fund balance - beginning 31,929,660 16,086,613
3000 Fund Balance - Ending 16,431,185$ 31,929,660$
For the Years Ended August 31, 2003 and 2002
Capital Projects Fund
Alief Independent School District
Comparative Schedule of Revenues, Expenditures, andChanges in Fund Balance
68

This page intentionally blank.
Alief
Non-Major Governmental Funds
In this report, the non-major governmental funds are the Special Revenue Funds. These funds are used to account for specific revenue sources which are legally restricted to expenditures for specified purposes. Emergency Immigrant Education Program (ESEA) Title VII – Funds are used to provide high-quality instruction to immigrant children and youth and to help with their transition into American society in order for them to meet the challenging State performance standards expected of all children and youth. Safe and Drug Free Schools and Communities Program (ESEA) Title IV, Part A - Funds are used to support comprehensive (EE-12) drug use prevention and violence prevention programs that foster a safe and drug-free environment and support academic achievement. Improving Basic Programs Operated by Local Education Agencies (ESEA) Title I –Funds are used to provide supplemental resources to help schools with high concentrations of students from low-income families to provide high-quality education which will enable all children to meet the state student performance standards. Individuals with Disabilities Education Act, Part B IDEA-B Formula – Funds are used to ensure that all students with disabilities have available a free, appropriate public education which includes special education and related services to meet their unique needs, ensure that the rights of students with disabilities and their parents are protected, assist states and localities to provide for the education of all students with disabilities, and assess and ensure the effectiveness of efforts to educate those students. Individuals with Disabilities Education Act, Part B IDEA-B Preschool – In addition to the goals for the Individuals with Disabilities Education Act IDEA-B Formula these funds also act as a means to supplement and increase services beyond the level of state and local funds expended for preschool student with disabilities ages three through five.
Innovative Education Program Strategies (ESEA) Title VI, Part A – Funds are used to support educational reform programs, school improvement programs, and educational programs to improve school, student, and teacher performance. Food Service – Funds are used to account for allowable expenditures, as determined under the National School Lunch Act, for the operation and improvement of the Child Nutrition Programs. Vocational Education – Funds are used to target career and technology education programs that serve the highest concentrations of individuals who are members of special populations. Teacher and Principal Training and Recruitment Fund (ESEA) Title II, Part A - Funds are used to increase student academic achievement through improving teacher and principal quality and increasing the number of highly qualified teachers in classrooms and highly qualified principals and assistant principals in schools. Comprehensive School Reform – Funds are intended to foster coherent school wide improvements that cover all aspects of a school’s operations through curriculum changes, sustained professional development, and enhanced involvement of parents, based on a careful assessment of campus needs. Effective, comprehensive school reform initiatives are based on reliable research and effective practices that result in improved student performance.
Alief
Non-Major Governmental Funds (continued)
Enhancing Education Through Technology (ESEA) Title II, Part D – Funds are used to improve student academic achievement through the use of technology by helping students become technologically literate and encouraging the effective integration of technology resources and systems with professional development and curriculum development to promote research-based instructional methods that can be widely replicated.
English Language Acquisition, Language Enhancement, and Academic Achievement for Limited English Proficient (LEP) and Immigrant Students (ESEA) Title III – Funds are used to help ensure that children who are limited English proficient, including immigrant children and youth, attain English proficiency, develop high levels of academic attainment in English, and meet the same challenging State academic content and student academic achievement standards as all children are expected to meet. 21st Century Community Learning Centers Program – Funds are used to provide significant expanded learning opportunities for children and youth outside of regular school hours and may include evening, Saturday, or summer sessions. The program supports learning centers that provide safety and substance abuse avoidance programs, recreational, musical, and artistic activities, and opportunities to use advanced technology. Title V, Part A, Innovative Programs - This fund classification is to be used to account, on a project basis, for funds granted to implement or expand innovative assistance programs to improve student, teacher, and school performance through a variety of local reform and improvement activities. Middle School Safe School Coordinators – Funds are used to recruit, hire, and train two full-time safe school coordinators to oversee implementation of drug prevention and school safety programs for all students in grades five through eight. Partnership for Quality Education - The purpose of this five-year grant is to restructure the education of teachers. School districts will encourage and facilitate interactions between their faculties and administrators and universities to help redesign more relevant teacher education. Case Partnership – Funds are used to increase the number of children served in high-quality after-school programs who are between the ages of 5 and 12 and whose parents or guardians are employed or enrolled in training or education programs. School to Career – A grant issued through the Gulf Coast Education That Works which received the funds from the Texas Workforce Commission. Funds are to be used for activities which relate directly to developing and increasing participation in School-to-Career activities such as providing interested, participating students with school-based, work -based, and connecting activities. Texas Mentor Schools - Funds are used to support a Statewide Initiative for Middle Schools and Mentors. The campuses selected must be able to show success in programs implemented and agree to be a mentor to other Texas middle schools. Texas After-School Initiative for Middle Schools – Funds support implementation of quality after-school programs that serve middle school aged students who are at risk of academic failure and/or at risk of committing juvenile offenses. All programs must incorporate the three required components: an academics-based curriculum linked to the Texas Essential Knowledge and Skills, a character/citizenship education component, and a plan for parent and/or mentor involvement.
Alief
Non-Major Governmental Funds (continued)
Visually Impaired – Funds are used to support the educational needs of students who have visual impairments. Early Childhood Limited English Proficient (LEP) Summer Program - Funds are used to account, on a project basis, for funds for summer school programs for LEP students only if a bilingual program is part of the standard curriculum. Texas Successful School Program – Funds are used for general student purposes except athletics. Awards are given to individual campuses and are based on student achievement and student achievement gains. Pregnancy Education and Parenting Program – Funds are used to provide counseling, job readiness, child care, transportation of student and student’s children, instruction in skills and knowledge for parenting, and assistance in obtaining services from government agencies or community service organization for all parenting students. Advanced Placement/International Baccalaureate Incentive Grant – Funds are intended to reward students, teachers, and campuses for high achievement . Campuses are awarded $100 for each student who scored three or above on an AP examination or four or above on an IB examination.
Optional Extended Year Program – Funds are used to immediately reduce and ultimately eliminate student retention in grades K-8 by providing additional accelerated instruction for students who otherwise would be retained.
Accelerated Reading Instruction Program– Funds flow from the Texas Education Agency to provide support for professional development of teachers and the implementation of scientific, research-based reading programs to support students in their reading development in grades K-3. Accelerated Reading Instruction programs are provided for students not showing adequate progress in reading development and who are at-risk for reading difficulties, including dyslexia. Ninth Grade Success Initiative – Funds flow from the Texas Education Agency to increase the graduation rate by reducing the disproportionately large percentage of students who are retained in the ninth grade and reducing the similarly large percentage of students who drop out of school at the ninth grade. Technology Allotment – Funds are used to provide a minimal technology infrastructure in the District.
TIF Grants – Funds are expended to purchase distance learning equipment so that students and teachers will have access to technology and information resources, information sharing, training, and curriculum. TRS Supplement –The purpose of this fund is to account for revenues that are legally restricted to the TRS supplemental compensation. Texas Reading Academy – The purpose of the Texas Reading Initiative is to assist schools as they strive to meet the governor’s challenge of having all children reading at or above grade level by the end of third grade and remaining on or above grade level throughout the remainder of their school career.
Alief
Non-Major Governmental Funds (continued) Tobacco Compliance Grant- Funds are used for enforcement and compliance activities as they relate to Texas Statewide Tobacco Education and Prevention. Read to Succeed - The purpose of this fund is to help provide educational materials for the school library. Funds are generated by the sale of specialty license plates. The community members who purchase these plates designated the school library to be the benefactor. Alief Education Foundation – Funds are used to encourage, facilitate, recognize, and reward innovative and creative instructional approaches on the campus level. Miscellaneous Local Grants Including: Fund 482 includes: Seaspace Teacher Grant – Awarded to Holub MS for project “Getting S.M.A.R.T. about the Ocean.” Jordan Fundamentals Grant – Project XPOSE at Killough MS. Funds were used to expose the children to diverse careers. This was achieved by exploring and investigating professions, observing professional demonstrations participating in a job search and finally performing their chosen profession. Fund 483 includes: Exxon Mobile “Smile” Program – Funds are used to attack freshman Algebra I and Integrated Physics and Chemistry, traditionally difficult courses. This program will integrate the two courses and enable the students to take data they collect in science class to their math class to be analyzed. Exxon Mobile “Aims” Program – Alief Integrated Math and Science Program is Alief’s first magnet school program. It is for gifted and talented students in grades 2 – 5 and will emphasize Math and Science. Wal-Mart – Awarded to Holub MS for Literacy. Wal-Mart – Awarded to Holub MS for miscellaneous student needs. Wal-Mart – Awarded to Holub MS for the purchase of video equipment. Mayor’s After School Achievement Program - Funds support both academic tutorials and enrichment activities for student during after-school hours. Houston A+ - Funds are used to promote a concept of “Whole School Reform,” highlighting areas of personalizing the learning environment, developing school communities, and providing professional development. Shell Oil & Rice – Funds were awarded to allow Alief ISD to partner with Rice University to provide extensive staff development. Staff will be collecting baseline mathematical information that will be used to measures progress toward the long-term goals during the following school years. Alief anticipates that the percentage of students demonstrating mastery and successfully completing pre-advanced placement and advanced placement courses will rise considerably as students in grades four through eight reach high school.

Alief
Non-Major Governmental Funds (continued) Spark Park – Funds are contributed by the City of Houston, Chambers Elementary, and the District to build a park/playground for students to use during the day and for the community to enjoy on the evenings and weekends.
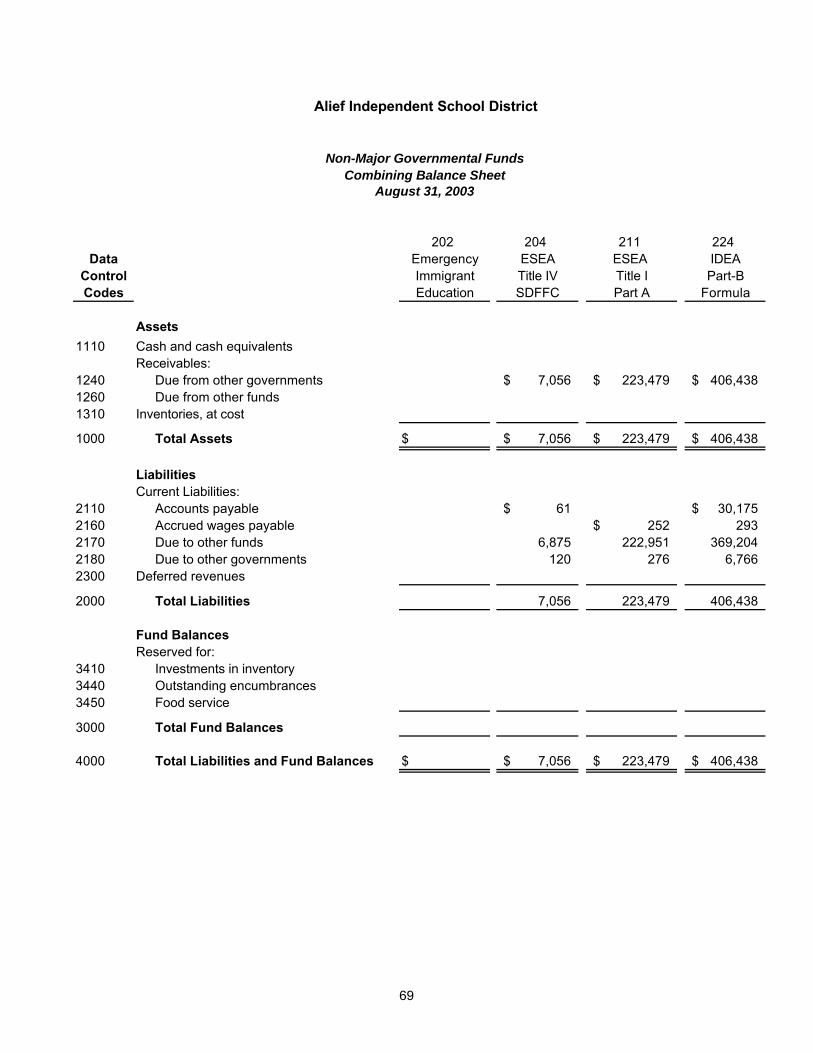
202 204 211 224Data Emergency ESEA ESEA IDEA
Control Immigrant Title IV Title I Part-BCodes Education SDFFC Part A Formula
1110 Cash and cash equivalentsReceivables:
1240 Due from other governments 7,056$ 223,479$ 406,438$ 1260 Due from other funds1310 Inventories, at cost
1000 Total Assets $ 7,056$ 223,479$ 406,438$
Current Liabilities:2110 Accounts payable 61$ 30,175$ 2160 Accrued wages payable 252$ 2932170 Due to other funds 6,875 222,951 369,204 2180 Due to other governments 120 276 6,7662300 Deferred revenues
2000 Total Liabilities 7,056 223,479 406,438
Fund BalancesReserved for:
3410 Investments in inventory3440 Outstanding encumbrances3450 Food service
3000 Total Fund Balances
4000 Total Liabilities and Fund Balances $ 7,056$ 223,479$ 406,438$
Alief Independent School District
August 31, 2003
Non-Major Governmental FundsCombining Balance Sheet
Assets
Liabilities
69
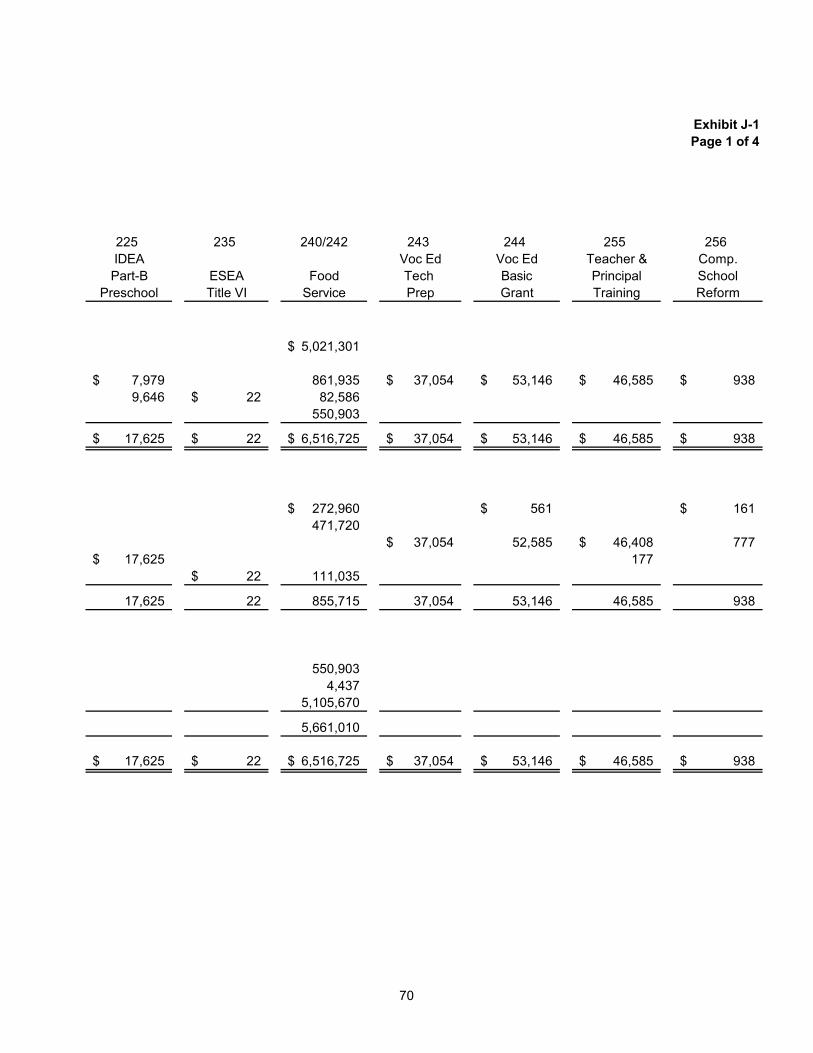
Exhibit J-1Page 1 of 4
225 235 240/242 243 244 255 256IDEA Voc Ed Voc Ed Teacher & Comp.Part-B ESEA Food Tech Basic Principal School
Preschool Title VI Service Prep Grant Training Reform
5,021,301$
7,979$ 861,935 37,054$ 53,146$ 46,585$ 938$ 9,646 22$ 82,586
550,903
17,625$ 22$ 6,516,725$ 37,054$ 53,146$ 46,585$ 938$
272,960$ 561$ 161$ 471,720
37,054$ 52,585 46,408$ 777 17,625$ 177
22$ 111,035
17,625 22 855,715 37,054 53,146 46,585 938
550,9034,437
5,105,670
5,661,010
17,625$ 22$ 6,516,725$ 37,054$ 53,146$ 46,585$ 938$
70

262 263 265 269Data Limited
Control Title II English 21stCodes Part, D Proficiency Century Title V
1110 Cash and cash equivalentsReceivables:
1240 Due from other governments 447$ 112,999$ 85,121$ 40,756$ 1260 Due from other funds1310 Inventories, at cost
1000 Total Assets 447$ 112,999$ 85,121$ 40,756$
Current Liabilities:2110 Accounts payable2160 Accrued wages payable 78$ 2170 Due to other funds 447$ 112,999$ 85,043 40,756$ 2180 Due to other governments2300 Deferred revenues
2000 Total Liabilities 447 112,999 85,121 40,756
Fund BalancesReserved for:
3410 Investments in inventory3440 Outstanding encumbrances3450 Food service
3000 Total Fund Balances
4000 Total Liabilities and Fund Balances 447$ 112,999$ 85,121$ 40,756$
Alief Independent School District
August 31, 2003
Non-Major Governmental FundsCombining Balance Sheet
Assets
Liabilities
71
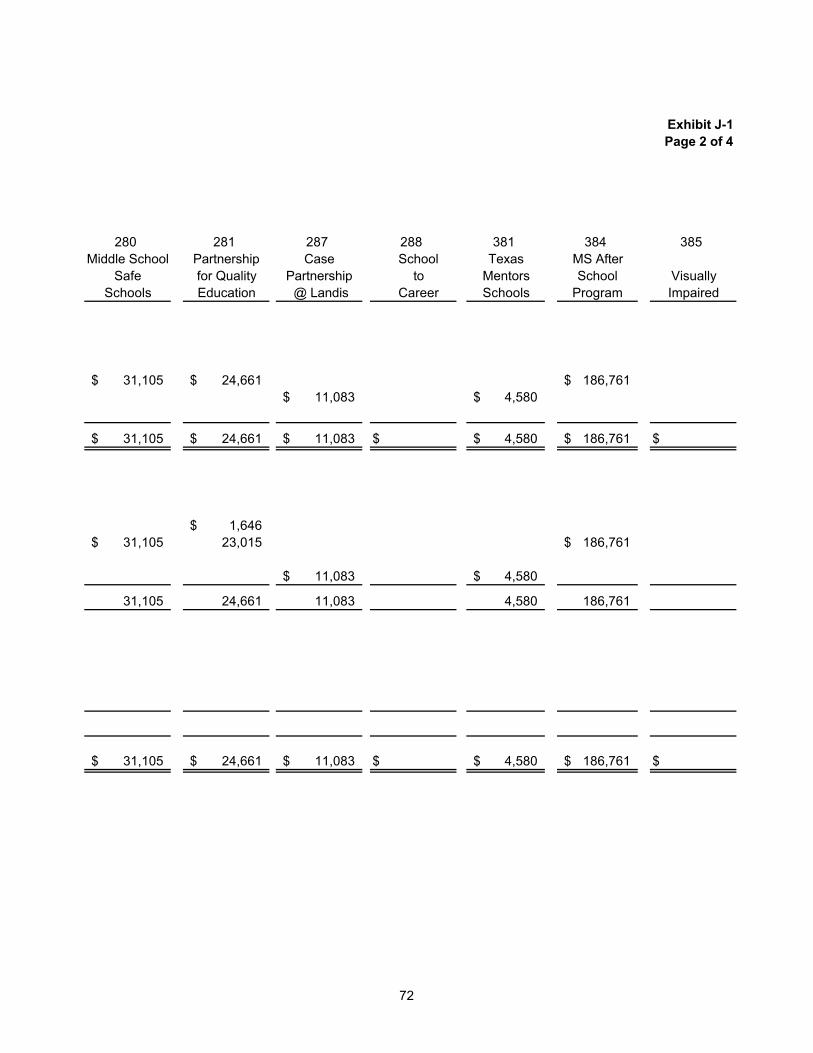
Exhibit J-1Page 2 of 4
280 281 287 288 381 384 385Middle School Partnership Case School Texas MS After
Safe for Quality Partnership to Mentors School VisuallySchools Education @ Landis Career Schools Program Impaired
31,105$ 24,661$ 186,761$ 11,083$ 4,580$
31,105$ 24,661$ 11,083$ $ 4,580$ 186,761$ $
1,646$ 31,105$ 23,015 186,761$
11,083$ 4,580$
31,105 24,661 11,083 4,580 186,761
31,105$ 24,661$ 11,083$ $ 4,580$ 186,761$ $
72
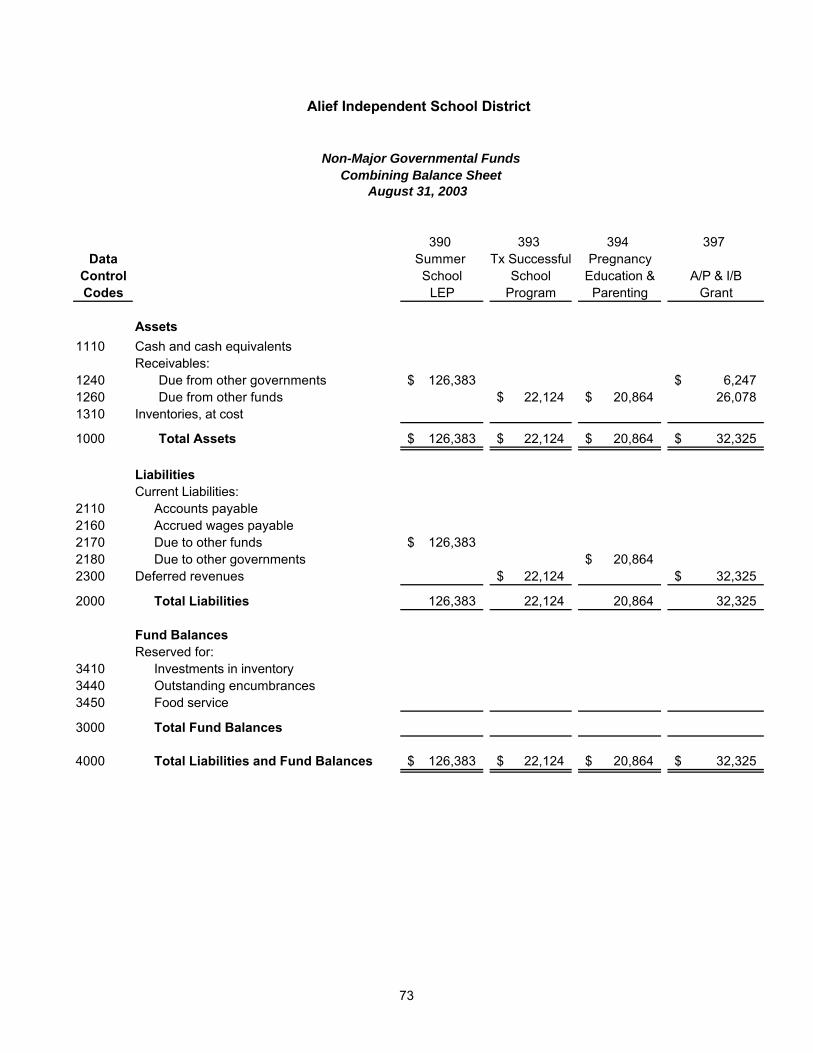
390 393 394 397Data Summer Tx Successful Pregnancy
Control School School Education & A/P & I/BCodes LEP Program Parenting Grant
1110 Cash and cash equivalentsReceivables:
1240 Due from other governments 126,383$ 6,247$ 1260 Due from other funds 22,124$ 20,864$ 26,078 1310 Inventories, at cost
1000 Total Assets 126,383$ 22,124$ 20,864$ 32,325$
Current Liabilities:2110 Accounts payable2160 Accrued wages payable2170 Due to other funds 126,383$ 2180 Due to other governments 20,864$ 2300 Deferred revenues 22,124$ 32,325$
2000 Total Liabilities 126,383 22,124 20,864 32,325
Fund BalancesReserved for:
3410 Investments in inventory3440 Outstanding encumbrances3450 Food service
3000 Total Fund Balances
4000 Total Liabilities and Fund Balances 126,383$ 22,124$ 20,864$ 32,325$
Alief Independent School District
August 31, 2003
Non-Major Governmental FundsCombining Balance Sheet
Assets
Liabilities
73
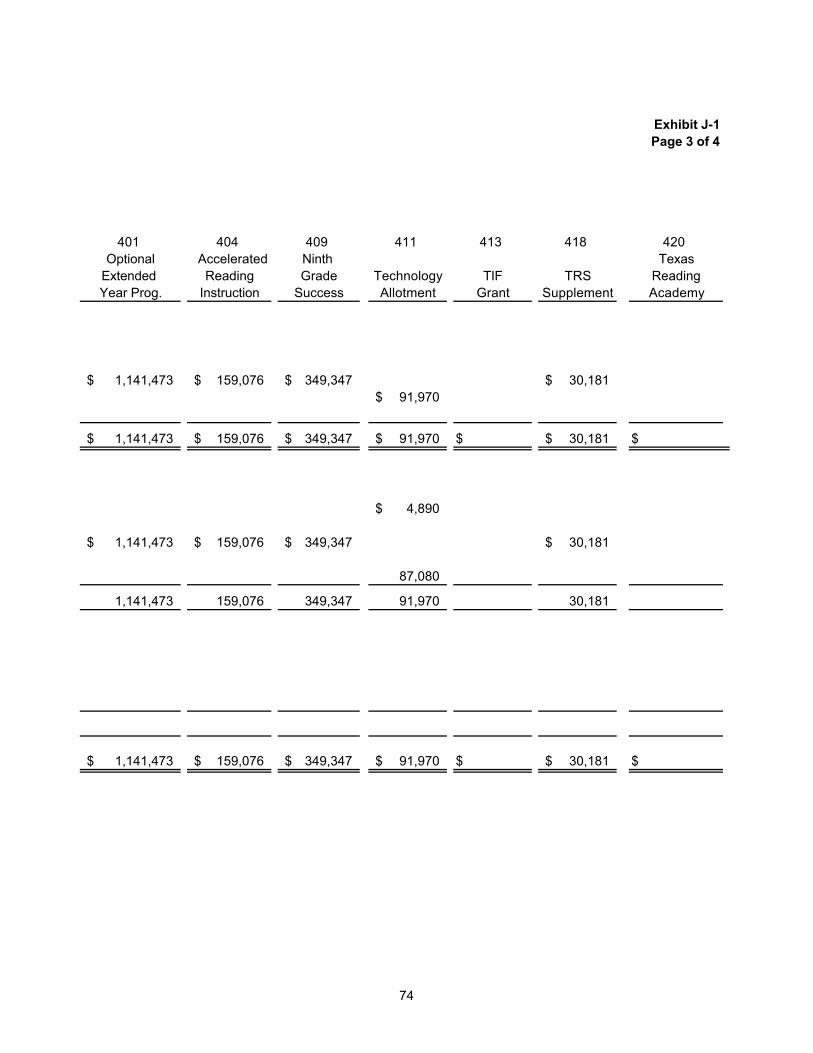
Exhibit J-1Page 3 of 4
401 404 409 411 413 418 420Optional Accelerated Ninth Texas
Extended Reading Grade Technology TIF TRS ReadingYear Prog. Instruction Success Allotment Grant Supplement Academy
1,141,473$ 159,076$ 349,347$ 30,181$ 91,970$
1,141,473$ 159,076$ 349,347$ 91,970$ $ 30,181$ $
4,890$
1,141,473$ 159,076$ 349,347$ 30,181$
87,080
1,141,473 159,076 349,347 91,970 30,181
1,141,473$ 159,076$ 349,347$ 91,970$ $ 30,181$ $
74
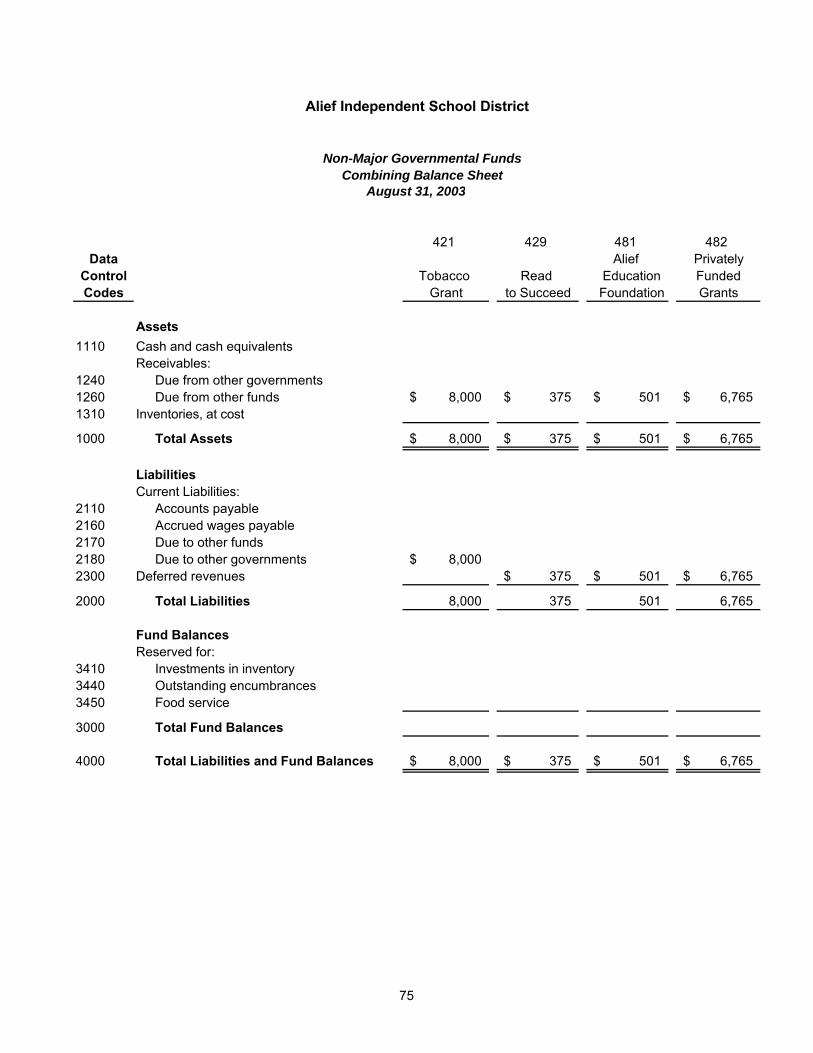
421 429 481 482Data Alief Privately
Control Tobacco Read Education FundedCodes Grant to Succeed Foundation Grants
1110 Cash and cash equivalentsReceivables:
1240 Due from other governments1260 Due from other funds 8,000$ 375$ 501$ 6,765$ 1310 Inventories, at cost
1000 Total Assets 8,000$ 375$ 501$ 6,765$
Current Liabilities:2110 Accounts payable2160 Accrued wages payable2170 Due to other funds2180 Due to other governments 8,000$ 2300 Deferred revenues 375$ 501$ 6,765$
2000 Total Liabilities 8,000 375 501 6,765
Fund BalancesReserved for:
3410 Investments in inventory3440 Outstanding encumbrances3450 Food service
3000 Total Fund Balances
4000 Total Liabilities and Fund Balances 8,000$ 375$ 501$ 6,765$
Alief Independent School District
August 31, 2003
Non-Major Governmental FundsCombining Balance Sheet
Assets
Liabilities
75
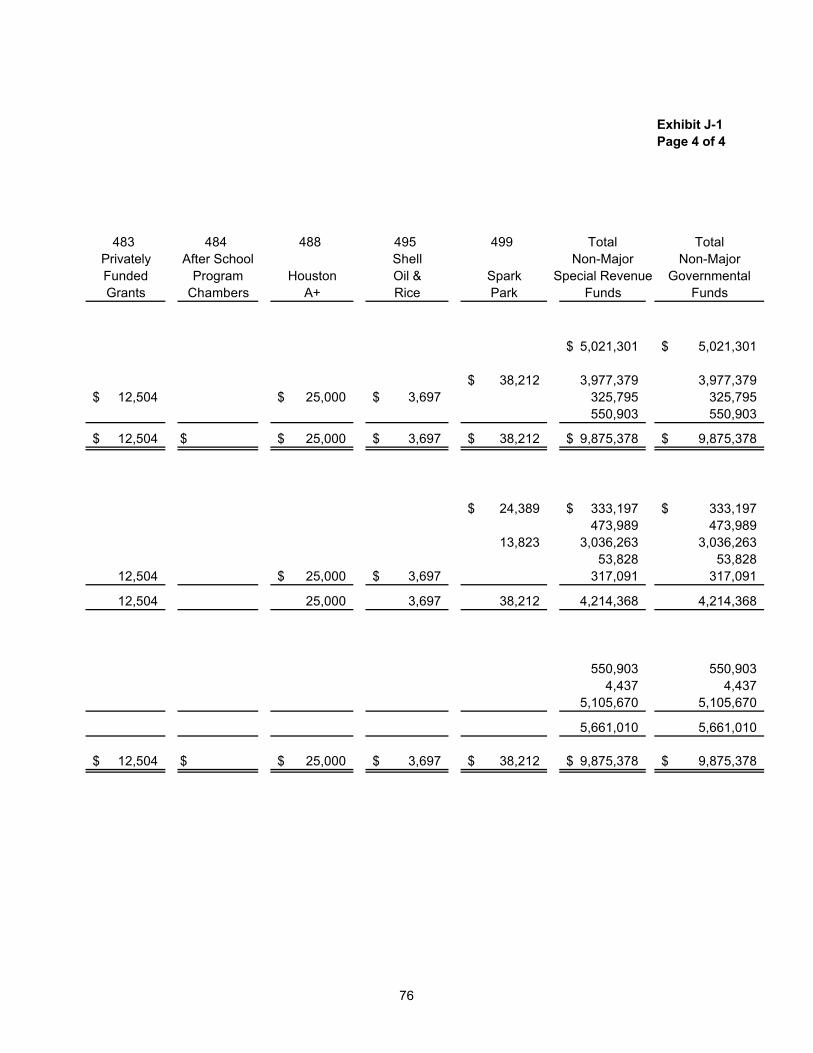
Exhibit J-1Page 4 of 4
483 484 488 495 499 Total TotalPrivately After School Shell Non-Major Non-MajorFunded Program Houston Oil & Spark Special Revenue GovernmentalGrants Chambers A+ Rice Park Funds Funds
5,021,301$ 5,021,301$
38,212$ 3,977,379 3,977,379 12,504$ 25,000$ 3,697$ 325,795 325,795
550,903 550,903
12,504$ $ 25,000$ 3,697$ 38,212$ 9,875,378$ 9,875,378$
24,389$ 333,197$ 333,197$ 473,989 473,989
13,823 3,036,263 3,036,263 53,828 53,828
12,504 25,000$ 3,697$ 317,091 317,091
12,504 25,000 3,697 38,212 4,214,368 4,214,368
550,903 550,9034,437 4,437
5,105,670 5,105,670
5,661,010 5,661,010
12,504$ $ 25,000$ 3,697$ 38,212$ 9,875,378$ 9,875,378$
76
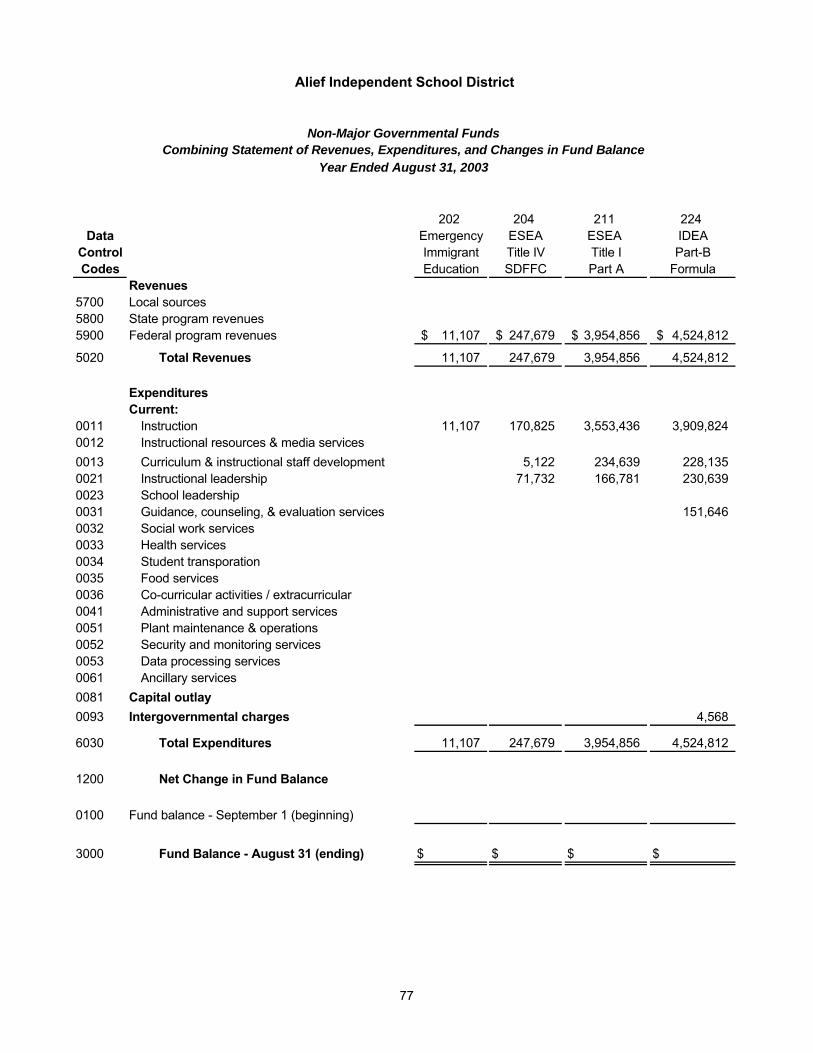
202 204 211 224Data Emergency ESEA ESEA IDEA
Control Immigrant Title IV Title I Part-BCodes Education SDFFC Part A Formula
Revenues5700 Local sources5800 State program revenues5900 Federal program revenues 11,107$ 247,679$ 3,954,856$ 4,524,812$
5020 Total Revenues 11,107 247,679 3,954,856 4,524,812
ExpendituresCurrent:
0011 Instruction 11,107 170,825 3,553,436 3,909,824 0012 Instructional resources & media services0013 Curriculum & instructional staff development 5,122 234,639 228,135 0021 Instructional leadership 71,732 166,781 230,639 0023 School leadership0031 Guidance, counseling, & evaluation services 151,646 0032 Social work services0033 Health services0034 Student transporation0035 Food services0036 Co-curricular activities / extracurricular0041 Administrative and support services0051 Plant maintenance & operations0052 Security and monitoring services0053 Data processing services0061 Ancillary services0081 Capital outlay0093 Intergovernmental charges 4,568
6030 Total Expenditures 11,107 247,679 3,954,856 4,524,812
1200 Net Change in Fund Balance
0100 Fund balance - September 1 (beginning)
3000 Fund Balance - August 31 (ending) $ $ $ $
Alief Independent School District
Combining Statement of Revenues, Expenditures, and Changes in Fund BalanceNon-Major Governmental Funds
Year Ended August 31, 2003
77
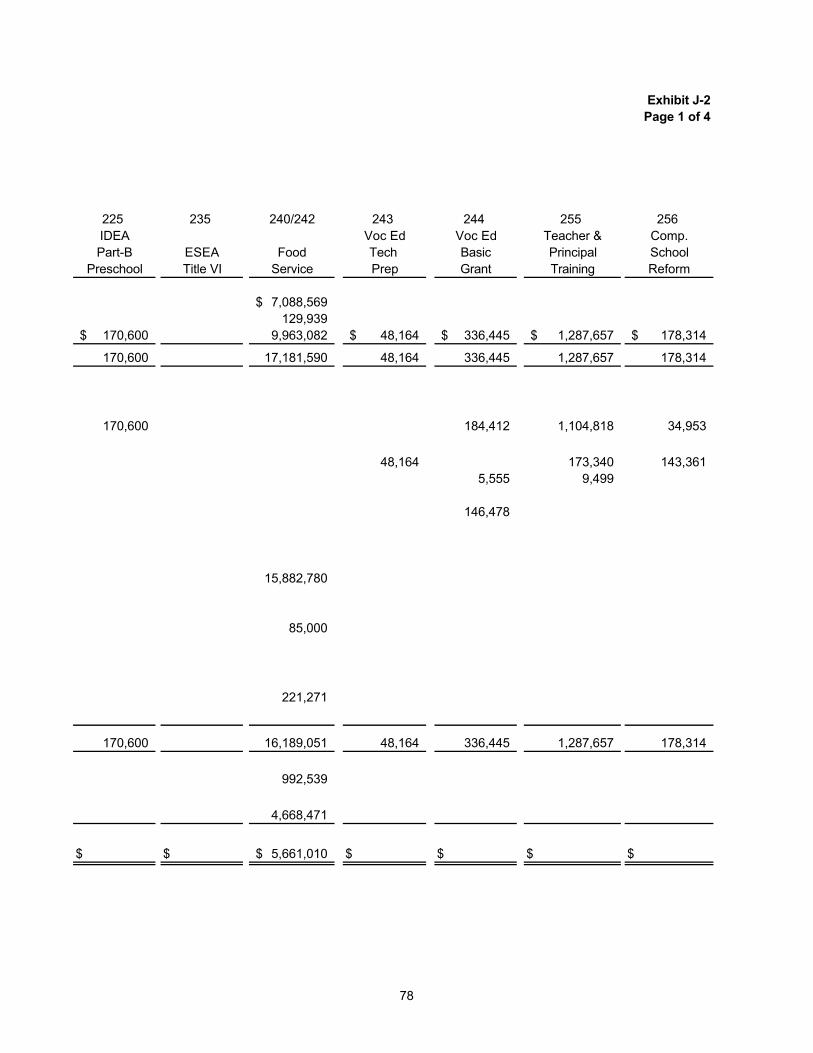
Exhibit J-2Page 1 of 4
225 235 240/242 243 244 255 256IDEA Voc Ed Voc Ed Teacher & Comp.Part-B ESEA Food Tech Basic Principal School
Preschool Title VI Service Prep Grant Training Reform
7,088,569$ 129,939
170,600$ 9,963,082 48,164$ 336,445$ 1,287,657$ 178,314$
170,600 17,181,590 48,164 336,445 1,287,657 178,314
170,600 184,412 1,104,818 34,953
48,164 173,340 143,361 5,555 9,499
146,478
15,882,780
85,000
221,271
170,600 16,189,051 48,164 336,445 1,287,657 178,314
992,539
4,668,471
$ $ 5,661,010$ $ $ $ $
78
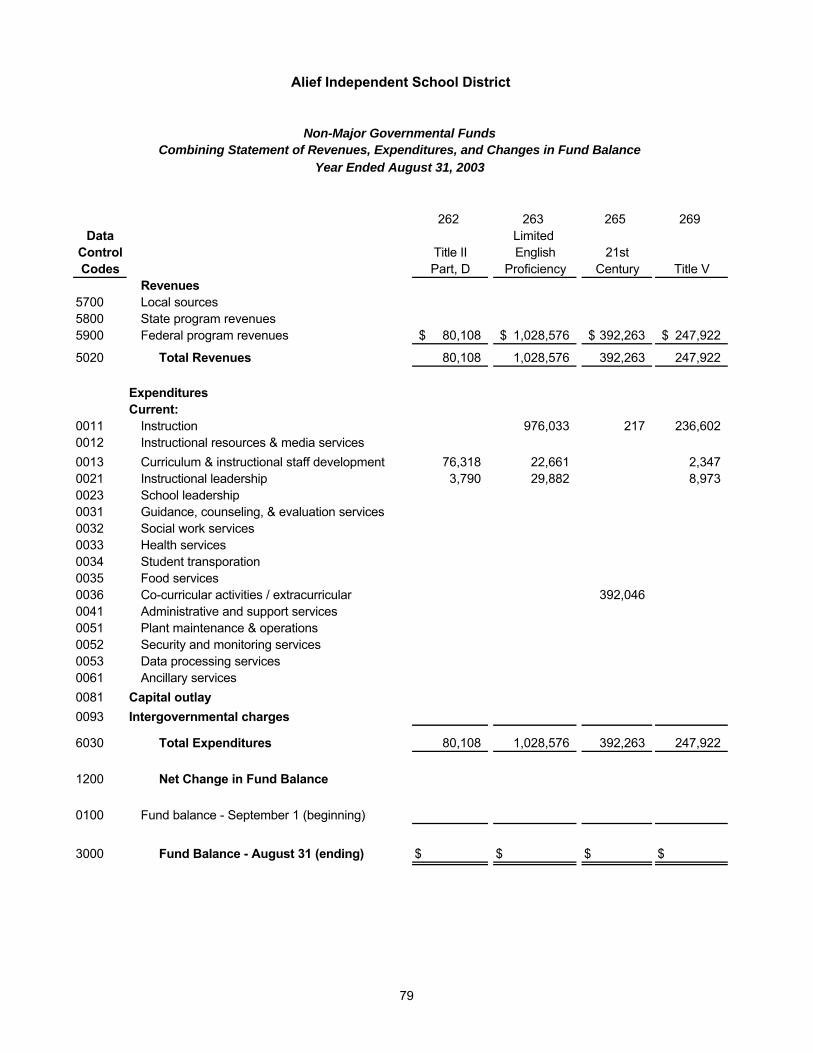
262 263 265 269Data Limited
Control Title II English 21stCodes Part, D Proficiency Century Title V
Revenues5700 Local sources5800 State program revenues5900 Federal program revenues 80,108$ 1,028,576$ 392,263$ 247,922$
5020 Total Revenues 80,108 1,028,576 392,263 247,922
ExpendituresCurrent:
0011 Instruction 976,033 217 236,602 0012 Instructional resources & media services0013 Curriculum & instructional staff development 76,318 22,661 2,347 0021 Instructional leadership 3,790 29,882 8,973 0023 School leadership0031 Guidance, counseling, & evaluation services0032 Social work services0033 Health services0034 Student transporation0035 Food services0036 Co-curricular activities / extracurricular 392,046 0041 Administrative and support services0051 Plant maintenance & operations0052 Security and monitoring services0053 Data processing services0061 Ancillary services0081 Capital outlay0093 Intergovernmental charges
6030 Total Expenditures 80,108 1,028,576 392,263 247,922
1200 Net Change in Fund Balance
0100 Fund balance - September 1 (beginning)
3000 Fund Balance - August 31 (ending) $ $ $ $
Alief Independent School District
Combining Statement of Revenues, Expenditures, and Changes in Fund BalanceYear Ended August 31, 2003
Non-Major Governmental Funds
79
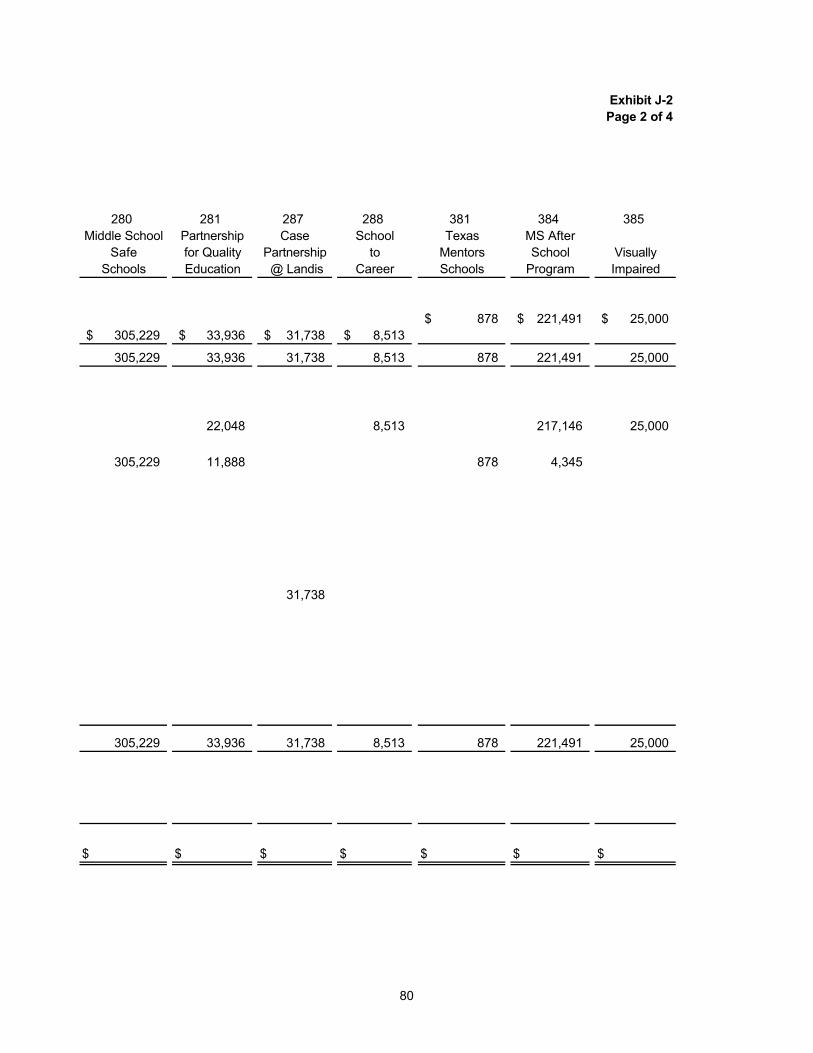
Exhibit J-2Page 2 of 4
280 281 287 288 381 384 385Middle School Partnership Case School Texas MS After
Safe for Quality Partnership to Mentors School VisuallySchools Education @ Landis Career Schools Program Impaired
878$ 221,491$ 25,000$ 305,229$ 33,936$ 31,738$ 8,513$
305,229 33,936 31,738 8,513 878 221,491 25,000
22,048 8,513 217,146 25,000
305,229 11,888 878 4,345
31,738
305,229 33,936 31,738 8,513 878 221,491 25,000
$ $ $ $ $ $ $
80
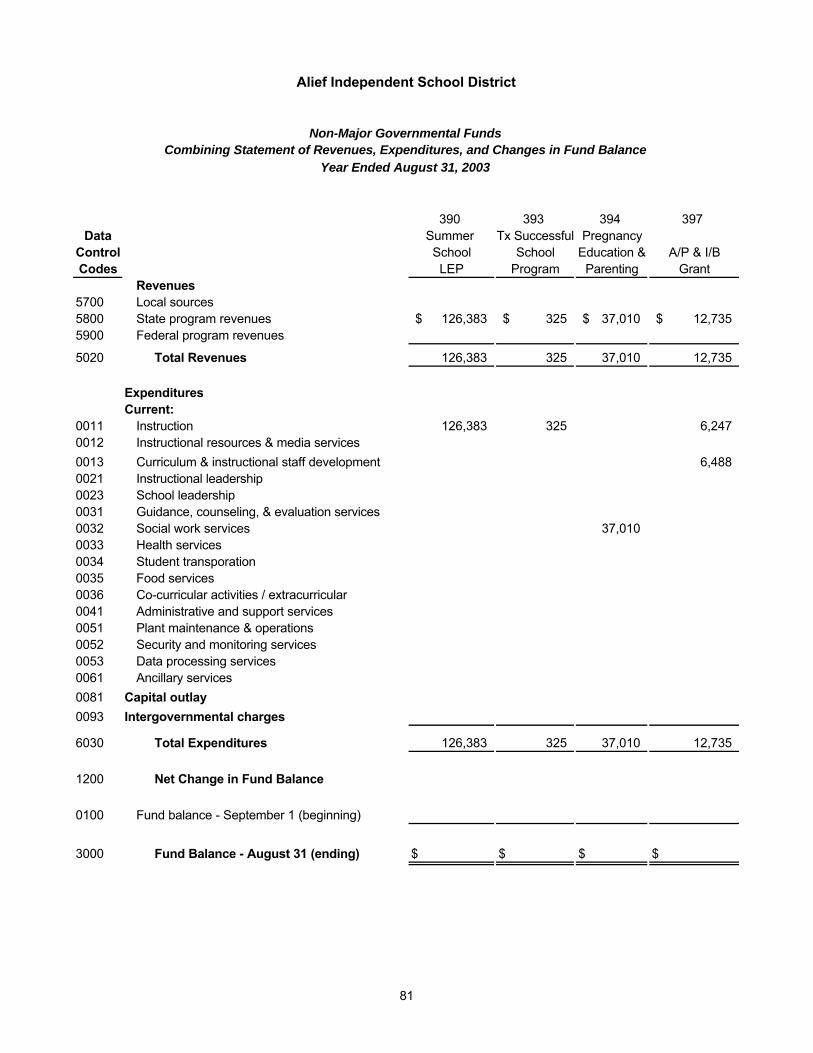
390 393 394 397Data Summer Tx Successful Pregnancy
Control School School Education & A/P & I/BCodes LEP Program Parenting Grant
Revenues5700 Local sources5800 State program revenues 126,383$ 325$ 37,010$ 12,735$ 5900 Federal program revenues
5020 Total Revenues 126,383 325 37,010 12,735
ExpendituresCurrent:
0011 Instruction 126,383 325 6,247 0012 Instructional resources & media services0013 Curriculum & instructional staff development 6,488 0021 Instructional leadership0023 School leadership0031 Guidance, counseling, & evaluation services0032 Social work services 37,010 0033 Health services0034 Student transporation0035 Food services0036 Co-curricular activities / extracurricular0041 Administrative and support services0051 Plant maintenance & operations0052 Security and monitoring services0053 Data processing services0061 Ancillary services0081 Capital outlay0093 Intergovernmental charges
6030 Total Expenditures 126,383 325 37,010 12,735
1200 Net Change in Fund Balance
0100 Fund balance - September 1 (beginning)
3000 Fund Balance - August 31 (ending) $ $ $ $
Alief Independent School District
Combining Statement of Revenues, Expenditures, and Changes in Fund BalanceYear Ended August 31, 2003
Non-Major Governmental Funds
81
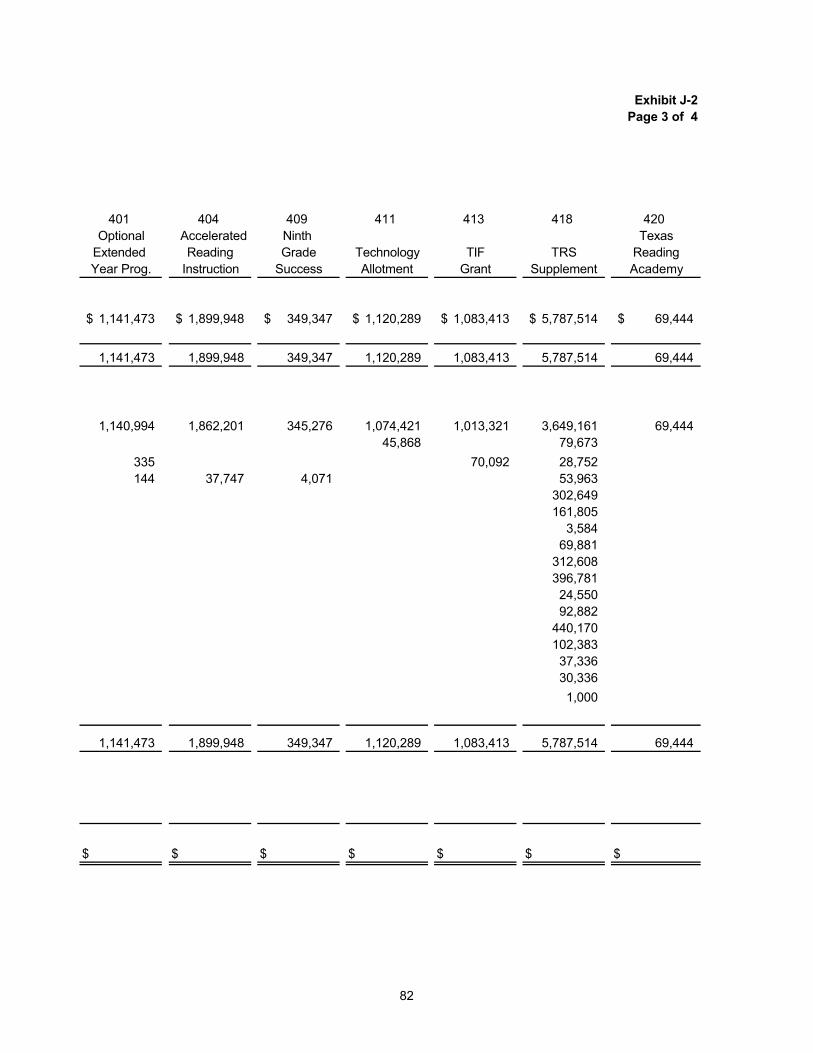
Exhibit J-2Page 3 of 4
401 404 409 411 413 418 420Optional Accelerated Ninth Texas
Extended Reading Grade Technology TIF TRS ReadingYear Prog. Instruction Success Allotment Grant Supplement Academy
1,141,473$ 1,899,948$ 349,347$ 1,120,289$ 1,083,413$ 5,787,514$ 69,444$
1,141,473 1,899,948 349,347 1,120,289 1,083,413 5,787,514 69,444
1,140,994 1,862,201 345,276 1,074,421 1,013,321 3,649,161 69,444 45,868 79,673
335 70,092 28,752 144 37,747 4,071 53,963
302,649 161,805
3,584 69,881
312,608 396,781 24,550 92,882
440,170 102,383 37,336 30,336 1,000
1,141,473 1,899,948 349,347 1,120,289 1,083,413 5,787,514 69,444
$ $ $ $ $ $ $
82
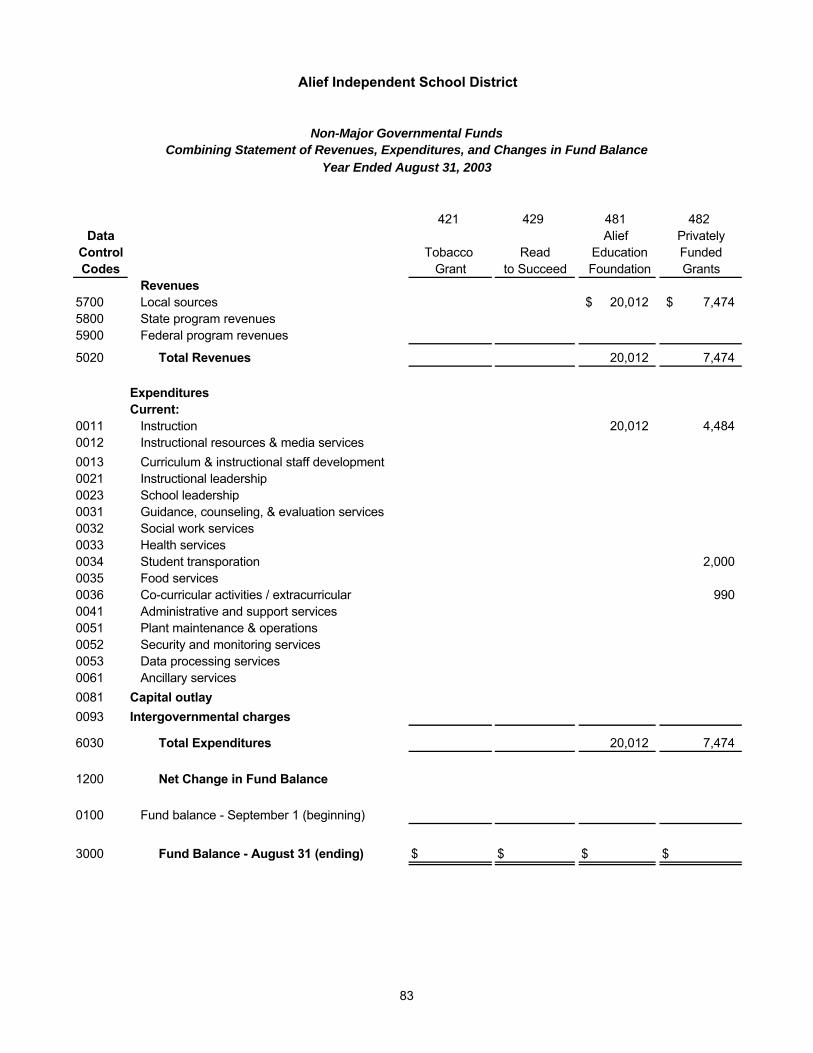
421 429 481 482Data Alief Privately
Control Tobacco Read Education FundedCodes Grant to Succeed Foundation Grants
Revenues 5700 Local sources 20,012$ 7,474$ 5800 State program revenues5900 Federal program revenues
5020 Total Revenues 20,012 7,474
ExpendituresCurrent:
0011 Instruction 20,012 4,484 0012 Instructional resources & media services0013 Curriculum & instructional staff development0021 Instructional leadership0023 School leadership0031 Guidance, counseling, & evaluation services0032 Social work services0033 Health services0034 Student transporation 2,000 0035 Food services0036 Co-curricular activities / extracurricular 990 0041 Administrative and support services0051 Plant maintenance & operations0052 Security and monitoring services0053 Data processing services0061 Ancillary services0081 Capital outlay0093 Intergovernmental charges
6030 Total Expenditures 20,012 7,474
1200 Net Change in Fund Balance
0100 Fund balance - September 1 (beginning)
3000 Fund Balance - August 31 (ending) $ $ $ $
Alief Independent School District
Combining Statement of Revenues, Expenditures, and Changes in Fund BalanceYear Ended August 31, 2003
Non-Major Governmental Funds
83
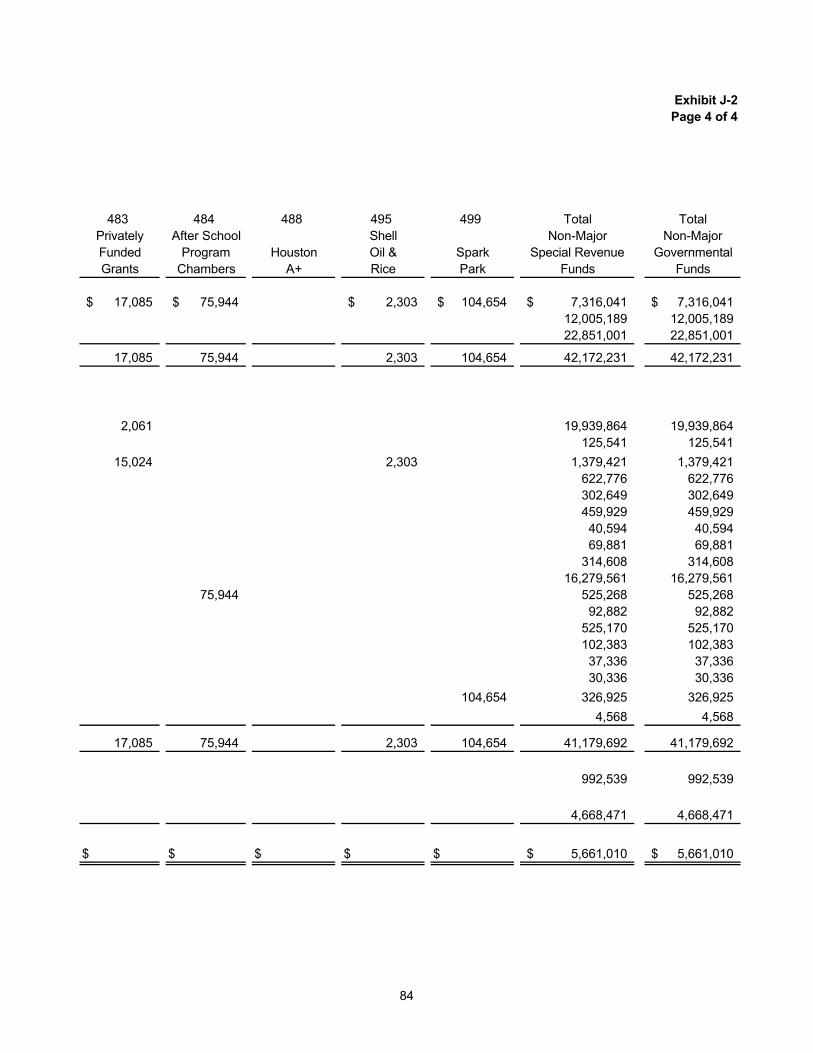
Exhibit J-2Page 4 of 4
483 484 488 495 499 Total TotalPrivately After School Shell Non-Major Non-MajorFunded Program Houston Oil & Spark Special Revenue GovernmentalGrants Chambers A+ Rice Park Funds Funds
17,085$ 75,944$ 2,303$ 104,654$ 7,316,041$ 7,316,041$ 12,005,189 12,005,189 22,851,001 22,851,001
17,085 75,944 2,303 104,654 42,172,231 42,172,231
2,061 19,939,864 19,939,864125,541 125,541
15,024 2,303 1,379,421 1,379,421622,776 622,776302,649 302,649459,929 459,92940,594 40,59469,881 69,881
314,608 314,60816,279,561 16,279,561
75,944 525,268 525,26892,882 92,882
525,170 525,170102,383 102,38337,336 37,33630,336 30,336
104,654 326,925 326,9254,568 4,568
17,085 75,944 2,303 104,654 41,179,692 41,179,692
992,539 992,539
4,668,471 4,668,471
$ $ $ $ $ 5,661,010$ 5,661,010$
84

This page intentionally blank.
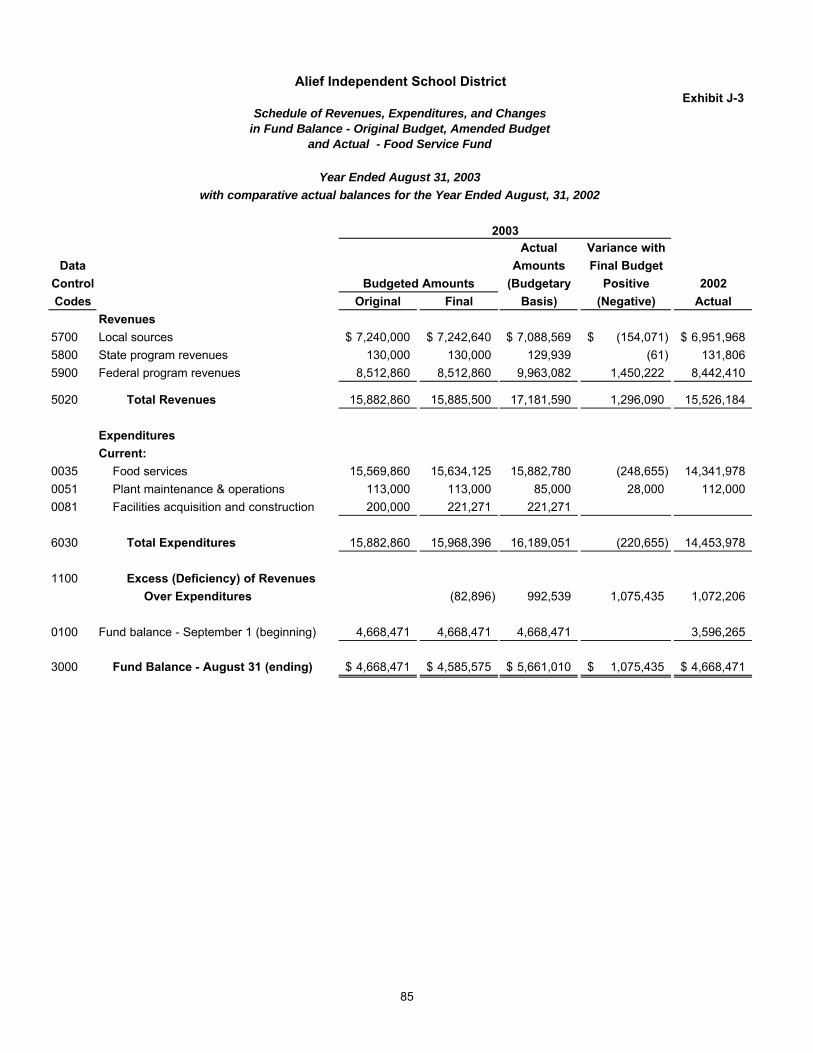
Exhibit J-3
Actual Variance withData Amounts Final Budget
Control (Budgetary Positive 2002Codes Original Final Basis) (Negative) Actual
Revenues5700 Local sources 7,240,000$ 7,242,640$ 7,088,569$ (154,071)$ 6,951,968$ 5800 State program revenues 130,000 130,000 129,939 (61) 131,806 5900 Federal program revenues 8,512,860 8,512,860 9,963,082 1,450,222 8,442,410
5020 Total Revenues 15,882,860 15,885,500 17,181,590 1,296,090 15,526,184
Expenditures Current:
0035 Food services 15,569,860 15,634,125 15,882,780 (248,655) 14,341,978 0051 Plant maintenance & operations 113,000 113,000 85,000 28,000 112,000 0081 Facilities acquisition and construction 200,000 221,271 221,271
6030 Total Expenditures 15,882,860 15,968,396 16,189,051 (220,655) 14,453,978
1100 Excess (Deficiency) of RevenuesOver Expenditures (82,896) 992,539 1,075,435 1,072,206
0100 Fund balance - September 1 (beginning) 4,668,471 4,668,471 4,668,471 3,596,265
3000 Fund Balance - August 31 (ending) 4,668,471$ 4,585,575$ 5,661,010$ 1,075,435$ 4,668,471$
Budgeted Amounts
Alief Independent School District
Schedule of Revenues, Expenditures, and Changesin Fund Balance - Original Budget, Amended Budget
and Actual - Food Service Fund
Year Ended August 31, 2003with comparative actual balances for the Year Ended August, 31, 2002
2003
85

This page intentionally blank.
Alief
Internal Service Funds Internal Service Funds are used to account for the operations of the District’s self-funded insurance programs. Workers’ Compensation Fund – This fund is used to account for the operations of the District’s self-funded workers’compensation plan, which is supported by employer contributions. Expenses include benefit payments to employees, excess loss insurance premiums, and related administrative costs. Insurance Fund – This fund is used to account for the operations of the District’s medical and dental insurance program, which is supported by both employee and employer contributions. Expenses include claims, excess loss insurance, and related administrative costs.
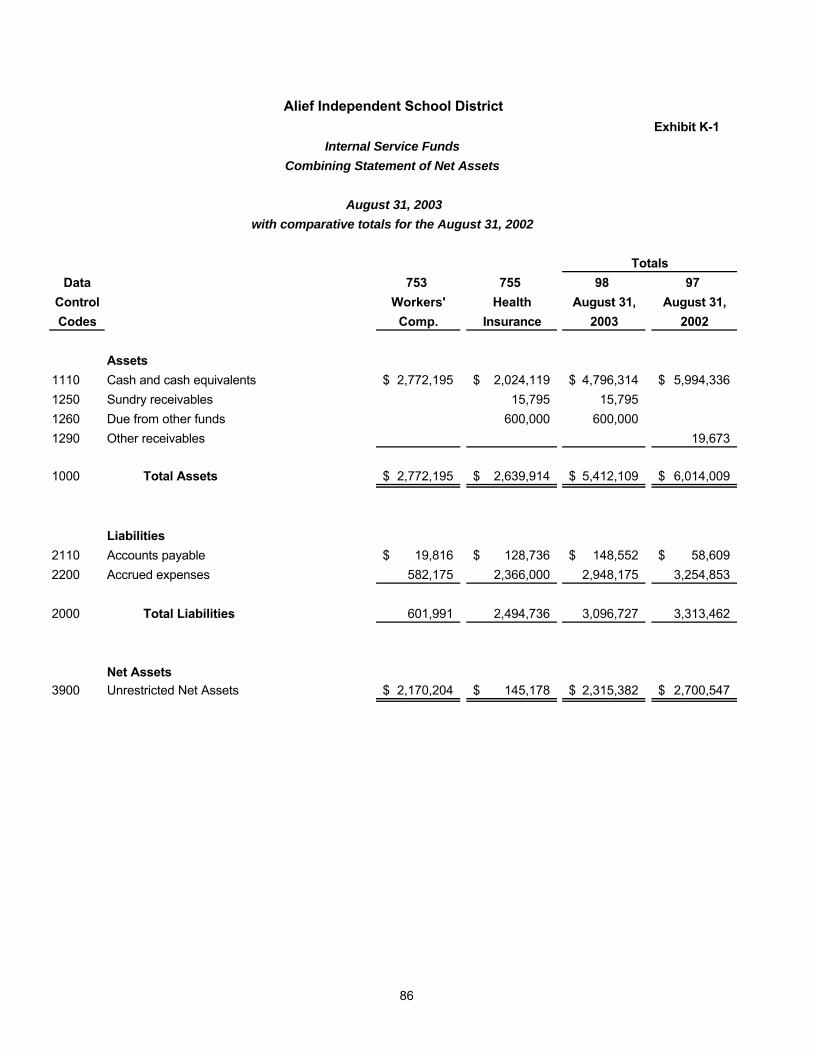
Exhibit K-1
Data 753 755 98 97Control Workers' Health August 31, August 31,Codes Comp. Insurance 2003 2002
Assets1110 Cash and cash equivalents 2,772,195$ 2,024,119$ 4,796,314$ 5,994,336$ 1250 Sundry receivables 15,795 15,795 1260 Due from other funds 600,000 600,000 1290 Other receivables 19,673
1000 Total Assets 2,772,195$ 2,639,914$ 5,412,109$ 6,014,009$
Liabilities2110 Accounts payable 19,816$ 128,736$ 148,552$ 58,609$ 2200 Accrued expenses 582,175 2,366,000 2,948,175 3,254,853
2000 Total Liabilities 601,991 2,494,736 3,096,727 3,313,462
Net Assets3900 Unrestricted Net Assets 2,170,204$ 145,178$ 2,315,382$ 2,700,547$
Totals
Alief Independent School District
Combining Statement of Net Assets
August 31, 2003with comparative totals for the August 31, 2002
Internal Service Funds
86
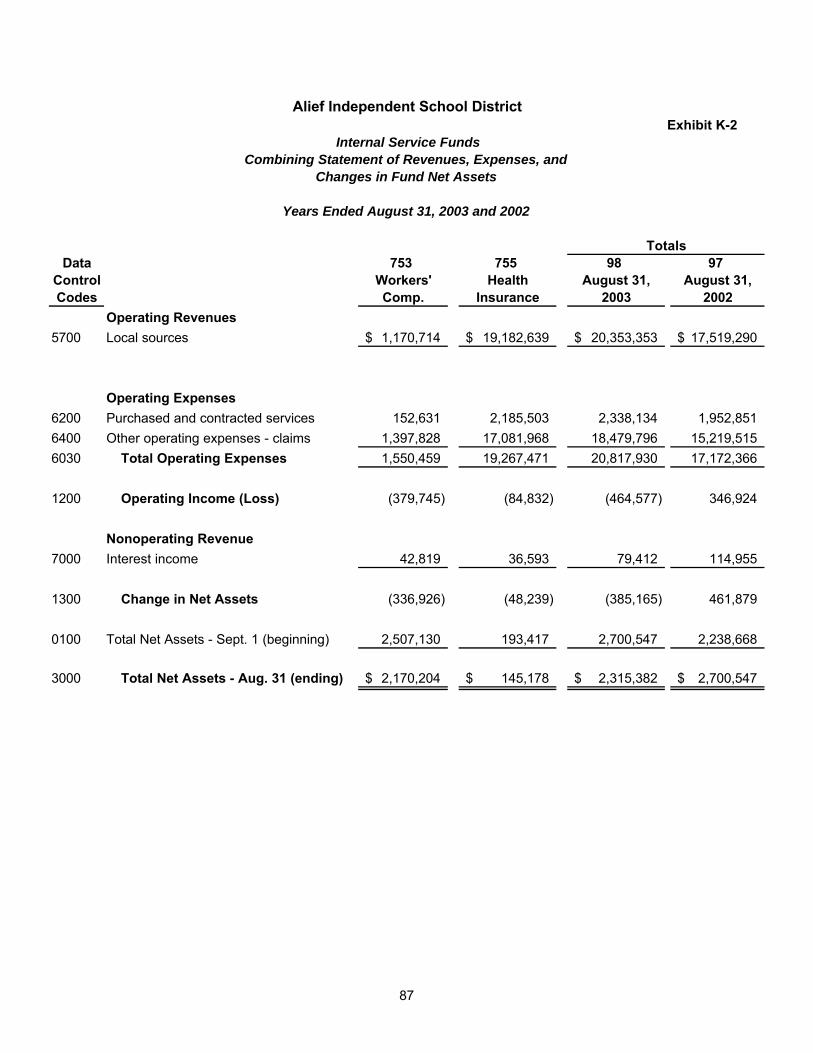
Exhibit K-2
Data 753 755 98 97Control Workers' Health August 31, August 31,Codes Comp. Insurance 2003 2002
Operating Revenues5700 Local sources 1,170,714$ 19,182,639$ 20,353,353$ 17,519,290$
Operating Expenses6200 Purchased and contracted services 152,631 2,185,503 2,338,134 1,952,8516400 Other operating expenses - claims 1,397,828 17,081,968 18,479,796 15,219,5156030 Total Operating Expenses 1,550,459 19,267,471 20,817,930 17,172,366
1200 Operating Income (Loss) (379,745) (84,832) (464,577) 346,924
Nonoperating Revenue7000 Interest income 42,819 36,593 79,412 114,955
1300 Change in Net Assets (336,926) (48,239) (385,165) 461,879
0100 Total Net Assets - Sept. 1 (beginning) 2,507,130 193,417 2,700,547 2,238,668
3000 Total Net Assets - Aug. 31 (ending) 2,170,204$ 145,178$ 2,315,382$ 2,700,547$
Totals
Alief Independent School District
Combining Statement of Revenues, Expenses, andChanges in Fund Net Assets
Years Ended August 31, 2003 and 2002
Internal Service Funds
87

This page intentionally blank.
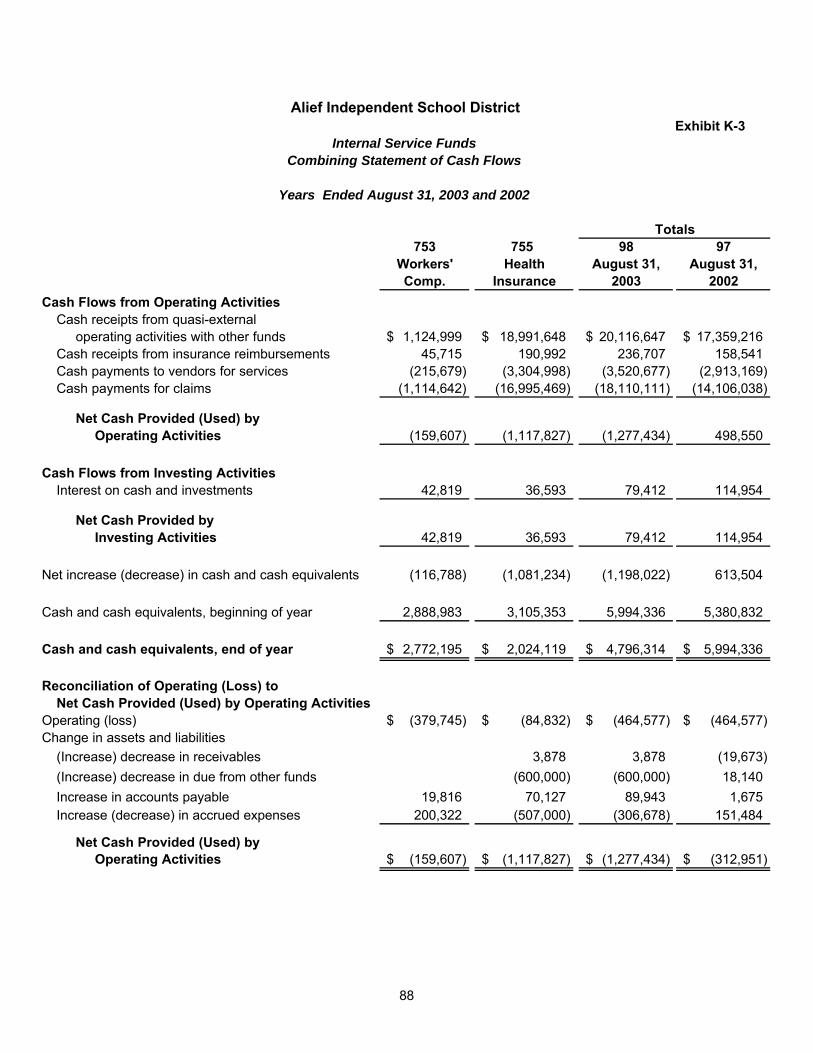
Exhibit K-3
753 755 98 97Workers' Health August 31, August 31,Comp. Insurance 2003 2002
Cash Flows from Operating ActivitiesCash receipts from quasi-external
operating activities with other funds 1,124,999$ 18,991,648$ 20,116,647$ 17,359,216$ Cash receipts from insurance reimbursements 45,715 190,992 236,707 158,541 Cash payments to vendors for services (215,679) (3,304,998) (3,520,677) (2,913,169)Cash payments for claims (1,114,642) (16,995,469) (18,110,111) (14,106,038)
Net Cash Provided (Used) byOperating Activities (159,607) (1,117,827) (1,277,434) 498,550
Cash Flows from Investing ActivitiesInterest on cash and investments 42,819 36,593 79,412 114,954
Net Cash Provided by Investing Activities 42,819 36,593 79,412 114,954
Net increase (decrease) in cash and cash equivalents (116,788) (1,081,234) (1,198,022) 613,504
Cash and cash equivalents, beginning of year 2,888,983 3,105,353 5,994,336 5,380,832
Cash and cash equivalents, end of year 2,772,195$ 2,024,119$ 4,796,314$ 5,994,336$
Reconciliation of Operating (Loss) to Net Cash Provided (Used) by Operating Activities
Operating (loss) (379,745)$ (84,832)$ (464,577)$ (464,577)$ Change in assets and liabilities
(Increase) decrease in receivables 3,878 3,878 (19,673)(Increase) decrease in due from other funds (600,000) (600,000) 18,140Increase in accounts payable 19,816 70,127 89,943 1,675Increase (decrease) in accrued expenses 200,322 (507,000) (306,678) 151,484
Net Cash Provided (Used) byOperating Activities (159,607)$ (1,117,827)$ (1,277,434)$ (312,951)$
Totals
Alief Independent School District
Combining Statement of Cash FlowsInternal Service Funds
Years Ended August 31, 2003 and 2002
88

This page intentionally blank.

Alief
Agency Fund The Agency Fund is used to account for the cash receipts and disbursements of the school activity funds of the individual schools.

This page intentionally blank.
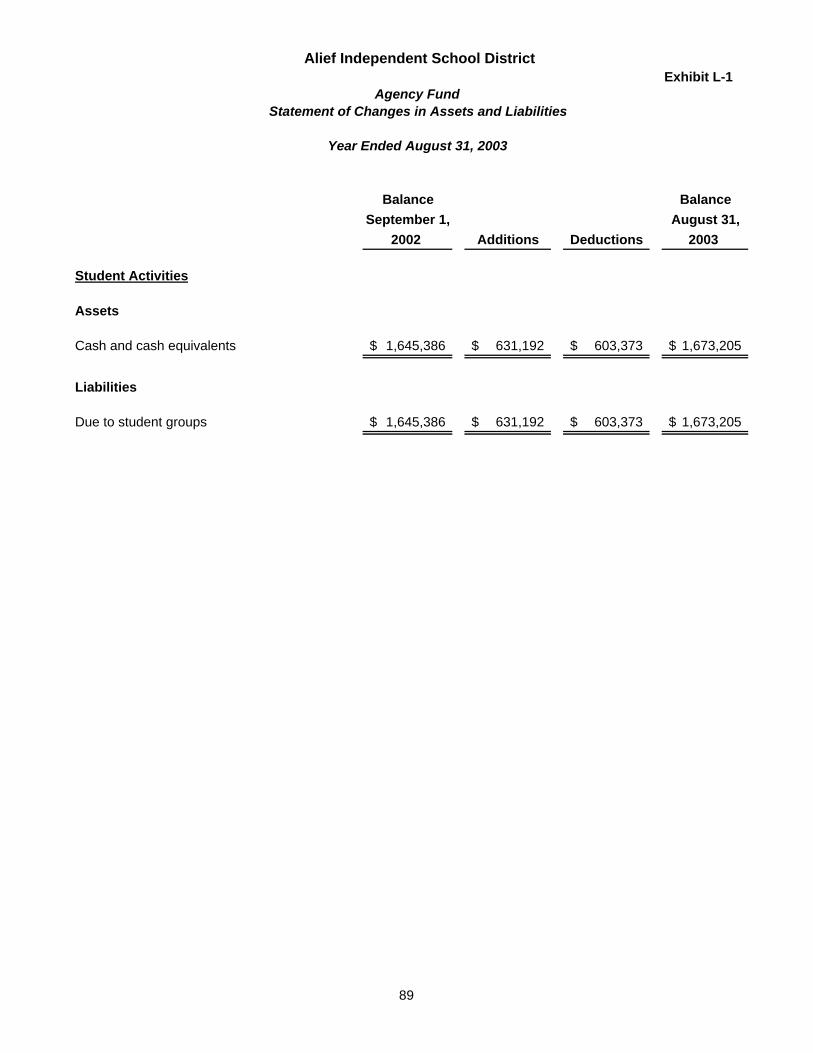
Exhibit L-1
Balance BalanceSeptember 1, August 31,
2002 Additions Deductions 2003
Cash and cash equivalents 1,645,386$ 631,192$ 603,373$ 1,673,205$
Due to student groups 1,645,386$ 631,192$ 603,373$ 1,673,205$
Student Activities
Assets
Liabilities
Alief Independent School District
Agency FundStatement of Changes in Assets and Liabilities
Year Ended August 31, 2003
89

This page intentionally blank.
Alief
Capital Assets Used in the Operation of Governmental Funds Capital assets purchased or constructed by the District are shown at original cost. Donated assets are valued at the fair market value on the date donated. Costs incurred for the purchase or construction of capital assets are recorded as expenditures in the Governmental Funds. Capital assets consists principally of school buildings and related equipment.

This page intentionally blank.
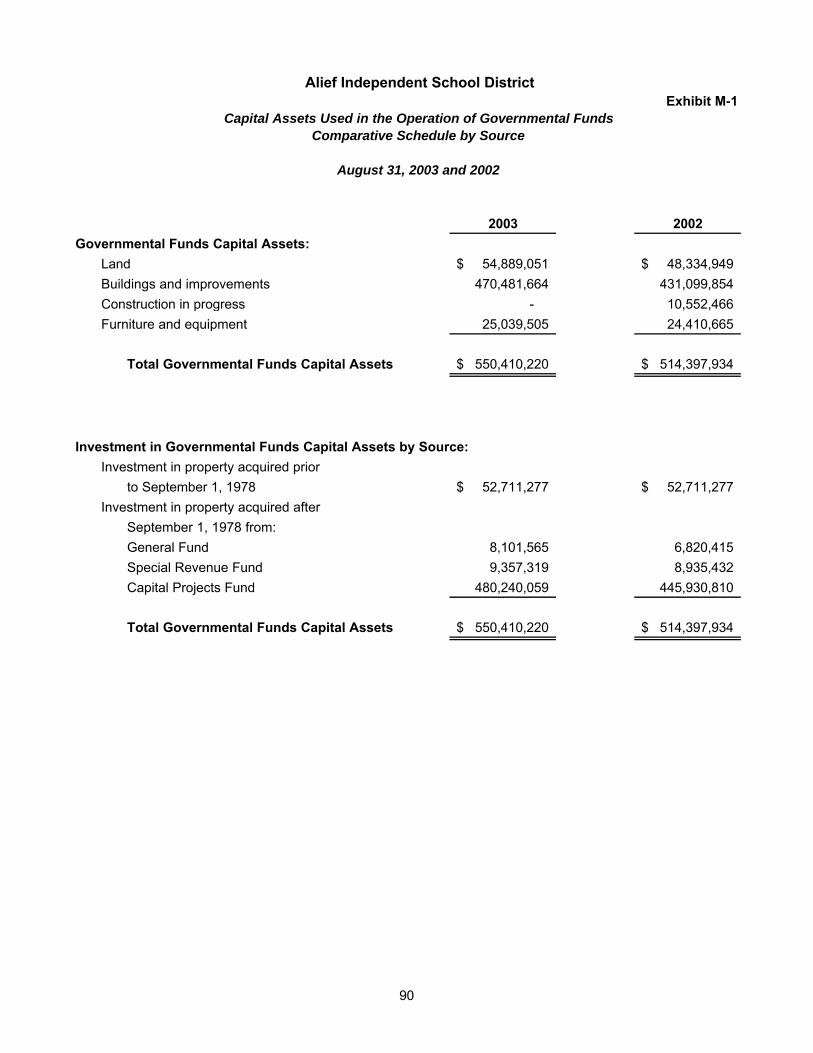
Exhibit M-1
2003 2002Governmental Funds Capital Assets:
Land 54,889,051$ 48,334,949$ Buildings and improvements 470,481,664 431,099,854 Construction in progress - 10,552,466 Furniture and equipment 25,039,505 24,410,665
Total Governmental Funds Capital Assets 550,410,220$ 514,397,934$
Investment in Governmental Funds Capital Assets by Source:Investment in property acquired prior
to September 1, 1978 52,711,277$ 52,711,277$ Investment in property acquired after
September 1, 1978 from:General Fund 8,101,565 6,820,415Special Revenue Fund 9,357,319 8,935,432Capital Projects Fund 480,240,059 445,930,810
Total Governmental Funds Capital Assets 550,410,220$ 514,397,934$
Alief Independent School District
Capital Assets Used in the Operation of Governmental FundsComparative Schedule by Source
August 31, 2003 and 2002
90
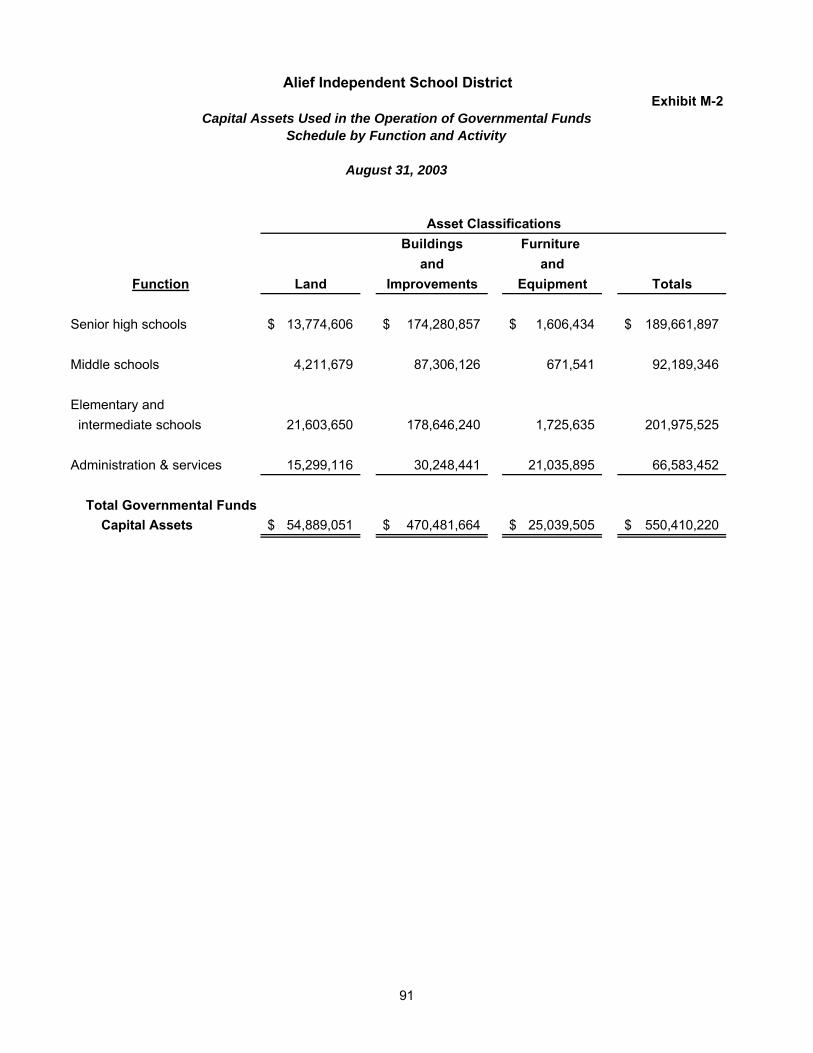
Exhibit M-2
Asset ClassificationsBuildings Furniture
and andFunction Land Improvements Equipment Totals
Senior high schools 13,774,606$ 174,280,857$ 1,606,434$ 189,661,897$
Middle schools 4,211,679 87,306,126 671,541 92,189,346
Elementary and intermediate schools 21,603,650 178,646,240 1,725,635 201,975,525
Administration & services 15,299,116 30,248,441 21,035,895 66,583,452
Total Governmental Funds Capital Assets 54,889,051$ 470,481,664$ 25,039,505$ 550,410,220$
August 31, 2003
Alief Independent School District
Capital Assets Used in the Operation of Governmental FundsSchedule by Function and Activity
91
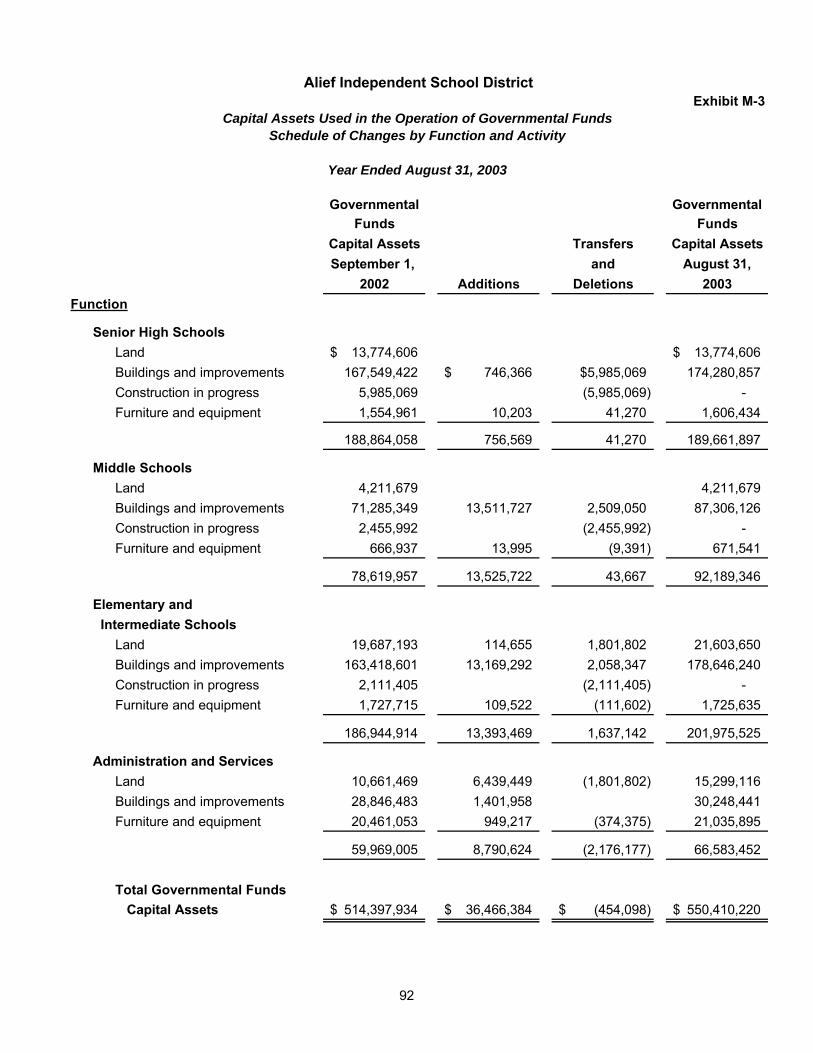
Exhibit M-3
Governmental GovernmentalFunds Funds
Capital Assets Transfers Capital AssetsSeptember 1, and August 31,
2002 Additions Deletions 2003
Senior High SchoolsLand 13,774,606$ 13,774,606$ Buildings and improvements 167,549,422 746,366$ $5,985,069 174,280,857 Construction in progress 5,985,069 (5,985,069) - Furniture and equipment 1,554,961 10,203 41,270 1,606,434
188,864,058 756,569 41,270 189,661,897
Middle SchoolsLand 4,211,679 4,211,679 Buildings and improvements 71,285,349 13,511,727 2,509,050 87,306,126 Construction in progress 2,455,992 (2,455,992) - Furniture and equipment 666,937 13,995 (9,391) 671,541
78,619,957 13,525,722 43,667 92,189,346
Elementary and Intermediate Schools
Land 19,687,193 114,655 1,801,802 21,603,650 Buildings and improvements 163,418,601 13,169,292 2,058,347 178,646,240 Construction in progress 2,111,405 (2,111,405) - Furniture and equipment 1,727,715 109,522 (111,602) 1,725,635
186,944,914 13,393,469 1,637,142 201,975,525
Administration and ServicesLand 10,661,469 6,439,449 (1,801,802) 15,299,116 Buildings and improvements 28,846,483 1,401,958 30,248,441 Furniture and equipment 20,461,053 949,217 (374,375) 21,035,895
59,969,005 8,790,624 (2,176,177) 66,583,452
Total Governmental Funds Capital Assets 514,397,934$ 36,466,384$ (454,098)$ 550,410,220$
Function
Year Ended August 31, 2003
Alief Independent School District
Capital Assets Used in the Operation of Governmental FundsSchedule of Changes by Function and Activity
92

This page intentionally blank.

Alief
General Long-Term Debt on Governmental Funds The long-term debt of the District consists of schoolhouse bonds and refunding bonds.
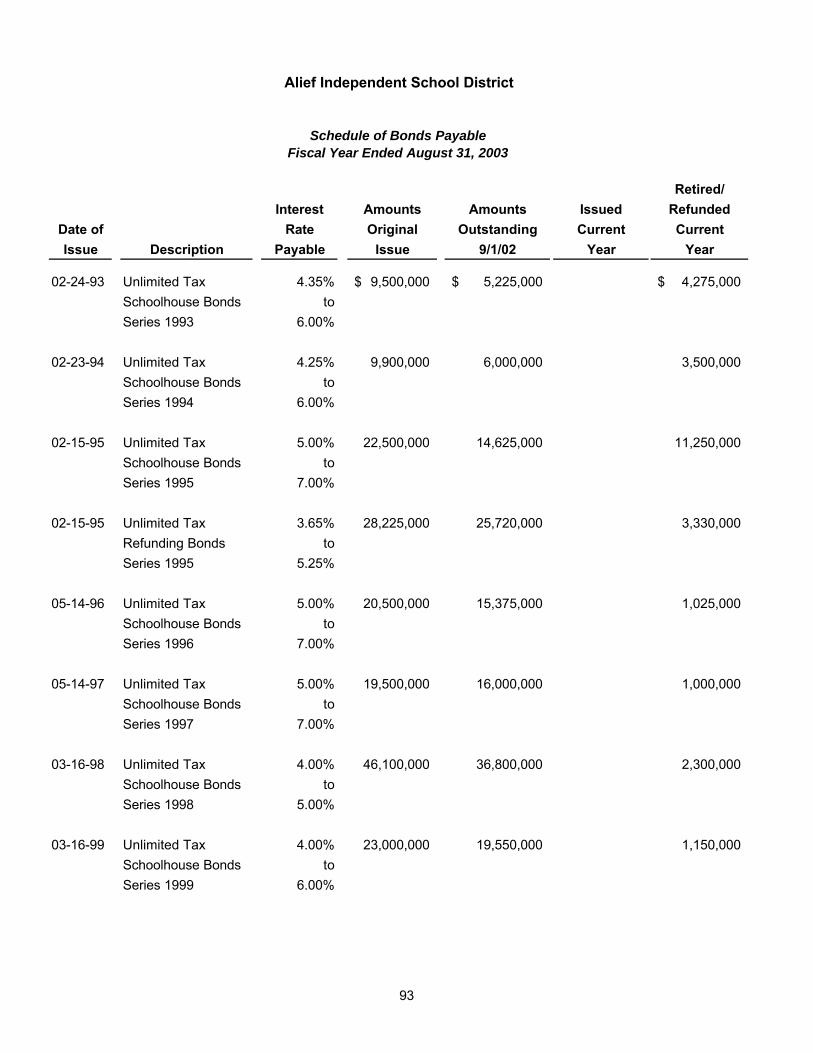
Retired/Interest Amounts Amounts Issued Refunded
Date of Rate Original Outstanding Current CurrentIssue Description Payable Issue 9/1/02 Year Year
02-24-93 Unlimited Tax 4.35% 9,500,000$ 5,225,000$ 4,275,000$ Schoolhouse Bonds toSeries 1993 6.00%
02-23-94 Unlimited Tax 4.25% 9,900,000 6,000,000 3,500,000Schoolhouse Bonds toSeries 1994 6.00%
02-15-95 Unlimited Tax 5.00% 22,500,000 14,625,000 11,250,000Schoolhouse Bonds toSeries 1995 7.00%
02-15-95 Unlimited Tax 3.65% 28,225,000 25,720,000 3,330,000Refunding Bonds toSeries 1995 5.25%
05-14-96 Unlimited Tax 5.00% 20,500,000 15,375,000 1,025,000Schoolhouse Bonds toSeries 1996 7.00%
05-14-97 Unlimited Tax 5.00% 19,500,000 16,000,000 1,000,000Schoolhouse Bonds toSeries 1997 7.00%
03-16-98 Unlimited Tax 4.00% 46,100,000 36,800,000 2,300,000Schoolhouse Bonds toSeries 1998 5.00%
03-16-99 Unlimited Tax 4.00% 23,000,000 19,550,000 1,150,000Schoolhouse Bonds toSeries 1999 6.00%
Alief Independent School District
Schedule of Bonds PayableFiscal Year Ended August 31, 2003
93
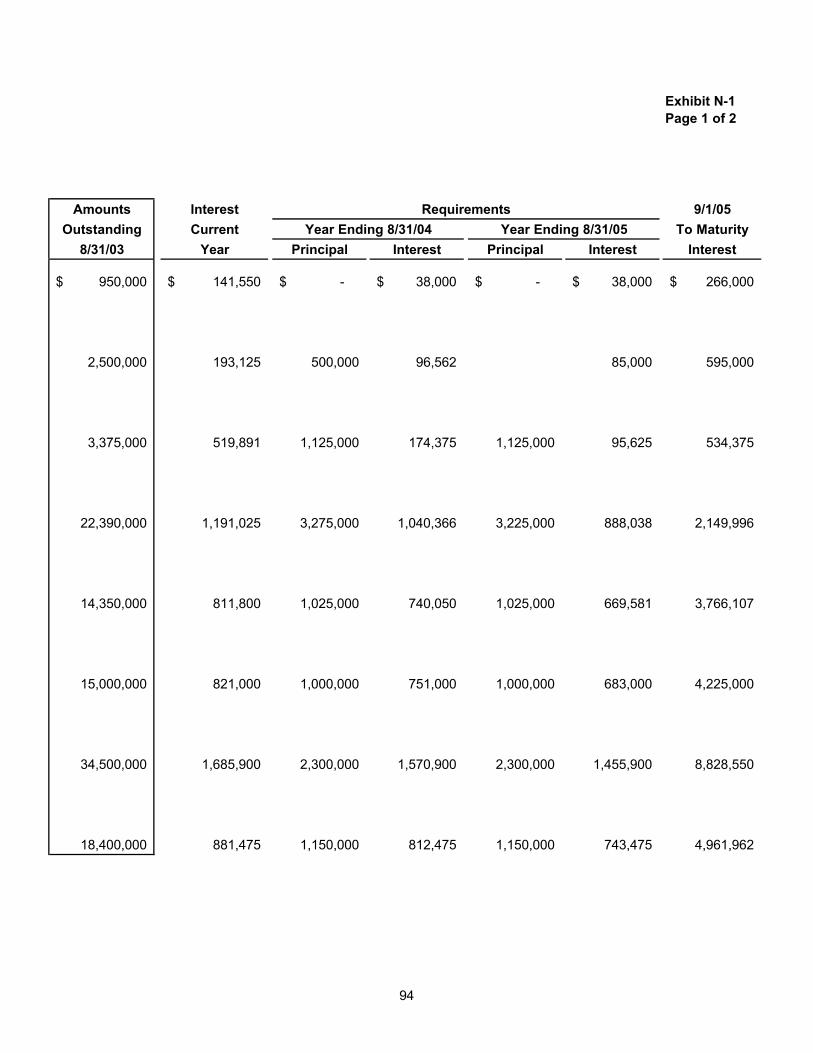
Exhibit N-1 Page 1 of 2
Amounts Interest Requirements 9/1/05Outstanding Current Year Ending 8/31/04 Year Ending 8/31/05 To Maturity
8/31/03 Year Principal Interest Principal Interest Interest
950,000$ 141,550$ -$ 38,000$ -$ 38,000$ 266,000$
2,500,000 193,125 500,000 96,562 85,000 595,000
3,375,000 519,891 1,125,000 174,375 1,125,000 95,625 534,375
22,390,000 1,191,025 3,275,000 1,040,366 3,225,000 888,038 2,149,996
14,350,000 811,800 1,025,000 740,050 1,025,000 669,581 3,766,107
15,000,000 821,000 1,000,000 751,000 1,000,000 683,000 4,225,000
34,500,000 1,685,900 2,300,000 1,570,900 2,300,000 1,455,900 8,828,550
18,400,000 881,475 1,150,000 812,475 1,150,000 743,475 4,961,962
94
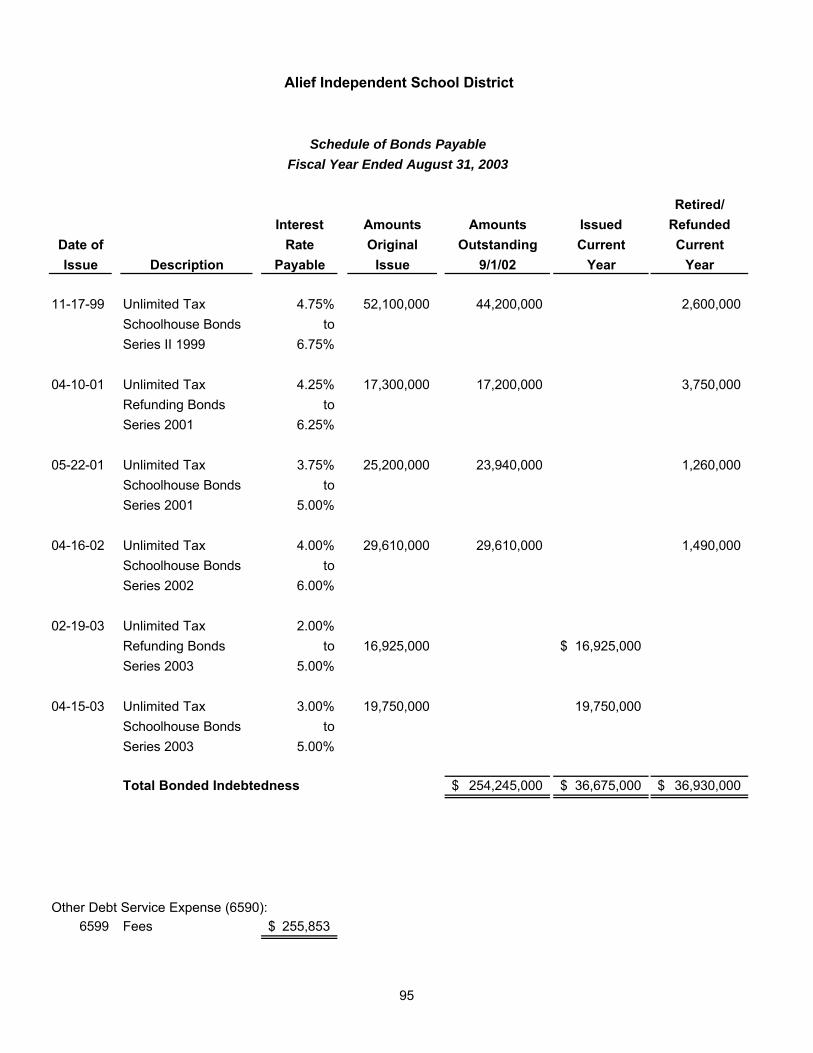
Retired/Interest Amounts Amounts Issued Refunded
Date of Rate Original Outstanding Current CurrentIssue Description Payable Issue 9/1/02 Year Year
11-17-99 Unlimited Tax 4.75% 52,100,000 44,200,000 2,600,000Schoolhouse Bonds toSeries II 1999 6.75%
04-10-01 Unlimited Tax 4.25% 17,300,000 17,200,000 3,750,000Refunding Bonds toSeries 2001 6.25%
05-22-01 Unlimited Tax 3.75% 25,200,000 23,940,000 1,260,000Schoolhouse Bonds toSeries 2001 5.00%
04-16-02 Unlimited Tax 4.00% 29,610,000 29,610,000 1,490,000Schoolhouse Bonds toSeries 2002 6.00%
02-19-03 Unlimited Tax 2.00%Refunding Bonds to 16,925,000 16,925,000$ Series 2003 5.00%
04-15-03 Unlimited Tax 3.00% 19,750,000 19,750,000Schoolhouse Bonds toSeries 2003 5.00%
Total Bonded Indebtedness 254,245,000$ 36,675,000$ 36,930,000$
Other Debt Service Expense (6590):6599 Fees 255,853$
Schedule of Bonds PayableFiscal Year Ended August 31, 2003
Alief Independent School District
95
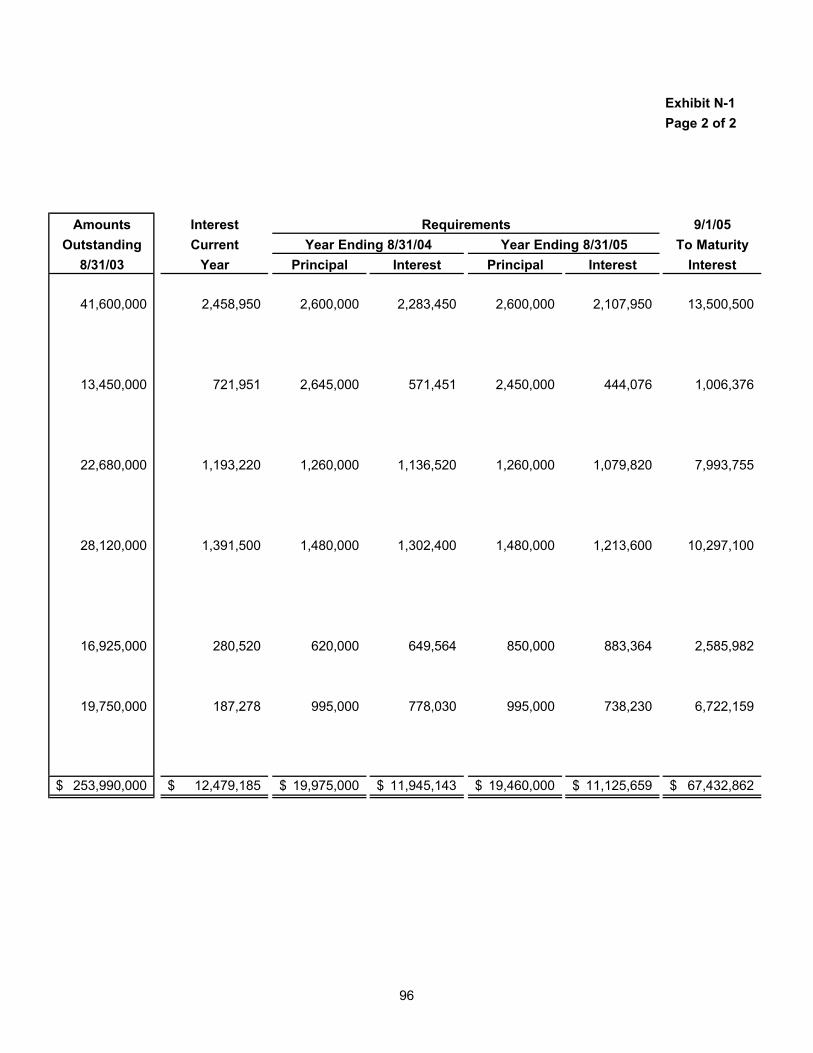
Exhibit N-1 Page 2 of 2
Amounts Interest Requirements 9/1/05Outstanding Current Year Ending 8/31/04 Year Ending 8/31/05 To Maturity
8/31/03 Year Principal Interest Principal Interest Interest
41,600,000 2,458,950 2,600,000 2,283,450 2,600,000 2,107,950 13,500,500
13,450,000 721,951 2,645,000 571,451 2,450,000 444,076 1,006,376
22,680,000 1,193,220 1,260,000 1,136,520 1,260,000 1,079,820 7,993,755
28,120,000 1,391,500 1,480,000 1,302,400 1,480,000 1,213,600 10,297,100
16,925,000 280,520 620,000 649,564 850,000 883,364 2,585,982
19,750,000 187,278 995,000 778,030 995,000 738,230 6,722,159
253,990,000$ 12,479,185$ 19,975,000$ 11,945,143$ 19,460,000$ 11,125,659$ 67,432,862$
96
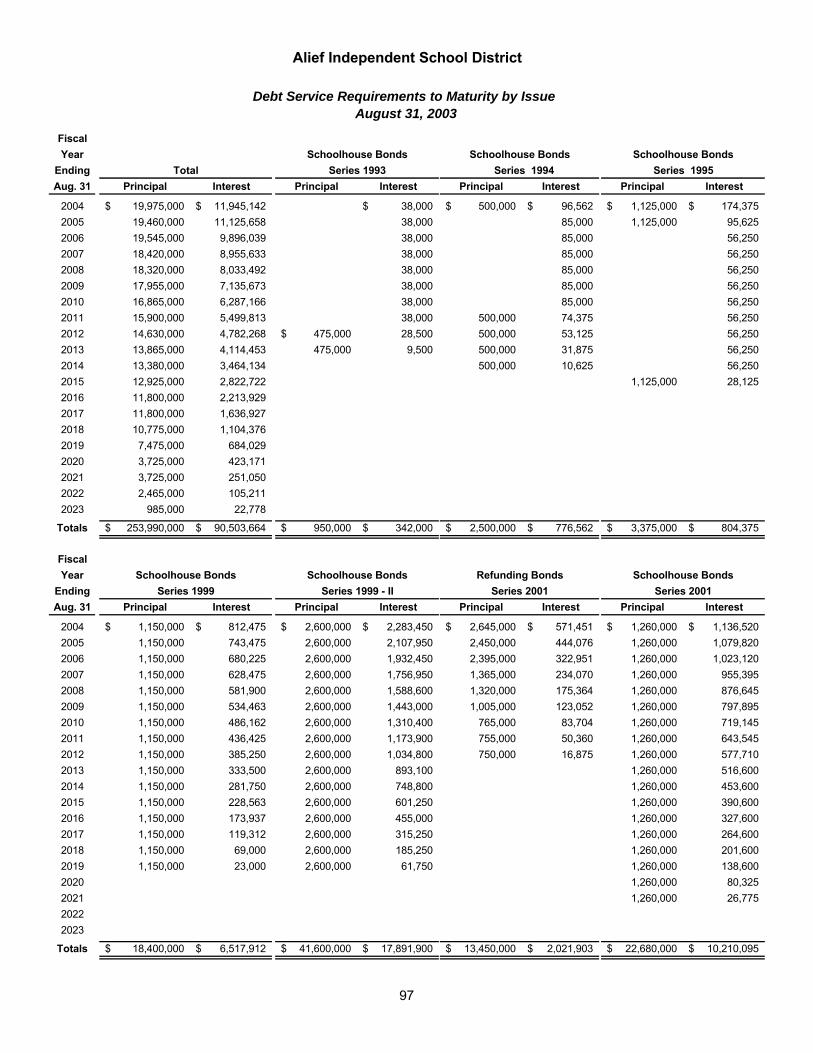
FiscalYear Schoolhouse Bonds Schoolhouse Bonds Schoolhouse Bonds
Ending Total Series 1993 Series 1994 Series 1995Aug. 31 Principal Interest Principal Interest Principal Interest Principal Interest
2004 19,975,000$ 11,945,142$ 38,000$ 500,000$ 96,562$ 1,125,000$ 174,375$ 2005 19,460,000 11,125,658 38,000 85,000 1,125,000 95,6252006 19,545,000 9,896,039 38,000 85,000 56,2502007 18,420,000 8,955,633 38,000 85,000 56,2502008 18,320,000 8,033,492 38,000 85,000 56,2502009 17,955,000 7,135,673 38,000 85,000 56,2502010 16,865,000 6,287,166 38,000 85,000 56,2502011 15,900,000 5,499,813 38,000 500,000 74,375 56,2502012 14,630,000 4,782,268 475,000$ 28,500 500,000 53,125 56,2502013 13,865,000 4,114,453 475,000 9,500 500,000 31,875 56,2502014 13,380,000 3,464,134 500,000 10,625 56,2502015 12,925,000 2,822,722 1,125,000 28,1252016 11,800,000 2,213,929 2017 11,800,000 1,636,927 2018 10,775,000 1,104,376 2019 7,475,000 684,029 2020 3,725,000 423,171 2021 3,725,000 251,050 2022 2,465,000 105,211 2023 985,000 22,778
Totals 253,990,000$ 90,503,664$ 950,000$ 342,000$ 2,500,000$ 776,562$ 3,375,000$ 804,375$
FiscalYear Schoolhouse Bonds Schoolhouse Bonds Refunding Bonds Schoolhouse Bonds
Ending Series 1999 Series 1999 - II Series 2001 Series 2001Aug. 31 Principal Interest Principal Interest Principal Interest Principal Interest
2004 1,150,000$ 812,475$ 2,600,000$ 2,283,450$ 2,645,000$ 571,451$ 1,260,000$ 1,136,520$ 2005 1,150,000 743,475 2,600,000 2,107,950 2,450,000 444,076 1,260,000 1,079,8202006 1,150,000 680,225 2,600,000 1,932,450 2,395,000 322,951 1,260,000 1,023,1202007 1,150,000 628,475 2,600,000 1,756,950 1,365,000 234,070 1,260,000 955,3952008 1,150,000 581,900 2,600,000 1,588,600 1,320,000 175,364 1,260,000 876,6452009 1,150,000 534,463 2,600,000 1,443,000 1,005,000 123,052 1,260,000 797,8952010 1,150,000 486,162 2,600,000 1,310,400 765,000 83,704 1,260,000 719,1452011 1,150,000 436,425 2,600,000 1,173,900 755,000 50,360 1,260,000 643,5452012 1,150,000 385,250 2,600,000 1,034,800 750,000 16,875 1,260,000 577,7102013 1,150,000 333,500 2,600,000 893,100 1,260,000 516,6002014 1,150,000 281,750 2,600,000 748,800 1,260,000 453,6002015 1,150,000 228,563 2,600,000 601,250 1,260,000 390,6002016 1,150,000 173,937 2,600,000 455,000 1,260,000 327,6002017 1,150,000 119,312 2,600,000 315,250 1,260,000 264,6002018 1,150,000 69,000 2,600,000 185,250 1,260,000 201,6002019 1,150,000 23,000 2,600,000 61,750 1,260,000 138,6002020 1,260,000 80,3252021 1,260,000 26,77520222023
Totals 18,400,000$ 6,517,912$ 41,600,000$ 17,891,900$ 13,450,000$ 2,021,903$ 22,680,000$ 10,210,095$
Alief Independent School District
Debt Service Requirements to Maturity by Issue August 31, 2003
97
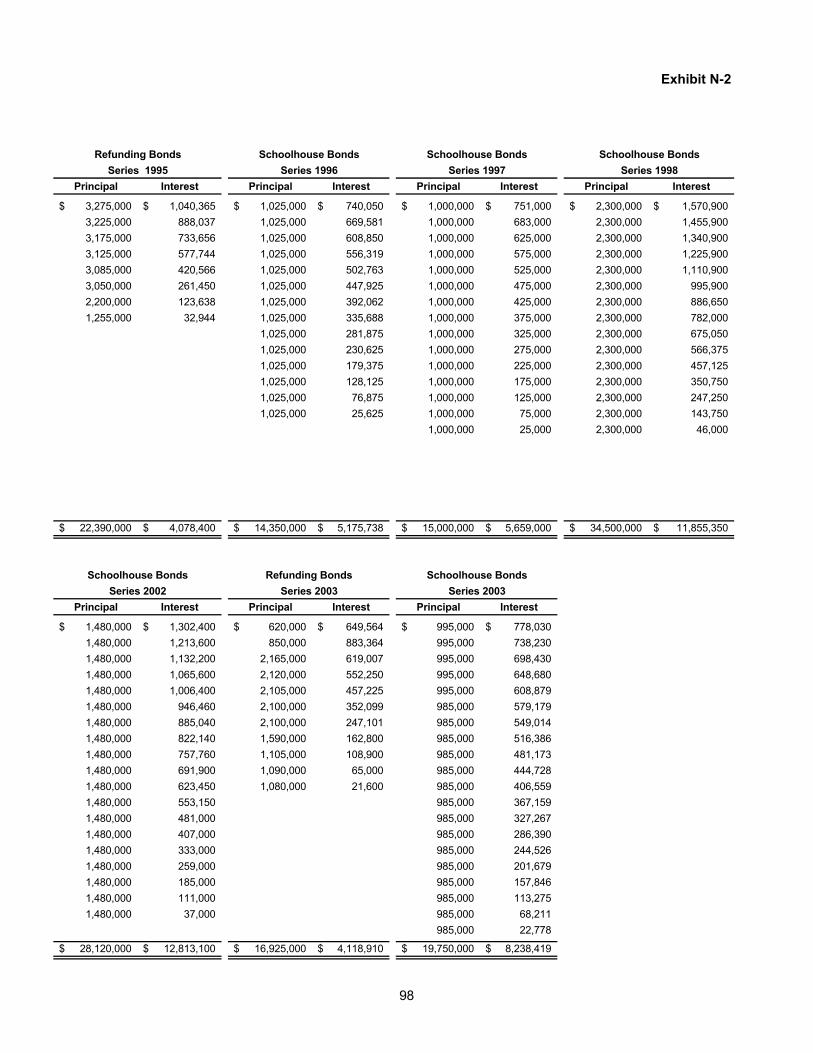
Exhibit N-2
Refunding Bonds Schoolhouse Bonds Schoolhouse BondsSeries 1995 Series 1996 Series 1997 Series 1998
Principal Interest Principal Interest Principal Interest Principal Interest
3,275,000$ 1,040,365$ 1,025,000$ 740,050$ 1,000,000$ 751,000$ 2,300,000$ 1,570,900$ 3,225,000 888,037 1,025,000 669,581 1,000,000 683,000 2,300,000 1,455,9003,175,000 733,656 1,025,000 608,850 1,000,000 625,000 2,300,000 1,340,9003,125,000 577,744 1,025,000 556,319 1,000,000 575,000 2,300,000 1,225,9003,085,000 420,566 1,025,000 502,763 1,000,000 525,000 2,300,000 1,110,9003,050,000 261,450 1,025,000 447,925 1,000,000 475,000 2,300,000 995,9002,200,000 123,638 1,025,000 392,062 1,000,000 425,000 2,300,000 886,6501,255,000 32,944 1,025,000 335,688 1,000,000 375,000 2,300,000 782,000
1,025,000 281,875 1,000,000 325,000 2,300,000 675,0501,025,000 230,625 1,000,000 275,000 2,300,000 566,3751,025,000 179,375 1,000,000 225,000 2,300,000 457,1251,025,000 128,125 1,000,000 175,000 2,300,000 350,7501,025,000 76,875 1,000,000 125,000 2,300,000 247,2501,025,000 25,625 1,000,000 75,000 2,300,000 143,750
1,000,000 25,000 2,300,000 46,000
22,390,000$ 4,078,400$ 14,350,000$ 5,175,738$ 15,000,000$ 5,659,000$ 34,500,000$ 11,855,350$
Schoolhouse Bonds Refunding Bonds Schoolhouse BondsSeries 2002 Series 2003 Series 2003
Principal Interest Principal Interest Principal Interest
1,480,000$ 1,302,400$ 620,000$ 649,564$ 995,000$ 778,030$ 1,480,000 1,213,600 850,000 883,364 995,000 738,2301,480,000 1,132,200 2,165,000 619,007 995,000 698,4301,480,000 1,065,600 2,120,000 552,250 995,000 648,6801,480,000 1,006,400 2,105,000 457,225 995,000 608,8791,480,000 946,460 2,100,000 352,099 985,000 579,1791,480,000 885,040 2,100,000 247,101 985,000 549,0141,480,000 822,140 1,590,000 162,800 985,000 516,3861,480,000 757,760 1,105,000 108,900 985,000 481,1731,480,000 691,900 1,090,000 65,000 985,000 444,7281,480,000 623,450 1,080,000 21,600 985,000 406,5591,480,000 553,150 985,000 367,1591,480,000 481,000 985,000 327,2671,480,000 407,000 985,000 286,3901,480,000 333,000 985,000 244,5261,480,000 259,000 985,000 201,6791,480,000 185,000 985,000 157,8461,480,000 111,000 985,000 113,2751,480,000 37,000 985,000 68,211
985,000 22,778
28,120,000$ 12,813,100$ 16,925,000$ 4,118,910$ 19,750,000$ 8,238,419$
Schoolhouse Bonds
98

This page intentionally blank.

Alief
Compliance Schedules
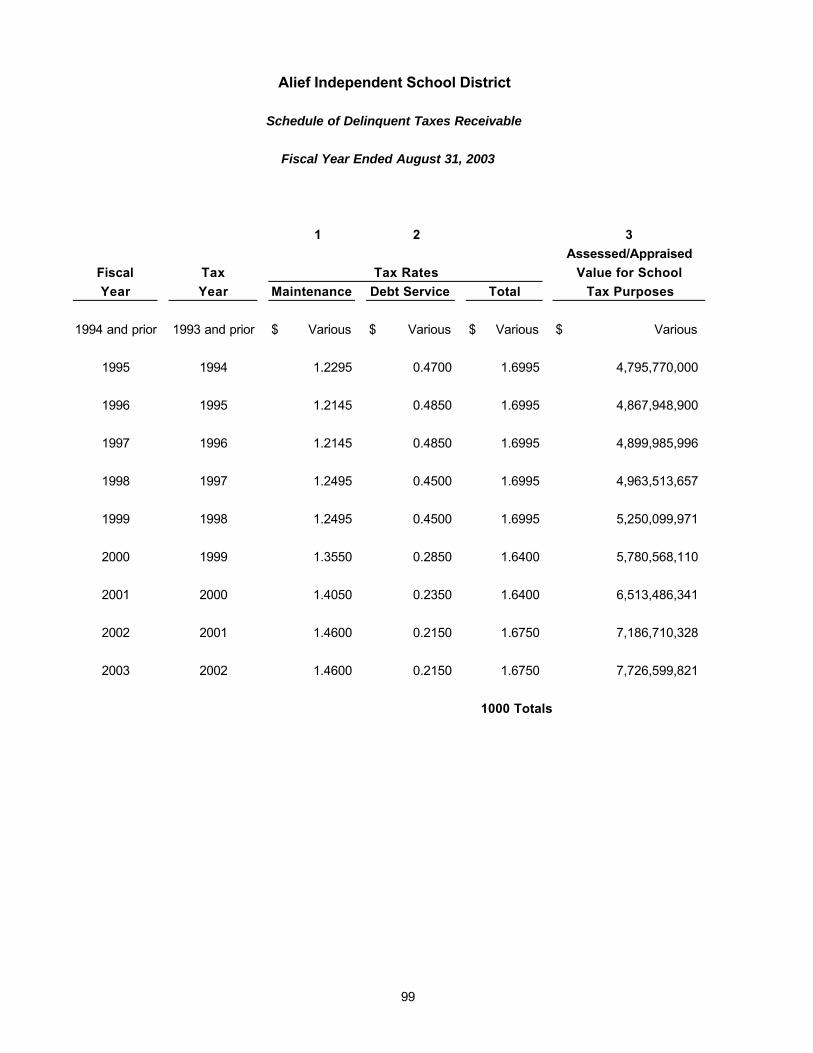
1 2
Fiscal TaxYear Year
1994 and prior 1993 and prior $ Various $ Various $ Various $ Various
1995 1994 1.2295 0.4700 1.6995 4,795,770,000
1996 1995 1.2145 0.4850 1.6995 4,867,948,900
1997 1996 1.2145 0.4850 1.6995 4,899,985,996
1998 1997 1.2495 0.4500 1.6995 4,963,513,657
1999 1998 1.2495 0.4500 1.6995 5,250,099,971
2000 1999 1.3550 0.2850 1.6400 5,780,568,110
2001 2000 1.4050 0.2350 1.6400 6,513,486,341
2002 2001 1.4600 0.2150 1.6750 7,186,710,328
2003 2002 1.4600 0.2150 1.6750 7,726,599,821
1000 Totals
Debt Service Total
Alief Independent School District
Schedule of Delinquent Taxes Receivable
Fiscal Year Ended August 31, 2003
3Assessed/Appraised
Value for SchoolTax Purposes
Tax RatesMaintenance
99
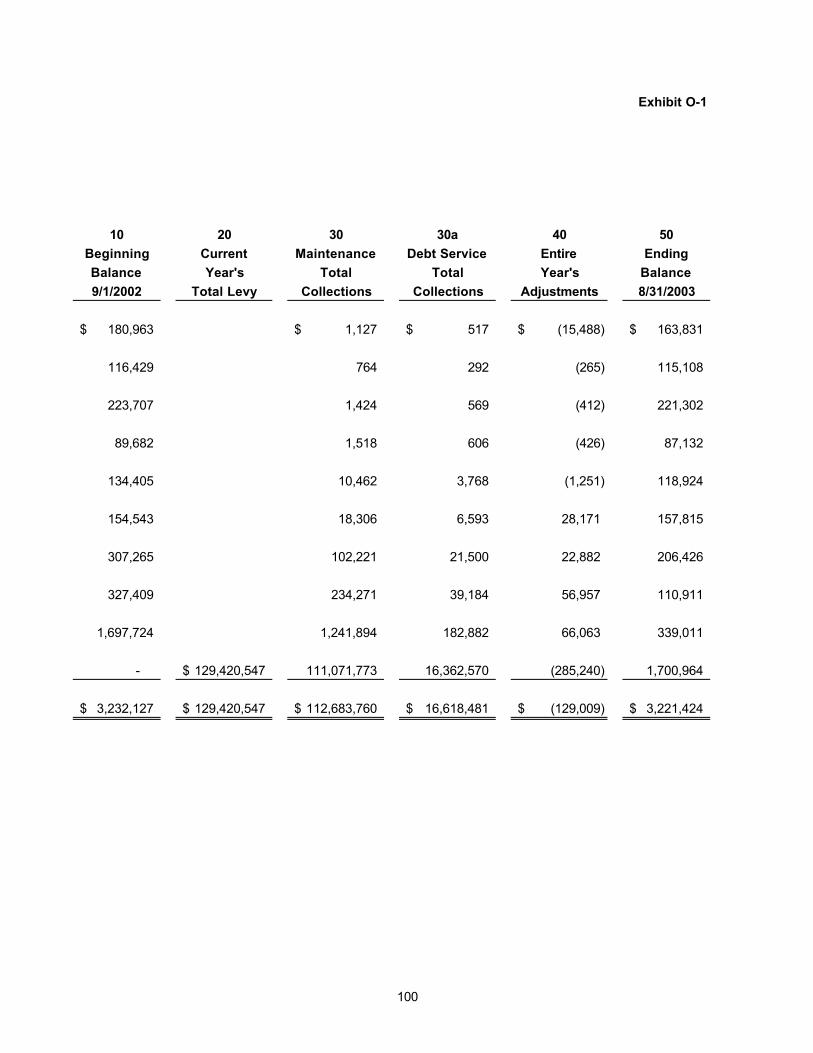
Exhibit O-1
10 20 30 30a 40 50Beginning Current Maintenance Debt Service Entire EndingBalance Year's Total Total Year's Balance9/1/2002 Total Levy Collections Collections Adjustments 8/31/2003
180,963$ 1,127$ 517$ (15,488)$ 163,831$
116,429 764 292 (265) 115,108
223,707 1,424 569 (412) 221,302
89,682 1,518 606 (426) 87,132
134,405 10,462 3,768 (1,251) 118,924
154,543 18,306 6,593 28,171 157,815
307,265 102,221 21,500 22,882 206,426
327,409 234,271 39,184 56,957 110,911
1,697,724 1,241,894 182,882 66,063 339,011
- 129,420,547$ 111,071,773 16,362,570 (285,240) 1,700,964
3,232,127$ 129,420,547$ 112,683,760$ 16,618,481$ (129,009)$ 3,221,424$
100
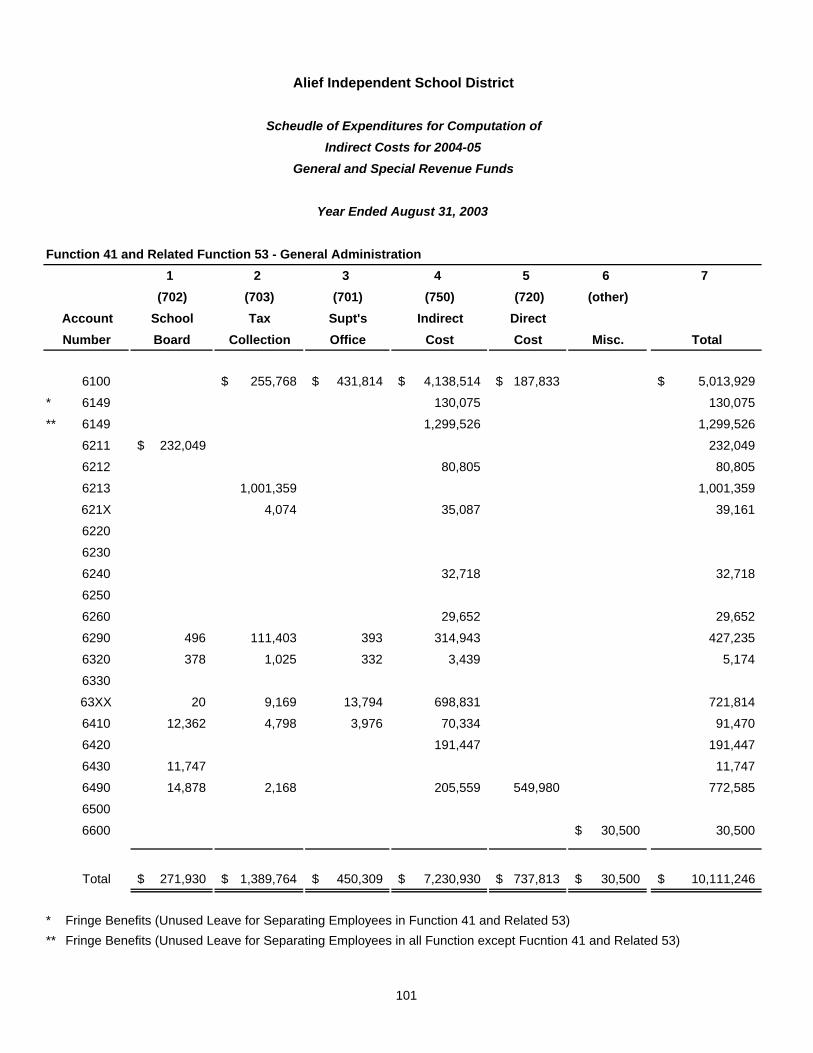
Function 41 and Related Function 53 - General Administration1 2 3 4 5 6 7
(702) (703) (701) (750) (720) (other)School Tax Supt's Indirect DirectBoard Collection Office Cost Cost Misc. Total
6100 255,768$ 431,814$ 4,138,514$ 187,833$ 5,013,929$
* 6149 130,075 130,075
** 6149 1,299,526 1,299,526
6211 232,049$ 232,049
6212 80,805 80,805
6213 1,001,359 1,001,359
621X 4,074 35,087 39,161
6220
6230
6240 32,718 32,718
6250
6260 29,652 29,652
6290 496 111,403 393 314,943 427,235
6320 378 1,025 332 3,439 5,174
6330
63XX 20 9,169 13,794 698,831 721,814
6410 12,362 4,798 3,976 70,334 91,470
6420 191,447 191,447
6430 11,747 11,747
6490 14,878 2,168 205,559 549,980 772,585
6500
6600 30,500$ 30,500
Total 271,930$ 1,389,764$ 450,309$ 7,230,930$ 737,813$ 30,500$ 10,111,246$
* Fringe Benefits (Unused Leave for Separating Employees in Function 41 and Related 53)** Fringe Benefits (Unused Leave for Separating Employees in all Function except Fucntion 41 and Related 53)
AccountNumber
Alief Independent School District
Scheudle of Expenditures for Computation ofIndirect Costs for 2004-05
General and Special Revenue Funds
Year Ended August 31, 2003
101
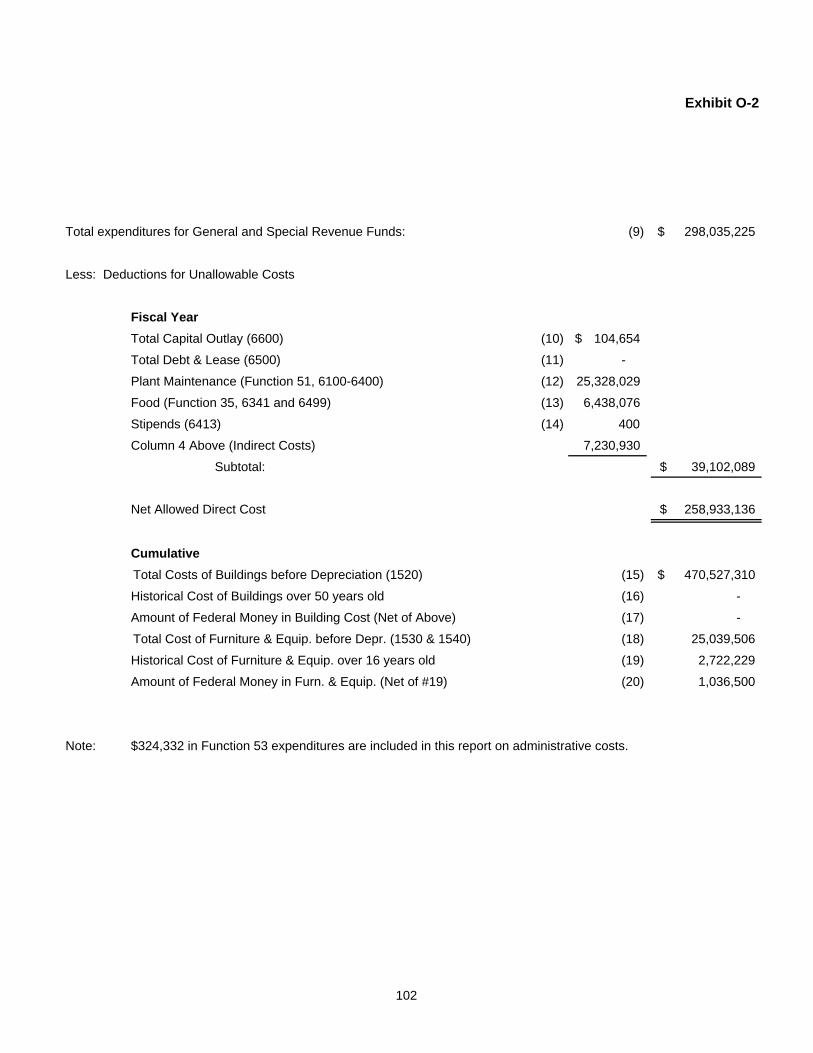
Exhibit O-2
Total expenditures for General and Special Revenue Funds: (9) 298,035,225$
Less: Deductions for Unallowable Costs
Fiscal YearTotal Capital Outlay (6600) (10) 104,654$
Total Debt & Lease (6500) (11) -
Plant Maintenance (Function 51, 6100-6400) (12) 25,328,029
Food (Function 35, 6341 and 6499) (13) 6,438,076
Stipends (6413) (14) 400
Column 4 Above (Indirect Costs) 7,230,930
Subtotal: 39,102,089$
Net Allowed Direct Cost 258,933,136$
CumulativeTotal Costs of Buildings before Depreciation (1520) (15) 470,527,310$
Historical Cost of Buildings over 50 years old (16) -
Amount of Federal Money in Building Cost (Net of Above) (17) -
Total Cost of Furniture & Equip. before Depr. (1530 & 1540) (18) 25,039,506
Historical Cost of Furniture & Equip. over 16 years old (19) 2,722,229
Amount of Federal Money in Furn. & Equip. (Net of #19) (20) 1,036,500
Note: $324,332 in Function 53 expenditures are included in this report on administrative costs.
102

This page intentionally blank.
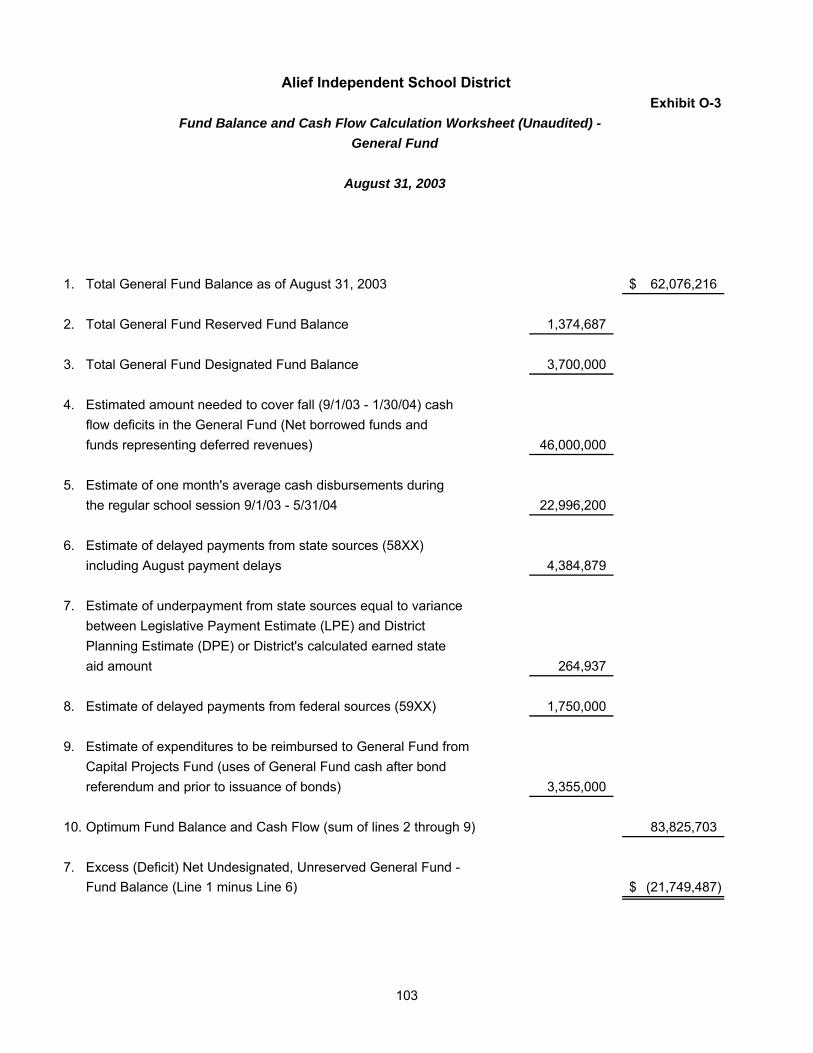
Exhibit O-3
1. Total General Fund Balance as of August 31, 2003 62,076,216$
2. Total General Fund Reserved Fund Balance 1,374,687
3. Total General Fund Designated Fund Balance 3,700,000
4. Estimated amount needed to cover fall (9/1/03 - 1/30/04) cash flow deficits in the General Fund (Net borrowed funds and funds representing deferred revenues) 46,000,000
5. Estimate of one month's average cash disbursements during the regular school session 9/1/03 - 5/31/04 22,996,200
6. Estimate of delayed payments from state sources (58XX)including August payment delays 4,384,879
7. Estimate of underpayment from state sources equal to variancebetween Legislative Payment Estimate (LPE) and DistrictPlanning Estimate (DPE) or District's calculated earned stateaid amount 264,937
8. Estimate of delayed payments from federal sources (59XX) 1,750,000
9. Estimate of expenditures to be reimbursed to General Fund fromCapital Projects Fund (uses of General Fund cash after bondreferendum and prior to issuance of bonds) 3,355,000
10. Optimum Fund Balance and Cash Flow (sum of lines 2 through 9) 83,825,703
7. Excess (Deficit) Net Undesignated, Unreserved General Fund - Fund Balance (Line 1 minus Line 6) (21,749,487)$
Alief Independent School District
Fund Balance and Cash Flow Calculation Worksheet (Unaudited) - General Fund
August 31, 2003
103

This page intentionally blank.

Alief
Unaudited Statistical Section
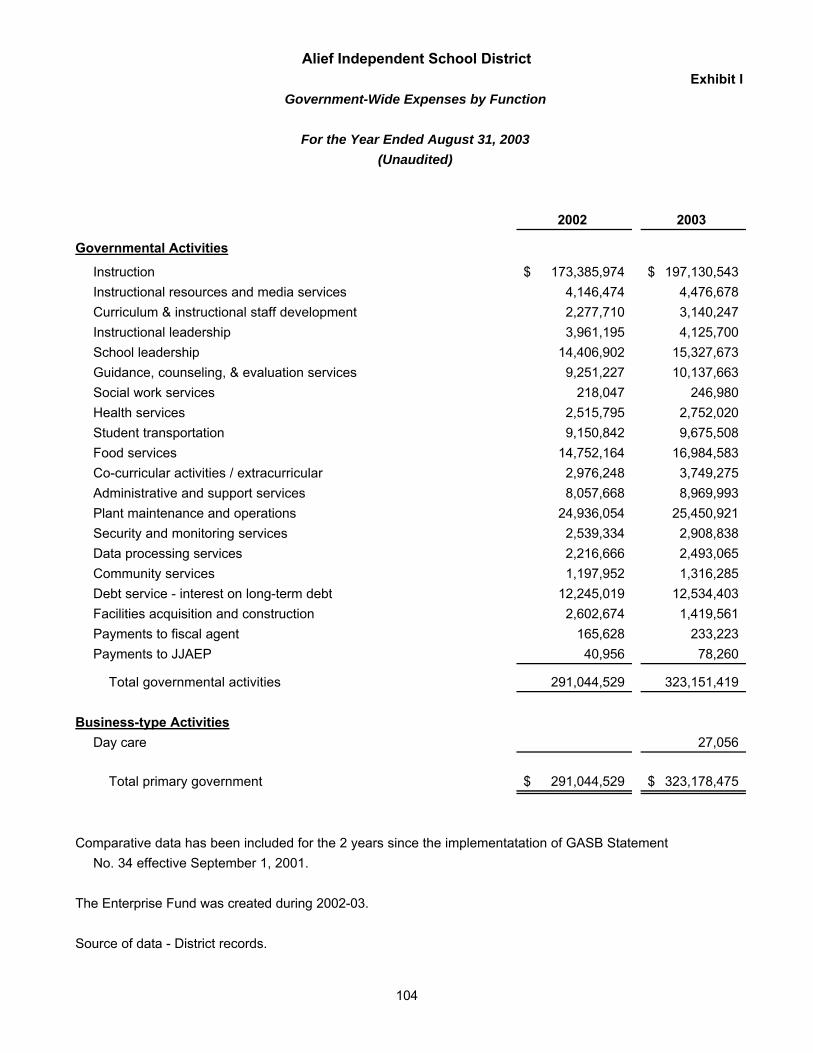
Exhibit I
2002 2003
Governmental Activities
Instruction 173,385,974$ 197,130,543$ Instructional resources and media services 4,146,474 4,476,678 Curriculum & instructional staff development 2,277,710 3,140,247 Instructional leadership 3,961,195 4,125,700 School leadership 14,406,902 15,327,673 Guidance, counseling, & evaluation services 9,251,227 10,137,663 Social work services 218,047 246,980 Health services 2,515,795 2,752,020 Student transportation 9,150,842 9,675,508 Food services 14,752,164 16,984,583 Co-curricular activities / extracurricular 2,976,248 3,749,275 Administrative and support services 8,057,668 8,969,993 Plant maintenance and operations 24,936,054 25,450,921 Security and monitoring services 2,539,334 2,908,838 Data processing services 2,216,666 2,493,065 Community services 1,197,952 1,316,285 Debt service - interest on long-term debt 12,245,019 12,534,403 Facilities acquisition and construction 2,602,674 1,419,561 Payments to fiscal agent 165,628 233,223
TotalPayments to JJAEP 40,956 78,260
Total governmental activities 291,044,529 323,151,419
Business-type ActivitiesDay care 27,056
Total primary government 291,044,529$ 323,178,475$
Comparative data has been included for the 2 years since the implementatation of GASB Statement No. 34 effective September 1, 2001.
The Enterprise Fund was created during 2002-03.
Source of data - District records.
For the Year Ended August 31, 2003
Government-Wide Expenses by Function
Alief Independent School District
(Unaudited)
104
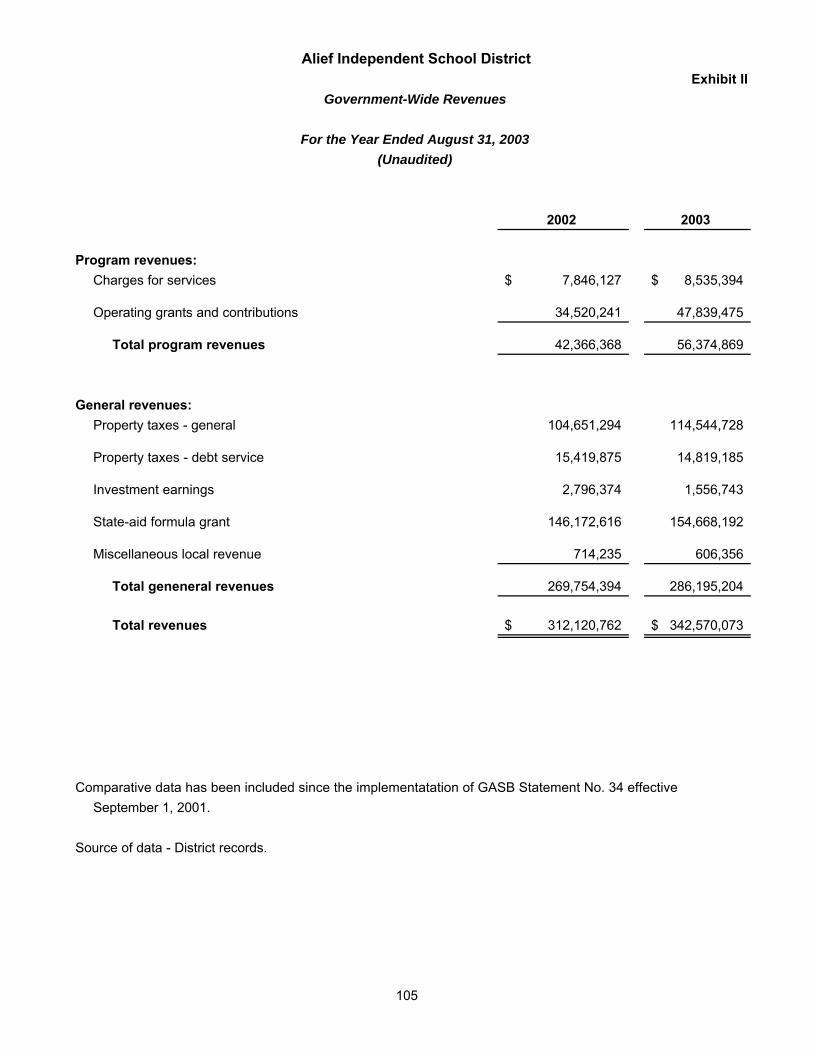
Exhibit II
2002 2003
Program revenues:Charges for services 7,846,127$ 8,535,394$
Operating grants and contributions 34,520,241 47,839,475
Total program revenues 42,366,368 56,374,869
General revenues:Property taxes - general 104,651,294 114,544,728
Property taxes - debt service 15,419,875 14,819,185
Investment earnings 2,796,374 1,556,743
State-aid formula grant 146,172,616 154,668,192
Miscellaneous local revenue 714,235 606,356
Total geneneral revenues 269,754,394 286,195,204
Total revenues 312,120,762$ 342,570,073$
Comparative data has been included since the implementatation of GASB Statement No. 34 effectiveSeptember 1, 2001.
Source of data - District records.
Alief Independent School District
Government-Wide Revenues
For the Year Ended August 31, 2003(Unaudited)
105
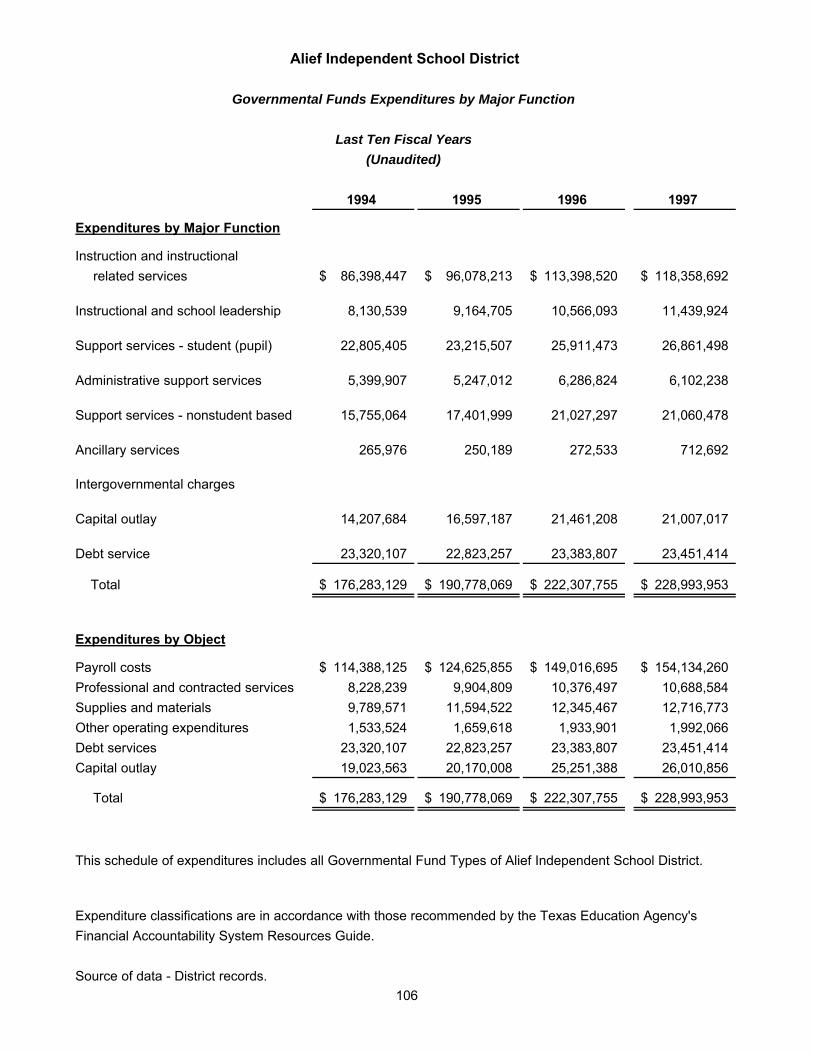
1994 1995 1996 1997
Expenditures by Major Function
Instruction and instructional related services 86,398,447$ 96,078,213$ 113,398,520$ 118,358,692$
Instructional and school leadership 8,130,539 9,164,705 10,566,093 11,439,924
Support services - student (pupil) 22,805,405 23,215,507 25,911,473 26,861,498
Administrative support services 5,399,907 5,247,012 6,286,824 6,102,238
Support services - nonstudent based 15,755,064 17,401,999 21,027,297 21,060,478
Ancillary services 265,976 250,189 272,533 712,692
Intergovernmental charges
Capital outlay 14,207,684 16,597,187 21,461,208 21,007,017
Debt service 23,320,107 22,823,257 23,383,807 23,451,414
Total 176,283,129$ 190,778,069$ 222,307,755$ 228,993,953$
Expenditures by Object
Payroll costs 114,388,125$ 124,625,855$ 149,016,695$ 154,134,260$ Professional and contracted services 8,228,239 9,904,809 10,376,497 10,688,584Supplies and materials 9,789,571 11,594,522 12,345,467 12,716,773Other operating expenditures 1,533,524 1,659,618 1,933,901 1,992,066Debt services 23,320,107 22,823,257 23,383,807 23,451,414 Capital outlay 19,023,563 20,170,008 25,251,388 26,010,856
Total 176,283,129$ 190,778,069$ 222,307,755$ 228,993,953$
This schedule of expenditures includes all Governmental Fund Types of Alief Independent School District.
Expenditure classifications are in accordance with those recommended by the Texas Education Agency'sFinancial Accountability System Resources Guide.
Source of data - District records.
Alief Independent School District
Governmental Funds Expenditures by Major Function
Last Ten Fiscal Years(Unaudited)
106
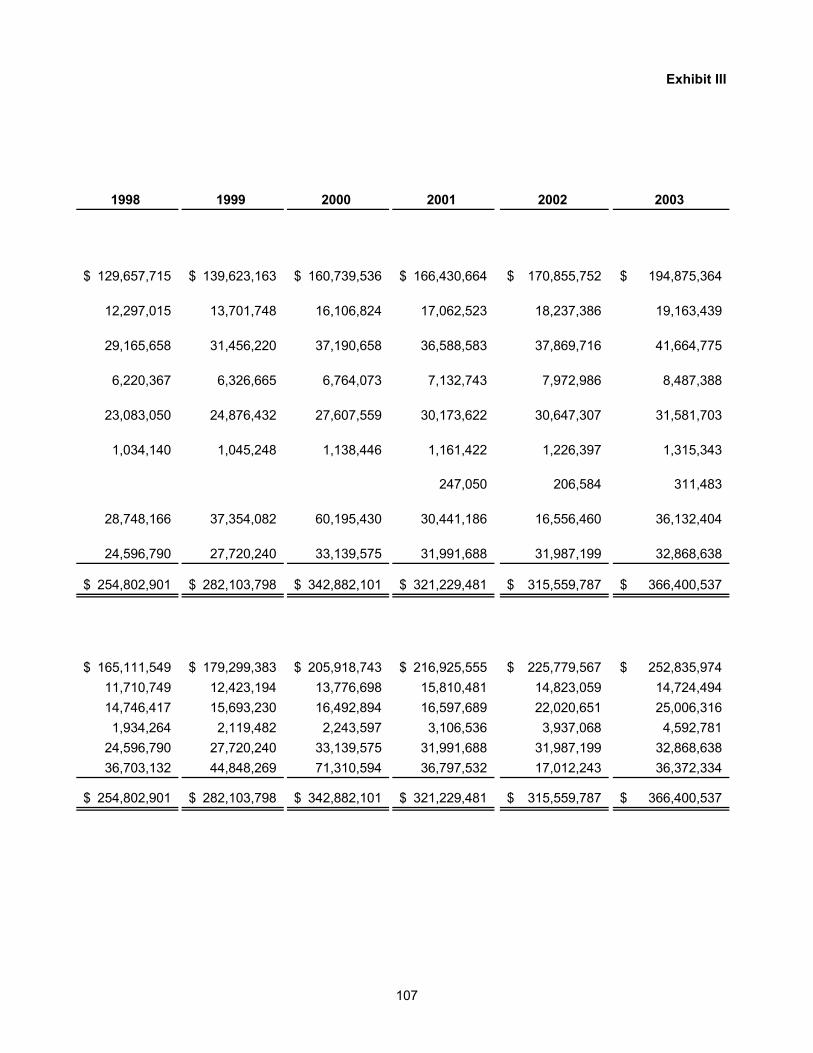
Exhibit III
1998 1999 2000 2001 2002 2003
129,657,715$ 139,623,163$ 160,739,536$ 166,430,664$ 170,855,752$ 194,875,364$
12,297,015 13,701,748 16,106,824 17,062,523 18,237,386 19,163,439
29,165,658 31,456,220 37,190,658 36,588,583 37,869,716 41,664,775
6,220,367 6,326,665 6,764,073 7,132,743 7,972,986 8,487,388
23,083,050 24,876,432 27,607,559 30,173,622 30,647,307 31,581,703
1,034,140 1,045,248 1,138,446 1,161,422 1,226,397 1,315,343
247,050 206,584 311,483
28,748,166 37,354,082 60,195,430 30,441,186 16,556,460 36,132,404
24,596,790 27,720,240 33,139,575 31,991,688 31,987,199 32,868,638
254,802,901$ 282,103,798$ 342,882,101$ 321,229,481$ 315,559,787$ 366,400,537$
165,111,549$ 179,299,383$ 205,918,743$ 216,925,555$ 225,779,567$ 252,835,974$ 11,710,749 12,423,194 13,776,698 15,810,481 14,823,059 14,724,49414,746,417 15,693,230 16,492,894 16,597,689 22,020,651 25,006,3161,934,264 2,119,482 2,243,597 3,106,536 3,937,068 4,592,781
24,596,790 27,720,240 33,139,575 31,991,688 31,987,199 32,868,638 36,703,132 44,848,269 71,310,594 36,797,532 17,012,243 36,372,334
254,802,901$ 282,103,798$ 342,882,101$ 321,229,481$ 315,559,787$ 366,400,537$
107
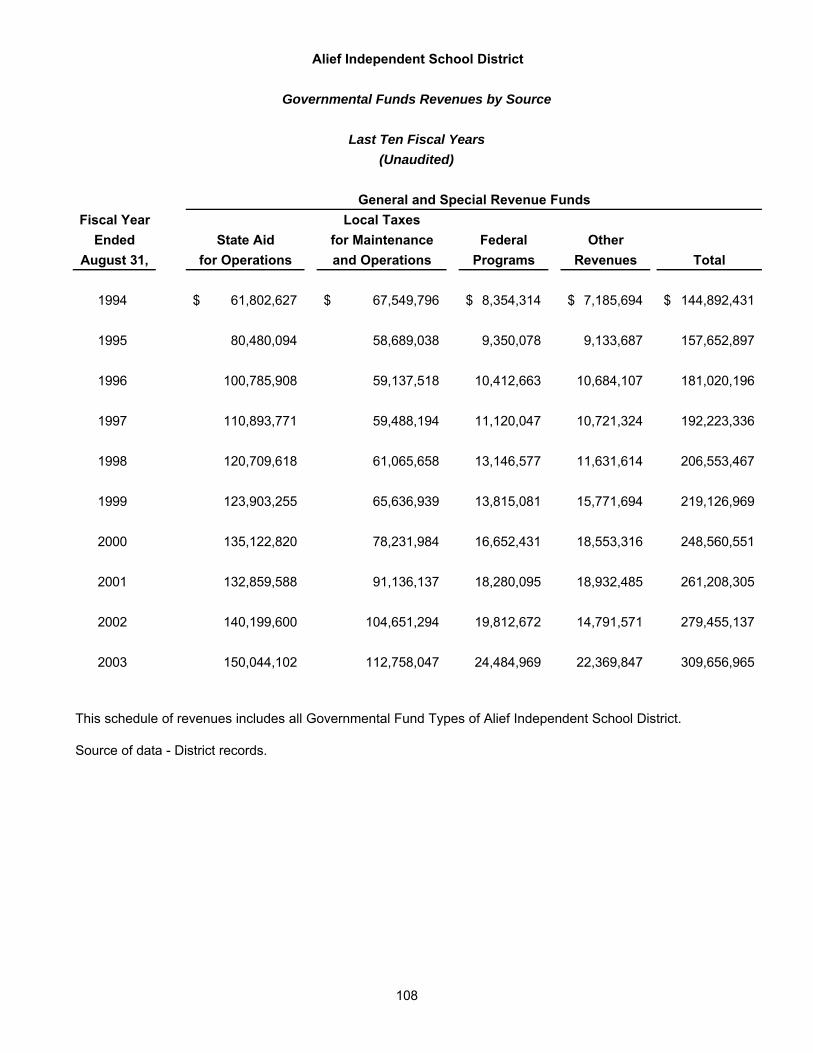
Fiscal Year Local TaxesEnded State Aid for Maintenance Federal Other
August 31, for Operations and Operations Programs Revenues Total
1994 61,802,627$ 67,549,796$ 8,354,314$ 7,185,694$ 144,892,431$
1995 80,480,094 58,689,038 9,350,078 9,133,687 157,652,897
1996 100,785,908 59,137,518 10,412,663 10,684,107 181,020,196
1997 110,893,771 59,488,194 11,120,047 10,721,324 192,223,336
1998 120,709,618 61,065,658 13,146,577 11,631,614 206,553,467
1999 123,903,255 65,636,939 13,815,081 15,771,694 219,126,969
2000 135,122,820 78,231,984 16,652,431 18,553,316 248,560,551
2001 132,859,588 91,136,137 18,280,095 18,932,485 261,208,305
2002 140,199,600 104,651,294 19,812,672 14,791,571 279,455,137
2003 150,044,102 112,758,047 24,484,969 22,369,847 309,656,965
This schedule of revenues includes all Governmental Fund Types of Alief Independent School District.
Source of data - District records.
General and Special Revenue Funds
Alief Independent School District
Governmental Funds Revenues by Source
Last Ten Fiscal Years(Unaudited)
108
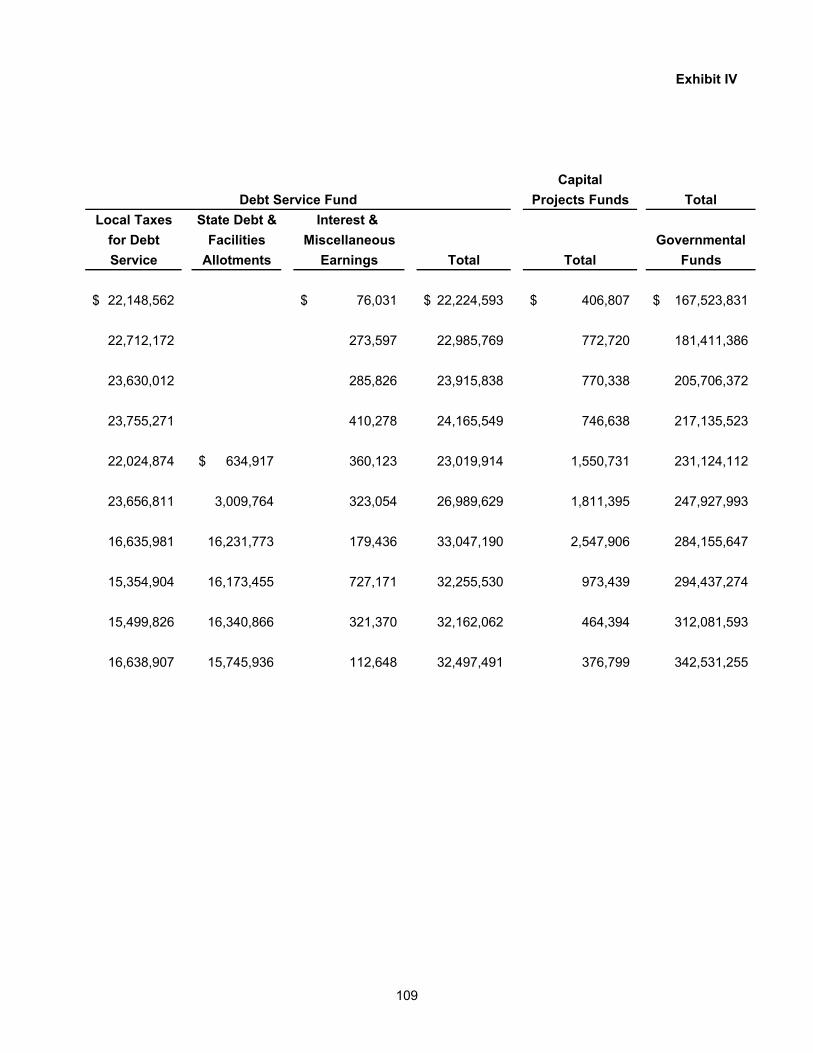
Exhibit IV
CapitalProjects Funds Total
Local Taxes State Debt & Interest & for Debt Facilities Miscellaneous GovernmentalService Allotments Earnings Total Total Funds
22,148,562$ 76,031$ 22,224,593$ 406,807$ 167,523,831$
22,712,172 273,597 22,985,769 772,720 181,411,386
23,630,012 285,826 23,915,838 770,338 205,706,372
23,755,271 410,278 24,165,549 746,638 217,135,523
22,024,874 634,917$ 360,123 23,019,914 1,550,731 231,124,112
23,656,811 3,009,764 323,054 26,989,629 1,811,395 247,927,993
16,635,981 16,231,773 179,436 33,047,190 2,547,906 284,155,647
15,354,904 16,173,455 727,171 32,255,530 973,439 294,437,274
15,499,826 16,340,866 321,370 32,162,062 464,394 312,081,593
16,638,907 15,745,936 112,648 32,497,491 376,799 342,531,255
Debt Service Fund
109
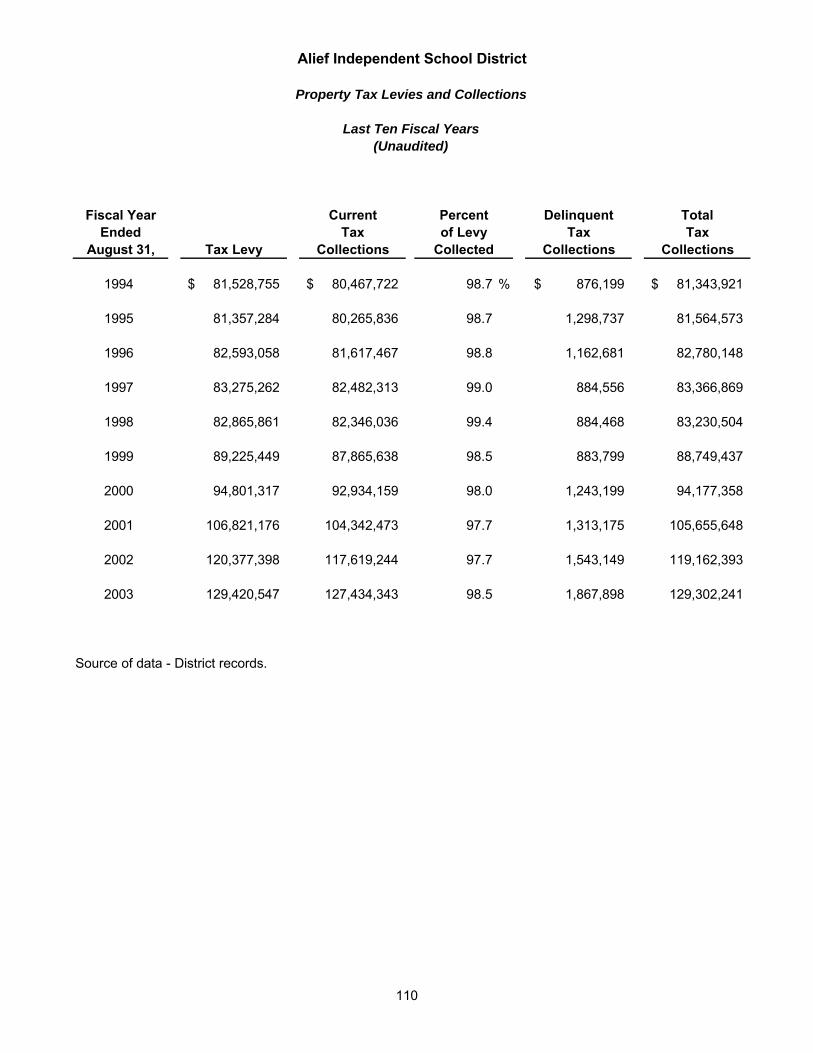
Fiscal Year Current Delinquent TotalEnded Tax Tax Tax
August 31, Tax Levy Collections Collections Collections
1994 81,528,755$ 80,467,722$ 98.7 % 876,199$ 81,343,921$
1995 81,357,284 80,265,836 98.7 1,298,737 81,564,573
1996 82,593,058 81,617,467 98.8 1,162,681 82,780,148
1997 83,275,262 82,482,313 99.0 884,556 83,366,869
1998 82,865,861 82,346,036 99.4 884,468 83,230,504
1999 89,225,449 87,865,638 98.5 883,799 88,749,437
2000 94,801,317 92,934,159 98.0 1,243,199 94,177,358
2001 106,821,176 104,342,473 97.7 1,313,175 105,655,648
2002 120,377,398 117,619,244 97.7 1,543,149 119,162,393
2003 129,420,547 127,434,343 98.5 1,867,898 129,302,241
Source of data - District records.
Percentof Levy
Collected
Alief Independent School District
Property Tax Levies and Collections
Last Ten Fiscal Years(Unaudited)
110
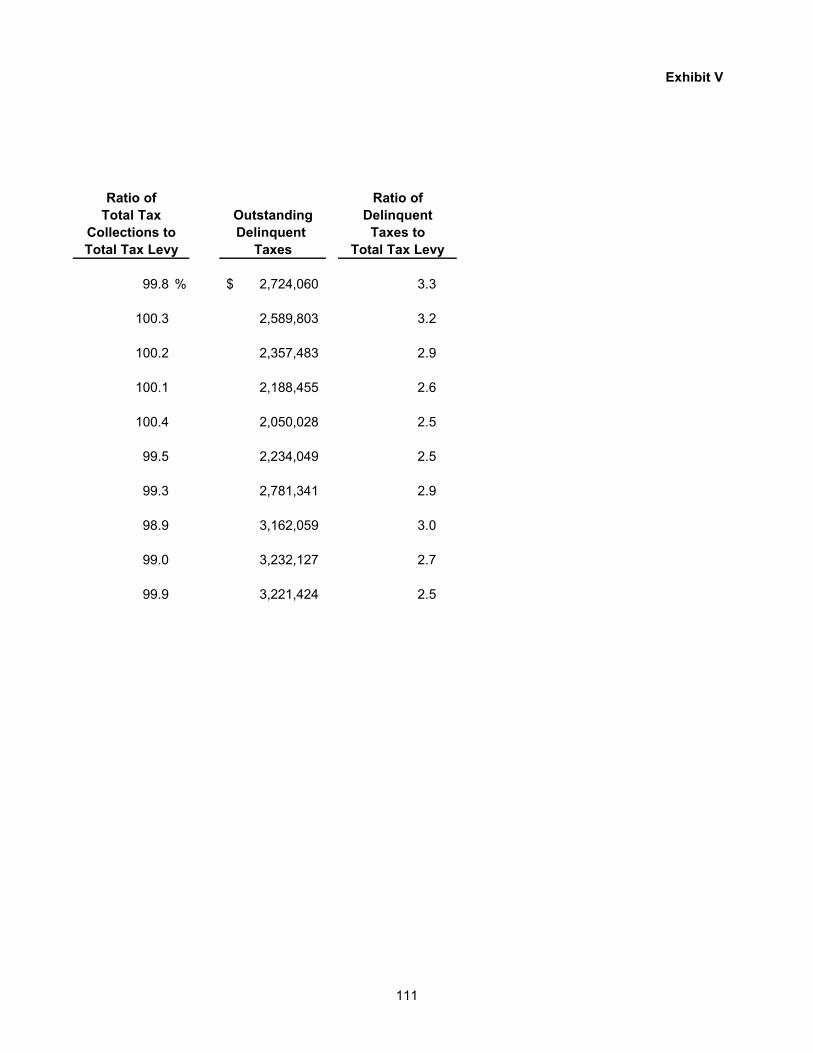
Exhibit V
OutstandingDelinquent
Taxes
99.8 % 2,724,060$ 3.3
100.3 2,589,803 3.2
100.2 2,357,483 2.9
100.1 2,188,455 2.6
100.4 2,050,028 2.5
99.5 2,234,049 2.5
99.3 2,781,341 2.9
98.9 3,162,059 3.0
99.0 3,232,127 2.7
99.9 3,221,424 2.5
Ratio ofDelinquent
Taxes toTotal Tax Levy
Ratio ofTotal Tax
Collections toTotal Tax Levy
111
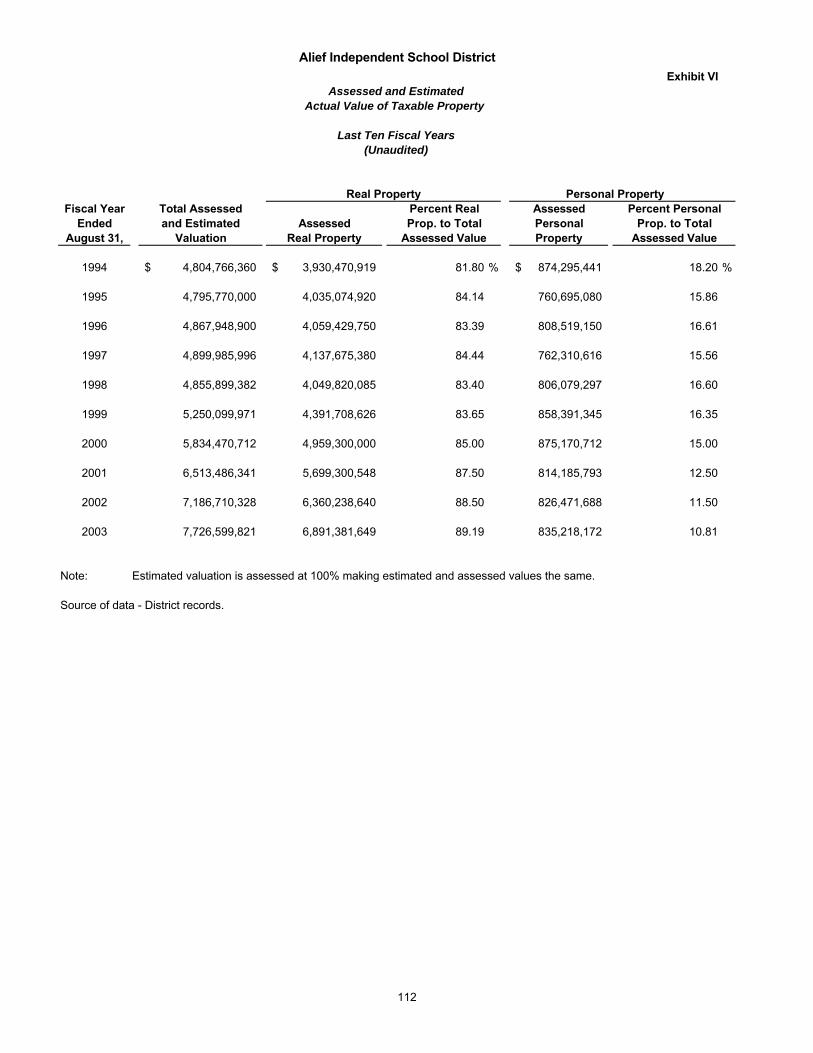
Exhibit VI
Fiscal Year Total Assessed AssessedEnded and Estimated Assessed Personal
August 31, Valuation Real Property Property
1994 4,804,766,360$ 3,930,470,919$ 81.80 % 874,295,441$ 18.20 %
1995 4,795,770,000 4,035,074,920 84.14 760,695,080 15.86
1996 4,867,948,900 4,059,429,750 83.39 808,519,150 16.61
1997 4,899,985,996 4,137,675,380 84.44 762,310,616 15.56
1998 4,855,899,382 4,049,820,085 83.40 806,079,297 16.60
1999 5,250,099,971 4,391,708,626 83.65 858,391,345 16.35
2000 5,834,470,712 4,959,300,000 85.00 875,170,712 15.00
2001 6,513,486,341 5,699,300,548 87.50 814,185,793 12.50
2002 7,186,710,328 6,360,238,640 88.50 826,471,688 11.50
2003 7,726,599,821 6,891,381,649 89.19 835,218,172 10.81
Note: Estimated valuation is assessed at 100% making estimated and assessed values the same.
Source of data - District records.
Assessed Value
Percent PersonalProp. to Total
Assessed ValueProp. to Total
Alief Independent School District
Assessed and Estimated
Percent Real
Actual Value of Taxable Property
Personal PropertyReal Property
Last Ten Fiscal Years(Unaudited)
112
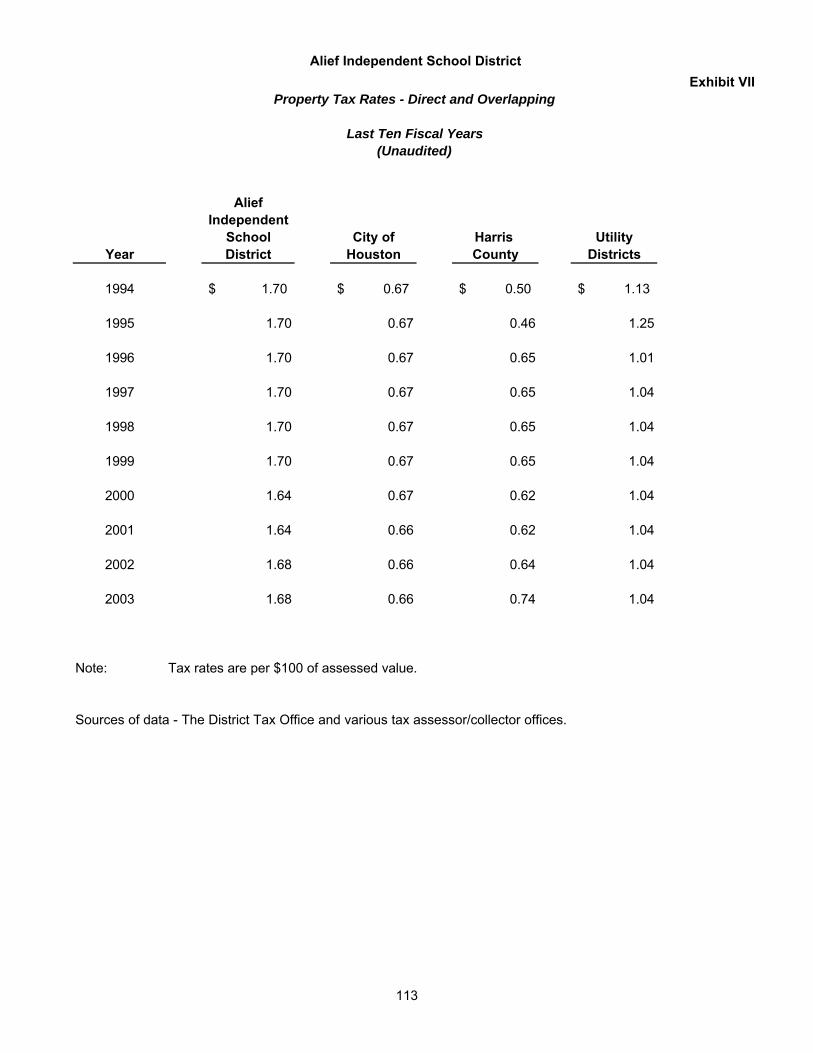
Exhibit VII
Alief Independent School City of Harris Utility
Year District Houston County Districts
1994 1.70$ 0.67$ 0.50$ 1.13$
1995 1.70 0.67 0.46 1.25
1996 1.70 0.67 0.65 1.01
1997 1.70 0.67 0.65 1.04
1998 1.70 0.67 0.65 1.04
1999 1.70 0.67 0.65 1.04
2000 1.64 0.67 0.62 1.04
2001 1.64 0.66 0.62 1.04
2002 1.68 0.66 0.64 1.04
2003 1.68 0.66 0.74 1.04
Note: Tax rates are per $100 of assessed value.
Sources of data - The District Tax Office and various tax assessor/collector offices.
Alief Independent School District
Property Tax Rates - Direct and Overlapping
Last Ten Fiscal Years(Unaudited)
113
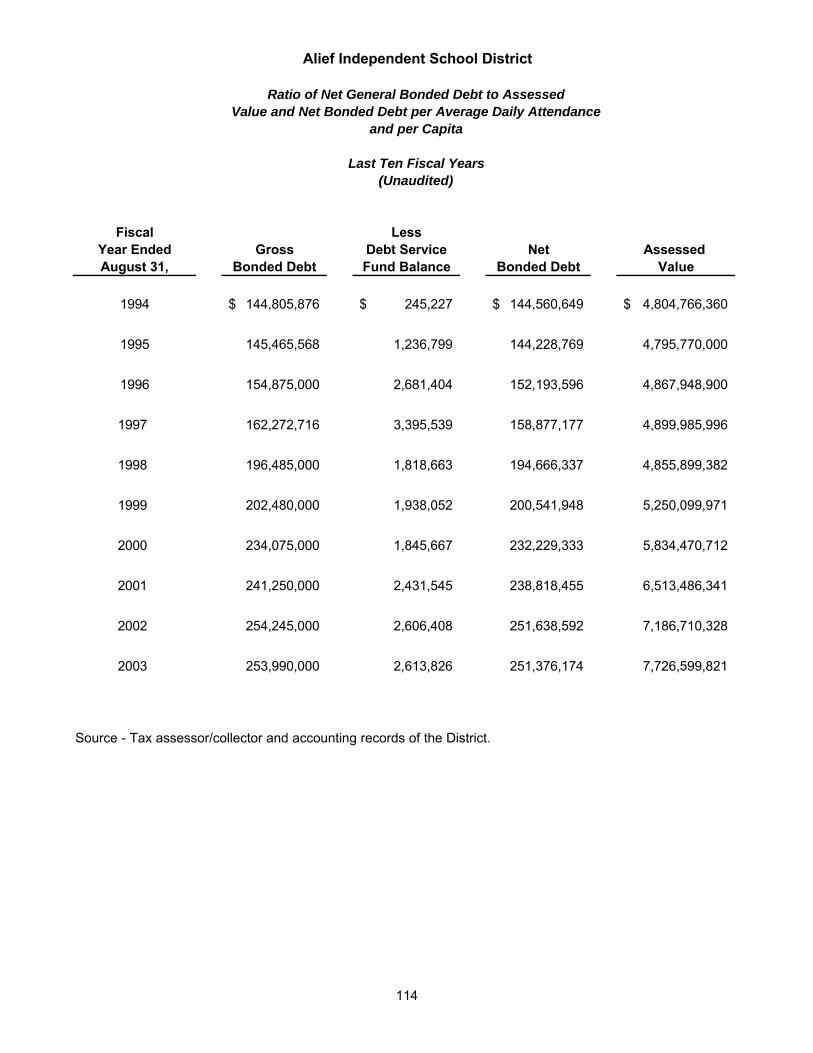
Fiscal LessYear Ended Gross Debt Service Net Assessed August 31, Bonded Debt Fund Balance Bonded Debt Value
1994 144,805,876$ 245,227$ 144,560,649$ 4,804,766,360$
1995 145,465,568 1,236,799 144,228,769 4,795,770,000
1996 154,875,000 2,681,404 152,193,596 4,867,948,900
1997 162,272,716 3,395,539 158,877,177 4,899,985,996
1998 196,485,000 1,818,663 194,666,337 4,855,899,382
1999 202,480,000 1,938,052 200,541,948 5,250,099,971
2000 234,075,000 1,845,667 232,229,333 5,834,470,712
2001 241,250,000 2,431,545 238,818,455 6,513,486,341
2002 254,245,000 2,606,408 251,638,592 7,186,710,328
2003 253,990,000 2,613,826 251,376,174 7,726,599,821
Source - Tax assessor/collector and accounting records of the District.
Last Ten Fiscal Years(Unaudited)
Alief Independent School District
Ratio of Net General Bonded Debt to AssessedValue and Net Bonded Debt per Average Daily Attendance
and per Capita
114
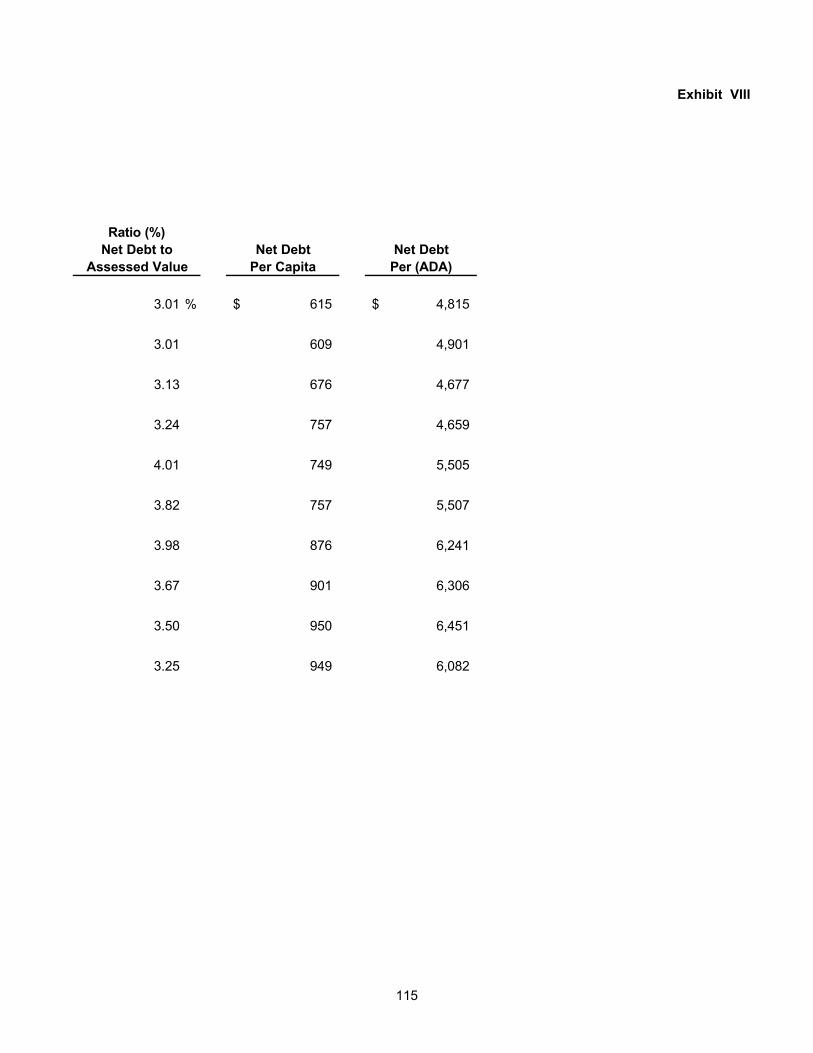
Exhibit VIII
Net Debt Net DebtPer Capita Per (ADA)
3.01 % 615$ 4,815$
3.01 609 4,901
3.13 676 4,677
3.24 757 4,659
4.01 749 5,505
3.82 757 5,507
3.98 876 6,241
3.67 901 6,306
3.50 950 6,451
3.25 949 6,082
Ratio (%)Net Debt to
Assessed Value
115
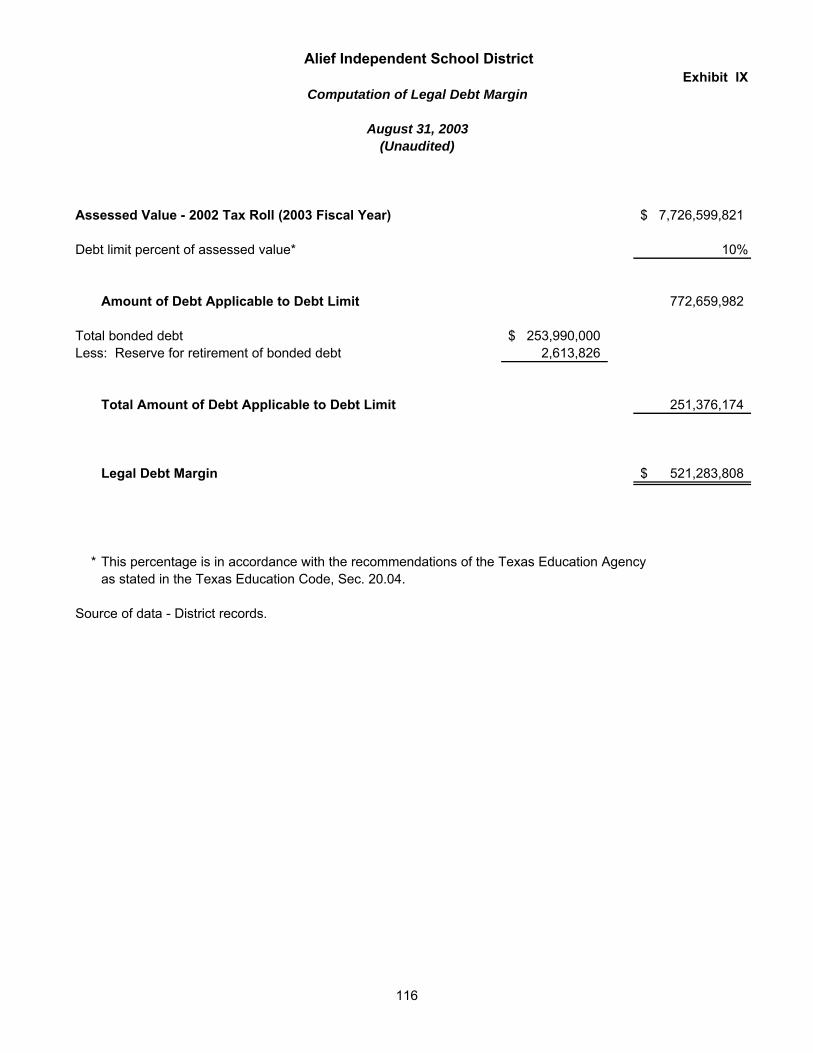
Exhibit IX
Assessed Value - 2002 Tax Roll (2003 Fiscal Year) 7,726,599,821$
Debt limit percent of assessed value* 10%
Amount of Debt Applicable to Debt Limit 772,659,982
Total bonded debt 253,990,000$ Less: Reserve for retirement of bonded debt 2,613,826
Total Amount of Debt Applicable to Debt Limit 251,376,174
Legal Debt Margin 521,283,808$
* This percentage is in accordance with the recommendations of the Texas Education Agencyas stated in the Texas Education Code, Sec. 20.04.
Source of data - District records.
Alief Independent School District
Computation of Legal Debt Margin
August 31, 2003(Unaudited)
116
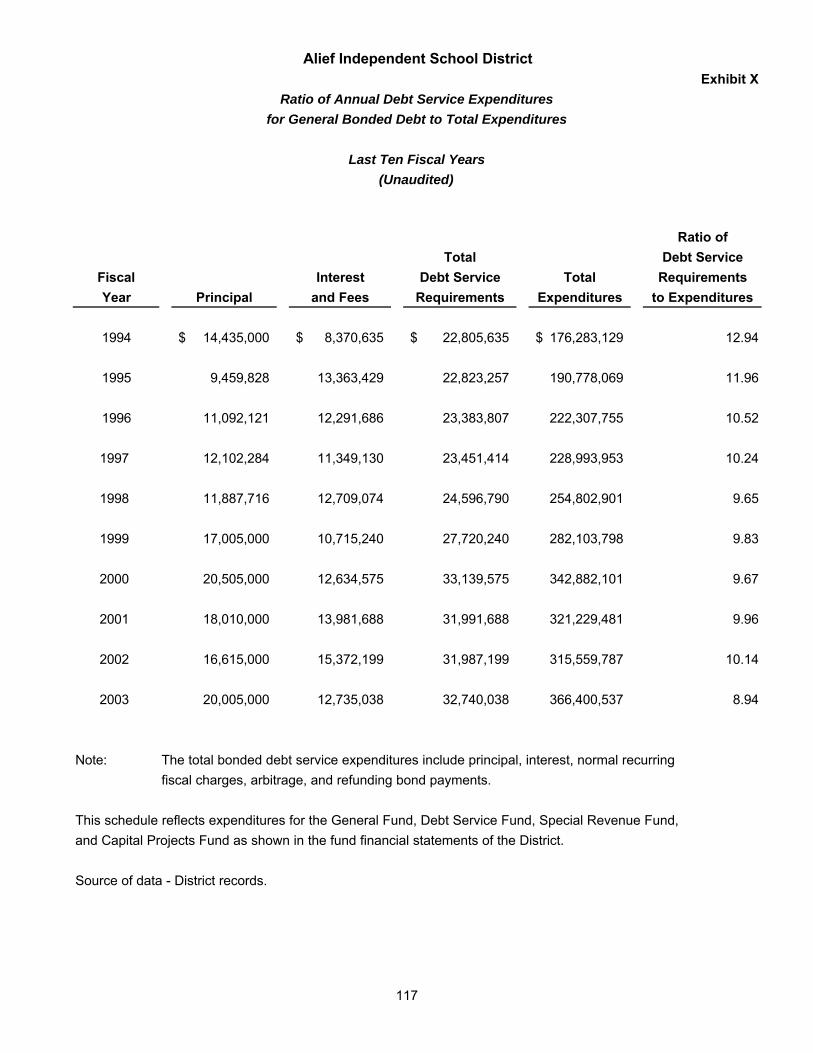
Exhibit X
Ratio ofTotal Debt Service
Fiscal Interest Debt Service Total RequirementsYear Principal and Fees Requirements Expenditures to Expenditures
1994 14,435,000$ 8,370,635$ 22,805,635$ 176,283,129$ 12.94
1995 9,459,828 13,363,429 22,823,257 190,778,069 11.96
1996 11,092,121 12,291,686 23,383,807 222,307,755 10.52
1997 12,102,284 11,349,130 23,451,414 228,993,953 10.24
1998 11,887,716 12,709,074 24,596,790 254,802,901 9.65
1999 17,005,000 10,715,240 27,720,240 282,103,798 9.83
2000 20,505,000 12,634,575 33,139,575 342,882,101 9.67
2001 18,010,000 13,981,688 31,991,688 321,229,481 9.96
2002 16,615,000 15,372,199 31,987,199 315,559,787 10.14
2003 20,005,000 12,735,038 32,740,038 366,400,537 8.94
Note: The total bonded debt service expenditures include principal, interest, normal recurring fiscal charges, arbitrage, and refunding bond payments.
This schedule reflects expenditures for the General Fund, Debt Service Fund, Special Revenue Fund, and Capital Projects Fund as shown in the fund financial statements of the District.
Source of data - District records.
(Unaudited)
Alief Independent School District
Ratio of Annual Debt Service Expendituresfor General Bonded Debt to Total Expenditures
Last Ten Fiscal Years
117
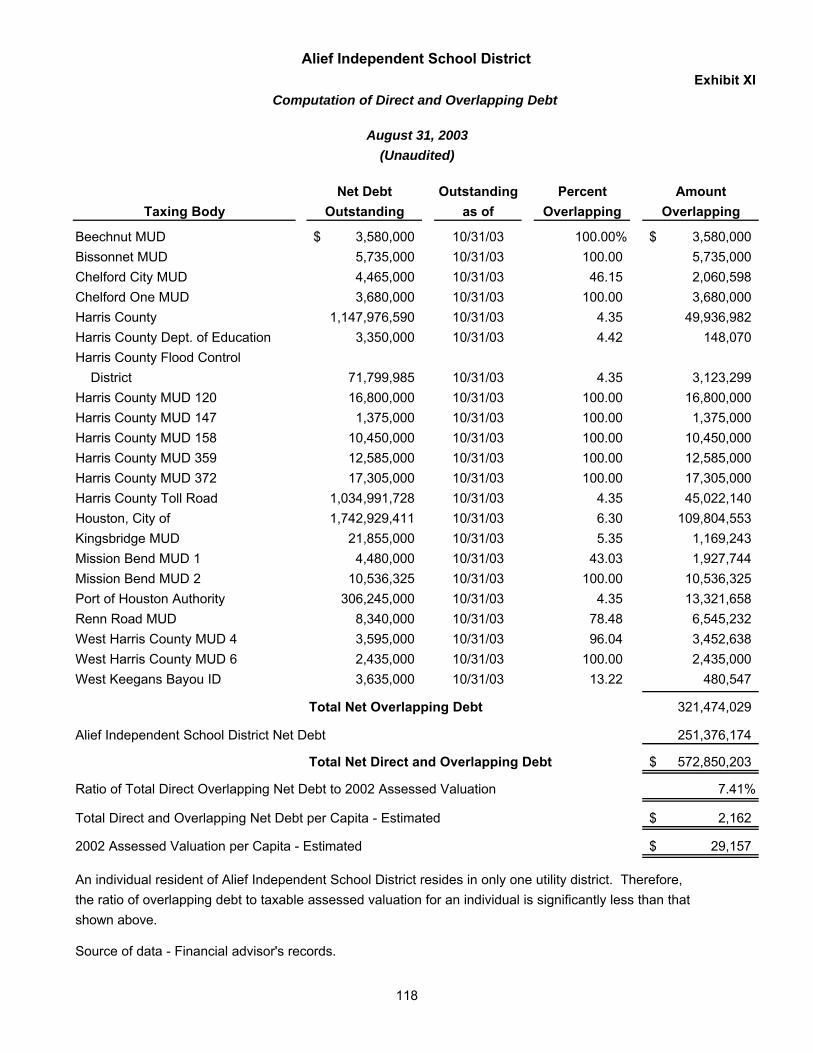
Exhibit XI
Net Debt Outstanding Percent AmountTaxing Body Outstanding as of Overlapping Overlapping
Beechnut MUD 3,580,000$ 10/31/03 100.00% 3,580,000$ Bissonnet MUD 5,735,000 10/31/03 100.00 5,735,000 Chelford City MUD 4,465,000 10/31/03 46.15 2,060,598 Chelford One MUD 3,680,000 10/31/03 100.00 3,680,000 Harris County 1,147,976,590 10/31/03 4.35 49,936,982 Harris County Dept. of Education 3,350,000 10/31/03 4.42 148,070 Harris County Flood Control District 71,799,985 10/31/03 4.35 3,123,299 Harris County MUD 120 16,800,000 10/31/03 100.00 16,800,000 Harris County MUD 147 1,375,000 10/31/03 100.00 1,375,000 Harris County MUD 158 10,450,000 10/31/03 100.00 10,450,000 Harris County MUD 359 12,585,000 10/31/03 100.00 12,585,000 Harris County MUD 372 17,305,000 10/31/03 100.00 17,305,000 Harris County Toll Road 1,034,991,728 10/31/03 4.35 45,022,140 Houston, City of 1,742,929,411 10/31/03 6.30 109,804,553 Kingsbridge MUD 21,855,000 10/31/03 5.35 1,169,243 Mission Bend MUD 1 4,480,000 10/31/03 43.03 1,927,744 Mission Bend MUD 2 10,536,325 10/31/03 100.00 10,536,325 Port of Houston Authority 306,245,000 10/31/03 4.35 13,321,658 Renn Road MUD 8,340,000 10/31/03 78.48 6,545,232 West Harris County MUD 4 3,595,000 10/31/03 96.04 3,452,638 West Harris County MUD 6 2,435,000 10/31/03 100.00 2,435,000 West Keegans Bayou ID 3,635,000 10/31/03 13.22 480,547
Total Net Overlapping Debt 321,474,029
Alief Independent School District Net Debt 251,376,174
Total Net Direct and Overlapping Debt 572,850,203$
Ratio of Total Direct Overlapping Net Debt to 2002 Assessed Valuation 7.41%
Total Direct and Overlapping Net Debt per Capita - Estimated 2,162$
2002 Assessed Valuation per Capita - Estimated 29,157$
An individual resident of Alief Independent School District resides in only one utility district. Therefore,the ratio of overlapping debt to taxable assessed valuation for an individual is significantly less than thatshown above.
Source of data - Financial advisor's records.
Alief Independent School District
Computation of Direct and Overlapping Debt
August 31, 2003(Unaudited)
118
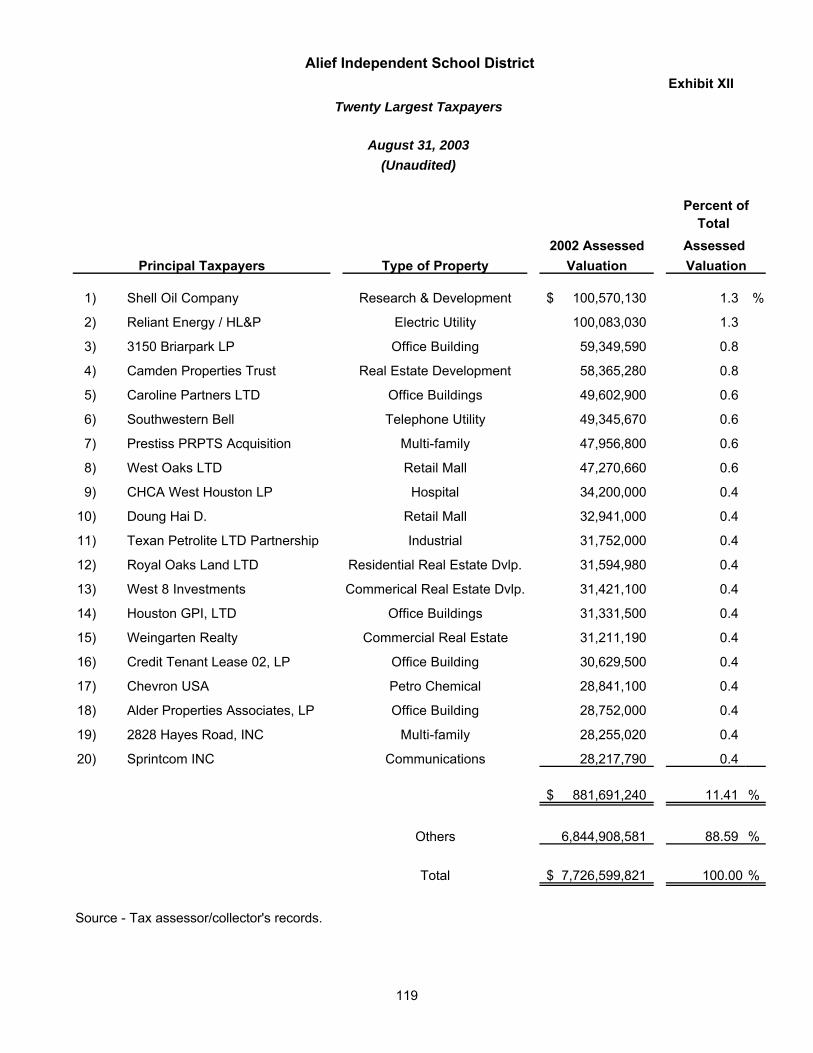
Exhibit XII
Total2002 Assessed
Principal Taxpayers Type of Property Valuation
1) Shell Oil Company Research & Development 100,570,130$ 1.3 %
2) Reliant Energy / HL&P Electric Utility 100,083,030 1.3
3) 3150 Briarpark LP Office Building 59,349,590 0.8
4) Camden Properties Trust Real Estate Development 58,365,280 0.8
5) Caroline Partners LTD Office Buildings 49,602,900 0.6
6) Southwestern Bell Telephone Utility 49,345,670 0.6
7) Prestiss PRPTS Acquisition Multi-family 47,956,800 0.6
8) West Oaks LTD Retail Mall 47,270,660 0.6
9) CHCA West Houston LP Hospital 34,200,000 0.4
10) Doung Hai D. Retail Mall 32,941,000 0.4
11) Texan Petrolite LTD Partnership Industrial 31,752,000 0.4
12) Royal Oaks Land LTD Residential Real Estate Dvlp. 31,594,980 0.4
13) West 8 Investments Commerical Real Estate Dvlp. 31,421,100 0.4
14) Houston GPI, LTD Office Buildings 31,331,500 0.4
15) Weingarten Realty Commercial Real Estate 31,211,190 0.4
16) Credit Tenant Lease 02, LP Office Building 30,629,500 0.4
17) Chevron USA Petro Chemical 28,841,100 0.4
18) Alder Properties Associates, LP Office Building 28,752,000 0.4
19) 2828 Hayes Road, INC Multi-family 28,255,020 0.4
20) Sprintcom INC Communications 28,217,790 0.4
881,691,240$ 11.41 %
Others 6,844,908,581 88.59 %
Total 7,726,599,821$ 100.00 %
Source - Tax assessor/collector's records.
Percent of
Assessed Valuation
Alief Independent School District
Twenty Largest Taxpayers
August 31, 2003(Unaudited)
119
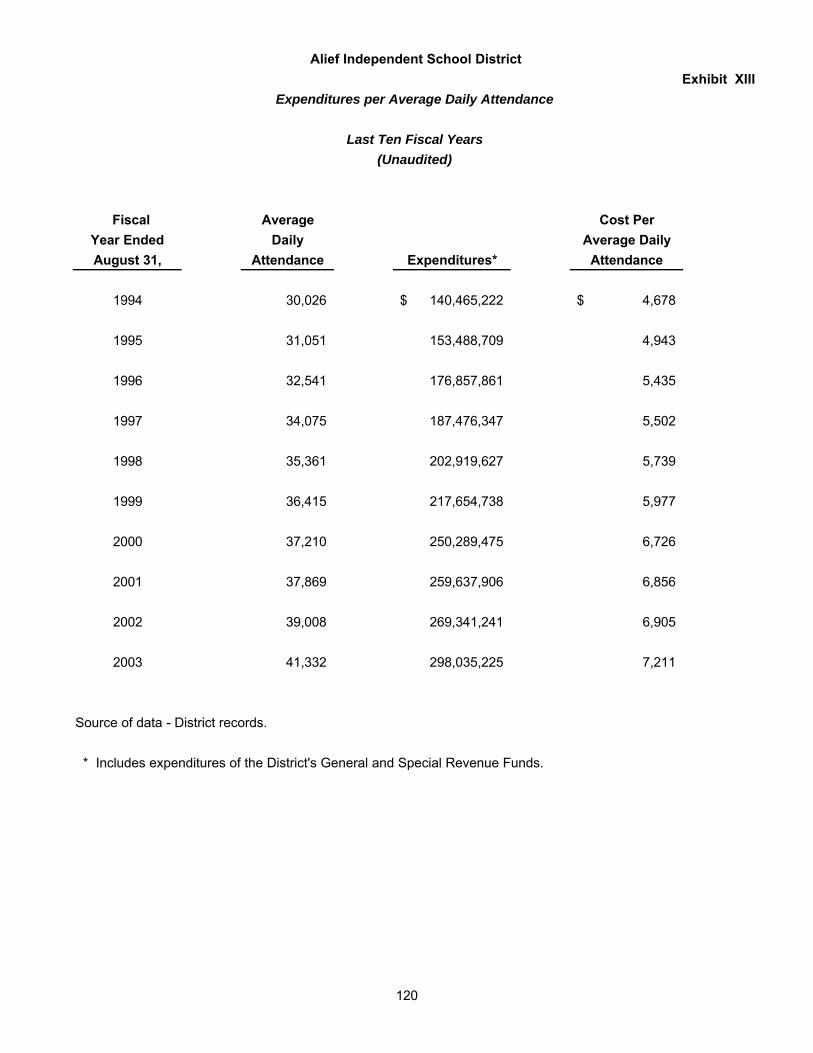
Exhibit XIII
Fiscal Average Cost PerYear Ended Daily Average DailyAugust 31, Attendance Expenditures* Attendance
1994 30,026 140,465,222$ 4,678$
1995 31,051 153,488,709 4,943
1996 32,541 176,857,861 5,435
1997 34,075 187,476,347 5,502
1998 35,361 202,919,627 5,739
1999 36,415 217,654,738 5,977
2000 37,210 250,289,475 6,726
2001 37,869 259,637,906 6,856
2002 39,008 269,341,241 6,905
2003 41,332 298,035,225 7,211
Source of data - District records.
* Includes expenditures of the District's General and Special Revenue Funds.
(Unaudited)
Alief Independent School District
Expenditures per Average Daily Attendance
Last Ten Fiscal Years
120
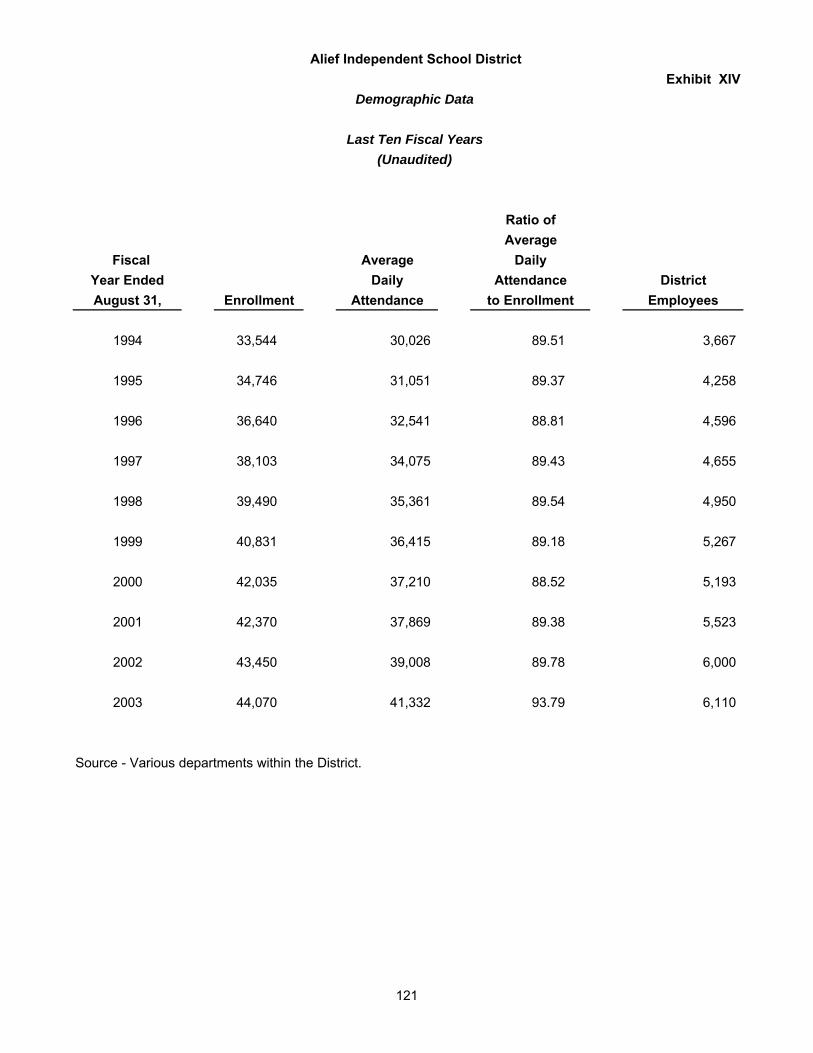
Exhibit XIV
Fiscal AverageYear Ended Daily DistrictAugust 31, Enrollment Attendance Employees
1994 33,544 30,026 89.51 3,667
1995 34,746 31,051 89.37 4,258
1996 36,640 32,541 88.81 4,596
1997 38,103 34,075 89.43 4,655
1998 39,490 35,361 89.54 4,950
1999 40,831 36,415 89.18 5,267
2000 42,035 37,210 88.52 5,193
2001 42,370 37,869 89.38 5,523
2002 43,450 39,008 89.78 6,000
2003 44,070 41,332 93.79 6,110
Source - Various departments within the District.
to Enrollment
Ratio ofAverage
DailyAttendance
(Unaudited)
Alief Independent School District
Demographic Data
Last Ten Fiscal Years
121

This page intentionally blank.
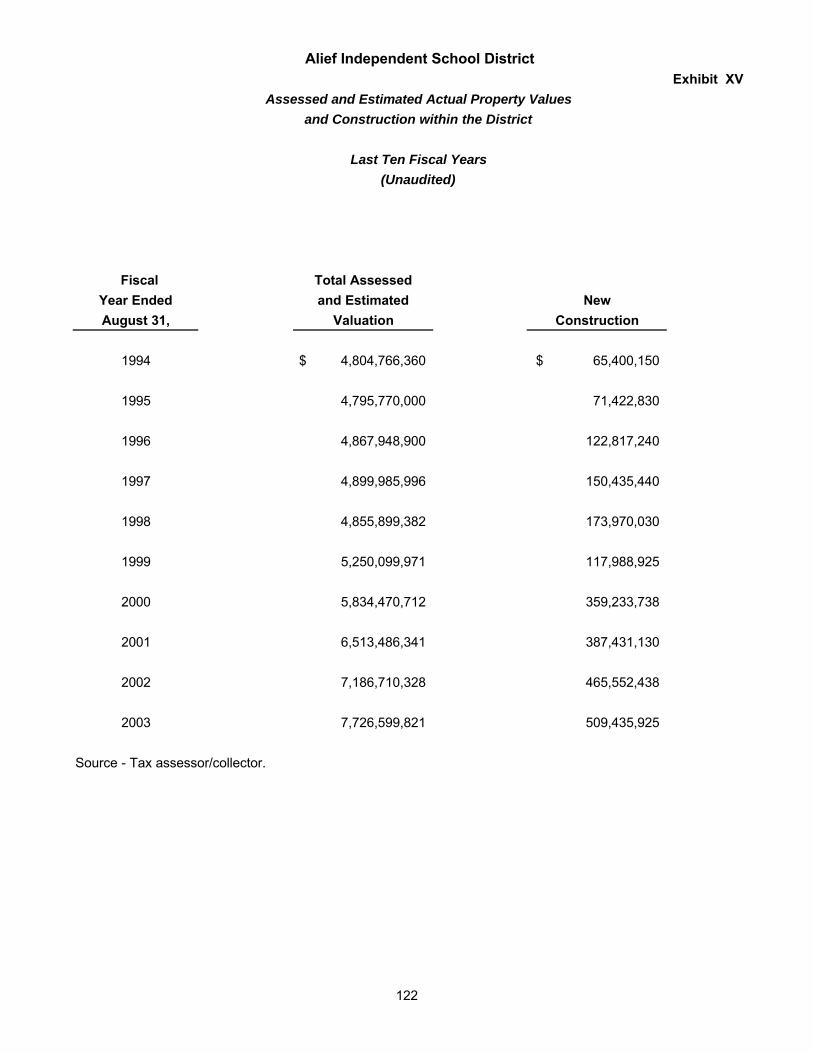
Exhibit XV
Fiscal Total AssessedYear Ended and Estimated NewAugust 31, Valuation Construction
1994 4,804,766,360$ 65,400,150$
1995 4,795,770,000 71,422,830
1996 4,867,948,900 122,817,240
1997 4,899,985,996 150,435,440
1998 4,855,899,382 173,970,030
1999 5,250,099,971 117,988,925
2000 5,834,470,712 359,233,738
2001 6,513,486,341 387,431,130
2002 7,186,710,328 465,552,438
2003 7,726,599,821 509,435,925
Source - Tax assessor/collector.
(Unaudited)
Alief Independent School District
Assessed and Estimated Actual Property Values
Last Ten Fiscal Years
and Construction within the District
122
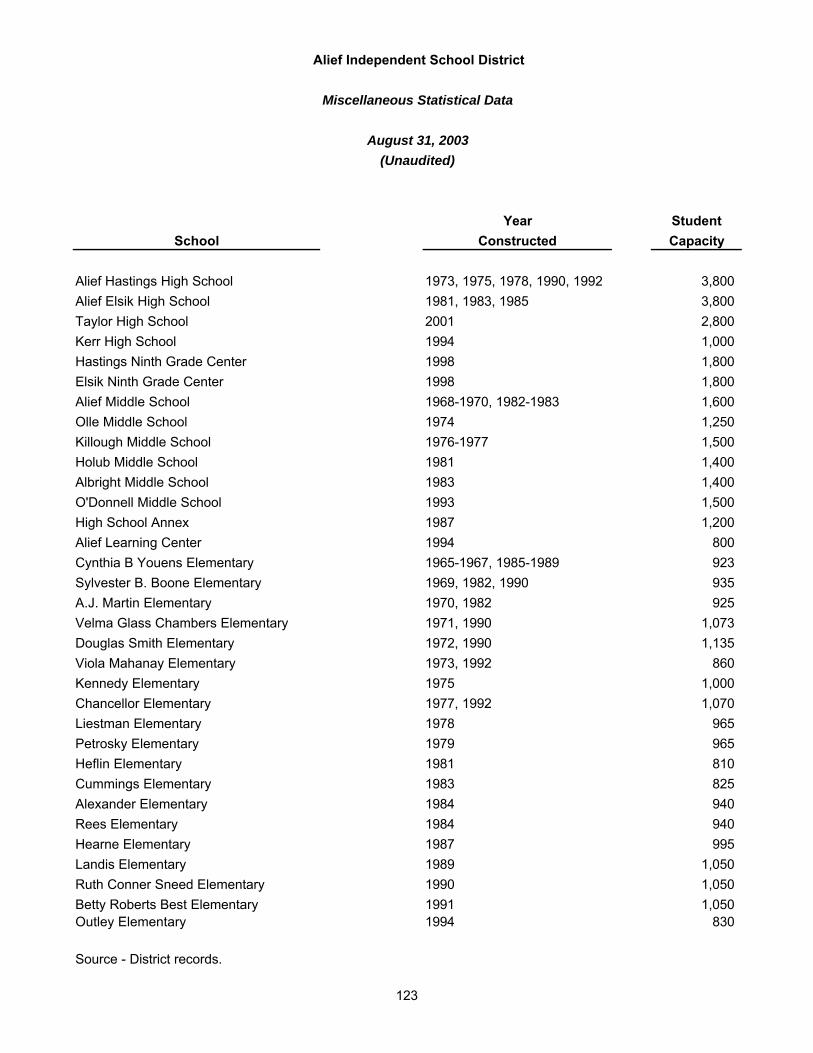
Year StudentSchool Constructed Capacity
Alief Hastings High School 1973, 1975, 1978, 1990, 1992 3,800Alief Elsik High School 1981, 1983, 1985 3,800Taylor High School 2001 2,800Kerr High School 1994 1,000Hastings Ninth Grade Center 1998 1,800Elsik Ninth Grade Center 1998 1,800Alief Middle School 1968-1970, 1982-1983 1,600Olle Middle School 1974 1,250Killough Middle School 1976-1977 1,500Holub Middle School 1981 1,400Albright Middle School 1983 1,400O'Donnell Middle School 1993 1,500High School Annex 1987 1,200Alief Learning Center 1994 800Cynthia B Youens Elementary 1965-1967, 1985-1989 923Sylvester B. Boone Elementary 1969, 1982, 1990 935A.J. Martin Elementary 1970, 1982 925Velma Glass Chambers Elementary 1971, 1990 1,073Douglas Smith Elementary 1972, 1990 1,135Viola Mahanay Elementary 1973, 1992 860Kennedy Elementary 1975 1,000Chancellor Elementary 1977, 1992 1,070Liestman Elementary 1978 965Petrosky Elementary 1979 965Heflin Elementary 1981 810Cummings Elementary 1983 825Alexander Elementary 1984 940Rees Elementary 1984 940Hearne Elementary 1987 995Landis Elementary 1989 1,050Ruth Conner Sneed Elementary 1990 1,050Betty Roberts Best Elementary 1991 1,050Outley Elementary 1994 830
Source - District records.
Alief Independent School District
(Unaudited)
Miscellaneous Statistical Data
August 31, 2003
123
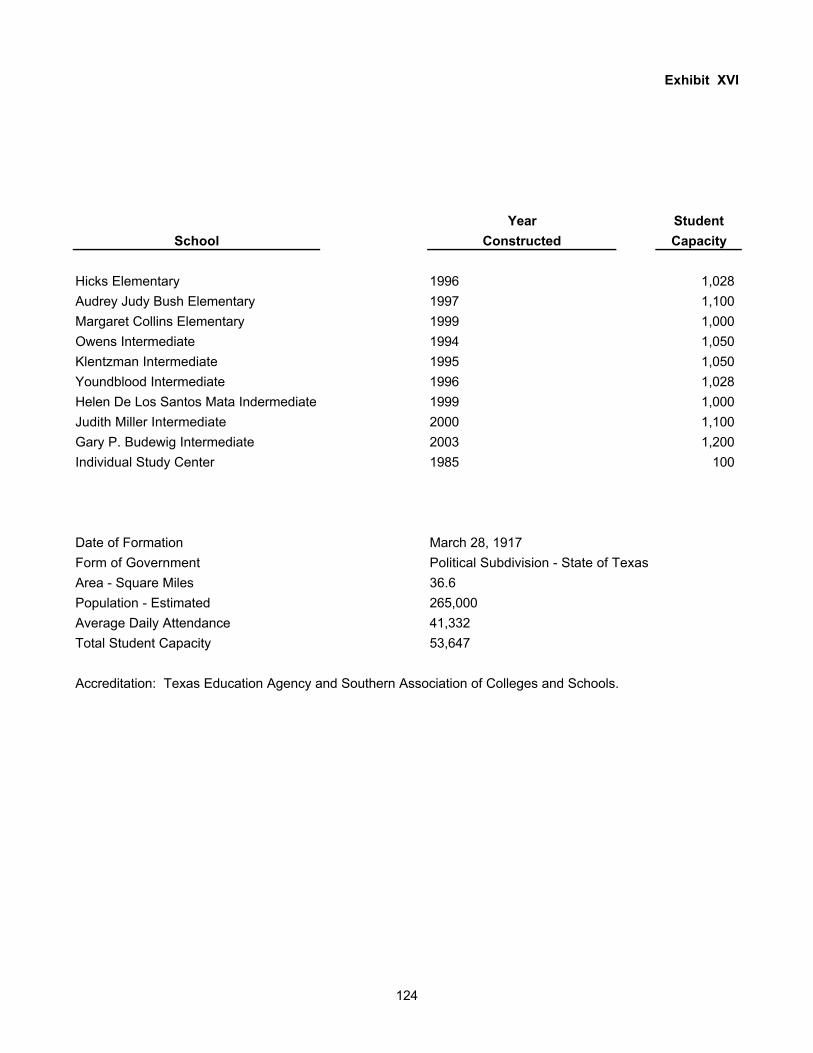
Exhibit XVI
Year StudentSchool Constructed Capacity
Hicks Elementary 1996 1,028Audrey Judy Bush Elementary 1997 1,100Margaret Collins Elementary 1999 1,000Owens Intermediate 1994 1,050Klentzman Intermediate 1995 1,050Youndblood Intermediate 1996 1,028Helen De Los Santos Mata Indermediate 1999 1,000Judith Miller Intermediate 2000 1,100Gary P. Budewig Intermediate 2003 1,200Individual Study Center 1985 100
Date of Formation March 28, 1917Form of Government Political Subdivision - State of TexasArea - Square Miles 36.6Population - Estimated 265,000Average Daily Attendance 41,332Total Student Capacity 53,647
Accreditation: Texas Education Agency and Southern Association of Colleges and Schools.
124

This page intentionally blank.
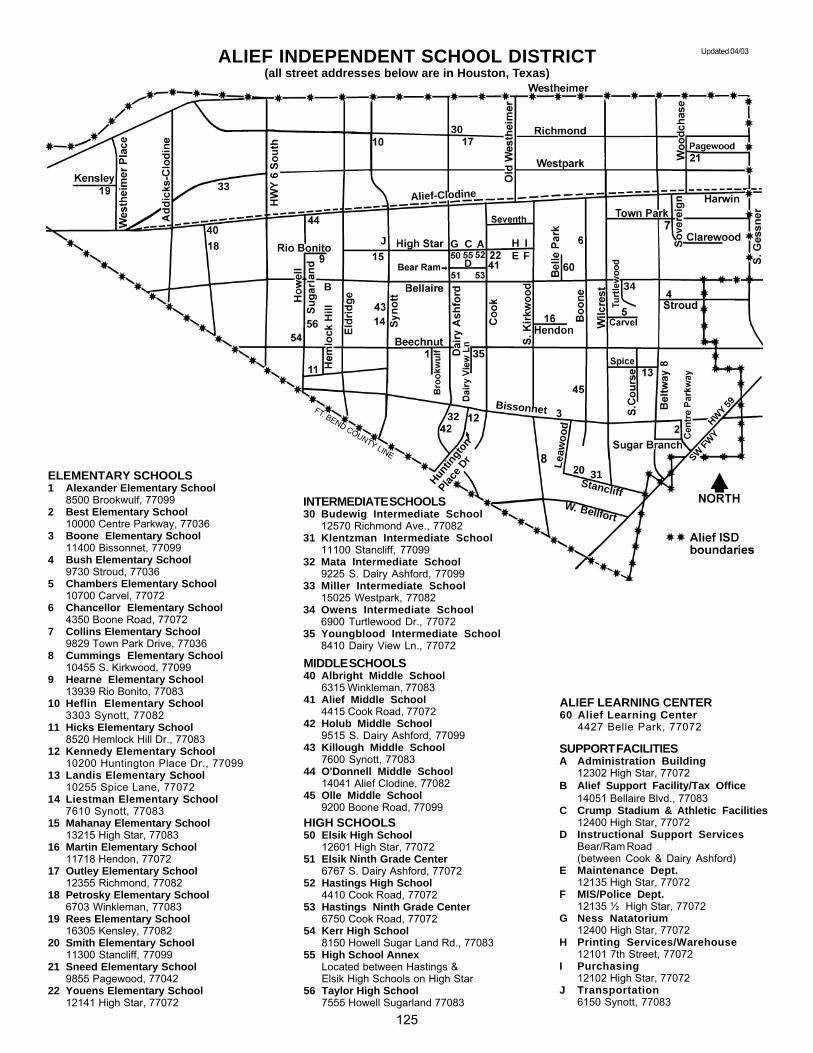
SUPPORT FACILITIESA Administration Building
12302 High Star, 77072B Alief Support Facility/Tax Office
14051 Bellaire Blvd., 77083C Crump Stadium & Athletic Facilities
12400 High Star, 77072D Instructional Support Services
Bear/Ram Road(between Cook & Dairy Ashford)
E Maintenance Dept.12135 High Star, 77072
F MIS/Police Dept.12135 ½ High Star, 77072
G Ness Natatorium12400 High Star, 77072
H Printing Services/Warehouse12101 7th Street, 77072
I Purchasing12102 High Star, 77072
J Transportation6150 Synott, 77083
ALIEF INDEPENDENT SCHOOL DISTRICT
HIGH SCHOOLS50 Elsik High School
12601 High Star, 7707251 Elsik Ninth Grade Center
6767 S. Dairy Ashford, 7707252 Hastings High School
4410 Cook Road, 7707253 Hastings Ninth Grade Center
6750 Cook Road, 7707254 Kerr High School
8150 Howell Sugar Land Rd., 7708355 High School Annex
Located between Hastings &Elsik High Schools on High Star
56 Taylor High School7555 Howell Sugarland 77083
MIDDLE SCHOOLS40 Albright Middle School
6315 Winkleman, 7708341 Alief Middle School
4415 Cook Road, 7707242 Holub Middle School
9515 S. Dairy Ashford, 7709943 Killough Middle School
7600 Synott, 7708344 O'Donnell Middle School
14041 Alief Clodine, 7708245 Olle Middle School
9200 Boone Road, 77099
INTERMEDIATE SCHOOLS30 Budewig Intermediate School
12570 Richmond Ave., 7708231 Klentzman Intermediate School
11100 Stancliff, 7709932 Mata Intermediate School
9225 S. Dairy Ashford, 7709933 Miller Intermediate School
15025 Westpark, 7708234 Owens Intermediate School
6900 Turtlewood Dr., 7707235 Youngblood Intermediate School
8410 Dairy View Ln., 77072
ELEMENTARY SCHOOLS1 Alexander Elementary School
8500 Brookwulf, 770992 Best Elementary School
10000 Centre Parkway, 770363 Boone Elementary School
11400 Bissonnet, 770994 Bush Elementary School
9730 Stroud, 770365 Chambers Elementary School
10700 Carvel, 770726 Chancellor Elementary School
4350 Boone Road, 770727 Collins Elementary School
9829 Town Park Drive, 770368 Cummings Elementary School
10455 S. Kirkwood, 770999 Hearne Elementary School
13939 Rio Bonito, 7708310 Heflin Elementary School
3303 Synott, 7708211 Hicks Elementary School
8520 Hemlock Hill Dr., 7708312 Kennedy Elementary School
10200 Huntington Place Dr., 7709913 Landis Elementary School
10255 Spice Lane, 7707214 Liestman Elementary School
7610 Synott, 7708315 Mahanay Elementary School
13215 High Star, 7708316 Martin Elementary School
11718 Hendon, 7707217 Outley Elementary School
12355 Richmond, 7708218 Petrosky Elementary School
6703 Winkleman, 7708319 Rees Elementary School
16305 Kensley, 7708220 Smith Elementary School
11300 Stancliff, 7709921 Sneed Elementary School
9855 Pagewood, 7704222 Youens Elementary School
12141 High Star, 77072
ALIEF LEARNING CENTER60 Alief Learning Center
4427 Belle Park, 77072
(all street addresses below are in Houston, Texas)
Updated 04/03
Bissonnet
Alief-Clodine
Stancliff
Leaw
ood
W. Bellfort
SW FWY
HWY 59
Huntin
gton
Place D
r
FT. BEND COUNTY LINE
I
30
31
32
33
35
34
G C H IE F
D
B
J
125
