alignment of informalignment of information systems with supply chains _ impacts on.pdfation systems...
DESCRIPTION
Alignment of information systems with supply chains _ impacts on.pdfTRANSCRIPT
The University of ToledoThe University of Toledo Digital Repository
Theses and Dissertations
2010
Alignment of information systems with supplychains : impacts on supply chain performance andorganizational performanceSufian M. QrunflehThe University of Toledo
Follow this and additional works at: http://utdr.utoledo.edu/theses-dissertations
This Dissertation is brought to you for free and open access by The University of Toledo Digital Repository. It has been accepted for inclusion in Thesesand Dissertations by an authorized administrator of The University of Toledo Digital Repository. For more information, please see the repository'sAbout page.
Recommended CitationQrunfleh, Sufian M., "Alignment of information systems with supply chains : impacts on supply chain performance and organizationalperformance" (2010). Theses and Dissertations. Paper 947.

A Dissertation
entitled
Alignment of Information Systems with Supply Chains: Impacts on Supply Chain
Performance and Organizational Performance
by
Sufian M. Qrunfleh
Submitted to the Graduate Faculty as partial fulfillment of the requirements for the
Doctor of Philosophy Degree in Manufacturing Management
______________________________________ Dr. Monideepa Tarafdar, Committee Co-Chair
______________________________________ Dr. T.S. Ragu-Nathan, Committee Co-Chair
______________________________________ Dr. Thuong T. Le, Committee Member
______________________________________ Dr. Hokey Min, Committee Member
______________________________________ Dr. Patricia Komuniecki, Dean
College of Graduate Studies
The University of Toledo
May 2010

Copyright 2010, Sufian M. Qrunfleh
This document is copyrighted material. Under copyright law, no parts of this document may be reproduced without the expressed permission of the author.

iii
An Abstract of
Alignment of Information Systems with Supply Chains: Impacts on Supply Chain Performance and Organizational Performance
by
Sufian M. Qrunfleh
Submitted to the Graduate Faculty as partial fulfillment of the requirements for the Doctor of Philosophy Degree in Manufacturing Management
The University of Toledo May 2010
Over the past decade, an important focus of researchers has been on supply chain
management (SCM), as many organizations believe that effective SCM is the key to
building and sustaining competitive advantage for their products/services. To manage the
supply chain, companies need to adopt an SCM strategy (SCMS) and implement
appropriate SCM practices. However, different SCM strategies and practices require
support from appropriate information technology (IT) applications and their usage. To
effectively manage the supply chain, there is therefore a need for aligning these
applications and their usage with the supply chain strategy and practices of the firm.
While the literature on IT-business alignment has mainly focused on various aspects of
the alignment between information systems (IS) strategy (ISS) and business strategy, it is
largely deficient in offering an understanding of how specific supply chain strategies
should be aligned with relevant IS strategies. Similarly, prior studies on SCM have
developed considerable detail on supply chain strategies, without enunciating the
implications of these strategies for the use of IT. Additionally, many studies have
examined the importance of implementing SCM practices and their impact on supply
chain and firm performance without identifying the corresponding IS usage that might be

iv
required for executing those practices in a more effective manner. Thus, there are no
studies that explore the alignment between SCMS and ISS and between SCM practices
and the usage of IT. This study contributes to the literature of SCM and IT by examining
the alignment between the supply chain and information systems (SC-IS) at two levels.
First, it looks at different SCM strategies and assesses appropriately- aligned information
strategies that would enhance their effectiveness vis-à-vis their effect on the supply chain
and firm performance; this is what this study refers to as alignment at the
planning/strategic level. Second, the study looks at SCM practices and identifies
corresponding IS usage practices that enhance the success of those practices vis-à-vis
their effect on the firm and its supply chain performance; this is what this study refers to
as alignment at the practice/operational level. Alignment was assessed using the
moderating and mediating methods.
Research methods included item development, Q-sort, a large scale survey of 205
respondents, who were mainly purchasing managers/directors of large organizations, and
data analysis using Structural Equation Modeling (SEM). The research developed and
validated reliable instruments for supply chain management strategy, information systems
strategy, IT utilization, the alignment between SCMS and ISS, and the alignment
between SCM practices and the usage of IT constructs through an extensive literature
review, and then revised the instruments by using pre-test, structured interviews, and Q-
sort methodologies. Valid and reliable measures from SCM practices were adapted and
validated from previous research to fit the context of the present study.
The research findings suggest that at the strategy level, aligning a particular IS S
with the corresponding SCMS enhances supply chain performance and firm performance
v
specific to the type of SCMS. At the operational level, the results suggest that
implementation of particular SCM practices requires the use of corresponding IT
applications, in order to have an enhanced positive effect on firm performance and supply
chain performance. The theoretical contribution of this research is in two domains. The
contribution in the IS domain is in introducing alignment concepts in the supply chain
context and analyzing ISS/SCMS and IT usage type/SCM practice pairs, the co-presence
of which can enhance supply chain performance. The study thus forwards current
contingency-based thinking in the IS literature that is beginning to suggest that study of
IS deployment or use at the aggregate level might be less informing than looking at
specific contexts and requirements against which applications are adopted. In the SCM
domain, this research shows the importance of the adoption and use of specific types of
IS in achieving enhanced benefits from particular SCM practices and strategies. The
study thus extends recent literature that is beginning to recognize the importance of
understanding the benefits of different types of IS applications to supply chains. This
study also has several important implications for practitioners, by demonstrating to
managers the importance of adapting an ISS that matches their SCMS, and the
importance of using the appropriate IT applications that match their SCM practices. As a
result, the findings help managers to better position, structure, and utilize their IS
applications in line with their SCM strategies and practices. So, for instance, if a focal
firm acquires a new supply chain related application, it should make sure that the
application supports and enhances the supply chain‟s ability to achieve its particular
goals; this will result in better supply integration and quicker response to customers‟
demands, which will allow the firm to achieve its market and financial goals. Therefore,

vi
these results should be useful for strategic decision making, especially with regards to
investment decisions concerning IT integration in supply chains.
vii
Acknowledgements
First, and foremost, I would like to thank Dr. T.S Ragu-Nathan and Dr.
Monideepa Tarafdar (the co-chairs of my dissertation) for their time, support,
inspirations, and advices throughout the entire process of completing my dissertation.
Equal thanks also go to Dr. Thuong T. Le and Dr. Hokey Min for their participation in
my dissertation committee and for their feedback and comments on my dissertation.
Thanks are also given to the wonderful professors at the University of Toledo. I
want to thank specially Dr. S. Subba Rao, Dr. James Pope, and Dr. Ken Kim for their
support in my entire Ph.D. journey. I want also to thank Drs. Mark Vonderembse, Jerzy
Kamburowski, Paul Hong, Udayan Nadkeolyar, William Doll, Ellen Pullins, Thomas
Sharkey, Anand Kunnathur, and other professors at the College of Business for their
encouragement during my doctoral studies.
I want to specially thank my good friend Susita Asree for her support throughout
the program. I also want to thank my other friends Melvin Williams, Erika Marsillac,
Abdullah Aldakhil, Oanh Tran, and David Dobrzykowski, and other doctoral students for
their professional and personal support. Finally, I am also grateful to the 205 individuals
who respondent to my survey. It would not be possible to complete this dissertation
without their participation.

viii
Contents
Abstract iii
Acknowledgement
viii
Contents viii
List of Tables xii
List of Figures xv
1 Introduction……………………………………………………………………………...1
2 Literature Review..............................................................................................................8
2.1 SCM Strategy (SCMS)......................................................................................8
2.1.1 Lean Supply Chain (LSC).................................................................14 2.1.2 Agile Supply Chain (ASC)...............................................................15 2.1.3 Hybrid Supply Chain (HSC)............................................................17
2.2 Information Systems Strategy (ISS)................................................................19
2.2.1 IS for Efficiency................................................................................23 2.2.2 IS for Flexibility................................................................................24 2.2.3 IS for Comprehensiveness................................................................26
2.3 Supply Chain Management (SCM) Practices..................................................28
2.3.1 Strategic Supplier Partnership...........................................................32 2.3.2 Customer Relationship......................................................................33 2.3.3 Internal Lean Practices......................................................................34 2.3.4 Postponement....................................................................................36 2.3.5 Information Sharing..........................................................................38 2.3.6 Information Quality..........................................................................39

ix
2.4 Information Technology Utilization................................................................40

ix
2.4.1 External Focus on IT.........................................................................43 2.4.2 Internal Focus on IT..........................................................................45 2.4.3 Infrastructural Focus on IT...............................................................46
2.5 Supply Chain Management (SCM) Performance............................................47
2.5.1 Supply Chain Flexibility...................................................................50 2.5.2 Supply Chain Integration..................................................................51 2.5.3 Customer Responsiveness.................................................................53
2.6 Firm Performance............................................................................................54
3 Theoretical Framework and Hypothesis Development………………...........................56
3.1Contingency Theory..........................................................................................56
3.2 Alignment as Moderator..................................................................................58
3.3 Proposed Research Model...............................................................................61
3.4 Research Hypothesis 1a, 1b, and 1c (Moderating Alignment between SCMS and ISS).................................................64 3.5 Research Hypothesis 2a, 2b, and 2c (Moderating Alignment between SCM Practices and IT Usage)…………..……67
3.5.1 Research Hypothesis 2a Moderating Alignment of External Focus of IT with Strategic Supplier Partnership and Customer Relationship on Supply Chain Management Performance ……………………...........68
3.5.2 Research Hypothesis 2b Moderating Alignment of Internal Focus of IT with Internal Lean Practices and Postponement on Supply Chain Management Performance …..………………….…...…69 3.5.3 Research Hypothesis 2c Moderating Alignment of Infrastructural Focus of IT with Information Sharing and Information Quality on Supply Chain Management Performance …………………................70
3.6 Research Hypothesis 3a, 3b, and 3c (SCM Practices and SCM Performance)………………………………..............71

x
3.7 Research Hypothesis 4 (SCM Performance and Firm Performance)………………………………....…..72
4 Instruments Development--Item Generation and Pilot Test….......................................74
4.1. Item Generation……………………………………………………..……....75
4.2 Scale Development: the Q-Sort Method…………………………………..…77
4.2.1 Sorting Procedures…………………………………………………77 4.2.2 Results of the First Sorting Round………………………………... 79 4.2.3 Results of the Second Sorting Round……………………………...83 4.2.4 Results of the Third Sorting Round………………………………..86
5 Instruments Development -Large-Scale Administration and Instrument Validation ……………………………………………...90
5.1 Large-Scale Data Collection Methodology………………………...………..90 5.2 Sample Demographics…………………………………………………..…...93
5.2.1 Sample Characteristics of the Respondent………………………94 5.2.2 Sample Characteristics of Surveyed Organizations………..........96
5.3 Non-Response Bias……………………………………………………..…..106 5.4 Large-Scale Instrument Assessment Methodology………………………...108 5.5 Large-Scale Measurement Results………………………………………….110
5.5.1 SCM Strategy (SCMS)…………………………………………...111 5.5.2 Information Systems Strategy (ISS)……………………………...118 5.5.3 Supply Chain Management (SCM) Practices………………….....122 5.5.4 Information Technology Utilization……………………………...129 5.5.5 Supply Chain Management (SCM) Performance………………...134 5.5.6 Firm Performance………………………………………………...138
5.6 Chapter Summary………………….……………………………………….140
6 Causal Model and Hypotheses Testing……………………………………..………...142
6.1 The Proposed Structural Model…………………………………………….143 6.2 Structural Equation Model Results Using PLS …………………………….148

xi
6.3 Discussion of Structural Equation Model and Hypothesis Testing Results…………………………………………………151 6.4 Revised Structural Model…………………………………………………..158 6.5 Discussion of Revised Structural Equation Model and Hypothesis Testing Results…………………………………….163 6.6 Summary of Results………………………………………………………...166
7 Summary and Recommendations for Future Research………………………………168
7.1 Summary and Interpretation of Findings…………………………………...168
7.2 Implications for Practitioners……………………………………………….172
7.3 Limitations of the Research………………………………………………...173
7.4 Recommendations for Future Research……………………………………174
References 177
Appendices
A Measurement Items Entering First Q-Sort Analysis 202 B Cohen‟s Kappa and Moore and Benbasat Coefficient 209 C Measurement Items Entering Third Q-Sort Analysis 213 D Large-Scale Survey Questionnaire 219
xii
List of Tables
2-1 The SCMS construct, its sub-constructs definitions, and literature
support………………………………………………………………………………13
2-2 A comparison of lean, hybrid, and agile supply chain…………………………...….18
2-3 The ISS construct, its sub-constructs definitions, and literature support……............23
2-4 The SCM practices construct, its sub-constructs definitions, and
and literature support..…….…………………….……………………..……………..28
2-5 A list of SCM practices, and literature support………………………...…................30
2-6 A list of postponement strategies and literature support……………….………........37
2-7 Information technology utilization construct definition and its sub-constructs‟
definitions and literature support……………….........................................................42
2-8 SCM performance construct and its sub-constructs‟ definitions
and literature support………………………………………………………………...49
2-9 Firm performance construct and literature support……………………...…………..55
4-2-1 Items placement ratios: first sorting round………………………………………...80
4-2-2 Inter-judge raw agreement scores: first sorting round…………………………….81
4-2-3 Items placement ratios: second sorting round…………………………………......84
4-2-4 Inter-judge raw agreement scores: second sorting round………………………….85
4-2-5 Items placement ratios: third sorting round……………………………..................87
4-2-6 Inter-judge raw agreement scores: third sorting round……………...…………….88

xiii
5-1-1 SIC codes and their descriptions……...…………………………………………...91
5-3-1 Test of non-response bias……………………….…………………………..……107
5-5-1-1 Supply chain management strategy-- initial large scale survey items,
CITC results, and overall alpha score………………………………..……….…112
5-5-1-2 Dimension–level factor analysis for LSC……………...………………..……..113
5-5-1-3 Dimension–level factor analysis for ASC……………………….……………..114
5-5-1-4 Dimension–level factor analysis for ASC results (2)………..………………...115
5-5-1-5 Dimension–level factor analysis for HSC…………………..……………..…..115
5-5-1-6 Supply chain management strategy -- construct level factor analysis
results…………………………………………………..……………………….116
5-5-1-7 Supply chain management strategy -- construct level factor analysis
results (2)……………………………………….………....……………………117
5-5-2-1 Information systems strategy-- initial large scale survey items, CITC results,
and overall alpha score…………………………….......……………………….118
5-5-2-2 Dimension–level factor analysis for ISE, ISF, and ISC…….……………….…120
5-5-2-3 Information systems strategy- construct level factor analysis
results………………………………………………………………………...….121
5-5-2-4 Information systems strategy--construct level factor analysis
results (2)………………………………………………..……………...…..…..122
5-5-3-1 Supply chain management practices- initial large scale survey items,
CITC results, and overall alpha score……..…………………………………....124
5-5-3-2 Dimension–level factor analysis for SSP, CR, LSP, POS, IS, and IQ…..…….126 5-5-3-3 Supply chain management practices -- construct level factor analysis

xiv
results………………………………………………………………………......127
5-5-3-4 Supply chain management practices -- construct level factor analysis
results (2)……………………………………………………………………….128
5-5-4-1 Information technology utilization-- initial large scale survey items, CITC
results, and overall alpha score………………………………………………….130
5-5-4-2 Dimension–level factor analysis for EIT, IIT, and INFRA……..……………..132
5-5-4-3 Information technology utilization--construct level factor analysis
results…………………………………………………………………….……..133
5-5-5-1 Supply chain management performance-- initial large scale survey items,
CITC results, and overall alpha score……………..……………...……………..135
5-5-5-2 Dimension–level factor analysis for SCF, SCI, and RC……………..….…….136
5-5-5-3 Supply chain management performance --construct level factor analysis
results………………………………...………………………………………...137
5.5.6.1 Firm performance-- initial large scale survey items, CITC results,
and overall alpha score…………………………………………………………..139
5-5-6-2 Firm performance - construct level factor analysis results…………...….…….140
5-6-1 Summary-large scale analysis results (construct level)………..………………....141
5-6-2 Summary-large scale analysis results (dimensional level)…………..…………...141
6-2-1 Initial PLS structural equation modeling results (model 1)..…...….…………….149
6-2-2 Initial PLS structural equation modeling results (model 2)………..…...………..150

xv
List of Figures
2-1 Matching supply chains with product characteristics…………..…………………....10
3-1 Schematic representation of the moderating effect……………………………….…59
3-2 Schematic representation of fit as moderation….…………………………………...59
3-3 SCM and IS research framework………………..……………………………….......63
5.2.1.1 Respondents by job title…………….……………………………………………94
5.2.1.2 Respondents by job function…………………………………………………….95
5.2.1.3 Respondents by years worked at the organization…………………..…………...96
5.2.2.1 Organizations by number of employees…………………………………….…...97
5.2.2.2 Industry category………………………………………………….……………..98
5.2.2.3 Years in business…………………………………………..……………………..98
5.2.2.4 Annual sales in US dollars.....................................................................................99
5.2.2.5 Annual information systems budget in US dollars..............................................100
5.2.2.6 Annual information systems budget as a percentage of sales
in US dollars…………………………………………………………...............101
5.2.2.7 Percentage of electronic transactions with customers………………………….102
5.2.2.8 Percentage of electronic transactions with suppliers…………………………...103
5.2.2.9 Percentage of organization‟s position in the supply chain……………………..104
5.2.2.10 Percentage of organizations using information systems programs aimed
specifically at implementing supply chain integration.………………………..105

xvi
5.2.2.11 Technology application utilization……………………………….……..……106
6.1.1 Proposed structural model (model 1)……………………………...……………..145
6.1.2 Proposed structural model (model 2)…………………………. ……………..….147
6.2.1 Results of initial structural model (model 1)…………………………………….148
6.2.2 Results of initial structural model (model 2)……………………………………..150
6.4.1 Revised proposed structural model (model 1.1)………………………….………160
6.4.2 Revised proposed structural model (model 2.1)……………………………….…162
6.5.1 Results of revised structural model (model 1.1)……………….………………....164
6.5.2 Results of revised structural model (model 2.1)………………………..………...165

1
Chapter 1
Introduction
Supply chain management (SCM) has been defined in many different ways (Tan,
2001). A common definition of SCM includes the flow of materials and information
along the supply chain in order to meet customer requirements in an efficient manner.
Two important elements in the definition of SCM are: (1) flow of products, and (2) flow
of information. Supply chain practices focus on products‟ movement (Chopra and
Meindl, 2001), while information systems (IS) focus on sharing information.
As more firms realize that effective SCM is the key to building and sustaining
competitive edge in their products and services, they are finding ways to improve the
performance of their supply chains by managing and integrating key information
elements into their supply chains (Gunasekaran and Ngai, 2004). It is impossible to
achieve effective supply chain integration without information technology (IT), since IT
plays a critical role in the success or failure of the supply chain. Handfield and Nichols
(1999) noted the significance of IT in determining the ultimate success in managing the
supply chain and cited evidence that IT was a necessary factor in the survival of SCM
projects. Brandyberry et al. (1999) suggest that IT has the potential to manage the flow
and to impact many dimensions of the supply chain, such as cost, quality, delivery,
flexibility, and, ultimately, the profit of firms. Byrd and Davidson (2003) provided

2
empirical evidence that IT impacts the supply chain, showing that the development and
utilization of long-term IT plans lead to a better firm performance measured by return on
investment (ROI), return on equity (ROE), and market share. Vickery et al. (2003)
provided empirical evidence that supply chain coordination and integration is facilitated
by the use of integrated information technologies, which directly impacts a firm‟s
financial performance (cost performance).
Despite the importance of IS in managing the supply chain and with many firms
investing in costly new systems and applications, a number of firms continue to struggle
in their efforts towards effectively integrating the physical goods and information flow in
their supply chains. One study suggests that over 50 percent of the respondents (U.S.
industries on their supply chains) agree that SCM is not meeting their needs (Staff, 1999).
At the same time, however, Procter and Gamble has reported generating more than U.S.
$325 million in supply chain savings. Shah et al. (2002) believe that Procter and Gamble
excel in managing its supply chain by having IT capabilities aligned with appropriate
supply chain activities. Shah et al. (2002) suggest that SCM practices and strategic
initiatives taken by supply chain members require using information intensively; and
thus, they require the support of inter-organizational information systems. They argue
that supply chains at different levels of integration and coordination require different
levels of IS integration. Therefore, they propose a conceptual framework to study the
alignment of IS with the needs of the supply chain members, arguing that a high level of
supplier integration must be aligned with a high level of IT integration. Similarly, a low
level of supplier integration requires a lower level of IT integration among suppliers in
order to achieve better performances.

3
Further, to achieve a competitive advantage and better performances, SCM
strategy (SCMS) should directly support and drive forward the business strategy. In other
words, SCMS should be aligned with the business strategy; at the same time, supply
chain managers need to use the best IT solution to support their SCMS in order to stay
competitive. A good example of this is Wal-Mart‟s use of IT to support its supply chain.
Wal-Mart has made significant investments in inventory control, materials management,
point of sale integration, and inventory tracking RFID systems. These systems provide
up-to-the-minute information on inventory and logistics, leading to rapid response to
customer requirements, higher inventory turnover, and reduction of its labor and
inventory costs; thus supporting the company‟s low cost supply chain. This example
clearly shows the importance of aligning SCMS with IS to achieve better performance
(Cohen and Roussel, 2005; Nickles et al., 1998; Jones et al., 2005).
While most of the literature regarding IT alignment focuses on strategic alignment
between business strategy and IS strategy (ISS) and its relationship to performance
(King, 1978; Henderson and Venkatraman, 1993; Chan et al., 1997; Gupta et al., 1997;
Sabherwal and Chan, 2001; Kearns and Lederer, 2003; Kearns and Sabherwal,
2006/2007), other literature has focused on social alignment or the alignment of IS-
business partnerships at various levels in the organization (Bassellier and Benbasat,
2004). However, there are no studies that explore the alignment between supply chain
and information systems (SC-IS), specifically the alignment between SCMS and ISS, and
the alignment between SCM practices and the usage of IT. In the absence of such
understanding, there is a lack of framework that managers can use for effectively
positioning and utilizing their IS in line with their SCM strategy and practices.

4
This study intends to fill the gap by examining the alignment between SCM and
IT; it examines SC-IS alignment at two levels. First, it looks at different SCM strategies
and assesses appropriately-aligned information system strategies that would enhance their
effectiveness vis-à-vis their effect on SCM and firm performance. Second, it looks at
SCM practices and identifies corresponding IS usage practices that enhance the success
of those practices vis-à-vis their effect on supply chain and firm performance.
It is important to align SCMS with business strategy. Evans and Danks (1998)
suggest that business strategy should address three questions: (1) What products/services
should the firm sell? (2) What customer segments should the firm service? (3) In what
geographic markets should the firm operate? The answers to these questions will
determine the context within which the firm‟s SCMS is developed. A good example of
this is Wal-Mart‟s strategic vision to build customer loyalty through everyday low prices
being accomplished by adopting a cross-docking strategy in its supply chain.
This study argues that not only should the business strategy and SCMS be
aligned, but the alignment should also include ISS. It is important to plan for an IT
application that supports and enhances a SCMS. This is what this study refers to as “the
alignment between SCMS and ISS”; or the alignment at the planning/strategic level. In
other words, this study argues that once a company plans to invest in an application, the
goal and the objective of this application should support the objective of the supply chain.
For instance, if the strategic positioning of a company is to have the lowest price in the
market relative to its competitors, then this company should emphasize having an
efficient supply chain, and then invest in applications that assist and enhance the goal of
the supply chain in order to have better supply chain and organizational performance.

5
Furthermore, this research also argues that it is important to utilize IT effectively
in the supply chain to achieve superior supply chain performance. In other words, IT
should be used to support and enhance the SCM practices; this is what this study refers to
as “the alignment between SCM practices and the usage of IT”, or the alignment at the
practice/operational level. For instance, if one of the practices of SCM is postponement
(delaying activities in the supply chain until the customer‟s requirement is known), then
the firm should use a “push-pull” supply chain strategy to implement this practice. An
example of a “push-pull” supply chain strategy is one in which the manufacturer builds to
order. This implies that component inventory is managed based on the forecasting but
final assembly is managed by responding to specific customers‟ requests (Simchi-Levi,
2005). In other words, the manufacturing process starts by producing a generic or family
product based on forecasting, and then differentiates its specific end-product when
demand is revealed. Implementing postponement practices requires using IT to share and
coordinate timely information across suppliers so the firm can react quickly to the
specific customers‟ orders. This will result in improved supply chain performance by (1)
reducing the lead times by better anticipating incoming orders from the customers, (2)
increasing service levels, (3) and improving the responsiveness to changes in customers‟
demand.
As IS continues to increase in use and importance in supply chain processes, the
IS alignment with supply chain practices and strategies becomes very critical. Literature
in this area is still emerging. This research thus attempts to make a significant
contribution to the literature on supply chain and IS research by addressing the following
two important questions:
6
Research Question 1: Can the alignment at the planning/strategic level (SCMS with ISS)
have a positive impact on SCM performance and firm performance?
Research Question 2: Can the alignment at the practice/operational level (SCM practices
with the usage of IT) have a positive impact on SCM performance and firm performance?
This research identifies three SCM strategies (lean, agile, and hybrid). A lean
supply chain is a supply chain that utilizes a strategy aimed at creating the most cost
efficiency. An agile supply chain is a supply chain that utilizes a strategy aimed at being
responsive and flexible to changing customer needs. A hybrid supply chain is a supply
chain that utilizes an “assemble-to-order strategy. Furthermore, this research identifies
three IS strategies (IS for efficiency, flexibility, and comprehensiveness). IS for
efficiency is a strategy oriented toward operational support of internal and inter-
organizational efficiency. IS for flexibility is a strategy oriented toward market flexibility
and quick strategic decisions. IS for comprehensiveness is a strategy that enables
comprehensive decisions.
At the strategic level, this study argues that the moderating alignment between
SCMS –lean, agile, and hybrid- and ISS -IS for efficiency, flexibility, and
comprehensiveness- will enhance SCM and firm performance. Furthermore, at the
operational level, this research identifies six SCM practices: strategic supplier
partnership; customer relationship; information sharing; information quality; internal lean
practices; and postponement. This research also identifies three ways to utilize IT --
externally internally and through a focus on infrastructure. This study argues that the
moderating alignment between SCM practices and IT utilization will enhance SCM and
firm performance.

7
Chapter 2 describes the literature review on SCMS, ISS, SCM practices, and the
usage of IT. The theoretical development and the hypothesis development are presented
in Chapter 3. The research methodology is described in Chapter 4. The validity and
reliability results are reported in Chapter 5. In Chapter 6, the results of hypotheses testing
are shown. Finally, Chapter 7 concludes the summary of the research--its theoretical and
practical contributions, managerial implications, and limitations. Recommendations for
future research are provided.

8
Chapter 2
Literature Review
This chapter presents the literature review and the definition for the constructs (SCMS,
ISS, SCM practices, IT utilization) and their sub-constructs.
2.1 SCM Strategy (SCMS)
Supply chain management (SCM) is becoming increasingly important in today‟s
global competition. As competition shifts from company vs. company to supply chain vs.
supply chain, SCM becomes a significant strategic tool for firms to survive and create
competitive advantages (Stalk and Hout, 1990; Quinn, 1997; Rich and Hines, 1997; Tan
et al., 2002). Market leaders in the retail industry such as Wal-Mart and Dell constantly
search for new ways to add value and push the boundaries of performance by realizing
the importance of managing their supply chains (Cohen and Roussel, 2005). To compete
at the supply chain level, companies must adopt an appropriate SCMS. Such strategy
needs integration and coordination throughout the supply chain to enhance the
performance of supply chain members (Green Jr. et al., 2008; Cohen and Roussel, 2005;
Wisner, 2003).
Mason-Jones et al. (2000) argue that supply chains need to adopt a strategy that
suits both their particular product and marketplace. Fisher (1997) suggests that the first
step in developing the supply chain strategy is to consider the nature of the demand for an
organization‟s product, proposing that these are either functional or innovative.

9
Functional products are like commodities; they are typically stable, fast moving
consumer goods that are widely available and satisfy basic needs that do not change over
time. As a result, functional products should have a very efficient low-cost supply chain.
On the other hand, innovative products have short life cycles with volatile demand that is
difficult to predict. They need a flexible and fast supply chain to deal with uncertainty in
the demand. Since by definition SCM requires collaboration of all supply chain
participants to satisfy final customers, an SCM strategy must be adopted.
Implementation of such a strategy requires creating a greater level of trust throughout the
supply chain, establishing more frequent contact with supply chain members, and
increasing information sharing and communication among suppliers (Wisner, 2003).
Porter (1990, p.41) argues that a “strategy guides the way a firm performs individual
activities and organizes its entire value chain”. For instance, if a firm has a low-cost
strategy, then the firm should optimize and coordinate the supply chain by having
frequent and timely deliveries from suppliers to reduce the required level of inventory
and achieve low cost. Porter (1990) argues that there are two types of generic strategies
to achieve a competitive advantage: low-cost and differentiation strategies. A low-cost
strategy enables a firm to design and produce a product more efficiently than its
competitors. A differentiation strategy allows a firm to offer a variety of products to the
customer with reliability and responsive services.
Fisher (1997) explains the need to match the appropriate supply chain
management strategy to product characteristics as shown in figure 2. 1., which illustrates
only two extreme types of product characteristics: functional and innovative products.
Fisher argues that functional products which are considered to have stable and predictable

10
demand require an efficient process (efficient chains) to supply that product. On the other
hand, innovative products which are considered to have unpredictable demand require a
responsive supply chain. This match between product type and supply chain strategy will
result in a better profit margin for the organization as Fisher was able to calculate the
profit based on the contribution margin and the stockout rate of functional and innovative
products.
Figure 2.1 Matching supply chains with product characteristics (source:
Fisher, 1997)
Vonderembse et al. (2006) discuss three types of supply chains that are necessary
to match three types of products: standard, innovative, and hybrid. They demonstrate that
standard products, which tend to be simple products with limited amounts of
differentiation, should be produced by a lean supply chain (LSC). LSCs employ
continuous improvement efforts and focus on eliminating wastes across the supply chain.
On the other hand, innovative products which may employ new and complex technology
require an agile supply chain (ASC). ASCs respond to rapidly changing global markets
by being dynamic and flexible across organizations. Hybrid products, which are complex
11
products, have many components and participating companies in the supply chain;
therefore, a variety of supplier relationships may be needed, which they refer to hybrid
supply chains (HSC). HSCs combine the capabilities of lean and agile supply chains to
meet the needs of complex products.
Lee (2002) expands on Fisher‟s ideas but focusing on the “supply” side of the
supply chain in determining the supply chain strategy. He suggests that there are
uncertainties revolving around the supply side that determine the supply chain strategy.
The supply side may be characterized by: (1) stable supply processes and (2) evolving
supply processes. A stable supply process is one where the manufacturing process and the
underlying technology are mature and the supply base is well established. An evolving
supply process is one where the manufacturing process and the underlying technology are
still under early development and are rapidly changing. Although functional products
tend to have more mature and stable supply chains; and innovative products tend to have
more evolving supply chains, this is not always the case. Some functional products could
be supplied by a rapidly changing process i.e. supply of hydroelectric power, which relies
on rainfall in a region. Similarly, there are also innovative products with a stable supply
process. Based on this, Lee (2002) was able to classify supply chain strategy into four
types: efficient supply chains, risk-hedging supply chains, responsive supply chains, and
agile supply chains. An efficient supply chain strategy aims at cutting cost and
eliminating non-value activities. A risk-hedging supply chain strategy aims at pooling
and sharing resources in a supply chain and it is quite common in retailing. A responsive
supply chain strategy tends to focus on being flexible and responsive to changes in
customers‟ demand. An agile supply chain strategy combines both risk-hedging and
12
responsive supply chain strategies. In other words, it aims at being flexible and
responsive to customers while pooling and sharing resources among suppliers.
Furthermore, Towill and Christopher (2002) suggest that there are three types of
supply chain strategies: agile supply chains; lean supply chains; and hybrid supply
chains. In their study, a case study was provided to show how a lean and agile supply
chain can be successfully combined to have a lean/agile supply chain strategy which they
refer to as “hybrid” or “leagile” supply chain. Naylor et al. (1999) uses the term
“leagility” as an integration of lean and agile paradigms with the aid of a decoupling
point in the supply chain. Thus, they provide a personal computer company as a case
study to demonstrate how agility and leanness can be combined successfully within the
supply chain to meet customers‟ requirements.
Regardless of the type of supply chain strategy the organization decided to adopt
(lean, agile, risk hedging, responsive, hybrid), the decision to adopt a supply strategy
should be made at a corporate level (Towill and Christopher 2002). In this study, three
types of supply chain strategies are considered, and they are as follows: (1) lean supply
chain; (1) agile supply chain; (3) hybrid supply chain (Huang et al., 2002; Wang et al.,
2004; Vonderembse et al., 2006). Table 2.1 shows the SCMS construct and its sub
constructs‟ definitions.

13
Table 2.1 The SCMS construct, its sub-constructs definitions, and literature
support
Constructs Definitions Literature
Supply Chain Management Strategy (SCMS)
A strategy that requires an end-to-end supply chain focus that supports integration of business processes throughout the chain for the purpose of providing optimum value to the ultimate customer/consumer.
Cohen and Roussel, 2005; Wisner, 2003; Green Jr. et al., 2008
Lean Supply Chain (LSC)
A supply chain that utilizes a strategy aimed at creating the most cost efficiency in the supply chain by reducing the inventory and focusing on improving the quality in the supply chain, thus eliminating waste.
Huang et al., 2002; Wang et al., 2004; Vonderembse et al., 2006; Towill and Christopher, 2002; Christopher and Towill, 2000; Lee, 2002.
Agile Supply Chain (ASC)
A supply chain that utilizes a strategy aimed at being responsive and flexible to changing customer needs by responding quickly and effectively (to rapidly changing dynamic and continually fragmenting markets).
Huang et al., 2002; Christopher and Towill, 2000; Wang et al., 2004; Vonderembse et al., 2006; Christopher, 2000; van Hoek et al., 2001; Lin et al., 2006; Agarwal et al., 2007; Towill and Christopher, 2002; Power et al., 2001; Lee, 2002.
Hybrid Supply Chain (HSC)
A supply chain that utilizes “assemble to order” strategy. This is a combination of a lean and agile supply chain aimed at achieving mass customization by postponing product differentiation until final assembly.
Huang et al., 2002; Naylor et al., 1999; Wang et al., 2004; Vonderembse et al., 2006; Towill and Christopher, 2002; Christopher and Towill, 2000.

14
2.1.1 Lean Supply Chain (LSC)
A lean supply chain (LSC) refers to a supply chain that utilizes a strategy aimed at
creating the most cost efficiency in the supply chain by reducing the inventory and
focusing on improving the quality in the supply chain, thus eliminating waste (Huang et
al., 2002; Wang et al., 2004; Vonderembse et al., 2006). Christopher (2000) argues that
lean supply chains work well where demand is relatively stable and predictable, and
variety is low.
Christopher and Towill (2000) suggest that an important lean supply chain
attribute is the minimization of total lead-times in the supply chain since by definition
excess time is waste and leanness calls for elimination of all wastes. Vitasek et al. (2005)
define six attributes for lean supply chains: (1) demand management capability, which
means doing a better job of managing demand signals by getting demand data from
customers to suppliers, (2) waste and cost reduction, which means working together to
modify policies, procedures, and practices that produce or encourages waste, (3) process
and product standardization, which means determining the best way to manage a process
then standardizing that process across the chain, (4) industry standards adoption which
extends standards beyond a company‟s particular supply chain to the industry overall to
reduce development costs for the original equipment manufacturers and allow for
standardized processes in assembly, (5) cultural change competency, which is considered
as one of the obstacles to successfully applying lean supply chains and getting lean
strategies accepted in the organization. Companies with cultural change competency view
their employees as valued assets and emphasize lean and total quality management
programs, (6) cross-enterprise collaboration, which means that supply chain partners

15
must work together to maximize the value stream to the customer. In lean supply chains,
teams must work toward solutions that benefit all members of the supply chain.
In summary, a lean supply chain can be recognized as a strategy for managing the
supply chain in an efficient way by eliminating waste and employing continuous
improvement techniques across the chain.
2.1.2 Agile Supply Chain (ASC)
An agile supply chain (ASC) refers to a supply chain that utilizes a strategy aimed
at being responsive and flexible to changing customer needs by responding quickly and
effectively to rapidly changing dynamic and continually fragmenting markets
(Christopher, 2000; Huang et al., 2002; Wang et al., 2004; Vonderembse et al., 2006).
Lin et al. (2006) suggest that ASC focuses on promoting adaptability, flexibility
and has the ability to respond appropriately and react quickly and effectively to changes
in the market. They developed a conceptual model of agile supply chain that consists of
agility drivers and agility enablers which impact and determine the capability of an agile
supply chain. They identified four main capabilities of an agile supply chain: (1)
responsiveness, which is the ability to identify changes and respond quickly to them, (2)
competency, which is the ability to efficiently and effectively realize enterprise
objectives, (3) flexibility/adaptability, which is the ability to implement different
processes and apply different facilities/equipments to achieve the same goal, and (4)
quickness/speed, which is the ability to complete an activity as quickly as possible. They
also identified main attributes for measuring agility in the supply chain: (1) collaborative
relationships (strategy), (2) process integration (foundation), (3) information integration
(infrastructure), and (4) customer/marketing sensitivity (mechanism). Christopher (2000)

16
distinguishes four characteristics of an agile supply chain: (1) market sensitivity, which
means that the supply chain is capable of responding faster to customers, (2) virtual
supply chain, which means using IT to share data between manufacturers and suppliers,
(3) process integration, which means collaborative work between manufacturers and
suppliers, joint product development, common system, and shared information, and
finally (4) network, which means linking all the suppliers together as one entity rather
than stand-alone entities. van Hoek et al. (2001) argue that there is a lack of insight into
supply chain agility since the focus of researchers has been on manufacturing agility and
not supply chain agility. Therefore, they developed a framework for supply chain agility
and suggested specific dimensions/capabilities of supply chain agility based upon an
empirical study conducted in Europe. They came up with the same four dimensions
identified by Christopher (2000). Agarwal et al. (2007) developed a model of variables
for improving supply chain agility. Those variables are important for managers to
formulate and build supply chain agility strategies. The variables are: delivery speed, data
accuracy, new product introduction, centralized and collaborative planning, process
integration, use of IT tools, lead-time reduction, service level improvement, cost
minimization, customer satisfaction, quality improvement, uncertainty minimization,
trust development, and minimization of resistance to change. Power et al., (2001)
identified critical factors for managing an agile supply chain based on the result of an
empirical study of Australian manufacturing firms. Some of those factors are related to
the involvement of suppliers, focus on customers, and technology utilization that
differentiates the “more agile” organizations from “less agile”.

17
In summary, the notion of agility in supply chains can be recognized as a strategy
for managing the supply chain when organizations need to respond quickly and
effectively to rapid changes in customers‟ demand. Some of the attributes, characteristics,
and capabilities of ASC have been identified in this literature.
2.1.3 Hybrid Supply Chain (HSC)
A hybrid supply chain (HSC) refers to a supply chain that utilizes an “assemble to
order” strategy. It‟s a combination of a lean and agile supply chain in which the supply
chain achieves mass customization by postponing product differentiation until final
assembly (Huang et al., 2002; Wang et al., 2004; Vonderembse et al., 2006). Naylor et
al. (1999) define a hybrid supply chain as “The combination of lean and agile paradigms
with the supply chain strategy by positioning the decoupling point so that they best suit
the need for responding to a volatile demand downstream yet providing level scheduling
upstream from the marketplace”. The point that separates part of the supply chain that
responds directly to customers (being agile) from the part of the supply chain that uses
strategic stocks to buffer against the variability in the demand (being lean) is referred to
as “decoupling point”. The aim of postponement is to increase the efficiency of the
supply chain by moving product differentiation (at the decoupling point) closer to the end
customer (Naylor et al., 1999). Towill and Christopher (2002) argue that processes are
designed to be lean at the upstream of the decoupling point, and agile at the downstream
of the decoupling point in a hybrid supply chain.
The difference between lean, agile, and hybrid supply chains has been presented
in some studies (Huang et al., 2002; Wang et al., 2004; Vonderembse et al., 2006). Table

18
2.2 summarizes the differences between lean, hybrid, and agile supply chains (Huang et
al., 2002).
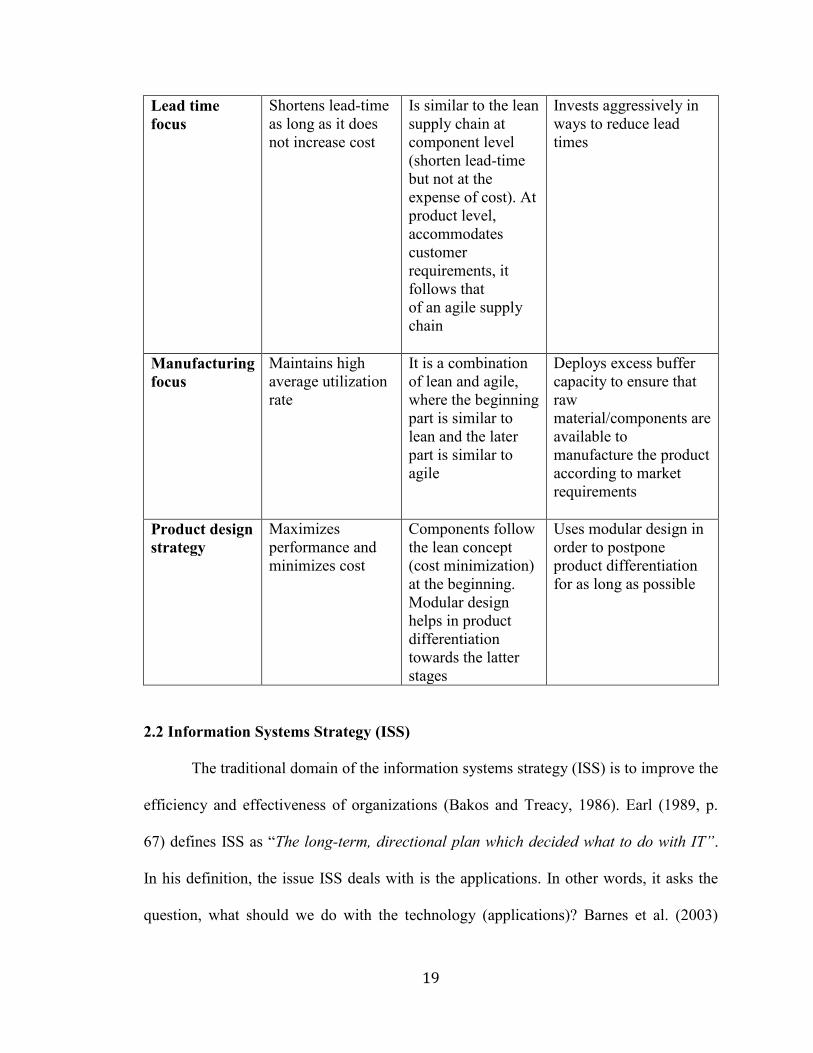
Table 2.2 A comparison of lean, hybrid, and agile supply chains (source:
Huang et al., 2002; Wang et al., 2004)
Category Lean supply chain Hybrid supply chain
Agile supply chain
Purpose
Focuses on cost reduction, flexibility and incremental improvements for already available products Employs a continuous improvement process to focus on the elimination of waste or non-value added activities across the chain
Interfaces with the market to understand customer requirements, maintaining future adaptability Tries to achieve mass customization by postponing product differentiation until final assembly and adding innovative components to the existing products
Understands customer requirements by interfacing with the market and being adaptable to future changes Aims to produce in any volume and deliver into a wide variety of market niches simultaneously Provides customized products at short lead times (responsiveness)
Approach to choosing suppliers
Supplier attributes involve low cost and high quality
Supplier attributes involve low cost and high quality, along with the capability for speed and flexibility, as and when required
Supplier attributes involve speed, flexibility, and quality
Inventory strategy
Generates high inventory turnover and minimizes inventory throughout the chain
Postpones product differentiation until as late as possible. Minimizes functional components inventory
Deploys significant stocks of parts to tide over unpredictable market requirements
19
Lead time focus
Shortens lead-time as long as it does not increase cost
Is similar to the lean supply chain at component level (shorten lead-time but not at the expense of cost). At product level, accommodates customer requirements, it follows that of an agile supply chain
Invests aggressively in ways to reduce lead times
Manufacturing focus
Maintains high average utilization rate
It is a combination of lean and agile, where the beginning part is similar to lean and the later part is similar to agile
Deploys excess buffer capacity to ensure that raw material/components are available to manufacture the product according to market requirements
Product design strategy
Maximizes performance and minimizes cost
Components follow the lean concept (cost minimization) at the beginning. Modular design helps in product differentiation towards the latter stages
Uses modular design in order to postpone product differentiation for as long as possible
2.2 Information Systems Strategy (ISS)
The traditional domain of the information systems strategy (ISS) is to improve the
efficiency and effectiveness of organizations (Bakos and Treacy, 1986). Earl (1989, p.
67) defines ISS as “The long-term, directional plan which decided what to do with IT”.
In his definition, the issue ISS deals with is the applications. In other words, it asks the
question, what should we do with the technology (applications)? Barnes et al. (2003)

20
suggest that ISS is concerned with what applications should be acquired and how they
should be managed?
Earl (1989) argues that the ISS should originate from the business strategy. This
means that IT should facilitate implementing the business strategy (whatever that
business strategy is) and help achieve its goals. In another study, King (1978) argues that
ISS should be derived from the business strategy. He argues that ISS cannot exist in a
vacuum. Thus, organizations need to ensure that the development of an effective ISS
does not occur in isolation from the business strategy; it must support and occur within
the business strategy (Puckridge and Woosley, 2003). This implies that in order for
organizations to develop an ISS, it should first consider its business strategy.
Furthermore, Weill (1990) developed a framework to investigate the impact of
originating an ISS from a business strategy on firm performance. The result of his
empirical study suggests that investing in applications that support business strategy will
provide the firm with a competitive advantage.
A strategy at the business level (also referred to as strategic business unit “SBU”)
is concerned with the following question: How do we compete effectively in each of our
chosen product- market segments? (Venkatraman, 1989a). This suggest that if a company
decided to compete in the market by offering the lowest price to achieve a competitive
advantage, then its ISS should support its business strategy and focus more on being
efficient to cut cost and therefore achieve the lowest price possible. Camillus and Lederer
(1985) suggest that there should be a match between the design of the IS and the strategic
management choices of the organization. Hence, if business strategy demands creativity,
quick response and innovation, an ISS should adopt a flexible approach to help foster

21
different managerial responses and attitudes; this is what Earl (1989) refers to as the
“Opportunity-led” strategy. This opportunity-led strategy focuses on investing in specific
applications that provide and create new opportunities for organizations which are
necessary for developing the business. The ISS for those applications creates and adopts
new strategic opportunities. As a result, there is a need for particular applications that
focus on being flexible. On the other hand, where efficiency is the heart of the business
strategy, the ISS strategy should emphasize efficient execution of some practices (e.g.
enable the organization to share quality information between entities) to support its
business strategy. This is what Earl (1989) refers to as the “Infrastructure-led” strategy.
This ISS helps the business deliver its goods and services in the sector e.g., banks and
retail industries. The infrastructure for those industries, which is an IT-based
infrastructure, becomes the platform for product development. At this point the business
strategy and the ISS is the same thing. Here, the ISS is concerned with laying down
telecommunications networks, rationalizing data standards, creating an appropriate
hardware environment and developing a basic business systems foundation. The ISS
focuses on developing efficient and updated basic systems. In other words, companies
which depends on IS to deliver their products will not care that much if they do not have
specific cutting edge systems. However, the focus of those companies is to obtain highly
standardized and efficient systems to help them deliver their products/services and keep
them in business. The ISS goal here is to invest in applications that helps improve the
efficiency of day-to-day activities. So the question becomes, what are the types of
business strategy that the ISS should support or be derived from?

22
Miles and Snow (1978) identified three different business organizational types
which employ different strategies: (1) defenders; (2) prospectors; (3) analyzers.
Defenders are organizations which have narrow product-market domains. They always
try to focus on improving the efficiency of their existing operations by developing a
single core technology that is highly cost-efficient. Prospectors are organizations which
continually search for market opportunities. They always focus on being innovative
which creates uncertainty in the market. Analyzers are organizations which focus on
improving their existing operations and also seek new market opportunities (innovative).
In other words, they use a combination of defenders‟ and prospectors‟ business strategy.
Venkatraman (1989a) developed an important construct termed Strategic Orientation of
Business Enterprise (STROBE). He assumes that this construct is a multidimensional
construct. Six important dimensions/attributes of (STROBE) are identified in his study:
(1) aggressiveness, (2) analysis, (3) defensiveness, (4) futurity (5) proactiveness, and (6)
riskiness. Sabherwal and Chan (2001) mapped the six STROBE attributes to the business
strategy types (defenders, prospectors, and analyzers). They also mapped four ISS
attributes (operational support systems, market information systems, strategic support
systems, and inter-organizational information systems) to the ISS types (IS for efficiency,
IS for flexibility, and IS for comprehensiveness). They argue that there are three types of
ISS (IS for efficiency, IS for flexibility, and IS for comprehensiveness) corresponding to
the defenders‟, prospectors‟, and analyzers‟ business strategies, respectively. They found
that, for defenders, an IS for efficiency strategy is oriented towards intra and inter-
organizational efficiencies and long term decision making. An IS for flexibility strategy
is focused on market flexibility and quick strategic decisions (suitable for the
23
prospectors). Finally, an IS for comprehensiveness strategy enables comprehensive
decisions and quick responses through knowledge of other organizations (suitable for the
analyzers).
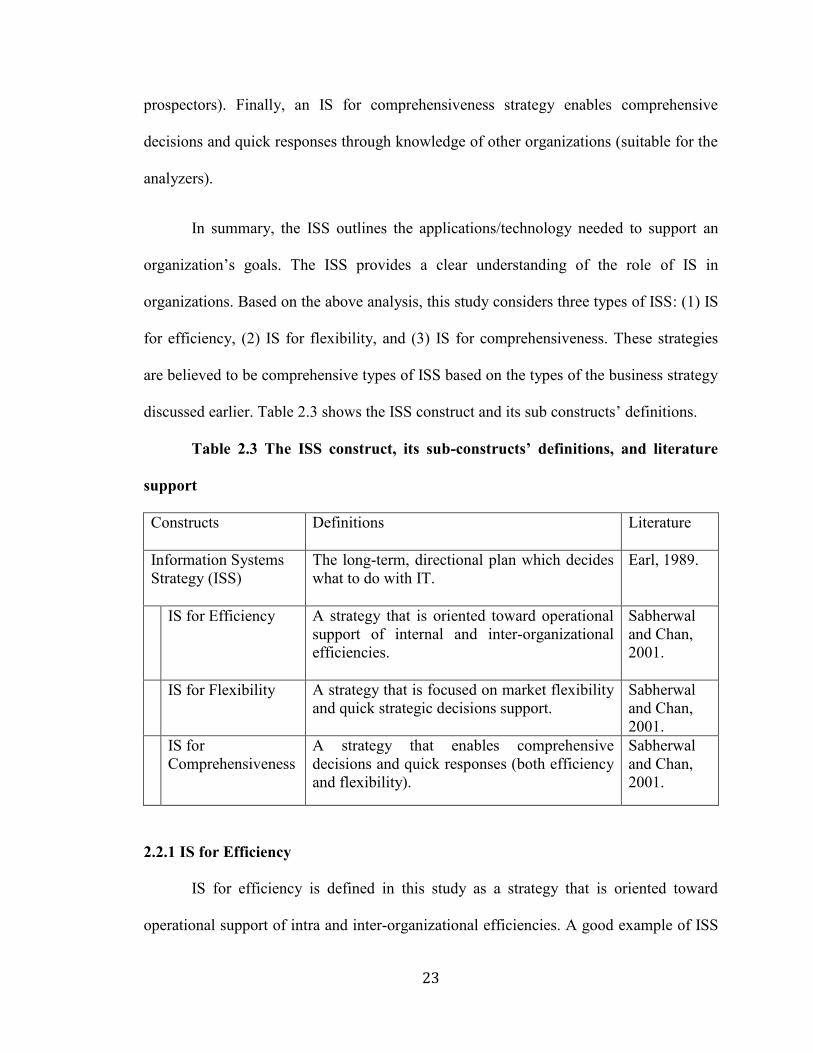
In summary, the ISS outlines the applications/technology needed to support an
organization‟s goals. The ISS provides a clear understanding of the role of IS in
organizations. Based on the above analysis, this study considers three types of ISS: (1) IS
for efficiency, (2) IS for flexibility, and (3) IS for comprehensiveness. These strategies
are believed to be comprehensive types of ISS based on the types of the business strategy
discussed earlier. Table 2.3 shows the ISS construct and its sub constructs‟ definitions.
Table 2.3 The ISS construct, its sub-constructs’ definitions, and literature
support
Constructs Definitions Literature
Information Systems Strategy (ISS)
The long-term, directional plan which decides what to do with IT.
Earl, 1989.
IS for Efficiency A strategy that is oriented toward operational support of internal and inter-organizational efficiencies.
Sabherwal and Chan, 2001.
IS for Flexibility A strategy that is focused on market flexibility and quick strategic decisions support.
Sabherwal and Chan, 2001.
IS for Comprehensiveness
A strategy that enables comprehensive decisions and quick responses (both efficiency and flexibility).
Sabherwal and Chan, 2001.
2.2.1 IS for Efficiency
IS for efficiency is defined in this study as a strategy that is oriented toward
operational support of intra and inter-organizational efficiencies. A good example of ISS

24
for efficiency is investing in operational support systems (i.e. enterprise resource
planning). This application helps in monitoring and controlling the day-to-day operations
that are expected to facilitate operational efficiency (Sabherwal and Chan, 2001).
Moreover, Bakos and Treacy (1986) discuss how ISS helps organizations to be
more efficient by improving the internal operational efficiency of a single firm, and the
inter-organizational efficiencies through better coordination with customers and
suppliers. For example, one might connect the production planning systems of a firm
with the order entry system of suppliers to lower the amount of inventory in process and
the turnaround time for new orders. Therefore, improving coordination and collaboration
of information across suppliers will increase the information availability and process
capability, which will result in reducing the coordination cost and therefore result in
being more efficient (Clemons et al., 1993).
In summary, internal and inter-organizational operations can be made more
efficient if organizations have an ISS that support being more efficient and cost effective.
2.2.2 IS for Flexibility
IS for flexibility is defined in this study as a strategy that is focused on market
flexibility and quick strategic decision support (Sabherwal and Chan, 2001). For
example, strategic decision support systems (SDSS) help organizations make strategic
decisions quickly and effectively by enabling executives to analyze (threats,
opportunities, strengths, and weaknesses), describe strategic situations, select alternative
strategies, and monitor performances (Belardo et al., 1994).
Rockart and Morton (1984) provided a good example of how ISS can be used to
achieve flexibility. When a distributor company decided to use IS to allow customers to

25
enter their orders directly, customers started to order directly from the distributor
company. Additionally, customers began to request new items that are not previously
carried by the company. The company decided to use the order data proactively, by
becoming closely involved with their customers and tracking and forecasting their
preferences. As a result, IS was able to help the company to speed up the response time,
introduce new products, and introduce potential new customers.
Porter and Millar (1985) argue that IS leads to flexibility and new product
development. They provided an example of how planning for IS at the strategic level
could lead to achieving flexibility. When General Electric (GE) decided to rebuild its Erie
locomotive facility, they decided to use IS to help them in the design of motors. As a
result, GE was able to design different types of motor frames without the need to use
manual adjustments. This really helped GE to respond faster to the market. Another
example of how IS leads to new product development is Western‟s Union link service.
“Western Union’s easy link service (a sophisticated high-speed data-communications
network) allows personal computers, word processors, and other electronic devices to
send messages to each other and to telex machines throughout the world. This service
was not needed before; the spread of information technology caused a demand for it.”
(Porter and Millar, 1985 p. 158).
Furthermore, planning to use IS to select fewer suppliers, monitor their
performance, or store information regarding complaints about the suppliers will help in
coordinating decision making with suppliers through information sharing (Clemons et al.,
1993). Hence, sharing information with suppliers will lead to increased flexibility and
improve timeliness of production (Bakos and Brynjolfsson, 1993).

26
2.2.3 IS for Comprehensiveness
Allen and Boynton (1991) suggest that organizations need to face the challenges
of both “low cost and efficient” and of “speed and flexibility”. They argue that in order
for organizations to meet the challenges of the market, organizations need to combine
elements of both (low cost and flexibility) through a revamped IS architecture.
IS for comprehensiveness is defined in this study as a strategy that enables
comprehensive decisions and quick responses (both efficiency and flexibility) (Sabherwal
and Chan, 2001). Allen and Boynton (1991) argue that there are two extreme ways to
achieve IS for both efficiency and flexibility: First, organizations must decentralize the IS
applications so that IS becomes the responsibility of every level of operating
management, and inter-link communications of those applications with suppliers. This is
what they refer to in their study as “the low-road” solution, which will result in
companies achieving a low-cost production and being more efficient. Second,
organizations must centralize IS applications by having common/standardized application
systems that help achieve flexibility. This is what they refer to in their study as “the high-
road” solution. The result of their study shows that companies must combine both
solutions (the high and low-road solutions) to achieve IS for efficiency and flexibility in
order for firms to meet the challenges of the market. A good example of an organization
that takes elements of both solutions is Hewlett-Packard (HP). A manager of HP focuses
on the ISS in order to achieve low cost and flexibility. “The company is an innovator and
is organized with considerable decentralized responsibility throughout its 54
manufacturing sites and 375 sales and service offices. Following a low-road philosophy,
IS is decentralized and IS management is considered a critical part of every manager’s

27
responsibility. Yet the corporation has concluded that high-road needs exist for company-
wide data and common systems in five key areas: Sales and service, procurement,
quality, personnel, and accounting.” (Allen and Boynton, 1991 p. 443).
Moreover, Zhang and Lado (2001) argue that ISS plays an important role in
supporting organizational capabilities which convert inputs into outputs, by improving
the operational efficiency and flexibility. Weerakkody and Hinton (1999) provide case
studies to illustrate how organizations should rethink their ISS and redesign their systems
in line with business processes to improve the efficiency, effectiveness, and speed of
product/service.
Sabherwal and Chan (2001) suggest that market information systems help
organizations observe the market in order to respond very quickly to market changes.
They argue that IS for comprehensiveness should help organizations understand and
monitor the market (external analysis) to seek any opportunity (by making quick
decisions), to introduce new products, and to help organizations maintain their position in
the market. In other words, IS should assist in, first understanding the market, then
making quick decisions to introduce new products and to maximize any opportunities for
growth. McLaren et al. (2004) expand on this by arguing that ISS should support SCM to
enable operational efficiency, flexibility, internal planning and analysis, and external
planning and analysis. They refer to such IS in the supply chain as “enterprise or inter-
organizational systems used to coordinate information between the manufacturers,
suppliers, distributors, and other partners in the supply chain” to reduce costs and
increase the responsiveness of their supply chain.

28
2.3 Supply Chain Management (SCM) Practices
SCM includes a set of approaches and practices that effectively integrate
suppliers, manufacturers, distributors, and customers to improve the long-term
performance of firms and their supply chains (Chopra and Meindl, 2001). These practices
represent opportunities for organizations to differentiate themselves on the basis of
superior performance in the context of demand forecasting, product availability,
inventory management, and distribution (Zielke and Pohl, 1996). Thus, organizations that
successfully implement SCM practices achieve superior supply chain performance. This,
however, requires internal cross-functional integration within a firm and external
integration with suppliers or customers (Narasimhan, 1997).
In this study, SCM practices are defined as a set of activities aimed at improving
the performance of the supply chain (Li et al., 2005; Li et al., 2006; Wong et al., 2005;
Zhou and Benton, 2007; Koh et al., 2007). Table 2.4 shows the SCM practices construct
and its sub constructs‟ definitions and literature support.
Table 2.4 The SCM practices construct, its sub-constructs’ definitions, and
literature support
Construct Definition Literature
SCM practices A set of activities aimed at improving the performance of the whole supply chain.
Li et al., 2005; Li et al., 2006; Wong et al., 2005; Zhou and Benton, 2007; Koh et al., 2007.
Strategic supplier partnership
The long term relationship between the organization and its suppliers to influence the strategic and operational capabilities of individual participating companies to
Li et al., 2005; Li et al., 2006; Monczka et al., 1998.

29
Tan et al. (2002) recognized six aspects of SCM practices through factor analysis
addressing various aspects of supply and material management issues, ranging from a
broad- based supply chain integration to more specific just-in-time (JIT) capabilities.
Zhou and Benton (2007) consider only three categories of supply chain practices: supply
help them achieve significant ongoing benefits.
Customer relationship The entire array of practices that are employed for the purpose of managing customer complaints, building long-term relationships with customers, and improving customer satisfaction.
Li et al., 2005; Li et al., 2006; Claycomb et al., 1999; Tan et al., 1998.
Internal lean practices
The practices of eliminating waste (cost, time, etc.) in manufacturing systems, characterized by reduced set-up times, small lot sizes, and pull-production.
Li et al., 2006; Li et al., 2005; Handfield and Nichols 1999; Mason-Jones and Towill 1997; McIvor 2001; Taylor 1999; Womack and Jones 1996.
Postponement
The practice of moving forward one or more operations or activities (making, sourcing and delivering) to a much later point in the supply chain.
Li et al., 2006; Li et al., 2005; Naylor et al., 1999; van Hoek et al., 1999; Beamon, 1998.
Information sharing
The extent to which critical and proprietary information is communicated to one‟s supply chain partner.
Li et al., 2005; Li and Lin, 2006; Monczka et al., 1998; Li et al., 2006; Mohr and Spekman, 1994.
Information quality The extent to which information exchange is accurate, timely, complete, adequate, and credible.
Li and Lin, 2006; Li et al., 2005; Monczka et al., 1998; Li et al., 2006; Mohr and Spekman, 1994.
30
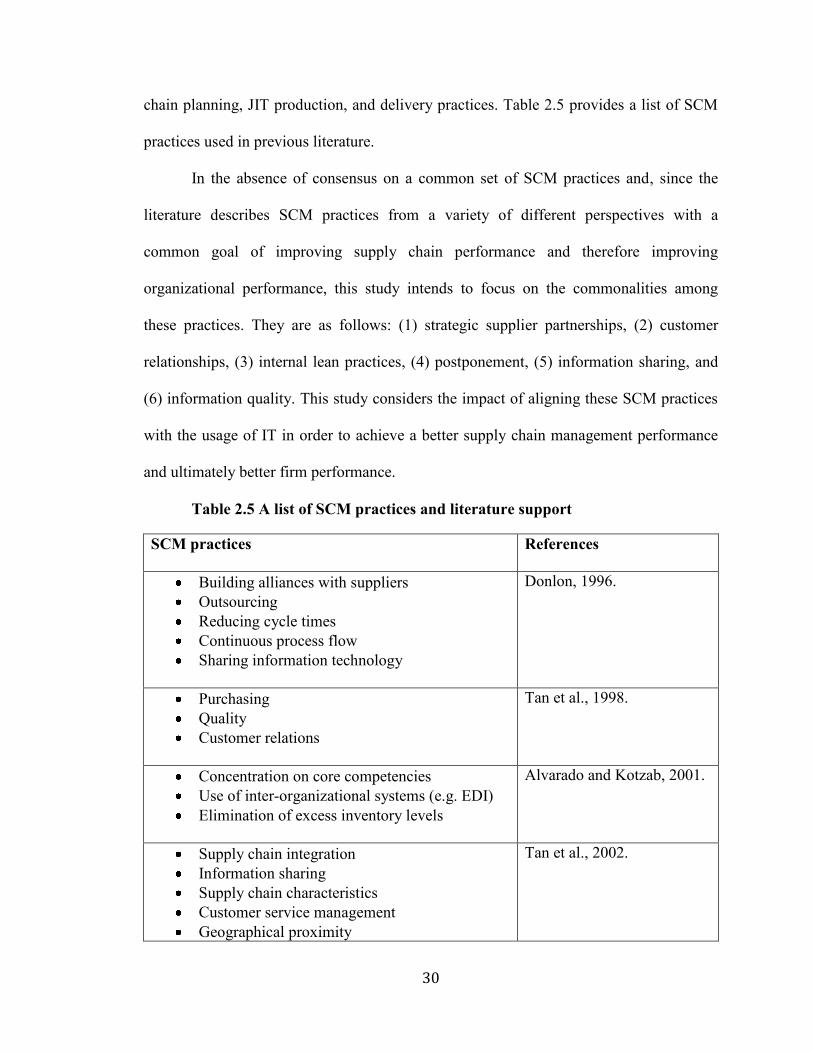
chain planning, JIT production, and delivery practices. Table 2.5 provides a list of SCM
practices used in previous literature.
In the absence of consensus on a common set of SCM practices and, since the
literature describes SCM practices from a variety of different perspectives with a
common goal of improving supply chain performance and therefore improving
organizational performance, this study intends to focus on the commonalities among
these practices. They are as follows: (1) strategic supplier partnerships, (2) customer
relationships, (3) internal lean practices, (4) postponement, (5) information sharing, and
(6) information quality. This study considers the impact of aligning these SCM practices
with the usage of IT in order to achieve a better supply chain management performance
and ultimately better firm performance.
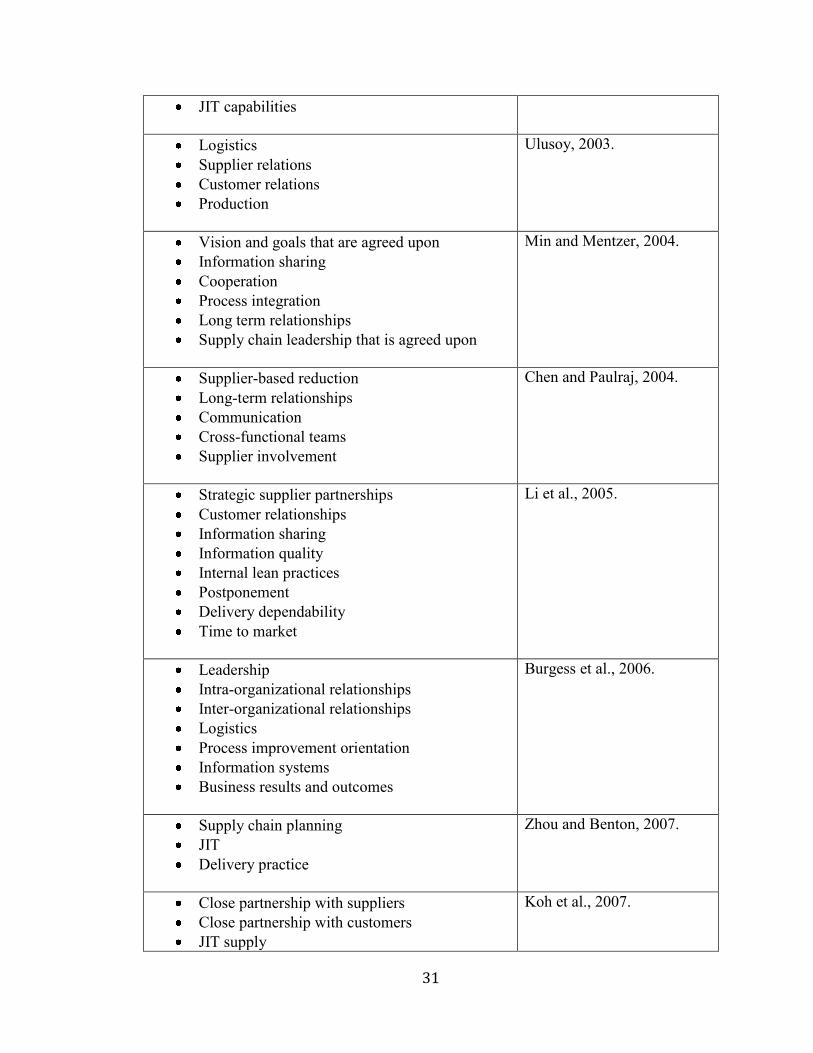
Table 2.5 A list of SCM practices and literature support
SCM practices
References
Building alliances with suppliers Outsourcing Reducing cycle times Continuous process flow Sharing information technology
Donlon, 1996.
Purchasing Quality Customer relations
Tan et al., 1998.
Concentration on core competencies Use of inter-organizational systems (e.g. EDI) Elimination of excess inventory levels
Alvarado and Kotzab, 2001.
Supply chain integration Information sharing Supply chain characteristics Customer service management Geographical proximity
Tan et al., 2002.
31
JIT capabilities
Logistics Supplier relations Customer relations Production
Ulusoy, 2003.
Vision and goals that are agreed upon Information sharing Cooperation Process integration Long term relationships Supply chain leadership that is agreed upon
Min and Mentzer, 2004.
Supplier-based reduction Long-term relationships Communication Cross-functional teams Supplier involvement
Chen and Paulraj, 2004.
Strategic supplier partnerships Customer relationships Information sharing Information quality Internal lean practices Postponement Delivery dependability Time to market
Li et al., 2005.
Leadership Intra-organizational relationships Inter-organizational relationships Logistics Process improvement orientation Information systems Business results and outcomes
Burgess et al., 2006.
Supply chain planning JIT Delivery practice
Zhou and Benton, 2007.
Close partnership with suppliers Close partnership with customers JIT supply
Koh et al., 2007.

32
Strategic planning Supply chain benchmarking Few suppliers Holding safety stock and sub-contracting E-procurement Outsourcing 3PL Subcontracting Many suppliers
2.3.1 Strategic Supplier Partnership
Dyer et al. (1998) suggest that not all suppliers should be considered as strategic
suppliers. They argue that, first, suppliers should be analyzed strategically to determine
which suppliers contribute to the core competence and competitive advantage of the
buying firm. Only then should companies conduct a strategic supplier partnership with
them. Sarkis and Talluri, (2002) propose an analytical network process (ANP) model to
address the selection of strategic suppliers. The ANP model shows a graphical
representation of analytical network hierarchy for strategic supplier selection. The model
consists of a number of factors that determine how to select strategic suppliers. One of
those factors is the strategic performance metric. Strategic performance metrics focus on
considering the quality, cost, delivery speed, and flexibility of the suppliers in
determining whether they are strategic suppliers.
Strategic supplier partnerships require a high degree of coordination between the
organization and its suppliers; companies tend to have a long-term relationship with
suppliers that create value to each party. In this study, a strategic supplier partnership is
defined as the long term relationship between the organization and its suppliers which
influences the strategic and operational capabilities of individual participating companies

33
to help them achieve significant ongoing benefits (Li et al., 2005; Li et al., 2006;
Monczka et al., 1998).
It is important to differentiate a strategic supplier partnership from a simple long-
term partnership. A strategic supplier partnership is not only about buying goods and
services from suppliers, but it is also about impacting the suppliers‟ systems and
operational capabilities, adding value to the goods and services, and improving the
performance of the whole supply chain (Monczka et al., 1998). This kind of partnership
emphasizes a direct, long-term association with suppliers, encouraging mutual planning
and problem solving efforts, and selecting fewer suppliers (Maloni and Benton, 1997;
Gunasekaran et al., 2001). Furthermore, Graham et al. (1994) found that a strategic
supplier partnership improves the quality of supplier operations and improves the quality
of parts that are supplied, which results in better product quality. Thus, strategic
partnerships will encourage suppliers to be involved and participate in quality
certification programs. In another empirical study on strategic supplier partnership, Stuart
(1993) suggests that sharing of information, continuous improvement, and the joint
problem-solving effort are the keys to a successful strategic partnership with suppliers.
2.3.2 Customer Relationship
Tan et al. (1998) suggest that customer relationship is an important element of
SCM practices; it involves the downstream element of SCM. In their study, customer-
relations practices include the following: evaluating customer complaints, following-up
with customers for feedback, enhancing customer support, predicting key factors
affecting customer relationships, predicting customers‟ future expectations, interacting
with customers to set standards, and measuring customer satisfaction. Furthermore, the

34
result of their survey suggests that firms that have strong customer relationships are
confident in their ability to evaluate customer complaints and provide support to their
customers.
Customer relationship is defined as the entire array of practices that are employed
for the purpose of managing customer complaints, building long-term relationships with
customers, and improving customer satisfaction (Li et al., 2005; Li et al., 2006).
According to Ulusoy (2003) customer satisfaction, customer services, and delivery
performance are the elements of customer relationship. He suggests that meeting
customers‟ requirements and expectations are broad indicators of customer satisfaction.
Additionally, feedback from customers helps improve product design to meet customer
expectations.
Vickery et al. (2003) emphasize the importance of establishing a close customer
relationship as a major practice of supply chain integration to enable organizations to
respond faster to customers. As the demand for customized products and personalized
services increases, so does the need to have close relationships with customers (Wines,
1996). Furthermore, Tu et al. (2004) hypothesize that close customer contact will lead to
higher levels of mass customization capabilities. This suggests that close and continuous
interaction with customers is essential for organizations to develop highly customized
products.
2.3.3 Internal Lean Practices
Global challenges during the past two decades have forced manufacturing firms to
adopt new approaches/concepts to sustain a competitive advantage. Among those
approaches is the concept of internal lean practices (Shah and Ward, 2003). They

35
reviewed the literature and identified a list of lean manufacturing practices: bottleneck
removal (production smoothing), cellular manufacturing, competitive benchmarking,
continuous-improvement programs, cross-functional work forces, cycle time reduction,
focused factory production, lot sizing reduction, maintenance optimization, new process
equipment/technologies, planning and scheduling strategies, preventive maintenance,
process capability measurements, pull production/Kanban, quality management
programs, quick changeover techniques, reengineered production processes, safety
improvement programs, self-directed work teams, and total quality management.
Just as manufacturing firms are required to change and adopt lean practices, so are
the firm‟s suppliers. Li et al. (2005) suggest that if organizations do not attempt to
eliminate waste from their internal supply chain, then the organization will run the risk of
losing customers. Hence, organizations must extend lean practices down through the
supply chain in order for the company to gain the full effectiveness of the lean system
(McIvor, 2001).
Internal lean practices are defined as the practices of eliminating waste (cost,
time, etc.) in manufacturing systems, characterized by reduced set-up times, small lot
sizes, and pull-production (Li et al., 2005, Li et al., 2006). Lean practices focus on
eliminating waste. The former president of Toyota, Fujio Cho, defines waste as “anything
other than the minimum amount of equipment, materials, parts, and workers (working
time) which are essential to production”. Furthermore, Fujio Cho identified seven types
of waste to be eliminated from the supply chain: (1) waste from overproduction, (2)
waste of waiting time, (3) transportation waste, (4) inventory waste, (5) processing waste,
(6) waste of motion, and (7) waste from production (Jacobs and Chase 2008).

36
2.3.4 Postponement
Postponement is defined as the practice of moving forward one or more
operations or activities (making, sourcing, and delivering) to a much later point in the
supply chain (Li et al., 2006; Li et al., 2005; Naylor et al., 1999; van Hoek et al., 1999;
Beamon, 1998). Firms adopt postponement strategies to sustain competitive advantage.
Hence, by keeping materials undifferentiated for as long as possible, companies such as
Dell are able to (1) increase their flexibility in responding to changes in customer demand
and (2) achieve cost-effectiveness in the supply chain by keeping undifferentiated
inventories (van Hoek et al.,1999).
The literature has identified different types of postponement strategy. For
instance, Pagh and Cooper (1998) distinguish between manufacturing, logistics, and full
postponement. A manufacturing postponement strategy is one in which the final
assembly of the product is often carried out by a third-party (3PL) logistics service
provider. A logistics postponement strategy is relevant when a distribution center
supplies dealers with spare parts. A full postponement strategy is a combination of both
(manufacturing and logistics postponement strategies). In another study, van Hoek (1999)
identifies three types of postponement strategy: form, time, and place. A form
postponement (manufacturing postponement) means that a company will delay
manufacturing, assembly or even design activities, until customers‟ orders are received;
this is what Mikkola and Skjøtt-Larsen (2004) refer to as modularization. Time and place
postponement strategies which are referred to as (logistics strategy) suggest that goods
are stored at central distribution points in the supply chain. Table 2.6 provides a list of
postponement strategies and literature support.

37
Table 2.6 A list of postponement strategies and literature support
Postponement Strategies
Literature support
Generic supply chain postponement and speculation strategies
Pagh and cooper, 1998.
The full speculation strategy The logistics postponement strategy The manufacturing postponement strategy The full postponement strategy
Generic types of postponement
van Hoek, 1999.
Form Time Place
Supply chain postponement strategies for global brands
Cooper, 1993.
Bundle manufacturing strategy Unicentric strategy Deferred assemble strategy Deferred packing strategy
Strategies for form postponement
Zinn and Bowersox, 1988.
Labeling Packaging Assembly Manufacturing Time
Speculation-postponement strategy and a continuum of standardization/customization
Yang and Burns, 2003.
Purchasing postponement Manufacturing postponement Assembly postponement Packaging/labeling postponement Logistics postponement
Yang and Burns (2003) argue that the implementation of postponement strategies
will often results in reconfiguration of the supply chain and often place the warehouse
where the final assembly is processed. Waller et al. (2000) suggest that postponement can

38
be extended further upstream in the supply chain to suppliers of raw materials or
downstream in the supply chain to distributors and retailers. They argue that
postponement decisions should be made with respect to SCM in market-oriented
organizations. In other words, companies should consider their SCM capabilities, and
coordinate appropriate changes in postponement among suppliers to achieve faster
production and cost reduction.
2.3.5 Information Sharing
Li et al. (2005) emphasize the importance of information sharing to SCM practice.
The main principle of SCM is sharing of information within supply chains (Moberg et al.,
2002). By sharing information with members of the supply chain, an organization can
respond more quickly to the customer‟s changing needs (Li and Lin, 2006).
Information sharing is defined as the extent to which critical and proprietary
information is communicated to one‟s supply chain partner (Li et al., 2005; Li and Lin,
2006; Monczka et al., 1998; Li et al., 2006; Mohr and Spekman, 1994).
Mohr and Spekman (1994) suggest that information sharing and being
knowledgeable about each other‟s business help partners maintain their relationship for a
longer time. Thus, it will reduce uncertainties in the market if supply chain members have
more information and knowledge about other members (Yu et al., 2001). Furthermore,
Frazier et al. (1988) suggest that organizations should share and exchange information
with their suppliers regarding production plans, core product, process design, schedules,
and product development to create synergies between the organization and its suppliers.
This synergy will increase the ability of supply chains to react effectively to sudden
changes and uncertainties in the market (Lee, 2000).
39
2.3.6 Information Quality
As we noted earlier, sharing information is important for the functioning of the
supply chain. However, sharing quality information between members of the supply
chain is important as well. For instance, sharing information within the entire supply
chain can create flexibility, but this requires accurate and timely information (Jarrel,
1998). Moberg et al. (2002) argue that accuracy, timeliness, and proper formatting of the
information determine the quality of the information. They suggest that supply chain
members emphasize the importance of having accurate, timely, and properly formatted
information to fully realize the value of information exchange among them. Hence,
managers may not even use information coming from their partners if the information has
poor quality.
Information quality is defined as the extent to which information exchange is
accurate, timely, complete, relevant, and credible (Li and Lin, 2006; Li et al. 2005;
Monczka et al., 1998; Li et al., 2006; Mohr and Spekman, 1994). Inaccurate and missing
data will add costs to the supply chain and can drive poor performance. Chopra and
Meindl (2001) argue that information must be accurate, accessible in a timely manner,
and valuable when making supply chain decisions. Inaccurate and missing data will make
it very difficult for managers to make good decisions as it will not provide the manager
with a true picture of the situation of the supply chain. For example, Wal-Mart collects
data in real time on what products are being purchased at each store of its stores and
send these data back to the manufacturers to determine how much inventory to hold at
each store and to decide when to ship new loads of products from the manufacturer.
Chopra and Meindl (2001) provide many examples of how inaccurate and missing data

40
results in an increase in materials inventory and adds costs to the supply chain.
Furthermore, Vijayasarathy and Robey (1997) argue that the more accurate, timely and
complete information is, the fewer misunderstandings and misinterpretations between
trading partners occur and the better the coordination between them is.
2.4 Information Technology Utilization
Porter and Millar (1985) argue that every value activity in the value chain requires
usage of information in some way that differs from other activities. For example, a
logistic activity utilizes IT for scheduling promises, transportation rates, and production
plans to ensure timely and cost effective delivery. On the other hand, a company could
use IT to enhance its ability to exploit internal activities as well as external activities i.e.
coordinate their activities closely with suppliers and customers. Ward (1987) suggests
that IS should be utilized to influence company growth, offset competitive threats, and
enable business strategies to be implemented and sustained. Earl (1989) classifies IT
usage in the supply chain as follows: (1) technology that can improve the physical task of
any activity e.g., computer controlled machine tools in assembly operations, (2)
technology that can physically connect or control activity linkages e.g., communications
linkages between production and distribution centers, (3) information systems that can
support or manage the value activities e.g., inventory control systems, and (4)
information systems that can coordinate activities across linkages e.g., CAD-CAM
systems for computer integrated manufacturing. This implies that IT can be utilized in
different ways and for different purposes. Benjamin et al. (1984) developed a strategic
opportunities framework to utilize IT. The framework suggests that companies can
effectively utilize IT to gain competitive advantage by either focusing on an internal set
41
of manufacturing processes to improve operations, or by creating strategic external links
with suppliers and customers. In another study, Kyobe (2004) argues that IT resources
such as hardware and software can be strategically utilized to achieve competitive
advantage. Companies might focus on utilizing IT for internal operations or for external
relationships i.e., improving customer services and links with suppliers by sharing useful
information and obtaining reductions in cost. Narasimhan and Kim (2001) propose
measuring IT utilization using the following three sub-constructs: (1) IS for value
creation management (e.g., customer management systems, sales management systems,
and inventory management systems), (2) IS for logistic operations (e.g., automatic
ordering systems, resource management systems, transportation management systems,
and forecasting systems), and (3) IS for infrastructural support (e.g., network plan/design
systems, office information systems, and accounting information systems). McFarlan and
McKenney (1983) developed a framework of information management with a „strategic
grid‟ and suggested some forms of planning, organizing, and controlling information
resources in each quadrant of the strategic grid. Hence, the strategic grid helps
management to position a firm appropriately based on the strategic impact of IT. The IT
strategic grid consists of four quadrants. In the first quadrant, IT can be seen as a support
to activity planning in which IS can represent islands of specialist technology that are
introduced to help innovate the manufacturing processes. In the second quadrant, IT can
be seen as a factory in which IT can help in planning and controlling daily production.
Quality and other operational controls are important in running the business. In the third
quadrant, IT is considered as a turnaround mechanism. Here senior executives consider
IT to be critical to the organization‟s growth i.e., a top IT executive is appointed to

42
oversee this. Finally in the forth quadrant, IT can be seen as truly strategic. In this case,
the company will not function without IT i.e., new product development is computer
based. From the previous discussion above, it is clear that the literature describes IT
utilization from a variety of different perspectives. A firm may utilize information
technology to assist in externally-focused strategic planning, to support its internal
operations, and/or to build its information processing infrastructure (Narasimhan and
Kim, 2001; Kim and Narasimhan, 2002; Benjamin et al., 1984; Kyobe, 2004; Boynton et
al., 1994). This study identifies different aspects of IT utilization relevant to
organizations: (1) strategic IT utilization which will be referred to in this study as the
external focus of IT i.e., suppliers and customers, (2) operational IT utilization which will
be referred to as the internal focus of IT i.e., daily production, and (3) infrastructural IT
utilization i.e., the use of networks, servers, databases, platforms and other elements of IT
that comprise organizational IT infrastructure. Table 2.7 shows the information
technology utilization construct and its sub constructs‟ definitions and literature support.
Table 2.7 Information technology utilization construct definition and its sub-
constructs’ definitions and literature support
Construct Definition Literature
Information Technology Utilization
The method a firm uses to utilize information technology to assist in external strategic decision planning and to support internal operational and infrastructural decisions.
Narasimhan and Kim, 2001; Kim and Narasimhan, 2002; Benjamin et al., 1984; Kyobe, 2004; Boynton et al., 1994.
External Focus on IT
The extent to which firms uses IT for formulating and improving inter-organizational planning
Wiseman, 1988; Benjamin et al., 1984; Cash Jr.

43
2.4.1 External Focus on IT
The external focus on IT in this study is defined as the extent to which firms
deploy IT applications for formulating and improving inter-organizational planning
processes with respect to suppliers and customers (Wiseman, 1988; Benjamin et al.,
1984; Cash Jr. and Konsynski, 1985). Earl (1989) suggests that one of the purposes of
using IT strategically is to share responsibilities with suppliers; this may be achieved by
setting up automatic orders with suppliers. Moreover, this could result in having long-
term relationships with suppliers and selecting suppliers with the lowest cost or best
services. An example of a strategic IT utilization is given in Earl (1989, p. 56) when
“Ford had set up CAD links with their suppliers and reduced design costs, reduced the
time taken in, and error rate of design and specification changes and improve parts stock
and acquisition procedures. No doubt like the Japanese automakers, such links
eventually will be developed with only one or two key suppliers of each product to
integrate suppliers into their computer integrated manufacturing so that both the
automakers and the supplier share growth and performance improvements together.”
processes with respect to suppliers and customers.
and Konsynski, 1985.
Internal Focus on IT
The extent to which firms uses IT for monitoring and improving internal processes.
Benjamin et al., 1984; Boynton et al., 1994.
Infrastructural Focus on IT
The extent to which firms use IT to facilitate information sharing and data communication.
Narasimhan and Kim, 2001; Kim and Narasimhan, 2002; Weill, 1993; McKay and Brockway, 1989.
44
This example clearly shows that IT is creating strategic links between organizations and
their key suppliers. As a result, companies can coordinate their actions closely with their
suppliers.
In another study, Parsons (1983) argues that utilizing IT strategically may change
the relationship between an industry and its suppliers. For example, the use of
sophisticated quality control systems is forcing suppliers to become more quality
conscious. Thus, utilizing IT strategically will also help in selecting and considering
certain suppliers for a partnership. Additionally, Parsons argues that IT can also
contribute to superior customer service by providing historical customer profiles,
increasing the availability of spare parts, and by improving the responsiveness to
customer needs.
Benjamin et al. (1984) provide five case studies as examples of how companies
can strategically utilize IT to gain competitive advantage. Their examples focus
externally on IT utilization in regards to the company‟s suppliers and customers. For
instance, IT is utilized strategically “to have close interconnection between production
facilities and key suppliers; to simplify ordering processes for customers; to improve
customer’s satisfaction through faster, high quality response time and improved
productivity; and to facilitate the way they support their customers” (Benjamin et al.,
1984 p. 4, 5, and 6). This clearly shows that companies are strategically utilizing IS to
improve customer satisfaction through faster, high quality response time, reduced
customer complaints, and increased customer loyalty by improving customer service.

45
2.4.2 Internal Focus on IT
The internal focus on IT refers to the extent to which firms deploy IT applications
for monitoring and improving their internal processes (Benjamin et al., 1984; Boynton et
al., 1994). Digital Equipment Corporation provided a good example of how to utilize IS
to improve an internal set of manufacturing processes when it used an “expert system” to
help improve key internal operations (Benjamin et al., 1984). Weerakkody and Hinton
(1999) provide a case study to demonstrate the role of IT in enabling business process
reengineering (BPR) programs. Hence, BPR plays an important part in providing quality
product.
One way to improve internal processes is through postponement, which involves
fundamental changes to a company‟s manufacturing processes and internal operations.
Using IT is essential to support the implementation of postponement (Prats, 2003). The
rational of postponement strategy is to delay some of the activities of production after the
information about customers‟ demand is known (Yang and Burns, 2003). In this sense,
companies may have to wait until exact information of customers‟ demand is available.
Here IT plays an important role in postponement by enabling the sharing of customers‟
demand information in a timely manner without distortion. For example, electronic data
interchange (EDI) and a point-of-sale system may improve the information flow between
manufacturer and suppliers by reducing the data collection errors and moving data
quickly. This will transmit customers‟ demands and, therefore, enhance the value of
postponement (Yang et al., 2004).
Another way to improve internal processes is through sharing information among
all parts of the organization. For instance, successfully implementing an Enterprise

46
Resource Planning (ERP) system may help companies gain competitive advantage by
integrating business processes and optimizing the resources available. As organizations
share and integrate information through ERP systems, they will have more control over
their operations by connecting and integrating all business processes so that workers (1)
use less time to perform tasks and (2) have faster access to the information which
improves the time and information for decision making (Zeng et al., 2003). In addition,
ERP has also been credited with reducing manufacturing lead times (Goodpasture, 1995).
Suzaki (1987) identifies several approaches to internal process improvement i.e.
developing quick setup, eliminating waste, and using lots sizes of one. According to
Suzaki, the key that helps in implementing approaches to improve internal processes is
having information and control systems that provide information on time, so firms can
use it to facilitate further improvement in operations.
2.4.3 Infrastructural focus on IT
The infrastructural focus on IT refers to the extent to which firms use IT to
facilitate organization-wide information sharing and data communication across data
networks (Narasimhan and Kim., 2001; Kim and Narasimhan., 2002; Simchi-Levi et al
2003; Weill, 1993; McKay and Brockway, 1989). The IT infrastructure generally
provides the foundation to enable present and future communication. This infrastructure
usually includes: (1) platforms technology, (2) network and telecommunication
technologies, (3) key data, and (4) core data-processing applications (Duncan, 1995). In
another study, Simchi-Levi et al. (2003) suggest that IT infrastructure forms the basis for
data collection, transactions, system access, and communication. They believe that IT

47
infrastructure typically consists of four components: (1) interface/presentation devices,
(2) communications, (3) databases, and (4) system architecture.
Narasimhan and Kim (2001) hypothesize that IT utilization for infrastructure
support has a direct influence on using IT for value creation activities. In other words,
they argue that the IT infrastructure provides the basis (foundation) for establishing
strategic linkages with suppliers and customers. In the context of SCM, Rai et al. (2006)
argue that data consistency (which is defined as the degree to which common data
definitions and consistency in stored data have been established across a focal firm’s
supply chain), and cross-functional application integration (which is defined as the degree
of real-time communication of a focal firm’s function-specific SCM applications with
each other) are critical elements of IT infrastructure integration for SCM. The result of
their study suggests that data quality and standards are facilitators in the process of
supply chain integration.
Simchi-Levi et al. (2003) suggest that without communication and database
capabilities, which they refer to as “IT infrastructure”, critical organizational goals may
not be achieved. Hence, the IT infrastructure is a critical factor in the success or failure of
any system implementation. Furthermore, Weill (1993) suggests that IT infrastructure
provides flexibility so that firms can handle different customers‟ needs without increasing
cost.
2.5 Supply Chain Management (SCM) Performance
Different researchers have attempted to measure SCM performance in different
ways. To assist firms in measuring the effectiveness of their supply chains, the Supply-

48
Chain Council (SCC) developed the Supply-Chain Operations References (SCOR)
model. The SCOR model provides a common process-oriented language for
communicating among supply-chain partners in the following decision areas: planning,
sourcing, making, and delivering (Lockamy and McCormack 2004)
In spite of the importance of measuring SCM performance, organizations often
lack the insight for the development of effective performance measures and metrics for
SCM performance (Gunasekaran et al., 2001). Furthermore, Holmberg (2000) noted a
number of problems in measuring SCM performance. He argues that measuring the
activities of SCM performance is fragmented within and across organizations. He briefly
summarizes the measurement problems as follows: (1) lack of connection between
strategy and measurement, (2) too much reliance on financial figures as the key
performance indicators, (3) too many isolated and incompatible measures, and finally (4)
use of a single-firm management style when measuring the supply chain.
In another study, Beamon (1999) presents a number of characteristics that are
found to be valuable in measuring SCM performance: inclusiveness (measuring all
related aspects), universality (allowing for comparison under various operating
conditions), measurability (having data which are measurable), and finally consistency
(performance measures consistent with the organizations‟ goals). Based on the above
guideline, Beamon (1999) argues that measuring SCM performance should include three
types of performance measurement: (1) resources measurement (generally efficient), (2)
output measurement (generally customer satisfaction), and finally (3) flexibility (how
well the system reacts to uncertainty). Each type is vital in measuring the SCM
performance.
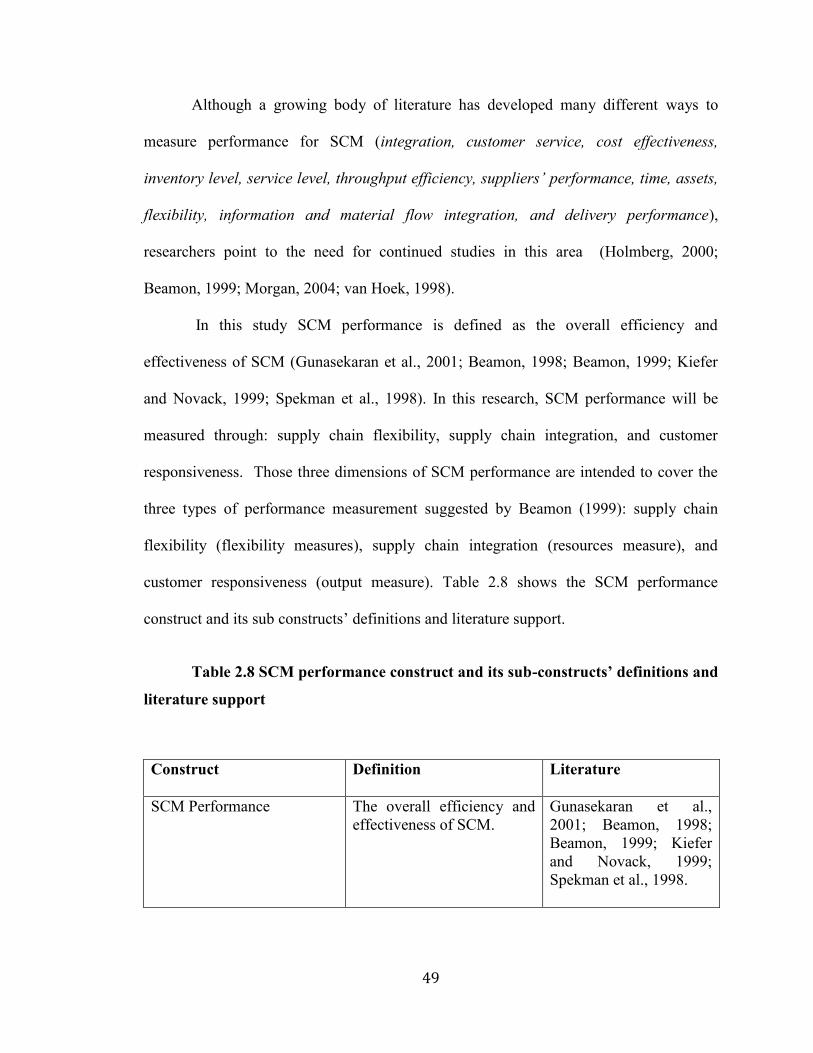
49
Although a growing body of literature has developed many different ways to
measure performance for SCM (integration, customer service, cost effectiveness,
inventory level, service level, throughput efficiency, suppliers’ performance, time, assets,
flexibility, information and material flow integration, and delivery performance),
researchers point to the need for continued studies in this area (Holmberg, 2000;
Beamon, 1999; Morgan, 2004; van Hoek, 1998).
In this study SCM performance is defined as the overall efficiency and
effectiveness of SCM (Gunasekaran et al., 2001; Beamon, 1998; Beamon, 1999; Kiefer
and Novack, 1999; Spekman et al., 1998). In this research, SCM performance will be
measured through: supply chain flexibility, supply chain integration, and customer
responsiveness. Those three dimensions of SCM performance are intended to cover the
three types of performance measurement suggested by Beamon (1999): supply chain
flexibility (flexibility measures), supply chain integration (resources measure), and
customer responsiveness (output measure). Table 2.8 shows the SCM performance
construct and its sub constructs‟ definitions and literature support.
Table 2.8 SCM performance construct and its sub-constructs’ definitions and
literature support
Construct Definition Literature
SCM Performance
The overall efficiency and effectiveness of SCM.
Gunasekaran et al., 2001; Beamon, 1998; Beamon, 1999; Kiefer and Novack, 1999; Spekman et al., 1998.

50
2.5.1 Supply Chain flexibility
The need for flexibility originates from customers; since customers ask for
variety, quality, competitive prices, and faster delivery. This has forced companies to
make design changes quickly and respond faster to customer needs in order to sustain the
company‟s competitive advantage. As a result, companies need to be flexible enough to
react to changes in customers‟ demands (Aggarwal, 1997).
Most of the previous literature has focused on manufacturing flexibility (Kumar et
al., 2006; Duclos et al., 2003). However, as the basis of competition expands to the
supply chain, supply chain flexibility is becoming increasingly important (Duclos et al.,
2003). Thus, there is a need for new supply chain flexibility framework and a
comprehensive analysis of supply chain flexibility.
In this study, supply chain flexibility is defined as the ability of supply chain
partners to effectively adapt or respond to changes that directly impact an organization‟s
customer (Vickery et al., 1999; Kumar et al., 2006). Furthermore, Vickery et al. (1999,
Supply Chain Flexibility
The ability of supply chain partners to effectively adapt or respond to change that directly impacts an organization‟s customer.
Vickery et al., 1999; Kumar et al., 2006.
Supply Chain Integration
The extent to which all the activities within an organization, suppliers, and customers are integrated together.
Stevens, 1990; Stock et al., 1998; Stock et al., 2000; Narasimhan and Jayaram, 1998.
Customer Responsiveness
A firm‟s ability to respond in a timely manner to customers‟ needs and wants.
Tunc and Gupta, 1993; Chen et al., 2004.

51
p.16) state that supply chain flexibility “should be examined from an integrative,
customer-oriented perspective.” They propose five dimensions to measure supply chain
flexibility. Since the definition of supply chain flexibility in this study has a customer-
oriented perspective, this research will adopt the five dimensions that measure supply
chain flexibility proposed by Vickery et al., (1999).
Vickery et al. (1999) propose that supply chain flexibility can be measured by the
following five dimensions: (1) product flexibility or the ability to customize product to
meet specific customer demand, (2) volume flexibility or the ability to adjust capacity to
meet changes in customer quantities, (3) new product flexibility or the ability to launch
new revised products; (4) distribution flexibility or the ability to provide widespread
access to products, (5) responsiveness flexibility or the ability to respond to target
markets‟ needs.
2.5.2 Supply Chain Integration
Stock et al. (1998) suggest that there are two kinds of logistics integration: (1)
internal integration which reflects the extent to which logistics activities interact with
other functions‟ areas, and (2) external integration, which is known as “supply chain
integration,” that reflects the integration of logistics activities across firm boundaries to
include suppliers and customers. This integration deals with sharing resources, risk, and
knowledge between supply chain partners (Kim et al., 2006). Furthermore, Frohlich and
Westbrook (2001) classified supply chain integration into two types. The first type of
integration involves coordinating and integrating the forward physical flow of deliveries
between suppliers, manufacturers, and customers. The second type of integration
52
involves the backward coordination of information technologies and the flow of data
from customers, to manufacturers, to suppliers.
In this study, supply chain integration is defined as the extent to which all the
activities within an organization, suppliers, and customers are integrated together
(Stevens, 1990; Stock et al., 1998; Stock et al., 2000; Narasimhan and Jayaram, 1998).
Supply chain integration requires effective communication among all members of the
supply chain, which means that information systems must be integrated too (Turner,
1993). Moreover, Lee (2000) suggests that there are three key dimensions that constitute
supply chain integration and they are: (1) information integration which refers to the
sharing of information and knowledge among members of the supply chain i.e. demand
information, inventory status, and capacity plans, (2) coordination which refers to the
redeployment of decision-making authority, work, and resources to the best-position in
the supply chain i.e. letting other suppliers replenish their inventory, and finally (3)
organizational linkage which means tight organizational relationships with suppliers i.e.
joint performance measures.
Supply chain integration can provide a firm with the opportunity to focus on its
core competencies and particular areas of expertise (Simchi-Levi et al., 2003). It will also
lead to the amplification of key resources be enabling the sharing of special resources and
technological knowledge between the firm and its supply chain partners (Vickery et al.,
2003). Such integration will not only help supply chains to reduce costs and be more
efficient, but it will also create value for the company, its supply chain partners, and its
shareholders (Lee, 2000).

53
2.5.3 Customer Responsiveness
Williamson (1991) examined the role of the supplier‟s strategy in achieving
customer responsiveness. Furthermore, Owens and Richmond (1995) suggest that
achieving customer responsiveness not only involves a supplier strategy, but also
includes the entire SCMS. They argue that the overall objectives of SCMS should be: (1)
to become increasingly responsive to customer needs, and (2) to create value for the
customer. As a result, the performance of SCM must be measured by its responsiveness
to customers (Lee and Billington, 1992).
In this study, customer responsiveness is defined as a firm‟s ability to respond in a
timely manner to customers‟ needs and wants (Tunc and Gupta, 1993; Chen et al., 2004).
According to Beamon (1998) and Lee and Billington (1992), measuring customer
responsiveness should include the following: lead time, stockout probability, order fill
rate, total cycle time, average backorder levels, total respond time to an order, order
lateness or earliness, and backlog profile.
Customer responsiveness is directly linked to information, in which appropriate
use of information is essential to achieve customer responsiveness. To support this
argument, Daugherty et al. (1995) conducted an empirical study to explore the
relationship between information availability and customer responsiveness. The result of
their study suggest that information availability and customer responsiveness are
positively related which resulted in improving firm performance.

54
2.6 Firm Performance
The literature does not agree on a basic terminology and definition of firm
performance (Venkatraman and Ramanujam, 1986). For instance, some researchers
prefer to measure firm performance based on accounting data (financial indicators) such
as ROI or return on assets (ROA) (Tan et al., 1999). Others argue that market or value
measurement such as product quality and new product development are more appropriate
than accounting-based measurements (Hax and Majluf, 1984). As a result, Yamin et al.
(1999) developed a broader framework of firm performance that includes non-financial
indicators in addition to financial performances.
In this study, firm performance refers to how well a firm achieves its market-
oriented goals as well as its financial goals (Yamin et al., 1999). With regards to the
financial goals, Yamin et al., (1999) posit 18 performance measurements (they are the
accounting-based measurements such as ROI, percentage in market share, rapid turnover
of inventories, ROA, etc…). As previously mentioned, this definition is believed to have
a comprehensive framework of firm performance and has been adopted in previous
studies (Li et al., 2006) to measure the impact of SCM practices on firm performance. Li
et al., (2006) measured firm performance through its market share, ROI, the growth of
market share, the growth of sales, growth in return on investment, profit margin on sales,
and overall competitive position. Table 2.9 shows a firm performance construct definition
and literature support.

55
Table 2.9 Firm performance construct and literature support
Construct Definition Literature
Firm Performance
How well a firm achieves its market-oriented goals as well its financial goals.
Yamin et al., 1999; Li et al., 2006.

56
Chapter 3
Theoretical Framework and Hypothesis Development
This chapter presents the theoretical foundation for this research, the research
model, and the research hypothesis.
3.1Contingency Theory
The essence of the contingency theory implies that fitting the characteristics of the
organization (i.e., technology, organization size, and strategy) to contingencies that
reflect the situation of the organization leads to high organization performance
(Donaldson, 2001). Lawrence and Lorsch (1967) proposed a contingency theory of
organization in which they argued that an organization must establish a “fit‟ between its
internal structure and its external environment. Burns and Stalker (1961) argued that
different kinds of management systems are appropriate to different kinds of technical
environments. For instance, the flexible and decentralized structure (organic structure) is
more suitable to a dynamic environment, while a centralized structure (mechanistic
structure) is more appropriate under a stable environment.
Chandler (1962) argues that structures follow strategy in organizations. The
strategy is the determination of long-term goals and objectives, courses of action and
allocation of resources. The structure is the way the organization is put together to
administer the strategy, with all the hierarchies and lines of authority that the strategy

57
implies. As different strategies create different administration needs, organizational
structure will eventually change to accommodate these needs. Mintzberg (1981) argues
that the key to organizational success is matching or fitting the parts and characteristics of
organizational structures to one another.
Galbraith (1973) discussed the contingency theory from the perspective of the
information processing in organizations by developing an information processing model
to explain the relationship between the information processing needs of a firm and the
structural mechanisms that can address those needs. He argues that the ability of an
organization to successfully coordinate its activities depends on how effectively and
efficiently it can process the amount of information needed to be processed. This is done
by either reducing the need for information processing, or by increasing the capacity to
process the information. In other words, an information processing mechanism or
capability should match the firm‟s information processing needs. Applying this concept
to SCM, our theoretical basis for alignment between supply chain and IS strategies lies in
effectively matching the contingencies of supply chain information requirements with
appropriate IT applications that can address these requirements. To give an example, let
us assume that a company wants to implement internal lean practices in the supply chain.
Such a strategy would require certain applications to process information that would
facilitate implementing those lean practices.
The contingency theory looks for a relationship between fit (alignment) and
performance. At an abstract level, the contingency approach states that the effect of one
variable (X) on another variable (Y) depends upon a third variable (W) (Donaldson,
2001). While applying this approach to this research, let us assume that variable (X) is

58
SCMS, variable (Y) is SCM performance, and variable (W) is ISS. In this case, this study
intends to find the effect of SCMS (variable X) on SCM performance (variable Y)
depending upon ISS (variable W). In other words, this research intends to find the impact
of aligning SCMS with ISS on SCM performance. This is what this study refers to as
“alignment at the strategic or planning level”.
Applying the same approach to SCM practices and the usage of IT, this study
intends to find the impact of aligning SCM practices with the usage of IT on SCM
performance. This is what this study refers to as “alignment at the operational level”.
Finally, this study intends to find the effect of SCM performance on firm performance.
3.2 Alignment as Moderator
Venkatraman (1989b) identifies six types of fit, and they are as follows: (1) fit as
moderation, (2) fit as mediation, (3) fit as matching, (4) fit as gestalts, (5) fit as profile
deviation, (6) and fit as covariation. Each type of fit has its own theoretical meaning and
requires a use of specific analytical methods. In this research, the fit as moderation will
be used to study the alignment at the strategic level and at the operational level.
The fit as moderation suggests that an interaction exist between two variables to
determine a third variable which is usually the performance. Looking at the diagram
below (Figure 3.2), let‟s assume that variable X is the strategy and variable Z is the
contextual variable that fits with strategy to achieve a better performance (variable Y).
The moderating effect of variable Z (contextual) on the variables X (strategy) and Y
(performance) as shown in Figure 3.1 is equivalent to the interaction effect (X.Z) as
shown in Figure 3.2.

59
Y (Performance)
Figure 3.1 Schematic representation of the moderating effect
In this research, at the strategic level, SCM performance is jointly determined by
the interaction of the predictor variable which is in this case is SCMS and the moderator
variable which is ISS. At the operational level, SCM performance is jointly determined
by the interaction of the predictor variable (SCM practices) and the moderator variable
(IT utilization).
Figure 3.2 Schematic representation of fit as moderation (source:
Venkatraman, 1989b)
The reason for using the moderator alignment approach is as follows: Many
organizations focus on their supply chain strategy to gain a competitive advantage
through their products/services. At the same time, they believe that acquiring and using
X (Strategy)
Z (Context)
X.Z
(Interaction)
Z (Contextual)
X (Strategy) Y (Performance)

60
appropriate information technologies are critical in managing the supply chain. Coronado
et al. (2007) suggest that IS facilitates better management of supply chain activities by
offering information about what kind of product the customers are demanding, what is
available in the warehouse, and how much should be manufactured. These technologies
enable organizations to effectively and efficiently coordinate and collaborate among
partners in the supply chain. As a result, while supply chain strategies are expected to
lead to improved supply chain performance, using the appropriate IT strategy in addition
will positively impact or increase this improvement. Zara (a Spanish clothier) is a good
example of a company that demonstrates the moderating alignment between IS Strategy
and SCM Strategy. Zara is well known for its responsive supply chain, it can design,
produce, and deliver a new garment and make it available in stores worldwide in just 15
days. However, Zara was only able to achieve the success in its supply chain by
developing highly responsive systems and deploying the latest IT tools to facilitate the
exchange of information between members of its supply chain (Ferdows et al. 2004). In a
similar manner, with regard to SCM practices, Chopra and Meindl (2001) argue that
utilizing IT systems in support of appropriate practices is critical to execute the plans and
strategies of the supply chain. That is, the positive effect of supply chain practices such as
supplier partnership, customer relationship, postponement, and information sharing on
supply chain performance is expected to be enhanced by the simultaneous use of IT
applications to support these practices. For example, one of Cisco‟s supply chain
practices involves sharing orders electronically with its suppliers and customers. The
expected positive effect of this practice on Cisco‟s supply chain is enhanced by the use of
IT applications such as internet access, extranets, and B2B systems that link Cisco to its

61
customers and suppliers, and integrate suppliers into its production systems, (Zhou and
Benton, 2007). Cisco‟s interaction with its customers and suppliers is network-based and
begins at Cisco‟s home page (Cisco.com). By using its home page, Cisco‟s customers can
directly place an order online at lower costs and get technical support around-the-clock.
Furthermore, Cisco automates its supply chain by using an integrated enterprise platform
to electronically link with all its suppliers. This allows Cisco to exchange information
freely with its partners which enables Cisco and it suppliers to respond quickly to
customers demand (Nolan, 2005).
3.3 Proposed Research Model
Supply chain-information systems‟ alignment is important and leads to better
SCM performance. To better understand this relationship, a proposed research model was
developed based on a comprehensive literature review. The theoretical model presented
in Figure 3.3 depicts the relationship among SCMS, ISS, SCM practices, IT utilization,
SCM performance, and firm performance. In this framework, SCMS consists of lean
supply chains, agile supply chains, and hybrid supply chains. ISS includes IS for
efficiency, IS for flexibility, and IS for comprehensiveness. SCM practices consist of
strategic supplier partnerships, customer relationships, internal lean practices,
postponement, information sharing, and information quality. IT utilization consists of an
external focus of IT, an internal focus of IT, and infrastructural IT. SCM performance
includes supply chain flexibility, supply chain integration, and customer responsiveness.
Finally, firm performance consists of market performance and financial performance. The
definitions are given in Tables 2.1, 2.3, 2.4, 2.7, 2.8, and 2.9.

62
The rationale underlying this research framework proposes that there are two
levels of moderating alignment. It is explained as follows: First, at the strategic level,
aligning SCMS with ISS as a moderator will lead to better SCM performance. In
particular, a lean supply chain is a better fit with IS for efficiency, whereas an agile
supply chain is a better fit with IS for flexibility, and finally a hybrid supply chain is a
better fit with IS for comprehensiveness. Second, at the operational level, aligning SCM
practices with IT utilization as a moderator will lead to better SCM performance. In
particular, strategic supplier partnerships and customer relationships are better aligned
with an external focus of IT, whereas internal lean practices and postponement are better
aligned with an internal focus of IT, and finally information sharing and information
quality are better aligned with infrastructural IT. As a result of those moderating
alignments, having better SCM performance will enhance firm performance.

63
Figure 3.3 SCM and IS research framework
64
3.4 Research Hypothesis 1a, 1b, and 1c (Moderating Alignment between SCMS and
ISS)
The literature has discussed many aspects of IS-business alignment. One type of
alignment is known as strategic alignment. The alignment at the planning or strategic
level ensures that IT plans and business plans are synchronized and that the organization
plans to adopt applications which support its strategic goals (Chan et al., 1997; Sabherwal
and Chan, 2001). Another type of alignment is structural alignment. The structural
alignment is between business structures and IS structures (Brown and Magill, 1994).
Alignment at the operational or tactical level is required for ensuring that planned
applications are successfully implemented, maintained, and used (Tarafdar and Qrunfleh,
2009).
These studies show that different kinds of IS business alignment positively affect
many aspects of firm performance, such as IS performance and competitive advantage
(Chan et al., 1997; Sabherwal and Kris, 1994; Kearns and Lederer, 2003; Sabherwal and
Chan, 2001). However, there are no studies that consider SC-IS alignment and its impact
on SCM performance.
Nickles et al. (1998) argue that supply chain managers need to redesign their
supply chain strategies based on IT investments. They argue that investing in applications
should fully support the strategic goals of a supply chain. The result of their study
suggests that SCMS and ISS should be developed together so companies can create a
competitive advantage. This is what (Gunasekaran and Ngai, 2004) refer to in their study
as “the strategic planning of IS in SCM” which plays an important role in achieving the

65
goals of the organization. They argue that companies are now focusing on the strategic
planning of IS in SCM with the objective of developing long term plans to improve their
performances. How can this be done? To give an example, the strategic planning of IS
should support the long-term objectives and goals of SCM in terms of flexibility and
responsiveness by sharing the right information with suppliers. In other words,
organizations should select and implement applications that support developing an
effective supply chain. Nevertheless, selecting the right application for specific supply
chain requirements is challenging. Richmond et al. (1998) addressed this issue by
identifying a number of factors for selecting supply chain applications. One of those
factors is aligning the technology with supply chains. They argue that a firm should
choose an application that supports the way it interacts and communicates with its
suppliers and customers.
Further, Puckridge and Woolsey (2003) emphasize the need to integrate ISS with
the supply chain by aligning the ISS with the organization‟s strategy to achieve
synchronization across the extended supply chain. For instance, if a firm‟s objective is
aimed at being responsive and flexible to customer needs, then ISS should support this
goal by investing in applications that enhance flexibility; this ISS must be extended
across the supply chain. “Requiring supply chains to become agile (the ability to respond
rapidly to unpredictable changes in the market) also requires the same agility in the
organization’s IT capability. Success will be defined by those organizations that are able
to meet the future requirements across their supply chain.” (Puckridge and Woolsey,
2003, p. 412). Additionally, Christopher (2000) suggests that in order to improve the
responsiveness of the supply chain, agility in the supply chain is needed which requires
66
agile IS so that firms can share information among supply chain partners. For instance,
when AT&T (electronic consumer products) decided to improve the agility of its supply
chain by employing an ISS to implement electronic transactions to share information
among suppliers, the implementation resulted in a better SCM performance measured by
its responsiveness to customers (Gunasekaran at el., 2008). AT&T‟s action was based on
the argument that “selecting the right technology/application for the right supply chain
strategy will enhance the performance of its supply chain”.
The above arguments show the need to have an ISS that supports and enhances
SCMS to have better SCM performance. In other words, the moderation (interaction)
between SCMS and the ISS will result in better SCM performance. So for instance, if the
firm‟s goal is to cut cost, then a lean supply chain (which emphasize being efficient) is
preferred. The lean supply chain should be aligned with an ISS that emphasizes and
supports being efficient (IS for efficiency). On the other hand, an agile supply chain is
best aligned with IS for flexibility; and finally, a hybrid supply chain is best aligned with
IS for comprehensiveness. Aligning SCMS with ISS will result in better SCM
performance. Therefore, it is hypothesized that:
H1a: The impact of a lean supply chain on supply chain management performance (as
measured by supply chain integration) is positively moderated by IS for efficiency.
H1b: The impact of an agile supply chain on supply chain management performance (as
measured by supply chain flexibility) is positively moderated by IS for flexibility.

67
H1c: The impact of a hybrid supply chain on supply chain management performance (as
measured by customer responsiveness) is positively moderated by IS for
comprehensiveness.
3.5 Research Hypothesis 2a, 2b, and 2c (Moderating Alignment between SCM
Practices and IT Utilization)
Using IT systems to capture and analyze information has a significant impact on
SCM performance (Chopra and Meindl, 2001). Similarly, using IT has an impressive
impact on supply chain practices. Both effective information sharing (which is facilitated
by IT) and effective supply chain practices are critical elements in achieving good SCM
performance (Zhou and Benton, 2007). Although the study of Zhou and Benton (2007)
discusses the role of IT on SCM practices and its impact on SCM performance, it fails to
discuss the role of alignment between SCM practices and the usage of IT in achieving
better SCM performance. This research argues that external IT usage moderates the
relationship between a strategic supplier partnership and customer-relationship aspects of
SCM practices and SCM performance. On the other hand, internal IT usage moderates
the relationship between internal lean practices and the postponement aspects of SCM
practices and SCM performance. Finally, infrastructural IT moderates the relationship
between information sharing and information quality of SCM practices and SCM
performance; these three types of IT usage, when matched with the corresponding SCM
practices, lead to better SCM performance.

68
3.5.1 Research Hypothesis 2a (Moderating Alignment of External Focus of IT with a
Strategic Supplier Partnership and Customer Relationship on Supply Chain
Management Performance)
The external focus of IT uses inter-organizational systems to maintain and acquire
new relationships (partnership) with suppliers and to get closer to customers for better
anticipating their needs (Philip and Booth, 2001). Mason-Jones and Towill (1997) argue
that the key to building these partnerships lies in the way firms utilize their IT. They note
that it is not enough to implement IT to build a relationship with suppliers, but the way
firms manage and utilize IT is what counts. They give the example of how Wal-Mart
utilizes its point-of-sale and inter-organizational IT to build a long term relationship with
one of its main suppliers (Proctor & Gamble) by sharing information about its customers
with Proctor & Gamble; this information helps Proctor & Gamble decide how much
stock is needed to be delivered to Wal-Mart stores, and how frequently, to meet customer
demand. As a result, the supply chain improves its overall speed of response to
customers.
To put this in another perspective, Fawcett et al. (2007) developed a strategic
management initiative framework or what they refer to as “a contingency perspective of
information sharing capability as a strategic enabler” to understand how IT is used to
enhance supply chain performance. They suggest that having a strategic relationship with
partners requires IT to support achieving relationship goals which enable faster decision
making in the supply chain. Specifically, they mentioned the importance of “matching the
technology to specific value-added capability need” in which IT enhances strategic,

69
managerial decision making to gain flexible customer responses. Therefore, it is
hypothesized that:
H2a: The impact of strategic supplier partnerships and customer relationships on SCM
performance is positively moderated by an external focus of IT.
3.5.2 Research Hypothesis 2b (Moderating Alignment of Internal Focus of IT with
Internal Lean Practices and Postponement on Supply Chain Management
Performance)
According to Philip and Booth (2001), an internal focus of IT deals with day-to-
day operations. The internal focus of IT leads to better operational efficiencies and cost
reductions in processes internal to the firm by improving everyday tasks through IT.
Additionally, they suggest that in manufacturing environments, the internal focus of IT
involves standard applications that are used in automation of repetitive tasks. Those
standard applications reduce the time and effort in a particular business process. Some of
the business processes are related to inter-organizational relationships, which include
quality control processes, operating processes, just-in-time deliveries, and customized
make-to-order processes (Subramani and Venkatraman, 2003). To perform these kinds of
inter-organizational business processes, firms must use IT to facilitate changes to those
processes. The usage of IT should match with the inter-organizational business processes,
so suppliers can achieve operational benefits i.e., lower transaction and production cost
(Sanders, 2008; Clark and Stoddard, 1996). Therefore, it is hypothesized that:
H2b: The impact of internal lean practices and postponement on SCM performance is
positively moderated by an internal focus of IT.

70
3.5.3 Research Hypothesis 2c (Moderating Alignment of Infrastructural Focus of IT
with Information Sharing and Information Quality on Supply Chain Management
Performance)
IT infrastructure is generally described as a set of platforms, networks, and data
processing and storage applications. The presence of an IT infrastructure enables sharing
information within and across organizations and is required for timely and seamless
information links throughout an organization. IT infrastructure thus plays a critical role in
the firm‟s ability to use IT competitively, as a fragile IT infrastructure could hinder basic
information sharing. McKay and Brockway (1989) suggest that an IT infrastructure
enables sharing IT capabilities among business organizations. It could also facilitate the
firm‟s requirements for mass customization by providing seamless information links
throughout an organization.
The ability of an organization to respond rapidly and effectively to changes in
customer demand relies on the IT infrastructure of that organization. This is what some
studies have referred to as “infrastructure flexibility” (Duncan, 1995; McKay and
Brockway, 1989; Weill, 1993; Chung et al., 2005). The key enabler of infrastructure
flexibility is the adoption of a standard open system which uses compatible IT
components to communicate across organizations (Chung et al., 2005) and which allows
firms to be flexible and respond to changes in customer demand by sharing information
across those organizations (Duncan, 1995). Further, improved IT infrastructure makes
information more accessible and more valuable by allowing suppliers immediate access
to information (Shapiro and Varian, 1999). Therefore, in order to have timely and

71
accurate data, firms must make significant investments in their information infrastructure.
Based on the arguments above it is hypothesized that:
H2c: The impact of information sharing and information quality on SCM performance is
positively moderated by an infrastructural focus of IT.
3.6 Research Hypothesis 3a, 3b, and 3c (SCM Practices and SCM Performance)
Numerous studies have shown that well managed and well executed SCM
practices will directly improve firm performance (Shin et al., 2000; Prasad and Tata,
2000; Tan et al., 1998; Tan, 2002). Although most studies have linked SCM practices
directly to firm performance without explicitly considering any intermediate measures
such as SCM performance; this study is considering a direct link between SCM practices
and its impact on SCM performance.
Two of the SCM practices considered in this study are information sharing and
information quality. Regarding those two practices, Zhou and Benton (2007) provided
empirical evidence that sharing information and quality information are critical to SCM
performance, specifically the delivery performance of the supply chain which includes
on-time delivery, perfect order fulfillment rate, and delivery reliability/dependability.
Regarding postponement, van Hoek et al. (1999) suggest that keeping materials
undifferentiated for as long as possible increases the flexibility in the supply chain in
responding to changes in customer demand, as well as improving the cost effectiveness of
supply chains.

72
Finally, Yu et al. (2001) provided a case study to illustrate the benefits of supply
chain partnerships on SCM performance; those benefits are captured through reductions
in inventory levels and cost savings from forming partnerships with one another. Based
on the arguments above it is hypothesized that:
H3a: Strategic supplier partnerships and customer responsiveness are positively
associated with SCM performance.
H3b: Internal lean practices and postponement are positively associated with
SCM performance.
H3c: Information sharing and information quality are positively associated with
SCM performance.
3.7 Research Hypothesis 4 (SCM Performance and Firm Performance)
Cohen and Roussel (2005) believe that an effective business strategy should be
supported by a good supply chain strategy. Using the supply chain as a strategic weapon
could improve firm performance, as many firms believe that SCM is the most popular
operations strategy for improving organizational competitiveness (Gunasekaran et al.,
2008). Companies such as Dell, Amazon, and Wal-Mart are constantly refining their
supply chains so they can stay one step ahead of their competitors. In an interview with
the CEO of Dell, Michael Dell explained that Dell was able to transform the struggling
PC Company to a market leader by managing its supply chain and introducing supply
chain innovations such as direct-to-consumer sales and build-to-order manufacturing that
help reduce inefficiencies and costs by managing inventories and working closely with
73
customers. This example clearly shows how SCM could impact firm performance
(Magretta, 1998; Cohen and Roussel, 2005).
Further, Vonderembse and Tracey (1999) empirically tested the relationship
between supplier performance and manufacturing performance. They argue that
involving suppliers in product design efforts enhances firm performances with regards to
production cost, work-in-process inventory levels, product quality, and on-time delivery
to the final customer. Narasimhan and Kim (2002) emphasize the roles of supply chain
integration on firm performance suggesting that supply chain integration enhances a
firm‟s performance through moderating the relationship between product diversification
(developing different products) and international market diversification. They evaluated
firm performance by using sales growth, market share growth, and profitability.
Further, Shin et al. (2000) provided a good example of how an excellent SCM
impacts a firm‟s performance “when Chrysler launched a supplier- involvement program,
which is called Supplier Cost Reduction Effort (SCORE), and benchmarked the supply
chain management practices of Japanese companies, Chrysler announced that it
achieved more than US$1.2 billion in cost savings through 1997 due to the SCORE
program”. Based on the arguments above it is hypothesized that:
H4. SCM performance is positively associated with firm performance.

74
Chapter 4
Instruments Development--Item Generation and Pilot Test
This chapter discusses the instrument development and pilot testing of the
measures of the research model. The instruments to measure -- (1) supply chain
management practices, (2) supply chain management performance, and (3) firm
performance-- were adopted from previous studies (Li et al., 2006; Li et al., 2005). Since
these instruments have been tested in previous studies and were found to be valid and
reliable, they will not be tested again in the pilot study of this research. However, they
will be revalidated in the large-scale analysis in chapter 5.
The instruments to measure-- (1) supply chain management strategy (SCMS), (2)
Information Systems strategy (ISS), (3) Information Technology (IT) utilization, (4) the
alignment between SCMS and ISS, and (5) the alignment between SCM practices and the
usage of IT-- will be developed or modified if they have been developed in earlier studies
to make them relevant for this study (Sabherwal and Chan, 2001; Venkatraman, 1989a;
Swafford et al., 2006).
The development of the instruments for the three constructs (SCMS, ISS, and IT
utilization) and the alignment between SCM and ISS, and the alignment between SCM
practices and the usage of IT was completed in three phases: (1) item generation, (2) a
pilot study using Q-sort method, and (3) a large scale-data analysis and instrument

75
validation. The item generation was done through an extensive and comprehensive
literature review to identify the content domain of the major constructs in this study. The
initial items and the definition of the constructs were generated from this literature
review. The second stage of the study was scale development and testing through a pilot
study using the Q-sort method. The objective of the Q-sort method is to pre-assess the
convergent and discriminant validity of the scale by asking different practitioners to sort
(place) the items into various construct categories. The goal of the Q-sort is to assess the
reliability of the sorting conducted by the practitioners. This is what the literature refers
to as inter-rater reliability. The study‟s final stage includes all the validity and reliability
tests using the data from the large-scale sample which is described later in chapter 5.
4.1. Item Generation
In order to have valid and reliable empirical research, appropriate steps
(techniques) to generate measurement items of any construct must be considered. First,
the content validity, which means the measurement items contained in an instrument,
should cover the major content domain of a construct (Churchill, 1979). Content validity
is usually achieved through extensive and comprehensive literature review as a list of
initial items for each construct is generated from the literature review. Thus, interviews
and feedback from practitioners and academicians should help in achieving the content
validity. The general literature bases for the items generation for each construct are
briefly discussed below.
The items for SCMS (lean supply chain, agile supply chain, and hybrid supply
chain) were generated based on previous SCM literature. In particular, the lean supply

76
chain was generated based on previous studies of (Huang et al., 2002; Wang et al., 2004;
Vonderembse et al., 2006; Towill and Christopher, 2002; Christopher and Towill, 2000;
Lee, 2002). Agile supply chain was modified and generated from (Swafford et al., 2006;
Huang et al., 2002; Christopher and Towill, 2000; Wang et al., 2004; Vonderembse et al.,
2006; Christopher, 2000; van Hoek et al., 2001; Lin et al., 2006; Agarwal et al., 2007;
Towill and Christopher, 2002; Power et al., 2001; Lee, 2002). Finally, hybrid supply
chain was generated based on previous studies of (Huang et al., 2002; Naylor et al., 1999;
Wang et al., 2004; Vonderembse et al., 2006; Towill and Christopher, 2002; Christopher
and Towill, 2000). In regards to ISS (IS for efficiency, IS for flexibility, and IS for
comprehensiveness), the items for those constructs were modified from the previous
study of (Sabherwal and Chan, 2001; Venkatraman, 1989a) and the consideration of other
studies (Bakos and Treacy, 1986; Clemons et al., 1993; Rockart and Morton, 1984; Porter
and Millar, 1985; Allen and Boynton, 1991). Finally, IT utilization (external Focus of IT,
internal focus of IT, and Infrastructural focus of IT) were generated based on previous
literature. In particular, the external Focus on IT was generated for the studies of
(Wiseman, 1988; Benjamin et al., 1984; Cash Jr. and Konsynski, 1985). An internal focus
of IT was generated from the studies of (Benjamin et al., 1984; Boynton et al., 1994).
Finally, the infrastructural focus of IT was generated from (Narasimhan and Kim, 2001;
Kim and Narasimhan, 2002; Weill, 1993; McKay and Brockway, 1989).
Once item pools were created, they were reviewed by two academicians and six
practitioners. The objective of this step is to check the relevance of each construct‟s
definition and the clarity of the wording of the sample questionnaire items that has been
developed or modified from previous literature. Based on the comments and feedbacks

77
from the academicians and the practitioners, redundant and ambiguous items were either
modified or eliminated, and some new items were added. As a result, a total of 11
constructs and 124 items were created. Below is the precise number of each construct and
the items that belong to that construct. Appendix A presents the items entering the first
Q-sort analysis.
Supply chain management strategy (SCMS)
Lean supply chain……………………………………..7 Agile supply chain……………………………………..12 Hybrid supply chain……………………………………5
Information systems strategy (ISS)
IS for efficiency………………………………………….7 IS for flexibility………………………………………….7 IS for comprehensiveness……………………………….6
Information technology (IT) utilization
External focus of IT………………………………….....13 Internal focus of IT……………………………………...8 Infrastructural focus of IT………………………………9
Alignment between SCMS and ISS……………………………………..24
Alignment between SCM practices and the Usage of IT……………….26
4.2 Scale Development: the Q-Sort Method
4.2.1 Sorting Procedures
First, the judges were presented with the model and all the definitions of the
constructs for this study, followed by a brief explanation of the objective of the study.
The items were printed on a 3” by 5” card, shuffled, and then given to the judges. After

78
explaining the Q-sort procedure and answering any additional question the judges might
have, the judges were asked to place each item (card) under the appropriate construct
where they believed it belonged based on their knowledge, experience, and practice. In
this study, a total of three rounds were conducted. In each round two judges were asked
to sort the items according to the different dimensions. Based on this, an inter-judge
agreement between two judges was calculated. There were 11 total constructs with a total
of 124 items. A “not-applicable” category (construct) was also included as the 12th
construct to ensure that the judges did not force any item into a particular category.
Furthermore, judges were allowed to ask as many questions as they wanted throughout
the process to ensure their understanding of the whole procedure of the Q-sort.
The criteria for evaluating the Q-sort results are based on the inter-judge agreement level.
Two evaluation indices were used to measure inter-judge agreement level: (1) Moore and
Benbasat‟s hit ratio (Moore and Benbasat, 1991), and (2) Cohen‟s Kappa coefficient
agreement (Cohen, 1960). The inter-judge agreement level is determined by counting the
number of items that both judges agree to place into a certain category, even though the
category into which items are sorted by both judges may not be the intended one. The
measurement based on Moore and Benbasat‟s deals with the “hit ratio”. The hit ratio is a
good indicator of how many items each pair of judges placed in the appropriate and
intended category, by counting all the items that are correctly grouped together according
to their intended theoretical construct by each judge and then dividing them by the total
number of items for each pair of judges. Finally, the measurement of Cohen‟s Kappa
coefficient agreement can be interpreted as the proportion of joint judgment in which
there is agreement after chance agreement. With regards to Kappa coefficient agreement,
79
there is no general agreement in the literature with respect to the required score.
However, several studies considered scores greater than 0.65 to be acceptable such as the
studies of (Jarvenpaa, 1989; Vessey, 1984).
4.2.2 Results of the First Sorting Round
In the first round, two senior managers of a major automobile firm participated in
the Q-sort. The hit ratio score averaged 79% (Table 4.2.1). The hit ratio was calculated
by counting all the items that were correctly sorted into the target category by each of the
judges and dividing them by twice the total number of items. In this research, the total
number of items that were correctly sorted by the two judges is 196, and the total number
of items placed for both judges is 248.

80
Table 4.2.1 Items placement ratios: first sorting round
1. Lean supply chain 2. Agile supply chain 3. Hybrid supply chain 4. IS for efficiency 5. IS for flexibility 6. IS for comprehensiveness 7. External focus of IT 8. Internal focus of IT 9. Infrastructural focus of IT 10. Alignment between supply chain management strategy and IS strategy 11. Alignment between supply chain management practices and usage of IT
The
oret
ical
Cat
egor
ies
Actual Categories 1 2 3 4 5 6 7 8 9 10 11 NA Total %
1 13 1 14 93%
2 4 20 24 83%
3 1 4 5 10 50%
4 14 14 100%
5 2 11 1
14 79%
6 4 1 7 12 58%
7 19 1 6
26 73%
8 1 13 2
16 81%
9 11 1 6 18 33%
10 41 7 48 85%
11 5 47 52 90%
NA
248
Total item placement: 248
Number of Hits: 196
Overall Hit Ratio: 79%

81
Table 4.2.2 Inter-judge raw agreement scores: first sorting round
Judge 1 Ju
dge
2 Constructs 1 2 3 4 5 6 7 8 9 10 11 NA
1 6 2 8 3 0 4 7 5 4 6 3 7 9 1 8 5 9 3 1
10 17 11 21
NA Total Item Placement : 124 Number of Correct
Agreements:81 Correct Agreement Ratio .65
1. Lean supply chain………………………………………………………………7 2. Agile supply chain…………………………………………………………….12 3. Hybrid supply chain…………………………………………………………….5 4. IS for efficiency………………………………………………………………..7 5. IS for flexibility………………………………………………………………...7 6. IS for comprehensiveness………………………………………………………6 7. External focus of IT…………………………………………………………...13 8. Internal focus of IT……………………………………………………………..8 9. Infrastructural focus of IT………………………………………………………9 10. Alignment between supply chain management strategy and IS strategy…….24 11. Alignment between supply chain management practices and usage of IT…..26
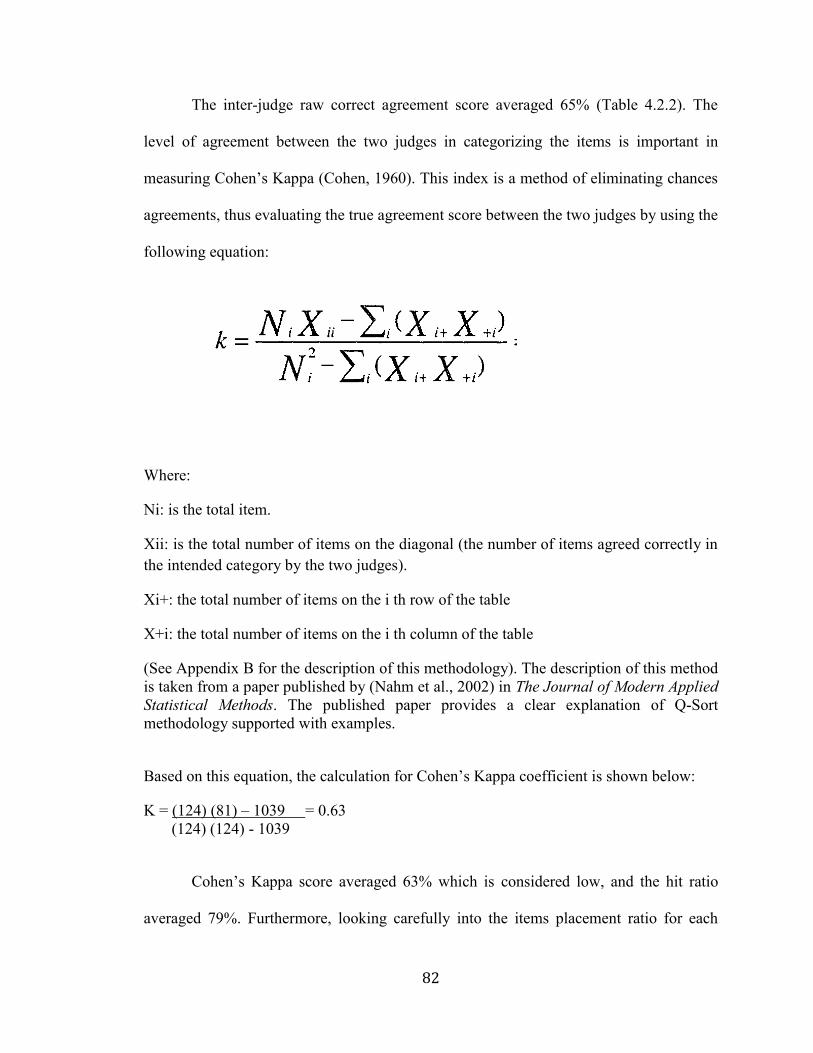
82
The inter-judge raw correct agreement score averaged 65% (Table 4.2.2). The
level of agreement between the two judges in categorizing the items is important in
measuring Cohen‟s Kappa (Cohen, 1960). This index is a method of eliminating chances
agreements, thus evaluating the true agreement score between the two judges by using the
following equation:
Where:
Ni: is the total item.
Xii: is the total number of items on the diagonal (the number of items agreed correctly in the intended category by the two judges).
Xi+: the total number of items on the i th row of the table
X+i: the total number of items on the i th column of the table
(See Appendix B for the description of this methodology). The description of this method is taken from a paper published by (Nahm et al., 2002) in The Journal of Modern Applied Statistical Methods. The published paper provides a clear explanation of Q-Sort methodology supported with examples.
Based on this equation, the calculation for Cohen‟s Kappa coefficient is shown below:
K = (124) (81) – 1039 = 0.63 (124) (124) - 1039
Cohen‟s Kappa score averaged 63% which is considered low, and the hit ratio
averaged 79%. Furthermore, looking carefully into the items placement ratio for each

83
category (construct), the results are not satisfying. For instance, the item # 3 (hybrid
supply chain) has a placement ratio of only 50%. The same is true for the item # 5 (IS for
flexibility) which has ratio of only 79%. Item # 6 (IS for comprehensiveness) has a
placement ratio of only 58%. Item # 7 (external focus of IT) has a placement ratio of only
73%. Finally, item # 9 (infrastructure focus of IT) has a placement ratio of only 33%. As
a result of the low scores for those constructs, a second round of Q-sort analysis is needed
to improve Cohen‟s Kappa score and the placement ratios.
4.2.3 Results of the Second Sorting Round
After making the changes to the items based on the results/feedback from the first
Q-sort round, some items were eliminated (8 items) and others were modified. A second
Q-sort round involved two senior purchasing managers with a total of 116 items (entering
the second Q-sort round). The hit ratio score averaged 93% (Table 4.2.3). The inter-judge
raw correct agreement scored average 89% (Table 4.2.4). The calculation for Cohen‟s
Kappa coefficient is shown below:
K = (116) (102) – 1382 = 0.87 (116) (116) – 1382
Cohen‟s Kappa score averaged 87% which is considered an excellent score.
However, looking carefully into the items placement ratio for each category (construct),
the results are not satisfying. Construct # 4 (IS for efficiency) has a placement ratio of
only 71.4%, and construct # 6 (IS for comprehensiveness) has a placement ratio of only
50%. In order to improve item placement ratio scores, a third Q-sort round was needed.

84
Table 4.2.3 Items placement ratios: second sorting round
1. Lean supply chain 2. Agile supply chain 3. Hybrid supply chain 4. IS for efficiency 5. IS for flexibility 6. IS for comprehensiveness 7. External focus of IT 8. Internal focus of IT 9. Infrastructural focus of IT 10. Alignment between supply chain management strategy and IS strategy 11. Alignment between supply chain management practices and usage of IT
The
oret
ical
Cat
egor
ies
Actual Categories 1 2 3 4 5 6 7 8 9 10 11 NA Tota
l %
1 14 14 100
2 20 20 100
3 10 10 100
4 10 2 1 1 14 71.4
5 2 12 14 85.7
6 1 4 3 8 50
7 24 24 100
8 16 16 100
9 14 14 100
10 42 6 48 87.5
11 1 49 50 98
NA
232
Total item placement: 232 Number of Hits: 215
Overall Hit Ratio: 93%

85
Table 4.2.4 Inter-judge raw agreement scores: second sorting round
Judge 1
Judg
e 2
Constructs 1 2 3 4 5 6 7 8 9 10 11 NA
1 7
2 10
3 5
4 5
5 5
6 1
7 12
8 8
9 7
10 18
11 24
NA
Total Item Placement: 116 Number of Correct Agreements:102
Correct Agreement Ratio 0.89
1. Lean supply chain……………………………………………………………..7 2. Agile supply chain……………………………………………………………10 3. Hybrid supply chain…………………………………………………………..5 4. IS for efficiency…………………………………………………….................7 5. IS for flexibility………………………………………………………………..7 6. IS for comprehensiveness………………………………………………………4 7. External focus of IT…………………………………………………………...12 8. Internal focus of IT……………………………………………………………..8 9. Infrastructural focus of IT………………………………………………………7 10. Alignment between supply chain management strategy and IS strategy.........24 11. Alignment between supply chain management practices and usage of IT…..25

86
4.2.4 Results of the Third Sorting Round
Taking into consideration the feedback/suggestions from the managers in the
second round, many items have been reworded and a total of 11 items were eliminated
from the pool. Two judges were involved in the third sorting round with a total of 105
items. Appendix C presents the items entering the third Q-sort analysis. In the third
round, the hit ratio score averaged 98% (Table 4.2.5). The inter-judge raw correct
agreement score averaged 95% (Table 4.2.6). The calculation for Cohen‟s Kappa
coefficient is shown below:
K = (105) (100) – 1286 = 0.95 (105) (105) – 1286
Kappa coefficient of 0.95 represents an excellent level of agreement for the
judges in the third round and also indicates consistency in the results between the second
and third sorting round. Moreover, eight constructs (lean supply chain, agile supply
chain, hybrid supply chain, IS for efficiency, external focus of IT, internal focus of IT,
and infrastructural focus of IT, and the alignment between supply chain management
practices and the usage of IT) obtained a 100% item placement ration, indicating a high
degree of construct validity.
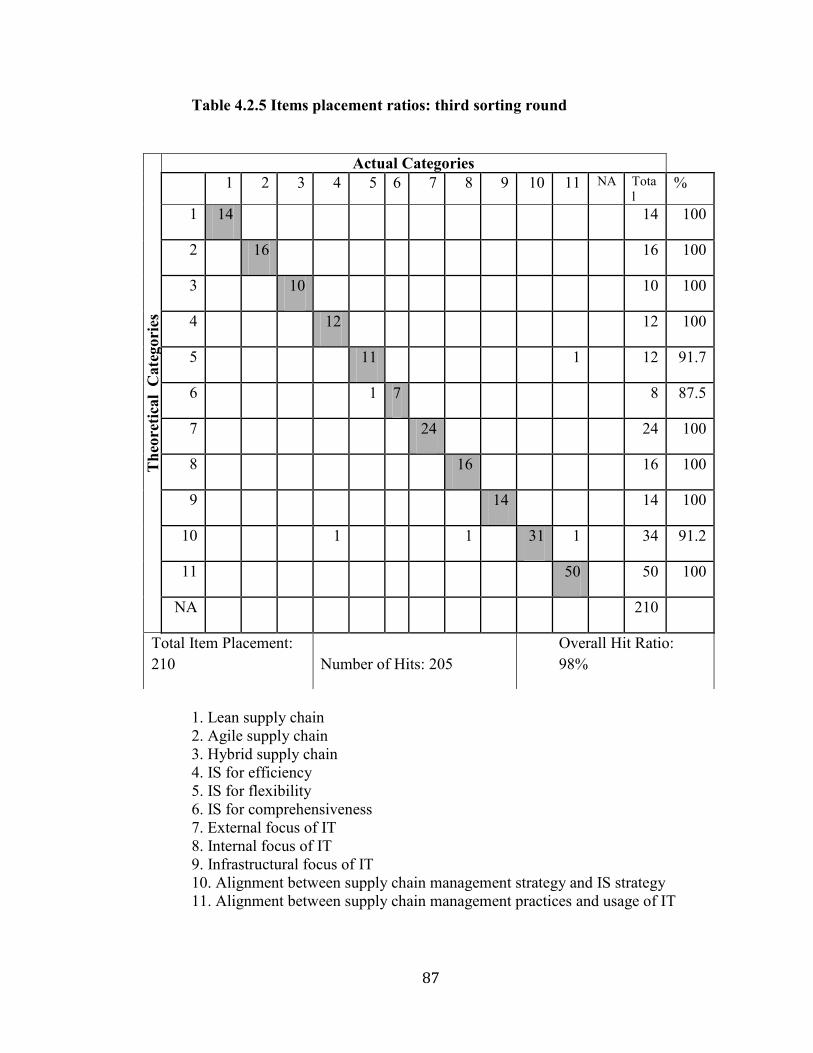
87
Table 4.2.5 Items placement ratios: third sorting round
1. Lean supply chain 2. Agile supply chain 3. Hybrid supply chain 4. IS for efficiency 5. IS for flexibility 6. IS for comprehensiveness 7. External focus of IT 8. Internal focus of IT 9. Infrastructural focus of IT 10. Alignment between supply chain management strategy and IS strategy 11. Alignment between supply chain management practices and usage of IT
The
oret
ical
Cat
egor
ies
Actual Categories 1 2 3 4 5 6 7 8 9 10 11 NA Tota
l %
1 14 14 100
2 16 16 100
3 10 10 100
4 12 12 100
5 11 1 12 91.7
6 1 7 8 87.5
7 24 24 100
8 16 16 100
9 14 14 100
10 1 1 31 1 34 91.2
11 50 50 100
NA 210
Total Item Placement: 210 Number of Hits: 205
Overall Hit Ratio: 98%

88
Table 4.2.6 Inter-judge raw agreement scores: third sorting round
Judge 1
Judg
e 2
Constructs 1 2 3 4 5 6 7 8 9 10 11 NA
1 7
2 8
3 5
4 6
5 5
6 3
7 12
8 8
9 7
10 14
11 25
NA
Total Item Placement: 105 Number of Correct Agreements:100
Correct Agreement Ratio .95
1. Lean supply chain…………………………………………………………….7 2. Agile supply chain……………………………………………………………8 3. Hybrid supply chain…………………………………………………………..5 4. IS for efficiency…………………………………………………….................6 5. IS for flexibility………………………………………………………………..6 6. IS for comprehensiveness……………………………………………………..4 7. External focus of IT…………………………………………………………...12 8. Internal focus of IT…………………………………………………………….8 9. Infrastructural focus of IT………………………………………………………7 10. Alignment between supply chain management strategy and IS strategy….....17 11. Alignment between supply chain management practices and usage of IT…..25

89
The total number of items after the third Q-sort has been reduced from 105 to 86.
The number of items remaining for each construct after the third round of Q-sort was as
follows:
1. Lean supply chain………………………………………………………….….6 2. Agile supply chain………………………………………………………..……6 3. Hybrid supply chain……………………………………………………….…..5 4. IS for efficiency………………………………………………..........................5 5. IS for flexibility………………………………………………………………...5 6. IS for comprehensiveness……………………………………………………...4 7. External focus of IT…………………………………………………………....5 8. Internal focus of IT…………………………………………………………….5 9. Infrastructural focus of IT……………………………………………………..5 10. Alignment between supply chain management strategy and IS strategy….....17 11. Alignment between supply chain management practices and usage of IT…..24
At this point we stopped the Q-sort method at round three as the raw agreement
score of 0.95, Cohen‟s Kappa of 0.95, and the average placement ratio of 0.95 were
considered as an excellent level of inter-judge agreement, indicating a high level of
reliability and construct validity. In the next chapter the test for the quantitative
assessment of construct validity and reliability using the large-scale sample is presented.
90
Chapter 5
Instruments Development – Large-Scale Administration and
Instrument Validation
5.1 Large-Scale Data Collection Methodology
The goal of the previous chapter (Chapter 4) was to partially validate the
construct measurement items of the research model through an extensive literature review
and Q-sort analysis. The main objective of this chapter is to further validate the
measurement instruments using a larger sample size.
Choosing the right respondent is very important when designing a large-scale
survey. The respondents are expected to have the best knowledge on the areas of the
survey. In the case of this study, the respondents chosen needed to have experience and
knowledge in managing the supply chain, and in information systems applications in their
organizations. Therefore, it was decided to choose purchasing directors, supply chain
directors, purchasing managers, and supply chain managers as the respondents for this
study.
A mailing list was obtained from RSA LIST SERVICES. RSA LIST SERVICES
provides an executive contact database for the manufacturing sector in the United States.

91
The initial mailing list used in this study contains 5000 records (names) which were
randomly selected by the RSA database. The list was limited mostly to organizations with
more than 200 employees and with sales revenue of more than $10 million, since small
organizations are unlikely to acquire or use sophisticated information systems in their
supply chains. Twenty SIC codes are covered in this study; they are summarized in Table
5.1.1. It is desirable for the respondents to represent different geographic areas. The
mailing list purchased covered the following States: AL, AR, AZ, CA, CO, CT, DE, FL,
GA, HI, IA, ID, IL, IN, OH, KS, KY, LA, MA, MD, MI, MN, MO, MS, MT, NC, ND,
NE, NH, NJ, NM, NV, NY, OK, PA, SC, TN, TX, UT, VA, VT, WA, WI, WV, and WY.
Table 5.1.1 SIC codes and their descriptions
SIC code Description
20 Food and Kindred Products
21 Tobacco Products
22 Textile Mill Products
23 Apparel, Finished Products from Fabrics & Similar Materials
24 Lumber and Wood Products, Except Furniture
25 Furniture and Fixtures
26 Paper and Allied Products
27 Printing, Publishing and Allied Industries
28 Chemicals and Allied Products
29 Petroleum Refining and Related Industries
30 Rubber and Miscellaneous Plastic Products
31 Leather and Leather Products
32 Stone, Clay, Glass, and Concrete Products
33 Primary Metal Industries
34 Fabricated Metal Products, Except Machinery & Transport Equipment
35 Industrial and Commercial Machinery and Computer Equipment
36 Electronic, Electrical Equipment, Except Computer Equipment
37 Transportation Equipment
38 Instruments and Related Products
39 Miscellaneous Manufacturing Industries
92
In this study, a web survey is used to collect data. The designing of the web
survey was done with the assistance of the Urban Affairs Center (UAC) at The University
of Toledo. UAC helps in designing a professional, high-quality survey that facilitates the
answering of the questionnaire. Furthermore, UAC helps by sending messages to the
respondents to remind them to complete the survey. UAC also stores the data (responses)
and provides them in a clear electronic file in SPSS or Excel format.
In designing the web survey, several aspects were taken into consideration: 1) it
was decided to present the survey as a multi-page form, rather than a single page form.
Even though previous research had not found significant differences between these two
presentation methods (Batagelj and Vehovar, 1998), we choose a multi-page format
because we did not want the respondent to see the whole questionnaire and get
discouraged by the total number of questions presented at once; 2) some sections of the
survey were designed by placing the scale at the right and left hand side of each
alignment, SCM strategy, and SCM practices questions, to help in reducing the number
of pages in the survey; 3) the online survey was designed to be as simple as possible in
terms of format and navigation as there was no password required to answer the survey.
The UAC sent the first waves of e-mail as an invitation to participate in the
survey. The e-mail briefly described the objective of the research and had a link to the
survey. In the first wave, initially from the 5000 contacts, 1888 bounced back due to e-
mails that do not exist. The results of the first waive shows that only 9 people responded
to the survey (from the 3112 names that received an e-mail). A second reminder was sent
exactly a week after the first attempt. In the second wave, to encourage participation in
the survey, I arranged for a lottery price worth $100. In the e-mails and cover letters, the
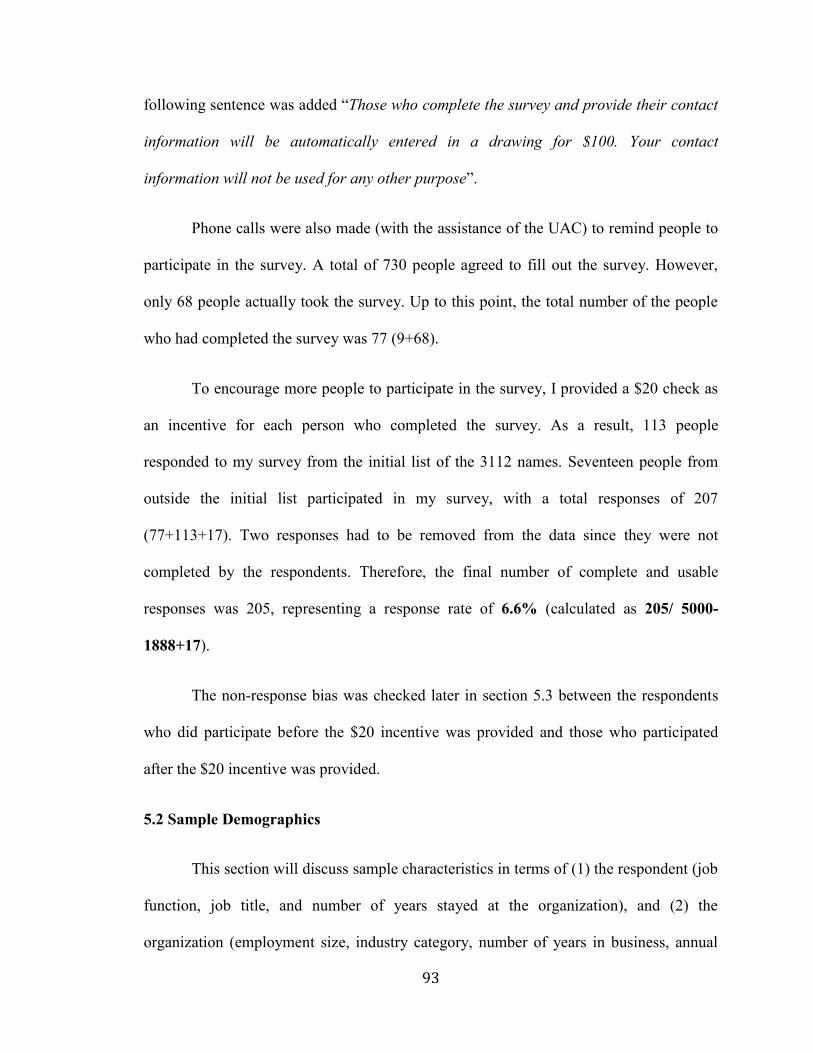
93
following sentence was added “Those who complete the survey and provide their contact
information will be automatically entered in a drawing for $100. Your contact
information will not be used for any other purpose”.
Phone calls were also made (with the assistance of the UAC) to remind people to
participate in the survey. A total of 730 people agreed to fill out the survey. However,
only 68 people actually took the survey. Up to this point, the total number of the people
who had completed the survey was 77 (9+68).
To encourage more people to participate in the survey, I provided a $20 check as
an incentive for each person who completed the survey. As a result, 113 people
responded to my survey from the initial list of the 3112 names. Seventeen people from
outside the initial list participated in my survey, with a total responses of 207
(77+113+17). Two responses had to be removed from the data since they were not
completed by the respondents. Therefore, the final number of complete and usable
responses was 205, representing a response rate of 6.6% (calculated as 205/ 5000-
1888+17).
The non-response bias was checked later in section 5.3 between the respondents
who did participate before the $20 incentive was provided and those who participated
after the $20 incentive was provided.
5.2 Sample Demographics
This section will discuss sample characteristics in terms of (1) the respondent (job
function, job title, and number of years stayed at the organization), and (2) the
organization (employment size, industry category, number of years in business, annual
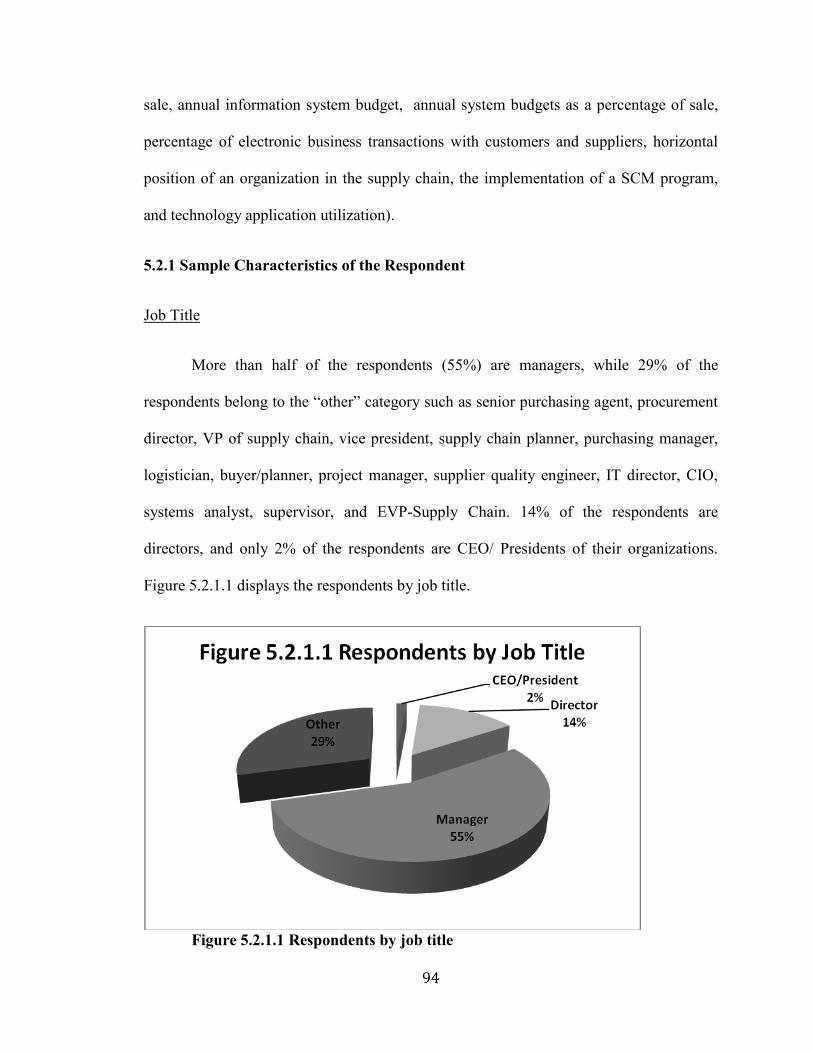
94
sale, annual information system budget, annual system budgets as a percentage of sale,
percentage of electronic business transactions with customers and suppliers, horizontal
position of an organization in the supply chain, the implementation of a SCM program,
and technology application utilization).
5.2.1 Sample Characteristics of the Respondent
Job Title
More than half of the respondents (55%) are managers, while 29% of the
respondents belong to the “other” category such as senior purchasing agent, procurement
director, VP of supply chain, vice president, supply chain planner, purchasing manager,
logistician, buyer/planner, project manager, supplier quality engineer, IT director, CIO,
systems analyst, supervisor, and EVP-Supply Chain. 14% of the respondents are
directors, and only 2% of the respondents are CEO/ Presidents of their organizations.
Figure 5.2.1.1 displays the respondents by job title.
Figure 5.2.1.1 Respondents by job title

95
Job Function
Seventy-seven percent (77%) of the respondents are experts in the area of
purchasing, while 21% of the respondents are experts in the area of manufacturing
production. Fifteen percent (15%) are experts in the transportation and distribution areas,
and 13% are corporate executives. Finally, only 3% are experts in the sales function.
Figure 5.2.1.2 displays the respondents by job function. This shows that most of the
respondents are knowledgeable and expert in the area of purchasing. (Note: one company
may represent multiple data items; the calculation of the percentage is based on the total
sample size of 205).
Figure 5.2.1.2 Respondents by job function
Years Stayed at the Organization
Forty-seven percent (47%) of the respondents indicate they have been working
with the organization for over 10 years; 21% of the respondents have been working with
the organization between 6-10 years; 25% of the respondents have been working between

96
2-5 years; and only 7% of the respondents had been at the organization for less than 2
years. Figure 5.2.1.3 displays the respondents by years worked at the organization. This
clearly shows that most of the respondents are experienced and have been working in
their organizations for many years.
Figure 5.2.1.3 Respondents by years worked at the organization
5.2.2 Sample Characteristics of Surveyed Organizations
Number of Employees
Thirty-one percent (31%) of the organizations have over 1000 employees, 6% of
the organizations have between 501-1000 employees and 6% of organizations have 1-50
employees. Organizations that have between 251 and 500 employees account for 17% of
the sample while organizations with between 101 and 250 employees account for 27% of
the sample. Finally, 13% of the organizations have between 51 and 101 employees.
Figure 5.2.2.1 displays the organizations by number of employees.

97
Figure 5.2.2.1 Organizations by number of employees
Industry Category
The majority of the organizations in the study are manufacturing organizations.
Eighty-four percent (84%) of the organizations are considered manufacturing
organizations, while 12% of the respondents belong to the “other” category such as retail,
distribution, logistics, design, manufacturing, and overhaul/repair. Three percent (3%) of
the respondents fall under the service category, and finally 1% of the organizations are
considered as process industries. Figure 5.2.2.2 displays the organizations by industry
category.

98
Figure 5.2.2.2 Industry category
Number of Years in Business
Ninety percent (90%) of the organizations have been in business for more than 10
years; 6% have been in business between 6 and 10 years; 4% have been in business
between 2 and 5 years, and none of the organizations have been in business for less than
2 years. Figure 5.2.2.3 displays the organizations by years in business. This clearly shows
that most of the organizations have been in business for more than 10 years.
Figure 5.2.2.3 Years in business

99
Annual Sale
Most of the organizations have annual sales of more than one million in USD.
Looking at Figure 5.2.2.4, only 1% of the organizations have annual sales of less than
one million USD; 20% of the organizations have annual sales of more than $1 billion;
20% had between $25-50 million; 9% and 11% of the respondents have sales volume
between $500-1000 million and between $250-500 million, respectively; 16% of the
organizations have annual sales between $20-250 million, while 13% have annual sales
of $10-25 million. Finally, 10% of the organizations have annual sales between $1 and
$10 million.
Figure 5.2.2.4 Annual sales in US dollars
Annual Information System Budget
Twenty percent (20%) of the respondents have an annual information systems
budget between $1 and $5 million; 20% between $500 thousand and $1 million; 47% of
the organizations have annual information systems budget between $0 and $500
thousand:, while 5% have a budget between $5 and $10 million; finally, 8% of the

100
respondents have an annual information systems budget more than $10 million. Figure
5.2.2.5 displays the organizations‟ annual information systems‟ budget in US dollars.
This clearly shows that organizations in the sample use information technology in their
organizations at different intensity.
Figure 5.2.2.5 Annual information systems’ budgets in US dollars
Annual Information System Budgets as Percentage of Sale
Almost half of the respondents (48%) have annual information systems‟ budgets
of less than 2% as a percentage of their sales, while 24% have an annual information
systems budget between 2% and 4% as a percentage of their sales. Eight percent (8%) of
the organizations have annual information systems budgets between 4% and 8% as a
percentage of their sales and 14% of the organizations have budgets between 8% and
10% of their sales. Three percent (3%) of the respondents have annual information

101
systems‟ budgets between 8%-10% and another 3% have budgets between 10%-15% as a
percentage of their sales. Finally, none of the respondents have annual information
systems‟ budgets over 15% of their sales. Figure 5.2.2.6 displays the organization‟s
annual information systems‟ budget as a percentage of sales in US dollars.
Figure 5.2.2.6 Annual information systems’ budget as a percentage of sales in
US dollars
Percentage of Electronic Business Transactions with Customers
Twenty percent (20%) of the organizations state that they have done less than
10% of their business transactions electronically with customers, while 24% of the
organizations have done 10%-30% of their business transactions electronically with
customers, and 23% of the organizations have done 30%-50% of their business
transactions electronically with customers. Twenty percent (20%) of the organizations
indicate that they do between 50% and 80% of these business transactions electronically.

102
Finally, 13% indicate that more than 80% of their business transactions with customers
are done electronically. Figure 5.2.2.7 displays the percentage of electronic transactions
with customers. These numbers clearly show the extent to which the sample companies
use information technology when dealing with customers differs from one organization to
another.
Figure 5.2.2.7 Percentage of electronic transactions with customers
Percentage of Electronic Business Transactions with Suppliers
Figure 5.2.2.8 shows the percentage of business transactions that organizations of
done electronically with suppliers: 22% of organizations have done less than 10% of their
business transactions electronically with suppliers; 25% have done between 10% and
30% ; between 30% and 50% of the organizations have done 23%; 50% to 80% have
done 20% of their business transactions electronically with suppliers; and finally, 10% of
the organizations indicate that more than 80% of their business transactions are done

103
electronically with their suppliers. Again, this also shows the extent to which
organizations are using IT when doing business with suppliers.
Figure 5.2.2.8 Percentage of electronic transactions with suppliers
Position of an Organization in the Supply Chain
The organization can position itself near the initial source of supply (raw material
and component supplier), or it can be positioned near the customer (distributor,
wholesaler, and retailer), or somewhere in between the near source of supply and
customer (assembler, sub-assembler, and manufacturer). Most of the surveyed
organizations are somewhere in between the near source of supply and customer: 83% of
the organizations are positioned at the manufacturer area, whereas distributors account
for 23% of respondents, and the sub-assemblers account for 15%. The assembler,
component supplier, and raw material suppliers account for 22%, 21%, and 10% of
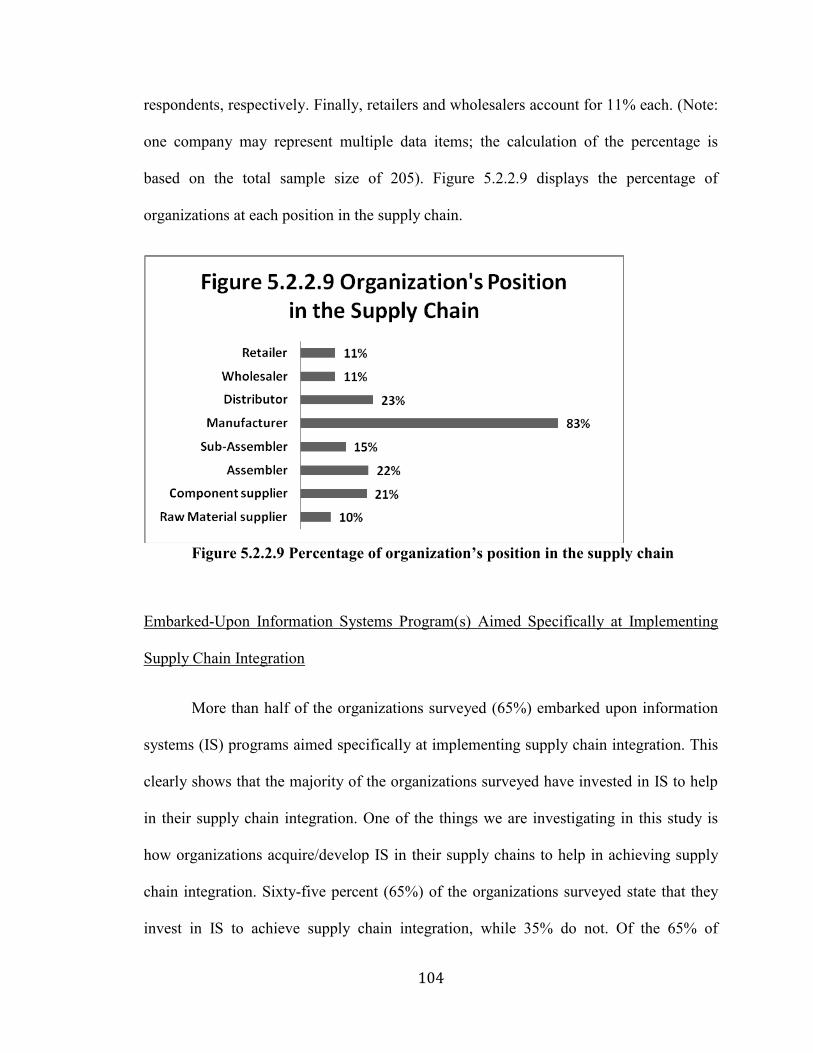
104
respondents, respectively. Finally, retailers and wholesalers account for 11% each. (Note:
one company may represent multiple data items; the calculation of the percentage is
based on the total sample size of 205). Figure 5.2.2.9 displays the percentage of
organizations at each position in the supply chain.
Figure 5.2.2.9 Percentage of organization’s position in the supply chain
Embarked-Upon Information Systems Program(s) Aimed Specifically at Implementing
Supply Chain Integration
More than half of the organizations surveyed (65%) embarked upon information
systems (IS) programs aimed specifically at implementing supply chain integration. This
clearly shows that the majority of the organizations surveyed have invested in IS to help
in their supply chain integration. One of the things we are investigating in this study is
how organizations acquire/develop IS in their supply chains to help in achieving supply
chain integration. Sixty-five percent (65%) of the organizations surveyed state that they
invest in IS to achieve supply chain integration, while 35% do not. Of the 65% of

105
organizations stating they invest in IS to achieve supply chain integration, 56% of them
have used these IS programs for this purpose for less than 5 years, and 29% of the
organizations have used them between 5 to 10 years. Finally, 15% of the organizations
have utilized IS programs aimed specifically for implementing supply chain integration
for more than 10 years. (Note: the calculation of the percentage is based on the total
sample size of 134 organizations that did actually embark upon IS programs). Figure
5.2.2.10 displays the percentage of organizations using information systems programs
aimed specifically at implementing supply chain integration.
Figure 5.2.2.10 Percentage of organizations using information systems
programs aimed specifically at implementing supply chain integration
Technology Application Utilization
Forty-eight percent (48%) of the organizations surveyed stated that the primary
technology application that they use in their organizations is EDI, while 19% of the
organization report that they use supply chain management software as their primary

106
application. Fourteen percent (14%) of the respondents belong to the “other” category
such as (SAP, ERP, JD Edwards, ETQ and Mapics, Custom Software, WMS, Bar Code,
Open Systems, Vendor Managed Inventory, Multiple Systems, PMR (Process Monitoring
Systems), and Manufacturing Execution Software). Furthermore, 14% of the
organizations use extranets, and finally 5% of the organizations surveyed use DSS.
Figure 5.2.2.11 displays the percentage of organizations based upon the primary
technology application that they use in their firms. (Note: one company may represent
multiple data items; the calculation of the percentage is based on the total sample size of
205).
Figure 5.2.2.11 Technology application utilization
5.3 Non-Response Bias
A non-response bias was assessed using a Chi-square test which was conducted
between two groups: 1) the respondents who did participate before the $20 incentive was

107
provided, “first wave”; and 2) the respondents who participated after a $20 incentive was
offered for each person who completed the survey, “second wave”. The first group has a
total of 77 responses; whereas the second group has a total of 128 responses. A non-
response bias analysis was conducted to check if there were any significant differences
between the two groups based on employment size, annual sales, and job title. The results
are shown in Table 5.3.1
Table 5.3.1 Test of non-response bias
Variables
First Wave (77)
First Wave Second Wave (128)
Second Wave
Chi-
square
Test
Observed Expected Frequency
Observed Expected Frequency
Number of Employees (205) Frequency (%)
1-50 5 (6%) 4.5 (5.8%) 7 (5%) 7.5 (5.9%) Chi-square = 2.1113 df=5 P (value)=.8335
51-100 10 (13%) 10.1 (13.1%) 17 (13%) 16.9 (13.2%) 101-250 23 (30%) 20.6 (26.7%) 32 (25%) 34.3 (26.8%) 251-500 15 (20%) 13.1 (17%) 20 (16%) 21.9 (17.1%) 501-1000 4 (5%) 4.5 (5.8%) 8 (6%) 7.5 (5.9%) Over 1000 20 (26%) 24 (31.1%) 44 (34%) 40 (31.3%)
Annual Sales in Million USD (203) *two respondent did not provide annual sales information from the second wave
Variables
First Wave (77)
First Wave Second Wave (126)
Second Wave
Chi-
square
Test
Observed Expected Frequency
Observed Expected Frequency
0-1 1 (1%) .75 (1%) 1 (1%) 1.2 (1%) Chi-square = 5.4005 df=7 P (value)=.6112
1-10 10 (13%) 7.6 (9.8%) 10 (8%) 12.4 (9.9%) 10-25 8 (10%) 10.2 (13.3%) 19 (10%) 16.8 (13.3%) 25-50 16 (21%) 14.4 (18.7%) 22 (17%) 23.6 (18.7%) 50-250 12 (16%) 12.5 (16.3%) 21 (16%) 20.5 (16.2%) 250-500 11 (14%) 8.3 (10.8%) 11 (9%) 13.7 (10.8%) 500-1000 7 (9%) 7.2 (9.4%) 12 (10%) 11.8 (9.4%)

108
over 1 Billion 12 (16%) 15.9 (20.7%) 30 (24%) 26 (20.7%)
Job Title (205) Variables
First Wave (77)
First wave Second Wave (126)
Second Wave
Chi-square Test Observed Expected
Frequency Observed Expected
Frequency CEO/president 2 (3%) 1.1 (1.4%) 1 (1%) 1.9 (1.4%) Chi-
square = 2.9712 df=3 P (value)=.3960
Director 14 (18%) 10.9 (14.1%) 15 (12%) 18.1 (14.1%) Manager 39 (51%) 42.4 (55.1%) 74 (58%) 17.6 (55.1%) Other 22 (28%) 22.3 (29.3%) 38 (29%) 37.5 (29.3%)
Based on the results of the Chi-square test provided in Table 5.3.1, we can clearly
see that there are no significant differences between the two groups, which suggest that
non-response bias is not a concern for this study.
5.4 Large-Scale Instrument Assessment Methodology
The next step is to test for instrument validation. The validation of the instruments
was tested with the following objectives: 1) purification of the items; (2)
unidimensionality; 3) convergent validity; and 4) discriminant validity. The methods used
in analyzing those objectives were: corrected item total correlation (CITC) for
purification; exploratory factor analysis for unidimensionality; Cronbach‟s alpha for
reliability; and finally, correlation analysis for convergent and discriminant validity. To
validate the instruments means that the degree to which the sets of instruments correctly
represent the concept of the study and consequently permit an appropriate interpretation
of the results (Hair, Anderson et al., 1995; Gay and Airasian, 2003). Validity needs to be
assessed in different levels: content, construct, and criterion-related. Construct validity
109
refers to the degree to which measures of the same construct correlate more highly with
each other than they do with measures of other constructs (Cook and Campbell, 1997;
Schoenfeldt, 1984). This usually takes the form of convergent and discriminant validity
which is explained later in the section. Criterion-related validity deals with finding the
presence or absence of one or more criteria considered to represent a construct. This type
of validity is assessed through concurrent and predictive validity.
Churchill (1979) suggests that there is a need to purify the items before
administrating factor analysis. This will be carried out by eliminating the items if their
CITC score is below a threshold value of 0.5. However, an item with a CITC score below
the threshold value can be kept if theoretical support and arguments to keep that item can
be provided. On the other hand, an item with a CITC score above the threshold value may
also be removed from the analysis if the deletion of that item dramatically improves the
overall reliability of the specific dimension. The reliability is about the internal
consistency of a latent variable. The reliability is determined by examining Cronbach‟s
alpha. Nunnally (1979) suggests that an alpha score of 0.7 or higher indicates a good
reliable scale.
The next step after purifying the items is to examine the factor structure through
exploratory factor analysis (EFA) to assess convergent validity at the dimension level and
discriminant validity at the construct level. The convergent validity is the evidence that
the observed items gathered at different levels converge into observed latent variables,
whereas the discriminant validity refers to the uniqueness and independence of two
different latent variables that are measured by two groups of observed variables
(Campbell, 1960). Assessing both (discriminant and convergent validity) will result in
110
measuring the construct validity. The content validity was explained and assessed in
chapter 3 and 4.
The most popular rotation methods used in factor analysis are principal
component analysis method and VARIMAX rotation extraction method (Kaiser, 1958).
Factor loading with a score greater than 0.5 are considered significant (Hair, Anderson et
al., 1995); the score of 0.5 is used as a cut-off score for the items. Any items that are not
loading in a particular dimension or having a significant cross loading with other
dimensions will be dropped from any further analysis. Thus, items with good
measurement properties should exhibit high factor loadings on the intended factor and
small factor loadings in other factors (Segars and Grover, 1993).
During the EFA stage, a Kaiser-Meyer-Olkin (KMO) measure of sampling
adequacy was calculated. Sampling adequacy assures that an effective sample size is
found so it can be assessed at the factor analysis stage. The KMO measure indicates that
the effective sample size is adequate for the factor analysis. Generally, KMO scores
below 0.5 are unacceptable, in the 0.60's are tolerable, in the 0.70's are average, in the
0.80's are very good, and in the 0.90's are outstanding.
5.5 Large-Scale Measurement Results
This section will present the results of the large-scale instrument validation of the
six constructs following the steps mentioned in the previous section (section 5.4 large-
scale instrument assessment methodology). The 6 constructs are: SCM Strategy,
Information Systems Strategy, SCM practices, IT utilization, SCM Performance, and
Firm Performance.
111
5.5.1 SCM Strategy (SCMS)
Purification of the items (Reliability)
A SCMS construct was initially represented by three dimensions and 17 items,
and they are as follows: (1) Lean Supply Chain (LSC) (6 items), (2) Agile Supply Chain
(ASC) (6 items), and (3) Hybrid Supply Chain (HSC) (5 items). The original items with
the code for each item and the CITC results of SCMS are shown in Table 5.5.1.1
The analysis began with purification using CITC analysis. CITC analysis was
done to the three dimensions. All the items in the three dimensions had a score higher
than 0.5 except for the item (SCMS_ASC1) which had a score of 0.49. Even though the
score was slightly below the threshold, it was decided to keep the item because removing
this item did not improve the reliability (Cronbach‟s alpha score of 0.81) for ASC
dimension. Also, removing this item has caused item (SCMS_ASC4) to have a score of
0.33 which means that I need to delete both items (SCMS_ASC1, and SCMS_ASC4).
Deleting these two items did not improve the overall reliability, so it was decided to keep
item (SCMS_ASC1). The reliability of the three dimensions (LSC, ASC, and HSC) are
(0.82, 0.81, and 0.93) respectively.

112
Table 5.5.1.1 Supply chain management strategy- initial large scale survey
items, CITC results, and overall alpha score
Item Code Survey Item CITC-1 Alpha
Lean Supply Chain (LSC)
.82
SCMS_LSC1 Our suppliers deliver what we need .51 SCMS_LSC2 Our suppliers deliver when we need .54 SCMS_LSC3 Our suppliers deliver where we need .53 SCMS_LSC4 Our suppliers adopt quality practices as per our
requirements .65
SCMS_LSC5 Our suppliers manage quality as per our requirements .69 SCMS_LSC6 Our suppliers inspect products frequently .57
Agile Supply Chain (ASC)
SCMS_ASC1 Our suppliers respond quickly to our changing requirements of cost
.49 .81
SCMS_ASC2 Our suppliers respond quickly to our changing requirements of delivery time
.57
SCMS_ASC3 Our suppliers respond quickly to our changing requirements of design
.59
SCMS_ASC4 Our suppliers respond effectively to our changing requirements of cost
.52
SCMS_ASC5 Our suppliers respond effectively to our changing requirements of delivery time
.62
SCMS_ASC6 Our suppliers respond effectively to our changing requirements of design
.65
Hybrid Supply Chain (HSC)
SCMS_HSC1 Our suppliers customize our products by adding feature models as per our requirements
.85 .93
SCMS_HSC2 Our suppliers produce modular products .83 SCMS_HSC3 Our suppliers respond to customization requirements
quickly .84
SCMS_HSC4 Our suppliers delay the product final assembly until customers make an order
.75
SCMS_HSC5 Our suppliers change the design of the product .76
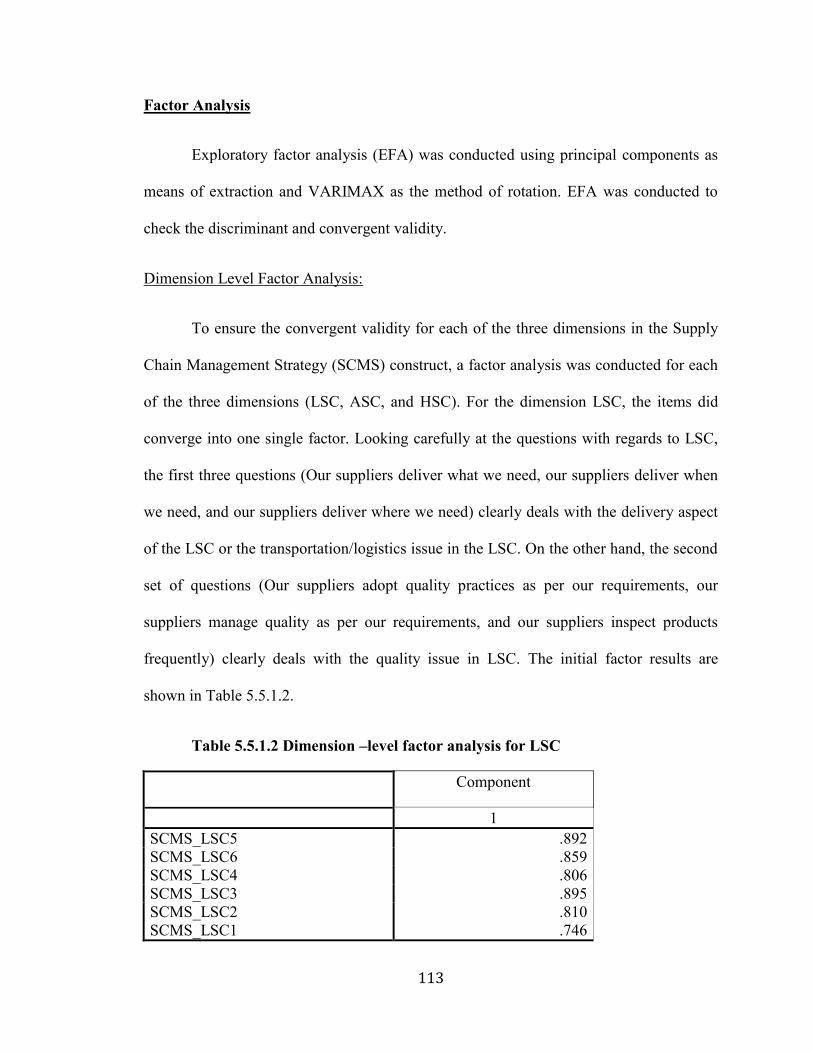
113
Factor Analysis
Exploratory factor analysis (EFA) was conducted using principal components as
means of extraction and VARIMAX as the method of rotation. EFA was conducted to
check the discriminant and convergent validity.
Dimension Level Factor Analysis:
To ensure the convergent validity for each of the three dimensions in the Supply
Chain Management Strategy (SCMS) construct, a factor analysis was conducted for each
of the three dimensions (LSC, ASC, and HSC). For the dimension LSC, the items did
converge into one single factor. Looking carefully at the questions with regards to LSC,
the first three questions (Our suppliers deliver what we need, our suppliers deliver when
we need, and our suppliers deliver where we need) clearly deals with the delivery aspect
of the LSC or the transportation/logistics issue in the LSC. On the other hand, the second
set of questions (Our suppliers adopt quality practices as per our requirements, our
suppliers manage quality as per our requirements, and our suppliers inspect products
frequently) clearly deals with the quality issue in LSC. The initial factor results are
shown in Table 5.5.1.2.
Table 5.5.1.2 Dimension –level factor analysis for LSC
Component
1 SCMS_LSC5 .892 SCMS_LSC6 .859 SCMS_LSC4 .806 SCMS_LSC3 .895 SCMS_LSC2 .810 SCMS_LSC1 .746

114
As indicated by Table 5.5.1.2, all factor loadings are greater than 0.76. The
Kaiser-Meyer-Olkin (KMO) measure of sampling adequacy for LSC dimension was 0.74.
For the dimension ASC, the items did not emerge into one single factor. The item
codes (SCMS_ASC1 and SCMS_ASC4) created a second factor as shown in Table
5.5.1.3.
Table 5.5.1.3 Dimension–level factor analysis for ASC
Component
1 2
SCMS_ASC3 .840
SCMS_ASC6 .834
SCMS_ASC2 .708
SCMS_ASC5 .707
SCMS_ASC1 .900 SCMS_ASC4 .886
Looking carefully at those two questions, they clearly deal with the cost issue in
the supply chain strategy which was captured in the LSC (the first dimension). The two
questions are: (Our suppliers respond quickly to our changing requirements of cost for
the code SCMS_ASC1, and our suppliers respond effectively to our changing
requirements of cost for the code SCMS_ASC4). Therefore, it was decided to drop these
two items from any further analysis. Hence, they are the same items that had a low CITC
scores in the purification section. After dropping those two items, another factor analysis
was conducted to the remaining 4 factors. The factor results are shown in Table 5.5.1.4
which indicates that a single factor solution emerged for this dimension with all factor

115
loadings greater than 0.77. The Kaiser-Meyer-Olkin (KMO) measure of sampling
adequacy for ASC dimension was 0.56.
Table 5.5.1.4 Dimension –level factor analysis for ASC results (2)
Component
1
SCMS_ASC6 .806 SCMS_ASC3 .800 SCMS_ASC5 .786 SCMS_ASC2 .778
Finally, for the dimension HSC, a single factor solution emerged for this
dimension with all factor loadings greater than 0.82. The Kaiser-Meyer-Olkin (KMO)
measure of sampling adequacy was 0.88. The results are shown in Table 5.5.1.5
Table 5.5.1.5 Dimension–level factor analysis for HSC
Component
1
SCMS_HSC3 .908 SCMS_HSC1 .905 SCMS_HSC2 .890 SCMS_HSC5 .840 SCMS_HSC4 .828
Construct Level Exploratory Factor Analysis
The remaining 15 items of the Supply Chain Management Strategy construct were
submitted to a construct level exploratory factor analysis to check for discriminant
validity. A clear three factors emerged from this analysis. However, two items cross

116
loaded into two dimensions; the items code (SCMS_ASC2, and SCMS_ASC5) loaded
into the first dimension which is LSC, and the second dimension which is ASC (where it
was initially supposed to load). After carefully reviewing the questions for item codes
SCMS_ASC2 and SCMS_ASC5 (Our suppliers respond quickly to our changing
requirements of delivery time, and our suppliers respond effectively to our changing
requirements of delivery time), these two questions deal with the delivery issue of the
supply chain strategy which was captured in the first dimension LSC. Therefore it was
decided to delete the two items (SCMS_ASC2, and SCMS_ASC5) from any further
analysis. The results are shown in Table 5.5.1.6.
Table 5.5.1.6 Supply chain management strategy-construct level factor
analysis results
Component
1 2 3
SCMS_HSC3 .895
SCMS_HSC2 .895
SCMS_HSC1 .887
SCMS_HSC5 .843
SCMS_HSC4 .825
SCMS_LSC3 .812
SCMS_LSC2 .794
SCMS_LSC1 SCMS_LSC5 SCMS_LSC6 SCMS_LSC4
.714
.857
.838
.751
SCMS_ASC3 .852 SCMS_ASC6 .790 SCMS_ASC2 .478 .614 SCMS_ASC5 .546 .566

117
After eliminating the two items, a second level exploratory factor analysis for the
remaining 13 items was conducted. Most of the factor loadings were above 0.73 as seen
in Table 5.5.1.7.The sample adequacy was very good at 0.78 and the three factors
accounted for almost 77% of the total variance.
Table 5.5.1.7 Supply chain management strategy - construct level factor
analysis results (2)
Component
1 2 3
SCMS_HSC3 .898
SCMS_HSC2 .897
SCMS_HSC1 .888
SCMS_HSC5 .842
SCMS_HSC4 .827
SCMS_LSC5 .870
SCMS_LSC6 .868
SCMS_LSC4 .738
SCMS_LSC3 .871
SCMS_LSC2 .789
SCMS_LSC1 .758 SCMS_ASC3 .910 SCMS_ASC6 .864
Eigen Value 4.169 4.408 1.478
% Variance Explained 32.069 33.899 11.37
Cumulative % of Variance
32.069 56.912 77.346
Kaiser Mayer Orkin (KMO) Measure of sampling adequacy = 0.78
Cronbach Alpha (α) = 0.82
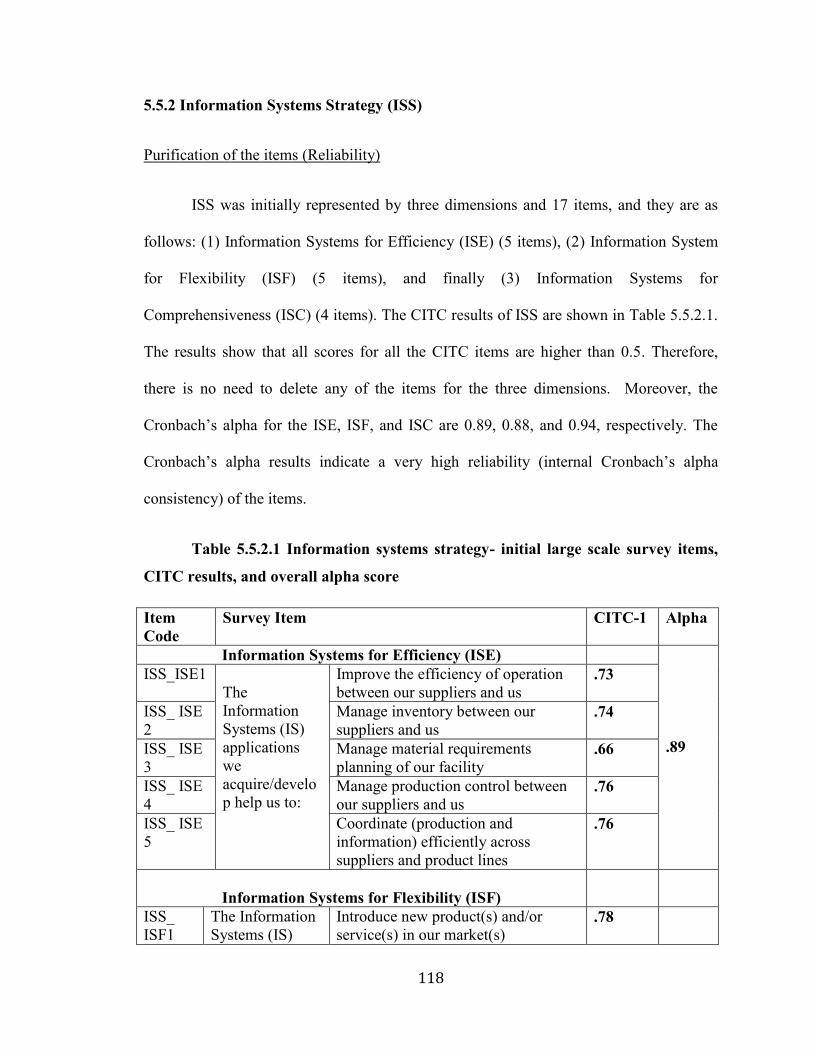
118
5.5.2 Information Systems Strategy (ISS)
Purification of the items (Reliability)
ISS was initially represented by three dimensions and 17 items, and they are as
follows: (1) Information Systems for Efficiency (ISE) (5 items), (2) Information System
for Flexibility (ISF) (5 items), and finally (3) Information Systems for
Comprehensiveness (ISC) (4 items). The CITC results of ISS are shown in Table 5.5.2.1.
The results show that all scores for all the CITC items are higher than 0.5. Therefore,
there is no need to delete any of the items for the three dimensions. Moreover, the
Cronbach‟s alpha for the ISE, ISF, and ISC are 0.89, 0.88, and 0.94, respectively. The
Cronbach‟s alpha results indicate a very high reliability (internal Cronbach‟s alpha
consistency) of the items.
Table 5.5.2.1 Information systems strategy- initial large scale survey items,
CITC results, and overall alpha score
Item Code
Survey Item CITC-1 Alpha
Information Systems for Efficiency (ISE) .89
ISS_ISE1 The Information Systems (IS) applications we acquire/develop help us to:
Improve the efficiency of operation between our suppliers and us
.73
ISS_ ISE 2
Manage inventory between our suppliers and us
.74
ISS_ ISE 3
Manage material requirements planning of our facility
.66
ISS_ ISE 4
Manage production control between our suppliers and us
.76
ISS_ ISE 5
Coordinate (production and information) efficiently across suppliers and product lines
.76
Information Systems for Flexibility (ISF)
ISS_ ISF1
The Information Systems (IS)
Introduce new product(s) and/or service(s) in our market(s)
.78
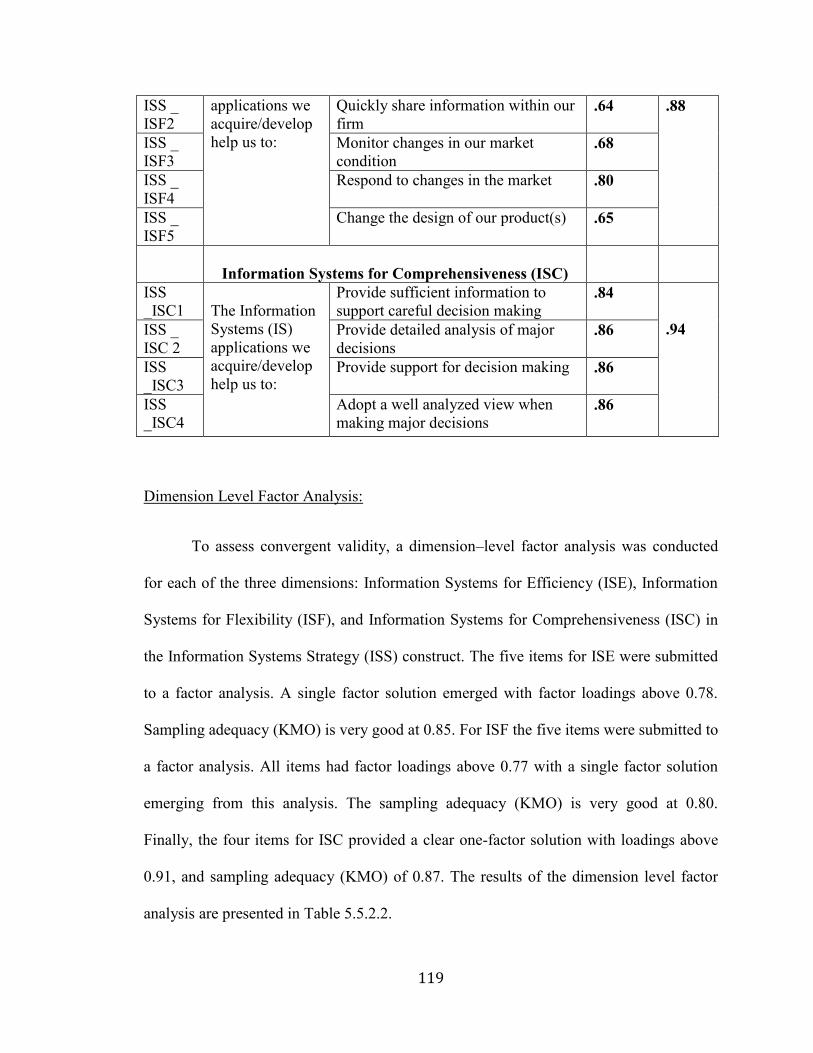
119
ISS _ ISF2
applications we acquire/develop help us to:
Quickly share information within our firm
.64 .88
ISS _ ISF3
Monitor changes in our market condition
.68
ISS _ ISF4
Respond to changes in the market .80
ISS _ ISF5
Change the design of our product(s) .65
Information Systems for Comprehensiveness (ISC)
ISS _ISC1
The Information Systems (IS) applications we acquire/develop help us to:
Provide sufficient information to support careful decision making
.84 .94
ISS _ ISC 2
Provide detailed analysis of major decisions
.86
ISS _ISC3
Provide support for decision making .86
ISS _ISC4
Adopt a well analyzed view when making major decisions
.86
Dimension Level Factor Analysis:
To assess convergent validity, a dimension–level factor analysis was conducted
for each of the three dimensions: Information Systems for Efficiency (ISE), Information
Systems for Flexibility (ISF), and Information Systems for Comprehensiveness (ISC) in
the Information Systems Strategy (ISS) construct. The five items for ISE were submitted
to a factor analysis. A single factor solution emerged with factor loadings above 0.78.
Sampling adequacy (KMO) is very good at 0.85. For ISF the five items were submitted to
a factor analysis. All items had factor loadings above 0.77 with a single factor solution
emerging from this analysis. The sampling adequacy (KMO) is very good at 0.80.
Finally, the four items for ISC provided a clear one-factor solution with loadings above
0.91, and sampling adequacy (KMO) of 0.87. The results of the dimension level factor
analysis are presented in Table 5.5.2.2.

120
Table 5.5.2.2 Dimension –level factor analysis for ISE, ISF, and ISC
Component
1
ISS_ISE5 .851 ISS_ISE4 .849 ISS_ISE1 .838 ISS_ISE2 .837 ISS_ISE3 .782
Component
1
ISS_ISF4 .885 ISS_ISF1 .862 ISS_ISF3 .795 ISS_ISF2 .773 ISS_ISF5 .770
Component
1
ISS_ISC2 .928 ISS_ISC4 .925 ISS_ISC3 .921 ISS_ISC1 .909
Construct Level Exploratory Factor Analysis:
To further ensure the discriminant validity of Information Systems Strategy (ISS)
dimensions, all 14 items of the ISS construct were submitted to a construct level
exploratory factor analysis. Three factors emerged from this analysis as seen in Table
5.5.2.3. However, item code ISS_ISF2 cross loaded into the second dimension (ISF) and
the third dimension (ISC). Therefore, it was decided to drop this item from any further
analysis.

121
Table 5.5.2.3 Information systems strategy- construct level factor analysis
results
Component
1 2 3
ISS_ISC2 .833
ISS_ISC3 .808
ISS_ISC4 .802
ISS_ISC1 .757
ISS_ISE3 .747
ISS_ISE1 .730
ISS_ISE2 .718
ISS_ISE4 .717
ISS_ISE5 .612
ISS_ISF2 .524 .489 ISS_ISF1 .828 ISS_ISF4 .774 ISS_ISF5 .762 ISS_ISF3 .745
A second exploratory factor analysis was conducted to the remaining 13 items.
The results are shown in Table 5.5.2.4 which indicates a clear three-factor solution
emerged with all factor loadings greater than 0.61 and no cross loadings, indicating no
further revision required for the items. The KMO measure (0.89) indicates an excellent
sampling adequacy, the three factors accounted for almost 76% of the total variance, and
the overall Cronbach alpha score is 0.82.
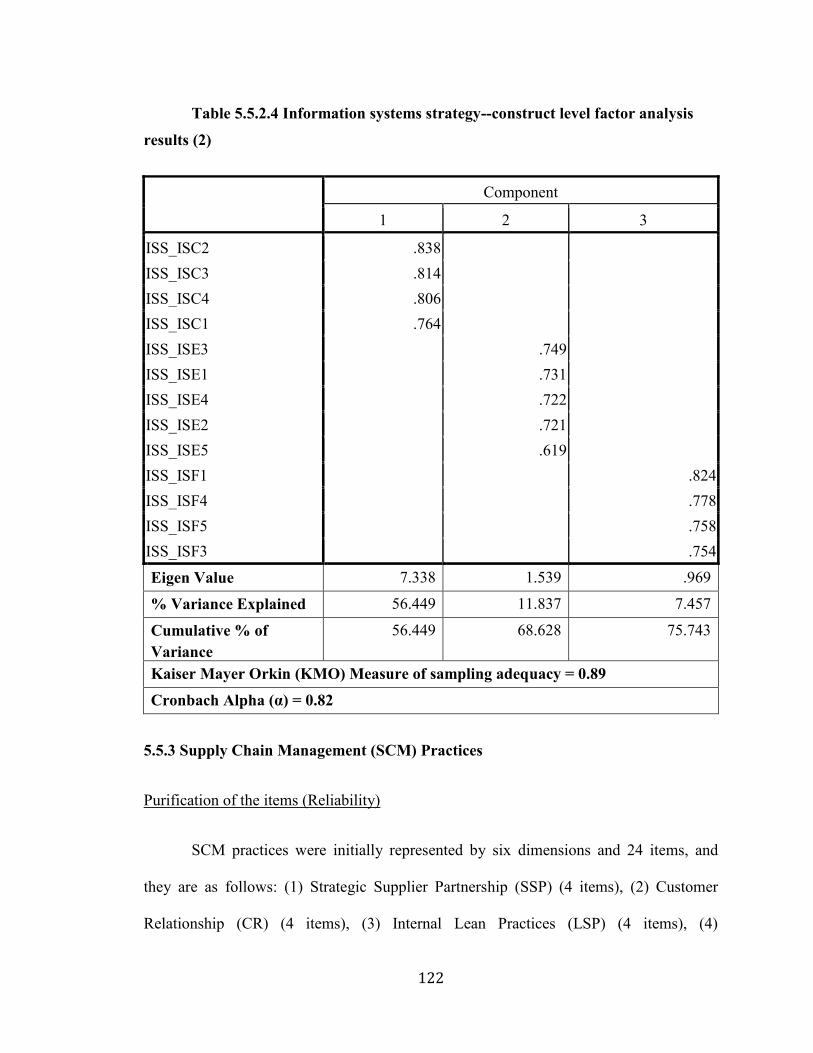
122
Table 5.5.2.4 Information systems strategy--construct level factor analysis
results (2)
Component
1 2 3
ISS_ISC2 .838
ISS_ISC3 .814
ISS_ISC4 .806
ISS_ISC1 .764
ISS_ISE3 .749
ISS_ISE1 .731
ISS_ISE4 .722
ISS_ISE2 .721
ISS_ISE5 .619
ISS_ISF1 .824 ISS_ISF4 .778 ISS_ISF5 .758 ISS_ISF3 .754
Eigen Value 7.338 1.539 .969
% Variance Explained 56.449 11.837 7.457
Cumulative % of Variance
56.449 68.628 75.743
Kaiser Mayer Orkin (KMO) Measure of sampling adequacy = 0.89
Cronbach Alpha (α) = 0.82
5.5.3 Supply Chain Management (SCM) Practices
Purification of the items (Reliability)
SCM practices were initially represented by six dimensions and 24 items, and
they are as follows: (1) Strategic Supplier Partnership (SSP) (4 items), (2) Customer
Relationship (CR) (4 items), (3) Internal Lean Practices (LSP) (4 items), (4)

123
Postponement (POS) (4 items), (5) Information Sharing (IS) (3 items), and finally (6)
Information Quality (IQ) (5 items). The analysis began with purification using CITC
analysis. The CITC scores for each item and its corresponding code name are shown in
Table 5.5.3.1
The CITC scores show that all scores for all the CITC items are higher than 0.5
except for the following items (SC_ SSP3 and SC_ SSP4 for the SSP dimension), and
(SC_POS3 for the POS dimension). After carefully examining the item SC_ SSP3,
(Include our key suppliers in our planning and goal-setting activities), it can be concluded
that this item can be constructed as part of SC_ SSP2 (Solve problems jointly with our
suppliers). Therefore, it was decided to drop this item from any further analysis. After
dropping this item, a second CITC analysis was conducted. The results did slightly
improve the CITC score for item SC_SSP4 to 0.50. Therefore, it was decided not to
remove this item. Moreover, the Cronbach‟s alpha for SSP is 0.74 which is above the
threshold value of 0.7 which indicates a good reliable scale.
The CITC scores for all items in (SC_CR, SC_LSP, SC_POS, SC_IS, and
SC_IQ) are all well above 0.50 with a Cronbach‟s alpha value of (0.85, 0.84, 0.78, 0.85,
and 0.96) respectively.
Dimension Level Factor Analysis:
Dimension level factor analysis was performed to each of the dimensions of the
Supply Chain Management Practices construct. For the Strategic Supplier Partnership
(SSP), the remaining three items were submitted to a factor analysis and a single-factor
solution emerged with factor loadings above 0.74. Sampling adequacy (KMO) is
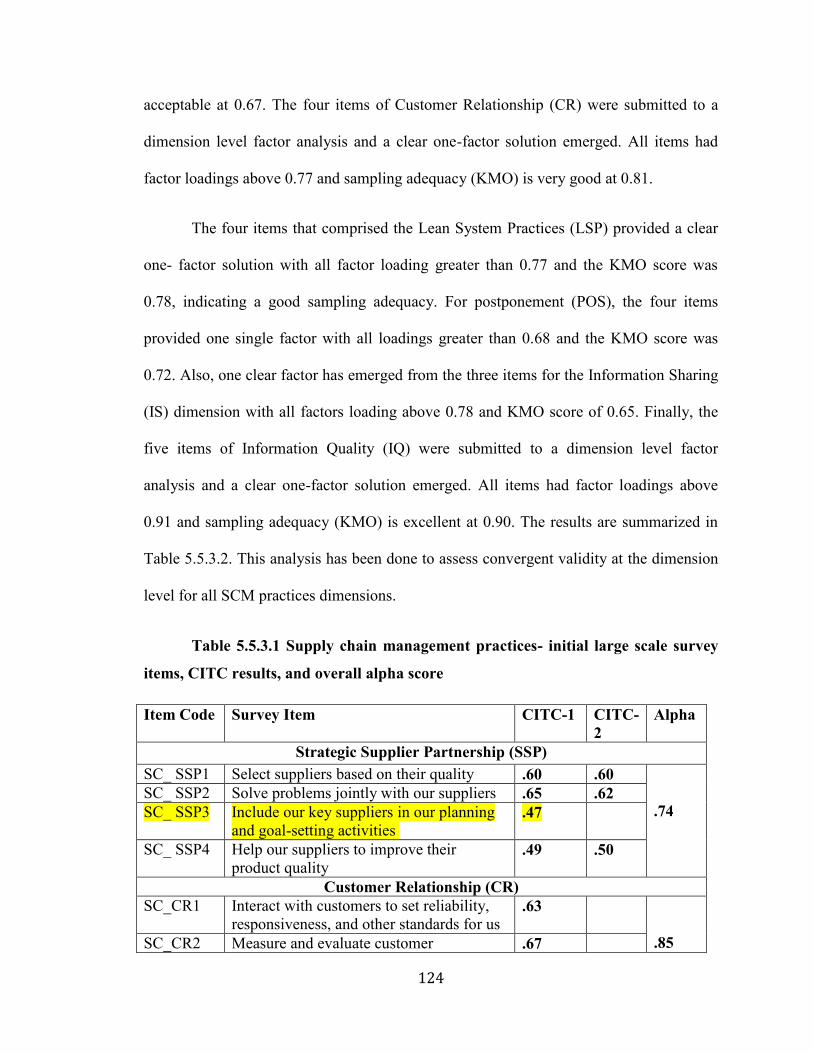
124
acceptable at 0.67. The four items of Customer Relationship (CR) were submitted to a
dimension level factor analysis and a clear one-factor solution emerged. All items had
factor loadings above 0.77 and sampling adequacy (KMO) is very good at 0.81.
The four items that comprised the Lean System Practices (LSP) provided a clear
one- factor solution with all factor loading greater than 0.77 and the KMO score was
0.78, indicating a good sampling adequacy. For postponement (POS), the four items
provided one single factor with all loadings greater than 0.68 and the KMO score was
0.72. Also, one clear factor has emerged from the three items for the Information Sharing
(IS) dimension with all factors loading above 0.78 and KMO score of 0.65. Finally, the
five items of Information Quality (IQ) were submitted to a dimension level factor
analysis and a clear one-factor solution emerged. All items had factor loadings above
0.91 and sampling adequacy (KMO) is excellent at 0.90. The results are summarized in
Table 5.5.3.2. This analysis has been done to assess convergent validity at the dimension
level for all SCM practices dimensions.
Table 5.5.3.1 Supply chain management practices- initial large scale survey
items, CITC results, and overall alpha score
Item Code Survey Item CITC-1 CITC-2
Alpha
Strategic Supplier Partnership (SSP) SC_ SSP1 Select suppliers based on their quality .60 .60
.74
SC_ SSP2 Solve problems jointly with our suppliers .65 .62 SC_ SSP3 Include our key suppliers in our planning
and goal-setting activities .47
SC_ SSP4 Help our suppliers to improve their product quality
.49 .50
Customer Relationship (CR) SC_CR1 Interact with customers to set reliability,
responsiveness, and other standards for us .63
.85 SC_CR2 Measure and evaluate customer .67

125
satisfaction SC_CR3 Determine future customer expectations .73
SC _CR4 Facilitate customers‟ ability to seek assistance from us
.75
Lean System Practices (LSP)
SC_LSP1 Reduce manufacturing set-up time .59 .84
SC_LSP2 Build and maintain continuous quality improvement program(s)
.77
SC_LSP3 Streamline ordering, receiving and other paperwork from suppliers
.62
SC_LSP4 Push suppliers for shorter lead-times .71 Postponement (POS)
SC_POS1 Delay final product assembly activities until customer orders have actually been received
.65 .78
SC_POS2 Delay final product assembly activities until the last possible position (or nearest to customers) in the supply chain
.71
SC_POS3 Store our parts/products at distribution points closer to the customer
.50
SC_POS4 Design products for modular assembly .51 Information Sharing (IS)
SC_IS1 Inform our trading partners in advance of our changing needs
.60 .85 SC_IS2 Mutually share business knowledge of
core business processes with our trading partners
.83
SC_IS3 Mutually share proprietary information with our trading partners
.74
Information Quality (IQ) SC_IQ1 Exchange
information with our trading partners in a:
timely manner .87 .96
SC_IQ2 accurate manner .92 SC_IQ3 complete manner .90 SC_IQ4 adequate manner .91 SC_IQ5 reliable manner .87
Construct Level Exploratory Factor Analysis:
To assess the discriminant validity, all 23 items of the SCM practices construct
were submitted to a construct level exploratory factor analysis. Six factors emerged from
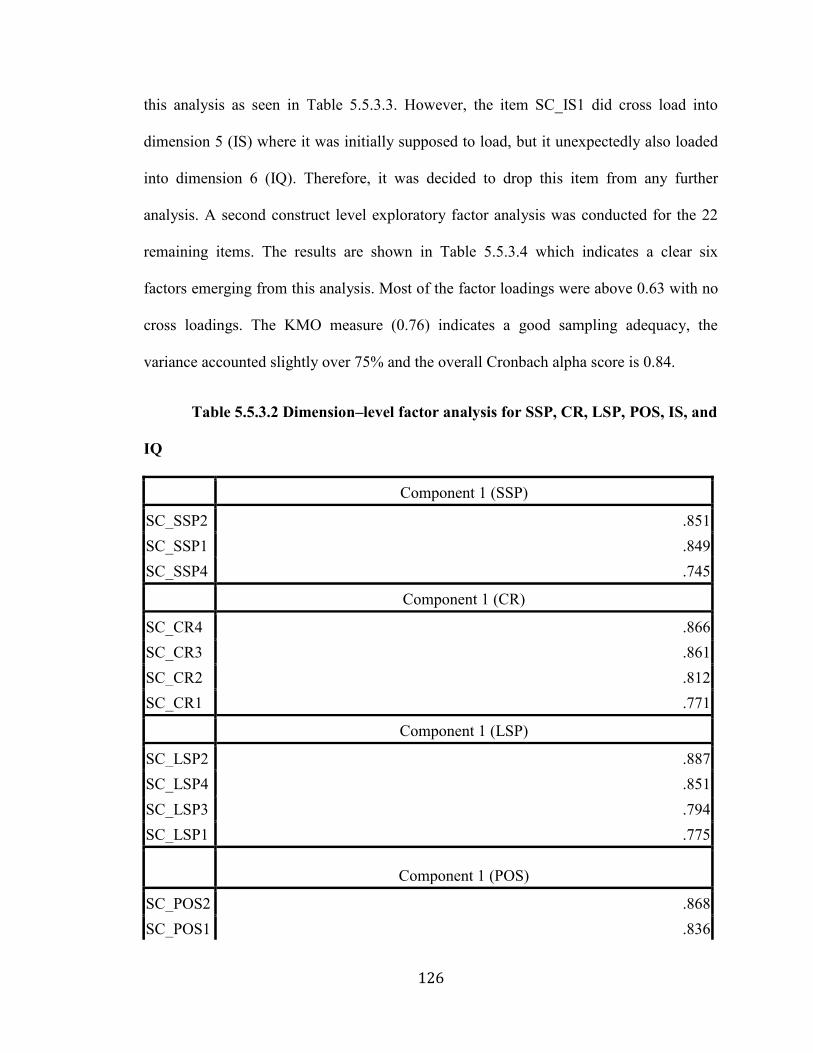
126
this analysis as seen in Table 5.5.3.3. However, the item SC_IS1 did cross load into
dimension 5 (IS) where it was initially supposed to load, but it unexpectedly also loaded
into dimension 6 (IQ). Therefore, it was decided to drop this item from any further
analysis. A second construct level exploratory factor analysis was conducted for the 22
remaining items. The results are shown in Table 5.5.3.4 which indicates a clear six
factors emerging from this analysis. Most of the factor loadings were above 0.63 with no
cross loadings. The KMO measure (0.76) indicates a good sampling adequacy, the
variance accounted slightly over 75% and the overall Cronbach alpha score is 0.84.
Table 5.5.3.2 Dimension–level factor analysis for SSP, CR, LSP, POS, IS, and
IQ
Component 1 (SSP)
SC_SSP2 .851 SC_SSP1 .849 SC_SSP4 .745
Component 1 (CR)
SC_CR4 .866 SC_CR3 .861 SC_CR2 .812 SC_CR1 .771
Component 1 (LSP)
SC_LSP2 .887 SC_LSP4 .851 SC_LSP3 .794 SC_LSP1 .775
Component 1 (POS)
SC_POS2 .868 SC_POS1 .836

127
SC_POS4 .712 SC_POS3 .684
Component 1 (IS)
SC_IS2 .930 SC_IS3 .887 SC_IS1 .787
Component 1 (IQ)
SC_IQ2 .951 SC_IQ4 .941 SC_IQ3 .940 SC_IQ1 .924 SC_IQ5 .911
Table 5.5.3.3 Supply chain management practices- construct level factor
analysis results
Component
1 2 3 4 5 6
SC_IQ2 .935
SC_IQ3 .925
SC_IQ4 .921
SC_IQ1 .893
SC_IQ5 .874
SC_LSP2 .885
SC_LSP4 .804
SC_LSP1 .751
SC_LSP3 .738
SC_CR4 .866
SC_CR3 .832
SC_CR2 .805
SC_CR1 .702

128
SC_POS2 .877
SC_POS1 .845
SC_POS4 .689
SC_POS3 .634
SC_IS2 .876
SC_IS3 .859
SC_IS1 .529 .575
SC_SSP2 .780 SC_SSP1 .777
SC_SSP4 .642
Table 5.5.3.4 Supply chain management practices- construct level factor
analysis results (2)
Component
1 2 3 4 5 6
SC_IQ2 .937
SC_IQ3 .928
SC_IQ4 .923
SC_IQ1 .897
SC_IQ5 .879
SC_LSP2 .885
SC_LSP4 .805
SC_LSP1 .751
SC_LSP3 .740
SC_CR4 .865
SC_CR3 .832
SC_CR2 .805
SC_CR1 .703
SC_POS2 .873
SC_POS1 .846
SC_POS4 .688

129
SC_POS3 .635
SC_SSP2 .789
SC_SSP1 .785
SC_SSP4 .633
SC_IS3 .879 SC_IS2 .872
Eigen Value
5.979 3.406 2.716 1.920 1.314 1.233
% Variance Explained
27.179 15.480 12.344 8.727 5.973 5.606
Cumulative % of Variance
27.179 42.658 55.002 63.729 69.702 75.308
Kaiser Mayer Orkin (KMO) Measure of sampling adequacy = 0.76
Cronbach Alpha (α) = 0.84
5.5.4 Information Technology Utilization
Purification of the items (Reliability)
Information Technology Utilization (ITU) was initially represented by three
dimensions and 15 items, and they are as follows: (1) External Focus on IT (EIT) (5
items), (2) Internal Focus on IT (IIT) (5 items), and finally (3) Infrastructural Focus on IT
(INFRA) (5 items) as well. The CITC scores indicated in Table 5.5.4.1 show that all
scores for all the CITC items are higher than 0.5 except for the following items (ITU_
IIT1, and ITU_ IIT2) for the IIT dimension. The CITC score for ITU_ IIT1 was very low
at 0.39. On the other hand, The CITC score for ITU_ IIT2 was .49 which is very close to
0.50. After carefully reviewing the item (ITU_ IIT1), (We improve processes inside our
firm by using IT to reduce manufacturing set-up time), it was decided to delete this items

130
for a low CITC score. After deleting this item, another reliability test was conducted for
the remaining four items. The results in Table 5.5.4.1 show that the CITC score for and
ITU_ IIT2 went down dramatically to 0.40 while the CITC score for the other three items
had minor changes in its scores. The Cronbach‟s alpha for (IIT) dimension did not
change from test 1 to test 2. Therefore, it was decided to delete item ITU_ IIT2 from any
further analysis. A third reliability test was conducted to the remaining three items. The
result in Table 5.5.4.1 indicates that all CITC scores are above .05 with a Cronbach‟s
alpha of 0.74. Finally, the CITC scores for the five items of the (INFRA) dimension are
well above .05 with a Cronbach‟s alpha of 0.96 which indicates an excellent reliable
scale.
Table 5.5.4.1 Information technology utilization - initial large scale survey
items, CITC results, and overall alpha score
Item Code Survey Item CITC-1
CITC-2
CITC-3
Alpha
External Focus on IT (EIT) .89
ITU _EIT1 We interact with our partners by using IT to:
Solve problems jointly with our suppliers
.78
ITU _ EIT2 Help our suppliers to improve their product quality
.66
ITU _ EIT3 Include our key suppliers in our planning and goal-setting activities
.73
ITU _ EIT4 Measure and evaluate customer satisfaction
.74
ITU _ EIT5 Facilitate customer service activities
.76
Internal Focus on IT (IIT)
ITU _ IIT1 We improve processes
Reduce manufacturing set-up time
.39 .74 ITU _ IIT2 Forecast demand .49 .40

131
ITU _ IIT3 inside our firm by using IT to
Design products for modular assembly
.54 .56 .59 ITU _ IIT4 Delay final product
assembly activities until customer orders have actually been received
.60 .57 .55
ITU _ IIT5 Store our parts/products at distribution points close to the customer
.54 .59 .55
Infrastructural Focus on IT (INFRA)
ITU_INFRA1
Inside our firm, our IT foundation (platforms, networks, and databases) facilitates
Communication and sharing of business knowledge of core business processes
.89 .96
ITU_INFRA2
Communication and exchange of timely information
.90
ITU_INFRA3
Communication and exchange of accurate information
.93
ITU_INFRA4
Communication and exchange of complete information
.91
ITU_INFRA5
Communication and exchange of adequate information
.84
Dimension Level Factor Analysis:
To validate the convergent validity of the dimensions in the Information
Technology Utilization (ITU) construct, dimension level factor analyses were conducted
for each of the three dimensions. Table 5.5.4.2 indicates a single-factor solution for the
five items for the EIT dimension with all factor loadings above 0.77. Sampling adequacy
(KMO) is very good at 0.81.

132
Table 5.5.4.2 Dimension–level factor analysis for EIT, IIT, and INFRA
Component (EIT)
1
ITU_EIT1 .870 ITU_EIT5 .854
ITU_EIT4 .844
ITU_EIT3 .830 ITU _EIT2 .774
Component (IIT)
1
ITU _IIT3 .827 ITU _IIT4 .803
ITU _IIT5 .800
Component (INFRA)
1
ITU _INFRA3 .957 ITU _INFRA4 .946
ITU _INFRA2 .936 ITU _INFRA1 .928 ITU _INFRA5 .899
The three remaining items of IIT were submitted to a dimension level factor
analysis and a clear one-factor solution emerged. All items had factor loadings above
0.80 and sampling adequacy (KMO) is acceptable at 0.69. Finally, the five items of
INFRA dimension were submitted to a dimension level factor analysis and a clear one-
factor solution emerged. All items had factor loadings above 0.89 and sampling adequacy
(KMO) is excellent at 0.90. The results of the dimension level factor analysis are
presented in Table 5.5.4.2.

133
Construct Level Exploratory Factor Analysis:
To further validate the discriminant validity of the dimensions in the Information
Technology Utilization (ITU) construct, dimension level factor analyses was conducted
for each of the three dimensions and the results are shown in Table 5.5.4.3. A clear three-
factor solution emerged for the (EIT, ITT, and INFRA). No cross-loadings were
observed, and all factor loadings have a value of 0.66 or greater. The variance explained
by the three factors accounts for 76% of the total variance and the KMO measure of 0.90
indicates an excellent sample adequacy. The reliability was also very high, with a
Cronbach alpha score of 0.89.
Table 5.5.4.3 Information technology utilization--construct level factor
analysis results
Component
1 2 3
UIT_INFRA4 .913
UIT_INFRA3 .898
UIT_INFRA2 .881
UIT_INFRA1 .869
UIT_INFRA5 .856
UIT_ETI4 .798
UIT_ETI5 .797
UIT_ETI1 .749
UIT_ETI3 .697
UIT_ETI2 .660
UIT_ITT3 .859
UIT_ITT4 .790
UIT_ITT5 .705

134
Component
1 2 3
UIT_INFRA4 .913
UIT_INFRA3 .898
UIT_INFRA2 .881
UIT_INFRA1 .869
UIT_INFRA5 .856
UIT_ETI4 .798
UIT_ETI5 .797
UIT_ETI1 .749
UIT_ETI3 .697
UIT_ETI2 .660
UIT_ITT3 .859
UIT_ITT4 .790
UIT_ITT5 .705 Eigen Value 6.706 2.242 .963
% Variance Explained
51.585 17.224 7.406
Cumulative % of Variance
51.585 68.829 76.235
Kaiser Mayer Orkin (KMO) Measure of sampling adequacy = 0.90 Cronbach Alpha (α) = 0.89
5.5.5 Supply Chain Management (SCM) Performance
Purification of the items (Reliability)
Supply Chain Management Performance (SCP) was initially represented by three
dimensions and 13 items, and they are as follows: (1) Supply Chain Flexibility (SCF) (6
items), (2) Supply Chain Integration (SCI) (4 items), (3) and Responsiveness to
Customers (RC) (3 items). A reliability analysis was done for each of the three

135
dimensions. The CITC score for all items were above the 0.50 threshold. The Cronbach‟s
alpha score for the three dimensions (SCF, SCI, and RC) are 0.86, 0.76, and 0.82
respectively. The results are presented in Table 5.5.5.1.
Table 5.5.5.1 Supply chain management performance - initial large scale
survey items, CITC results, and overall alpha score
Item Code
Survey Item CITC-1 Alpha
Supply Chain Flexibility(SCF) .86
SCP_SCF1
Our supply chain is able to
handle difficult nonstandard orders .68
SCP_SCF2
meet special customer specification .64
SCP_SCF3
produce products characterized by numerous features options, sizes and colors
.68
SCP_SCF4
rapidly adjust capacity so as to accelerate or decelerate production in response to changes in customer demand
.60
SCP_SCF5
rapidly introduce large numbers of product improvements/variation
.73
SCP_SCF6
handle rapid introduction of new products
.60
Supply Chain Integration (SCI) SCP_SCI1
There is a high level of communication and coordination between all functions in our firm
.60 .76
SCP_SCI2
Cross-functional teams are frequently used for process design and improvement in our firm
.52
SCP_SCI3
There is a great amount of cross-over of the activities of our firm and our trading partners
.59
SCP_SCI4
There is a high level of integration of information systems in our firm
.53
Responsiveness to Customers (RC)
SCP_RC1 Our firm fills customer orders on time .63 .82
SCP_RC2 Our firm has short order-to-delivery cycle time .71 SCP_RC3 Our firm has fast customer response time .73
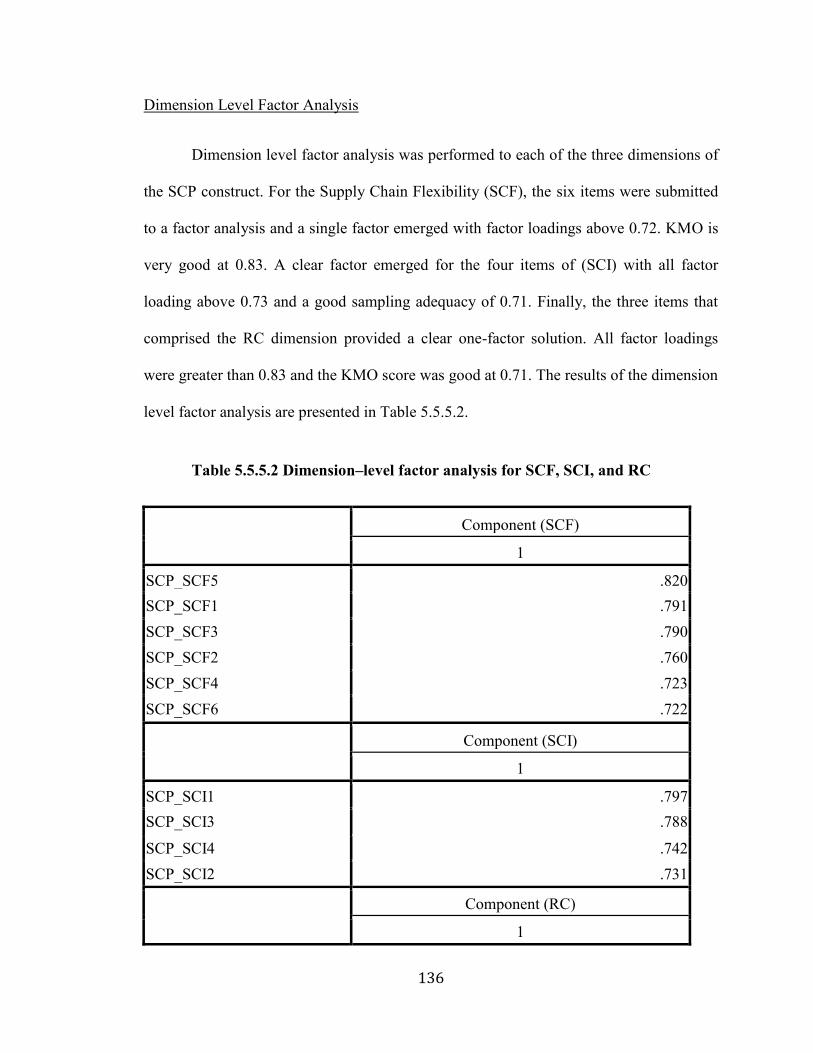
136
Dimension Level Factor Analysis
Dimension level factor analysis was performed to each of the three dimensions of
the SCP construct. For the Supply Chain Flexibility (SCF), the six items were submitted
to a factor analysis and a single factor emerged with factor loadings above 0.72. KMO is
very good at 0.83. A clear factor emerged for the four items of (SCI) with all factor
loading above 0.73 and a good sampling adequacy of 0.71. Finally, the three items that
comprised the RC dimension provided a clear one-factor solution. All factor loadings
were greater than 0.83 and the KMO score was good at 0.71. The results of the dimension
level factor analysis are presented in Table 5.5.5.2.
Table 5.5.5.2 Dimension–level factor analysis for SCF, SCI, and RC
Component (SCF)
1
SCP_SCF5 .820 SCP_SCF1 .791 SCP_SCF3 .790 SCP_SCF2 .760 SCP_SCF4 .723 SCP_SCF6 .722
Component (SCI)
1
SCP_SCI1 .797 SCP_SCI3 .788
SCP_SCI4 .742 SCP_SCI2 .731
Component (RC)
1
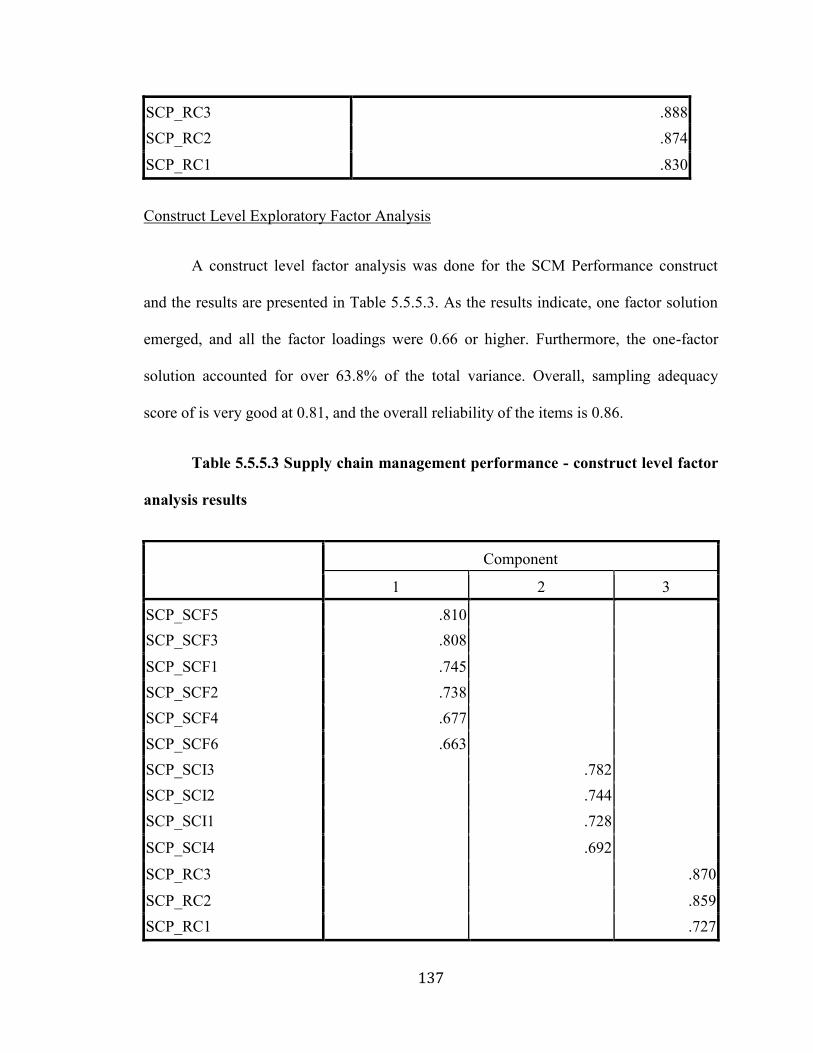
137
SCP_RC3 .888 SCP_RC2 .874
SCP_RC1 .830
Construct Level Exploratory Factor Analysis
A construct level factor analysis was done for the SCM Performance construct
and the results are presented in Table 5.5.5.3. As the results indicate, one factor solution
emerged, and all the factor loadings were 0.66 or higher. Furthermore, the one-factor
solution accounted for over 63.8% of the total variance. Overall, sampling adequacy
score of is very good at 0.81, and the overall reliability of the items is 0.86.
Table 5.5.5.3 Supply chain management performance - construct level factor
analysis results
Component
1 2 3
SCP_SCF5 .810
SCP_SCF3 .808
SCP_SCF1 .745
SCP_SCF2 .738
SCP_SCF4 .677
SCP_SCF6 .663
SCP_SCI3 .782
SCP_SCI2 .744
SCP_SCI1 .728
SCP_SCI4 .692
SCP_RC3 .870
SCP_RC2 .859 SCP_RC1 .727

138
Component
1 2 3
SCP_SCF5 .810
SCP_SCF3 .808
SCP_SCF1 .745
SCP_SCF2 .738
SCP_SCF4 .677
SCP_SCF6 .663
SCP_SCI3 .782
SCP_SCI2 .744
SCP_SCI1 .728
SCP_SCI4 .692
SCP_RC3 .870
SCP_RC2 .859 SCP_RC1 .727
Eigen Value 4.883 1.834 1.586
% Variance Explained 37.558 14.111 12.2
Cumulative % of Variance
37.558 51.670 63.869
Kaiser Mayer Orkin (KMO) Measure of sampling adequacy = 0.81 Cronbach Alpha (α) = 0.86
5.5.6 Firm Performance
Purification of the items (Reliability)
The Firm Performance (FP) construct is comprised of a single dimension and six
items. The CITC scores and the overall alpha score were calculated to assess the
reliability of this construct, and the results are shown in Table 5.5.6.1. Overall, the CITC
scores are all above 0.71 and the Cronbach alpha score of 0.92 shows high reliability of

139
the measures. Because this construct consisted of a single dimension, no dimension level
analysis was conducted.
Table 5.5.6.1 Firm performance--initial large scale survey items, CITC
results, and overall alpha score
Item Code
Survey Item CITC-1 Alpha
Firm Performance (FP)
FP1 Market Share .78 .92
FP2 Return on investment .79 FP3 The growth of market share .75 FP4 Growth in return on investment .81 FP5 Profit margin on sales .71 FP6 Overall competitive position .80
Construct Level Exploratory Factor Analysis
The results of the confirmatory factor analysis for the Firm Performance (FP)
construct are presented in Table 5.5.6.2. As seen in the table, a single-factor solution
emerged from the analysis, and all factor loadings had values of 0.79 or greater.
Furthermore, the KMO measure (0.82) indicated a very good result for this construct.
Overall, the single-factor solution accounted for almost 72% of the total variance, and the
final Cronbach alpha score is 0.92, indicating a very good internal consistency.

140
Table 5.5.6.2 Firm performance - construct level factor analysis results
Component
1
FP4 .872 FP6 .870 FP1 .861 FP2 .852 FP3 .831 FP5 .796
Eigen Value 4.31
% Variance Explained 71.827
Cumulative % of Variance 71.827
Kaiser Mayer Orkin (KMO) Measure of sampling adequacy = 0.82
Cronbach Alpha (α) = 0.92
5.6 Chapter Summary
Chapter 5 presented a rigorous empirical examination of all the constructs
considered in this research. The purpose of this chapter is to assess the measurement
model for each construct and its dimensions by reporting the convergent validity,
reliability, discriminant validity for each construct (SCM strategy, ISS, SCM practices,
IT utilization, SCM performance, and Firm Performance). From the 89 items that were
considered in this chapter, nine items were deleted and 80 are kept for further analysis.
Table 5.6.1 presents a summary of the results of construct level analysis. As indicated by
this table, all constructs have alpha score of 0.82 or above and KMO scores of 0.76 and
above, indicating the high reliability and sampling adequacy of the constructs. Table
5.6.2 presents a summary of the results of dimensional level analysis.

141
Table 5.6.1 Summary-large scale analysis results (construct level)
Construct Level Results # of dimensions alpha KMO
SCM Strategies 3 0.82 0.78
ISS 3 0.82 0.89
SCM Practices 6 0.84 0.76
IT Utilization 3 0.89 0.90
SCM Performance 3 0.86 0.81
Firm Performance 1 0.92 0.82
Table 5.6.2 Summary-large scale analysis results (dimensional level)
Dimensional Level Results # of items alpha KMO
Lean Supply Chain (LSC) 6 0.82 0.74 Agile Supply Chain (ASC) 2 0.81 0. 56 Hybrid Supply Chain (HSC) 5 0.93 0.88 IS for Efficiency (ISSE) 5 0.89 0.85 IS for Flexibility (ISSF) 4 0.88 0.80 IS for Comprehensiveness (ISSC) 4 0.94 0.87 Strategic Supplier Partnership (SSP) 3 0.74 0.67 Customer Relationship (CR) 4 0.85 0.81 Lean System Practices (LSP) 4 0.84 0.78 Postponement (POS) 4 0.78 0.72 Information Sharing(IS) 2 0.85 0.65 Information Quality(IQ) 5 0.96 0.90 External Focus of IT (EIT) 5 0.89 0.81 Internal Focus of IT (IIT) 3 0.74 0.69 Infrastructural Focus of IT (INFRA) 5 0.96 0.90 Supply Chain Integration (SCI) 4 0.86 0.71 Supply Chain Flexibility (SCF) 6 0.72 0.72 Customer Responsiveness (CR) 3 0.82 0.71 Market and Financial Performance 6 0.92 .082
80 Total Items

142
Chapter 6
Causal Model and Hypotheses Testing
In this chapter, the proposed relationship between the model variables is going to
be tested. Structural equation modeling (SEM) framework will be used to test the ten
hypotheses proposed in Chapter 3.
In general, SEM is composed of two parts: 1) The measurement model, and 2) the
structural model. The measurement model in SEM is used to specify the indicators of
each construct and assess the reliability and validity of each construct. On the other hand,
the structural model is used to study the complex interrelations among variables
(Joreskog and Sorbom, 1977). Since each construct has been validated and checked for
reliability through rigorous analysis in Chapter 5, the SEM model described in this
chapter will focus on the path analysis using SMART Partial Least Square (PLS)
software.
Chin et al. (2003) argue that using PLS to test the interaction (moderating) effects
among variables without taking the composite score of each sub-construct will provide
better and presumably more accurate path estimates than creating a composite score and
using multiple regressions. Since this research is dealing with the interaction effects
(moderating alignment) of ISS and SCM strategy and of utilization and SCM practices,
this study will not use the composite score of the sub-constructs to build the structural

143
model. Instead, each SCM strategy (lean, agile, and hybrid) will be tested separately with
its corresponding ISS (IS for efficiency, IS for flexibility and IS for comprehensiveness)
to test the impact of aligning (moderating effect) these strategies on SCM performance
and firm performance. These relationships are depicted in Model 1 Figure 6.1.1. The
same goes for SCM practices; each pair of SCM practices will be tested separately with
its corresponding IT usage to test for the effect of their alignment (moderating effect) on
SCM performance and firm performance. These relationships are depicted in Model 2
Figure 6.1.2. The proposed structural model (for Model 1 and Model 2) is going to be
explained in section 6.1. In section 6.2, SEM results using PLS are presented, and
discussed in section 6.3. Finally, a revised model will be presented in section 6.4 to
discuss some new and alternative relationships for the unsupported hypotheses.
6.1 The Proposed Structural Model
In PLS, the strength of the relationship proposed earlier will be tested and
analyzed through the values of T-statistic, standardized path (Beta coefficient) and R2.
Statistical level of T-value indicates the significant level of a relationship. A
bootstrapping procedure is used to generate t-statistics. On the other hand, standardized
path (Beta coefficient) indicates the strength of the relationship. Finally, R2 examines the
impact of independent variables on dependent variables (Chin, 1998a and Chin, 1998b).
PLS algorithm procedure using path weighting scheme technique is used to calculate both
the standardized coefficient (Beta coefficient) and R2.
In this research, two research models are proposed to test the 10 hypotheses
discussed in chapter 3, the two research models are described below.

144
Model 1 (The alignment at the planning/strategic level):
The proposed structural model is depicted in Figure 6.1.1. In this model, the three
hypotheses (H1a, H1b, and H1c) will be tested. This model will look at the three types of
SCM strategies (lean, agile, and hybrid) and tests how aligning (as moderator) these SCM
strategies with three types of IS strategies (IS for efficiency, flexibility, and
comprehensiveness) would enhance SCM performance and firm performance. In
particular, H1a will test how IS for efficiency will interact with (moderate) the
relationship between a lean supply chain and SCM performance to have better SCM
performance measured by supply chain integration. Similarly, H1b will test the
moderating effect of IS for flexibility on the relationship between an agile supply chain
and supply chain flexibility. Finally, H1c will test the moderating effect of IS for
comprehensiveness on the relationship between a hybrid supply chain strategy and
customer responsiveness. Testing the three hypotheses will address research question 1
which is stated earlier in Chapter 1 (Can the alignment at the planning/strategic level
(SCMS with ISS) have a positive impact on SCM performance and firm performance?)

145
Figure 6.1.1 Proposed structural model (model 1)
LSC: Lean Supply Chain ISSC: IS for Comprehensiveness ASC: Agile Supply Chain SCI: Supply Chain Integration HSC: Hybrid Supply chain SCF: Supply Chain Flexibility ISSE: IS for Efficiency CR: Customer Responsiveness ISSF: IS for Flexibility FP: Firm Performance
Model 2 (The alignment at the practice/operational level):
The proposed structural model is depicted in Figure 6.1.2. This model will test the
remaining seven hypotheses (H2a, H2b, H2c, H3a, H3b, H3c, and H4). Thus, this model
will look at six SCM practices and align them with the corresponding IT usage and test
their impact on SCM performance and firm performance. In particular, H2a will test how
the external usage of IT will interact with (moderate) the relationship between two SCM
practices (strategic supplier partnership and customer relationship), and SCM

146
performance to have better SCM performance. H2b will test how the moderating effect of
internal usage of IT on the relationship between two SCM practices (lean practices and
postponement), and SCM performance to have better SCM performance. Finally, H2c
will test the moderating effect of IT infrastructure on the relationship between two SCM
practices (information quality and information sharing), and SCM performance to have
better SCM performance. In hypotheses (H2a, H2b, and H2c), SCM performance is
measured by the three performance measurements (SCI, SCF and CR) taken together at
the same time. By doing this, we will also measure the direct impact of SCM practices on
SCM performance which is captured by (H3a, H3b, and H3c). Finally, H4 will measure
how SCM performance impacts firm performance. The seven hypotheses should address
research question 2 from my introduction section (Can the alignment at the
practice/operational level (SCM practices with the usage of IT) have a positive impact on
SCM performance and firm performance?)
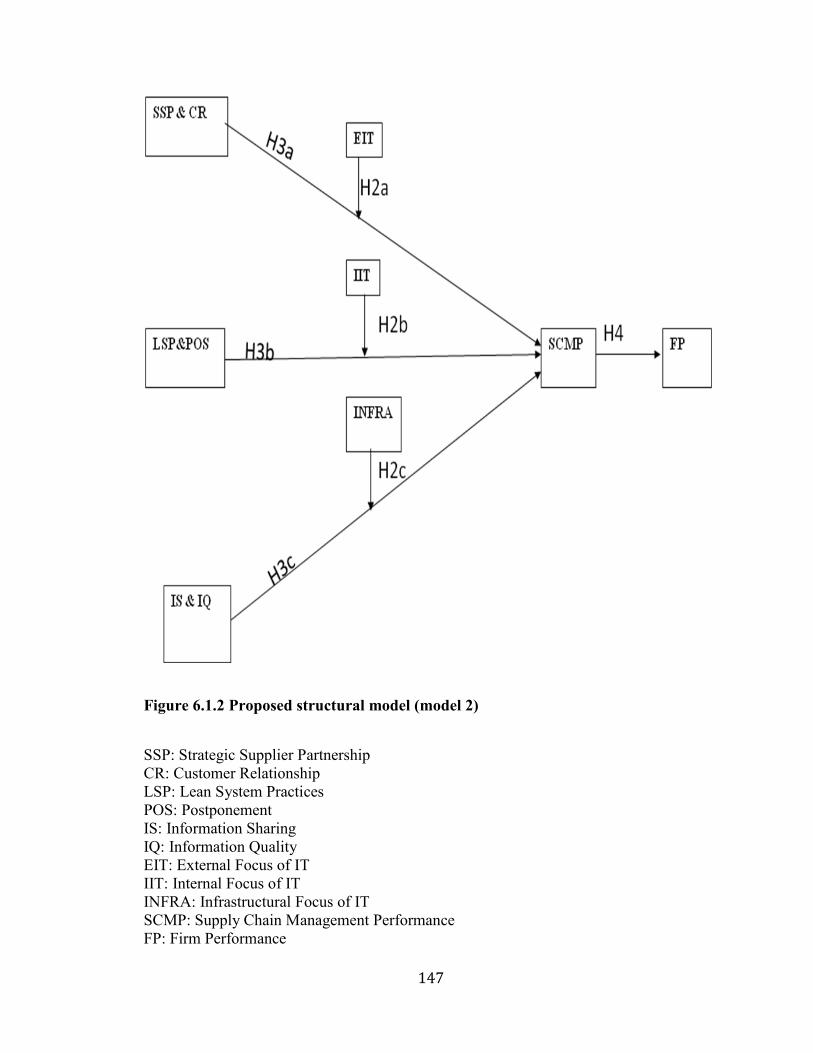
147
Figure 6.1.2 Proposed structural model (model 2)
SSP: Strategic Supplier Partnership CR: Customer Relationship LSP: Lean System Practices POS: Postponement IS: Information Sharing IQ: Information Quality EIT: External Focus of IT IIT: Internal Focus of IT INFRA: Infrastructural Focus of IT SCMP: Supply Chain Management Performance FP: Firm Performance

148
6.2 Structural Equation Model Results Using PLS
Figure 6.2.1 display the results (the t coefficient) of Model 1 resulting from the
structural equation modeling (SEM) using SMART PLS. Of the 3 Hypotheses (H1a, H1b,
and H1c) proposed in Model 1, two of the hypotheses are significant (H1a, and H1c),
whereas H1b is not significant. The detailed findings of the SEM for Model 1 are
presented in Table 6.2.1.
*Figure 6.2.1 Results of initial structural model (model 1)
* Note: The items for each construct was hidden for simplicity purposes only
H1a
H1b
H1c

149
Table 6.2.1 Initial PLS structural equation modeling results (model 1)
Hypothesis Relationship Type Beta-
Coefficient
T-Coefficient Significant
H1a LSC*ISSE Moderation .182 2.255 Yes
H1b ASC*ISSF Moderation .169 1.221 No
H1c HSC*ISSC Moderation .151 3.091 Yes
For Model 2, the (t coefficient) results from SEM are displayed in Figure 6.2.2.
Of the seven hypotheses proposed, six of them are significant and they are (H2a, H2c,
H3a, H3b, H3c, and H4). The other hypothesis (H2b) is not significant. The results of
SEM for Model 2 are presented in Table 6.2.2. The detailed discussion of each
hypothesis is provided in the next section (section 6.3).

150
*Figure 6.2.2 Results of initial structural model (model 2)
*Note: The items for each construct were hidden for simplicity purposes only
Table 6.2.2 Initial PLS structural equation modeling results (model 2)
Hypothesis Relationship Type Beta-Coefficient T-Coefficient Significant
H2a SSP&CR*EIT Moderation 1.59 2.255 Yes
H2b LSP&POS*IIT Moderation .095 1.221 No
H2c IS&IQ*INFRA Moderation .131 3.091 Yes
H3a SSP&CR-SCP Direct .135 3.315 Yes
H3b LSP&POS-
SCP
Direct .123 3.855 Yes
H3c IS&IQ-SCP Direct .129 3.804 Yes
H4 SCP-FP Direct .182 4.677 Yes
H2a
H2b
H2c
H4
H3a
H3b
H3c

151
6.3 Discussion of Structural Equation Model and Hypothesis Testing Results
From Model 1:
H1a: The impact of a lean supply chain on supply chain management performance
(as measured by supply chain integration) is positively moderated by IS for
efficiency
The result of this hypothesis is found to be significant (t coefficient = 2.255). The
R2 of SCM performance (supply chain integration) = 0.356 indicates a good amount of
variance explained by the mode. This indicates that IS for efficiency moderates the
relationship between a lean supply chain and supply chain performance measured by
supply chain integration. Furthermore, the direct impact of a lean supply chain on supply
chain integration (direct relationship) is found to be significant (t coefficient = 5.012).
Also, the direct impact of supply chain integration on firm performance is significant (t
coefficient = 3.328). What does this mean?
This means that at the strategic planning level IS should support and enhance the
long-term objectives and goals of SCM. In particular, if a focal firm is planning to cut its
cost by creating the most cost efficiency in its supply chain (i.e. Wal-Mart), then the firm
should also plan and invest in IT to support and enable implementing its lean supply
chain (LSC) strategy. The fit (interaction) between these two strategies will result in
having better supply chain integration which helps the focal firm to reduce its cost and be
more efficient. In other words, acquiring specific IS applications that help firms manage,
coordinate, and improve production and information sharing will result in better
communication and coordination between firms and their suppliers. This alignment

152
between LSC and ISS for efficiency will result in better supply chain integration which
could not only benefit the suppliers, but also help the firm to achieve its market and
financial goals.
H1b: The impact of an agile supply chain on supply chain management
performance (as measured by supply chain flexibility) is positively moderated by IS
for flexibility
The relationship for hypothesis 1b is found to be non significant (t coefficient =
1.2). The R2 of supply chain flexibility is equal to 0.204. The result of this hypothesis
indicates that IS for flexibility does not moderate the relationship between an agile supply
chain (ASC) and supply chain performance measured by supply chain flexibility. The
findings suggest that for those firms, acquiring IS applications for flexibility does not
enhance the ability to execute its supply chain agility strategy, and therefore does not
help in improving the flexibility of its supply chain. This shows that firms may be lacking
the understanding of how to manage the applications that provide flexibility, in their
pursuit of supply chain flexibility. In other words, firms that acquire an IS application for
flexibility without understanding and analyzing whether this application truly fits the
requirements of their agility supply chain strategy or how to manage the implementation
of the application will not see the benefits of ASC - IS for flexibility alignment for their
supply chain performance. As a good example, when Nike acquired supply chain
software from i2 Technologies to help in its agility distribution strategy, Nike moved too
quickly into this new technology without analyzing, observing and monitoring the market
and without appropriately managing the adoption of the software. In the case of Nike,
they had a mismatch between the management and implementation of IS application and
153
its supply chain agility strategy which resulted in a $100 million loss in their revenue
(Smith, 2001, McLaren et al., 2004, Sabherwal and Chan, 2001). An alternative
relationship will be discussed later in section 6.4.
H1c: The impact of a hybrid supply chain on supply chain management
performance (as measured by customer responsiveness) is positively moderated by
IS for comprehensiveness
The relationship for hypothesis 1c is found to be significant (t coefficient = 3.091)
and R2= 0.08. The result of this hypothesis indicates that IS for comprehensiveness
moderates the relationship between a hybrid supply chain (HSC) and supply chain
performance measured by customer responsiveness.
The result suggests that having an ISS that enables comprehensive decisions and
quick responses will positively interact with the supply chain strategy that emphasizes
achieving mass customization and responsiveness; this interaction will result in better
customer satisfaction. Achieving mass customization which is based on assemble-to-
order strategy and which also can be achieved by producing a modular design requires
responsiveness in understanding and monitoring the market to seek any opportunity to
introduce new products. At the strategic level therefore, planning for IS to support
comprehensive and quick decisions will enhance the ability of the focal firm to execute a
hybrid (assemble-to-order) strategy, and will result in better understanding of customer
requirements. This would lead firms to maximize any opportunities they are seeking for
market and financial growth.

154
The statistical results shows that ISS for comprehensiveness moderates the
relationship between a hybrid supply chain strategy (HSC) and customer responsiveness
(CR), even though the direct impact of HSC on CR is not significant (t coefficient
=0.712).
From Model 2:
H2a: The impact of strategic supplier partnerships and customer relationships on
SCM performance is positively moderated by external focus of IT
The result of this hypothesis is found to be significant (t coefficient = 3.637). This
indicates that for a focal firm, utilizing IT externally to formulate and improve the
planning processes of building long term relationships with suppliers and customers will
enable faster response from suppliers, better understanding of customer needs, and better
integration of activities between the focal firm, its suppliers, and its customers. A good
example of this is when Wal-Mart used satellite communication systems to send point-of-
sale (POS) data to all its vendors so that they could have a clear picture of all the sales in
all of Wal-Mart stores; by sharing this information, suppliers can ship products more
quickly to Wal-Mart which reduces the need for safety stock and cuts its cost. This means
that utilizing IT externally to support and enhance the supply chain practices of strategic
supplier partnerships and customer relationships will result in better SCM performance
and firm performance. Furthermore, the direct impact of strategic supplier partnerships
and customer relationships (direct relationship) on SCM performance is found to be
significant (t coefficient = 3.315) which is going to be discussed later in hypothesis 3a.

155
H2b: The impact of internal lean practices and postponement on SCM performance
is positively moderated by internal focus of IT
The relationship for hypothesis 2b is found to be non-significant (t coefficient =
0.862). This indicates that utilizing IT internally does not moderate the relationship
between internal lean practices and postponement, and SCM performance. The findings
suggest that for those firms, using IT internally does not enhance the ability of the supply
chain to eliminate waste and implement postponement practices, and therefore does not
help in improving the supply chain performance. However, eliminating waste and
implementing postponement strategy will improve the overall performance of the supply
chain (the direct relationship is found to be significant; t=3.855). This will be discussed
later in hypothesis 3b.
One reason why utilizing IT internally does not moderate the relationship between
internal lean practices and postponement, and SCM performance is that the amount of
information processing and communication between the firm and suppliers, and among
suppliers must match the level of IT used to improve internal processes such as
eliminating waste and increasing mass customization (that are associated with lean and
postponement respectively). Thus, internal IT utilization alone may not be sufficient in
positively moderating the effect of lean practices and postponement on SCM
performance, but that more complete integration of resources and collaboration across the
supply chain may be required. This is not really easy to achieve. This could explain why
using IT internally does not enable the execution of those practices and therefore the
interaction (moderating alignment) does not help in improving the supply chain
performance and firm performance.

156
H2c: The impact of information sharing and information quality on SCM
performance is positively moderated by infrastructural focus of IT
The result of this hypothesis is found to be significant (t coefficient = 2.029). This
indicates that IT infrastructure will enhance the ability of organizations to share quality
information in its supply chain. Having the right IT infrastructure to share information
enables the supply chain to have access to any data which allows firms to better
collaborate with other supply chain partners and respond more quickly to customers‟
demands. In other words, if the systems‟ capabilities in focal firms are compatible with
the type of information they need to share with their suppliers, then this will facilitate
information sharing and data communication among members of the supply chain. As a
result, this will increase the ability of supply chains to react quickly and effectively to
sudden changes in the market, and therefore respond faster to customers‟ requirements
which will benefit not only the supply chain, but also the firm as well. Additionally, the
direct impact of information sharing and information quality (direct relationship) on SCM
performance is found to be significant (t coefficient = 3.804) which is going to be
discussed later in H3c.
H3. SCM practices are positively associated with SCM performance
H3a: Strategic supplier partnerships and customer responsiveness are positively
associated with SCM performance.
H3b: Internal lean practices and postponement are positively associated with
SCM performance.

157
H3c: Information sharing and information quality are positively associated with
SCM performance.
The result of the hypotheses (H3a, H3b, H3c) are found to be significant (t
coefficient = 3.315, 3.885, and 3.804) respectively. The R2 of 0.547 shows a good
amount of variance explained by the mode. The results of these hypotheses confirm the
empirical conclusions and theoretical justifications found by other researches (Shin et al.,
2000; Narasimhan and Jayaram 1998; Tan et al., 1998) which suggest that well managed
supply chain practices lead to better SCM performance. In other words, forming
partnerships with other suppliers and managing interactions with customers could benefit
the focal firm to reduce its level of inventory (cost savings) and better serve its
customers. Also, sharing quality information about inventory levels, orders, production,
and delivery status through the supply chain will enable the focal firm to react quickly to
changes in customers‟ demand. Finally, elimination of waste and non-value activities in
the supply chain will enable the focal firm to operate with more efficiency.
H4. SCM performance is positively associated with firm performance
The result of this hypothesis is found to be significant (t coefficient = 4.667 and
R2 = 0.33). Numerous studies have shown that well managed and well executed SCM
practices will directly improve firm performance (Shin et al., 2000; Prasad and Tata,
2000; Tan et al., 1998; Tan, 2002). Since SCM practices lead to better SCM performance
(H3), we can conclude that a better SCM performance will result in a better firm
performance. So, for instance, if the supply chain is able to respond effectively and react
quickly to changes in the market, then the firm will benefit from this by improving its

158
competitive advantage through price, quality, and delivery (Li et al., 2006) which enables
the firm to achieve its market and financial goals.
6.4 Revised Structural Model
The non-significant relationships for the two hypotheses (H1b in model 1, and
H2b in model 2) will be re-analyzed and discussed through a revised structural model.
The revised model will contain only the two hypotheses (H1b, and H2b) that were not
significant with a mediating relationship instead of moderating relationship. This
mediating relationship will capture the concept of alignment “fit” at the strategic and
operation levels.
Venkatraman (1989b) identifies six perspectives of fit as mentioned earlier in
section 3.2, chapter 3. One of the six types of alignment is fit as mediation. According to
Venkatraman (1989b), fit as mediation is simply viewed as direct vs. indirect effect of
variables. In other words, the fit as mediation between two variables (SCM strategy and
SCM performance) is determined by their direct relationship as well as through the
indirect effect of a third variable (ISS). This implies that if the presence of the ISS is
necessary to influence the effect of SCM strategy on SCM performance, then ISS is
called a complete mediator. However, if the direct relationship between SCM strategy
and SCM performance exists and an indirect effect of ISS between SCM strategy and
SCM performance also exists, then ISS is considered as a partial mediator. This means
that at the strategic level, the alignment will exist if 1) a firm acquired an IS application
(e.g. IS for flexibility) to support the objective of the ASC to have better SCM
performance and subsequent to this acquisition, the ACS strategy would not have any

159
direct effect on performance. Or 2) if a firm acquired an IS application (IS for flexibility)
to support the objective of the ASC to have better SCM performance and subsequent to
this acquisition, the ACS strategy would still have direct effect, as well as an indirect
effect mediated by the ISS, on performance. This conceptualization is somewhat different
from the moderating alignment concept.
Mediating alignment at the strategic level will be captured by the revised Model
1.1. The same concept will be applied at the operational level, with the alignment
between SCM practices (internal lean practices and postponement) and internal usage of
IT and on SCM performance. This is going to be captured by the revised Model 2.1.
Revised Model 1.1 (The alignment at the planning/strategic level):
The proposed structural model is depicted in Figure 6.4.1. In this model, only the
revised hypothesis H1b will be tested. H1b will test the mediating effect of IS for
flexibility between ASC and supply chain flexibility.
Revised H1a: The impact of a lean supply chain on supply chain management
performance (as measured by supply chain integration) is positively mediated by IS for
efficiency.
Revised H1b: The impact of an agile supply chain on supply chain management
performance (as measured by supply chain flexibility) is positively mediated by IS for
flexibility.
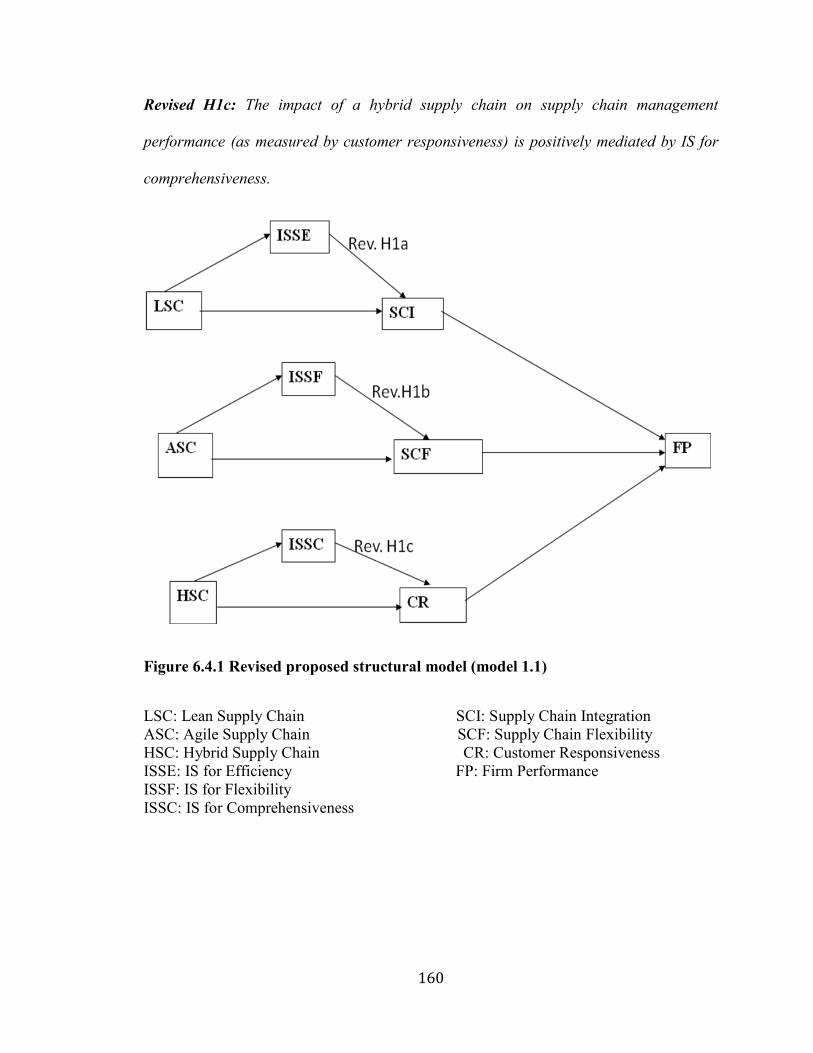
160
Revised H1c: The impact of a hybrid supply chain on supply chain management
performance (as measured by customer responsiveness) is positively mediated by IS for
comprehensiveness.
Figure 6.4.1 Revised proposed structural model (model 1.1)
LSC: Lean Supply Chain SCI: Supply Chain Integration ASC: Agile Supply Chain SCF: Supply Chain Flexibility HSC: Hybrid Supply Chain CR: Customer Responsiveness ISSE: IS for Efficiency FP: Firm Performance ISSF: IS for Flexibility ISSC: IS for Comprehensiveness

161
Revised Model 2.1 (The alignment at the practice/operational level):
Similar to Figure 6.4.1., the proposed structural model is depicted in Figure 6.4.2
will test the revised hypothesis H2b with a mediating, instead of moderating, relationship.
Hypotheses (H3a, H3b, H3c, and H4) will have the same hypotheses as stated in chapter
3. Only the revised H2b will be discussed in this section. H2b will test the mediating
effect of the internal use of IT on the relation between internal lean practices and
postponement on SCM performance.
Revised H2a: The impact of strategic supplier partnerships and customer relationships
on SCM performance is positively mediated by an external focus of IT.
Revised H2b: The impact of internal lean practices and postponement on SCM
performance is positively mediated by an internal focus of IT.
Revised H2c: The impact of information sharing and information quality on SCM
performance is positively mediated by an infrastructural focus of IT.

162
Figure 6.4.2 Revised proposed structural model (model 2.1)
SSP: Strategic Supplier Partnership CR: Customer Relationship LSP: Lean System Practices POS: Postponement IS: Information Sharing IQ: Information Quality EIT: External Focus of IT IIT: Internal Focus of IT INFRA: Infrastructural Focus of IT SCMP: Supply Chain Management Performance FP: Firm Performance

163
6.5 Discussion of Revised Structural Equation Model and Hypothesis Testing
Results
Revised Model 1.1:
Revised H1b: The impact of an agile supply chain on supply chain management
performance (as measured by supply chain flexibility) is positively mediated by IS
for flexibility
Figure 6.5.1 indicates that the relationship for the revised H1b is found to be
significant (t coefficient = 7.008). The R2 of supply chain flexibility is equal to 0.189.
The result of this hypothesis indicates that IS for flexibility partially mediates the
relationship between ASC and SCM performance measured by supply chain flexibility.
The findings suggest that acquiring IS applications for flexibility introduces an indirect
effect between ASC and supply chain flexibility, through IS for flexibility. This means
that IS for flexibility is a partial mediator for the relationship between ASC and Supply
Chain flexibility. That is, acquiring IS for flexibility enhances the ability of the focal firm
with an agile supply chain to sense any changes in the market which allows it to react
quickly to those changes, increasing supply chain flexibility. However, there is also a
direct effect from ASC to supply chain flexibility, indicating that even without acquiring
applications that enhance flexibility there is some measure of supply chain flexibility that
is possible from ASC. Thus, acquiring an ISS for flexibility in a focal firm will indirectly
support agility by enhancing the supply chain‟s ability to sense and respond quickly and
effectively to changes in the market (Overby et al., 2006).
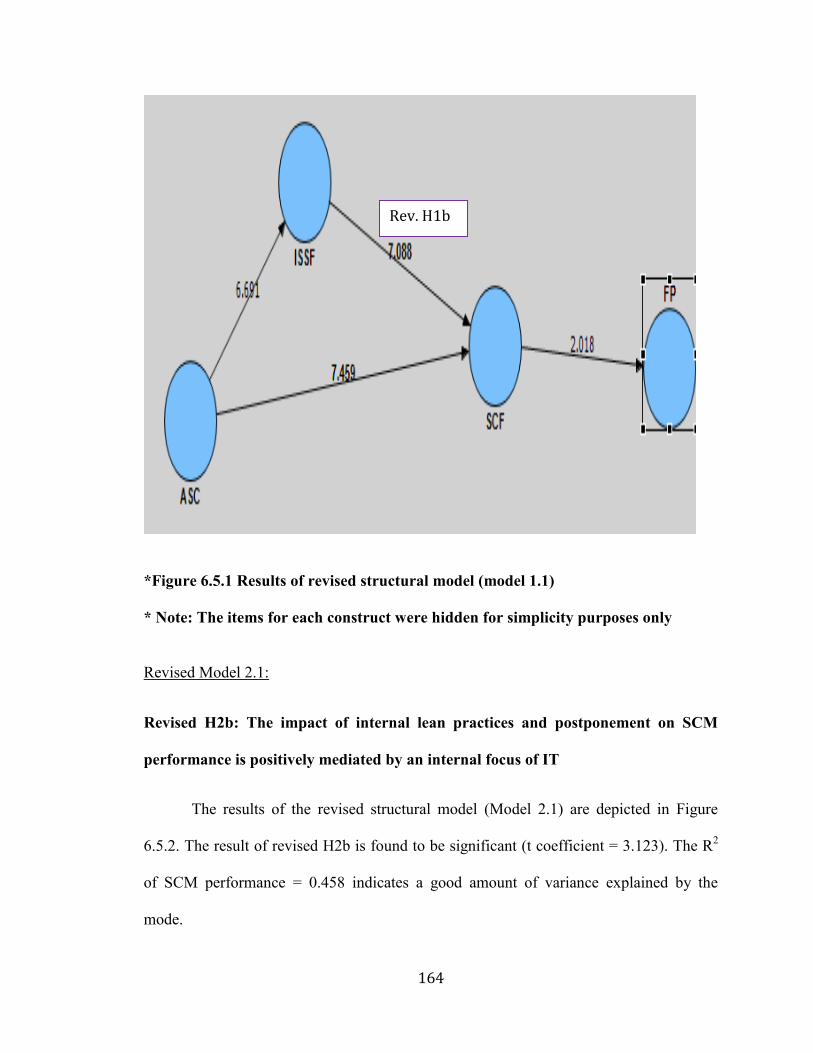
164
*Figure 6.5.1 Results of revised structural model (model 1.1)
* Note: The items for each construct were hidden for simplicity purposes only
Revised Model 2.1:
Revised H2b: The impact of internal lean practices and postponement on SCM
performance is positively mediated by an internal focus of IT
The results of the revised structural model (Model 2.1) are depicted in Figure
6.5.2. The result of revised H2b is found to be significant (t coefficient = 3.123). The R2
of SCM performance = 0.458 indicates a good amount of variance explained by the
mode.
Rev. H1b

165
*Figure 6.5.2 Results of revised structural model (model 2.1)
* Note: The items for each construct were hidden for simplicity purposes only
The result of this hypothesis indicates that using IT internally fully mediates the
relationship between lean and postponement practices and SCM performance. In other
words, using IT internally is necessary to execute lean and postponement practices.
Bruun and Mefford (2004) argue that internal IT usage facilitates and allows lean
production concepts to be more fully applied. They provided a case study to demonstrate
how using IT can help in executing postponement and JIT practices. For instance, Dell
allows its customers to place an order and customize their PCs electronically. Once an
order is placed, Dell will transmit this order for the appropriate facility to start the
Rev. H2b

166
production. The suppliers will access this information, adjust their production schedules,
and plan ahead for the component needed for production. Sharing this information with
suppliers will allow the focal firm to be more responsive to customers‟ demand. This
clearly shows that for a focal firm, using IT internally increases the internal efficiency of
the firm through internal integration with their suppliers and customers. This internal
integration is essential to improve internal process i.e. enables the execution of lean and
postponement practices which results in better SCM and firm performances. Ilebrand et
al. (2010) provided an example of a bank to demonstrate the importance of using IT
internally to enable lean execution. They argue that poor IT integration and fragmented
oversight of IT in the bank meant manual entries, overlapping requirements, and high
volumes of paperwork. Poor IT integration resulted in higher costs for the bank, and
frustrated potential customers, which resulted in failure of the lean program they
implemented.
6.6 Summary of Results
Overall, the results indicate that at a strategic level, aligning SCM strategy with
an ISS strategy will result in a better SCM performance and firm performance. At the
operational level, aligning SCM practices with the usage of IT will improve SCM
performance and firm performance. According to the SEM results, six of the eight
hypotheses were supported using the concept of moderating alignment (interaction) at the
strategic and operational level. The two unsupported hypotheses were tested using
mediating alignment (direct vs. indirect). The results suggest that at the strategic level
(through an indirect relationship), aligning SCM strategies with ISS enhances their
effectiveness and results in a superior supply chain and firm performance. At the

167
operational level (through an indirect relationship), aligning SCM practices with
corresponding IT usages enhances the success of those practices and their effect on
supply chain and firm performance. The following chapter (Chapter 7) concludes with
the interpretations of the research findings and major contributions, managerial
implications, limitations of the research, and recommendations for future research.

168
Chapter 7
Summary and Recommendations for Future Research
This chapter provides (1) summary and interpretation of the research findings and
major contributions, (2) implications for practitioners, (3) limitations of the research, and
finally (4) recommendations for future research.
7.1 Summary and Interpretation of Findings
Many organizations believe that effective SCM is the key to building and
sustaining competitive advantage in the market. To effectively manage their supply
chains, organizations need to adopt appropriate SCM strategies and practices. The
research shows that in order to do so, there is a need to integrate IS into the supply chain.
This integration should be done by matching IS applications that support and enhance a
given SCM strategy (the alignment at the planning/strategic level), and also by
corresponding use of appropriate IT with particular SCM practices (the alignment at the
practice/operational level).
This research is one of the first large-scale empirical studies to explore the
moderating alignment at two levels between SCM and IS, and the impact of this
alignment on supply chain performance and firm performance. First, the research looks at
different SCM strategies and assesses appropriately-aligned information strategies that

169
would enhance their effectiveness by positively influencing SCM performance and firm
performance. Second, it looks at SCM practices and identifies corresponding IS usage
that enhances the execution of those SCM practices positively, and thus improves SCM
performance and firm performance. Based on the data collected from 205 supply chain
managers/directors and purchasing managers/directors, the research hypotheses are tested
using the structural equation modeling methodology. The result of this study contributes
to our knowledge of SCM and IS in many ways.
First, this research provides a theoretical framework for a contingency-based
approach for understanding how the alignment between supply chain strategies and IS
strategies impacts SCM performance and firm performance, and how alignment between
SCM practices and usage of IT impacts SCM performance and firm performance. We
used the moderating and mediating definitions of alignment. This research framework
provides a foundation for future research to test this model with different types of
alignments such as fit as gestalts, fit as profile deviation, and fit as covariation.
Second, this research makes a contribution in the IS domain as well as the SCM
domain. In the IS domain, this research looks at specific ways in which IS can support
and enhance supply chains by understanding specific alignments at the strategic and
usage levels, thus extending the IT alignment literature. In the SCM domain, this research
demonstrates that 1) SCM strategies require corresponding IS strategies to be effective,
and 2) that in order for SCM practices to be effectively executed, they require the
presence of appropriate IT usage.

170
Third, the research develops and validates reliable measures for the following
constructs: (1) supply chain management strategy (SCMS), (2) information systems
strategy (ISS), (3) information technology (IT) utilization, (4) the alignment between
SCMS and ISS, and (5) the alignment between SCM practices and the usage of IT. All
measurements have been tested through a rigorous statistical process, which included a
pilot test, factor analysis (construct and dimensional levels analysis), reliability,
convergent validity, and discriminant validity. This will allow researchers to use and
build on these measurements in their future research.
Fourth, the results from the structural model indicate several important
relationships at the strategic level. The outcome of this study suggests that aligning SCM
strategy with ISS strategy will result in better SCM performance and firm performance.
This means that IS should support and enhance the long-term objectives and goals of
SCM; this will result in superior supply chain performance and firm performance. In
other words, if the organization‟s goal is to cut its cost through a cross-docking strategy,
for example, then the SCM strategy should be derived from its organizational strategy
and help the organization achieve its goal. At the same time, the organization should
acquire an IT application (e.g., electronic data interchange (EDI)) which reduces
information lead times between the focal firm and its suppliers. Thus, this application
will also reduce the time it takes to produce and ship the items to the stores; as a result
the ISS enhances the organization‟s ability and its supply chain‟s ability to achieve its
goals. Having these three strategies aligned together will result in better supply
integration and better firm performance (the results of H1a). On the other hand, if the
organization implements an assemble-to-order strategy, then this requires a supply chain
171
that holds components in a generic form (parts ready in stocks) to delay the point of
product differentiation, then responds quickly by having the final assembly of products
completed once customer orders have been received. In order to do so, the organization
should acquire certain supply chain applications (i.e., application of strategic information
systems planning (SISP)) that enables them to implement this type of strategy. Aligning
those strategies will enable organizations to achieve mass customization and therefore
respond faster to customer needs (the results of H1c). Finally, if the organization‟s
strategy is to respond faster to its customers, then the supply chain strategy should focus
on being flexible and enable it to respond quickly and effectively to the organization‟s
requirements. As shown by the revised mediating hypothesis (revised H1b),
acquiring/developing an appropriate supply chain application (i.e., i2e technologies) for
this type of strategy will indirectly support the agility strategy adopted by the supply
chain, which enables the supply chain to meet specific requirements and respond faster to
changes in customers‟ demand.
Fifth, the results from the structural model indicate several important relationships
at the operational level. The outcome of this study suggests that aligning SCM practices
with the usage of IT will improve SCM performance and firm performance. In other
words, this study looks at different SCM practices and identifies corresponding IS usage
practices that enhance the success of those SCM practices. For instance, if the
organization wants to build a strategic partnership with its suppliers and wants to have a
better customer relationship, then certain supply chain software (e.g. Customer
Relationship Management (CRM) software) needs to be used to enable the organization
to interact with its partners and customers (this is the results of H2a). In other words,

172
using the right application for the right practice will result in a superior SCM
performance and firm performance. On the other hand, if the organization wants to share
quality information with its suppliers, then the organization must have the right
infrastructure (platforms, networks, and databases) that is compatible with the type of
software its suppliers are using, and compatible with the type of information they are
exchanging. This will allow for a smooth flow/transaction of information between the
organization and its suppliers (the results of H2c). Finally, in the case of lean and
postponement practices, organizations must use the appropriate supply chain application
to execute lean and postponement practices, without which the ability to increase supply
chain benefits would be limited (the results of revised H2b).
7.2 Implications for Practitioners
The results of this study have several important implications for practitioners.
First, since effective supply management has become the way organizations improve
performance (since competition is no longer between organizations but among suppliers),
many organizations are increasingly adapting SCM strategies and practices in order to
sustain their competitive advantage in the market. The findings of this research reveal to
practitioners 1) the importance of adapting an IS strategy in their organizations that
matches their SCM strategy and 2) using the appropriate IT applications that match with
their SCM practices. This will have an impact on improving their performances. As
shown by the particular cases of external use of IT (in the case of practice-level
alignment) and IS for agility and comprehensives (in the case of strategy-level
alignment), managers should take into consideration the types of IT applications their

173
suppliers are using when making decisions on what applications they need to acquire and
use in their organizations
Second, the findings of this study help managers position, structure, and utilize
their IS applications in line with SCM strategies and practices. The results of this study
are expected to be useful for strategic decision making, especially with regards to
investment decisions concerning acquisition and use of IT in supply chains.
Third, organizations striving to implement lean and postponement practices must
achieve a corresponding use of IT to improve their internal processes, without which
these practices may not yield the desired benefits (the result revised hypothesis H2b). The
difference between lean and postponement practices and the other SCM practices
(strategic practices with suppliers and customers, and sharing quality information) is that,
using the appropriate IT application is not essential, but will enhance their ability to
execute those practices and improve their performances. However, in the case of lean and
postponement practices, it is necessary to use the appropriate IT applications to yield
supply chain benefits from these practices.
7.3 Limitations of the Research
Even though this research makes several academic and practitioner contributions,
there are several limitations that need to be addressed.
First, this study is done at the firm level with one person from each organization
responding to the survey. A single respondent was asked complex questions about SCM
issues dealing with strategy, applications, and practices. Although the respondent was a
174
senior purchasing manager/ director, or supply chain manager/director, no one person in
an organization is in charge of the entire supply chain.
Second, some of the questions deal with IS strategy and utilizing IT in the supply
chain. Some of the respondents may not have been in an appropriate position to answer
these IS-related questions; since the main area of manufacturing is production, they may
not have enough knowledge of their suppliers IS strategy and the IT applications that they
use to answer these questions accurately.
Third, the research design and method employed may constrain the results found
and the implications of this research. Thus, a sample size with 205 responses may not be
sufficient to handle a complex model that consists of both strategic and operational
levels.
7.4 Recommendations for Future Research
Future research should apply multiple methods to test this model using different
types of alignment. For example, the alignment can be tested with different perspectives
such as fit as gestalts, fit as profile deviation, and fit as covariation. By doing that, we can
see if the results will hold to generalize that the concept of alignment is important and
will improve performances.
Future research should try to see if there is a relation between SCM strategy and
SCM practices. It would be a good idea to see if the alignment between strategy and
practices will have an impact on performance. For example future research could, 1)
explore the alignment between lean supply chain and strategic supplier partnership and
customer relationship practices and its impact on performance; 2) explore the alignment
175
between agile supply chain and lean and postponement practices in the supply chain and
its impact on performance; 3) and finally, explore the alignment between hybrid supply
chains and information sharing and information quality practices in the supply chain, and
their impact on performance.
The result of this study is expected to help managers to anticipate certain
alignment patterns required to have better outcomes in certain industries. For instance,
lean-efficiency alignment is better suited in a general retail industry e.g. Wal-Mart, and
Costco. However, an agile-flexibility alignment is expected to be needed in a high
fashion, retail industry such as Zara. Finally, a hybrid-comprehensiveness alignment is
expected to be needed in a mass market industry like the car industry. With regards to the
practice-usage level, partnerships and customer relationships-external alignment is best-
suited to the consumer goods industry e.g. Procter and Gamble, while lean and
postponement-internal alignment is better suited in a computer manufacturing company
such as Dell and HP. Finally, information sharing and quality information-infrastructure
is expected to be found in high-tech industries. However, to the best of our knowledge,
there is no research that investigates why these patterns can be expected. Therefore,
future research should investigate 1) if these patterns really exist; and if so 2) why.
Future research should revalidate the measurement scales developed in this study,
especially for the alignment constructs by choosing respondents from different fields
such as IS functional managers and IS users; this validation will confirm the instrument
proposed in this research and create generalizability for those instruments. Use of
multiple respondents i.e. in SC and IS fields will help in increasing the generalizability of
the results.

176
There are many other supply chain practices such as outsourcing, reduced cycle
times, purchasing, quality, logistics, JIT, cross functional team, etc..., and many other
performance measures such as customer service, inventory level, service level,
throughput efficiency, suppliers‟ performance, time, assets, information and material
flow integration, and delivery performance, to name a few, that are important and were
not considered in this study. Therefore, there is an opportunity for researchers to test the
same model with different supply chain practices and different performance measures,
and perhaps test the same model using other SEM techniques such as LISREL or AMOS.
Future research can also expand on the current theoretical framework by
integrating new constructs and expanding it to take a global perspective. For example, it
would be interesting to test this model from the perspective of a global supply chain.
Global supply chains are more complex in that they have to deal with suppliers and
customers from different geographical regions that vary in terms of infrastructure, market
demands, supplier sophistication, and IT sophistication. Aligning SC strategies and
practices with corresponding IS strategies and IT usage is thus expected to present greater
challenges that would require additional theoretical and empirical examination.

177
References
Agarwal, A., Shankar, R., & Tiwari, M.K. (2007). Modeling agility of supply chain.
Industrial Marketing Management, 36 (4), pp. 443-457.
Aggarwal, S. (1997). Flexibility management: the ultimate strategy. Industrial
Management, 39 (1), pp.26-31.
Allen, B. R., & Boynton, A. C. (1991). Information architecture: In search of efficient
flexibility. MIS Quarterly, 15(4), pp.435–445.
Alvarado, U.Y. & Kotzab, H. (2001). Supply chain management: the integration of
logistics in marketing”, Industrial Marketing Management. 30 (2), pp.183-98.
Bakos, J. Y, & Brynjolfsson, E. (1993). Information technology, incentives, and the
optimal number of suppliers. Journal of Management Information Systems, 10 (2), pp.37-
53.
Bakos, J. Y., & Treacy, M. E. (1986). Information technology and corporate strategy: A
research perspective. MIS Quarterly, 10 (2), pp.107-119.
Barnes, D., Mieczkowska, S., & Hinton, M. (2003). Integrating operations and
information strategy in e-Business. European Management Journal, 21 (5), pp. 626-634.
178
Bassellier, G., & Benbasat, I. (2004). Business competence of information technology
professionals: Conceptual development & influence on IT-business partnerships. MIS
Quarterly, 28 (4), pp. 673–694.
Batagelj, Z. and Vehovar, V. (1998). Technical and Methodological Issues In WWW
Surveys. Proceedings of the 53rd Annual Conference of the American Association for
Public Opinion Research (AAPOR), St. Louis, MO.
Beamon, B.M. (1998). Supply chain design and analysis: Models and methods.
International Journal of Production Economics, 55 (3), pp.281-294.
Beamon, B.M. (1999). Measuring supply chain performance. International Journal of
Operations and Production Management, 19 (3), pp.275–292.
Belardo, S., Duchessi, P., & Coleman, J. R. (1994). A strategic decision support system at
Orell Fussli. Journal of Management Information Systems, 10 (4), pp.135-157.
Benjamin, R.I., Rockart, J.F., Scott Morton, M.S., & Wyman, J. (1984). Information
Technology: A Strategic Opportunity. Sloan Management Review, spring, pp.3-10.
Boynton, A.C., Zmud, R.W., & Jacobs, G.C. (1994). The Influence of IT Management
Practice on IT Use in Large Organizations. MIS Quarterly, 18 (3), pp.299-318.
Brandyberry, A., Rai, A., & White, G. P. (1999). Intermediate performance impacts of
advanced manufacturing technology systems: An empirical investigation. Decision
Sciences, 30 (4), pp.993-1020.
Brown, C., and Magill, S. (1994). Alignment of IS functions with the enterprise: Toward
a model of antecedents. MIS Quarterly, 18 (4), pp.371-403.

179
Brunn, P., Mefford, R.N., (2004). Lean production and the Internet. International Journal
of Production Economics, 89(3), pp.247–260.
Burgess, K., Singh, P.J. and Koroglu, R. (2006). Supply chain management: a structured
literature review and implications for future research. International Journal of
Operations & Production Management, 26 (7), pp.703-29.
Burns, T., & Stalker, G. M. (1961). The Management of Innovation. London: Tavistock.
Byrd, T. A., & Davidson, N. W. (2003). Examining possible antecedents of IT impact on
the supply chain & its effect on firm performance. Information and Management, 41 (2),
pp. 243-255.
Camillus, J.C. and Lederer, A.L. (1985). Corporate strategy and design of computerized
information systems. Sloan Management Review, 26 (3), pp.35-42.
Campbell, D. T. (1960). Recommendations for APA test standards regarding construct,
trait, or discriminant validity. The American Psychologist, 15(8), pp.546-553.
Cash Jr., J. I., & Konsynski, B. R. (1985). IS redraws competitive boundaries. Harvard
Business Review, 63 (2), pp.134-142.
Chan, Y., Huff, S., Barclay, D., & Copeland, D. (1997). Business strategic orientation,
information systems strategic orientation, and strategic alignment. Information Systems
Research, 8 (2), pp.125-150.
Chandler, A. D. (1962). Strategy and Structure. Cambridge, MA.: MIT Press

180
Chen, I.J. & Paulraj, A. (2004). Towards a theory of supply chain management: the
constructs and measurements. Journal of Operations Management, 22 (2), pp.119-50.
Chen, I.J., Paulraj, A., & Lado, A. (2004). Strategic purchasing, supply management, and
performance. Journal of Operations Management, 22 (5), pp.505-523.
Chin, W. W. (1998a). Issues and Opinion on Structural Equation Modeling. MIS
Quarterly, 22(1), pp. 7-16.
Chin, W. W. (1998b). The Partial Least Squares Approach to Structural Equation
Modeling. In Marcoulides, G. A. (Eds.), Modern Methods for Business Research, pp.
295-336. Lawrence Erlbaum Associates, Hillsdale, NJ.
Chin, W. W., Marcolin, B. L., and Newsted, P. R. (2003). A Partial Least Squares Latent
Variable Modeling Approach for Measuring Interaction Effects: Results from a Monte
Carlo Simulation Study and an Electronic Mail Emotion/Adoption Study. Information
Systems Research, 14(2), pp. 189-217.
Chopra, S., & Meindl, P. (2001). Supply Chain Management: Strategy, Planning, &
Operation. NJ: Prentice-Hall. Inc.
Christopher, M. (2000). The agile supply chain competing in volatile markets. Industrial
Marketing Management, 29 (1), pp. 37-44.
Christopher, M., & Towill, D. R. (2000). Supply chain migration from lean & functional
to agile & customized. Supply Chain Management: An International Journal, 5 (4)
pp. 206-213.

181
Chung, S. H., Byrd, T.A., Lewis, B. R., and Ford, F. N. (2005). An empirical study of the
relationships between IT infrastructure flexibility, mass customization, and business
performance. ACM SIGMIS Database, 36 (3), pp.26-44.
Churchill, G. A. (1979). A paradigm for developing better measures of marketing
constructs. Journal of Marketing Research, 16(1), pp.12-27.
Clark, T.H., & Stoddard, D.B. (1996). Interorganizational business process redesign:
Merging technological and process innovation. Journal of Management Information
Systems, 13 (2), pp.9-29.
Claycomb, C., Droge, C., & Germain, R. (1999). The effect of just-in-time with
customers on organizational design and performance. International Journal of Logistics
Management, 10 (1), pp.37–58.
Clemons, E. K., Reddi, S. P., & Row, M. C. (1993). The impact of information
technology on the organization of economic activity: The "move to the middle"
hypothesis. Journal of Management Information Systems, 10 (2), pp.9-35.
Cohen, J. (1960). A coefficient of agreement for nominal scales. Educational and
Psychological Measurement, 20, pp.37–46.
Cohen, S., & Roussel J. (2005). Strategic Supply Chain Management: The Five
Disciplines for Top Performance. New York: McGraw-Hill.
Cook, T. D. and. Campbell, D. T. (1979). Quasi-Experimentation: Design & Analysis
Issues for Field Settings. Chicago, Rand McNally College Pub. Co.

182
Cooper, J.C., (1993). Logistics strategies for global business. International Journal of
Physical Distribution and Logistics Management, 23 (4), pp.12–23.
Daugherty, P.J., Ellinger, A.E., & Rogers, D.S. (1995). Information accessibility:
Customer responsiveness and enhanced performance. International Journal of Physical
Distribution and Logistics Management, 25 (1), pp.4-17.
Donaldson, L. (2001). The Contingency Theory of Organizations. Thousand Oaks,
London: Sage Publications.
Donlon, J.P. (1996). Maximizing value in the supply chain. Chief Executive, 117, pp.54-
63.
Duclos, L.K., Vokurka, R.J., & Lummus, R.R. (2003). A Conceptual Model of Supply
Chain Flexibility. Industrial Management and Data Systems, 103 (6), pp.446-456.
Duncan, N.B. (1995). Capturing flexibility of information technology infrastructure: a
study of resource characteristics and their measure. Journal of Management Information
Systems, 12 (2), pp. 37 – 57.
Dyer, J. H., Dong, S. C., & Wujin, C. (1998). Strategic supplier segmentation: The next
„best practice‟ in supply chain management. California Management Review, 40 (2),
pp.57-77.
Earl, M. J. (1989). Management Strategies for Information Technology. New York:
Prentice Hall.
Evans, R., and Danks, A. (1998). Strategic supply chain management: Creating
shareholder value by aligning supply chain strategy with business strategy. In Gattorna, J.
183
(Eds), Strategic supply chain alignment: Best practice in supply chain management
(pp.494-508). Aldershot, England: Gower.
Fawcett, S. E., Osterhaus, P., Magnan, G., Brau, J. C., & McCarter, M. W. (2007).
Information sharing and supply chain performance: the role of connectivity and
willingness Supply Chain Management: An International Journal, 12 (5), pp.358-368.
Fisher, M. L. (1997). What is the Right Supply Chain for Your Product? Harvard
Business Review, 75 (2), pp.105-116.
Frazier, G.L., Spekman, R.E., & O'Neal C.R. (1988). Just-in- time exchange relationships
in industrial markets. Journal of Marketing, 52(4), pp.52-67.
Frohlich, M.T., & Westbrook, R. (2001). Arcs of integration: an international study of
supply chain strategies. Journal of Operations Management, 19 (2), pp.185-200.
Galbraith, J. (1973). Designing Complex Organizations. Reading, MA: Addison-Wesley.
Gay, L. R. and Airasian, P. (2003). Educational Research: Competencies for Analysis
and Applications. Upper Saddle River, N.J., Merrill/Prentice Hall.
Goodpasture, V. (1995). Easton steps up to the plate. Manufacturing Systems, 13 (9), pp.
58-64.
Graham, S. T., Daugherty, P.J., & Dudley, W. N. (1994). The long-term strategic impact
of purchasing partnerships. Journal of Supply Chain Management, 30 (4), pp.12-13.

184
Green Jr., K. W., Whitten, D., & Inman, R. A. (2008). The impact of logistics
performance on organizational performance in a supply chain context. Supply Chain
Management, 13 (4), pp.317-327.
Gunasekaran, A., & Ngai, E. W. T. (2004). Information systems in supply chain
integration & management. European Journal of Operational Research, 159 (2), pp.269-
295.
Gunasekaran, A., Lai, K., & Cheng, E. (2008). Responsive supply chain: A competitive
strategy in a networked economy. Omega, 36 (4), pp.549-564.
Gunasekaran, A., Patel, C., &Tirtiroglu, E. (2001). Performance measures and metrics in
a supply chain environment. International Journal of Operations and Production
Management, 21, (1-2), pp.71-87.
Gupta, Y., Karimi, J., & Somers, T. M. (1997). Alignment of a firm's competitive
strategy & information technology management sophistication: the missing link. IEEE
Transactions on Engineering Management, 44 (4), pp.399-413.
Hair, J. F., Anderson, R. E. (1995). Multivariate Data Analysis. Upper Saddle River,
New Jersey, Prentice Hall.
Handfield, R.B., & Nichols Jr., E.L. (1999). Introduction to Supply Chain Management.
Upper Saddle River, NJ: Prentice-Hall.
Hax, A.C., & Majluf, N.S. (1984).The corporate strategic planning process. Interfaces, 14
(1), pp.47-60.

185
Henderson, J., & Venkatraman, N. (1993). Strategic alignment: leveraging information
technology for transforming organizations. IBM Systems Journal, 32(1), pp.4-16.
Holmberg, S. (2000). A systems perspective on supply chain measurements.
International Journal of Physical Distribution and Logistics Management, 30 (10),
pp.847-868.
Huang, S.H., Uppal, M., & Shi, J. (2002). A product driven approach to manufacturing
supply chain selection. Supply Chain Management: An International Journal, 7 (2),
pp.189-199.
Ilebrand, N., Mesøy, T., and Vlemmix, R. (2010). Using IT to enable a lean
transformation. McKinsey Quarterly, 18 Winter, pp.1–3.
Jacobs, F. R., & Chase, R. B. (2008). Operations and Supply Management: The Core.
New York, NY: McGraw-Hill.
Jarrell, J.L. (1998). Supply chain economics. World Trade, 11(11), pp.58–61.
Jarvenpaa, S.L. (1989). The Effect of Task Demands and Graphical Format on
Information Processing Strategies. Management Science, 35(3), pp. 285-303.
Jones, P., Clarke-Hill, C., Hillier, D. & Comfort, D. (2005).The benefits, challenges &
impacts of radio frequency identification technology (RFID) for retailers in the UK.
Marketing Intelligence & Planning, 23 (4), pp. 395-402.
Joreskog, K. G., & Sorbom, D. (1989). LISREL 7 users reference guide. Chicago, IL:
Scientific Software Inc.

186
Kaiser, H. F. (1958). The varimax criterion for analytic rotation in factor analysis.
Psychometrika, 23 pp.187-200.
Kearns, G., & Lederer, A. (2003). A resourced-based view of strategic IT alignment:
How knowledge sharing creates competitive advantage. Decision Sciences, 34 (1), pp.1-
29.
Kearns, G.S., & Sabherwal, R. (2006/2007). Strategic alignment between business and
information technology: A knowledge-based view of behaviors, outcome, and
consequences. Journal of Management Information Systems, 23 (3), pp.129-162.
Kiefer, A. W., & Novack, R. A. (1999). An empirical analysis of warehouse
measurement systems in the context of supply chain implementation. Transportation
Journal, 38 (3), pp.18-27.
Kim, D., Cavusgil, T.S., & Calantone, R.J. (2006). Information systems innovations and
supply chain management: Channel relationships and firm performance. Journal of
Academy of Marketing Science, 34(1), pp.40-54.
Kim, S. W., & Narasimhan, R. (2002). Information system utilization in supply chain
integration efforts. International Journal of Production Research, 40 (18), pp.4585-4609.
King, W. R. (1978). Strategic planning for management information systems. MIS
Quarterly, 2 (1), pp.27-37
Koh, S.C., Demirbag, M., Bayraktar, E., Tatoglu, E., & Zaim, S. (2007). The impact of
supply chain management practices on performance of SMEs. Industrial Management
and Data Systems, 107 (1), pp.103-124.
187
Kumar, V., Fantazy, K., Kumar, U., & Boyle, T. A. (2006). Implementation and
management framework for supply chain flexibility. Journal of Enterprise Information
Management, 19 (3), pp.303-319.
Kyobe, M. E. (2004). Investigating the Strategic Utilization of IT Resources in the Small
and Medium-Sized Firms of the Eastern Free State Province. International Small
Business Journal, 22 (2), pp.131-158.
Lawrence, P.R., & Lorsch, J.W. (1967). Organizations and Environment: Managing
Differentiation and Integration. Cambridge, MA.: Harvard University Press.
Lee H., & Billington, C. (1992). Managing Supply Chain Inventories: Pitfalls and
Opportunities. Sloan Management Review, 33(3), pp.65-73.
Lee, H. L. (2002). Aligning supply chain strategies with product uncertainties. California
Management Review, 44 (3), pp.105-119.
Lee, H.L. (2000). Creating value through supply chain integration. Supply Chain
Management Review, 4 (4), pp.30-36.
Li, S. & Lin, B. (2006). Accessing information sharing and information quality in supply
chain management. Decision Support Systems, 42 (3), pp.641-1656.
Li, S., Ragu-Nathan, B., Ragu-Nathan, T.S. & Rao, S. S. (2006).The impact of supply
chain management practices on competitive advantage and organizational performance.
Omega, 34 (2), pp.107-124.
188
Li, S., Rao, S. S., Ragu-Nathan, T.S., & Ragu-Nathan, B. (2005). Development and
validation of a measurement instrument for studying supply chain management practices.
Journal of Operations Management, 23 (6), pp.618-641.
Lin, C., Chiu, H., & Chu, P. (2006). Agility index in the supply chain. International
Journal of Production Economics, 100 (2), pp.285-299.
Lockamy, A. and McCormack, K. (2004). Linking SCOR planning practices to supply
chain performance. International Journal of Operations and Production Management, 24
(12), pp.1192-1218.
McLaren, T. S., Head M. M., and Yuan, Y. (2004). Using competitive strategy patterns to
determine ideal supply chain management information systems capabilities. International
Journal of Internet and Enterprise Management, 2(1), pp.45-61.
Magretta, J. (1998). The power of virtual integration: an interview with Dell Computer‟s
Michael Dell. Harvard Business Review, 76 (March–April), pp.72-85.
Maloni, M. J., & Benton, W.C. (1997). Supply chain partnerships: Opportunities for
operations research. European Journal of Operational Research, 101 (3), pp.419-429.
Mason-Jones, R., & Towill, D.R. (1997). Information enrichment: Designing the supply
chain for competitive advantage. Supply Chain Management, 2 (4), pp.137-148.
Mason-Jones, R., Naylor, B., & Towill, D. R. (2000). Lean, agile or leagile? Matching
your supply chain to the marketplace. International Journal of Production Research,
(38), pp. 4061-4070.

189
McFarlan, F.W., & McKenney, J. L. (1983) Corporate Information Systems
Management: The Issue Facing Senior Executive. Dow Jones: Irwin.
McIvor, R. (2001). Lean supply: the design and cost reduction dimensions. European
Journal of Purchasing & Supply Management, 7 pp.227-242.
McKay, D. T. & Brockway, D. W. (1989). Building I/T Infrastructure for the1990s. Stage
by Stage, 9 (3), pp.1-11.
McLaren, T. S., Head, M. M., & Yuan, Y. (2004). Supply chain management information
systems capabilities. An exploratory study of electronics manufacturers. Information
Systems and e-Business Management, 2 (2-3), pp.207-222.
Mikkola, J. H., & Skjøtt-Larsen, T. (2004). Supply-chain integration– implications for
mass customization, modularization and postponement strategies. Production Planning &
Control, 15(4), pp.352–361.
Miles, R. E., & Snow, C. C. (1978). Organizational Strategy, Structure, and Process.
New York: McGraw-Hill.
Min, S., & Mentzer, J.T. (2004). Developing and measuring supply chain management
concepts. Journal of Business Logistics, 25 (1), pp.63-99
Mintzberg, H. (1981). Organization design: Fashion or fit? Harvard Business Review, 59
(1), pp.103-116.
Moberg, C. R., Cutler, B. D., Gross, A., & Speh, T.W. (2002). Identifying antecedents of
information exchange within supply chains. International Journal of Physical
Distribution and Logistics Management, 32 (9), pp.755-770.

190
Mohr, J., & Spekman, R. (1994). Characteristics of partnership success: partnership
attributes, communication behavior and conflict resolution techniques. Strategic
Management Journal, 15 (2), pp.135-152.
Monczka, R. M., Petersen, K. J., Handfield, R. B., & Ragatz, G. L. (1998). Success
factors in strategic supplier alliances: The buying company perspective. Decision
Sciences, 29 (3), pp.553-577.
Moore, G. C., & Benbasat, I. (1991). Development of an instrument to measure the
perceptions of adopting an information technology innovation. Information Systems
Research, 2 (3), pp.192-222.
Morgan, C. (2004). Structure, speed and salience: performance measurement in the
supply chain. Business Process Management Journal, 10 (5), pp.522-36.
Nahm, A. Y., Solis-Galvan, L. E., Rao, S. S., Ragu-Nathan, T.S. (2002). The Q-Sort
Method: Assessing Reliability and Construct Validity of Questionnaire Items at a Pre-
Testing Stage. Journal of Modern Applied Statistical Methods, 1(1), pp.114-125.
Narasimhan, R. (1997). Strategic supply management: a total quality management
imperative. Advances in the Management of Organizational Quality, 2, pp. 39-86.
Narasimhan, R., & Jayaram, J. (1998). Causal linkages in supply chain management: an
exploratory study of north american manufacturing firms. Decision Sciences, 29 (3),
pp.579-605.
Narasimhan, R., & Kim, S. W. (2001). Information system utilization strategy for supply
chain integration. Journal of Business Logistics, 22 (2), pp.51-75.

191
Narasimhan, R., & Kim. S. W. (2002). Effect of supply chain integration on the
relationship between diversification and performance: evidence from Japanese and
Korean firms. Journal of Operations Management, 20 (3), pp.303-323.
Naylor, B. J., Naim, M. M. & Berry, D. (1999). Leagility: Integrating the lean & agile
manufacturing paradigms in the total supply chain. International Journal of Production
Economics, 62 (1-2), pp.107-118.
Nickles, T., Mueller, J., & Takacs, T. (1998). Strategy, information technology & the
supply chain: Managing information technology for success, not just survival. In
Gattorna, J. (Eds), Strategic supply chain alignment: Best practice in supply chain
management (pp.494-508). Aldershot, England: Gower.
Nunnally, J. (1978). Psychometric theory. New York: McGraw-Hill.
Owens, G., & Richmond, B. (1995). Best Practices in Retailing: How to Reinvent Your
Supply Chain: What Works, What doesn‟t. Chain Store Age, 71 (11), pp.96-98.
Overby, E., Bharadwaj, A., and Sambamurthy, V. (2006). Enterprise agility and the
enabling role of information technology. European Journal of Information Systems, 15,
pp.120–131.
Pagh, J.D., & Cooper, M.C., (1998). Supply chain postponement and speculation
strategies: how to choose the right strategy. Journal of Business Logistics, 19 (2), pp.13-
33.
Parsons, G.L. (1983). Information technology: a new competitive weapon. Sloan
Management Review, 25 (1), pp.3-14.

192
Philip, G., & Booth, M. E. (2001). A new six ‟S‟ framework on the relationship between
the role of information systems (IS) and competencies in ‟IS‟ management. Journal of
Business Research, 51, pp.233-24.
Porter, M. E. & Millar, V. E. (1985). How information gives you a competitive
advantage. Harvard Business Review, 63 (4), pp.149-160.
Porter, M. E. (1990). The Competitive Advantage of Nations. New York, NY: The Free
Press.
Power, D.J., Sohal, A., & Rahman, S.U. (2001). Critical success factors in agile supply
chain management: an empirical study. International Journal of Physical Distribution &
Logistics Management, 31(4), pp.247–65.
Prasad, S., & Tata, J. (2000). Information investment in supply chain management.
Logistics Information Management, 13 (1), pp.33-38.
Prats, L. M., (2003). The adaptive Supply Chain: Postponement for Profitability, Oracle
Corporation and Cap Gemini Ernst & Young. Retrieved December 2, 2008, from
http://www.oracle.com/applications/postponement-for-profitability-brochure.pdf
Puckridge, D. S. & Woolsey, I. (2003). Information systems strategy for supply chains. In
Gattorna, J. (Eds), Gower Handbook of Supply Chain Management (pp.406-425).
Aldershot, England: Gower.
Quinn, F.J. (1997). Team up for supply chain success. Logistics Management, (36) pp.39-
41.
193
Rai, A., Patnayakuni, R., & Seth, N. (2006). Firm performance impacts of digitally
enabled supply chain integration capabilities. MIS Quarterly, 30 (2), pp.225-246.
Rich, N., & Hines, P. (1997). Supply chain management and time based competition: The
role of the supplier association. International Journal of Physical Distribution &
Logistics Management, 27 (3/4), pp.210-225.
Richmond, B., Burns, A., Mabe, J., Nuthall, L., & Toole, R. (1998). Supply chain
management tools minimizing the risks: maximizing the benefits. In Gattorna, J. (Eds),
Strategic supply chain alignment: Best practice in supply chain management (pp.509-
520). Aldershot, England: Gower.
Rockart, J. F. & Morton, M. S. (1984). Implications of changes in Information
technology for Corporate Strategy. Interfaces, 14 (1) pp.84-95.
Sabherwal, R., & Chan, Y. E. (2001). Alignment between business & IS strategies: a
study of prospectors, analyzers, & defenders. Information Systems Research, 12 (1),
pp.11-33.
Sabherwal, R., & Kirs, P. (1994). The alignment between organizational critical success
factors and information technology capability in academic institutions. Decision
Sciences, 25 (2), pp.301-330.
Schoenfeldt, L. F. (1984). Psychometric Properties of Organizational Research
Instruments. In Bateman, T. S. and Ferris. G. R. (Eds), Method and Analysis in
Organizational Research. Reston, Va. Reston Publishing Company.
194
Sanders, N.R. (2008). Pattern of information technology use: the impact on buyer-suppler
coordination and performance. Journal of Operations Management, 26 (3), pp.349-67.
Sarkis, J., & Talluri, S. (2002). A model for strategic supplier selection. Journal of
Supply Chain Management, 38 (1), pp.18-28.
Segars, A. H. and Grover, V. (1993). Re-examining perceived ease of use and usefulness:
A confirmatory factor analysis. MIS Quarterly, 17(4), pp. 517-525.
Shah, R. &. Ward, P.T. (2003). Lean manufacturing: context, practice bundles, and
performance. Journal of Operations Management, 21 (2), pp.129-149.
Shah, R., Goldstein, S. M., & Ward, P. T. (2002). Aligning supply chain management
characteristics & inter-organizational information system types: An exploratory study.
IEEE Transactions on Engineering Management, 49 (3), pp.282-292.
Shapiro, C., & Varian, H.R. (1999). Information Rules. Boston, MA: Harvard Business
School Press.
Shin, H., Collier, D.A., & Wilson, D.D. (2000). Supply management orientation and
supplier/buyer performance. Journal of Operations Management, 18, pp.317-333.
Simchi-Levi, D. (2005). Tactical planning for reinventing the supply chain. In Harrison,
T.P., Lee, H.L., and Neale, J.J. (Eds), The practice of supply chain management: Where
Theory and Application Converge (pp 15-30). Springer Science & Business Media, USA.
Simchi-Levi, D., Kaminsky, P., & Simchi-Levi, E. (2003). Designing and Managing the
Supply Chain: Concepts, Strategies, and Case studies. Boston: Irwin/McGraw-Hill.

195
Spekman, R.E, Kamauff Jr., J.W., & Myhr, N. (1998). An empirical investigation into
supply chain management: a perspective on partnerships. Supply Chain Management,
3(2), pp.53-67.
Smith, T. (2001). Call this Efficient? Supply Chain isn‟t Place to Experiment‟, in
Internetweek.
Staff, (1999). Survey says supply chain not meeting needs. Modern Materials Handling,
45, (4), p.27.
Stalk, G., & Hout, T. M. (1990). Competing Against Time: How Time-based Competition
is Reshaping Global Markets. New York, NY: The Free Press.
Stevens, G. C. (1990). Successful supply-chain management. Management Decision, 28
(8), pp.25-30.
Stock, G.N., Greis, N.P, & Kasarda, J.D. (2000). Enterprise logistics and supply chain
structure: the role of fit. Journal of Operations Management, 18 (5), pp.531-47.
Stock, G.N.; Greis, N.P. & Kasarda, J.D. (1998). Logistics, strategy and structure: A
conceptual framework. International Journal of Operations and Production
Management, 18 (1), pp.37-52.
Stuart, F.I., 1993. Supplier Partnerships: Influencing Factors and Strategic Benefits.
Journal of Supply Chain Management, 29 (4), pp.21-29.
Subramani, M., & Venkatraman, N. (2003). Safeguarding investments in asymmetric
interorganizational relationships: Theory and evidence. Academy of Management
Journal, (46) 1, pp.46-62.

196
Suzaki, K. (1987). The New Manufacturing Challenge. New York: The free Press.
Swafford, P.M., Ghosh, S. and Murthy, N. (2006). The antecedents of supply chain
agility of a firm: scale development and model testing. Journal of Operations
Management, 24, pp.170-88.
Tan, K. C., Kannan, V.R., & Handfield, R. B. (1998). Supply chain management:
supplier performance and firm performance. International Journal of Purchasing and
Materials Management, 34 (3), pp.2-9.
Tan, K. H., Lyman, S. B., & Wisner, J. D. (2002). Supply chain management: a strategic
perspective. International Journal of Operations & Production Management, 22 (6),
pp.614-631.
Tan, K.C., Kannan, V.J., Handfield, R.B., & Ghosh, S. (1999). Supply chain
management: an empirical study of its impact on firm performance. International Journal
of Operations and Production Management, 19 (10), pp.1034-1052.
Tan, K.H. (2001). A framework of supply chain management literature. European
Journal of Purchasing & Supply Management, 7 (1), pp.39-48.
Tarafdar, M., & Qrunfleh, S. (2009). IT-Business Alignment: The Two level Decision.
Information Systems Management, 26(4), pp.338-349.
Taylor, D.H., (1999.) Supply chain improvement: the lean approach. Logistics Focus 7
(January–February (1), 14–20.

197
Towill, D., & Christopher, M. (2002). The supply chain strategy conundrum: To be lean
or agile or to be lean & agile? International Journal of Logistics: Research &
Applications, 5 (3), pp.299-309.
Tu, Q., Vonderembse, M. A., Ragu-Nathan, T. S., &Ragu-Nathan, B. (2004). Measuring
Modularity-Based Manufacturing Practices and Their Impact on Mass Customization
Capability: A Customer-Driven Perspective. Decision Sciences, 35 (2), pp.147-168.
Tunc, E.A., & Gupta, J.N.D. (1993). Is time a competitive weapon among manufacturing
firms? International Journal of Operations and Production Management, 13 (3), pp.4-
12.
Turner, J.R. (1993). Integrated supply chain management: what's wrong with this picture?
Industrial Engineering, 25 (12), pp.52-55.
Ulusoy, G. (2003). An assessment of supply chain and innovation management practices
in the manufacturing industries in Turkey. International Journal of Production
Economics, 86, pp.251-70.
van Hoek, R.I. (1998). Measuring the unmeasurable––measuring and improving
performance in the supply chain. Supply Chain Management: an International Journal, 3
(4), pp.187-192.
van Hoek, R.I. (1999). Postponement and the reconfiguration challenge for food supply
chains. Supply Chain Management: an International Journal, 4(1), pp.18-34.
198
van Hoek, R.I., Harrison, A., & Christopher, M. (2001). Measuring agile capabilities in
the supply chain. International Journal of Operations & Production Management, 21 (1-
2), pp. 126-148.
Venkatraman, N. (1989a). Strategic orientation of business enterprises: the construct,
dimensionality, and measurement. Management Science, 35 (8), pp.942-962.
Venkatraman, N. (1989b). The Concept of Fit in Strategy Research: Toward Verbal and
Statistical Correspondence. The Academy of Management Review, 14 (3), pp. 423-444.
Venkatraman, N., & Ramanujam, V. (1986). Measurement of business performance in
strategy research: A comparison of approaches. Academy of Management Review, 11,
pp.801-814.
Vessey, I. (1984). An Investigation of the Psychological Processes Underlying the
Debugging of Computer Programs. Unpublished Ph.D. dissertation, Department of
Commerce, The University of Queensland, Queensland, Australia.
Vickery, S. K., Jayaram, J., Droge, C., & Calantone, R. (2003). The effects of an
integrative supply chain strategy on customer service and financial performance: an
analysis of direct versus indirect relationships. Journal of Operations Management, 21
(5), pp.523-539.
Vickery, S., Calantone, R., & Droge, C. (1999). Supply chain flexibility: an empirical
study. Journal of Supply Chain Management, 35 (3), pp.16-24.
Vijayasarathy, L. R., & Robey, D. (1997). The effect of EDI on market channel
relationships in retailing. Information & Management, 33 (2), pp.73-86.
199
Vitasek, K., Manrodt, K. B., & Abbott, J., (2005).What makes a lean supply chain?
Supply Chain Management Review, 9 (7), pp.39-45.
Vonderembse, M. A., Uppal, M., Huang, S. H., & Dismukes, J. P. (2006). Designing
supply chains: Towards theory development. International Journal of Production
Economics, 100 (2), pp.223-238.
Vonderembse, M.A., & Tracey, M. (1999). The impact of supplier selection criteria and
supplier involvement on manufacturing performance. The Journal of Supply Chain
Management: a Global Review of Purchasing and Supply, 35 (3), pp.33-39.
Waller, M. A., Dabholkar, P. A. & Gentry, J. J. (2000). Postponement, product
customization, and market-oriented supply chain management. Journal of Business
Logistics, 21 (2), pp.133-160.
Wang, G., Huang, S. H., & Dismukes, J. P. (2004). Product-driven supply chain selection
using integrated multi-criteria decision-making methodology. International Journal of
Production Economics, 91 (1), pp.1-15.
Ward, J.M. (1987). Integrating information systems into business strategies. Long Range
Planning, 20 (3), pp.19-29.
Weerakkody, V. J. P. & Hinton, C. M. (1999). Exploiting information systems and
technology through business process improvement. Knowledge and Process
Management, 6 (1), pp.17-23.
Weill, P. (1990). Strategic investment in information technology: An empirical study.
Information Age, 12 (3), pp.141-147.

200
Weill, P. (1993). The role and value of information technology infrastructure: Some
empirical observations. In Banker R, Kaufftnan R., & Mahmood M.A. (Eds), Strategic
Information Technology Management: Perspectives on Organizational Growth and
Competitive Advantage (pp.547-572). Middleton, PA: Idea Group.
Williamson, P. (1991). Supplier strategy and customer responsiveness managing the
links. Business Strategy Review, 2 (2), pp.75-90.
Wines, L. (1996). High order strategy for manufacturing. The Journal of Business
Strategy, 17(4), pp.32-3.
Wiseman, C. (1988). Strategic Information Systems. Homewood, Illinois: Irwin.
Wisner, J.D. (2003). A structural equation model of supply chain management strategies
and firm performance. Journal of Business Logistics, 24 (1), pp.1-26.
Womack, J., Jones, D. (1996). Lean Thinking. New York: Simon and Schuster.
Wong, C.Y., Arlbjorn, J. S., & Johansen, J. (2005). Supply chain management practices
in toy supply chains. Supply Chain Management: An International Journal, 10 (5),
pp.367-378.
Yamin, S., Gunasekruan, A., & Mavondo, F.T. (1999). Relationship between generic
strategy, competitive advantage and firm performance: an empirical analysis.
Technovation, 19 (8), pp.507-18
Yang, B., & Burns, N.D. (2003). Implications of postponement for the supply chain.
International Journal of Production Research, 41 (9), pp.2075-90.

201
Yang, B., Burns, N.D. and Backhouse, C.J (2004). Postponement: A Review and
Integrated Framework. International Journal of Operations & Production Management,
24 (5), pp.468-487.
Yu, Z., Yan, H., & Cheng, T. E. (2001). Benefits of information sharing with supply
chain partnerships. Industrial Management & Data Systems, 101 (3), pp.114-121.
Zeng, Y., Chiang, R. H. L. &Yen, D. C. (2003). Enterprise integration with advanced
information technologies: ERP and data warehousing. Information Management &
Computer Security, 11 (3), pp.115-122.
Zhang, M. J., & Lado, A. A. (2001). Information systems and competitive advantage: a
competency-based view. Technovation, 21 (3), pp.147-156.
Zhou, H., & Benton, W.C. (2007). Supply chain practice and information sharing.
Journal of Operations Management, 25 (6), pp.1348-1365.
Zielke, A., & Pohl, M. (1996). Virtual vertical integration: The key to success. McKinsey
Quarterly, 3, pp.160-163.
Zinn,W., & Bowersox, D.J., (1988). Planning physical distribution with the principle of
postponement. Journal of Business Logistics, 9 (2), pp.117-137.

202
Appendix A
Measurement Items Entering First Q-Sort Analysis
SCM STRATEGY
Lean Supply Chain
Our suppliers help us to reduce our costs by delivering what we need. Our suppliers help us to reduce our costs by delivering when we need. Our suppliers help us to reduce our costs by delivering into the production line (and not at a receiving dock). Our suppliers help us to reduce our costs by delivering frequently as per our requirements. Our suppliers help us to reduce our costs by adopting quality practices as per our requirements. Our suppliers help us to reduce our costs by managing their quality as per our requirements. Our suppliers help us to reduce our costs by inspecting their products frequently as per our requirements. Agile Supply Chain
Our suppliers help us to be responsive and flexible by reducing lead-times. Our suppliers help us to be responsive and flexible by reducing product development cycle times. Our suppliers help us to be responsive and flexible by quickly responding to our changing requirements of cost. Our suppliers help us to be responsive and flexible by quickly responding to our changing requirements of volume. Our suppliers help us to be responsive and flexible by quickly responding to our changing requirements of delivery time. Our suppliers help us to be responsive and flexible by quickly responding to our changing requirements of design. Our suppliers help us to be responsive and flexible by quickly responding to our changing requirements of customization. Our suppliers help us to be responsive and flexible by effectively responding to our changing requirements of cost.
203
Our suppliers help us to be responsive and flexible by effectively responding to our changing requirements of volume. Our suppliers help us to be responsive and flexible by effectively responding to our changing requirements of delivery time. Our suppliers help us to be responsive and flexible by effectively responding to our changing requirements of design. Our suppliers help us to be responsive and flexible by effectively responding to our changing requirements of customization.
Hybrid Supply Chain
Our suppliers help us to achieve assemble-to-order strategy by customizing our products by adding feature modules as requested by us. Our suppliers help us to achieve assemble-to-order strategy by responding to customization requirements quickly. Our suppliers help us to achieve assemble-to-order strategy by producing modular products as requested by us. Our suppliers help us to achieve assemble-to-order strategy by delaying the product final assembly until we place an order. Our suppliers help us to achieve assemble-to-order strategy by changing the design of the product as requested by us.
IS STRATEGY
The applications we acquire help us to improve the efficiency of our supplier operations. The applications we acquire help us to facilitate negotiation with our suppliers. The applications we acquire help us to monitor performance of our suppliers. The applications we acquire help us to manage inventory between our suppliers and us. The applications we acquire help us to manage material requirement planning of our facility. The applications we acquire help us to manage production control between our suppliers and us. The applications we acquire help us to coordinate (production and information) across suppliers and product lines. The applications we acquire help us to introduce new product and/or service in our markets. The applications we acquire help us to share information within our firm. The applications we acquire help us to share information with our suppliers. The applications we acquire help us to monitor changes in our market condition. The applications we acquire help us to respond to changes in the market.
204
The applications we acquire help us to model possible future outcomes and identify alternative courses of action. The applications we acquire help us to change the design of the product.
The applications we acquire help us to interact with customer. The applications we acquire help us to interact with suppliers. The applications we acquire help us to provide sufficient detailed information to support careful decision making. The applications we acquire help us to provide detail analysis of major supplier‟s decision. The applications we acquire help us to provide support for decision making. The applications we acquire help us to adopt a rather conservative view when making major decisions.
ALIGNMENT BETWEEN SUPPLY CHAIN MANAGEMENT STRATEGY AND IS STRATEGY
The applications we have enhance the ability to deliver frequently. The applications we have enhance the ability to deliver what we need. The applications we have enhance the ability to deliver when we need. The applications we have enhance the ability to deliver into the production line (and not at a receiving dock). The applications we have enhance the ability to adopt quality practices. The applications we have enhance the ability to manage quality. The applications we have enhance the ability to inspect products frequently.
The applications we have enhance the ability to reduce lead-times. The applications we have enhance the ability to reduce product development cycle times. The applications we have enhance the ability to respond quickly to our changing requirements of cost. The applications we have enhance the ability to respond quickly to our changing requirements of volume. The applications we have enhance the ability to respond quickly to our changing requirements of delivery time The applications we have enhance the ability to respond quickly to our changing requirements of design. The applications we have enhance the ability to respond quickly to our changing requirements of customization. The applications we have enhance the ability to respond effectively to our changing requirements of cost. The applications we have enhance the ability to respond effectively to our changing requirements of volume.

205
The applications we have enhance the ability to respond effectively to our changing requirements of delivery time. The applications we have enhance the ability to respond effectively to our changing requirements of design. The applications we have enhance the ability to respond effectively to our changing requirements of customization.
The applications we have enhance the ability to customize our products by adding feature modules as requested. The applications we have enhance the ability to produce modular products. The applications we have enhance the ability to respond to customization requirements quickly. The applications we have enhance the ability to delay the product final assembly until customers make an order The applications we have enhance the ability to change the design of the product. IT UTILIZATION
External Focus of IT
In our firm, we use IT for selecting suppliers. In our firm, we use IT for solving problems jointly with our suppliers. In our firm, we use IT for helping our suppliers to improve their product quality. In our firm, we use IT for building continuous improvement programs that include our key suppliers. In our firm, we use IT for including our key suppliers in our planning and goal-setting activities. In our firm, we use IT for interacting with customers to set reliability, responsiveness, and other standards for us. In our firm, we use IT for measuring and evaluating customer satisfaction. In our firm, we use IT for determining customer feedback about our products/services. In our firm, we use IT for facilitating customers‟ ability to seek assistance from us. In our firm, we use IT for facilitating customer service activities. In our firm, we use IT for monitoring supplier performance In our firm, we use IT for order placing and purchasing In our firm, we use IT for communicating product specifications Internal Focus of IT
In our firm, we use IT for reducing manufacturing set-up time. In our firm, we use IT for building and maintaining continuous quality improvement program. In our firm, we use IT for using a "Pull" production system. In our firm, we use IT for demand forecasting. In our firm, we use IT for designing products for modular assembly.

206
In our firm, we use IT for delaying final product assembly activities until customer orders have actually been received. In our firm, we use IT for delaying final product assembly activities until the last position (or nearest to customers) in the supply chain. In our firm, we use IT for storing our parts/products at appropriate distribution points close to the customer Infrastructural Focus of IT
In our firm, we use IT for informing trading partners in advance of changing needs. In our firm, we use IT for sharing proprietary information with our trading partners. In our firm, we use IT for sharing business knowledge of core business processes with our trading partners. In our firm, we use IT for sharing our proprietary information with our trading partners In our firm, we use IT for exchanging timely information between our trading partners and us. In our firm, we use IT for exchanging accurate information between our trading partners and us. In our firm, we use IT for exchanging complete information between our trading partners and us. In our firm, we use IT for exchanging adequate information between our trading partners and us. In our firm, we use IT for exchanging reliable information between our trading partners and us.
ALIGNMENT BETWEEN SUPPLY CHAIN MANAGEMENT PRACTICES AND
USAGE OF IT
The Information Technology (IT) we use in our supply chain activities (purchasing, order taking, inventory management etc.) enhances our ability to select suppliers based on their quality. The Information Technology (IT) we use in our supply chain activities (purchasing, order taking, inventory management etc.) enhances our ability to solve problems jointly with our suppliers. The Information Technology (IT) we use in our supply chain activities (purchasing, order taking, inventory management etc.) enhances our ability to build continuous improvement programs that include our key suppliers. The Information Technology (IT) we use in our supply chain activities (purchasing, order taking, inventory management etc.) enhances our ability to Include our key suppliers in our planning and goal-setting activities. The Information Technology (IT) we use in our supply chain activities (purchasing, order taking, inventory management etc.) enhances our ability to interact with customers to set reliability, responsiveness, and other standards for us. The Information Technology (IT) we use in our supply chain activities (purchasing, order taking, inventory management etc.) enhances our ability to measure and evaluate customer satisfaction.

207
The Information Technology (IT) we use in our supply chain activities (purchasing, order taking, inventory management etc.) enhances our ability to determine future customer expectations. The Information Technology (IT) we use in our supply chain activities (purchasing, order taking, inventory management etc.) enhances our ability to facilitate customers‟ ability to seek assistance from us. The Information Technology (IT) we use in our supply chain activities (purchasing, order taking, inventory management etc.) enhances our ability to periodically evaluate the importance of our relationship with our customers.
The Information Technology (IT) we use in our supply chain activities (purchasing, order taking, inventory management etc.) enhances our ability to inform our trading partners in advance of changing needs. The Information Technology (IT) we use in our supply chain activities (purchasing, order taking, inventory management etc.) enhances our ability to share proprietary information of our trading partners with us. The Information Technology (IT) we use in our supply chain activities (purchasing, order taking, inventory management etc.) enhances our ability to share business knowledge of core business processes with our trading partners. The Information Technology (IT) we use in our supply chain activities (purchasing, order taking, inventory management etc.) enhances our ability to share our proprietary information with our trading partners . The Information Technology (IT) we use in our supply chain activities (purchasing, order taking, inventory management etc.) enhances our ability to exchange information with our trading partners in a timely manner. The Information Technology (IT) we use in our supply chain activities (purchasing, order taking, inventory management etc.) enhances our ability to exchange information with our trading partners in a accurate manner. The Information Technology (IT) we use in our supply chain activities (purchasing, order taking, inventory management etc.) enhances our ability to exchange information with our trading partners in a complete manner. The Information Technology (IT) we use in our supply chain activities (purchasing, order taking, inventory management etc.) enhances our ability to exchange information with our trading partners in a adequate manner. The Information Technology (IT) we use in our supply chain activities (purchasing, order taking, inventory management etc.) enhances our ability to exchange information with our trading partners in a reliable manner.
The Information Technology (IT) we use in our supply chain activities (purchasing, order taking, inventory management etc.) enhances our ability to Reduce manufacturing set-up time. The Information Technology (IT) we use in our supply chain activities (purchasing, order taking, inventory management etc.) enhances our ability to Build and maintain continuous quality improvement program.

208
The Information Technology (IT) we use in our supply chain activities (purchasing, order taking, inventory management etc.) enhances our ability to Use a "Pull" production system. The Information Technology (IT) we use in our supply chain activities (purchasing, order taking, inventory management etc.) enhances our ability to Push suppliers for shorter lead-times. The Information Technology (IT) we use in our supply chain activities (purchasing, order taking, inventory management etc.) enhances our ability to Design products for modular assembly. The Information Technology (IT) we use in our supply chain activities (purchasing, order taking, inventory management etc.) enhances our ability to Delay final product assembly activities until customer orders have actually been received. The Information Technology (IT) we use in our supply chain activities (purchasing, order taking, inventory management etc.) enhances our ability to Delay final product assembly activities until the last possible position (or nearest to customers) in the supply chain. The Information Technology (IT) we use in our supply chain activities (purchasing, order taking, inventory management etc.) enhances our ability to Store our parts/products at appropriate distribution points close to the customer.

209
Appendix B
Cohen’s Kappa and Moore and Benbasat Coefficient
The Q-sort method is an iterative process in which the degree of agreement between judges forms the basis of assessing construct validity and improving the reliability of the constructs. The Q-sort method was devised by Nahm et al. (2002) as a method of assessing reliability and construct validity of questionnaire items that are generated for survey research. This method is applied as a pilot study, which comes after the pre-test and before administering the questionnaire items as a survey (Nahm et al., 2002). The method is simple, cost efficient and accurate and provides sufficient insight into potential problem areas in the questionnaire items that are being tested. The method consists of two stages. In the first stage, two judges are requested to sort the questionnaire items according to different constructs, based on which the inter-judge agreement is measured. In the second stage, questionnaire items that were identified as being too ambiguous, as a result of the first stage, are reworded or deleted, in an effort to improve the agreement between the judges. The process is carried out repeatedly until a satisfactory level of agreement is reached.
The following example describes the theoretical basis for the Q-sort method and
the two evaluation indices to measure inter-judge agreement level: Cohen‟s Kappa (Cohen, 1960) and Moore and Benbasat‟s „Hit Ratio” (Moore and Benbasat, 1991). Let us assume that two judges independently classified a set of N components as either acceptable or rejectable. After the work was finished the following table was constructed:
The above table can also be constructed using percentages by dividing each numerical entry by N. For the population of components, the table will look like:

210
We will use this table of percentages to describe the Cohen‟s Kappa coefficient of
agreement. The simplest measure of agreement is the proportion of components that were classified the same by both judges, i.e., Σi Pii = P11 + P22. However, Cohen suggested comparing the actual agreement, Σi Pii, with the chance of agreement that would occur if the row and columns are independent, i.e., Σi Pi+P+i. The difference between the actual and chance agreements, Σi Pii - Σi Pi+P+i, is the percent agreement above that which is due to chance. This difference can be standardized by dividing it by its maximum possible value, i.e., 100% - Σi Pi + P+I = 1 - Σi Pi +P+i. The ratio of these is denoted by the Greek letter kappa and is referred to as Cohen‟s kappa.
Thus, Cohen‟s Kappa is a measure of agreement that can be interpreted as the proportion of joint judgment in which there is agreement after chance agreement is excluded. The three basic assumptions for this agreement coefficient are: 1) the units are independent, 2) the categories of the nominal scale are independents, mutually exclusive, and 3) the judges operate independently. For any problem in nominal scale agreement between two judges, there are only two relevant quantities: po= the proportion of units in which the judges agreed pc= the proportion of units for which agreement is expected by chance
Like a correlation coefficient, k=1 for complete agreement between the two judges. If the observed agreement is greater than or equal to chance K <= 0. The minimum value of k occurs when ΣPii =0, i.e.
When sampling from a population where only the total N is fixed, the maximum likelihood estimate of k is achieved by substituting the sample proportions for those of the population. The formula for calculating the sample kappa (k) is:
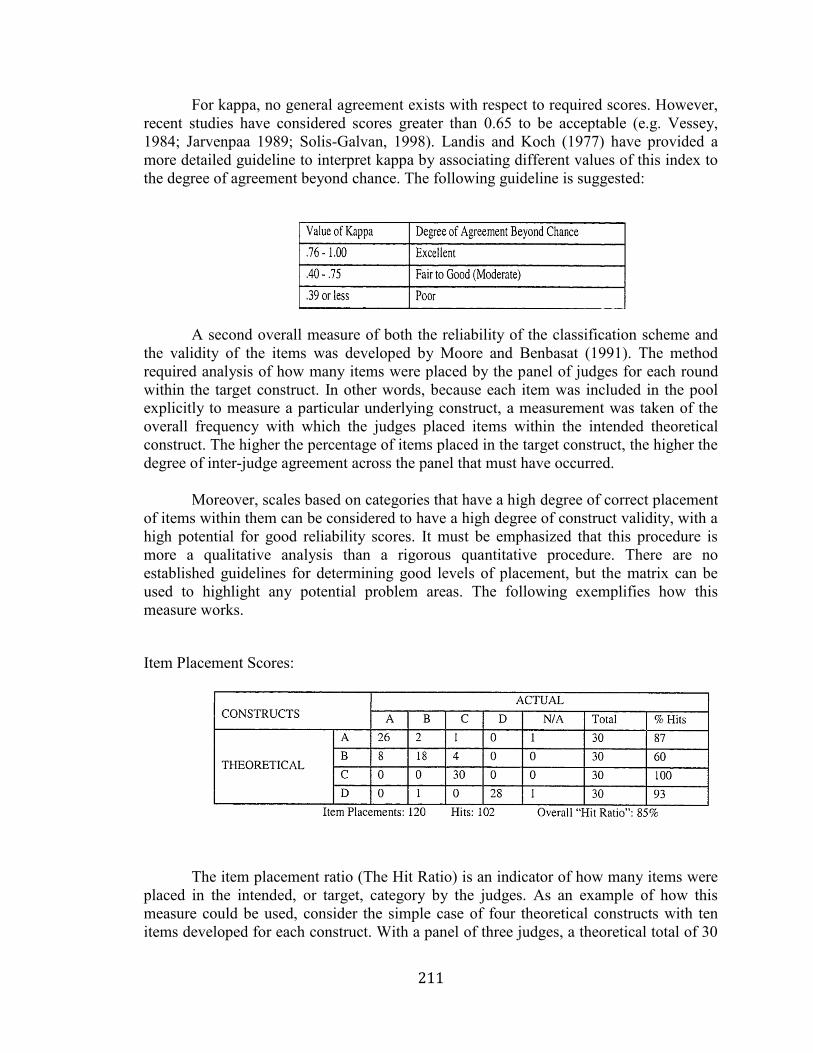
211
For kappa, no general agreement exists with respect to required scores. However, recent studies have considered scores greater than 0.65 to be acceptable (e.g. Vessey, 1984; Jarvenpaa 1989; Solis-Galvan, 1998). Landis and Koch (1977) have provided a more detailed guideline to interpret kappa by associating different values of this index to the degree of agreement beyond chance. The following guideline is suggested:
A second overall measure of both the reliability of the classification scheme and the validity of the items was developed by Moore and Benbasat (1991). The method required analysis of how many items were placed by the panel of judges for each round within the target construct. In other words, because each item was included in the pool explicitly to measure a particular underlying construct, a measurement was taken of the overall frequency with which the judges placed items within the intended theoretical construct. The higher the percentage of items placed in the target construct, the higher the degree of inter-judge agreement across the panel that must have occurred.
Moreover, scales based on categories that have a high degree of correct placement of items within them can be considered to have a high degree of construct validity, with a high potential for good reliability scores. It must be emphasized that this procedure is more a qualitative analysis than a rigorous quantitative procedure. There are no established guidelines for determining good levels of placement, but the matrix can be used to highlight any potential problem areas. The following exemplifies how this measure works.
Item Placement Scores:
The item placement ratio (The Hit Ratio) is an indicator of how many items were placed in the intended, or target, category by the judges. As an example of how this measure could be used, consider the simple case of four theoretical constructs with ten items developed for each construct. With a panel of three judges, a theoretical total of 30
212
placements could be made within each construct. Thereby, a theoretical versus actual matrix of item placements could be created as shown in the table above (including an ACTUAL “N/A: Not Applicable” column where judges could place items which they felt fit none of the categories).
Examination of the diagonal of the matrix shows that with a theoretical
maximum of 120 target placements (four constructs at 30 placements per construct), a total of 102 “hits” were achieved, for an overall “hit ratio” of 85%. More important, an examination of each row shows how the items created to tap the particular constructs are actually being classified. For example, row C shows that all 30-item placements were within the target construct, but that in row B, only 60% (18/30) were within the target. In the latter case, 8 of the placements were made in construct A, which might indicate the items underlying these placements are not differentiated enough from the items created for construct A. This finding would lead one to have confidence in scale based on row C. However, one must be hesitant about accepting any scale based on row B. An examination of off-diagonal entries indicates how complex any construct might be. Actual constructs based on columns with a high number of entries in the off diagonal might be considered too ambiguous, so any consistent pattern of item misclassification should be examined.

213
Appendix C
Measurement Items Entering Third Q-Sort Analysis
SCM STRATEGY
Lean Supply Chain
Our suppliers help us to reduce our costs by delivering what we need. Our suppliers help us to reduce our costs by delivering when we need. Our suppliers help us to reduce our costs by delivering where we need (straight at the production line). Our suppliers help us to reduce our costs by delivering frequently as per our requirements. Our suppliers help us to reduce our costs by adopting quality practices as per our requirements. Our suppliers help us to reduce our costs by managing their quality as per our requirements. Our suppliers help us to reduce our costs by inspecting their products frequently as per our requirements. Agile Supply Chain
Our suppliers help us to be responsive and flexible by quickly responding to our changing requirements of cost. Our suppliers help us to be responsive and flexible by quickly responding to our changing requirements of volume. Our suppliers help us to be responsive and flexible by quickly responding to our changing requirements of delivery time. Our suppliers help us to be responsive and flexible by quickly responding to our changing requirements of design. Our suppliers help us to be responsive and flexible by effectively responding to our changing requirements of cost. Our suppliers help us to be responsive and flexible by effectively responding to our changing requirements of volume. Our suppliers help us to be responsive and flexible by effectively responding to our changing requirements of delivery time. Our suppliers help us to be responsive and flexible by effectively responding to our changing requirements of design.

214
Hybrid Supply Chain
Our suppliers help us to achieve assemble-to-order strategy by customizing our products by adding feature modules as requested by us. Our suppliers help us to achieve assemble-to-order strategy by responding to customization requirements quickly. Our suppliers help us to achieve assemble-to-order by producing modular products as requested by us. Our suppliers help us to achieve assemble-to-order by delaying the product final assembly until we place an order. Our suppliers help us to achieve assemble-to-order by changing the design of the product as requested by us.
IS STRATEGY
The Information Systems (IS) applications we acquire help us to improve the efficiency of our supplier operations. The Information Systems (IS) applications we acquire help us to monitor the efficiency of our suppliers. The Information Systems (IS) applications we acquire help us to manage inventory between our suppliers and us. The Information Systems (IS) applications we acquire help us to manage material requirement planning of our facility. The Information Systems (IS) applications we acquire help us to manage production control between our suppliers and us. The Information Systems (IS) applications we acquire help us to coordinate efficiently (production and information) across suppliers and product lines. The Information Systems (IS) applications we acquire help us to introduce new product and/or service in our markets. The Information Systems (IS) applications we acquire help us to quickly share strategic information within our firm. The Information Systems (IS) applications we acquire help us to quickly share strategic information with our suppliers The Information Systems (IS) applications we acquire help us to monitor changes in our market condition. The Information Systems (IS) applications we acquire help us to respond to changes in the market. The Information Systems (IS) applications we acquire help us to change the design of the product. The information systems (IS) applications we acquire help us to provide sufficient information to support careful decision making. The information systems (IS) applications we acquire help us to detailed analysis of major supplier‟s decision. The information systems (IS) applications we acquire help us to provide support for decision making.

215
The information systems (IS) applications we acquire help us to adopt a well analyzed view when making major decisions.
ALIGNMENT BETWEEN SUPPLY CHAIN MANAGEMENT STRATEGY AND IS STRATEGY
The supply chain applications we have enhance our ability to schedule delivery. The supply chain applications we have enhance our ability to manage quality. The supply chain applications we have enhance our ability to inspect products frequently. The supply chain applications we have enhance our ability adopt quality practices. The supply chain applications we have enhance our ability to respond quickly to our changing requirements of cost. The supply chain applications we have enhance our ability to respond quickly to our changing requirements of volume. The supply chain applications we have enhance our ability to respond quickly to our changing requirements of delivery time. The supply chain applications we have enhance our ability to respond quickly to our changing requirements of design. The supply chain applications we have enhance our ability to respond effectively to our changing requirements of cost. The supply chain applications we have enhance our ability to respond effectively to our changing requirements of volume. The supply chain applications we have enhance our ability to respond effectively to our changing requirements of delivery time. The supply chain applications we have enhance our ability to customize our products by adding feature modules as requested. The Supply chain applications we have enhance our ability to produce modular products. The Supply chain applications we have enhance our ability to respond to customization requirements quickly. The Supply chain applications we have enhance our ability to delay the product final assembly until customers make an order. The supply chain applications we have enhance our ability to change the design of the product.
IT UTILIZATION
External Focus of IT
In our firm, we use IT in interacting with our partners by solving problems jointly with our suppliers.
216
In our firm, we use IT in interacting with our partners by helping our suppliers to improve their product quality. In our firm, we use IT in interacting with our partners by building continuous improvement programs that include our key suppliers. In our firm, we use IT in interacting with our partners by including our key suppliers in our planning and goal-setting activities. In our firm, we use IT in interacting with our partners by communicating with customers to set reliability, responsiveness, and other standards for us. In our firm, we use IT in interacting with our partners by measuring and evaluating customer satisfaction. In our firm, we use IT in interacting with our partners by determining customer feedback about our products/services. In our firm, we use IT in interacting with our partners by facilitating customers‟ ability to seek assistance from us. In our firm, we use IT in interacting with our partners by facilitating customer service activities. In our firm, we use IT in interacting with our partners by monitoring supplier performance . In our firm, we use IT in interacting with our partners by placing order and purchasing. In our firm, we use IT in interacting with our partners by communicating product specifications.
Internal Focus of IT
We use IT to improve processes inside our firm by reducing manufacturing set-up time. We use IT to improve processes inside our firm by building and maintaining continuous quality improvement program. We use IT to improve processes inside our firm by using a "Pull" production system. We use IT to improve processes inside our firm by demand forecasting. We use IT to improve processes inside our firm by designing products for modular assembly. We use IT to improve processes inside our firm by delaying final product assembly activities until customer order have actually been received. We use IT to improve processes inside our firm by delaying final product assembly activities until the last position (or nearest to customers) in the supply chain. We use IT to improve processes inside our firm by storing our parts/products at appropriate distribution points close to the customer Infrastructural Focus of IT
In our firm, our IT foundation (platforms, networks, and databases) facilitates communicating and sharing proprietary information. In our firm, our IT foundation (platforms, networks, and databases) facilitates communicating and sharing business knowledge of core business processes.
217
In our firm, our IT foundation (platforms, networks, and databases) facilitates communicating and exchanging timely information. In our firm, our IT foundation (platforms, networks, and databases) facilitates communicating and exchanging accurate information. In our firm, our IT foundation (platforms, networks, and databases) facilitates communicating and exchanging complete information. In our firm, our IT foundation (platforms, networks, and databases) facilitates communicating and exchanging adequate information. In our firm, our IT foundation (platforms, networks, and databases) facilitates communicating and exchanging reliable information. ALIGNMENT BETWEEN SUPPLY CHAIN MANAGEMENT PRACTICES AND
USAGE OF IT The IT we use in our supply chain activities (purchasing, order taking, inventory management etc.) enhances our ability to select suppliers based on their quality. The IT we use in our supply chain activities (purchasing, order taking, inventory management etc.) enhances our ability to solve problems jointly with our suppliers. The IT we use in our supply chain activities (purchasing, order taking, inventory management etc.) enhances our ability to Build continuous improvement programs that include our key suppliers. The IT we use in our supply chain activities (purchasing, order taking, inventory management etc.) enhances our ability to Include our key suppliers in our planning and goal-setting activities. The IT we use in our supply chain activities (purchasing, order taking, inventory management etc.) enhances our ability to Interact with customers to set reliability, responsiveness, and other standards for us. The IT we use in our supply chain activities (purchasing, order taking, inventory management etc.) enhances our ability to measure and evaluate customer satisfaction. The IT we use in our supply chain activities (purchasing, order taking, inventory management etc.) enhances our ability to determine future customer expectations. The IT we use in our supply chain activities (purchasing, order taking, inventory management etc.) enhances our ability to facilitate customers‟ ability to seek assistance from us. The IT we use in our supply chain activities (purchasing, order taking, inventory management etc.) enhances our ability to periodically evaluate the importance of our relationship with our customers. The Information Technology (IT) we use in our supply chain activities (purchasing, order taking, inventory management etc.) enhances our ability to inform our trading partners in advance of changing needs.

218
The Information Technology (IT) we use in our supply chain activities (purchasing, order taking, inventory management etc.) enhances our ability to share proprietary information with our trading partners. The Information Technology (IT) we use in our supply chain activities (purchasing, order taking, inventor management etc.) enhances our ability to share business knowledge of core business processes with our trading partners. The Information Technology (IT) we use in our supply chain activities (purchasing, order taking, inventory management etc.) enhances our ability to exchange information with our trading partners in a timely manner. The Information Technology (IT) we use in our supply chain activities (purchasing, order taking, inventor management etc.) enhances our ability to exchange information with our trading partners in an accurate manner. The Information Technology (IT) we use in our supply chain activities (purchasing, order taking, inventory management etc.) enhances our ability to exchange information with our trading partners in a complete manner. The Information Technology (IT) we use in our supply chain activities (purchasing, order taking, inventor management etc.) enhances our ability to exchange information with our trading partners in an adequate manner. The Information Technology (IT) we use in our supply chain activities (purchasing, order taking, inventory management etc.) enhances our ability to exchange information with our trading partners in a reliable manner.
The IT we use in our supply chain activities (purchasing, order taking, inventory management etc.) enhances our ability to reduce manufacturing set-up time. The IT we use in our supply chain activities (purchasing, order taking, inventory management etc.) enhances our ability to build and maintain continuous quality improvement program. The IT we use in our supply chain activities (purchasing, order taking, inventory management etc.) enhances our ability to use a "Pull" production system. The IT we use in our supply chain activities (purchasing, order taking, inventory management etc.) enhances our ability to push suppliers for shorter lead-times. The IT we use in our supply chain activities (purchasing, order taking, inventory management etc.) enhances our ability to design products for modular assembly. The IT we use in our supply chain activities (purchasing, order taking, inventory management etc.) enhances our ability to delay final product assembly activities until customer orders have actually been received. The IT we use in our supply chain activities (purchasing, order taking, inventory management etc.) enhances our ability to delay final product assembly activities until the last possible position (or nearest to customers) in the supply chain. The IT we use in our supply chain activities (purchasing, order taking, inventory management etc.) enhances our ability to store our parts/products at appropriate distribution points close to the customer.
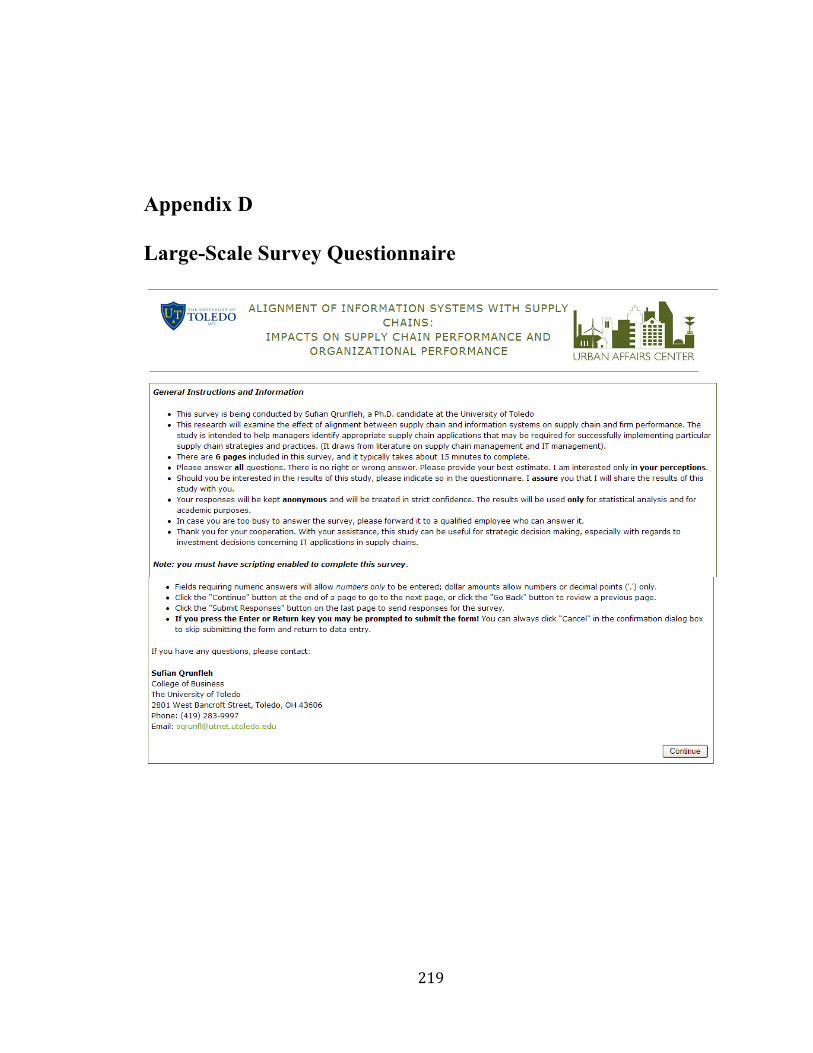
219
Appendix D
Large-Scale Survey Questionnaire

220
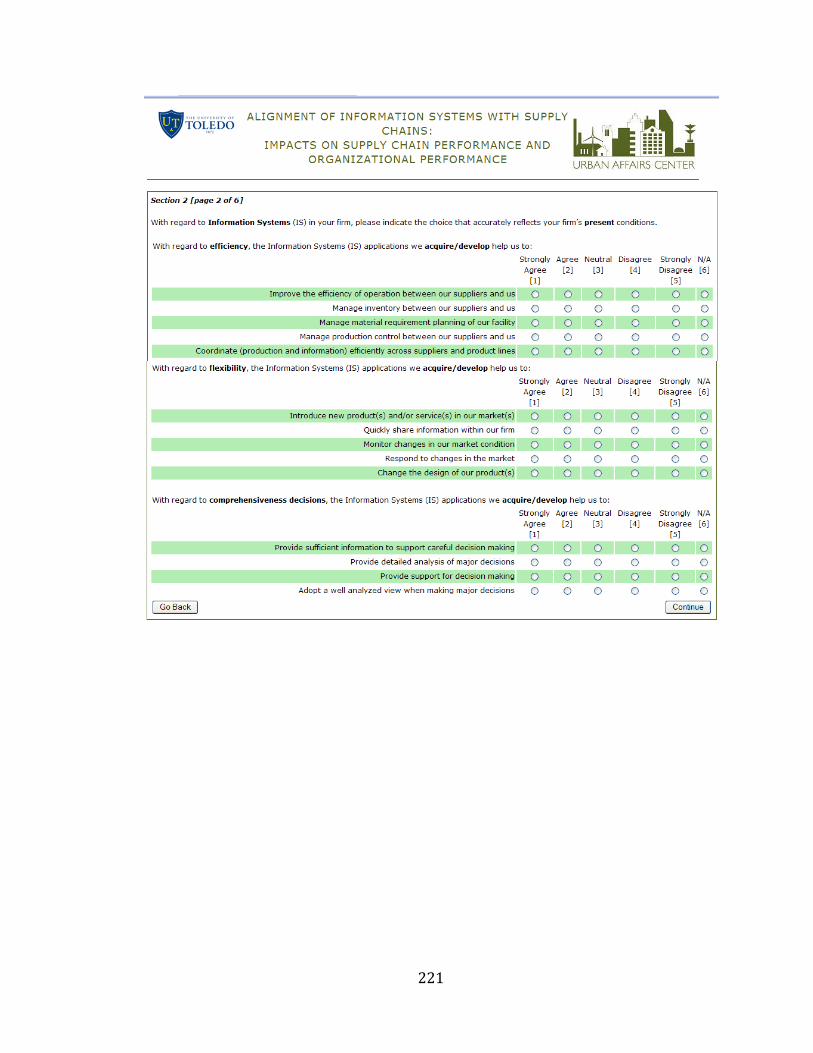
221

222

223

224

225

226
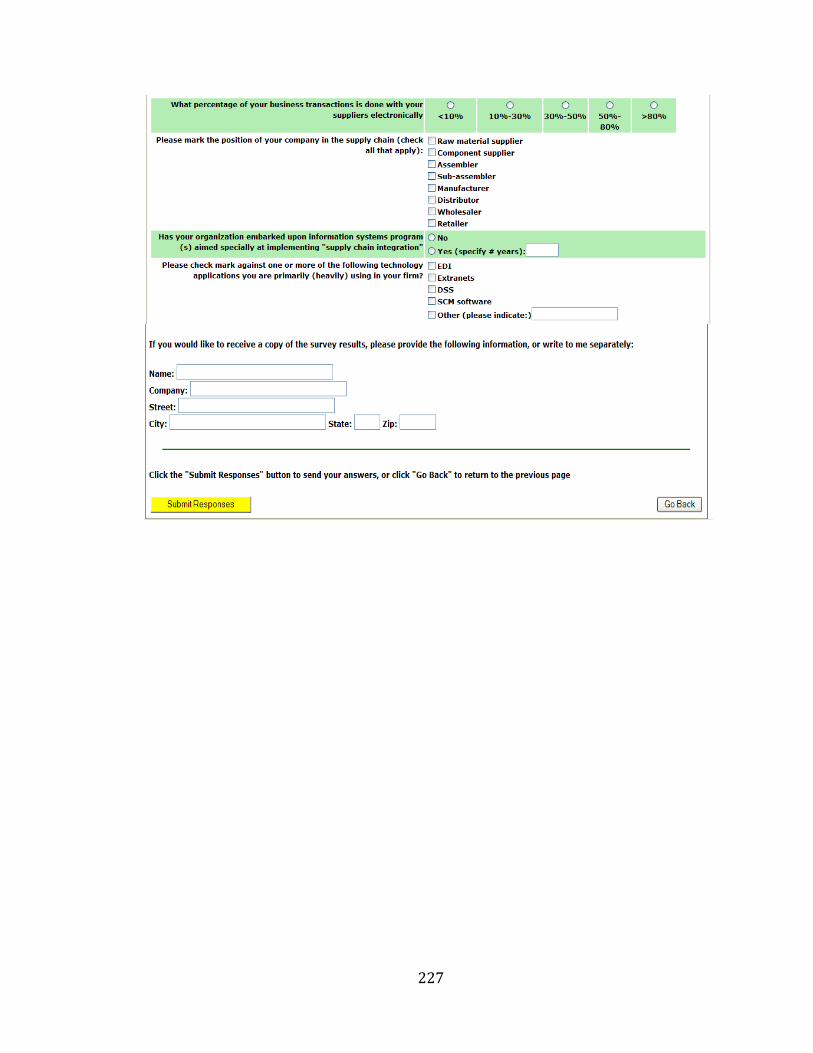
227