allegany county judy center evaluation 2014
DESCRIPTION
This report describes outcomes for the Allegany County (MD) Judy Center with locations at Beall Elementary and South Penn schools for the 2013-2014 school year.TRANSCRIPT

Judy Center Evaluation July 2013 - June 2014
Terance J. Rephann96 Red Cedar RoadBarboursville, VA 22923e-mail: [email protected]

Judy Center Evaluation, July 2013-June 2014
Terance J. Rephann96 Red Cedar Road
Barboursville, VA 22923E-mail: [email protected]
July 31, 2014

Page
Table of Contents i
List of tables, figures, and appendices .................................................................................. ii
Executive Summary ................................................................................................................1
1.0 Review of Last Year’s Results ...........................................................................................2
2.0 Characteristics and Delivery of This Year’s Training .........................................................3
3.0 Enrollment, Training, and Validation................................................................................8
4.0 Partner Surveys .............................................................................................................13
5.0 Teacher Surveys .............................................................................................................18
6.0 Parent Surveys ...............................................................................................................21
7.0 Child Readiness Progress ...............................................................................................32
8.0 Special Research Questions...........................................................................................38
9.0 Changes Introduced .....................................................................................................40
10.0 Summary and conclusions ...........................................................................................41
References ...........................................................................................................................42
Appendices ..........................................................................................................................44
i

Page
List of Tables
Table 2.1 Implementation plan .................................................................................................4-5Table 2.2 Evaluation questions .....................................................................................................6Table 2.3 Special research questions ............................................................................................7Table 3.1 Enrollment of children by age .......................................................................................9Table 3.2 Judy Center enrollment by age and program, 2013-14 ..................................................9Table 3.3 Kindergarten enrollment by need ................................................................................10Table 4.1 Allegany County Judy Center Partners and Roles ....................................................13-14Table 4.2 Activity level of partners .............................................................................................15Table 4.3 Collaboration success .................................................................................................16Table 4.4 Goal success ..............................................................................................................16Table 4.5 Performance area rating ..............................................................................................17Table 4.6 Partner satisfaction with Judy Center ...........................................................................17Table 5.1 Years teaching ............................................................................................................18Table 5.2 Teacher satisfaction ....................................................................................................18Table 5.3 Performance area ratings ............................................................................................19Table 5.4 Adequacy of materials at Judy Center .........................................................................20 Table 5.5 Feeling of families served by Judy Center ....................................................................20Table 6.1 Respondent characteristics ....................................................................................21-23Table 6.2 Learning/reading materials at home ............................................................................24Table 6.3 Activities with children ..........................................................................................24-25Table 6.4 Satisfaction with Judy Center Services .........................................................................27Table 6.5 Satisfaction with Judy Center services by site, percentage of parents, Spring 2012 .............................................................................27Table 6.6 Satisfaction with Judy Center in performance areas, Beall Elementary.........................................................................................................28Table 6.7 Satisfaction with Judy Center in performance areas, South Penn Elementary ...............................................................................................29Table 6.8 Parent participation in Judy Center activities ...............................................................30Table 6.9 Improvement in child learning and habits because of the Judy Center Participation .....................................................................31Table 8.1 Regression results, Fall and 4th Period composite scores for South Penn students ..............................................................................................38
ii

PageList of Figures
Figure 3.1 Enrollment by race .....................................................................................................8Figure 3.2 Child daycare attendance .........................................................................................10Figure 3.3 Health screenings .....................................................................................................11Figure 3.4 Family training participation .....................................................................................12Figure 6.1 Parent satisfaction .....................................................................................................26Figure 7.1 Composite kindergarten readiness, All, FARMS, and Special Education, 2004-2013 ...........................................................................32Figure 7.2 Kindergarten readiness by domain for All Students, 2004-2013 ................................33Figure 7.3 Kindergarten readiness by domain, All, FARM, and Special Education, 2013 ....................................................................................33Figure 7.4 Kindergarten readiness by domain by Judy Center School, 2013 ...............................34Figure 7.5 Composite full readiness, Judy Center, County, and State 2004-2013 .......................35Figure 7.6 Kindergarten Scores by domain for Fall 2013 and Spring 2014 .................................36Figure 7.7 Third grade MSA proficiency, 2014, Maryland, Allegany County, and Judy Center ........................................................................................................37Figure 8.1 South Penn readiness by domain, Fall 2012 and Fall 2013 .......................................39
Appendices
A.1 Fall Parent Survey Comments ...............................................................................................44A.2 Spring Parent Survey Comments ...........................................................................................48
iii

Executive Summary
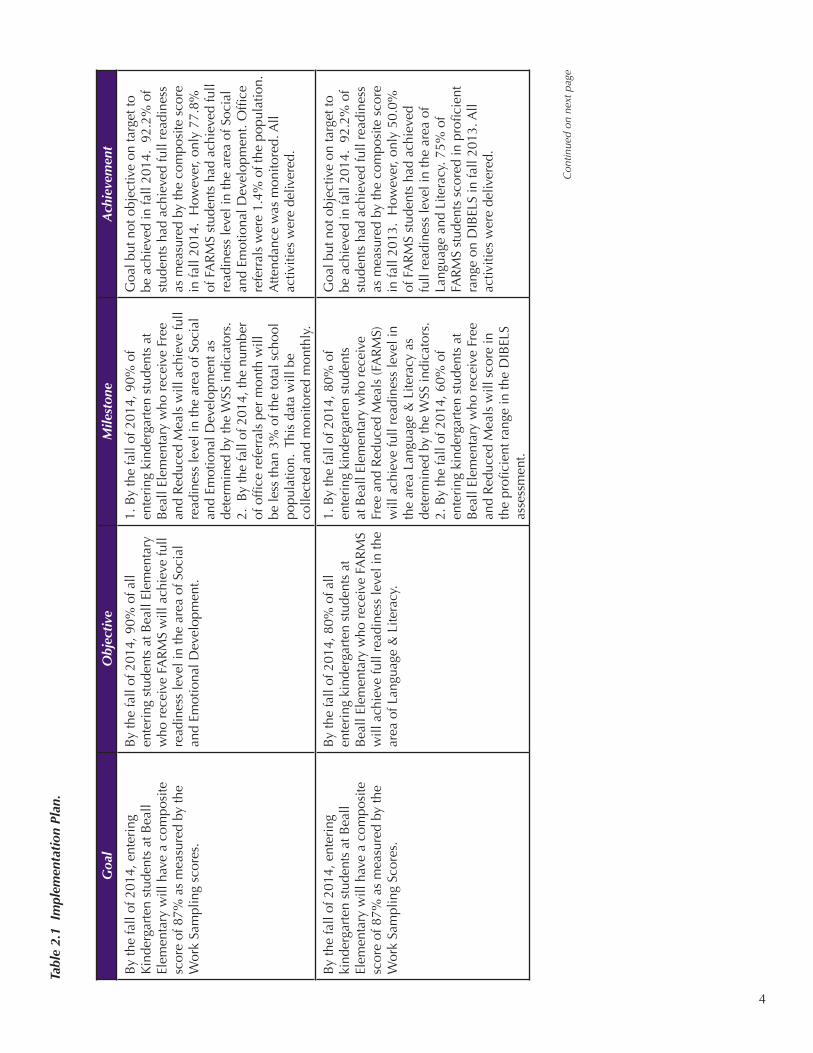
In FY 2014, the Judy Center continued to ramp up services at its recently introduced site at South Penn Elementary while continuing services at Beall Elementary. The Judy Center implementation plan this year involved many of the same elements and activities as last year. The goals and objectives for Beall Elementary remained the same and focused on the domains of Social and Emotional Development and Language and Literacy. South Penn had the same goals and objectives. However, South Penn had milestones that were lower than Beall Elementary.
Table 2.1 of this report summarizes progress made in the implementation plan toward the goals, objectives, and milestones in the grant. Activities supporting these goals are also listed. These activities were carried out as described in the plan with the exception of a teacher professional development activity that was cancelled due to inclement weather.
Child readiness improved over last year. Beall Elementary arrived at school with similar readiness levels to previous years but South Penn improved markedly. Therefore, the two locations combined achieved only an 86 percent readiness level in 2013 (See Figure 7.1). This improvement may at least partly be related to the expansion of services at South Penn.
Judy Center Beall Elementary and South Penn pupils combined did better than their peers in the State and County in terms of overall readiness. However, 89.2 percent of students with prior Judy Center experience were at full readiness in 2014, which is better than the Judy Center average and State and County averages. However, this rate is slightly lower than last year (93 percent).
Child-learning progress was evident during the 2013-2014 school year. Eighty-six percent of students entered at full-readiness in the fall, but ninety-five percent exited at full readiness in the spring as measured by the composite score. This exit readiness level was higher than previous years. Progress was charted in every single domain with the most notable progress in Language and Literacy, which increased from 20.58 percentage points (from 66.7 to 87.3 percent). Ninety-seven percent of Beall Elementary students were fully ready by spring 2014 as measured by the composite score compared to ninety-four percent of South Penn Elementary students.
Survey results were very positive as in previous years. Partner surveys indicate a relatively high degree of participation and cooperation, and they indicated in open-ended comments that they were prepared to offer even more cooperation and additional services. Staff and parent surveys continue to show strong satisfaction. Teachers continue to agree that the amount of resources and cooperation available were good and that teachers were satisfied with the Judy Center. However, some Beall Elementary teachers expressed concern that resources and programs were being moved out of the Beall Elementary site to South Penn Elementary and wondered what impact it would have on their students. Parents recognized improvements in their children’s learning and development during the year.
1

1.0 Review of Year Twelve of Program
FY 2013, the Judy Center was operating at two sites (Beall Elementary and South Penn Elementary) and offered an array of services that addressed each of the Judy Center components for all early childhood age groups, children with special needs, and families. The Center also ran summer camps at both sites and established a behavioral hotline at the South Penn site. New parent training was offered and smart tables were purchased for Kindergarten classrooms. The Judy Center continued to offer a School Readiness Fair at the Country Club Mall in March before the school year to introduce the community to the varied services offered by the Center and its multiple agency and nonprofit organization partners.
The twelfth year evaluation report described other accomplishments and challenges during the year:
u Progress toward goals and objectives in the Judy Center continuing grant application was mixed. The composite score goals were on target to be achieved for Beall Elementary with fall MMSR scores falling slightly short of targets. The target-achievement gaps for South Penn Elementary were much wider, suggesting that they were less likely to be achieved based on fall MMSR data. However, as data presented showed that South Penn students exceeded goal benchmarks by the fourth quarter. Moreover, South Penn students had not received full Judy Center early childhood services during the previous school year.
u The unduplicated number of children in Judy Center programs increased from 491 in FY 2012 to 657 in FY 2013.
u The total number of health screenings decreased over the previous year from 1,465 to 1,171.
u Child readiness lagged levels achieved in the past several years. Beall Elementary arrived at school with slightly lower readiness levels than the previous four years while South Penn entered its first year at a relatively low level of readiness in fall 2012. Therefore, the two locations combined achieved only a 72.5 percent readiness level in 2012. This was the lowest composite readiness level in the last 8 years for the Allegany County Judy Center.
u Judy Center Beall Elementary and South Penn pupils combined lagged their peers in the State and County in terms of overall readiness. However, 93.3 percent of students with prior Judy Center experience enrolled at Beall Elementary were at full readiness in 2013, which was up from the previous year level of 90 percent.
u Considerable child-learning progress occurred during the 2012-2013 school year. Although only 72.5 percent of students entered at full-readiness in the fall, ninety-four percent exited at full readiness in the spring as measured by the composite score.
u Parent, partner, and teacher surveys continue to show a strong level of satisfaction with the Judy Center. In addition, parents recognized sizeable improvements in child learning and development during the year
u Family participation in Judy Center after-school activities showed further increases. Parent workshops/trainings increased from a duplicated headcount of 1,406 in FY12 to 1,511 in FY13.
2

2.0 Characteristics and Delivery of the Thirteenth Year
In FY 2014, services continued at the two Judy Center sites with many of the same features as the previous year but with improved coverage at the South Penn site. In addition, the Judy Center continued to improve its curriculum, programming, and activities, including the following:
u Both Judy Center schools piloted the new WSS during the school year.
u APPLES for Children provided staff training to facilitate a “Parent Café” program and created a resource library at the Kids Korner, Mt. Ridge site
u The JC purchased 5 ASQ (Ages & Stages Questionnaire) kits that were used by family childcare providers after they were trained by APPLES for Children
u Field trips were taken to multiple locations, including Rocky Gap, Brookdale Farms, Hixson Farms, Cumberland Theatre, Cumberland Zoo, Wagner’s Sugar Camp, New Germany State Park, Glendenning Park
u The South Penn Judy Center sent 4 childcare providers to attend the NAEYC Conference
u A speech therapist came to the South Penn JC classrooms 2 ½ days/week and worked with students who have speech issues but who do not qualify for services.
The parameters for evaluation were spelled out in the proposal and are listed in table 2.1. The ultimate goals of the program are to improve child readiness for elementary school. These goals are supported by objectives that target particular learning domains for specific categories of at risk students. Milestones represent particular numerical targets for assessment measures. The final column briefly describes the achievement of each goal, milestone, and activity. To summarize this table: the activities were carried out as specified in the original continuing grant application with the exception of a out-of-town teacher training (due to inclement weather) but progress toward goals and objectives in the Judy Center continuing grant application was mixed. The composite score goals were on target to be achieved for South Penn with fall MMSR scores exceeding targets. The FARMS targets for Beall Elementary fell short of the benchmark objectives, suggesting that they were less likely to be achieved based on fall MMSR data.
3
Tabl
e 2.
1 I
mpl
emen
tati
on P
lan.
Con
tinue
d on
nex
t pag
e
4
Goa
lO
bjec
tive
Mile
ston
eA
chie
vem
ent
By
the
fall
of 2
014,
ent
erin
g K
inde
rgar
ten
stud
ents
at B
eall
Elem
enta
ry w
ill h
ave
a co
mpo
site
sc
ore
of 8
7% a
s m
easu
red
by th
e W
ork
Sam
plin
g sc
ores
.
By
the
fall
of 2
014,
90%
of a
ll en
teri
ng s
tude
nts
at B
eall
Elem
enta
ry
who
rec
eive
FA
RM
S w
ill a
chie
ve fu
ll re
adin
ess
leve
l in
the
area
of S
ocia
l an
d Em
otio
nal D
evel
opm
ent.
1. B
y th
e fa
ll of
201
4, 9
0% o
f en
teri
ng k
inde
rgar
ten
stud
ents
at
Bea
ll El
emen
tary
who
rec
eive
Fre
e an
d R
educ
ed M
eals
will
ach
ieve
full
read
ines
s le
vel i
n th
e ar
ea o
f Soc
ial
and
Emot
iona
l Dev
elop
men
t as
dete
rmin
ed b
y th
e W
SS in
dica
tors
. 2.
By
the
fall
of 2
014,
the
num
ber
of o
ffice
ref
erra
ls p
er m
onth
will
be
less
than
3%
of t
he to
tal s
choo
l po
pula
tion.
Thi
s da
ta w
ill b
e co
llect
ed a
nd m
onito
red
mon
thly
.
Goa
l but
not
obj
ectiv
e on
targ
et to
be
ach
ieve
d in
fall
2014
. 92
.2%
of
stud
ents
had
ach
ieve
d fu
ll re
adin
ess
as m
easu
red
by th
e co
mpo
site
sco
re
in fa
ll 20
14.
How
ever
, onl
y 77
.8%
of
FA
RM
S st
uden
ts h
ad a
chie
ved
full
read
ines
s le
vel i
n th
e ar
ea o
f Soc
ial
and
Emot
iona
l Dev
elop
men
t. O
ffice
re
ferr
als
wer
e 1.
4% o
f the
pop
ulat
ion.
A
ttend
ance
was
mon
itore
d. A
ll ac
tiviti
es w
ere
deliv
ered
.
By
the
fall
of 2
014,
ent
erin
g ki
nder
gart
en s
tude
nts
at B
eall
Elem
enta
ry w
ill h
ave
a co
mpo
site
sc
ore
of 8
7% a
s m
easu
red
by th
e W
ork
Sam
plin
g Sc
ores
.
By
the
fall
of 2
014,
80%
of a
ll en
teri
ng k
inde
rgar
ten
stud
ents
at
Bea
ll El
emen
tary
who
rec
eive
FA
RM
S w
ill a
chie
ve fu
ll re
adin
ess
leve
l in
the
area
of L
angu
age
& L
itera
cy.
1. B
y th
e fa
ll of
201
4, 8
0% o
f en
teri
ng k
inde
rgar
ten
stud
ents
at
Bea
ll El
emen
tary
who
rec
eive
Fr
ee a
nd R
educ
ed M
eals
(FA
RM
S)
will
ach
ieve
full
read
ines
s le
vel i
n th
e ar
ea L
angu
age
& L
itera
cy a
s de
term
ined
by
the
WSS
indi
cato
rs.
2. B
y th
e fa
ll of
201
4, 6
0% o
f en
teri
ng k
inde
rgar
ten
stud
ents
at
Bea
ll El
emen
tary
who
rec
eive
Fre
e an
d R
educ
ed M
eals
will
sco
re in
th
e pr
ofici
ent r
ange
in th
e D
IBEL
S as
sess
men
t.
Goa
l but
not
obj
ectiv
e on
targ
et to
be
ach
ieve
d in
fall
2014
. 92
.2%
of
stud
ents
had
ach
ieve
d fu
ll re
adin
ess
as m
easu
red
by th
e co
mpo
site
sco
re
in fa
ll 20
13.
How
ever
, onl
y 50
.0%
of
FA
RM
S st
uden
ts h
ad a
chie
ved
full
read
ines
s le
vel i
n th
e ar
ea o
f La
ngua
ge a
nd L
itera
cy. 7
5% o
f FA
RM
S st
uden
ts s
core
d in
pro
ficie
nt
rang
e on
DIB
ELS
in fa
ll 20
13. A
ll ac
tiviti
es w
ere
deliv
ered
.

Tabl
e 2.
1 I
mpl
emen
tati
on P
lan.
Con
tinue
d fr
om p
revi
ous
page
5
Goa
lO
bjec
tive
Mile
ston
eA
chie
vem
ent
By
the
fall
of 2
014,
ent
erin
g ki
nder
gart
en s
tude
nts
at S
outh
Pen
n El
emen
tary
will
hav
e a
com
posi
te
scor
e of
65%
as
mea
sure
d by
the
Wor
k Sa
mpl
ing
Syst
em s
core
s.
By
the
fall
of 2
014,
50%
of a
ll ki
nder
gart
en s
tude
nts
at S
outh
Pen
n El
emen
tary
who
rec
eive
FA
RM
S w
ill a
chie
ve fu
ll re
adin
ess
in th
e La
ngua
ge a
nd L
itera
cy D
omai
n as
m
easu
red
by th
e W
ork
Sam
plin
g Sy
stem
Sco
res.
1. B
y th
e fa
ll of
201
4, 5
0% o
f en
teri
ng k
inde
rgar
ten
stud
ents
at
Sout
h Pe
nn E
lem
enta
ry w
ho r
ecei
ve
Free
and
Red
uced
Mea
ls (F
AR
MS)
w
ill a
chie
ve fu
ll re
adin
ess
leve
l in
the
area
Lan
guag
e &
Lite
racy
as
dete
rmin
ed b
y th
e W
SS in
dica
tors
. 2.
B
y th
e fa
ll of
201
3, 5
0% o
f ent
erin
g ki
nder
gart
en s
tude
nts
at S
outh
Pe
nn E
lem
enta
ry w
ho r
ecei
ve F
ree
and
Red
uced
Mea
ls w
ill s
core
in
the
profi
cien
t ran
ge in
the
DIB
ELS
asse
ssm
ent.
Goa
l on
targ
et to
be
achi
eved
in
fall
2014
. 81
.4%
of s
tude
nts
had
achi
eved
full
read
ines
s as
mea
sure
d by
the
com
posi
te s
core
. 68
.6%
of
FA
RM
S st
uden
ts h
ad a
chie
ved
full
read
ines
s le
vel i
n th
e do
mai
n of
Lan
guag
e an
d Li
tera
cy. 6
9% o
f FA
RM
S st
uden
ts s
core
d in
pro
ficie
nt
rang
e on
DIB
ELS
in fa
ll 20
13.
Atte
ndan
ce w
as m
onito
red.
All
activ
ities
wer
e de
liver
ed.
By
the
fall
of 2
014,
ent
erin
g ki
nder
gart
en s
tude
nts
at S
outh
Pen
n El
emen
tary
will
hav
e a
com
posi
te
scor
e of
65%
as
mea
sure
d by
the
Wor
k Sa
mpl
ing
Syst
em s
core
s.
By
the
fall
of 2
014,
52%
of a
ll en
teri
ng k
inde
rgar
ten
stud
ents
at
Sout
h Pe
nn E
lem
enta
ry w
ho r
ecei
ve
FAR
MS
will
ach
ieve
full
read
ines
s in
th
e do
mai
n of
Soc
ial a
nd E
mot
iona
l D
evel
opm
ent.
By
the
fall
of 2
014,
52%
of e
nter
ing
kind
erga
rten
stu
dent
s at
Sou
th P
enn
Elem
enta
ry w
ho r
ecei
ve F
ree
and
Red
uced
Mea
ls w
ill a
chie
ve fu
ll re
adin
ess
leve
l in
the
area
of S
ocia
l an
d Em
otio
nal D
evel
opm
ent a
s de
term
ined
by
the
WSS
indi
cato
rs.
Goa
l on
targ
et to
be
achi
eved
in
fall
2014
. 81.
4% o
f stu
dent
s ha
d ac
hiev
ed fu
ll re
adin
ess
as m
easu
red
by th
e co
mpo
site
sco
re.
72.9
% o
f FA
RM
S st
uden
ts h
ad a
chie
ved
full
read
ines
s le
vel i
n th
e do
mai
n of
So
cial
and
Em
otio
nal D
evel
opm
ent.
All
activ
ities
wer
e de
liver
ed.

In this report, a broader spectrum of measures (see table 2.2) is used to measure program effectiveness. This includes the following elements: (1) marketing and outreach efforts (did the Judy Center meet expectations for program marketing and conduct outreach to other schools in the county?) (2) program enrollment and attendance (were enrollment and attendance expectations for child programs and family activities achieved?), (3) staff training, curriculum resources, and validation (were necessary staff training, program validation, and curriculum materials available as planned?), (4) partner satisfaction (how did partners rate collaboration success?), (5) teacher satisfaction (how did teachers in Pre-K and Kindergarten, view the Judy Center?), (6) parent satisfaction (how did parents view the Judy Center?), (7) child learning (how was school readiness improved according to information from pupil progress reports and other assessment data?), (9) Judy Center component standard ratings (how did parents, staff and partners view accomplishment of Judy Center goals), and (10) answers to special research questions posed in the continuation grant proposal (see table 2.3).
Table 2.2 Evaluation questions.
Issues Measurement
Marketing and outreach Public school outreach activities, Parent survey results
Children enrolled # children enrolled in Judy Center programs by area
Parent involvement #, type, and level of participation in parent workshops, Parent survey results
Staff professional development # and type training workshops attended
Program accreditation # programs validated
Student discipline # Referrals and attendance
Partner satisfaction Partner survey results
Teacher satisfaction Teacher survey results
Parent satisfaction Parent survey results
Child readiness and progress MMSR results, DIBELS assessments, MSA scores
Alignment with Judy Center Goals Teacher survey, Parent survey, MSDE Accreditation and site evaluation comments
Special research questions MMSR results
6

7
The remainder of the report is divided into seven sections. The next section (3.0) addresses pupil enrollment, family service, training, and validation strategies of the program. Section 4.0 describes the results of a steering board partner survey. Section 5.0 describes the results of an end-of year teacher survey and section 6.0 describes the findings of fall and spring surveys of parents. The fall survey asks mainly questions about parenting practices and family resources for use in designing Judy Center activities during the remainder of the year while the spring survey was designed to provide summative information about the perceived effectiveness of the Judy Center, different strategies, and overall parent satisfaction. Section 7.0 provides information on child learning achievement as revealed by performance on various pupil progress reports and tests using benchmark comparisons. Section 8.0 answers special research questions (see table 2.3) introduced in last year’s continuation grant application. Section 9.0 describes changes that are anticipated for next year’s Judy Center. The report ends with a summary.
Table 2.3 Special research questions.
Question
(1) How has the introduction of Judy Center activities at South Penn Elementary impacted that location in terms of the various outcomes measures?
(2) What has been the effect on children who participated in summer JC activities at South Penn versus those who do not (controlling for enrollment in FARMS and Special Education)?

3.0 Enrollment, training, and validation
Programs housed at the Judy Center during FY 2014 served an unduplicated headcount of 597. The duplicated headcount was 706 compared to a duplicated count of 729 during FY 2013. The unduplicated distribution of children by age over the last four years is shown in table 3.1 and the unduplicated distribution by race for Pre-K, Kindergarten, and after-school/before school programs in figure 3.1. Table 3.2 provides a breakdown of 2013-14 attendance by age and Judy Center Program. One hundred and seventy one pupils were enrolled in Kindergarten programs. Table 3.3 indicates that 68 percent of Beall Elementary and South Penn kindergarten students participated in the Free and Reduced Price Meals (FARM) program and 22 percent were enrolled in Special Education. The FARMS percentage was higher at South Penn Elementary but the Special Education percentage was higher at Beall Elementary.
Child enrollment racial demographics from available partners showed that minority enrollment was higher than the service area—15% of children were minority versus 11.8% percent of the total population and 10.1 % of children aged four and younger reported in the 2010 U.S. Census. The Census estimate includes a large minority adult population in state and federal correctional institutions.
8
Other (N=40) 7%
Hispanic (N=3) -1%
Asian (N=10) 2%
Black (N=37) 6%
White (N=510) 85%
Figure 3.1 Enrollment by Race

9
Table 3.1 Unduplicated Enrollment of children by age.
2010-11 2011-12 2012-13 2013-14
Birth to 3 51 101 162 128
3-year old 67 71 111 94
4 year old 151 159 235 204
5 year old 120 160 149 171
Total 349 491 657 597
Table 3.2 Judy Center enrollment by age and program, 2013-14.
Birth to 3 3 year old 4 year old 5 year old
Infant and Toddlers 22
YMCA 16
Kids Korner Daycare
12 13 10 16
Little Tykes 9 5 3
WIC 35 40 34
Family Junction 19
Judy Center Playgroups
15
Autism Class 4
Head Start 4 16
Pre-K 112
Multi-age 28 32
Kindergarten 152
Total 128 94 204 171

10
0
20
40
60
80
100
120
140
160
FY 2002 FY 2003 FY 2004 FY 2005 FY 2006 FY 2007 FY 2008 FY 2009 FY 2010 FY 2011 FY 2012 FY 2013 FY 2014
Perc
enta
ge
Fig. 3.2 Child Daycare Attendance, 2002-2014 Figure 3.2 Child Daycare Attendance, 2002-2014
Table 3.3 Kindergarten enrollment by need.*
Beall Elementary South Penn Total
# % # % #
Free and Reduced Price Meals 44 65 60 71 104
English Language Learners 0 0 0 0 0
Special Education 20 29 14 16 34
* Students may participate in more than one program.
11
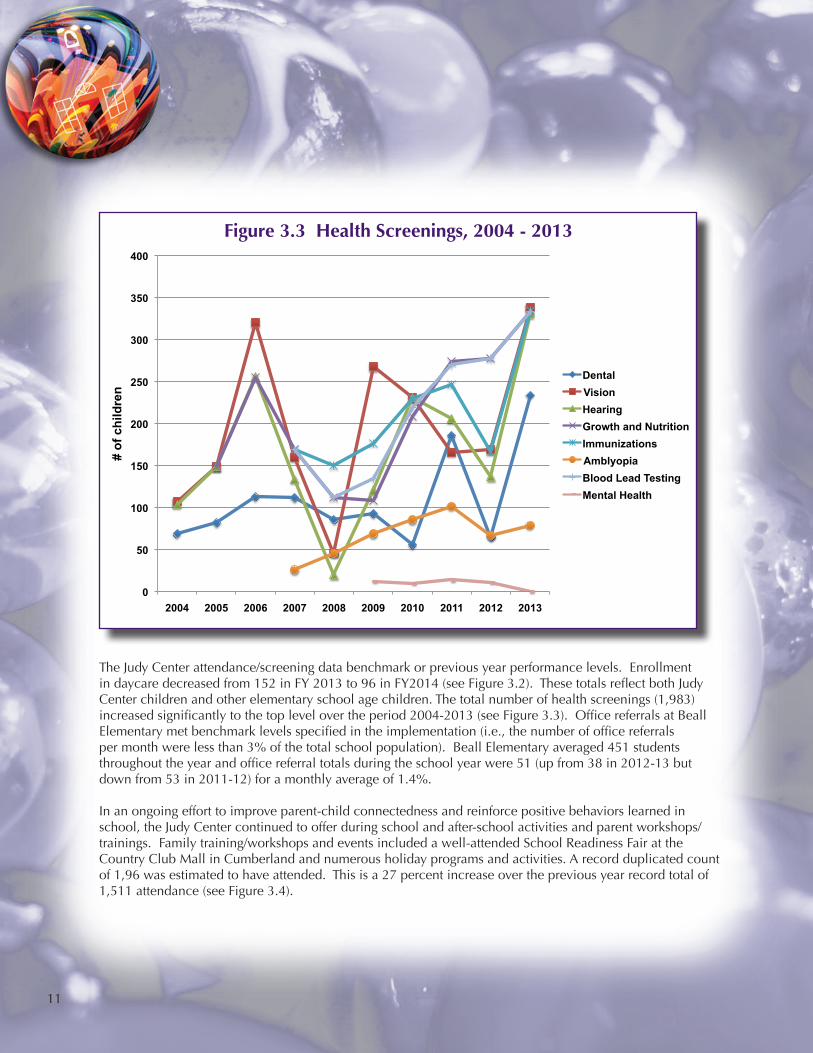
The Judy Center attendance/screening data benchmark or previous year performance levels. Enrollment in daycare decreased from 152 in FY 2013 to 96 in FY2014 (see Figure 3.2). These totals reflect both Judy Center children and other elementary school age children. The total number of health screenings (1,983) increased significantly to the top level over the period 2004-2013 (see Figure 3.3). Office referrals at Beall Elementary met benchmark levels specified in the implementation (i.e., the number of office referrals per month were less than 3% of the total school population). Beall Elementary averaged 451 students throughout the year and office referral totals during the school year were 51 (up from 38 in 2012-13 but down from 53 in 2011-12) for a monthly average of 1.4%.
In an ongoing effort to improve parent-child connectedness and reinforce positive behaviors learned in school, the Judy Center continued to offer during school and after-school activities and parent workshops/trainings. Family training/workshops and events included a well-attended School Readiness Fair at the Country Club Mall in Cumberland and numerous holiday programs and activities. A record duplicated count of 1,96 was estimated to have attended. This is a 27 percent increase over the previous year record total of 1,511 attendance (see Figure 3.4).
0
50
100
150
200
250
300
350
400
2004 2005 2006 2007 2008 2009 2010 2011 2012 2013
# of
chi
ldre
n
Figure 3.3 Health Screenings, 2004-2013
Dental Vision Hearing Growth and Nutrition Immunizations Amblyopia Blood Lead Testing Mental Health
Figure 3.3 Health Screenings, 2004 - 2013

12
0
200
400
600
800
1,000
1,200
1,400
1,600
1,800
2,000
FY 2003 FY 2004 FY 2005 FY 2006 FY 2007 FY 2008 FY 2009 FY 2010 FY 2011 FY 2012 FY 2013 FY 2014
Figure 3.4 Family Training and Activity Participation, FY 2003-FY 2014
Figure 3.4 Family Training and Activity ParticipationFY 2003 - FY 2014
Judy Center staff and partners attended several professional development workshops, conferences and trainings during the year. Teachers received training on the Smart Boards that were recently introduced to classrooms. Childcare Providers received more professional development opportunities arranged around several different topics (i.e., school readiness, poetry, international Christmas customs, parent partnerships, nutrition, motor skills). The Judy Center Coordinator attended several training sessions and workshops during the year, including a Transition training and training for the Maryland Leadership for Early Childhood Advisory Councils.
The Beall Elementary and South Penn Judy Center pre-k and kindergarten programs obtained re-accreditation by the MSDE in spring 2012. The Kids Korner daycare center obtained MSDE re-accreditation for its Beall Elementary childcare program in spring 2013. Head Start was re-accredited in 2014. The new childcare partner for South Penn, Little Tykes Childcare has not yet received and may not be able to continue at its present site.

4.0 Partner Surveys
Partner surveys were administered to the Judy Center partners in spring 2014. These partners are listed in Table 4.1 along with their principal roles in the Judy Center program.
Table 4.1 Allegany County Judy Center Partners/Friends (F) and Roles.
Agency/Organization/Department Principal Role(s)
Allegany Co. Public Schools Education, Health, and Family Education Services; Case management; Adult Education
Special Education Department
Family Support Network
Family Literacy/GED programs
Pre-k classrooms
Kindergarten classrooms
Multiage classrooms
Special Education Department
Infant’s & Toddler’s Program
Nutritional services (provision of meals)
Pupil Services Office
Child Find Clinic
Early Childhood Department
Allegany Co. Health Dept. Health Screening and Services
Nursing Services
Dental Screenings
Fetal and Infant Mortality Board
Mental Health Dept.
HRDC, Inc.
Head Start Early Childhood Education
13
Continued on next page

Agency/Organization/Department Principal Role(s)
Frostburg State University Student interns and tutoring
Education Department
Psychology Department
Foreign Language Department
Allegany College of Maryland (F) Student classroom volunteers
Department of Social Services Parenting Education and Referrals
Family Preservation Program
YMCA – Family Center Child and Family Activities
WIC Child Nutrition
Apples for Children Personnel Training
Md. Cooperative Extension Nutrition Training Support
Allegany Co. Public Libraries Child and Family Literacy
Family Junction Parenting Programs
Kids Korner Childcare Childcare and Family Activities
Little Tykes Childcare Childcare
Allegany County Child Care Professional Association
Provider Training
Lion’s Club (F) Vision screenings
Allegany County Sheriff’s Department Truancy Enforcement
14
Table 4.1 Allegany County Judy Center Partners/Friends (F) and Roles.Continued from previous page
15
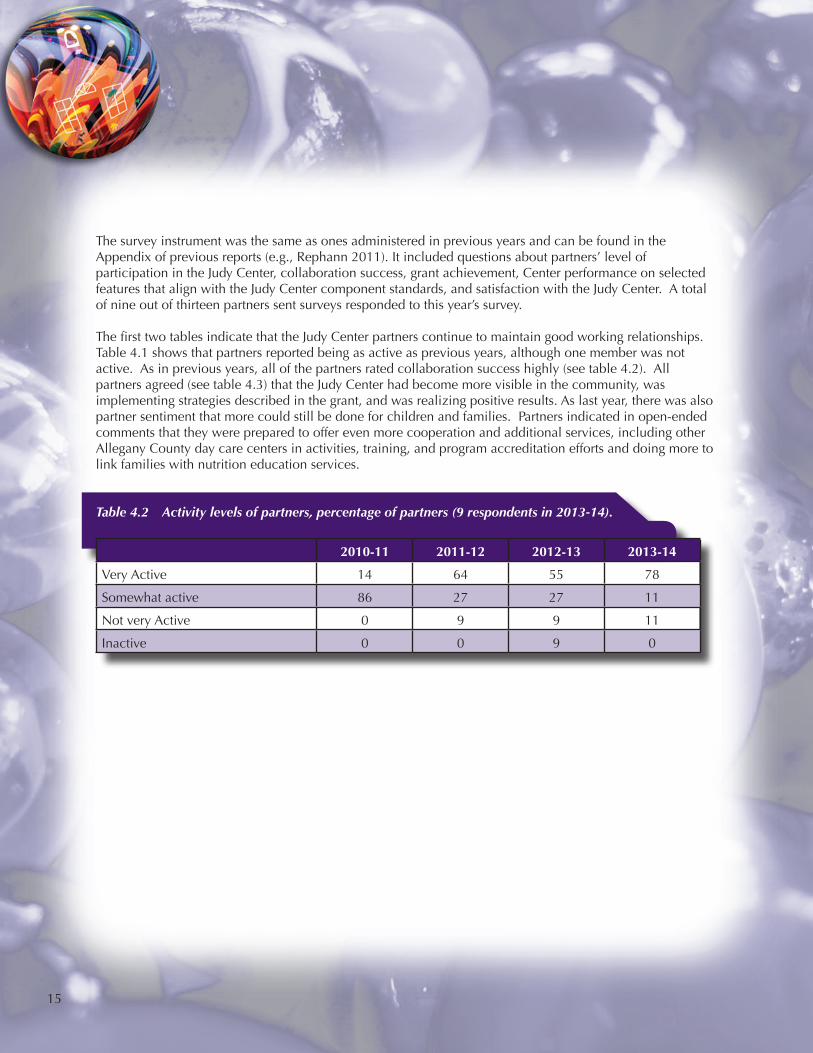
The survey instrument was the same as ones administered in previous years and can be found in the Appendix of previous reports (e.g., Rephann 2011). It included questions about partners’ level of participation in the Judy Center, collaboration success, grant achievement, Center performance on selected features that align with the Judy Center component standards, and satisfaction with the Judy Center. A total of nine out of thirteen partners sent surveys responded to this year’s survey.
The first two tables indicate that the Judy Center partners continue to maintain good working relationships. Table 4.1 shows that partners reported being as active as previous years, although one member was not active. As in previous years, all of the partners rated collaboration success highly (see table 4.2). All partners agreed (see table 4.3) that the Judy Center had become more visible in the community, was implementing strategies described in the grant, and was realizing positive results. As last year, there was also partner sentiment that more could still be done for children and families. Partners indicated in open-ended comments that they were prepared to offer even more cooperation and additional services, including other Allegany County day care centers in activities, training, and program accreditation efforts and doing more to link families with nutrition education services.
Table 4.2 Activity levels of partners, percentage of partners (9 respondents in 2013-14).
2010-11 2011-12 2012-13 2013-14
Very Active 14 64 55 78
Somewhat active 86 27 27 11
Not very Active 0 9 9 11
Inactive 0 0 9 0

16
Table 4.3 Collaboration success, percentage of partners agreeing (9 respondents in 2013-14).
10-11 11-12 12-13 13-14
The composition of the Steering Committee members is appropriate for making Judy Center decisions.
100 100 100 100
The Judy Center staff communicated openly and clearly during meetings.
100 100 100 100
The Judy Center staff communicated openly and clearly between meetings.
100 100 100 100
Member of the Judy Center staff established informal communication networks (e-mail communication, phone calls, etc.)
100 100 100 100
I understand the goals and objectives of the Judy Center project
100 100 100 100
I understand my roles and responsibilities as a member of this project
100 100 100 100
The Judy Center team has clear and effective decision making procedures.
100 100 100 100
Table 4.4 Goal success, percentage of partners (9 respondents in 2013-14).
10-11 11-12 12-13 13-14
Community awareness of the Judy Center has increased in the past year.
100 100 100 100
Resources for this project were adequate to meet objectives.
100 100 91 100
The strategies of this grant have been implemented. 100 100 100 100
The strategies of this grant are demonstrating positive outcomes.
100 100 100 100
Enough is being done to help families with their needs. NA NA 60 88
Enough is being done to help children be successful in school.
NA NA 55 88
Table 4.4 shows partner assessment of various features of the Judy Center. The ratings all of the characteristics were high.

Table 4.5 Performance area ratings, percentage of partners (4=Excellent, 3=Good, 2=Minimal, 1=Inadequate, 0=NA/Don’t Know) (9 respondents in 2013-14).
(4) (3) (2) (1) (0)
a. Child care before or after school care 100 0 0 0 0
b. Array of child and family support services on site 100 0 0 0 0
c. Array of child services for all ages (e.g., infants and toddlers, pre-k, multi-age, kindergarten)
100 0 0 0 0
d. Free summer camp for children 78 11 0 0 11
e. Screening for disabilities 89 11 0 0 0
f. Provision of services for children with disabilities 89 11 0 0 0
g. Health services (e.g., Dental assessment, vision/hearing screening)
89 11 0 0 0
h. Friendliness/helpfulness of staff 100 0 0 0 0
i. Activities for parents and families (e.g., field trips, family literacy nights, infant & toddler playgroups)
100 0 0 0 0
j. Education programs for families (e.g., parenting workshops, GED classes)
89 11 0 0 0
k. Information provided by Judy Center about upcoming activities
100 0 0 0 0
l. Food and nutrition assistance (e.g., WIC) 89 11 0 0 0
Table 4.5 shows partner satisfaction compared to the previous three. All of the partners expressed that they were “satisfied” or “very satisfied” with the Center.
Table 4.6 Partner satisfaction with Judy Center, percentage of partners (9 respondents in 2013-14).
2010-11 2011-12 2012-13 2013-14
Very Satisfied 86 82 82 89
Satisfied 14 18 18 11
Somewhat Satisfied 0 0 0 0
Somewhat Dissatisfied 0 0 0 0
Not Satisfied at All 0 0 0 0
17

5.0 Teacher Surveys
Teacher surveys used to obtain feedback from staff in kindergarten/pre-school. The survey is similar to those used in previous years and is included in those reports. It asks about teacher background, satisfaction with school resources and staff and parent involvement, Center performance on Judy Center component standard areas, and overall satisfaction with the Center. Nine of the 12 surveyed teachers at South Penn and Beall Elementary responded. As table 5.1 shows this year’s teacher pool contains two relatively new teachers. The others have substantial prior teaching experience.
Table 5.1 Years teaching, percentage of teachers (8 respondents).
1-2 25
3-5 0
5-10 25
11-15 12
16 or more 38
Table 5.2 shows that pre-k teachers are generally satisfied with resources, support and collaboration, professional development opportunities, and parental involvement. However, the lowest relative rating was again this year obtained for the category of professional development opportunities with only three-fourths indicating that they were only “somewhat satisfied.” Table 5.3 shows that many categories received “Don’t know” ratings, including after and before school child care, family case management, field trip experiences, and education programs for families. Curiously, this unfamiliarity increased over last year at the same time as services were expanded at the South Penn Elementary site. Table 5.4 indicates that teachers perceived resources at the Judy Center to excellent on average. However, adequacy of materials for music, physical education, and parent and family were more likely to be rated “good” rather than “excellent” compared to last year. In the comments section of the survey, two Beall Elementary teachers expressed concern that resources and programs were being moved out of the Beall Elementary site to South Penn Elementary and wondered what impact it would have on their students.
Table 5.2 Pre-K Teacher satisfaction, percentage of teachers (5=Very Satisfied, 3=Somewhat Satisfied, 1=Not Satisfied) (8 respondents).
(5) (4) (3) (2) (1)
Quality of classroom equipment 50 38 12 0 0
Judy Center support 50 38 12 0 0
Professional development opportunities 0 25 75 0 0
Collaboration with other teachers 88 12 0 0 0
Collaboration with early childhood agencies 25 63 12 0 0
Level of parental involvement in children’s education 0 63 37 0 0
18

Table 5.3 Performance area ratings, percentage of teachers (4=Excellent, 3=Good, 2=Minimal, 1=Inadequate, 0=NA/Don’t Know) (8 respondents).
(4) (3) (2) (1) (0)
a. Support from Judy Center staff 100 0 0 0 0
b. Behavioral support 63 13 25 0 0
c. Child care before or after day 25 0 0 0 75
d. Family case management (lunch, breakfast) 0 25 13 0 63
e. Array of child and family support services on site 25 63 0 0 13
f. Array of child services for all ages (e.g., infants and toddlers, pre-k, kindergarten)
100 0 0 0 0
g. Screening for disabilities 63 37 0 0 0
h. Provision of services for children with disabilities 100 0 0 0 0
i. Providing a variety of field trip experiences 13 25 13 0 50
j. Health services (e.g., immunizations, dental assessment vision/hearing screening)
87 13 0 0 0
k. Friendliness/helpfulness of staff and teachers 63 37 0 0 0
l. Education programs for families 13 0 0 0 87
m. Progress reports and conferences 63 37 0 0 0
n. Judy Center newsletter 100 0 0 0 0
o. Information about upcoming activities 100 0 0 0 0
19

Table 5.4 Adequacy of materials at Judy Center (4=Excellent, 3=Good, 2=Minimal, 1=Inadequate, 0=NA/Don’t Know) (9 respondents).
(4) (3) (2) (1) (0)
a. Activities/materials for learning art 100 0 0 0 0
b. Activities/materials for learning music 63 37 0 0 0
c. Activities/materials for learning PE 50 50 0 0 0
d. Activities/materials for learning language/reading/writing
100 0 0 0 0
e. Activities/materials for learning nature/science 87 13 0 0 0
f. Activities/materials for learning math 100 0 0 0 0
g. Activities/equipment for learning to use computers 63 37 0 0 0
h. Materials for learning and play 100 0 0 0 0
i. Activities for parents and families 75 25 0 0 0
All teaching staff felt that families served by the Judy Center were satisfied” with the Judy Center (see table 5.5). These ratings were similar to last years.
Table 5.5 Feeling of families served by Judy Center, percentage of teachers (N=9).
2010-11 2011-12 2012-13 2013-14
Very Satisfied 38 77 73 75
Satisfied 50 23 27 25
Somewhat Satisfied 12 0 0 0
Somewhat Dissatisfied 0 0 0 0
Don’t Know 0 0 0 0
20

6.0 Parent Surveys
Two parent surveys were administered during the school year. The survey instruments were similar to previous years and can be found in previous year reports. The fall survey collected information on family resources and attitudes for use in designing curriculum improvements and outside activities for the school year. The spring survey collected information on parent satisfaction with various features of the Judy Center, parental assessments of child development during the school year, and information on family resources and attitudes.
Table 6.1 shows the characteristics of Judy Center parent respondents to the fall survey based on the 182 respondents out of 301 surveys distributed (for a response rate of 60 percent). There were 108 respondents out of 147 distributed at Beall Elementary (for a response rate of 73 percent) and 74 respondents at South Penn (for a response rate of 48 percent). Most parents (81%) have only one child enrolled in the Center. But, the characteristics of Beall and South Penn respondents differ in notable ways. South Penn respondents were older and more likely to report being homemakers. They were less likely to report having Bachelors degrees or higher levels of educational attainment. They were also more likely to report having children enrolled in the Judy Center who had special needs. When compared to previous years, Beall Elementary respondents were younger, and had somewhat lower levels of educational attainment and homeownership rates. The typical Beall Elementary Judy Center survey respondent has a socioeconomic level higher than the average Allegany County resident and the average South Penn respondent a lower socioeconomic level.
Table 6.1 Respondent characteristics, percentage of parents by school, Fall 2013 (108 respondents for Beall and 74 respondents for South Penn).
Age Beall South Penn Total
15-19 1 0 1
20-24 19 10 15
25-29 37 32 35
30-34 23 34 27
35-39 9 10 10
40+ 11 14 12
Gender Beall South Penn Total
Male 12 5 9
Female 88 95 91
21
Continued on next page

Employment Status
Employed full-time 56 39 49
Employed Part-time 19 19 19
Not Employed and seeking job 14 12 13
Not Employed and not seeking job 1 2 1
Homemaker 5 20 12
Student/business owner 5 8 6
Marital Status
Married 51 47 49
Single 39 45 41
Divorced 9 8 9
Widowed/Widower 1 0 1
Educational level
Some high school 5 11 7
High school diploma 24 31 27
GED 4 4 4
Some College 33 27 30
Associates Degree 9 20 14
Bachelor’s degree or higher 25 7 18
Own or rent home
Own 51 46 49
Rent 40 46 42
Live with relatives 9 8 9
22
Table 6.1 Respondent characteristics, percentage of parents by school, Fall 2013 (108 respondents for Beall and 74 respondents for South Penn).
Continued from previous page
Continued on next page

Table 6.1 Respondent characteristics, percentage of parents by school, Fall 2013 (108 respondents for Beall and 74 respondents for South Penn).
Continued from previous page
Number of children
One 81 73 81
Two 19 16 18
Three 0 2 1
Special needs
Yes 25 45 34
No 75 55 66
Parents were surveyed about the availability of learning support materials in the household and parental participation in learning activities as in similar years (see table 6.2). A similar percentage of Beall Elementary parents to previous years reported having books, magazines, and other learning materials at home. Lower percentage reported such resources at South Penn, with the largest gaps in computer ownership and Internet access.
At each Judy Center site, nearly all parents reported “frequently” praising their children for doing well and nearly all sit and talk with their children about their day. Nine in ten reported eating dinner together as a family (see table 6.3). Eight in ten in ten played with toys or played games with their children and three quarters read to their children. Five in ten parents “frequently” visited a playground, park, or went on a picnic with their children. Three in ten parents reported attending an event hosted by a community or religious group. Slightly lower percentages of parents said that they visited a public library or museum with their child than did last year.
23

24
Table 6.2 Learning/reading materials at home, percentage of parents, Fall 2013 (108 respondents for Beall and 74 respondents for South Penn).
Beall South Penn Total
Children’s books 100 97 99
Magazines for children 53 50 52
Adult books 75 69 73
Newspapers 49 38 45
Television 93 91 92
Home computer 82 70 77
Computer with Internet Access 82 68 76
Table 6.3 Activities with children, percentage of parents, Fall 2013 (108 respondents for Beall and 74 respondents for South Penn)
Beall Elementary
Frequently Sometimes Rarely Never NA
Read a story. 82 16 2 0 0
Played with toys or played games. 86 13 1 0 0
Praised your child for doing well. 98 2 0 0 0
Visited public library or museum. 10 38 42 10 0
Visited a playground, park, or went on a picnic.
53 44 3 0 0
Eat a meal together as a family. 91 7 2 0 0
Attended an event hosted by a community or religious group.
29 39 25 7 0
Sit and talk to your child about his/her day.
93 7 0 0 0
Continued on next page

South Penn Elementary
Frequently Sometimes Rarely Never NA
Read a story. 77 22 1 0 0
Played with toys or played games. 77 23 0 0 0
Praised your child for doing well. 96 4 0 0 0
Visited public library or museum. 9 46 30 15 0
Visited a playground, park, or went on a picnic.
47 52 1 0 0
Eat a meal together as a family. 91 9 0 0 0
Attended an event hosted by a community or religious group.
34 43 15 5 3
Sit and talk to your child about his/her day.
95 5 0 0 0
Total
Frequently Sometimes Rarely Never NA
Read a story. 80 18 2 0 0
Played with toys or played games. 82 17 1 0 0
Praised your child for doing well. 97 3 0 0 0
Visited public library or museum. 10 41 37 12 0
Visited a playground, park, or went on a picnic.
51 47 2 0 0
Eat a meal together as a family. 91 8 1 0 0
Attended an event hosted by a community or religious group.
31 41 21 6 1
Sit and talk to your child about his/her day.
94 6 0 0 0
25
Table 6.3 Activities with children, percentage of parents, Fall 2013 (108 respondents for Beall and 74 respondents for South Penn).
Continued from previous page

The spring survey received 49 responses from the Beall Elementary site and 32 responses from the South Penn site for a total of 81 responses (out of 301 total parents for a response rate of 27 percent). The response rate for Beall Elementary was 33 percent and for South Penn was 21 percent. The answers are tabulated in tables 6.4-6.10. Table 6.4 and Figure 6.1 show that parent satisfaction with the Judy Center remains high at 93 percent. However, the percentage reporting that they were “very satisfied” was the lowest since 2003. The percentage that reported they were “very satisfied” with the South Penn site was slightly higher than for the Beall Elementary site and a significant improvement from 61 percent achieved in 2012-13 (see Table 6.5). However, the Beall Percentage (63%) was significantly lower than the 85 percent achieved in that year.
26
0
10
20
30
40
50
60
70
80
90
100
2002
2003
2004
2005
2006
2007
2008
2009
2010
2011
2012
2013
2014
Perc
enta
ge
Figure 6.1 Parent Satisfaction, 2002-2014
Don't Know Not Satisfied at All Somewhat Dissatisfied Somewhat Satisfied Satisfied Very Satisfied
Figure 6.1 Parent Satisfaction, 2002-2014

Table 6.4 Satisfaction with Judy Center services, percentage of parents, Spring 2006-Spring 2014 (49 respondents for Beall and 32 respondents for South Penn).
2009 2010 2011 2012 2013 2014
Very Satisfied 78 87 79 70 76 65
Satisfied 19 9 15 20 21 28
Somewhat Satisfied 0 1 3 1 0 0
Somewhat Dissatisfied 0 0 0 0 0 0
Not Satisfied at All 0 0 0 0 0 0
Don’t know/Confused or uniformed about the services provided
0 0 1 1 2 0
Don’t know/No feeling about the center
3 0 3 8 2 6
Table 6.5 Satisfaction with Judy Center services by site, percentage of parents, Spring 2014.
Beall South Penn Total
Very Satisfied 63 69 65
Satisfied 31 25 28
Somewhat Satisfied 0 0 0
Somewhat Dissatisfied 0 0 0
Not Satisfied at All 0 0 0
Don’t know/Confused or uniformed about the services provided
0 0 0
Don’t know/No feeling about the center 6 6 6
Table 6.6 shows parent satisfaction with various features of the Judy Center at each site. Satisfaction at all sites was generally high for both sites. The percentage reporting features as “excellent” increased in seven of the ten categories for south Penn Elementary but only three of the ten for Beall Elementary. In open-ended comments, several parents also identified a desire for additional services such as day care expansion, an infant program, anger management training, additional activities, and assistance with transportation (see Appendix A.1 and A.2).
27

Table 6.6 Satisfaction with Judy Center in performance areas, percentage of parents (E=Excellent, G=Good, M=Minimal, I=Inadequate, A=Not applicable/Not available), Spring 2014 Beall Elementary (49 respondents) and South Penn (32 respondents).
Beall Elementary
(E) (G) (M) (I) (NA)
Family case management 37 26 2 0 35
Behavior management 57 24 2 0 17
Provision of services for children with disabilities 48 13 0 0 39
Health services 78 20 0 0 2
Friendliness/helpfulness of staff/teachers 80 17 0 0 2
Supervision of children/discipline 74 22 0 0 4
Materials for learning and play 65 30 0 0 4
Activities for parents and families 64 27 2 0 7
Education programs for families 47 22 2 0 29
Information provided by Center about upcoming activities
63 35 0 0 2
South Penn Elementary
(E) (G) (M) (I) (NA)
Family case management 38 12 0 0 40
Behavior management 38 19 0 0 42
Provision of services for children with disabilities 38 4 4 0 54
Health services 77 11 0 0 12
Friendliness/helpfulness of staff and teachers 81 11 0 0 8
Supervision of children/discipline 65 11 0 4 19
Materials for learning and play 76 16 0 0 8
Activities for parents and families 85 15 0 0 0
Education programs for families 54 15 0 0 31
Information provided by Center about upcoming activities
81 19 0 0 0
28

Table 6.7 shows that sixty-five percent of the Beall Elementary parents and eighty-six percent of South Penn Elementary parents “frequently” read flyers and newsletters, which are sent home with the children. Fifty-one percent of Beall parents reported that they “frequently” attended parent-teacher conference while seventy-two percent of South Penn parents reported doing so. In general, the South Penn site engagement levels were higher and Beall slightly lower than last year.
Table 6.7 Parent participation in Judy Center activities, percentage of parents, Spring 2014, (49 Beall Respondents and 32 South Penn Respondents).
Frequently Sometimes Rarely Never NA
Beall Elementary Site
Volunteering in classroom or participated in parent/child activity during day
17 41 20 17 4
Attended parent-teacher conference 51 29 2 11 7
Read JC flyer/newsletter 65 33 0 0 2
Attended School Readiness Fair 4 11 13 59 13
South Penn Site
Volunteering in classroom or participated in parent/child activity during day
14 25 7 50 4
Attended parent-teacher conference 72 3 7 14 3
Read JC flyer/newsletter 86 7 7 0 0
Attended School Readiness Fair 14 11 3 61 11
29

30
Table 6.8 indicates that parents continue to see substantial improvements in child learning and habits because of the Judy Center. The biggest improvements were in areas similar to previous years: counting numbers, recognizing letters of the alphabet, speaking, articulation, and vocabulary, and writing and drawing. The percentage of parents reporting “much” improvement increased in seven of the eight areas for South Penn Elementary over last year.
Table 6.8 Improvement in child learning and habits because of the Judy Center, Spring 2014, (49 Beall Respondents and 32 South Penn Respondents).
Much A little Not at All NA
Beall Elementary Site
Counting numbers 85 13 2 0
Recognizing letters of the alphabet 96 2 2 0
Writing/Drawing 83 17 0 0
Speaking and articulation 87 13 0 0
Vocabulary 89 11 0 0
Asking to be read to 69 22 7 2
Eating nutritious and healthy meals 53 33 9 4
Behavior/following routines 48 41 7 5
South Penn Elementary Site
Counting numbers 93 7 0 0
Recognizing letters of the alphabet 90 7 0 3
Writing/Drawing 82 18 0 0
Speaking and articulation 86 14 0 0
Vocabulary 89 11 0 0
Asking to be read to 76 17 7 0
Eating nutritious and healthy meals 46 39 11 4
Behavior/following routines 46 39 14 0

Table 6.9 shows parent ratings of Judy Center activities. These ratings are generally very positive. Over 60 percent of parents rated dental screenings as excellent at each site. Most parents were unable to rate summer camp, the School Readiness Fair, Infant and Toddler Playgroups, Infant Massage Classes, and Parent Café.
Table 6.9 Ratings of Judy Center activities (E=Excellent, G=Good, M=Minimal, I=Inadequate, A=Not applicable/Not available), (49 Beall Respondents and 32 South Penn Respondents).
(E) (G) (M) (I) (NA)
Beall Elementary Site
Free Lions Club vision screenings 63 28 0 0 9
Free dental screenings 68 28 0 2 2
Judy Center summer camp 35 9 0 0 56
Pre-K and K trip to FSU Cultural Events 56 22 2 0 20
K trip to “Jungle Book” 42 11 0 0 47
Monthly family literacy nights 30 7 5 0 58
School Readiness Fair 18 7 5 0 70
Infant and Toddler Playgroups 14 5 0 0 81
Infant Massage Classes 9 5 2 0 84
Parent Café 9 2 2 0 86
South Penn Site
Free Lions Club vision screenings 48 7 0 0 45
Free dental screenings 63 13 0 0 24
Judy Center summer camp 39 7 0 0 54
Pre-K and K trip to FSU Cultural Events 43 7 0 0 50
K trip to “Jungle Book” 48 0 4 0 48
Monthly family literacy nights 52 7 3 0 38
School Readiness Fair 25 7 0 0 68
Infant and Toddler Playgroups 18 0 0 0 82
Infant Massage Classes 11 0 0 0 89
Parent Café 11 0 0 0 89
31

7.0 Child Readiness ProgressEvidence on achievement towards milestones outlined in the Judy Center continuing grant application were reported in section 2. These milestones were based on separating Beall Elementary and South Penn Elementary site results. This section examines time trend readiness progress for the schools, domains, and student subcategories such as FARMS, Special Education, and students with previous Judy Center experience.
South Penn arrived at school with significantly higher readiness levels in fall 2013 than the previous year while Beall Elementary had similar readiness to last year. Therefore, the two locations combined improved to a 86.0 readiness level in 2013 (See Figure 7.1). This is slightly higher than the average readiness level of the Judy Center (85.4) over the period 2004-2012. FARMS students also saw significant readiness increases over the previous year in composite readiness while special education student readiness dropped to the lowest level (53.3%) of the 2004-2013 time period. Readiness in each domain improved over last year (see Figure 7.2). This improvement was evident in each domain for FARMS children also. However, Special Education children readiness dropped in each domain (see Figure 7.3).
32
Figure 7.1 Composite Kindergarten Readiness, All, FARMS, and Special Education, 2004-2013
30
40
50
60
70
80
90
100
2004 2005 2006 2007 2008 2009 2010 2011 2012 2013
Perc
ent R
eady
Figure 7.1 Composite Kindergarten Readiness, All, FARMS, and Special Education, 2004-2013
Judy Center--All
Judy Center--FARM
Judy Center--SPED
Maryland--All
Maryland--FARM
Maryland--SPED
Allegany--All
Allegany--FARM
Allegany--SPED

33
50
55
60
65
70
75
80
85
90
95
100
2004 2005 2006 2007 2008 2009 2010 2011 2012 2013
Perc
ent R
eady
Figure 7.2 Kindergarten Readiness by Domain for All Students, 2004-2013
Social and Personal Language and Literacy Mathematical Thinking Scientific Thinking Social Studies The Arts Physical Development Composite
0 10 20 30 40 50 60 70 80 90 100
Social and Personal
Language and Literacy
Mathematical Thinking
Scientific Thinking
Social Studies
The Arts
Physical Development
Composite
Percent Ready
Figure 7.3 Kindergarten Readiness by Domain, All, Farm, and Special Education, 2013
Total FARM Special Ed.
Figure 7.2 Kindergarten Readiness by Domain for All Students, 2004-2013
Figure 7.3 Kindergarten Readiness by Domain, All, FARM, and Special Education, 2013

34
South Penn Elementary was added as a new Judy Center site in 2012. Therefore, last year the students did not have exposure to the same array of early childhood services as Beall Elementary had. But, this year was different. This added exposure may help account for the rebound. However, South Penn Elementary readiness still lags Beall Elementary. These readiness lags (see Figure 7.4) extended to every domain except language and literacy.
Figure 7.4 indicates that Beall Elementary and South Penn pupils combined lagged their peers in Allegany County in terms of overall readiness but exceeded the state. Also, 89.2 percent of students with prior Judy Center experience enrolled at Beall Elementary were at full readiness in 2013, which is down slightly from the previous year level of 93 percent. (See Figure 7.5).
0
10
20
30
40
50
60
70
80
90
100
Social and Personal
Language and Literacy
Mathematical Thinking
Scientific Thinking
Social Studies
The Arts Physical Development
Composite
Perc
ent R
eady
Figure 7.4 Kindergarten Readiness by Domain by Judy Center School, 2013
South Penn Beall All
Figure 7.4 Kindergarten Readiness by Domain by Judy Center School, 2013

Figure 7.6 show that child-learning progress occurred during the 2013-2014 school year comparing only children in the spring that were also enrolled in the fall. Eighty-six percent of students entered at full-readiness in the fall, but ninety-five percent exited at full readiness in the spring as measured by the composite score. This exit readiness level was higher than that achieved last year (93.6%). Progress was charted in every single domain with the most notable progress in Language and Literacy, which increased from 20.58 percentage points (from 66.7 to 87.3 percent). Ninety-seven percent of Beall Elementary students were fully ready by spring 2014 as measured by the composite score compared to ninety-four percent of South Penn Elementary students.
35
50
55
60
65
70
75
80
85
90
95
100
2004 2005 2006 2007 2008 2009 2010 2011 2012 2013
Perc
ent R
eady
Figure 7.5 Composite Full Readiness, Judy Center, County, and State 2004-2013
Maryland Allegany Beall Elementary South Penn All Judy Center Prior Judy Center Experience
Figure 7.5 Composite Full Readiness, Judy Center, County, and State 2004-2013

MSA reading and math proficiency provides one measure of longer-term Judy Center benefits (see Figure 7.7). There were 54 third graders at Allegany County Schools who were enrolled in Judy Center pre-kindergarten during the 2010-11 school year. Approximately 70 percent achieved proficiency in reading and 80 percent achieved proficiency in math in 2014. Forty-seven of these students were enrolled at Beall Elementary for third grade and achieved proficiency levels of 77 percent for reading and 77 percent for math. These compare to proficiency rates of 70 percent and 79 percent in reading and math respectively for 10 third grade Beall students with no prior Judy Center experience. The Judy Center student proficiency rates were lower than what Beall Elementary students in third grade with Judy Center experience realized in 2013 for reading (86 percent) and the same for math (77 percent). They were also lower than all Allegany County third graders (80 percent for reading and 81 percent for math) but similar or higher than the State of Maryland (77 percent for reading and 74 percent for math) in 2014.
36
0 10 20 30 40 50 60 70 80 90 100
Social and Personal
Language and Literacy
Mathematical Thinking
Scientific Thinking
Social Studies
The Arts
Physical Development
Composite
Figure 7.6 Kindergarten Readiness by Domain for Fall 2013 (150 Students) and Spring 2014 (149 Students)
Fall Spring
Figure 7.6 Kindergarten Scores by Domain for Fall 2013 and Spring 2014

37
70.0
72.0
74.0
76.0
78.0
80.0
82.0
84.0
Reading Math
Perc
ent P
rofic
ient
Figure 7.7 Third Grade MSA Proficiency, 2014, Maryland, Allegany County, and Judy Center
Maryland Allegany All Third Grade--Beall Prior Judy Center Experience @ Beall Prior Judy Center Experience -- All Schools No Prior Judy Center Experience @ Beall
Figure 7.7 Third grade MSA proficiency, 2014, Maryland, Allegany County, and Judy Center

8.0 Special Research Questions
As part of the 2013-14 Judy Center continuation grant application, the Allegany County Board of Education posed two questions about child progress during the year:
u How has the introduction of Judy Center activities at South Penn Elementary impacted that location in terms of the various outcomes measures?
As mentioned previously, South Penn Elementary was added as a new Judy Center site in 2012. Therefore, students in 2012 did not have exposure to the full array of early childhood services as Beall Elementary had. This added exposure may help account for the rebound. South Penn Elementary readiness improved overall and in every (see Figure 8.1). Some of the domain improvements were substantial including The Arts (going from 30.8 percent readiness in 2012 to 72.8 percent in 2013), language and literacy (38.5 percent to 70.9 percent), social studies (47.7 percent to 77.9 percent), and social and personal (52.3 percent to 74.4 percent). Social and personal and language and literacy were targeted domains.
u What has been the effect on children who participated in summer JC activities at South Penn versus those who do not (controlling for enrollment in FARMS and Special Education)?
In previous Judy Center reports (2008 and 2010), we investigated the effect of summer school activities on Beall Elementary and John Humbird Elementary Kindergarten readiness levels. In those evaluations, we were not able to confirm a statistically significant correlation for summer school participation one we controlled for other factors such as Free and Reduced Meal (FARM) and Special Education (SPED) status. Table 8.2 shows a similar result for South Penn Elementary for 2013. Results are reported for the fall and spring/4th period composite scores. Results suggest that prior Judy Center experience (JCPART) is an important factor in fall Kindergarten child readiness, adding approximately 3 percentage points in fall and spring readiness. The regression coefficient on summer participation (SUMMER) is not statistically significant.
Table 8.1 Regression results, Fall and 4th Period composite scores for South Penn students.
Fall Composite 4th Period Composite
CONSTANT 78.974* 84.742*
FARM -1.667* -0.476
SPED -10.990* -7.266*
SUMMER -0.246 1.308
JCPART 2.685* 3.445*
R2 0.23 .20
Statistically significant at a =.10 level
38

0 10 20 30 40 50 60 70 80 90 100
Social and Personal
Language and Literacy
Mathematical Thinking
Scientific Thinking
Social Studies
The Arts
Physical Development
Composite
Percent Ready
Figure 8.1 South Penn Readiness by Domain, Fall 2012 and Fall 2013
2012 2013
Figure 8.1 South Penn Readiness by Domain, Fall 2012 and Fall 2013
39

9.0 Changes Introduced
The Judy Center will maintain most of the programming and activities that were used during the fiscal year 15 funding cycle. For both sites, Language and Literacy and Social and Emotional Development goals and objectives are outlined. Also, for Beall Elementary, goals and objectives for Scientific Thinking and Mathematical Thinking were added. Among the new or expanded activities to be conducted during the FY 2015 year are the following:
u The JC will provide a training to the Allegany Co. Librarians to help them know when and how to talk to parents about a suspected delay or other problem with their children.
u The Guidance Counselor will provide an evening parent training based on “bullying.”
u A number of math enhancements will be implemented at the Beall Elementary site to support improved learning for the Mathematical Thinking domain, including (a) a family math night, (b) distribution of math-on-the-go cards, (c) offering a math curriculum at the 5-week summer camp, (d) features in the JC newsletter on how parents can develop math skills at home, and (e) adding math materials to the classrooms.
u Several enhancements will be offered at the Beall Elementary site to support improved learning for the Scientific Thinking domain, including: (a) offering science activities in the 5-week summer camp, (b) offering a field trip to Wagner’s sugar camp and local farms that emphasize science skills and activities, and (c) features in the JC newsletter on science activities parents can do with their children.
u The 5-week South Penn and Beall summer camp will be increased to 7-weeks in length.
u Several new activities will be offered at the South Penn site including the establishment of an Infant & Toddler Playgroup to be held monthly, introduction of a holiday party held in conjunction with Family Support Services, and parent training by Family Junction.
u Evaluation standards have also been modified with goals and objectives now measured relative to the previous year’s benchmarks with incremental improvement expected.
40

10.0 Summary and conclusionsThe latest funding cycle (FY 2014) for the Allegany County Judy Center saw expanded services offered at its South Penn site. As in previous years, goals, objectives and activities were designed to enhance child readiness for FARMS students. The domains of focus were the same as the previous year for both sites (social and personal development and language and literacy) but mathematical literacy was dropped as a goal for South Penn Elementary.
Kindergarten child readiness levels improved from last year. One might attribute part of this rise to the expansion of services at South Penn Elementary. Students at the Beall Elementary site showed similar levels of readiness to previous years. Students with prior Judy Center experience showed high readiness levels according to the fall MMSR. These gains were not as evident by the third grade--third grade students at Beall Elementary who had previous Judy Center experience showed higher performance in reading but not the math portion of the MSA than other Beall Elementary students. These results suggest that the area of mathematical thinking should be the focus of additional focus.
Other measurements showed progress that was similar to previous years. Parent participation levels in Judy Center and partner sponsored activities continued to increase during the 2013-14 school year by over 27 percent from the previous year. Survey results are also positive. Partner surveys indicate a relatively high degree of participation and cooperation. Staff and parent surveys continue to show a satisfaction, though the percentage indicating that they were “very satisfied” decreased. Teachers continue to agree that the amount of resources and cooperation available were good and that teachers were satisfied with the Judy Center. However, some Beall Elementary teachers expressed concern that resources and programs were being moved out of the Beall Elementary site to South Penn Elementary and wondered what impact it would have on their students. Parents recognized improvements in their children’s learning and development during the year.
Progress toward goals and objectives in the Judy Center continuing grant application was mixed. The goals and objectives in the social and personal and language and literacy domains for South Penn Elementary are close to being met. The objectives milestones for the language and literacy and social and personal domains for Beall Elementary lagged the milestones established.
41

REFERENCES
Allegany County Board of Education. 2014. Continuation Grant Application for Judith P. Hoyer Early Child Care and Education Center Grants (Judy Centers). (June 2014)
Allegany County Board of Education. 2013. Continuation Grant Application for Judith P. Hoyer Early Child Care and Education Center Grants (Judy Centers). (June 2013)
Rephann, Terance. 2013. Allegany County Judy Center Evaluation: July 2012-June 2013.
Maryland State Department of Education. 2013. Children Entering School Ready to Learn: School Readiness Information. Baltimore: MSDE.
Maryland State Department of Education. 2013. Maryland Report Card. http://www.mdreportcard.org
42

A.1 Fall Parent Survey Comments on Additional Needs
44

Beall Elementary
A used computer.
Additional spots available for 1/2 day care and before school.
An infant program within the school.
South Penn Elementary
Anger management for children with anger problems and how parents can handle it.
Autism assistance if possible.
Extra stuff for parents and children to come to after school.
For my child to embrace his good characteristics and be well educated.
I need help with my electric bill.
Maybe something where kids and parent get together to do activities.
More activities parent/child can participate in
More information for the teachers about their students. It got old repeating information that is important about medical history such as the beginning of the year.
My child really loved summer camp and I hope there will be one next summer.
The continuance of existing programs, more funding for free all day early Headstart.
Transportation outside of Cumberland.
Transportation to summer activities.
Would like kids books.
46

A.2 Spring Parent Survey
48

50
In what ways has the Judy Center helped your child, you, and/or other members of the family?
BEALL ELEMENTARY
Educationally in all aspects.
Given my child nice opportunities for screenings and activities.
Has become more outgoing.
Head Start.
Her social skills have grown. Reading, writing, spelling and imagination have all blossomed! Very positive experience.
Her speech has improved. She knows her letters and numbers. She has learned to play well with other children.
I liked the vision and dental screens. I also believe the filed trips to plays/shows were good for the kids.
Made him enjoy school and advanced his learning at only age 4.
Makes it convenient for working parents w/o other family support or help.
Meeting other children, giving them a feel for school, getting them ready for kindergarten. Helped 3 of our children with learning preparing them for Kindergarten making friends.
Mrs. McCutcheon is a fabulous teacher who really cares. She has really helped my daughter learn and grow this year! Wish she could have had better technology like a
Smart Board or Smart Table.
My child has improved in all areas.
My son can talk in complete sentences, explain his day, count to 15, and repeat his ABCs--he’s only 3. This is the best place for kids!
No specific examples but the events have always been well organized and family oriented.
Provided opportunities to participate in activities would not normally do (i.e., field trips, plays).
Reading, ABC’s, Writing
She is more outgoing, helpful when home, reads more, wants to learn everything
She speaks better (more vocab/clearer speech). She recognizes letters, spells short words, counts well w/o mistakes
Socially, speech therapy in the past.
Speech.

Structured environment, improved social interaction. Provided full day schooling which prevented having to obtain child care for autistic child.
Summer camp.
Summer camp was a huge bonus to help her get ready for Pre-K.
The JC has helped to make my child feel welcome at school, especially in the beginning of the year when she had trouble adjusting. The JC provides free books and has allowed us to develop a library of books that we go back to again and again! Our kids can now read above grade level thanks to the emphasis on reading.
The learning information is helpful.
They have helped in getting my son the help he needs for his development delays also keeping me informed of his progress. They have helped me with getting information that I needed to improve our lives (i.e., college information, housing help). Getting my son interested in school.
They have helped set my kid into a Pre-K class that she would have otherwise missed out on and really needed. She is very shy and needed the social skills and thanks to them is coming out of her shell.
They have made me feel comfortable asking questions and assisted me in getting my son into programs that were beneficial to him.
They provided the environment my child needed to become more confident in his speaking and gave him a social setting to make new friends and become prepared for school.
SOUTH PENN
At summer camp, Xmas presents this year.
Behavior.
Better reader and writing and counting.
Field trips, classroom materials.
He is always eager to learn more. We communicate more often about our day and routine
He really likes to read and literacy night really excites him and makes him really want to read his books.
Helped with social skills, learning and getting a routine. It gave us an idea of what to expect in regular school
I have seen an excellent improvement in her reading and social skills.
Materials provided, summer camp.
More interested in activities. Doing more things together.
My child attended the summer school program. It is a wonderful program. He loved to go every day. It helped my child to keep for us during the summer.
51

52
My daughter enjoyed the summer camp that was offered and it helped prepare her for pre-K.
Pre-K has helped with social skills, learning, and separation anxiety.
Pre-K summer camp.
Provided many activities that keep her excited and interested in learning and school. The activities give us fun/educational things to do as a family
Reminding him the importance.
So many valuable programs/materials. I wish my work schedule allowed me to participate.
To learn and grow, both educationally and socially. It has given me relief to know that my child will be more ready for Kindergarten that I would have provided.
We started coming to the family literacy nights at South Penn. My kindergardner loves it. It has become a family activity for all of us. Even my middle schooler. Thank you. Bringing us together for family literacy night!
With general learning skills. Teach my daughter to help her sister
With his speech tremendously, one on one interaction, keeping me updated on what he working on so we can do the same at home. His dental, summer camp in 2013. He loved and also loved and it was a tremendous experience for him. I hope so much he can get into another program this summer even if it cost it was great for him. Teaching me the importance of keeping a child always in some kind of activity where they are not just running these streets with friends especially in the summer. The differences I see in him and others his age where this no strong foundation, stability and just reading talking and walking or riding bikes with your kids
In whatever way myself and my kids have participated in any activity or event. For me personally a little help with anything helps me a lot.
