allegheny county health department roger westman, ph.d manager, air quality program 2006
TRANSCRIPT
Allegheny County Health DepartmentAllegheny County Health Department
Roger Westman, Ph.D
Manager, Air Quality Program 2006
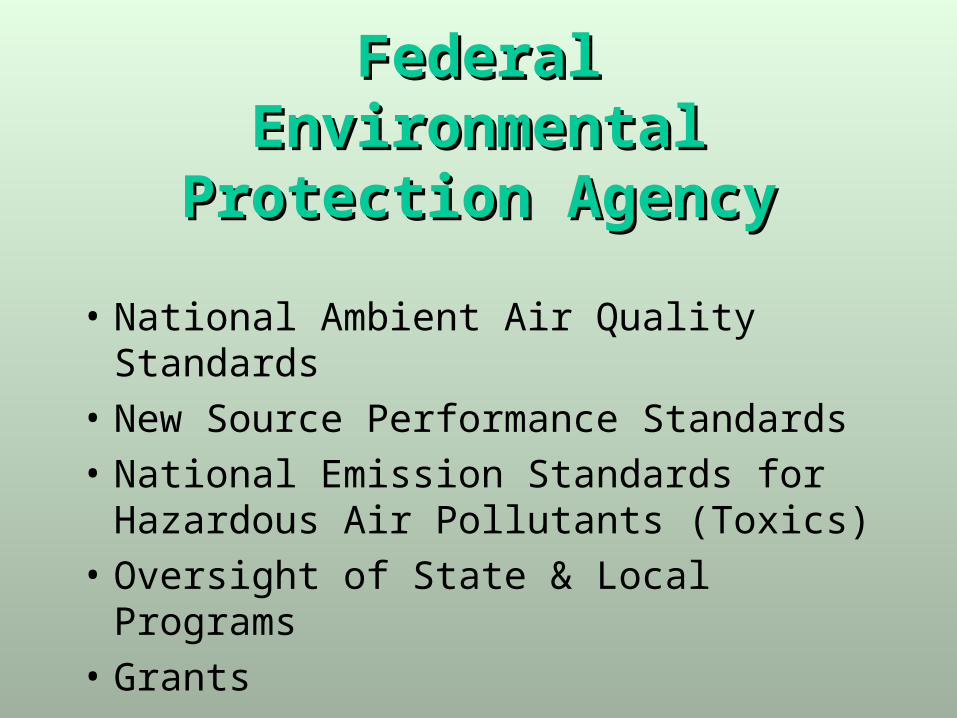
FederalFederalEnvironmental Protection Environmental Protection
AgencyAgency
• National Ambient Air Quality Standards
• New Source Performance Standards
• National Emission Standards for Hazardous Air Pollutants (Toxics)
• Oversight of State & Local Programs
• Grants
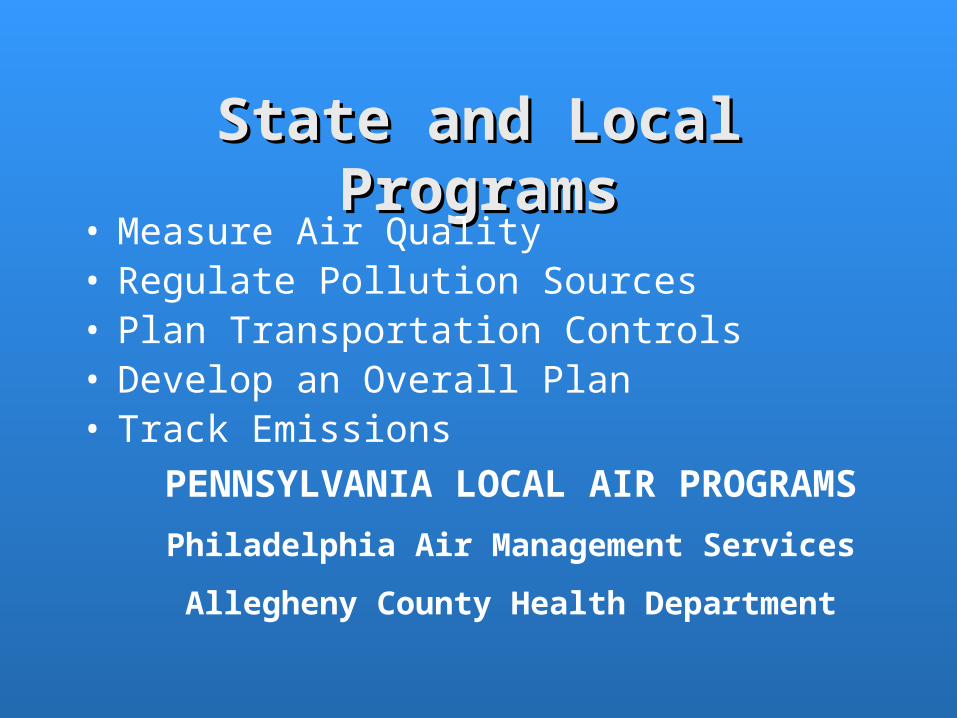
State and Local ProgramsState and Local Programs• Measure Air Quality• Regulate Pollution Sources• Plan Transportation Controls• Develop an Overall Plan• Track Emissions
PENNSYLVANIA LOCAL AIR PROGRAMS
Philadelphia Air Management Services
Allegheny County Health Department
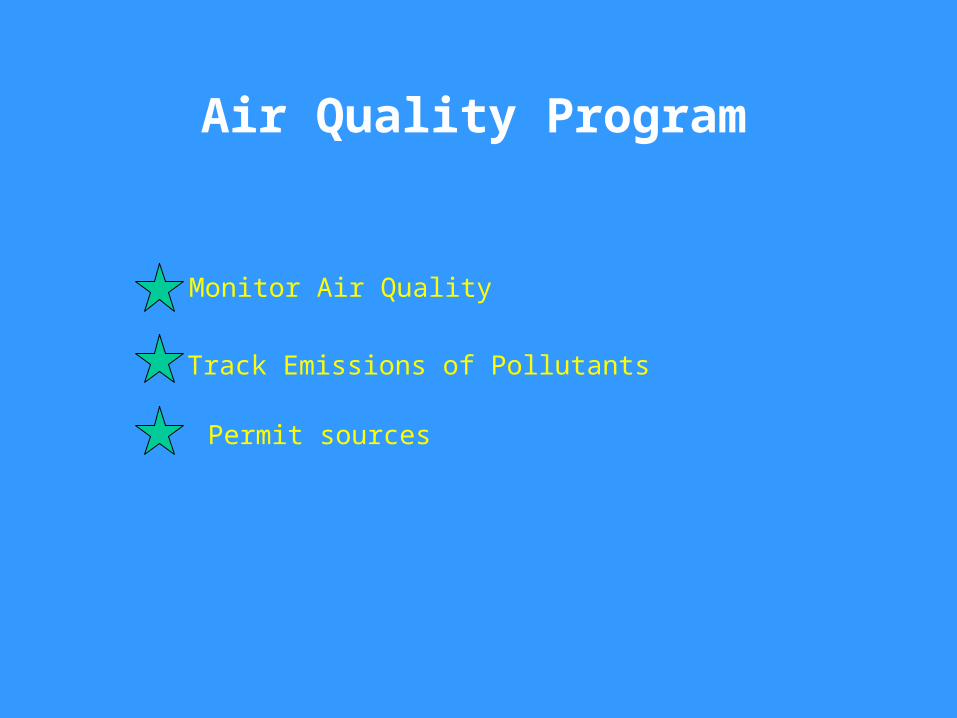
Air Quality Program
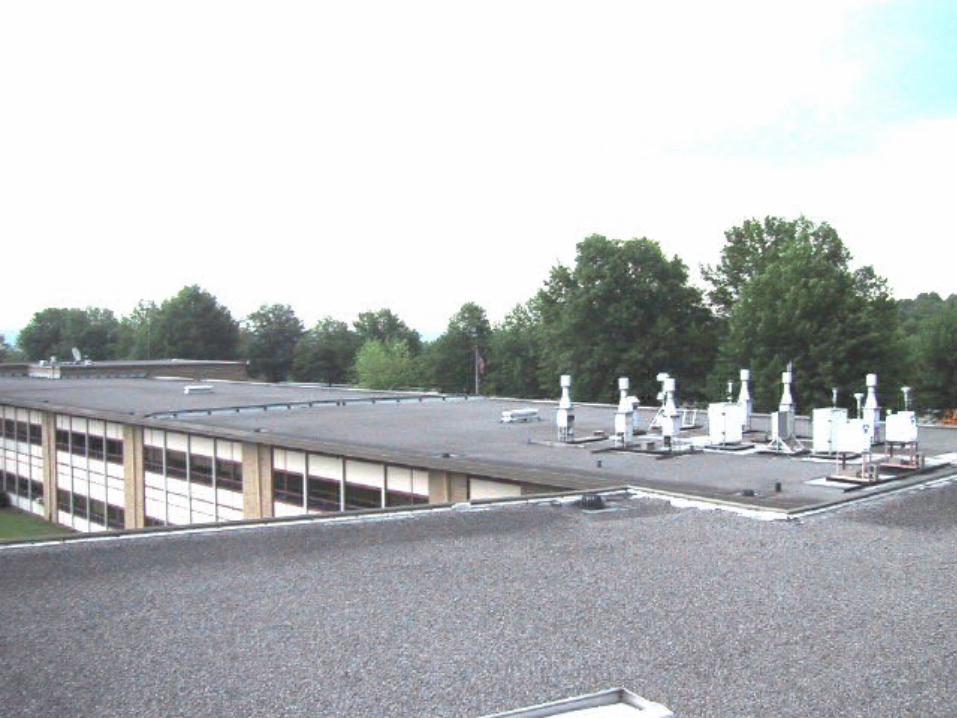
Monitor Air Quality

Air Quality Program
Monitor Air Quality
Track Emissions of Pollutants
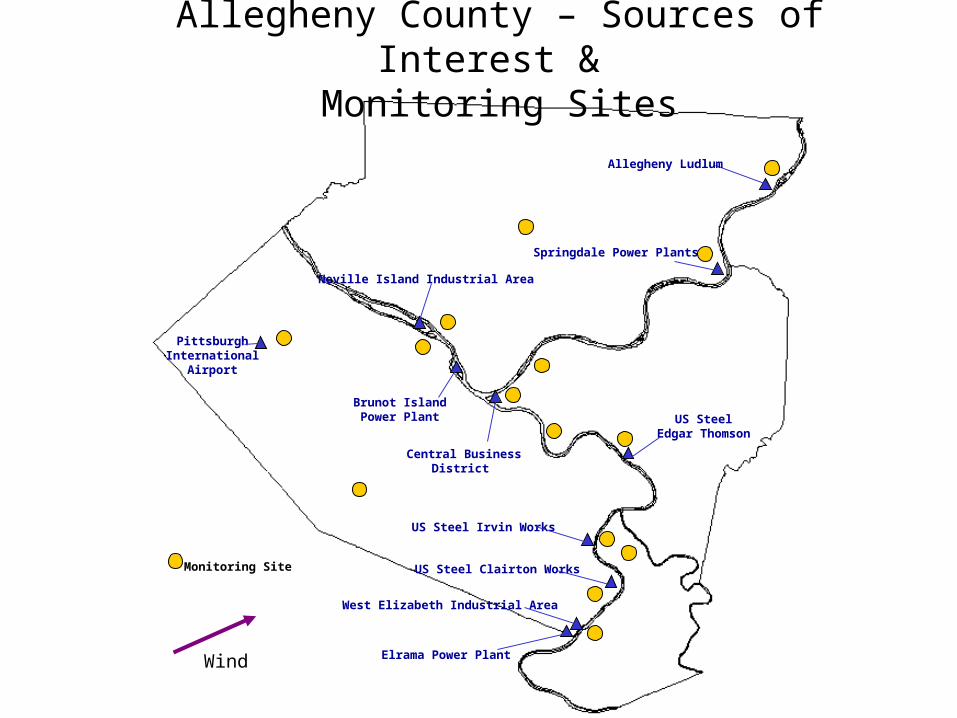
Elrama Power Plant
West Elizabeth Industrial Area
US Steel Clairton Works
US Steel Irvin Works
Central BusinessDistrict
PittsburghInternational
Airport
Neville Island Industrial Area
Springdale Power Plants
US SteelEdgar Thomson
Allegheny Ludlum
Brunot IslandPower Plant
Monitoring Site
Wind
Allegheny County – Sources of Interest & Monitoring Sites
Air Quality Program
Monitor Air Quality
Track Emissions of Pollutants
Permit sources

Air Quality Program
Monitor Air Quality
Track Emissions of Pollutants
Permit sources
Enforce Air Regulations
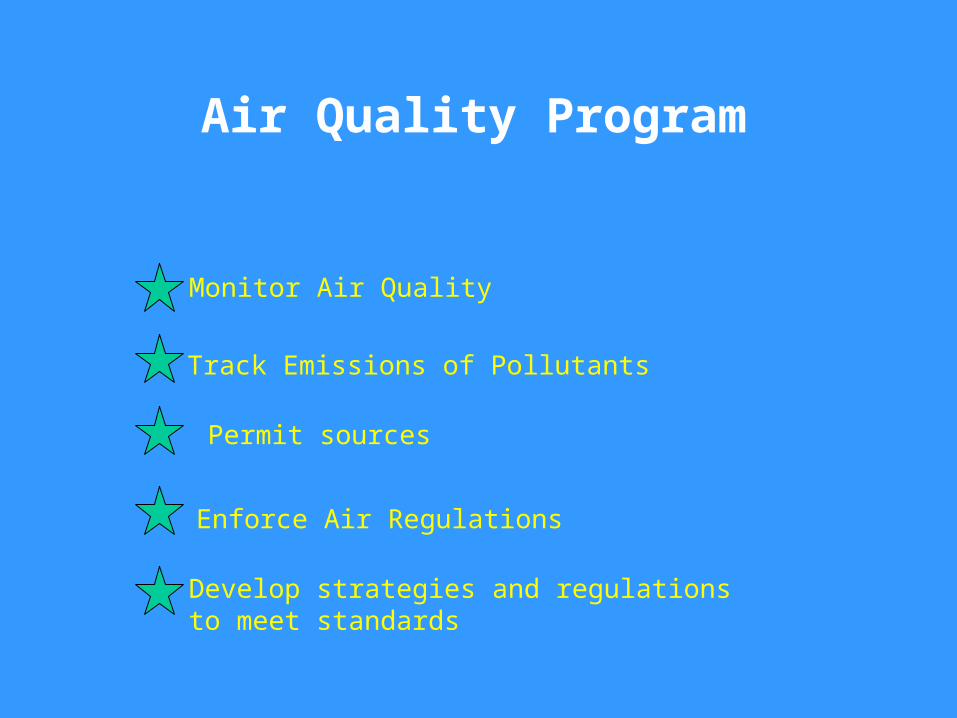
Air Quality Program
Monitor Air Quality
Track Emissions of Pollutants
Permit sources
Enforce Air Regulations
Develop strategies and regulations to meet standards

Reasons for Regulations
• State Implementation Plans• Federal Source Operating Permit Requirements• Installation Permits• Special Federal Control Programs• Toxic Air Pollutant Programs • Pennsylvania State Air Regulations• Local Needs
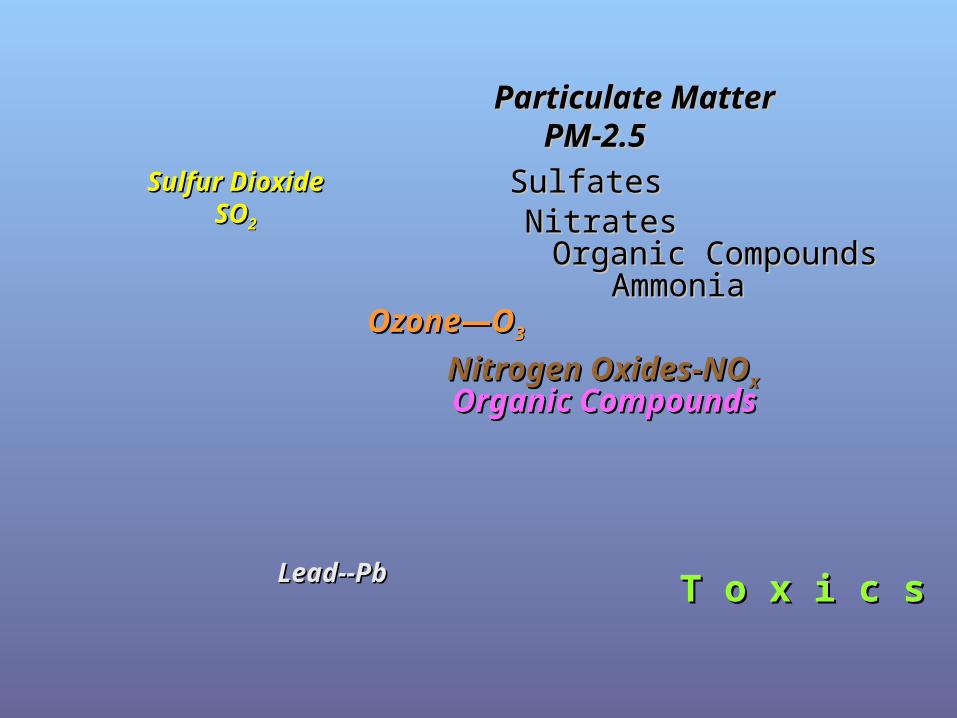
Sulfur DioxideSulfur DioxideSOSO22
Lead--PbLead--Pb
Ozone—OOzone—O33
Nitrogen Oxides-NONitrogen Oxides-NOxxOrganic CompoundsOrganic Compounds
Particulate MatterParticulate Matter PM-2.5PM-2.5
T o x i c sT o x i c s
SulfatesSulfatesNitratesNitrates
Organic CompoundsOrganic CompoundsAmmoniaAmmonia
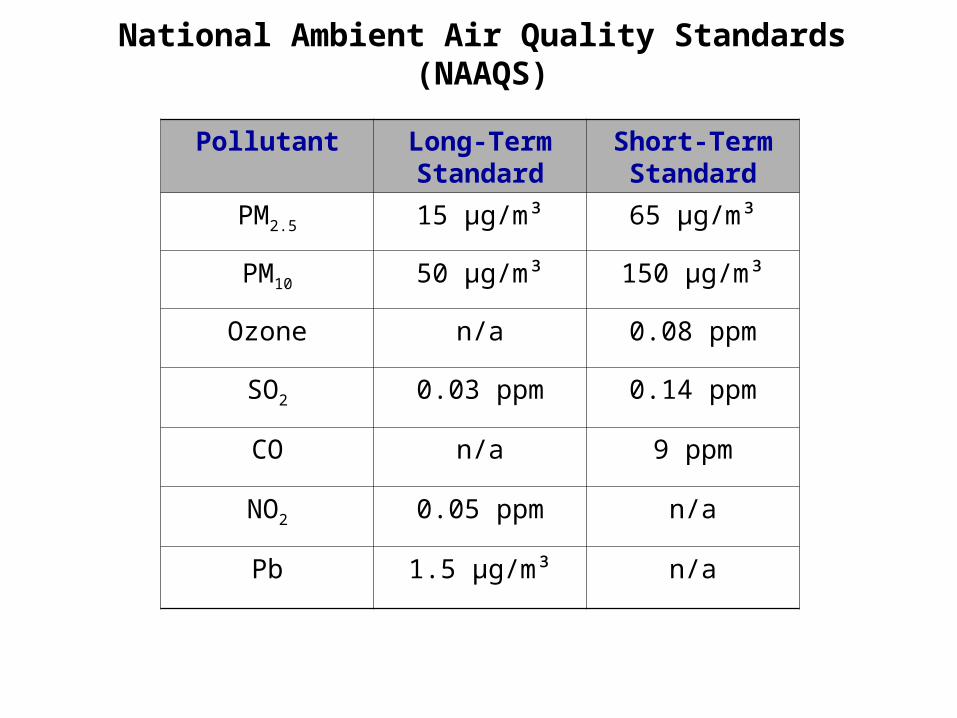
National Ambient Air Quality Standards (NAAQS)
Pollutant Long-Term Standard
Short-Term Standard
PM2.5 15 µg/m³ 65 µg/m³
PM10 50 µg/m³ 150 µg/m³
Ozone n/a 0.08 ppm
SO2 0.03 ppm 0.14 ppm
CO n/a 9 ppm
NO2 0.05 ppm n/a
Pb 1.5 µg/m³ n/a
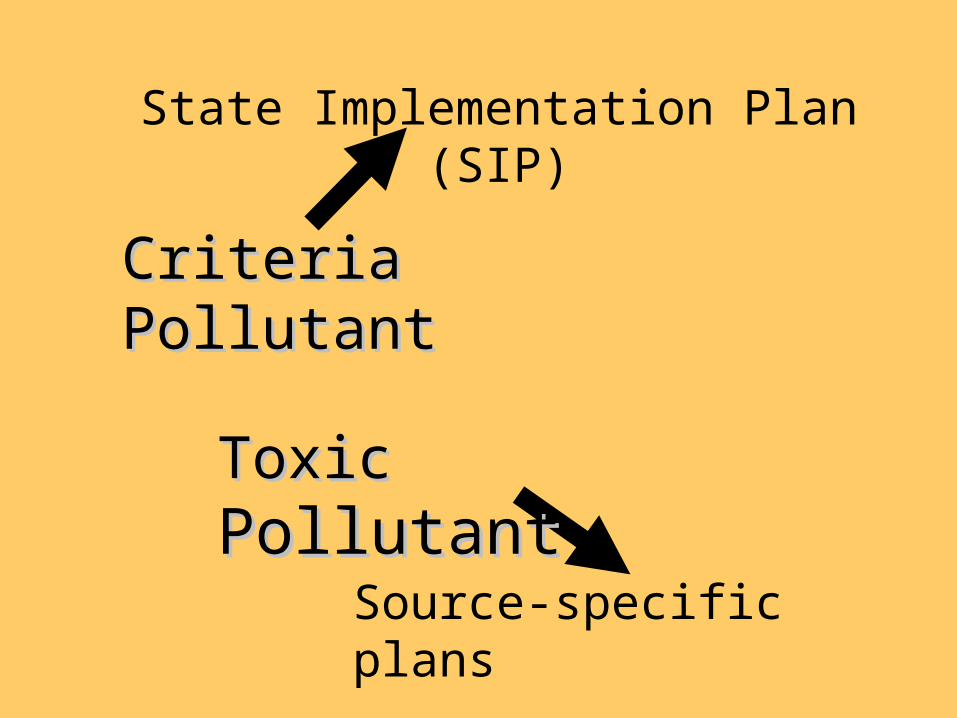
Criteria Criteria PollutantPollutant
State Implementation Plan (SIP)
Toxic Toxic PollutantPollutant
Source-specific plans

Successes:Successes:
Now meeting all the 1970’s and 1980’sNow meeting all the 1970’s and 1980’s
Air Quality StandardsAir Quality Standards
Challenges:Challenges:
Ozone – 8 hour standardOzone – 8 hour standard
PM-2.5PM-2.5

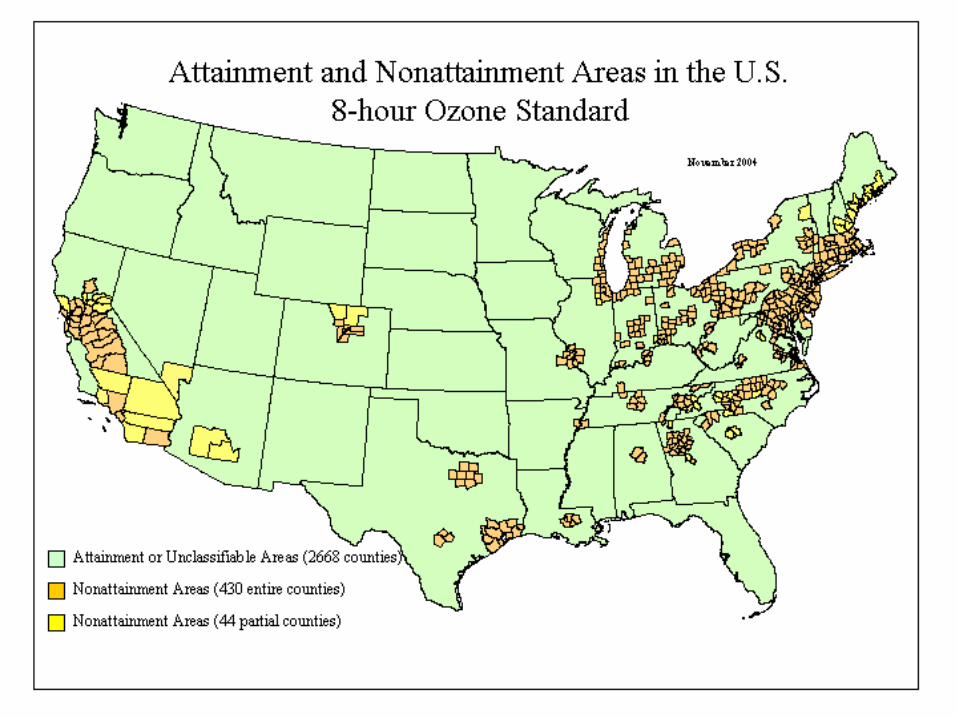
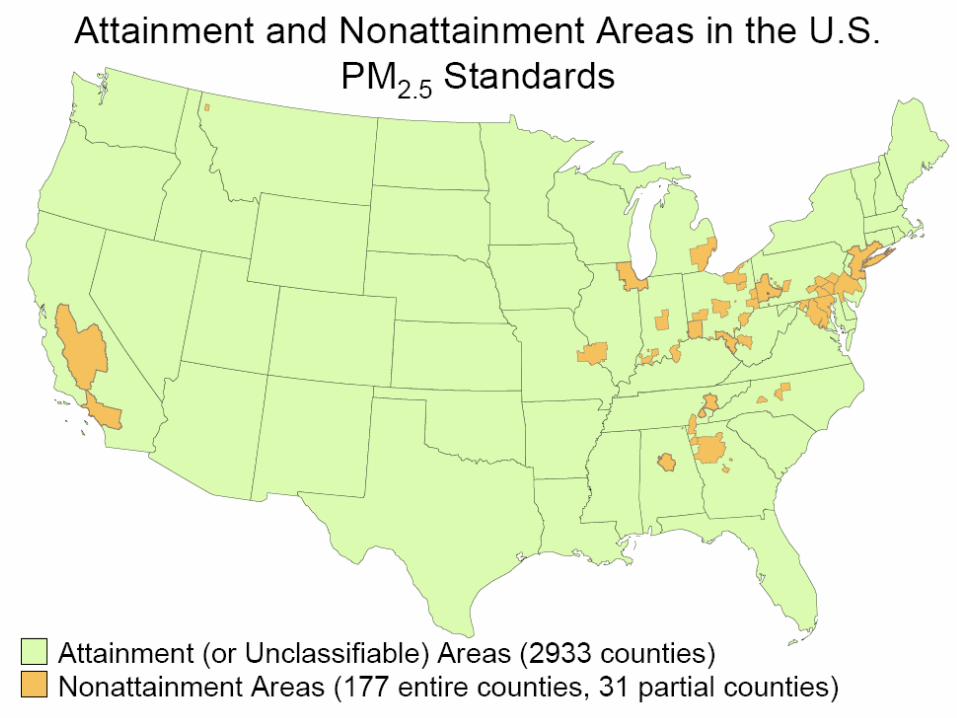
March 2005 Ozone and Fine Particle Nonattainment Areas
Nonattainment areas for both 8-hour ozoneand fine particle pollution
Nonattainment areas for fine particle pollution only
Nonattainment areas for 8-hour ozone pollution only
Source: EPA
Note: Southern California is the only area in the Western U.S. with red areas (both 8-hour ozone
and PM2.5)
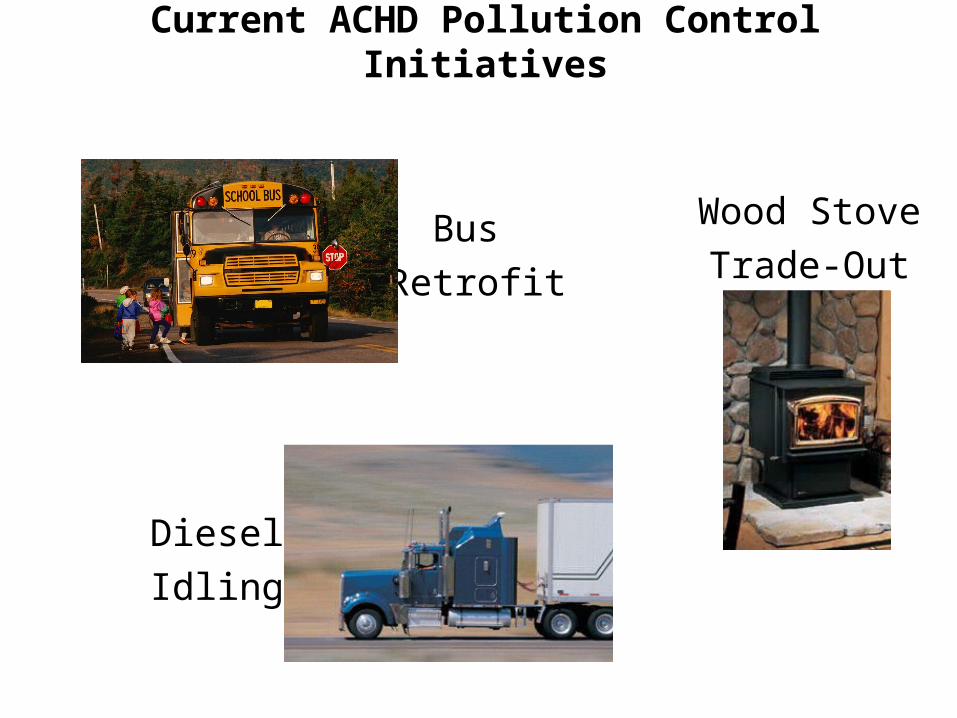
Current ACHD Pollution Control Initiatives
Wood Stove
Trade-OutBus
Retrofit
Diesel
Idling
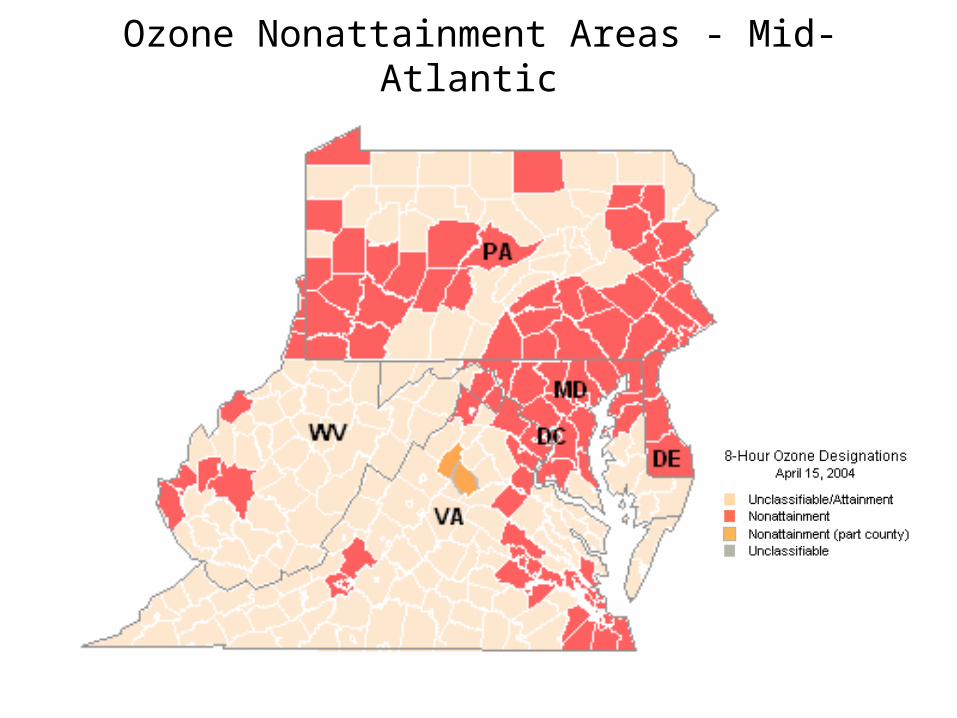
Ozone Nonattainment Areas - Mid-Atlantic
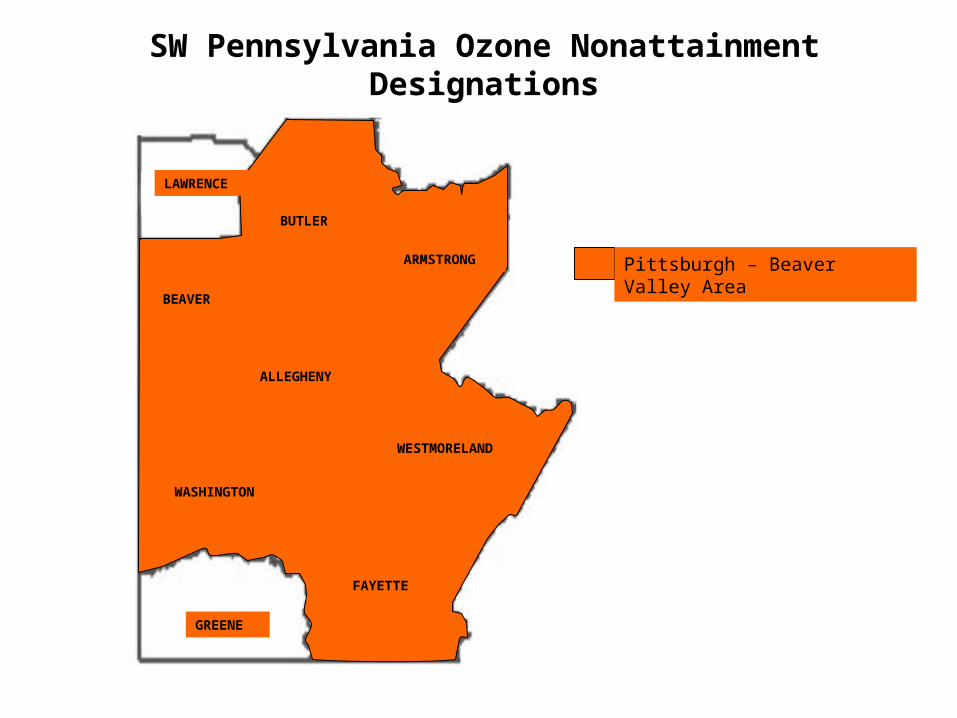
BUTLER
LAWRENCE
BEAVER
ALLEGHENY
ARMSTRONG
FAYETTE
GREENE
WASHINGTON
WESTMORELAND
Pittsburgh – Beaver Valley Area
SW Pennsylvania Ozone Nonattainment Designations

PM2.5 Nonattainment Areas - Pennsylvania


Liberty/Clairton PM2.5 Area
Includes:
City of Clairton
Glassport Borough
Liberty Borough
Lincoln Borough
Port Vue Borough

Liberty/Clairton Area

PM2.5 Trends, Annual Averages

PM2.5 Trends, 98-percentile 24-Hour Values
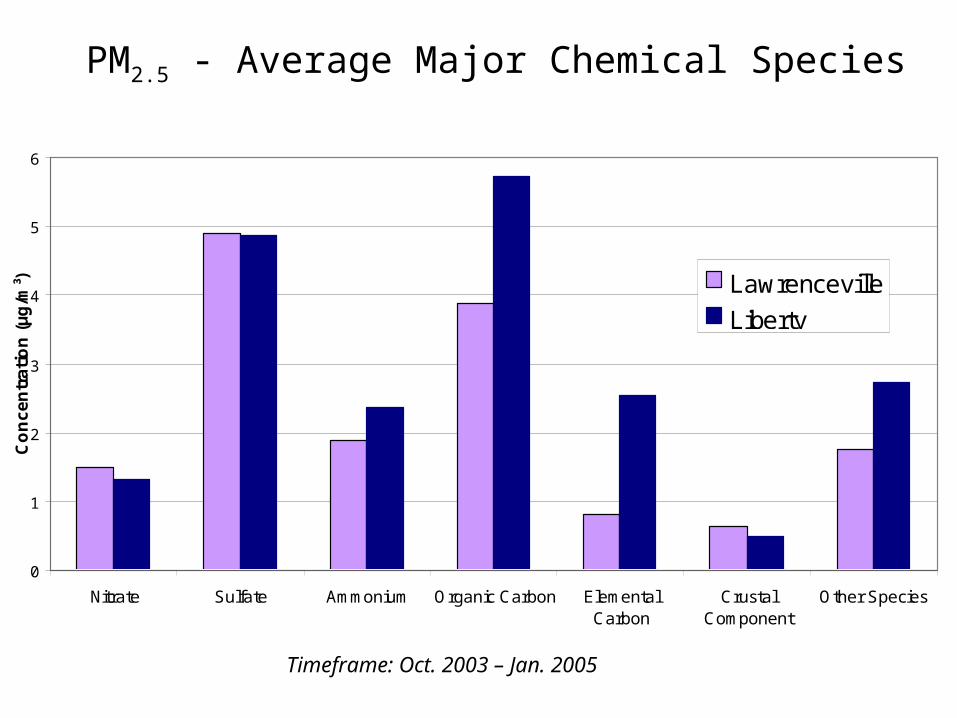
PM2.5 - Average Major Chemical Species
0
1
2
3
4
5
6
Nitrate Sulfate Ammonium Organic Carbon ElementalCarbon
CrustalComponent
Other Species
Co
nc
en
tra
tio
n (
µg
/m³) Lawrenceville
Liberty
Timeframe: Oct. 2003 – Jan. 2005

Lawrenceville PM2.5 - Major Species by Time
Timeframe: Oct. 2003 – Jan. 2005
0
5
10
15
20
25
30
10/6
/200
3
11/6
/200
3
12/6
/200
3
1/6/
2004
2/6/
2004
3/6/
2004
4/6/
2004
5/6/
2004
6/6/
2004
7/6/
2004
8/6/
2004
9/6/
2004
10/6
/200
4
11/6
/200
4
12/6
/200
4
1/6/
2005
Date
Co
nce
ntr
atio
n (
µg/m
³)
Nitrate
Sulfate
Ammonium
Organic carbon
Elemental carbon
Crustal component
Other
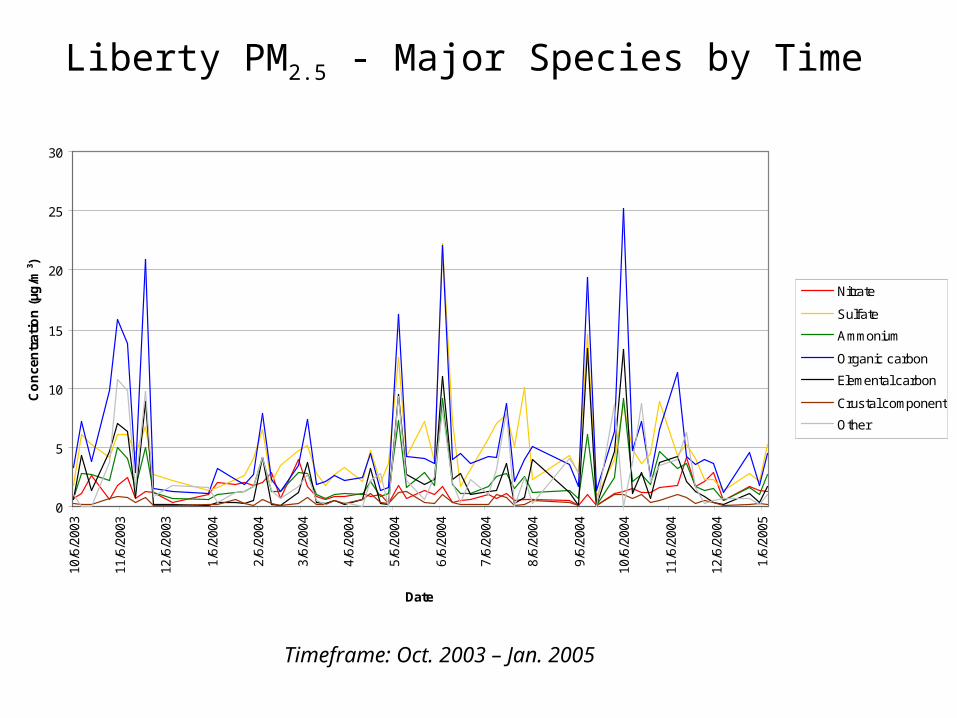
Liberty PM2.5 - Major Species by Time

Lawrenceville & Liberty Hourly Peaks, High Day

Positive Matrix Factorization (PMF) Modeling Results

Positive Matrix Factorization (PMF) Modeling Results
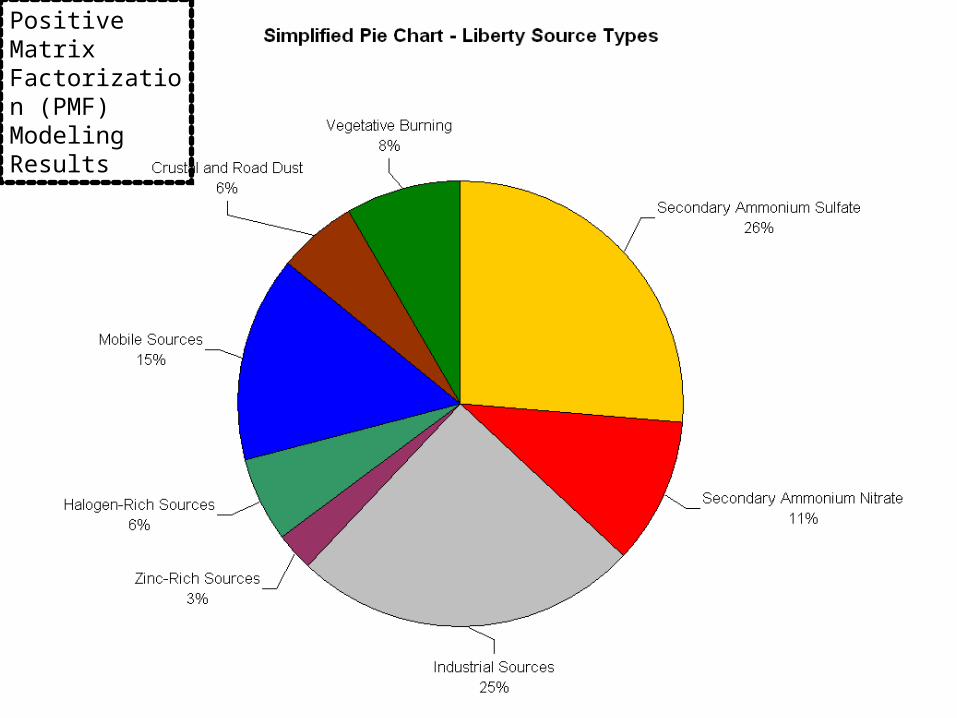
Positive Matrix Factorization (PMF) Modeling Results
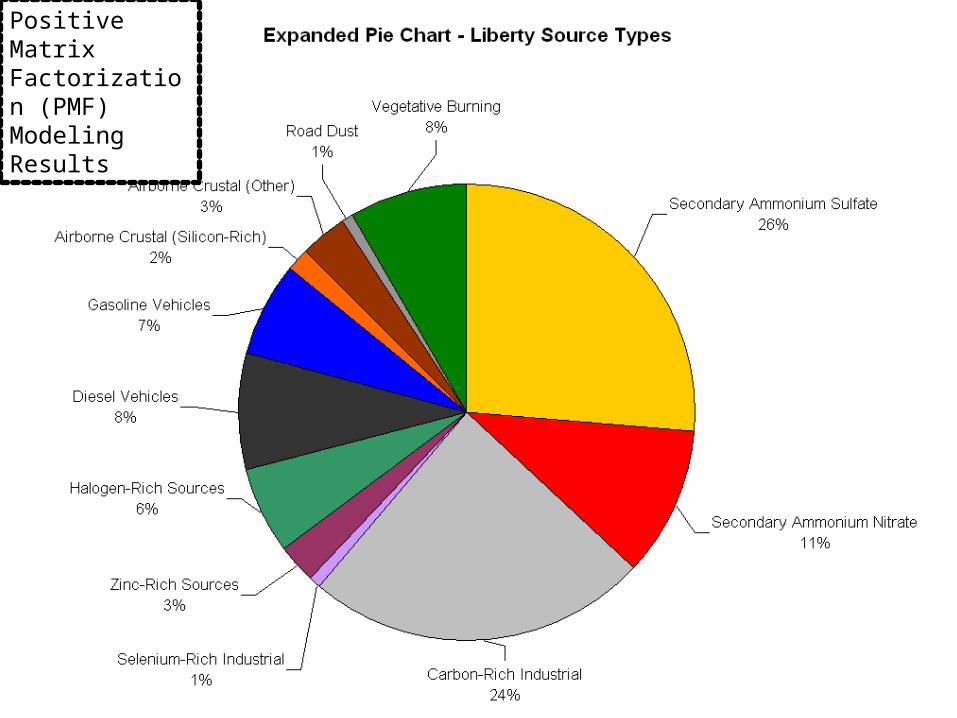
Positive Matrix Factorization (PMF) Modeling Results

PM2.5 - Average Major Chemical Species
0
1
2
3
4
5
6
Nitrate Sulfate Ammonium Organic Carbon ElementalCarbon
CrustalComponent
Other Species
Co
nc
en
tra
tio
n (
µg
/m³) Lawrenceville
Liberty
Timeframe: Oct. 2003 – Jan. 2005
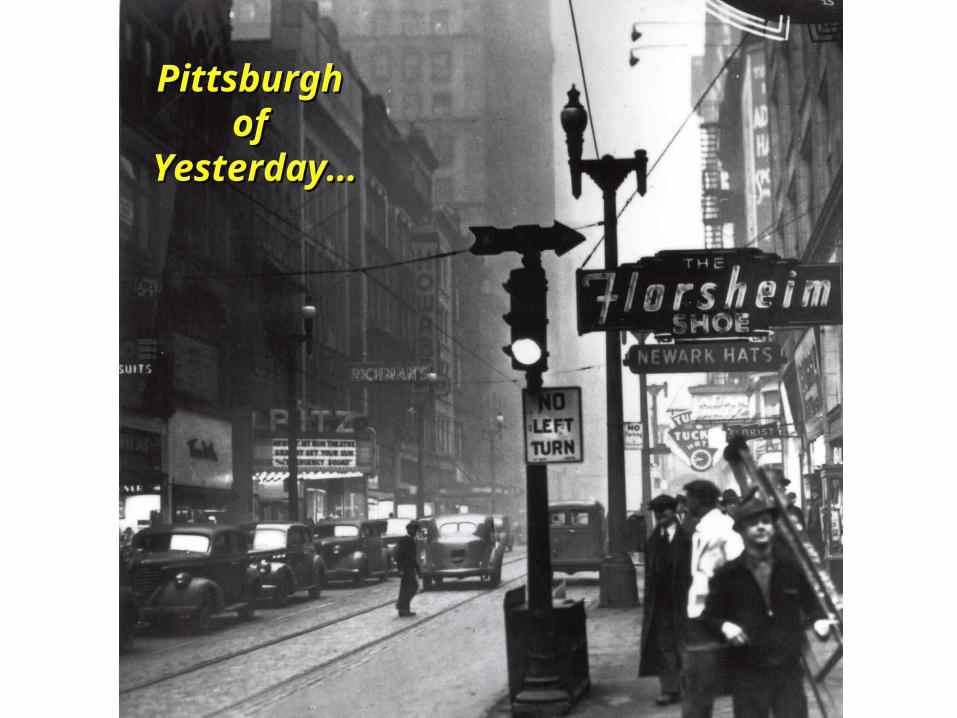
Pittsburgh Pittsburgh of of
Yesterday…Yesterday…

Pittsburgh TodayPittsburgh Today
Successes, but with ChallengesSuccesses, but with Challenges