allium fistulosum l.) july 2009
TRANSCRIPT

Application of SSR markers for the breeding of bunching onion
(Allium fistulosum L.)
July 2009
Hikaru Tsukazaki

(千葉大学学位申請論文)
Application of SSR markers for the breeding of bunching onion
(Allium fistulosum L.)
ネギ(Allium fistulosum L.)の育種におけるSSRマーカーの応用
2009年7月
塚﨑 光

Table of Contents
Summary ・・・・・・・・・・・・・・・・・・・・・・・・・・・・・・・・・・・・・・・・・・・・・・・・・・・・・・・・・・・・・・・・・・・・・・ 1
Chapter 1 Introduction ・・・・・・・・・・・・・・・・・・・・・・・・・・・・・・・・・・・・・・・・・・・・・・・・・・・・ 4
Chapter 2 A Large-Scale Isolation of SSR Clones from SSR-Enriched DNA
Libraries of Bunching Onion ・・・・・・・・・・・・・・・・・・・・・・・・・・・・・・・・・・・ 8
2-1 Introduction ・・・・・・・・・・・・・・・・・・・・・・・・・・・・・・・・・・・・・・・・・・・・・・・・・・・・・・・・・・・・・ 8
2-2 Materials and Methods ・・・・・・・・・・・・・・・・・・・・・・・・・・・・・・・・・・・・・・・・・・・・・・・・・ 9
2-2-a Plant material and DNA extraction・・・・・・・・・・・・・・・・・・・・・・・・・・・・・・・・ 9
2-2-b Construction of SSR-enriched DNA libraries ・・・・・・・・・・・・・・・・・・・・・・ 9
2-2-c Sequence data assembly and primer design ・・・・・・・・・・・・・・・・・・・・・・ 10
2-2-d Evaluation of DNA polymorphisms in bunching onion inbred lines
・・・・・・・・・・・・・・・・・・・・・・・・・・・・・・・・・・・・・・・・・・・・・・・・・・・・・・・・・・ 11
2-3 Results ・・・・・・・・・・・・・・・・・・・・・・・・・・・・・・・・・・・・・・・・・・・・・・・・・・・・・・・・・・・ 12
2-3-a SSR-enriched DNA libraries ・・・・・・・・・・・・・・・・・・・・・・・・・・・・・・・・・・ 12
2-3-b Core sequences ・・・・・・・・・・・・・・・・・・・・・・・・・・・・・・・・・・・・・・・・・・・・・ 13
2-3-c DNA polymorphisms among bunching onion inbred lines ・・・・・・・・・ 14
2-4 Discussion ・・・・・・・・・・・・・・・・・・・・・・・・・・・・・・・・・・・・・・・・・・・・・・・・・・・・・・・・ 14

Chapter 3 Construction of SSR-based Chromosome Map in Bunching Onion ・
・・・・・・・・・・・・・・・・・・・・・・・・・・・・・・・・・・・・・・・・・・・・・・・・・・・・・・・・・・・・・ 17
3-1 Introduction ・・・・・・・・・・・・・・・・・・・・・・・・・・・・・・・・・・・・・・・・・・・・・・・・・・・・・・・・ 17
3-2 Materials and Methods ・・・・・・・・・・・・・・・・・・・・・・・・・・・・・・・・・・・・・・・・・・・・・・ 18
3-2-a Plant materials for linkage analysis ・・・・・・・・・・・・・・・・・・・・・・・・・・・・・ 18
3-2-b SSR markers ・・・・・・・・・・・・・・・・・・・・・・・・・・・・・・・・・・・・・・・・・・・・・・・・ 18
3-2-c InDel and SNP markers ・・・・・・・・・・・・・・・・・・・・・・・・・・・・・・・・・・・・・ 20
3-2-d Segregation scoring (or observation) and linkage analyses ・・・・・・・・ 21
3-2-e Chromosomal assignment of linkage groups ・・・・・・・・・・・・・・・・・・・・・ 22
3-3 Results ・・・・・・・・・・・・・・・・・・・・・・・・・・・・・・・・・・・・・・・・・・・・・・・・・・・・・・・・・・・・ 23
3-3-a SSR markers ・・・・・・・・・・・・・・・・・・・・・・・・・・・・・・・・・・・・・・・・・・・・・・・・・ 23
3-3-b InDel and SNP markers ・・・・・・・・・・・・・・・・・・・・・・・・・・・・・・・・・・・・・・・ 24
3-3-c Linkage map of bunching onion ・・・・・・・・・・・・・・・・・・・・・・・・・・・・・・・・ 25
3-3-d Assignment of bunching onion linkage groups to their corresponding A.
cepa chromosomes ・・・・・・・・・・・・・・・・・・・・・・・・・・・・・・・・・・・・・・・・・・ 25
3-3-e Assignment of bunching onion linkage groups to their relevant
chromosomes ・・・・・・・・・・・・・・・・・・・・・・・・・・・・・・・・・・・・・・・・・・・・・・・ 27
3-4 Discussion ・・・・・・・・・・・・・・・・・・・・・・・・・・・・・・・・・・・・・・・・・・・・・・・・・・・・・・・・ 27

Chapter 4 Considerable Heterogeneity in Commercial F1 Cultivars of Bunching
Onion and the Proposal of Breeding Scheme for Conferring Genetic
Traceability using SSR Markers ・・・・・・・・・・・・・・・・・・・・・・・・・・・・・ 31
4-1 Introduction ・・・・・・・・・・・・・・・・・・・・・・・・・・・・・・・・・・・・・・・・・・・・・・・・・・・・・・・ 31
4-2 Materials and Methods ・・・・・・・・・・・・・・・・・・・・・・・・・・・・・・・・・・・・・・・・・・・・・ 32
4-2-a Plant materials ・・・・・・・・・・・・・・・・・・・・・・・・・・・・・・・・・・・・・・・・・・・・・ 33
4-2-b DNA extraction and PCR ・・・・・・・・・・・・・・・・・・・・・・・・・・・・・・・・・・・・・ 33
4-2-c Evaluation of genetic uniformity ・・・・・・・・・・・・・・・・・・・・・・・・・・・・・・・ 33
4-3 Results ・・・・・・・・・・・・・・・・・・・・・・・・・・・・・・・・・・・・・・・・・・・・・・・・・・・・・・・・・・・ 34
4-4 Discussion ・・・・・・・・・・・・・・・・・・・・・・・・・・・・・・・・・・・・・・・・・・・・・・・・・・・・・・・・ 35
Chapter 5 SSR-tagged Breeding Scheme in Allogamous Crops with an
Example Application to Bunching Onion ・・・・・・・・・・・・・・・・・・・・・ 39
5-1 Introduction ・・・・・・・・・・・・・・・・・・・・・・・・・・・・・・・・・・・・・・・・・・・・・・・・・・・・・・・ 39
5-2 Materials and Methods ・・・・・・・・・・・・・・・・・・・・・・・・・・・・・・・・・・・・・・・・・・・・・ 40
5-2-a Preliminary examination of SSR markers on polymorphisms within the
starting population ・・・・・・・・・・・・・・・・・・・・・・・・・・・・・・・・・・・・・・・・・・ 40
5-2-b Selection from the starting population ・・・・・・・・・・・・・・・・・・・・・・・・・ 40
5-2-c Selection in the foundation seed field ・・・・・・・・・・・・・・・・・・・・・・・・・・ 41
5-2-d Observation of agronomic traits ・・・・・・・・・・・・・・・・・・・・・・・・・・・・・・・ 42

5-3 Results ・・・・・・・・・・・・・・・・・・・・・・・・・・・・・・・・・・・・・・・・・・・・・・・・・・・・ 43
5-3-a Genetic heterogeneity in ‘Shimonita’ ・・・・・・・・・・・・・・・・・・・・・・・・・・・ 43
5-3-b SSR-tagged breeding scheme ・・・・・・・・・・・・・・・・・・・・・・・・・・・・・・・・ 43
5-3-c Feasibility of the SSR-tagged breeding scheme ・・・・・・・・・・・・・・・・・ 45
5-4 Discussion ・・・・・・・・・・・・・・・・・・・・・・・・・・・・・・・・・・・・・・・・・・・・・・・・・ 45
Chapter 6 General Discussion ・・・・・・・・・・・・・・・・・・・・・・・・・・・・・・・・・・・・・・・ 48
6-1 A large scale isolation of SSR clones and construction of SSR-based
chromosome map of bunching onion ・・・・・・・・・・・・・・・・・・・・・・・・・・ 49
6-2 Breeding scheme for conferring genetic traceability using SSR markers ・
・・・・・・・・・・・・・・・・・・・・・・・・・・・・・・・・・・・・・・・・・・・・・・・・・・・・・・・・・・・ 53
Acknowledgements ・・・・・・・・・・・・・・・・・・・・・・・・・・・・・・・・・・・・・・・・・・・・・・・・・・・・ 57
References ・・・・・・・・・・・・・・・・・・・・・・・・・・・・・・・・・・・・・・・・・・・・・・・・・・・・・・・・・・・・ 59
Figures ・・・・・・・・・・・・・・・・・・・・・・・・・・・・・・・・・・・・・・・・・・・・・・・・・・・・・・・・・・・・・・・・ 67
Tables ・・・・・・・・・・・・・・・・・・・・・・・・・・・・・・・・・・・・・・・・・・・・・・・・・・・・・・・・・・・・・・・・ 79

1
Summary
Bunching onion (Allium fistulosum L.) is one of the most important vegetables in
Japan. However, despite its economic importance, its genetic characteristics have been
poorly studied. To establish a genetic basis for molecular breeding of bunching onion,
1,796 simple sequence repeat (SSR) clones were isolated by large-scale sequencing of
SSR-enriched genomic DNA libraries. Of these, 1,331 (74.1%) contained (GT)n repeats
(n > 5), while 314 (17.5%) were (GA)n-containing clones. The average number of SSR
repeats was 10.5 and 10.4 in the (GT)n- and (GA)n-containing clones, respectively. In a
sample of five bunching onion inbred lines, an average of 3.2 alleles were detected in
the 100 SSR loci investigated, with the polymorphism information content (PIC)
averaging 0.55. These results indicate that bunching onion SSRs are very rich sources
of highly informative genetic markers.
Secondly, a linkage map of bunching onion (2n = 16) was constructed using an F2
population of 225 plants. The map consists of 17 linkage groups with 213 bunching
onion SSR markers and 42 bulb onion (A. cepa L.) SSR, insertions–deletion (InDel),
cleaved amplified polymorphic sequence (CAPS) or derived CAPS (dCAPS) markers,
covering 2,069 cM. This is the first linkage map based mainly on SSR markers in the
genus Allium. Using 103 anchor markers (81 bunching onion SSRs, 11 bulb onion SSRs
and 11 bulb onion non-SSR markers, including 1 InDel, 9 CAPSs and 1 dCAPS),
chromosome assignments were made in A. cepa and/or A. fistulosum, via the use of
several kinds of Allium alien addition lines, and 16 of the 17 linkage groups were
connected to the eight basic chromosomes of A. cepa.

2
DNA markers can be powerful tools for verifying cultivar identity and genetic
homogeneity of F1 hybrid seeds. In bunching onion, F1 cultivars are becoming prevalent
in Japan due to the advantage of their high uniformity in agronomic traits. However,
bunching onion is an allogamous crop and suffers from severe inbreeding depression
when selfed. It is thought that not only open-pollinated cultivars but also parental lines of
F1 hybrids may be bred to hold a degree of genetic heterogeneity. Thus, the genetic
homogeneity of eight bunching onion cultivars, including six F1 hybrids, was evaluated
by using 14 SSR markers. All the SSR loci examined showed two or more polymorphic
alleles in each cultivar. The number of alleles detected in the eight cultivars varied from
three to seven among the 14 SSR loci, and the PIC value ranged from 0.41 to 0.76. All
the cultivars examined showed very low degrees of uniformity at any of these
polymorphic loci. Hence, it would seem impossible to determine an appropriate
genotypic identity for any of existing cultivars of bunching onion. Thus, to make cultivar
identification easy and accurate, an “SSR-tagged breeding” scheme was proposed. In
this scheme, those individuals that are homozygous at a few SSR loci are selected out
of a foundation seed field.
Finally, to demonstrate the feasibility of this procedure, a bunching onion landrace was
used as starting material for a trial in an allogamous crop population. Two SSR-tagged
populations were produced by selecting double homozygous individuals (population A)
and quadruple homozygous individuals (population B) at selected loci. The selected
individuals were then open-pollinated within each population. Field growth tests detected
no significant differences in any traits tested among the SSR-tagged populations and the

3
control populations. In addition, the SSR-tagged populations were genetically uniform at
the selected loci whereas the other loci still contained high degrees of heterogeneity,
suggesting that the SSR-tagged populations can be distinguished from the other
cultivars by using selected SSR markers. Therefore, the “SSR-tagged breeding” scheme
is suggested as a powerful tool for cultivar identification and for conferring traceability
not only in bunching onion but also in other allogamous crops in which inbreeding
depression is as severe as in bunching onion.

4
Chapter 1
Introduction
Bunching onion (Allium fistulosum L.), also referred to as Japanese bunching onion or
Welsh onion, is thought to have originated in northwestern China, and at present is
cultivated mainly in East Asian countries, particularly Japan, China and Korea
(Kumazawa and Katsumata 1965, Ford-Lloyd and Armstrong 1993). In Japan, bunching
onion produces the fourth highest annual output of vegetable crops, following tomato,
strawberry and cucumber (MAFF 2005). However, despite the economic importance of
bunching onion, its genetics remain relatively unstudied using molecular-based
approaches.
The main breeding objectives for bunching onion are disease resistance, high yield,
late bolting, high consumer qualities (e.g., low pungency, high sugar content) and
suitability for mechanized farming (e.g. vigorous seedling growth). Quantitative trait loci
(QTL) analysis based on a genetic linkage map would be an efficient means of revealing
the mode of inheritance of these traits. Such molecular-based approaches need to be
examined in order for them to be utilized in molecular breeding programs for bunching
onion.
Two simple and fast PCR-based approaches for detecting DNA polymorphisms,
namely, random amplified polymorphic DNA (RAPD) and amplified fragment length
polymorphism (AFLP) analyses, have previously been applied to genetic studies of
Allium (Wilkie et al. 1993, Bradeen and Havey 1995, van Heusden et al. 2000, Ohara et
al. 2005, Ipek et al. 2005). However, these markers are usually expressed as dominant

5
characters. In contrast, King et al. (1998) reported a linkage map of bulb onion (A. cepa
L.) based on RAPDs and restriction fragments length polymorphisms (RFLPs), the latter
of which are expressed as codominant characters and have high specificity over RAPDs
and AFLPs. However, despite these advantages, RFLP analysis is both time-consuming
and labor-intensive (Crockett et al. 2000). Simple sequence repeats (SSRs), also called
microsatellites or simple tandem repeats (STRs), on the other hand, are ideal DNA
markers due to their simplicity, reproducibility and codominant inheritance. SSR markers
have been used for phylogenetic analysis and construction of linkage maps in many
crop species (Jones et al. 1997).
In the genus Allium, Fischer and Bachmann (2000) reported for the first time the
development of 30 SSR markers from bulb onion. Wako et al. (2002a) and Song et al.
(2004) also succeeded in isolating 118 SSRs from a genomic library of bunching onion.
Some of these markers were subsequently used to connect two linkage maps of
reciprocal cross populations of bunching onion (Ohara et al. 2005). From a large-scale
sequencing program of bulb onion expressed sequence tags (ESTs), Kuhl et al. (2004)
detected 336 SSR cores among 313 EST sequences and developed 88 EST-SSR
markers. In addition, Martin et al. (2005) located 35 EST-SSRs, 43 single nucleotide
polymorphisms (SNPs) and four insertion–deletion (InDel) markers on a medium-density
linkage map in bulb onion. This map was simultaneously anchored to bulb onion
chromosomes by use of A. fistulosum–A. cepa monosomic addition lines developed by
Shigyo et al. (1996; Martin et al. 2005).
In this study, SSR-enriched DNA libraries were constructed from bunching onion and

6
more than 1,000 SSR clones were successfully isolated from these libraries. A linkage
map of bunching onion was then constructed based mainly on codominant SSR markers.
To assign the detected linkage groups to the eight basic chromosomes of A. cepa, the
chromosomes to which some anchor markers should belong were directly identified by
using Allium alien chromosome addition lines.
In order to determine the quality of hybrid seeds, seed companies maintain quality
control programs that monitor seeds from harvest to purchase (McDonald 1998).
Traditionally, the grow-out test or morphological comparisons of seedlings are conducted
for checking genetic purity of hybrid seed. However, these methods are time-consuming
and space-demanding. Therefore, a seed purity test based on molecular markers is
desirable.
Isozymes (Tanksley and Jones 1981), RFLPs (Livneh et al. 1990), and RAPDs
(Hashizume et al. 1993, Ballester and de Vicente 1998, Crockett et al. 2000, 2002) have
been used for testing hybrid purity. However, RAPDs have the problem of low
reproducibility of some bands and the uncertain homology of fragments co-migrating in
gel electrophoresis (Klaas and Friesen 2002). Although isozyme analysis is simple and
easy, it cannot easily detect polymorphisms between closely related genotypes (Crockett
et al. 2000). While RFLPs are highly reliable, they have limitations for routine
commercial testing because the procedure is time-consuming, labor-intensive, and is
technically complex. In contrast, SSRs have very high utility value because of their
co-dominant inheritance, greater reliability over RAPDs and abundance in genomes
(Jones et al. 1997).In addition, they have already been successfully used for cultivar

7
identification (Bredemeijer et al. 1998, Meesang et al. 2001, Rajora and Rahman 2003).
Bunching onion is a typical allogamous crop due to protandry, which results in a high
rate of outcrossing (Ford-Lloyd and Armstrong 1993). Although self-compatible, it suffers
from severe inbreeding depression when self-pollinated. Open-pollinated cultivars of
bunching onion are considered to maintain certain levels of heterozygosity and
heterogeneity. Parental lines of F1 hybrids may also be bred to hold a degree of genetic
heterogeneity.
The objective of the present study was to evaluate genetic uniformity of commercial F1
cultivars of bunching onion by using SSR markers. Furthermore, a breeding scheme is
proposed to confer traceability that enables cultivar identification or F1 purity tests using
SSR markers. The feasibility of the breeding scheme was demonstrated by using a
bunching onion landrace as starting material for a trial in an allogamous crop population.

8
Chapter 2
Large-Scale Isolation of SSR Clones from SSR-Enriched DNA Libraries of
Bunching Onion
2-1 Introduction
RAPD and AFLP marker analysis are two PCR-based approaches for detecting DNA
polymorphisms that have previously been applied to genetic studies of Allium (Wilkie et
al. 1993, Bradeen and Havey 1995, van Heusden et al. 2000, Ohara et al. 2005, Ipek et
al. 2005). Although these markers are efficient and easy to use, they are usually
expressed as dominant characters. King et al. (1998) reported a linkage map of bulb
onion based on RAPDs and RFLPs, where the latter are expressed as codominant
characters and have greater specificity than RAPDs and AFLPs. However, RFLP
analysis is both time-consuming and labor-intensive (Crockett et al. 2000). SSRs, on the
other hand, are PCR-based DNA markers that are ideal genetic markers because they
are simple, highly reproducible and are inherited codominantly. SSR markers have so far
been successfully used for phylogenetic analysis, construction of linkage maps and
cultivar identification in a variety of crops (Jones et al. 1997, Bredemeijer et al. 1998).
Fischer and Bachmann (2000) have reported the development of 30 SSR markers
from bulb onion, the first such markers developed for the genus Allium. In other previous
studies, 118 SSRs were also successfully isolated from a genomic library of bunching
onion (Wako et al. 2002a, Song et al. 2004). More recently, hundreds of EST-derived
SSR markers were developed from large-scale sequencing of bulb onion-expressed

9
sequence tags (ESTs; Kuhl et al. 2004, Martin et al. 2005). In the present study,
SSR-enriched DNA libraries were constructed from bunching onion and were used to
successfully isolate more than 1,000 SSR clones.
2-2 Materials and Methods
2-2-a Plant material and DNA extraction
The bunching onion inbred line J1s-14s-23s-9s-2, derived from the cultivar ‘Kujo Futo’,
was used to construct SSR-enriched DNA libraries. Genomic DNA was extracted from
0.1 g of fresh leaf tissue with Nucleon PhytoPure (GE Healthcare Bioscience, CA, USA).
Since Allium leaves have a high concentration of polysaccharides, the DNA solutions
prepared with Nucleon PhytoPure were highly viscous and required a second
purification with the PhytoPure resin.
2-2-b Construction of SSR-enriched DNA libraries
Four SSR-enriched DNA libraries (AFA, AFB, AFC and AFD; where AF denotes Allium
fistulosum) were custom-made commercially (Genetic Identification Services, CA, USA).
Among trinucleotide motifs, GAA and AGC were selected since a preliminary experiment
suggested that these two motifs occur most frequently in bunching onion (Song,
unpublished data). Digested DNA fragments were hybridized with (GT)n, (GA)n, (GAA)n
and (AGC)n probes to develop the AFA, AFB, AFC and AFD libraries, respectively. No
information was provided by the supplier about either the restriction enzymes used for
library preparation or the number of motif repeats in the probes used for SSR

10
enrichment. SSR-enriched DNA fragments were ligated into the HindIII site of the
plasmid vector pUC19.
Six additional libraries were constructed according to the method described by
Nunome et al. (2006). Genomic DNA was completely digested with either of three
restriction enzymes, AluI, HaeIII or RsaI, and ligated with a PCR adaptor. DNA
fragments were hybridized with a digoxigenin-labeled (DIG-labeled) (GA)15 or (GT)15
probe at 60°C for 16 h, washed with 1´ saline sodium citrate (SSC; 3 M sodium chloride,
300 mM trisodium citrate, pH 7) [[please check insertion]] at 60°C, and collected.
SSR-enriched DNA fragments were amplified using DNA polymerase KOD Plus (Toyobo,
Osaka, Japan), and dATP was attached to the 3' end of the amplified DNA fragments
with the Klenow fragment (Toyobo). The dATP-attached PCR amplicons were purified
and ligated to a pGEM-T Easy vector (Promega, WI, USA), and then transformed into
Escherichia coli competent cells (JM109; Promega). The SSR-enriched DNA libraries
prepared by this method were denoted AFAA, AFAT, AFHA, AFHT, AFRA and AFRT,
where the third letters, A, H and R, denote the restriction enzymes AluI, HaeIII and RsaI,
respectively, and the fourth letters, A and T, denote the probes (GA)15 and (GT)15,
respectively.
2-2-c Sequence data assembly and primer design
Sequence data assembly, SSR detection and primer design were conducted using the
automated SSR detection system “read2Marker” developed by Fukuoka et al. (2005).
The index of SSR enrichment was calculated for each library as the percentage of

11
SSR-containing clones out of the total number of sequenced clones. The index of
efficiency for marker development was also calculated as the percentage of
SSR-containing uniclones out of the total number of sequenced clones, and the contrary
index of clone redundancy as the percentage of uniclones in the SSR-containing clones.
2-2-d Evaluation of DNA polymorphisms in bunching onion inbred lines
DNA polymorphisms at 100 randomly selected SSR loci (Table 2-1) were evaluated in
five bunching onion inbred lines (S3 to S5 generation): C1s-11s-25s-7 (C), D1s-15s-10s-8
(D), F1s-7s-17s-3s-1 (F), J1s-14s-23s-9 (J) and K1s-5s-2s-2s-4s-5 (K). The inbred lines
‘C’ and ‘D’ belong to the “Senju” group, ‘F’ to “Kaga”, and ‘J’ to “Kujo”. The inbred line ‘K’
is derived from a Taiwanese ever-flowering cultivar “Kitanegi”.
PCR amplification was conducted under the following conditions: initial denaturation at
94°C for 2 min, followed by 10 cycles of 94°C for 0.5 min, 65°C for 0.5 min, and 72°C for
0.5 min, where the annealing temperature was reduced by 1°C per cycle; then, 35
cycles of 94°C for 0.5 min, 55°C for 0.5 min and 72°C for 0.5 min, and a final extension
at 72°C for 4 min. Forward primers were fluorescent-labeled with 6-FAM, NED, PET or
VIC (Applied Biosystems, CA, USA) prior to use in PCR reactions. PCR products were
loaded on a capillary DNA sequencer (ABI3730; Applied Biosystems) and each
genotype was analyzed by GeneMapper software ver. 3.0 (Applied Biosystems).
To assess the degree of DNA polymorphism at each SSR loci, the number of alleles
and the polymorphism information content (PIC) in the five inbred lines at 96 SSR loci
were evaluated. The PIC value was calculated for each SSR locus according to the

12
following formula (Anderson et al. 1993):
PIC = 1–å=
k
iiP
1
2 ,
where k is the total number of alleles detected at a locus and Pi is the frequency of the
ith allele in the set of five bunching onion inbred lines investigated.
2-3 Results
2-3-a SSR-enriched DNA libraries
From each DNA library, 69 to 2,426 clones were randomly selected and sequenced.
Of the 10,922 clones sequenced, 3,752 (34.4%) were found to contain more than five
SSR motif repeats (Table 2-2).
DNA libraries AFA, AFAA and AFAT showed high degrees of SSR enrichment and
library efficiency. Of these, AFAT and AFAA showed the highest degrees of library
efficiency (37.6% and 37.1%, respectively) due to their much lower level of clone
redundancy compared to AFA; the contrary index of clone redundancy was 84.7%,
85.0% and 53.8% in AFAT, AFAA and AFA, respectively. AFAT and AFAA were therefore
deemed most efficient for SSR marker development among the libraries used in the
present study. It should be noted, however, that the number of sequenced clones was
relatively small in these two libraries, especially in AFAA.
The AFB library achieved a moderate degree of library efficiency (21.1%, higher than
the mean), even though more than 2,000 clones were sequenced. Moreover, AFB was
the only library in which most clones contained GA repeats.

13
In contrast, the AFHA and AFHT libraries showed a very low degree of SSR
enrichment (14.5% and 17.6%, respectively) and therefore very low degrees of library
efficiency (8.7% and 13.0%, respectively). Although the degree of SSR enrichment was
moderate in AFD (34.0%), its library efficiency was the third lowest (13.1%) due to it
having the highest clone redundancy (the lowest uniclone frequency in SSR-containing
clones, 38.5%).
In total, 1,796 SSR-containing uniclones were isolated from the SSR-enriched DNA
libraries.
2-3-b Core sequences
The length of the SSR-containing uniclones ranged from 86 to 1,320 bp with an
average of 505 bp, and of these, 1,331 (74.1%) contained GT repeats (Table 2-3). Many
(GT)n-containing clones were isolated not only from the DNA libraries enriched with
(GT)n probes, AFA, AFAT, AFHT and AFRT, but also from those enriched with (GA)n
probes, AFB, AFAA, AFHA and AFRA (Table 2-2). Except for those obtained from the
AFB library, most clones isolated with (GA)n probes contained many GT repeats (n > 5)
as well as some GAs (n ≤ 5). Such clones were categorized with the core motif “GT” in
Table 2-2.
The average number of repeats was 10.5 and 10.4 in the (GT)n- and (GA)n-containing
clones, and 7.9 and 7.3 in the (AT)n- and trinucleotide repeat-containing clones,
respectively (Table 2-3). Although no (AT)n probes were used, many (AT)n-containing
clones (73 clones) were isolated, and of these, 21 contained (AT)n + (GT)n cores. On the

14
other hand, only six clones contained GC repeats, and of these, five had (GT)n + (GC)n
cores and the remaining clone had a (GA)n + (GC)n core. The average GC content of the
bunching onion SSR clones was estimated at 37.7%.
2-3-c DNA polymorphisms among bunching onion inbred lines
The total number of alleles detected in the five bunching onion inbred lines sampled
varied from one to six among the 100 SSR loci investigated, and the PIC value from
0.00 to 0.83 (Fig. 2-1, Table 2-4). The number of alleles per locus averaged 3.2, and the
PIC value 0.55. Seven loci—AFA13H07, AFA16E11, AFAT02D10, AFAT05A12,
AFAT06B02, AFB17C10 and AFRA13H07—were monomorphic in the five inbred lines
investigated. A low positive correlation (r = 0.36) was found between PIC and number of
motif repeats in the longest continuous repeat sequence, whereas no correlation (r =
0.05) was found between PIC and total number of motif repeats.
2-4 Discussion
To increase the efficiency of isolation of SSR-containing clones from bunching onion
genomic DNA, an SSR enrichment procedure was employed. Moreover, to decrease the
redundancy of effort in developing new markers, the effectiveness of 10 differently
prepared SSR-enriched libraries was compared. In the 3,752 SSR-containing clones
obtained (10 to 1,009 clones per library), the frequency of uniclones was 47.9% (Table
2-2), with clone redundancy increasing when more clones were sequenced (data not
shown). However, the frequency of SSR-containing uniclones in the total sequenced

15
clones was higher than 20% in the AFA, AFB, AFAT and AFRA libraries, from which
more than 1,000 clones were sequenced (Table 2-2). Therefore, it may be considered
that new SSR-containing uniclones can still be efficiently isolated by sequencing clones
from these libraries. AFAA appeared to be very efficient, having the second highest
library efficiency and second lowest clone redundancy, despite the relatively small
number of clones sequenced. Overall, AFA, AFAA, AFAT and AFRA could be efficient
sources of new (GT)n-containing uniclones, and AFB an important source of new
(GA)n-containing uniclones.
Unexpectedly, most of the SSR uniclones isolated from AFAA and AFHA, which were
SSR-enriched with (GA)15 probes, possessed (GT)n instead of (GA)n cores (Table 2-2).
In AFAA, only four of the 144 clones categorized as GT core-containing clones had more
than five repeats of the GA motif, and only one of 196 did so in AFRA (data not shown).
At present, however, it remains unclear why so many (GT)n-containing clones were
isolated from the libraries SSR-enriched with (GA)15 probes.
Within the bunching onion genome, Song et al. (2004) revealed that GT repeats are
surprisingly more frequent than GA repeats, which are known to be more frequent than
GT repeats in most plant species (Lagercrantz et al. 1993). The present study showed
that 74.1% of the bunching onion genomic SSRs had GT cores, while only 17.5% had
GA cores (Table 2-3). These results thus confirm that GT repeats are far more abundant
than GA repeats in the bunching onion genome. Fischer and Bachmann (2000) further
suggested that the bulb onion genome is rich in GT repeats, revealing that of 30 markers
developed from an SSR-enriched genomic library, 21 contained GT repeats, while only

16
three contained GA repeats. It should be noted, however, that Kuhl et al. (2004) detected
many GA repeats (34 loci for marker development) as well as a similar number of GT
repeats (31 loci) from a bulb onion EST data set. One reason for this is that the
(GT)n:(GA)n ratio in gene-coding regions may be different from that in non-coding
regions.
SSR markers were shown to be highly polymorphic in five bunching onion inbred lines
(Table 2-4). Song et al. (2004) reported that the average number of alleles and the
average PIC value for 33 SSR markers among nine cultivars were 3.3 and 0.59,
respectively. On the other hand, bulb onion EST-derived SSR markers were less
polymorphic; the average number of alleles and the average PIC value were previously
shown to be 2.0 and 0.34, respectively, in five inbred lines (data not shown). Bunching
onion SSRs may therefore be powerful as polymorphic DNA markers.
In conclusion, more than 1,000 SSRs were successfully isolated from SSR-enriched
DNA libraries of bunching onion. These SSRs will be applicable for phylogenetic
analysis, construction of genetic linkage maps and plant breeding.

17
Chapter 3
Construction of SSR-based Chromosome Map in Bunching Onion
3-1 Introduction
In bunching onion, the main desirable breeding outcomes are disease resistance, high
yield, late bolting, high consumer qualities and suitability for mechanized farming, such
as vigorous seedling growth. These traits are also important in bulb onion breeding.
Quantitative trait loci (QTL) analysis based on a genetic linkage map would be an
efficient method for revealing the mode of inheritance of these commercial traits.
However, despite the economic importance of bunching onion and bulb onion, their
genetic characteristics have been poorly studied and molecular-based approaches need
to be utilized to clarify such characteristics. By revealing these genetic characteristics, it
will be possible to utilize comparative genomics approaches between bunching onion
and bulb onion, and molecular breeding for both crops may be conducted.
SSR markers are ideal DNA markers owing to their simplicity, reproducibility and
codominant inheritance (Jones et al. 1997). In the genus Allium, Fischer and Bachmann
(2000) first reported the development of SSR markers from a bulb onion genomic library.
Through large-scale sequencing of bulb onion ESTs, Kuhl et al. (2004) detected 336
SSR cores among 313 EST sequences and developed 88 EST-SSR markers. In
addition, Martin et al. (2005) located 35 EST-SSRs, 43 SNPs and four InDel markers on
a medium-density linkage map in bulb onion. This map was simultaneously anchored to
bulb onion chromosomes by the use of A. fistulosum–A. cepa monosomic addition lines

18
developed by Shigyo et al. (1996; Martin et al. 2005). Furthermore, 1,940 SSR clones
were also isolated from a genomic library and 10 SSR-enriched DNA libraries of
bunching onion (Wako et al. 2002a, Song et al. 2004, Chapter 2).
In the present study, the above-mentioned markers were screened for polymorphisms
in a bunching onion F2 population; additional informative markers were developed; and a
linkage map of bunching onion was constructed based primarily on codominant SSR
markers from bunching onion and bulb onion. To assign the detected linkage groups to
the eight basic chromosomes of A. cepa, the chromosomes to which some anchor
markers should belong were directly identified by using Allium alien chromosome
addition lines.
3-2 Materials and Methods
3-2-a Plant materials for linkage analysis
A total of 225 individuals of the F2 progeny derived from a cross between two bunching
onion inbred lines, D1s-15s-10s and J1s-14s-23s, were used as the mapping population.
D1s-15s-10s was an S3 line from ‘Saiko’, an open-pollinated cultivar of the “Senju” group,
and J1s-14s-23s was an S3 line from ‘Kujo Futo’, an open-pollinated cultivar of the
“Kujo” group. The F2 mapping population was the selfed progeny of a single F1 plant
between these S3 lines. Total DNA was extracted from each plant according to the
method described in Chapter 2-2-a.
3-2-b SSR markers

19
The 266 primer sets previously developed from bunching onion genomic SSR clones
(Wako et al. 2002a, Song et al. 2004, Ohara et al. 2005, Chapter 2), 1,456 new ones,
and 30 from bulb onion (Fischer and Bachmann 2000) were screened for markers
showing polymorphisms between the parental lines.
As for bulb onion EST-derived SSR markers, 11,008 bulb onion EST sequences from
the Dana-Farber Cancer Institute (DFCI) A. cepa Gene Index ver. 1.0
(http://compbio.dfci.harvard.edu/tgi/cgi-bin/tgi/gimain.pl?gudb=onion) were screened to
identify SSRs and design PCR primer sequence sets for the detected SSR cores with
“read2Marker” (Fukuoka et al. 2005), and obtained 99 effective primer sequence sets for
them. These markers were named Allium cepa EST (ACE) and screened for
polymorphisms between the parental lines. An additional 118 bulb onion EST-derived
SSR markers (ACM) reported by Kuhl et al. (2004) and Martin et al. (2005) were also
screened.
PCR was conducted according to the method described in Chapter 2-2-d, except that
the annealing temperature was different for some primer sets (see Tables 3-1 to 3-3).
PCR products were separated on 3% (w/v) agarose gel or 5% (w/v) denatured
polyacrylamide gel according to the method of Song et al. (2004). In addition, some
forward primers were fluorescent-labeled with 6-FAM, NED, PET or VIC dyes (Applied
Biosystems) prior to use for PCR. PCR products were loaded on a capillary DNA
sequencer (ABI3730; Applied Biosystems), and analyzed using GeneMapper ver. 3.0
software (Applied Biosystems).

20
3-2-c InDel and SNP markers
Previously, Wako et al (2002b) developed 39 EST-derived sequence-tagged site
(STS) markers of bulb onion, named here as Allium cepa CAPS (ACC) markers. In
addition, 208 EST-derived bulb onion STS markers reported by McCallum et al. (2001),
Kuhl et al. (2004), and Martin et al. (2005) were used. An STS marker, AOB272 (Gökçe
et al. 2002), reported to be closely linked to the bulb onion nuclear male-fertility
restoration locus (Ms), was also used for mapping. Moreover, 93 intron-spanning
EST-derived markers for bunching onion were developed from rice genome sequences.
Rice cDNA sequences and their annotation data were obtained from The Institute for
Genomic Research Rice Genome Pseudomolecules ver. 4.0
(<ftp://ftp.tigr.org/pub/data/Eukaryotic_Projects/o_sativa/annotation_dbs/
pseudomolecules/version_4.0/all_chrs/all.con>). Bulb onion EST sequences from the
DFCI database were screened for those homologous to the rice cDNA sequences (1st hit
score > 80) that were considered unique to the rice genome (the ratio of 1st to 2nd hit
E-values was higher than 1´1010) by conducting a BLASTN search. The selected bulb
onion ESTs were aligned to the rice genome sequences, and primer pairs were
designed from highly conserved segments interposing rice intron regions between them
so that they could amplify putative intron regions during PCR with the genomic DNA
template of either bulb onion or bunching onion.
In total, 341 bulb onion EST-derived marker candidates were screened for InDels and
single nucleotide polymorphisms (SNPs) between the bunching onion parental lines
D1s-15s-10s and J1s-14s-23s.

21
Primer sets producing single amplicons were selected and the fragment sizes were
compared between the parental lines on 2% (w/v) agarose gel. When distinct allele
differences (> 0.1 kb in fragment size) were identified, the primers were directly applied
to F2 individuals. For identification of SNPs and small InDels, each PCR product was
purified using the Wizard SV Gel and PCR Clean-Up System (Promega, WI, USA), and
sequenced with the DNA sequencer ABI3730 (Applied Biosystems). Sequence
alignment and SNP/InDel detection were conducted using ATGC ver. 3 software
(Genetyx, Tokyo, Japan). The SNPs detected at restriction sites were converted to
CAPS markers using Genetyx-Win ver. 5.1 software (Genetyx). Some other SNPs were
converted to derived cleaved amplified polymorphic sequence (dCAPS) markers using
dCAPS Finder 2.0 software (Neff et al. 2002) followed by Primer 3 (Rozan et al. 2000).
When InDels of more than 7 bp were detected, primer sets were redesigned with Primer
3 to amplify smaller fragments with clearer banding differences.
3-2-d Segregation scoring (or observation) and linkage analyses
Markers showing polymorphisms between the parental lines were applied to F2
individuals. Some markers did not segregate in a codominant manner probably due to
the preferential annealing of primers or small differences in the size of restriction
enzyme-digested PCR fragments, and these were treated as dominant markers. Linkage
analysis was performed using the computer program MapMaker/EXP 3.0b (Lander et al.
1987). The Kosambi function was used to obtain cM values (Kosambi 1944). A log of
odds threshold of 6.0 was used to group and order the markers.

22
3-2-e Chromosomal assignment of linkage groups
To determine the chromosome identity of the detected bunching onion linkage groups,
a complete set of bunching onion–shallot (A. cepa Aggregatum group) monosomic
addition lines (2n = 16 + 1 = 17; FF + 1C to FF + 8C, where ‘F’ stands for the basic
chromosome set of A. fistulosum, and ‘1C’ and ‘8C’ the 1st and 8th chromosomes,
respectively, of A. cepa) developed by Shigyo et al. (1996) was used. Note that Shigyo
et al. (1996) used the symbol ‘A’ instead of ‘C’ for shallot chromosomes. The
chromosomal locations of 30 bunching onion SSRs were directly determined using these
monosomic addition lines.
The bulb onion chromosome map constructed by Martin et al. (2005) was used as a
reference. Their map consisted of 222 bulb onion markers (RFLPs, SSRs, SNPs and
InDels), with the linkage groups assigned to the eight basic chromosomes of A. cepa
using the Shigyo et al. monosomic addition lines described above. The bunching onion
map was directly compared with the bulb onion reference map with respect to the 13
bulb onion markers located on both maps. Some other bulb onion-derived markers were
assigned to these monosomic addition lines.
Additionally, 141 markers (139 bunching onion- and 2 bulb onion-derived SSR
markers) were applied to hypo-allotriploids in which one of the alien chromosomes are
missing from the A. fistulosum complement in the diploid background of shallot (2n = 23;
CCF – 1F, CCF – 4F, CCF – 6F, CCF – 7F and CCF – 8F, where ‘C’ and ‘F’ stand for the
basic chromosome sets of A. cepa and A. fistulosum, respectively, and ‘1F’, for example,

23
stands for the first chromosome of A. fistulosum) developed by Hang et al. (2004) and
Yaguchi et al. (2009). According to a suggestion in their previous report (Hang et al.
2004), these hypo-allotriploids are designated hereafter as single-alien deletions in this
report.
3-3 Results
3-3-a SSR markers
Of 1,722 bunching onion genomic SSR primer sets, 1,406 (81.6%) appeared to
amplify single loci, and 398 of them detected polymorphisms between the parental lines
(Table 3-4). The efficiency of polymorphism detection was 23.1% by the designed primer
sets and 28.3% by the STS markers amplifiable with the primer sets. On the other hand,
STS frequency was low (43.3%) for bulb onion genomic SSRs in bunching onion (Table
3-4). More than 50% of these primers could not amplify bunching onion DNA fragments
or they produced multiple bands. In contrast, 75.1% of bulb onion EST-derived SSR
markers were clearly amplified in bunching onion. The frequency of polymorphic
markers in bulb onion EST-SSRs (11.0%) was comparable to that in bulb onion genomic
SSRs (15.4%).
Thus, 398 bunching onion SSR markers and 20 bulb onion SSR markers (18
EST-derived and two genomic SSR markers) were obtained showing polymorphisms
between the bunching onion parental lines, and 259 of the bunching onion SSR markers
and all of the bulb onion markers were applied to the F2 population (Table 3-4).

24
3-3-b InDel and SNP markers
From 11,008 bulb onion EST sequences, 1,090 were selected as highly homologous
to rice unigene cDNA sequences. Of these, 19 have already been used for developing
EST markers for bulb onion by Kuhl et al. (2004) and Martin et al. (2005). From the
remaining 1,071 sequences, 93 new primer sets were designed for intron-spanning EST
markers for bunching onion (Table 3-5). These 93 original marker candidates, together
with 248 previously reported markers, were examined for amplifiability in bunching
onion.
From a total of 341 primer sets, 253 (74.2%) appeared to amplify single loci in
bunching onion (Table 3-5). Of the amplified loci in each parent, 195 were sequenced
and three were found to be informative markers (ACAAJ79, ACAAX07 and TC1952) with
large (> 0.1 kb) InDels between the parents (Fig. 3-1a). These InDels were detected in
intron regions (Fig. 3-1b).
Sequence comparisons of the 192 other loci between the parental lines detected 55
polymorphic loci: 13 small InDels (1 to 11 bp) at 10 loci and 134 SNPs at 54 loci, with
nine loci containing both types of polymorphism. By including the large InDels described
above, the frequency of polymorphic markers was 29.7% ([3 + 55]/195 loci). As for the
SNPs detected, most (95 SNPs, 70.9%) were due to transitions. The frequency of SNP
detection was estimated at 1.5 per 1 kb of sequence.
For a small InDel marker, TC0678 (containing an 8 bp InDel), primer sets were
redesigned to differentiate the parental alleles clearly (Fig. 3-1c). Of the 54
SNP-containing loci, 17 were directly converted to CAPS markers (Fig. 3-1d), and

25
another four loci (ACAEK46, ACAER72, CF439394 and TC2026) were successfully
converted to dCAPS markers (Fig. 3-1e).
Thus, 25 polymorphic InDel, CAPS or dCAPS markers were obtained (Table 3-5).
These markers, except for ACAAX07, AOB272 and TC1891, segregated codominantly in
the F2 population.
3-3-c Linkage map of bunching onion
The genetic map for the F2 population consists of 17 linkage groups with 230 SSRs
(213 bunching onion SSRs and 17 bulb onion SSRs) and 25 bulb onion-derived
non-SSR markers (4 InDels, 17 CAPSs and 4 dCAPSs) covering 2,069 cM (Fig. 3-2). Of
the markers located on this map, 151 bunching onion SSRs, 11 bulb onion SSRs and
five bulb onion-derived non-SSRs were newly developed in this study (Tables 3-1 to 3-3).
The other polymorphic markers developed in this study were not mapped mainly due to
distorted segregation or absence of significant linkages with other markers. The average
distance between markers was 8.1 cM. Ten linkage groups in the map corresponded to
the nine groups of a previously reported linkage map of bunching onion (Ohara et al.
2005) with 11 SSR and two CAPS markers in common (Fig. 3-2).
3-3-d Assignment of bunching onion linkage groups to their corresponding A.
cepa chromosomes
Thirty of the 213 bunching onion SSR markers located on our bunching onion map
were examined for their chromosomal location using a complete set of bunching

26
onion–shallot monosomic addition lines (Shigyo et al. 1996). Of these, only eight
(AFAA02D08, AFB20G05, AFS015, AFS039, AFS104, AFS145, AFS149 and
AFRA11F11) could be assigned to corresponding A. cepa chromosomes (Fig. 3-3a,
Table 3-6). The others could not be assigned due to their poor amplifiability in shallot,
monomorphism between bunching onion and shallot, or inconsistent polymorphisms
(probably caused by some residual heterozygosity in the shallot and/or bunching onion
lines used for developing the monosomic addition lines).
A total of 42 bulb onion-derived markers (17 SSRs, 4 InDels, 17 CAPSs and 4
dCAPSs) were mapped on 13 of the 17 linkage groups in the bunching onion map (Fig.
3-2). Of these, 13 markers had already been mapped on an A. cepa chromosome map
by Martin et al. (2005). The relevant A. cepa chromosomes for three of these markers,
that is, ACC013, ACC033 (named API40 and AJB64, respectively, by Martin et al. 2005;
Wako et al. 2002b) and ACADR60 (in this study) were newly identified.
Of the 29 other bulb onion markers, four markers (ACC008, ACC015, ACC043 and
AMS14) were previously assigned to relevant A. cepa chromosomes (Wako et al. 2002b,
Masuzaki et al. 2006; Fig. 3-3b). In the present study, relevant A. cepa chromosomes for
three other markers were identified (ACE039, ACE044 and TC1010; Table 3-6). Besides
these newly assigned markers, ACADR60, which Martin et al. (2005) assigned to the 6C
chromosome, was assigned to 2C on the basis of our data (Fig. 3-3c). Five markers
could not be assigned to relevant A. cepa chromosomes due to monomorphism between
bunching onion and shallot. The remaining 17 bulb onion-derived markers on the
bunching onion map have not, so far, been examined for chromosomal location.

27
Twelve linkage groups in the bunching onion map were connected to seven A. cepa
chromosomes (Chrs. 1C–6C and 8C) with eight bunching onion-derived SSR markers
and 20 bulb onion-derived markers (1 genomic SSR, 8 EST-SSRs, 1 InDel, 9 CAPSs
and 1 dCAPS; Table 3-6).
3-3-e Assignment of bunching onion linkage groups to their relevant
chromosomes
Of the 213 bunching onion SSR markers on our map, 139 were examined for their
chromosome assignment using the allotriploid-bunching onion single-alien deletion lines.
Seventy markers did not amplify in shallot, and 39 of these were assigned to A.
fistulosum chromosomes on the basis of the absence of bunching onion-specific bands
in one of the deletion lines. The other 69 markers were amplifiable in shallot. Of these,
55 were polymorphic between bunching onion and shallot, of which 38 were assigned to
A. fistulosum chromosomes (Fig. 3-4a and b). In addition, the relevant bunching onion
chromosomes for two bulb onion EST-derived SSR markers (ACM096 and ACE113)
were determined with the deletion lines.
Eleven bunching onion linkage groups were assigned to five chromosomes (Chrs. 1F,
4F, 6F, 7F and 8F) with 77 bunching onion- and two bulb onion-derived SSR markers
(Table 3-7).
3-4 Discussion
In a previous study, Ohara et al. (2005) constructed a low-density bunching onion

28
linkage map covering 947 cM mainly based on amplified fragment length polymorphism
(AFLP) markers. In the present study, a new bunching onion linkage map covering 2,069
cM was constructed (Fig. 3-2). Compared with previously reported bulb onion maps (694
cM, van Heusden et al. 2000; 1,907 cM, Martin et al. 2005), this map has greater
genome coverage and may therefore be used as a standard map for bunching onion.
This linkage map will be useful for genetic studies such as QTL analysis of agronomic
traits in bunching onion.
It was also found that many bulb onion-derived markers were useful for mapping in
bunching onion (Tables 3-4 and 3-5). Among bulb onion EST-derived markers, the
frequency of informative (i.e., polymorphic between the parental lines of bunching onion)
markers was higher in those with InDels and/or SNPs (29.2%) than in those with SSRs
(11.0%; Tables 3-4 and 3-5). Seventy-five polymorphic markers (18 SSRs and 57 InDels
and/or SNPs) were developed or identified from 558 bulb onion EST-derived primer sets,
and 42 of these were located on the bunching onion map (Fig. 3-2). There were 558
bulb onion ESTs examined in this study, however, Kuhl et al. (2004) reported 11,008
unique ESTs of bulb onion. Thus, it may be considered that considerable numbers of
bulb onion EST-derived markers can be newly added to the bunching onion map.
Forty-two bulb onion-derived markers, including one genomic SSR, were located on
13 of the 17 linkage groups in the bunching onion map (Fig. 3-2). In the bulb onion map
reported by Martin et al. (2005), AOB272 was located on Chr. 2C and four other markers
(ACADR60, ACM024, ACM066 and ACM177) were located on Chr. 6C. Masuzaki et al.
(2006) directly identified the relevant A. cepa chromosome (2C) for AMS14. In this
29
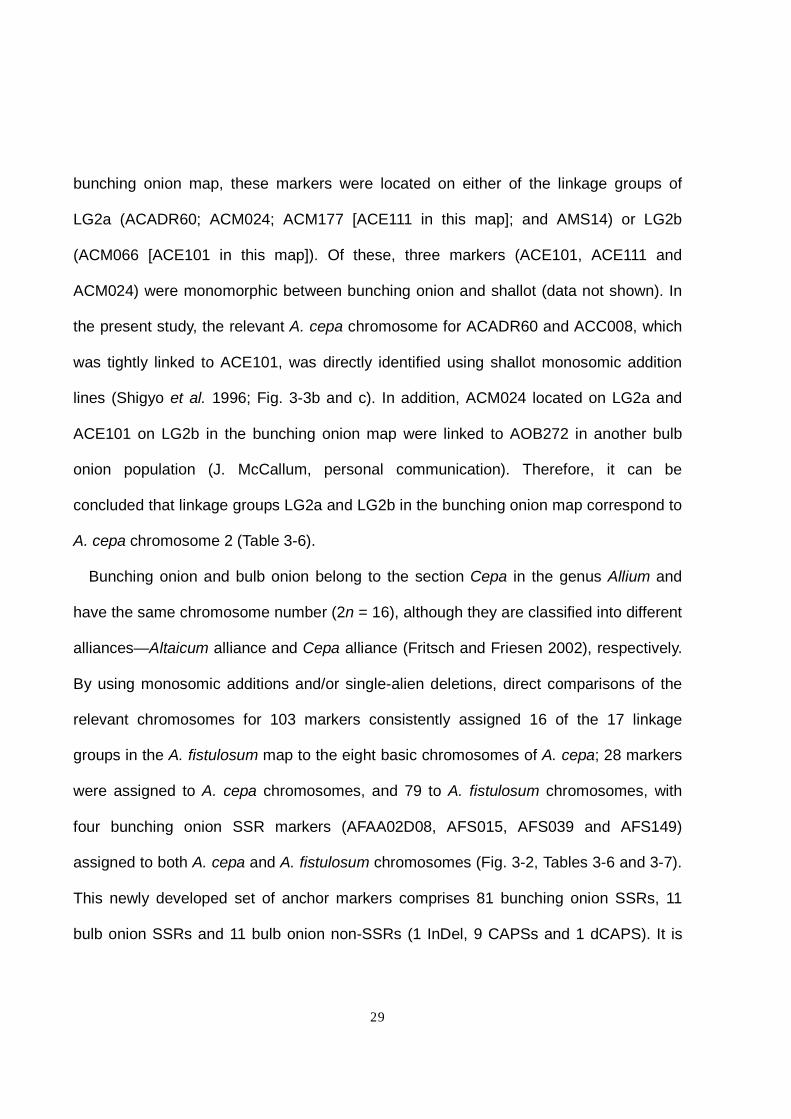
bunching onion map, these markers were located on either of the linkage groups of
LG2a (ACADR60; ACM024; ACM177 [ACE111 in this map]; and AMS14) or LG2b
(ACM066 [ACE101 in this map]). Of these, three markers (ACE101, ACE111 and
ACM024) were monomorphic between bunching onion and shallot (data not shown). In
the present study, the relevant A. cepa chromosome for ACADR60 and ACC008, which
was tightly linked to ACE101, was directly identified using shallot monosomic addition
lines (Shigyo et al. 1996; Fig. 3-3b and c). In addition, ACM024 located on LG2a and
ACE101 on LG2b in the bunching onion map were linked to AOB272 in another bulb
onion population (J. McCallum, personal communication). Therefore, it can be
concluded that linkage groups LG2a and LG2b in the bunching onion map correspond to
A. cepa chromosome 2 (Table 3-6).
Bunching onion and bulb onion belong to the section Cepa in the genus Allium and
have the same chromosome number (2n = 16), although they are classified into different
alliances—Altaicum alliance and Cepa alliance (Fritsch and Friesen 2002), respectively.
By using monosomic additions and/or single-alien deletions, direct comparisons of the
relevant chromosomes for 103 markers consistently assigned 16 of the 17 linkage
groups in the A. fistulosum map to the eight basic chromosomes of A. cepa; 28 markers
were assigned to A. cepa chromosomes, and 79 to A. fistulosum chromosomes, with
four bunching onion SSR markers (AFAA02D08, AFS015, AFS039 and AFS149)
assigned to both A. cepa and A. fistulosum chromosomes (Fig. 3-2, Tables 3-6 and 3-7).
This newly developed set of anchor markers comprises 81 bunching onion SSRs, 11
bulb onion SSRs and 11 bulb onion non-SSRs (1 InDel, 9 CAPSs and 1 dCAPS). It is

30
therefore concluded that a very high level of macrosynteny exists between these two
species. The remaining linkage group, temporarily named ‘LG X’, could not be assigned
to any chromosome. The relevant chromosome of LG X would be identified by mapping
new bulb onion-derived markers and/or by integrating different bunching onion linkage
maps with common markers.
Compared with bulb onion, bunching onion is suitable for genetic studies because the
crop is annual and has a 28% smaller genome size (Ricroth et al. 2005). Genome
synteny is, as mentioned above, highly conserved between bunching onion and bulb
onion. However, it has been reported that a minimum of two heteromorphic bivalents are
observed in meiotic analysis of interspecific hybrids between bunching onion and bulb
onion (Peffley 1986), suggesting that chromosomal mutations such as translocation and
inversion might be involved in the speciation between A. fistulosum and A. cepa. For
detailed studies of such chromosomal mutations, microsynteny should be evaluated at
the genome-wide level by plotting many more common markers onto the maps of both
species.

31
Chapter 4
Considerable Heterogeneity in Commercial F1 Cultivars of Bunching Onion and
the Proposal of Breeding Scheme for Conferring Genetic Traceability using SSR
Markers
4-1 Introduction
To determine the quality of hybrid seed, seed companies undertake quality control
programs that monitor seeds from harvest to purchase (McDonald 1998). The grow-out
test and morphological comparisons of seedlings are commonly conducted for
assessing the genetic purity of hybrid seed. However, since these tests are
time-consuming and require a large area, a seed purity test based on molecular markers
is desirable. Such markers would also be useful for cultivar identification and hence for
protection of breeders’ rights.
Methods including isozyme (Tanksley and Jones 1981), RFLP (Livneh et al. 1990),
and RAPD analysis (Hashizume et al. 1993, Ballester and de Vicente 1998, Crockett et
al. 2000, 2002) have all been used to test hybrid purity. Although isozyme analysis is
simple and easy, it does not allow for effective detection of polymorphisms between
closely related genotypes (Crockett et al. 2000). While the RFLP method is highly
reliable, it displays the limitations of most routine commercial testing; in particular, it is
time-consuming, labor-intensive and requires complex procedures.
In comparison, PCR-based techniques are simple, fast, and easily automated.
Because of its remarkable simplicity and rapidity, the RAPD technique is currently widely

32
used for detecting DNA polymorphisms. However, this method is also associated with
certain problems, including the low reproducibility of some bands and uncertainty in the
homology of some fragments co-migrating in gel electrophoresis experiments (Klaas and
Friesen 2002). In contrast, SSRs are very useful because of their codominant mode of
inheritance, higher reliability over RAPDs and their abundance in genomes (Jones et al.
1997). SSRs are used for linkage map construction, marker-assisted selection, diversity
studies and genomic synteny analysis. Moreover, SSR markers can be applied to
cultivar identification (Bredemeijer et al. 1998, Meesang et al. 2001, Rajora and Rahman
2003).
Bunching onion is a typical allogamous crop arising from protandry, which results in a
high rate of outcrossing (Ford-Lloyd and Armstrong 1993). It is self-compatible, but
suffers from severe inbreeding depression when self-pollinated. Open-pollinated (OP)
cultivars of bunching onion exhibit very high degrees of genetic heterogeneity (Haishima
et al. 1993). Parental lines of F1 hybrids may also maintain a certain degree of genetic
heterogeneity.
The objective of the present study was to determine whether the SSR markers can be
applied to F1 purity tests in bunching onion by investigating the level of genetic
uniformity of commercial F1 cultivars. Furthermore, a breeding scheme is proposed to
confer traceability that would allow for easy identification and/or seed purity
determination of cultivars using SSR markers.
4-2 Materials and Methods

33
4-2-a Plant materials
Eight cultivars of bunching onion (6 F1 cultivars; 1 open pollinated [OP] cultivar,
‘Yoshikura’; and 1 landrace, ‘Ojima’) and one accession of A. altaicum Pall., JP138870,
the closest species and considered to be the wild progenitor of A. fistulosum (Friesen et
al. 1999), were used (Table 4-1). Seeds were sown in 200-cell plug trays (one seed per
plug), and the seedlings were transplanted to the field 7 weeks after sowing. All the eight
cultivars belonged to “Senju”, the most popular cultivar group of bunching onion in Japan.
The A. altaicum accession was introduced from Almaty Botanical Garden, Kazakhstan,
in 1997, and was propagated by open-pollination at the National Institute of Vegetable
and Tea Science (NIVTS), Japan.
4-2-b DNA extraction and PCR
Total genomic DNA was extracted from 0.1 g of fresh leaf tissue from 3-month-old
plants (randomly selected, 33 plants/cultivar) according to the method described in
Chapter 2-2-a.
Fourteen SSR markers were used for DNA fingerprinting (Table 4-2). These SSR loci
were highly polymorphic among nine bunching onion cultivars (Song et al. 2004). PCR
and was conducted according to the method described in Chapter 2-2-d, and PCR
products were separated on 5% (w/v) denatured polyacrylamide gel according to the
method of Song et al. (2004).
4-2-c Evaluation of genetic uniformity

34
The degree of DNA polymorphism at each SSR locus was evaluated on the basis of
PIC. The PIC value was calculated for each SSR locus according to the formula
(Anderson et al. 1993);
PIC = 1-å=
k
iiP
1
2 ,
where k is the total number of alleles detected for a locus and Pi is the frequency of the
ith allele in the set of eight bunching onion cultivars (33 plants each) investigated.
For evaluating genetic homogeneity, the number of alleles, the number of genotypes
determined and the proportion of plants exhibiting the prevailing genotype (Pr%) were
calculated for each cultivar. When more than 5% of the individuals in a cultivar carried
any alleles other than the prevailing one, the locus was defined as polymorphic in the
cultivar. For each cultivar, the frequency of heterogeneous loci was represented by the
proportion of polymorphic loci (Pl) among the 14 SSR loci investigated.
4-3 Results
All the SSR primer sets used amplified one or two bands in each plant, revealing
polymorphism and genetic heterogeneity in each cultivar (Fig. 4-1). Within the eight
bunching onion cultivars, the PIC values of the SSR markers ranged from 0.41 to 0.76
among the 14 loci with an average value of 0.59 (Table 4-3).
The number of alleles detected at each locus varied among the cultivars and SSR loci,
ranging from three to seven among the eight cultivars with an average value of 4.3
(Table 4-3). A. altaicum-specific alleles were detected at three loci (AFS096, AFS146

35
and AFS149; data not shown).
The number of alleles within each cultivar at each locus ranged from two to seven with
an average value of 3.1 (Table 4-4). The number of genotypes within each cultivar
ranged from one to 15 with an average value of 4.1. In the landrace ‘Ojima’, seven
alleles were detected and 15 genotypes were found at the AFS123 locus. The Pr%
values averaged over the 14 SSR loci ranged from 45 to 73 in the eight cultivars, with an
average value of 58. Even though the F1 cultivars were found to be highly
heterogeneous, the landrace ‘Ojima’ and the OP cultivar ‘Yoshikura’ were still more
heterogeneous. The average Pr% scores showed that three F1 cultivars—‘Yuzan’,
‘Natsubasho’ and ‘White Tower’—were as heterogeneous as the OP cultivar, the
landrace cultivar and even the A. altaicum accession studied (Table 4-4).
Among the 112 loci (8 cultivars ´ 14 SSRs) studied, only four loci were found to be
genetically uniform in at least one cultivar. ‘Natsuougi 2’ at the AFS104 and AFS145 loci
and ‘Shuitsu’ at the AFS105 and AFS110 loci were highly homogeneous. Of them,
‘Natsuougi 2’ at AFS145 was highly homozygous but heterozygous at other loci.
However, the other loci in these cultivars were polymorphic, as was the case for most of
the SSR loci studied in the bunching onion cultivars, including the F1 cultivars. As a
result, the Pl value was very high (86 or 100%) in all the cultivars investigated (Table
4-4).
4-4 Discussion
Although bunching onion is self-compatible, it is protandrous and is usually

36
insect-pollinated, exhibiting a high rate of outcrossing (Kumazawa and Katsumata 1965,
Ford-Lloyd and Armstrong 1993). Therefore, it is considered that landraces and OP
cultivars of bunching onion maintain high levels of heterozygosity and heterogeneity. It
has previously been reported that, on the basis of an isozyme study, very high degrees
of genetic heterogeneity occur within landrace cultivars of bunching onion (Haishima et
al. 1993) or bulb onion (Rouamba et al. 2001). In the present study, SSR markers were
used for the evaluation of the degree of genetic heterogeneity. The number of alleles
and the PIC value at each SSR locus showed that SSRs were highly polymorphic (Table
4-3). A high degree of heterozygosity was also found even in the commercial F1 cultivars
(Fig. 4-1 and Table 4-4). The Pr% value, rather than the degree of heterozygosity (He;
Nei 1973), was used for the evaluation of the degree of heterogeneity since F1 cultivars
can be highly homogeneous, even though completely heterozygous. If an F1 cultivar is
produced by crossing two pure lines, the cultivar should be homogeneous at all the loci,
regardless of homozygosity or heterozygosity for the locus. In the present study,
however, more than two genotypes were found at significant frequencies at most of the
loci in each cultivar. Not only OP or landrace cultivars but also F1 cultivars showed very
high Pl values (Table 4-4). It was, therefore, concluded that most of, if not all, the
parental lines of existing F1 cultivars of bunching onion were not genetically uniform.
In general, the agronomic traits of F1 cultivars are more uniform than those of OP and
landrace cultivars. It was confirmed that the bunching onion F1 cultivars tended to be
more genetically uniform than the OP and landrace cultivars (Table 4-4). However, since
bunching onion breeding takes many years (usually 1–2 years per generation) and

37
bunching onion shows severe inbreeding depression, it is very difficult to produce pure
lines of bunching onion. Moreover, the F1 purity test, based on a grow-out test or
morphological comparison of bunching onion seedlings, is time-consuming and requires
a large area because of the extremely slow growth of the plants.
Therefore, I propose here an "SSR-tagged breeding" scheme to enhance the rapidity,
ease and accuracy of cultivar identification and F1 purity testing in bunching onion (Fig.
4-2). This scheme consists of the following four steps:
1. Selection of a small number of highly polymorphic SSR loci that are not tightly
linked to each other, and identification of the prevailing allele at each locus since the
parental lines of the F1 hybrids must carry different alleles at each selected locus.
2. Selection of the plants in a foundation seed field that are homozygous for the
prevailing allele at all the SSR loci selected.
3. Harvest of the foundation seed from the selected plants. For F1 breeding, one
parental line should be homozygous at each selected SSR locus, and the other should
be homozygous for a different allele.
4. Production of stock seed and then marketing of the seed. OP cultivars should be
homozygous and uniform at the selected SSR loci, and F1 cultivars developed by this
scheme should not exhibit significant inbreeding depression since most of the loci can
maintain their original heterogeneity.
Cultivars developed using this scheme could be efficiently identified by examining
individuals for the desired genotypes at a few SSR loci. In addition, the purity of F1 seed
can be rapidly and accurately evaluated based on the degree of uniformity at the

38
selected SSR loci.
The “SSR-tagged breeding” scheme can be applied to any allogamous crops in which
inbreeding depression is as severe as in bunching onion. This could be useful for
protecting breeders' rights and also for conferring cultivar traceability in such crops.

39
Chapter 5
SSR-tagged Breeding Scheme in Allogamous Crops with an Example Application
to Bunching Onion
5-1 Introduction
Cultivar identification using DNA markers is important for the protection of breeders’
rights over new cultivars. RAPDs, STSs, CAPSs and SSRs have all been used for
cultivar identification in several autogamous and vegetatively propagated crops (Bellamy
et al. 1996; Meesang et al. 2001; Kunihisa et al. 2003; Otsubo et al. 2005), in which
individual cultivars usually show a very high degree or even perfect genetic homogeneity.
In allogamous crops, however, accurate identification of existing cultivars is often very
difficult, since inbreeding depression hinders genetic fixation, and consequently, causes
population heterogeneity. Indeed, high degrees of genetic heterogeneity exist in
commercial seed populations, including recently developed F1 cultivars, of bunching
onion (Chapter 4), which is an allogamous crop with protandrous flowers (Kumazawa
and Katsumata 1965; Ford-Lloyd and Armstrong 1993). Accordingly, accurate
identification of existing cultivars using DNA markers may be impossible in bunching
onion.
In Chapter 4, I proposed the “SSR-tagged breeding” scheme for easy and accurate
identification of cultivars and purity checks of F1 cultivar seed lots in allogamous crops.
In this scheme, plants homozygous at a few SSR loci are selected in the foundation
seed field. In this chapter, the feasibility of the SSR-tagged breeding scheme is

40
demonstrated using a bunching onion landrace as an example of an allogamous crop
population
5-2 Materials and Methods
5-2-a Preliminary examination of SSR markers on polymorphisms within the
starting population
A landrace ‘Shimonita’ was selected as the sample for the trial. ‘Shimonita’ is one of
the most valuable bunching onion cultivars in Japan, having excellent taste properties
when cooked.
Seventeen SSR markers located on a bunching onion linkage map were used for DNA
fingerprinting (Table 5-1). These markers were located on the A. fistulosum linkage map
consisting of 17 linkage groups with 163 markers (111 AFLPs,48 SSRs,4 CAPSs) and
covers 1,098cM (Fig. 5-1). Except for AFS103, all of these SSRs are also located on the
SSR marker-based linkage map (Fig. 3-2).
PCR and acrylamide gel electrophoresis were conducted according to the method of
Song et al. (2004). Each plant was genotyped at the 17 SSR loci, and the numbers of
alleles and genotypes, the frequency of the prevailing allele, the PIC value, and the Pr%
values for alleles (PrA%) and genotypes (PrG%), were calculated for the starting
population according to the method described in Chapter 4-2-c.
5-2-b Selection from the starting population
Marker information is useful for an SSR-tagged breeding scheme. The advantage of

41
SSR-tagged breeding using marker information is summarized in Table 5-2. Based on
the results of the preliminary examination, two sets of markers were selected, Set A
(AFS039 and AFS088) and Set B (AFS099, AFS131, AFS140 and AFS142; Table 5-3).
These markers were selected for the following reasons: (1) stability in PCR amplification;
(2) a high PIC value (resulting in lower PrA% and PrG% values) for Set A, thus avoiding
severe selection intensity; (3) a lower or moderate PIC value (resulting in higher PrA%
and PrG% values) for Set B; and (4) large differences in base pair size between the
prevailing, targeted and other alleles, enabling easy identification of genotypes to be
selected.
A total of 12 and 20 plants genotyped as having the prevailing allele, either in a
homozygous or heterozygous state, at all marker loci of Sets A and B, respectively, were
selected. Of these, seven and 12 plants were randomly selected. They were then potted
in the autumn of 2002 and selfed in the spring of 2003 (Fig. 5-2). The remaining 18
plants were also self-pollinated, although one plant was later omitted due to poor seed
set.
5-2-c Selection in the foundation seed field
Total DNA was extracted from leaf tissue of each of the S1 plants preselected by
observation, then PCR was conducted with each primer pair for the Set A or Set B
markers. This time a capillary DNA sequencer system was used instead of the
polyacrylamide gel electrophoresis system for genotyping of the many more individuals
than in the preliminary examination. PCR products were loaded into a capillary DNA

42
sequencer (ABI3700; Applied Biosystems, CA, USA) and genotypes were determined
using the software GeneMapper ver. 3.0 (Applied Biosystems). The forward primers
were fluorescent-labeled with 6-FAM, NED, PET or VIC (Applied Biosystems) in
advance of PCR. S1 plants selected with the assistance of the Set A or Set B markers
were potted and open-pollinated within each population. The resulting progeny
populations were named Shimonita A and Shimonita B.
5-2-d Observation of agronomic traits
Six morphological traits (number of pseudostems, fresh weight, leaf blade length
and width, pseudostem length and width) were scored for 10 plants per maternal line of
each population. Each line was treated as a replicate. Leaf tissue pungency was
assessed by measuring the concentration of pyruvate, which is formed as a stable
by-product of the enzymatic decomposition of Allium-specific flavor precursors.
Approximately 100 mg of tissue was collected from the mid-portion of the fresh
pseudostem or leaf blades of each plant, ground using a TissueLyser (Qiagen, Hilden,
Germany) and maintained at room temperature for 30 min. After centrifugation
(10,000´g for 10 min), the supernatant was collected. Pyruvic acid concentration was
measured according to Yoo et al. (1995) for three plants per line.
After the investigation of morphological traits, plants were transplanted into an
unheated greenhouse and grown until bolting. Bolting time was scored as the average
bolting date for eight plants in each line.
Statistical analysis among populations for each agronomic trait was conducted and the

43
degree of heterogeneity was measured according to the Tukey-Kramer HSD test (P =
0.05) and the Wilcoxon rank-sum scores (P = 0.05) using JMP ver. 4.0 (SAS Institute
Inc., NC, USA).
5-3 Results
5-3-a Genetic heterogeneity in ‘Shimonita’
All the SSR primer sets revealed polymorphism and genetic heterogeneity in the
starting population (Fig. 5-3). The number of alleles detected in the starting population
varied from 2 to 10 among the 17 SSR loci examined, and the PIC ranged from 0.31 to
0.82 (Table 5-3). The average numbers of alleles and genotypes were 4.4 and 7.3,
respectively, and the average PrG% was 46. These data are comparable with those
reported in other landraces (Haishima et al. 1993) and OP cultivars (Chapter 4) of
bunching onion, indicating a high degree of genetic heterogeneity in ‘Shimonita’.
5-3-b SSR-tagged breeding scheme
In the lineage leading to Shimonita A, a total of 2,037 S1 seeds from seven plants of
the starting generation (120 to 450 seeds per plant) were sown in a greenhouse in June
2003. A total of 680 seedlings (30 to 120 seedlings per family) were then transplanted
into the field 7 weeks after sowing. After stand observations of agronomic traits in
October 2003, when the plants were 4-months-old, 108 plants (12 to 16 plants per
family) were preselected for marker-assisted selection. From these 108 preselected
plants, 26 double homozygous individuals, homozygous for the 298 bp allele at AFS039

44
and the 168 bp allele at AFS088, were selected.
In the lineage leading to Shimonita B, a total of 2,138 S1 seeds from 12 plants (53 to
364 seeds per plants) were sown, 820 seedlings (30 to 180 seedlings per family) were
transplanted, and 147 plants (5 to 16 plants per family) were preselected by stand
observation for marker-assisted selection. From these 147 preselected plants, 40
quadruple homozygotes for the 234 bp, 159 bp, 208 bp and 248 bp alleles at AFS099,
AFS131, AFS140 and AFS142, respectively, were selected.
Thus, 26 plants of seven S1 A families and 40 plants of 11 S1 B families were selected
in the transitional generation (Fig. 5-2). These plants were potted and open-pollinated
within each population. The resulting progeny populations, Shimonita A and Shimonita B,
were consequently SSR-tagged. In addition, 30 plants from 17 S1 families selected by
stand observation, but not genotyped and therefore not screened at any SSR loci, were
also open-pollinated and used as a control (Shimonita C).
The selection intensity for each marker set was estimated based on the following
formulae:
Selection intensity (Set A) = [1–(1–a1/100)2] ´ [1–(1–a2/100)2]
Selection intensity (Set B) = [1–(1–b1/100)2] ´ [1-(1-b2/100)2] ´ [1–(1–b3/100)2] ´
[1–(1–b4/100)2],
where a1, a2, b1, b2, b3 and b4 are the PrA% of AFS039, AFS088, AFS099, AFS131,
AFS140 and AFS142, respectively. As shown in Table 5-2, a1, a2, b1, b2, b3 and b4 were
37, 61, 64, 60, 63 and 61, respectively. The selection intensity was therefore expected to
be 0.51 for Set A and 0.53 for Set B. The actual selection rate with Set A and Set B

45
markers was 0.32 (12/37) and 0.54 (20/37) in the starting population, respectively.
5-3-c Feasibility of the SSR-tagged breeding scheme
As the maternal line, seeds were harvested from each plant in the two SSR-tagged
populations, Shimonita A and Shimonita B, and the control population, Shimonita C; 13,
23 and 10 maternal lines were obtained from Shimonita A, B and C, respectively. Sixty
seeds of each line were sown in a greenhouse on April 26, 2004. Twenty-two to 64
randomly selected seedlings of each maternal line were then transplanted into the field
at NIVTS (Tsu, Mie prefecture) on June 24. On November 9, plants were harvested and
investigated for morphological traits and pungency. Plants were then transplanted into
an unheated greenhouse and investigated for bolting time.
The field trial conducted in April 2004 through April 2005 detected no significant
differences in any traits tested between the SSR-tagged populations and control
population (Table 5-4). The PIC value was estimated for each allele at the targeted loci
in Shimonita A, Shimonita B and Shimonita C. The SSR-tagged populations were
genetically uniform at the targeted loci, whereas untargeted loci still had high degrees of
heterogeneity (Table 5-5). The degree of genetic heterogeneity at untargeted loci in each
SSR-tagged population was as high as that in the control population. The high degree of
heterogeneity in the starting population was maintained into Shimonita C.
5-4 Discussion
To evaluate the efficiency of the SSR-tagged breeding scheme, two marker sets were

46
selected according to different selection criteria (Table 5-2). The number of target
markers was set to two and four for Set A and Set B, respectively, and markers were
chosen so that the expected selection intensity with Set A was nearly equal to that with
Set B. For Set A, AFS039 was the first marker selected because of its higher PIC as well
as its consistent PCR results, in order to achieve a high identification power with a
limited number of markers. Although AFS017 showed the highest PIC value in the
markers examined, it was omitted because of the extremely large number (i.e. 21) of
genotypes found at this locus among only 36 plants genotyped, suggesting that this
region might be a hotspot for microsatellite slippage. For the other markers of Set A,
AFS088 was selected, despite it not having a very high PIC value, for two reasons:
(1) it was located in the middle of the largest linkage group (J1) in the preliminary
bunching onion map (Fig. 5-1) and therefore was thought to have the lowest risk of
linkage to AFS039, which was located at a distal end of the linkage group J7; and (2) the
intensity of selection with the combination of AFS039 and AFS088 was expected to be
nearly equal to that with Set B markers (see below). For Set B, four markers were
selected with moderate PrA% values (i.e. 60–64; Table 5-3). The selection intensity was
expected to be 0.51 for Set A and 0.53 for Set B. The present results showed that both
Sets were effective for SSR-tagged breeding. These results thus demonstrate that two
markers with a high PIC value and a not-too-low PrA% can be sufficient for SSR
tagging.
The field trial detected no significant differences in any traits tested between the
SSR-tagged populations and the control population (Table 5-3). This demonstrates that

47
the SSR-tagged scheme can practically maintain the agronomic traits of the original
population. On the other hand, the SSR-tagged populations still maintained high
degrees of heterogeneity (Table 5-4), suggesting that a high level of heterogeneity in the
starting population can be maintained throughout the SSR-tagged breeding procedure.
These results demonstrate the feasibility of the SSR-tagged breeding scheme using a
bunching onion landrace. This scheme may be applicable not only to bunching onion but
also to other allogamous crops in which inbreeding depression is as severe as in
bunching onion. In addition, the purity of F1 seed lots can be rapidly and accurately
evaluated for the degree of uniformity or heterozygosity at a small number of selected
SSR loci when the parental lines of the F1 cultivar are developed using this scheme.
Thus, the SSR-tagged breeding scheme may be useful for protecting breeders’ rights
and conferring traceability in allogamous crops.
Genomic SSR markers were used for the SSR-tagged breeding in this study. Recently,
from analysis of a large number of ESTs in bulb onion cDNA libraries, hundreds of
EST-derived SSR markers have been developed (Kuhl et al. 2004; Martin et al. 2005).
EST-derived SSRs may well be superior to genomic SSRs for developing DNA markers
linked to agronomic traits since they are tightly or directly linked to genes. EST-derived
SSR markers are, however, thought to be less suitable than genomic SSRs for
SSR-tagged breeding since they may directly influence agronomic traits and therefore
originally exhibit low heterogeneities within cultivars.

48
Chapter 6
General Discussion
Bunching onion is one of the most important vegetables in East Asian countries,
especially in Japan, China and Korea (Kumazawa and Katsumata 1965, Ford-Lloyd and
Armstrong 1993). In Japan, bunching onion is the fourth-highest producing annual
vegetable crop, after tomato, strawberry and cucumber (MAFF 2005). However, despite
the economic importance of bunching onion, its genetics remain relatively unstudied
using molecular-based approaches.
Several breeding objectives for bunching onion have been identified, including
disease resistance, high yield, late bolting, high qualities and suitability for mechanized
farming. These traits are also important in bulb onion breeding. An efficient method of
analyzing the mode of inheritance of such traits is QTL analysis based on a genetic
linkage map of bunching onion. The genetic characteristics of bunching onion and bulb
onion have not been thoroughly investigated to date and molecular-based approaches
need to be utilized to elucidate such characteristics. Through molecular genetic analyses,
it will be possible to utilize comparative genomics approaches between bunching onion
and bulb onion, and will enable molecular breeding for both crops.
On the other hand, cultivar identification and F1 purity tests using DNA markers are
also important for the protection of new cultivars and for checking genetic purity of hybrid
seed. Although bunching onion is self-compatible, it is protandrous and is usually
insect-pollinated, exhibiting a high rate of outcrossing (Ford-Lloyd and Armstrong 1993).
Therefore, it is considered that the landraces and OP cultivars of bunching onion

49
maintain high levels of heterozygosity and heterogeneity. The objective of this study was
to evaluate genetic uniformity of commercial F1 cultivars of bunching onion by using
SSR markers. Furthermore, a breeding scheme is proposed to confer traceability that
enables cultivar identification and F1 purity tests using SSR markers. Finally, a bunching
onion landrace was used as starting material to test the feasibility of the proposed
breeding scheme in an allogamous crop population.
6-1 A large scale isolation of SSR clones and construction of SSR-based
chromosome map of bunching onion
In addition to 166 primer sets that have previously been developed from bunching
onion genomic SSR clones (Wako et al. 2002a, Song et al. 2004, Ohara et al. 2005),
1,796 SSR clones were newly isolated in this study by large-scale sequencing of
SSR-enriched genomic DNA libraries. This was performed in order to establish a genetic
basis for molecular breeding of bunching onion. The present study showed that 74.1% of
the bunching onion genomic SSRs had GT cores, while only 17.5% had GA cores (Table
2-3). Within the bunching onion genome, Song et al. (2004) revealed that GT repeats
are more frequent than GA repeats, even though GA repeats are known to be more
frequent in most plant species (Lagercrantz et al. 1993). Fischer and Bachmann (2000)
further suggested that the bulb onion genome is rich in GT repeats, revealing that of 30
markers developed from an SSR-enriched genomic library, 21 contained GT repeats,
while only three contained GA repeats. The results from this study thus confirm that GT
repeats are far more abundant than GA repeats in the Allium genome.

50
In the present study, the frequency of GC repeats was much lower than that of AT
repeats. In a data set of bulb onion EST sequences, Kuhl et al. (2004) detected 54 (AT)n
cores versus only one (GC)n core. The GC content of bunching onion nuclear DNA has
previously been estimated at 37.9% (Kirk et al. 1970) and 39.8% (Ricroch et al. 2005),
making it one of the lowest known GC values for angiosperms (Kirk et al. 1970, Stack
and Coming 1979). Using EST data, the GC content of bulb onion was estimated at
41.9% and 30.4% in total and intron regions, respectively (Kuhl et al. 2004), and in the
present study, the average GC content of the bunching onion SSR clones was estimated
at 37.7%. Thus, these results also demonstrate the low GC content of Allium genomes.
SSR markers were shown to be highly polymorphic in five bunching onion inbred lines
(Table 2-4). In fact, 398 of 1,722 bunching onion genomic SSR markers detected
polymorphisms between the parental lines, and were used for constructing a linkage
map (Table 3-4).
The bunching onion linkage map constructed in this study consists of 17 linkage
groups with 213 bunching onion SSR markers and 42 bulb onion SSR, InDel, CAPS or
dCAPS markers, covering 2,069 cM (Fig. 3-2). This is the first linkage map based mainly
on SSR markers in the genus Allium. Compared with previously reported bulb onion
maps (694 cM, van Heusden et al. 2000; 1,907 cM, Martin et al. 2005) and a bunching
onion map (947 cM, Ohara et al. 2005), this map has greater coverage and may
therefore be used as a standard map in bunching onion. The main breeding objectives
for bunching onion are disease resistance, high yield, late bolting, high consumer
qualities (e.g., low pungency, high sugar content) and suitability for mechanized farming,
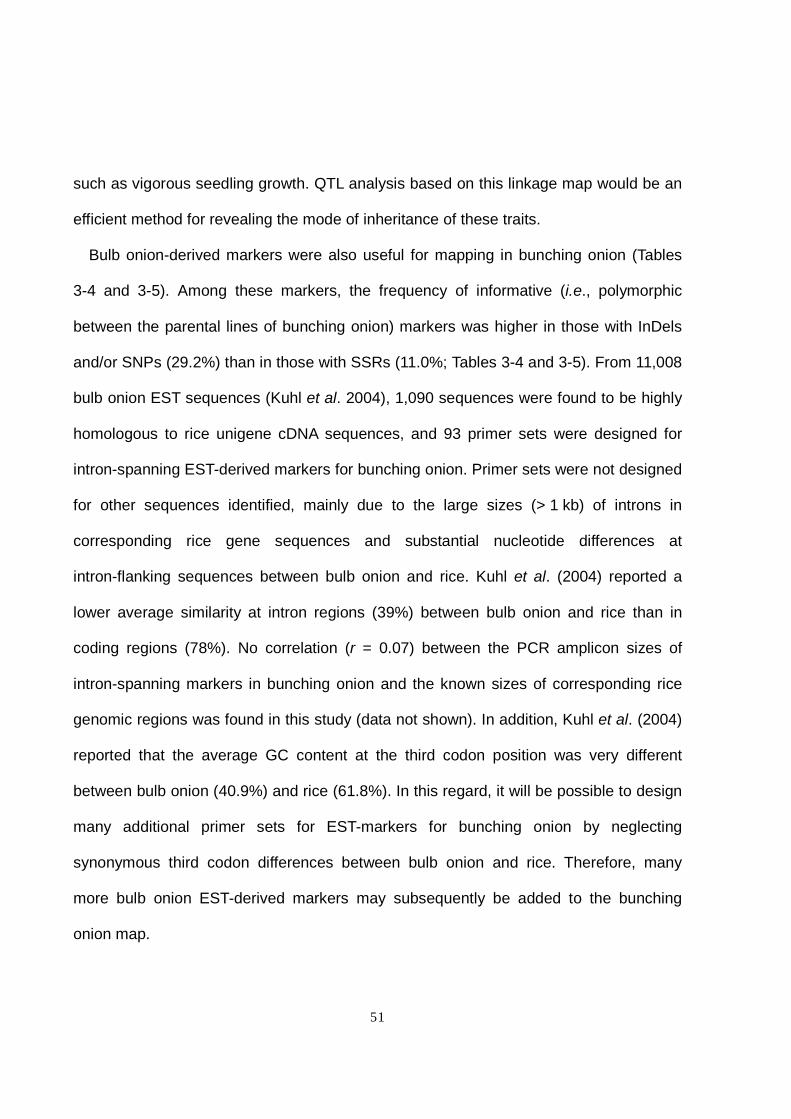
51
such as vigorous seedling growth. QTL analysis based on this linkage map would be an
efficient method for revealing the mode of inheritance of these traits.
Bulb onion-derived markers were also useful for mapping in bunching onion (Tables
3-4 and 3-5). Among these markers, the frequency of informative (i.e., polymorphic
between the parental lines of bunching onion) markers was higher in those with InDels
and/or SNPs (29.2%) than in those with SSRs (11.0%; Tables 3-4 and 3-5). From 11,008
bulb onion EST sequences (Kuhl et al. 2004), 1,090 sequences were found to be highly
homologous to rice unigene cDNA sequences, and 93 primer sets were designed for
intron-spanning EST-derived markers for bunching onion. Primer sets were not designed
for other sequences identified, mainly due to the large sizes (> 1 kb) of introns in
corresponding rice gene sequences and substantial nucleotide differences at
intron-flanking sequences between bulb onion and rice. Kuhl et al. (2004) reported a
lower average similarity at intron regions (39%) between bulb onion and rice than in
coding regions (78%). No correlation (r = 0.07) between the PCR amplicon sizes of
intron-spanning markers in bunching onion and the known sizes of corresponding rice
genomic regions was found in this study (data not shown). In addition, Kuhl et al. (2004)
reported that the average GC content at the third codon position was very different
between bulb onion (40.9%) and rice (61.8%). In this regard, it will be possible to design
many additional primer sets for EST-markers for bunching onion by neglecting
synonymous third codon differences between bulb onion and rice. Therefore, many
more bulb onion EST-derived markers may subsequently be added to the bunching
onion map.

52
Bunching onion and bulb onion belong to the section Cepa and have the same
chromosome number (2n = 16), although they are classified into different
alliances—Altaicum alliance and Cepa alliance (Fritsch and Friesen 2002), respectively.
Using 103 anchor markers (81 bunching onion SSRs; 11 bulb onion SSRs; and 11 bulb
onion non-SSRs, including 1 InDel, 9 CAPSs and 1 dCAPS), chromosome assignments
were determined in A. cepa and/or A. fistulosum, via the use of several kinds of Allium
alien addition lines. Sixteen of the 17 linkage groups were connected to the eight basic
chromosomes of A. cepa. It was therefore concluded that a very high level of
macrosynteny exists between these two species. In addition, it was shown that some
parts of the linkage group Chr. 6C of the bulb onion map (Martin et al. 2005)
corresponded to chromosome 2 by using a complete set of shallot monosomic addition
lines (Fig. 3-3a and b). This information will be useful for comparisons between the
genomes of bunching onion and bulb onion using linkage maps.
The remaining linkage group, temporarily named ‘LG X’, could not be assigned to any
chromosome. All the 14 markers located on LG X were applied to both the complete set
of shallot addition lines and the incomplete set of bunching onion deletion lines. However,
five of the markers were monomorphic in bunching onion and shallot. Although three
others showed the presence/absence (in bunching onion/shallot) of polymorphisms, all
the bunching onion-specific bands were detected in all the single-alien deletions used
(CCF-1F, CCF-4F, CCF-6F, CCF-7F and CCF-8F). The remaining six markers showed
poor amplifiability in shallot or inconsistent polymorphisms probably caused by some
residual heterozygosity in the shallot and/or bunching onion lines used for developing

53
the monosomic addition lines and deletion lines. There are two possible explanations for
this: 1) the incompleteness of the set of allotriploid-bunching onion single-alien deletion
lines suggests that LG X might belong to any of the 2F, 3F or 5F chromosomes; and 2)
all the markers located on LG X were bunching onion-derived SSR markers, which might
have resulted in the exclusive amplification of bunching onion genome regions. In
another bunching onion F2 population, some markers located on bunching onion LG X
were loosely linked to ACE010 (ACM133 in Martin et al. 2005, assigned to A. cepa Chr.
5; unpublished data). The relevant chromosome of LG X could be identified by mapping
new bulb onion-derived markers and/or by integrating different bunching onion linkage
maps with common markers.
Compared with bulb onion, bunching onion is more suitable for genetic studies
because it is an annual crop and has a 28% smaller genome (Ricroth et al. 2005).
Genome synteny is, as mentioned above, highly conserved between bunching onion
and bulb onion. However, it has been reported that a minimum of two heteromorphic
bivalents are observed in meiotic analysis of interspecific hybrids between bunching
onion and bulb onion (Peffley 1986), suggesting that chromosomal mutations such as
translocation and inversion might have occurred during the speciation between A.
fistulosum and A. cepa. For detailed studies of such chromosomal mutations,
microsynteny should be evaluated at the genome-wide level by plotting additional
common markers onto the maps of both species.
6-2 Breeding scheme for conferring genetic traceability using SSR markers

54
Bunching onion is a typical allogamous crop that is protandrous, resulting in a high
rate of outcrossing (Ford-Lloyd and Armstrong 1993). Bunching onion cultivars are
considered to have high levels of heterozygosity and heterogeneity. In this study, a high
degree of heterozygosity was also found, even in the commercial F1 cultivars (Fig. 4-1
and Table 4-4). OP and landrace cultivars, as well as F1 cultivars, showed very high Pl
values (Table 4-4). It was, therefore, concluded that most of the parental lines of existing
F1 cultivars of the bunching onion were not genetically uniform.
In F1 seed production of bulb onion, parental lines are usually maintained by
open-pollination of lines selfed only two or three times to avoid inbreeding depression
(Jakše et al. 2005). The same procedure could be applied to bunching onion breeding.
In addition, some F1 hybrid seeds may be produced by a three-way cross or double
cross in order to decrease the cost of seed production. The present results reveal how
well bunching onion breeders avoided inbreeding depression, and demonstrate that it is
impossible to determine an appropriate genotypic identity for any existing bunching
onion cultivar.
In general, the agronomic traits of F1 cultivars are more uniform than those of OP and
landrace cultivars. Results in this study confirm that the bunching onion F1 cultivars
tended to be more genetically uniform than the OP and landrace cultivars (Table 3-4).
However, since bunching onion breeding takes many years (usually 1–2 years per
generation) and bunching onion shows severe inbreeding depression, it is very difficult
to produce pure lines of bunching onion. Moreover, the F1 purity test, based on a
grow-out test or morphological comparison of bunching onion seedlings, is

55
time-consuming and requires a large area because of the extremely slow growth of the
plants.
I, therefore, proposed an "SSR-tagged breeding" scheme to enhance the rapidity,
ease and accuracy of cultivar identification and F1 purity testing in bunching onion (Fig.
3-2).
To demonstrate the feasibility of the SSR-tagged breeding scheme, a bunching onion
landrace as used as starting material as an example of an allogamous crop population.
Marker information is useful for the SSR-tagged breeding scheme. Two marker sets
were selected to evaluate the efficiency of the SSR-tagged breeding scheme, according
to different selection criteria (Table 5-2). The number of target markers was set to two
and four for Set A and Set B, respectively, and markers were chosen so that the
expected selection intensity with Set A was nearly equal to that of Set B. The selection
intensity was expected to be 0.51 for Set A and 0.53 for Set B. The present results
showed that both Sets were effective for SSR-tagged breeding. These results thus
demonstrate that two markers with a high PIC value and a not-too-low PrA% can be
sufficient for successful SSR tagging.
Field growth tests detected no significant differences in any traits tested among the
SSR-tagged populations and the control population (Table 5-4). In addition, the
SSR-tagged populations were genetically uniform at the selected loci whereas the other
loci still showed high degrees of heterogeneity (Table 5-5). Therefore, the feasibility of
the SSR-tagged breeding scheme was demonstrated using a bunching onion landrace.
This scheme could be a powerful tool for cultivar identification and for conferring

56
traceability, not only in bunching onion but also in other allogamous crops in which
inbreeding depression is as severe as in bunching onion.
In this study, genomic SSR markers were used for SSR-tagged breeding. Recently,
from an analysis of a large amount of ESTs of bulb onion cDNA libraries, hundreds of
EST-derived SSR markers were developed (Kuhl et al. 2004, Martin et al. 2005).
EST-derived SSRs may well be superior to genomic SSRs for developing DNA markers
linked to agronomic traits because they are tightly or directly linked to genes.
EST-derived SSR markers are, however, not suitable for the SSR-tagged breeding
scheme since they might directly influence agronomic traits and therefore have low
heterogeneity among cultivars.
The proposed SSR-tagged breeding scheme can be applied to any allogamous crop
in which inbreeding depression is as severe as in bunching onion. This could be useful
for protecting breeders’ rights and also for conferring cultivar traceability in such crops.

57
Acknowledgements
I am most grateful to my supervisor Prof. M. Mii (Faculty of Horticulture, Chiba
University) for his guidance, invaluable suggestions and advice in compiling this study.
I express my deep gratitude to Dr. A. Kojima (National Institute of Vegetable and Tea
Science, NIVTS; National Agriculture and Food Research Organization, NARO) for his
able guidance, invaluable suggestions, advice, encouragement and insightful criticisms
throughout this study.
I wish to give special thanks to Drs. T. Wako, T. Ohara, K. Yamashita, H. Fukuoka, T.
Nunome (NIVTS, NARO) and Y. S. Song (NIVTS, NARO; present address Mokpo
Experiment Station, Honam Agricultural Experiment Station, RDA, Korea) for their able
guidance, invaluable suggestions and advice throughout this study.
I wish to express my gratitude to Drs. H. Kanamori, I. Kono (Institute of the Society for
Techno-innovation of Agriculture, Forestry and Fisheries; STAFF) and J. Yonemaru
(National Agricultural Research Center for Tohoku Region, NARCT; NARO; present
address QTL Genomics Research Center, National Institute of Agrobiological Sciences,
NIAS) for their invaluable support for DNA sequencing, detecting DNA polymorphisms
and developing intron-spanning EST markers for bunching onion.
I would like to give special thanks to Assistant Prof. M. Shigyo, Drs. S. Masuzaki and
S. Yaguchi (Faculty of Agriculture, Yamaguchi University) for the gift of both sets of
shallot chromosome addition lines and single-alien deletions.
I am grateful to Mss. K. Tanaka, K. Wakita, M. Ikeyama, T. Kihira, H. Tanoda and S.
Negoro and Messrs. T. Sasaki, M. Takahashi and K. Shomura for technical assistance

58
throughout this study. I am also grateful to Messrs. F. Hori, H. Maruyama and S. Masuji
for management of the field sites.
This work was supported by grants from the Ministry of Agriculture, Forestry and
Fisheries of Japan (Green Technology Project, DM–1604; Integrated Research Program
for Functionality and Safety of Food Toward an Establishment of Healthy Diet, I–206;
Development of Evaluation and Management Methods for Supply of Safe , Reliable and
Functional Food and Farm Produce, II–207; and Research Project for Utilizing Advanced
Technology, 1655) and a Grant-in-Aid for Young Scientists (B) (19780010) from the
Japan Society for the Promotion of Science.

59
References
Anderson JA, Churchill GA, Autrique JE, Tanksley SD, Sorrells ME (1993) Optimizing
parental selection for genetic linkage maps. Genome 36:181-186.
Ballester J and de Vicente MC (1998) Determination of F1 hybrid seed purity in pepper
using PCR-based markers. Euphytica 103: 223-226.
Bellamy A, Vedel F, Bannerot H (1996) Varietal identification in Cichorium intybus L. and
determination of genetic purity of F1 hybrid seed samples, based on RAPD
markers. Plant Breed. 115: 128-132.
Bradeen JM, Havey MJ (1995) Randomly amplified polymorphic DNA in bulb onion and
its use to assess inbred integrity. J. Am. Soc. Hort. Sci. 120: 752-758.
Bredemeijer GMM, Arens P, Wouters D, Visser D, Vosman B (1998) The use of
semi-automated fluorescent microsatellite analysis for tomato cultivar
identification. Theor. Appl. Genet. 97: 584-590.
Crockett PA, Bhalla PL, Lee CK, Singh MB (2000) RAPD analysis of seed purity in a
commercial hybrid cabbage (Brassica oleracea var. capitata) cultivar. Genome
43: 317-321.
Crockett, PA. Singh MB, Lee CK, Bhalla PL (2002) Genetic purity analysis of hybrid
broccoli (Brassica oleracea var. italica) seeds using RAPD PCR. Aust. J. Agric.
Res. 53: 51-54.
Fischer D, Bachmann K (2000) Onion microsatellites for germplasm analysis and their
use in assessing intra- and interspecific relatedness within the subgenus
Rhizirideum. Theor. Appl. Genet. 101: 153-164.

60
Ford-Lloyd BV, Armstrong SJ (1993) Welsh onion Allium fistulosum L. “Genetic
Improvement of Vegetable Crops” Kalloo G, Bergh BO, Pergamon Press: 51-58.
Friesen N, Pollner S, Bachmann K, Blattner FR (1999) RAPDs and non-coding
chloroplast DNA reveal a single origin of the cultivated Allium fistulosum from A.
altaicum (Alliaceae). Am. J. of Bot. 86: 554-562.
Fritsch RM, Friesen N (2002) Evolution, domestication and taxonomy. “Allium crop
science: Recent advances” Rabinowitch HD, Currah L, CABI Publishing: 5-30.
Fukuoka H, Nunome T, Minamiyama Y, Kono I, Namiki N, Kojima A (2005)
Read2Marker: a data processing tool for microsatellite marker development from
a large data set. BioTechniques 39: 472-476.
Gökçe AF, McCallum J, Sato Y, Havey MJ (2002) Molecular tagging of the Ms locus in
onion. J. Am. Soc. Hort. Sci. 127: 576-582.
Haishima M, Kato J, Ikehashi H (1993) Isozyme polymorphism in native cultivars of
Japanese bunching onion (Allium fistulosum L.). Japan J. Breed. 43: 537-547.
Hang TTM, Shigyo M, Yamauchi N, Tashiro Y (2004) Production and characterization of
alien chromosome additions in shallot (Allium cepa L. Aggregatum group)
carrying extra chromosome(s) of Japanese bunching onion (A. fistulosum L.).
Genes Genet. Syst. 79: 263-269.
Hashizume T, Sato T, Hirai M (1993) Determination of genetic purity of hybrid seed in
watermelon (Citrullus lanatus) and tomato (Lycopersicon esculentum) using
randon amplified polymorphic DNA (RAPD). Japan J. Breed. 43: 367-375.
Ipek M, Ipek A, Almquist SG, Simon PW (2005) Demonstration of linkage and

61
development of the first low-density genetic map of garlic, based on AFLP
markers. Theor. Appl. Genet. 110: 228-236.
Jakše J, Martin W, McCallum J, Havey M (2005) Single nucleotide polymorphisms,
indels, and simple sequence repeats for onion cultivar identification. J. Am. Hort.
Sci. 130: 912-917.
Jones CJ, Edwards KJ, Castaglione S, Winfield MO, Sala F, van de Wiel C, Bredemeijer
G, Vosman B, Matthes M, Daly A, Brettschneider R, Bettini P, Buiatti M, Maestri E,
Malcevschi A, Marmiroli N, Aert R, Volckaert G, Rueda J, Linacero R, Vazquez A,
Karp A (1997) Reproducibility testing of RAPD, AFLP and SSR markers in plants
by a network of European laboratories. Mol. Breed. 3: 381-390.
King JJ, Bradeen JM, Bark O, McCallum JA, Havey MJ (1998) A low-density map of
onion reveals a role for tandem duplication in the evolution of an extremely large
diploid genome. Theor. Appl. Genet. 96: 52-62.
Kirk JTO, Rees H, Evans G (1970) Base composition of nuclear DNA within the genus
Allium. Heredity 25: 507-512.
Klaas M, Friesen N (2002) VIII. Molecular markers in Allium. “Allium crop science:
Recent advances”. Rabinowitch HD and Currah L. CABI international,
Wallingford, Oxon: 159-185.
Kosambi D (1944) The estimation of map distance from recombination values. Ann.
Eugen. 12: 172-175.
Kuhl JC, Cheung F, Yuan Q, Martin W, Zewdie Y, MaCallum J, Catanach A, Rutherford P,
Sink KC, Jenderk M, Prince JP, Town CD, Havey MJ (2004) A unique set of

62
11,008 onion expressed sequence tags reveals expressed sequence and
genomic differences between the monocot orders Asparagales and Poales. Plant
Cell 16: 114-125.
Kumazawa S, Katsumata H (1965) Negi (Japanese Japanese bunching onion).
“Sosai-engei kakuron (Vegetable crops)” Kumazawa S, Yokendo press (In
Japanese): 280-289.
Kunihisa M, Fukino N, Matsumoto S. (2003) Development of cleavage amplified
polymorphic sequence (CAPS) markers for identification of strawberry cultivars.
Euphytica 134: 209-215.
Lagercrantz U, Ellegren H, Andersson L (1993) The aboundance of various polymorphic
microsatellite motifs differs between plants and vertebrates. Nucleic Acid Res. 21:
1111-1115.
Lander E, Green P, Abrahamson J, Barlow A, Daly M, Lincoln S, Newburg L (1987)
MAPMAKER: an interactive computer package for constructing primary genetic
linkage maps of experimental and natural populations. Genomics 1: 174–181.
Livneh O, Nagler Y, Tal Y, Harush SB, Gafni Y, Beckmann JS, Sela I (1990) RFLP
analysis of a hybrid cultivar of pepper (Capsicum annuum) and its use in
distinguishing between parental lines and in hybrid identification. Seed Sci. and
Tech. 18: 209-214.
MAFF (2005) Shuyou Nousanbutsu no Sanshutsugaku to Kouseihi (The production of
vegetables in Japan). “Seisan Nougyo Shotoku Toukei”. MAFF (In Japanese).
http://www.tdb.maff.go.jp/toukei/a02stoukeiexl?Fname=E015-16-194.xls&PAGE=

63
3&TokID=E015&TokKbn=B&TokID1=E015B2004-002&TokID2=E015B2004-002-
004&TokID3=E015B2004-002-004-002. Cited 20 Dec 2006
Martin WJ, McCallum J, Shigyo M, Jakše J, Kuhl JC, Yamane N, Pither-Joyce M, Gokce
AF, Sink KC, Town CD, Havey MJ (2005) Genetic mapping of expressed
sequences in onion and in silico comparisons with rice show scant colinearity.
Mol. Gen. Genomics 274: 197-204.
Masuzaki S, Araki N, Yamane N, Yamauchi N, Wako T, Kojima A, Shigyo M (2006)
Chromosomal locations of microsatellites in onion. Hort Sci. 41: 315-318.
McCallum J, Leite D. Pither-Joyce M, Havey MJ (2001) Expressed sequence markers
for genetic analysis of bulb onion (Allium cepa L.). Theor. Appl. Genet. 103:
979-991.
McDonald MB (1998) Seed quality assessment. Seed Sci. Res. 8: 265-275.
Meesang N, Ranamukhaarachchi SL, Petersen MJ, Andersen SB (2001) Soybean
cultivar identification and genetic purity analysis using microsatellite DNA
markers. Seed Sci. and Tech. 29: 637-645.
Neff MM, Turk E, Kalishman M (2002) Web-based primer design for single nucleotide
polymorphism analysis. Trends in Genetics 18: 613-615.
Nei M. (1973) Analysis of gene diversity in subdivided populations. Proc. Natl. Acad. Sci.
USA 70: 3321-3323.
Nunome T, Negoro S, Miyatake K, Yamaguchi H, Fukuoka H (2006) A protocol for the
construction of microsatellite enriched genomic library. Plant Mol. Biol. Rep. 24:
305-312.

64
Ohara T, Song YS, Tsukazaki H, Wako T, Nunome T, Kojima A (2005) Genetic mapping
of AFLP markers in Japanese bunching onion (Allium fistulosum). Euphytica 144:
255-263.
Ohtsubo K, Nakamura S, Kumo S, Kawakami H, Miyamura T (2005) Development of the
primer sets for identification of rice cultivars by PCR on DNA polymorphisms.
Nippon Shokuhin Kagaku Kogaku Kaishi. 52: 102-106 (in Japanese with English
summary).
Peffley EB (1986) Evidence for chromosomal differentiation of Allium fistulosum and A.
cepa. J. Am. Soc. Hort. Sci. 111: 126-129.
Rajora OP, Rahman MH (2003) Microsatellite DNA and RAPD fingerprinting,
identification and genetic relationships of hybrid poplar (Populus × canadensis)
cultivars. Theor. Appl. Genet. 106: 470-477.
Ricroch A, Yockteng R, Brown SC, Nadot S (2005) Evolution of genome size across
some cultivated Allium species. Genome 48: 511-520.
Rouamba A, Sandmeier M, Sarr A, Ricroch A (2001) Allozyme variation within and
among populations of onion (Allium cepa L.) from West Africa. Theor. Appli.
Genet. 103: 855-861.
Rozen S, Skaletsky HJ (2000) Primer 3 on the WWW for general users and for biologist
programmers. “Bioinformatics methods and protocols: Methods in molecular
biology.” Krawetz S, Misener S, Humana Press, Totowa, NJ: 365-386.
Shigyo M, Tashiro Y, Issiki S, Miyazaki S (1996) Establishments of a series of alien
monosomic addition lines of Japanese bunching onion (Allium fistulosum L.) with

65
extra chromosomes from shallot (A. cepa L. Aggregatum group). Genes Genet.
Syst. 71: 363-371.
Song YS, Suwabe K, Wako T, Ohara T, Nunome T, Kojima A (2004) Development of
microsatellite markers in Japanese bunching onion (Allium fistulosum L.). Breed.
Sci. 54: 361-365.
Stack SM, Coming DE (1979) The chromosomes and DNA of Allium cepa. Chromosoma
70:161-181
Tanksley SD, Jones RA (1981) Application of alcohol dehydrogenase allozymes in
testing the genetic purity of F1 hybrids of tomato. Hort Sci. 16:179-181.
van Heusden AW, van Ooijen JW, Vrielink-van Ginkel R, Verbeek WHK, Wietsma WA,
Kik C (2000) A genetic map of an interspecific cross Allium based on amplified
fragment length polymorphism (AFLP) markers. Theor. Appl. Genet. 100:
118-126.
Wako T, Ohara T, Song YS, Kojima A (2002a) Development of SSR markers in bunching
onion. Breed Sci. 4 (suppl. 1): 83 (in Japanese).
Wako T, Shigyo M, Tashiro Y, Kataoka S, Ohara T, Kojima A (2002b) Development of
chromosome-specific CAPS markers in shallot. J. Japan Soc. Hort. Sci. 71 (suppl.
1): 348 (in Japanese).
Wilkie SE, Isaac PG, Slater RJ (1993) Random amplified polymorphic DNA (RAPD)
markers for genetic analysis in Allium. Theor. Appl. Genet. 86: 497-504.
Yaguchi S, Hang TTM, Tsukazaki H, Hoa VQ, Masuzaki S, Wako T, Masamura N,
Shiomi N, Onodera S, Yamauchi N, Shigyo, M (2009) Molecular and biochemical

66
identification of alien chromosome additions in shallot (Allium cepa L.
Aggregatum group) carrying extra chromosome(s) of bunching onion (A.
fistulosum L.). Genes Genet. Syst. 84: 43-55.
Yoo KS, Pike LM, Hamilton BK (1995) A simplified pyruvic acid analysis suitable for
onion breeding programs. Hort Sci. 30: 1306.

67
Figures
Fig. 2-1 DNA polymorphisms among inbred lines of bunching onion.
PCR fragments were separated by 3% agarose gel (left) or DNA sequencer (right).
D1s-15s-10s-8 (D)
J1s-14s-23s-9 (J)
F1s-7s-17s-3s-1 (F)
D x J
259bp
257bp
257+259bp
251bp
D1s-15s-10s-8 (D)
J1s-14s-23s-9 (J)
F1s-7s-17s-3s-1 (F)
D x J
259bp
257bp
257+259bp
251bp
AFAT13H10
AFA16E11
AFAT04F03

68
(b)
(a) M D J F1F2 population
500bp
1000bp
(a) M D J F1F2 population
500bp
1000bp
(d)M D J F1
F2 population
500bp
1000bp
(d)M D J F1
F2 population
500bp
1000bp
M D J F1F2 population
500bp
1000bp
100bp
F2 populationM D J F1(c)
100bp
F2 populationM D J F1(c)
100bp
(e)M D J F1
F2 population
200bp
100bp
(e)M D J F1
F2 population
200bp
intronintron

69
Fig. 3-1 DNA polymorphisms of bulb onion EST-derived markers within F2 individuals
of bunching onion.
M, 100bp ladder; D, D1s-15s-10s; J, J1s-14s-23s.
(a): A large InDel marker ACAAJ79.
(b): DNA sequence alignment of a part of the ACAAJ79 locus; PCR products from the
bunching onion parental lines, D1s-15s-10s (ACAAJ79_D) and J1s-14s-23s
(ACAAJ-79_J), and the bulb onion EST sequence (CF434863) which was submitted to
GenBank for bulb onion cDNA clone of ACAAJ79. A large deletion (243bp) was detected
in a putative intron region in the parental line ‘J’.
(c): InDel (8bp) marker TC0678.
(d): CAPS marker ACACU34. PCR products were digested with SspI.
(e): dCAPS marker CF439394. PCR products were digested with TaqI.

70
AFAT05H05 [4F]0.0ACE08715.6AFA07A10 [4F]20.8AFA01E06 [4F]29.1AFA15G07 [4F]33.2AFRA07E10 [4F]40.3AFB01C03 [4F]45.0AFB03E0946.3AFA11C12 [4F]49.5ACM00552.7AFAT02H0558.6ACACG8366.0AFB03B09 [4F]70.4AFS149 [4C][4F]76.2AFA01F03 [4F]87.6AFAT00A06 [4F]99.0AFAT05D09105.4ACACU34 [4C]113.0AFC09D10130.7AFS156 [4F]146.1
4a
AFAA05B02 [4F]AFA11H10 [4F]AFRA04D09 [4F]AFAT04E09 [4F]AFAT09E05 [4F]AFS117 [4F]ACE039 [4C]AFB02C01 [4F]AFB277 [4F]AFA15D09 [4F]
0.016.226.432.936.946.961.674.976.991.4
4b
ACE044 [3C]0.0AFA01H1214.2AFA08E1018.7AFA08G0219.9AFAT04G0621.1TC2026_dCAPS25.8TC256630.9AFC03F1035.6AFD02A1242.2AFAA04D0644.6AFB17G0249.3AFS10452.5
59.2AFA11B0561.3AFA02A0562.2AFA14E0664.3AFA07F0668.9AFAT04D1271.6AFA23B0372.4AFAT11A0374.6AFB04A0978.1AFA05B0287.9AFHT11F10110.4AFB05H09121.8AFA09F08137.0AFA18G01144.9AFAT13F12154.6
3a
ACC043 [3C]
AFAT10E060.0AFB04B1224.5AFA03D0347.2AFS04258.5AFS00661.2AFS145 [3C]67.7AFA16C0669.0ACAAJ79_InDel [3C]73.4AFA23D0984.0AFA04G0898.7
111.3AFC03G02116.9AFB01G10119.1AFRA12E05120.5AFA08E07124.5AFA04G02128.2AFA01D09132.4AFA06A10144.2AFA01D10162.8
3b
ACC013 [3C]
AFA10B06 [1F]0.0ACC015 [1C]13.8
AFA05G04 [1F]31.7
1c
ACC0180.0AFA01G1228.5AFRA01G0739.7
46.8AFA05G0256.2AFRA04F03 [1F]60.4ACC00663.8AFA09A0666.6ACM154 [1C]68.9AFS10577.0AFA06H0786.1AFAA02D08 [1C][1F]90.2AFA03F08 [1F]93.6ACE08097.1AFRA01B05101.6AFA23C12108.5AFA07E01 [1F]116.0AFB06C08 [1F]120.7AFB04B08125.1
133.3AFB01B03161.2
AFRA04F12192.5AFAA00A02207.3AFA08G10 [1F]221.3
1aAFS015 [1C][1F]
AFS142 [1F]
AFA06H12 [1F]0.0AFA04H02 [1F]17.8AFRA03E08 [1F]22.7AFHT11E0726.0AFA05H01 [1F]26.9AFA01C0736.6AFA09F01 [1F]39.4AFS12343.3
53.5AFA06 [1F]67.3AFB08 [1F]72.9AFA14A02 [1F]77.4AFB22184.5ACC033 [1C]90.8AFB06E05 [1F]99.9AFA10G11121.5
1b
AFS099 [1F]
ACE0200.0
AFA05D0228.0AFB09D0638.8AMS14 [2C]52.7AFA03B0768.9AFAA02H0480.0AFB05H0392.1AFB01A0295.3AFC12109.5ACE111 [2C]121.0AFA18C03122.6AFA07C08125.6AFRA00B10133.3AFAT00B05140.1ACADR60 [2C]147.7AFA01E09151.3AFAT04B03154.4TC0678_InDel160.6
164.7AFB04C03169.1AFRA11H08174.2AFAT05F03176.4ACM024 [2C]180.4AFA03E07192.2AFA10H07201.0AFAT06D06209.3TC3133210.0AFA01A04216.1AOB272 [2C]223.2AFAA01D09235.2TC1891242.5ACABO23245.3TC1952_InDel277.5AFRA11F11304.7
2a
AFS012
2b0.0
ACC008 [2C]12.5ACE101 [2C]16.8AFAT00C0721.5AFAA05B0523.1AFC08G0526.2AFA03B0330.6AFA23D1238.0AFB13G1052.1
AFS111
AFAT05H05 [4F]0.0ACE08715.6AFA07A10 [4F]20.8AFA01E06 [4F]29.1AFA15G07 [4F]33.2AFRA07E10 [4F]40.3AFB01C03 [4F]45.0AFB03E0946.3AFA11C12 [4F]49.5ACM00552.7AFAT02H0558.6ACACG8366.0AFB03B09 [4F]70.4AFS149 [4C][4F]76.2AFA01F03 [4F]87.6AFAT00A06 [4F]99.0AFAT05D09105.4ACACU34 [4C]113.0AFC09D10130.7AFS156 [4F]146.1
4a
AFAA05B02 [4F]AFA11H10 [4F]AFRA04D09 [4F]AFAT04E09 [4F]AFAT09E05 [4F]AFS117 [4F]ACE039 [4C]AFB02C01 [4F]AFB277 [4F]AFA15D09 [4F]
0.016.226.432.936.946.961.674.976.991.4
4b
AFAT05H05 [4F]0.0ACE08715.6AFA07A10 [4F]20.8AFA01E06 [4F]29.1AFA15G07 [4F]33.2AFRA07E10 [4F]40.3AFB01C03 [4F]45.0AFB03E0946.3AFA11C12 [4F]49.5ACM00552.7AFAT02H0558.6ACACG8366.0AFB03B09 [4F]70.4AFS149 [4C][4F]76.2AFA01F03 [4F]87.6AFAT00A06 [4F]99.0AFAT05D09105.4ACACU34 [4C]113.0AFC09D10130.7AFS156 [4F]146.1
4aAFAT05H05 [4F]0.0ACE08715.6AFA07A10 [4F]20.8AFA01E06 [4F]29.1AFA15G07 [4F]33.2AFRA07E10 [4F]40.3AFB01C03 [4F]45.0AFB03E0946.3AFA11C12 [4F]49.5ACM00552.7AFAT02H0558.6ACACG8366.0AFB03B09 [4F]70.4AFS149 [4C][4F]76.2AFA01F03 [4F]87.6AFAT00A06 [4F]99.0AFAT05D09105.4ACACU34 [4C]113.0AFC09D10130.7AFS156 [4F]146.1
4a
AFAA05B02 [4F]AFA11H10 [4F]AFRA04D09 [4F]AFAT04E09 [4F]AFAT09E05 [4F]AFS117 [4F]ACE039 [4C]AFB02C01 [4F]AFB277 [4F]AFA15D09 [4F]
0.016.226.432.936.946.961.674.976.991.4
4bAFAA05B02 [4F]AFA11H10 [4F]AFRA04D09 [4F]AFAT04E09 [4F]AFAT09E05 [4F]AFS117 [4F]ACE039 [4C]AFB02C01 [4F]AFB277 [4F]AFA15D09 [4F]
0.016.226.432.936.946.961.674.976.991.4
4b
ACE044 [3C]0.0AFA01H1214.2AFA08E1018.7AFA08G0219.9AFAT04G0621.1TC2026_dCAPS25.8TC256630.9AFC03F1035.6AFD02A1242.2AFAA04D0644.6AFB17G0249.3AFS10452.5
59.2AFA11B0561.3AFA02A0562.2AFA14E0664.3AFA07F0668.9AFAT04D1271.6AFA23B0372.4AFAT11A0374.6AFB04A0978.1AFA05B0287.9AFHT11F10110.4AFB05H09121.8AFA09F08137.0AFA18G01144.9AFAT13F12154.6
3a
ACC043 [3C]
AFAT10E060.0AFB04B1224.5AFA03D0347.2AFS04258.5AFS00661.2AFS145 [3C]67.7AFA16C0669.0ACAAJ79_InDel [3C]73.4AFA23D0984.0AFA04G0898.7
111.3AFC03G02116.9AFB01G10119.1AFRA12E05120.5AFA08E07124.5AFA04G02128.2AFA01D09132.4AFA06A10144.2AFA01D10162.8
3b
ACC013 [3C]
ACE044 [3C]0.0AFA01H1214.2AFA08E1018.7AFA08G0219.9AFAT04G0621.1TC2026_dCAPS25.8TC256630.9AFC03F1035.6AFD02A1242.2AFAA04D0644.6AFB17G0249.3AFS10452.5
59.2AFA11B0561.3AFA02A0562.2AFA14E0664.3AFA07F0668.9AFAT04D1271.6AFA23B0372.4AFAT11A0374.6AFB04A0978.1AFA05B0287.9AFHT11F10110.4AFB05H09121.8AFA09F08137.0AFA18G01144.9AFAT13F12154.6
3a
ACC043 [3C]
AFAT10E060.0AFB04B1224.5AFA03D0347.2AFS04258.5AFS00661.2AFS145 [3C]67.7AFA16C0669.0ACAAJ79_InDel [3C]73.4AFA23D0984.0AFA04G0898.7
111.3AFC03G02116.9AFB01G10119.1AFRA12E05120.5AFA08E07124.5AFA04G02128.2AFA01D09132.4AFA06A10144.2AFA01D10162.8
3b
ACC013 [3C]
AFAT10E060.0AFB04B1224.5AFA03D0347.2AFS04258.5AFS00661.2AFS145 [3C]67.7AFA16C0669.0ACAAJ79_InDel [3C]73.4AFA23D0984.0AFA04G0898.7
111.3AFC03G02116.9AFB01G10119.1AFRA12E05120.5AFA08E07124.5AFA04G02128.2AFA01D09132.4AFA06A10144.2AFA01D10162.8
3b
ACC013 [3C]
AFA10B06 [1F]0.0ACC015 [1C]13.8
AFA05G04 [1F]31.7
1c
ACC0180.0AFA01G1228.5AFRA01G0739.7
46.8AFA05G0256.2AFRA04F03 [1F]60.4ACC00663.8AFA09A0666.6ACM154 [1C]68.9AFS10577.0AFA06H0786.1AFAA02D08 [1C][1F]90.2AFA03F08 [1F]93.6ACE08097.1AFRA01B05101.6AFA23C12108.5AFA07E01 [1F]116.0AFB06C08 [1F]120.7AFB04B08125.1
133.3AFB01B03161.2
AFRA04F12192.5AFAA00A02207.3AFA08G10 [1F]221.3
1aAFS015 [1C][1F]
AFS142 [1F]
AFA06H12 [1F]0.0AFA04H02 [1F]17.8AFRA03E08 [1F]22.7AFHT11E0726.0AFA05H01 [1F]26.9AFA01C0736.6AFA09F01 [1F]39.4AFS12343.3
53.5AFA06 [1F]67.3AFB08 [1F]72.9AFA14A02 [1F]77.4AFB22184.5ACC033 [1C]90.8AFB06E05 [1F]99.9AFA10G11121.5
1b
AFS099 [1F]
AFA10B06 [1F]0.0ACC015 [1C]13.8
AFA05G04 [1F]31.7
1cAFA10B06 [1F]0.0ACC015 [1C]13.8
AFA05G04 [1F]31.7
1c
ACC0180.0AFA01G1228.5AFRA01G0739.7
46.8AFA05G0256.2AFRA04F03 [1F]60.4ACC00663.8AFA09A0666.6ACM154 [1C]68.9AFS10577.0AFA06H0786.1AFAA02D08 [1C][1F]90.2AFA03F08 [1F]93.6ACE08097.1AFRA01B05101.6AFA23C12108.5AFA07E01 [1F]116.0AFB06C08 [1F]120.7AFB04B08125.1
133.3AFB01B03161.2
AFRA04F12192.5AFAA00A02207.3AFA08G10 [1F]221.3
1aAFS015 [1C][1F]
AFS142 [1F]
AFA06H12 [1F]0.0AFA04H02 [1F]17.8AFRA03E08 [1F]22.7AFHT11E0726.0AFA05H01 [1F]26.9AFA01C0736.6AFA09F01 [1F]39.4AFS12343.3
53.5AFA06 [1F]67.3AFB08 [1F]72.9AFA14A02 [1F]77.4AFB22184.5ACC033 [1C]90.8AFB06E05 [1F]99.9AFA10G11121.5
1b
AFS099 [1F]
AFA06H12 [1F]0.0AFA04H02 [1F]17.8AFRA03E08 [1F]22.7AFHT11E0726.0AFA05H01 [1F]26.9AFA01C0736.6AFA09F01 [1F]39.4AFS12343.3
53.5AFA06 [1F]67.3AFB08 [1F]72.9AFA14A02 [1F]77.4AFB22184.5ACC033 [1C]90.8AFB06E05 [1F]99.9AFA10G11121.5
1b
AFS099 [1F]
ACE0200.0
AFA05D0228.0AFB09D0638.8AMS14 [2C]52.7AFA03B0768.9AFAA02H0480.0AFB05H0392.1AFB01A0295.3AFC12109.5ACE111 [2C]121.0AFA18C03122.6AFA07C08125.6AFRA00B10133.3AFAT00B05140.1ACADR60 [2C]147.7AFA01E09151.3AFAT04B03154.4TC0678_InDel160.6
164.7AFB04C03169.1AFRA11H08174.2AFAT05F03176.4ACM024 [2C]180.4AFA03E07192.2AFA10H07201.0AFAT06D06209.3TC3133210.0AFA01A04216.1AOB272 [2C]223.2AFAA01D09235.2TC1891242.5ACABO23245.3TC1952_InDel277.5AFRA11F11304.7
2a
AFS012
2b0.0
ACC008 [2C]12.5ACE101 [2C]16.8AFAT00C0721.5AFAA05B0523.1AFC08G0526.2AFA03B0330.6AFA23D1238.0AFB13G1052.1
AFS1112b
0.0ACC008 [2C]12.5ACE101 [2C]16.8AFAT00C0721.5AFAA05B0523.1AFC08G0526.2AFA03B0330.6AFA23D1238.0AFB13G1052.1
AFS1110.0ACC008 [2C]12.5ACE101 [2C]16.8AFAT00C0721.5AFAA05B0523.1AFC08G0526.2AFA03B0330.6AFA23D1238.0AFB13G1052.1
AFS111
AFA14C07 [6F]0.0AFB05D11 [6F]27.3AFA09E1249.6ACM096 [6F]54.4AFRT08C02 [6F]61.1AFB22H06 [6F]68.1AFRT01G11 [6F]72.6ACAAX07_InDel75.9TC1010 [6C]76.9AFA02H08 [6F]82.3AFA03H0389.3AFA03D07 [6F]99.1ACE088103.7AFB20G05114.1AFS039 [6C][6F]122.7
6a
AFA02E09 [6F]0.0AFAT01B0112.7AFB14B08 [6F]24.2AFRA04B10 [6F]33.1
6b
AFAT03G10 [6F]0.0
AFC12A06[6F]20.8
6c
ACM071 [5C]0.0AFA01H099.6ACE010 [5C]17.7ACE12727.9AFA01F1235.2AFA14G0349.5AFA07D0162.7
5
20cM
AFA02D050.0AFA10C0711.5AFA0221.5AFA01A0822.8AFA09A1135.5AFA07A0842.4AFA09C0844.6AFA10A0846.6AFRA03F0362.8AFA07G1069.5
70.775.8
AFA03C0683.4AFB02C1095.1
X
AFS131AFS109
AFB25H010.0
AFAA03F01 [7F]20.0AFB04H04 [7F]34.5
AFB02G0452.1AFA07H05 [7F]64.0AFRT01F02 [7F]73.0AFB237 [7F]79.7AFA16D05 [7F]91.4
AFC01E09110.6
7a
CF439394_dCAPS0.0
AFA06A08 [7F]30.7TC316441.6AFAT03F07 [7F]47.8AFAT04C0855.0AFAT02E05 [7F]58.0AFS05861.3AFA10E04 [7F]68.8ACE113 [7F]71.8AFS221 [7F]74.4
77.7AFB15A0389.4AFA15E08 [7F]109.3
7b
AFS140
AFA02F09 [8F]0.0AFB23G0223.5AFA15D06 [8F]33.6AFA08A09 [8F]35.9AFS09639.0AFA18C1142.3
47.8AFS10152.4AFA07G06 [8F]58.9AFAT06D0965.9AFB05E0670.6AFC03A09 [8F]75.3AFS054 [8F]79.9ACAEK46_dCAPS [8C]85.1AFS088 [8F]92.8
109.3ACAER72_dCAPS123.0AFA06G01135.5AFAA05H04140.7AFA11E12 [8F]150.0AFAT10C04162.5AFAT05A03187.7AFAT05E04 [8F]202.1AFAT05G01 [8F]204.2AFRT01H05206.3AFAT01F03 [8F]212.3AFA17A05 [8F]216.5AFA10E05 [8F]228.0
8
AFS008 [8F]
AFS017
AFA14C07 [6F]0.0AFB05D11 [6F]27.3AFA09E1249.6ACM096 [6F]54.4AFRT08C02 [6F]61.1AFB22H06 [6F]68.1AFRT01G11 [6F]72.6ACAAX07_InDel75.9TC1010 [6C]76.9AFA02H08 [6F]82.3AFA03H0389.3AFA03D07 [6F]99.1ACE088103.7AFB20G05114.1AFS039 [6C][6F]122.7
6a
AFA02E09 [6F]0.0AFAT01B0112.7AFB14B08 [6F]24.2AFRA04B10 [6F]33.1
6b
AFAT03G10 [6F]0.0
AFC12A06[6F]20.8
6c
AFA14C07 [6F]0.0AFB05D11 [6F]27.3AFA09E1249.6ACM096 [6F]54.4AFRT08C02 [6F]61.1AFB22H06 [6F]68.1AFRT01G11 [6F]72.6ACAAX07_InDel75.9TC1010 [6C]76.9AFA02H08 [6F]82.3AFA03H0389.3AFA03D07 [6F]99.1ACE088103.7AFB20G05114.1AFS039 [6C][6F]122.7
6aAFA14C07 [6F]0.0AFB05D11 [6F]27.3AFA09E1249.6ACM096 [6F]54.4AFRT08C02 [6F]61.1AFB22H06 [6F]68.1AFRT01G11 [6F]72.6ACAAX07_InDel75.9TC1010 [6C]76.9AFA02H08 [6F]82.3AFA03H0389.3AFA03D07 [6F]99.1ACE088103.7AFB20G05114.1AFS039 [6C][6F]122.7
6a
AFA02E09 [6F]0.0AFAT01B0112.7AFB14B08 [6F]24.2AFRA04B10 [6F]33.1
6bAFA02E09 [6F]0.0AFAT01B0112.7AFB14B08 [6F]24.2AFRA04B10 [6F]33.1
6b
AFAT03G10 [6F]0.0
AFC12A06[6F]20.8
6cAFAT03G10 [6F]0.0
AFC12A06[6F]20.8
6c
ACM071 [5C]0.0AFA01H099.6ACE010 [5C]17.7ACE12727.9AFA01F1235.2AFA14G0349.5AFA07D0162.7
5ACM071 [5C]0.0AFA01H099.6ACE010 [5C]17.7ACE12727.9AFA01F1235.2AFA14G0349.5AFA07D0162.7
5
20cM20cM
AFA02D050.0AFA10C0711.5AFA0221.5AFA01A0822.8AFA09A1135.5AFA07A0842.4AFA09C0844.6AFA10A0846.6AFRA03F0362.8AFA07G1069.5
70.775.8
AFA03C0683.4AFB02C1095.1
X
AFS131AFS109
AFA02D050.0AFA10C0711.5AFA0221.5AFA01A0822.8AFA09A1135.5AFA07A0842.4AFA09C0844.6AFA10A0846.6AFRA03F0362.8AFA07G1069.5
70.775.8
AFA03C0683.4AFB02C1095.1
X
AFS131AFS109
AFB25H010.0
AFAA03F01 [7F]20.0AFB04H04 [7F]34.5
AFB02G0452.1AFA07H05 [7F]64.0AFRT01F02 [7F]73.0AFB237 [7F]79.7AFA16D05 [7F]91.4
AFC01E09110.6
7a
CF439394_dCAPS0.0
AFA06A08 [7F]30.7TC316441.6AFAT03F07 [7F]47.8AFAT04C0855.0AFAT02E05 [7F]58.0AFS05861.3AFA10E04 [7F]68.8ACE113 [7F]71.8AFS221 [7F]74.4
77.7AFB15A0389.4AFA15E08 [7F]109.3
7b
AFS140
AFB25H010.0
AFAA03F01 [7F]20.0AFB04H04 [7F]34.5
AFB02G0452.1AFA07H05 [7F]64.0AFRT01F02 [7F]73.0AFB237 [7F]79.7AFA16D05 [7F]91.4
AFC01E09110.6
7aAFB25H010.0
AFAA03F01 [7F]20.0AFB04H04 [7F]34.5
AFB02G0452.1AFA07H05 [7F]64.0AFRT01F02 [7F]73.0AFB237 [7F]79.7AFA16D05 [7F]91.4
AFC01E09110.6
7a
CF439394_dCAPS0.0
AFA06A08 [7F]30.7TC316441.6AFAT03F07 [7F]47.8AFAT04C0855.0AFAT02E05 [7F]58.0AFS05861.3AFA10E04 [7F]68.8ACE113 [7F]71.8AFS221 [7F]74.4
77.7AFB15A0389.4AFA15E08 [7F]109.3
7b
AFS140
CF439394_dCAPS0.0
AFA06A08 [7F]30.7TC316441.6AFAT03F07 [7F]47.8AFAT04C0855.0AFAT02E05 [7F]58.0AFS05861.3AFA10E04 [7F]68.8ACE113 [7F]71.8AFS221 [7F]74.4
77.7AFB15A0389.4AFA15E08 [7F]109.3
7b
AFS140
AFA02F09 [8F]0.0AFB23G0223.5AFA15D06 [8F]33.6AFA08A09 [8F]35.9AFS09639.0AFA18C1142.3
47.8AFS10152.4AFA07G06 [8F]58.9AFAT06D0965.9AFB05E0670.6AFC03A09 [8F]75.3AFS054 [8F]79.9ACAEK46_dCAPS [8C]85.1AFS088 [8F]92.8
109.3ACAER72_dCAPS123.0AFA06G01135.5AFAA05H04140.7AFA11E12 [8F]150.0AFAT10C04162.5AFAT05A03187.7AFAT05E04 [8F]202.1AFAT05G01 [8F]204.2AFRT01H05206.3AFAT01F03 [8F]212.3AFA17A05 [8F]216.5AFA10E05 [8F]228.0
8
AFS008 [8F]
AFS017

71
Fig. 3-2 Bunching onion chromosome map consisting of 17 linkage groups with 230
SSRs (213 bunching onion SSRs and 17 bulb onion SSRs) and 26 bulb onion-derived
non-SSR markers (4 InDels, 17 CAPSs and 4 dCAPSs) covering 2,069 cM.
The genetic markers used to assign linkage groups to their relevant chromosomes are
marked with [1C] to [8C] (assigned to A. cepa chromosomes) and [1F] to [8F] (to A.
fistulosum chromosomes). Markers located on a previously reported bunching onion
linkage map (Ohara et al. 2005) are indicated in italic with underlines.

72
Fig. 3-3 Direct identification of relevant A. cepa chromosomes for the bunching
onion-derived SSR marker AFS015 (a), the bulb onion EST-derived CAPS marker
ACC008 digested by HaeIII (b), and the bulb onion EST-derived CAPS marker
ACADR60 digested by TaqI (c) by using Shigyo et al’s complete set of bunching
onion-shallot monosomic addition lines.
Arrows show shallot-specific DNA fragments. These markers are located on 1C
(AFS015) and 2C (ACC008, ACADR60) chromosome, respectively.
(c)M FF CC 1C 2C 3C 4C 5C 6C 7C 8C
A. cepa monosomic addition lines (FF+nC)
M FF CC 1C 2C 3C 4C 5C 6C 7C 8CA. cepa monosomic addition lines (FF+nC)
500bp
300bp
(c)M FF CC 1C 2C 3C 4C 5C 6C 7C 8C
A. cepa monosomic addition lines (FF+nC)
M FF CC 1C 2C 3C 4C 5C 6C 7C 8CA. cepa monosomic addition lines (FF+nC)
500bp
300bp
M FF CC 1C 2C 3C 4C 5C 6C 7C 8CA. cepa monosomic addition lines (FF+nC)
M FF CC 1C 2C 3C 4C 5C 6C 7C 8CA. cepa monosomic addition lines (FF+nC)
500bp
300bp
(b)M CC FF 1C 2C 3C 4C 5C 6C 7C 8C
A. cepa monosomic addition lines (FF+nC)
M CC FF 1C 2C 3C 4C 5C 6C 7C 8CA. cepa monosomic addition lines (FF+nC)
500bp
300bp
(b)M CC FF 1C 2C 3C 4C 5C 6C 7C 8C
A. cepa monosomic addition lines (FF+nC)
M CC FF 1C 2C 3C 4C 5C 6C 7C 8CA. cepa monosomic addition lines (FF+nC)
500bp
300bp
(a)M 1C 2C 3C 4C 5C 6C 7C 8C CC FF
A. cepa monosomic addition lines (FF+nC)
M 1C 2C 3C 4C 5C 6C 7C 8C CC FFA. cepa monosomic addition lines (FF+nC)
300bp
200bp
500bp
(a)M 1C 2C 3C 4C 5C 6C 7C 8C CC FF
A. cepa monosomic addition lines (FF+nC)
M 1C 2C 3C 4C 5C 6C 7C 8C CC FFA. cepa monosomic addition lines (FF+nC)
300bp
200bp
500bp
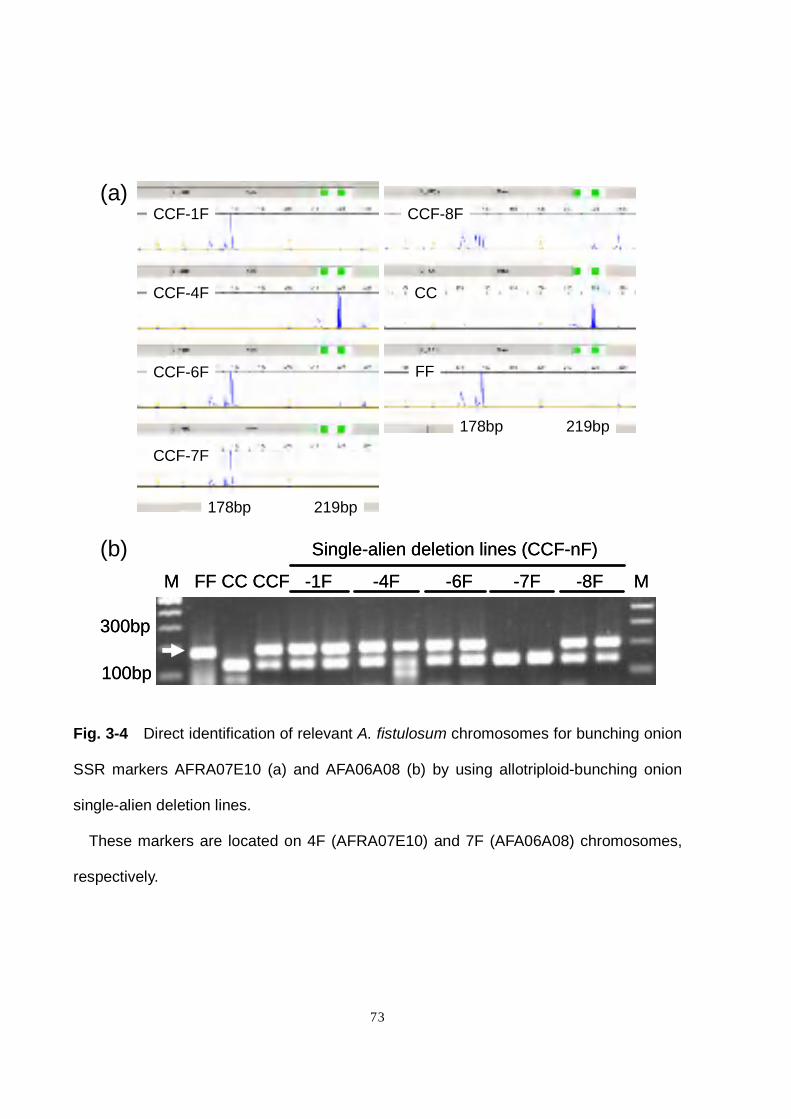
73
Fig. 3-4 Direct identification of relevant A. fistulosum chromosomes for bunching onion
SSR markers AFRA07E10 (a) and AFA06A08 (b) by using allotriploid-bunching onion
single-alien deletion lines.
These markers are located on 4F (AFRA07E10) and 7F (AFA06A08) chromosomes,
respectively.
(a)
(b)
CCF-1F
CCF-4F
CCF-6F
CCF-7F
CCF-8F
CC
FF
178bp 219bp
178bp 219bp
CCF-1F
CCF-4F
CCF-6F
CCF-7F
CCF-8F
CC
FF
178bp 219bp
178bp 219bp
300bp
100bp
M FF CC CCF -1F -4F -6F -7F -8F M
Single-alien deletion lines (CCF-nF)
300bp
100bp
M FF CC CCF -1F -4F -6F -7F -8F M
Single-alien deletion lines (CCF-nF)

74
Fig. 4-1 Example of polymorphism among 24 plants, each from four cultivars of
bunching onion. Detected at a SSR locus AFS131. PCR products were separated on 5%
denatured polyacrylamide gels. Asterisks indicate the prevailing genotype in each
cultivar.
White Tower (F1)Fuyuougi 2 (F1)
No. alleles : 2No. of genotypes : 3Pr% : 72
No. of alleles : 3No. of genotypes : 6Pr% : 27
Ojima (landrace)Yoshikura (OP)
No. of alleles : 3No. of genotypes : 6Pr% : 30
No. of alleles : 3No. of genotypes : 6Pr% : 41
White Tower (F1)Fuyuougi 2 (F1)
No. alleles : 2No. of genotypes : 3Pr% : 72
No. of alleles : 3No. of genotypes : 6Pr% : 27
Ojima (landrace)Yoshikura (OP)
No. of alleles : 3No. of genotypes : 6Pr% : 30
No. of alleles : 3No. of genotypes : 6Pr% : 41

75
Fig. 4-2 The “SSR-tagged breeding” scheme to achieve cultivar identification and F1
purity test in bunching onion. In bunching onion breeding, most of the F1 seeds are
produced by using the cytoplasmic male sterility (CMS) system as in bulb onion. In this
case, the top and the bottom loci are selected and genetically fixed into a genotype
denoted by a white circle for the seed parent and black circle for the pollen parent.
These two parental lines are crossed to produce F1 hybrid seeds, which are
heterozygous and homogeneous at the selected loci but heterogeneous at many others.
For F1 purity test or cultivar identification, these selected loci can be used.
F1 seed field
F1 cultivar
C line (pollen parent)A line (CMS)
Stock seed field
Foundation seed field
B line (maintainer)
Mass pollinationSelection and backcross
F1 seed field
F1 cultivar
C line (pollen parent)A line (CMS)
Stock seed field
Foundation seed field
B line (maintainer)
Mass pollinationSelection and backcross

76
Fig. 5-1 SSR markers on the linkage map of the backcross population of bunching
onion
The map consists of 17 linkage groups (1,098 cM) with 163 markers (111 AFLPs,48
SSRs and 4 CAPS).
SSR and CAPS marker names are included. Asterisks show bulb onion EST-derived
markers.
SSR markers used in the preliminary examination were shown as italic.
AFS096
AFS101
AFS008
AFS054
AFS088
AFS017
J1AFS015
AFS105
ACE080*
AFS142
ACC015*
AFS097
J2ACM024*AFS111AFS012AFS062_1ACE111*AMS14*ACE020*
J3
AFS042
ACC013*
AFS060
J4
AFS099AFS123
ACC033*
AFS103
J5
AMS22*AFS117ACE039*
J6ACM096*ACE088*AFS141_3AFS039
J7
AFS131
AFS109
J8ACM071*ACE127*
J10
AFS104
J11AFS156AFS141_1AFS149ACM005*
ACE087*
J12AFS058AFS221AFS140ACE113*
J9
ACE101*
J13
AFS075_2
J14 J15 J16ACC006*
AFS021
J17
10cM
AFS096
AFS101
AFS008
AFS054
AFS088
AFS017
J1AFS096
AFS101
AFS008
AFS054
AFS088
AFS017
J1AFS015
AFS105
ACE080*
AFS142
ACC015*
AFS097
J2AFS015
AFS105
ACE080*
AFS142
ACC015*
AFS097
J2ACM024*AFS111AFS012AFS062_1ACE111*AMS14*ACE020*
J3ACM024*AFS111AFS012AFS062_1ACE111*AMS14*ACE020*
J3
AFS042
ACC013*
AFS060
J4
AFS042
ACC013*
AFS060
J4
AFS099AFS123
ACC033*
AFS103
J5
AFS099AFS123
ACC033*
AFS103
J5
AMS22*AFS117ACE039*
J6
AMS22*AFS117ACE039*
J6ACM096*ACE088*AFS141_3AFS039
J7ACM096*ACE088*AFS141_3AFS039
J7
AFS131
AFS109
J8
AFS131
AFS109
J8ACM071*ACE127*
J10ACM071*ACE127*
J10
AFS104
J11
AFS104
J11AFS156AFS141_1AFS149ACM005*
ACE087*
J12AFS156AFS141_1AFS149ACM005*
ACE087*
J12AFS058AFS221AFS140ACE113*
J9AFS058AFS221AFS140ACE113*
J9
ACE101*
J13
ACE101*
J13
AFS075_2
J14
AFS075_2
J14 J15J15 J16J16ACC006*
AFS021
J17ACC006*
AFS021
J17
10cM10cM

77
Fig. 5-2 The SSR-tagged breeding trial in this study.
<Open pollination without selection>
<Selection and selfing>
Starting materials(37 plants)
<Selection and open pollination>
Shimonita A (homozygous for AFS039 and 088)
Shimonita B(homozygous for AFS099,
131, 140 and 142)
Control
12 plants
26 plants from 7 families 40 plants from 11 families
<Selfing without selection>
30 plants
2 loci (AFS039 and 088) 4 loci (AFS099, 131, 140 and 142)7 plants
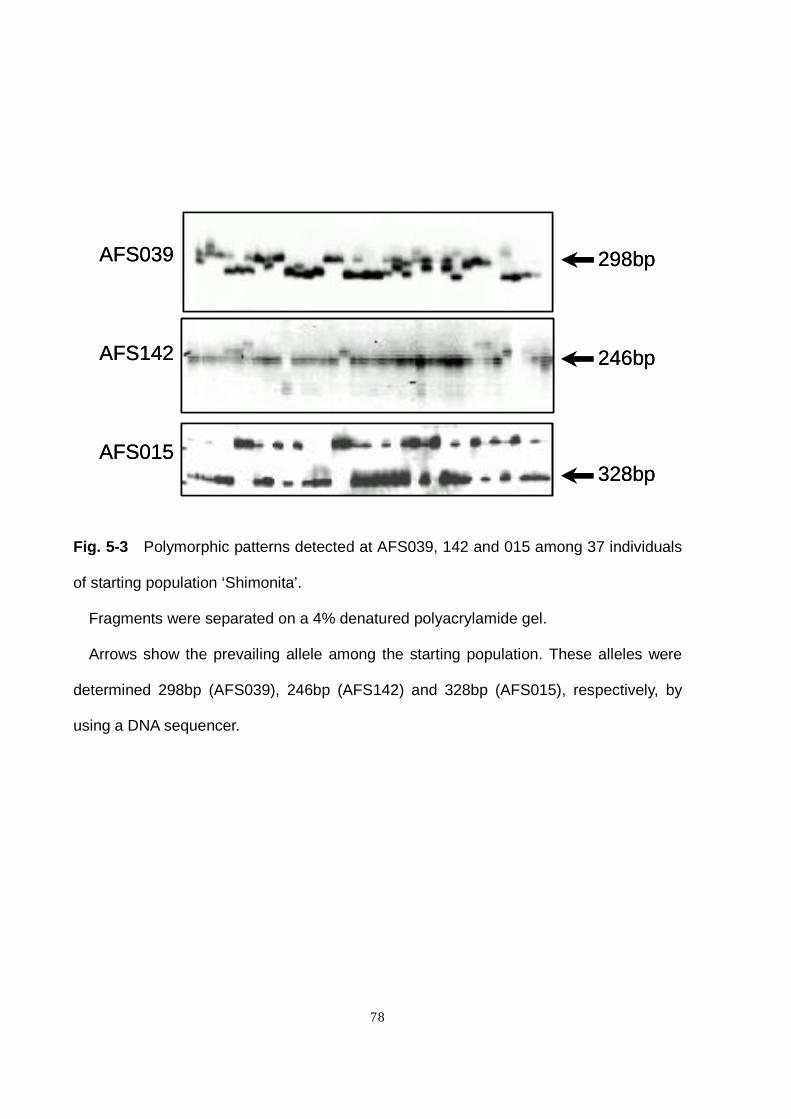
78
Fig. 5-3 Polymorphic patterns detected at AFS039, 142 and 015 among 37 individuals
of starting population ‘Shimonita’.
Fragments were separated on a 4% denatured polyacrylamide gel.
Arrows show the prevailing allele among the starting population. These alleles were
determined 298bp (AFS039), 246bp (AFS142) and 328bp (AFS015), respectively, by
using a DNA sequencer.
AFS039
AFS142
AFS015
298bp
246bp
328bp
AFS039
AFS142
AFS015
298bp
246bp
328bp

79
Tables
Table 2-1 Primer sequences of 100 SSR markers of bunchimg onion (Allium fistulosum )
Repeat region Forward primer sequence (5'-3') Reverse primer sequence (5'-3')
AFA01A08 (TA)7(TG)14 24 14 agataagtgctcatggagcaaggg acatccacagcaaacatagcaagc
AFA01C06 (TG)7tata(TG)6 13 7 tatgtataagaaattgtacggggttgg aacattaaagggagggtcaatagtatttt
AFA01C07 (TG)14 18 14 cattccagacgtttgttgtgacag tggtctccaatacgagcatcaaaa
AFA01C09 (TG)9tt(GAT)5 17 9 tgggacttcgtgtctagcgtacaa cagcacgtagctttgcccaaata
AFA01F03 (TG)19 19 19 aaacccatggacaaagaattcagg atcgtgccttggttccatctatgt
AFA02 (TA)7(TG)12 19 12 ccttggtaatggcaaagact catagcctcacatctctcactc
AFA02F09 (AC)14 23 14 cctaggttcattaggggactatagga ccaagcaccagtatctgcctttct
AFA02H08 (AC)12 22 12 agatcttggatagttattaaagtagttccagtaga gggctgaaatattatgtgggtttg
AFA03B07 (AC)14aga(TA)5 19 14 tttactaatacaataaacaactataatgctcataca agtagttagtcagagcacagtagaagacct
AFA03C06 (AC)11aacacgc(AC)5 16 11 ggtcgcctatcaacacaaatgaga ggctacgtgccgcatattattgta
AFA06A08 (AC)6atatacatacat(AC)10 20 10 cctcaggagaggggtattttggtt cttgggaaaggcttctcttgaggt
AFA06A10 (CAA)3(TA)8(TG)14 25 14 gttgccaggtttctttggcttaaa tgctagcaccaccatttttcatgt
AFA06H12 (TG)14 18 14 tggacattgacttttggatgtttagc gaacacatagaaacagaacatagcgaaga
AFA07A08 (TG)8tt(TG)5 13 8 tctggaaggcggtttaaggctatt gcatccatatccatatcccacgat
AFA07A10 (AC)11a(TA)3tgtatg(TA)7 21 11 actactgggatgaatgcccaaaga atccagttgcacatgacttttg
AFA07G10 (AC)14 20 14 ttcgctgtgttgtctgattctgtg tcaaatggttaggagcaaccatcc
AFA09C01 (AC)11 11 11 ggatctcatcattctcactctcacca cacgaacatcgtcaatagattcaaaca
AFA09C08 (TG)10ta(TG)4cg(TG)5tata(TG)9 35 10 gaaaccgataatgacttaattgcttgaaaa ccttatcttaatctgcttccagtctctcaa
AFA10B06 (AC)15(TC)6 21 15 ccgcaaactggactaactgtacaaa ggcagaatagcccaagtgttttca
AFA10C07 (AC)22a(TA)7 29 22 caacattgcaaacatgtcacaca gcactgagtttgcgttgagcta
AFA11D02 (TA)6cacatatc(TG)9tt(TG)4 26 9 cggcaaacctgttaaatcc tttatacataaacacaaacacacacg
AFA13H07 (TA)6tc(TG)6ag(TG)8 20 8 cctaccatatcatgacggcctacg acgattacgaatcttcaatataatgttgtcct
AFA14E06 (AC)10 10 10 cacaacatgctgctccagatcttact tgaagatagcaccgtttGAGAGAgtg
AFA14C03 (TG)11 11 11 gtaggcgatggataagaaatatgtacaagaaat tgaatcaaacacgagtaatcaatcacaaat
AFA14G03 (TG)12 12 12 ctccatgaatgggaggtcttctgt gtttttccaaaaggattcacacgc
AFA16E11 (TG)6tatgtatatgtata(TG)5 25 6 tatgcgtagacatgagggcacaat cacaaacatgagaaatacgttggca
AFA17A05 (TG)22 22 22 ttccatcaattacactgccagcac tgctgaacttggtatgttgatactcca
AFA23A09 (TG)9 9 9 GTtgttttcagcatttacaggtgagtttT taacaccaaagaagtatcctccaggtctaa
AFA23D07 (TG)5(TA)4tgtatgtatg(TA)6(TG)9 24 9 ttagctactagcatgtgcgaagga gttgtacccagtcggtccattgat
AFA23H11 (TA)6(TG)17 29 17 catgaccacactttgtcgcatttt tctcgttctgaattcaaccccaat
AFAA01D09 (TC)6(AC)6 12 6 gccataatggagcatccaaaaact aaagcaacttgcatcgtacgtcat
AFAA02A06 (TG)9 12 9 ccttggcttcatggcctaaggtat gcgacccttcactagtcccatct
AFAA02D08 (TG)10(TA)6tgtatgtatgcatgta(TG)7 23 10 ctatggccaagttccattttgagc tatttttacagcaacggagcagca
AFAA03F01 (AC)8 8 8 cgactttgtttctcgctcttggtt aaattgcacaaggctctgcgagat
AFAA05F12 (TG)8 8 8 ttcattattgcttgatgtcgttagtgt ttcaagtccacttatcgagtgttcc
AFAA07E07 (AC)6 12 6 ggaagcaggtttggcatt ctattggacagaccttgaaataactt
AFAT00B05 (TA)6tttcgtgtatc(TG)12 21 12 tgtccactattcacggcttactca gatgggtctgcctcctccttattt
AFAT00C07 (TG)5cgtgagtgcg(TG)3tt(TA)4 12 5 aagcacatcgcctagaatagcacc attctcaacatttggagtcagccc
AFAT02A03 (AC)4aa(AC)7 14 7 tagcagaagccttgtagcgaggatag gaatgcaataaaatgacacatcaagca
AFAT02B11 (AC)8atctacacgtgtatgtatgt(AC)7 21 8 gcatcgggtcagacgctagtattt caagaagacaaaaggatgactgaag
AFAT02D10 (AC)9 27 9 acgcacttggtttctcctcttttg gtgggtaattttgtgctaggcgtt
AFAT02H05 (AC)12 16 12 tctcgtaccagtttctcctttttcc gattcggatcaatacagggaatgc
AFAT03D12 (AC)7agag(AC)3 25 7 atacacggcaatgggtcaagtacc gtctggggttgtgtttatgtgggt
AFAT03H10 (AC)11a(TA)6 36 11 gcacttcctacttgattcacacaagc ttgatttcatggtgtataaactggttaatctt
AFAT04E02 (TG)7 13 7 ttcattggttaaaagttatctaaaatgtca ttcacgctatgctcaatgtcc
AFAT04E10 (TG)8tatt(TA)5tgcatact(TG)7 26 8 actaatctcgcgtccatcattggt tgcgtaaatgcgagtgagatatgc
AFAT04F03 (AC)8atattat(AC)5gc(AC)3t(CA)3 29 8 caaaaggtgagaaagggctacatga gagagagaaattgttagttcggcaaca
AFAT04H07 (AC)6at(AC)9 15 9 ttggaaccaaccttgcatca ggccttatttatgaaacgatgataaga
AFAT05A12 (AC)3aa(AC)7 10 7 gcggtttatttctttctgatttttgttt tgcacgggtacagttcctatttacag
AFAT05B07 (TG)7ta(TG)3tctgta(TG)11 27 11 gaatataccgaatcagctacccgtga tgcagtctaaattagttgaaacctttttcc
AFAT05D02 (AC)11 11 11 ggcatttaggcttcaccttagtgt cccaaaatgcatacaacatcct
Repeat(max) b)
Repeat(total) a)Marker name

80
Table 2-1 (Continued)
Repeat region Forward primer sequence (5'-3') Reverse primer sequence (5'-3')
AFAT05D09 (AC)12 12 12 ccggataaatttacctgcaaatcc cagccattaaagaacctgatgtaag
AFAT05F03 (TA)9 13 9 ggtcagtgggtttatctacgaaaagg tcaatctaaccgtcccctaatcca
AFAT05G01 (TG)8 56 8 cgtgtgttgcagtgtttgtgtatg ccactacaccgcacatccctatatc
AFAT06B02 (TG)8cgca(TG)4 12 8 tgagcacatgcgtattgtgta ttaatatataatggcactggacaactt
AFAT06B10 (AC)10a(TA)4 17 10 acgaaagtcgttcgaaatcaatgc tccacatgttactaccccctccat
AFAT06C02 (AC)9 9 9 tctcgataagaactcacggtgaaa acgttattccgattccctcctcat
AFAT06H08 (TA)7(TG)10tttatgtaaa(TA)6t(AC)4 33 10 attttattattcacaaacgtctcatcattt tgtcgaaaacattgtaaactctagtacaaa
AFAT13H10 (TA)8(TG)6 14 8 cggattgtgtgtcttgattacttgtg ggctgattcaaccagaaggctaag
AFB01B03 (AG)11 11 11 gattgcattcgatttcgttgagtg cagcacacttcgtttggatttcag
AFB02E10 (AG)6gg(AG)5 11 6 cgtaggtgttgattggaaaggagg acgaccacaccatggcatatacag
AFB03G07 (TC)9c(TC)9gctc(AC)6 38 9 ggctgtttggaagcccttctt atgcgtgtatgtgtgcgtgtg
AFB04A09 (AG)13 16 13 actagagtcattgcgagacggagg tattttgttgagcggaagtcagca
AFB04B12 (AC)6(TC)15 24 15 ctagacttgaggggaggatgggtt ggagagggcaacatgcatttttag
AFB04F07 (TC)10 10 10 agcaatatgaaggagacacatgg cccaaactaatttagggtttacaattc
AFB05H09 (AG)17(CG)5 22 17 gcgagcgtatcccctaagaagaat ttggtccctagatttcactgcaca
AFB06C08 (AG)3gg(AG)18 21 18 cgcacaaaacatatagggagaggg tctccgtaagaagacctgcactca
AFB06E05 (TC)13 13 13 tttgaattggcagagacaatggtg tgtatggaggaagggctgaaagag
AFB09D04 (AG)8 8 8 tgagatggtgtggtttggtaggaa aatcttgattgccaacgctgatct
AFB09E05 (AG)10 10 10 ctaagagaaactacatcggtaccttga gtggtcctgatgtatgcgatgttc
AFB09G09 (TC)13 16 13 ccaagacaaaagattcctatacaccc aatcagacatcgaggatgcaaaca
AFB10D09 (TC)9 9 9 ggttccttttggttctgtgtttgc ccatacagatttccttaagagacga
AFB10F03 (TC)6 6 6 taccgtaacccaatagtcgctgct gccaagcaaaacaaagaagtggaa
AFB10G06 (AG)8 8 8 tgatgagtccataaaatgcaagtcc ccttgatgttcgacgatgcaatta
AFB15A03 (TC)5ttt(TC)3tgc(TC)8 16 8 tcttttacggtcggttcagtggtt agaagataggcagcaatctctccg
AFB16A11 (TC)7 7 7 ctactcccttgctctcgtacgctc gacagggaagctctatcacgggta
AFB16C05 (AG)6 6 6 acggtgcatgatttagtgaaacga tcgggtccaatattcacctacaca
AFB17B09 (AG)8 8 8 ctagtggaagaagtcgcaggcac caagtaagcctctgccatctcctc
AFB17C10 (TC)7 7 7 ccgtgtattaacccaacagccatt gagtgtgacggcgctgaaaaatag
AFB17G01 (TC)7 7 7 gattcaagtgcccacttttcaaca gcAGAAGAAGAatgaatgtgagcc
AFB17G02 (AG)7aa(AG)3 13 7 tgctaaggagaggtgaaggaggaa atggattcccttgggcatttg
AFB20F12 (AG)11 14 11 agtatccacccatttggttgttgg atgtttcaatacatccactccggc
AFB21A08 (AG)3tg(AG)7(TG)5 18 7 tacaggtatattggggttcggtgg gcatgcagtgcgacttatatacgacta
AFB23B03 (TC)8 8 8 cctattcgcttccaccatgatagc aaaggtgacgtgaaggctacttcg
AFB24E07 (TCA)6 6 6 agagacgactctccacacgactca atagagcagcagaagtgcatggtg
AFB25G01 (TC)20 20 20 tgagatgttgagtggagagtcgct tgcaatgtcaagtccatgttcact
AFB25H01 (AG)7 7 7 aaaggtagttgtggtgggcagtgt tgtcactcctctccttccatttcc
AFC01E09 (TCT)7 7 7 cccttttgttcgacaagatttcca caagacagcgatgacaaggaagaa
AFC03G02 (TCT)9 9 9 tcatctccctcttgtctgatgtcg tccgatgaagttcgagtagaaggg
AFC08G05 (GAA)11 17 11 gttaaaggcccattgggtatgaca gaagttcgatgccttcatgtctca
AFC12 (TTC)8 8 8 tgcgattgtgagattttgt ccagcgtttggatagttg
AFC12A06 (TCT)7 7 7 acgacatattttgatacggttttgagc gaataactttagcataacttcgacgcatt
AFRA01B05 (TG)5tt(TG)6 11 6 caaagacccaaaggaaaaagaccc ttgaagtggattgaatgtagggac
AFRA04B10 (TG)5cagttgta(TG)8, (TG)5catagttgta(TG)7 35 8 gtgagtgtgcagttttgtgagggt gtgcgcaggtccatctgtaaaaa
AFRA04D09 (TG)3ca(TG)7 16 7 ctagcggggaatttatcctggttc cgatacgcccaacttactcgactt
AFRA04F12 (TG)3cga(TG)4a(TG)3 14 4 tgaggctcaggtgtagactcggtt ctgcctcacaaatcacactcaaca
AFRA07E10 (TC)9 9 9 cagaactagacggtttgggaggaa agctcatattttgaagctcgcagg
AFRA13H07 (TG)8 15 8 gcgtatgttagtttggggattcatgt acccagtcacacaagagcagtagatg
AFRT01F02 (CG)3c(AC)6 9 6 acgaggcataggtggatgaggtta cagccaactcgtcataggaacgata
AFRT01F06 (TG)5tc(TA)6tgta(TG)8 22 8 cctttgtcccctctcatcata acatgcaaatgcacatacaca
a): Total number of repeats.
b): Number of repeats in the longest continuous repeat sequence.
Marker nameRepeat(total) a)
Repeat(max) b)

81
Table 2-2 Characteristics of SSR-enriched DNA libraries
%% in SSR-containing
clones CCT GGT(Index of
SSRenrichment)
(Contrary indexof clone
redundancy)AFA - a) GT 1,725 1,009 58.5 576 31.5 53.8 569 1 6 0 0 0 0 576
AFB - GA 2,426 858 35.4 271 21.1 59.6 8 258 3 1 1 0 0 271
AFC - GAA 1,347 237 17.6 54 15.1 85.7 1 4 0 49 0 0 0 54
AFD - AGC 589 200 34.0 22 13.1 38.5 0 2 1 0 18 1 0 22
AFAA GA 534 233 43.6 164 37.1 85.0 144 11 8 0 1 0 0 164
AFAT GT 1,062 471 44.4 311 37.6 84.7 269 14 28 0 0 0 0 311
AFHA GA 69 10 14.5 7 8.7 60.0 4 2 1 0 0 0 0 7
AFHT GT 1,067 188 17.6 70 13.0 73.9 58 2 7 1 1 1 0 70
AFRA GA 1,372 391 28.5 228 23.8 83.4 196 18 12 0 1 0 1 228
AFRT GT 731 155 21.2 93 17.2 81.3 82 2 7 0 2 0 0 93
Total 10,922 3,752 34.4 1,796 16.4 47.9 73 51 24 2 1
a): Not disclosed by the supplier.
Rsa I
Rsa I
Restrictionenzyme
Alu I
Alu I
Hae III
Hae III
SSR-containingclones SSR-containing uniclones
Library ProbeNo. ofclones
sequenced No.Total
Core motif
1,331 314 1,796
AGCGT GA AT GAA
% insequenced
clones(Index of library
efficiency)
No.

82
Motif
GT 856 10.1 GT + others 475 11.2 GT (total) 1,331 74.1 10.5 GA 277 9.8 GA + others 37 14.2 GA (total) 314 17.5 10.4 AT 52 7.5 AT + others 21 9.0 AT (total) 73 4.1 7.9 Trinucleotides 78 4.3 7.3 total 1,796 100.0 10.2a): Mean number of repeats in the longest continuous repeatsequence in each clone.
Table 2-3 Core motif and number of repeats in1,796 SSR clones of bunching onion
ClonesRepeats(max) a)
Frequency(%)

83
C1s-11s-25s-7
D1s-15s-10s-8
F1s-7s-17s-3s-1
J1s-14s-23s-9
K1s-5s-2s-2s-4s-5
AFA01A08 300 306 304 302 314 4 0.72
AFA01C06 - b) 244 242 242 - 2 0.44
AFA01C07 280 280 288 288 284 3 0.56
AFA01C09 225 225+227 223 227 225 3 0.62
AFA01F03 219 229 223 221+223 223 4 0.66
AFA02 176+184 182 180 178 190 6 0.83
AFA02F09 292 267 294 290 296 5 0.80
AFA02H08 - 190 186 186 - 2 0.44
AFA03B07 328 328 328 336+350 334 4 0.58
AFA03C06 223+243 - - 241 219+225 5 0.78
AFA06A08 178 184 176 176+190 188 5 0.78
AFA06A10 278 278 276 284 290 4 0.72
AFA06H12 274 264+266 268 268 264 4 0.70
AFA07A08 223 225+253 223+249 223 251 5 0.68
AFA07A10 - - 230+236 238 240 4 0.72
AFA07G10 a) 192, 206 192, - 192, 200 192, 204 192, 202 4 0.75
AFA09C01 - 201 199 203 - 3 0.67
AFA09C08 - 206 182 182 - 2 0.44
AFA10B06 302 294 294 296+302 - 3 0.74
AFA10C07 237+247 247+261 253 249 253 5 0.74
AFA11D02 - 161 165 161 - 2 0.44
AFA13H07 - 211 211 211 - 1 0.00
AFA14C03 - 200 190 192 - 3 0.67
AFA14E06 209 209 209 217 209 2 0.32
AFA14G03 216 216 214+216 216 216 2 0.18
AFA16E11 - 186 186 186 - 1 0.00
AFA17A05 a) 151, 183 151, 161 151, 161 151, 183 151, 181 2 0.64
AFA23A09 198 196+198 - 198 198 2 0.22
AFA23D07 206 204 202 204 204 3 0.56
AFA23H11 - 227 222 222 - 2 0.44
AFAA01D09 120 120 120+130 128 120+130 3 0.56
AFAA02A06 294+298 294 296 296 292+296 4 0.69
AFAA02D08 170 168 176 168 184 4 0.72
AFAA03F01 233 231 231 235 233 3 0.64
AFAA05F12 - 245 241 241 - 2 0.44
AFAA07E07 - 173 171+173 173 - 2 0.50
AFAT00B05 202 202+204 204 202 202 2 0.42
AFAT00C07 105+129 105 - 129 - 2 0.50
AFAT02A03 - 239 237 239 - 2 0.44
AFAT02B11 220 220 214+222 220 214+222 3 0.56
AFAT02D10 303 303 303 303 303 1 0.00
AFAT02H05 300+302 296 302 290+302 282 5 0.74
AFAT03D12 222+224 224 224 224 224 2 0.10
AFAT03H10 - 210 210 208 198 3 0.63
AFAT04E02 241 229 239 235 231 5 0.80
AFAT04E10 273 275 275 275 279 3 0.56
AFAT04F03 168 168 170 168 164 3 0.56
AFAT04H07 207+219 221 207+217 221 203+205 6 0.76
AFAT05A12 180 180 180 180 180 1 0.00
AFAT05B07 198 198 198+200 196 202 4 0.66
AFAT05D02 302 304 302 302 296 3 0.56
Table 2-4 DNA polymorphisms at 100 SSR loci among 5 inbred lines ofbunchimg onion (Allium fistulosum )
SSR locusProduct size (bp) in inbred line
No. ofalleles PIC

84
C1s-11s-25s-7
D1s-15s-10s-8
F1s-7s-17s-3s-1
J1s-14s-23s-9
K1s-5s-2s-2s-4s-5
AFAT05D09 300 308 300 298 302 4 0.72
AFAT05F03 229 225 223 217 217 4 0.72
AFAT05G01 308 294 308 308 308 2 0.32
AFAT06B02 - 207 207 207 207 1 0.00
AFAT06B10 259 275 277 275 275 3 0.56
AFAT06C02 205 207 205 215 203 4 0.68
AFAT06H08 168 172 172 168 148+150 4 0.66
AFAT13H10 257 259 257 251 259 4 0.68
AFB01B03 204 200 206+220 204+220 206+220 4 0.74
AFB02E10 236+246 236 236 236 234+236 3 0.34
AFB03G07 192 202 192 204 202 3 0.64
AFB04A09 250+252 272 250+252 260 250+252 4 0.74
AFB04B12 243 235 231+239 233+243 233 5 0.76
AFB04F07 156 156 154+158 158 154 3 0.66
AFB05H09 268 268 270 272 270 3 0.64
AFB06C08 144 164 170 146 180 5 0.80
AFB06E05 144+149 142 - 151 - 4 0.72
AFB09D04 171 169 167 171 169 3 0.64
AFB09E05 145+147 147 145 145 143+145 3 0.54
AFB09G09 206 206 204 208+210 206 4 0.58
AFB10D09 298+302 298 298 298 290+296 4 0.48
AFB10F03 181+187 181 - 181 181+189 3 0.41
AFB10G06 279+291 279 279 279 279+289 3 0.34
AFB15A03 149+153 149 153 153 155 3 0.65
AFB16A11 152+154 168 162 162 162 4 0.58
AFB16C05 283 283 285 283+285 285 2 0.50
AFB17B09 131+133 133 129 125+129 129+131 4 0.70
AFB17C10 300 300 300 300 300 1 0.00
AFB17G01 255 251 251 251 255 2 0.48
AFB17G02 146 158 150 150 146 3 0.64
AFB20F12 228 230 228 230 226 3 0.64
AFB21A08 257 253 257 253+257 255 3 0.62
AFB23B03 133+145 133 131 133 131+143 4 0.64
AFB24E07 204 206 200 200+206 204 3 0.66
AFB25G01 218 222 210 212 220 5 0.80
AFB25H01 218+228 208 220 208 218+222 5 0.72
AFC01E09 140 140 144 146 140 3 0.56
AFC03G02 164 164 166 168 164 3 0.56
AFC08G05 293 290 290 293 293 2 0.48
AFC12 236 233 233 236 236 2 0.48
AFC12A06 208 214 206 208 198+208 4 0.66
AFRA01B05 212 212 210 210 212 2 0.48
AFRA04B10 298 284 298 296 284 3 0.64
AFRA04D09 147 147 151 151 149 3 0.64
AFRA04F12 300 300 300 306 300 2 0.32
AFRA07E10 172 172 170 178 170 3 0.64
AFRA13H07 185 185 - 185 185 1 0.00
AFRT01F02 222 222 222 220 222 2 0.32
AFRT01F06 164+172 194 194 214 172 3 0.70
Average 3.2 0.55
a): Amplified at 2 loci.
b): Did not investigated.
No. ofalleles PIC
Table 2-4 (Continued)
SSR locusProduct size (bp) in inbred line

85
Table 3-1 Primer sequences of 213 bunching onion SSR markers located on bunching onion (Allium fistulosum ) map
in D1s-15s-10s
in J1s-14s-23s
AFA01A04 + (TA)5(TG)14cgcgc(GT)3atgtcactttgttcata(AT)3
cctatatttggtgacattcctgaag cgaccacgcataacatatgtccac 55 codominant 2a 216.1 266 270
AFA01A08 + (TA)7(TG)14tatctaagggcatctgagt(GA)3
agataagtgctcatggagcaaggg acatccacagcaaacatagcaagc 55 codominant X 22.8 306 302
AFA01C07 + (TG)14(TA)4 cattccagacgtttgttgtgacag tggtctccaatacgagcatcaaaa 55 codominant 1b 36.6 280 288AFA01D09 (TA)3(GT)17(TG)3 ttcttcgattcttgtgtgtttgagc tacttcgattcaacatgcaagcca 55 codominant 3b 132.4 290 300AFA01D10 (CA)3(AC)9 tcgcttcaaacaagttcacacaca taggcttggtttggggtgagttta 55 codominant 3b 162.8 250 241+250AFA01E06 + (AT)3ggaggctgctagatttccata
aca(AC)14(AT)5
caattctggtcaaaccgagactca tctgttccatctattcatgttcctcc 55 codominant 4a 29.1 258 254
AFA01E09 (TA)3tctatatgt(AC)13 cccaacctacttgagggattgcta gttctgtgtatgcaggcaatttgg 55 codominant 2a 151.3 160 180AFA01F03 + (TG)19 aaacccatggacaaagaattcagg atcgtgccttggttccatctatgt 55 codominant 4a 87.6 229 221+223AFA01F12 (ac)11 ggtggacatagcacagccataaca ccctatgttgccttgcttgagttt 55 codominant 5 35.2 160 150AFA01G12 (TA)4(TG)19 gccatggctaagttttcttaagctc ggtatggatggaatttagggagga 55 codominant 1a 28.5 180, 240 b) 180, 250 b)
AFA01H09 + (TA)3(TG)16tt(CA)3tg(TA)3 cactgtttgcttggaatgaagtcg gttcagaggtgacagcagagcatc 55 codominant 5 9.6 100, 150 b) 100, 130 b)
AFA01H12 + (TA)6(TG)18 cagaacaatcaatagccacgacca tcaggagaccgcctaccttttgta 55 codominant 3a 14.2 180 190AFA02 * + (TA)7(TG)12 ccttggtaatggcaaagact catagcctcacatctctcactc 55 codominant X 21.5 182 178
AFA02A05 (AC)11 ttatcatcgaccgaagccctctaa agactggaaaaatgaggagttgcg 55 codominant 3a 62.2 260 280AFA02D05 + (TA)3cta(AT)3(AC)11 ttaggcgtcacataccaaagctacaa tggaatttcaaaaagacaccgagtaa 55 codominant X 0.0 220 230AFA02E09 + (AC)4at(AC)11(AT)6 tgcatacacacacacgcagacata ttccccctttctagtcatcatgga 55 codominant 6b 0.0 230 226AFA02F09 + (AT)3(AC)14(AT)4g(TA)3 cctaggttcattaggggactatagga ccaagcaccagtatctgcctttct 55 codominant 8 0.0 267 290AFA02H08 + (TA)3cat(AC)4aa(AC)12 agatcttggatagttattaaagtagttccagtaga gggctgaaatattatgtgggtttg 55 codominant 6a 82.3 190 186AFA03A05 (TA)10(TG)12 aaaaacatatttgattacatgacgttatactt tcatcatctccccctcgtc 55 J_dominant 5 96.5 190 210AFA03B03 + (AT)3gaa(TA)6(TG)6ta(TG)6 gtgtgaagttgagttcgttggcag ggcattacccagtagtgtccttgg 55 codominant 2b 30.6 230 240
AFA03B07 + (AC)14aga(TA)5 tttactaatacaataaacaactataatgctcataca agtagttagtcagagcacagtagaagacct 55 codominant 2a 68.9 328 336+350AFA03C06 + (AC)11aacacgc(AC)5 ggtcgcctatcaacacaaatgaga ggctacgtgccgcatattattgta 55 codominant X 83.4 230 241AFA03D03 (TA)3catgta(TG)8ca(TG)7ta(TG)3 tgtccaaagcagtgttagctggaa ccaagcacatgaaagtgcacaag 55 codominant 3b 47.2 183 177AFA03D07 (TG)3(CA)18 tgtcctcgaaaatgagatgcttca tgaaatgtaacccgactgtccaaa 55 codominant 6a 99.1 290 310AFA03E07 (TG)12 aggaacgatttcgaaaggtttgac cctccggtagcttattcgtcatca 55 codominant 2a 192.2 275 280AFA03F08 + (TA)4(TG)7ta(TG)7 ttaggtaaagggacgaaacgacca tgcctccaggactgaacaatacaa 55 codominant 1a 93.6 301 285AFA03H03 (TCA)3cacggcacggtagtgagaa
aaga(AT)6(GT)17(TCT)3
gatccattcaaacacgtttccctc cagttgacgatgagccttggtatg 55 codominant 6a 89.3 205 215
AFA04G02 + (TC)10(AC)13(AT)6 ggaacaacaatgaagtttggaggg gatggaattcaaaaaccaacactgc 55 codominant 3b 128.2 170 155AFA04G08 (TG)11(TA)3 aagtgggtcgtatcaaagtggcat tcatatcactaacaaatacgcgcac 55 codominant 3b 98.7 200 205AFA04H02 + (AAT)3attttattttgcttgtaa(AC)5at
(AC)12(AT)4
tgtgatgtgctcatgagtgagttg tgcgacaagatgacaagacttatg 55 codominant 1b 17.8 270+290 280
AFA05B02 + (AC)3tctc(AT)4(AC)12 cgcatcgactagaattcttaagccac agcgaacacctaggctttgggtat 55 codominant 3a 87.9 150, 210 b) 150, 190 b)
AFA05D02 + (AC)10(AT)5 caactcgaagcaatactcgggaac gaatgctttgttgcacttgtttgg 55 codominant 2a 28.0 280 300+320AFA05G02 (TG)4(TA)7(TG)15 atccagcatgaagccacttaaca tgacaaaactggttatcaaacaaagg 55 codominant 1a 56.2 150 160AFA05G04 + (TG)11(TA)5(TG)3 agtttgaattttggcatctatttgcat agtatgcttggttaggtgagcaaagg 55 codominant 1c 31.7 180 210AFA05H01 + (TG)9t(TG)7ttt(TG)12ttttccgtgtt
gcgtgt(TG)5
acaccttccttgcacatttgctta tcttcagagaaagatacagaagggga 55 codominant 1b 26.9 230 210
AFA06 + (CA)6gata(CA)11 cgaaatcacaagttaggagaac ccactgaaacgagatgactc 55 codominant 1b 67.3 170+180 170AFA06A08 + (AC)6atatacatacat(AC)10ata
taca(TA)4
cctcaggagaggggtattttggtt cttgggaaaggcttctcttgaggt 55 codominant 7b 30.7 184 176+190
AFA06A10 + (CAA)3(TA)8(TG)14 gttgccaggtttctttggcttaaa tgctagcaccaccatttttcatgt 55 codominant 3b 144.2 278 284AFA06G01 (AC)15(AT)7 tacatttgggtgcacttacgttgg ttaatgagcgcacaacctacctca 55 codominant 8 135.5 110, 190 b) 110, 180 b)
AFA06H07 (TG)15 catggtaaatgtcatccgcctaca tgaaatcactgccatatgttcacg 55 codominant 1a 86.1 180 190
AFA06H12 + (TG)14ttttattgtctccatgtatg(TA)4 tggacattgacttttggatgtttagc gaacacatagaaacagaacatagcgaaga 55 codominant 1b 0.0 264+266 268AFA07A08 (TG)8tt(TG)5 tctggaaggcggtttaaggctatt gcatccatatccatatcccacgat 55 J_dominant X 42.4 225+253 223AFA07A10 + (AC)11(AT)4tgtatg(TA)7 actactgggatgaatgcccaaaga atccagttgcacatgacttttg 55 J_dominant 4a 20.8 228 238AFA07C08 (TG)4(TA)8tctc(TG)9 tgtgctaaagccaggatcattgag tgctttcaaaagtaaaggggacca 55 codominant 2a 125.6 230 240AFA07D01 + (TA)3(TG)16ttcctttgc(AT)3 ttaatttgattttgggtcgttatcaa tcattttgtgtgtactgtaatttgtcca 55 codominant 5 62.7 280 290AFA07E01 + (TA)5(TG)18 tcgatgcattctaactctgtattctttga cgatatggggcacacacatga 55 codominant 1a 116.0 189+222 216AFA07F06 + (TA)7(TG)14 aaagcgaagaaggaagaaagggtg tggtttagctcaacgaaattggct 55 codominant 3a 68.9 280 285+290AFA07G06 + (TG)5tc(TA)5(TG)14 tgaaccgttcccatctaccttctg atgagatcgtgatacaacaaggcg 55 codominant 8 58.9 160, 180 b) 160, 200 b)
AFA07G10 + (TA)3ttactttgtgtcgagactgttc(AC)14(AT)3
ttcgctgtgttgtctgattctgtg tcaaatggttaggagcaaccatcc 55 J_dominant X 69.5 192 192+204
AFA07H05 + (TG)11ca(TG)3cgct(TG)3tatgtg(TA)5
gtggttatttcttgagtggagggg cccgatcgatgagaataggcatac 55 codominant 7a 64.0 310 300
AFA08A09 + (TA)8(TG)11tatgcgctga(TA)3 ttcggttaaatacccacccctacc tccaacatgtccccctacatcata 55 codominant 8 35.9 230 240AFA08E07 (TG)13 ataccatggcattccattgaacct cccctatccactttcaagatgacg 55 codominant 3b 124.5 220 224AFA08E10 (TA)3atagc(TA)3cg(TG)11 gtacgatgcgcccaacctactcta aggaggcaacgctaaataacccat 55 codominant 3a 18.7 288 280+290AFA08G02 + (TA)4(TG)11 ggttgaacacgctttttgtgaattg ccagttctagtgggtctatcaaccg 55 codominant 3a 19.9 298 290AFA08G10 + (TG)18 tgagcatgccagaaaatccactaa cgagaatgaggatatgagattcgagtg 55 codominant 1a 205.6 235 241AFA09A06 (TA)3gta(AT)3gtctaat(AC)11 cacatatgttggtcatatcgtccatgt agttatttgggcgatgcgatacct 55 codominant 1a 66.6 280 272AFA09A11 (AC)3(AT)3acat(AC)17at
(AC)3g(TACA)2(TA)3
agaactctctgttcgctcattcca gcgagacttatatcgcctcgctta 55 codominant X 35.5 206 200
AFA09C08 * + (TA)4ca(TA)3(TG)10ta(TG)4cg(TG)5
tata(TG)9
gaaaccgataatgacttaattgcttgaaaa ccttatcttaatctgcttccagtctctcaa 55 codominant X 44.6 206 182
AFA09E12 * + (AC)11 tggaccctaatgaggtgttaagcaa tttgtaatgaggagggggtcagaa 55 codominant 6a 49.6 262 260AFA09F01 + (AC)11(AT)3 ttggcaatgaaaagacacgaggta ccttccttttgtttctgtcgtgct 55 codominant 1b 39.4 170 180
AFA09F08 (AC)3gc(AC)11at(AC)3aa(AC)8 gggaacatgtgcaataagacattg aataatgtgcaacaaaaattaacggtatta 55 codominant 3a 137.0 280 270AFA10A08 (TG)11 gtttagggcgtaaaatctaaacgct gtgcttttgactaacctcgcatcc 55 codominant X 46.6 294 296AFA10B06 + (AC)15(TC)6 ccgcaaactggactaactgtacaaa ggcagaatagcccaagtgttttca 55 codominant 1c 0.0 294 296+302AFA10C07 + (AC)22a(TA)7 caacattgcaaacatgtcacaca gcactgagtttgcgttgagcta 55 codominant X 11.5 247+261 249AFA10E04 + (AC)6aa(AC)7agaga(CAGA)3caa
aga(TA)7
gaaggaacttattgctgtgtgcga ggtctctcctatctgcctctgagc 55 codominant 7b 68.8 216 218
AFA10E05 + (TG)10t(TG)3 gctttgatgtgctgatgtttatgagg catatgtatgaacatacgcacgc 55 codominant 8 228.0 284 282AFA10G11 * + (TG)9(TA)3tgttttactacatcatg(TA)3 ttggttgatggtcatctccatttg agtgcagcataaccaaattgtcca 55 codominant 1b 121.5 150 160AFA10H07 (TG)12 tacgatacgcgcaacctactcaag gaatgtgtcttggtccatgaggg 55 codominant 2a 201.0 120 110AFA11B05 (TA)6(TG)16ttgtggattggc(AT)3 ctcggtccaactttggagttatcg tatggatataacggggactggctg 55 codominant 3a 61.3 250 240AFA11C12 + (AC)4tga(TA)5(TG)7tt(TG)3ta
(TG)3ta(TG)5tata(TG)8tatc(TATG)3tattatat(AC)4atacatacgtatgtgtatg(TA)3a(TA)3
gggttcgagtctccaagacatca caaggggacttgatcttgccctat 55 codominant 4a 49.5 296 282
AFA11E12 + (AC)5tcttc(AC)12 gctggacggacttctgtatgcttt cgaccttaagtcataaacgtggtaa 55 codominant 8 150.0 158 160AFA11H10 + (TG)11ttcgcgcatg(TA)3 atcttttgtgtgttgtcaccgcat gcaaagtgcaaagcaactcaacat 55 codominant 4b 16.2 230 260AFA14A02 + (TG)12(TA)3 aaagtggacgtaggcacattctgg tagccgtgggtttgaagagaaaaa 55 codominant 1b 77.4 250+260 260AFA14C07 + (AT)3(AC)11a(CT)3 atgtcgcaaccctataccagtcct actttcaatagattcgaaggggg 55 codominant 6a 0.0 182 190AFA14E06 + (AC)3attcatcc(AC)10 cacaacatgctgctccagatcttact tgaagatagcaccgtttgagagagtg 55 codominant 3a 61.3 209 217AFA14G03 (TG)12 ctccatgaatgggaggtcttctgt gtttttccaaaaggattcacacgc 55 codominant 5 49.5 216 222AFA15D06 + (TA)3ca(TG)9tatgg(TG)9 tctaagtcccgatgggctttttct tttcctagtgtggttgcatatgttc 55 codominant 8 33.6 236 252AFA15D09 + (AC)11 cgtagaacaaacgcattgactagaa caccggtggggtaaactcattaga 55 codominant 4b 91.4 161 169AFA15E08 + (TG)8tattg(TA)3 tgagaagtgtgtgtaaggcaaggc gccccaaagtcatactgctggtag 55 codominant 7b 109.3 240 245AFA15G07 + (AC)7aaaa(AC)8 agagcgagaacaatagtggaggga aacgaatacctaaggaagggtaacg 55 codominant 4a 33.2 214 222
Product size (bp) Marker name a) Core repeats Forward primer
sequence (5'-3')Reverse primersequence (5'-3')
Annealingtemperature
(°C)Segregation in F2
Linkagegroup
Mapposition
(cM)

86
Table 3-1 (continued)
in D1s-15s-10s
in J1s-14s-23s
AFA16C06 + (TG)18 ggagctctggaacgttcgaactaa attgtcaaaatcaagccacggaag 55 codominant 3b 69.0 220 230AFA16D05 + (AC)12(AT)5 aattcacccataacttccgctacg gtgcaacactactgacctcgcatt 55 codominant 7a 91.4 200 190AFA17A05 + (TG)22 ttccatcaattacactgccagcac tgctgaacttggtatgttgatactcca 55 codominant 8 216.5 151, 161 b) 151, 183 b)
AFA18C03 (AC)5(TC)5(AC)9tatacatataaat(AC)6agag(AC)9(AT)4t(AG)5
aatttgtgtccaaatggtcatccc cacctgcatgggcactttaatttt 55 codominant 2a 122.6 270 280
AFA18C11 (AC)13(AT)8 aacgacagaaatttcggcgagtta tagggtcatgcactattatgcggg 55 J-dominant 8 42.3 220 220+280AFA18G01 (TG)4tatg(TC)3(TG)13 aaaattttccccattaacctgcaac tgagttcatgtttgttataaacttccctacc 55 codominant 3a 144.9 152 146
AFA23B03 + (TG)13 attgaaactggctaggatgaaatcg tgctatgattaattagacgcattccaa 55 J_dominant 3a 72.4 240 200AFA23C12 (AC)20 aaactgatcaaaatgtgccccact gagaatccgattaaaaacgagcaag 55 codominant 1a 108.5 146 126AFA23D09 (AC)4aagc(AC)8(AT)7 ttggcattggctttgataacacac ggatcgatagtgtacgagacagcg 55 codominant 3b 84.0 164 162AFA23D12 (AC)4gc(AC)13(AT)8 cggtgcagagttacgtatatgagcg gggatgggttagaacaatgtttgg 55 codominant 2b 38.0 310 296
AFAA00A02 (CA)5atacat(AC)4atacatgc(AT)3
gt(AC)6
acagagttttcatacttaaaggatttttgg gtttcgatagaaaaatgcatagttggaaatg 55 codominant 1a 207.3 220 210
AFAA01D09 (TC)6(AC)6 gccataatggagcatccaaaaact aaagcaacttgcatcgtacgtcat 55 codominant 2a 235.2 120 128AFAA02D08 * + (TG)10(TA)6(TGTA)2tgcatgta(TG)7 ctatggccaagttccattttgagc tatttttacagcaacggagcagca 55 codominant 1a 90.2 179 171AFAA02H04 + (TC)24 tgataggtgggaagtttgtctga tgacagcgttattatttaaagggagt 55 codominant 2a 80.0 130 180AFAA03F01 + (AC)8 cgactttgtttctcgctcttggtt aaattgcacaaggctctgcgagat 55 codominant 7a 20.0 231 235AFAA04D06 (AC)4aaaaatattaatacaaacc
(AC)4agat(AC)4gcatgc(AC)4tcat(AC)14(AT)11
ttattagccatgatcaacacacacaaaaa agattcaagcagagtcaaggtattcaatg 55 codominant 3a 44.6 260 270
AFAA05B02 + (AC)10(AT)11(AC)8a(TA)3
cacaa(AC)9(AT)9cg(TA)5
agag(TG)4
cgtaaagttatccatacaatgccca ggaccagttatccatacgtacaca 55 codominant 4b 0.0 300 310
AFAA05B05 (TA)5(TG)23tt(TA)3 gggtattagtcaggcgaaaaatctg tagcgtattacattctcccctcctt 55 codominant 2b 23.1 170 190AFAA05H04 (TA)4ggtgtactag(TG)9 aagttatagaaaacattgtgaactctttagtg gcctccctccacctcatc 55 codominant 8 140.7 280 260AFAT00A06 + (GT)9(AT)5 gtgtgtgtatgggagtgcgtgt ctcccgtggctcaattctgata 55 codominant 4a 9.0 172 178
AFAT00B05 + (AT)3ctatgctaaccttctctaaagtacaac(TA)6tttcgtgtatc(TG)12
tgtccactattcacggcttactca gatgggtctgcctcctccttattt 55 codominant 2a 140.1 202+204 202
AFAT00C07 + (TG)5cgtgagtgc(GT)4t(TA)4 aagcacatcgcctagaatagcacc attctcaacatttggagtcagccc 55 J_dominant 2b 21.5 105 129AFAT01B01 (AT)3(AC)11 aaagtaaggtatggcatcagatatgataag actcgatgcgaccatttatacctt 55 codominant 6b 12.7 174 166AFAT01F03 + (AC)11at(AG)9aatt(AC)3gcg(CA)3
tgcatgcacg(CA)3att(AC)6
tgacatagacccttttgtaggaggaaa tgcatacatacatacatacgcatatacatacaa 55 codominant 8 212.3 210 200
AFAT02E05 + (AC)8(AT)7 attgtgaaaatgaaacttgtataacattgg caattgtacatcatttacgctagtttacag 55 codominant 7b 58.0 240 210AFAT02H05 + (AC)12tg(AT)4 tctcgtaccagtttctcctttttcc gattcggatcaatacagggaatgc 55 codominant 4a 58.6 296 290+302AFAT03F07 + (AC)8(AT)6 gtaacgtgtggttgaaaatgcgag tggtgctaaataagggagactacgga 55 codominant 7b 47.8 130 170AFAT03G10 + (TA)8(TGTA)4(TG)7tatgta(TG)6 gtttaggataccaatgaatgctcca cgcggatatagacaaatatcagataaca 55 codominant 6c 0.0 340 300AFAT04B03 (TA)7(TG)22 tttttcatttcagcataaagtaattttcta ataacaacggtaaccaacgctctaa 55 codominant 2a 154.4 240 260AFAT04C08 + (AG)14(TG)6tatc(TG)5tctgtg
(TATG)2ta(TATG)2tag(TG)5
tggtaccataaacctcgaaccaatg catattcaagggaatgccacatgc 55 codominant 7b 55.0 150 180
AFAT04D12 (AC)10(AT)7 gcgtgtacatacacacattcatacata aatattttccattaattatacatcacaatcg 55 J_dominant 3a 71.6 280 270AFAT04E09 + (TG)8(TA)3tgtttgtc(TG)5tttgt
ccg(TG)4tttgtcc(GT)3
gaagccttttgcgaagcatatgta tggataagtagaaaacaaactgacccg 55 codominant 4b 32.9 280 270
AFAT04G06 (AT)4(AC)11(GT)4 tacttgggtagtcatctgggaacg ccgaccattcttacttctgcatcc 55 codominant 3a 21.1 120 160AFAT05A03 (TA)7(TG)7ta(TG)4gaaacattcccta
ttaca(TC)5cg(TG)12
taatgcatgaacgctgtatagcatatt gagtaaaatatgagaagaaacatctatgtgc 55 codominant 8 187.7 300 250
AFAT05D09 (AC)12 ccggataaatttacctgcaaatcc cagccattaaagaacctgatgtaag 55 codominant 4a 105.4 308 298AFAT05E04 + (TA)3tg(TA)3tctctgtgtctgtg(TC)3
(TG)8ggggggtgtg(GT)3(TG)5
tgttatttgaggtgaagcagcaaga ccatttttgatgtggagcaaaacc 55 codominant 8 202.1 190 200
AFAT05F03 (CA)4g(AT)9 ggtcagtgggtttatctacgaaaagg tcaatctaaccgtcccctaatcca 55 codominant 2a 176.4 225 217AFAT05G01 + (TG)3ctatgtgcacgtg(TA)4attgc
(GT)3a(TA)3ag(TG)4cgttc(GT)3
atatca(GT)3(AT)3gacagatt(TG)3
c(GT)3agtatacctgtatgttag(TG)4
cgtgagtgtaattt(TG)5ttgc(GT)3
cgtgtgttgcagtgtttgtgtatg ccactacaccgcacatccctatatc 55 codominant 8 204.2 294 308
AFAT05H05 + (AC)11(AT)6(AG)3 aaatataaattattcattgctttctatggttag aacttcctttgaaaactgcttttg 55 codominant 4a 0.0 114 134AFAT06D06 (TG)8tttgtatacgtatg(TA)4tcta(TG)5
(TATG)2(TA)4tgtatc(TA)4tgtacgtata(TG)5ta(TG)4
caatgaaggtaaagttgggtggt ttaaaaataagggttgatcttaattatcacat 55 codominant 2a 209.3 273 261
AFAT06D09 (TA)9(TG)8gg(TG)6 taggcctcaagataggggtggttt tcgacttgactccacctaccacac 55 codominant 8 65.9 180 210AFAT09E05 + (TG)11 aactgcgagtaatttctcaacaactgc ggaggaaaatctctactcccagcatc 55 codominant 4b 36.9 240 240+250AFAT10C04 (TA)6(TG)13a(TA)4(TG)5 ctggatgtttgtgaccatttttgg tcgatagatatgcgggttgttacat 55 J_dominant 3a 74.6 230 230+280AFAT10E06 (TG)9 tcggcctaaatgaaagaaagggtt tgctttactcaaaatctcgttgcc 55 J_dominant 3b 0.0 170 180AFAT11A03 (TA)4(TG)9 cttgtcctatatgtattgaatgttgtccaaa cggaatattttggtgtgcatgtgt 55 codominant 3a 74.6 210 190AFAT13F12 (AC)15(AT)7c(TG)5 aaaatttcatttgtaggatttcatttgttt tgtttgttatcatcaaataggagagattgt 55 codominant 3a 154.6 220 240AFB01A02 (TG)3aaca(TA)9(TG)17(AG)7 aacaggacatgcacacaagtggtt caattcaatctgcacctggttgtc 55 codominant 2a 95.3 200 250AFB01B03 + (AG)11 gattgcattcgatttcgttgagtg cagcacacttcgtttggatttcag 55 codominant 1a 161.2 200 204+220AFB01C03 + (TC)14ttttaagtatttgtaggagta
ggc(AT)3
gtttagccgatacctcaccctcct gctcgatgatccctattagcatgg 55 codominant 4a 45.0 115 130
AFB01G10 + (TC)29 tccgaaatccttggaactggttta aagtagactattatcgtcgccgtatc 55 codominant 3b 119.1 95 120
AFB02C01 + (AG)17ggaaagtagagtgaagctcc(GA)3
tccataggtggatgggttatgtcc aacaaatcccggctggagaataat 55 codominant 4b 74.9 160 180
AFB02C10 (AG)3gagtgg(AG)5 gataattgcatgaaggggttagcg atccctggatacaatccaatccct 55 codominant X 95.1 310 300AFB02G04 + (TC)18 acacgttacagtgggcagaaacaa gcagagggtggattagtcatttgg 55 codominant 7a 52.1 170 175AFB03B09 + (AG)7gg(AG)4aa(AG)20 atcagcatacgaatcatcctgcaa agattctcattcccggttcgtttt 55 codominant 4a 70.4 220 270AFB03E09 + (TC)27 tgactgcacttagactcattcgcc tgtgctaggaagaaatgtgcactca 55 codominant 4a 46.3 170 144AFB04A09 + (AG)3aaagagaa(AG)13 actagagtcattgcgagacggagg tattttgttgagcggaagtcagca 55 codominant 3a 78.1 272 260AFB04B08 (AG)13 agaattcgtgggatgtgaagtggt attcctcttcagtcatggcgactc 55 codominant 1a 125.1 170+175 165AFB04B12 + (AC)6(TC)15 ctagacttgaggggaggatgggtt ggagagggcaacatgcatttttag 55 codominant 3b 24.5 235 233+243AFB04C03 (CAA)4aacaaaataaccaaaaaa
c(AG)21(TG)8
ctaaaacccttcatcgtatgccca gagtgctcctggtgaatctccttc 55 codominant 2a 169.1 230 260
AFB04H04 + (TC)3ctcc(CT)3t(TC)7 cgcaacacaaaagataacgtctcg agacttcgacgtagagtccgatgg 55 codominant 7a 34.5 300 290
AFB05D11 + (TC)3cttatcccttctcaacgctgctt(TC)3
cttcttacatgacgtcgcc(TC)13
ttctcacatgtatgctttg(CT)3
acttttgataacccacccagtcca ggttccagcgatgaccaattttt 55 codominant 6a 27.3 290 295
AFB05E06 (AG)4aaag(AGA)3gggagaagatgcgggaaatgatga(CGA)3
aagcgaaggagatgaaggaagagg acatcaccaattggcggtaaactt 55 codominant 8 70.6 301 299
AFB05H03 (AG)8 catgccaattcttattcaccccat ccctatcgatgaattcttttagctc 55 codominant 2a 92.1 290 260AFB05H09 + (AG)17(CG)5 gcgagcgtatcccctaagaagaat ttggtccctagatttcactgcaca 55 codominant 3a 121.8 268 272AFB06C08 + (AG)3gg(AG)18 cgcacaaaacatatagggagaggg tctccgtaagaagacctgcactca 55 codominant 1a 120.7 164 146AFB06E05 + (TC)13 tttgaattggcagagacaatggtg tgtatggaggaagggctgaaagag 55 codominant 1b 99.9 142 151
AFB08 + (GA)13(GT)7 ttacgtggagacaaaatgaaag cagggaacaatgactatttgg 55 codominant 1b 72.9 135 131AFB09D06 + (TC)20 caggacactcatgtggcttgtctt tcgagagaatttgtgtggaggatt 55 codominant 2a 38.8 270 310AFB13G10 + (AG)17 aaaaggtaaaggaggcgtgtaggc atctgccgggattgatttcctact 55 codominant 2b 51.1 220 240
Product size (bp)Annealingtemperature
(°C)Segregation in F2
Linkagegroup
Mapposition
(cM)
Marker name a) Core repeats Forward primer
sequence (5'-3')Reverse primersequence (5'-3')

87
Table 3-1 (continued)
in D1s-15s-10s
in J1s-14s-23s
AFB14B08 + (TA)8cat(AC)4 gcgagcagtgttgatgtgtgtgta agaaatgcgatggaggagaatgag 55 codominant 6b 24.2 290 316
AFB15A03 (TC)5ttt(TC)3tg(CT)8 tcttttacggtcggttcagtggtt agaagataggcagcaatctctccg 55 codominant 7b 89.4 149 153AFB17G02 (AG)7aa(AG)3aaaga(AG)3 tgctaaggagaggtgaaggaggaa atggattcccttgggcatttg 55 codominant 3a 49.3 158 150AFB20G05 * + (TC)10a(CT)3 ttccacaccgtaatccaactcctt attaaaatgagcgttgttggctcg 55 codominant 6a 114.1 105 107
AFB221 (CT)9at(CT)8 gacaggttgtgtgattgtgtg gaccgatgtaggatgattgtt 55 J_dominant 1b 84.5 140 160AFB22H06 + (AG)15 gatgtcgcgatttactatggaggc aaaacctacctgccacccaaactt 55 J_dominant 6a 68.1 150 170
AFB237 + (CA)3tgt(GA)16 aggcgtagcataagggtg gtgtgcgtgagtgactgtg 55 codominant 7a 79.7 120 135AFB23G02 (AG)13aa(AC)3 aagcaaagatcatagcccgagatg gttgcaaaggtaatcggtaacaaag 55 codominant 8 23.5 210 230AFB25H01 (AG)7 aaaggtagttgtggtgggcagtgt tgtcactcctctccttccatttcc 55 codominant 7a 0.0 220 200
AFB277 + (CT)15 aggtggatgggttatgtcc tccttttcacactctttcttcc 55 codominant 4b 76.9 98 114AFC01E09 + (TCT)7 cccttttgttcgacaagatttcca caagacagcgatgacaaggaagaa 55 codominant 7a 110.6 140 146
AFC03A09 + (GAA)7 gtggtagaggaaggagacgatgga tcaggggatgtttccctgtatgat 55 codominant 8 75.3 175 170AFC03F10 + (TCT)3tcg(TCT)6(CT)3 agttcttgatcgcttagagggctg gaaggcacaatgtatgcttcgcta 55 codominant 3a 35.6 190 180AFC03G02 + (TCT)9 tcatctccctcttgtctgatgtcg tccgatgaagttcgagtagaaggg 55 codominant 3b 116.9 164 168AFC08G05 + (GA)3a(GAA)11aa(AGA)3 gttaaaggcccattgggtatgaca gaagttcgatgccttcatgtctca 55 codominant 2b 26.2 290 293AFC09D10 (GAA)8 gatgggtgtcagcgttgttaagtg tcatttccccgagtctttctcttg 55 codominant 4a 130.7 200 200+220
AFC12 + (TTC)8 tgcgattgtgagattttgt ccagcgtttggatagttg 50 codominant 2a 109.5 233 236AFC12A06 + (TCT)7 acgacatattttgatacggttttgagc gaataactttagcataacttcgacgcatt 55 codominant 6c 20.8 214 208AFD02A12 (GCT)8 gatcagggttacggtgaagaggc tcaaataactcaatgtcggcgaag 55 codominant 3a 42.2 100 100+115
AFHT11E07 (AG)8(TG)10(AG)8cgtacttgt(TA)3ttttcattttcaaaac(TA)3
ttattatatt(TA)4
aggtgagcttaggttgcgttgttt caagtagtacccgttggtgcagtg 55 J_dominant 1b 26.0 200 200+220
AFHT11F10 (TG)4catgcatgtttcaa(TA)7(TG)9 gcaaaggaagaagtttttgtgcgt gctctttcttcctcttcagggtcc 55 codominant 3a 110.4 310 300
AFRA00B10 * + (TA)8(TG)9ttcatgcatg(TA)3 ttgaatcatgcctgctgtcacata tagaccacaaccgaatgcacaact 55 codominant 2a 133.3 205+213 201AFRA01B05 + (TG)5tt(TG)6 caaagacccaaaggaaaaagaccc ttgaagtggattgaatgtagggac 55 codominant 1a 101.6 212 210AFRA01G07 + (AC)13(AT)4taaatacttatac
ac(AT)3t(TA)3atgataa(AT)3
ggtttggtggtagatcatctcggt catgcacatgagcaggtagtgaaa 55 codominant 1a 39.7 240 230
AFRA03E08 + (CG)3agcgtg(CA)11(TA)5 caacccactcatactcatgaaatagca gcgggtatctaagtgtgttaggcg 55 codominant 1b 22.7 200 190AFRA03F03 (AC)10(AT)4 gacgagggcaagaaagtatggttg tgaagacaaagtggctcagtgtcc 55 codominant X 62.8 220 220+230AFRA04B10 + (TG)5cagttgta(TG)8cgcgtgcat
(GCGT)2gtgcatgc(GT)3atgtgctac(TG)3ca(TG)4cagttgtgta(TG)5catagttgta(TG)7
gtgagtgtgcagttttgtgagggt gtgcgcaggtccatctgtaaaaa 55 codominant 6b 33.1 284 296
AFRA04D09 (TG)3tatgtgtatctaca(TG)3ca(TG)7tatatttatatgtatg(TA)3
ctagcggggaatttatcctggttc cgatacgcccaacttactcgactt 55 codominant 4b 26.4 147 151
AFRA04F03 + (AC)4(gc)3(AC)3atacat(AC)7(AT)6 accgacttttcacatttgctccat ccattacggaaggcaataaagaacc 55 codominant 1a 60.4 250 220AFRA04F12 + (TG)4atgcgtgcga(TG)3cga
(TG)4a(TG)3
tgaggctcaggtgtagactcggtt ctgcctcacaaatcacactcaaca 55 codominant 1a 192.5 300 306
AFRA07E10 + (TC)9 cagaactagacggtttgggaggaa agctcatattttgaagctcgcagg 55 codominant 4a 40.3 172 178
AFRA11F11 * (CT)3atggtttttaagcatcatatacat(AC)5(AT)4(AC)4ata(TACA)2
(TA)5t(AC)9
ccgccattagtgagagactacgtg gggcaaacggttacatatagccaa 55 codominant 2a 304.7 220 200
AFRA11H08 (TG)16 gatggggagttttgttctgttttct atgcacatgaacacacttccattt 55 codominant 2a 174.2 101 115AFRA12E05 (TA)6(TG)15 aaaagtcaatgccaagcccatcta gatttcctttgtgatattcgacgtg 55 codominant 3b 120.5 280 285AFRT01F02 + (CG)3(CA)6 acgaggcataggtggatgaggtta cagccaactcgtcataggaacgata 55 codominant 7a 73.0 222 220AFRT01G11 + (AGA)4(GA)15 agtgatgatttctaggggtgtggg ctggaaccaccaccatacacaaaa 55 codominant 6a 72.6 254 260AFRT01H05 + (TG)6agtgta(TATG)2ca(TG)4
acagtgtatgtgcaag(TG)10tatgtgcatgtgagtgta(TG)3tatgtaattactcatcccgatcctcg(CT)3
taatggatggcattagatgcaacg ctcttccacctccatccaatgagt 55 codominant 8 206.3 420 270
AFRT08C02 + (AC)8(AT)7 catccttaacttcaattctatgggg tttatccaaattacggctttgggc 55 codominant 6a 61.1 200 204AFS006 * + (AC)13(AT)6 gtgaccttatgtaggggttaggatt tcgctccattcaaattaaaaa 55 codominant 3b 61.2 296 300AFS008 * + (AC)6at(AC)6 ggttatgaatactagcggggatag atcagaacaacattctgctgacta 50 codominant 8 47.8 254 256AFS012 * + (AC)13 attgagaattggaaatatgaccgtt ggtgttcatttttgggtttctaagt 50 codominant 2a 164.7 200 190
AFS015 * + (TA)4tgtatg(TA)6tg(TA)5tgtg(TA)6tg(TA)3
atctcactgtccttgtacctgaaag catcttgactttgtgatatttgtgc 50 codominant 1a 32.7 358 328
AFS017 + (TC)5catctctttac(TC)15 tgaacttttatttatgcttcttcctc atggaggacgaaggtgggtt 50 codominant 8 109.3 233 261AFS039 * + (AT)8 cgggtaataacggatatcataaaca cagttgttacatgtggtatcagagc 50 codominant 6a 122.7 292 288AFS042 (AC)9(AT)7 atgcttaaatcatcaacacacacac accatttttaatctcaagggaagat 50 codominant 3b 58.5 253 251AFS054 * + (AT)12(AC)8 tttttgcctagaacagaagcaga ggtatagaggtggggcgtca 50 J_dominant 8 79.9 238 232AFS058 * + (AC)8(AT)6 tggactgaggtgaaaggatgg accttttccattgcgtttgg 55 codominant 7b 61.3 193 193+197AFS088 * + (TG)10 tatcttcgagcacggttcttcttgt atggcttcgatgatggatagttgta 50 codominant 8 92.8 157 167AFS096 (CA)12(CT)3 ccaagtattgggtggtcaaagtaca tcacaagagagtgtgtgtgtgtgtg 50 codominant 8 39.0 161 165AFS099 * + (AC)13(AT)8cacacttata(AT)3 tgcccctcattaataacaacatgac ttaatcgcattgacaaagtttattt 50 codominant 1b 53.5 243 229AFS101 * (AC)5atat(AC)9atatacag(AT)3 atcacacacacacatatacacacac agcgaccatatatagccttgcctta 50 codominant 8 52.4 124 128AFS104 * + (AT)3(AC)7 tcaaggaaacacgtatgccact tcgcccttttagattcatttcc 50 codominant 3a 52.5 210 216
AFS105 * (AC)3aa(AC)10 tttcgttgcaaacatttacacacac gtggagtttacttccccaaatgaag 50 codominant 1a 77.0 289 273AFS109 * (TG)3tt(TG)7 cctatgtctttacctatccaaccaaca ccgaatttcaagtgtgtcaagtttt 50 codominant X 70.7 197 195AFS111 * + (AT)3gtgtctcta(TG)8 tgtttaatggactttcaatgcctgt gcattaaaatgaagaaatcccgaag 50 codominant 2b 0.0 228 230AFS117 * + (AC)4gc(AC)4 attccaaatgagattccttctttcg ttgtactgaccatagtgttccatcg 50 codominant 4b 46.9 290 270AFS123 * + (AT)3(TA)4(AT)3ttatacataca
(TG)9tc(TA)9ttgtaaca(TA)3
tctccagatttttcctaagctct tgggatttacatcgcaacat 50 codominant 1b 43.3 387 397
AFS131 * + (AC)8 caacaaatcagagagaaacagatga actgtatatttatgtatcactccatgtaaa 50 codominant X 75.8 161 163AFS140 * + (TA)3ca(AC)12(AT)6g(CA)3 cgtagcggatggtcacaaga tggacctggaggcctagact 50 codominant 7b 77.7 219 199AFS142 * + (AC)3aa(AC)11(AT)5gt(TA)8 tgagagaattaatattattggaggcctat ataaaatgacaaccaacccatgtta 50 codominant 1a 133.3 246 244AFS145 * + (AC)9 acccttgggataagtggtttattga ggtcatgagtaattcaccgaacatt 55 J_dominant 3b 67.7 210 216
AFS149 * + (AC)11(AT)7ttcacttgtaca(TA)3 aaccaattgattacctctcatctgc tgcggaccttccatagtctgtataa 50 codominant 4a 76.2 202 204AFS156 + (AG)13 tcatatgcatgtccataatccgata tttataaatagaccccgagcgaaaa 55 codominant 4a 146.1 214 216AFS221 + (TG)9 ttggtctaataagtcctcgaaaatg gatctgtgcatttcgactaacaata 50 codominant 7b 74.4 246 242
a) Used for assignment of chromosomal location in A. cepa (*) and A. fistulosum (+). b) Amplified at two loci.
Marker name a) Core repeats Forward primer
sequence (5'-3')Reverse primersequence (5'-3')
Product size (bp)Annealingtemperature
(°C)Segregation in F2
Linkagegroup
Mapposition
(cM)

88
Table 3-2 Primer sequences of 17 bulb onion SSR markers located on bunching onion (Allium fistulosum ) map
D1s-15s-10s
J1s-14s-23s
ACE010* EST CF436768 (AC)8(GC)6tgc(GT)4 atgtaccacatggatgaaaaacaca ggtagctgaagcaaatcaagcaa 55 codominant 5 17.7 167 169 this study
ACE020 EST CF439232 (AT)3(AC)3at(AC)4 agtggtcatggttgtcttgctt tgcacaagtacacagcgacaaac 55 codominant 2a 0.0 200 210 this studyACE039* EST CF442638 (GC)4(AC)4(TC)3t
(AC) gtgca(TG)atggtcgtccatttcttattgaagt ttgatgtatgaggcagcattctactg 55 codominant 4b 61.6 273 275 this study
ACE044* EST CF436576 (CGT)7 atgtacgcagaatctcgtcctttt ttcaaattcttttgctgatgggttc 55 codominant 3a 0.0 186 187 this study
ACE080 EST TC1121 (TA)22 aggattaaaatgggagaaagagat ttgagaataagaagccgcttga 45 codominant 1a 97.1 300 250 this study
ACE087 EST CF449129 (TA)31 aggccacatctgattatgcttttcc tcccggaatcttgaatagaagaca 50 codominant 4a 15.6 250 258 this study
ACE088 EST TC2278 (TA)33 atttatagccatcattcttttt gggatatctagtattgcatgtctgc 55 J_dominant 6a 103.7 220 250 this studyACE101* EST CF437209 (TAA)3c(TA)5, (TC)6 tttaacaggtctccctcttctcccc agggggtactttcatcactccgtt 55 codominant 2b 16.8 190 182 this study
ACE111* EST CF440609 (TCA)14 acttggatgtagaaacttcacaacatt ttgacctaacaaatatagtcccacaaa 50 codominant 2a 121.0 270 260 this study
ACE113+ EST TC839 (TCA)6 atcagacctcggacaatcaaaccttc tcgagaacaagcatccaacaattcca 55 codominant 7b 71.8 200 196 this studyACE127 EST TC1106 (TG)4tatg(TA)6tgtgg
(TG) (TA)tcgagacgagcacgcatgaaaa agctccattgtccgttccatt 55 codominant 5 27.9 292 296 this study
ACM005 EST BI095610 (ACA)5 cgcttcagcagtgagttgtt tgttgtccgatacagagttgct 55 codominant 4a 52.7 205 201 Kuhl et al . 2004
ACM024* EST CF446873 (GCA)10 ccccattttcttcattttctca tgctgttgctgttgttgttg 50 codominant 2a 180.4 95 105 Kuhl et al . 2004
ACM071* EST CF449595 (AG)10 tctcatttcaactttctacctatcc ctgacatttgctcgactgga 55 codominant 5 0.0 170 160 Kuhl et al . 2004
ACM096+ EST CF446191 (CTA)5 gtgggcaattcacgttatgtgtgt agttccaagcaccaaaagaagcac 55 codominant 6a 54.4 275 271 Kuhl et al . 2004
ACM154* EST TC387 (GAA)8 cttgttttggcagttgggat cgatgaatacaccgatgacg 55 codominant 1a 68.9 210 220 Martin et al . 2005AMS14* genomic (CA)28(TA)4 cccctgagtaaattcaaaatcc tccttagtataatttcggggtaac 50 codominant 2a 52.7 150 154 Fischer and Backmann 2000
a) Used for assignment of chromosomal location in A. cepa (*) and A. fistulosum (+).
Product size (bp) inReported in
Mapposition
(cM)
Linkagegroup
Segregationin F2
Annealingtemperature
(°C)
Reverse primersequence (5'-3')
Forward primersequence (5'-3') Core repeats
Marker name a) Origin Accession No.

89
Table 3-3 Primer sequences of 25 InDel, CAPS and dCAPS markers located on bunching onion (Allium fistulosum ) map
D1s-15s-10s J1s-14s-23s
ACAAJ79_InDel* InDel CF434863 tgacaccacttttcctcgtttg cttaaagtcttcttcgcttggc 55 codominant 3b 73.4 - - 870 627 Kuhl et al . 2004
ACAAX07_InDel InDel CF447127 tgagttggtgatttcagccacggaga gcatgtgccccgtgctatatttgttg 50 D_dominant 6a 75.9 - - 710 780 Martin et al. 2005
TC0678_InDel InDel ACADO41/CF447640 tgcaatcgccaactattcttca aaaatggagtgcaccatctgc 50 codominant 2a 160.6 - - 95 87 this study
TC1952_InDel InDel CF450835/CF447545 aatgcaaccaatgatgttgct cccttcggagaatattgcttt 55 codominant 2a 277.5 - - 280 450 this studyACABO23 CAPS CF448968 ccgagatcaccgccgtcaccttccgc tcgacatattcccatagttcctcaaa 55 codominant 2a 245.3 384 Hae III 151+89+65+
40+26+8+5151+91+89+40+8+5
Martin et al . 2005
ACACG83 CAPS CF436477 tacatcaccgacaaaggcggaagg gacccaaccgttatatcgaagctg 55 codominant 4a 66.0 520 Alu I 185+170+125+40 185+125+115+55+40
Martin et al. 2005
ACACU34* CAPS CF449808 gtcagacttggtgatgttgtatctgtcc ccacttcatccaacctatcttcatcc 55 codominant 4a 113.0 685 Ssp I 685 503+182 Kuhl et al . 2004
ACADR60* CAPS CF437227 gtaaccaaggttgatgagccctcc gcatccttctcctatcttcgcact 55 codominant 2a 147.7 396 Taq I 249+69+66+12 249+81+65 Martin et al . 2005
ACC006* CAPS AF255795 acagtaaaggaaccgggctt tggcacagttccaattaagaca 55 codominant 1a 63.8 626 Mbo I 425+324 425+151+122+61 Wako et al . 2002b
ACC008* CAPS AF218356 agtacacaggacattccggc aaaaagcacaccactttggg 50 codominant 2b 12.5 493 Hsp 92II 410+202 342+202+68 Wako et al . 2002b
ACC013* CAPS AA451549 cgtgacaccacaattatcgc ctcacgtggatcccagctat 55 codominant 3b 111.3 721 Acc II 453+196 649 Ohara et al. 2005
ACC015* CAPS ALCLECTINA caggccaatccctagtcgta gcgcttaaggccacatacat 50 codominant 1c 13.8 388 Mse I 388 289+99 Wako et al . 2002b
ACC018* CAPS ACY13373 ttcgtccgatctcctgttgt gacaaaggatccccctgc 50 codominant 1a 0.0 402 Hsp 92II 251+139 139+139+65+45 Wako et al . 2002b
ACC033* CAPS AA451560 gactgtacgcaggccaatc acggcagtgacattctgattc 55 codominant 1b 90.8 399 Fok I 334+65 184+99+66 Wako et al . 2002b
ACC043* CAPS AJ006067 atgcaggtgtttctgataagacttc ataaaactttccccagtcatacctc 55 codominant 3a 59.2 919 Bcn I 376+171+90 376+108+90 Wako et al . 2002b
AOB272* CAPS AA451592 gcatttgcattggcttttgttgt gcaaagcaaggaacagcaacact 55 D_dominant 2a 223.2 850 Sca I 638+212 850 Gökçe et al . 2002TC1010* CAPS CF440857/CF449499 attggagaatgagcttgcaga agaccatcgagctttgtttga 55 codominant 6a 76.9 921 Tsp 509I 195+193+154+149
+67+53+52195+160+154+149
+67+53+52+33this study
TC1891 CAPS CF447415/CF434904 ccgagatcaccgccgtcaccttccgc tcgacatattcccatagttcctcaaa 55 J_dominant 2a 242.5 437 Hae III 151+98+91+39+5 151+98+65+53+5 Kuhl et al . 2004
TC2566 CAPS CF447326 ccgttccaatttaccaag atcatcccaatgctcata 55 codominant 3a 30.9 259 Hpy CH4IV 194+65 259 Kuhl et al . 2004
TC3133 CAPS CF441621/BQ579911 gcatctcaatctcgacttcca acacgaacgagaaacaagctc 58 codominant 2a 210.0 832 Msp I 472+260+100 732+100 this study
TC3164* CAPS CF449495 tagaggtggaactgttgg ttggtgaaataggtggat 55 codominant 7b 41.6 184 Hsp 92II 108+76 184 Kuhl et al . 2004
ACAEK46_dCAPS* dCAPS CF451695 atgcgatgtttgaagtatgtacaatgatt gcattgctttttggatctcagg 55 codominant 8 85.1 170 Hin fI 105+32+33 137+33 this study
ACAER72_dCAPS dCAPS CF452432 ctccagctatccattcaagctct gtttgaaaagtttatggtcgtaattaagc 55 codominant 8 123.0 173 Alu I 126+28+13+6 154+13+6 this study
CF439394_dCAPS* dCAPS CF439394 tggtatttcatcatccatttgtcc tgcaacttatatatgctcatttttattttcg 50 codominant 7b 0.0 165 Taq I 135+30 165 this study
TC2026_dCAPS dCAPS CF445209 ttttaatttgatccaaatttcccg atgaatgcaagaggcggttt 55 codominant 3a 25.8 150 Msp I 128+22 150 this study a) Used for assignment of chromosomal location in A. cepa (*).
Map position(cM)
Fragment sizes (bp) after digection inRestructionenzyme Reported in
Product sizein A.
fistulosum
Linkagegroup
Segregationin F2
Annealingtemperature
(°C)
Reverse primer sequence (5'-3')
Forward primer sequence (5'-3')Accession No.Marker
typeMarker name a)

90
%
Bunching onion Genomic SSR 1,722 1,406 81.6 398 28.3 259 AFA, AFAA,
AFAT,AFB,AFC, AFD,
AFHT, AFRA,AFRT, AFS
213
Bulb onion
Genomic SSR c) 30 13 43.3 2 15.4 2 AMS 1
EST-derived SSR (original) 99 78 78.8 12 15.4 12 ACE 11
EST-derived SSR (reported d)) 118 85 72.0 6 7.1 6 ACM 5
EST-derived SSR (total) 75.1 11.0
Total 1,969 1,582 80.3 418 26.4 279 230
a) Markers showing polymorphisms between the parental lines, D1s-15s-10s and J1s-14s-23s.
b) No. of polymorphic markers / No. of STS markers obtained (%).
c) Fischer and Bachmann (2000).
d) Kuhl et al . (2004) and Martin et al . (2005).
Markername
No. of SSRmarkersmapped
Table 3-4 Number of bunching onion- and bulb onion-derived SSR markers used for our bunching onion map
No. of primersets
designed
No. ofmarkers
applied toF2
STS markers
No.
Polymorphic markers
No.a) % b)

91
% % InDel CAPS dCAPS
Original 93 71 76.3 52 13 25.0 4 20 5 misc. b) 2 2 1 4 Reported c) 39 27 69.2 20 8 40.0 1 33 7 7 7 Reported d) 209 155 74.2 123 37 30.1 11 81 16 misc. b) 2 8 3 14
Total 341 253 74.2 195 58 29.7 16 134 28 4 17 4 25 a) Markers showing polymorphisms between the parental lines, D1s-15s-10s and J1s-14s-23s, including three large (>0.1kbp) InDel markers, ACAAJ79, ACAAX07 and TC1952. b) Marker names are headed with "TC" or EST clone names such as ACA and CF. c) Wako et al . (2002b). d) McCallum et al. (2001), Gökçe et al . (2002), Kuhl et al . (2004) and Martin et al . (2005).
ACC
No. ofInDels
detected Total
No. of non-SSR markers mappedMarkername
Primersequence
source
No. ofSNPs
detetcted
No. ofmarkers
applied toF2
Table 3-5 Numbers of bulb onion EST-derived InDel, CAPS and dCAPS markers used for our bunching onion map
No. ofmarkers
sequenced
No. of primer setsexamined
STS markers
No.
InDel/SNP markersa)
No.

92
A. cepamap b)
ACM154 bulb onion EST SSR 1a 1 ACM154 CF451414
AFAA02D08 bunching onion genomic SSR 1a 1 e) - -
AFS015 bunching onion genomic SSR 1a 1 e) - -
ACC033 bulb onion EST CAPS 1b 1 d) 1 AJB64 AA451549
ACC015 bulb onion EST CAPS 1c 1 d) - ALCLECTINA
ACADR60 bulb onion EST CAPS 2a 2 e) 6 ACADR60 CF437227
ACE111 bulb onion EST SSR 2a 6 ACM177 CF445960
ACM024 bulb onion EST SSR 2a 6 ACM024 CF446873
AFRA11F11 bunching onion genomic SSR 2a 2 e) - -
AMS14 bulb onion genomic SSR 2a 2 c) - -AOB272 bulb onion EST CAPS 2a 2 AOB272-E1- 10.0/12.0 AA451592
ACC008 bulb onion EST CAPS 2b 2 d) - AF218356
ACE101 bulb onion EST SSR 2b 6 ACM066 CF437209
ACC043 bulb onion EST CAPS 3a 3 d) - AJ006067
ACE044 bulb onion EST SSR 3a 3 e) ACM078 CF436576
AFS104 bunching onion genomic SSR 3a 3 e) - -
ACAAJ79_InDel bulb onion EST InDel 3b 3 ACAAJ79 CF434863
ACC013 bulb onion EST CAPS 3b 3 d) 3 API40 AA451549
AFS145 bunching onion genomic SSR 3b 3 e) - -
ACACU34 bulb onion EST CAPS 4a 4 ACACU34 CF449808
AFS149 bunching onion genomic SSR 4a 4 e) - -
ACE039 bulb onion EST SSR 4b 4 e) - CF442638
ACE010 bulb onion EST SSR 5 5 ACM133 CF436768
ACM071 bulb onion EST SSR 5 5 ACM071 CF449595
TC1010 bulb onion EST CAPS 6a 6 e) - CF440857/CF449499
AFB20G05 bunching onion genomic SSR 6a 6 e) - -
AFS039 bunching onion genomic SSR 6a 6 e) - -
ACAEK46_dCAPS bulb onion EST dCAPS 8 8 ACAEK46 CF451695
b) Reported by Martin et al . (2005).
c) Reported by Masuzaki et al. (2006).
d) Reported by Wako et al . (2002b).
e) Identified in the present study.
a) Complete set of alien addition lines of A. fistulosum carrying single chromosomes of shallot (A. cepa) (Shigyo et al. 1996).
Table 3-6 List of markers with the chromosome identity determined in A. cepa
Correspondingmarker in
A. cepa map
AccessionNo.Marker Marker type
Linkagegroup in
A. fistulosum
Chromosome numberin A. cepa
Additionlines a)
Origin

93
ChromosomeNo.a)
Linkagegroup
1F 1a AFA03F08 AFA07E01 AFA08G10 AFAA02D08 AFB06C08AFS015 AFS142 AFRA04F03
1b AFA04H02 AFA05H01 AFA06 AFA06H12 AFA09F01AFA14A02 AFB06E05 AFB08 AFRA03E08 AFS099
1c AFA10B06 AFA05G044F 4a AFA01E06 AFA01F03 AFA11C12 AFA15G07 AFAT00A06
AFAT05H05 AFB01C03 AFB03B09 AFB03E09 AFRA07E10AFS149 AFS156
4b AFA11H10 AFA15D09 AFAA05B02 AFAT04E09 AFAT09E05AFB02C01 AFB277 AFRA04D09 AFS117
6F 6a ACM096 b) AFA02H08 AFA14C07 AFB05D11 AFB22H06AFRT01G11 AFRT08C02 AFS039
6b AFA02E09 AFB14B08 AFRA04B106c AFAT03G10 AFC12A06
7F 7a AFA07H05 AFA16D05 AFAA03F01 AFB04H04 AFB2377b ACE113 b) AFA06A08 AFA10E04 AFA15E08 AFAT02E05
AFAT03F07 AFS2218F 8 AFA07G06 AFA08A09 AFA10E05 AFA11E12 AFA15D06
AFA17A05 AFAT01F03 AFAT05E04 AFAT05G01 AFC03A09AFS008 AFS054 AFS088
b) Bulb onion EST-derived SSR marker.
Table 3-7 List of SSR markers with the chromosome identity determined in A. fistulosum
SSR markers
a) Determined by using allotriploid-bunching onion single-alien deletion lines (Hang et al . 2004, Yaguchi et al .2009).

94
Table 4-1 Plant materials used
Species Cultivars Type Seed company(Genebank)
AccessionNo.
Seedproduction
year A. fistulosum Fuyuougi 2 F1 Sakata Seed 1997
Natsubasyo F1 Kaneko Seed 1999 Natsuougi 2 F1 Sakata Seed 1998 Shuitsu F1 Musashino Seed 2001 White Tower F1 Takii Seed 1998 Yuzan F1 Tokita Seed 1998 Yoshikura OP Musashino Seed 2000 Ojima landrace MAFF JP25445 1998
A. altaicum JP138870 MAFF JP138870

95
Table 4-2 Primer sequences of 14 SSR markers usedMarkers Forward and reverse primer sequences (5'-3') Repeat regionAFS039 cgggtaataacggatatcataaaca (AT)8
cagttgttacatgtggtatcagagcAFS096 ccaagtattgggtggtcaaagtaca (CA)12(CT)3
tcacaagagagtgtgtgtgtgtgtgAFS099 atgcccctcattaataacaacatgac (AC)13(AT)8
ttaatcgcattgacaaagtttatttAFS104 actcaaggaaacacgtatgccact (AC)7
tcgcccttttagattcatttccAFS105 actttcgttgcaaacatttacacacac (AC)3aa(AC)10
gtggagtttacttccccaaatgaagAFS110 ttttgaagttttgccctttttatcc (GT)3ata(TG)9
tcatgacaccatgtgtctctatgtctAFS111 tgtttaatggactttcaatgcctgt (TG)8
gcattaaaatgaagaaatcccgaagAFS123 tctccagatttttcctaagctct (TG)9tc(TA)9
tgggatttacatcgcaacatAFS131 caacaaatcagagagaaacagatga (AC)8
actgtatatttatgtatcactccatgtaaaAFS142 tgagagaattaatattattggaggcctat (AC)11(AT)5gt(TA)8
ataaaatgacaaccaacccatgttaAFS145 acccttgggataagtggtttattga (AC)9
ggtcatgagtaattcaccgaacattAFS146 attcagatgactcacaggaatgacc (AC)10aa(TAA)4
ggagaaggcctggtcctatgtaagAFS149 aaccaattgattacctctcatctgc (AC)11(AT)7
tgcggaccttccatagtctgtataaAFS152 tttcgaacttttgactttcatcgtc (AC)8
acaaggatgagttgtcatgttgtga

96
Locus No. ofalleles PIC Locus No. of
alleles PIC
AFS039 5 0.57 AFS123 7 0.62AFS096 5 0.66 AFS131 3 0.60AFS099 5 0.57 AFS142 5 0.76AFS104 3 0.64 AFS145 3 0.41AFS105 5 0.66 AFS146 4 0.54AFS110 3 0.54 AFS149 5 0.68AFS111 4 0.47 AFS152 3 0.54
Mean 4.3 0.59
Table 4-3 Polymorphisms of 14 SSR loci among eight bunchingonion cultivars
a): Proportion of plants exhibiting the prevailing genotype in each cultivar.

97
Max. Min. Avg. Max. Min. Avg. Max. Min. Avg.A. fistulosum Fuyuougi 2 (F1) 4 2 2.7 6 2 3.4 97 23 63 100.0
Natsubasyo (F1) 5 2 3.1 7 2 4.5 84 39 56 100.0Natsuougi 2 (F1) 4 2 2.9 5 1 3.4 100 45 70 85.7Shuitsu (F1) 4 2 2.9 5 1 3.2 100 31 73 85.7White Tower (F1) 6 2 3.3 7 2 3.4 88 27 56 100.0Yuzan (F1) 4 2 3.1 5 2 4.1 70 30 49 100.0(mean of 6 F1 cultivars) 4.5 2 3.0 1.7 3.7 90 32 61 95.2Yoshikura (OP) 5 2 3.2 9 2 5.1 88 28 50 100.0Ojima (landrace) 7 2 3.6 15 2 5.6 80 18 45 100.0 (mean of 8 cultivars) 4.9 2 3.1 1.8 4.1 88 30 58 96.4
A. altaicum JP138870 6 2 3.4 7 2 4.6 82 27 49 100.0mean 5.0 2 3.1 1.8 4.1 88 30 57 96.8
5.8
7.4
7.3
Cultivars No. of alleles
Table 4-4 No. of alleles, genotypes, proportion of plants exhibiting the prevailing genotype (Pr%) and proportion of polymorphic loci(Pl ) using 14 SSR markers in bunching onion
Pr% Pl No. of genotypes Species

98
Table 5-1 Primer sequences of SSR markers used in the preliminary examinationMarkers Forward and reverse primer sequences (5'-3') Repeat regionAFS008 ggttatgaatactagcggggatag (AC)6at(AC)6
atcagaacaacattctgctgactaAFS012 attgagaattggaaatatgaccgtt (AC)13
ggtgttcatttttgggtttctaagtAFS015 atctcactgtccttgtacctgaaag (TGTA)5, (TA)6tg(TA)5tgtg(TA)6
catcttgactttgtgatatttgtgc (TA)4, (TA)4, (TATG)4AFS017 tgaacttttatttatgcttcttcctc (TC)5, (TC)15
atggaggacgaaggtgggttAFS039 cgggtaataacggatatcataaaca (AT)8
cagttgttacatgtggtatcagagcAFS060 cctatccccatgcatcacaacttat (GC)5t(AC)8t(TA)8c(TG)13
attccttcaccaccgttgatttattAFS088 tatcttcgagcacggttcttcttgt (TG)10
atggcttcgatgatggatagttgtaAFS096 ccaagtattgggtggtcaaagtaca (AC)12
tcacaagagagtgtgtgtgtgtgtgAFS099 atgcccctcattaataacaacatgac (AC)13(AT)8
ttaatcgcattgacaaagtttatttAFS101 atcacacacacacatatacacacac (AC)5atat(AC)9
agcgaccatatatagccttgccttaAFS103 ttttacctagatattttcgaatttca (TA)9(TG)9
catctttctttttcactagcttcctgAFS105 actttcgttgcaaacatttacacacac (AC)10
gtggagtttacttccccaaatgaagAFS109 cctatgtctttacctatccaaccaaca (TG)7
ccgaatttcaagtgtgtcaagttttAFS111 tgtttaatggactttcaatgcctgt (TG)8
gcattaaaatgaagaaatcccgaagAFS131 caacaaatcagagagaaacagatga (AC)8
actgtatatttatgtatcactccatgtaaaAFS140 cgtagcggatggtcacaaga (AC)12
tggacctggaggcctagactAFS142 tgagagaattaatattattggaggcctat (AC)11(AT)5gt(TA)8
ataaaatgacaaccaacccatgtta

99
Table 5-2 Selection criteria of marker loci for SSR-tagged breeding
Selection criterion Advantage Disadvantage
Located on different linkagegroups from each other
Unexpected selection of largelinkage blocks can be avoided.
Linkage map information is needed.
High PIC The identification power of markeris high.
There is a trade-off between PICand Pr%. Too high PIC results inrather low Pr%, and therebyhomozygous individuals for multipleselected loci can hardly be obtainedfrom original population.
High Pr% (PrA% and PrG%) The probability of close linkage toundesirable agronomical traits islow.
Too high Pr% results in rather lowPIC, and thereby manyhomozygous individuals for theselected loci might appear in non-selected populations by chance.
Large differences in melecularsize of PCR product between theprevailing allele and the otheralleles
The prevailing allele (the alleletargeted) can easily bedistinguished.

100
Linkage group a) Locus No. ofindivisuals PIC
Prevailingallele % b) Pr% d) Marker
setJ1 AFS008 33 3 5 0.43 72.7 55J1 AFS017 36 10 21 0.82 29.2 17J1 AFS088 36 3 6 0.57 61.1 39 AJ1 AFS096 32 4 8 0.64 48.4 41J1 AFS101 37 4 4 0.31 82.4 76J2 AFS015 37 2 3 0.50 54.1 70J2 AFS105 33 3 5 0.49 66.7 58J2 AFS142 35 3 5 0.45 61.4 54 BJ3 AFS012 35 5 9 0.72 42.9 29J3 AFS111 34 3 2 0.60 50.0 74J4 AFS060 18 6 8 0.71 44.4 39J5 AFS099 35 5 6 0.47 63.5 54 BJ5 AFS103 35 6 13 0.73 38.7 34J7 AFS039 34 6 13 0.76 36.8 21 AJ8 AFS109 35 3 4 0.66 40.0 40J8 AFS131 37 3 5 0.48 59.5 46 BJ9 AFS140 36 6 7 0.57 62.5 41 BAverage 0.58 53.8 46
a) According to Fig. 5-1. b) The frequency exhibiting prevailing allele. b) The frequency of plants exhibiting prevailing genotype.
Table 5-3 Polymorphisms at 17 SSR losi in the starting population (37 plants) of the bunching onionlandrace 'Shimonita' and two sets of markers selected for SSR-tagged breeding
4.4
No. ofalleles
No. ofgenotypes
7.3

101
No. of maternal lines No. of pseudostems 1.0 ± 0.0 1.0 ± 0.0 1.0 ± 0.0 0.88 NS b)
Fresh weight (g) 290 ± 8.9 281 ± 8.3 278 ± 8.1 0.64 NS Leaf blade length (mm) 473 ± 8.0 481 ± 7.6 481 ± 6.2 0.26 NS Leaf blade width (mm) 55 ± 0.7 55 ± 1.0 54 ± 1.0 0.75 NS Pseudostem length (mm) 190 ± 3.1 195 ± 3.7 192 ± 3.3 0.69 NS Pseudostem width (mm) 28 ± 0.4 26 ± 0.4 26 ± 0.5 0.20 NS Pyruvic acid (leaf blade) (µg/ml) 16.8 ± 1.2 19.0 ± 0.9 19.1 ± 0.8 0.21 NS Pyruvic acid (pseudostem) (µg/ml) 18.5 ± 0.7 17.7 ± 0.6 17.7 ± 0.5 0.62 NS Bolting time difference (2005) (day) c) 0.0 ± 1.6 0.2 ± 1.6 -3.1 ± 1.6 0.14 NS a) Sown on April 26, 2004, transplanted on June 24, and harvested on Nov 9. Each data was shown as average ± SE. b) Not signicicant. c) Difference between the bolting time in the control (Feburary 25, 2005) and that in the SSR-tagged populations.
Traits P value(Prob > F)
Table 5-4 Agronomic traits in SSR-tagged populations of bunching onion 'Shimonita' a)
Shimonita(control)
10
Shimonita A
13
Tuley-KramerHSD test(P=0.05)21
Shimonita B

102
Startingpopulation
Shimonita C(control) Shimonita A Shimonita B
34-37 40 92 117
Locus Linkagegroup
Set AAFS088 J1 0.57 0.78 0.00 0.66AFS039 J7 0.76 0.66 0.00 0.53
Set BAFS142 J2 0.45 0.65 0.32 0.00AFS099 J5 0.47 0.32 0.48 0.00AFS131 J8 0.48 0.53 0.55 0.00AFS140 J9 0.57 0.61 0.56 0.00
OthersAFS017 J1 0.82 0.48 0.38 0.37AFS015 J2 0.50 0.80 0.78 0.76
- NS- NS NS
Table 5-5 Degree of heterogenetity at targeted and untargeted loci in SSR-tagged bunching onion populations derived from a landrace 'Shimonita'
No. of plants genotyped
Wilcoxon rank-sum scores (P=0.05)