allometric equations for predicting aboveground … j. for. sci., 60, 2014 (6): 236–247 allometric...
TRANSCRIPT

236 J. FOR. SCI., 60, 2014 (6): 236–247
Allometric equations for predicting aboveground biomass of beech-hornbeam stands in the Hyrcanian forests of Iran
A.A. Vahedi1, A. Mataji1, S. Babayi-Kafaki1, J. Eshaghi-Rad2, S.M. Hodjati3, A. Djomo4
1Faculty of Agriculture and Natural Resources, Science and Research Branch, Islamic Azad University, Tehran, Iran
2Faculty of Natural Resources, Urmia University, Urmia, Iran3Faculty of Natural Resources, Sari Agricultural Sciences and Natural Resources University, Sari, Iran
4Faculty of Arts and Science, Department of Geography, Queen’s University, Kingston, Ontario, Canada
ABSTRACT: A better understanding of the carbon biomass from forests is needed to improve both models and mitiga-tion efforts related to the global C cycle and greenhouse gas mitigation. Despite the importance of Hyrcanian forests for biodiversity conservation, no study with biomass destruction has been done to predict biomass and carbon pools from this forest. Mixed-specific regression equations with 45 sample trees using different input variables such as di-ameter, height and wood density were developed to estimate the aboveground biomass of beech-hornbeam stands. All the sample trees were harvested and the diameter at breast height (DBH) spanned from 31 to 104 cm so as to represent the diameter distribution reported in the beech-hornbeam stand management. Using only diameter as an input vari-able, the stands regression model estimates the aboveground biomass of the stand with an average deviation of 19% (R2
adj = 0.92; SEE = 0.22). Adding height as the second explanatory variable slightly improved the estimation with an average deviation of 18% (R2
adj = 0.95; SEE = 0.17). Adding only height or wood density did not improve significantly the estimations. Using the three variables together improved the precision of bole biomass prediction of stands with an average deviation of 10.3% (R2
adj = 0.965; SEE = 0.167). 68% of the observed variation in the aboveground biomass of beech-hornbeam stands was explained only by diameter.
Keywords: climate change mitigation; carbon stock
JOURNAL OF FOREST SCIENCE, 60, 2014 (6): 236–247
The tree biomass from forest ecosystems plays a key role in the sustainable management of natural resources and also for the contribution of forests in the global C cycle (Brown 2002; Zianis, Mencuc-cini 2003). Hyrcanian forests which are located in the north of Iran stretch up to an altitude of 2800 m above sea level. They are constituted of different forest stands with about 80 woody species (Rouhi-Moghaddam et al. 2008). The communities of oriental beech (Fa-gus orientalis Lipsky) forests are the most important parts of the Hyrcanian forests due to their valuable ecological characteristics and their commercial value. The proportion of oriental beech reaches up to 30% of
total volume in the Hyrcanian forests and is the best-known industrial commercial tree species among the broadleaved trees and shrubs (IUFRO 2004). Oriental beech appears in the stands usually in a mixture with hornbeam (Carpinus betulus Lipsky) and constitutes beech-hornbeam stands in the Hyrcanian forests. Hornbeam is the most abundant tree species in the Hyrcanian forests and sometimes reaches a height of 25–30 m and a diameter at breast height (DBH) of 120 cm in theses stands (Marvi-Mohajer 2004). The beech-hornbeam stands are characterized by a two-layer structure with beech in the upper storey and hornbeam in the lower storey (IUFRO 2004).

J. FOR. SCI., 60, 2014 (6): 236–247 237
Thus, the knowledge of aboveground biomass related to these stands in the Hyrcanian forests may help to reduce the uncertainty associated with carbon ac-counting on a regional and/or national level.
Biomass studies are a very costly, time-consuming and destructive method, which is generally restricted to small areas and small sample trees (Ketterings et al. 2001; Fehrmann, Kleinn 2006), is the most appropriate method that has been used by many researchers (Ketterings et al. 2001; Djomo et al. 2010; Henry et al. 2010) for biomass estimations and carbon accounting from forests. Thus, to predict biomass and carbon storage of the forests, allometric models are the powerful tools widely applied (Yen, Lee 2011; Alvarez et al. 2012). The most important variable used in these models is diameter at breast height (DBH) (Zianis, Mencuccini 2004; Yen et al. 2010; Shackleton, Scholes 2011). The most com-mon allometric model used to predict biomass is the power function Y = a × Xb, where Y – dry biomass weight, a is the integration factor, b is the scaling fac-tor and X is the diameter at breast height (Ketter-ings et al. 2001; Zianis, Mencuccini 2003, 2004; Fehrmann, Kleinn 2006; Pilli et al. 2006; Djomo et al. 2010). This function is considered as the best applicable mathematical model for biomass studies because it has long been noted that growing plants maintain the weight proportion between different parts (Pilli et al. 2006; Djomo et al. 2010).
Allometric biomass equations have been devel-oped for tree species in different ecological regions of the world, which are related to species-specific and stand-specific biomass models (Ter-Mikaelian, Korzukhin 1997; Zianis, Mencuccini 2003, 2004; Joosten et al. 2004; Xiao, Ceulemans 2004; Chave et al. 2005; Peichl, Arain 2007; Djomo et al. 2010; Rebeiro et al. 2011). These equations are not actually available for Hyrcanian forests resulting in higher un-certainties of biomass estimations. This study focuses on the aboveground biomass of beech and hornbeam which are the dominant and most abundant tree spe-cies in Hyrcanian forests. Therefore, the main objec-tives are to use destructive biomass data to (1) devel-op allometric models for beech and hornbeam tree species; (2) evaluate the accuracy of each model pre-sented; (3) choose the best allometric equation from each model for the estimation of the beech-hornbeam stand biomass in the Hyrcanian forests.
MATERIAL AND METHODS
Study area. The study was carried out in Glan-drood Forest District (36°27'30''–36°32'15''N and
51°53'25''–51° 57'25''E) located in northern forests of Iran. The study land has a total area of 1,521 ha with altitudes which range between 940 and 1,520 m a.s.l. The studied forests belong to the beech community widely distributed in most parts of the district. The abundant tree species in the studied forests are F. ori-entalis L. and C. betulus L. The bedrock is of lime-stone and the soil texture ranges from silty clay loam to clay. According to data of the Nowshahr Meteo-rological Station, the mean annual precipitation and temperature of this area were 1,293.5 mm and 16.1°C, respectively.
Destructive sampling and biomass data. A to-tal of 45 sample trees belonging to F. orientalis L. (21 individuals) and C. betulus L. (24 individuals) were harvested for biomass estimation and allome-tric equation parameterization of beech-hornbeam stands in the study area. All the trees were selected following lines of exploitation carried out by the for-estry department of Nowshahr. We took samples from the trees in the beech-hornbeam stands which exhibited similar structure and site conditions in the Glandrood forest. Selection of each individual tree was based on diameter at breast height (1.3 m above the ground). The individuals were grouped into three DBH classes: 30–60, 60–80 and ≥ 80 cm, which is the diameter classification system com-monly used in the Hyrcanian forests of Iran. The di-ameter (DBH) range of the felled trees spanned from 31 to 104 cm so as to represent the diameter distri-bution reported in the beech-hornbeam stands. For each sample tree the DBH and total height (H) of the stand trees were first recorded. Then, trees were felled at the DBH level and separated into bole and branches (Zianis, Mencuccini 2003). Because the trees were felled in the winter, the leaves were not measured. For trees with multiple stems, the bole biomass of one single stem was considered as the sum of weights of each stem of this tree (Rebeiro et al. 2011). The boles were cut and divided into 2-m sections and weighed in the field using a steelyard of 650 kg capacity (Aboal et al. 2005; Henry et al. 2010; Zhu et al. 2010). A sample of 2-cm thick disk was cut from the base of each stem section (Peichl, Arain 2006; Zhu et al. 2010) and two sub-samples of 3 × 3 × 3 cm were extracted from the opposite sides of disks and oven-dried at 105°C to constant mass. The dry mass was determined with an elec-tronic balance in the laboratory and was used to es-timate the moisture content and the wood density (Henry et al. 2010; Zhu et al. 2010; Rebeiro et al. 2011; Alvarez et al. 2012). The basic wood density (WD) was calculated as an average of the two mea-surements per disk (Rebeiro et al. 2011). The wet

238 J. FOR. SCI., 60, 2014 (6): 236–247
volume (cm3) and the dry mass (g) were measured to calculate the wood density (g·cm–3) as dry mass divided by wet volume. The biomass of each bole section was calculated by multiplying the wet mass of each component by the dry/wet ratio of each disk. The total biomass of a tree was calculated by sum-ming the dry mass of the branches and the various sections of bole.
Data analysis and modelling. A general nonlinear mathematical model Y = a × Xb with X being the DBH is the most frequently used for biomass prediction because it has long been noted that growing plants maintain the weight proportion between different parts (Zianis, Mencuccini 2003; Pilli et al. 2006; Djomo et al. 2010). The DBH is the most commonly used parameter because it can be easily measured from the field with a great precision. In addition to the fact that the height and other parts such as crown length and volume are not easy to measure from the field, there is a good correlation between diameter and these other parameters (Santa Regina 2000). Differ-ent independent variables such as DBH, height, wood density and several combinations (DBH2, DBH2×H, H/DBH, DBH/H, DBH2×WD, DBH2×H×WD) were tested to select the best combined variables having a high correlation with biomass (Santa Regina et al. 2000; Zianis, Mencuccini 2003; Aboal et al. 2005; Chave et al. 2005; Djomo et al. 2010). The models were fitted to data using the ordinary least squares regression analysis. Because of heteroscedasticity of the data, the power function was logarithmically transformed into the linear form lnY = ln a + b × ln (D). The systematic bias introduced by this log-trans-formation was corrected with the correction factor CF depending on the standard error of the estimate SEE (Chave et al. 2005; Pilli et al. 2006; Djomo et al. 2010; Rebeiro et al. 2011) using the formula CF = exp (SEE2/2). In order to obtain the most ac-curate biomass predictions, the most common and empirical regression models proposed in the litera-ture were tested (Brown et al. 1989; Chave et al. 2005; Djomo et al. 2010; Rebeiro et al. 2011). First, only diameter as an independent variable was used to develop the allometric equations and subsequently height and wood density stepwise were introduced in the models and their effects were analyzed to deter-mine the best goodness of fit and predictive model. Model comparison and selection were based on ad-justed R2 that corrects the coefficients of determina-tion, and also on other parameters such as standard error of estimate (SSE), T-test statistical significance, correction factor (CF), average deviation and Akaike information criterion (AIC). AIC was measured by the equation:
AIC = 2k – 2 ln L (1)
where:k – number of parameters in the regression model, L – likelihood of the fitted regression model (Nelson
et al. 1999; Basuki et al. 2009; Djomo et al. 2010; Razakamanarvio et al. 2012).
The models having smaller AIC, average devia-tion, standard error and correction factor CF were selected as the best estimator (Djomo et al. 2010). The precision of regression equation was calculated after the prediction was back-transformed to the unit values and corrected with CF using the aver-age deviation method. The average deviation to the regression model was estimated by the equation:
( ) ∑ =
−⋅=
n
ii
ipi
yyy
nS
1
100% (2)
where: S – average deviation, ypi – predicted dry weight, yi – observed dry weight, n – number of observations.
In order to identify the multicollinearity associ-ated with log-transformed models having multiple independent variables, a collinearity diagnostic test was carried out using a variance inflation factor (Bihamta, chahouki 2011). The variance infla-tion factor (VIF) measures the severity of multicol-linearity in the regression model and is calculated as follows:
211
iRVIF
−= (3)
where: R2
i – coefficient of determination. This index shows how much the variance of an es-
timated regression coefficient increases because of collinearity. A value greater than 10 (VIF > 10) is an indication of potential multicollinearity among in-dependent variables. Thus, according to the smaller variance inflation factor (VIF < 10) the predictive model either can be valid and applicable or can be compared to other predictive models (Bihamta, Zare Chahouki 2011).
RESULTS AND DISCUSSION
Tree variables
The mean values of DBH, height and wood den-sity as measurable characteristics related to the subset of trees that was destructively sampled for branch and bole biomass estimation are sum-

J. FOR. SCI., 60, 2014 (6): 236–247 239
marized in Table 1. The minimum and maximum weight of dry branches and of dry bole mass was 78–2,460 kg and 310–6,810 kg, respectively, with coefficient of variation of 54% and 69% (Table 1). Among all the variables measured, the coefficient of variation of wood density (4.7%) was the small-est compared to others (Table 1). The results also show that there was a strong significant correlation (P < 0.01) between bole biomass and diameter, bole height, wood density (Table 1). However, the wood density was not correlated with branch biomass, diameter and height significantly (P > 0.05).
Modelling and developing allometric equations
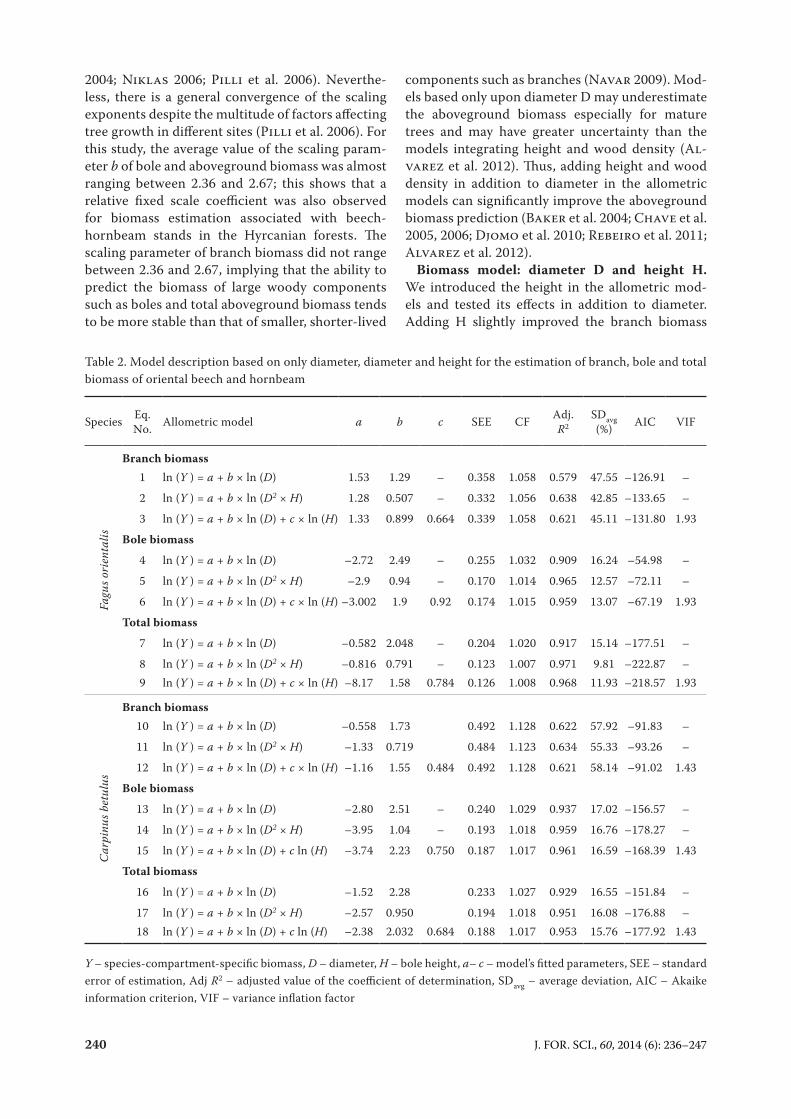
One-way biomass model: breast height diam-eter D. We first tested the species-specific allome-tric equation of beech and of hornbeam separately with only diameter at breast height (Table 2). Also, the mixed-species allometric equations related to the beech-hornbeam stands were tested with only diameter at breast height (Table 5). The analysis of species-compartment-specific allometric equa-tions showed that using only diameter in the basic functional model Eq. (1) and Eq. (10) predicted the branch biomass of beech and of hornbeam respec-tively with adjusted R2 of 0.58 and 0.62 with average deviation of 47.5% and of 58% and Akaike informa-tion criterion (AIC) of –127 and of –92 (Table 2). Using only diameter as a predictor in the regression Eq. (4) and Eq. (13) estimated the bole biomass of beech and of hornbeam respectively with adjusted R2 of 0.91 and 0.94, average deviation of 16% and 17%, AIC of –55 and –156.5. The total biomass of beech and of hornbeam was predicted using only diameter at breast height. The prediction accuracy was similar and close to the bole biomass of each species (Table 2). It implies that the bole biomass of
beech and of hornbeam has a majority contribution to the total biomass goodness of fit data because the majority of total weight of trees belongs to the bole. Using only diameter in the allometric equa-tion predicted bole biomass and total aboveground biomass of the stand with more accuracy and bet-ter goodness of fit of data compared to branch bio-mass (Figs 1, 4 and 9). Moreover, the goodness of fit showed that 68% of the observed variation in aboveground biomass was explained just only by diameter (Fig. 9). Similar to our findings, Navar (2009) indicated that in the allometric equations related to the tree species of northwestern Mexi-co forests in most cases more than 67% of the ob-served variation in biomass was explained by diam-eter at breast height. DBH is the common and best predictor for biomass in allometric models because it is strongly correlated with biomass; in addition, DBH can be easily measured in the field and is al-ways available in forest inventories data (Zianis, Mencuccini 2003; Segura, Kanninen 2005; Re-beiro et al. 2011). Table 1 also shows that there is a strong correlation between DBH and bole biomass (r = 0.92; P < 0.01), total aboveground biomass (r = 0.94; P < 0.01), confirming the prominent effect of diameter on the aboveground biomass predic-tion. Most of the studies on tree allometry with the power function Y = a × Xb including only diameter showed the value of b as the scaling factor to be be-tween 2.36 and 2.67 or between 2 and 3; this value varies with species, stand age, site quality, climatic conditions and stocking of stands (Enquist 2002; Niklas 2004; Ulrich 2004; Zianis, Mencucci-ni 2004; Djomo et al. 2010; Alvarez et al. 2012). However, some authors underlined that the use of a universal value of b is not acceptable, implying that the ratio of aboveground biomass and diameter for trees growing in different environmental con-ditions cannot be constant (Zianis, Mencuccini
Table 1. Pearson’s correlation between diameter, height, wood density and branches, bole mass, total aboveground biomass and measurable parameters of destructive biomass
Pearson’s correlation Mean (CV) Range
DBH (cm) H (m) WD (g·cm–3)
Branch biomass (t) 0.718** 0.515** 0.101ns 1.07 (54.6%) 0.078–2.46
Bole biomass (t) 0.923** 0.652 ** 0.448 ** 2.72 (69%) 0.31–6.81
Total aboveground biomass (t) 0.942** 0.667** 0.375** 3.79 (61%) 0.38–8.43
DBH (cm) 1 0.588** 0.269 ns 69.22 (31%) 30.87–104.35
H (m) 0.588** 1 0.043 ns 16.62 (24%) 9.15–25
WD (g·cm–3) 0.269 ns 0.043 ns 1 0.62 (4.7%) 0.57–0.69
CV – coeficient of variation, **P < 0.01, ns – P > 0.05
240 J. FOR. SCI., 60, 2014 (6): 236–247
2004; Niklas 2006; Pilli et al. 2006). Neverthe-less, there is a general convergence of the scaling exponents despite the multitude of factors affecting tree growth in different sites (Pilli et al. 2006). For this study, the average value of the scaling param-eter b of bole and aboveground biomass was almost ranging between 2.36 and 2.67; this shows that a relative fixed scale coefficient was also observed for biomass estimation associated with beech-hornbeam stands in the Hyrcanian forests. The scaling parameter of branch biomass did not range between 2.36 and 2.67, implying that the ability to predict the biomass of large woody components such as boles and total aboveground biomass tends to be more stable than that of smaller, shorter-lived
components such as branches (Navar 2009). Mod-els based only upon diameter D may underestimate the aboveground biomass especially for mature trees and may have greater uncertainty than the models integrating height and wood density (Al-varez et al. 2012). Thus, adding height and wood density in addition to diameter in the allometric models can significantly improve the aboveground biomass prediction (Baker et al. 2004; Chave et al. 2005, 2006; Djomo et al. 2010; Rebeiro et al. 2011; Alvarez et al. 2012).
Biomass model: diameter D and height H. We introduced the height in the allometric mod-els and tested its effects in addition to diameter. Adding H slightly improved the branch biomass
Table 2. Model description based on only diameter, diameter and height for the estimation of branch, bole and total biomass of oriental beech and hornbeam
Species Eq. No. Allometric model a b c SEE CF Adj.
R2SDavg (%) AIC VIF
Fagu
s ori
enta
lis
Branch biomass1 ln (Y ) = a + b × ln (D) 1.53 1.29 – 0.358 1.058 0.579 47.55 –126.91 –
2 ln (Y ) = a + b × ln (D2 × H) 1.28 0.507 – 0.332 1.056 0.638 42.85 –133.65 –
3 ln (Y ) = a + b × ln (D) + c × ln (H) 1.33 0.899 0.664 0.339 1.058 0.621 45.11 –131.80 1.93
Bole biomass
4 ln (Y ) = a + b × ln (D) –2.72 2.49 – 0.255 1.032 0.909 16.24 –54.98 –
5 ln (Y ) = a + b × ln (D2 × H) –2.9 0.94 – 0.170 1.014 0.965 12.57 –72.11 –
6 ln (Y ) = a + b × ln (D) + c × ln (H) –3.002 1.9 0.92 0.174 1.015 0.959 13.07 –67.19 1.93
Total biomass
7 ln (Y ) = a + b × ln (D) –0.582 2.048 – 0.204 1.020 0.917 15.14 –177.51 –
8 ln (Y ) = a + b × ln (D2 × H) –0.816 0.791 – 0.123 1.007 0.971 9.81 –222.87 –9 ln (Y ) = a + b × ln (D) + c × ln (H) –8.17 1.58 0.784 0.126 1.008 0.968 11.93 –218.57 1.93
Car
pinu
s bet
ulus
Branch biomass10 ln (Y ) = a + b × ln (D) –0.558 1.73 0.492 1.128 0.622 57.92 –91.83 –
11 ln (Y ) = a + b × ln (D2 × H) –1.33 0.719 0.484 1.123 0.634 55.33 –93.26 –
12 ln (Y ) = a + b × ln (D) + c × ln (H) –1.16 1.55 0.484 0.492 1.128 0.621 58.14 –91.02 1.43
Bole biomass
13 ln (Y ) = a + b × ln (D) –2.80 2.51 – 0.240 1.029 0.937 17.02 –156.57 –
14 ln (Y ) = a + b × ln (D2 × H) –3.95 1.04 – 0.193 1.018 0.959 16.76 –178.27 –
15 ln (Y ) = a + b × ln (D) + c ln (H) –3.74 2.23 0.750 0.187 1.017 0.961 16.59 –168.39 1.43
Total biomass
16 ln (Y ) = a + b × ln (D) –1.52 2.28 0.233 1.027 0.929 16.55 –151.84 –
17 ln (Y ) = a + b × ln (D2 × H) –2.57 0.950 0.194 1.018 0.951 16.08 –176.88 –18 ln (Y ) = a + b × ln (D) + c ln (H) –2.38 2.032 0.684 0.188 1.017 0.953 15.76 –177.92 1.43
Y – species-compartment-specific biomass, D – diameter, H – bole height, a– c – model’s fitted parameters, SEE – standard error of estimation, Adj R2 – adjusted value of the coefficient of determination, SDavg – average deviation, AIC – Akaike information criterion, VIF – variance inflation factor

J. FOR. SCI., 60, 2014 (6): 236–247 241
prediction of beech, of hornbeam (Table 2) and of mixed-species stands (Table 5). Figs 2 and 3 show the goodness of fit of data on the branch bio-mass of mixed-species stand type. As indicated in Table 2, the equations that included height in addition to diameter were the optimal estimative regression of each tree species’ bole biomass and total biomass.
We compared the biomass prediction of each best estimative regression of beech and of horn-beam using the paired t-test presented in Table 3. The results showed that there was no significant difference (P > 0.05) between predictions of Eq. (2) and Eq. (11), which are related to beech branch bio-mass and to hornbeam branch biomass, respective-ly (Table 3). Moreover, the lower and the upper lim-it of confidence interval of the difference of Eq. (5) and Eq. (14) was similar to the range of Eq. (8) and Eq. (17) according to the mean residual and t- value of estimations (Table 3).
Adding the height as incorporated variable (D2 ×H) or second variable improved the bole biomass and to-tal aboveground biomass of beech-hornbeam stands (Table 5). Adding the height to the square of diameter in Eq. (26) and Eq. (36) ameliorated the bole biomass and aboveground biomass prediction significantly with an adjusted R2 of 0.95 and 0.92, an average devia-tion of 16.9% and 18.2%, an AIC of –145.5 and –154 as shown in Table 5. The interaction term (D2×H) is more appropriate than D×H to estimate biomass be-cause the biomass is a product of volume (π/4 × D2 × H × form factor) and wood density. Figs 5 and 10 show the observed values and the prediction line using the interaction term of D and H. We further tested the effects of height in the allometric models with inde-pendent variables D and H using Eq. (27) and Eq. (37) (Table 5). The results showed that adding H as an in-dependent second variable in the regression models can improve the accuracy of bole biomass and aboveg-round biomass prediction very slightly compared to
ln D (cm)4.754.504.254.003.753.50
8
7
6
5
4
Y = 0.112 + 1.59*(x); Adj.R2 = 0.605; N=45ln
(Bra
nche
s bio
mas
s in
kg)
ln (D2H)131211109
8
7
6
5
4
ln (B
ranc
hes b
iom
ass i
n kg
)
Y = –0.346 + 0.640*(x); Adj.R2 = 0.605; N=45
Fig. 1. Regression between the natural logarithm of branch biomass (kg) and the natural logarithm of diameter at breast height (cm)
Fig. 2. Regression between the natural logarithm of branch biomass (kg) and the natural logarithm of the product of square diameter and height
ln (H) (m)
3.20 3.00 2.80 2.60 2.40 2.20 2.00
ln (B
ranc
hes b
iom
ass i
n kg
)
8
7
6
5
4
ln (D) (cm) 4.754.50
4.254.00
3.753.50
Y = 0.295 + 1.38*(x) + 0.468*(z); N = 45–
ln (D)
4.84.54.34.03.83.5
9
8
7
6
5
ln (B
ole b
iom
ass i
n kg
)
Y = –2.65 + 2.44*(x); Adj.R2 = 0.92; N = 45
Fig. 4. Regression between the natural logarithm of total bole biomass (kg) and the natural logarithm of diameter at breast height (cm)
Fig. 3. Multivariate regression between the natural loga-rithm of branch biomass (kg) and the natural logarithm of diameter (x) (cm), natural logarithm of height (z) (m)

242 J. FOR. SCI., 60, 2014 (6): 236–247
the regression model including the interaction term (D2×H). Fig. 11 shows the observed values and the prediction line using a multivariate linear model Eq. (37). In accordance with this result other re-searches in different biomes found that adding height to diameter in the allometric modelling as interaction term or independent predictor slightly ameliorated the accuracy of aboveground components of tree biomass (Ketterings et al. 2001; Chave et al. 2005; Basuki et al. 2009; Navar 2009; Djomo et al. 2010; Yen, Lee 2010, 2011; Rebeiro et al. 2011). Further-more, incorporating H in the regression model may increase the potential applicability of the equation to different sites since the height is often used as an in-dex for the site growing conditions; it will also help to explain some of the variations in bole weight (Vann et al. 1998; Ketterings et al. 2001; Navar 2009). Also, Peichl and Arain (2007) reported that the in-clusion of height as second variable would be neces-sary in equations that are applied to trees from differ-ent social classes (e.g. seedlings, young, co-dominant, dominant, etc.). Table 1 shows a significant correla-tion between diameter and height; therefore, a multi-collinearity test was performed. The result in Eq. (27) and in Eq. (37) (VIF = 1.61 < 10) showed that in this case diameter and height are individual predictors of bole biomass and aboveground biomass when log-transformed.
Height regression model
Tree height is laborious to measure in the field and many forest inventories data do not include these values (Ketterings et al. 2001; Navar 2009).
A height regression model with diameter at breast height as an input variable can be applied in the biomass allometric equation including diameter and height to increase the precision of estimations (Djomo et al. 2010). For development of height – diameter regression equations, we measured the height of 144 trees, especially of beech and horn-beam, which represented the diameter classes in the studied stands. We tested three models (Table 3) which have been reported by different authors to give a good fit of the height diameter relationship (Djomo et al. 2010). The regression equation from model Eq. (21) ln (H) = 2.962 – 17.07/D estimates better the relationship between the two variables with adjusted R2 of 0.22, SEE of 0.30 and average deviation of 14.63 %. The linear regression from model Eq. (19) ln (H) = 1.287 + 0.344 ln (D) esti-mates the height with very slightly different ac-curacy compared to model Eq. (21) with correla-tion coefficient of 0.22, SEE of 0.25 and average deviation of 14.67 % (Table 4). Although there is a correlation between DBH and H (Table 1), a large variance was observed around this general re-lationship that can be seen in Fig. 6, and a lower value of adjusted R2 in the three models. The re-sults showed the multicollinearity between inde-pendent variables in model Eq. (20) because the value of VIF was much higher than 10 (Table 4), showing that this model may not be suitable to pre-dict tree height in the studied area. Marshal et al. (2012) and Feldpausch et al. (2011) reported that precipitation, dry season length, stem density and mean annual temperature are all key drivers of
Table 4. Height-diameter regression models for the total bole biomass of beech-hornbeam stands (n = 144)
Eq. No. Mixed-species model a b c SEE CF Adj.
R2SDavg (%) AIC VIF
19 ln (H) = a + b × ln (D) 1.287 0.334 – 0.253 1.032 0.215 14.67 –393.67 –
20 ln (H) = a + b × ln (D) + c × ln (D)2 –0.923 1.454 –0.14 0.253 1.032 0.214 14.77 –392.56 518.46
21 ln (H) = a + b/D 2.962 – 17.07 – 0.251 1.031 0.217 14.63 –394.07 –
D – diameter, H – bole height, a–c – model’s fitted parameters, SEE – standard error of estimation, CF – correction factor, Adj R2 – adjusted value of the coefficient of determination, SDavg – average deviation, AIC – Akaike information criterion, VIF – variance inflation factor
Table 3. Paired t-test at 95% confidence interval of the mean of branch, bole and total aboveground biomass (kg) for oriental beech and hornbeam (the optimal models were compared)
Pair Allometric Models Mean residual (95% conf. int.) t P
Model 2–model 11 (branch biomass) –102.31 (–343.51 to 138.88) –0.885 0.387
Model 5–model 14 (bole biomass) –495.66 (–910.67 to –80.64) –2.49 0.022
Model 8–model 17 (total biomass) 481.64 (9.24 to 954.03) 2.12 0.043

J. FOR. SCI., 60, 2014 (6): 236–247 243
variation in height-diameter relationships and may also explain the variations in these relationships in the Hyrcanian forests.
Biomass model: diameter D, height H and wood density WD
We included the wood density as an incorporated variable to diameter and height (D2 × H × WD). The regression analysis showed that the wood density was not an effective variable on the improvement of accuracy and goodness of fit of data for the predic-tion of aboveground biomass in beech-hornbeam stands. Moreover, as shown in Table 2, the wood density was excluded to develop species-specific regressions because it did not change within spe-cies. Even if the wood density might change within the different trees organs, we tested introducing the wood density in mixed species-compartment-specific regressions and found no considerable pre-
cision of biomass prediction in regression analysis. Introducing the wood density (WD) as an inter-action term with diameter and height in the lin-ear models improved the bole biomass prediction more accurately than the other mentioned allome-tric equations (Table 5). The results showed that adding the wood density to Eq. (28) increased R2
adj and reduced the value of SEE and of average devia-tion and lowered the value of AIC (Table 5). Linear equation Eq. (31) had the highest accuracy with R2
adj of 0.97, SEE of 0.17, average deviation of 10.3 and AIC of –160.2 (Table 5). Eq. (34) had the same accuracy compared to Eq. (31) with a higher VIF of 19.43 (Table 5). Introducing the wood density only with height or diameter like Eq. (29) did not improve the model; it was then concluded that the wood density can improve certainty of the model prediction when adding both diameter and height. Fig. 7 shows the observed values of bole biomass
Table 5. Model description based on diameter, height and wood density for the estimation of branch, bole and total aboveground biomass of beech-hornbeam stand
Eq. No. Mixed–species equation type a b c k SEE CF Adj.
R2SDavg (%) AIC VIF
Branches
22 ln (Y ) = a + b × ln (D) 0.112 1.59 – – 0.449 1.05 0.605 49.21 –69.76 –23 ln (Y ) = a + b × ln (D2 × H) –0.346 0.640 – – 0.439 1.099 0.621 48.08 –71.58 –24 ln (Y ) = a + b × ln (D ) + c ln (H) –0.295 1.38 0.468 – 0.442 1.102 0.614 48.97 –69.89 1.61
Bole biomass
25 ln (Y) = a + b × ln (D) –2.65 2.44 – – 0.256 1.033 0.918 21.46 –123.52 –26 ln (Y) = a + b × ln (D2 × H) –3.4 0.986 – – 0.201 1.020 0.950 16.89 –145.46 –27 ln (Y) = a + b × ln (D) + c ln (H) –3.34 2.08 0.79 – 0.198 1.019 0.951 16.49 –144.98 1.6128 ln (Y) = a + b × ln (D2 × H × WD) –2.85 0.97 – – 0.179 1.016 0.960 10.34 –155.56 –29 ln (Y)= a + b × ln (D) + c × ln (WD) –1.48 2.38 1.91 – 0.243 1.029 0.926 20.89 –126.64 1.06
30 ln (Y)= a + b × ln (D) + c × ln (D2 × H × WD) –2.88 0.23 0.89 – 0.180 1.016 0.959 10.48 –153.65 19.41
31 ln (Y) = a + b × ln (D2 × H) + c × ln (WD) –1.92 0.95 2.47 – 0.167 1.013 0.965 10.28 –160.22 1.0432 ln (Y )= a + b × ln (D2 ×WD) + c × ln (H) –2.77 1.02 0.808 – 0.177 1.015 0.961 12.14 –155.09 1.59
33 ln (Y )= a + b × ln (D) + c × ln (H) + k × ln (WD) –1.94 1.98 0.85 2.38 0.168 1.014 0.965 11.90 –156.46 1.73
34 ln (Y )= a + b × ln (D) + c × ln (D2 × H) + k × ln (WD) –1.94 0.26 0.85 2.38 0.168 1.014 0.965 10.56 –156.46 19.43
Total biomass
35 ln (Y ) = a + b × ln (D) –1.11 2.71 – – 0.219 1.024 0.925 19.12 –134.28 –36 ln (Y ) = a + b × ln (D2 × H) –1.75 0.875 – – 0.176 1.015 0.951 18.23 –154.05 –37 ln (Y ) = a + b × ln (D ) + c × ln (H) –1.69 1.87 0.668 – 0.172 1.014 0.953 18.0.1 –154.60 1.61
Y – species-compartment-specific biomass, D – diameter, H – bole height, a–c – model’s fitted parameters, k – ???, SEE – standard error of estimation, Adj R2 – adjusted value of the coefficient of determination, SDavg – average deviation, AIC – Akaike information criterion, VIF – variance inflation factor

244 J. FOR. SCI., 60, 2014 (6): 236–247
and the prediction line using model Eq. (28) that includes (D2 × H × W) as an independent variable. Also, Fig. 8 shows the goodness of fit between the observed values of bole biomass and multivariate model Eq. (31) that includes (D2 × H) and WD as different explanatory variables.
Wood density is an important factor for convert-ing forest volume data to biomass data; it may de-pend on location, climate, management scenarios, and is a good indicator for life history strategy for tree species (Mani, Parthasarathy 2007).Thus, introducing wood density and height as well as diameter may explain the site variations, species variations and increase the precision of the estima-tions. Alvarez et al. (2012) indicated that for the Amazonian watershed, the inclusion of wood den-sity and tree height revealed spatial biomass and carbon patterns in these forests. Moreover, Chave et al. (2005) included D, H and WD within their models and proposed a global forest classification
system that contains three climatic categories (dry, moist, and wet) to account for climatic constraints in the aboveground biomass variation.
CONCLUSIONS
In the presence of complex environmental gradi-ents, allometric equations can provide additional in-formation to improve the knowledge of biomass dis-tribution (Chave et al. 2005; Alvarez et al. 2012). Mani and Parthasarathy (2007) reported that variation in environmental factors such as topogra-phy and edaphic characteristics (e.g. soil nutrient availability) may also complicate attempts to general-ize aboveground biomass on a regional or landscape scale. Allometric equations presented in this study associated with beech-hornbeam stands, the most common stand in the Hyrcanian forests, may bring
131211109
9
8
7
6
5
ln (B
ole b
iom
ass i
n kg
)
ln (D2H)
Y = –3.4 + 0.99*(x); Adj.R2 = 0.95; N = 45
ln (D)5.04.54.03.53.0
4
3
3
2
2
ln(B
ole H
eigh
t in
m)
Y = 1.3 + 0.33*(x); Adj.R2 = 0.21; N =144
Fig. 5. Regression between the natural logarithm of total bole biomass (kg) and the natural logarithm of the product of di-ameter (cm) and height (m)
Fig. 6. Regression between the natural logarithm of total bole biomass (kg) and the natural logarithm of the product of square diameter and height
ln (D2 * H * WD)12111098
9
8
7
6
5
ln (B
ole b
iom
ass i
n kg
)
Y = –2.8 + 0.98*(x); Adj.R2 = 0.96; N =45
Fig. 7. Regression between the natural logarithm of total bole biomass (kg) and the natural logarithm of the product of square diameter, height and wood density (g·cm–3)
ln (WD) (g·cm–3 )
–0.35–0.40–0.45–0.50–0.55–0.60
ln (B
ole b
iom
ass i
n kg
)
9
8
7
6
5
ln (D2H) 1312
1110
9
Y = 1.92 + 0.95*(x) + 2.47*(z); Adj.R2 = 0.96; N = 45–
Fig. 8 Multivariate regression between the natural loga-rithm of total bole biomass (kg) and the natural logarithm of the product of square diameter and height (x) and loga-rithm of wood density (z) (g·cm–3)

J. FOR. SCI., 60, 2014 (6): 236–247 245
additional information for the aboveground biomass patterns and distribution. Measuring height (H) and wood density (WD) requires additional work, in-creases project time and costs (Alvarez et al. 2012). The allometric model including D and H as incor-porated terms or two different explanatory variables was the best estimator for the total aboveground bio-mass prediction for each single species. For the mixed species beech and hornbeam, the allometric models including D, H and WD had a higher precision than the models including only diameter or only diameter and wood density or only diameter and height. A lot of researches confirmed that the role of wood den-sity in the allometric equations is more prominent for mixed species than for species-specific allomet-ric equations because trees of different species differ greatly in tree architecture and wood density (Ket-terings et al. 2001; Baker et al. 2004; Chave et al.
2005; Basuki et al. 2009; Djomo et al. 2010; Rebeiro et al. 2011; Alvarez et al. 2012). Here, we considered beech-hornbeam stands including F. orientalis L. and C. betulus L. as the majority of tree species within this ecological area. Despite the low number of spe-cies in the stand, there was still a variation in aver-age wood density that explained the need of adding wood density as another parameter in the predic-tion when it is possible. Although there was no need of wood density for the total aboveground biomass prediction, allometric equations related to the beech-hornbeam stands as mixed-species stands predicted bole biomass much more accurately through intro-ducing WD as well as D and H. The branch biomass of species-specific and of mixed-species was not well fitted as those of bole biomass and aboveground biomass (Figs 1–3). For aboveground biomass, this study recommended using Eq. (35) when only diam-eter is considered, Eq. (37) when only diameter and height are included. Furthermore, for bole biomass estimation Eq. (28) and Eq. (31) are recommended when diameter, height and wood density are the in-put parameters. This study also shows that D is the most prominent explanatory variable for biomass prediction and simple equation (ln Y = a + b × ln D) can be used in the absence of height and wood den-sity as concluded by studies (Zianis, Mencuccini 2003, 2004; Dias et al. 2006; Zianis 2008; Djomo et al. 2010; Shackelton, Scholes 2011; Alvarez et al. 2012)
Acknowledgements
We thank particularly the personnel of natural resources organization of Nowshahr who kindly
4.754.504.254.003.753.50
9
8
7
6
ln (T
otal
abov
e-gr
ound
bio
mas
s in
kg)
Y = –1.11 + 2.71*(x); Adj.R2 = 0.925; N = 45
ln (D)
131211109
9
8
7
6
ln (T
otal
abov
e-gr
ound
bio
mas
s in
kg)
Y = –1.75 + 0.785*(x); Adj.R2 = 0.951; N = 45
ln (D2H)
Fig. 10 Regression between the natural logarithm of total aboveground biomass of the stands (kg) and the natural logarithm of the product of square diameter and height
Fig. 9. Regression between the natural logarithm of total aboveground biomass of the stands (kg) and the natural logarithm of diameter at breast height (cm)
)
3.20 3.00 2.80 2.60 2.40 2.20 2.00
ln (T
otal
abo
ve-g
roun
d bi
omas
s in
kg)
9.00
8.00
7.00
6.00
4.754.50
4.254.00
3.753.50
ln (D) (cm) ln (H) (m
Y = –1.96 + 1.87*(x) + 0.668*(z); Adj.R2 = 0.953; N = 45
Fig. 11. Multivariate regression between the natural loga-rithm of total aboveground biomass of the stands (kg) and the natural logarithm of diameter (x) (cm), natural loga-rithm of height (z) (m)

246 J. FOR. SCI., 60, 2014 (6): 236–247
helped us by providing licence to enable our field work. Our thanks are extended to the workers who helped us with wood samples as well as weighing tree boles during and after harvesting.
R e f e r e n c e s
Aboal J.R., Arévalo J.R., Fernández A. (2005): Allomet-ric relationships of different tree species and stand above ground biomass in the Gomera laurel forest (Canary Islands). Flora, 200: 264–274.
Alvarez E., Duque A., Saldarriaga J., Cabrera K., Salas G.D.L., Valle L.D., Lema A., Moreno F., Orrego S., Rod-riguez L. (2012): Tree above-ground biomass allometries for carbon stocks estimation in the natural forests of Co-lombia. Forest Ecology and Management, 267: 297–308.
Baker T.R., Phillips O.L., Malhi Y., Almeida S., Arroyo L., Di Fiore A., Erwin T., Higuchi N., Killeen T.J., Laurance S.G., Laurance W.F., Lewis S.L., Lioyd J., Monteagudo A., Neill D.A., Patino S., Pitman N.C.A., Silva J.N.M., Vasquez Martinez R. (2004): Variation in wood density determines spatial patterns in Amazonian forest biomass. Global Change Biology, 10: 545–562.
Basuki T.M., Van Laake P.E., Skidmore A.K., Hussin Y.A. (2009): Allometric equations for estimating the above-ground biomass in tropical lowland Dipterocarp forests. Forest Ecology and Management, 257: 1684–1694.
Bihamta M.R., Zare Chahouki M.A. (2011): Principles of Statistics for the Natural Resources Science. 3rd Ed. Tehran, University of Tehran Press: 300.
Brown S. (2002): Measuring carbon in forests: current status and future challenges. Environmental Pollutant, 116: 363–372.
Brown S., Gillespie A., Lugo A.E. (1989): Biomass estima-tion methods for tropical forests with applications to forest inventory data. Forest Science, 35: 881–902.
Chave J., Andalo C., Brown S., Cairns M.A., Chambers J.Q., Eamus D., Folster H., Fromard F., Higuchi N., Kira T., Lescure J.P., Nelson B.W., Ogawa H., Puig H., Riera B., Yamakura T. (2005): Tree allometry and improved estimation of carbon stocks and balance in tropi-cal forests. Oecologia, 145: 87–99.
Dias A.T.C., De Mattos E.A., Vieira S.A., Azeredo J.V., Sacarano F.R. (2006): Aboveground biomass stocks of native woodland on a Brazilian sandy coastal plain: esti-mates based on the dominant tree species. Forest Ecology and Management, 226: 364–367.
Djomo A.N., Adamou I., Joachim S., Gode G. (2010): Allo-metric equations for biomass estimations in Cameroon and pan moist tropical equations including biomass data from Africa. Forest Ecology and Management, 260:1873–1885.
Enquist B.J. (2002): Universal scaling in tree and vascular plant allometry: toward a general quantitative theory link-
ing plant form and function from cells to ecosystems. Tree Physiology, 22: 1045–1064.
Fehrmann L., Kleinn C. (2006): General considerations about the use of allometric equations for biomass estima-tion on the example of Norway spruce in central Europe. Forest Ecology and Management, 236: 412–421.
Feldpausch T.R., Banin L., Phillips O.L., Baker T.R., Lewis S.L., Quesada C.A., Affumbaffoe K., Aerts E., Berry N., bird M., Brondizio E.S., de Camargo P., Chave J., Djagbletey G., Domingues T., Drescher M., Fearnside P.M., Franc M.B., Fyllas N.M., Lopez-Gonzalez G., Hladik A., Higuchi N., Hunter M., Iida Y., Abu Silam K., Rahman bin Kassim A., Keller M., Kemp J., King D., Lovett J.C., Marimon BS., Marimon Junior B.H., Marshall A.R., Metcalfe D.J., Mitchard E.T.A., Moran E.F., Nelson B.W., Nilus R., Nogueira E.M., Lenza de Oliveira E., Palace M., Pati S., Peh K.S.H., Raventos M.T., Reitsma J.M., Saiz G., Sonk´e B Taedoumg H.E., Tan S., Woll H., White L., Lloyd J. (2011): Height–diameter allometry of tropical forest trees. Biogeosciences, 8: 1081–1106.
Henry M., Besnard A., Asante W.A., Eshun J., Adu-Bredu S., Valentini R., Bernoux M., Saint-André L. (2010): Wood density, phytomass variations within and among trees, and allometric equations in a tropical rainforest of Africa. Forest Ecology and Management, 260: 1375–1388.
IUFRO (2004): Improvement and Silviculture of Beech. In: Proceedings of the 7th International Beech Symposium. Tehran, 10.–20. May 2004. Tehran, Research Institute of Forests and Rangelands: 186.
Joosten R., Schumacher J., Wirth C., Schulte A. (2004): Evaluating tree carbon predictions for beech (Fa-gus sylvatica L.) in western Germany. Forest Ecology and Management, 189: 87–96.
Ketterings Q.M., Coe R., Noordwijk M.V., Ambagau Y., Palm C.A. (2001): Reducing uncertainty in the use of allometric biomass equations for predicting abone-ground tree biomass in mixed secondary forests. Forest Ecology and Management, 146: 199–209.
Mani S., Parthasarathy N. (2007): Above-ground bio-mass estimation in ten tropical dry evergreen forest sites of peninsular India. Biomass and Bioenergy, 31: 284–290.
Marshall A.R., Willcock S., Platts P.J., Lovett J.C., Balmford A., Burgess N.D., Latham J.E., Munishi P.K.T., Salter R., Shirima D.D., Lewis S.L. (2012): Measuring and modelling above-ground carbon and tree allometry along a tropical elevation gradient. Biological Conservation, 154: 20–23.
Marvi-Mohajer M.R. (2004): Silviculture. Tehran, Univer-sity of Tehran Press: 387.
Navar J. (2009): Allometric equations for tree species and carbon stocks for forests of northwestern Mexico. Forest Ecology and Management, 257: 427–434.

J. FOR. SCI., 60, 2014 (6): 236–247 247
Nelson B.W., Mesquita R., Pereira J.L.G., de Souza S.G.A., Batista G.T., Couta L.B. (1999): Allometric regressions for improved estimate of secondary forest biomass in the Central Amazon. Forest Ecology and Man-agement, 117: 149–167.
Niklas K.J. (2004): Plant allometry: is there a grand unifying theorem? Biological Review, 79: 871–889.
Niklas K.J. (2006): Scaling the paths of resistance. New Phytologist, 169: 219–222.
Peichl M., Arain M.A. (2006): Above- and belowground ecosystem biomass and carbon pools in an age-sequence of temperate pine plantation forests. Agricultural and Forest Meteorology, 140: 51–63.
Peichl M., Arain M.A. (2007): Allometry and partitioning of above- and belowground tree biomass in an age-sequence of white pine forests. Forest Ecology and Management, 253: 68–80.
Pérez-Cruzado C., Rodriguez-Soalleiro R. (2011): Im-provement in accuracy of aboveground biomass estimation in Eucalyptus nitens plantations: Effect of bole sampling intensity and explanatory variables. Forest Ecology and Management, 261: 2016–2028.
Pilli R., Anfodillo T., Carrer M. (2006): Towards a functional and simplified allometry for estimating forest biomass. Forest Ecology and Management, 237: 583–593.
Razakamanarivo RH., Razakavololona A., Razafin-drakoto MA., Vieilledent G., Albrecht A. (2012): Below-ground biomass production and allometric rela-tionships of eucalyptus coppice plantation in the central highlands of Madagascar. Biomass and Bioenergy, 45: 1–10.
Ribeiro C.S., Fehrmann L., Boechat Soares C.P., Gon-çalves Jacovine L.A., Kleinn C., de Oliveira Gaspar R. (2011): Above- and belowground biomass in a Brazilian Cerrado. Forest Ecology and Management, 262: 491–499.
Rouhi-Moghaddam E., Hosseini S.M., Ebrahimi E., Tabari M., Rahmani A. (2008): Comparison of growth, nutrition and soil properties of pure stands of Quercus castaneifolia and mixed with Zelkova carpinifolia in the Hyrcanian forests of Iran. Forest Ecology and Management, 255: 1149–1160.
Santa Regina I. (2000): Biomass estimation and nutrient pools in four Quercus pyrenaica in Sierra de Gata Moun-tains, Salamanca, Spain. Forest Ecology and Management, 132: 127–141.
Shackleton C.M., Scholes R.J. (2011): Above ground woody community attributes, biomass and carbon stocks along a rainfall gradient in the savannas of the central lowveld, South Africa. South African Journal of Botany, 77: 184–192.
Ulrich W. (2004): Allometric ecological distributions in a local community of Hymenoptera. Acta Oecologica, 25: 179–186.
Vann D.R., Palmiotto P.A., Richard S. (1998): Allomet-ric equations for two South American conifers: Test of a non-destructive method. Forest Ecology and Management, 106: 55–71.
Xiao C.W., Ceulemans R. (2004): Allometric relationships for below- and aboveground biomass of young Scots pines. Forest Ecology and Management, 203: 177–186.
Yen T.M., Ai L.M., Li C.L., Lee J.S., Huang K.L. (2009): Aboveground carbon contents and storage of three major Taiwanese conifer species. Taiwan Journal Forest Science, 24: 91–102.
Yen T.M., Ji Y.J., Lee J.S. (2010) Estimating biomass produc-tion and carbon storage for a fast-growing makino bam-boo (Phyllostachys makinoi) plant based on the diameter distribution model. Forest Ecology and Management, 260: 339–344.
Yen T.M., Lee J.S. (2011): Comparing aboveground carbon sequestration between moso bamboo (Phyllostachys heterocycla) and China fir (Cunninghamia lanceolata) forests based on the allometric model. Forest Ecology and Management, 261: 995–1002.
Zhu B., Wang X., Fang W., Piao S., Shen H., Zhao S., Peng C. (2010): Altitudinal changes in carbon storage of temperate forests on Mt Changbai, Northeast China. Journal of Plant Research, 123: 439–452.
Zianis D. (2008): Predicting mean aboveground forest biomass and its associated variance. Forest Ecology and Management, 256: 1400–1407.
Zianis D., Mencuccini M. (2003): Aboveground biomass relationships for beech (Fagus moesiaca Cz.) trees in Ver-mio Mountain, northern Greece, and generalised equations for Fagus sp. Annals of Forest Science, 60: 439–448.
Zianis D., Mencuccini M. (2004): On simplifying al-lometric analyses of forest biomass. Forest Ecology and Management, 187: 311–332.
Received for publication April 6, 2014 Accepted after corrections June 12, 2014
Corresponding author:
Ali Asghar Vahedi, Islamic Azad University of Tehran, Science and Research Branch, Natural Resource Faculty, Forestry Department, Poonak Square, Ashrafi Esfahani Boulevard towards Hesarak, Postal Code 1477893855, Tehran, Iran; e-mail: [email protected]