alternative dynamic regimes and trophic control of plant succession
TRANSCRIPT

Alternative Dynamic Regimes andTrophic Control of Plant Succession
Oswald J. Schmitz,1,2* Elizabeth L. Kalies,1,3 and Michael G. Booth1,4
1School of Forestry and Environmental Studies, Yale University, 370 Prospect Street, New Haven, Connecticut 06511, USA;2Department of Ecology and Evolutionary Biology, Yale University, New Haven, Connecticut 06511, USA; 3School of Forestry,
Northern Arizona University, Flagstaff Arizona 86011, USA; 4Institute of Arctic Biology, University of Alaska, Fairbanks,Alaska 99775, USA
ABSTRACT
Ecological succession has been the subject of in-tense study and debate throughout the history ofecology as conceptualizations of process were pro-posed and refined. Modern concepts view ecologicalsuccession as largely driven by bottom-up resourcecompetition for light and nutrients. However,growing evidence shows that top–down effects ofconsumers can govern succession. These contrast-ing perspectives require synthesis. We offer such asynthesis by revitalizing the hypothesis that suc-cession proceeds by abrupt transitions to alternativestates or dynamic regimes. We present evidencefrom field sampling along two successional gradi-ents in a New England old field aimed at identifyingpattern, and from experimentation in the same fieldaimed at identifying process. Field sampling re-vealed that a competitive dominant plant existed ina mosaic with two distinct patch types of relativeabundances ( £ 25% and > 30%). Competitivedominant plant abundance varied systematicallywith plant species diversity (evenness), and re-source supply (light and soil nitrogen). The six-year
field experiment tested for alternative regimes bysystematic removal and staggered reintroduction oftop predators. Long-term predator removal causedan abrupt and irreversible shift from a top–down toa bottom–up controlled regime with a breakpoint atapproximately 25% relative abundance of thecompetitive dominant plant. This caused significantshifts in plant species evenness and resource supply(solar radiation and N mineralization rate). More-over, the competitive dominant abundance, speciesevenness and resource supply in the two dynamicregimes matched levels in the different patch typesin the field. We conclude that a single ecosystemcan display both top–down and bottom–up control.Abrupt shifts in trophic control lead to abruptchanges in the rate of development of ecosystemsconsistent with a working hypothesis that succes-sion proceeds via abrupt regime shifts.
Key words: tropic cascade; secondary succession;food webs; indirect effects; keystone effects; alter-native states.
INTRODUCTION
Terrestrial ecosystems recovering from disturbancesundergo chronologically distinct changes in theirspecies composition (viz. diversity). This recoveryprocess, called ecological succession, has been thesubject of intense study and debate as conceptual-izations of the driving mechanisms were developedand refined (for example, Cowles 1899; Cooper
1913; Clements 1916; Gleason 1927; Elton 1927;Tansley 1935; Lindeman 1942; Connell and Slatyer1977; Bazzaz 1979; Peet and Christensen 1980;Pickett and others 1987; Tilman 1988).
Modern conceptions of secondary successionlargely view it as a process dominated by compet-itive replacement of colonizing plant species(Connell and Slatyer 1977; Bazzaz 1979; Peet andChristensen 1980; Pickett and others 1987; Tilman1988). It is argued that fast-growing, short-livedspecies that best cope with high light and lownutrient conditions are typically the first to invade
Received 22 January 2005; accepted 14 September 2005; published
online 31 May 2006.
*Corresponding author; e-mail: [email protected]
Ecosystems (2006) 9: 659–672DOI: 10.1007/s10021-006-0006-4
659

(Tilman 1988; Smith 1996; Foster and Tilman2000). Those species ameliorate these biophysicalconditions through altered nutrient cycling andshading thereby facilitating invasion of slower-growing, longer-lived plant species that bettercompete under newly created light and nutrientregimes (Tilman 1988; Smith 1996; Foster andTilman 2000). The new competitors eventuallysupplant opportunistic species but then transformratios of light and nutrient availability in ways thatlead to their own replacement by other competitors(Tilman 1988; Smith 1996).This concept accords with a long-held view that
terrestrial ecosystem productivity and trophicstructure is governed largely from the bottom-upby limiting supplies of nutrients and light to plants(Lindeman 1942; Hutchinson 1959; Odum 1969;White 1978; Polis and Strong 1996; Loreau andothers 2001). The view is strengthened by twoadditional observations. Namely, the diversity andidentity of species in higher trophic levels may of-ten be determined by plant diversity within specificsites or along successional gradients (Southwoodand others 1979; Lawton 1983; Corbett 1995;Tscharntke and Greiler 1995; Siemann and others1998, 1999); and, herbivore species can have littleor no measurable effect on total plant biomass ornet primary production (Crawley 1983; Strong1992; Hairston and Hairston 1993; Polis and Strong1996).Accumulating evidence, however, shows that
species in higher trophic levels exert strong top–down control over plant species productivity anddiversity (Gutierrez and others 1997; Fraser andGrime 1998; Ritchie and others 1998; Duffy 2002;Paine 2002, Schmitz 2003; Seabloom and Richards2003; Carson and others 2004). Moreover, suchtop–down effects can govern the successionaltrajectories of terrestrial ecosystems (Harper 1969;Sutherland 1974; Brown and others 1988; Brownand Gange 1992; Pastor and Naiman 1992;Davidson 1993; Bach 1994; Carson and Root1999; Wootton 2002; Seabloom and Richards2003; Kuijper and others 2004). In particular,selective foraging by herbivores in response toplant nutrient quality or predators can alter theidentity and rate of spread of the colonizing spe-cies: effects that cascade further downward toinfluence nutrient cycling (Pastor and Naiman1992; Davidson 1993; Carson and Root 2000,Uriarte 2000).Such contrasting perspectives about the mecha-
nism driving secondary succession begs explana-tion. To this end, we offer here a conceptualizationthat attempts to reconcile when bottom–up and
top–down processes might govern secondary suc-cessional dynamics. Our conceptualization revital-izes the hypothesis that succession proceeds bychanges in the nature of trophic control of eco-system function that leads to abrupt transitions toalternative states (Sutherland 1974; Holling 1986;Gunderson 2000). The view is supported by recentexperimental evidence for alternative states in aterrestrial old-field ecosystem (Schmitz 2004b). Inour view, alternative states represent different dy-namic regimes (sensu Scheffer and others 2001) inwhich the dominant factor controlling successionvaries. Thus, during one phase of succession,development is slowed or arrested by top–downtrophic interactions between plants and theirassociated fauna. Eventually, environmental con-ditions cause the system to reach a breakpoint inwhich top–down control is rapidly lost and thesystem abruptly transitions to an alternative, bot-tom–up controlled regime.
We present here two lines of evidence—onefrom field sampling aimed at identifying pattern;and the other from a field experiment aimed atidentifying process—that together bolster thehypothesis (Holling 1986) that succession proceedsvia abrupt transitions to alternative regimes in re-sponse to alteration of trophic control of ecosystemfunction. We first present our evidence in twostand-alone sections dealing separately with thefield survey and the field experiment. The sectionseach present methods, results and a brief summaryof the results. We use this approach deliberately toprovide appropriate background and rationale forthe separate phases of this study and their associ-ated methodologies. These sections are followed bya third that synthesizes the field sampling andexperimental data to infer the process underlyingthe field pattern. We close the paper with a generaldiscussion of the implications of our findings forunderstanding terrestrial plant succession in thecontext of alternative dynamic regimes theory.
FIELD SURVEY: IDENTIFICATION OF
PATTERN
Background
The temporal progression of species change in oldfields is often proffered as a textbook example ofsuccession (for example, Morin 1999; Smith 1996).It involves clonal spread of grasses and herbs,especially Solidago (goldenrod) species (Bazzaz1996; Smith 1996; Carson and Root 1999). Solidagospecies can dominate by preempting less competi-tive herb species through shading (Cain and others
660 O. J. Schmitz and others

1991; Bazzaz 1996; Uriarte and Schmitz 1998;Schmitz 2003) and altering soil N availability andcycling (Uriarte 2000).
Old field successional dynamics are ideally stud-ied by following the chronological progression ofspecies change at a specific location (Smith 1996).But, this requires long-term study because succes-sion requires decades to play itself out completely.This limitation can be overcome by swapping spacefor time (Pickett 1989) and comparing patternsamong different locations that represent differentstages of succession (for example, Uriarte andSchmitz 1998; Foster and Tilman 2000; Uriarte2000). Such comparisons are usually made at thewhole field scale based on the implicit reasoningthat the post-disturbance age of a field is a goodapproximation of its successional stage; and thatentire fields are uniformly affected by a disturbance(for example, agriculture).
Examining succession at the whole field scale isappropriate whenever the species composition of afield is comparatively uniform. However, there maybe considerable spatial heterogeneity in relativeabundance of a competitive dominant within fieldsbecause plant species may be organized into patchymosaics (Peterson 1984; Petraitis and Latham 1999;Seabloom and Richards 2003). In such cases, fieldage may not be an appropriate surrogate for suc-cessional state. Rather, several successional statesmay co-occur in a field; so whole-field comparisonsmay be too crude to reveal important mechanismsgoverning the successional processes. Moreover,the existence of patchy mosaics with sharp bound-aries is a necessary precondition for any argumentthat alternative dynamic regimes explain dynamics(Sutherland 1974; Seabloom and Richards 2003).
We illustrate this case in point using insightsfrom long-term research in a New England old fieldecosystem (reviewed in Schmitz 2004a). The studysystem includes 18 species of herbaceous plants andnumerous arthropod predators and herbivores thatare linked in a highly interconnected food web(Schmitz 2004a). The five most abundant plantspecies (species comprising > 95% of the total plantbiomass) are the perennial grass Poa pratensis, andthe perennial herbs Solidago rugosa, Solidago gra-minifolia, Potentilla simplex, and Trifolium repens(Schmitz 2004a).
Methods
During summer 2003, we sampled two locations(Upper and Lower) of an old field ecosystem thatwas the focus of past research on trophic interac-
tions (Schmitz 2004a). We arrayed an 8 m · 20 msampling grid in each location. Grid points weremarked at 2 m intervals using wooden stakes. Bothsampling grids were located along an S. rugosaabundance gradient.
Plant Sampling. We sampled the % cover of allplant species within a 0.5 m2 sampling quadratcentered at each 2 m grid point four times duringthe summer (mid May, late June, late July and lateAugust). These periods represented differentgrowing conditions in the field system (Schmitz2004a).
Resource Sampling. According to the Resource-Ratio hypothesis of plant succession (Tilman1988), plant dominance is controlled from thebottom–up by resource supply. Different plantspecies should dominate at different supply ratiosof limiting nutrients based on a trade-off in theirphysiological capacities to exploit different re-sources. Old field systems tend to be limited mostby the amount of light penetrating the vegetationcanopy to the ground storey, and by soil nitrogen(Tilman 1988; Cain and others 1991; Uriarte2000). We therefore sampled photosyntheticallyactive solar radiation (PAR) striking the groundand soil nitrogen content along each gradientconcurrently with plant species sampling. Wemeasured PAR (l mol s)1 m)2) by placing a LI-190SA quantum sensor coupled to a LI-250 LightMeter (Li-Cor Inc., Lincoln, Nebrasea, USA) onthe ground surface in the center of each 0.5 m2
sampling quadrat. We allowed the readings tostabilize for 10 s before recording a measurement.For logistical reasons, we sampled nitrogen atfewer locations along the grid. We treated each 2m · 8 m section of the 20 m sampling area as ablock and subdivided each section into four, 2 m· 2 m plots. We randomly select two of four plotsin each block and extracted soil cores (10 cmlong · 5.08 cm diameter metal corer) below thelitter layer to estimate soil N (ammonium andnitrate) content (mg g)1 soil). We extracted N in2 M KCl using standard procedures (Hart andothers 1994). Extracted samples were refrigerateduntil analyzed for nitrate and ammonium contentby colorimetric assays at the University of GeorgiaSoil, Water, and Plant Analysis facility. We alsomeasured, at each 2 m grid point, soil surfacetemperature using a Digi-Sense 8523 thermistorthermometer (Cole-Parmer Instrument Company,Chicago, Illinois, USA), coupled to a surfaceprobe accurate to 0.1!C; and soil moisture (%water content) using a Dynamax ML2x ThetaProbe (Dynamax, Inc., Houston, Texas, USA).
Alternative Dynamic Regimes and Trophic Control of Plant Succession 661
Results
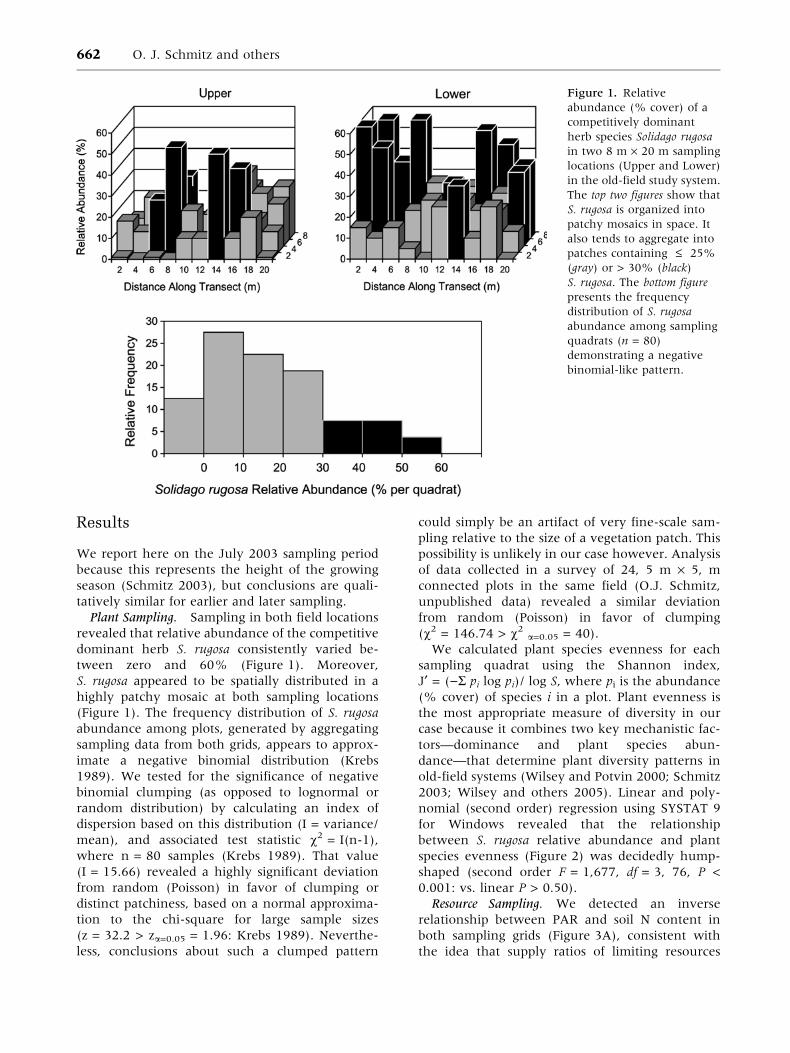
We report here on the July 2003 sampling periodbecause this represents the height of the growingseason (Schmitz 2003), but conclusions are quali-tatively similar for earlier and later sampling.
Plant Sampling. Sampling in both field locationsrevealed that relative abundance of the competitivedominant herb S. rugosa consistently varied be-tween zero and 60% (Figure 1). Moreover,S. rugosa appeared to be spatially distributed in ahighly patchy mosaic at both sampling locations(Figure 1). The frequency distribution of S. rugosaabundance among plots, generated by aggregatingsampling data from both grids, appears to approx-imate a negative binomial distribution (Krebs1989). We tested for the significance of negativebinomial clumping (as opposed to lognormal orrandom distribution) by calculating an index ofdispersion based on this distribution (I = variance/mean), and associated test statistic v2 = I(n-1),where n = 80 samples (Krebs 1989). That value(I = 15.66) revealed a highly significant deviationfrom random (Poisson) in favor of clumping ordistinct patchiness, based on a normal approxima-tion to the chi-square for large sample sizes(z = 32.2 > za=0.05 = 1.96: Krebs 1989). Neverthe-less, conclusions about such a clumped pattern
could simply be an artifact of very fine-scale sam-pling relative to the size of a vegetation patch. Thispossibility is unlikely in our case however. Analysisof data collected in a survey of 24, 5 m · 5, mconnected plots in the same field (O.J. Schmitz,unpublished data) revealed a similar deviationfrom random (Poisson) in favor of clumping(v2 = 146.74 > v2 a=0.05 = 40).
We calculated plant species evenness for eachsampling quadrat using the Shannon index,J¢ = ()S pi log pi)/ log S, where pi is the abundance(% cover) of species i in a plot. Plant evenness isthe most appropriate measure of diversity in ourcase because it combines two key mechanistic fac-tors—dominance and plant species abun-dance—that determine plant diversity patterns inold-field systems (Wilsey and Potvin 2000; Schmitz2003; Wilsey and others 2005). Linear and poly-nomial (second order) regression using SYSTAT 9for Windows revealed that the relationshipbetween S. rugosa relative abundance and plantspecies evenness (Figure 2) was decidedly hump-shaped (second order F = 1,677, df = 3, 76, P <0.001: vs. linear P > 0.50).
Resource Sampling. We detected an inverserelationship between PAR and soil N content inboth sampling grids (Figure 3A), consistent withthe idea that supply ratios of limiting resources
Figure 1. Relativeabundance (% cover) of acompetitively dominantherb species Solidago rugosain two 8 m · 20 m samplinglocations (Upper and Lower)in the old-field study system.The top two figures show thatS. rugosa is organized intopatchy mosaics in space. Italso tends to aggregate intopatches containing £ 25%(gray) or > 30% (black)S. rugosa. The bottom figurepresents the frequencydistribution of S. rugosaabundance among samplingquadrats (n = 80)demonstrating a negativebinomial-like pattern.
662 O. J. Schmitz and others

should vary inversely along a successional gradi-ent (compare. Figure 8.13 in Tilman 1988). Wefit a linear regression and the exponential modelY = a eb/X to these data using linear and nonlin-ear regression in SYSTAT 9 for Windows. Thelinear regression was not significant (P > 0.25)but the exponential model was (F = 20.92, df = 2,36, P < 0.01, R2 = 0.54). Plots of PAR and Nmineralization in relation to the S. rugosa abun-dance (Figure 3B, C) revealed that S. rugosadominated when both biophysical variables wereat their lowest levels. We found no significantrelationship between S. rugosa abundance andeither soil surface temperature or soil moisture(both regression P > 0.65).
Summary
Field sampling revealed that S. rugosa is indeedorganized into a patchy mosaic. Under an hypoth-esis of alternative regimes, one might, however,expect that the frequency distribution of S. rugosaabundance should be bimodal rather than unimo-dal. However, succession is a temporally sequencedprocess and the frequency of the two regimes de-pends on the time a field is sampled. A bimodaldistribution may eventually occur during latersuccession and indeed the entire system mayeventually be overwhelmed by S. rugosa and com-pletely flip to the single bottom–up controlled re-gime in late succession, giving again a unimodaldistribution. We suggest that such a temporal
transition is akin to shifts from murky to clearwater regimes in freshwater systems (Scheffer andothers 2001) but that it requires a considerablylonger period of time to manifest itself in the old-field system.
The humped-shaped species evenness curve isconsistent with the way species diversity is ex-pected to change as competitive dominant speciesgradually replace one another along a successional
Figure 2. Relationship between the abundance (%cover) of a competitively dominant herb species S. rugosaand plant species evenness measured in two 8 m · 20 msampling locations. Black circles represent the Upper fieldsampling site and gray circles represent Lower field sam-pling site. The curve through the data is derived fromfitting a second order polynomial regression to the data.
Figure 3. A Relationship between soil nitrogen content(mg g soil)1) and photosyntheitically active radiation atground surface (PAR, lmol s)1 m)2) measured along twosampling transects in the field. (Upper black circles; Lowergray circles) The curve through the data is derived fromfitting an exponential regression to the data. B Rela-tionship between PAR and abundance (% cover) of acompetitively dominant herb species S. rugosa. C Rela-tionship between soil N content and S. rugosa abundance(% cover). These figures demonstrate that S. rugosadominates under low light and low soil N.
Alternative Dynamic Regimes and Trophic Control of Plant Succession 663

gradient (Tilman 1988). However, the dominanceof a single competitor species (S. rugosa) at bothextremes of a resource ratio gradient is inconsistentwith the predictions of the resource ratio hypoth-esis of plant succession (Tilman 1988). Consumer-resource competition theory (Tilman 1988) predictsthat a species can only dominate at both extremesof the resource ratio gradient if it is a superiorcompetitor for both resources (that is, draws downboth resources to lower levels than other plantspecies). If this were the case here, then the zeronet growth isocline (ZNGI) should fall below that ofother plant species; and the competitive dominantplant should preempt other plant species from thesystem. The fact that multiple plant species coexistacross the gradient implies that the system may notbe altogether bottom–up controlled. One candidateexplanation for the pattern in our field system isthat S. rugosa dominance is modified by keystonepredation (Holt and others 1994; Leibold 1996),which has attendant affects on light and soilnutrient supply via altered N mineralization rates.We now describe a field experiment that addressesthis possibility.
FIELD EXPERIMENT: IDENTIFICATION OF
PROCESS
Background
Long term research (Schmitz 2003, 2004a) revealedthat an important controlling factor of plantdiversity and productivity in the old field ecosystemis an indirect keystone predation effect among adominant hunting spider Pisaurina mira, its grass-hopper herbivore Melanoplus femurrubrum prey,and the grass P. pratensis, and the competitivedominant herb S. rugosa. M. femurrubrum grass-hoppers eat both P. pratensis and S. rugosa. But, theyprefer P. pratensis in the absence of predators andcan inflict considerable damage to it. Mortality riskdue to predator presence causes grasshoppers lar-gely to forego feeding on grass and to seek refuge inand forage on leafy S. rugosa, thereby causing highdamage levels to this species. Suppression of thecompetitive dominant S. rugosa allows less com-petitive herb species to proliferate, leading to in-creased plant species diversity but loweredproductivity (Schmitz 2003).Furthermore, long-term disruption of the indi-
rect keystone effect (top–down control) can causethe system to entrain to an alternative bottom–upcontrolled regime once S. rugosa relative abundanceexceeds 25–30%. Such evidence comes from along-term field experiment designed expressly to
test for alternative regimes (Schmitz 2004b).Demonstrating the existence of alternative regimesrequires three pieces of evidence (May 1977;Connell and Sousa 1983; Sinclair 1989; Schefferand Carpenter 2003). There must be experimentaldemonstration that patches with high and low S.rugosa abundance present alternative regimes ofplant diversity and biophysical properties. Theremust be experimental demonstration that a dis-continuity separates the alternative regimes. Theremust be experimental demonstration that pertur-bation of an important controlling factor of eco-system function causes an abrupt and irreversibleshift across the discontinuity (that is, no recovery toinitial conditions). We now briefly review a previ-ous field experiment—conducted in the same fieldas the field survey—that fulfilled these criteria. Wethen describe methodology and results of samplingaimed at measuring the same biotic and biophysicalvariables as in the field survey.
The field experiment, which ran between 1998and 2003, was deployed in 2 m · 2 m field plotsarrayed in ten blocks of six plots each with each offive treatments or control assigned randomly toeach block (Schmitz 2004b). Initial S. rugosaabundance was below 25% in all plots and did notdiffer systematically among treatments and thecontrol (Figure 4). Trophic control of ecosystemfunction was systematically altered by manipulat-ing the trophic structure in different perturbationand recovery phases of the experiment. The per-turbation comprised two treatments and a controlrandomly assigned to plots once in each of tenblocks. The control contained natural levels ofplants, herbivores, and predators (3-level treat-ment). Predators were excluded (2-level treatmentcontaining herbivores and plants) by surroundingthe treatment plots with a 45 cm wide aluminumsheet-metal barrier, buried 5–10 cm in the groundand then maintaining a 30 cm mowed buffer striparound the perimeter of the enclosed plot. Her-bivory was prevented (1-level treatment containingonly plants) by applying an organic pyrethroidinsecticide every 15 days with a backpack sprayer.The recovery component comprised three 2-leveltreatments that were sequentially returned to 3-level conditions in 1999, 2000 and 2001. Removingaluminum barriers surrounding 2-level plots ef-fected natural re-invasion. Details of samplingprotocol are presented in Schmitz (2004b).
Long-term time series (Figure 4A) and meantreatment values for 2003 (Figure 5A) confirmedthat S. rugosa abundance in the 1-level plant-onlytreatment would increase in the absence of anyconsumer top–down control. S. rugosa abundance
664 O. J. Schmitz and others
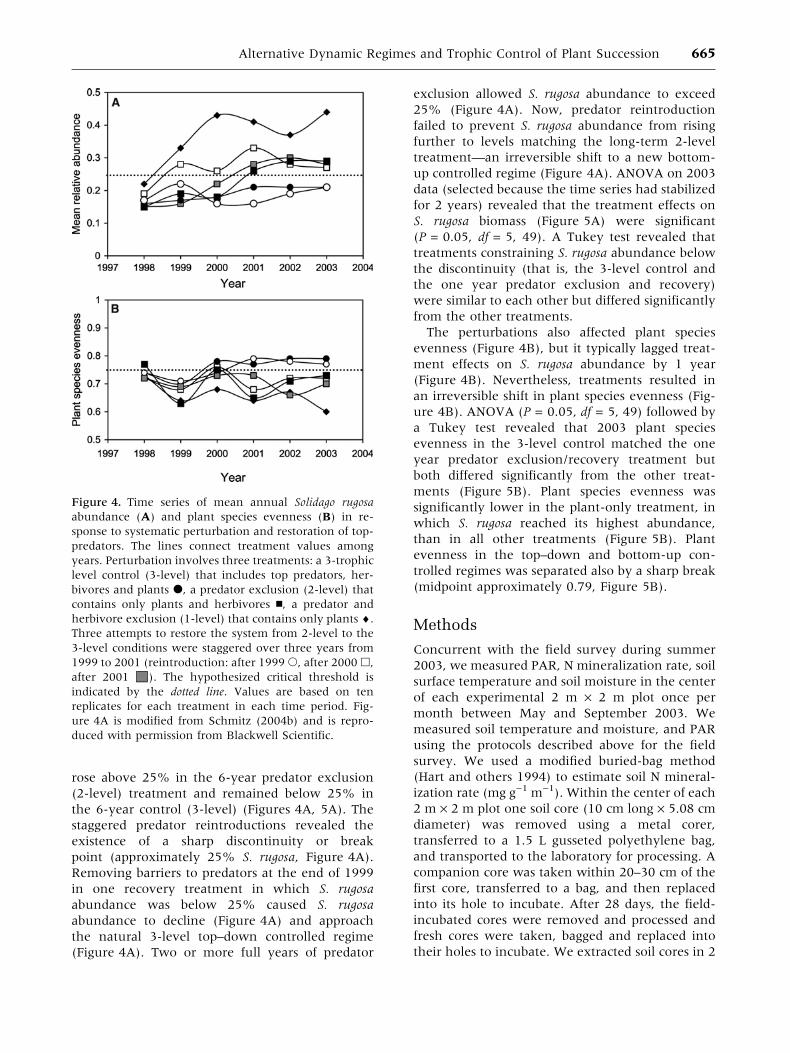
rose above 25% in the 6-year predator exclusion(2-level) treatment and remained below 25% inthe 6-year control (3-level) (Figures 4A, 5A). Thestaggered predator reintroductions revealed theexistence of a sharp discontinuity or breakpoint (approximately 25% S. rugosa, Figure 4A).Removing barriers to predators at the end of 1999in one recovery treatment in which S. rugosaabundance was below 25% caused S. rugosaabundance to decline (Figure 4A) and approachthe natural 3-level top–down controlled regime(Figure 4A). Two or more full years of predator
exclusion allowed S. rugosa abundance to exceed25% (Figure 4A). Now, predator reintroductionfailed to prevent S. rugosa abundance from risingfurther to levels matching the long-term 2-leveltreatment—an irreversible shift to a new bottom-up controlled regime (Figure 4A). ANOVA on 2003data (selected because the time series had stabilizedfor 2 years) revealed that the treatment effects onS. rugosa biomass (Figure 5A) were significant(P = 0.05, df = 5, 49). A Tukey test revealed thattreatments constraining S. rugosa abundance belowthe discontinuity (that is, the 3-level control andthe one year predator exclusion and recovery)were similar to each other but differed significantlyfrom the other treatments.
The perturbations also affected plant speciesevenness (Figure 4B), but it typically lagged treat-ment effects on S. rugosa abundance by 1 year(Figure 4B). Nevertheless, treatments resulted inan irreversible shift in plant species evenness (Fig-ure 4B). ANOVA (P = 0.05, df = 5, 49) followed bya Tukey test revealed that 2003 plant speciesevenness in the 3-level control matched the oneyear predator exclusion/recovery treatment butboth differed significantly from the other treat-ments (Figure 5B). Plant species evenness wassignificantly lower in the plant-only treatment, inwhich S. rugosa reached its highest abundance,than in all other treatments (Figure 5B). Plantevenness in the top–down and bottom-up con-trolled regimes was separated also by a sharp break(midpoint approximately 0.79, Figure 5B).
Methods
Concurrent with the field survey during summer2003, we measured PAR, N mineralization rate, soilsurface temperature and soil moisture in the centerof each experimental 2 m · 2 m plot once permonth between May and September 2003. Wemeasured soil temperature and moisture, and PARusing the protocols described above for the fieldsurvey. We used a modified buried-bag method(Hart and others 1994) to estimate soil N mineral-ization rate (mg g)1 m)1). Within the center of each2 m · 2 m plot one soil core (10 cm long · 5.08 cmdiameter) was removed using a metal corer,transferred to a 1.5 L gusseted polyethylene bag,and transported to the laboratory for processing. Acompanion core was taken within 20–30 cm of thefirst core, transferred to a bag, and then replacedinto its hole to incubate. After 28 days, the field-incubated cores were removed and processed andfresh cores were taken, bagged and replaced intotheir holes to incubate. We extracted soil cores in 2
Figure 4. Time series of mean annual Solidago rugosaabundance (A) and plant species evenness (B) in re-sponse to systematic perturbation and restoration of top-predators. The lines connect treatment values amongyears. Perturbation involves three treatments: a 3-trophiclevel control (3-level) that includes top predators, her-bivores and plants d, a predator exclusion (2-level) thatcontains only plants and herbivores n, a predator andherbivore exclusion (1-level) that contains only plants ¤.Three attempts to restore the system from 2-level to the3-level conditions were staggered over three years from1999 to 2001 (reintroduction: after 1999s, after 2000h,after 2001 M). The hypothesized critical threshold isindicated by the dotted line. Values are based on tenreplicates for each treatment in each time period. Fig-ure 4A is modified from Schmitz (2004b) and is repro-duced with permission from Blackwell Scientific.
Alternative Dynamic Regimes and Trophic Control of Plant Succession 665

M KCl using standard procedures (Hart and others1994). Extracted samples were refrigerated untilanalyzed for nitrate and ammonium content bycolorimetric assays at the University of GeorgiaSoil, Water, and Plant Analysis facility. We calcu-lated N mineralization rate using standard meth-odology (Hart and others 1994), which convertswet mass concentrations of nitrate and ammoniumin samples to dry mass concentrations. Net miner-alization rate is expressed as the difference in thesum of dry mass nitrate and ammonium concen-tration between consecutive monthly (28 days)sampling periods.
Results
We report here on the July 2003 sampling periodbecause this represents the height of the growing
season (Schmitz 2003), but conclusions are quali-tatively similar for earlier and later sampling.ANOVA’s (P = 0.05, df = 5, 49) followed by Tukeytests revealed that in general treatment effects on Nmineralization rate and PAR were parallel totreatment effects on S. rugosa abundance and onplant species evenness (Figure 5C, 5D). Namely,the 3-level control and 1-year perturbation andrecovery treatment were similar to each other butdiffered from the other treatments (Figure 5).There was one outlier: N-mineralization for the 6-year 2-level treatment was significantly interme-diate to the other treatments (Figure 5D). (This biaswas determined by two of ten plots with consis-tently (all sampling periods) high estimates of Nmineralization rate.) There was no systematictreatment effect on either soil surface temperatureor soil moisture (ANOVA, both P > 0.15).
Figure 5. Mean and standard error in: (A) steady state abundance of Solidago rugosa (% cover); (B) plant species evenness(from Schmitz 2004b); (C) photosyntheitically active radiation at ground surface (PAR, l mol s)1 m)2); and (D) nitrogenmineralization rate (mg g)1 month)1) in response to experimental removal and restoration of top predators. Treatmentsare long-term predator and herbivore exclusion (1), long-term predator exclusion (2), and natural (control) field state (3).Treatments 21, 22, and 23 represent predator restoration after 1, 2 and 3 years of exclusion, respectively. N = 10 replicatesfor each treatment. The food web diagrams (Figure 4A) depict trophic linkages (solid arrows) among predators (triangle),herbivores (circles), and plants (squares) in each treatment. In the natural field state (3), top predators exert an indirectnegative effect on S. rugosa (dotted arrow). This effect was re-established upon reintroducing predators after 1 year ofexclusion (21) but not after 2 and 3 years (22, and 23). The dotted lines (A and B) represent breakpoints between alternativeregimes.
666 O. J. Schmitz and others

Summary
The field experiment revealed that relationshipsamong S. rugosa relative abundance, plant speciesevenness, PAR and N mineralization rate areinfluenced by an indirect top–down keystone effectbetween a top predator and the competitive dom-inant plant S. rugosa. Long-term suppression of top–down control led to a regime shift in trophic controlof ecosystem function and the level of associatedbiophysical variables (plant species evenness, PAR,N-mineralization rate).
SYNTHESIS OF FIELD RESEARCH: RELATING
PROCESS TO PATTERN
In the field, S. rugosa is organized into a patchymosaic (Figure 1) in which it is comparatively rare(approximately 5%–20%) or comparatively abun-dant (approximately 35%–60%). There also ap-pears to be a sharp change (transition) betweentheses patches at approximately 25–30% (Fig-ure 1). The existence of patchy mosaics with sharpboundaries has been regarded as evidence that localhistory might determine community state(Sutherland 1974; Seabloom and Ricahrds 2003) inwhich case alternative dynamic regimes could bethe appropriate explanation for such pattern(Sutherland 1974; Seabloom and Richards 2003).To examine this more closely, we now use the re-sults of the field experiment demonstrating alter-native regimes to infer process in the patternobserved in the field survey.
In Figure 3, we treated PAR and soil N content asindependent variables and S. rugosa abundance as adependent variable—an appropriate relationship ifthe line of dependency is from resource-supply up tothe organism (that is, bottom–up control of patternand function). However, the field experiment re-vealed that S. rugosawas important inmediating top–down direct and indirect effects among predators,herbivores and resource supply (PAR and N miner-alization rate). That is, resource supply is dependenton S. rugosa abundance. Species evenness then be-comes dependent upon resource supply. We thusreinterpret the field pattern by switching dependentand independent variables (Figure 6). We alsosuperimpose on these graphs the breakpoints ob-served in the field experiment and the mean andstandard errors of the treatment response variablesin the field experiment. This comparison demon-strates strong congruence between the pattern ob-served in the field and in the experiment.
Below 25% S. rugosa abundance (that is, thetop–down controlled regime) both PAR and N
mineralization rates vary widely with S. rugosaabundance and this is reflected in treatment val-ues for the field experiment (Figure 6A, B). Be-yond 25% S. rugosa, (the bottom-up controlledregime) PAR and N mineralization vary tightlywith S. rugosa abundance. This same pattern ofvariation in response variable with the nature oftrophic control is observed in the relationshipbetween resource supply and plant species even-ness (Figure 6C, D).
In light of the correspondence between the fieldsurvey and the experiment, we expect to see widevariation in plant species evenness and S. rugosaabundance when top–down control should prevail(that is, less then or equal to 25% S. rugosa) and atight relationship between plant species evennessand S. rugosa abundance when bottom-up control isexpected to prevail (that is, greater than 25%).Reanalysis of the data in Figure 2 bears this out.Linear regression using Systat 9.0 for Windowsrevealed a significant positive relationship over therange 0–25% S. rugosa abundance (F = 10.53, df 1,57, P < 0.01). Moreover, little of the variation inthe data is explained by this regression (R2 = 0.39).The data beyond 25% S. rugosa reveal a differentpattern. There is a significant negative relationshipbetween evenness and S. rugosa abundance(F = 13.78, df = 1, 21, P < 0.01) and the regressionexplains almost 2 times more variation in the data(R2 = 0.63).
Our synthesis thus suggests that hump-shapeddiversity curves (Figure 2) and inverse relationshipsbetween limiting resources (for example, Figure 3;Figure 8.13 in Tilman 1988) derived from fieldsurveys offer equivocal evidence for the resourceratio hypothesis (and alternative regime hypothesisfor that matter) primarily because they cannot re-solve sharp breakpoints if they exist. Rather, it iscritical to deploy companion field experiments toelucidate whether or not alternative regimes existand if so where the breakpoints in the system lie.
DISCUSSION
Evidence from the field experiment and fieldsampling revealed that a competitive dominantplant species, S. rugosa, transformed importantbiotic (diversity) and biophysical (N-mineralizationrate, photosynthetically active radiation) propertiesof an old-field ecosystem as it increased in abun-dance. Such ecosystem transformation could beconsistent with long-held views of plant successionprogressing entirely via competitive (bottom–upcontrolled) processes. However, the identificationof alternative regimes, thresholds, and abrupt shifts
Alternative Dynamic Regimes and Trophic Control of Plant Succession 667

in abundance of the competitive dominant suggeststhat successional development and correspondingecosystem change is not solely competition-driven.Instead, we offer that succession can proceed viaabrupt transitions to alternative regimes in re-sponse to alteration of trophic control of ecosystemfunction, consistent with the idea proposed byHolling (1986).Early proposals that succession proceeds via
transitions to alternative regimes (Matthews 1979;Sutherland 1974) were criticized for failing to meetspecific criteria (Connell and Sousa 1983). Namely:(1) One must demonstrate threshold relationshipsbetween ecosystem properties (for example, pro-ductivity, species diversity) and associated biotic orabiotic factors controlling those properties; (2) Onemust show that manipulating the controlling factorleads to irreversible regime changes by causing thesystem to cross a breakpoint (sensu May 1977); (3)One must show that different regimes propagatefrom similar initial conditions and that they persistunder similar abiotic conditions. (4) Finally, onemust also show that alternative regimes persist
under identical abiotic environmental conditionsfor at least one complete turnover of all individualsin the system.
Our evidence is largely consistent with thesecriteria. Experimental predator removal disruptedan important controlling factor of ecosystem func-tion—an indirect keystone predation effect thatarrested the progression of the competitive domi-nant plant S. rugosa. This allowed S. rugosa to pro-liferate (Figure 4). Temporally-staggered predatorreintroductions eventually failed to re-establish thekeystone effect because S. rugosa abundance cros-sed a critical threshold and entrained into analternative regime (Figure 4). The different regimespersisted anywhere from two to four years once thetime series reached a steady state. The more strik-ing feature is that all reintroduction treatmentsentrained to the bottom–up controlled regime onceS. rugosa exceeded 25%. All of the arthropodspecies in the system have annual life-cycles, soadults of these species turned over multiple times.The plants are either biennials or perennials. Theseplants die back to their root stocks at the end of
Figure 6. Relationships between biophysical properties (A: Photosyntheitically active radiation at ground surface PAR, lmol s)1 m)2; B: N-mineralization rate mg g)1 month)1) and relative abundance (% cover) of a competitive dominant plantspecies S. rugosa, and between biophysical properties and plants species evenness (C, D). The figures superimpose valuessampled at two locations (Upper black circles; Lower gray circles) with treatment values measured in the field experiments(large black circles with standard errors). The dotted lines represent breakpoints between the top–down and bottom–upcontrolled regimes revealed by the field experiment.
668 O. J. Schmitz and others

each growing season and produce new individualstems the following growing season. Moreover, therhizomes from which Solidago stems are producedpersist up to 5–6 years (Cain and others 1991).Thus, much of the turnover of vegetative produc-tion by an individual S. rugosa plant potentiallyoccurred within the duration of the fieldexperiment.
Holling (1986) proposed three additional eviden-tiary criteria were needed to conclude that succes-sion may proceed via transitions to alternativeregimes. First, the ecological system has to build upinto a complex network of trophic interactions.Second, the boundary between alternative dynamicregimes must be narrow so disturbances can easilypush the system abruptly from one regime to an-other. Third, the shift between regimes can beinternally or externally driven. Long-term research(Schmitz 2004a) has revealed that the old-field sys-tem is comprised of many consumer species con-nected by a large network of direct and indirectinteractions. Thefield experiment revealed anarrowtransition zone separating the top–down and bot-tom–up controlled regimes (Figure 4A) and plantspecies evenness (Figure 4B). S. rugosa abundance inthe ecosystemwas experimentally pushed across thethreshold after a short 2 years following initial per-turbation (Figure 4) and led to different values ofecosystem variables like solar radiation striking thesoil surface and nitrogen mineralization rate (Fig-ure 5C, 5D). Finally, experimental disruption of theinternal factor (the indirect keystone effect) resultedin the abrupt regime shift.
The Exploitation Ecosystems Hypothesis, whichpredicts that top–down control weakens as plantnutrient supply or standing plant biomass—surro-gates for productivity—increase (Oksanen 1990)proposes a potential alternative explanation for ourresults. Under this hypothesis, the strength of top–down control should vary in a continuous, hump-shaped manner along a gradient of nutrient supplyor plant biomass, viz., top–down control should bestrongest in the middle of the gradient and weakestat either end of the gradient (Schmitz 1992).Moreover, the shift from top–down to bottom-upcontrol should be gradual (Schmitz 1992). In oursystem, however, the strength of top–down controlalong a Solidago rugosa biomass gradient is z-shapedrather than hump-shaped (see Figure. 1 in Schmitz2004b), suggesting consistently strong top–downcontrol over part of the gradient and an abrupt shiftto weak top–down control over the remainder ofthe gradient.
The switch from the top–down to the bottom-upcontrolled regime in our experiment was induced
by complete removal of the top predator trophiclevel. Such complete loss of a trophic level is un-likely to occur in natural settings however. Never-theless, top predator control of ecosystem functioncan be systematically altered by exogenous climaticfactors that alter the strength of the indirect key-stone effect. In the study system, grasshopper sur-vival changed by 88% between years with a small(3–4!C) difference in temperature (Ovadia andSchmitz 2003). Such a small, but season-long tem-perature increase can decouple predator–herbivoreinteractions leading to an abrupt shift from top–down to bottom–up control (Chase 1996). An in-crease in rainfall also can cause a shift from top–down to bottom–up control. A 20% rainfall increasewas shown to decrease the strength of top–downcontrol by 80%, because wetter conditions lowergrasshopper survival and cause plants to becomemore productive and compensate for herbivory(Ovadia and Schmitz 2004).
The idea of alternative regimes may seemincompatible for systems with clonally growingspecies like Solidago. After all, there is potential for asingle individual to exist in 2 different regimes,given the adjacency of different patches (Figure 1)and our definition of regimes based on patchstructure. However, previous research (Cain andothers 1991) has shown that the mean length ofSolidago rhizomes is on the order of 11–13 cm andthat rhizome growth involves considerable randomadvancing and backtracking. Thus the linear extentof a clone is restricted to a locally narrow domainbecause of the low net displacement of the rhi-zomes from a point of origin (Cain and others1991). Moreover, consumers can limit the pro-duction and growth of both rhizomes and associ-ated emergent aboveground shoots (Cain andothers 1991) and consumer effects may be quitelocal. Field mark-release experiments in our system(O.J. Schmitz, unpublished) revealed thatM. femurrubrum grasshoppers undergo a net dis-placement of 111.2 cm ± 24.4 cm (1 SE, n = 14)from their point of release over the course of 2days. This displacement compares with that foundfor this species at other locations (Narisu and others1999) and falls well within the area of the 2 m · 2m experimental field plots and the 4 m · 4 m orgreater patches of natural vegetation within thefield (Figure 1). We propose therefore, that alter-native regimes and clonal growth can be consistentwhenever species clones exist in local patches. Inour case, as S. rugosa relative abundance ap-proaches 20–25%, climate-altered strength of top–down control may allow S. rugosa to rapidlyincrease in abundance via above- and below-
Alternative Dynamic Regimes and Trophic Control of Plant Succession 669

ground expansion outward into space along a wavefront at the patch boundaries, giving rise to thepatchy mosaics observed in the field.We also propose that the patchy mosaic in the
field is maintained over the long-term becausesuccession may not proceed by continuousproliferation of the competitive dominant once thebottom–up controlled regime is reached. This isbecause an alternative mechanism of top–downcontrol may emerge as a consequence of Solidagoreaching high field densities. In many old-fieldsystems, dense concentrations of Solidago speciesattract specialist insect species and foster theiroutbreak which in turn causes Solidago to be dev-astated (Carson and others 2004). This feedbackfrees resources for subordinate plant species(Carson and others 2004) to the extent that thestage of successional development can be reset. Wesuggest further that such severe damage may pushthe ecosystem from a bottom–up back to a top–down controlled regime. The cyclic transition froma top–down to bottom-up controlled regime fol-lowed by resetting to a top–down controlled regimemay explain why old-field succession persists for50–60 or more years despite many Solidago species’capacities to rapidly increase in abundance, reduceresource levels and thus preempt other plant spe-cies when top–down control is altogether absent(for example, Figure 4).This study contributes to growing evidence that
top–down effects of consumers can have major ef-fects on succession by altering light and soil nutri-ent levels (Pastor and Naiman 1992; Pastor andothers 1993; Kielland and Bryant 1998; Carson andRoot 1999). In our system, top–down effects likelyprolong early succession by arresting S. rugosaabundance at or below 25%. However, top–downcontrol can be disrupted thus allowing the systemto cross a critical breakpoint and entrain into abottom–up controlled regime. We therefore do notsuggest here that the resource ratio hypothesis ofplant succession should be discarded altogether.Rather, the resource ratio hypothesis can be nestedwithin the alternative regime framework. Thus,consumer effects dominate by mediating resourceratio competition in the top–down controlled re-gime as shown in theoretical analyses (Holt andothers 1994; Leibold 1996). This may explain theweak coupling between S. rugosa abundance andplant species evenness uncovered over the domain0–25% S. rugosa abundance in Figure 2. We expectresource ratio competition to dominate once thesystem entrains into the bottom-up controlled re-gime. This would explain the rapid proliferation ofS. rugosa—a superior competitor for light and soil
N—when consumers are removed from the system(Treatment 1: Figure 4A) and the tighter couplingbetween S. rugosa abundance and evenness beyond25% S. rugosa (Figure 2).
Our interpretation of the collective body of evi-dence presented here is that a single ecosystem candisplay both top–down and bottom–up control.These shifts in trophic control are mirrored byabrupt changes in ecosystem properties such asplant species diversity and resource supply (solarradiation at soil surface and nitrogen mineraliza-tion rate), consistent with a working hypothesisthat succession proceeds via abrupt regime shifts(Holling 1986).
ACKNOWLEDGEMENTS
We wish to thank W. Carson, J. Cronin,J. McKenna and M. Smith for helpful discussionand comments. This research was funded by NSFgrant DEB-0107780 to OJS and a grant from theSperry-Carpenter fund to ELK.
REFERENCES
Bach CE. 1994. Effects of a specialist herbivore (Altica subplicata)
on Salix cordata and sand dune succession. Ecol Monogr64:423–45.
Bazzaz FA. 1979. The physiological ecology of plant succession.
Ann Rev Ecol Syst 10:351–71.
Bazzaz FA. 1996. Plants in a changing environment. Cambridge
(UK): Cambridge University Press.
Brown VK, Gange AC. 1992. Secondary plant succession: how is
it modified by herbivory? Vegetatio 101:3–13.
Brown VK, Jepson M, Gibb CWD. 1988. Insect herbivory: effects
of early old-field succession demonstrated by chemicalexclusion methods. Oikos 52:293–302.
Cain ML, Carson WP, Root RB. 1991. Lon-term suppression of
insect herbivores increase the production and growth of Sol-
idago altissima rhizomes. Oecologia 88:251–7.
Carson WP, Cronin JP, Long ZT. 2004. A general rule for pre-dicting when insects will have strong top–down effects on
plant communities: on relationship between insect outbreaks
and host concentration. In: Weisser WW, Siemann E, Eds.
Insects and ecosystem function. Springer series in ecologicalstudies. Berlin: Springer-Verlag. p 193–211.
Carson WP, Root RB. 1999. Top–down effects of insect herbi-
vores during early succession: influence of biomass and plant
dominance. Oecologia 121:260–72.
Carson WP, Root RB. 2000. Herbivory and plant species coex-istence: community regulation by an outbreaking phytopha-
gous insect. Ecol Monogr 70:73–100.
Chase JM. 1996. Abiotic controls of trophic cascades in a simple
grassland food chain. Oikos 77:495–506.
Clements FE. 1916. Plant succession: an analysis of the devel-
opment of vegetation. Carnegie Institute Washington Publi-
cation 242.
Connell JH, Slatyer RO. 1977. Mechanisms of succession in
natural communities and their role in community stability.Am Nat 111:1119–44.
670 O. J. Schmitz and others
Connell JH, Sousa WP. 1983. On the evidence needed to
judge ecological stability or persistence. Am Nat 121:789–824.
Cooper WS. 1913. The climax forest of Isle Royale, Lake Supe-
rior, and its development. Botanical Gazette 55:1–44.
Corbett SA. 1995. Insects, plants and succession: the advantageof long-term set aside. Agric, Ecsosys Environ 53:201–17.
CowlesHC. 1899. The ecological relations of the vegetation on the
sand dunes of Lake Michigan. Botanical Gazette 27:95–117.
Crawley MJ. 1983. Herbivory: the dynamics of animal–plant
interactions. Oxford (UK): Blackwell Scientific.
Davidson DW. 1993. The effects of herbivory and granivory onterrestrial plant succession. Oikos 68:23–35.
Duffy JE. 2002. Biodiversity and ecosystem function: the con-
sumer connection. Oikos 99:201–19.
Elton C. 1927. Animal ecology. London: Sidgwick and Jackson.
Foster BL, Tilman D. 2000. Dynamic and static views of suc-cession: testing the descriptive power of the chronosequence
approach. Plant Ecol 146:1–10.
Fraser LH, Grime JP. 1998. Top–down control and its effect on
biomass and composition of three grasses at high and low soilfertility in outdoor mesocosms. Oecologia 113:239–46.
Gunderson LH. 2000. Ecological resilience—in theory and
application. Ann Rev Ecol Syst 31:425–39.
Gleason HA. 1927. Further views on the succession concept.
Ecology 8:299–326.
Gutierrez J, Meserve PL, Herrera S, Contreras LC, Jaksic FM.1997. Effects of small mammals and vertebrate predators on
vegetation in the Chilean semi-arid zone. Oecologia 109:396–
406.
Hairston NG, Hairston NG. 1993. Cause–effect relationships inenergy flow, trophic structure and interspecific interactions.
Am Nat 142:379–411.
Harper JL. 1969. Role of predation in vegetational diversity.
Brookhaven Symposia in Biology 22:48.
Hart SC, Stark JM, Davidson EA, Firestone MK. 1994. Nitrogenmineralization, immobilization, and nitrification. Methods of
soil Analysis, Part 2. Microbiological and biochemical prop-
erties. Soil Science of America Book Series, no. 5. p 985–1018.
Holling CS. 1986. The resilience of terrestrial ecosystems: localsurprise and global change. In: Clark WC, Munn RE, Eds.
Sustainable development of the biosphere. Cambridge, UK:
Cambridge University Press. p 292–317.
Holt RD, Grover J, Tilman D. 1994. Simple rules for interp-specific dominance in systems with exploitative and apparent
competition. Am Nat 144:741–71.
Hutchinson GE. 1959. Homage to Santa Rosalia, or why are
there so many kinds of animals? Am Nat 93:145–59.
Kielland K, Bryant JP. 1998. Moose herbivory in taiga: Effects onbiogeochemistry and vegetation dynamics in primary succes-
sion. Oikos 82:377–83.
Krebs, CJ. 1989 Ecological methodology New York (NY): Harper
and Row.
Kuijper DPJ, Nijhoff DJ, Bakker JP. 2004. Herbivory and com-petition slow down invasion of a tall grass along a productivity
gradient. Oecologia 141:452–9.
Lawton JH. 1983. Plant architecture and the diversity of phy-
tophagous insects. Annu Rev Entomol 28:23–39.
Leibold MA. 1996. A graphical model of keystone predators in
food webs: trophic regulation, of abundance, incidence, and
diversity patterns in communities. Am Nat 147:784–812.
Lindeman R. 1942. Trophic-dynamic aspect of ecology. Ecology
23:399–418.
Loreau M, Naeem S, Inchausti P, Bengtsson J, Grime JP,
Hector A, Hooper DU, Huston MA, Raffaelli D, Schmid B,
Tilman D, Wardle DA. 2001. Biodiversity and ecosystem
functioning: current knowledge and future challenges.Science 294:804–8.
Matthews JA. 1979. A study of the variability of some succes-
sional and climax plant assemblage-types using multiple dis-
criminant analysis. J Ecol 67:255–71.
May RM. 1977. Thresholds and breakpoints in ecosystems with amultiplicity of stable states. Nature 269:471–7.
Morin PJ. 1999. Community ecology. Oxford: Blackwell Science.
Narisu , Lockwood JA, Schell SP. 1999. A novel mark-recapture
technique and its application to monitoring the direction anddistance of local movement of rangeland grasshoppers
(Orthoptera: Acrididae) in the context of pest management. J
Appl Ecol 36:604–17.
Odum EP. 1969. The strategy of ecosystem development. Sci-
ence 164:262–70.
Oksanen L. 1990. Predation, herbivory and plant strategies along
gradients of primary productivity. In: Grace JB, Tilman D, Eds.
Perspectives on plant competition. New York: Academic Press.
p 445–74.
Ovadia O, Schmitz OJ. 2004. Weather variation and trophic
interaction strength: sorting the signal from the noise. Oeco-
logia 140:398–406.
Paine RT. 2002. Trophic control of production in a rocky inter-
tidal community. Science 296:736–9.
Pastor J, Naiman RJ. 1992. Selective foraging and ecosystem
processes in boreal forests. Am Nat 139:690–705.
Pastor J, Dewey B, Naiman RJ, McInnes F, Cohen Y. 1993.
Moose browsing and soil fertility in boreal forests of IsleRoyale National Park. Ecology 74:467–80.
Peet RK, Christensen NL. 1980. Succession: a population pro-
cess. Vegetatio 43:131–140.
Peterson CH. 1984. Does a rigorous criterion for environmental
identity preclude the existence of multiple stable points? AmNat 124:127–33.
Petraitis PS, Latham RE. 1999. The importance of scale in testing
the origins of alternative community states. Ecology80:429–42.
Pickett STA. 1989. Space for time substitution as an alternative
to long-term studies. In: Likens GE, Ed. Long-term studies inecology. Chichester: Wiley. p 71–88.
Pickett STA, Collins SL, Armesto JJ. 1987. Models, mechanisms
and pathways of succession. Bot Rev 53:335–71.
Polis GA, Strong DR. 1996. Food web complexity and commu-
nity dynamics. Am Nat 47:813–46.
Ritchie ME, Tilman D, Knopps JM. 1998. Herbivore effects on
plant and nitrogen dynamics in oak savanna. Ecology 79:165–
77.
Scheffer M, Carpenter SR. 2003. Catastrophic regime shifts in
ecosystems: linking theory to observation. TREE 18:648–656.
Scheffer M, Carpenter SR, Foley JA, Folke C, Walker B. 2001.
Catastrophic shifts in ecosystems. Nature 413:591–6.
Schmitz OJ. 1992. Exploitation in model food chains with
mechanistic consumer-resource dynamics. Theor PopulationBiol 41:161–83.
Schmitz OJ. 2003. Top predator control of plant biodiversity
and productivity in an old field ecosystem. Ecol Lett 6:156–
63.
Alternative Dynamic Regimes and Trophic Control of Plant Succession 671

Schmitz OJ. 2004a. From mesocosms to the field: the role and
value of cage experiments in understanding top–down effectsin ecosystems. In: Weisser WW, Siemann E, Eds. Insects and
ecosystem function. Springer series in ecological studies.
Berlin: Springer-Verlag. p 277–302.
Schmitz OJ. 2004b. Perturbation and abrupt shift in trophiccontrol of biodiversity and productivity. Ecol Lett 7:403–9.
Seabloom EW, Richards SA. 2003. Multiple stable equilibria in
grasslands mediated by herbivore population dynamics and
foraging behavior. Ecology 84:2891–904.
Siemann E, Tilman D, Haarstad J, Ritchie ME. 1998. Experi-mental tests of the dependence of arthropod diversity on plant
diversity. Am Nat 152:738–50.
Siemann E, Haarstad J, Tilman D. 1999. Dynamics of plant and
arthropod diversity during old field succession. Ecography22:406–14.
Sinclair ARE. 1989. Population regulation in animals. In: Cherett
JM, Ed. Ecological concepts. Oxford: Blackwell Scientific. p
197–241.
Smith RL. 1996. Ecology and Field biology. 5th ed. New York:Harper and Collins Publishers.
Southwood TRE, Brown VK, Reader PM. 1979. The relationship
of plant and insect diversities in succession. Biol J the Linnean
Society 12:327–48.
Strong DR. 1992. Are trophic cascades all wet? Differentiation
and donor control in a speciose system. Ecology 73:747–54.
Sutherland JP. 1974. Multiple stable points in natural commu-
nities. American Naturalist 108:859–73.
Tansley AG. 1935. The use and abuse of vegetational concepts
and terms. Ecology 16:284–307.
TilmanD. 1988. Plant strategies and the dynamics and structure of
plant communities. Princeton (NJ): Princeton University Press.
Tscharntke T, Greiler H. 1995. Insect communities, grasses, andgrasslands. Ann Rev Entomol 40:535–58.
Uriarte M. 2000. Interactions between goldenrod (Solidago
altissima L.) and its insect herbivore (Trirhabda virgata) over
the course of succession. Oecologia 122:521–8.
Uriarte M, Schmitz OJ. 1998. Trophic control across a naturalproductivity gradient with sap-feeding herbivores. Oikos
82:552–60.
White TCR. 1978. The importance of relative shortage of food in
animal ecology. Oecologia 33:71–86.
Wilsey BJ, Potvin C. 2000. Biodiversity and ecosystem func-tioning: Importance of species evenness in an old field. Ecol-
ogy 81:887–92.
Wilsey BJ, Chalcraft DR, Bowles CM, Willig MR. 2005.
Relationships among indices suggest that richness is anincomplete surrogate for grassland biodiversity. Ecology
86:1178–84.
Wootton JT. 2002. Mechanisms of successional dynamics: con-
sumers and the rise and fall of species dominance. Ecol Res17:249–60.
672 O. J. Schmitz and others