alternative investments— - fa mag
TRANSCRIPT
OVERVIEW
This is a challenging time for investors. New demands are being
placed on them as many fi nancial and economic experts confi rm
that the investment returns of the past twenty-fi ve years are
not necessarily indicative of the next quarter century’s
performance. Moreover, conventional diversifi cation and long-
term growth strategies need to evolve to keep pace with the vast
number of Americans who are on the cusp of extended and
active retirements.
These factors, though challenging, also make it an exciting
time for investors as they search for new asset classes that
can potentially add value to their overall asset allocation. Many
institutional investors and high-net worth individual investors have
discovered alternative investments. Are individual investors next?
In this paper, we will review the changing investment
environment, defi ne alternative investments, assess their potential
and examine the role they can play in a portfolio positioned for
new diversifi cation and long-term growth opportunities. With this
insight, you can appreciate alternative investments’ ability to help
investors aggressively pursue their long-term goals and support
the millions of Americans who want to maintain their lifestyles in
retirement for many years.
THE CHANGING INVESTMENT ENVIRONMENT
Heightened volatility in the equity markets and record low bond
yields have made investment success more challenging for
many investors. Added to that is the fact that individual investors
are shouldering greater personal responsibility for their own
retirement income. The consequences of poor investment
decisions could, potentially, be more severe.
The straightforward investment strategy of emphasizing
U.S. stocks and bonds that worked for previous generations of
investors may not be enough going forward. It remains unclear
what direction U.S. stock and bond returns will go in the future.
Is it possible that the twenty-three year cycle of falling interest
rates that fueled U.S. stock and bond returns from 1982 to 2005
is over?
CURVANOMICS
10-YEAR TREASURY YIELD (1982–2008)
Source: http://www.treas.gov
0%
2%
4%
6%
8%
10%
12%
14%
1982
2004
2000
1986
1988
1984
1990
1992
1994
1996
1998
2008
2002
2006
How low can long-term rates go?
WHITE PAPER 2009
ALTERNATIVE INVESTMENTS—
INSIGHTS FOR INDIVIDUAL INVESTORS
For financial professional use only. Not for public viewing or distribution.
The changing investment environment
Alternative investments in perspective
Emulating the practices of leading institutional investors
may help individual investors meet their goals
Implementing an investment strategy using alternative
asset classes
HIGHLIGHTS

For financial professional use only. Not for public viewing or distribution. W H I T E PA P E R / / PA G E 2
CORRELATION OF S&P 500® TO MSCI EAFE®
Source: Morningstar, Inc., as of 12/31/08. Performance is historical and does not
guarantee future results. Correlation measures how assets perform in relation to
one another. A 1.0 correlation indicates assets with exactly the same pattern. A -1.0
correlation indicates an exact opposite return pattern. A zero correlation indicates an
unrelated return pattern.
Global markets are not the only ones that seem to have become
more closely correlated to the S&P 500® in recent years. As you
can see from this chart, small-caps and large-caps, as represented
by the Russell 2000 and Russell 1000 Indexes, have a fairly
high correlation to the S&P 500® Index for the fi ve years ended
12/31/08.
CORRELATION TO THE S&P 500® INDEX (2004–2008)
Source: Morningstar, Inc. as of 12/31/08.
Perhaps the greatest individual investor challenges going forward
are lowered return expectations combined with increased return
requirements of pre-retirees and retirees. The “long-only liquid
bonds and stocks” constraint still limits the overwhelming majority
of U.S. institutional and retail assets to these traditional types of
investments. Is it possible for investors to create portfolios (using
alternative investments) with similar risk characteristics and greater
return potential? Will it be possible to liberate the effi cient frontier?
Investors may no longer be able to rely on declining rates to drive
stock and bond returns.
THE RETURN EXPECTATION REALITY
Source: Morningstar, Inc., as of 12/31/08, U.S. Stocks are represented by the
S&P 500® Index, Bonds represented by Barclays Capital (BarCap) U.S. Aggregate
Index. Past performance is historical and does not guarantee future results.
Index returns assume reinvestment of all distributions and, unlike mutual funds,
do not refl ect fees or expenses. It is not possible to invest directly in an index.
Going forward, many industry forecasters are predicting much
lower expected returns in both the equity and fi xed income
markets. At Deutsche Asset Management’s Quantitative
Strategies Group, we produce market forecasts of expected
returns. Our long-term (20 years) forecast for the U.S. equity
(as represented by the S&P 500® Index) and the bond
(as represented by the Barclays Capital (BarCap) U.S. Aggregate
Index) markets are considerably lower than the historical returns
of the 1980s and 1990s.1
For many investors, international investments have historically
provided the dual benefi t of broadening the investor’s opportunity
set while also adding meaningful portfolio diversifi cation.
The diversifi cation benefi t seems to be declining, as U.S. and
international markets become more correlated due
to globalization.
Time Period Correlation of S&P 500® to MSCI EAFE®
1980–1989 0.47
1990–1999 0.54
2000–2008 0.86
-5%
0%
5%
10%
15%
20%
-5%
0%
5%
10%
15%
20%
1980–1989 1990–1999 2000–2008 1980–1989 1990–1999 2000–2008
17.6% 12.4% 7.7% 6.4%18.2%
-3.6%
U.S. Stocks Average Annualized Return U.S. Bonds Average Annualized Return
1Opinions and estimates, including forecasts of conditions, refl ect our judgment
as of the date of this presentation and are subject to change without notice. Such
opinions and estimates, including forecasts of conditions, involve a number of
assumptions and may not prove valid. The past performance of securities or other
instruments is not indicative of future results and the value of investments and
income arising there from can fall as well as rise. No assurance can be given that
the investment objectives will be met or that an investor will receive a return of all
or part of their investment. No representation or warranty is made that any portfolio
or investment described herein would yield favorable investment results.
MSCI EAFE
Russell1000 Growth
Russell1000 Value
Russell2000
Russell2000 Growth
Russell2000 Value
0.89%
0.97%
0.98%
0.90%
0.90%
0.87%
For financial professional use only. Not for public viewing or distribution. W H I T E PA P E R / / PA G E 3
In recent years, some of those barriers have lessened and alterna-
tive investment products are becoming available to the average
investor. Before discussing alternative investments and their pos-
sible inclusion in an investor’s portfolio, it’s important to under-
stand the different types of alternative asset classes.
The term alternative investment covers a broad range of
investment strategies that fall outside the realm of traditional
asset classes. Alternative investments are actually many different
investment strategies—each with unique characteristics. The
following profi les of the main alternative investment categories
convey some of their unique properties.
Commodities
Commodities, also referred to as Managed Futures, include
investments in energy, metals, agricultural products and
currencies. Listed commodity futures instruments are used to
establish investment positions.
These investments may provide the greatest diversifi cation
benefi t of any alternative investment category, as correlations to
traditional U.S. stock and bond investments have been very low.
Their low correlation stems from the fact that commodities tend
to perform well when interest rates and infl ation are rising—
periods when most fi nancial assets tend to suffer.
LIBERATED EFFICIENT FRONTIER
As you can see in this hypothetical effi cient frontier, alternative
investments, in theory, allow an investor to achieve greater
returns than a traditional portfolio, with essentially the same risk.
We believe alternative asset classes and products will be at the
forefront of an “alternative revolution.”
ALTERNATIVE INVESTMENTS IN PERSPECTIVE
Alternative investments were once the sole province of institu-
tions, endowments and high net worth individuals. There were bar-
riers to entry that typical individual investors faced that made most
alternative investments impossible investment options.
Ret
urn
Risk
Bonds
Stocks
Portfolio withAlternatives
TraditionalPortfolio
Alternative investments: Typically are not publicly traded
and have low correlation with U.S. stocks and bonds.
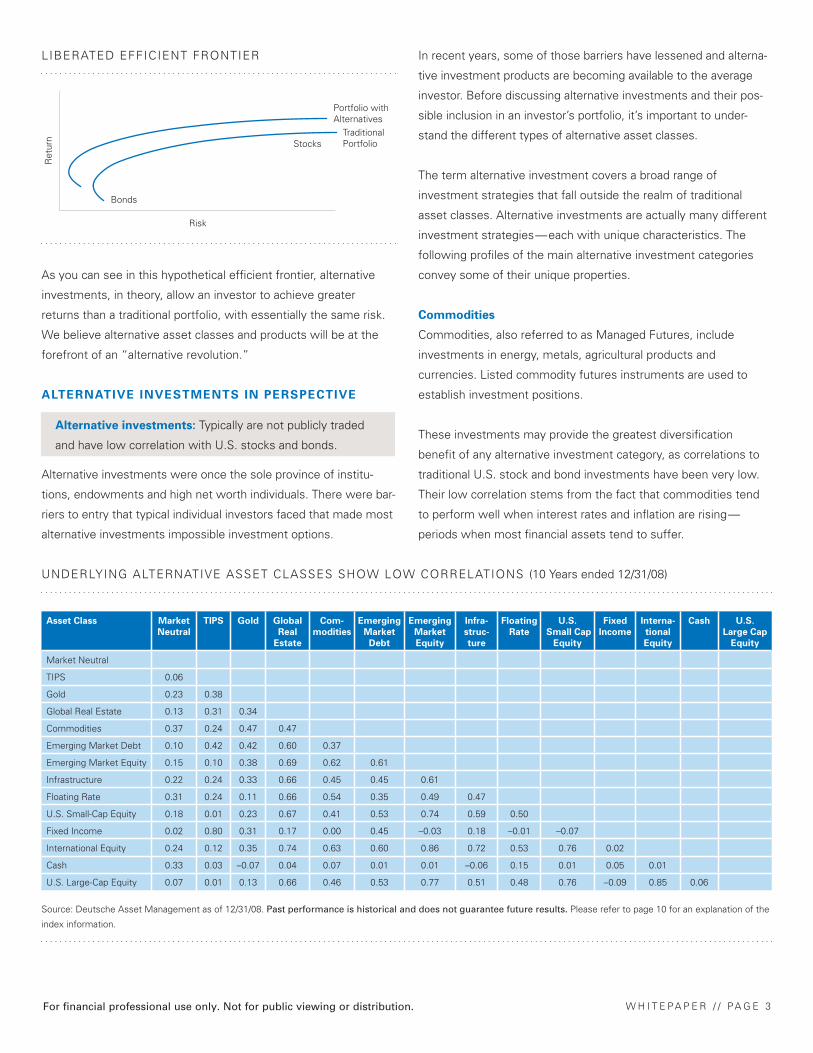
UNDERLYING ALTERNATIVE ASSET CLASSES SHOW LOW CORRELATIONS (10 Years ended 12/31/08)
Source: Deutsche Asset Management as of 12/31/08. Past performance is historical and does not guarantee future results. Please refer to page 10 for an explanation of the
index information.
Asset Class Market
Neutral
TIPS Gold Global
Real
Estate
Com-
modities
Emerging
Market
Debt
Emerging
Market
Equity
Infra-
struc-
ture
Floating
Rate
U.S.
Small Cap
Equity
Fixed
Income
Interna-
tional
Equity
Cash U.S.
Large Cap
Equity
Market Neutral
TIPS 0.06
Gold 0.23 0.38
Global Real Estate 0.13 0.31 0.34
Commodities 0.37 0.24 0.47 0.47
Emerging Market Debt 0.10 0.42 0.42 0.60 0.37
Emerging Market Equity 0.15 0.10 0.38 0.69 0.62 0.61
Infrastructure 0.22 0.24 0.33 0.66 0.45 0.45 0.61
Floating Rate 0.31 0.24 0.11 0.66 0.54 0.35 0.49 0.47
U.S. Small-Cap Equity 0.18 0.01 0.23 0.67 0.41 0.53 0.74 0.59 0.50
Fixed Income 0.02 0.80 0.31 0.17 0.00 0.45 –0.03 0.18 –0.01 –0.07
International Equity 0.24 0.12 0.35 0.74 0.63 0.60 0.86 0.72 0.53 0.76 0.02
Cash 0.33 0.03 –0.07 0.04 0.07 0.01 0.01 –0.06 0.15 0.01 0.05 0.01
U.S. Large-Cap Equity 0.07 0.01 0.13 0.66 0.46 0.53 0.77 0.51 0.48 0.76 –0.09 0.85 0.06
For financial professional use only. Not for public viewing or distribution. W H I T E PA P E R / / PA G E 4
Emerging Markets
Emerging Markets are the financial markets of a developing
country—typically a small market with a short operating history.
Emerging Markets are characterized as transitional, meaning they
are in the process of moving from a closed to an open market
economy while building accountability within the system. These
countries constitute approximately 80% of the global population,
representing approximately 20% of the world's economies.
Floating Rate Loans
Floating Rate Loans are debt fi nancing obligations generally
issued by banks to corporations, and they hold legal claim to the
borrower's assets above all other debt obligations. The loan is
considered senior to all other claims against the borrower, which
means that in the event of a bankruptcy the senior bank loan is
the fi rst to be repaid. Corporate borrowers, who typically have
credit ratings below investment-grade, pay interest rates that
reset periodically (they “fl oat”) as interest rates change.
Global Tactical Asset Allocation
Global Tactical Asset Allocation (GTAA) is a strategy that adds
value through tactical asset allocation. This strategy seeks out-
performance from macro or “top-down” decisions which may
include broad asset classes (global stocks and bonds), regions/
countries within global stocks and bonds, currencies, as well
as sectors. Instead of deciding which individual securities to
overweight or underweight, a GTAA manager decides which
country indexes to overweight and underweight. This top-
down distinction means that GTAA managers are not looking
for ineffi ciencies between securities, but rather ineffi ciencies
between entire markets and regions.
Hedge Funds
Hedge Funds are structured as limited partnerships. They typically
have broad latitude to use a combination of sophisticated invest-
ment techniques such as taking both long and short positions,
using leverage and derivatives, and investing in variety of markets.
The term hedge fund includes a broad spectrum of investment
strategies. At the conservative end of the spectrum are “absolute
return” oriented market-neutral strategies—whose objective is to
provide investors with a positive return regardless of the market
environment. At the more aggressive end of the spectrum, global
macro strategies make directional bets on currencies, stocks and
interest rates and are often leveraged and highly volatile.
Infrastructure
Infrastructure is comprised of highly diverse assets, with no two
having identical attributes. The asset class is an amalgamation of
various sectors, including roads, bridges, dams, ports, airports,
power generation and distribution, transmission of electricity,
water and gas utilities and communications. Despite the
differences, infrastructure assets have certain traits in common,
including: high barriers to entry, high degrees of regulation, high
initial capital expenditure, stable cash fl ow, inelastic demand, and
long duration assets. Infrastructure is evolving into one of the
hottest alternative asset classes.
Private Equity
Private equity refers to equity investments in companies which are
not listed on publicly-traded stock exchanges. Most institutional
investors obtain Private Equity exposure via Private Equity Funds
which primarily invest in leveraged buyouts and venture capital.
Real Estate
Equity real estate includes investments in offi ce, retail, residential,
and industrial properties. Institutional investors access real estate
via both private and public vehicles.
Private Equity Real Estate is typically offered via limited
partnership funds. Public Equity Real Estate is accessed by
institutional investors via publicly-traded Real Estate Investment
Trusts (REITS). They are publicly traded entities that invest
in offi ce buildings, apartment complexes, industrial facilities,
shopping centers and other commercial spaces. Most REITs trade
on major stock exchanges.
TIPS
TIPS stands for Treasury Infl ation-Protected Securities. Introduced
by the federal government in 1997, TIPS are designed to protect
portfolios from declining purchasing power during infl ationary
periods. Like traditional Treasuries, TIPS pay a fi xed rate of
interest, but their principal, to which the interest rate is applied, is
linked to the current infl ation rate. Therefore, TIPS help investors
manage infl ation risk. TIPS are backed by the full faith and credit
of the U.S. government.
New alternative asset classes will continue to evolve over time.
It is important for investors to be able to adequately evaluate
these investment options to determine whether or not they are an
appropriate investment.
For financial professional use only. Not for public viewing or distribution. W H I T E PA P E R / / PA G E 5
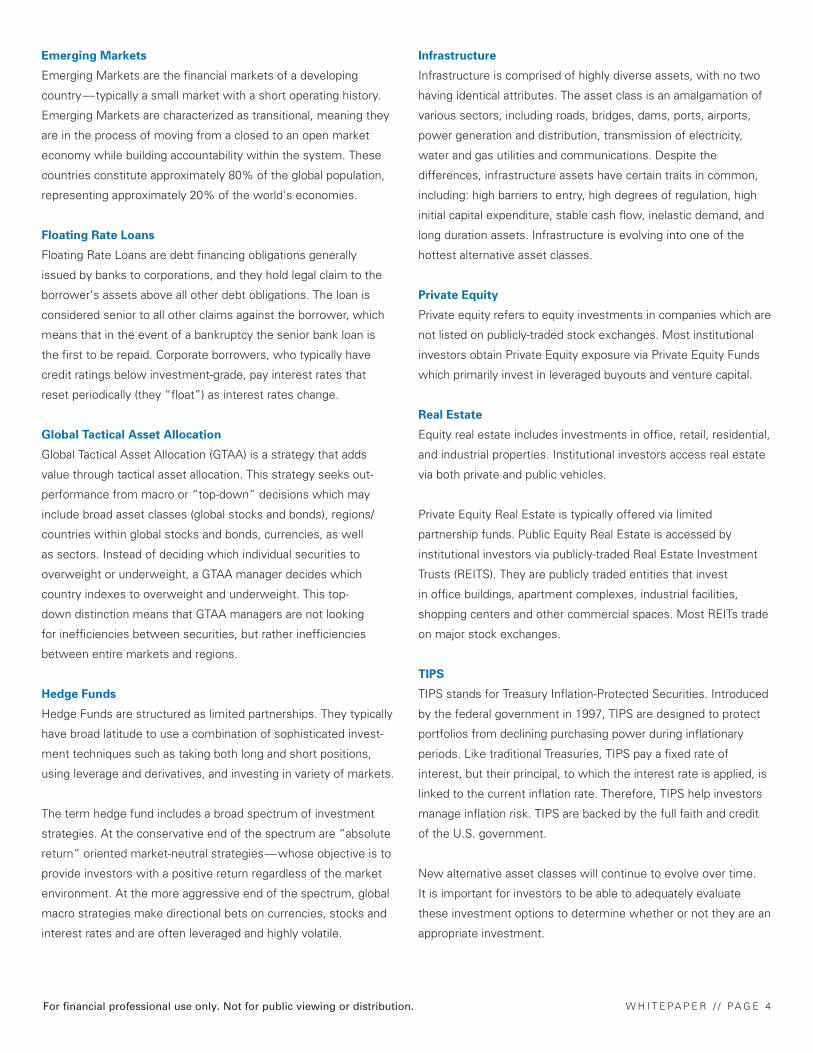
PERFORMANCE VS. RISK (1999–2008)
Source: Deutsche Asset Management 12/31/08. Index returns assume reinvestment
of all distributions and, unlike mutual funds, do not refl ect fees or expenses. It is not
possible to invest directly in an index. Risk is represented by the standard deviation.
Past performance is no guarantee of future results. Please refer to page 10 for an
explanation of the index information.
As with traditional asset classes, alternative class market
leadership has changed over time and the benefi ts of
diversifi cation apply to alternative investments as well. The
importance of maintaining a diversifi ed portfolio does not just
apply to traditional asset classes. As you can see from the chart
below, there have been substantial differences in the performance
of the various asset classes we have described.
CHARACTERISTICS OF ALTERNATIVES
Alternative investments have historically had the ability to provide
investors with several potential investment advantages—
diversifi cation, risk reduction, higher returns and capital
preservation in volatile markets. Not all alternative investments
have all of these capabilities, but it’s important to examine these
potential advantages as well as the risks to fully understand the
inclusion of alternatives in an investment portfolio.
DIVERSIFICATION
Alternative assets typically have different return characteristics
than traditional assets. Combining alternative strategies with
traditional long equity and bond strategies has the potential
to generate steady gains and preserve wealth through up and
down markets. As we have discussed, correlation quantifi es the
diversifi cation potential between different investments. Alternative
assets have historically provided low correlations versus traditional
asset classes. In addition, many alternative sub-groups have also
provided low correlations against each other.
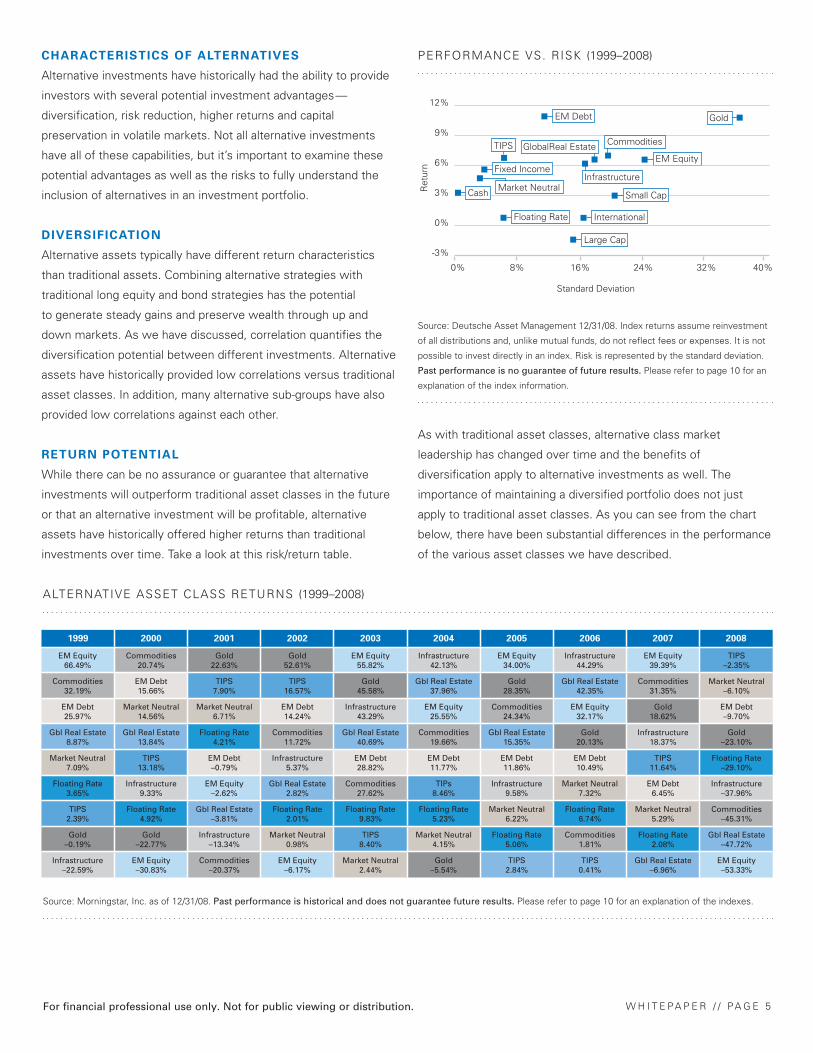
RETURN POTENTIAL
While there can be no assurance or guarantee that alternative
investments will outperform traditional asset classes in the future
or that an alternative investment will be profi table, alternative
assets have historically offered higher returns than traditional
investments over time. Take a look at this risk/return table.
ALTERNATIVE ASSET CLASS RETURNS (1999–2008)
Source: Morningstar, Inc. as of 12/31/08. Past performance is historical and does not guarantee future results. Please refer to page 10 for an explanation of the indexes.
1999 2000 2001 2002 2003 2004 2005 2006 2007 2008
EM Equity66.49%
Commodities20.74%
Gold22.63%
Gold52.61%
EM Equity55.82%
Infrastructure42.13%
EM Equity34.00%
Infrastructure44.29%
EM Equity39.39%
TIPS–2.35%
Commodities32.19%
EM Debt15.66%
TIPS7.90%
TIPS16.57%
Gold45.58%
Gbl Real Estate37.96%
Gold28.35%
Gbl Real Estate42.35%
Commodities31.35%
Market Neutral–6.10%
EM Debt25.97%
Market Neutral14.56%
Market Neutral6.71%
EM Debt14.24%
Infrastructure43.29%
EM Equity25.55%
Commodities24.34%
EM Equity32.17%
Gold18.62%
EM Debt–9.70%
Gbl Real Estate8.87%
Gbl Real Estate13.84%
Floating Rate4.21%
Commodities11.72%
Gbl Real Estate40.69%
Commodities19.66%
Gbl Real Estate15.35%
Gold20.13%
Infrastructure18.37%
Gold–23.10%
Market Neutral7.09%
TIPS13.18%
EM Debt–0.79%
Infrastructure5.37%
EM Debt28.82%
EM Debt11.77%
EM Debt11.86%
EM Debt10.49%
TIPS11.64%
Floating Rate–29.10%
Floating Rate3.65%
Infrastructure9.33%
EM Equity–2.62%
Gbl Real Estate2.82%
Commodities27.62%
TIPs8.46%
Infrastructure9.58%
Market Neutral7.32%
EM Debt6.45%
Infrastructure–37.96%
TIPS2.39%
Floating Rate4.92%
Gbl Real Estate–3.81%
Floating Rate2.01%
Floating Rate9.83%
Floating Rate5.23%
Market Neutral6.22%
Floating Rate6.74%
Market Neutral5.29%
Commodities–45.31%
Gold–0.19%
Gold–22.77%
Infrastructure–13.34%
Market Neutral0.98%
TIPS8.40%
Market Neutral4.15%
Floating Rate5.06%
Commodities1.81%
Floating Rate2.08%
Gbl Real Estate–47.72%
Infrastructure–22.59%
EM Equity–30.83%
Commodities–20.37%
EM Equity–6.17%
Market Neutral2.44%
Gold–5.54%
TIPS2.84%
TIPS0.41%
Gbl Real Estate–6.96%
EM Equity–53.33%
Large Cap
International
EM Equity
Ret
urn
0% 8% 16% 24% 32% 40%
-3%
0%
3%
6%
9%
12%
Standard Deviation
Cash
TIPS
EM Debt Gold
GlobalReal Estate
Infrastructure
Small Cap
Fixed Income
Market Neutral
Commodities
Floating Rate
For financial professional use only. Not for public viewing or distribution. W H I T E PA P E R / / PA G E 6
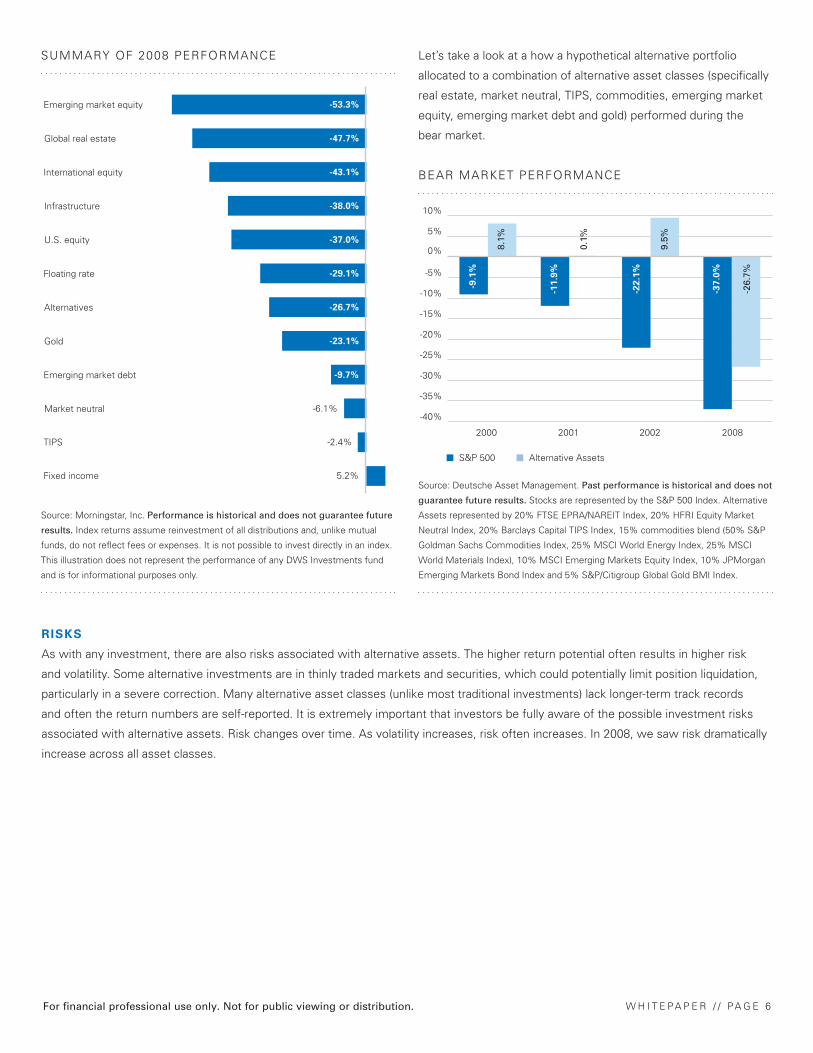
SUMMARY OF 2008 PERFORMANCE
Source: Morningstar, Inc. Performance is historical and does not guarantee future
results. Index returns assume reinvestment of all distributions and, unlike mutual
funds, do not refl ect fees or expenses. It is not possible to invest directly in an index.
This illustration does not represent the performance of any DWS Investments fund
and is for informational purposes only.
Global real estate -47.7%
International equity -43.1%
Infrastructure -38.0%
Floating rate -29.1%
Alternatives -26.7%
Gold -23.1%
Emerging market debt -9.7%
Market neutral -6.1%
TIPS -2.4%
Fixed income 5.2%
-37.0%U.S. equity
Emerging market equity -53.3%
Let’s take a look at a how a hypothetical alternative portfolio
allocated to a combination of alternative asset classes (specifi cally
real estate, market neutral, TIPS, commodities, emerging market
equity, emerging market debt and gold) performed during the
bear market.
BEAR MARKET PERFORMANCE
Source: Deutsche Asset Management. Past performance is historical and does not
guarantee future results. Stocks are represented by the S&P 500 Index. Alternative
Assets represented by 20% FTSE EPRA/NAREIT Index, 20% HFRI Equity Market
Neutral Index, 20% Barclays Capital TIPS Index, 15% commodities blend (50% S&P
Goldman Sachs Commodities Index, 25% MSCI World Energy Index, 25% MSCI
World Materials Index), 10% MSCI Emerging Markets Equity Index, 10% JPMorgan
Emerging Markets Bond Index and 5% S&P/Citigroup Global Gold BMI Index.
-40%
-35%
-30%
-25%
-20%
-15%
-10%
-5%
0%
5%
10%
-9.1
%
8.1%
-11.9
%
0.1%
-22.1
%
9.5%
2000 2001 20082002
-26.
7%
-37.0
%
S&P 500 Alternative Assets
RISKS
As with any investment, there are also risks associated with alternative assets. The higher return potential often results in higher risk
and volatility. Some alternative investments are in thinly traded markets and securities, which could potentially limit position liquidation,
particularly in a severe correction. Many alternative asset classes (unlike most traditional investments) lack longer-term track records
and often the return numbers are self-reported. It is extremely important that investors be fully aware of the possible investment risks
associated with alternative assets. Risk changes over time. As volatility increases, risk often increases. In 2008, we saw risk dramatically
increase across all asset classes.

For financial professional use only. Not for public viewing or distribution. W H I T E PA P E R / / PA G E 7
INSIGHT FROM INSTITUTIONAL INVESTORS
The Bank of New York Mellon publishes information on
institutional investor returns. While it is virtually impossible to
compare these returns to an average investors, it is possible
to compare the returns to an appropriate benchmark portfolio
without alternative investments.
BNY MELLON TRUST MEDIAN PLAN RETURNS
(Period ended 12/31/08)
Source: http://www.bnymellon.com/pressreleases/2009/pr021009.html
ASSET ALLOCATIONS CONTINUE TO SHIFT
TO ALTERNATIVES
Source: JPMorgan Asset Management "Next Generation Alternative Investing,” as
of 7/08. *This information is a forecast and due to a variety of uncertainties, and
assumptions made in our analysis, actual events or results or the actual performance
of the markets covered may differ from those presented.
OVERALL ALLOCATION OF 401(K) ASSETS IN THE
U.S., BY TYPE OF INVESTMENT
Source: BusinessWeek (July 14 & 21, 2008). Data calculated by Hewitt Associates,
as of 5/31/08. *Includes money-market, emerging market, and specialty/sector
strategies as well as self-directed brokerage accounts. Percentages do not add up to
100% due to rounding.
Individual investors, however, are still trailing institutional investors
in their allocations to alternatives.
INDIVIDUAL INVESTORS
AND ALTERNATIVE INVESTMENTS
Alternative investments were once investment options for
institutions, endowments and high net worth individuals. There
were barriers to entry that deterred the average investor. They
were typically structured as limited partnerships sold only to
qualifi ed investors. Minimum eligibility requirements were often a
net worth of greater than $1.5 million for individuals (with spouse,
excluding primary residence) and $5 million for entities and minimum
investment requirements were as high as $5 to $10 million. This
has made it diffi cult for the average investor to invest in alternatives.
Five Years Ten Years
Corporate Plans 2.07% 3.48%
Endowments 2.88% 3.82%
Benchmark –0.03% 0.78%
0%
20%
40%
60%
80%
100%
55%
26%
18%
51%
26%
22%
Equity Fixed income Alternatives
2007 2010*
Large cap65%
International9%
Midcap2%
Fixed income andstable value
5%
Company stock65%
Lifestyle/target9%
Balanced9%
Other6%
Smallcap5%
For financial professional use only. Not for public viewing or distribution. W H I T E PA P E R / / PA G E 8
In addition, alternative investments may have the following
characteristics, which could make them potentially unattractive to
individual investors. They may:
Involve shorting, derivatives, and/or leverage
Be less liquid than traditional asset classes
Have less information on valuations/pricing—reliance on
appraised value
Have less transparency
Not be tax-sensitive
Be diffi cult to model within an overall asset allocation
The barriers to entry for retail investors mentioned above have
changed in recent years—as some mutual funds are now being
structured to include investments in alternative asset classes.
THE ROLE OF ALTERNATIVES IN AN
INVESTMENT PORTFOLIO
The inclusion of alternative investments in a portfolio, while
possibly reducing overall portfolio risk, can be a complicated
process. Considerable investment expertise may be required to
analyze the risk associated with differing investment styles and to
allocating to these investments. The question for individuals and
institutions alike is—what is the optimal allocation to alternatives
and what are the alternative asset classes to invest in?
Asset allocation
Traditional asset allocation models typically rely on mean variance
optimization—attempting to fi nd the asset allocation with the
lowest possible risk for an expected rate of return. Traditional
optimization utilizes historical risk and return information to
represent a prospective view. This model requires a long history
across all asset classes and typically does not incorporate investor
views and insights.
Most investors recognize that a traditional asset allocation
refers to a “traditional” portfolio with an allocation to stocks and
an allocation to bonds, with these percentages being further
subdivided by style. In the past, this blend of capital appreciation
from stocks and capital preservation from bonds seemed a
reasonable solution for many investors—institutional and
individual alike. Will this hold true in the future and are there other
options aside from traditional long-only portfolios?
A new generation of portfolio construction techniques has
evolved to address many of the challenges that have existed with
alternative investments in traditional asset allocation models.
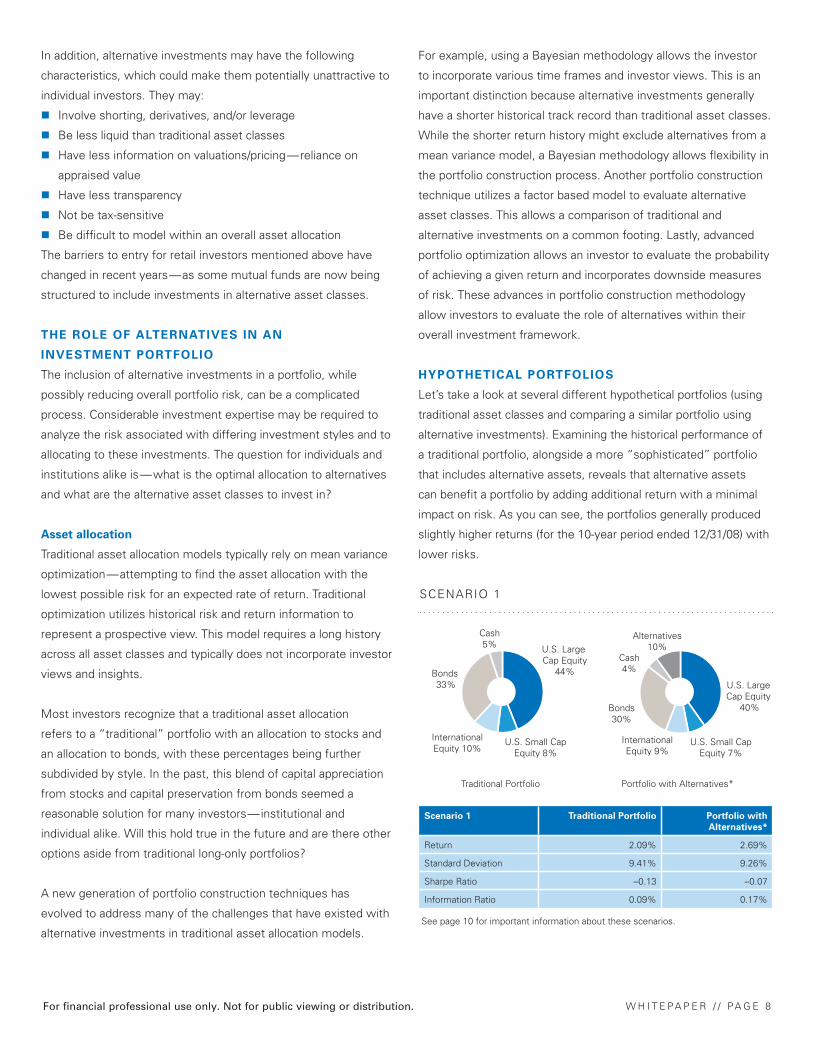
U.S. Large Cap Equity
44%
U.S. Small CapEquity 8%
InternationalEquity 10%
Bonds 33%
Cash5%
U.S. Large Cap Equity
40%
U.S. Small CapEquity 7%
InternationalEquity 9%
Bonds30%
Cash4%
Alternatives10%
Traditional Portfolio Portfolio with Alternatives*
Scenario 1 Traditional Portfolio Portfolio with
Alternatives*
Return 2.09% 2.69%
Standard Deviation 9.41% 9.26%
Sharpe Ratio –0.13 –0.07
Information Ratio 0.09% 0.17%
SCENARIO 1
See page 10 for important information about these scenarios.
For example, using a Bayesian methodology allows the investor
to incorporate various time frames and investor views. This is an
important distinction because alternative investments generally
have a shorter historical track record than traditional asset classes.
While the shorter return history might exclude alternatives from a
mean variance model, a Bayesian methodology allows fl exibility in
the portfolio construction process. Another portfolio construction
technique utilizes a factor based model to evaluate alternative
asset classes. This allows a comparison of traditional and
alternative investments on a common footing. Lastly, advanced
portfolio optimization allows an investor to evaluate the probability
of achieving a given return and incorporates downside measures
of risk. These advances in portfolio construction methodology
allow investors to evaluate the role of alternatives within their
overall investment framework.
HYPOTHETICAL PORTFOLIOS
Let’s take a look at several different hypothetical portfolios (using
traditional asset classes and comparing a similar portfolio using
alternative investments). Examining the historical performance of
a traditional portfolio, alongside a more “sophisticated” portfolio
that includes alternative assets, reveals that alternative assets
can benefi t a portfolio by adding additional return with a minimal
impact on risk. As you can see, the portfolios generally produced
slightly higher returns (for the 10-year period ended 12/31/08) with
lower risks.

For financial professional use only. Not for public viewing or distribution. W H I T E PA P E R / / PA G E 9
U.S. Large Cap Equity
20%
U.S. SmallCap Equity
20%
InternationalEquity 8%
Bonds 50%
Cash 2%
U.S. Large Cap Equity
17%
U.S. Small Cap Equity
15%InternationalEquity 2%
Bonds45%
Cash 1%
Alternatives 20%
Traditional Portfolio Portfolio with Alternatives*
SCENARIO 3
Deutsche Asset Management as of 12/31/08. *Alternative investments represented
by 20% FTSE EPRA/NAREIT Index, 20% HFRI Equity Market Neutral Index,
20% Barclays Capital US TIPS, 15% commodities blend (50% Goldman Sachs
Commodity Index, 25% MSCI World Energy Index, 25% MSCI World Materials
Index), 10% MSCI EAFE® Emerging Markets Equity Index, 10% JP Morgan EMBI,
5% S&P Global Gold BMI Index. Past performance is no indication of future
results. Index returns assume reinvestment of all distributions and, unlike mutual
funds, do not refl ect fees or expenses. It is not possible to invest directly in an index.
Scenario 3 Traditional Portfolio Portfolio with
Alternatives*
Return 3.74% 4.81%
Standard Deviation 7.91% 7.34%
Sharpe Ratio 0.05 0.19
Information Ratio 0.24% 0.28%
U.S. Large Cap Equity
48%
U.S. Small CapEquity 9%
InternationalEquity12%
Bonds 25%
Cash 6%
U.S. Large Cap Equity
40%
U.S. Small CapEquity 7%
InternationalEquity 9%
Bonds 27%
Cash 2%
Alternatives 15%
Traditional Portfolio Portfolio with Alternatives*
SCENARIO 2
Scenario 2 Traditional Portfolio Portfolio with
Alternatives*
Return 1.65% 2.84%
Standard Deviation 10.45% 9.65%
Sharpe Ratio –0.16 –0.05
Information Ratio 0.04% 0.19%
See page 10 for important information about these scenarios.
CONCLUSION
In this paper, we have examined the changing investment
environment, defi ned key alternative asset classes, explored
advantages and disadvantages of alternative investments, and
compared the risk/return characteristics of hypothetical traditional
and non-traditional portfolios. We have discovered how many
institutional investors, leading university endowments, and high-
net worth individuals successfully utilize alternative investments.
This leads to a vital question: is the general investing public next?
Many individual investors faced with lower return expectations,
the increased correlation of most “traditional” asset classes,
and the need to take greater personal fi nancial responsibility are
seeking dependable, risk adjusted returns for future liabilities.
Following the time-tested example of institutions, numerous
individual investors are pursuing alternative investments and
many are fi nding that the decision-making process quickly
becomes complicated. In addition to determining the appropriate
percentage to invest in alternatives, there is selecting the asset
class for investment as well as rebalancing. These are important
and sometimes diffi cult decisions to make.
Typically, institutional investors have considerable expertise or hire
experts with deep experience in alternative investments. Individual
investors can also follow this model by tapping into their fi nancial
advisors’ knowledge and fully understanding the risks and potential
benefi ts of alternative investments. There is a new generation of
innovative funds designed to bring alternative investments to the
general investing public and it is essential for individual investors,
intrigued by these offerings, to gain the insight and foresight to
make an informed decision.

For financial professional use only. Not for public viewing or distribution. W H I T E PA P E R / / PA G E 1 0
INDEX INFORMATION
The following indexes were used for charts in this White Paper. Past performance is historical and does not guarantee future
results. Please keep in mind that index returns assume reinvestment of all distributions and, unlike mutual funds, do not refl ect
fees or expenses. It is not possible to invest directly in an index.
Equity index returns assume reinvestment of all distributions. Index returns do not reflect fees or expenses, and it is not possible to invest directly in an index.
Category Index
Cash Citigroup 3-Month US Treasury Bill Index is an unmanaged index reflecting monthly return equivalents of yield averages that
are not marked to the market and an average of the last three, three-month T-bill issues. Three-month T-bills are the short-
term debt obligations of the US government.
Commodities 50% S&P Goldman Sachs Commodity Index, which represents commodity sector returns of an unleveraged, long-term
investment in commodity futures; 25% MSCI World Energy Index, which measures the performance of energy equities
in developed markets around the world; 25% MSCI World Materials Index, which measures the performance of material
equities in developed markets around the world.
Emerging market equity The MSCI Emerging Markets Equity Index measures equity market performance in 26 global emerging markets.
Emerging market debt The JP Morgan Emerging Market Bond Index tracks Brady bonds, loans, eurobonds and local-market debt traded in
emerging markets.
Fixed income The Barclays Capital US Aggregate Bond Index represents domestic taxable investment-grade bonds with average maturities
of one year or more.
Floating rate The S&P/LSTA Leveraged Loan Index is an unmanaged, market-value weighted total return index that tracks outstanding
balance and current spread over LIBOR for fully funded loan terms.
Global infrastructure UBS Global Infrastructure Index: UBS considers utilities to be a subset of infrastructure; however, due to the size and
relative maturity of utilities as an asset class, UBS has chosen to identify “infrastructure” and ”utilities” separately as
second-tier indices (UBS Infrastructure Index, UBS Utilities Index). The UBS Global Infrastructure & Utilities (UBS I&U)
Indices are calculated based on free-float market capitalization, as defined by S&P.
Global real estate The FTSE EPRA/NAREIT Developed Index is a market capitalization-weighted index based on the last trade prices of shares
of all eligible companies.
Gold The S&P/Citigroup Global Gold BMI Index represents the precious metals industry component of the S&P/Citigroup global
equity family of indices.
International equity The MSCI EAFE Index is a free float-adjusted market capitalization weighted index designed to measure developed market
equity performance.
Market neutral The HFRI Equity Market Neutral Index is designed to represent performance of equity market neutral strategies, which
employ sophisticated quantitative techniques of analyzing price data to ascertain information about future price movements
and relationships between securities to select securities for purchase and sale.
TIPS (Treasury Inflation Protection Securities) The Barclays Capital US TIPS Index tracks US Treasury inflation-linked securities.
US large-cap equities The S&P 500 Index represents the US equity market in general.
US small-cap equities The Russell 2000 Index tracks the equity performance of the 2,000 smallest companies of the Russell 3000 Index.
For financial professional use only. Not for public viewing or distribution. W H I T E PA P E R / / PA G E 1 1
" Alternatives are no longer the preserve of the super-wealthy or experimental academic endowments. The number of investment
products for retail investors that incorporate...or invest in alternative asset classes, such as real estate or commodities,
is rising rapidly. The shift away from the old allocation model is enjoying a groundswell of support."
Kevin Parker, CEO, Deutsche Asset Management in Financial Times editorial, May 12, 2008
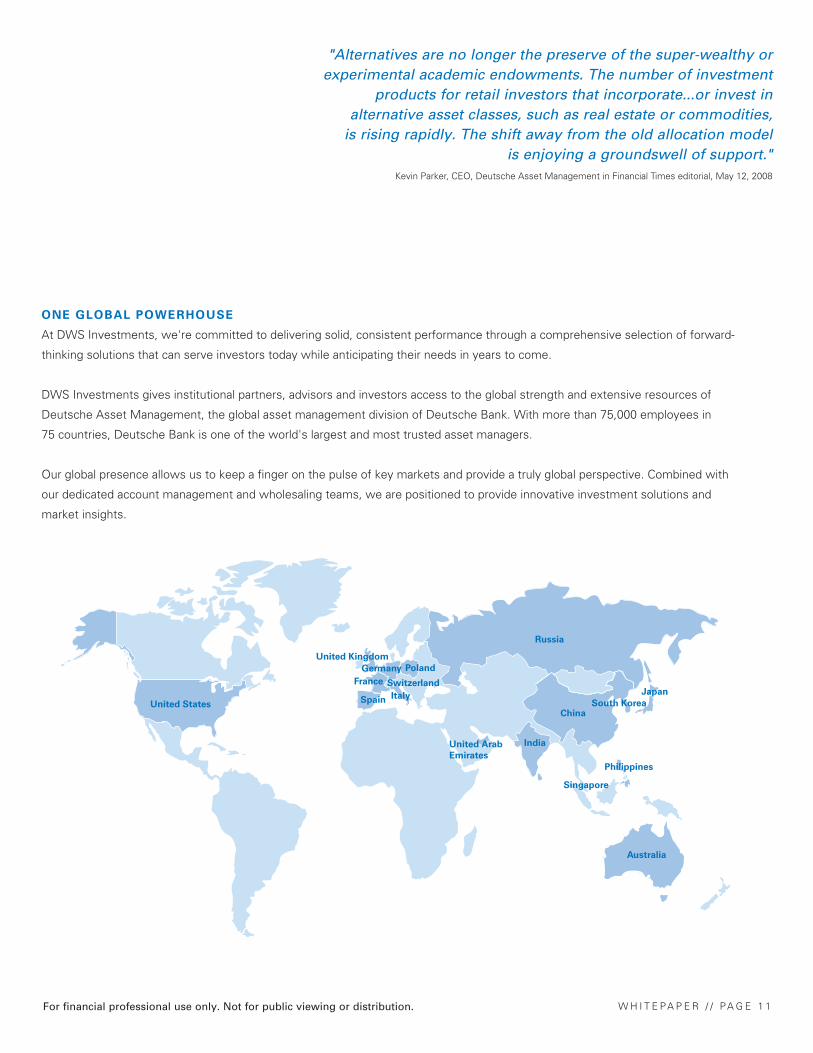
ONE GLOBAL POWERHOUSE
At DWS Investments, we're committed to delivering solid, consistent performance through a comprehensive selection of forward-
thinking solutions that can serve investors today while anticipating their needs in years to come.
DWS Investments gives institutional partners, advisors and investors access to the global strength and extensive resources of
Deutsche Asset Management, the global asset management division of Deutsche Bank. With more than 75,000 employees in
75 countries, Deutsche Bank is one of the world's largest and most trusted asset managers.
Our global presence allows us to keep a fi nger on the pulse of key markets and provide a truly global perspective. Combined with
our dedicated account management and wholesaling teams, we are positioned to provide innovative investment solutions and
market insights.
© 2009 DWS Investments Distributors, Inc. All rights reserved. M72034-A (5/09) R-9790-2 ALT-100
DWS Investments Distributors, Inc.222 South Riverside Plaza Chicago, IL 60606-5808www.dws-investments.com [email protected] (800) 621-1148
NOT FDIC/NCUA INSURED MAY LOSE VALUE
NO BANK GUARANTEE NOT A DEPOSIT
NOT INSURED BY ANY FEDERAL GOVERNMENT AGENCY
DWS Investments is part of Deutsche Bank’s Asset Management division and, within the US, represents the retail asset management activities of Deutsche Bank AG, Deutsche Bank Trust Company Americas, Deutsche Investment Management Americas Inc. and DWS Trust Company.
This material is intended for informational purposes only. It is not intended that it be relied on to make any investment decision. It does not constitute investment advice a recommendation, or an offer or solicitation and is not the basis for any contract to purchase or sell any security or other instrument, or for Deutsche Bank AG and its affi liates to enter into or arrange any type of transaction as a consequence of any information contained herein. Neither Deutsche Bank AG nor any of its affi liates gives any warranty as to the accuracy, reliability or completeness of information which is contained in this document. Except insofar as liability under any statute cannot be excluded, no member of the Deutsche Bank Group, the Issuer or any offi cer, employee or associate of them accepts any liability (whether arising in contract, in tort or negligence or otherwise) for any error or omission in this document or for any resulting loss or damage whether direct, indirect, consequential or otherwise suffered by the recipient of this document or any other person.
The views expressed in this document constitute Bank AG or its affi liates’ judgment at the time of issue and are subject to change. This document is only for fi nancial professionals. This document was prepared without regard to the specifi c objectives, fi nancial situation or needs of any particular person who may receive it.
PREPARED BY:Christine M. Johnson, Director, DWS Investments, Inc., Asset Allocation Product SpecialistInna Okounkova, Director, Deutsche Asset Management, Asset Allocation Portfolio Manager
REFERENCE:Leitner, C., Mansour, A., and Naylor, S. “Alternative Investments in Perspective.” RREEF Research, September 2007.
IMPORTANT RISK INFORMATION All investments involve risk. Some investment products have more risk than others, such as those investing in commodity-related securities, which are subject to market price movements, regulatory changes and economic conditions as well as adverse political and fi nancial factors. Real estate investments can be affected by interest-rate moves, economic cycles, and tax and regulatory requirements. Investing in foreign securities, especially emerging markets, presents unique risks not associated with domestic investments, such as currency fl uctuations, political and economic changes, and market risks. There are additional risks associated with investing in high-yield bonds, aggressive growth stocks, non-diversifi ed/concentrated investments and small-, mid and micro-cap stocks. Diversifi cation does not guarantee a profi t or protect against loss.
OBTAIN A PROSPECTUS To obtain a prospectus, download one from www.dws-investments.com, or call Shareholder Services at (800)-522-1441. Investors should be advised to carefully consider the fund’s objectives, risks, charges and expenses before investing. The prospectus contains this and other important information about the fund. Investors should read the prospectus carefully before investing.
For fi nancial professional use only. Not for public viewing or distribution.