alternative oxidants
TRANSCRIPT

ALTERNATIVE OXIDANTS
AND PROCESSING
PROCEDURES FOR
PYROTECHNIC TIME
DELAYS
ISABEL MARIA MOREIRA RICCO
A dissertation submitted in partial fulfilment of the requirements for the degree of
MASTER OF ENGINEERING (CHEMICAL ENGINEERING)
In the
Faculty of Engineering, Built Environment and Information Technology
University of Pretoria
2004
UUnniivveerrssiittyy ooff PPrreettoorriiaa eettdd –– RRiiccccoo,, II ((22000055))

ii
ALTERNATIVE OXIDANTS AND
PROCESSING PROCEDURES FOR
PYROTECHNIC TIME DELAYS
Isabel Maria Moreira Ricco
Supervisor: Professor W. W. Focke
Department: Department of Chemical Engineering
University: University of Pretoria
Degree: Master of Engineering (Chemical Engineering)
SYNOPSIS
This study was directed at the pyrotechnic time delay compositions that are used in
detonator assemblies. The objectives were to:
� Investigate effective alternatives for the barium and lead-based oxidants currently
used, maintaining the use of silicon as fuel
� Develop easy to use, realistic measurement techniques for burn rates and shock
tube ignitability
� Determine the variables that affect burn rate, and
� Evaluate alternative processing routes to facilitate intimate mixing of the
component powders.
Lead chromate and copper antimonite were found to be suitable oxidants for silicon in
time delay compositions. They were ignitable by shock tubing, a relatively weak
ignition source. The measured burn speeds for these systems showed a bimodal
dependence on stoichiometry. Measured burn rates varied between 6-28 mm/s. Lead
chromate is potentially a suitable alternative to the oxidant currently used in the
UUnniivveerrssiittyy ooff PPrreettoorriiaa eettdd –– RRiiccccoo,, II ((22000055))

iii
medium burn rate commercial composition. It burns faster than copper antimonite.
The latter is potentially a suitable replacement oxidant for the slow and medium
compositions.
Antimony trioxide-based compositions exhibited unreliable performance with respect
to ignition with shock tubing.
The addition of aluminium powder or fumed silica was found to reduce the burn rate.
Increasing the silicon particle size (<3,5µm) also decreased the burn speed for copper
antimonite and lead chromate compositions. Addition of fumed silica improved the
flow properties of the lead chromate, copper antimonite and antimony trioxide
powders allowing for easier mixing.
The silicon powder was found to react violently with water in alkaline solutions. This
makes particle dispersion in a wet-mixing process problematic.
Keywords: pyrotechnic, time delay, copper antimonite, burn speed, silicon, lead
chromate, antimony trioxide, detonator.
UUnniivveerrssiittyy ooff PPrreettoorriiaa eettdd –– RRiiccccoo,, II ((22000055))
iv
ALTERNATIEWE OKSIDEERMIDDELS EN
PROSSESSERING VAN PIROTEGNIESE TYD
VERTRAGERS
Isabel Maria Moreira Ricco
Promotor: Professor W. W. Focke
Department: Department of Chemical Engineering
Universiteit: University of Pretoria
Graad: Magister in Ingenieurswese (Chemies Ingenieurswese)
SINOPSIS
Hierdie studie was gerig op pirotegniese tydvertragersamestellings wat in slagdoppies
gebruik word. Die doelwit was om:
� Effektiewe alternatiewe vir die barium- en loodgebaseerde oksideermiddels te
vind wat tans saam met silikon as brandstof gebruik word
� Eenvoudige en realistiese meettegnieke vir ontsteekbaarheid en die brandtempo
van tydvertrager formulasies te ontwikkel
� Te bepaal watter veranderlikes brandtempos beïnvloed, en
� Alternatiewe prosesserings roetes te ondersoek om goeie vermenging van die
komponentpoeiers te verseker.
Dit is gevind dat loodchromaat en koperantimoniet geskikte oksideermiddels is vir
silikon in tydvertragendesamestellings. Hulle kon ontsteek word met behulp van ‘n
skokbuis, ‘n relatief lae intensiteit ontstekingsbron. Die brandtempos toon ‘n
bimodale afhanklikheid van stoichiometrie. Die gemete waardes het variëer oor die
gebied 6-28 mm/s. Loodchromaat is ‘n potensiële alternatief vir die oksideermiddels
wat tans in die “medium” kommersiëele samestelling gebruik word. Dit brand
UUnniivveerrssiittyy ooff PPrreettoorriiaa eettdd –– RRiiccccoo,, II ((22000055))

v
vinniger as koperantimoniet. Laasgenoemde is ‘n potensiële alternatief vir die
oksideermiddels in die “stadige” en “medium” samestellings.
Antimoon trioksied gebasseerde sametstellings het wisselende resultate in terme van
aansteekbaarheid met skokbuise getoon.
Toevoegings van aluminium of gerookte silika poeiers het brandtempos verlaag. Die
brandtempos van die koperantimoniet en loodchromaat samestellings het ook
afgeneem met toename in die silikon partikelgrootte. Gerookte silika het ook die vloei
eienskappe van loodchromaat, koperantimoniet en antimoontrioksied poeiers verbeter
en sodoende beter vermenging bewerkstellig.
Silikon reageer heftig met water in die teenwoordigheid van alkalies. Dus is die
dispersie van die partikels in ‘n nat vermengingsproses problematies.
Sleutelwoorde: pirotegnies, koperantimoniet, brandtempo, silikon, loodchromaat,
antimoontrioksied, slagdoppie
UUnniivveerrssiittyy ooff PPrreettoorriiaa eettdd –– RRiiccccoo,, II ((22000055))

vi
ACKNOWLEDGEMENTS
I wish to express my appreciation to the following organisations and persons who
made this dissertation possible:
� This dissertation is based on a research project of African Explosives Limited
(AEL). Permission to use the material is gratefully acknowledged. The opinions
expressed are those of the author and do not necessarily represent the policy of
AEL.
� AEL for financial support, the provision of data and the use of facilities and
expertise.
� The following persons are gratefully acknowledged for their assistance during the
course of the study:
� Mr C. Conradie, Mrs L. Cloete, Hilton Lange (AEL)
� Dr S. van der Walt who wrote and rewrote Capture until
perfect, designed the electronic interface, got the data capture
card to work, and still had the patience to teach me. A true
gentleman who kept his word and was proud of his work.
� Serei Sefanyetso
� Leon de Jager from Poretech who willingly did particle size
analysis for us at his own cost.
� Dr B. Kosowski from Mach I who supplied and couriered the
Nanocat from the US at his own cost.
� All other organisations who supplied free samples: Hayley
from Rolfes pigments, Bayer, Steve Swart from Delta EMD,
Chemimpo, Rhombus Vanadium Mine, Degussa, Bayer
� SEM, XRD and XRF staff.
� Professor W. W. Focke, my supervisor for his guidance and support.
� My family for the encouragement and support during the study, in particular my
sister, Marisa, who helped brush mix and crimp detonators for hours on end.
UUnniivveerrssiittyy ooff PPrreettoorriiaa eettdd –– RRiiccccoo,, II ((22000055))

vii
� Eddie Ferreira, my partner for life, who listened to endless ideas and helped me
implement quite a few of them. Your support, enthusiasm to better the world
around you and belief in my abilities inspired me through the good and bad.
UUnniivveerrssiittyy ooff PPrreettoorriiaa eettdd –– RRiiccccoo,, II ((22000055))

viii
CONTENTS
Synopsis.................................................................................................................... ii
Sinopsis.................................................................................................................... iv
Acknowledgements .................................................................................................. vi
Contents ................................................................................................................. viii
Tables .................................................................................................................... xiii
Figures ................................................................................................................... xvi
Nomenclature.......................................................................................................... xx
1. Introduction .................................................................................................... 1-1
2. The Solid State and Pyrotechnic Reactions ..................................................... 2-1
2.1 The Solid State........................................................................................ 2-1
2.1.1 Crystals ........................................................................................... 2-1
2.1.2 Crystal Imperfections ...................................................................... 2-2
2.2 Reaction Propagation Mechanism ........................................................... 2-3
2.3 Combustion Wave Stability..................................................................... 2-8
3. Existing Practices for the Manufacture of Delay Detonators ........................... 3-1
3.1 Delay Detonators .................................................................................... 3-1
3.2 Delay Element Requirements .................................................................. 3-2
3.3 Delay Element Manufacture.................................................................... 3-4
3.4 AEL Practices ......................................................................................... 3-5
4. Reactivity, Burn Speed and Modelling of Reactions ....................................... 4-1
4.1 Variables Affecting Reactivity and Burn Speed....................................... 4-1
4.2 Mathematical Modelling of Reactions................................................... 4-13
4.3 Combustion versus Thermal Analysis ................................................... 4-13
5. Previous Work................................................................................................ 5-1
5.1 Reagent Properties .................................................................................. 5-1
5.1.1 Silicon............................................................................................. 5-1
5.1.2 Antimony Trioxide.......................................................................... 5-3
5.1.3 Barium Sulphate.............................................................................. 5-5
5.1.4 Nanocat (Super Fine Iron Oxide)..................................................... 5-5
5.1.5 Iron Oxides ..................................................................................... 5-6
5.1.6 Lead Oxides .................................................................................... 5-6
UUnniivveerrssiittyy ooff PPrreettoorriiaa eettdd –– RRiiccccoo,, II ((22000055))

ix
5.1.7 Lead Chromate................................................................................ 5-7
5.1.8 Copper Oxides ................................................................................ 5-8
5.1.9 Manganese Oxides .......................................................................... 5-8
5.1.10 Copper Antimonite.......................................................................... 5-9
5.2 Silicon as a Fuel – Compositions Reported in Literature ......................... 5-9
5.2.1 Lead Oxides-Si.............................................................................. 5-12
5.2.2 BaSO4-Si....................................................................................... 5-16
5.2.3 Fe2O3-Si ........................................................................................ 5-19
5.2.4 Sb2O3-Si........................................................................................ 5-21
5.2.5 MnO2-Si........................................................................................ 5-23
5.2.6 PbCrO4-Si ..................................................................................... 5-23
6. Equipment and Experimental Procedures Development .................................. 6-1
6.1 Planning.................................................................................................. 6-1
6.1.1 Experimental Procedures Reported in Literature.............................. 6-1
6.1.2 Planned Measurements.................................................................... 6-4
6.2 Equipment .............................................................................................. 6-5
6.2.1 Particle size and BET Measurements............................................... 6-5
6.2.2 Thermal Analysis ............................................................................ 6-5
6.2.3 X-Ray Diffraction and Fluorescence................................................ 6-5
6.2.4 Scanning Electron Microscopy........................................................ 6-6
6.2.5 Weighing of Compositions .............................................................. 6-6
6.2.6 Mixing ............................................................................................ 6-6
6.2.7 Tube Loading and Composition Compaction................................... 6-7
6.2.8 Detonator Assembly........................................................................ 6-8
6.2.9 Ignition ........................................................................................... 6-8
6.2.10 Temperature Sensing Devices ......................................................... 6-9
6.2.11 Electronic Interface ....................................................................... 6-13
6.2.12 Data Acquisition ........................................................................... 6-13
6.3 Experimental Procedures....................................................................... 6-14
6.3.1 Weighing and Tumble Mixing of Compositions ............................ 6-14
6.3.2 Brush Mixing ................................................................................ 6-15
6.3.3 Visual Interpretation of Burn Characteristics ................................. 6-15
6.3.4 Initial Tube Loading...................................................................... 6-15
6.3.5 Lead Tube Rolling......................................................................... 6-17
UUnniivveerrssiittyy ooff PPrreettoorriiaa eettdd –– RRiiccccoo,, II ((22000055))

x
6.3.6 Detonator Assembly...................................................................... 6-18
6.3.7 Preparation of Detonators for Combustion..................................... 6-20
6.3.8 Measurement of Temperature Profiles ........................................... 6-21
6.3.9 Disposal of Detonators .................................................................. 6-23
6.3.10 Numerical Processing of the Data.................................................. 6-23
6.3.11 General Safety Precautions............................................................ 6-24
6.3.12 Recommended Further Investigations and Complementary
Experimental Techniques.............................................................................. 6-25
6.4 Reagent Properties ................................................................................ 6-26
6.4.1 Silicon........................................................................................... 6-26
6.4.2 Oxidants........................................................................................ 6-26
6.4.3 Additives....................................................................................... 6-31
7. Alternative Oxidants....................................................................................... 7-1
7.1 Thermochemistry of Various Oxidants and Silicon ................................. 7-1
7.2 Preliminary Experiments......................................................................... 7-4
7.2.1 Visual Evaluation of the Burn Characteristics of Various Oxidants . 7-4
7.2.2 Industrial Trials............................................................................... 7-7
7.2.3 Measurement of Burn Rates – Initial Trials ..................................... 7-9
8. Modification of Burn rates.............................................................................. 8-1
8.1 Varying Stoichiometry – Tumble Mixed Compositions........................... 8-1
8.1.1 Experimental................................................................................... 8-1
8.1.2 Results and Discussion.................................................................... 8-2
8.2 Varying Stoichiometry – Tumble and Brush Mixed Compositions .......... 8-4
8.2.1 Experimental................................................................................... 8-4
8.2.2 Results and Discussion.................................................................... 8-5
8.3 Varying Fuel Particle Size..................................................................... 8-10
8.3.1 Experimental................................................................................. 8-10
8.3.2 Results and Discussion.................................................................. 8-11
8.4 Varying Oxidant Particle Size ............................................................... 8-16
8.4.1 Experimental................................................................................. 8-16
8.4.2 Results and Discussion.................................................................. 8-17
8.5 Additives – Aluminium Addition .......................................................... 8-18
8.5.1 Experimental................................................................................. 8-18
8.5.2 Results and Discussion.................................................................. 8-19
UUnniivveerrssiittyy ooff PPrreettoorriiaa eettdd –– RRiiccccoo,, II ((22000055))

xi
8.6 Conclusions .......................................................................................... 8-22
8.7 Applicability and Recommended Further Investigations........................ 8-24
9. Dry mixing of Flow Conditioner Additives..................................................... 9-1
9.1 Powder Processing Problems .................................................................. 9-1
9.1.1 The Use of Additives....................................................................... 9-3
9.1.2 Density............................................................................................ 9-7
9.2 Formulation of Free Flowing Oxidants.................................................... 9-8
9.2.1 Experimental................................................................................... 9-8
9.2.2 Results and Discussion.................................................................... 9-8
9.3 Formulation of Free Flowing Silicon....................................................... 9-9
9.3.1 Experimental................................................................................... 9-9
9.3.2 Results and Discussion.................................................................. 9-10
9.4 Tapped Bulk Density Measurements ..................................................... 9-10
9.4.1 Experimental................................................................................. 9-10
9.4.2 Results and Discussion.................................................................. 9-12
9.5 Addition of Wacker HDK20 to Silicon compositions with Cu(SbO2)2,
PbCrO4 and Sb2O3 as Oxidants ......................................................................... 9-12
9.5.1 Experimental................................................................................. 9-12
9.5.2 Results and Discussion.................................................................. 9-13
10. Wet Mixing .............................................................................................. 10-1
10.1 Implications of Implementing Dispersions to Mix Formulations ........... 10-1
10.2 Effect of Addition of Surfactants to Si-CuO.......................................... 10-2
10.2.1 Experimental................................................................................. 10-2
10.2.2 Results and Discussion.................................................................. 10-3
11. Incorporation into a Thermoset Resin or Thermoplastic ............................ 11-1
11.1 Thermosets and Thermoplastics ............................................................ 11-1
11.2 Reaction of Metal Powders with Fluorine-containing Polymers............. 11-2
11.3 Incorporation into Silicone Oil .............................................................. 11-5
11.3.1 Experimental................................................................................. 11-5
11.3.2 Results and Discussion.................................................................. 11-6
11.4 Reaction of a Metal Powder with a Bromine Oxidiser ........................... 11-7
11.4.1 Experimental................................................................................. 11-7
11.4.2 Results .......................................................................................... 11-8
UUnniivveerrssiittyy ooff PPrreettoorriiaa eettdd –– RRiiccccoo,, II ((22000055))

xii
12. Conclusions and Recommendations .......................................................... 12-1
12.1 Review.................................................................................................. 12-1
12.2 Experimental Review............................................................................ 12-2
12.3 Conclusions .......................................................................................... 12-3
12.3.1 Ignition. ........................................................................................ 12-3
12.3.2 Burn Rates .................................................................................... 12-3
12.3.3 Alternative Processing................................................................... 12-5
12.4 Recommendations................................................................................. 12-7
13. References ................................................................................................ 13-1
14. Appendices ....................................................................................................A
Appendix A...............................................................................................................A
Appendix B...............................................................................................................B
Appendix C...............................................................................................................C
Appendix D...............................................................................................................D
Appendix E ...............................................................................................................E
Appendix F ............................................................................................................... F
Appendix G...............................................................................................................G
Appendix H...............................................................................................................H
Appendix I ................................................................................................................. I
Appendix J .................................................................................................................J
Appendix K...............................................................................................................K
Appendix L ............................................................................................................... L
Appendix M .............................................................................................................M
UUnniivveerrssiittyy ooff PPrreettoorriiaa eettdd –– RRiiccccoo,, II ((22000055))

xiii
TABLES
Section 4
4-1 Possible Reactions for PbO2-Si as the Silicon Content is Varied 4-5
Section 5
5-1 Thermal Analysis of Pb3O4-Si 5-14
5-2 Beck and Flanagan’s (1992) Experimental Results for BaSO4-Si 5-18 &
5-19
5-3 MnO2-Si – Burn Rates and Mass Loss as Reported by
Rugunanan (1991)
5-23
Section 6
6-1 Experimental Procedures and Equipment Reported for use in
Pyrotechnic Composition Analysis
6-1 till
6-4
6-2 XRD Data Collection Parameters 6-6
6-3 Silicon Properties and Supplier 6-26
6-4 Oxidant Properties and Supplier or Method of Preparation 6-26 &
6-27
6-5 XRF Analysis of Cu(SbO2)2 6-29
6-6 Additive Properties and Suppliers 6-31
Section 7
7-1 Calculated Thermochemical Reaction Properties of Various
Oxidants with Silicon as Fuel
7-2
7-2 Calculated Thermochemical Reaction Properties of Various
Oxidants with Tungsten as Fuel
7-3 till
7-4
7-3 Oxidants and Mass Fractions Silicon used for Visual Evaluation
of Burn Characteristics
7-5
7-4 Visual Observations of the Burn Characteristics of Various
Oxidants and Type 4 Silicon
7-5 till
7-6
7-5 Mass Ratios for Compositions used in Industrial Trials 7-8
7-6 Results of Industrial Trials 7-8 till
7-9
UUnniivveerrssiittyy ooff PPrreettoorriiaa eettdd –– RRiiccccoo,, II ((22000055))
xiv
7-7 Compositions which Burned during Initial Trials and their
respective Burn Rates
7-10
Section 8
8-1 Summary of Results of Varying Stoichiometry for Tumble
Mixed Compositions
8-2
8-2 Effect of Varying Stoichiometry on the Burn Rate of Tumbled
Sb2O3-Type 4 Si
8-2
8-3 Mass Percentage Type 4 Si used for Tumbled and Brushed
Compositions
8-4
8-4 Comparison of Experimental Burn Rates and Those Reported in
Literature for Sb2O3 and PbCrO4
8-8
8-5 Reagents and Mass Percentages used for Determining the Effect
of Varying Si Particle Size
8-10
8-6 Replacement Compositions for the Slow and Medium
Compositions Currently in Use
8-25
Section 9
9-1 Wacker HDK Product Range Specifications 9-6
9-2 Reagents used in Bulk Density Measurements 9-11
9-3 Modification of the Bulk Densities of BaSO4, Si and Sb2O3 using
Nano-sized Particles
9-12
9-4 Compositions Containing Wacker Fumed Silica as Additive 9-13
Section 10
10-1 Effect of Surfactant Addition to Type 4 Si-CuO 10-3
Section 11
11-1 Maximum Ratios Obtained for Filling Silicone Oil 11-6
11-2 Theoretically Required Mass of Oxidant for Complete
Combustion of Silicone Oil
11-7
11-3 Reagents used for Reaction of Al with a Bromine Flame
Retardant
11-7
Appendix L
L-1 Hamaker Constants L-3
L-2 Effect of Increasing Various Variables on the Coagulation and
Flocculation Resistance
L-7
UUnniivveerrssiittyy ooff PPrreettoorriiaa eettdd –– RRiiccccoo,, II ((22000055))

xv
L-3 Practical Differences Between Electrostatic and Steric
Stabilisation
L-7
L-4 Examples of Dispersants L-15
L-5 Dispersion of Si using Various Dispersants L-16 &
L-17
UUnniivveerrssiittyy ooff PPrreettoorriiaa eettdd –– RRiiccccoo,, II ((22000055))

xvi
FIGURES
Section 1
1-1 Investigation Methodology 1-4
Section 2
2-1 Principal Components of Pyrotechnic Compositions 2-4
2-2 Simplified Schematic Diagrams of an Equilibrium Combustion
Wave
2-7
Section 3
3-1 Non-electric Delay Detonator 3-2
Section 4
4-1 Thermal Characteristics of B-BaCrO4 4-6
4-2 Dependence of the Combustion Temperature and Velocity on
Various Variables
4-12
Section 5
5-1 (a
& b)
Si-based Compositions Reported in Literature 5-10 &
5-11
Section 6
6-1 Equipment used for Tumble Mixing of Compositions (Tumbler) 6-7
6-2 Tube Roller and Motor Control Box 6-7
6-3 Crimper 6-8
6-4 “Mouse Trap” and Silencer 6-9
6-5 Response Time for Bare Wire Type R Thermocouple during
heated Silicone Oil Experiment
6-10
6-6 Type R Thermocouple Calibration Curve 6-11
6-7 Thermocouples and Electronic Interface 6-13
6-8 Data Acquisition Computer 6-14
6-9 Schematic Diagram of Visual Evaluation of the Burn
Characteristics of Compositions
6-15
6-10 Simplified Diagram of Die for the Laboratory Press 6-16
6-11 Effect of Feeding Lead Tube through the Tube Roller 6-18
6-12 Detonator Assembly – Component Sequence 6-19
6-13 Completed Detonator 6-20
UUnniivveerrssiittyy ooff PPrreettoorriiaa eettdd –– RRiiccccoo,, II ((22000055))

xvii
6-14 Examples of Detonator Assemblies that Ignited and Burned 6-21
6-15 XRD Patterns for Sb2O3 and Cu(SbO2)2 6-28
6-16 IR Scans of CuO, Sb2O3 and Cu(SbO2)2 6-29
6-17 SEM Photo of Cu(SbO2)2 6-30
6-18 TGA/DTA of Cu(SbO2)2 6-30
Section 7
7-1 CuO Prepared by Foamed Technique 7-7
7-2 Precipitated CuO 7-7
Section 8
8-1 Experimental Procedure for Determining the Effect of Varying
Stoichiometry for Tumble Mixed Compositions
8-1
8-2 Effect of Varying Stoichiometry on the Burn Rate of Tumbled
Cu(SbO2)2-Type 4 Si
8-3
8-3 Experimental Procedure for Determining the Effect of Varying
Stoichiometry for Tumbled and Brushed Compositions
8-5
8-4 Effect of Varying Stoichiometry on the Burn Rate of Tumbled and
Brushed Sb2O3-Type 4 Si
8-6
8-5 Effect of Varying Stoichiometry on the Burn Rate of Tumbled and
Brushed Cu(SbO2)2-Type 4 Si
8-6
8-6 Effect of Varying Stoichiometry on the Burn Rate of Tumbled and
Brushed PbCrO4-Type 4 Si
8-7
8-7 Fraction of Successful Ignitions as a function of Stoichiometry for
Brushed and Tumbled Type 4 Si-based Compositions for a Total
of 5 Attempts
8-9
8-8 Experimental Procedure for Determining the Effect of Varying
Stoichiometry and Si Particle Size
8-11
8-9 Effect of Varying Stoichiometry on the Burn Rate of Cu(SbO2)2-
Type 3 Si
8-12
8-10 Effect of Varying Stoichiometry on the Burn Rate of PbCrO4-
Type 3 Si
8-13
8-11 Detonator Assembly for which Molten Lead had flowed back into
the Shock Tube
8-14
UUnniivveerrssiittyy ooff PPrreettoorriiaa eettdd –– RRiiccccoo,, II ((22000055))

xviii
8-12 Fraction of Successful Ignitions as a Function of Stoichiometry for
Type 3 Si-based Compositions for a Total of 5 Attempts
8-16
8-13 Experimental Procedure for Determining the Effect of Varying
Oxidant Particle Size
8-17
8-14 Experimental Procedure for Determining the Effect of Al Addition 8-19
8-15 Aluminium Addition Decreases the Burn Rate and Ignition Range
of Cu(SbO2)2-Type 4 Si
8-20
8-16 Aluminium Addition Decreases the Burn Rate and Ignition Range
of Sb2O3 Type 4 Si
8-20
8-17 Effect of Oxidant on the Burn Rate of Type 4 Si 8-22
8-18 Burn Speed Decreases with Increasing Aluminium Addition and
Silicon Particle Size for Cu(SbO2)2-Si
8-23
8-19 Burn Speed Decreases with Increasing Aluminium Content and
Decreasing Silicon Content for Sb2O3-Si
8-23
8-20 Increasing the Silicon Particle Size Decreases the Burn Rate for
PbCrO4-Si
8-24
Section 9
9-1 Formulation of Free Flowing Oxidants 9-8
9-2 Comparison of Sample 1 (left) and Sample 2 (right) 9-9
9-3 Formulation of Free Flowing Silicon 9-10
9-4 Effect of Varying Stoichiometry and WackerFumed Silica
Addition on the Burn Rate of Sb2O3-Type 4 Si
9-14
9-5 Effect of Varying Stoichiometry and WackerFumed Silica
Addition on the Burn Rate of Cu(SbO2)2-Type 4 Si
9-14
9-6 Effect of Varying Stoichiometry and WackerFumed Silica
Addition on the Burn Rate of PbCrO4-Type 4 Si
9-15
9-7 Fraction of Successful Ignitions as a Function of Stoichiometry for
Type 4 Si-based Compositions with 1% Fumed Silica for a Total
of 5 Attempts
9-16
Section 11
11-1 Summary of Experimental Results Reported for Metal powders
and Halogen-containing Polymers
11-4
11-2 TGA-DTA Analysis of Al, OCTA and CCDFB Mixture 11-9
UUnniivveerrssiittyy ooff PPrreettoorriiaa eettdd –– RRiiccccoo,, II ((22000055))

xix
Appendix A
A-1 Simple Parallel Slab Model A-2
A-2 Temperature Profile for Combustion with a Thin Reaction Zone A-8
A-3 Temperature Profile for Combustion with a Wide Reaction Zone A-9
A-4 Temperature Profile for Combustion with Phase Transformations A-9
A-5 Temperature Profile for Combustion with Multistage Spatially
Separated Reactions
A-10
A-6 Reaction Cell Geometry for A(s)+B(s)→C(s) A-11
A-7 Reaction Cell Geometry for A(l)+B(s)→C(s) A-12
A-8 Reaction Cell Geometry for A(l)+B(s)→C(l) A-13
A-9 Reaction Cell Geometry for A(l)+B(l)→C(l) A-14
Appendix L
L-1 Processing Equipment for Pyrotechnic Powder Wetting and
Deagglomeration
L-20
UUnniivveerrssiittyy ooff PPrreettoorriiaa eettdd –– RRiiccccoo,, II ((22000055))

xx
NOMENCLATURE
a Filtration parameter for first order data filter
ao Initial thickness of metal A (half effective particle size of the
discontinuous phase (cm)
b Reaction zone width
b1 Fraction of inert or product diluent
c Specific heat capacity
c1 Heat capacity of the gaseous products
cp, cs, cf Specific heat capacity of solid
d Particle size
d1 Particle size of fine particles
d2 Particle size of coarse particles
dBst Diameter of reactant B in a corresponding stoichiometric mixture
deff Effective particle size
dmax Maximum particle size
dmin Minimum particle size
D Mass diffusivity
Drc Diameter of the reaction cell.
E Activation energy
f Fraction of the surface covered by the adsorbate
f(d) Dependence of v on particle size
f(n) Reaction order function
F Van der Waal’s force between particles
F(T) Dependence of v on temperature
G Thermal power arising from heat effects of all changes
h Lateral heat transfer coefficient
HR Heat of reaction at 298K
Hf Heat of formation at 298K
k Boltzmann constant
Kads Adsorption constant
Ko Preexponential constant for kinetics
l Order of reaction
UUnniivveerrssiittyy ooff PPrreettoorriiaa eettdd –– RRiiccccoo,, II ((22000055))

xxi
L Distance between centres of two particles
Le Lewis number
m Combustion mass velocity
m1 Mass fraction of fine particles
MWi Molecular mass of component i
n Reaction order
P Vapour pressure of most volatile component or product dissociation
pressure at the combustion temperature
Po External gas pressure
Q Heat of reaction
r Radius of spherical particle
R Ideal gas constant
s Distance between two particles
S Surface area
t* Rise time of inert forewave
tth Thermal relaxation time
T Absolute temperature
T* Conversion controlling the combustion front
Ta Ambient temperature
Tc Combustion temperature
Tf Flame temperature
Tg Gas temperature
Tm Melting point
Ts Condensed phase temperature
T0 Initial temperature of porous solid
u Attraction energy
U Temperature excess
v Velocity of the combustion front
v1 Mass fraction of gas in the reaction products
vi Volume of component i
w Rate of heat evolution per unit mass of reaction mixture
w1 Thickness ratio of metals A and B
W Constant for calculation of van der Waal’s forces
W1 Energy required to produce a dispersion
UUnniivveerrssiittyy ooff PPrreettoorriiaa eettdd –– RRiiccccoo,, II ((22000055))

xxii
x Spatial coordinate in travelling wave frame
xT Characteristic length of thermal relaxation in combustion wave
xn Measured value at time n.
y Reaction velocity
yn Filtered value corresponding to x at time n
yn-1 Filtered value corresponding to x at time n-1
α Tamman temperature ratio
α1 Thermal diffusivity
α2 Coefficient of interphase heat transfer
β1 Heating rate
β2 Pore shape parameter
β, γ Wave stability parameters
χ(d) Particle size distribution
δ Product layer thickness
δ1 Length which surfactant extends into liquid
φ Volume fraction of component
γ1 Surface tension
η Reactant conversion
η* Conversion controlling the combustion front
η1 Degree of reaction
ι Confinement parameter (fraction of the gas that passes through the
flame)
λ Thermal conductivity
ρ Density
ρo Initial effective solid density (mass per unit volume of porous solid)
ρ∞ Final effective solid density (fully reacted)
ξ Gas direction flow parameter
UUnniivveerrssiittyy ooff PPrreettoorriiaa eettdd –– RRiiccccoo,, II ((22000055))

1.Introduction
1-1
1. INTRODUCTION
Delay detonators are self-contained pyrotechnic devices that allow a desired interval
(burning time) between an impulse and a later action. The delay elements which are
contained in the delay detonators involve reactions between a fuel and an oxidiser. At
present African Explosives Limited (AEL) manufactures various grades of these
shock tube delay and carrick detonators as well as detonating relays. A single fuel,
silicon, is used in conjunction with three possible oxidisers: red lead (Pb3O4), lead
dioxide (PbO2) and barium sulphate (BaSO4) to obtain burn rates varying between 4
and 250mm/s for the delay elements.
The formulation of the pyrotechnic compositions in these elements was developed by
a former ICI Explosive company in Canada. Since then, ICI Explosives has split and
AEL and the company are competitors, leaving AEL with a range of powders which
function satisfactorily, but when a problem occurs it is difficult to obtain information
to solve the problem and to continue production (Taylor, 2000). Further problems
encountered by AEL include:
� The lead-based compounds are toxic and the mixtures are very sensitive to
ignition during mixing, making them difficult and dangerous to process.
Furthermore they are not environmentally friendly.
� The barium sulphate-based composition has exhibited variable performance.
Mixtures sometimes fail to initiate, propagate or burn at a consistent burn rate
within a single batch.
� The powders coming directly from the dry mixer have poor flow properties and
cause difficulty during downstream processing i.e. jams, increased processing
time, high wastage levels and a higher incidence of fires. In order to overcome this
problem, AEL have granulated the powder using a nitrocellulose binder.
However, the binder is a gas generator which affects the burn rates of the
powders, an undesirable situation.
� Currently AEL use 6 different types of silicon.
UUnniivveerrssiittyy ooff PPrreettoorriiaa eettdd –– RRiiccccoo,, II ((22000055))
1.Introduction
1-2
In light of these problems the following long term solutions were proposed by AEL:
� To critically analyse the available literature on pyrotechnic mixtures and delay
elements in order to gain a better theoretical, scientific understanding of how these
and other pyrotechnic formulations function and the variables which influence
them.
� To replace the three oxidisers with oxidisers that are more environmentally
friendly, easily sourced, cost effective, whilst rationalising the range of silicon and
still obtaining the required burn rates and ignition reliability.
� To improve the processing of the powders such that the final product is a free
flowing powder that burns in a lead tube by considering the use of dispersions,
controlled precipitation or dry mixing using flow conditioners.
� To investigate the possibility of using thermoset resins or filled thermoplastic
compositions as a novel processing technology.
Based on the above the main objectives of this investigation were:
� To obtain insight, through a critical literature review, into how delay elements and
pyrotechnic formulations work and the variables which influence them. Also, to
understand AEL’s needs in terms of product range and AEL’s existing processes
and equipment (not discussed here).
� To find alternative oxidants that are easily sourced and cost effective, whilst
maintaining the use of silicon as a fuel. The compositions also had to be ignited
using shock tube and comply with the required burn rates.
� To establish safe and cheap experimental procedures and equipment in the
laboratory to characterise (in particular the burn rates) the existing (not discussed
here) and new formulations in an environment as close to reality as possible. The
following equipment was used: TGA-DTA, the data acquisition computer, particle
size analysers, XRD, XRF and SEM. Analysis of the reaction products was not
conducted.
� To investigate experimentally, the influence of the most important variables,
which were to be identified during the literature review, on the new compositions’
burn rates.
UUnniivveerrssiittyy ooff PPrreettoorriiaa eettdd –– RRiiccccoo,, II ((22000055))
1.Introduction
1-3
� To investigate on a laboratory scale and through literature, the feasibility and
repercussions of using dispersions, flow conditioners and thermoset resins or
filled thermoplastic compositions in terms of burn rates etc.
Figure 1-1 is a schematic of the methodology used in this investigation.
UUnniivveerrssiittyy ooff PPrreettoorriiaa eettdd –– RRiiccccoo,, II ((22000055))

1.Introduction
1-4
Figure 1-1: Investigation Methodology
Literature Review to evaluate and understand pyrotechnic reactions and delay detonators i.e.
� Insight into the solid state (Section 2.1) and reaction propagation mechanism and stability
(Section 2.2)
� Understanding of the processing of delay compositions, AEL specific needs in terms of
burn rate, etc. (Section 3)
� Knowledge of the variables affecting burn rate and the mathematical expression of these
variables (Section 4), as well the properties of reagents and Si-based compositions used by
AEL and in this investigation (Section 5). A critical analysis of the mathematical modelling
presented previously will not be conducted.
Equipment and Experimental Procedures Development
Develop (trial and error) an easy, close-to-reality technique to measure burn rates and suggest
further improvements to enable a better setup and augmentation of burn rate measurements of
compositions (Sections 6.1-3) as well as determine reagent properties (Section 6-4)
Measure Burn Rates for
Existing Compositions (Not
discussed here)
Find Alternative Oxidants by evaluating
thermochemistry (Section 7.1), AEL Trials (Section
7.2) and Initial Trials (Section 7.3) using Si as fuel
Modification of Burn Rates for alternative oxidants
by varying stoichiometry (Sections 8.1 and 8.2),
varying particle size (Sections 8.3 and 8.4) and
aluminium addition (Section 8.5).
Evaluate Different Processing Routes. Dry mixing
using flow conditioner additives (Section 9), wet
mixing using dispersions (Section 10) and
incorporation into a thermoset or thermoplastic
(Section 11).
UUnniivveerrssiittyy ooff PPrreettoorriiaa eettdd –– RRiiccccoo,, II ((22000055))

2.The Solid State and Pyrotechnic Reactions
2-1
2. THE SOLID STATE AND PYROTECHNIC REACTIONS
2.1 The Solid State
2.1.1 Crystals
The reactivity of a solid is dependent on the departures from bulk properties. When
two particles are placed in intimate contact, something must cross the boundary for a
reaction to occur i.e. something must diffuse out and must have a place to diffuse to.
It is the imperfections in the solid that makes reactions possible and determines the
reactivity (McLain, 1980:9).
Most solids are crystalline in nature i.e. a homogeneous structure in which the
constituent atoms are arranged in a regular repeated pattern. Crystalline solids are
categorised according to the chemical bonds that hold the atoms or molecules
together. In descending order of strength the bonds are covalent (held together by
electron-pair bonds e.g. diamond, Si, grey tin and graphite), ionic (large differences in
electronegativity produces an attraction between the constituents’ unlike charges, e.g.
alkali metal halides and metallic oxides and hydroxides), metallic (electrons are
shared broadly without preferential directions defined by atom pairs i.e. elemental
metals), hydrogen and van der Waals. Many crystals are simultaneously ionic and
covalent (McLain, 1980:12).
The physical properties of a solid depend largely on the crystal bonding forces and
specific crystal structure, i.e.
� Hardness. Diamond is very hard partly because the covalent crystal bonds are
very strong. The close packing of the carbon atoms in diamond also affects the
hardness as the forces between the atoms are increased and prevents easy
displacement by external pressures.
� Melting point. The melting point tends to be higher for crystals with stronger
bonds as the atoms are more difficult to separate.
UUnniivveerrssiittyy ooff PPrreettoorriiaa eettdd –– RRiiccccoo,, II ((22000055))

2.The Solid State and Pyrotechnic Reactions
2-2
� Malleability and ductility. Metals are generally more malleable and ductile than
other solids because the bonding forces have no preferred orientation and the
assembly of atoms tolerates deformation without bond rupture (McLain, 1980:12).
Crystal structures are characterised by the geometric symmetries of the unit cell that is
repeated throughout the lattice and the closeness of packing. Spheres, which include
metal crystals, naturally assemble with either cubic or hexagonal symmetry whilst
other crystals arrange either side by side (plate-like and stick-like molecules) or
cluster in various configurations (pear-shaped molecules) (McLain, 1980:12-13).
2.1.2 Crystal Imperfections
The relationship between the physical properties of a solid and the chemical and
geometric crystal classification is not exact due to crystals’ imperfect ions e.g.
dislocations, cracks and lattice defects (McLain, 1980:13).
A crystal may contain structural dislocations along the grain boundaries as a result of
the manner of crystal growth and the acquisition of impurities (occupy sites for which
they are too large or small). Cracks and dislocations influence the chemical reactivity
of solids as they result in a larger surface area and in more edges and corners where
material may be lost at the crystal decomposition temperature, i.e.:
� Reaction of a solid with a liquid begins at defects where the bonds are weakened
and,
� The rates of adsorption, decomposition and solution increase with greater surface
area (McLain, 1980:14).
Inherent lattice or Schottky and Frenkel defects occur when there are absences or
displacements of atoms from their normal lattice sites and does not involve the
intrusion of impurities. The defective crystal is more thermodynamically stable
because of a proportionately compensating increase in configurational entropy. Other
lattice defects are due to impurities being included in the crystal structure and
nonstoichiometric defects (McLain, 1980:15-6).
UUnniivveerrssiittyy ooff PPrreettoorriiaa eettdd –– RRiiccccoo,, II ((22000055))

2.The Solid State and Pyrotechnic Reactions
2-3
Several compounds, e.g. ZnO, NiO, Cu2O, Fe3O4, PbO2, Pb3O4 and CaSi2, deviate
from stoichiometry due to the vacancy of one specie and not of the other or the
preferential acceptance of one specie into interstitial sites. Ionic crystals must remain
electrically neutral therefore, if a crystal has an excess of interstitial cations, there
must be an equal excess of trapped electrons. The electronic properties of the crystal
will therefore be affected. These nonstoichiometric crystals are further classified into
two semiconductor categories: n-type and p-type. A semiconductor differs from a
metallic conductor in that its resistivity decreases with an increase in temperature.
Silicon is an intrinsic semiconductor. If the Si crystal were perfect, all of the electrons
would be used for bonding and none would have the mobility necessary for
conduction. As the crystal is not perfect, Si is able to conduct and heating the crystal
gives more vibrational freedom and mobility to the carrier electrons. If an impurity
that has five electrons in its valence shell, is introduced into the Si crystal, the crystal
is an n-type conductor. If however, the impurity has only three electrons in its valence
shell the crystal is p-type semiconductor. The conductivity of nonstoichiometric
crystals may be altered i.e.:
� n-type nonstoichiometric semiconductors – the conductivity may be decreased by
doping with foreign ions of higher ionic charge and increased by doping with ions
with a lower ionic charge
� p-type nonstoichiometric semiconductors– the conductivity may be decreased by
doping with foreign ions of lower ionic charge and increased by doping with ions
with a higher ionic charge.
The semiconductor properties depend on the extent of the impurity and the chemical
identity of the impurity (McLain, 1980:15-8).
The nature of a reaction of a solid with a gas, liquid or another solid is dependent on
the chemical composition of the solid but the rate of the reaction is affected by the
mode of pre-treatment of the solid (McLain, 1980:25).
2.2 Reaction Propagation Mechanism
The usefulness of pyrotechnic reactions derives from their being exothermic, self-
sustaining and self-contained (Conkling, 1996:680).
UUnniivveerrssiittyy ooff PPrreettoorriiaa eettdd –– RRiiccccoo,, II ((22000055))

2.The Solid State and Pyrotechnic Reactions
2-4
In general the principal components of pyrotechnic compositions are (Figure 2-1):
� Reducing agent or fuel (metals, non-metals, carbohydrates, inorganic and organic
compounds.
� Oxidising agent (nitrates, perchlorates, chlorates, chromates, peroxides, oxides
and halogen-containing substances.
� Catalysts (Fe2O3, V2O5 etc.)
� Binders (natural and synthetic resins) and
� Formulation aids (anticaking agents and lubricants) (Krone and Lancaster,
1992:438).
Figure 2-1: Principal Components of Pyrotechnic Composition
Considerable research has been undertaken to understand the mechanisms of various
solid-state reactions and a large number of rate equations have been proposed and
tested with varying success. The complexity of various solid-state systems has made
the understanding of the reaction mechanisms difficult (Beretka, 1984). A
fundamental question which arises in pyrotechnic reactions is whether the reaction is
a genuine solid-solid reaction, a solid-liquid reaction involving a molten fuel or
oxidant or whether the fuel reacts only with gaseous oxygen (or some other gaseous
species) formed by the prior thermal decomposition of the oxidant or whether by
combination of these processes (Rugunanan and Brown, 1991).
The theory of pyrotechnic reactions is based largely on the work of Spice and
Staveley (quoted by McLain, 1980:4-5). They proved that for an iron-potassium
dichromate mixture and an iron-barium dioxide mixture, that two reactions were
occurring: ignition and preignition (PIR). They concluded that the PIR reaction for
these mixtures was a genuine solid-solid reaction mechanism, as the rate increased
Fuel
Oxidant
Well mixed,
easy to process
formulation
Binder Aids
Mixing
UUnniivveerrssiittyy ooff PPrreettoorriiaa eettdd –– RRiiccccoo,, II ((22000055))

2.The Solid State and Pyrotechnic Reactions
2-5
with increased packing density in terms of the increased contact surface between the
particles. The effects of compaction and inert dilution are useful for determining if a
pyrotechnic system is also a solid-solid reaction. If the PIR is a necessary precursor to
the bulk, incandescent, self-propagating reaction, then it plays a vital role in the
reactivity of the mixture. Thus, by controlling the onset of the PIR and the slope of its
self-heating curve, the bulk reaction may be controlled (quoted by McLain, 1980:4-5,
quoted by Drennan and Brown, 1992a). They have further suggested that the burning
characteristics are more dependent on the properties of the oxidant than on the fuel
(quoted by Drennan and Brown, 1992a).
Hill et al (quoted by Drennan and Brown, 1992a) on the other hand proposed that the
burning rates were dependent on a thermal conduction mechanism. This is further
echoed by Fordham (1980:117). According to Fordham (1980:117), by analysing the
temperature profile of the reaction front it can be deduced that the reaction is solid-
solid reaction initiated by thermal conduction of heat through the unreacted material.
Thus to obtain reproducible reaction rates there must be a constant amount of solid to
solid contact and constant thermal conductivity (Fordham, 1980:117).
According to McLain (1980:20), the reaction between a metal and a non-metal may
proceed by two possible mechanisms. Either the metal migrates through the product
layer to the non-metal or the non-metal migrates in the opposite direction. The
reaction will not proceed if the product layer is not capable of conducting electrons,
which accompany the ionic migration of the ions (McLain, 1980:20). He has also
compared an oxidation-reduction reaction with semiconductor activity as it
necessitates the transfer of electrons. The reducing agent is the electron donor and the
oxidising agent is the electron acceptor. This is analogous to the activity at an np
semiconductor junction where the n-type crystal creates the space charge potential by
donating electrons to the p-type crystal. Therefore a n-type reducing agent should be
more reactive than a p-type and a p-type oxidising agent is more reactive than a n-
type (McLain, 1980:23). Therefore as Si is a semiconductor, this property of doping
with foreign ions can be used to modify the burn rate. The Si can be doped with
foreign ions of a higher ionic charge to increase its conductivity and become an n-type
conductor. This will subsequently increase the overall reaction rate. The opposite
UUnniivveerrssiittyy ooff PPrreettoorriiaa eettdd –– RRiiccccoo,, II ((22000055))
2.The Solid State and Pyrotechnic Reactions
2-6
effect can also be brought about by doping with ions of lower ionic charge if a slower
reaction rate is desired.
For gasless delay compositions, McLain (1980:3) has found that the failure of the
reaction to propagate through the entire length of the column in metal tubes with
small column diameters and at low temperatures is as a result of the rapid heat loss
which is promoted by these conditions. This is because the burning is a series of
reignitions along the length of the delay column from layer to layer of the compressed
mixture, i.e. the burning of a column of delay composition takes place by the passage
of a reaction front along the column. McLain (1980:50) supports the view that
burning propagates by reignition from layer to layer along the burning path and
therefore depends in the thermal conductivity of the mixture. His study of a Pb3O4-Si-
Al mix, showed that the burn rate varied with train cross section and packing density
and indicated a planar transfer mechanism. The addition of inert materials with
relatively low thermal conductivity reduced the rate of heat transfer through the
mixture and slowed the reaction. Conversely, the addition of thermally conductive
material (i.e. fine Cu and Al powders) has been found to increase the burn rate of
gasless delay mixtures (McLain, 1980:50).
Further evidence which supports that a solid-solid reaction is taking place is that the
mass burning rates are relatively constant with loading pressure, or increase with
rising consolidation and level off as maximum density is approached. An example
which has been quoted by McLain (1980:51-52) is the B-BaCrO4 system. He
concluded that the reaction was truly solid-solid and that a 10:90 (B:BaCrO4) system
was more dependent on density than a 5:95 system because it was more nearly
stoichiometric and the excess, unreacted material contained less inert, insulating
BaCrO4 and more conducting B. There was however scatter in the burn rate data at
low consolidation pressures due to the poor contact and heat transfer between the
particles and the low rate of heat generation was too slow to overcome radiation
losses (McLain, 1980:52).
The reaction for a solid-solid reaction proceeds according to the simplified schematic
diagrams in Figure 2-2.
UUnniivveerrssiittyy ooff PPrreettoorriiaa eettdd –– RRiiccccoo,, II ((22000055))

2.The Solid State and Pyrotechnic Reactions
2-7
Figure 2-2: Simplified Schematic Diagrams of an Equilibrium Combustion Wave (Crider, 1982).
Therefore the determination of whether a solid-solid reaction is taking place can be
conducted by analysing the effect of cross sectional area and packing density on the
reaction rate (on a mass basis) and the temperature profile independently of analysing
the reaction products of samples that have been frozen.
Direction of Synthesis Wave
Temperature
Final Product Combustion
zone Initial Substances
Combustion
zone
Transformation
depth
Rate of heat release
Final Product Heating
zone
Initial
Substances
UUnniivveerrssiittyy ooff PPrreettoorriiaa eettdd –– RRiiccccoo,, II ((22000055))

2.The Solid State and Pyrotechnic Reactions
2-8
According to Hardt and Holsinger (1973) whether a condensed-phase reaction goes to
completion spontaneously after initiation depends on whether the heat transfer is
sufficiently low to allow accumulation of heat in the reaction zone and system
characteristics of particle size and fusion temperatures sufficiently small to promote a
high rate of mass transfer.
2.3 Combustion Wave Stability
Instability of the combustion wave can come from insufficient heat generation due to
weak exothermic reactions (Munir, 1988). Zeldovich et al (quoted by Varma et al,
1998) found from classic combustion theory that the following two conditions must
be satisfied for a constant pattern combustion wave with a thin reaction zone to be
self-propagating:
1<<=E
RTcβ and 1
2
<<=QE
cRTcγ …………………………………………(2-1, 2-2)
However using numerical results Aldushin et al (quoted by Varma et al, 1998) found
that
1)(<<
−=−
oc
co
TTE
TRTβγ ……………………………………………………. (2-3)
was sufficient. Margolis (quoted by Varma et al, 1998) modified the stability
criterion for melting reactants i.e.
)52()(
exp12
)(
2
2
+<
−−
−
c
occ
oc
RT
TTERT
TTE……………………………………….(2-4)
According to this equation it can be deduced that for gasless combustion, unstable
combustion is more likely to occur for higher melting temperatures and higher
activation energies and lower combustion temperatures. The higher melting
temperatures will absorb energy that will have been used for conduction to the next
zone for ignition. Also the higher activation energy means that more energy is
required before the reaction commences and releases its own energy. Therefore
compositions with high melting points and activation energies will exhibit unstable
combustion.
UUnniivveerrssiittyy ooff PPrreettoorriiaa eettdd –– RRiiccccoo,, II ((22000055))
3.Existing Practices for the Manufacture of Delay Detonators
3-1
3. EXISTING PRACTICES FOR THE MANUFACTURE OF DELAY
DETONATORS
3.1 Delay Detonators
Delay Detonators, both electric and non-electric are used in mining, quarrying and
other blasting operations for the sequential initiation of explosive charges (Beck and
Flanagan, 1992, Davitt and Yuill, 1983). The delays between the sequential initiation
is commonly referred to as a millisecond delay blasting operation. It is effective in
controlling the fragmentation and throw of the rock being blasted and reduces the
ground vibration and air blast noise (Beck and Flanagan, 1992, Davitt and Yuill,
1983). It is thus evident that reliable ignition is paramount owing to its safety
implications. Repeatable burn rates are important for efficient use of the explosive
during mining and quarrying. Short period delays (25-1000ms) usually allow for the
best results in terms of fragmentation, however, where excessive throw and
concussion (such as tunnelling and shaft sinking) are problematic, long period delays
are used (Beck, 1984). Electronic delay detonators in which the desired delay time
may be programmed into a microchip timing circuit within the detonator; are more
precise and accurate but are considerably more expensive (Rugunanan, 1991).
Commercial delay detonators are essentially metallic shells which are closed at one
end and which contain in sequence from the closed end, a base charge of a detonating
high explosive e.g. PETN, a primer charge of a heat-sensitive detonable material e.g.
lead azide and an amount of deflagrating or burning composition which provides the
desired delay time in the manner of a fuse (Beck, 1984, Beck and Flanagan, 1992,
Davitt and Yuill, 1983). In some cases the primer charge of a heat sensitive material
may be omitted if the delay composition has been designed to have sufficient
ignitable power (Fordham, 1980:119). A non-electric delay detonator is depicted in
Figure 3-1 .The burning composition may be ignited by an ignition charge using an
electrically heated bridge wire or by the heat and flame of a low energy detonating
cord or shock wave conductor (Beck and Flanagan, 1992, Davitt and Yuill, 1983).
UUnniivveerrssiittyy ooff PPrreettoorriiaa eettdd –– RRiiccccoo,, II ((22000055))

3.Existing Practices for the Manufacture of Delay Detonators
3-2
Figure 3-1: Non-Electric Delay Detonator
A pyrotechnic delay composition consists of an intimate mixture of solid, powdered
fuels and oxidants capable of a highly exothermic propagating oxidation-reduction
reaction. The delay times are linearly related to the length of the element (Beck,
1984).
3.2 Delay Element Requirements
Numerous delay compositions have been used with varying degrees of success. In
general delay element compositions and elements have the following requirements:
� Must be essentially gasless. The evolution of large amounts of gaseous by-
products will interfere with the functioning of the delay detonator i.e. gas-
producing delays are vented and can only operate at low altitude whilst gasless
delays are unvented and may be used at any altitude (Watkins et al, 1968:62). The
description “gasless” is usually applied to mixtures that release during
combustion, less than 10cm3 of gas per g of mixture (Charsley et al, 1980). Wang
et al (1993) have stated that the criterion for defining gasless combustion as
0)( PTP c << where P is the vapour pressure of the most volatile component (or
dissociation pressure of the products) at the combustion temperature Tc and P0 is
the external gas pressure.
� Must be safe to handle (both from a health and explosive viewpoint). This is to
avoid problems during manufacture, to reduce emissions and also to lessen the
problem of exposure at the point of end use. For these reasons it is desirable that
Shock
tubing
Al outer tube
Lead with
pyrotechnic core
Antistatic
cup
Rubber
spacer
High explosive and
primer charge
UUnniivveerrssiittyy ooff PPrreettoorriiaa eettdd –– RRiiccccoo,, II ((22000055))

3.Existing Practices for the Manufacture of Delay Detonators
3-3
charges be prepared without using solvents and that special precautions are
implemented when a compound is dangerous (e.g. BaCrO4 is recognised as
carcinogenic and requires special procedures (Boberg et al, 1997 and Davitt and
Yuill, 1983).
� Must be resistant to moisture.
� Must not deteriorate over periods of storage, i.e. there must be no change over in
burning characteristics over time. Brauer (1974:16-17) has discussed the problem
of storage and temperature. He stated that the delay time may be affected by as
much as 16%.
� Must be simply compounded and economical to manufacture.
� Must be adaptable for use in a wide range of delay units within the limitations of
space available inside a detonator shell (Beck and Flanagan, 1992, Davitt and
Yuill, 1983). Some compositions have a very high burn rate and are therefore very
difficult to incorporate in delay detonators having short delay periods. These result
in variations in the delay times within groups of detonators intended to have equal
delay times. The same can be said of compositions having slow burn rates (Davitt
and Yuill, 1983).
� Must have the reduced possibility of “flash past”, particularly in the shorter delay
periods where the length of the elements used are at a minimum. In the past this
problem was overcome by introducing a layer of delay composition above the
initiating explosive before placing in the delay element. This is no longer done
due to improved overall design and technique (Fordham, 1980:119).
� Must have minimal effect due to the liberation of gas. As the speed of the delay
composition is affected by pressure, the free space within the detonator should be
controlled. The plug, which seals the leading wires in place, should be able to
withstand this pressure for more than the delay period of the detonator.
Conduction along the metal walls of the detonator shell of the heat which is
liberated by the fusehead and delay composition, is likely to soften plastic plugs in
particular. These may be ejected from the detonator with probable failure of the
burning of the delay column (Fordham, 1980:119).
� Delay detonators that are to be used in coal mines should be constricted such that
they do not ignite methane-air mixtures even if fired outside the cartridge of the
blasting explosive. This requires careful selection of the fusehead and the use of a
delay composition which will not produce large particles of slag on burning.
UUnniivveerrssiittyy ooff PPrreettoorriiaa eettdd –– RRiiccccoo,, II ((22000055))

3.Existing Practices for the Manufacture of Delay Detonators
3-4
Carrick detonators have been developed for this application. They are of the lead
type with five or six narrow cores instead of the single central column (Fordham,
1980: 119-120).
3.3 Delay Element Manufacture
The general processing procedures and equipment used for pyrotechnics have been
discussed by McLain (1980: 201-213).
Two methods may be used for the manufacture of delay detonators. The first method
requires that the delay composition be pressed into preformed zinc, brass or
aluminium tubes which are a sliding fit into the detonator shell and which are thick
enough to withstand the consolidating pressure (the rigid element). The second
method entails filling a lead tube with composition and drawing it down in diameter
by conventional means. The required length of lead tube is then cut (Fordham,
1980:118). There is a desire in the industry to phase out the use of drawn-lead
containment and use only drawn elements of another metal such as aluminium or rigid
elements (Beck and Flanagan, 1992). Beck and Flanagan (1992) have however found
that the heat-sink effect of the metal containment of the column of delay composition
may result in quenching the exothermic reaction of the composition. This is a problem
particularly in the use of rigid elements using zinc and also drawn aluminium tubes,
but not lead-drawn tubes.
Regardless of the method used, the delay composition has to be made in a free-
flowing form. The fine powders may be mixed and then pelletised in a press. The
pellets are then broken down and sieved to remove the fines. If it is difficult to
pelletise the mixture, the mixture is granulated with a small amount of nitrocellulose
solution in a suitable mixer (Fordham, 1980:118).
It is essential that a constant thermal conductivity and constant solid-solid contact is
maintained to ensure repeatability in terms of burn speed and ignitability. To achieve
adequate solid contact between the reacting solids, it is necessary to use the
ingredients in fine condition and bring them into contact by pressure, whilst to
UUnniivveerrssiittyy ooff PPrreettoorriiaa eettdd –– RRiiccccoo,, II ((22000055))
3.Existing Practices for the Manufacture of Delay Detonators
3-5
maintain constant solid contact and thermal conductivity, the density of the column
has to be controlled at a uniform value. It is thus essential that the ingredients are
suitably sized and are adequately mixed and accurately pressed (Fordham, 1980:117).
3.4 AEL Practices
AEL currently manufactures 5 compositions with burn rates varying between 3-
250mm/s. These have been renamed for the purposes of this document as being
starter, sealer, slow, medium and fast compositions (AEL Product Specification,
2000a & 2000b).
UUnniivveerrssiittyy ooff PPrreettoorriiaa eettdd –– RRiiccccoo,, II ((22000055))

4.Reactivity, Burn Speed and Modelling of Reactions
4-1
4. REACTIVITY, BURN SPEED AND MODELLING OF
REACTIONS
4.1 Variables Affecting Reactivity and Burn Speed
According to McLain (1980:31) and Brown (1989) the following interrelated
variables influence reactivity and in turn the burn speed:
� Deviations from the normal crystallographic amorphous structure of a substance.
� Lattice defects in the form of hereditary structures.
� Formation of imperfect structures, i.e. transitions from one modification to
another or thermal decomposition.
� Impurity and presence of guest particles in the lattice.
� Mechanical treatment such as grinding or pressing.
� Differences in the crystallographic formation of different surfaces.
� Gases which are dissolved in the lattice but which are not chemically reactive.
� Corrosion.
� Adsorption and catalysis.
� Irradiation by absorbable wave lengths.
� Changes in the magnetic state and
� Changes in the electric state.
A number of variables which affect the burn speeds have been discussed in literature:
i) Nature of the Oxidant - In general the rate of reaction of a metal to form an oxide
depends on the physical state of the oxide, the nature of the transport processes within
it and its ability to maintain physical continuity between the reactant phases.
Thermodynamic driving forces for reaction determine which phases form and in what
sequence. The defects in each phase and their mobilities largely determine the rates of
growth. If the oxide is solid, a number of processes may occur:
UUnniivveerrssiittyy ooff PPrreettoorriiaa eettdd –– RRiiccccoo,, II ((22000055))

4.Reactivity, Burn Speed and Modelling of Reactions
4-2
� Nucleation of the oxide at the metal-gas interface may be slow or at preferential
sites. Or it may absorb uniformly and oxidation may initiate by the metal and
oxygen atoms exchanging places.
� Transport across the metal-oxide, oxide-oxide or oxide-oxygen interface may be
slow enough to control the rate of reaction. The slow step could be the
decomposition of the oxidant.
� Growth of thick, compact adherent scales occurs by diffusion of ions through the
solid oxide, usually cations are more mobile than oxide ions.
� Oxygen may dissolve and diffuse further into the metal before and during the
growth of the reaction layer on the surface (Birchenall, 1986:3355).
There is a relationship between the lattice vibrations and chemical reactivity. As the
temperature increases, crystals vibrate with increasing amplitude about their average
positions in the lattice. When the amplitude is great enough, diffusion is enhanced and
the atoms may exchange positions. At low temperatures this may result in a solid
transition and at higher temperatures the solid may melt. During such transitions the
reactivity is enhanced as the lattice units are more loosely bound. This is known as the
Hedvall effect (McLain, 1980:30).
The Tamman temperature ratio (α) scales the actual temperature of the solid to its
melting point. It may be used as a rough measure of lattice loosening. Ionic surface
mobility becomes effective at α≈0.3 and lattice diffusion at α≈0.5 (McLain, 1980:30).
Spice and Staveley (quoted by McLain, 1980:40) found that the rate of burning was
more sensitive to the chemical nature of the oxidising agent than to the metal. This
may be explained by the fact that the oxidiser generally has the lower melting point
(Tamman), transition temperature (Hedvall) or decomposition temperature. This was
noted by Rugunanan and Brown (1994b) who found that changing oxidant has the
greatest effect on burn rate. It influences the reaction by its role, through thermal
decomposition to supplying gaseous O2 for the fuel oxidation or by simultaneous
diffusion of the species through a developing layer of solid product. The size and
charge of the diffusing species may be important, as well as maintenance of contact at
UUnniivveerrssiittyy ooff PPrreettoorriiaa eettdd –– RRiiccccoo,, II ((22000055))

4.Reactivity, Burn Speed and Modelling of Reactions
4-3
the origins of the diffusion paths. Melting and or vaporisation of the oxidant will be
important in the maintenance of such contact (Rugunanan & Brown, 1994b).
The ignition temperature of a mixture is largely determined by the decomposition
temperature of the oxidant (Conkling, 1996:684). Chernenko et al (quoted by Wang et
al, 1993) classified oxides according to the following criteria:
� Chemically and physical stable oxides – These oxides (NiO, TiO2, Cr2O3, Al2O3,
Ta2O5 and Nb2O5) are essentially inert up to the moment of ignition. Generally
when used with Al, the oxidation of Al by atmospheric oxygen precedes and
initiates the combustion of the mixture.
� Chemically stable but physically unstable oxides – These oxides include B2O3
which melts at 450°C, MoO3 and WO3 which sublime. The appearance of a liquid
oxide or gaseous oxide phase increases the rate of the oxidation-reduction reaction
and thus enhances ignitability. It has been found that oxidisers with high vapour
pressures (such as WO3 and MoO3) gave the greatest rates of combustion.
� Chemically unstable oxides that decompose – The ignition process for these
oxides (V2O5, CrO3, Li2O2 and BaO2) is more complex because the oxygen
liberated from the decomposition of the oxide plays a significant role in initiating
the reaction.
� Chemically unstable oxides that undergo further oxidation – Further oxidation
takes place in air and the heat liberated from this reaction heats the specimen to
ignition point (Wang et al, 1993).
ii) Preparation of Constituents and Compositions– During processing a number of
variables such as addition of impurities, grinding, adsorption (e.g. H2O), surface
oxidation of the fuel and partial decomposition of the oxidant may occur and affect
the reaction. Grinding, rolling and milling a solid crystal will create new surfaces,
edges and corners at which atoms are not bonded as strongly as the internal atoms as
well as loosen the crystal lattice. The lattice may also be “loosened” by adding
dopants, i.e. Si and Li have been added to Al weakening the Al-Al bonds. This results
in increased reactivity (McLain, 1980:35).
An example of how the preparation of an oxidant may affect the reactivity is the
dependence of Fe2O3 reactivity on the method of preparation. Hedvall and Sandberg
UUnniivveerrssiittyy ooff PPrreettoorriiaa eettdd –– RRiiccccoo,, II ((22000055))

4.Reactivity, Burn Speed and Modelling of Reactions
4-4
(quoted by McLain, 1980:31) found that Fe2O3 prepared from iron sulphate was three
times more reactive than that derived from iron oxalate, despite the average particle
size of the sulphate-derived oxide being larger. X-ray powder diffraction patterns of
the sulphate-derived iron oxide showed a less ordered crystal structure, i.e. less
sharply defined, below 650°C compared to the patterns of the oxalate-derived iron
oxide. Furthermore, it was observed that at temperatures exceeding 900°C, the
oxalate-derived iron oxide was more reactive. By annealing the sulphate-derived iron
oxide at 900°C, the lattice was found to be more sharply defined and its reactivity
over the full temperature range was found to be more like that of the oxalate-derived
iron oxide.
The effect of mechanical and heat pre-treatment of the reagents was not evaluated in
this study and is recommended for future work.
iii) Irradiation by absorbable wave lengths. Radiation of high enough energy can
dislodge atoms from their normal lattice positions to create vacancies and interstitial
atoms. In many semiconductors, irradiation increases the conductivity because it
increases the abundance of imperfections. The opposite is true for metals. Irradiation
also increases the chemical reactivity of semiconductors (McLain, 1980:34). The
effect of irradiating the Si was not investigated during this study and it is
recommended that this be completed, noting the effects of aging on the burn rates of
irradiated compositions.
iv) Stoichiometry – Stoichiometry, heat of reaction and burning rate are all
interrelated (McLain, 1980:53). The early work by Spice and Staveley (quoted by
McLain, 1980:47) provided the following relationships and conclusions concerning
the stoichiometry, heat of reaction and burn rate:
� The delivered heats of reaction were never as high as calculated.
� A composition that gave the maximum burning rate usually gave the maximum
heat of reaction.
� Burning rate and sensitivity to ignition spark depended mainly on the nature of the
oxidant.
UUnniivveerrssiittyy ooff PPrreettoorriiaa eettdd –– RRiiccccoo,, II ((22000055))

4.Reactivity, Burn Speed and Modelling of Reactions
4-5
� Stoichiometry could be determined from a plot of Q (the heat emitted by that
quantity of mix containing a gram formula weight of the oxidiser) versus the
percent reductant (McLain, 1980:47).
McLain (1980:53) has demonstrated the relationship between these factors using the
PbO2-Si as an example. He compared a graph for the measured heats of reaction
versus varied amount of Si with a graph of the theoretical values calculated from heats
of formation of possible reactions. He stated the following reactions take place for the
system (Table 4-1):
Table 4-1: Possible Reactions for PbO2-Si as the Si Content is Varied (McLain, 1980:53)
% Silicon Reaction
2.3 Si + 4PbO2 → Pb4SiO6 + O2
3.1 Si + 3PbO2 → SiO2 + 3PbO + 3/2 O2
4.8 Si + 2PbO2 → Pb2SiO4
6.0 2Si + 3PbO2 → 2PbSiO3 + Pb
8.7 Si + PbO2 → SiO2 + Pb
12.6 3Si + 2PbO2 → SiO2 + 2SiO + 2Pb
16.1 2Si + PbO2 → SiO2 + 2Pb
22.3 3Si + PbO2 → Pb + Si + 2SiO
McLain (1980:53) observed that the heat of reaction reaches a maximum near 10% Si
for PbO-Si. A plot for Pb3O4-Si reached a plateau above 20% Si. The measured
burning rates for both these systems were a maximum at or near the exothermic
maximum (McLain, 1980:53).
Conkling (1996:684) stated that the stoichiometric mixture generates the maximum
heat output, but is not always the fastest burning composition. McLain (1980:55) has
confirmed that the maximum burning rate occurs at a somewhat higher reductant
content than does the maximum heat of reaction (Figure 4-1). This displacement was
generally greater for metal reductants such as Fe, Sb and Mn and smaller for non-
metals such as S and C and metalloids such as B and Si (McLain, 1980:55).
UUnniivveerrssiittyy ooff PPrreettoorriiaa eettdd –– RRiiccccoo,, II ((22000055))

4.Reactivity, Burn Speed and Modelling of Reactions
4-6
Figure 4-1: Thermal Characteristics of B-BaCrO4 (McLain, 1980:55)
This points to the effect of heat transfer on columnar burning. The addition of a good
heat conductor may cause departure from stoichiometry, and may increase the thermal
conductivity sufficiently to cause a net increase in the burning rate (McLain,
1980:56).
Spice and Staveley, as well as Hill et al (quoted by McLain, 1980:56) found that the
smaller the heat of reaction, the more the peak in burning rate is displaced from the
peak in heat of reaction. Furthermore, the slope of the burning rate curve is always
steeper below the maximum percentage reductant below stoichiometric than above the
maximum percentage. This is due to the fact that the region below the maximum
represents excess oxidiser, which is an inert diluent and heat insulator that retards
burning. Addition of the thermally conductive reductant has a relatively large effect
UUnniivveerrssiittyy ooff PPrreettoorriiaa eettdd –– RRiiccccoo,, II ((22000055))

4.Reactivity, Burn Speed and Modelling of Reactions
4-7
on accelerating the burning rate. Above the maximum, there is excess reductant which
maintains a relatively high burning rate despite the departure from stoichiometry
(McLain, 1980:56).
Optimum delay performance is generally expected for stoichiometric compositions
because they ignite and propagate more readily. However, if a slower burn rate is
necessary, the percentage reductant may be reduced. It is however, much better to
rather increase the reductant concentration until the desired burn rate is achieved. The
larger addition is more easily mixed and departures from homogeneity will have less
of an effect as this portion of the curve is less steep (Figure 4-1). Note, however, that
inhomogeneities are less critical near the stoichiometric composition (McLain,
1980:60).
v) Particle Size and Shape –The kinetics of solid state reactions are dependent on the
initial dispersion of the reactants and thus are affected by the particle size (Munir,
1988). Generally the combustion velocity decreases with increasing particle size.
Models have been developed to account for particle size (Appendix A). There has
been an exception to this trend e.g. for the Ta-N system the temperature and
propagation velocity were independent of the Ta particle size as the coarser particles
were more porous than the finer particles and thus acted as a large number of
nonporous grains (Varma et al, 1998).
According to Cardellini, Mazzone and Antisari (1996) an irregular type of powder
morphology (flaky powders) reacts more readily than a regular more uniform type of
powder morphology upon application a shock-compression wave. The influence of
the type of crystal form on the impact sensitivity and reactivity has also been noted by
McLain (1980:33). He mentioned that. the reactivity of KClO3 decreases as the crystal
form varies from needles to thin lamellae (McLain, 1980:34). The shape of the
particles used in this investigation was not varied. It would perhaps be beneficial to
note whether the particle shape does influence the burn rate in particular in the case of
the precipitated oxidants as it is easy to modify particle size and shape through the use
of surfactants, seed particles and varying temperature and concentrations of starting
reagents.
UUnniivveerrssiittyy ooff PPrreettoorriiaa eettdd –– RRiiccccoo,, II ((22000055))

4.Reactivity, Burn Speed and Modelling of Reactions
4-8
vi) Additives – Additives may inhibit the reaction by decreasing the contact area
between the fuel and oxidant particles or by changing the heat capacity and/or thermal
conductivity of the mixture sufficiently to alter the burn rate (Drennan and Brown,
1992a Wang et al, 1993 Varma et al, 1998 McLain, 1980:60). The addition of fluxing
additives such as CaO can be added to the mixtures to form lower melting slags and
increase the burn rate. The addition of small amounts of salts of alkali metals and
alkaline earth metals and cryolite (NaAlF2) can effectively increase the mass
combustion rate of a thermite composition. It has been proposed that the salt additive
reduces the temperature at which the reaction occurs. In Al-based compositions, the
salt disintegrates the barrier oxide layer on the Al at a lower temperature (Wang et al,
1993). McLain (1980:56) recommends that different burn rates should be obtained by
adding inert, thermally insulating ingredients to retard the burn rate, or adding metal
powder to accelerate the burn rate (McLain, 1980:56). McLain (1980:57)
recommends that dilutions of a stoichiometric mix with inert material should not
exceed 4%, whether to retard or accelerate the burn rate.
vii) Compact Density – The compact density affects the thermal conductivity of the
compositions (Wang et al, 1993). Goodfield and Rees (1985) have found that the
response to variation in consolidation pressure for SnO2, PbO – Si compositions can
be divided into three distinct types of behaviour with respect to the oxidant/fuel ratio
in which they are observed, i.e.
� At high oxidant levels where the reaction temperature is high (1700°C), the
propagation rate decreases with increasing consolidation pressure. They proposed
that this is as a result of the large amounts of relatively volatile metallic reaction
products which are formed and allow for the transfer of heat by mass transfer
processes as the dominant propagation mechanism.
� At low oxidant levels (lower reaction temperature - 1250°C), the propagation rate
increases as a result of heat transfer by conduction being the dominant process.
� At intermediate oxidant levels, the response is more complex as a result of the fact
that no one process dominates the consolidation process (Goodfield and Rees,
1985).
UUnniivveerrssiittyy ooff PPrreettoorriiaa eettdd –– RRiiccccoo,, II ((22000055))

4.Reactivity, Burn Speed and Modelling of Reactions
4-9
Varma et al (1998) noted that the combustion velocity often shows a maximum at
some intermediate density value. They proposed that the effect can be attributed to the
following:
� As the density increases, intimate contact between the reactant particles is
augmented, which enhances the reaction and the front propagation.
� The increased thermal conductivity at higher densities however, means that a
greater heat is lost due to conduction from the reaction zone to the unreacted
portion inhibiting front propagation.
� Contact resistance has not been accounted for previously and may have an effect.
Vadchenko et al (quoted by Varma et al, 1998) on the other hand have found that the
density and absorbed gaseous impurities may have an interrelated effect on the
combustion i.e.
� For low sample densities, escape of the desorbed gases is not limited by
permeation and occurs without destruction of the reactant medium structure. Thus
increasing the density results in increasing thermal diffusivity of the medium and
hence increased velocity.
� At higher sample densities, absorbed gases are unable to escape due to sample
permeability. As the temperature increase, the gas pressure inside the pores also
increases, forming cracks in the sample, lowering the effective thermal
conductivity.
It has been found that a pellet with a higher initial density resulted in a product with a
lower density than pellets with a lower initial density (Varma et al, 1998).
viii) Ambient Pressure – The burning rate may be affected by ambient pressure. This
has been associated with vaporisation of the starting components at the temperature
reached in the combustion front. It has been noted that in some systems, the
combustion rate increases with pressure, reaching a maximum, and then decreases
with further increase in pressure. Examples include: BaO2-Zr, MoO3-Mg and PbO2-
Mg. Because of the high volatility of the reactants, vapours are formed owing to the
heat of combustion. The rise of combustion rate at the low range of pressure is
associated with the rise in the extent of the vapour phase penetrating the pores as the
ambient pressure is increased. However, at higher pressure the gas formation is
UUnniivveerrssiittyy ooff PPrreettoorriiaa eettdd –– RRiiccccoo,, II ((22000055))

4.Reactivity, Burn Speed and Modelling of Reactions
4-10
suppressed and the melt formed in the combustion process can selectively wet the
pores, thereby inhibiting the reaction. The ambient pressure may also affect the
dissolved hydrogen and nitrogen gas.
ix) Cross Sectional Area and Surrounding Material – The reduction in cross sectional
area is accompanied by an increasing lateral heat loss which becomes the dominant
variable as the point of failure is approached with about 60% of the evolved heat
being lost during the reaction (Boddington et al, 1986). Boddington et al (1986) have
found that the use of glass channels rather than steel did not give very different results
except under conditions close to those which give rise to failure. They have therefore
concluded that the cross sectional area of the pyrotechnic column is of prime
importance in determining lateral heat loss. Increasing the sample diameter (D)
increases the ratio of volumetric heat generation (∝D3) to surface heat loss (∝D2). By
increasing the diameter above a critical value, the combustion temperature approaches
the adiabatic value and the burn speed becomes constant (Varma et al, 1998). McLain
recommends that for slow compositions, containers with large diameters and low
thermal conductivity be used (McLain, 1980:60). Beck and Brown (1986) have
experimented with the use of plastic materials with low thermal diffusivities as
containers but found that the pressure of the gaseous polymer degradation products
cause a problem. In the future it would be beneficial to investigate the use of
alternative materials (such as metal-lined polymeric rigid elements) as opposed to
lead as a result of the environmental and health implications of using lead.
x) Binder. Organic binders are reported to lower the ignition temperatures of
pyrotechnic systems. It has been found that the addition of boiled linseed oil (<2%) to
15% Sb/KMnO4 (Does not burn on own) resulted in a composition that ignited and
burned. The temperature profile indicated that the binder acts as a fuel and increases
the combustion temperature (Beck and Brown, 1986). Hardt and Holsinger (1973)
however have found that a mixture of gum arabic and water could be used as a binder
and have no effect on the reaction characteristics of intermetallic reactions.
Ellern (1968:312-318) offers a detailed discussion on the binders used in the
pyrotechnic industry. Boberg et al (1997) report the successful use (little gas
UUnniivveerrssiittyy ooff PPrreettoorriiaa eettdd –– RRiiccccoo,, II ((22000055))

4.Reactivity, Burn Speed and Modelling of Reactions
4-11
production) of carboxymethylcellulose (CMC) in pyrotechnic delay mixtures
containing Si. It would be beneficial to investigate the effect of various binders on the
burning characteristics and safety of the delay compositions and the implications in
terms of processing and cost of implementing the new binder.
xi) Fluxes. The addition of a fluxing agent i.e. a material which reduces the lowest
eutectic temperature effective in the mixture and thus introduce a small amount of
liquid phase, does accelerate solid-solid reactions. Water vapour is known to
accelerate pyrotechnic reactions. Similarly, the mixing, storage and loading of PbO2-
Si mixtures in humidified atmospheres, due to the static hazards, resulted in an
increase in the burn rate of these mixtures (McLain, 1980:43). The effect of the
addition of a fluxing agent would need to be evaluated.
xii) Impurity and presence of guest particles in the lattice. Doping by means of co-
crystallisation has made Fe2O3 highly reactive. McLain (1980:39) experimented with
crystals of CuSO4.FeSO4.xH2O and NiSO4.FeSO4.xH2O, which were grown from an
acidic solution of the salts. The crystals were then decomposed in a current of O2 at
200°C-250°C to produce Fe2O3 Ti-Fe2O3 mixtures prepared using this Fe2O3 had an
increased calorific value (McLain, 1980:39). Doping (Described in Section 2.1.2) NiO
with LiO2 and Cr2O3 affected the reactivity of NiO (McLain, 1980:39). It would be
interesting in the future to compare the reactivity of Si as an n or p-type fuel as well as
an n or p type oxidant (Section 2.1.2).
Varma et al (1998) have graphically summarised the dependencies of the combustion
velocity and maximum combustion temperature on some of the above variables in
Figure 4-2. Varma et al (1998) offer the following explanation for Figure 4-2:
� Velocity and Tc decrease with increasing reactant particle size and with the
addition of an inert (non-reactive) diluent to the mixture, while increasingly
significantly with increasing initial sample temperature.
� Different trends have been observed when the initial sample density is varied.
With increasing density, the combustion front velocity either increases
monotonically or goes through a maximum, while the combustion temperature
generally remains constant.
UUnniivveerrssiittyy ooff PPrreettoorriiaa eettdd –– RRiiccccoo,, II ((22000055))

4.Reactivity, Burn Speed and Modelling of Reactions
4-12
� A decrease in the sample size (i.e. diameter) does not influence velocity and Tc
when the size is larger than the critical size, since heat losses are negligible
compared to the heat release from the chemical reaction. Below the critical sample
size both velocity and Tc decrease due to significant heat loss (Varma et al, 1998).
Figure 4-2: Dependence of Combustion Temperature and Velocity on Various Variables (Varma et al,
1998)
Therefore, a number of variables affect reactivity, ignitability and burn rate of delay
compositions. The aforementioned variables can be divided into three categories:
� Constituent material properties
� Compositional properties and
� Processing and end use properties.
The easiest variables to manipulate on a laboratory scale using the lead-drawn
elements are: the oxidant used, the particle size, the addition of an inert or thermally
conductive material and stoichiometry. These variables will also be the most practical
to modify on a commercial scale. Should the lead-drawn elements be phased out to
use rigid elements, then variables such as the cross sectional area and packing density
can also be used.
UUnniivveerrssiittyy ooff PPrreettoorriiaa eettdd –– RRiiccccoo,, II ((22000055))

4.Reactivity, Burn Speed and Modelling of Reactions
4-13
4.2 Mathematical Modelling of Reactions
A number of authors have attempted to mathematically model the combustion wave
with mixed success. As Boddington et al (Quoted by Yoganarasimhan, 1988) has
stated “The interrelationships which exist between combustion kinetics, heat transfer
and burning velocity are complex and simple cause and effect explanations are
seldom tenable”. This sentiment is echoed by Beretka (1984) who states that due to
the complexity of solid state systems, the mechanisms of many reactions are still not
understood. Furthermore according to Beretka (1984) in practice reactions rarely
reach completion in mixtures of powdered solids due to poor contact of the reacting
particles and sintering of the reactants at high temperatures. In addition, the particle
size distribution and previous history of the reactants make the interpretation of
kinetic measurements difficult (Beretka, 1984). A summary of the mathematical
modelling for thermal properties and combustion which have been attempted may be
found in Appendix A. This modelling will not be analysed here and it is
recommended that the models presented be compared using a chosen formulation that
is well understood.
4.3 Combustion versus Thermal Analysis
The use of thermal analysis for the analysis of pyrotechnics has led to controversy.
The processes or reactions which occur during combustion of a pyrotechnic
composition may be far removed from those identified during thermal analysis
experiments where the samples and experimental conditions are such that thermal
runaway may be avoided (Rugunanan and Brown, 1991, Beck & Brown, 1991). This
is as a result of the different temperature-time histories of the compositions
(Rugunanan & Brown, 1991). Laye (1997) on the other hand is of the opinion that it is
possible to link the self-sustained combustion process with the presence of reactions
identified by thermal analysis.
It has been concluded, however, that caution be exercised when ascribing kinetic
parameters to a combustion regime when these have been obtained from studies under
UUnniivveerrssiittyy ooff PPrreettoorriiaa eettdd –– RRiiccccoo,, II ((22000055))
4.Reactivity, Burn Speed and Modelling of Reactions
4-14
non-ignition conditions where a different rate determining step may operate
(Boddington et al, 1986, Laye, 1997).
In thermal analysis the values obtained for the activation energy are usually higher
than those obtained from combustion studies. In thermal analysis, activation energies
are derived under low-heating rates and non-ignition conditions whereas for those
derived from temperature profile analysis are dominated by diffusion of heat transfer
(Boddington et al, 1990 Laye, 1997).
The DTA/DSC measurements are limited by the following variables:
� Al-Kazarji and Rees (1978) have stated that thermal studies usually have been
performed on loose powdered mixtures whereas in fuse technology compressed
columns of relatively high-density composition are used. While the basic chemical
reactions are similar, the mechanism of combustion will differ from the loose
powder (Al-Kazarji and Rees, 1978).
� Thermal runaway has been the cause of some concern due to the damage it has
caused to thermal analysis equipment, as a result of the increased adiabatic
temperature. Thermal runaway occurs only when the rate of heat generation by the
reaction is greater than the rate of heat loss to the surroundings (Brown, 1989).
� The isothermal or non-isothermal determination of kinetic parameters has been the
source of controversy. Non-isothermal methods require less time and samples
whereas isothermal methods are likely to provide more reliable kinetic
information. Possible tests include the ASTM test based on Ozawa's method
(Brown, 1989). This test involves the measurement of the temperature at the
maximum exotherm, Tmax, on DSC or DTG traces done at different heating rates
(β1). The Arrenhius parameters can then be determined from a plot of ln β1 against
1/Tmax. One problem does exist though. As the use of the temperatures at the peak
maximum or times to the maximum rate does not take into account that the
activation energy of the induction period (should there be one) may differ widely
from that of the main reaction. Rogers and Janney (quoted by Brown, 1989)
recommend DSC measurements under isothermal conditions be used and give
detailed procedures which include careful temperature calibration of the
instrument used and avoidance of emittance errors caused by condensation of
UUnniivveerrssiittyy ooff PPrreettoorriiaa eettdd –– RRiiccccoo,, II ((22000055))

4.Reactivity, Burn Speed and Modelling of Reactions
4-15
decomposition products on the sample holder. There is also a need to determine
the effects of confinement pressure and volume on the kinetic parameters. Rogers
and Janney have made effective use of isotopic substitution in determining
reaction mechanisms (Brown, 1989).
� According to Beck and Brown (1991) it is uncertain whether the DTA signal
obtained from the sample can be regarded as a damped response to the ignition of
the pyrotechnic mixture or whether the conditions in the DTA apparatus result in a
modified, more controlled reaction in the sample. For this reason Beck and Brown
(1991) have modified TOPAZ 2D, a two-dimensional finite element code for heat-
transfer analysis, to allow for heat generation by a chemical reaction with
specified kinetics in an attempt to simulate the heating of a typical “slow-burning”
pyrotechnic composition in DTA. They found during this study that the enthalpy
of combustion may be overestimated by altering the thermal response of the
instrument (the thermal response is a function of the various thermal resistances in
the instrument). The DTA should therefore be calibrated using a material with a
thermal resistance comparable to that of the sample being studied. The extraction
of kinetic parameters from DTA traces also presented difficulties for Beck and
Brown (1991). They recommended that kinetic analysis can be done if confined to
the region of the DTA trace corresponding to the initial stages of the reaction and
if the instrument is of the type in which the averaged sample temperature is
recorded (Beck and Brown, 1991).
� Laye and Charsley (quoted by Beck and Brown, 1991) have stated that the
interpretation of DTA curves are difficult when ignition occurs. The ignition
temperature may be estimated but the exotherm will show temperature rises of
several hundred degrees. Another factor that can not be measured successfully at
ignition is the energy, which is released during ignition because of the inability of
DTA and DSC to follow the rapid rise in the temperature of the sample. Also the
removal of energy by gaseous products cannot be detected in this open form of
calorimetric system (Beck and Brown, 1991).
It is therefore felt that the processes observed during thermal analysis can be used to
explain the combustion process, however, that the values (i.e. activation energy,
kinetic parameters) obtained are not representative of the actual combustion
UUnniivveerrssiittyy ooff PPrreettoorriiaa eettdd –– RRiiccccoo,, II ((22000055))

4.Reactivity, Burn Speed and Modelling of Reactions
4-16
conditions due to the ignition process difference as well as the difference in
compaction and the surroundings.
UUnniivveerrssiittyy ooff PPrreettoorriiaa eettdd –– RRiiccccoo,, II ((22000055))

5.Previous Work
5-1
5. PREVIOUS WORK
5.1 Reagent Properties
A number of authors have reported on the characteristics of some of the reagents
which are used by AEL or which have been used in this investigation.
5.1.1 Silicon
Silicon is one of the most widely used fuels in time delays. It is a chemically abundant
material readily obtained by chemical reduction of silane or by electrolytic
decomposition of molten mixtures of K2SiF6-LiF-KF or SiO2-Na3AlF6. When mixed
with a suitable oxidant and ignited, it provides relatively high heat outputs
(Rugunanan, 1991).
Silicon is generally unreactive except at high temperatures. Hackley et al (1997) has
stated that oxygen, water and steam have no noticeable effect on silicon. This is due
to the presence of a thin, continuous, protective surface layer of SiO2, which is a few
atoms thick. According to Hackley et al (1997), the presence of the oxide layer
prevents further hydrolysis, but also permits wetting of the powder and promotes the
particle dispersion through the development of an electrical double layer resulting
from the dissociation of acidic silanol (Si-OH) surface groups. This is despite a clean
silicon surface being hydrophobic (Hackley et al, 1997). On the other hand, Weiss
and Engelhardt (quoted by Pourbaix, 1966:462) have shown that silicon reacts slowly
with water. It has been stated that the silicon tends to decompose water with the
evolution of hydrogen and gaseous silicon hydride (SiH4) and the formation of silica
or silicates. This is often not apparent at room temperature due to the irreversibility of
the oxidation-reduction reactions of Si and the presence of a thin layer passive layer
of silica (Pourbaix, 1966:462).
UUnniivveerrssiittyy ooff PPrreettoorriiaa eettdd –– RRiiccccoo,, II ((22000055))

5.Previous Work
5-2
Silicon is however, susceptible to attack by halogens i.e. fluorine at room temperature,
chlorine at 300°C and bromine and iodine at 500°C. Molten silicon is extremely
reactive. Greenwood and Earnshaw (1984:385) recommend that when using crucibles
and molten silicon, the crucibles should be made of refractories such as ZrO2 or
borides of transition metals in Groups IVA and VIA. With non-metals of higher
electronegativity, silicon forms non-polar Si3N4 and SiC and polar SiO2 and SiF4 with
an oxidation state of +4.
Silicon is insoluble in water, but does dissolve in hot aqueous alkaline solutions
(Greenwood & Earnshaw, 1984:385). Zeulehner et al (1993:722) describe this
reaction as being extremely violent, even with dilute solutions and it leads to the
formation of hydrogen gas. Dillinger et al (quoted by Hackley et al, 1997)
recommend that silicon only be processed in acidic or weakly alkaline solutions as a
result of the increased reactivity of the silicon at high pH values. This reactivity is
further increased with increasing particle size (Hackley et al, 1997). This means that
wet mixing of Si and any oxidant is limited by the pH range. This has been discussed
in section 10. Silicon is resistant to most acids except to mixtures of HF and HNO3.
According to Zeulehner et al (1993:722), the HF etches the thin oxide layer, which is
present, and the HNO3 in the solution reforms the oxide layer and the process is
repeated.
According to Davies (1999) silicon is a good fuel for delays as it is reasonably
energetic and forms slags which have good heat-retaining properties, however it often
reacts sluggishly except for the unusually fast reaction with lead oxides.
Silicon undergoes gaseous oxidation between 990-1200°C which is below its melting
point of 1410°C. Amorphous SiO2 is formed. The oxidation has been found to be
accelerated by the presence of water and the formation of Si-O-H bonds has been
reported. Oxidation occurs at the Si/SiO2 interface and therefore oxygen has to diffuse
through the oxide layer for the reaction to occur (Rugunanan and Brown, 1991,
Rugunanan, 1991). It thus appears that the reaction rate may be limited by the rate of
diffusion of oxygen to the Si/SiO2 interface and the thickness of the SiO2 layer.
UUnniivveerrssiittyy ooff PPrreettoorriiaa eettdd –– RRiiccccoo,, II ((22000055))
5.Previous Work
5-3
The nitridation of silicon by gaseous N2 to form Si3N4 occurs at temperatures greater
then 1200°C (Rugunanan and Brown, 1991, Rugunanan, 1991).
During TG analysis, Rugunanan and Brown (1991) found that in a N2 atmosphere the
silicon experienced a slight mass loss between 50-700°C due to the desorption of
surface impurities. Above 700°C there was a mass increase due to the slow reaction
with O2 present in the purge gas and not nitridation which as mentioned previously
occurs above 1200°C (Rugunanan & Brown, 1991, Rugunanan, 1991).
Oxygen forms strong bonds with Si. The bond energy has been reported as 25.8kJ and
the observed bond length is 0.163nm (Runyan, 1996:834).
From the Ellingham diagram presented by Birchenall (1986:3356) it can be seen that
the oxidation of Si is possible by Cu2O, CuO, Fe3O4, ZnO, SnO2, CoO, NiO, Cr2O3
and MnO.
Elemental Si is inert and is only classified as a nuisance particulate with a TLV of
10mg/m3. Most Si-compounds are poisonous and the silanes are highly explosive.
SiCl4, SiHCl3 and SiBr4 decompose in the presence of moisture and form SiO2 and the
corresponding acid. The long-chain chlorinated silicon polymers are unstable and
detonate under mild shock (Runyan, 1996:842).
5.1.2 Antimony Trioxide
Sb2O3 has been employed in numerous applications, such as flame retardant in rubber,
textiles, paper, plastics and paints, as a stabiliser in plastics and as a catalyst/opacifier
in glass, ceramics and vitreous enamels. It can be produced by high temperature
oxidation of Sb or SbS3 or it can be produced electrochemically (Mani et al, 1996,
Freedman et al, 1996:385-6).
Below 570°C antimony trioxide is dimorphic i.e. senarmontite - Sb4O6. Sb2O3 melts
in the absence of O2 at 656°C and partially sublimes before reaching the boiling
temperature of 1425°C. Sb2O3 is insoluble in organic solvents and slightly soluble in
UUnniivveerrssiittyy ooff PPrreettoorriiaa eettdd –– RRiiccccoo,, II ((22000055))

5.Previous Work
5-4
water where it forms hydrates that are related to antimonic acid. In an acidic solution,
it dissolves to form a series of complex polyantimonic (III) acids. Freshly precipitated
antimony trioxide dissolves in strong basic solutions and forms the antimonite ion
(Sb(OH)63-). Other derivatives may be made by heating antimony trioxide with the
appropriate metal oxides and carbonates (Freedman et al., 1996:385).
Rugunanan and Brown (1991, Rugunanan, 1991) have reported the following thermal
behaviour in N2 for Sb2O3 heated to 1000°C in open Pt pans:
� A rapid mass loss (94%) between 500-620°C, which meant that it sublimed before
its melting point of 656°C.
� The further mass loss (3.1%) between 620-800°C was the vaporisation of the
remainder of the Sb2O3.
Rugunanan and Brown (1991, Rugunanan, 1991) have reported the following thermal
behaviour in air for Sb2O3 heated to 1000°C in open Pt pans:
� An endotherm between 500-650°C which corresponded to the oxidation of Sb2O3
by O2 i.e. 2Sb2O3 (s) + O2 (g) → 2Sb2O4 (s).
� In air the sublimation and oxidation occur simultaneously.
� The mass loss (63%) was less than obtained by heating the Sb2O3 in N2.
� There was a slight mass loss (1.7%) between 600-760°C followed by a mass gain
(3.8%) between 760-900°C due to the oxidation of unreacted Sb2O3.
� A further mass loss (12-17%) occurred above 910°C as a result of the
decomposition of Sb2O4.
� The formation of Sb2O5 during oxidation was not ruled out as the IR spectrum of
Sb2O5 closely resembles that of Sb2O4.
Long term exposure to Sb2O3 has been reported to result in pneumoconiosis and
emphysema. It is also a suspected carcinogen for humans as it has been carcinogenic
when inhaled by rats. Concentration limits for Sb2O3 as reported by Herbst et al
(1985) are TLV 0.5mg/m3 (as Sb) and TCLo 4.2mg/m
3 during 52 weeks.
UUnniivveerrssiittyy ooff PPrreettoorriiaa eettdd –– RRiiccccoo,, II ((22000055))

5.Previous Work
5-5
5.1.3 Barium Sulphate
Heating BaSO4 decomposes it, the rate increasing with temperature over the range
100-1500°C. The main products are BaO, SO2 and O2. For this reason the melting
point differs in literature. BaSO4 is insoluble in water, more soluble in hot
concentrated H2SO4 and melts of alkali metal salts (Baudis, 1985:330). Beck (1989)
however found that BaSO4 undergoes a crystal phase transition around 1156°C. The
addition of SiO2 has been said to have a catalytic effect on the decomposition of
BaSO4 which may enhance the initial interaction between Si and BaSO4 (Beck,
1989).This phenomenon may explain the variable performance found for detonators
based on this composition. The SiO2 content is a function of the age of the Si,
therefore the difference in SiO2-content may be found throughout a batch and hence
the varying burn speed in batches of this composition.
Insoluble BaSO4 is non-toxic (Wolf, 1985:339).
5.1.4 Nanocat (Super Fine Iron Oxide)
Mach I produce a nano-size iron oxide. The structure of this catalyst has been
determined by Zhao et al (1993) as being FeOOH. Feng et al (1993) found that
annealing the Mach I product led to a 12% weight loss, which indicates that the
FeOOH converts to Fe2O3 by releasing water. The average particle size was also
found to be a function of the annealing temperature (Feng et al., 1993).
Feng et al. (1993) found that the nano-phase powder is water sensitive and may
absorb as much as 15% by weight of water upon prolonged exposure to the
atmosphere. The particles become linked by the adsorbed water molecules and form a
particle cluster (i.e. hydrogen bonding). At elevated temperatures, the water molecules
are readily evolved from particle linkages, leading to agglomeration of the small
particles (Feng et al, 1993).
UUnniivveerrssiittyy ooff PPrreettoorriiaa eettdd –– RRiiccccoo,, II ((22000055))

5.Previous Work
5-6
5.1.5 Iron Oxides
Rugunanan and Brown (1991, Rugunanan, 1991) have found that Fe2O3 heated in air
and N2 showed a linear mass loss (0.6%) between 60-940°C. Fe2O3 melts at 1457°C
(Ellern, 1986:267). Fe2O3 has been classified by Conkling (1996:681) as a slow
oxidiser due to it high melting point and endothermic decomposition meaning that it
will only sustain a self-propagating reaction with the most energetic fuels. This is an
example of how the nature of the oxidant affects the reaction rate.
Investigation into the reaction of Fe2O3 and Al revealed that three intermediate
reaction zones exist between the ferric oxide and Al. It was found that the
decomposition of Fe2O3 →Fe3O4→FeO precedes the interaction between the Al and
iron oxide (Wang et al, .1993).
5.1.6 Lead Oxides
Lead monoxide (PbO) exists in a reddish alpha form up to 489°C. It has a water
solubility of 17mg/L at 20°C and is soluble in HNO3, alkalis, lead acetate, ammonium
chloride and chlorides of Ca and St (Carr, 1993:252-253). It melts at 885°C (Ellern,
1968:267).
Lead dioxide (PbO2) consists of fine flakes in either the orthorhombic alpha of the
tetragonal beta form. As mentioned previously, flaky powders react more readily than
regular, more uniform powder morphologies. This may be one of the variables that
account for the fast reactions encountered with Si-PbO2 compositions.
PbO2 decomposes to PbO when heated above 290°C. This is a low temperature
decomposition that can also account for the fast burn speed observed with Si. It is
practically insoluble in water or alkaline solutions. It dissolves in acetic acid,
ammonium acetate, HCl and a mixture of HCl and H2O2. It is a vigorous oxidising
agent. Pb3O4 is insoluble in water and ethanol, but dissolves in acetic acid or hot HCl
(Carr, 1993:252-253).
UUnniivveerrssiittyy ooff PPrreettoorriiaa eettdd –– RRiiccccoo,, II ((22000055))

5.Previous Work
5-7
Concentration limits for lead and lead-containing materials have been reported by
Adrian (1993:320) as being MAK value (lead) <0.1mg/m3 and TLV-TWA value
(lead) <0.15mg/m3.
Triblehorn, Venables and Brown (1995) have found the following thermal behaviour
for PbO2 and Pb3O4 during a thermoanalytical study:
� DTA curves of PbO2 in air and nitrogen showed a number of shallow, poorly
defined endotherms between 320 and 600°C. TG curves showed 2 overlapping
stages over 370-570°C; the first corresponding to the decomposition
PbO2→Pb3O4 and the second to Pb3O4→PbO.
� DTA curves showed the endothermic decomposition of Pb3O4 at 560°C in N2 and
580°C in air. The decomposition of Pb3O4 to PbO occurred in a single step
starting from 550°C.
� DTA curves of PbO in air and N2 showed 2 small endotherms at 280 and 330°C
with a slight mass loss. This is thought to be as a result of PbCO3 on the surface of
PbO.
5.1.7 Lead Chromate
The chrome yellow pigments are pure lead chromate or mixed phase pigments with
the general formula Pb(Cr,S)O4. They are insoluble in water. Precipitating inert metal
hydroxides on the pigment particles may reduce the pigment’s solubility in acids and
alkalis and discoloration by H2S and SO2. Bayer (quoted by Adrian, 1993, 318) has
described pigments containing lead chromate stabilised in aqueous slurry with
silicate-containing solutions and antimony (III) compounds. Furthermore, Heubach
(quoted by Adrian, 1993:318) developed a process for the alternate precipitation of
metal oxides and silicates using a homogeniser to disperse the pigment particles
during stabilisation. Lead chromate has a low binder demand and good dispersibility
(Adrian, 1993:319).
PbCrO4 with Ti metal or W-based compositions have been studied extensively. It was
found that for the Ti-based system the oxidation of the Ti was to TiO. The burning
rates were linearly dependent on the amount of inert material which was added to the
UUnniivveerrssiittyy ooff PPrreettoorriiaa eettdd –– RRiiccccoo,, II ((22000055))
5.Previous Work
5-8
mixture. The proportionality was also dependent on the fuel/oxidant ratio and
increased as the ratio increased. It was deduced that the rate determining step for the
Ti-based reaction was not the thermal decomposition of the oxidant but rather the
oxidation of the metal. This is unusual for pyrotechnic compositions. For the
W/PbCrO4 system the initial reaction step was proposed to be the decomposition of
the PbCrO4, followed by diffusion of the decomposition products to the W surface
where the W reacts with the oxygen. The volatile WO3 then combines with the PbO to
form PbWO4 or the PbO could decompose further (quoted by Beck, 1984).
PbCrO4 has been classified as a substance suspected of having carcinogenic potential,
but as yet epidemiological investigations have given no indication that practically
insoluble PbCrO4 has any carcinogenic properties (Adrian, 1993:321).
5.1.8 Copper Oxides
Cu2O and red phosphorous have been used in the past and yield intermediate time
delays. Another alternative has been the use of Cu2O with Zn by Johnson (quoted by
Ellern, 1968:202). Watkins et al (1968:80) has also mentioned the use of copper
oxides as oxidant. It melts at 1230°C (Ellern, 1968:267).
5.1.9 Manganese Oxides
According to Greenwood and Earnshaw (1984:1048), MnO2 is an unstable oxide as it
decomposes to Mn2O3 above 530°C and is a useful oxidising agent. Lower oxides of
manganese are basic and react with aqueous acids to give salts of Mn2+ and Mn
3+
cations, whilst higher oxides of manganese are acidic and react with alkalis to yield
oxoanion salts (Greenwood and Earnshaw, 1984:1049).
MnO2 is not extensively used in delay compositions as the dioxide is not stable and its
decomposition is largely dependent on its method of manufacture. It has been used
with FeSi where it was claimed that the rate of decomposition of MnO2 was
independent of the component ratio and that mixtures with the highest rate of reaction
UUnniivveerrssiittyy ooff PPrreettoorriiaa eettdd –– RRiiccccoo,, II ((22000055))
5.Previous Work
5-9
generated the lowest heat of reaction (quoted by Beck, 1984). Beck (1984) has found
that thermal behaviour of MnO2 was not reproducible and depended on the source. It
was also used by Beck (1984) in conjunction with Sb. Thermal analysis of 50%
Sb/MnO2 showed a gradual mass loss (decomposition of MnO2) followed by a rapid
mass gain and strong exotherm around 500°C.
5.1.10 Copper Antimonite
Harding (quoted by Mellors, 1933:432) obtained the compound by adding a dilute
solution of copper sulphate to an excess of a saturated solution of antimony trioxide in
potash lye. The green crystalline powder that Harding (quoted by Mellors, 1933:432)
produced was soluble in hydrochloric, tartaric or citric acid. When heated in an open
crucible, it first evolves antimony oxide and then explodes, leaving a residue of
antimony trioxide and copper oxide. When heated in a closed vessel, the powder was
found to leave a residue containing metallic copper (Mellors, 1933:432).
5.2 Silicon as a Fuel – Compositions Reported in Literature
Figure 5-1 (a and b) contains a summary of Si-based compositions which have been
reported in literature. Summaries based on the reported literature of the compositions
which are used by AEL or were used in this study follow Figure 5-1 (a and b).
UUnniivveerrssiittyy ooff PPrreettoorriiaa eettdd –– RRiiccccoo,, II ((22000055))
5.Previous Work
5-10
Figure 5-1(a): Si-based Compositions Reported in Literature
Silicon as Fuel
Binary Compositions Ternary Compositions
SnO2: Davitt and Yuill (1983) Burn
speed:759-3181ms for 25.4mm element
and 12mm Pb3O4 element. Rugunanan
and Brown (1991) Burn Speed: 5.1mm/s-
17mm/s. Goodfield and Rees (1985).
Pb3O4: Snegirev and Talalov (1991).
Moghaddam and Rees (1981). Hale
(quoted by Ellern, 1968: 197).
Hedger (1983). Al-Kazraji et al,
Nakahara & Hikita (quoted by
Rugunanan and Brown, 1991).
PbO: Moghaddam and Rees (1981).
Al-Kazaraji and Rees (1979a).
Goodfield and Rees (1985).
PbCrO4: Hale (quoted by Ellern,
1968: 197). Rugunanan (1991).
BaSO4: Beck (1989). Beck and
Flanagan (1992). Kelly (quoted by
Rugunanan and Brown, 1991).
Bi2O3: Boberg et al (1997) Burn
speed:5mm/s and 35mm/s.
Zr, Bi2O3: Boberg et al (1997) burn
speed:76-100mm/s.
MnO, Bi2O3: Boberg et al (1997)
burn speed: 20mm/s.
SiO2, Bi2O3: Boberg et al (1997)
burn speed: 11mm/s.
PbO2: McLain (1980).
Fe2O3: Goldschmidt (quoted by
McLain, 1980). Rugunanan and
Brown (1991). Spector et al (Quoted
by Wang et al, 1993).
SnO2, Fe2O3: Rugunanan and
Brown (1994c). Rugunanan (1991).
SnO2, Sb2O3: Rugunanan and
Brown (1994c). Rugunanan (1991).
Fe2O3, Sb2O3: Rugunanan and
Brown (1994c). Rugunanan (1991).
SnO2, KNO3: Rugunanan and
Brown (1994c). Rugunanan (1991).
KNO3, Fe2O3: Rugunanan and
Brown (1994c). Rugunanan (1991).
B, K2Cr2O7: (quoted by
Rugunanan, 1991).
Sb2S3, Pb2O3: (quoted by
Rugunanan, 1991).
Fe, MnO2: (quoted by Rugunanan,
1991).
NaF, Pb3O4: (quoted by
Rugunanan, 1991).
UUnniivveerrssiittyy ooff PPrreettoorriiaa eettdd –– RRiiccccoo,, II ((22000055))

5.Previous Work
5-11
Figure 5-1 (b): Si-based Compositions Reported in Literature
One four component mixture was reported by Boberg et al (1997) i.e. Si, Zr, Bi2O3
and TiO2 with a burn rate varying between 7-9mm/s.
B, KCrrO7: Charsley et al (1980)
Howlett and May (1974).
KNO3: Krishnamohan et al, Leeuw
(quoted by Rugunanan and Brown,
1991). Rugunanan and Brown (1991)
1.7mm/s-34.5mm/s.
Sb2O3: Rugunanan and Brown
(1991). Rugunanan (1991).
MnO2: (quoted by Rugunanan, 1991).
Rugunanan (1991).
KMnO4: (quoted by Rugunanan,
1991).
Fe2O3, Pb3O4: (quoted by
Rugunanan, 1991).
KClO4, Pb3O4: (quoted by
Rugunanan, 1991) Yoganarasimhan
FeSi, Pb3O4: (quoted by
Rugunanan, 1991).
S, KNO3: (quoted by Rugunanan,
1991).
BaCrO4: Rugunanan (1991).
K2CrO4: Rugunanan (1991).
Na2CrO4: Rugunanan (1991).
K2Cr2O7: Rugunanan (1991).
Na2Cr2O7: Rugunanan (1991).
Cu2O: Rugunanan (1991).
SrO2: Rugunanan (1991).
Silicon as Fuel
Binary Compositions Ternary Compositions
Al, Cu2O: Mohler (quoted by Wang
et al, 1993).
UUnniivveerrssiittyy ooff PPrreettoorriiaa eettdd –– RRiiccccoo,, II ((22000055))

5.Previous Work
5-12
5.2.1 Lead Oxides-Si
Hale (quoted by Ellern, 1968:197) reported the first use of Pb3O4. He proposed a
composition of 84.4% Pb3O4, 14.85 Si and 0.8% glycerine (binder) for anti-aircraft
fuses.
Thermal Analysis
i) PbO-Si
During DSC studies, Moghaddam and Rees (1981) found that 2 exothermic peaks in
N2 for the PbO-Si system were evident with maxima at 637°C and 709°C
respectively. They proposed that the first peak is due to the surface reaction of PbO
and Si to form trace amounts of SiO2 and Pb and the second peak is the bulk reaction
whereby the Si atoms penetrate the PbO lattice. This is in contradiction to Rugunanan
and Brown (1991) and Rugunanan, (1991) who have stated that the oxidation of Si in
air occurs at the Si/SiO2 interface. The maximum heat release was obtained from the
90:10 (PbO:Si) composition (Moghaddam & Rees, 1981).
However, studies by Al-Kazarji and Rees (1979a) on a 70:30 PbO:Si system yielded
the following conclusions:
� The reactions followed the same pattern as those of the Pb3O4-Si system i.e.
similar temperature occurrence and relative size of the DTA peaks.
� Initially the monoxide was converted to red lead at temperatures above 350°C:
540°C
6PbO + O2 ↔ 2Pb3O4
590°C
2Pb3O4 + Si ↔ 6PbO+SiO2
665°C
PbO + ½O2 + Si↔ SiO2 + Pb
� The excess Si which was present at this concentration meant that the first
exothermic reaction occurred on the surface and the second exothermic reaction
UUnniivveerrssiittyy ooff PPrreettoorriiaa eettdd –– RRiiccccoo,, II ((22000055))
5.Previous Work
5-13
was enhanced at the higher temperature to favour the movement of the reactants to
penetrate the product layer which formed around the constituents.
� Under nitrogen, the same composition yielded a less violent second reaction due
to the absence of oxygen.
� A DTA study of a 70:30 Pb-Si mixture in air showed that the lead melted at
327°C and was partially oxidised to PbO. At temperatures higher than 350°C the
monoxide was converted to Pb3O4 and the reactions thereafter were similar to
those of Pb3O4-Si mixtures (Al-Kazarji and Rees, 1979a)
ii) Pb3O4-Si
Moghaddam and Rees (1981) detected two exothermic peaks at the same temperature
range as PbO-Si for Pb3O4-Si mixtures. They also observed the reaction under a hot
stage microscope and observed a contraction in volume at the beginning of the
reaction. They concluded that the reaction is between lead dioxide (formed by the
decomposition of the red lead) and Si.
Zhou Conzhang et al (quoted by Davies, 1999) confirmed by chemical analysis and
DTA the existence of a solid state non-incandescent pre-ignition reaction starting at
420°C for the Pb3O4-Si composition. It was considered to involve the diffusion of
oxygen and of lead from red lead to the surface of the Si. PbSiO3 was found in the
diffusion layer and the rate of the reaction depended on the thickness of the oxide
layer on the Si. Zhong Jun et al (quoted by Davies, 1999) on the other hand showed
that the thermal ignition of the reaction between red lead and silicon was controlled
by the diffusion of Si through its oxide coating and the thickness of the oxide coating
affected the burn rate and its reproducibility. Hence again the discrepancy on whether
the lead and oxygen diffuse or the Si diffuses to the reaction interface.
Mixtures of Pb3O4-Si were also analysed by Al-Kazraji and Rees (1978). A summary
of their main findings with regards this system may be found in Table 5-1.
UUnniivveerrssiittyy ooff PPrreettoorriiaa eettdd –– RRiiccccoo,, II ((22000055))

5.Previous Work
5-14
Table 5-1: Thermal Analysis of Pb3O4-Si (Al-Kazarji and Rees, 1978)
Pb3O4 in air
� Endotherm between 540-590°C indicated the decomposition of Pb3O4 to PbO and O2.
� Endotherm at 868°C indicated the melting of the PbO which was formed.
� TG curve indicated a mass loss due to the decomposition and finally due to the
vaporisation of PbO at 950°C.
Si in air
No noticeable peaks were obtained by the DTA until 1000°C.
Pb3O4-Si in air
� An exotherm was observed between 520°C and 600°C for all the compositions. The
reaction was of short duration (200ms) and the formation molten lead and excess
molten silicon was confirmed.
� An exotherm which commenced slowly at 626°C but rose sharply at 660°C was
explained by the oxidation of the molten lead to lead oxide, which then reacted with
the excess silicon at 665°C. It was observed that the higher the silicon content of the
mixture, the less oxygen is available from the red lead and thus the reactions were less
exothermic.
� An exotherm was observed between 755-788°C, which indicated the reaction of PbO
with lead silicate by migration of lead oxide into the silicate lattice at the silicate
melting point.
� The TG curve indicated an increase in the mass of the products. The percentage
increase increased with increasing Si content due to the reaction of O2 with excess Si.
� The maximum heat evolution occurred for the 90:10 (Pb3O4) composition near the
stoichiometric amount of silicon (7.6%).
� XRD and IR confirmed the presence of PbO, Si and SiO2.
Pb3O4-Si in N2
� Little or no reaction occurs after the first peak at 520-600°C in the DTA as the lead that
was formed after the first reaction, was not oxidised to react further.
� Reactions were less exothermic than those in air.
� XRD indicated that for mixtures 30:70 to 80:20 (Pb3O4:Si) heated to 600°C, only
crystalline Pb and Si were present. The 90:10 mixture indicated the presence of PbO,
Pb and Si under the same conditions.
UUnniivveerrssiittyy ooff PPrreettoorriiaa eettdd –– RRiiccccoo,, II ((22000055))

5.Previous Work
5-15
They also found that at higher %Si compositions (30:70, 40:60 and 50:50) the amount
of oxidiser present was insufficient to oxidise the silicon surface available and the
heat generated was too small to sustain the burning of delay compositions (Al-Kazarji
and Rees, 1978).
Composition, Heats of Reaction and Burn Rate
Glasby (quoted by McLain 1980:58-59) found that the velocity of propagation for the
Pb3O4-Si system increased with pressure until a limiting velocity at a critical pressure
(900-1000 psi i.e. 6.2-6.9MPa) after which is decreased. This effect was due to the
stabilisation of the PbO moiety of the red lead. Jakubko (quoted by Davies, 1999)
found that the burning of very rich fuel mixtures (55% Si) the composition burned
faster under venting than under confinement.
Al-Kazarji and Rees (1979b) did further work on the lead oxides and silicon systems.
Their findings confirmed McLain’s (1980:53) (Section 4.1 (iv)) concerning the
relationship between the stoichiometry, heat of reaction and burning rate particularly
for the finer silicon particle sizes. Some of their other observations include the
following:
� Compositions containing more than 50%Si failed to maintain sustained reliable
combustion. This was particularly evident with the coarser silicon particles that
were used.
� The maximum heat of generation occurred at about 10% silicon and then
decreased.
� For fine silicon the heat evolved per second reached a peak value at approximately
the same percentage silicon as that at which the rate of burning reached its
maximum.
� A second peak was found to occur for the coarser grades of silicon. This was been
attributed to the high pressure generated in the tubes owing to the high
temperature of reaction.
� Theoretically the maximum rate of burning should coincide with the maximum
heat of reaction. The discrepancy, in particular for the coarser grades of Si, was
due to the fact that the reactions took place at the surface and the Si particles
became coated with a layer of SiO2, which prevents complete reaction of the Si
UUnniivveerrssiittyy ooff PPrreettoorriiaa eettdd –– RRiiccccoo,, II ((22000055))

5.Previous Work
5-16
core even in the molten state. Thus, in approaching the peak of the rate of
reaction, the amount of Si is reduced and the layer of product being thicker, causes
the rate of reaction and burning rate to drop. This occurs at a point richer in Si
than that for the heat-generation maximum.
� For compositions less than 15%Si the rates of reaction were dependent on the
pressures formed and the diffusion of the vaporised oxides into the surface of the
Si and product layer. Where the Si content was in excess of 20%, solid-solid
mechanisms prevail and the surface area of the Si and good fuel/oxidiser contact
(controlled by the loading process of the tubes) were the controlling variables.
� XRD and IR confirmed the presence of Pb, fused silica and unreacted Si.
� For compositions containing large amounts of Si, TG showed the loss of some of
the oxygen, indicating a solid-solid reaction, whereas compositions with small
amounts of Si, the temperature was so high that some of the PbO was vaporised
and the solid-solid reactions would not predominate.
� For large excesses of Si, (above 30%), the reactions were incomplete owing to the
presence of some Si particles not being in contact with Pb3O4 (Al-Kazarji and
Rees, 1979b).
Hedger (1983) found and suggested the following for Pb3O4-Si :
� The delay time varied with fuel surface area but became independent at high
surface areas.
� At fuel surface areas >1m2/g the delay time curve had a discontinuity between 30
and 40% Si which was attributed to the change in propagation mechanism of the
reaction front.
� There was a minimum delay time between 30 and 40% Si.
� The time delay was provided by the initial stage of the reaction which was
suggested to be formation of the SiO2PbO liquid phase.
5.2.2 BaSO4-Si
Kelly (quoted by Rugunanan, 1991) attempted to obtain a burn rate of 4.2mm/s with
this composition and found that it could be achieved with a mixture containing 45.5%
Si. He found the minimum burn rate (3.8mm/s) was observed at 40% Si. The burn rate
UUnniivveerrssiittyy ooff PPrreettoorriiaa eettdd –– RRiiccccoo,, II ((22000055))
5.Previous Work
5-17
generally increased with increasing SSA of Si. Furthermore, the burn rates were very
dependent on the source of the ingredients (Rugunanan, 1991).
Beck and Flanagan (1992) have patented a delay composition comprising a
consolidated, particulate mixtures of silicon and BaSO4 and a minor proportion of a
dispersed metal compound such as alkali metal salts (sodium chloride, sodium
sulphate and potassium sulphate); lead monoxide, antimony tri- and pentoxide and
vanadium pentoxide. Of the available oxidisers, Beck and Flanagan (1992) have used
BaSO4 but have found Fe2O3 to be effective. The metal compound serves as a reaction
facilitating flux. The preferred metal compound is vanadium pentoxide as it melts at a
temperature of 600°C, which is lower than the ignition temperature of Si/BaSO4
compositions (reported as being 680°C). The molten flux appears to facilitate the
Si/BaSO4 reaction without actually participating in any dominant chemical reaction or
altering the essential character of the Si/BaSO4 composition as an intermediate to
slow burning composition. The V2O5 is, however, consumed and becomes involved in
complex mixed oxide formation as can be seen from the products, which contain the
V4+ and V
5+ species. The presence of the V2O5 helps with the composition’s
resistance to quenching by the heat-sink effect of the metal tubular containment so
that the composition is effective in rigid elements. The relative proportions of each
ingredient are as follows:
� Si:BaSO4 -55:45 to 30:70 parts by mass
� Flux – preferably 2 to 5 percent by mass. Above 10%, it is believed that the
facilitating role of the flux will be offset by the inert diluent effect and tend to
quench the reaction.
Table 5-2 summarises Beck and Flanagan’s (1992) experimental results. Their
formulations were prepared by a wet mixing procedure, drying and sieving. The
formulations were tested using two testing procedures i.e.:
1. The first procedure included the consolidation of the compositions to a density of
about 2g/cm3 in a 22mm zinc delay element (i.d. 3,1mm, o.d. 64mm), containing a
6mm long fast burning igniting sealing composition. The element was then encased in
a delay detonator and initiated using a shock wave conductor.
2. The second procedure included the loading of the compositions into a stainless steel
combustion channel (dimensions:6mm× 10mm×30mm) with a wall thickness of 1mm
UUnniivveerrssiittyy ooff PPrreettoorriiaa eettdd –– RRiiccccoo,, II ((22000055))

5.Previous Work
5-18
to reduce heat losses. The delay column was then consolidated to a density of about
1.8g/cm3 and initiation was achieved by an electric fusehead. The delay times were
determined by means of two thermocouples embedded in the column and separated by
14mm.
Table 5-2: Beck and Flanagan’s (1992) Experimental Results for BaSO4-Si
Reagent Mass Ratios
(Experimental Procedure)
Results
Si:BaSO4 – 45,5:54,5
(Basic Si-BaSO4 formulation used
in the experiments which follow)
Si–7m2/g
BaSO4–0,8m2/g
(1)
All the attempted samples were incapable of
sustaining combustion over an appreciable
distance.
V2O5 – 1% mass percentage was
added to the basic Si-BaSO4
formulation
(1)
18 out of a sample of 20 detonators fired
successfully with an average delay time of
3,550±0.072s. The two misfired detonators
revealed that the main delay column had initiated
but had failed to propagate along the length of
the column
V2O5 – 2% by mass was added to
the basic Si-BaSO4 formulation
(1)
All 20 detonators fired with an average delay
time of 3,562±0,103s
V2O5 – 4.5% by mass was added
to the basic Si-BaSO4 formulation
(1)
All 20 detonators fired with an average delay
time of 3.523±0.066s
V2O5 – 10% by mass added to the
basic Si-BaSO4 formulation
(1)
All 20 detonators fired with an average delay
time of 3,562±0,103s
Sb2O3 - 10% by mass was added
to the basic Si-BaSO4 formulation
(1)
12 out of the 20 detonators which were tested
fired with an average burning speed of 4.5mm/s
UUnniivveerrssiittyy ooff PPrreettoorriiaa eettdd –– RRiiccccoo,, II ((22000055))
5.Previous Work
5-19
Reagent Mass Ratios
(Experimental Procedure)
Results
Sb2O5 - 10% by mass was added
to the basic Si-BaSO4 formulation
(1)
19 out of the 20 detonators which were tested
fired with an average burning speed of 4.8mm/s.
Basic Si-BaSO4 formulation
(2)
An average delay time of 3.900±0.500s was
measured.
V2O5 – 10% by mass added to the
basic Si-BaSO4 formulation
(2)
An average delay time of 3.840±0.200s was
measured.
Si:Fe2O3 – 30:70
10% by mass of Na2SO4 was
intimately mixed with the
Si/Fe2O3 mixture
Si–5.6m2/g
Fe2O3–0,8m2/g
(1)
A maximum burning speed of about 8.75mm/s
was obtained.
According to Beck and Flanagan (1992), these compositions are characterised by low
toxicity, moisture resistance and a uniform burn rate.
5.2.3 Fe2O3-Si
A number of possible reactions may occur between Si and Fe2O3. These include:
� 3Si(s) + 2Fe2O3(s) → 3SiO2(s) and 4Fe(s) (Hr=-355kJ/molSi and 21% Si) (A)
� 3Si(s) + 2Fe2O3(s) → SiO2(s) and 4FeO(s) (Hr=-325kJ/molSi and 8% Si)
(Rugunanan and Brown, 1994a).
� Fayalite (Fe2SiO4) may also be formed. Spector et al (quoted by Wang et al, 1993)
mixed radioactive wastes into a thermite mixture and then ignited the mixture to
form highly water insoluble polysilicates which fix the radioactive materials. The
principal thermite reaction for this process was 4Fe2O3+3Si → 3FeSiO4+2Fe
UUnniivveerrssiittyy ooff PPrreettoorriiaa eettdd –– RRiiccccoo,, II ((22000055))

5.Previous Work
5-20
(Hr=-245cal – 1026J). The mixture was however preheated before ignition (Wang
et al, 1993).
Rugunanan and Brown (1991, 1994, Rugunanan, 1991) have found the following:
� The range of compositions which sustained combustion was 20-40% Si (by mass).
� The measured burn rates were 2.3 (20% Si), 3.7 (25% Si), 3.8 (30% Si), 3.6 (35%
Si) and 4.5 (40% Si) mm/s.
� The maximum temperature attained during combustion was 1250°C. This
indicated that the reaction appeared to occur predominantly between solid oxidant
and solid fuel as this temperature is below the melting points of Fe2O3 and Si.
� The temperature profiles were complex with three overlapping stages. The first
stage was the relatively slow rise in temperature after triggering. The second was a
sigmoid segment followed by the third segment which was also a sigmoid
segment. This was explained by diffusion of Si or Si4+ via the cation vacancies
into the condensed Fe2O3 layer. The possibility of redox processes such as
Fe2+→Fe3+, with accompanying changes in ionic size, could occur as the reaction
proceeds through the SiO2 layer and could thus not be excluded as also a possible
explanation. Another explanation was that the burn front could have been convex-
forward resulting in different time responses in the thermocouple.
� The presence of fayalite was confirmed and was formed by SiO2 and FeO and not
by the direct reaction of Fe2O3 and Si.
� The heat of reaction at 30%Si was -0.83kJ/g.
� There was only a slight mass loss after burning indicating no significant loss of
volatile species.
� SEM showed the formation of solidified melts and the presence of unreacted
particles.
� The maximum enthalpy of reaction was found to be at 25% Si which is higher
than the 21% indicated for reaction A. This was attributed to the fact that the Si
particles become coated with a layer of oxide and this prevents further oxidation
of the bulk.
� Varying the loading pressure of the compositions resulted in emphasis of the step-
wise nature of the temperature profiles. The linear burn rate initially decreased till
a minimum followed by an increase with further increase in density. The mass
UUnniivveerrssiittyy ooff PPrreettoorriiaa eettdd –– RRiiccccoo,, II ((22000055))

5.Previous Work
5-21
burning rate was approximately constant but then increased at higher densities
further indicating a solid-solid reaction since the inter-particle contact between the
reactants was increased by increasing the compaction of the mixture.
� The burn rate was found to vary only slightly (35%Si) with increasing surface
area of the Si particles.
� Burning failed when the addition of additives exceeded 9% for SiO2 and 7%
Al2O3. The maximum temperatures were unaffected by the additives. The burning
rates decreased sharply with increasing H2O content whilst the reaction
temperature increased. Samples containing 5% water failed to ignite.
Thermal analysis of this composition (35% Si) by Rugunanan and Brown (1991)
yielded no significant thermal activity up to 1000°C.
5.2.4 Sb2O3-Si
Rugunanan and Brown (1991, 1994b, Rugunanan, 1991) have found the following:
� The range of compositions which sustained combustion was 20-50% Si (by mass).
Mixtures with 20-25% Si were slightly gassy (mass loss≈3%) which caused
thermocouple shorting and sample movement.
� The measured burn rates were 1.6 (20% Si), 3.3 (25% Si), 6.3 (30% Si), 8.7 (35%
Si),8.5 (40% Si),8.7 (45% Si) and 7.25 (50% Si) mm/s. This burn rate was lower
than expected because despite the high mobility of Sb2O3 through sublimation, it
was thought that the adsorption of unchanged Sb2O3 on Si surfaces precedes the
oxidation of the Si. They felt that the movement of Si4+ into Sb
3+ vacancies in the
condensed Sb2O3 layer was a possibility, as was the formation of a barrier of the
higher oxide, Sb2O5 on the surfaces.
� The temperature profiles of mixtures between30-50% showed a smooth rise to the
maximum temperature and appeared reproducible.
� The maximum temperature attained during combustion was 1250°C.
� The heat of reaction at 43%Si (which corresponded to the maximum burn rate)
was -0.6kJ/g.
UUnniivveerrssiittyy ooff PPrreettoorriiaa eettdd –– RRiiccccoo,, II ((22000055))

5.Previous Work
5-22
� SEM of the combustion products showed the formation of molten material and
crystalline structures embedded in the solidified melt. The presence of channels
and cavities in the frozen melt formed during the evolution of gaseous products.
� Non-crystalline SiO2 was detected using IR whilst XRD yielded Si, Sb2O3 and Sb.
Low intensity XRD peaks were attributed to the formation of antimony silicates
and antimony silicides.
� The temperature profiles showed a decrease in the rise-time to the maximum
temperature with increasing density. The burn rate and mass burn rate showed an
initial increase with compaction followed by a slight decrease with increasing
density. This provides further evidence that the system may involve the reaction
between molten Sb2O3 or even Sb2O3 vapour and solid Si.
� There was a slight increase in the burn rate with an increase in the specific surface
area of the fuel.
� Both the burn rate and maximum temperature decreased with increasing
proportions of additives SiO2 and Al2O3, but the decrease was greater for SiO2.
The presence of water decreased the burn rate even more than SiO2 and Al2O3 and
the mixtures containing 3% water failed to ignite. The maximum temperature
appeared unchanged after the addition of water, but there was an increase in the
induction time of the temperature profile. The effect of enhancing the reactivity of
Si in the presence of moisture and oxygen could thus not be confirmed.
� The thermal conductivity of this composition increased linearly with increasing Si
content.
DSC analysis of this composition (40%Si) by Rugunanan and Brown (1991,
Rugunanan, 1991) yielded the following:
� An exotherm from 590-615°C with change in enthalpy of -0.53kJ/g was evident in
N2. This occurred during the temperature range for the sublimation of Sb2O3.
� Similarly an exotherm was evident for air between 600-680°C with a change in
enthalpy of -0.74kJ/g.
� The enthalpy values which were measured were not reproducible and varied
according to the mass of the sample and the heating rate used.
It thus appears that some reaction occurs between the Si and Sb2O3 during the
sublimation of Sb2O3. In air the reaction is further complicated by the gaseous
oxidation of Sb2O3.
UUnniivveerrssiittyy ooff PPrreettoorriiaa eettdd –– RRiiccccoo,, II ((22000055))
5.Previous Work
5-23
TG analysis by Rugunanan and Brown (1991, Rugunanan, 1991) found that the
reaction was incomplete as only 5% of the Si reacted with the Sb2O3 for pans without
lids and 20% of the Si reacted for pans with lids compared with the expected 46.5%.
5.2.5 MnO2-Si
This composition has been reported to be used for long period delays i.e. 0.6 to 12s. A
ternary mixture of MnO2-Fe-Si has been reported as providing millisecond delays (0
to 400ms) (quoted by Rugunanan, 1991).
Rugunanan (1991) found the following for this composition:
� The composition was slightly gassy and very hot.
� The thermocouple melted in all his experiments
� The measured burn rates and mass loss that were reported are summarised in
Table 5-3
Table 5-3: MnO2-Si – Burn Rates and Mass Loss as Reported by Rugunanan (1991)
Mass % Silicon Burn rate (mm/s) % Mass loss
20 5.0 4
30 6.6 4
40 6.6 2
5.2.6 PbCrO4-Si
Rugunanan (1991) found that for 20 and 30% Si mixtures, this composition burned
with a 15% mass loss and a burn rate of 7.2 and 13.0 mm/s respectively. Furthermore
the gassy nature of the reaction led to shorting of the thermocouples.
UUnniivveerrssiittyy ooff PPrreettoorriiaa eettdd –– RRiiccccoo,, II ((22000055))

6.Equipment and Experimental Procedures Development
6-1
6. EQUIPMENT AND EXPERIMENTAL PROCEDURES
DEVELOPMENT
6.1 Planning
6.1.1 Experimental Procedures Reported in Literature
Table 6-1 summarises the experimental procedures and equipment (with the exception
of thermal analysis) reported in literature as well as any problems which may have
been encountered for the analysis of pyrotechnic compositions.
Table 6-1: Experimental Procedures and Equipment Reported for use in Pyrotechnic Composition
Analysis
Method and Equipment Comments
Charsley et al (1978)
Temperature Profile: 0.1 mm Pt/Pt10%Rh glass
sleeve-insulated thermocouples embedded in steel
tube. Fuse ignition. Transient recorder (Data
Laboratories DL 905)
Charsley et al (1980)
Velocity: Electronic timer (Venner, TSA6616) initiated
by electric pulse used to ignite fuse and stopped by
photo cell which detected burn through. Corrected for
time response of apparatus.
Temperature Profile: Same as for Charsley et al
(1978).
Davitt and Yuill (1983)
Velocity: Nonelectric detonators initiated by Nonel
Shock wave conductor.
UUnniivveerrssiittyy ooff PPrreettoorriiaa eettdd –– RRiiccccoo,, II ((22000055))

6.Equipment and Experimental Procedures Development
6-2
Method and Equipment Comments
Drennan and Brown (1992a)
Temperature Profile: Composition pressed into
stainless steel channel. Ignited by starter increment
and safety match. 0.05-0.3mm Pt/Pt10%Rh
thermocouple. Smoothed temperature profiles using
12-point cubic spline program.
Velocity: IR detectors triggered and stopped timing
circuit.
Hardt and Holsinger (1973)
Velocity: Observation of flame front through high
speed motion pictures or burn wire technique.
Oscillographs of anode current of pyrometer. Ignition
by B/BaCrO4 heated nichrome or tungsten bridge wire
Beck (1989)
Temperature Profile: Composition pressed into
stainless steel channel and ignited with a fusehead and
captured with A/D card. Sample frequencies varied
between 1109 and 20Hz. 0.1mm Pt/Pt10%Rh
thermocouples.
Experienced signal
disruption after reaching
1400°C. Attributed to
electrical interference as a
result of presence of molten
Si as thermocouples were
undamaged.
Boddington et al (1982)
Temperature Profile: Composition pressed into
stainless steel channels and ignited with a fusehead.
Recorded using a microprocessor and computer.
Signal amplification. Pt/Pt10%Rh thermocouples
(0.05, 0.1, 0.2 and 0.3mm diameter). Thermocouple
calibration done using British Standards 4937, 1973).
Checked using melting point of zinc and gold.
Velocity: Electronic timer (Venner TSA 6616).
Photocell at end of channel stopped signal.
Found that the calculated
burning velocities based on
temperature profiles were
generally less than the
experimental results.
Attributed this to the size of
the thermocouples. Have
proposed a method for
compensating for the
thermocouple size.
UUnniivveerrssiittyy ooff PPrreettoorriiaa eettdd –– RRiiccccoo,, II ((22000055))

6.Equipment and Experimental Procedures Development
6-3
Method and Equipment Comments
Boddington et al (1986, 1989)
Temperature Profiles: Composition pressed into steel
or machinable glass (Corning, Macor Glass). Pt/Pt
13% Rh thermocouples (0.1, 0.2 and 0.3mm diameter).
Captured by high speed analogue to digital converter.
Boddington et al (1990)
Temperature Profiles: Composition pressed into steel
cylinder with septum. Ignited with electric fuse. Used
pyrometers with analogue signal. Velocity: Electric
timer (Venner, TSA 6616) started by electrical pulse
and stopped by signal from photocell.
Corrected for the response
time of the pyrometers
which lowered the observed
maximum temperatures by
<30K.
Al-Kazarji and Rees (1979b)
Velocity. Photoelectric cell connected to Racal
Universal Counter/Timer (no9901)
Hedger (1983)
Velocity: Conventional Electric Detonators
Beck (1984)
Temperature Profile: Composition pressed into
channel. Pt/Pt 10% Rh thermocouple (0.05, 0.1, 0.2
and 0.3mm diameter) insulated with thin glass
capillaries. Could not initiate using hot wires. Initiated
using starter increment of 50% Mn/KMnO4. Originally
used digital storage oscilloscope. Replaced with
Southwestern Technical Products 6809
microcomputer. Low noise DC amplifier and 12bit
analogue to digital converter. Used fourth order
polynomial to convert emf to temperature. Electronic
CJC. Checked thermocouple calibration using melting
points of pure metals and salts.
Velocity. Used photodetectors. Caused interference in
thermocouple signal. Could not measure profiles
simultaneously.
Container is reusable.
UUnniivveerrssiittyy ooff PPrreettoorriiaa eettdd –– RRiiccccoo,, II ((22000055))

6.Equipment and Experimental Procedures Development
6-4
Method and Equipment Comments
Goodfield and Rees (1985)
Velocity: Compressed into metal tubes. Ignited by
electrically fired fuse head. Time measured with Racal
Universal Counter Timer (9901). Photoelectric cell.
Beck and Brown (1986)
Velocity. Compared use of aluminium and
polymethacrylate (Perspex) tubes.
Found that the results
obtained in open laboratory
system were different from
those obtained from
detonators in practice, i.e.
Compositions which burned
in the channel misfired in
the detonators.
Rugunanan (1991)
Temperature Profile: Pt/Pt 10% Rh (0.1mm diameter).
Insulated with asbestos paper. Initiated with starter
increment. Calibrated using melting points of Pb and
Zn. PC-26A/D card.
Velocity. IR detectors and manual computing counter
clock.
Laye (1997)
Thermal Conductivity. Hot wire and laser flash heating
techniques.
Neither were reliable.
Rugunanan and Brown (1994a,b)
Temperature Profile. Pt/Pt 10%Rh. 0.1mm diameter.
Composition pressed into stainless steel channel.
Velocity. Same as for Beck (1985)
6.1.2 Planned Measurements
Based on the above experiences and the objectives, it was decided to attempt to
combine temperature profile capturing and burn rate measurements by embedding two
temperature sensing devices along the length of the pyrotechnic column during
UUnniivveerrssiittyy ooff PPrreettoorriiaa eettdd –– RRiiccccoo,, II ((22000055))

6.Equipment and Experimental Procedures Development
6-5
combustion. The compositions had to be prepared in real detonator assemblies
(excluding explosive) and detonated using shock tube in an attempt to simulate the
commercial system as close as possible and evaluate compositions for their
ignitability using shock tube. The mixing procedures had to be standardised to prevent
difference in burn rate due to mixing. The compaction of the sample also had to be
standardised. The reagents would need to be characterised in terms of particle size or
surface area. Complementary techniques such as XRD, XRF, SEM etc. were also to
be used.
6.2 Equipment
6.2.1 Particle size and BET Measurements
A Flowsorb II 2300 supplied by Micrometrics Instrumentation for single point surface
areas was used in the determination of the surface area of the powders and was
completed by Serei Sefanyetso (s.a.).
A Saturn Digisizer 5200v1.03 was used for the particle size analysis and was
completed by Poretech.
6.2.2 Thermal Analysis
A Mettler Toledo TGA/SDTA 851e was used in conjunction STARe Software to do
the thermal analysis of various compounds and compositions.
6.2.3 X-Ray Diffraction and Fluorescence
A Siemens D-501 XRD was used with the collection parameters contained in Table 6-
2. XRF analysis was executed using a ARL9400XP+ spectrometer using the wide
confidence limit program.
UUnniivveerrssiittyy ooff PPrreettoorriiaa eettdd –– RRiiccccoo,, II ((22000055))
6.Equipment and Experimental Procedures Development
6-6
Table 6-2: XRD Data Collection Parameters
Radiation CuK α
Temperature 25°C
Specimen Flat-plate rotating (30RPM)
Power Setting 40kV, 40mA
Soller Slits 2° (diffracted beam side)
Divergence Slits 1°
Receiving Slits 0.05°
Monochromator Secondary, graphite
Detector Scintillation counter
Range of 2θ 4-70°
Step Width 0.04°2θ
Time per step 1.5 seconds
6.2.4 Scanning Electron Microscopy
A JEOL 840 scanning electron microscope was used unless otherwise stated.
6.2.5 Weighing of Compositions
A standard 3-digit laboratory mass balance (Precisa) was used.
6.2.6 Mixing
A box lined with polyurethane attached to rollers and a motor (Figure 6-1) (Tumbler)
was used for the end over end tumbling of the compositions.
UUnniivveerrssiittyy ooff PPrreettoorriiaa eettdd –– RRiiccccoo,, II ((22000055))

6.Equipment and Experimental Procedures Development
6-7
Figure 6-1: Equipment used for Tumble Mixing of Compositions (Tumbler)
6.2.7 Tube Loading and Composition Compaction
Compositions were loaded incrementally into lead tubes using a metal funnel.
Consolidation was achieved by intermediate tapping of the lead tube. The lead tubes
were obtained from AEL. The lead tubes had the following dimensions: ID-5mm and
OD-10mm. The tube roller with forward-reverse motor and motor control box (Figure
6-2) was supplied by AEL and was used to draw down the lead tubes and compact the
compositions.
Figure 6-2: Tube Roller and Motor Control Box
UUnniivveerrssiittyy ooff PPrreettoorriiaa eettdd –– RRiiccccoo,, II ((22000055))

6.Equipment and Experimental Procedures Development
6-8
6.2.8 Detonator Assembly
The drawn lead tubes were cut into elements using a standard copper tube or pipe
cutter. All other components used in the detonator assembly (Al tubes, antistatic cup
etc.) were supplied by AEL. The detonators were crimped using a pneumatic crimper
operated with N2 gas for safety (Figure 6-3).
Figure 6-3: Crimper
6.2.9 Ignition
As mentioned previously, shock tube was used to initiate the compositions. The shock
tube was initiated using a “mouse trap” (Figure 6-4) which allows for two probes to
pierce the shock tube. An electric spark is generated between the probes initiating the
reaction of the composition lining the shock tube. The reaction wave passes down the
shock tube into the detonator at a speed of about 2000m/s and breaks the antistatic
cup, initiating the pyrotechnic composition. The open end of the shock tube was
inserted into a silencer consisting of a sealed plastic container filled with kitchen steel
wool.
UUnniivveerrssiittyy ooff PPrreettoorriiaa eettdd –– RRiiccccoo,, II ((22000055))

6.Equipment and Experimental Procedures Development
6-9
Figure 6-4: “Mouse Trap” and Silencer
6.2.10 Temperature Sensing Devices
Thermocouples were the chosen as temperature sensing device above resistance
thermometers as the temperature at a point in the sample was to be monitored and not
over the entire length of the sensor.
Type R (Pt/Pt 13% Rh) thermocouples were chosen due to their resistance to extreme
oxidising conditions and high melting point. These thermocouples are suitable for
temperature measurements up to 1600°C. They do have the disadvantages of a low
sensitivity and high cost.
Thin wire thermocouples (0.38mm in diameter) were obtained from WIKA
Instrumentation as it was necessary to obtain very rapid response times due to the low
thermal inertia of the thin wires. An experiment to gauge the response time of the
thermocouples was conducted. A thermally insulted beaker of silicone oil was heated
to 196°C and the temperature was kept constant. The data acquisition was initiated
(1000Hz) and then a bare thermocouple was plunged into hot oil until the signal
stabilised. The data was filtered. The response time of the thermocouple was noted.
UUnniivveerrssiittyy ooff PPrreettoorriiaa eettdd –– RRiiccccoo,, II ((22000055))

6.Equipment and Experimental Procedures Development
6-10
Figure 6-5 shows the thermocouple response. The response time of the thermocouple
was just over 5ms.
0.00
0.20
0.40
0.60
0.80
1.00
1.20
1.40
1.60
0.000 0.005 0.010 0.015 0.020
Time (s)
mV
Figure 6-5: Response Time for Bare Wire Type R Thermocouple during heated Silicone Oil Experiment
Spot welding was used for the joining of the thermocouple wires due to its ease. This
method has been criticised by Beck (1984) as it does not produce as strong a junction
as a gas flame and also possibly introduces a thin oxide layer between the wires in the
junction. Pico Technology (2001) however, recommend that welding be used as it
ensures that the junction is not limited to the melting point of the solder. It is
recommended for future work that the possible inclusion of the oxide layer during
spot welding be investigated.
The signals were not corrected for cold junctions (CJC). Typically CJC is sensed by a
precision thermistor in good thermal contact with the input connectors of the
measuring instrument. The second thermocouple reading, along with the reading from
the thermocouple itself is used by the measuring instrument to calculate the true
temperature at the thermocouple tip. For less critical temperature measurements, Pico
Technology (2001) recommend that CJC be performed by a semiconductor
temperature sensor. The combination of this signal and the thermocouple signal will
result the correct reading without having to record and store two temperatures (Pico
UUnniivveerrssiittyy ooff PPrreettoorriiaa eettdd –– RRiiccccoo,, II ((22000055))

6.Equipment and Experimental Procedures Development
6-11
Technology, 2001). It is recommended that the current set up be modified to include
CJC either via having a reference junction at 0°C before feeding the signal to the
computer or preferentially installing equipment that models CJC electronically, i.e. a
semiconductor temperature sensor. It would be necessary to minimise the number of
junctions to reduce noise.
Due to the lack of cold junction compensation the voltage profiles cannot be
converted reliably to absolute temperature profiles. It is recommended that once cold
junction compensation has been added to the set up, the graph and correlation in
Figure 6-6 be used for the conversion. The data points were taken from the CRC
Handbook for Chemistry and Physics (1992:15-1) and a correlation and trend fitted to
the data. It should be noted that a second order polynomial is used as it results in a
better fit to the data than a linear regression. Linear regressions should be used for all
thermocouple types excluding those based on Pt/Rh due to the sluggish voltage
response at low temperatures. Pico Technology (2001) on the other hand have stated
that the relationship between temperature and voltage is a complex polynomial (5th to
9th order). It is therefore recommended that the accuracy of the conversion expression
be validated using compounds that undergo visible transitions at known temperatures,
i.e. boiling of water, melting point of gold etc or to just use the tables directly.
y = -1.532x2 + 113.05x
R2 = 0.9977
0
200
400
600
8001000
1200
1400
1600
1800
0 10 20 30
mV
Temperature (°C)
Pt/13%Rh Poly. (Pt/13%Rh)
Figure 6-6: Type R Thermocouple Calibration Curve (Data taken from CRC Handbook of Chemistry
and Physics, 1992:15-1)
UUnniivveerrssiittyy ooff PPrreettoorriiaa eettdd –– RRiiccccoo,, II ((22000055))

6.Equipment and Experimental Procedures Development
6-12
Once temperature conversion has been completed it is recommended that the method
proposed by Boddington et al (1982, 1986) for the extraction of kinetic data and burn
velocities (Leeds Model – Appendix A) be implemented to determine this data about
the compositions. However it should be noted that Boddington et al (1982) found that
the experimental burn velocities were generally higher than those that were extracted
from the temperature profiles. Another discrepancy arises in the maximum burning
temperature. They attributed this to the finite size of the thermocouples and have
proposed various methods to correct for these problems. It is therefore recommended
for future work that the effect of thermocouple size be investigated and corrected for
using the methods prescribed by Boddington et al (1982 and 1986). This phenomenon
was also observed by Beck (1984) who also applied the correction.
The possibility of using pyrometry should be investigated for reactions where the
temperature exceeds 1700°C, bearing in mind that Laye (1997) has mentioned the
problems encountered with spatial convolution of the pyrometer signal and
Rugunanan (1991) has mentioned that there are problems associated with changes in
the emittance of the sample during combustion and interference from product
vapours.
The thermocouples were insulated with thin glass sleeves and the thermocouples held
in place by taping them to polystyrene (Figure 6-7).
UUnniivveerrssiittyy ooff PPrreettoorriiaa eettdd –– RRiiccccoo,, II ((22000055))

6.Equipment and Experimental Procedures Development
6-13
Figure 6-7: Thermocouples and Electronic Interface
6.2.11 Electronic Interface
The electronic interface between the thermocouples and computer was designed and
soldered by Dr S. van der Walt and shown in Figure 6-8. The connections were
earthed and the thermocouples could be easily interchanged for other thermocouples.
An amplifier was added to the first differential channel, but was found to be
unnecessary as the data acquisition card had onboard gains of 10, 100 and 1000.
6.2.12 Data Acquisition
An Eagle PC30F (330KHz) card was the chosen data acquisition card for the Intel
PIII 650MHz computer (Figure 6-8). The card has 16A/D single ended (8 differential)
inputs and 4D/A outputs. Software was developed by Dr S. van der Walt using
Delphi. The software allowed for manipulating the sampling frequency, total length of
data acquisition time, mode of triggering (manual or electronically), the number of
channels being used, and the calibration of the thermocouples should they be changed.
UUnniivveerrssiittyy ooff PPrreettoorriiaa eettdd –– RRiiccccoo,, II ((22000055))

6.Equipment and Experimental Procedures Development
6-14
The program also included a data filter which simulates a low-pass filter circuit using
a Gaussian filter routine, graphing routines and the ability to extract data to Excel for
further manipulation.
Figure 6-8: Data Acquisition Computer
6.3 Experimental Procedures
6.3.1 Weighing and Tumble Mixing of Compositions
All compositions were carefully weighed into large polytops noting the relevant
masses. The polytops were then sealed with a lid and then further sealed with
laboratory sealing film (parafilm). The polytops were placed within the cavities cut
into the polyurethane contained in the tumbler. The tumbler was sealed and the motor
switched on. The compositions were tumble mixed for 4 hours unless otherwise
stated.
UUnniivveerrssiittyy ooff PPrreettoorriiaa eettdd –– RRiiccccoo,, II ((22000055))
6.Equipment and Experimental Procedures Development
6-15
6.3.2 Brush Mixing
After tumbling some of the compositions were brush mixed through an earthed dry
sieve. This was done in order to break up the agglomerates and improve mixing.
6.3.3 Visual Interpretation of Burn Characteristics
The propagation and burning characteristics of the mixtures were evaluated using the
following “screening” procedure. A rectangular piece of paper was folded along its
length and placed on a fire resistant tile. The tile was then placed in the fume
cupboard. A small amount (less than 1 g) of the mixture being tested was placed along
the fold of the paper from the middle of the paper until the end (Figure 6-9). The
paper was lit on the corner of the paper furthest from the mixture and left to burn.
Figure 6-9: Schematic Diagram of Visual Evaluation of the Burn Characteristics of Compositions
The burnt residue was then disposed of in water.
6.3.4 Initial Tube Loading
Initially it was thought to be unsafe to drill into the compositions directly, so a die
was designed for a laboratory press to compact the powder into a copper tube (ID
4.35mm) which was already in the aluminium tube (OD 7.5mm). The die is shown in
Figure 6-10. The copper tube was placed in the aluminium tube and small holes were
Tile Folded
Paper Match to light
corner furthest
from the mixture
UUnniivveerrssiittyy ooff PPrreettoorriiaa eettdd –– RRiiccccoo,, II ((22000055))

6.Equipment and Experimental Procedures Development
6-16
drilled into the tube to allow for insertion of the thermocouples. The tubes were
placed in the centre hole of the die and a thin layer of the powdered composition
poured into the aluminium tube. The powder was then compacted and the process
repeated till the first thermocouple opening was reached. The thermocouple was
inserted and covered with powder and once again the powder carefully compacted.
The process was repeated until the copper tube was filled. The reason for the
incremental compaction of the powder is due to the hydrostatic nature of powder i.e.
when a powder is pressed, compaction occurs by particle rearrangement by sliding
and by deformation and or fracture. Initially the forces resisting compaction are those
holding the agglomerates together augmented by friction between the particles and the
die wall. As the pressure increases, the compaction force overcomes the force acting
at interparticle contacts (Veale, 1972:139).
Figure 6-10: Simplified Diagram of Die for the Laboratory Press
However it was found that this method did not work in practice for the following
reasons:
� The laboratory press’ pressure range was incorrect for the application. A smaller
punch would have been more practical.
UUnniivveerrssiittyy ooff PPrreettoorriiaa eettdd –– RRiiccccoo,, II ((22000055))

6.Equipment and Experimental Procedures Development
6-17
� The aluminium tubes would bend and stick in the die making removal without
damage difficult.
� The thermocouples kept falling out during the powder compaction and the powder
would pour out of the openings.
� The powder would break through the bottom of the aluminium tubes.
� The safety of the process was questioned – the powder was loaded and any
powder along the sides of the copper tube would undergo huge amounts of friction
as the die was lowered (friction and impact ignite the compositions).
� The process was difficult to control for reproducibility.
For these reasons it was decided that it would be better to drill into the aluminium
tubes after the detonators were already assembled.
6.3.5 Lead Tube Rolling
The lead tube was crimped shut at one end using a pair of pliers making sure that the
end still passed through the first opening in the tube roller. The lead tube was then
clamped and a funnel inserted into the open end. The tube was tapped during the
incremental filling of the tube with the composition to aid with settling of the powder
and help overcome some of the wall friction. Once full, the open end of the lead tube
was carefully crimped shut.
The lead tube was then fed through the tube roller. The roller consisted of a number of
openings. Each opening corresponded to a different diameter and these decreased in
size sequentially. The lead tubes were fed twice to each opening (turning 90° before
the second pass) in the prescribed order and drawn down, thereby compacting the
powder contained within the tube. It was found that the tube roller left lead trimmings
along the sides. These were carefully cut off using a Stanley knife before feeding to
the next opening. Figure 6-11 shows the effect of drawing down a lead tube.
UUnniivveerrssiittyy ooff PPrreettoorriiaa eettdd –– RRiiccccoo,, II ((22000055))
6.Equipment and Experimental Procedures Development
6-18
Figure 6-11: Effect of Feeding a Lead Tube through the Tube Roller
The effect of compaction and initial mixture density was not investigated during this
investigation due to the nature of the preparation of the delay elements i.e. difficulty
to control amount of compaction with tube roller. It is recommended that the effect of
compaction be investigated by varying the consolidation pressure, noting the initial
density and measuring the burn rate. It would be beneficial to measure the density of
the product in order to determine the effect of absorbed gas impurities as a function of
initial densities (Section 4.1 vii) and compare these results to compositions based on
reactants which have been preheated to remove the absorbed gases.
6.3.6 Detonator Assembly
The 45mm elements were cut from the lead tubes using a pipe cutter. The core
diameter of each element was noted. As mentioned previously the core diameter has
an effect on the burn speed (Section 4.1 ix). The element was pushed gently to the
bottom of the lead tube, followed by the antistatic cup. The antistatic cup prevents
friction and the development of static between the end of the shock tube and the
composition so as to prevent premature initiation of the composition during handling.
Also, it was necessary to include the antistatic cup so as to keep as close to the
UUnniivveerrssiittyy ooff PPrreettoorriiaa eettdd –– RRiiccccoo,, II ((22000055))

6.Equipment and Experimental Procedures Development
6-19
commercial system as possible. A hollow cylindrical rubber spacer was fed next,
through which the shock tube had been fed. Figure 6-12 depicts the actual sequence of
components which are included into a detonator.
Figure 6-12: Detonator Assembly – Component Sequence
The detonators were then carefully crimped to stabilise the position of the components
in the detonator and to seal the detonator. In industry the detonators are crimped
twice, but in the laboratory the final crimp was omitted as it was found that due to the
fact that a gas cylinder was used, the crimping pressure of the final crimp could not be
properly controlled. This led to a number of shock tube failures i.e. the shock tube
bursts just before the final crimp and the wave fails to travel any further. A completed
detonator assembly is shown in Figure 6-13.
UUnniivveerrssiittyy ooff PPrreettoorriiaa eettdd –– RRiiccccoo,, II ((22000055))

6.Equipment and Experimental Procedures Development
6-20
Figure 6-13: Completed Detonator Assembly
6.3.7 Preparation of Detonators for Combustion
The sealed detonator assemblies were then marked for drilling. A thin sharp
implement was used with a die to ensure that the detonators were always drilled at the
same place and the holes were the same distance apart. The detonator was clamped
and a manual hand drill was used to slowly drill in the holes in the prescribed marks.
The drilling was done slowly so as to minimise the build up of heat and friction and to
control the depth of the hole. The hole was drilled until the composition was reached.
A shortcoming of using this manual method is that it produces some error in the hole
size and positioning, hence the reason why all burn rates are only reported to the
closest mm/s despite the accuracy and dynamics of the other equipment.
As shown in Figure 6-8 the detonator assembly was clamped and the thermocouples
inserted into the openings and secured. The placement of the thermocouples is
important. Surface or contact applications are inaccurate due temperature influences
from the surroundings. Beck (1984) found that by placing the thermocouple junction
near the side of the sample channel instead of in the centre lowered the maximum
temperature by 50°C. The thermocouples were consistently placed at the side of the
UUnniivveerrssiittyy ooff PPrreettoorriiaa eettdd –– RRiiccccoo,, II ((22000055))

6.Equipment and Experimental Procedures Development
6-21
detonator to allow for reproducibility of the temperature profiles, but in future when
the temperature profiles are used to determine the kinetic parameters, this effect
should be borne in mind. The shock tube was placed in the “mouse trap” and the free
end fed into the silencer. The safety screen was also placed in position.
6.3.8 Measurement of Temperature Profiles
The sampling frequency was set at 580Hz for all the measurements with a gain of
1000. It was decided not to have the data acquisition triggered automatically once a
threshold temperature had been achieved as Rugunanan and Brown (1994a) found
that the triggering level and lack of a meaningful zero value led to the non-
reproducibility of temperature profiles. The software was triggered manually and once
data acquisition started, the “mouse trap’s” electric pulse was initiated manually. The
wave travelled down the shock tube and into the detonator assembly to break the
membrane of the antistatic cup and initiate the composition. The propagation
characteristics of the wave as seen by the wave travelling from thermocouple opening
to thermocouple opening was noted. In general the data acquisition period was fixed
at 40s, after which the data was saved as a text file for import to Excel for further
manipulation. Figure 6-14 contains examples of detonator assemblies that ignited and
burned. The thermocouples were visually checked for damage or adherence of
combustion products or molten lead. If there was lead or material presence the tips
were cut and rejoined.
Figure 6-14: Examples of Detonator Assemblies that Ignited and Burned
UUnniivveerrssiittyy ooff PPrreettoorriiaa eettdd –– RRiiccccoo,, II ((22000055))

6.Equipment and Experimental Procedures Development
6-22
It should be noted that Charsley et al (1978) found considerable variation in their
temperature profiles which they attributed in part, to the uneven nature of the flame
front and variations in the microscopic environment of the thermocouple junction. A
further avenue of investigation is the derivation of the power function from the
temperature profile (Charsley et al, 1978). Rugunanan and Brown (1994a,
Rugunanan, 1991) noted that the following variables cause the irreproducibility of
temperature profiles:
� Inconsistent mixing and packing of the sample
� Variation in the size and placement of the thermocouple junction and
� The triggering level and lack of a meaningful zero value (triggered when
temperature exceeded 70°C).
Initially it was thought to embed a thin wire between the antistatic cup and the delay
element. As the shock wave passes from the shock tube to the composition, the wire
would be destroyed and be used to trigger the data acquisition. This option was ruled
out due to the difficulty of embedding the wire in the detonator and connecting it
simultaneously to the electronic interface as well the unknown effect of releasing
pressure before wave ignites the composition, i.e. the shock tube may not be able to
initiate the composition due to the punctured hole ahead of the composition.
Furthermore, the wire would need to be replaced after every experiment and will
increase cost and time between tests.
A short coming of this measuring method used in this investigation is the puncturing
of the detonator assembly. Puncturing of the detonator assembly has three possible
effects: It affects the pressure, the temperature attained and the actual burn rate which
is observed. This can be seen from the literature. Nosgrove et al (1991) have stated
that a delay detonator puncture significantly changes the burn rate (up to 40%). In the
event of a gassing system, the direction of the gas flow has an effect. The local flame
speed also varies as it passes down the delay element. Gassing also influences the
flame temperature (Nosgrove et al, 1991). Pressure also has an effect on the burning
rate (McLain, 1980:58). In Figure 6-14 there is evidence that some material has
flowed out of the first hole as a result of gassing. It may perhaps by necessary to
modify the setup using Perspex tubes and use photocells or a high speed camera to
determine the burn rate. Alternatively the procedure used for the data acquisition
UUnniivveerrssiittyy ooff PPrreettoorriiaa eettdd –– RRiiccccoo,, II ((22000055))

6.Equipment and Experimental Procedures Development
6-23
could be triggered by an electric input from the “mouse trap”. This will only require
puncturing the detonator once for the insertion of the thermocouple (i.e. effect is not
felt until wave passes the hole at the downstream end).
6.3.9 Disposal of Detonators
After burning, the detonators were allowed to cool down. The shock tube was cut off.
Both the shock tube and the detonator were returned to AEL for disposal. As
mentioned previously the combustion products were not analysed during this
investigation. It is thus recommended that XRF, XRD, IR and SEM be considered to
analyse the combustion products in future.
6.3.10 Numerical Processing of the Data
The measured signal was very noisy because of:
� Mechanical movement of the thermocouple during combustion.
� Interference from the electrical wiring and heavy electrical equipment in the area.
� Turbulence in the molten and gaseous products.
It is recommended that for future work, the occurrence of noise be minimised by
shielding the cables.
The “noisy” data was imported into Excel where a template had been drawn up to
immediately filter and graph the data. A first order digital filter i.e.
nnn axyay +−= −1)1( was applied to the data (Stephanopolous, 1984:611). The effect
of varying the filtration parameter (a) on a 25% Type 3 Si – PbCrO4 composition is
illustrated in Appendix B. The value of a affects the maximum voltage attained, but
has very little effect on shifting the graphs along the time axis. It was therefore
decided that the value of the filtration parameter (a) be fixed at 0.01. The effect of
varying a should be borne in mind when extracting kinetic data from the temperature
profiles. It would perhaps be necessary in future to investigate different methods of
data smoothing. Another reason is that the smoothness of the temperature profile is
critical for the subsequent kinetic and thermochemical analysis of the temperature
UUnniivveerrssiittyy ooff PPrreettoorriiaa eettdd –– RRiiccccoo,, II ((22000055))

6.Equipment and Experimental Procedures Development
6-24
profiles. Boddington et al (1982) have proposed the use of a convolution process
based on a least mean squares fit of 25 consecutive points to a second order
polynomial. Drennan and Brown (1992b) used a 12-point cubic spline program.
The burn rate was then determined from the temperature profiles as follows:
� The time when the voltage reached 1mV for the first thermocouple was noted.
� The time when the voltage reached 1mV for the second thermocouple was noted.
� The difference between the two times was taken as the time it took for the wave to
travel between the first and second thermocouple.
� The distance between the two thermocouples was measured (centre to centre) and
� Thus the burn rate equals the distance over time.
Using the correlation proposed in Section 6.2.10, a voltage of 1mV corresponds to
temperature of 115°C. However when comparing the 1.2mV obtained during the
heating of the silicone oil to 196°C, it can be seen that the correlation does not yield
196°C, but yields a value of 138°C. This discrepancy may be attributed to the lack of
CJC. As mentioned in Section 6.2.10, calibration of the thermocouples are to be
conducted using salts with known transition temperatures.
6.3.11 General Safety Precautions
The weighing, brush mixing, burn rate measurements etc. of the compositions were
completed behind a thick (8mm) polycarbonate screen. The weighing of the
compositions and brush mixing was always done on top of an earthed copper sheet.
Personal protective equipment such as leather gloves, lab coats were always worn. Ear
muffs were worn during shock tube initiation should a failure have occurred.
UUnniivveerrssiittyy ooff PPrreettoorriiaa eettdd –– RRiiccccoo,, II ((22000055))

6.Equipment and Experimental Procedures Development
6-25
6.3.12 Recommended Further Investigations and Complementary Experimental
Techniques
The feasibility (availability, safety, cost and time) of augmenting the above
procedures and equipment with the procedures and equipment which follow for the
investigation of the combustion wave should be investigated:
� The use of time-resolved XRD to monitor when components melt and new
crystals are formed. This method has been used successfully by researchers of
SHS reactions to identify the composition of chemical phases that appear at a
particular moment during the reaction (Varma, 2000).
� The use of quenched samples and SEM to analyse the microstructure. This
method has been used to study the way solid rocket fuel burns. A burning sample
is dropped into a pool of liquid Ar thereby freezing the reaction before all the
starting components have reacted. The quenched sample is then sliced into thin
layers and the microstructure analysed using SEM (Varma, 2000).
� The use of a high speed digital video camera that peers through a microscope to
observe the microscopic conditions along the combustion front. Varma (2000)
have used this technique to great success in evaluating combustion synthesis
reactions. This would entail encasing the pyrotechnic material in glass tubes. An
added bonus of this set up is that the velocity of the wave can also be determined
as the camera has a known shutter speed and the distance the wave has travelled
between photographs is known.
� The use of the apparatus designed by AEL to measure pressure during
combustion.
� The use of a probe technique (described by Beck, 1984 and Rugunanan, 1991) or
hot wire and laser flash heating techniques (Laye, 1997) to measure the thermal
conductivity of the mixtures. It should be borne in mind that Laye (1997) has
stated that the hot wire and laser flash heating techniques have not rendered
satisfactory results.
UUnniivveerrssiittyy ooff PPrreettoorriiaa eettdd –– RRiiccccoo,, II ((22000055))

6.Equipment and Experimental Procedures Development
6-26
6.4 Reagent Properties
6.4.1 Silicon
The properties and supplier of the types of Si which were used have been summarised
in Table 6-3.
Table 6-3: Silicon Properties and Supplier
Silicon Type Supplier Properties
Type 1 AEL 0.73m2/g, 28.11µm (standard deviation= 0.39)
Type 2 AEL 2.44m2/g 12.7µm (standard deviation = 0.15)
Type 3 (12hr
import)
AEL 6.39m2/g 3.53µm (standard deviation = 0.03)
Type 4 (40hr
import)
AEL 8.33m2/g 1.84µm (standard deviation = 0.06)
Type 5 (Dust) AEL 3.63m2/g, 9.43µm (standard deviation = 0.22)
6.4.2 Oxidants
Table 6-4 contains a summary of the properties and supplier or methods of
preparation of the oxidants which were used.
Table 6-4: Oxidant Properties and Supplier or Method of Preparation
Oxidant Supplier or Method of
Preparation
Properties
BaSO4 Metallgesellschaft (Pty)
Ltd but obtained via AEL
Non-toxic (lethal dose 15g/kg body
mass). 99% BaSO4. Retained on 63µm
sieve. pH within 8.5-9.5 in aqueous
slurry. 0.8-1.3m2/g. Tapped volume
within 55-65ml/100g (AEL Raw
Material Specification, 1994). 0.85m2/g
Pb3O4 AEL 0.89m2/g
Fe2O3 Bayer Spherical, 0.09µm particles, pH within
5-8 in aqueous slurry. 0.002% sieve
residue for 0.045mm mesh (Bayer’s
Paint Shade Card Brochure, s.a.).
0.70m2/g
UUnniivveerrssiittyy ooff PPrreettoorriiaa eettdd –– RRiiccccoo,, II ((22000055))

6.Equipment and Experimental Procedures Development
6-27
Oxidant Supplier or Method of
Preparation
Properties
MnO2 Delta EMD 90% is below 70µm. 30.2m2/g. pH in
aqueous slurry – 7.2 (Delta EMD
General Certificate, 2000). 15.60m2/g
PbCrO4 Rolfes Pigments Middle Chrome L-GXD. 16.70m2/g
V2O5 Rhombus Vanadium Mine 2.4m2/g
Fe3O4 Bayer 0.85m2/g
Cu(SbO2)2 Precipitated (Sefanyetso,
s.a.)
A detailed description of the analysis of
this compound follows this Table.
CuO.Fe2O3 Precipitated (Sefanyetso,
s.a.)
CuO.MnO2 Precipitated (Sefanyetso,
s.a.)
CuO.V2O5 Precipitated (Sefanyetso,
s.a.)
Sb2O3 Antimonox Red Star
Associated Additives
3.3m2/g
Cu2O Merck
CuO (1) Merck
CuO (2) Precipitated from
analytical grade
CuSO4.5H2O and NaOH
CuO (3) Foaming Technique
(Labuschagne, s.a.)
(BiO)2CO3 Merck
ZnO Merck
Nanocat
Iron Oxide
Mach I
Amorphous. 250m2/g, 0.05g/ml bulk
density and 3nm (Mach I Product
Bulletin, 1995)
UUnniivveerrssiittyy ooff PPrreettoorriiaa eettdd –– RRiiccccoo,, II ((22000055))

6.Equipment and Experimental Procedures Development
6-28
Cu(SbO2)2 Characterisation (Ricco et al, 2002)
As a result of its use in further experimentation and the nature of its preparation,
Cu(SbO2)2 was characterised in detail. The X-Ray Diffraction (XRD) patterns
obtained for this oxidant as well as Sb2O3 is shown in Figure 6-15. Strangely, the
XRD pattern does not correspond to any compound which can be found in the Powder
Diffraction File (2000) (PDF 1-50 + 70-88) which is available from the International
Centre for Diffraction Data – Newton Square, P.A. despite the compound being
known.
A N T IM O N Y O X ID E
0 5 -0 5 3 4 ( I) - S e n a rm o n ti t e , s yn - S b 2 O 3 - Y : 1 0 0 .0 0 % - d x b y : 1 . - W L : 1 . 5 4 0 6 - C u b ic -
A N T IM O N Y O X ID E - F i le : S E R E I0 1 -1 4 .r a w - T y p e : 2 T h / T h lo c k e d - S ta r t : 3 .0 0 0 ° - E n d : 7 0 .0 0 0 ° - S t e p : 0 . 0 4 0 ° - S te p t i m e : 1 . 5 s - T e m p . : 2 5 ° C (R o o m ) - T i m e S ta r t e d : 0 s - 2 -T h e ta : 3 .0 0 0 ° - T h e t a : 1 . 5 0
Lin (Counts)
0
1 0 0
2 0 0
3 0 0
4 0 0
5 0 0
6 0 0
7 0 0
8 0 0
9 0 0
1 0 0 0
1 1 0 0
1 2 0 0
1 3 0 0
1 4 0 0
2 - T h e t a - S c a l e
3 1 0 2 0 3 0 4 0 5 0 6 0 7 0
Counts
0
100
200
300
400
500
600
700
800
900
1000
1100
1200
1300
1400
1500
1600
1700
1800
1900
2000
2100
2200
2300
2400
2500
2600
Degrees 2 - Theta (C uK-a lpha)
3 10 20 30 40 50 60 70
Figure 6-15: XRD Patterns for Sb2O3 and Cu(SbO2)2 respectively
UUnniivveerrssiittyy ooff PPrreettoorriiaa eettdd –– RRiiccccoo,, II ((22000055))

6.Equipment and Experimental Procedures Development
6-29
X-Ray Fluorescence (XRF) analysis of the compound and Sb2O3 was done by
pressing large amounts of the powder in a powder briquette. The results are
summarised in Table 6-5. Two samples of the powder were produced to confirm
reproducibility of the samples.
Table 6-5: XRF Analysis of Cu(SbO2)2
% Sb2O3 CuO.Sb2O3 (1:1) CuO-Sb2O3 (1:1)
Sb2O3 97.7 77.7 76.1
CuO n/d 20.9 20.4
Furthermore, Figure 6-16 is the infrared (IR) scan which was obtained for this
compound, CuO and Sb2O3. As the spectra for all three are different, it indicates that
the compound was indeed formed and was not merely a mixture of Sb2O3 and CuO
which would have precipitated.
Figure 6-16: IR Scans of CuO, Sb2O3 and Cu(SbO2)2
A particle size analysis of the compound is still to be completed, but BET showed that
the compound had a surface area of 9m2/g.
Sb2O3
CuO.Sb2O3
CuO
UUnniivveerrssiittyy ooff PPrreettoorriiaa eettdd –– RRiiccccoo,, II ((22000055))

6.Equipment and Experimental Procedures Development
6-30
Scanning Electron Microscopy (SEM) (Figure 6-17) revealed agglomerated flat
particles.
Figure 6-17 SEM Photo of Cu(SbO2)2
Figure 6-18 shows the results of the TGA/SDTA analysis of the compound. The
compound shows exothermic peaks at 460°C and 541°C heated in an air atmosphere.
These peaks are not evident in the SDTA/TGA scans of CuO and Sb2O3 (endothermic
peaks at 990°C for CuO and 648°C and 950°C for Sb2O3). This once again indicates
that the compound is not purely a mixture of copper oxide and the antimony oxide.
M e t h o d : I A M P y r o R e a g e n t s , 7 0 u l a l u m i n a , a i r , 2 0
2 5 . 0 - 1 4 0 0 . 0 ° C 2 0 . 0 0 ° C / m i n A i r , 3 0 . 0 m l / m i n
S t e p - 6 5 . 9 7 4 9 %
- 1 0 . 0 5 1 9 m g
I A M P y r o C u O . S b 2 O 3 ( 1 : 1 ) l i d r e p . - I A M P y
I A M P y r o C u O . S b 2 O 3 ( 1 : 1 ) l i d r e p . , 1 5 . 2 3 6 0 m gm g
5
1 0
1 5
° C1 0 0 2 0 0 3 0 0 4 0 0 5 0 0 6 0 0 7 0 0 8 0 0 9 0 0 1 0 0 0 1 1 0 0 1 2 0 0 1 3 0 0
I n t e g r a l 4 2 . 6 0 s ° C
O n s e t 5 4 1 . 2 9 ° C
P e a k 5 5 0 . 2 1 ° C
L e f t b l L i m i t 5 4 0 . 1 4 ° C
R i g h t b l L i m i t 5 6 9 . 3 3 ° C
B a s e l i n e T y p e l i n e
I n t e g r a l 3 5 . 5 7 s ° C
O n s e t 4 5 9 . 4 9 ° C
P e a k 4 7 4 . 1 5 ° C
L e f t b l L i m i t 4 5 7 . 8 0 ° C
R i g h t b l L i m i t 4 9 6 . 3 8 ° CB a s e l i n e T y p e l i n e
° C
. 0
. 5
. 0
. 5
° C4 4 0 4 5 0 4 6 0 4 7 0 4 8 0 4 9 0 5 0 0 5 1 0 5 2 0 5 3 0 5 4 0 5 5 0 5 6 0 5 7 0 5 8 0 5 9 0 6 0 0
^ e x o
U n i v e r s i t y o f P r e t o r ia : C h e m is t r y S y s t e meRT AM E T T L E R T O L E D O S
Figure 6-18: TGA/DTA of Cu(SbO2)2
UUnniivveerrssiittyy ooff PPrreettoorriiaa eettdd –– RRiiccccoo,, II ((22000055))

6.Equipment and Experimental Procedures Development
6-31
6.4.3 Additives
Table 6-6 contains a summary of the suppliers and properties of the additives which
were used.
Table 6-6: Additive Properties and Suppliers
Additive Supplier Properties
Aluminium
Powder
Zimalco (Pty) Ltd Supramex 2000. Uncoated (natural oxide
coat present). 99.5% Al, 95% minimum
to pass 106µm sieve and 50% minimum
to pass 45µm sieve (Zimalco - Material
Safety Data Sheet, s.a)
Nanocat Iron
Oxide
Mach I Amorphous. 250m2/g, 0.05g/ml bulk
density and 3nm (Mach I Product
Bulletin, 1995)
Fumed Silica -
Aerosil 200
Degussa
Wacker Fumed
Silica – HDK20
Wacker-Chemie -
Chemimpo
Fumed Alumina Degussa
Fumed Titanium
Dioxide
Degussa
Ultrasil VN3 Degussa
Nanocat A Iron
Oxide
Mach I
All other reagents have been described in their relevant section.
UUnniivveerrssiittyy ooff PPrreettoorriiaa eettdd –– RRiiccccoo,, II ((22000055))
7.Alternative Oxidants
7-1
7. ALTERNATIVE OXIDANTS
7.1 Thermochemistry of Various Oxidants and Silicon
In order to determine which reactions may possibly occur with silicon as fuel, the heat
of reaction, adiabatic temperature and free energy for various proposed reactions were
calculated as follows:
� The reactions were assumed to be adiabatic and all calculations were based on
complete conversion.
� All relevant data was taken from
o JANAF Thermochemical Tables (1971)
o Liley, Reid and Buck (1984) Physical and Chemical Data in Perry’s
Chemical Engineers’ Handbook and
o Barin (1989) Thermochemical Properties of Inorganic Substances
� The heat of reaction at 298K based on the moles of silicon was calculated by
reagentsfproductsfR HHH ,, ∆−∆=∆ . Where ∆HR is the heat of reaction at 298K
(kJ/mol Si), ∆Hf,products is the heat of formation of the respective product (kJ/mol
Si) at 298K and ∆Hf,reagents is the heat of formation of the respective reagent
(kJ/mol Si) at 298K
� The adiabatic temperature of each reaction was calculated iteratively assuming
that all the available energy liberated by the reaction at 298K is available to raise
the temperature of the products which leave at the temperature of the reaction. The
phase changes are accounted for.
A sample calculation is presented in Appendix C.
The calculated heats of reaction, adiabatic temperature and free energy for all the
oxidants with silicon as fuel are given in Table 7-1.
UUnniivveerrssiittyy ooff PPrreettoorriiaa eettdd –– RRiiccccoo,, II ((22000055))
7.Alternative Oxidants
7-2
Table 7-1: Calculated Thermochemical Reaction Properties of Various Oxidants with Silicon as Fuel
System ∆∆∆∆HR 298K
(kJ/molSi)
Tadiabatic
(K)
∆∆∆∆G298K
(kJ/molSi)
Fuel:Oxidant
(Mass ratio)
V2O5 – Si System
2V2O5 + 3Si → 3SiO2 + 4VO(g) -446 2398 -443 0.23
V2O5 + Si → SiO2 + V2O3 -569 1910 -566 0.15
2V2O5 + Si → SiO2 + 2V2O4 -644 1762 -635 0.08
2V2O5 + 5Si → 5SiO2 + 4V -287 2166 -285 0.39
Sb2O3 – Si System
2Sb2O3 + 3Si → 3SiO2 + 4Sb(s) -431 3657 -434 0.14
2Sb2O3 + 3Si → 3SiO2 + 2Sb2(g) -277 1200 -297 0.14
2Sb2O3 + 3Si → 3SiO2 + 4Sb(g) -78 1114 -132 0.14
2Sb2O3 + Si → SiO2 + 2SbO(g) 323 - - 0.05
MnO2 – Si System
2MnO2 + Si → SiO2 + 2MnO -648 1350 -659 0.16
MnO2 + Si → Mn + SiO2 -394 1416 -385 0.32
Fe2O3 – Si System
2Fe2O3 + Si → SiO2 + 4FeO -332 1408 -386 0.09
2Fe2O3 + 3Si → 3SiO2 + 4Fe -357 1155 -358 0.26
Fe3O4 – Si System
Fe3O4 + 2Si → 2SiO2 + 3Fe -353 1139 -350 0.24
2Fe3O4 + Si → SiO2 + 6FeO -300 1046 -329 0.06
UUnniivveerrssiittyy ooff PPrreettoorriiaa eettdd –– RRiiccccoo,, II ((22000055))

7.Alternative Oxidants
7-3
The most thermodynamically favourable reactions have been highlighted in each
instance. These mass ratios were used in the preparation of compositions for
DTA/TGA analysis. These experiments and their results will be discussed by
Sefanyetso (s.a.).
It was decided to repeat the above calculations with tungsten as fuel instead of silicon
as AEL had expressed that perhaps in the future they would like to experiment with
replacing the silicon with tungsten. The results have been summarised in Table 7-2.
From Table 7-2 it can be deduced that tungsten is not as energetic as silicon as a fuel.
Tungsten has been used in the past. Charsley et al (1978) analysed the thermal
properties and temperature profiles of mixtures of tungsten and potassium dichromate.
Further work on this system was done by Boddington et al (1982 and 1986). In future
it would perhaps be necessary to evaluate alternative fuels. Alternative fuels could
include Zn, Fe, Mn, Mo. Tribelhorn, Venables and Brown (1995) have studied the use
of Zn-fuelled binary compositions with oxidants such as PbO2, Pb3O4, PbO, BaO2,
SrO2 and KMnO4, but have found it to be unsuitable for delay applications due to the
gassy nature of the reactions. Spice and Staveley (quoted by Drennan and Brown,
1992a) have studied Fe-fuelled binary compositions with oxidants such as BaO2 and
K2Cr2O7. Drennan and Brown (1992a) studied Mo/Mn-fuelled binary compositions
with oxidants such as BaO2 and SrO2.
Table 7-2: Calculated Thermochemical Reaction Properties of Various Oxidants with Tungsten as Fuel
System ∆∆∆∆HR 298
(kJ/molW)
Tadiabatic
(K)
∆∆∆∆G298
(kJ/molW)
Fuel:Oxidant
(Mass ratio)
V2O5 – W System
2V2O5 + 3W → 3WO2 + 4VO(g) -81 850 -76 1.52
V2O5 + W → WO2 + V2O3 -204 1089 -200 1.01
2V2O5 + W → WO2 + 2V2O4 -279 983 -268 0.51
2V2O5 + 5W → 5WO2 + 4V 78 - - 2.53
UUnniivveerrssiittyy ooff PPrreettoorriiaa eettdd –– RRiiccccoo,, II ((22000055))

7.Alternative Oxidants
7-4
System ∆∆∆∆HR 298
(kJ/molW)
Tadiabatic
(K)
∆∆∆∆G298
(kJ/molW)
Fuel:Oxidant
(Mass ratio)
Sb2O3 – W System
2Sb2O3 + 3W → 3WO2 + 4Sb(s) -66 878 -67 0.95
2Sb2O3 + 3W → 3WO2 + 2Sb2(g) 88 - - 0.95
2Sb2O3 + 3W → 3WO2 + 4Sb(g) 287 - - 0.95
2Sb2O3 + W → WO2 + 2SbO (g) 688 - - 0.32
MnO2 – W System
2MnO2 + W → WO2 + 2MnO -283 1613 -292 1.06
MnO2 + W → Mn + WO2 -29 447 -19 2.11
Fe2O3 – W System
2Fe2O3 + W → WO2 + 4FeO 34 - - 0.58
2Fe2O3 + 3W → 3WO2 + 4Fe 8 - - 1.73
Fe3O4 – W System
2Fe3O4 + W → WO2 + 6FeO 12 - - 0.40
Fe3O4 + 2W → 2WO2 + 3Fe 65 - - 1.59
7.2 Preliminary Experiments
7.2.1 Visual Evaluation of the Burn Characteristics of Various Oxidants
Experimental
The oxidants and mass ratios used in the preparation of the compositions are
summarised in Table 7-3. All the compositions were prepared using type 4 silicon.
UUnniivveerrssiittyy ooff PPrreettoorriiaa eettdd –– RRiiccccoo,, II ((22000055))
7.Alternative Oxidants
7-5
Table 7-3: Oxidants and Mass Fractions Silicon used for Visual Evaluation of Burn Characteristics
Oxidant Mass Fraction Si Oxidant Mass Fraction Si
Sb2O3 0.12 CuO (2) 0.16
PbCrO4 0.15 CuO (3) 0.16
Fe2O3 0.08 CuO.Fe2O3 0.20
Fe3O4 0.06 CuO.Sb2O3 0.14
MnO2 0.14 CuO.V2O5 0.25
V2O5 0.07 CuO.MnO2 0.21
Melamine 0.83 Bi2(CO3)3 0.07
Cu2O 0.09 ZnO 0.15
CuO (1) 0.16
All the compositions were accurately weighed and tumbled gently end over end for 2
minutes. The propagation and burning characteristics of the mixtures were visually
interpreted using the procedure outlined in Section 6.3.3.
Results and Discussion
The visual observations of the burn characteristics of the compositions are reported in
Table 7-4.
Table 7-4: Visual Observations of the Burn Characteristics of Various Oxidants and Type 4 Si
Mixture Burn Characteristics
Fe2O3 Very slow burning.
Fe3O4 Very slow burning with melting.
V2O5 Did not ignite.
PbCrO4 Burned very slow.
MnO2 Did not ignite.
Sb2O3 Burned fast.
CuO (1) Ignition required high heat. Slow burning. Combustion wave initially
propagates but then self-extinguishes. Cu particles formed after
burning.
UUnniivveerrssiittyy ooff PPrreettoorriiaa eettdd –– RRiiccccoo,, II ((22000055))

7.Alternative Oxidants
7-6
Mixture Burn Characteristics
CuO (2) Very quick burning. Combustion wave propagates but then self-
extinguishes. Cu particles formed after burning.
CuO (3) Easier ignition than CuO (2), but burning is not as quick as CuO
(2). Propagation of combustion wave is more stable than for CuO
(2). Cu particles formed after burning.
CuO.Fe2O3 Burned very slowly.
Cu(SbO2)2 Burned fast.
CuO.V2O5 Did not burn.
CuO.MnO2 Fast burning with stable self propagation of combustion wave.
Melamine Did not ignite.
Cu2O Ignited but self extinguished.
Bi2(CO3)3 Burned very slowly with yellow flame front. Produced a large amount
of gas.
ZnO Did not ignite.
It appeared from these experiments that the freshly prepared CuO may be a
replacement for the Pb-based systems. CuO.MnO2 appeared promising for the BaSO4-
based system especially due to its inherent self-propagating nature. This was however
subject to the results obtained from the burn rate tests.
Nature of the oxidant. The iron oxide-based systems burnt very slowly. That was
expected due to the nature of the oxidant as described by McLain(1980:40) and
Conkling (1996:681), i.e. high temperature transitions and melting point. The Sb2O3-
based system burned fast for the same reason – low transition temperature. The
surprising result was the slow burning of the PbCrO4 system as PbCrO4 has a low
transition temperature.
Hereditary Nature or Method of Preparation. The analytical grade CuO (1) from
Merck did not burn nearly as fast as the CuO (2) which was freshly prepared. It would
be necessary to analyse the crystal structure in order to determine if this is as a result
of the relative “looseness” of the crystal structures for the copper oxides or if other
variables are the dominant driving mechanism or are having a synergistic effect i.e.
UUnniivveerrssiittyy ooff PPrreettoorriiaa eettdd –– RRiiccccoo,, II ((22000055))

7.Alternative Oxidants
7-7
particle size differences, mechanical enhancement during processing or the addition
of particles through impurities which are present.
Addition of Particles or Impurities. It does not appear that the coprecipitated systems
showed enhanced reactivity. The CuO.MnO2 system appeared promising for use in
the delay elements due to the stable propagation of the combustion wave. The CuO
systems however did show different burn characteristics and the copper oxide
prepared using the foamed technique (CuO (3)) contained CaSO4 as contaminant as
can be seen from the needle shaped crystals in Figure 7-1 which can not be found in
Figure 7-2 which was precipitated. This result was confirmed by the XRD and XRF
analysis (Appendix D).
Figure 7-1: CuO prepared by Foamed Technique Figure 7-2: Precipitated CuO
It was decided that all the compositions which burnt (excluding PbCrO4, (BiO)2CO3
and Cu2O) be submitted to AEL for burn speed measurements.
7.2.2 Industrial Trials
Experimental
Compositions with the mass ratios reported in Table 7-5 were prepared without brush
mixing and loaded into lead tubes according to the procedures outlined in Sections
6.3.1 and 6.3.5 (tubes were not rolled). All the compositions were prepared using type
UUnniivveerrssiittyy ooff PPrreettoorriiaa eettdd –– RRiiccccoo,, II ((22000055))

7.Alternative Oxidants
7-8
4 Si as fuel. The tubes were drawn down at AEL and the delay elements cut (15mm).
The delay elements were assembled into conventional non-electric detonator
assemblies with or without starter and sealing elements and the burn time measured
using the quality control experimental set up used by AEL.
Table 7-5: Mass Fraction Silicon added for Compositions used in Industrial Trials
Oxidant Mass Fraction Si Oxidant Mass Fraction Si
CuO 0.16 Cu(SbO2)2 0.14
MnO2 0.14 V2O5 0.07
Fe2O3 0.08 CuO.Fe2O3 0.20
CuO. MnO2 0.21 Fe3O4 0.06
Sb2O3 0.12
Results and Discussion
The results of trials have been summarised in Table 7-6
Table 7-6: Results of Industrial Trials
Oxidant Detonator Assembly
Layout Attempted
Fired Core
Diameter
(mm)
Burn
Time
(ms)
CuO With starter and
sealing elements
0/3 1.6
MnO2 With starter and
sealing elements
10/10 2.2 1776
MnO2 With sealing element 10/10 2.2 1681
MnO2 Without sealing or
starter elements
0/1 2.2
Fe2O3 With sealing and
starter elements
0/3 1.7
UUnniivveerrssiittyy ooff PPrreettoorriiaa eettdd –– RRiiccccoo,, II ((22000055))

7.Alternative Oxidants
7-9
Oxidant Detonator Assembly
Layout Attempted
Fired Core
Diameter
(mm)
Burn
Time
(ms)
CuO.MnO2 With sealing and
starter elements
0/3 2.8
Sb2O3 With sealing and
starter elements
1/3 1.6
Cu(SbO2)2 With sealing and
starter elements
10/10 2.7 1257
Cu(SbO2)2 With sealing element
only
10/10 2.7 959
Cu(SbO2)2 Without sealing or
starter elements
0/3 2.7
V2O5 With sealing and
starter elements
0/3 2.7
CuO.Fe2O3 With sealing and
starter elements
0/3 2.8
Fe3O4 With sealing and
starter elements
0/3 2.1
From Table 7-6 it appears that the only compositions which ignited and burned in
detonator assemblies are Sb2O3, Cu(SbO2)2 and MnO2. CuO apparently does not burn
when compacted.
7.2.3 Measurement of Burn Rates – Initial Trials
Experimental
It was necessary to determine the following:
� The burn rate using the setup described in Sections 6.3.8 and 6.3.10
� Whether the use of a starter element is necessary and its effect on the burn rate.
UUnniivveerrssiittyy ooff PPrreettoorriiaa eettdd –– RRiiccccoo,, II ((22000055))
7.Alternative Oxidants
7-10
Additional elements were obtained from AEL and the burn rates measured. The
elements were incorporated into detonator assemblies according to Section 6.3.6 with
or without a starter element and prepared according to Section 6.3.7.
Results
Table 7-7 contains a summary of the compositions which burnt and their burn rates.
Detailed experimental results may be found in Appendix E.
Table 7-7: Compositions which Burned during Initial Trials and their respective Burn Rates
Oxidant With or without starter
element
Burn rate (mm/s)
Cu(SbO2)2 (first run) With starter element 9
Cu(SbO2)2 (second run) With starter element 25
Sb2O3 (first run) With starter element 3
Sb2O3 (second run) With starter element 2
Unlike the AEL trials, MnO2 did not burn. This may be as a result of aging of the
composition in the delay elements from the time when the AEL trials were run and
these runs (3 months). Further experiments using the fresh MnO2 were conducted and
reported in Section 9.1 to determine whether aging had an effect. Furthermore, all the
compositions failed to ignite when ignited using shock tubing directly.
There was a wide discrepancy in the burn rate of Cu(SbO2)2 between the first run and
the second run which could be as a result of the aging of the sample or the second run
was just a clear outlier. Further experimentation would need to be undertaken under
stricter time control to evaluate the extent to which aging affects the burn rate of
Cu(SbO2)2 - Si.
In light of these observations it was decided to continue experimentation with Sb2O3,
Cu(SbO2)2, MnO2 and CuO for AEL’s application needs.
UUnniivveerrssiittyy ooff PPrreettoorriiaa eettdd –– RRiiccccoo,, II ((22000055))

8.Modification of Burn rates
8-1
8. MODIFICATION OF BURN RATES
8.1 Varying Stoichiometry – Tumble Mixed Compositions
8.1.1 Experimental
Binary mixtures containing 5, 10, 15, 20, 25, 30, 35 and 40% Type 4 Si were prepared
for the following oxidants: Sb2O3;; Cu(SbO2)2; MnO2 and CuO. The detonators were
assembled and the burn rates were measured using the procedure outlined in Figure 8-
1.
Figure 8-1: Experimental Procedure for Determining the Effect of Varying Stoichiometry for Tumble
Mixed Compositions.
Oxidant Type 4 Si
Weighed into polytop, using safety procedures
outlined in Sections 6.3.1 and 6.3.11
Tumble mixed for 4 hours using
procedure outlined in Section 6.3.1
Loaded into lead tubes and detonators for
each composition assembled according to
procedure in Sections 6.3.5, 6.3.6 and 6.3.7
Measurement of burn speed using data
logger (Section 6.3.8) and data filtering
and processing (Section 6.3.10)
UUnniivveerrssiittyy ooff PPrreettoorriiaa eettdd –– RRiiccccoo,, II ((22000055))

8.Modification of Burn rates
8-2
8.1.2 Results and Discussion
As can be seen from Table 8-1 the only compositions that ignited and burned
contained Sb2O3 and Cu(SbO2)2 as oxidants. Despite the MnO2-based compositions
burning when ignited using a starter element (AEL trials) when they were fresh, they
were not directly ignitable using shock tubing despite being fresh. So it appears that
this composition cannot be ignited directly using shock tube. The CuO remained
unresponsive when compacted despite showing promising burn results during the
previous visual burn trials. Rugunanan (1991) found that Cu2O did not burn when
compacted. It was decided that for further trials only Cu(SbO2)2, Sb2O3 and PbCrO4
be considered. All the raw data is reported in Appendix F.
Table 8-1: Summary of Results of Varying Stoichiometry for Tumble Mixed Compositions
Oxidant Sb2O3 Cu(SbO2)2 MnO2 CuO
Mass % Fuel which ignited 25-35 20-40 No ignition No ignition
The results of the burn rate measurements of Sb2O3 have been summarised in Table 8-
2. There were a number of mixture and thermocouple failures so the burn rates
reported in Table 8-2 may not be truly representative of the burn rates.
Table 8-2: Effect of Varying Stoichiometry on the Burn Rate of Tumbled Sb2O3 – Type 4 Si
Fuel Mass % Burn rate (mm/s)
25% 9
40% 11
The results of the burn rate measurements of Cu(SbO2)2 is reported graphically in
Figure 8-2.
UUnniivveerrssiittyy ooff PPrreettoorriiaa eettdd –– RRiiccccoo,, II ((22000055))

8.Modification of Burn rates
8-3
0
2
4
6
8
10
12
20 25 30 35 40
Silicon Mass %
Burn Speed (mm/s)
Figure 8-2: Effect of Varying Stoichiometry on the Burn Rate of Tumbled Cu(SbO2)2 – Type 4 Si
Figure 8-2 shows that the highest measured burn rates occurred at 25 and 30% Si.
There is an indication of a local minimum at 35% Si.
As with the Sb2O3 experiments, there were a number of mixture and thermocouple
failures so the burn rates reported in the Figure 8-2 may not be truly representative of
the burn rates. Generally there were two burn rates for each mass percentile and the
mean was determined. The standard deviation for these measurements was below
1mm/s as reported in Appendix F.
Whilst looking at the lead tubes and the tumbled compositions it was observed that
proper mixing had not occurred as agglomerates of Cu(SbO2)2, Sb2O3 and Si were
visible. It was decided to redo these experiments but to brush mix the reagents before
loading into the lead tubes so as to break down the agglomerates and improve the
mixing of the constituents.
UUnniivveerrssiittyy ooff PPrreettoorriiaa eettdd –– RRiiccccoo,, II ((22000055))
8.Modification of Burn rates
8-4
8.2 Varying Stoichiometry – Tumble and Brush Mixed Compositions
8.2.1 Experimental
The mass percentage fuel (Type 4 Si) used for each composition is summarised in
Table 8-3. As can be seen from the Table, all the compositions which previously did
not ignite for the Sb2O3 and Cu(SbO2)2-based compositions were not repeated.
Table 8-3: Mass Percentage Type 4 Si used for Tumbled and Brushed Compositions
Oxidant Mass Percentage Si
Sb2O3 25; 30; 35
Cu(SbO2)2 20; 25; 30; 35; 40; 45; 50
PbCrO4 5; 10; 15; 20; 25; 30; 35; 40; 45; 50
The detonators were made and burn rates were measured using the procedure outlined
in Figure 8-3.
UUnniivveerrssiittyy ooff PPrreettoorriiaa eettdd –– RRiiccccoo,, II ((22000055))

8.Modification of Burn rates
8-5
Figure 8-3: Experimental Procedure for Determining the Effect of Varying Stoichiometry for Tumbled
and Brushed Compositions
8.2.2 Results and Discussion
Appendix G contains all the experimental data. All the results of the burn rate
measurements are reported graphically in Figures 8-4, 8-5 and 8-6.
Oxidant Type 4 Si
Weighed into polytop, using safety procedures
outlined in Sections 6.3.1 and 6.3.11
Tumble mixed for 4 hours using
procedure outlined in Section 6.3.1
Loaded into lead tubes and detonators for
each composition assembled according to
procedure in Sections 6.3.5, 6.3.6 and 6.3.7
Measurement of burn speed using data
logger (Section 6.3.8) and data filtering
and processing (Section 6.3.10)
Brush mixed using procedure
outlined in Section 6.3.2
UUnniivveerrssiittyy ooff PPrreettoorriiaa eettdd –– RRiiccccoo,, II ((22000055))
8.Modification of Burn rates
8-6
0
2
4
6
8
10
12
14
16
25 30 35
Silicon Mass %
Burn Speed (mm/s)
Figure 8-4: Effect of Varying Stoichiometry on the Burn Rate of Tumbled and Brushed Sb2O3-Type 4
Si
0
2
4
6
8
10
12
14
20 25 30 35 40 45
Silicon Mass %
Burn Speed (mm/s)
Figure 8-5: Effect of Varying Stoichiometry on the Burn Rate of Tumbled and Brushed Cu(SbO2)2-
Type 4 Si
UUnniivveerrssiittyy ooff PPrreettoorriiaa eettdd –– RRiiccccoo,, II ((22000055))
8.Modification of Burn rates
8-7
0
5
10
15
20
25
30
10 15 20 25 30 35 40 45 50
Silicon Mass %
Burn Speed (mm/s)
Figure 8-6: Effect of Varying Stoichiometry on the Burn Rate of Tumbled and Brushed PbCrO4-Type
4 Si
Ignition and Burning. Successful ignition and burning were observed for
compositions containing Sb2O3, PbCrO4, and Cu(SbO2)2 as oxidants (See Figures 8-4
to 8-6). The burn rates varied in the range 7 – 28 mm/s. Lead chromate burned fastest
and Sb2O3 slowest under comparable conditions.
Nature of Cu(SbO2)2 and PbCrO4 curves. Figure 8-5 shows that the highest measured
burn rate occurred at 30 and 40% Si with clear lower value at 35% for Cu(SbO2)2. A
similar trend can be found in Figure 9-6 – PbCrO4-Si. This suggests the existence of
two local maxima and a local minimum in burn rates (bimodal distribution). This
phenomenon is not expected for true solid-solid reactions, where one maximum is
expected at or near the stoichiometric ratio. However, this has been observed
previously by Al-Kazarji & Rees (1979b) (Section 5.2.1) who found a second peak
when using coarser grades of Si and which they attributed to the high pressure
generated in the tubes owing to the high temperature of the reaction. They also found
that for compositions less than 15%, the rate of reaction was dependent on the
pressures formed and the diffusion of the vaporised oxides to the reaction interface.
However where the Si content was in excess of 20%, solid-solid mechanisms prevail
UUnniivveerrssiittyy ooff PPrreettoorriiaa eettdd –– RRiiccccoo,, II ((22000055))

8.Modification of Burn rates
8-8
and the surface contact area were the controlling variables. Hedger (1983) also found
a minimum delay time between 30 and 40% Si for Pb3O4-Si systems and attributed it
to a change in propagation mechanism. It is felt that this is the case for the Cu(SbO2)2
and PbCrO4 based compositions. At low oxidant levels the heat transfer takes place by
mass transfer of the volatile reaction products, whilst at lower oxidant levels, heat
transfer occurs by conduction. As Si is a semi-conductor, more heat is conducted as
its ratio is increased, hence the second peak. This would need to be checked by
analysing the reaction products.
Comparison of Experimental Burn Rates and Those Reported in Literature. Table 8-4
contains a comparison of the measured burn rates and those reported by Rugunanan
(1991) for Si-fuelled compositions with Sb2O3 and PbCrO4 as oxidants.
Table 8-4: Comparison of Measured Burn Rates and Those Reported in Literature for Si-Fuelled
Compositions with Sb2O3 and PbCrO4 as Oxidants
Mass % Si Rugunanan (1991) (mm/s) Experimental (mm/s)
Sb2O3
25% Si 3.3 7
30% Si 6.3 11
35% Si 8.7 14
PbCrO4
20% Si 7.2 22
30% Si 13 23
Rugunanan (1991) reported that the composition range for Sb2O3 which ignited and
burned as 20-50% Si. This was not the case for these experiments (Figure 8-4) where
only the 20, 25 and 35% Si compositions ignited and burned. It is thought the reason
for this was the difference in the method of ignition. Rugunanan (1991) used a starter
increment of KMnO4 and Mn, whilst these compositions were directly ignited using
shock tube, a relative weak ignition source. As can be seen from Section 7.2.2, a 13%
Si composition ignited but it was initiated by incorporating a starter element. This
implies that the ignition of Sb2O3-based compositions is sensitive to the method of
UUnniivveerrssiittyy ooff PPrreettoorriiaa eettdd –– RRiiccccoo,, II ((22000055))

8.Modification of Burn rates
8-9
initiation. Figure 8-4 shows that the burn rate for this composition increased linearly
till 35% Si. This implies that the maximum burn rate (specified by Rugunanan, 1991
as being 43% Si) had not yet been achieved but due to the method of ignition could
not be determined under these conditions.
Overall the burn speeds measured experimentally were higher. This may in part be
due to particle size differences. Rugunanan (1991) reports using a Si with a particle
size <53µm whereas a 1.84µm (deviation 0.06) Si was used here. Furthermore, the
source of the Sb2O3 and PbCrO4 differs which may have affected the burn rate
(Section 4.1).
Ignition Reliability. Figure 8-7 depicts the ignition reliability (defined as the fraction
of successful ignitions) as a function of mass % Si for all three oxidants. It should be
noted that compositions that ignited successfully but did not propagate were still
considered as successful ignitions. As can be seen from the Figure, Sb2O3 showed
unreliable ignition, rendering it unsuitable for the application despite the lower burn
rates which were achieved. Commercial applications require a failure rate below or
equal to 1 in 5 000. The non-reliability of the compositions at the extreme
stoichiometries (e.g. 15% Si and 50% Si) is expected as the probability of finding a Si
particle next to oxidant particle is reduced. It would be beneficial to study these
extremes in detail.
0
0.2
0.4
0.6
0.8
1
5 10 15 20 25 30 35 40 45 50
Silicon Mass %
Fraction of Successful Ignitions
Sb2O3
Cu(SbO2)2
PbCrO4
Figure 8-7: Fraction of Successful Ignitions as a Function of Stoichiometry for Tumbled and Brushed
Type 4 Silicon-based Compositions for a Total of 5 Attempts
UUnniivveerrssiittyy ooff PPrreettoorriiaa eettdd –– RRiiccccoo,, II ((22000055))

8.Modification of Burn rates
8-10
Burn Rate Standard Deviation. The standard deviations reported in Appendix G show
excellent repeatability for Sb2O3 except at 35% Si where the burn rates varied
markedly (standard deviation of 4 mm/s). When comparing the temperature profiles
for the runs at 35% Si it was noted that the temperature profiles appear vastly
different as a result of lead melting onto the thermocouples during the third and fourth
runs. For Cu(SbO2)2, the standard deviation between runs for each compositions was
below 1mm/s. This was not the case for PbCrO4 where the standard deviation was
below 2mm/s.
8.3 Varying Fuel Particle Size
8.3.1 Experimental
The reagents and compositions used are given in Table 8-5. All the compositions
listed in Table 8-5 were tested with Si types 1, 2, 3 and 5. Other relevant information
e.g. particle size etc. is reported in Section 6.4.
Table 8-5: Reagents and Compositions used for Determining the Effect of Varying Si Particle Size
Oxidant Mass Percentage Si
Sb2O3 25; 30; 35
Cu(SbO2)2 20; 25; 30; 35; 40; 45
PbCrO4 15; 20; 25; 30; 35; 40; 45
The detonators were assembled and the burn rates were measured using the procedure
outlined in Figure 8-8.
UUnniivveerrssiittyy ooff PPrreettoorriiaa eettdd –– RRiiccccoo,, II ((22000055))

8.Modification of Burn rates
8-11
Figure 8-8: Experimental Procedure for Determining the Effect of Varying Stoichiometry and Si
Particle Size
8.3.2 Results and Discussion
The experimental data are reported in Appendix H.
Ignition and Burning. It should be noted from the data in the Appendix I that the
burning of Sb2O3-Si compositions is very dependent on the fuel particle size as
Oxidant Type 1, 2,
3 or 5 Si
Weighed into polytop, using safety procedures
outlined in Sections 6.3.1 and 6.3.11
Tumble mixed for 4 hours using
procedure outlined in Section 6.3.1
Loaded into lead tubes and detonators for each
composition assembled according to procedure in
Sections 6.3.5, 6.3.6 and 6.3.7
Measurement of burn speed using data
logger (Section 6.3.8) and data filtering
and processing (Section 6.3.10)
Brush mixed using procedure outlined
in Section 6.3.2
UUnniivveerrssiittyy ooff PPrreettoorriiaa eettdd –– RRiiccccoo,, II ((22000055))

8.Modification of Burn rates
8-12
neither type 1, 2, 3 nor 5 Si ignited. This is unfortunate because particle size can not
be used to modify burn rates to suit practical application. Rugunanan (1991) on the
other hand found that varying the Si particle size for a Sb2O3-40%Si composition still
resulted in compositions that ignited and that the burn rate increased with increasing
specific surface area. Once again it is thought that the difference arises from the
method of ignition.
It should be noted that although all the Si types were tried only type 3 and type 4 Si
resulted in compositions that ignited (using shock tube directly) with Cu(SbO2)2 and
PbCrO4 as oxidants. Interestingly the reactions for Cu(SbO2)2 and type 3 Si were less
violent and gassy than those for Cu(SbO2)2 and type 4 Si. All the results of the burn
rate measurements for the PbCrO4 and Cu(SbO2)2- based compositions are reported
graphically in Figures 8-9 and 8-10.
0
2
4
6
8
10
12
14
16
25 30 35 40 45
Silicon Mass %
Burn Speed (mm/s)
Figure 8-9: Effect of Varying Stoichiometry on the Burn Rate of Cu(SbO2)2-Type 3 Si
UUnniivveerrssiittyy ooff PPrreettoorriiaa eettdd –– RRiiccccoo,, II ((22000055))

8.Modification of Burn rates
8-13
0
5
10
15
20
25
20 25 30 35 40 45
Silicon Mass %
Burn Speed (mm/s)
Figure 8-10: Effect of Varying Stoichiometry on the Burn Rate of PbCrO4-Type 3 Si
Another point of interest for the PbCrO4-Si compositions which is not plotted
graphically is the ignition of one detonator for the 40% type 5 Si (5th run). No burn
rate could be determined as the burn front extinguished as it reached the second
thermocouple. This point is unusual as it was the only type 5 Si based composition
which ignited. Also interestingly a number of PbCrO4-based compositions (in
particular at a high Si content) ignited but failed to propagate beyond the first
thermocouple. This may be the result of localised areas of inferior interaction between
the PbCrO4 and Si. It was also noted that these compositions were very gassy.
Nature of Cu(SbO2)2 curve. Figure 8-9 does not show the bimodal distribution that
was evident for type 4 Si. This may be due to the different compact density that was
obtained due to the different particle size. As observed by Goodfield and Rees (1985)
in Section 4.1 vii the compact density in conjunction with oxidant level has a marked
effect on the propagation mechanism and they found that the response is complex at
intermediate oxidant levels as no one process dominates the heat transfer process. At
the intermediate concentration of 35% Si, where the proposed mechanism changeover
occurs, the response for the bigger size Si is different due the change in the compact
density. This however would need to be confirmed through analysis of the reaction
products. The burn rate increases until the highest measured burn rate is reached at ca.
UUnniivveerrssiittyy ooff PPrreettoorriiaa eettdd –– RRiiccccoo,, II ((22000055))

8.Modification of Burn rates
8-14
45% Si. It appears that the maximum has shifted to a higher Si content not measured.
It would be beneficial to determine whether this was the case by determining the burn
rates for compositions with >45%Type 3 Si.
Nature of PbCrO4 curve. Similarly, Figure 8-10 does not show the bimodal
distribution that was evident for type 4 Si. It is also felt that similar to the Cu(SbO2)2-
Si system, this observation is also due to the difference in compact density between
the type Si and the type 3 Si. The highest measured burn rate occurs at 40% Si with a
plateau at 25 and 30% Si. It was observed, in particular for the 25% Si compositions
that the reactions were extremely violent and that molten lead had been pushed back
up into the shock tube (Figure 8-11). This means that the gas which was produced
flowed in the opposite direction to the combustion front. As discussed by Aldushin &
Zeinenko (1992) (Appendix A) this plays an important role in the burn rate and
affects the nature of the reactions. In order to limit this effect, it is recommended that
a sealing element be added to the detonators to limit gas flow in the opposite
direction.
Figure 8-11: Detonator Assembly for which Molten Lead had Flowed Back into the Shock Tube
Ignition Reliability. Figure 8-12 depicts the ignition reliability (defined as the fraction
of successful ignitions) as a function of mass % type 3 Si for PbCrO4 and Cu(SbO2)2
UUnniivveerrssiittyy ooff PPrreettoorriiaa eettdd –– RRiiccccoo,, II ((22000055))
8.Modification of Burn rates
8-15
as oxidants. It should be noted that once again compositions that ignited successfully
but did not propagate were still considered as successful ignitions. Comparing Figure
8-7 (repeated here) and Figure 8-12 shows that ignition reliability decreases with
increasing Si particle size. This may be attributed to the decreased surface area of
contact between the Si particles and the oxidant. It should be noted that this may
affect the Si mass percentage range which can be applied due to quality control.
0
0.2
0.4
0.6
0.8
1
5 10 15 20 25 30 35 40 45 50
Silicon Mass %
Fraction of Successful Ignitions
Sb2O3
Cu(SbO2)2
PbCrO4
Figure 8-7 (Repeated): Fraction of Successful Ignitions as a Function of Stoichiometry for Tumbled and
Brushed Type 4 Si-based Compositions for a Total of 5 Attempts
UUnniivveerrssiittyy ooff PPrreettoorriiaa eettdd –– RRiiccccoo,, II ((22000055))

8.Modification of Burn rates
8-16
0
0.2
0.4
0.6
0.8
1
15 20 25 30 35 40 45
Silicon Mass %
Fraction of Successful Ignitions
Cu(SbO2)2
PbCrO4
Figure 8-12: Fraction of Successful Ignitions as a Function of Stoichiometry for Type 3 Si-based
Compositions for a Total of 5 Attempts
Standard Deviation of Data. The data in Appendix H shows that the standard
deviation in the measured burn rates for Cu(SbO2)2-type 3 Si was below 1mm/s. On
the other hand the standard deviation for PbCrO4-type 3 Si was as high as 3mm/s. The
voltage profiles appear similar but spurious results were obtained. This may have
been the result of the lead melting, the gas formation and the nature of the interaction
between the PbCrO4 and Si.
8.4 Varying Oxidant Particle Size
8.4.1 Experimental
Two compositions were prepared using Nanocat iron oxide and type 4 Si to check
whether varying the particle size of the iron oxide would have an effect on the burn
characteristics. The compositions were 15% Si and 25% Si. The oxidant was not dried
beforehand and was therefore surface hydrated. The detonators were prepared and
UUnniivveerrssiittyy ooff PPrreettoorriiaa eettdd –– RRiiccccoo,, II ((22000055))

8.Modification of Burn rates
8-17
subjected to burn rate measurements using the procedure outlined in Figure 8-13. It
should be noted that brush mixing was omitted.
Figure 8-13: Experimental Procedure for Determining the Effect of Varying Oxidant Particle Size
8.4.2 Results and Discussion
A summary of the experimental results is contained in Appendix I. The mixture failed
to ignite in all cases. Varying the particle size and origin of the iron oxide did not
result in a composition which could be used. The problem with the application of the
Nanocat as an oxidant on its own and not as an additive is the large bulk density of
the fine powder. This makes it difficult to process, compact and to prevent
segregation of the Si particles after tumbling which happens instantaneously.
Nanocat iron
oxide
Type 4 Si
Weighed into polytop, using safety procedures
outlined in Sections 6.3.1 and 6.3.11
Tumble mixed for 4 hours using
procedure outlined in Section 6.3.1
Loaded into lead tubes and detonators for
each composition assembled according to
procedure in Sections 6.3.5, 6.3.6 and 6.3.7
Measurement of burn speed using data
logger (Section 6.3.8) and data filtering
and processing (Section 6.3.10)
UUnniivveerrssiittyy ooff PPrreettoorriiaa eettdd –– RRiiccccoo,, II ((22000055))

8.Modification of Burn rates
8-18
8.5 Additives – Aluminium Addition
8.5.1 Experimental
The compositions tested are reported in Appendix J. It should be noted that
compositions containing PbCrO4 as oxidant were not tested. The formulations were
prepared as follows:
� Two, 5,10 and 20% Al based on the total composition mass was weighed out.
� Of the remaining mass (total composition mass - mass of Al) the relevant
percentage of type 4 Si (20-45%) was taken
� The remainder of the mass was the oxidant.
As before, the burn rates were determined according to the procedure outlined in
Figure 8-14
UUnniivveerrssiittyy ooff PPrreettoorriiaa eettdd –– RRiiccccoo,, II ((22000055))

8.Modification of Burn rates
8-19
Figure 8-14: Experimental Procedure for Determining the Effect of Al Addition
8.5.2 Results and Discussion
The relevant data on the behaviour of the compositions during burning and burn rates
is reported in Appendix J. The burn rate data is reported graphically in Figures 8-15
and 8-16.
Oxidant Type 4 Si
Weighed into polytop, using safety procedures
outlined in Sections 6.3.1 and 6.3.11
Tumble mixed for 4 hours using
procedure outlined in Section 6.3.1
Loaded into lead tubes and detonators for each
composition assembled according to procedure in
Sections 6.3.5, 6.3.6 and 6.3.7
Measurement of burn speed using data
logger (Section 6.3.8) and data filtering
and processing (Section 6.3.10)
Brush mixed using procedure outlined
in Section 6.3.2
2,5,10,20% Al
UUnniivveerrssiittyy ooff PPrreettoorriiaa eettdd –– RRiiccccoo,, II ((22000055))

8.Modification of Burn rates
8-20
0
3
5
8
10
13
20 25 30 35 40 45
Silicon mass %
Burn speed (mm/s)
0,0 % Al
2,0% Al
5,0% Al
10% Al
Figure 8-15: Aluminium Addition Decreases the Burn Rate and Ignition Range of Cu(SbO2)2-Type 4
Si
0
5
10
15
25 30 35
Silicon mass %
Burn speed (mm/s)
0,0% Al
5,0% Al
10,0% Al
Figure 8-16: Aluminium Addition Decreases the Burn Rate and Ignition Range of Sb2O2-Type 4 Si.
UUnniivveerrssiittyy ooff PPrreettoorriiaa eettdd –– RRiiccccoo,, II ((22000055))

8.Modification of Burn rates
8-21
Nature of the Curves. Figures 8-15 and 8-16 show that the addition of aluminium
powder decreased the burn rate for Cu(SbO2)2 and Sb2O3 instead of increasing it as
reported in literature (Section 4.1 iv). Possible reasons for this observation may be:
� The Al acted as a secondary fuel thereby increasing the overall the fuel
concentration.
� The presence of the Al may have decreased the available amount of heat for
transfer.
� The particle size of the Al was not investigated and may have had an effect.
The highest measured burn rates occurred at 30 (exception – 10% Al) and 40% Si for
the compositions with Cu(SbO2)2 as oxidant. It therefore appears that the bimodal
distribution of the burn rates for Cu(SbO2)2-Si is retained for all the Al addition
levels, thereby still indicating that a change in propagation mechanism may have
taken place.
Gassiness. It was observed that the gassiness of the burning mixtures increased and
the reactions became more vigorous with the addition of Al. Lead was observed to
pour out of the opening for the first thermocouple as the wave passed the second
opening.
Ignition Reliability. As the proportion of Al which was added increased, the ignition
reliability decreased until 10% Al beyond which no compositions ignited. The
addition of the Al desensitises the composition to ignition by shock tube. This may
also indicate that the Al acts as a secondary fuel.
Standard Deviation of Data. As reported in Appendix J, the standard deviation of the
Sb2O3-based compositions was not determined due to the low fraction of
compositions which actually ignited and yielded a burn rate. The standard deviation
of the data for the Cu(SbO2)2-based compositions was below 2mm/s.
UUnniivveerrssiittyy ooff PPrreettoorriiaa eettdd –– RRiiccccoo,, II ((22000055))

8.Modification of Burn rates
8-22
8.6 Conclusions
0
5
10
15
20
25
30
10 20 30 40 50
Silicon Mass %
Burn Speed (mm/s)
Cu(SbO2)2
Sb2O3
PbCrO4
Figure 8-17: Effect of Oxidant on the Burn Rate of Type 4 Si
As shown in Figure 8-17 and the data contained in the preceding sections, the main
controlling variable over the burn rate was the nature of the oxidant i.e. in decreasing
order of burn rate PbCrO4, Cu(SbO2)2 and Sb2O3. As mentioned previously it would
be beneficial to determine the processes which occur during combustion by analysing
the combustion products, evaluating the effect of compaction density, core diameter
etc. to determine whether the reactions for these oxidants are truly solid-solid
reactions and whether there is change in the propagation mechanism at 35% Si for the
copper antimonite and lead chromate systems.
Bimodal burn rate distributions were observed for the Cu(SbO2)2-based compositions
as the stoichiometry was varied and Al added. This was not the case when the Si
particle size was increased (Figure 8-18). The addition of Al and increasing the
particle size decreased the measured burn rates.
The addition of Al reduced the measured burn rates for Sb2O3-Si slightly (Figure 8-
19). Increasing the Si content on the other hand increased the measured burn speeds
within the ignitable composition range. It should be noted that the ignition of Sb2O3 is
UUnniivveerrssiittyy ooff PPrreettoorriiaa eettdd –– RRiiccccoo,, II ((22000055))

8.Modification of Burn rates
8-23
very dependent on the method of initiation. Increasing the Si particle size and Al
content beyond 10% resulted in compositions which were not ignitable by shock tube.
0
3
5
8
10
13
20 25 30 35 40 45
Silicon mass %
Burn speed (mm/s)
Type 3 Si (6.39m 2̂/g)
Type 4 Si (8.33m 2̂/g)
2% Al
5% Al
10% Al
Figure 8-18: Burn Speed Decreases with Increasing Aluminium Addition and Silicon Particle Size for
Cu(SbO2)2-Si
0
5
10
15
25 30 35
Silicon mass %
Burn speed (mm/s)
0,0% Al
5,0% Al
10,0% Al
Figure 8-19: Burn Speed Decreases with Increasing Aluminium Content and Decreasing Silicon
Content for Sb2O3-Si
UUnniivveerrssiittyy ooff PPrreettoorriiaa eettdd –– RRiiccccoo,, II ((22000055))

8.Modification of Burn rates
8-24
0
5
10
15
20
25
30
10 20 30 40 50
Silicon Mass %
Burn Speed (mm/s)
Type 3 Si (6.39m^2/g)
Type 4 Si (8.33m^2/g)
Figure 8-20: Increasing the Silicon Particle Size Decreases the Burn Rate for PbCrO4-Si
A bimodal burn rate distribution was observed for the PbCrO4-Type 4 Si
compositions as the stoichiometry was varied (Figure 8-20). Increasing the Si particle
size not only reduced the measured burn rate for this composition, but as seen in
Figure 8-20, the bimodal burn rate distribution is not evident.
8.7 Applicability and Recommended Further Investigations
As was shown, Sb2O3, PbCrO4 and Cu(SbO2)2 – based compositions are all directly
ignitable by shock tube thereby eliminating the need for a “starter” composition. This
will create more space in the detonator assemblies. The implementation of PbCrO4
would still require the use of a “sealing” composition to prevent the back-flow of
molten lead into the shock tube.
From the reported burn rates for all three oxidants (Appendices G to J), it appears that
the only compositions which may be replaced are the “medium” and “slow”
compositions i.e. Table 8-6.
UUnniivveerrssiittyy ooff PPrreettoorriiaa eettdd –– RRiiccccoo,, II ((22000055))

8.Modification of Burn rates
8-25
Table 8-6: Replacement Compositions for Slow and Medium Compositions Currently in Use
Sb2O3 as oxidant Cu(SbO2)2 as oxidant PbCrO4 as oxidant
“Medium” Composition
35% Type 4 Si 45% Type 3 Si 15 and 50% Type 4 Si
25% Type 4 Si, 2% Al 25-45% Type 3 Si
“Slow” Composition
25% Type 4 Si 20% Type 4 Si 2 & 5% Al
25% Type 4 Si, 5% Al 25% Type 4 Si 5 & 10%
Al
35% Type 4 Si 10% Al
45% Type 4 Si 2% Al
The commercial application of Sb2O3-based compositions is not advisable due to the
large number of ignition failures this composition has exhibited during these
laboratory trials. Furthermore, the ignition sensitivity of this composition to varying
fuel particle size makes it unattractive should there be a slight difference in the fuel
particle size.
Cu(SbO2)2 has been shown to be a reliable oxidant with a small standard deviation in
the burn rate. The burn rates of this composition are easily modified by stoichiometry,
particle size and the addition of Al. It appears that it may be a little too fast to replace
the “slow” composition (i.e. all the compositions reported in Table 8-6 refer to 7mm/s
which is the maximum permissible burn rate for the commercial “slow” composition).
This implies that the processing of this composition would need to exact in order to
achieve the burn rate. It should be borne in mind that this composition does not
require a “starter” element (directly ignitable using shock tube) and therefore longer
elements (compared to the “slow” composition) can be used to achieve the desired
burn time in the long period delay detonators. It also means that developing an
alternative composition for the “starter” composition will be unnecessary. One
drawback of using this compound is that its manufacture will require special
processing procedures to ensure the safety of workers as the inhalation of Sb2O3 (one
of the starting reagents) is suspected of causing cancer (Section 5.1.2).
UUnniivveerrssiittyy ooff PPrreettoorriiaa eettdd –– RRiiccccoo,, II ((22000055))

8.Modification of Burn rates
8-26
Based on these results it is suggested that the use of Cu(SbO2)2-based compositions be
tested by AEL. The implications of large-scale manufacture of the compound also
need to be investigated.
No replacement could be found for the “fast” and “sealing” compositions. It is
thought that perhaps a complete change in thinking may be needed and intermetallic
reactions be used. Hardt and Holsinger (1973) have found that B and C mixtures with
Ti and Zr are self propagating at room temperature with burn rates varying between
0.07 and 97mm/s. They found that the adiabatic temperature must exceed the melting
point of the alloy in order to insure a self-propagating reaction (Hardt and Holsinger,
1973). Perhaps the inclusion of one of the above formulations would supply enough
energy as a starter for these reactions.
UUnniivveerrssiittyy ooff PPrreettoorriiaa eettdd –– RRiiccccoo,, II ((22000055))

9.Dry mixing of Flow Conditioner Additives
9-1
9. DRY MIXING OF FLOW CONDITIONER ADDITIVES
9.1 Powder Processing Problems
The following terms may be used in the description of the various states of
undispersed particles:
� Aggregation – describes an association of particles
� Agglomeration – process by which particles grow by collision with other particles
� Flocculation – Reversible aggregation whereby particles are held together loosely
with considerable surface separations.
� Coagulation – irreversible aggregation, whereby the particles are held closely
together (Hann, 1996:230).
A major problem in the processing of powdered formulations is agglomeration. The
agglomeration results in mixtures which are not homogeneously mixed. This in turn
affects the burn rate of the pyrotechnic formulations (i.e. constant solid-solid contact
and thermal conductivity is not maintained). This problem is compounded when the
powders are hygroscopic, waxy or oily or unusually shaped such as needle-type or
flake particles. The agglomeration increases as the particle size decreases.
Furthermore, moisture content directly increases agglomeration and leads to caking of
the powder. This means that most fine-particle powders must be specially handled, i.e.
drying at elevated temperatures, screening to break up or remove agglomerates and
desiccating to prevent moisture uptake (Tulis, 1980). As mentioned previously
(Section 4.1 ix) moisture adsorption affects the burn rate of pyrotechnic formulations
(McLain, 1980).
Another related problem occurs when the powders are milled in order to reduce the
particle size and during mixing before granulation. The surface areas of the powders
are increased and the moisture absorption becomes extensive (Tulis, 1980).
Cohesiveness of the powder increases as the moisture content increases (Marinelli &
Carson, 1996:1120).
UUnniivveerrssiittyy ooff PPrreettoorriiaa eettdd –– RRiiccccoo,, II ((22000055))

9.Dry mixing of Flow Conditioner Additives
9-2
According to Nelson (1996:1099), the strength of the bonds holding the clumps
together may increase with storage time because of surface migration of material into
the high energy contact region. The migration is as a result of the solubilisation and
mobilisation caused by the absorbed vapours. This may explain the phenomenon of
slower burning that has been observed in pyrotechnic formulations where the
individual constituents of the formulation have been allowed to age before being
mixed. Some powders may be treated to decrease the likelihood of these changes and
to keep the clumps soft and easy to deagglomerate (Nelson, 1996:1099).
Forces causing primary particles to stick together have been classified as:
� Solid bridging
� Liquid bridging
� Attraction between particles
� Interlocking
Solid bridges form as a result of sintering, solid diffusion or chemical reaction. Liquid
bridging results from the presence between individual particles of bulk liquid. Forces
of interparticle attraction are electrostatic and Van der Waal’s forces. Electrostatic
forces arise through charging by contact with charged particles or by friction. Van der
Waal’s forces arise from electron motion within the atoms and protrude beyond the
surface of the particle. These forces are only appreciable where the radii (r) and
distance between the particles is small.
The formation of agglomerates by particle interlocking can occur with fibrous or
plate-shaped particles but not spheres (Veale, 1972:135-136).
For fine particles (<1µm) the most important agglomerating forces are Van der
Waal’s and liquid bridging. The tap density of such powders may be as low as 1% of
the theoretical density, so particle bridging and extensive void formation occurs.
Veale (1972:136-137) has stated that mixing these powders with a fluid and
granulating will increase the density to 20% of its theoretical value.
UUnniivveerrssiittyy ooff PPrreettoorriiaa eettdd –– RRiiccccoo,, II ((22000055))

9.Dry mixing of Flow Conditioner Additives
9-3
As a result of these forces, powders do not flow easily. Agglomerates move rather
than individual particles (Veale, 1972:137). Five common flow problems are:
� No Flow – This may occur when a cohesive arch forms at the outlet of the
container or a stable rat hole is formed within the container
� Erratic Flow – Combination of two no flow conditions.
� Flooding- Flooding occurs when fresh material is added to a bulk material (a fine
powder) that has formed a stable rat hole.
� Limited Discharge Rate – This is a function of the material’s air or gas
permeability – i.e. material flow is limited by counter flow of gas through the
outlet.
� Segregation – Occurs when powders are composed of different particle sizes or
densities (Marinelli and Carson, 1996:1114).
A further problem during powder processing is the effect of wall friction. The
following variables affect wall friction values:
� Pressure – as the pressure acting normal to the wall increases, the coefficient of
sliding friction often decreases.
� Moisture Content – As the moisture increases, the more frictional the particles.
� Particle Size and Shape – Fine materials are more frictional and angular particles
dig into the wall surface creating more friction.
� Temperature – Higher temperatures result in more frictional particles.
� Time of storage at rest – If allowed to remain in contact with a wall surface, many
solids experience an increase in friction between the particles and the wall surface.
� Wall Surface – Smoother wall surfaces are typically less frictional and the
corrosion of the surface affects the ability of the material to flow on it (Marinelli
& Carson, 1996:1119).
9.1.1 The Use of Additives
In the past small amounts of fine powders have been used as additives to improve the
flow properties of a range of powdered insecticides, chemicals, pharmaceuticals, etc.
During the mixing the agglomerates are broken down and the fine particles coat the
coarser particles of the main constituent and prevent these sticking together. The
UUnniivveerrssiittyy ooff PPrreettoorriiaa eettdd –– RRiiccccoo,, II ((22000055))

9.Dry mixing of Flow Conditioner Additives
9-4
coated hydrophobic forms of the fine powder have been used very successfully for
this purpose. The fine powders may also be used to absorb the small amount of liquid
in the bridges and convert the powder to a mass of dry powder (Veale, 1972:138).
These are usually fine powders of sub sieve particle size and include silicates,
stearates, phosphates, diatomaceous earth, starch, magnesium oxide, talcum and fatty
amines (Tulis, 1980).
The mechanisms by which these conditioners work in inhibiting agglomeration and
improving flowability are:
� They form a solid barrier between the powder particles, reducing their attractive
forces
� They lubricate the solid surfaces thereby reducing friction between the particles
and
� They neutralise electrostatic charge (Tulis, 1980 & Veale, 1972:138).
Electrostatic charge and friction are both potential ignition sources for pyrotechnic
compositions and their minimisation will result in safer operating conditions.
Dow Corning Corporation has developed a hydrophobic fumed silica powder, which
was called Silanox and Tulanox 500. It has been prepared from a hydrophilic colloidal
silica by reacting the latter with hexamethyldisilazane. According to Tulis (1980), this
flow conditioner has the following advantages:
� It has an exceedingly light bulk density.
� The particle size is about 1nm.
� The conditioner may be premixed before milling and will allow for the milling of
waxy or oily materials.
� The treated powder becomes water repellent, even if initially hygroscopic.
� On a mass basis, the addition of less than 1% of the conditioner is sufficient.
� The resultant powder generally has a higher bulk density after the addition and
� It is chemically inert, even with sensitive pyrotechnic mixtures (Tulis, 1980).
The silica causes a steric methyl field to form on the particles that causes the particles
to become hydrophobic. Air is trapped upon the surface of the powder and the water
surface then rests on the millions of points of the hydrophobic silica projections
coating the powder (Tulis, 1980).
UUnniivveerrssiittyy ooff PPrreettoorriiaa eettdd –– RRiiccccoo,, II ((22000055))

9.Dry mixing of Flow Conditioner Additives
9-5
Tulis (1980) has found that the lack of agglomeration and free-flowing characteristic
has helped in preventing powder separation and aiding powder fills. Storage of
pyrotechnic devices for extended periods has resulted in a high degree of propagation
failures due to powder separation within the devices. Tulis (1980) found that this was
not the case with the powders treated with the hydrophobic fumed silica.
One disadvantage of this technology is associated with the increased bulk density.
The bulk density increase is caused by the fluidisation of the individual particles; they
flow and slip past each other readily so that they compact better. If however, the
powder stands for an extended period, it becomes thixotropic in nature i.e. it is
difficult to achieve instant motion even though once disturbed the powder flows
easily. This does not pose a problem where the powders will be fluidised, but should
be considered for the dispersal of the powders that are initially tightly contained
(Tulis, 1980).
The amount of silica that should be added depends on the material to be fluidised and
its particle size. If the particle size is to be reduced, either by milling,
deagglomeration etc. additional silica should be added. Incomplete coating will be
effective but not optimum, whereas excess silica will not improve the flowability
appreciably. Tulis (1980) has found that in some cases it will segregate from the
coated particles, floating on the surface as a separate layer.
The Silanox and Tullanox 500 products are old trade names for a product now called
CAB-O-SIL TS-500 (Sims, 2000). The CAB-O-SIL TS-500 product has a surface
area that varies between 204-245m2/g (Cabot-Corporation website, 2000).
Wacker-Chemie, on the other hand, produce a high purity fumed silica. When mixed
with a powder, even in small amounts, Wacker-Chemie (2000) have stated that their
HDK® grades H20 and H2000 can improve the flow properties of powders. The
fumed silica accumulates on the surface of the particles, thereby separating the
particles and allowing free flow (Wacker HDK® brochure, 2000).
As result of the high specific surface area, the silica can bind moisture on the surface
of the hygroscopic powders. This drying effect promotes the free flow of the powder.
UUnniivveerrssiittyy ooff PPrreettoorriiaa eettdd –– RRiiccccoo,, II ((22000055))

9.Dry mixing of Flow Conditioner Additives
9-6
Wacker-Chemie (2000) recommend their N20 and T30 fumed silicas for this
particular desired effect. They recommend that a concentration of about 0.1 to 3% be
used as additive (Wacker HDK® brochure, 2000).
Wacker-Chemie (2000) have summarised their product specifications and determined
the charge of the silicas in their range (Table 9-1).
Table 9-1: Wacker HDK Product Range Specifications (Wacker HDK Brochure, 2000)
Product Electric Charge Surface Modification Surface Area
(BET) [m2/g]
H20 Highly negative -OSi(CH3)2- 170
H1303 P
H2000
H3004
Negative
-OSi(CH3)3
100
140
210
H1018 Highly negative -OSi(CH3)2- PDMS-treated 100
H2015 Positive -OSi(CH3)2- PDMS-treated,
-NR2/-NR3+ functions
110
H2050 Highly positive -OSi(CH3)2- PDMS-treated,
-NR2/-NR3+ functions
110
H2150 VP Highly positive -OSi(CH3)2- PDMS-treated,
-NR2/-NR3+ functions
110
H3050 VP Highly positive -OSi(CH3)2- PDMS-treated,
-NR2/-NR3+ functions
150
A disadvantage of using the Wacker HDK® range is that it may build up an
electrostatic charge. It is therefore recommended that when applied to the pyrotechnic
mixtures all the equipment used should be properly earthed. Furthermore, Wacker
recommend that in order to maintain the structural properties of the silica, gentle
conveying methods such as compressed-air diaphragm pumps may be used for
conveying over short distances (Wacker HDK® brochure, 2000).
UUnniivveerrssiittyy ooff PPrreettoorriiaa eettdd –– RRiiccccoo,, II ((22000055))

9.Dry mixing of Flow Conditioner Additives
9-7
Molecular sieves have been added to powdered mixtures in the past in order to
facilitate the drying process before milling. An example where this addition has been
advantageous is in the preparation of water-ignitable B-AgF2 pyrotechnic
compositions. Before the size reduction process, molecular sieves (10% on a mass
basis) were added to the AgF2. Subsequent ignition tests revealed that the ignition was
much faster, the burn rate reduced and this was even evident after 24 hours (Tulis,
1980).
The molecular sieves remove the moisture from the powders by absorption in an
equilibrium process. According to Tulis (1980), for this reason, they should only be
used when a continuous drying action is necessary such as in the AgF2 milling
process. They can however be added to powders that are nearly dry. Direct contact
with sensitive compositions should be avoided, as the heat of absorption could be
sufficient to ignite the mixtures.
Tulis (1980) has added both molecular sieves and the hydrophobic fumed silica to
certain milling operations. The molecular sieves are used to dry the particles in the
milling process, so that as the particles are fragmented, they are coated with the
hydrophobic fumed silica.
9.1.2 Density
The bulk density of a material can be affected by moisture (more moisture makes
material more compressible), particle size and shape, temperature (increased
temperature results in softer particles which can be compressed) and particle elasticity
(Marinelli & Carson, 1996:1121).
The packing of powders under their own weight is expressed as the tap density. Tap
density depends on the shape, absolute size and size distribution, surface
characteristics and state of agglomeration of the powder (Veale, 1972:138). The
apparent density is measured as the mass of powder which fills a given container
under free flow (Kaysser and Weise, 1993:114).
UUnniivveerrssiittyy ooff PPrreettoorriiaa eettdd –– RRiiccccoo,, II ((22000055))

9.Dry mixing of Flow Conditioner Additives
9-8
9.2 Formulation of Free Flowing Oxidants
9.2.1 Experimental
The experimental procedure which was used has been summarised in Figure 9-1
Figure 9-1: Formulation of Free Flowing Oxidants
9.2.2 Results and Discussion
It was observed that the addition of the Aerosil 200 fumed silica led to an increase in
the bulk volume which the powders occupied as the fraction of the added fumed
silica, increased. This was not expected as theoretically the bulk density was supposed
BaSO4 PbCrO4
Sample 1: 0% Aerosil 200-fumed silica
OR
Sample 2: 0.5% Aerosil 200-fumed silica
OR
Sample 3: 1% Aerosil 200-fumed silica
30 g mixture milled in
coffee grinder for 5
minutes
End-over-end tumbled for 2
minutes. Visual interpretation
of flow characteristics and
bulk density
30 g mixture milled in
coffee grinder for 5
minutes 5g 5g
Monolayer of powder placed on carbon disks with double-sided carbon tape.
Coated by monolayer of chromium atoms or coated with monolayer of ruthenium
tetraoxide atoms. Only sample 1 and 2 analysed in JEOL – JSM 6000F SEM.
UUnniivveerrssiittyy ooff PPrreettoorriiaa eettdd –– RRiiccccoo,, II ((22000055))

9.Dry mixing of Flow Conditioner Additives
9-9
to increase. The bulk density increase is caused by the fluidisation of the individual
particles; they flow and slip past each other readily so that they compact better (Tulis,
1980). It was therefore decided to measure the tapped bulk density of the powders
before and after the addition of the nano-sized particles.
No visible difference was observed in the SEM as a result of coating with chromium
or ruthenium tetraoxide.
No visible difference was observed in the SEM as a result of the amount of fumed
silica which was added (Figure 9-2).
Figure 9-2: Comparison of Sample 1 (left) and Sample 2 (right)
The use of this processing method is limited by the fact that the addition fumed silicas
and other inert fine particles, may coat the powders completely and not allow for
proper solid to solid contact. This may result in propagation failures. It appeared,
though, that this may be overcome through control of the amount which is added and
the use of reactive nano-sized particles.
9.3 Formulation of Free Flowing Silicon
9.3.1 Experimental
The experimental procedure which was used has been summarised in Figure 9-3.
UUnniivveerrssiittyy ooff PPrreettoorriiaa eettdd –– RRiiccccoo,, II ((22000055))

9.Dry mixing of Flow Conditioner Additives
9-10
Figure 9-3: Formulation of Free Flowing Silicon
9.3.2 Results and Discussion
The addition of the Nanocat iron oxide to the silicon did not improve the flow
characteristics of the powder regardless of the amount that was added.
9.4 Tapped Bulk Density Measurements
9.4.1 Experimental
Apparatus:
A coffee grinder was used to blend the powders and the tapped bulk density was
determined using a measuring cylinder and a mass balance
Silicon (Type 4)
Sample 1: 0,5% Nanocat Iron Oxide
OR
Sample2: 1% Nanocat Iron Oxide
OR
Sample 3: 2% Nanocat Iron Oxide
4g mixtures were end-over-end
tumbled for 2 minutes. Visual
interpretation of flow characteristics.
UUnniivveerrssiittyy ooff PPrreettoorriiaa eettdd –– RRiiccccoo,, II ((22000055))

9.Dry mixing of Flow Conditioner Additives
9-11
Reagents:
The reagents that were used may be found in Table 9-2.
Table 9-2: Reagents used in Bulk Density Measurements
Micro or Nano-sized Particles: Powders:
Wacker hydrophobic fumed silica Silicon
Fumed alumina Barium sulphate
Fumed titanium dioxide Antimony trioxide
Ultrasil VN3
Aerosil 200 – hydrophilic fumed silica
Nanocat (standard) – Iron oxide
Nanocat (A) – Iron oxide
Method:
A 30g mixture containing 1% of the one micro or nano-sized particles and 99% of one
of the powders was accurately weighed out and placed in the coffee grinder. A
standard of the powder alone was also used. The mixture was then milled in a coffee
grinder for 1 minute. Some of the mixture was then placed in the measuring cylinder
and the cylinder tapped until there was no powder along its sides and the solids level
was distinct. The volume and the mass of the powder in the cylinder were noted and
the bulk density calculated.
� Barium Sulphate. All the micro and nano-sized particles were used to determine
the effect of their addition to the density of the barium sulphate.
� Silicon. Only the Wacker fumed silica was tested.
� Antimony Trioxide. Only the standard Nanocat was tested.
UUnniivveerrssiittyy ooff PPrreettoorriiaa eettdd –– RRiiccccoo,, II ((22000055))

9.Dry mixing of Flow Conditioner Additives
9-12
9.4.2 Results and Discussion
The tap densities that were measured are reported in Table 9-3.
Table 9-3: Modification of the Bulk Densities of BaSO4, Si and Sb2O3 using Nanosized Particles
Powder Nano-sized Particle
(1% Addition)
Bulk Density
(kg/m3)
No additive 1356
Fumed Alumina 1187
Fumed Titanium Dioxide 1451
Ultrasil VN3 1194
Wacker Fumed Silica 1439
Nanocat – standard 1320
BaSO4
Nanocat A 1226
No additive 354 Si
Wacker Fumed Silica 358
No additive 910 Sb2O3
Nanocat 832
As can be seen, not all the particles used resulted in a higher bulk density. It should be
noted that the Wacker fumed silica addition did however lead to a slightly higher
bulk density.
9.5 Addition of Wacker HDK20 to Silicon compositions with
Cu(SbO2)2, PbCrO4 and Sb2O3 as Oxidants
9.5.1 Experimental
The compositions were prepared as follows:
� A batch of type 4 Si (79g) was weighed out and 1% Wacker fumed silica (0.80g)
was added to the Si. The mixture was blended in a coffee grinder for 2 minutes.
UUnniivveerrssiittyy ooff PPrreettoorriiaa eettdd –– RRiiccccoo,, II ((22000055))

9.Dry mixing of Flow Conditioner Additives
9-13
� The same procedure as for the preparation of the Si was followed for the
preparation of the following powders:
o 70g Cu(SbO2)2 and 1% Wacker fumed silica (0.70g);
o 65g PbCrO4 and 1% Wacker fumed silica (0.65g) and
o 40g Sb2O3 and 1% Wacker fumed silica (0.40g).
� The flow characteristics of mixtures were visually noted after the blending.
� The following pyrotechnic compositions using these batches were prepared –
Table 9-4:
Table 9-4: Compositions Containing Wacker Fumed Silica as Additive
Oxidant and 1% Wacker fumed silica Mass Percentage Si and 1% Wacker
fumed silica
Sb2O3 25; 30; 35
Cu(SbO2)2 20; 25; 30; 35; 40; 45
PbCrO4 15; 20; 25; 30; 35; 40; 45
� The compositions were tumble mixed for 4 hours and loaded into lead tubes
without brush mixing using the procedures outlined in Sections 6.3.1 and 6.3.5.
� Five detonators for each composition were assembled and the voltage profiles
measured according to the procedures described in Sections 6.3.6 and 6.3.8 .
� The profiles were filtered and processed according to the procedure outlined in
Section 6.3.10.
9.5.2 Results and Discussion
Flow Characteristics. During the mixing and loading of the compositions it was noted
that at an addition level of 1% fumed silica the oxidants became free-flowing powders
while Si still remained “sticky”.
All the relevant data on the behaviour of the compositions during burning and burn
rates is contained in Appendix K. The burn rate data have been summarised in Figures
UUnniivveerrssiittyy ooff PPrreettoorriiaa eettdd –– RRiiccccoo,, II ((22000055))

9.Dry mixing of Flow Conditioner Additives
9-14
9-4, 9-5 and 9-6 which also compare the data with measured burn rates without the
addition of the fumed silica.
0
2
4
6
8
10
12
14
16
25 30 35
Silicon Mass %
Burn Speed (mm/s)
Plain Fumed Silica
Figure 9-4: Effect of Stoichiometry and Wacker HDK20 Fumed Silica Addition on the Burn Rate of
Sb2O3-Type 4 Si
0
2
4
6
8
10
12
14
20 25 30 35 40 45
Silicon Mass %
Burn Speed (mm/s)
Plain
Fumed Silica
Figure 9-5: Effect of Stoichiometry and Wacker HDK20 Fumed Silica Addition on the Burn Rate of
Cu(SbO2)2-Type 4 Si
UUnniivveerrssiittyy ooff PPrreettoorriiaa eettdd –– RRiiccccoo,, II ((22000055))

9.Dry mixing of Flow Conditioner Additives
9-15
0
5
10
15
20
25
30
10 20 30 40 50
Silicon Mass %
Burn Speed (mm/s)
Plain
Fumed Silica
Figure 9-6: Effect of Stoichiometry and Wacker HDK20 Fumed Silica Addition on the Burn Rate of
PbCrO4-Type 4 Si
Ignition and Burning. The compositions ignited and burnt with burn rates varying
between 7-18mm/s. The Figures show that the burn rate was reduced significantly
with the addition of the fumed silica. This was expected as the fumed silica acts a
diluent and absorbs heat.
Nature of the Curves. After reaching the highest measured burn rate at 20% Si
(18mm/s) for PbCrO4 as oxidant, the measured burn rate was approximately constant
at 15mm/s until 45% Si. This was also the case for Cu(SbO2)2-Si where the measured
burn rates are constant from 30% Si onwards. The constant burn rates despite the
change in stoichiometry is a welcome result for the implementation of either PbCrO4
or Cu(SbO2)2 in industry because it means that should a slight error be made with the
Si content the burn rate will remain unaffected.
Ignition Reliability. Figure 9-7 shows the ignition reliability as a function of silicon
content with the addition of fumed silica. Comparing Figure 8-7 (repeated here) and
Figure 9-7 shows that ignition reliability decreases slightly with the addition of fumed
silica. As was seen before, the Sb2O3-based composition still remains unreliable in
terms of ignitable mixtures, limiting its use (i.e. 25% Si-Sb2O3 is no longer ignitable
UUnniivveerrssiittyy ooff PPrreettoorriiaa eettdd –– RRiiccccoo,, II ((22000055))

9.Dry mixing of Flow Conditioner Additives
9-16
using shock tube). The occasional composition failed to ignite or the combustion
wave failed to propagate.
0
0.2
0.4
0.6
0.8
1
5 10 15 20 25 30 35 40 45 50
Silicon Mass %
Fraction of Successful Ignitions
Sb2O3
Cu(SbO2)2
PbCrO4
Figure 8-7 (Repeated): Fraction of Successful Ignitions as a Function of Stoichiometry for Tumbled and
Brushed Type 4 Si-based Compositions for a Total of 5 Attempts
0
0.2
0.4
0.6
0.8
1
10 15 20 25 30 35 40 45 50
Silicon Mass %
Fraction of Successful Ignitions
Ignition Reliability
Sb2O3
Ignition Reliability
Cu(SbO2)2
Ignition Reliability
PbCrO4
Figure 9-7: Fraction of Successful Ignitions as a Function of Stoichiometry for Type 4 Si-based
Compositions with 1% Fumed Silica for a Total of 5 Attempts
UUnniivveerrssiittyy ooff PPrreettoorriiaa eettdd –– RRiiccccoo,, II ((22000055))
9.Dry mixing of Flow Conditioner Additives
9-17
Standard Deviation of Data. Generally the standard deviation in burn rate for the
Cu(SbO2)2-based compositions was below 1mm/s. The standard deviation for the burn
rates measured for the PbCrO4-based compositions was as high as 3 mm/s.
Yet again it appears that only the “medium” and “slow” compositions can be replaced
with the following compositions:
“Slow” “Medium”
Cu(SbO2)2 25% Si, Fumed Silica PbCrO4 20% Si, Fumed silica
PbCrO4 30-40%Si, Fumed silica
The comments and recommendations which have been made in Section 8.7 apply here
and will not be repeated.
UUnniivveerrssiittyy ooff PPrreettoorriiaa eettdd –– RRiiccccoo,, II ((22000055))

10.Wet Mixing
10-1
10. WET MIXING
10.1 Implications of Implementing Dispersions to Mix Formulations
One method of improving the formulation procedures currently used in practice
would be to form stable solid aqueous dispersions of the mixtures. This could
minimise the risk of fires, dust exposure and allow for easier mixing and handling of
the powders to achieve constant thermal conductivity and solid-solid contact.
Dispersions have been used in industry for the processing of pyrotechnic
formulations. Davitt and Yuill (1983) prepared mixtures of Si and SnO2 by vigorous
mechanical stirring of the ingredients in slurry form utilising water. The slurry was
then filtered under vacuum and the resulting filter cake dried and sieved to obtain a
reasonably free-flowing powder. Boberg et al (1997) have also mixed Si and various
other reagents in water. The mixtures were oven dried to a water content of 7-10%,
then granulated and dried once again to a 0.1% H2O content.
A proposal (Appendix L) was written detailing what this entailed and a number of
suggestions made for experimental work to be conducted using this method for the
preparation of the delay compositions.
The problems encountered with powder processing and the reagent properties have
already been summarised in Section 9.1 and Section 5.1 respectively. As can be
deduced from the reagent properties the powders will have to be processed in weakly
alkaline or preferably lower pH values due to the reaction of silicon in alkaline
solutions and the dissolution of freshly precipitated antimony trioxide. This will
eliminate the use of surfactants which result in a high pH and the precipitation of the
oxidant directly onto the Si to promote intimate contact as most hydroxides
(excluding iron hydroxides) precipitate at pH values above 8.
An alternative processing route was envisaged upon forming the stable dispersion i.e.
the dispersions would be loaded directly into a rigid element, centrifuged to form a
UUnniivveerrssiittyy ooff PPrreettoorriiaa eettdd –– RRiiccccoo,, II ((22000055))

10.Wet Mixing
10-2
dense sediment. The excess water removed and the elements dried further in the
drying rooms available at AEL. An initial laboratory scale simulation was attempted
by forming a dispersion of a Si-CuO mixture and filling glass tubes will the
dispersions and subjecting the glass tube to centrifugation. The drying and dispersion
characteristics of the composition were noted.
10.2 Effect of Addition of Surfactants to Si-CuO
10.2.1 Experimental
Three 20% solid slurries were formed by adding 4g of a type 4 Si-CuO (16% Si) to
16g of water. The slurries were then handled as follows:
� The first slurry or reference slurry was mixed using a high shear mixer at
13000rpm and transferred by pipette to fill glass tubes with varying diameters (ID
2.2, 3, 4 and 5mm). The mass of the glass tubes were noted before the addition.
� A quantity of Tamol (a surfactant obtained from BASF) i.e. 1% of the solids’
mass in the slurry was added in the dry form to the slurry. The slurry was then
subjected to the high speed shear mixer (13 000rpm) and similarly transferred by
pipette to glass tubes with varying diameters.
� Similarly, a quantity of DisperByk i.e. 1% of the solids’ mass in the slurry was
added to the slurry. The slurry was then mixed using the high shear mixer and
once again transferred to glass tubes with varying diameters.
The nature of the dispersions were evaluated visually and the mass of the tubes after
the addition of the slurries noted before being centrifuged for 40min at 2500rpm in a
small laboratory centrifuge. The height of the solids after centrifuging was measured
and the top layer of water removed carefully using a pipette so as to not disturb or
remove the solids. The mass of material and the tubes was noted once again. The
tubes were then dried for a day in a desiccators under vacuum and with P2O5. The
mass of the tubes were to be noted after the drying and the slurry visually evaluated
for degree of dryness.
UUnniivveerrssiittyy ooff PPrreettoorriiaa eettdd –– RRiiccccoo,, II ((22000055))

10.Wet Mixing
10-3
10.2.2 Results and Discussion
The experimental data sheet is contained in Appendix M. The initial results have been
summarised in Table 10-1.
Table 10-1: Effect of Surfactant Addition to Type 4 Si-CuO
Reference Tamol DisperByk
Initial mass of
slurry (g)
2.2 - 0.267
3 - 0.626
4 – 1.168
5 - 1.851
2.2 – 0.139
3 – 0.719
4 – 1.154
5 – 1.889
2.2 – 0.152
3 - 0.655
4 – 1.137
5 – 1.806
Height after initial
water removal and
centrifuge
2.2 – 16mm and
10mm at 38mm
(Included layer of
water i.e. 2 solid
layers)
3 – 29mm
4 – 32mm
5 – 33mm
2.2 – 25mm
3 – 55mm
4 – 60mm
5 – 66mm
Could not be
determined as no
separation had
occurred
Height after drying
for a day
Material for all tubes appeared as if had shot out of tubes due
to the production of gas
As mentioned previously Si cannot be processed in an alkaline environment due to its
violent reaction and the production of hydrogen gas. When formulating a 17% CuO
slurry it was found that the pH was 8.78. In the processing of the Cu(SbO2)2-based
compositions, this will also be a problem as even after 4 washes the Cu(SbO2)2 still
resulted in a slurry with a pH of 11.53.
These problems have not been reported by Boberg et al (1997) and Davitt and Yuill
(1983) and it is thought that this is due to the short time which the Si and oxidants
were in contact with water, i.e. were dried immediately. It may perhaps be beneficial
to investigate whether this is the case by mixing the ingredients in water using a
UUnniivveerrssiittyy ooff PPrreettoorriiaa eettdd –– RRiiccccoo,, II ((22000055))

10.Wet Mixing
10-4
surfactant and then drying it immediately by filtration and oven drying at low
temperatures. This will affect the burn characteristics due to the presence of the
surfactant and the heat pre-treatment of the ingredients before loading into tubes.
UUnniivveerrssiittyy ooff PPrreettoorriiaa eettdd –– RRiiccccoo,, II ((22000055))

11.Incorporation into a Thermoset Resin or Thermoplastic
11-1
11. INCORPORATION INTO A THERMOSET RESIN OR
THERMOPLASTIC
11.1 Thermosets and Thermoplastics
Thermosets are formed in a processing mould from moderately large molecular
building blocks (reactive precursors) by chemical reaction, whereas with
thermoplastics, the finished high-molecular material is merely physically remelted in
the mould. This means that thermosets no longer melt and are processed far below
their application temperature whilst, thermoplastics can be remelted and must thus be
processed at temperatures above their temperatures of application (Schönthaler,
1995:665).
Thermosets that are available include phenolic-, urea-, melamine resins, as well as
others based on unsaturated polyester-, diallyl phthalate-, epoxy- and silicone resins.
Thermosetting moulding compounds have been compounded from binders and fillers
that reinforce the mouldings, economise on resin and broaden the range of application
of the resins. An extremely wide variety of materials are used as fillers i.e. organic
and inorganic materials. The binders or resins can be combined with the filler. The
properties of the cured moulded material are the sum of the properties of the resins
and of the fillers, i.e. thus for a given filler, the typical binder properties and for a
given binder typical filler properties are also observed (Schönthaler, 1995:665-7).
Thermosets may be manufactured via two routes. The fusion process entails the
production of a premix from finely ground solid resin, fillers, etc. The premix is then
further compounded on roll mills or extruders. When using roll mills, the fillers are
impregnated with the binder and the material is homogenised. According to
Schönthaler, (1995:668), the fusion process is best suited for powder or short-fiber
fillers. The liquid resin process is used mainly for compounding thermosetting
moulding materials that contain long-fiber or macerate fillers (Schönthaler, 1995:668-
669). Barr (2000) has stated that addition of the powder may influence the cure rates
UUnniivveerrssiittyy ooff PPrreettoorriiaa eettdd –– RRiiccccoo,, II ((22000055))

11.Incorporation into a Thermoset Resin or Thermoplastic
11-2
of these compounds, but the cure rate may be accelerated by the addition of a catalyst
that will react with the silicone.
Silicone resin compounds have been found to satisfy high electrical and thermal
requirements and have a high temperature stability, even over long periods.
Schönthaler, (1995:675) has reported silicone resins as being very expensive.
The calorific values from the incineration of thermosetting compounds have been
reported to be typically about 12 500 – 21 000 kJ/kg (Schönthaler, 1995:665).
Beck (1984) incorporated a small amount of PVC into Sb/KMnO4 system and found
that at small additions <1%, the burn rate increased, but larger proportions resulted in
a decrease in the burn rate and a very gassy system.
11.2 Reaction of Metal Powders with Fluorine-containing Polymers
The use of fluorine or its derivatives as oxidisers in various propellants and explosives
has been recognised for many years. The reaction of fluorine and its derivatives with
metals and metal hydrides is used in flares, igniters and incendiaries (Lee et al, 1997).
According to Lee et al (1997) the higher cost of using the fluorine-based oxidisers can
be justified by their unique characteristics.
Metal powders such as aluminium, magnesium, titanium and hafnium react
exothermically with decomposition products of fluorine containing polymers to
produce metal fluorides, generally in the gaseous state yielding a comparatively high
flame temperature, enthalpy release and energy density. It has been stated that the
decomposition temperature and extent of reaction depends on the size and shape of
the metal particles. In general oxidation is retarded by the thin oxide layer which is
present on the surface of the metal and reactions with decomposed fluorine
compounds are greatly influenced by the quality of the oxide layer (Lee et al, 1997).
UUnniivveerrssiittyy ooff PPrreettoorriiaa eettdd –– RRiiccccoo,, II ((22000055))

11.Incorporation into a Thermoset Resin or Thermoplastic
11-3
Lee et al (1997) used thermal analysis to determine the ignition temperature and the
extent of reaction, i.e. from room temperature to 1000°C at a heating rate of 10°C/min
with an Ar atmosphere. A summary of their results is reported in Figure 11-1.
Fluorine containing polymers decompose by depolymerisation to the volatile matter.
In general if a reaction occurred the following reactions are expected:
2Al + 3CF2 → 2AlF3 + 3C(s) for PTFE and
4Al + 3(CF2(Cl)CF2) → 4AlF3 + 6C(s) +3Cl for Kel F
However in the presence of fluorine and oxygen containing compounds, the
thermochemical calculations predict AlOF as a major product (Lee et al, 1997).
UUnniivveerrssiittyy ooff PPrreettoorriiaa eettdd –– RRiiccccoo,, II ((22000055))

11.Incorporation into a Thermoset Resin or Thermoplastic
11-4
Figure 11-1: Summary of Experimental Results Reported for Metal Powders and Halogen-containing
Polymers
Polymers
Melting- 348°C. Complete decomposition – 556°C (PTFE) and
425°C (Kel F).No difference in thermal behaviour due to size but
crystallinity has effect
Al/Kel F
Exothermic reaction 840°C. Major mass loss started at 197°. 661°C –
endothermic peak = Al melting
Al/iodoform
Single exothermic reaction at 163°C –decomposition of iodoform.
Endotherm at 661°C- Al melting. No reaction or mass gain –
depletion of oxidiser due to low melting point of iodoform
Ti
Ti/PTFE – strong exotherm at 500°C. Mass gain.
Ti/Kel F – 470 and 630°C
Results and Discussion
Al/PTFE
20µm – exothermic peak and mass loss at 530°C – reaction not
violent enough for useful energetic application. Gradual mass
increase till 1000°C.
200nm – strong exothermic peak at 520°C
Al/DBDPE
Mass loss (85%) at 450°C. Small broad exothermic peak with mass
gain at 850°C – weak Al-Br bond compared to Al-F
General Comments
• Al- reactions not as exothermic as desired. Increasing
exothermicity as increased bond strength of Al-X (X=F, Br, I).
• Ti different to al due to difference in oxide layers – TiO2 is more
porous and diffusion is easier.
UUnniivveerrssiittyy ooff PPrreettoorriiaa eettdd –– RRiiccccoo,, II ((22000055))

11.Incorporation into a Thermoset Resin or Thermoplastic
11-5
11.3 Incorporation into Silicone Oil
11.3.1 Experimental
Planning
It was decided to fill silicone oil with some of the powders and one of the mixtures.
The maximum amount of powder, which could be added, was determined and used to
calculate whether enough oxidant could be added to the silicone oil. The mixtures
were also ignited in a fume hood to check the propagation and burning characteristics
of the filled oil.
Apparatus and Reagents
The following reagents were used:
� Silicone Oil – VSF 500 (Supplied by Silicon and Technical Products)
� Barium sulphate
� Silicon
� Red lead
� Antimony trioxide
� Antimony trioxide-Silicon mixture (14%Si).
A mass balance was used to accurately determine the mass of each of the reagents.
The mixtures were stirred using a glass rod.
Method
Filling of the Silicone Oil
A known mass of the silicone oil was added to a beaker. Each of the powders was
added in increments of approximately 0.5g and stirred after each addition. The
addition continued until the oil-powder mixtures or pastes appeared to be almost dry
UUnniivveerrssiittyy ooff PPrreettoorriiaa eettdd –– RRiiccccoo,, II ((22000055))

11.Incorporation into a Thermoset Resin or Thermoplastic
11-6
and could not flow. The total mass of powder was then noted and the maximum ratio
of powder:silicone oil was determined.
Calculation of the Required Amounts of Silicone Oil and Oxidants
The required amount of each of the oxidants to allow for complete combustion of the
silicone oil was calculated based on the silicone oil having the following chemical
formula: SiO(CH3)2.
Burn rate Screening Tests
The mixtures were evaluated using the procedure described in Section 6.3.3.
11.3.2 Results and Discussion
Filling of the Silicone Oil
The maximum ratios of the powders to silicone oil that could be added have been
reported in Table 11-1.
Table 11-1: Maximum Ratios Obtained for Filling Silicone Oil
Powder Added Mass Silicone Oil
Added (g)
Mass Powder
Added (g)
Mass Ratio of
Powder to Silicone
Oil
Si 5.125 5.966 1.164
BaSO4 5.180 10.377 2.003
Sb2O3 17.427 33.096 1.900
Pb3O4 21.285 118.110 5.549
Si-Sb2O3 mixture 0.753 1.029 1.367
It is apparent from the Table that more red lead can be added to the oil than any of the
other powders.
Required Amounts of the Fuels and Oxidants
A summary of the results is reported in Table 11-2.
UUnniivveerrssiittyy ooff PPrreettoorriiaa eettdd –– RRiiccccoo,, II ((22000055))
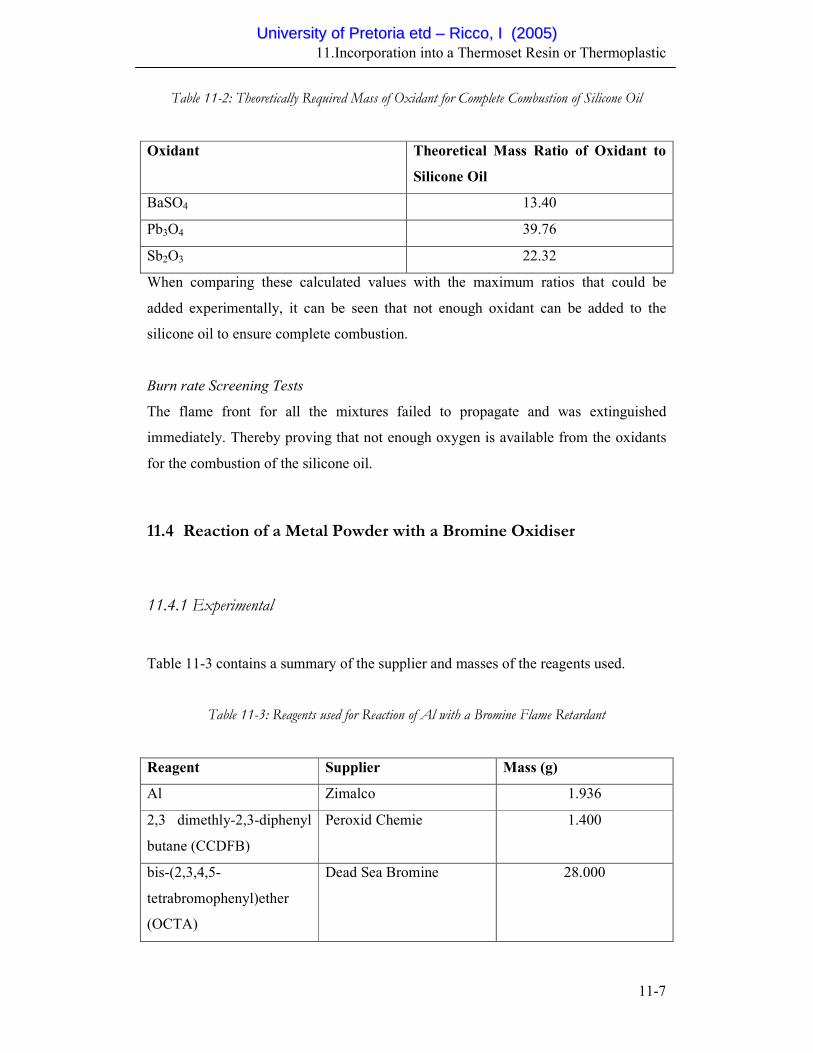
11.Incorporation into a Thermoset Resin or Thermoplastic
11-7
Table 11-2: Theoretically Required Mass of Oxidant for Complete Combustion of Silicone Oil
Oxidant Theoretical Mass Ratio of Oxidant to
Silicone Oil
BaSO4 13.40
Pb3O4 39.76
Sb2O3 22.32
When comparing these calculated values with the maximum ratios that could be
added experimentally, it can be seen that not enough oxidant can be added to the
silicone oil to ensure complete combustion.
Burn rate Screening Tests
The flame front for all the mixtures failed to propagate and was extinguished
immediately. Thereby proving that not enough oxygen is available from the oxidants
for the combustion of the silicone oil.
11.4 Reaction of a Metal Powder with a Bromine Oxidiser
11.4.1 Experimental
Table 11-3 contains a summary of the supplier and masses of the reagents used.
Table 11-3: Reagents used for Reaction of Al with a Bromine Flame Retardant
Reagent Supplier Mass (g)
Al Zimalco 1.936
2,3 dimethly-2,3-diphenyl
butane (CCDFB)
Peroxid Chemie 1.400
bis-(2,3,4,5-
tetrabromophenyl)ether
(OCTA)
Dead Sea Bromine 28.000
UUnniivveerrssiittyy ooff PPrreettoorriiaa eettdd –– RRiiccccoo,, II ((22000055))
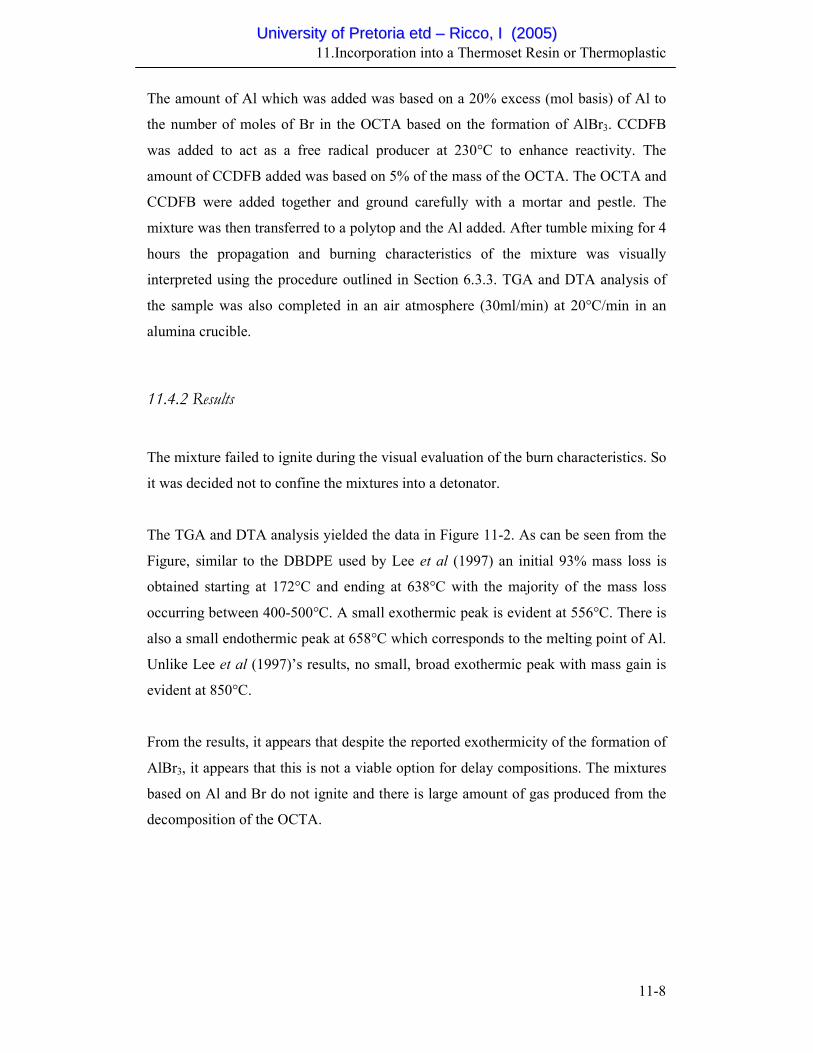
11.Incorporation into a Thermoset Resin or Thermoplastic
11-8
The amount of Al which was added was based on a 20% excess (mol basis) of Al to
the number of moles of Br in the OCTA based on the formation of AlBr3. CCDFB
was added to act as a free radical producer at 230°C to enhance reactivity. The
amount of CCDFB added was based on 5% of the mass of the OCTA. The OCTA and
CCDFB were added together and ground carefully with a mortar and pestle. The
mixture was then transferred to a polytop and the Al added. After tumble mixing for 4
hours the propagation and burning characteristics of the mixture was visually
interpreted using the procedure outlined in Section 6.3.3. TGA and DTA analysis of
the sample was also completed in an air atmosphere (30ml/min) at 20°C/min in an
alumina crucible.
11.4.2 Results
The mixture failed to ignite during the visual evaluation of the burn characteristics. So
it was decided not to confine the mixtures into a detonator.
The TGA and DTA analysis yielded the data in Figure 11-2. As can be seen from the
Figure, similar to the DBDPE used by Lee et al (1997) an initial 93% mass loss is
obtained starting at 172°C and ending at 638°C with the majority of the mass loss
occurring between 400-500°C. A small exothermic peak is evident at 556°C. There is
also a small endothermic peak at 658°C which corresponds to the melting point of Al.
Unlike Lee et al (1997)’s results, no small, broad exothermic peak with mass gain is
evident at 850°C.
From the results, it appears that despite the reported exothermicity of the formation of
AlBr3, it appears that this is not a viable option for delay compositions. The mixtures
based on Al and Br do not ignite and there is large amount of gas produced from the
decomposition of the OCTA.
UUnniivveerrssiittyy ooff PPrreettoorriiaa eettdd –– RRiiccccoo,, II ((22000055))

11.Incorporation into a Thermoset Resin or Thermoplastic
11-9
Figure 11-2: TGA/DTA Analysis of Al, OCTA and CCDFB Mixture
UUnniivveerrssiittyy ooff PPrreettoorriiaa eettdd –– RRiiccccoo,, II ((22000055))
12.Conclusions and Recommendations
12-1
12. CONCLUSIONS AND RECOMMENDATIONS
12.1 Review
At present commercial time delay elements manufactured by AEL contain silicon as
fuel. It is used in conjunction with three possible oxidisers: red lead, lead dioxide and
barium sulphate. The main objective of the investigation was to find alternative
oxidants for these time delay elements maintaining the use of silicon as fuel. The
required burn speed range was 4 to 250mm/s. The lead compounds need to be
replaced because of toxicity concerns during manufacture. The barium sulphate
system is plagued with variable ignition and burn rate performance. The requirements
for a delay element composition include:
� A constant, repeatable burn speed within a given manufactured batch.
� A “gasless” reaction which is directly ignitable using shock tube (a weak ignition
source) and
� A safe, moisture-resistant composition that does not deteriorate with time.
A typical time delay composition comprises of an oxidant, a fuel and processing as
well as burn rate moderating additives. These constituents are mixed in powder form
and pressed into monolithic delay elements.
In practice, reliable ignition is paramount owing to its safety implications. Repeatable
burn rates are very important for efficient use of the explosive during mining and
quarrying. Many variables affect the reactivity and thus ignitability and burn rate of
time delay compositions. They have been identified and can be divided into three
categories:
� Constituent Material Properties. These include deviations from the normal
crystallographic amorphous structure of the substance, lattice defects in the form
of hereditary structures, formation of imperfect structures during transitions or
thermal decomposition, impurities and guest particles in the lattice, gases
dissolved in the lattice, the nature of the oxidant and fuel and particle shape and
size.
UUnniivveerrssiittyy ooff PPrreettoorriiaa eettdd –– RRiiccccoo,, II ((22000055))

12.Conclusions and Recommendations
12-2
� Compositional Properties. These include processing and burn rate moderating
additives (catalysts, fluxes, binders etc.) and stoichiometry.
� Processing and End-use Properties. These include mechanical treatment such as
grinding or pressing, degree of mixing, heat pre-treatment, aging, irradiation,
compact density, ambient pressure, cross sectional area and surrounding material.
It is essential that a constant thermal conductivity and constant solid-solid contact is
maintained to ensure repeatability in terms of burn speed and ignitability.
12.2 Experimental Review
Samples were prepared by tumble mixing followed by brush mixing. Elements were
made by filling lead tubes and compacting the powder by drawing down the lead
tubes. The compaction of the sample and pyrotechnic core diameter could not be
controlled due to the nature of the equipment.
In the laboratory, the compositions were ignited using Exel shock tube, a weak
ignition source. During industrial tests (AEL trials) “starter” and “sealing”
compositions were used to ignite the delay elements. The “starter” composition is a
stronger ignition source.
The burn rate of the compositions was measured using two thermocouples attached
via an electronic interface to a data acquisition computer. The thermocouples were
inserted a known distance apart into two holes drilled into the detonator assembly that
had no explosive charge. The time between the voltage profiles at a fixed voltage was
determined and the burn rate calculated. The shortcomings of this method included
the drilling processes and the presence of the holes which affects the burn rate of
compositions that produce gas. The data smoothing was performed using a first order
digital filter. Absolute temperature profiles could not be derived due to the lack of
cold junction compensation and thermocouple calibration.
UUnniivveerrssiittyy ooff PPrreettoorriiaa eettdd –– RRiiccccoo,, II ((22000055))

12.Conclusions and Recommendations
12-3
12.3 Conclusions
12.3.1 Ignition.
� The mode of ignition affects the reliability of ignition of the compositions, i.e.
MnO2-Si was ignitable using a “starter” element during industrial trials (AEL
trials), but failed to ignite using shock tube directly (laboratory trials). The
following oxidants were directly ignitable with shock tube and tested successfully
with silicon powders as fuel: Sb2O3, Cu(SbO2)2 and PbCrO4.
� The composition range over which ignition was successful is wider when a strong
ignition source is used e.g. the ignitable composition range of Sb2O3-Si obtained
during this study was markedly narrower than that reported in literature where a
stronger source was used.
� The ignition reliability was found to decrease when the fuel particle size
increased, e.g. Sb2O3-based compositions failed to ignite when types 1, 2, 3 and 5
Si were used.
� The ignition reliability decreased when the addition level of aluminium powder
was increased.
� The addition of a low percentage of fumed silica affected the ignition reliability
slightly.
12.3.2 Burn Rates
The burn rate was strongly affected by the nature of the oxidant, stoichiometry and
the addition of Al and fumed silica. The burn rate data obtained for compositions that
were only tumble mixed appears dubious to the presence of agglomerates in
compositions. Lead chromate is potentially a suitable alternative to the oxidant
currently used in “medium” composition and copper antimonite is potentially a
suitable alternative oxidant for “slow” and “medium” compositions that are currently
used by AEL. The need for a “starter” composition is eliminated as both the
Cu(SbO2)2 and PbCrO4-based compositions are directly ignitable using shock tube.
The PbCrO4-based compositions require the use of a “sealing” composition due to gas
UUnniivveerrssiittyy ooff PPrreettoorriiaa eettdd –– RRiiccccoo,, II ((22000055))
12.Conclusions and Recommendations
12-4
flowing in the opposite direction to which the burn front is travelling. No alternative
compositions were found for the “sealing” and “fast” compositions.
Antimony trioxide - Silicon
Stoichiometry. The Sb2O3-based compositions exhibited burn rates between 7 and
14mm/s over the stoichiometric range where shock tube ignition was achieved i.e. 25-
35% Si for type 4 Si. These burn rates were higher than those reported in literature
due to the difference in Si particle size. The compositions exhibited occasional
ignition failure rendering them unsuitable for commercial application.
Varying Fuel Particle Size. The ignitability of Sb2O3 is very dependent on the fuel
particle size i.e. neither type 1, 2, 3 or 5 Si ignited. This is unfortunate because
particle size can not be used to modify burn rates to suit practical application.
The Addition of Aluminium. The addition of aluminium reduced the burn rate slightly
and resulted in compositions which were gassier.
Copper Antominite-Silicon
Stoichiometry. The Cu(SbO2)2-based compositions showed a bimodal burn rate
variation with stoichiometry. Measured burn rates varied between 8-12mm/s over the
composition range which was ignitable (20-45% Si).
Varying Fuel Particle Size. Increasing the silicon particle size decreased the burn
speed for copper antimonite-based compositions. Increasing the Si particle size above
3.5µm resulted in compositions which failed to ignite using shock tube. The bimodal
burn rate variation with stoichiometry was no longer evident.
Aluminium Addition. The addition of aluminium reduced the measured burn speeds.
The bimodal distribution was once again evident for all addition levels of aluminium.
The compositions were also gassier.
UUnniivveerrssiittyy ooff PPrreettoorriiaa eettdd –– RRiiccccoo,, II ((22000055))

12.Conclusions and Recommendations
12-5
Lead Chromate-Silicon.
Stoichiometry. The PbCrO4-based compositions had a bimodal burn rate distribution
as the stoichiometry was varied with the measured burn rates varying between 10-
28mm/s over the composition range which was ignitable (10-50% Si).
Varying Fuel Particle Size. Increasing the silicon particle size decreased the burn
speed for the lead chromate-based compositions. Increasing the Si particle size above
3.5µm resulted in compositions that were not ignitable using shock tube.
Iron oxide-Silicon. Despite attempts at varying the size and origin of the iron oxide
used, none of the compositions were ignitable using shock tube.
12.3.3 Alternative Processing
Dry mixing with fumed silica as processing aid
As mentioned previously solid-solid contact is very important in obtaining repeatable
performance. This is best achieved if the oxidant and fuel individually dispersed in the
pyrotechnic mixture. However, solid particles have a strong tendency to agglomerate.
Owing to the sensitivity of pyrotechnic mixtures, high shear is avoided during mixing
of the compositions. The use of fumed silica to break down agglomerates in the fuel
and oxidant before mixing was explored. Even small amounts of fumed silica
adsorbed on the individual particle cause separation and agglomerate breakdown. This
is visualised by the free flowing nature of the solid powder in the presence of silica.
The objective was to achieve complete mixing by tumbling alone. These tests proved
that the addition of 1% Wacker HDK20 (fumed silica) improved the flow
characteristics of the PbCrO4, Cu(SbO2)2 and Sb2O3, but the Si remained slightly
“sticky”.
Reliable ignition and constant burn speeds were achieved with only tumble mixing as
a result of the addition of small amounts of Wacker HDK20. The measured burn
UUnniivveerrssiittyy ooff PPrreettoorriiaa eettdd –– RRiiccccoo,, II ((22000055))

12.Conclusions and Recommendations
12-6
rates were reduced for all the compositions as the fumed silica acted as a diluent.
Furthermore the bimodal burn rate distributions which were evident previously for
PbCrO4 and Cu(SbO2)2-based compositions were no longer evident. Cu(SbO2)2 had a
constant burn rate (8mm/s) from 30%Si onwards whilst PbCrO4 had a constant burn
rate of 15mm/s from 25-45% Si. This is a welcome result as should a slight error be
made with the Si content during processing, the batch will not be ruined as the burn
rate remains unaffected. Once again it appears that replacements for “slow” and
“medium” compositions have been found.
Wet mixing.
Safe dispersion and intimate mixing of pyrotechnic compositions is in principle also
possible in a water medium. The process of particle agglomerate breakdown is further
aided by using surfactants as dispersants. For the present situation this option was
only considered for the Si-CuO system. Problems were encountered with the high
resultant pH of the dispersion. Silicon reacts violently in an alkaline medium. A
dispersion of Cu(SbO2)2 was also found to alkaline.
The mixing of Cu(SbO2)2, CuO and Si using a dispersions followed by centrifuging
into a rigid element is not possible due to the alkaline nature of Cu(SbO2)2 and CuO
and Si reacts violently in alkaline solutions.
Incorporation into a thermoset resin or thermoplastic.
All mixtures failed to ignite when incorporated in silicone oil suggesting the use of
more energetic compositions. Al, OCTA and CCDFB failed to ignite and the reported
exothermicity of the formation of AlBr3 was not evident. The mixture exhibited a
major mass loss during TG/DTA analysis rendering it unviable for use in time delays.
UUnniivveerrssiittyy ooff PPrreettoorriiaa eettdd –– RRiiccccoo,, II ((22000055))

12.Conclusions and Recommendations
12-7
12.4 Recommendations
The following recommendations are made for further work:
Literature Review
� Investigate the effect of introducing impurities into the Si crystal lattice and
compare the reactivity of n and p-type reducing agents and n and p-type reducing
agents.
� Investigate the types of binders used and the implications of their use.
� Investigate the effect of irradiating the silicon to change conductivity and
reactivity. The effects of aging on the burn rate of irradiated samples should be
noted.
� Investigate the effect of modifying particle shape and size (by changing
precipitation conditions such as concentration, the addition of seed particles and
temperature) of Cu(SbO2)2 on the burn rate.
� Investigate the use of alternative materials (metal-lined polymeric rigid elements)
in order to phase out the use of lead drawn elements
� Investigate the effect of mechanical and heat pre-treatment of the reagents on the
combustion products and burn rate.
� Investigate the effect of varying compaction by varying the consolidation pressure
and initial density. It would be necessary to measure the density of the final
product to determine the effect of absorbed gases as a function of initial densities
and to compare these results to compositions whose reagents have been preheated
to remove the absorbed gases.
� Analyse the effect of varying the pyrotechnic core diameter.
� Determine if the reactions are truly solid-solid reactions
� Analyse the reaction products.
Equipment and Further Analysis
� Evaluate whether an oxide layer has been included in the thermocouple junction
by spot welding.
UUnniivveerrssiittyy ooff PPrreettoorriiaa eettdd –– RRiiccccoo,, II ((22000055))
12.Conclusions and Recommendations
12-8
� Modify the data acquisition set up to include cold junction compensation (CJC)
before feeding the signal to the computer by installing equipment that models CJC
electronically.
� Correct for thermocouple size using the method prescribed by Boddington et al
(1982 and 1986).
� Investigate the implications of using pyrometry as an alternative temperature
sensing device.
� Investigate the possible use of photocells or a high speed camera to measure the
burn speed.
� Investigate the effect that different methods of smoothing have on the extraction
of kinetic parameters from temperature profiles.
� Convert voltage profiles to temperature profiles.
� Extract kinetic data and burn velocities using the Leeds Method.
� Consider triggering the data acquisition by an electric input from the “mouse trap”
and only have one opening for the insertion of a thermocouple.
� Investigate the feasibility of using:
o Time-resolved XRD to monitor component melting and crystal
formation during combustion.
o SEM to analyse the microstructure of quenched samples (reaction is
frozen).
o A high speed digital video camera to monitor the combustion front and
measure burn rate
o The pressure apparatus available from AEL to monitor pressure
changes
o A probe technique to measure the thermal conductivity of
compositions
Alternative Oxidants
� Investigate the effect of aging on Cu(SbO2)2-Si
UUnniivveerrssiittyy ooff PPrreettoorriiaa eettdd –– RRiiccccoo,, II ((22000055))

12.Conclusions and Recommendations
12-9
Modification of the Burn Rate
� Measure the burn speeds or Cu(SbO2)2 and PbCrO4-based compositions using
commercial detonator assemblies and test facilities.
� Determine the burn rates for >45% Si for Type 3 Si-Cu(SbO2)2.
� Investigate the implications of large scale manufacture of Cu(SbO2)2.
� Investigate the use of intermetallic reactions as an alternative to achieve the
desired burn rate for the “fast” and “sealing” compositions.
Alternative Processing
� Investigate the possibility of mixing of the constituents in water, using a surfactant
and filtering the slurry immediately, followed by oven drying using low
temperatures. The effect of surfactant coating and heat pre-treatment of the
compositions should be noted.
UUnniivveerrssiittyy ooff PPrreettoorriiaa eettdd –– RRiiccccoo,, II ((22000055))

13.References
13-1
13. REFERENCES
� Adrian G (1993) Pigments, Inorganic in Ullmann’s Encyclopedia of Industrial
Chemistry, Elvers, B. (editor), VCH Publishers, fifth revised edition, A20,
Weinheim, Germany.
� AEL Raw Material Specification (1994) Barium Sulphate – “Blanc Fixe N”,
Document reference 073.
� AEL Product Specification (2000a) Delay Composition “starter, fast, medium and
slow”, Drawn Lead Rod, Single Core, Doc. Ref 281 revision B.
� AEL Product Specification (2000b) Delay Composition “sealing”, Drawn Lead
Rod, Single Core, Doc. Ref 281/01 revision A.
� Albano M P and Garrido L B (1999) Improvement of Ammonium Polyacrylate
Adsoprtion on Si3N4 Powders by an Aluminium Hydroxide Coating, Materials
Letters, 38, 431-436.
� Aldushin A P and Zeinenko K I (1992) Combustion of Pyrotechnic Mixtures with
Heat Transfer from Gaseous Products, Combustion, Explosion and Shock Waves,
27 (6), 700-703.
� Al-Kazaji S S and Rees G J (1978) The Fast Pyrotechnic Reaction of Silicon and
Red Lead – Part 1: Differential Thermal Analysis Studies, Combustion and
Flame, 31, 105-113.
� Al-Kazaji S S and Rees G J (1979a) Differential Thermal Analysis Studies of the
Reactions of Silicon and Lead Oxides, Journal of Thermal Analysis, 16, 35-39.
� Al-Kazaji S S and Rees G J (1979b) The Fast Pyrotechnic Reaction of Silicon and
Red Lead – Heats of Reaction and Rates of Burning, Fuel, 58, 139-143.
� Barin I (1989) Thermochemical Properties of Inorganic Substances, vol. 2, New
York.
� Barr N (2000) Personal Communication, affiliated to Dow Corning.
� Baudis U (1985) Barium and Barium Compounds in Ullmann’s Encyclopedia of
Industrial Chemistry, 5th edition, vol. A3, Wolfgang G (Ed), VCH Publishers,
Weinheim, Germany.
� Bayer Paint Shade Card Brochure (s.a) Inorganic Bayer Pigments: Bayferrox,
Document Edition: 6.97.
UUnniivveerrssiittyy ooff PPrreettoorriiaa eettdd –– RRiiccccoo,, II ((22000055))

13.References
13-2
� Beck M W (1984) Intersolid Combustion Reactions in Pyrotechnic Systems, PhD
Thesis, Rhodes University, South Africa.
� Beck M W and Brown M E (1986) Modification of the Burning rate of
Antimony/Potassium Permanganate Pyrotechnic Delay Compositions,
Combustion and Flame, 66, 67-75.
� Beck M W (1989) A Preliminary Investigation into the Si/BaSO4 combustion
Mechanism, ICI Explosives Group Technical Report no.684, Ardeer Site.
� Beck M W and Brown M E (1991) Finite-element Simulation of the Differential
Thermal Analysis Response to Ignition of a Pyrotechnic Composition, Journal of
the Chemistry Society of Faraday Transactions, 87(5), 711-715.
� Beck M W and Flanagan J (1992) Delay Composition and Device, Patent, US 5
147 476.
� Beretka J (1984) Kinetic Analysis of Solid-State Reactions between Powdered
Reactants, Journal of the American Chemical Society, 67(9), 615-620.
� Bergström L (1997) Hamaker Constants of Inorganic Materials, Advances in
Colloid and Interface Science, 70, 125-169.
� Birchenall C E (1986) Oxidation of Metals and Alloys in Encyclopedia of
Materials Science and Engineering, vol. 5, Beuer M B (Ed.), Pergamon Press.
� Boberg T, Carlsson S, Ekman B and Karlsson B (1997) Delay Charge and
Element and Detonator Containing such a Charge, Patent, US 5 654 520.
� Boddington T, Laye P G, Pude J R G and Tipping J (1982) Temperature Profile
Analysis of Pyrotechnic Systems, Combustion and Flame, 47, 235-254.
� Boddington T, Laye P G, Tipping J and Whalley D (1986) Kinetic Analysis of
Temperature Profiles of Pyrotechnic Systems, Combustion and Flame, 63, 359-
368.
� Boddington T, Cottrell A, Laye P G and Singh M (1986) Times-to-Ignition of
Pyrotechnics, Thermochimica Acta, 106, 253-261.
� Boddington T, Cottrell A and Laye P G (1989) Combustion Transfer in Gasless
Pyrotechnics, Combustion and Flame, 79, 234-241.
� Boddington T, Cottrell A and Laye P G (1990) A Numerical Model of
Combustion in Gasless Pyrotechnics, Combustion and Flame, 76, 63-69.
� Bognolo G (2000) Structure-Performance Relationship, paper presented at
Surfactant Technology and its Applications course, 2-4 August 2000, University
of Pretoria, Pretoria, South Africa.
UUnniivveerrssiittyy ooff PPrreettoorriiaa eettdd –– RRiiccccoo,, II ((22000055))

13.References
13-3
� Brauer K O (1974) Handbook of Pyrotechnics, Chemical Publishing Company,
New York, United States.
� Broadbent M (2000) Introduction to Surfactants, paper presented at Surfactant
Technology and its Applications course, 2-4 August 2000, University of Pretoria,
Pretoria, South Africa.
� Brown M E (1989) Thermal Analysis of Energetic Materials, Thermochimica
Acta, 148, 521-531.
� Cabot Corporation (2000), http://www.cabosil, http://www.cabot-
corp.com/cabosil, 21/07/2000.
� Cardellini F, Mazzone G and Antisari M V (1996) Solid State Reactions and
Microstructural Evolution of Al-Ni Powders During High-Energy Ball Milling,
Acta Mater., 44(4), 1511-1517.
� Carr D S (1993) Lead Compounds in Ullmann’s Encyclopedia of Industrial
Chemistry, 5th edition, vol. A26, Elvers B (Ed), VCH Publishers, Weinheim,
Germany.
� Charsley E L, Ford M C, Tolhurst D E, Barid-Parker S, Boddington T and Laye P
G (1978) Differential Thermal Analysis and Temperature Profile Analysis of
Pyrotechnic Delay Systems: Mixtures of Tungsten and Potassium Dichromate,
Thermochimica Acta, 25, 131-141.
� Charsley E L, Chen C, Boddington T, Laye P G and Pude J R G (1980)
Differential Thermal Analysis and Temperature Profile Analysis of Pyrotechnic
Delay Systems: Ternary Mixtures of Silicon, Boron and Potassium Dichromate,
Thermochimica Acta, 35, 141-152.
� Churaev N V (1995) Contact Angles and Surface Forces, Advances in Colloid and
Interface Science, 58, 85-118.
� Conkling J A (1996) Pyrotechnics in Kirk Othmers’ Encyclopedia of Chemical
Technology, J. I. Krosschwitz (Exec. Ed.), John Wiley and Sons, volume 20, 680-
697, New York, United States.
� CRC Handbook for Chemistry and Physics (1992) Lide D R (Ed), CRC Press,
Boca Raton, Florida, United States.
� Crider J F (1982) Self-Propagating High Temperature Synthesis – A Soviet
Method for Producing Ceramic Material, 519-526.
� Davies N (1999) Cranfield University, Personal communication with M Taylor.
UUnniivveerrssiittyy ooff PPrreettoorriiaa eettdd –– RRiiccccoo,, II ((22000055))

13.References
13-4
� Davitt, A.L. and Yuill, K.A. (1983), Delay Composition for Detonators, Patent
US 4 374 686.
� Delta EMD General Certificate (2000) MnO2 Special Sample Request, Request
number 860.
� Drennan R L and Brown M E (1992a) Binary and Ternary Pyrotechnic Systems of
Mn and/or Mo and BaO2 and/or SrO2 Part 2, Thermochimica Acta, 208, 223-246.
� Drennan R L and Brown M E (1992b) Binary and Ternary Pyrotechnic Systems of
Mn and/or Mo and BaO2 and/or SrO2 Part 3. Kinetic Aspects, Thermochimica
Acta, 208, 247-259.
� Drummond C J and Chan D Y C (1997) van der Waals Interaction, Surface Free
Energies and Contact Angles: Dispersive Polymers and Liquids, Langmuir,
13(14), 3890-3895.
� Ellern H (1968) Military and Civilian Pyrotechnics, Chemical Publishing
Company, New York, United States.
� Farminer K W (1973) Silicone Antifoams in Chemical Processing, Chemical
Processing, October.
� Feng Z, Zhao J, Huggins F E and Huffman G P (1993) Agglomeration and Phase
Transition of a Nanophase Iron Oxide Catalyst, Journal of Catalysis, 143, 499-
509.
� Focke W W (2000a) Introduction to surfaces and interfaces, paper presented at
Surfactant Technology and its Applications course, 2-4 August 2000, University
of Pretoria, Pretoria, South Africa.
� Focke W W (2000b) Particle Suspension Formulation, paper presented at
Surfactant Technology and its Applications course, 2-4 August 2000, University
of Pretoria, Pretoria, South Africa.
� Focke W W and Ricco I M M (2002) Progress Report: Evaluation of Alternative
Oxidants for AEL Time Delay Detonators, report to AEL.
� Fordham S (1980) High Explosives, second revised edition, Pergamon Press.
� Freedman L D, Doak G D and Long G G (1996) Antimony Compounds in Kirk-
Othmers Encyclopedia of Chemical Technology, 4th edition, volume 3, 385, New
York, United States.
� Goodfield J A C and Rees G J (1985) Metal/Oxidant Combustion Reactions:
Variation of Propagation Rate with Consolidation Pressure, Fuel, 64, 1627-1630.
UUnniivveerrssiittyy ooff PPrreettoorriiaa eettdd –– RRiiccccoo,, II ((22000055))

13.References
13-5
� Greenwood N N and Earnshaw A (1984) Manganese, Technetium and Rhenium in
Chemistry of the Elements, Pergamon Press, Oxford, England.
� Greenwood N N and Earnshaw A (1984) Silicon in Chemistry of the Elements,
Pergamon Press, Oxford, England.
� Guidarelli G, Craciun F, Galassi C and Roncari E (1998) Ultrasonic
Characterisation of Solid-Liquid Suspensions, Ultrasonics, 36, 467-470.
� Hackley V A, Paik U, Kim B and Malghan S G (1997) Aqueous Processing of
Sintered Reaction-Bonded Silicon Nitride: I, Dispersion Properties of Silicon
Powder, Journal of the American Ceramic Society, 80(7), 1781-1788.
� Hann W M (1996) Dispersants, in Kirk-Othmer’s Encyclopedia of Chemical
Technology, Kroschwitz, J.I. (Exec. Ed.), fourth edition, John-Wiley and Sons,
volume 8, New York, United States.
� Hardt A P and Phung P V (1973) Propagation of Gasless Reactions in Solids – I.
Analytical Study of Exothermic Intermetallic Reaction Rates, Combustion and
Flame, 21, 77-89.
� Hardt A P and Holsinger R W (1973) Propagation of Gasless Reactions in Solids
– II. Experimental Study of Exothermic Intermetallic Reaction Rates, Combustion
and Flame, 21, 91-97.
� Hedger J T (1983) Factors Influencing the Pyrotechnic Reaction of Silicon and
Red Lead, Propellants, Explosives, Pyrotechnics, 8, 95-98.
� Herbst K A, Rose G, Hanusch K, Schumann H and Wolf H U (1985) Antimony
and Antimony Compounds in Ullmann’s Encyclopedia of Industrial Chemistry,
5th edition, vol. A3, Gerhartz W B (Ed), VCH Publishers, Weinheim, Germany.
� Heusch R (1993) Disperse Systems and Dispersants, in Ullman’s Encyclopedia of
Chemical Technology, Elvers, B. (editor), VCH Publishers, fifth revised edition,
A23, Weinheim, Germany.
� Howlett S L and May F G J (1974) Ignition Reactions of Boron: I: B-K2Cr2O7 and
B-Si-K2Cr2O7. Thermochimica Acta, 9, 213.
� JANAF Thermochemical Tables (1971) United States Department of Commerce
and National Bureau of Standards, Washington.
� Kaysser W A and Weise W (1993) Powder Metallurgy and Sintered Materials in
Ullmann’s Encyclopedia of Industrial Chemistry, 5th edition, vol. A26, Elvers B
(Ed), VCH Publishers.
UUnniivveerrssiittyy ooff PPrreettoorriiaa eettdd –– RRiiccccoo,, II ((22000055))

13.References
13-6
� Krone U and Lancaster R (1992) Pyrotechnics in Ullmann’s Encyclopedia of
Industrial Chemistry, 5th edition, vol. A22, Elvers B (Ed), VCH Publishers,
Weinheim, Germany.
� Labuschagne F J W (s.a.) Phd Thesis to be submitted, Department of Chemical
Engineering, University of Pretoria.
� Lafuma (2000) Fundamental Mechanisms of Stabilisation or Destabilisation of
Disperse Media, paper presented at Surfactant Technology and its Applications
course, 2-4 August 2000, University of Pretoria, Pretoria, South Africa.
� Laye P G (1997) Tying up Loose Ends, Thermochimica Acta, 300, 237-245.
� Lee I, Reed R R, Brady V L and Finnegan S A (1997) Energy Release in the
Reaction of Metal Powders with Fluorine Containing Polymers, Journal of
Thermal Analysis, 49, 1699-1705.
� Liley P E; Read R C and Buck E (1984) Physical and Chemical Data, section 3 in
Perry’s Chemical Engineers’ Handbook, 6th edition, McGraw-Hill Book
Company, New York.
� Mach I Product Bulletin (1995) Nanocat Superfine Iron Oxide.
� Mailwane H (2000) Dispersing a mixture of Deca-bromobiphenyl Oxide and
Antimony Oxide, Report for CSC 420, Department of Chemical Engineering,
University of Pretoria, South Africa.
� Mani A, Athinarayanaswamy K, Pushpavanam S, Madhu S and Mahadevaiyer Y
(1996) pH-Dependent Phases of Electrolytic Antimony Trioxide, Journal of
Material Science Letters, 15, 2085-2087.
� Marinelli J and Carson J W (1996) Powders, Handling (Bulk) in Encyclopedia of
Chemical Technology, 4rth edition, vol. 19, Kroschwitz J I (Ed), John Wiley and
Sons.
� McLain J H (1980) Pyrotechnics from the Viewpoint of Solid State Chemistry, The
Franklin Institute Press, Philadelphia, Pennsylvania.
� Mellor J W (1933) The Antimonious Acids and the Antimonites, in A
Comprehensive Treatise on Inorganic and Theoretical Chemistry, Volume IX,
Longmans, Green and co., London.
� Moghaddam A Z and Rees G J (1981) The Fast Pyrotechnic Reaction of Silicon
with Lead Oxides: Differential Scanning Calorimetry and Hot-stage Microscopy
Studies, Fuel, 60, 629-632.
UUnniivveerrssiittyy ooff PPrreettoorriiaa eettdd –– RRiiccccoo,, II ((22000055))

13.References
13-7
� Nelson R D (1996) Powders, Handling (Dispersion) in Kirk-Othmer’s
Encyclopedia of Chemical Technology, Kroschwitz, J.I. (Exec. Ed.), fourth
edition, John-Wiley and Sons, volume 19.
� Nguyen A V (2000) Improved Approximation of Water Dielectric Permittivity for
Calculation of Hamaker Constants, Journal of Colloid and Interface Science 229,
648-651.
� Nosgrove A H C, Jones A F and King-hele J A (1991) Effects of Solid to Gas
Conversion in Detonator Delay Elements, Combustion Science and Technology,
76, 133-157.
� Parrott J E and Stuckes A D (1975) Thermal Conductivity of Technological
Materials, Pion Limited, Bristol.
� Penfold J, Staples E J, Tucker I and Fragnetto G (1996) The Effect of Shear on the
Adsorption of Non-ionic Surfactants at the Liquid-Solid Interface, Physica B, 221,
325-330.
� Penfold J, Staples E J, Tucker I, Thompson L J and Thomas R K (1998) The
Structure and Composition of Mixed Cationic and Non-ionic Surfactant Layers
Adsorbed at the Hydrophilic Silicon Surface, Physica B, 248, 223-228.
� Pico Technology Application Note (2001)
� Pourbaix M (1966) Silicon in Atlas of Electrochemical Equilibria in Aqueous
Solutions, Franklin J A (translator), National Association of Corrosion Engineers
and Cebelcor.
� Reiter G, Sharma A, Khanns R, Casoli A and David M (1999) The Strength of
Long Range Forces Across Thin Liquid Films, Journal of Colloid and Interface
Science, 214, 126-128.
� Ricco I M M, Sefanyetso S O and Focke W W (2002) An Alternative Oxidant for
Silicon-based Pyrotechnic Delay Compositions, submission for DM Kisch
Competition for Innovation, University of Pretoria.
� Rugunanan R A (1991) Intersolid Pyrotechnic Reactions of Silicon, PhD Thesis,
Rhodes University, South Africa.
� Rugunanan R A and Brown M E (1991) Reactions of Powdered Silicon with some
Pyrotechnic Oxidants, Journal of Thermal Analysis, 37, 1193-1211.
� Rugunanan R A and Brown M E (1994a) Combustion of Binary and Ternary
Silicon/Oxidant Pyrotechnic Systems, Part I: Binary Systems with Fe2O3 and
SnO2 as Oxidants, Combustion Science and Technology, 95, 61-83.
UUnniivveerrssiittyy ooff PPrreettoorriiaa eettdd –– RRiiccccoo,, II ((22000055))
13.References
13-8
� Rugunanan R A and Brown M E (1994b) Combustion of Binary and Ternary
Silicon/Oxidant Pyrotechnic Systems, Part II: Binary Systems with Sb2O3 and
KNO3 as Oxidants, Combustion Science and Technology, 95, 85-99.
� Rugunanan R A and Brown M E (1994c) Combustion of Binary and Ternary
Silicon/Oxidant Pyrotechnic Systems, Part III: Ternary Systems, Combustion
Science and Technology, 95, 101-115.
� Runyan, W (1996) Silicon and Silicon Alloys in Kirk-Othmer’s Encyclopedia of
Chemical Technology, Kroschwitz, J.I. (Exec. Ed.), fourth edition, John-Wiley
and Sons, volume 20, New York.
� Sefanyetso S O (s.a.) MSc Thesis to be submitted, Department of Chemistry,
University of Pretoria.
� Schönthaler W (1995) Thermosets in Ullmann’s Encyclopedia of Industrial
Chemistry, Elvers, B. (editor), VCH Publishers, fifth revised edition, A26.
� Shin H, Agarwal M, De Guire M R and Heuer A H (1998) Deposition Mechanism
of Oxide Thin Films on Self-Assembles Organic Monolayers, Acta Mater, 46(3),
801-815.
� Sims E. (2000) Personal Communication, affiliated to Cabot Corporation
� Snegirev A Y and Talalov V A (1991) Determination of Kinetic Parameters for a
Pyrotechnic Mixture, Inorganic Materials, 27, 462-467.
� Stephanopolous G (1984) Chemical Process Control – An Introduction to Theory
and Practice, Prentice Hall, New Jersey.
� Taylor M (2000) Proposed Project in Delay Composition Flow Properties for
AEL, Personal Communication with W. Focke, affiliated with AEL.
� Taylor R (1986) Thermal Conductivity of Ceramics in Encyclopedia of Materials
Science and Engineering, Volume 7, Bever M (Ed), Pergamon press, Oxford,
England.
� Taylor S J (1994) Computer Modelling of Pyrotechnic Combustion, PhD Thesis,
Rhodes University, South Africa.
� Triblehorn M J, Venables D S and Brown M E (1995) A Thermoanalytical Study
of some Zinc-fuelled Binary Pyrotechnic Systems, Thermochimica Acta, 269/270,
649-663.
� Tulis A J (1980) Flowability Techniques in the Processing of Powdered
Explosives, Propellants and Pyrotechnics, Journal of Hazardous Materials, 4, 3-
10.
UUnniivveerrssiittyy ooff PPrreettoorriiaa eettdd –– RRiiccccoo,, II ((22000055))

13.References
13-9
� van der Avort N (1992) Pigment Dispersion for Water-based Paints and Printing
Inks, ICI Surfactants brochure, September , document 64-25E/748-191.
� Varma A, Rogachev A S, Mukasyan A S and Hwang S (1998) Combustion
Synthesis of Advanced Materials: Principles and Applications, Advances in
Chemical Engineering, 24, 79-226.
� Varma A (2000) Form from Fire, Scientific American, 283(2), 44-47.
� Veale C R (1972) Fine Powders – Preparation, Properties and Uses, Applied
Science Publishers Ltd, London.
� Wacker HDK® brochure (2000) Wacker HDK
® Fumed Silica – Thickening and
Thixotropy, Reinforcement and Free Flow, Document Edition no. 4955e3.00.
� Wang L L, Munir Z A and Maximov M (1993) Review Thermite Reactions: Their
Utilisation in the Synthesis and Processing of Materials, Journal of Material
Science, 28, 3693-3708.
� Watkins T F, Cackett J C and Hall R G (1968) Chemical Warfare, Pyrotechnics
and the Fireworks Industry, Pergamon Press, Oxford, England.
� Wolf H U (1985) Barium and Barium Compounds in Ullmann’s Encyclopedia of
Industrial Chemistry, 5th edition, vol. A3, Wolfgang G (Ed), VCH Publishers,
Weinheim, Germany.
� Yoganarasimhan S R (1988) Effects of Gas-Phase Mass Transport in the
Pyrotechnic System Red Lead-Silicon-Potassium Perchlorate, Journal of Thermal
Analysis, 34, 937-947.
� Zeulehner W, Neuer B and Rau G (1993) Silicon in Ullmann’s Encyclopedia of
Industrial Chemistry, Elvers, B. (editor), VCH Publishers, fifth revised edition,
A23, Weinheim, Germany.
� Zhao J, Huggins F E, Feng Z, Lu F, Shah N and Huffman G P (1993) Structure of
a Nanophase Iron Oxide Catalyst, Journal of Catalysis, 143, 499-509.
� Zimalco – Material Safety Data Sheet (s.a.) Supramex 2000.
UUnniivveerrssiittyy ooff PPrreettoorriiaa eettdd –– RRiiccccoo,, II ((22000055))

14.Appendices
14. APPENDICES
UUnniivveerrssiittyy ooff PPrreettoorriiaa eettdd –– RRiiccccoo,, II ((22000055))
14.Appendices
A
APPENDIX A
MATHEMATICAL MODELLING
UUnniivveerrssiittyy ooff PPrreettoorriiaa eettdd –– RRiiccccoo,, II ((22000055))

Appendix A
A-1
A1 THERMAL PROPERTIES
A1.1 Thermal Diffusivity
Hardt and Holsinger (1973) have found that despite thermal diffusivities (k/ρc) in
theory being independent of compaction pressure, values for compressed and
uncompressed powders differ by as much as an order of magnitude which they
attribute to the predominance of surface effects. They have also found that the thermal
transport properties depend also on the particle size and on the direction of
compression (Hardt and Holsinger, 1973).
A1.2 Thermal Conductivity
Parrott and Stuckes (1975:124-126) have made the following generalisations with
regards to the thermal conductivity of isotropic oxides:
� Oxides with a lower atomic weight of the cation show a higher thermal
conductivity to that of one with a higher atomic weight. This is attributed to the
increasing anharmonicity in the lattice vibrations as the atomic weight of the
cation becomes increasingly large to that of the oxygen atom.
� The apparent thermal conductivity has been shown to decrease above 300K until
about 1000K where it increases due to radiative heat transfer and
� The thermal conductivity for single crystals is higher than that of a polycrystalline
substance.
� Small quantities of impurities lower the thermal conductivity, especially around
the peak of the thermal conductivity-temperature curve.
� The addition of a second component to form a solid solution greatly decreases the
thermal conductivity. The solid solution disturbs the short range order of the
lattice and consequently the phonons responsible for heat conduction, with
wavelengths of the order of a few interatomic spacings, are effectively scattered
by such disturbances.
UUnniivveerrssiittyy ooff PPrreettoorriiaa eettdd –– RRiiccccoo,, II ((22000055))

Appendix A
A-2
Cosgrove et al (quoted by Parrott and Stuckes, 1975:126) found that the different
conditions used in crystal growth affected the thermal conductivity. A decrease was
found with decreasing freezing rate and with increasing temperature gradient at the
liquid/solid interface. This was attributed to the degree of microsegragation produced
in the crystals as the freezing conditions were changed (Parrott & Stuckes, 1975:126-
127).
In general the thermal behaviour of the heterogeneous material, unlike that of a solid
solution, lies between that of its components and depends on the volume and
distribution of each component (Parrott & Stuckes, 1975:128).
For a mixture of 2 components with the materials arranged in parallel slabs, the
relationships represented in Figure A-1 hold:
Figure A-1: Simple Parallel-slab Model (Parrott & Stuckes, 1975:130, Godbee and Ziegler, 1966b)
Heat conduction in this arrangement is predominately through the better conductor.
However, for heat flow perpendicular to the plane of the slabs the heat flow through
each component must be equal but the temperature gradient in each is different as can
be seen in Figure A-1. It is dominated by the poorer conductor and is the minimum
conductivity of the arrangement (Parrott & Stuckes, 1975:129-130).
2211(max) λφλφλ +=mix
2211
21(min) λφλφ
λλλ +=mix
Q
Q
1φ 2φ
UUnniivveerrssiittyy ooff PPrreettoorriiaa eettdd –– RRiiccccoo,, II ((22000055))

Appendix A
A-3
Porous Solids
When the thermal conductivity of the fluid is negligible compared to that of the solid,
Maxwell’s model simplifies to:
φφ
λλ
211
1
+−
=ccont
mix
Since the thermal conductivity of air is negligible, porosity levels up to 10-20%
merely reduce the observed phonon thermal conductivity. However as the pores are
not always spherical, Parrott and Stuckes (1975:133) and Taylor (1986:4921) have
found that experimental results can sometimes be fitted rather better to the equation:
( )φβλλ 21−= contmix
A limitation of this expression is that the shape of the pore is not always known.
Where the porosity exceeds 25% conduction due to the solid component is reduced by
the constriction in the heat flow paths provided by the pores. There are 4 basic heat
flow mechanisms that can interact with each other: normal solid conduction, gaseous
conduction through the pores, convective heat transfer within the pores and radiation
across the pores. Convection can in general be neglected unless the pores exceed
about 3mm in diameter; furthermore the contribution due to conduction through the
gas is small compared with the solid conductivity (Taylor, 1986:4921-4922). Heat
transfer by radiation increases as the pore size increases. As radiation has a T4
dependence, it plays an increasingly active role at high temperatures. The thermal
conductivity will decrease with increasing proportions of glass, liquid and pores
although it will start to increase at very high porosities due to the increasing effect of
radiative heat transfer (Parrott & Stuckes, 1975:133-134).
Powders
The thermal conductivity of powders is very dependent on the physical texture. For
porous samples the low values of thermal conductivity which are obtained are due to
the presence of air and also the constriction to heat flow in the solid path at contacts
between grains or fibres. Carbon black has a thermal conductivity lower than air due
to the presence of a large volume of pores smaller than the mean free path of air
molecules. In general, the smaller the particle size, the lower the conductivity. None
UUnniivveerrssiittyy ooff PPrreettoorriiaa eettdd –– RRiiccccoo,, II ((22000055))
Appendix A
A-4
of the theoretical models proposed above have good agreement with experimental
results as they are too low at room temperature and the experimental conductivities
will increase more rapidly with temperature than the model predicts owing to neglect
of radiative heat transfer through the air spaces. Lausitz (quoted by Parrott & Stuckes,
1975:145) has commented that although the mathematics is exact, the models used are
artificial and radically depart from real powders (Parrott & Stuckes, 1975:144-145).
According to Veale (1972:139) the thermal conductivity of an agglomerated powder
in a gas can be calculated by assuming that the heat is transferred by conduction
through the solid, by conduction through the gas and by particle to particle radiation.
For fine powders, conduction is small owing to the small contact areas between the
particles, although these areas may be somewhat increased by the presence of
adsorbed layers or preferential condensation of liquid into the saddles between
particles. Conductivity is independent of gas pressure as long as the mean free path of
the gas molecule is less than the interparticle spacing (Veale, 1972:139-140).
Beck (1984) has used the models proposed by Maxwell and Rayleigh, Russel, Webb,
Gorring and Churchill and Kunii and Smith to predict the thermal conductivity of
Sb/KMnO4 (quoted in Beck, 1984). He found that the model of Kunii and Smith gave
reasonable results.
UUnniivveerrssiittyy ooff PPrreettoorriiaa eettdd –– RRiiccccoo,, II ((22000055))

Appendix A
A-5
A2. EXTRACTION OF KINETIC PARAMETERS AND
COMBUSTION MODELLING
A number of authors have attempted to mathematically model the combustion wave
with mixed success. The earliest theory was based on the Mallard-Le Chatelier theory
of propagation, i.e. )(2
af TTbc
Qv
−=
ρλ
(Quoted by Beck, 1984).
Snegirev and Talalov (1991) have outlined a procedure for recovering kinetic
parameters from data of firing a pyrotechnic mixture by an incandescent surface at a
constant temperature. They have stated, however, that the combustion time can not be
calculated using the kinetic parameters which they derived for the Si-Pb3O4
composition as they have not considered the increase in retarding effect of a SiO2
layer on the Si particles, kinetics of the Pb3O4 decomposition and the transport
oxidising agent to the zone of combustible material oxidation.
A2.1 Leeds Method for Gasless Pyrotechnic Reactions
Boddington et al (1982, 1986) have derived a model for the analysis of temperature
profiles for gasless pyrotechnics to obtain information regarding the adiabatic
temperature rise and the local instantaneous rate of heat evolution. The model is one
of a long cylinder of gasless pyrotechnic mixture, initially and finally at ambient
temperature Ta. They have assumed that the temperature excess U=T-Ta over a cross
section normal to the axis of propagation is given by:
01* =−+− −
thttt UtGUUt
The time 2*
cvt
ρλ= is the rise time of the inert forewave of the profile in the
absence of lateral heat transfer. hc
t thρ= is the thermal relaxation time of the system
due to lateral heat transfer. cwG = is a measure of the local thermal power arising
from the heat effects of all the chemical and phase changes. The model is based on the
UUnniivveerrssiittyy ooff PPrreettoorriiaa eettdd –– RRiiccccoo,, II ((22000055))

Appendix A
A-6
assumption that the density, thermal conductivity, specific heat capacity etc. are
independent of temperature. This model has been further developed by Boddington et
al (1989, 1990) to allow for a more complex rate law to describe the reaction kinetics
at low temperatures and where the global approach used previously predicted too
great a reaction rate and to allow for heat loss. The approach is to combine a high
temperature diffusion term with an Arrhenius temperature dependence that determines
the behaviour at lower temperatures. A limitation of the model is that it makes no
allowance for phase changes and is pseudo-one-dimensional (Boddington et al, 1989
and 1990).
Drennan and Brown (1992b), Rugunanan and Brown (1994a,b,c), Rugunanan (1991)
Beck (1984) have used this method for the extraction of kinetic parameters for binary
and ternary mixtures.
A2.2 Combustion Synthesis Reaction Modelling
Munir (1988) has proposed the following equation to calculate the velocity of the
combustion front for SHS reactions:
−=RT
EK
E
RT
Q
cdnfv o
c exp)(
2
2
where f(n) is a function of the kinetic order n and T the absolute temperature.
The equation was derived with the following assumptions:
� The thermophysical properties of the product are not strong functions of
temperature.
� Convective and radiative heat losses are negligible.
� The width of the reaction zone is narrow in comparison with the thermally
affected zone (Munir, 1988).
UUnniivveerrssiittyy ooff PPrreettoorriiaa eettdd –– RRiiccccoo,, II ((22000055))

Appendix A
A-7
Varma et al (1998) on the other hand have proposed the following equations for the
combustion wave velocity in gasless systems:
� For a zero order reaction:
−=
c
oc
RT
EK
E
RT
Qv exp
22
2
ρλ
� For n’th order type kinetics, Varma et al (1998) have proposed:
−
−=
c
oc
RT
EK
E
RT
Q
nv exp
)2(2
2
ρλ
This equation is not valid for n≥2, since it leads to zero (n=2) and imaginary values
of velocity for n>2). The origin of this discrepancy is that when the dependence of
reaction rate on conversion is sufficiently strong (e.g. for higher order reactions), the
reaction rate away from the adiabatic combustion temperature may also be significant.
Khaikan and Merzahanov (quoted by Varma et al, 1998) derived the following
equation for n’th order kinetics:
−
+Γ=−
c
o
c
nn
RT
EK
E
RT
Qe
nnv exp
21
22
242
1
2
2
ρλ
where ∫∞
−−=Γ0
1)( dttez
zt is the gamma function.
These equations were based on the following assumptions:
� The Lewis number is very small i.e. 1<<<=αD
Le . This means that heat
conduction occurs much faster than mass diffusion and therefore mass diffusion at
a macroscopic scale may be neglected and an average concentration of the
reactants in any local region may be used. Density, thermal conductivity and heat
capacity are an average of the reactant and product values.
� The temperature and concentration profiles do not change with time (constant
pattern propagation).
� There is no heat loss.
� There is one chemical reaction.
� The rate of heat evolution is neglected everywhere except in the narrow zone near
Tc (narrow zone approximation) (Varma et al, 1998).
UUnniivveerrssiittyy ooff PPrreettoorriiaa eettdd –– RRiiccccoo,, II ((22000055))

Appendix A
A-8
This theory applies mainly to kinetic-controlled reactions, but reactions involve many
processes. Merzanhov (quoted by Varma et al, 1998) compared experimental data
with combustion equations for various types of heat sources and concluded that the
combustion wave velocity can be represented as follows:
−=*
**2exp),(
RT
ETAv η
Where T* and η* are the values of temperature and corresponding conversion which
control the combustion front propagation and A(T*,η
*) is a function weaker than the
exponential. Merzhanov (quoted by Varma et al, 1998) identified 4 types of
combustion:
� Combustion with a thin reaction zone (Figure A-2). η*=1,
c
QTTT oc +≈=*
Figure A-2: Temperature Profile for Combustion with a Thin Reaction Zone (Varma et al, 1998)
� Combustion with a wide zone which occurs when a product layer strongly inhibits
the reaction (Figure A-3). ** η
c
QTT o += , where η
* is determined from:
0),(),( ****
=∂
∂+
∂∂
ηηφηφ T
T
T
c
Q
T*
UUnniivveerrssiittyy ooff PPrreettoorriiaa eettdd –– RRiiccccoo,, II ((22000055))

Appendix A
A-9
Figure A-3: Temperature Profile for Combustion with a Wide Reaction Zone (Varma et al, 1998)
� Combustion with phase transformations (Figure A-4). T*=Tm (melting point) and
−=
cQ
TT om )(*η .
Figure A-4: Temperature Profile for Combustion with Phase Transformations (Varma et al, 1998)
� Combustion with multistage spatially separated reactions (Figure A-5). η*1= 1 and
+≈c
QTT o
1* where the subscript refers to the first low temperature stage of the
complex reaction (Varma et al, 1998).
T*
T*
UUnniivveerrssiittyy ooff PPrreettoorriiaa eettdd –– RRiiccccoo,, II ((22000055))

Appendix A
A-10
Figure A-5: Temperature Profile for Combustion with Multistage Spatially Separated Reactions
(Varma et al, 1998)
Varma et al (1998) have further proposed that the temperature profile in the
preheating zone be described by:
−+= xv
TTTT oco αexp)( where 0≤x and
vxT
α= denotes the characteristic
length scale of the combustion wave. The temperature profile in the reaction zone is
equal to the combustion temperature.
A2.2.1 Mictrostructural Models
Microstructural models have been developed to account for reactant particle size and
distribution, product layer thickness etc and correlate them with the combustion
temperature and velocity. The equations used are similar to those in the previous
section. However the kinetics of heat release may be controlled by phenomena such as
diffusion through a product layer of melting or spreading of reactants. These
phenomena often have Arrenhius-type dependencies. The dependence of velocity on
particle size has been described as: )()( TFdfv = (Varma et al, 1998)
Four reaction cell geometries have been used in the theoretical models (Varma et al,
1998). These include:
T*
UUnniivveerrssiittyy ooff PPrreettoorriiaa eettdd –– RRiiccccoo,, II ((22000055))
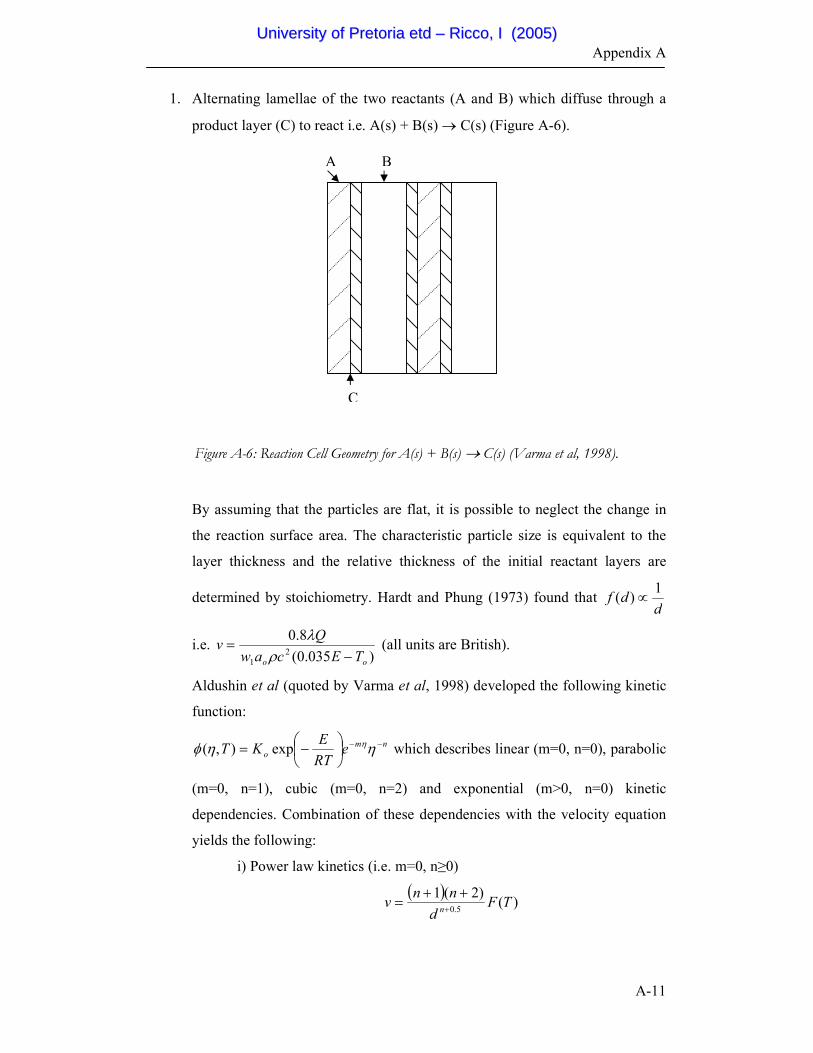
Appendix A
A-11
1. Alternating lamellae of the two reactants (A and B) which diffuse through a
product layer (C) to react i.e. A(s) + B(s) → C(s) (Figure A-6).
Figure A-6: Reaction Cell Geometry for A(s) + B(s) → C(s) (Varma et al, 1998).
By assuming that the particles are flat, it is possible to neglect the change in
the reaction surface area. The characteristic particle size is equivalent to the
layer thickness and the relative thickness of the initial reactant layers are
determined by stoichiometry. Hardt and Phung (1973) found that d
df1
)( ∝
i.e. )035.0(
8.02
1 oo TEcaw
Qv
−=
ρλ
(all units are British).
Aldushin et al (quoted by Varma et al, 1998) developed the following kinetic
function:
nm
o eRT
EKT
−−
−= ηηφ ηexp),( which describes linear (m=0, n=0), parabolic
(m=0, n=1), cubic (m=0, n=2) and exponential (m>0, n=0) kinetic
dependencies. Combination of these dependencies with the velocity equation
yields the following:
i) Power law kinetics (i.e. m=0, n≥0)
( ))(
)2(15.0
TFd
nnv
n+
++=
A
C
B
UUnniivveerrssiittyy ooff PPrreettoorriiaa eettdd –– RRiiccccoo,, II ((22000055))

Appendix A
A-12
ii) Exponential kinetics (i.e. m>0, n=0)
)()1(
2
TFdme
mv
m −−=
For a unimodal particle size distribution with particle size distribution
function, χ(d) the effective diameter can be calculation using
5.02max
min
)(
= ∫d
deff ddddd χ and used in the above expressions in place of d. For
a bimodal distribution, the combustion wave has a two stage structure similar
to Figure A1-5, where two combustion fronts propagate in sequence. Using
effective particle sizes for fine (d1) and coarse (d2) particles the velocity
dependence for the leading combustion front is described by:
[ ] 5.0
1
2
21
2
1 )1(
)(
mdmd
TFU
−+= where m1 is the mass fraction of finer particles
(Varma et al, 1998).
2. A spherical particle of one reactant (B) is surrounded by a melt of the other
reactant (A) and a solid product layer (C) grows on the surface of the particle
with the molten reactant diffusing through the product layer i.e.
A(l)+B(s)→C(s) (Figure A-7). At a given temperature the concentrations at
the interphase boundaries are determined from the phase diagrams of the
system (Varma et al, 1998).
Figure A-7: Reaction Cell Geometry for A(l) + B(s) → C(s) (Varma et al, 1998)
B
A C
UUnniivveerrssiittyy ooff PPrreettoorriiaa eettdd –– RRiiccccoo,, II ((22000055))

Appendix A
A-13
3. Similar to the second cell geometry except that the solid reactant diffuses
through an initial product layer to the melt and a liquid product is formed
which crystallises in the in the volume of the melt after saturation i.e.
A(l)+B(s)→C(l) (Figure A-8). The initial product layer’s thickness is assumed
to remain constant. Cao and Varma (quoted by Varma et al, 1998) reported the
combustion wave velocity as being )(121
5.0
TFdd
U
+=δ
where δ is the
thickness of the initial product layer.
Figure A-8: Reaction Cell Geometry for A(l) + B(s) → C(l) (Varma et al, 1998)
4. Both reactants melt and the liquid product forms in the reaction zone i.e.
A(l)+B(l)→C(l) (Varma et al, 1998) (Figure A-9). After both reactants melt,
their interdiffusion and the formations of a liquid product occur
simultaneously. In the kinetic-limiting case, for a stoichiometric mixture of
reactants (A and B) the propagation velocity does not depend on the initial
reactant particle sizes. For diffusion-controlled reactions the velocity is
)(1 TFd
bv = where
1 if d<dBst
b1=
AA
BB
rcMWv
MWv
dD
d33
3
− if d>dB
st
dBst is the diameter of reactant B in a corresponding stoichiometric mixture
and Drc is diameter of the reaction cell.
B
A+C δ
ABx
UUnniivveerrssiittyy ooff PPrreettoorriiaa eettdd –– RRiiccccoo,, II ((22000055))

Appendix A
A-14
Figure A-9: Reaction Cell Geometry for A(l) + B(l) → C(l) (Varma et al, 1998)
2.2.2 Cellular Models
For cellular models, the reaction medium is divided into a discrete matrix of cells,
where the temperature and effective properties are assumed to be uniform throughout
the cell. The difference between cellular models and finite difference/element models
is that the latter are finite approximations of continuous equations with the implicit
assumption that the width of the reaction zone is larger than other length scales
(diffusion, heterogeneity of medium etc.). Cellular models have no such assumptions
and the local transport processes in a heterogeneous medium is accounted for. Varma
et al (1998) provide a description of the cellular models which have been reported in
literature.
A2.3 Combustion with Gaseous Reaction Products
Varma et al (1998) describe the various models which have been derived for filtration
combustion, i.e. gas-solid reactions. These models will not be discussed here as they
involve the addition of a gaseous reactant which is not the case for pyrotechnic delay
reactions, where both reactants are initially solids. However, the model proposed by
A+C
B
δ
Drc
UUnniivveerrssiittyy ooff PPrreettoorriiaa eettdd –– RRiiccccoo,, II ((22000055))
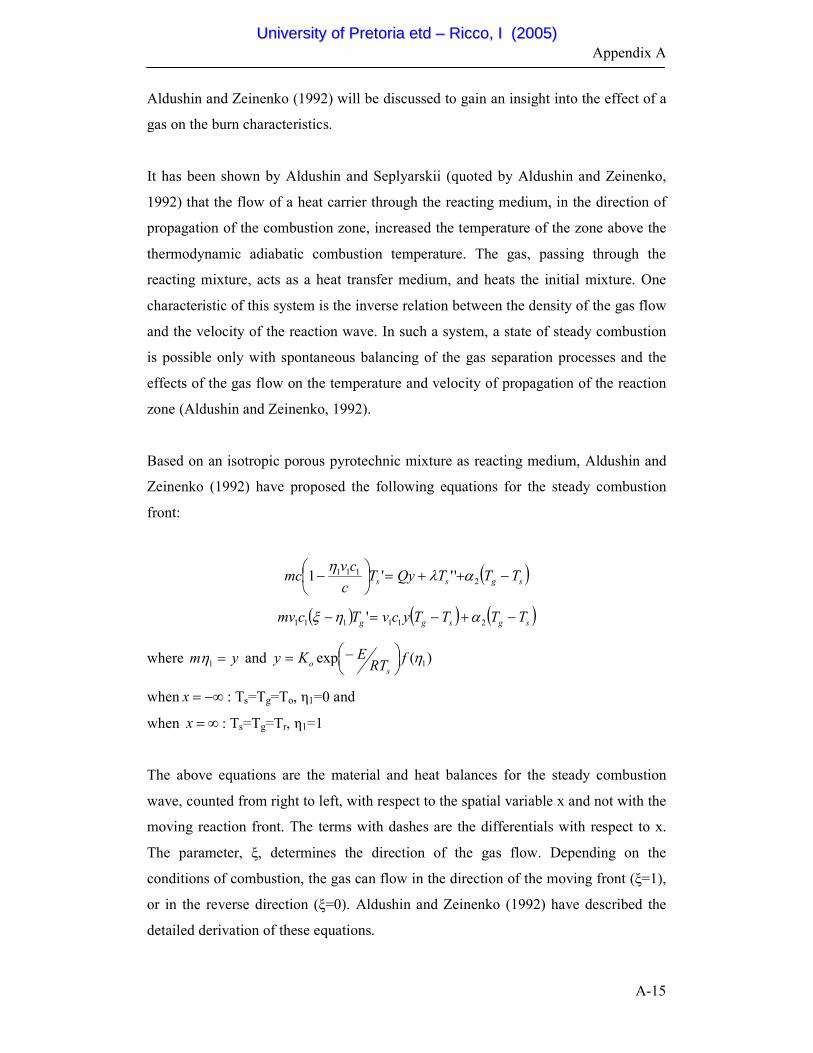
Appendix A
A-15
Aldushin and Zeinenko (1992) will be discussed to gain an insight into the effect of a
gas on the burn characteristics.
It has been shown by Aldushin and Seplyarskii (quoted by Aldushin and Zeinenko,
1992) that the flow of a heat carrier through the reacting medium, in the direction of
propagation of the combustion zone, increased the temperature of the zone above the
thermodynamic adiabatic combustion temperature. The gas, passing through the
reacting mixture, acts as a heat transfer medium, and heats the initial mixture. One
characteristic of this system is the inverse relation between the density of the gas flow
and the velocity of the reaction wave. In such a system, a state of steady combustion
is possible only with spontaneous balancing of the gas separation processes and the
effects of the gas flow on the temperature and velocity of propagation of the reaction
zone (Aldushin and Zeinenko, 1992).
Based on an isotropic porous pyrotechnic mixture as reacting medium, Aldushin and
Zeinenko (1992) have proposed the following equations for the steady combustion
front:
( )sgss TTTQyT
c
cvmc −++=
− 2
111 '''1 αλη
( ) ( ) ( )sgsgg TTTTycvTcmv −+−=− 211111 ' αηξ
where ym =1η and )(exp 1ηfRTEKy
so
−=
when −∞=x : Ts=Tg=To, η1=0 and
when ∞=x : Ts=Tg=Tr, η1=1
The above equations are the material and heat balances for the steady combustion
wave, counted from right to left, with respect to the spatial variable x and not with the
moving reaction front. The terms with dashes are the differentials with respect to x.
The parameter, ξ, determines the direction of the gas flow. Depending on the
conditions of combustion, the gas can flow in the direction of the moving front (ξ=1),
or in the reverse direction (ξ=0). Aldushin and Zeinenko (1992) have described the
detailed derivation of these equations.
UUnniivveerrssiittyy ooff PPrreettoorriiaa eettdd –– RRiiccccoo,, II ((22000055))
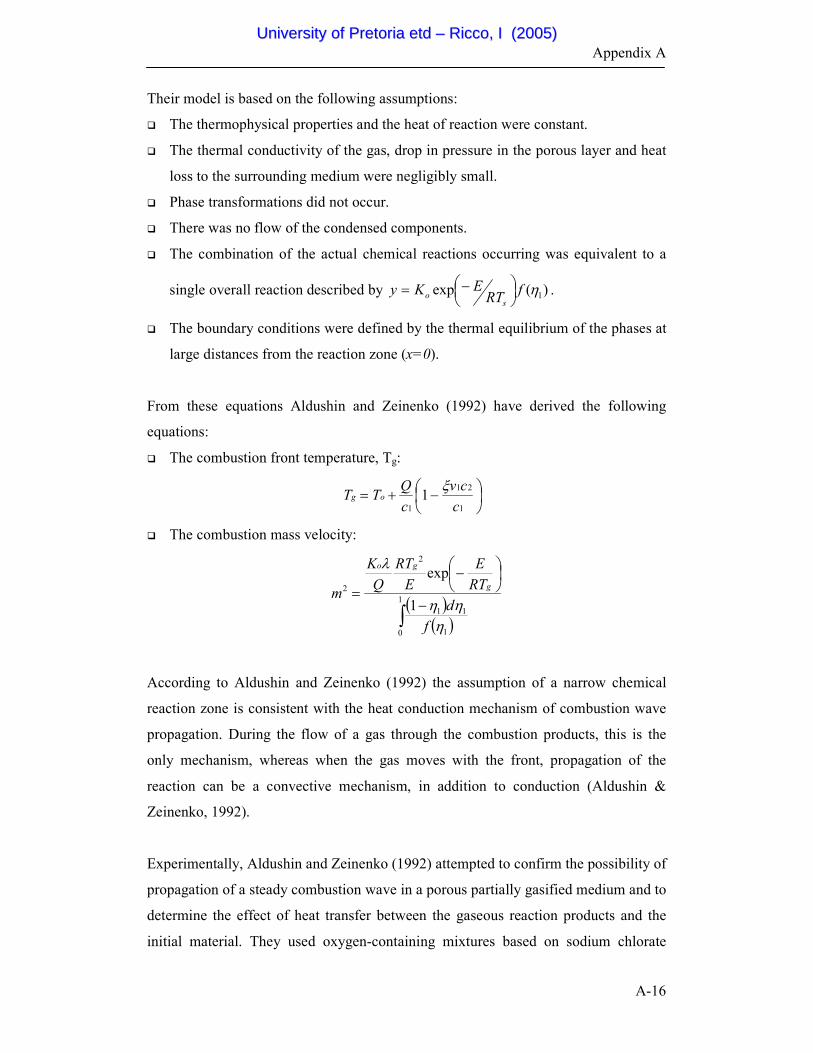
Appendix A
A-16
Their model is based on the following assumptions:
� The thermophysical properties and the heat of reaction were constant.
� The thermal conductivity of the gas, drop in pressure in the porous layer and heat
loss to the surrounding medium were negligibly small.
� Phase transformations did not occur.
� There was no flow of the condensed components.
� The combination of the actual chemical reactions occurring was equivalent to a
single overall reaction described by )(exp 1ηfRTEKy
so
−= .
� The boundary conditions were defined by the thermal equilibrium of the phases at
large distances from the reaction zone (x=0).
From these equations Aldushin and Zeinenko (1992) have derived the following
equations:
� The combustion front temperature, Tg:
−+=1
21
1
1c
cv
c
QTT og
ξ
� The combustion mass velocity:
( )( )∫
−
−=
1
0 1
11
2
2
1
exp
ηηη
λ
f
d
RT
E
E
RT
Q
K
mg
go
According to Aldushin and Zeinenko (1992) the assumption of a narrow chemical
reaction zone is consistent with the heat conduction mechanism of combustion wave
propagation. During the flow of a gas through the combustion products, this is the
only mechanism, whereas when the gas moves with the front, propagation of the
reaction can be a convective mechanism, in addition to conduction (Aldushin &
Zeinenko, 1992).
Experimentally, Aldushin and Zeinenko (1992) attempted to confirm the possibility of
propagation of a steady combustion wave in a porous partially gasified medium and to
determine the effect of heat transfer between the gaseous reaction products and the
initial material. They used oxygen-containing mixtures based on sodium chlorate
UUnniivveerrssiittyy ooff PPrreettoorriiaa eettdd –– RRiiccccoo,, II ((22000055))

Appendix A
A-17
granules. They found that when the flow of the generated oxygen was in the direction
of the moving front, the maximum temperature exceeded the combustion front
temperature of the products, without taking into account the heat transfer from the
gaseous reaction products, but did not exceed the theoretical combustion temperature
because of heat losses and the low mass velocity of steady combustion. Furthermore
they found that mixtures that burned at a stable constant rate when ξ=0 burned at a
progressively increasing rate when ξ=1. Also, a change in the direction of low for
mixtures which were not capable of stable propagation under normal conditions, led
to the stabilisation of the combustion. This leads to the assumption that for highly
concentrated fuel or compositions of low activity, the change in the direction of gas
flow causes the heat transfer mechanism to change. They thus confirmed using the
above model experimentally that a steady combustion wave can exist in a porous
reacting media composed of chemical sources of pure gases when the gaseous
reaction products heat the original material. In this study they have found that the
temperature of combustion increases with increasing mass fraction and heat capacity
of the released gas and exceeds the adiabatic combustion temperature of the material
(Aldushin & Zeinenko, 1992).
Nosgrove et al (1991) proposed a model to study the effects of gas production on
pyrotechnic compositions. Their model is based on the following assumptions:
� The flow is one-dimensional so that all the variables depend only x the distance
down the delay element and on t, the time. This assumption is poor as it neglects
heat losses into the detonator wall which is not one-dimensional.
� The temperature of the reacting solid is the same as that of the gas.
� The gas which is released flows under the action of the local pressure gradient
according to Darcy’s law, but the reacted solid does not move. This implies that
permeability is uniform throughout the element length, but the permeability is
sensitive to the structure and void fraction of the porous medium which changes
as the reaction proceeds.
� Transfer of heat by radiation between the fuel particles may be neglected.
� The gas is an ideal gas.
The resultant equations are:
� Flame Temperature:
UUnniivveerrssiittyy ooff PPrreettoorriiaa eettdd –– RRiiccccoo,, II ((22000055))
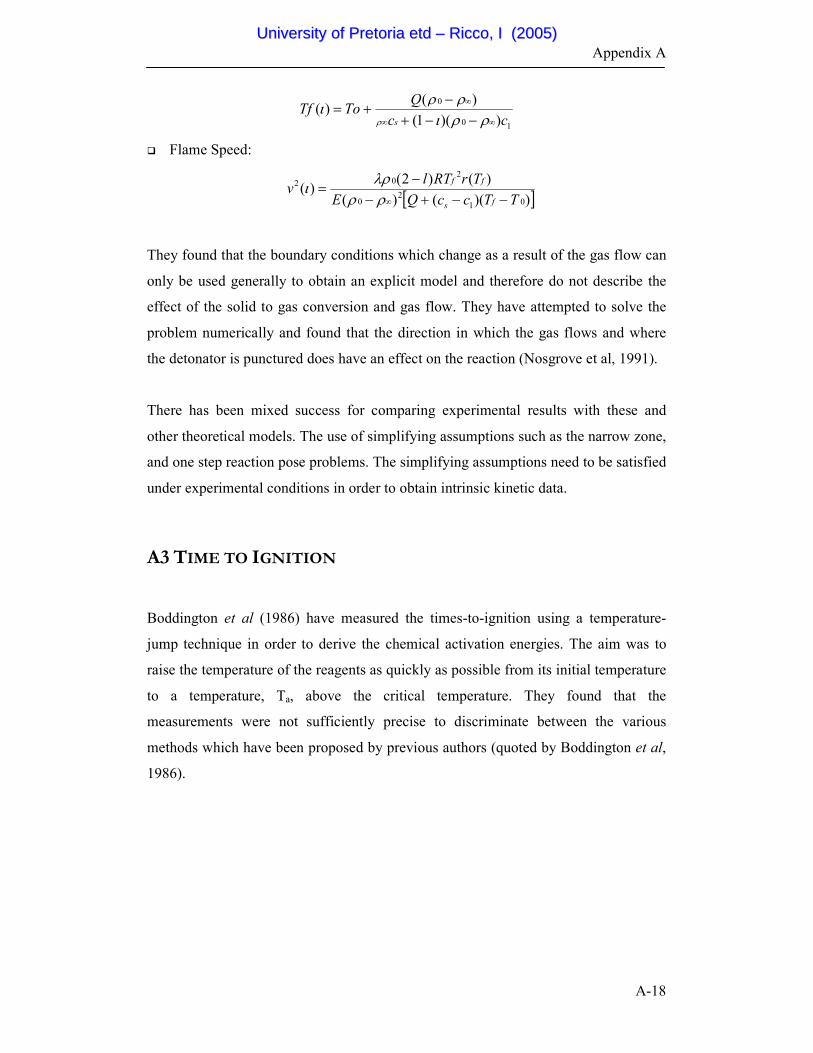
Appendix A
A-18
10
0
))(1(
)()(
cc
QToTf
s ∞∞
∞
−−+−
+=ρρι
ρρι
ρ
� Flame Speed:
[ ]))(()(
)()2()(
01
20
202
TTccQE
TrRTlv
fs
ff
−−+−−
=∞ρρ
λρι
They found that the boundary conditions which change as a result of the gas flow can
only be used generally to obtain an explicit model and therefore do not describe the
effect of the solid to gas conversion and gas flow. They have attempted to solve the
problem numerically and found that the direction in which the gas flows and where
the detonator is punctured does have an effect on the reaction (Nosgrove et al, 1991).
There has been mixed success for comparing experimental results with these and
other theoretical models. The use of simplifying assumptions such as the narrow zone,
and one step reaction pose problems. The simplifying assumptions need to be satisfied
under experimental conditions in order to obtain intrinsic kinetic data.
A3 TIME TO IGNITION
Boddington et al (1986) have measured the times-to-ignition using a temperature-
jump technique in order to derive the chemical activation energies. The aim was to
raise the temperature of the reagents as quickly as possible from its initial temperature
to a temperature, Ta, above the critical temperature. They found that the
measurements were not sufficiently precise to discriminate between the various
methods which have been proposed by previous authors (quoted by Boddington et al,
1986).
UUnniivveerrssiittyy ooff PPrreettoorriiaa eettdd –– RRiiccccoo,, II ((22000055))

Appendix A
A-19
A4 COMPUTER MODELLING
Taylor (1994) attempted to use computer modelling to complement the existing
experimental techniques used to analyse pyrotechnic compositions. A detailed
discussion of his work will not be discussed here.
In summation, Taylor (1994) found the following:
� The one-dimensional model used a simple model (Heat loss through the sides of
the column is negligible, heat loss through ends is described by Biot number) and
of the column with temperature being calculated at each node at each time step
using an explicit method. The method depended on the availability of good kinetic
data. It would be beneficial to implement for quick evaluation of compositions.
� The two-dimensional model allows for heat loss and stipulating surrounding
material. It had the added advantage of being able to obtain fringe and contour
plots and temperature gradients. The model was limited by the quality of the
available kinetic data and available computation time.
� The particle-packing model was based on the assumption that the fuel and oxidant
particles both had uniform but different radii and that all the particles were
spherical.
� The Monte Carlo method incorporated the effect of random packing of the
particles on the burn speed.
He recommended that future models allow for the introduction of temperature
dependence of properties such as heat capacity etc., non-homogeneous material in the
composition (additives), direct incorporation of variables such as compaction and
composition and improvement in the models used for kinetic analysis of experimental
temperature profiles (Taylor, 1994).
UUnniivveerrssiittyy ooff PPrreettoorriiaa eettdd –– RRiiccccoo,, II ((22000055))

14.Appendices
B
APPENDIX B
EFFECT OF VARYING DATA FILTRATION PARAMETER
UUnniivveerrssiittyy ooff PPrreettoorriiaa eettdd –– RRiiccccoo,, II ((22000055))

14.Appendices
C
APPENDIX C
CALCULATION OF THERMOCHEMICAL REACTION
PROPERTIES
UUnniivveerrssiittyy ooff PPrreettoorriiaa eettdd –– RRiiccccoo,, II ((22000055))
14.Appendices
D
APPENDIX D
XRD AND XRF ANALYSIS OF CUO
UUnniivveerrssiittyy ooff PPrreettoorriiaa eettdd –– RRiiccccoo,, II ((22000055))
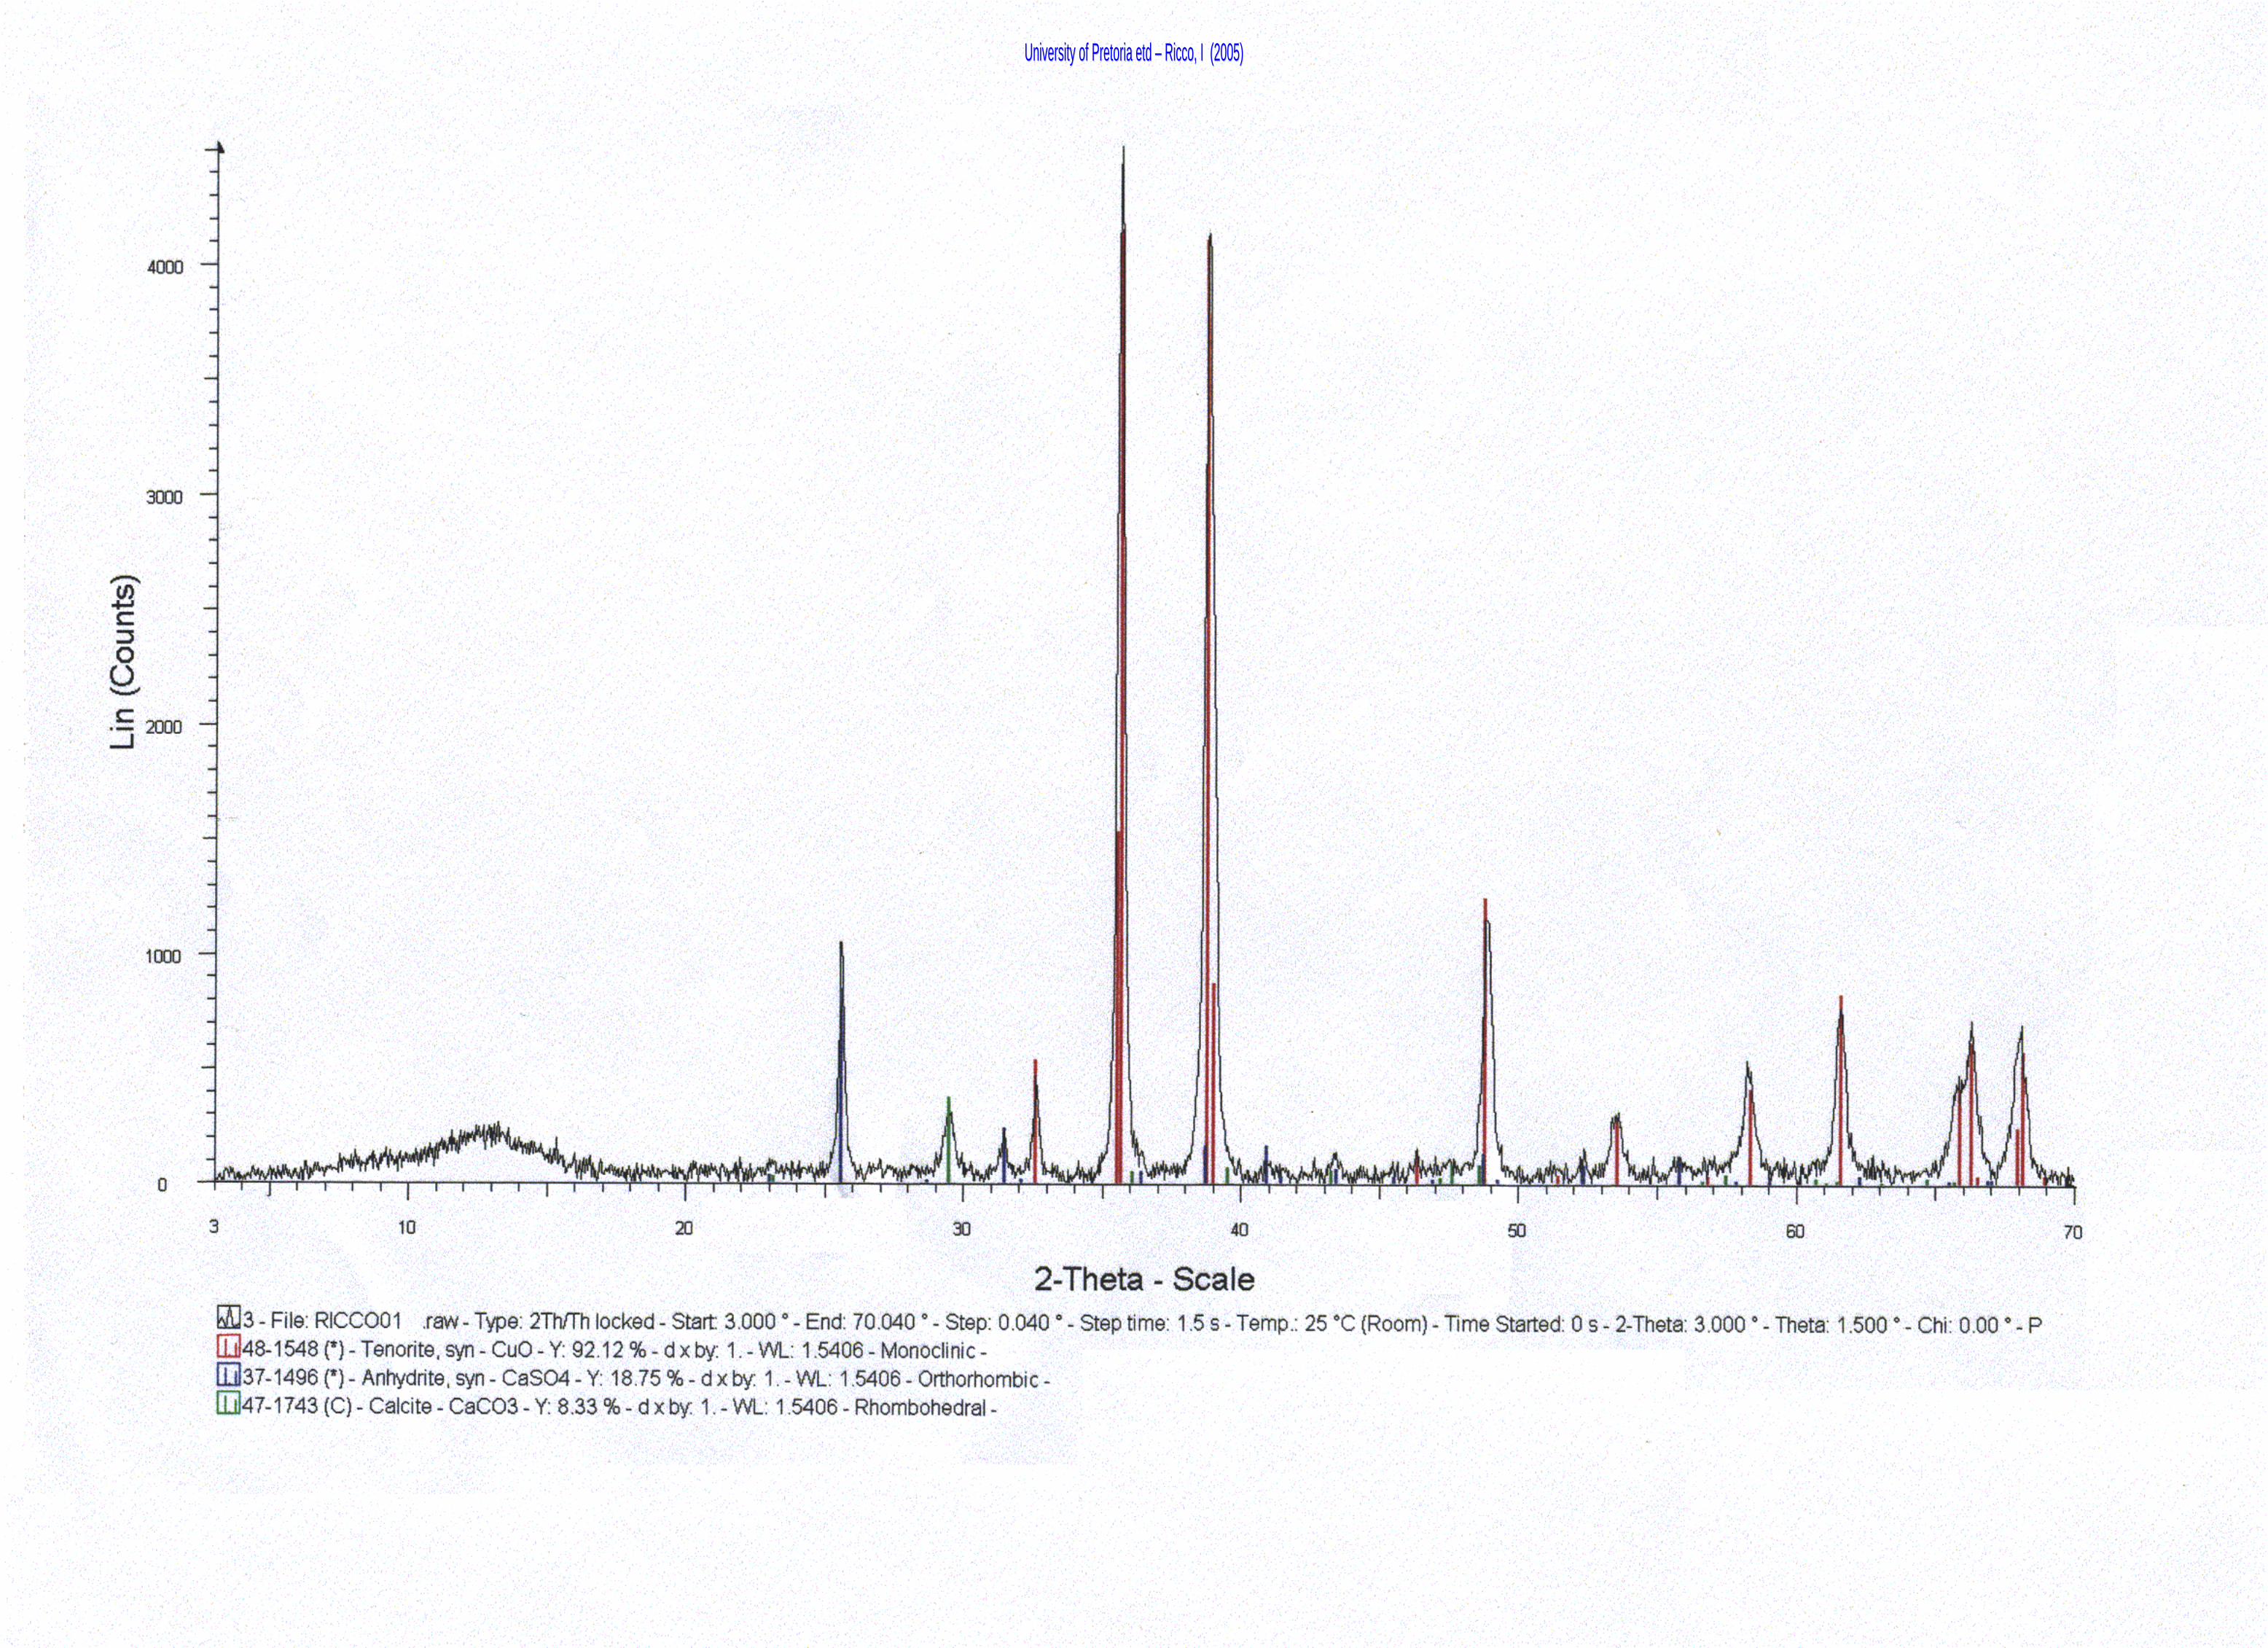
UUnniivveerrssiittyy ooff PPrreettoorriiaa eettdd –– RRiiccccoo,, II ((22000055))

UUnniivveerrssiittyy ooff PPrreettoorriiaa eettdd –– RRiiccccoo,, II ((22000055))

14.Appendices
E
APPENDIX E
BURN RATE MEASUREMENTS FOR INITIAL TRIALS
UUnniivveerrssiittyy ooff PPrreettoorriiaa eettdd –– RRiiccccoo,, II ((22000055))

Page 1
All burn speeds are in mm/s. All runs under 1 were run in Nov 01 and all runs under 2 were run Feb. 02. The samples of PbCrO4 were lost
A) CuO and Si
mm Comment
Burn
speed mm Comment
Burn
Speed
Shock Tube 25.309 4.691 15.63667 Did not ignite 4 Mixture Failure 10 Shock Tube Failure
Starter 5
Mixture Failure, heat
due to starter element 10
Mixture Failure, heat
due to starter element
B) MnO2 and Si
mm Comment
Burn
speed mm Comment
Burn
Speed
Shock Tube 17.218 2.789 13.94012 Burnt with sealer, 5 Mixture Failure 10 Shock Tube Failure
Starter Burnt with sealer and starter 5
Mixture Failure, heat
due to starter element 10
Mixture Failure, heat
due to starter element
C) CuO.MnO2 (Prepared by Serei) and Si
mm Comment
Burn
speed mm Comment
Burn
Speed
Shock Tube Did not ignite 5 Mixture Failure 10 Shock Tube Failure
Starter 5
Mixture Failure, heat
due to starter element 10
Mixture Failure, heat
due to starter element
D) Cu(SbO2)2 (Prepared by Serei) and Si
mm Comment
Burn
speed mm Comment
Burn
Speed
Shock Tube Burnt with sealer, 5 Mixture Failure 10 Shock Tube Failure
Starter Burnt with sealer and starter 5 Burnt 9 5 Burnt 25
2
2
2
2
1
Fuel:total
mass ratio AEL tests
1
AEL tests
Fuel:Total
mass ratioMass Si
Mass
oxidant
Method of
intitiation
Method of
intitiation
Mass
oxidant Mass Si
Method of
intitiation
Mass
oxidant Mass Si
Fuel:total
mass ratio
Method of
intitiation
Mass
oxidant Mass Si
Fuel:total
mass ratio
AEL tests
1
AEL tests
1
Appendix E
UUnniivveerrssiittyy ooff PPrreettoorriiaa eettdd –– RRiiccccoo,, II ((22000055))

Page 2
E) CuO.Fe2O3 (Prepared by Serei) and Si
mm Comment
Burn
speed mm Comment
Burn
Speed
Shock Tube Did not ignite 4 Mixture Failure 10 Mixture Failure
Starter 4
Mixture Failure, heat
due to starter element 10
Mixture Failure, heat
due to starter element
F) Fe2O3 and Si
mm Comment
Burn
speed mm Comment
Burn
Speed
Shock Tube 9.161 0.808 8.105126 Did not ignite 5 Mixture Failure 5 Mixture Failure
Starter 5
Mixture Failure, heat
due to starter element 5
Mixture Failure, heat
due to starter element
G) Fe3O4 and Si
mm Comment
Burn
speed mm Comment
Burn
Speed
Shock Tube 18.855 1.14 5.701425 Did not ignite 5 Mixture Failure 5 Mixture Failure
Starter 5
Mixture Failure, heat
due to E element 5
Mixture Failure, heat
due to E element
H) Fused V2O5 and Si
mm Comment
Burn
speed mm Comment
Burn
Speed
Shock Tube 18.571 1.435 7.172848 Did not ignite 5 Mixture Failure 5 Mixture Failure
Starter 5
Mixture Failure, heat
due to starter element 5
Mixture Failure, heat
due to starter element
2
2
2
2
AEL tests
1
AEL tests
1
Method of
intitiation
Mass
oxidant
Method of
intitiation
Mass
oxidant Mass Si
Fuel:total
mass ratio
Mass Si
Fuel:total
mass ratio
Method of
intitiation
Mass
oxidant Mass Si
Fuel:total
mass ratio
Method of
intitiation
Mass
oxidant Mass Si
Fuel:total
mass ratio
AEL tests
1
AEL tests
1
Appendix E
UUnniivveerrssiittyy ooff PPrreettoorriiaa eettdd –– RRiiccccoo,, II ((22000055))

Page 3
I) Deamm V2O5 and Si
mm Comment
Burn
speed mm Comment
Burn
Speed
Shock Tube 18.561 1.438 7.19036 Did not ignite 5 Mixture Failure 5 Mixture Failure
Starter 4
Mixture Failure, heat
due to starter element 5
Mixture Failure, heat
due to starter element
J) Sb2O3 and Si
mm Comment
Burn
speed mm Comment
Burn
Speed
Shock Tube 17.479 2.539 12.68358 Burnt with starter and sealer 10 Shock Tube Failure 5 Mixture Failure
Starter 4.5 Burnt 3 5 Burnt 2
2
2
AEL tests
1
AEL tests
1
Method of
intitiation
Mass
oxidant
Method of
intitiation
Mass
oxidant Mass Si
Fuel:total
mass ratio
Mass Si
Fuel:total
mass ratio
Appendix E
UUnniivveerrssiittyy ooff PPrreettoorriiaa eettdd –– RRiiccccoo,, II ((22000055))

14.Appendices
F
APPENDIX F
VARYING STOICHIOMETRY
EXPERIMENTAL DATA FOR TUMBLE MIXED COMPOSITIONS
UUnniivveerrssiittyy ooff PPrreettoorriiaa eettdd –– RRiiccccoo,, II ((22000055))
14.Appendices
G
APPENDIX G
VARYING STOICHIOMETRY
EXPERIMENTAL DATA FOR TUMBLE AND BRUSH MIXED
COMPOSITIONS
UUnniivveerrssiittyy ooff PPrreettoorriiaa eettdd –– RRiiccccoo,, II ((22000055))

14.Appendices
H
APPENDIX H
VARYING STOICHIOMETRY AND SILICON PARTICLE SIZE
EXPERIMENTAL DATA
UUnniivveerrssiittyy ooff PPrreettoorriiaa eettdd –– RRiiccccoo,, II ((22000055))

14.Appendices
I
APPENDIX I
VARYING OXIDANT PARTICLE SIZE
EXPERIMENTAL DATA
UUnniivveerrssiittyy ooff PPrreettoorriiaa eettdd –– RRiiccccoo,, II ((22000055))

14.Appendices
J
APPENDIX J
ALUMINIUM ADDITION
EXPERIMENTAL DATA
UUnniivveerrssiittyy ooff PPrreettoorriiaa eettdd –– RRiiccccoo,, II ((22000055))
14.Appendices
K
APPENDIX K
FUMED SILICA ADDITION
EXPERIMENTAL DATA
UUnniivveerrssiittyy ooff PPrreettoorriiaa eettdd –– RRiiccccoo,, II ((22000055))

14.Appendices
L
APPENDIX L
THE USE OF DISPERSIONS AS A PROCESSING ROUTE
PROPOSAL
UUnniivveerrssiittyy ooff PPrreettoorriiaa eettdd –– RRiiccccoo,, II ((22000055))

Appendix L
L-1
L1 DISPERSIONS AND DISPERSANTS
Dispersions occur when two or more phases are insoluble or slightly soluble and are
dispersed in one another. The continuous or external phase is termed the dispersion
medium while the substance distributed in it is termed the internal or dispersed phase
(Heusch, 1993:577).
The energy required to produce a dispersion increases with decreasing particle size
because their surface area increase and the energy (W) is directly proportional to the
surface area (S), i.e.:
dSdW 11 γ=
From the equation, it can be seen that as the surface tension (γ) of the fluid increases,
so does the energy required to produce the dispersion. Dispersants lower the
interfacial tension between the phases (Heusch, 1993:577). They thus help maintain
fine solid particles in a state of suspension and inhibit the particles from
agglomeration or settling in the fluid medium.
L1.2 The Dispersion Process
The preparation of a dispersion entails three stages, i.e.
� Wetting the powder into the liquid medium
� Deagglomerating the wetted clumps and
� Preventing reagglomeration or flocculation (Nelson, 1996:1093).
L1.2.1 Wetting the Powders
In order to overcome surface defects such as:
� Lattice defects
� Non-stoichiometry
� Impurity ions
� Dislocations and
UUnniivveerrssiittyy ooff PPrreettoorriiaa eettdd –– RRiiccccoo,, II ((22000055))
Appendix L
L-2
� Surface roughness
a solid will tend to adsorb polar molecules such as water i.e. oxygen or hydroxyl
radicals cover the exposed surfaces (Focke, 2000a). Despite this, the wetting of
powders remains a problem. The wetting process consists of three mechanical steps:
adhesion, immersion and spreading. Nelson (1996:1094-1096) has described the
fundamentals for the wetting of single particles and clumps. A more detailed
discussion of the wetting phenomenon with an approach based on the theory of
surface forces has been made by Churaev (1995).
The most common wetting agents are anionic surfactants chosen from the families of
alkali, sulphonates, sulphates, ligno sulphates, carboxylates and phosphates. The
optimum chain length is between 12 and 18. A wetting agent with a low molar mass
has a high diffusion coefficient and thus has a faster rate of wetting. The selection of
the wetting agent is important, as the agent may interfere with the drying of the
powders in the downstream processing (i.e. in the case of the delay elements the
loading of the lead tubes may be affected).
Gas that is drawn beneath the surface of the liquid as a result of a vortex or plunging
jet, due to the high shear which is used, may be dispersed into small bubbles which
may be stabilised by the wetting agent to form a stable foam. The amount of wetting
agent that should also be limited for this reason (Nelson, 1996:1096). Typically only
0.01 to 0.2% (mass basis) of the wetting agent is added to the dispersion (Focke,
2000c)
L1.2.2 Deagglomerating the Wetted Clumps
The particles in a dry powder are held together by the polarisability attraction of
adjoining particles, the surface tension at wetted contacts or moderately strong
sintering or precipitation bonds. These bonds are formed at the contact points because
of the exposure to humidity and temperature cycles during storage before use.
Breaking these bonds to fully disperse the submerged and wetted clumps requires
high shear stress or mechanical impact. This will result in the formation of a small
amount of new surface area that may have a higher adsorptivity and reactivity than the
rest of the clump. Methods for the deagglomeration of pigments, which a few of the
UUnniivveerrssiittyy ooff PPrreettoorriiaa eettdd –– RRiiccccoo,, II ((22000055))

Appendix L
L-3
constituents in the pyrtechnic formulations are, have been described in ISO 8780 –
parts 1-6 (Nelson, 1996:1097-1098).
L1.2.3 Preventing Reagglomeration
Factors Affecting Reagglomeration
The factors which affect dispersion stability have been discussed in detail by Nelson
(1996:1100-1104).
� Polarisability Attraction
All matter is composed of electric charges which move in response to an external field
which can be created by the distribution and motion of charges in nearby matter. The
Hamaker constant for interaction energy is a measure of this polarisability attraction
between the particles. The determination of the Hamaker constant has been described
by numerous authors (Nelson, 1996:1100; Drummond & Chan, 1997; Nguyen, 2000;
Bergström, 1997; Reiter et al, 1999). Higher constants indicate greater attraction
(Hann, 1996:298). The following Hamaker constants have been reported in literature
(Table L-1).
Table L-1: Hamaker Constants (Lafuma, 2000)
Particle Hamaker Constant (10-20 J)
Silicon 25.5
Water 4.35
Oxides 10.6 – 15.5
Metals 16.2 - 45.5
Nelson (1996:1100) has used the example of two identical spheres with diameter d
separated in a liquid by a distance s, to describe the attractive energy, u, due to the
attraction, i.e. when s=0 then u becomes infinite. A strongly adsorbed layer of liquid
or other solute limits s to smin, which may be set equal to twice the molecular diameter
of the liquid, and u to the maximum value (Nelson, 1996:1100).
UUnniivveerrssiittyy ooff PPrreettoorriiaa eettdd –– RRiiccccoo,, II ((22000055))

Appendix L
L-4
� Thermal Jostling or Particle Motion
If the thermal energy (uthermal=kT as per convention) of the particles exceeds the
maximum attractive energy u, then the thermal jostling is sufficient to disrupt the
agglomerates and often keep the particles dispersed (Nelson, 1996:1100; Hann,
1996:296). Thus by increasing the temperature, agglomerates may be broken and
particles may be dispersed. If, however, the particles collide with enough energy and
are not well dispersed, they will coagulate or flocculate.
� Sedimentation
If the particles are more dense than the liquid medium, then they will move
downwards and the bed of particles which is formed compresses toward the state of
minimum-included liquid. The property of minimum included water is desirable for
the processing of pyrotechnics, as the presence if water in the mixtures affects the
burn rate, i.e. small amounts of water have been known to accelerate the burn rate of
lead dioxide-silicon mixtures (McLain, 1980:43). If the product of the height of the
container and the sedimentation force of the particles (due to gravity or
centrifugation) is greater than the thermal energy, then the particles will settle in a
dense bed at the bottom (or top if the particle density is greater than the density of the
liquid) (Nelson, 1996:1100-1101).
� Viscous Drag
The viscosity of the liquid limits the velocity with which the particle can move
through the liquid in response to an external force. The balance between the forces on
the particle due to gravity and viscous drag determines the terminal sedimentation
velocity (Nelson, 1996:1101).
� Electrostatic Interactions
Particles with like charges repel each other. The charges may be as a result of
hydrolysis (which will be discussed later) of the surface groups or adsorption of ions
from the solution. The Stern layer is defined as the layer of solution immediately
adjacent to the surface that contains the counterions not part of the solid structure but
which are bound so strongly to the surface that they do not exchange with the
solution. The plane separating the Stern layer from the next is known as the Stern
plane and has a smaller potential than at the surface. At the shear plane, the motion of
UUnniivveerrssiittyy ooff PPrreettoorriiaa eettdd –– RRiiccccoo,, II ((22000055))

Appendix L
L-5
the fluid relative to the particle is equal to zero. For particles with no adsorbed
surfactant or ions, this plane is at the particle surface. Adsorbed surfactant or ions that
are strongly attracted to the particle, prevent liquid motion close to the particle, thus
moving the shear plane away from the particle surface. The effective potential at the
shear plane is known as the zeta potential that may be used to determine the
electrostatic repulsion force. If the electrostatic repulsion exceeds the polarisability
attraction at the distance of closest approach, determined by the surrounding fluid,
then the particles may be prevented from coming into contact unless they are in a bed
of sediment and are pressed together due to its weight (Nelson, 1996:1102-1103).
� Polymer Chain Interactions
If the particle is covered with links to polymer chains that are soluble in water, then
the particles will be sterically hindered from coming together. If the chains extend a
distance of δ1 into the liquid, then according to Nelson (1996:1103), unlike
electrostatic and polarisability interactions which act over large distances, steric
repulsive interactions act only when s<2δ1.
Surface Modification
Reaction or adsorption at the solid surface alters the properties and lead to a surface
charge or steric stabilisation.
� Hydrolysis
Inorganic particles have a surface charge in water that is a function of the particle’s
character and the pH. The surfaces of metal oxides, which are the primary constituent
of the formulations, can be hydrolysed and take up H+ or OH
- ions and become
charged. Aqueous solutions may sustain potentials as high as 100mV. This potential is
a function of the pH. The zeta potential is a measure of the electrostatic potential at
the Stern layer that surrounds the particle. The zeta potential for the particle is
positive if the solution pH is below the particle’s isoelectric pH and negative if it is
above the isoelectric pH. According to Nelson (1996:1105) a zeta potential greater
than 30mV (positive or negative) is sufficient to keep the particles well dispersed.
Lower values may be sufficient for particles with weak attractive forces (Hamaker
UUnniivveerrssiittyy ooff PPrreettoorriiaa eettdd –– RRiiccccoo,, II ((22000055))

Appendix L
L-6
Constant close to that of the liquid), but not for particles with strong interactions
(Nelson, 1996:1104-1105 & Hann, 1996:294-296).
It is possible to measure the surface charge of a particle using titration. The following
points of zero charge or isoelectric pH values have been reported in literature:
� Fe2O3 (synthetic or freshly formed in water) – 8.6 (Lafuma, 2000b), 8.0 – 8.7
(Hann, 1996:295)
� Fe2O3 (dehydrated) – 5.2 (Hann, 1996:295)
� SiO2 – 2.2 (Hann, 1996:295).
� Si – above 2, the zeta potential has been reported as being negative (Hackley et al,
1997)
This means that at a pH of 7 synthetic or freshly formed Fe2O3 will be attracted to Si,
whereas dehydrated Fe2O3 will not be attracted to Si.
� Differential Dissolution or Complexation
In the case of ionic salts, one of the ions making up the lattice may be complexed or
hydrated more readily than the other resulting in an imbalance in the particle charge.
The surface charge of the particle will thus change with the solution composition as
the degree of complexation is affected by additives that adsorb on the surface,
complex with the ion or affect the ionic strength and hence the distance over which
the particle potential is effective (Nelson, 1996:1105).
� Chemical Grafting
Polymer chains which are soluble in the liquid may be grafted onto the particle and
provide steric stabilisation. Nelson (1996:1105) has stated that for typical interparticle
potentials and a particle diameter of 10µm, steric stabilisation can be provided by a
soluble polymer layer with a thickness of approximately 10nm, which can be
provided by a polymer tail with a molar mass of 10kg/mol.
� Surface Coating
Semisteric stabilisation can be achieved by adding a dense surface coating that
contains no occluded solvent, provided that the coating has a Hamaker constant,
which is intermediate between the particle and the liquid (Nelson, 1996:1105-1106).
UUnniivveerrssiittyy ooff PPrreettoorriiaa eettdd –– RRiiccccoo,, II ((22000055))

Appendix L
L-7
DLVO Theory
The overall stability of the particle dispersion depends on the sum of the attractive and
repulsive forces as a function of the distance between the particles. The DLVO theory
encompasses the attraction (as mentioned previously is a function of the Hamaker
constant) and electrostatic repulsion between the particles (as mentioned previously is
a function of the kinetic energy of the particle – thermal jostling; ionic strength, zeta
potential and separation distance) but ignores steric stabilisation. The effect of the
various variables as predicted by the DLVO theory has been summarised by Hann
(1996:299) and can be found in Table L-2.
Table L-2: Effect of Increasing Various Variables on the Coagulation and Flocculation Resistance
(Hann, 1996:299).
Variable Coagulation Resistance Flocculation Resistance
Particle size Increase Decrease
Surface potential Increase Increase
Electrolyte Decrease Decrease
Hamaker constant Decrease Decrease
Steric Stabilisation versus Electrostatic Stabilisation
Hann (1996:300) has summarised the practical differences between electrostatic and
steric stabilisation. This summary may be found in Table.L-3
Table L-3: Practical Differences between Electrostatic and Steric Stabilisation
Steric Stabilisation Electrostatic Stabilisation
Insensitive to electrolyte Coagulation occurs with increased
electrolyte
Effective in aqueous and nonaqueous
media
More effective in aqueous media
Effective at high and low concentrations More effective at low concentrations
Reversible flocculation common Coagulation is often irreversible
Good freeze-thaw stability Freezing induces irreversible coagulation
UUnniivveerrssiittyy ooff PPrreettoorriiaa eettdd –– RRiiccccoo,, II ((22000055))

Appendix L
L-8
Stabilising Additives
Dispersants consist of molecules, which have one region that is soluble in the liquid
and another which is slightly insoluble and attaches to the particles. The adsorbed
dispersant prevents agglomeration either by steric stabilisation or by electrostatic
stabilisation. The polarisability interactions attract the dispersant molecules from the
solution onto the particle surface. If the adsorption sites are equivalent and do not
interact with one another, then the fraction of the surface covered by the adsorbate, f,
can be described by the following relationship:
surfads
surfads
CK
CKf
+=1
(A)
Near monolayer coverage (f>0.95) can only be achieved if KadsCsurf>19, which can be
problematic for some dispersants since the solution concentration cannot be higher
than the critical micelle concentration (CMC) (Nelson, 1996:1106-1107). Typical
usage levels of high molecular weight dispersants is between 1-10% and for low
molecular weight dispersants the level is between 0.5-2% for inorganic powders
which the formulations are composed of (Mailwane, 2000).
Positive ions are attracted by the negatively charged surface of the solid particles and
therefore will have a higher concentration near the surface than in the bulk.
Meanwhile negative ions are repelled from the negative surface and will have a lower
concentration near the surface. The ionic attraction or repulsion from the surface
affects the non-ionic adsorption coefficient (Nelson, 1996:1107).
Short chain organics that are adsorbed may reduce the polarisability attraction
between the particles, provided that its Hamaker constant is between that of the solid
and the liquid medium and that the adsorption layer is thick enough. Adsorption does
not follow the Langmuir adsorption profile described by equation A in aqueous
systems for organic dispersants, as the tails adsorbed molecules at adjacent sites tend
to attract each other strongly. Ionisable organic dispersants lose or gain protons in
solution if it is within the right pH range. The ionic species may absorb on the
UUnniivveerrssiittyy ooff PPrreettoorriiaa eettdd –– RRiiccccoo,, II ((22000055))
Appendix L
L-9
oppositely charged inorganic surface and provide semisteric stabilisation (Nelson,
1996:1107).
Nonionic polymeric units which have been hydrated such as polyethylene oxide are
water-soluble and thus adsorb strongly to highly polar materials, whereas alkanes are
adsorbed strongly on non-polar materials. The adsorption of these materials cannot be
described using the Langmuir theory because the sites are not independent.
Dispersants under this class include homopolymers, random block copolymers,
diblock copolymers and comb polymers.
� Homopolymers consist of a series of identical segments. If their segments adsorb
strongly on the particle, the polymer layer will have a compressed conformation
(little occluded liquid) and provide semisteric stabilisation. Less strongly adsorbed
homopolymers will coat the particles and be anchored by either loops or tails and
provide steric stabilisation.
� Random copolymers consist of random length sequences of soluble segments
interspersed with less soluble segments which adsorb onto the particle, while the
more soluble segments form loops or tails extending into the liquid. The
advantage of this type of polymeric unit over the homopolymer is that due to the
separate anchor and soluble segments, there can be better control over the
adsorbed layer depth and desorption. Thermal energy drives the motion of the
loops and tails and provides a steric barrier. The thickness of this barrier is
dependent on the solvent. In a good solvent it is roughly one-third of the fully
extended length of the loop or tail.
� Diblock copolymers consist of one sequence of anchor segments and a second
sequence of backbone segments. Like random copolymers, the lengths of these
segments can be controlled to allow for control of the adsorbed layer depth and
soluble segments.
� Comb polymers have a soluble backbone with a number of side chains that
contain the anchor group (Nelson, 1996:1107-1108).
Drummond and Chan (1997) have studied the van der Waals interaction, surface free
energies and contact angles for the following dispersive polymers and liquids:
� Polymers – Poly(dimethylsiloxane) (PDMS), poly(4-methyl-1-pentene) (TPX),
polyethylene (PE), natural rubber and polystyrene (PS)
UUnniivveerrssiittyy ooff PPrreettoorriiaa eettdd –– RRiiccccoo,, II ((22000055))

Appendix L
L-10
� Liquids – diiodomethane, 1-bromonaphthalene, 1-methylnaphthalene,
bromobenzene, tert-butylnaphthalene, liquid paraffin and hexadecane (Drummond
& Chan, 1997).
Adsorption of Microparticles
Nelson (1996:1109) has proposed that microparticles which diameters less than a
tenth of the particles to be dispersed, can be attached to the larger particles by
sintering prior to wet in. According to Nelson (1996:1109-1110), these particles will
provide polarisability attraction if their Hamaker constant is midway between the
liquid and larger particle or electrostatic attraction if the microparticles have a charge
opposite to that of the larger particle. The attached microparticles will prevent the
surfaces of the larger particles from coming close together, thus reducing the
maximum attractive energy in the same way that encapsulation does (Nelson,
1996:1110). Solid state sintering occurs when a system of loose or compacted
powders are subjected to heat treatment below the melting point of all its constituents
(Kayser & Weise, 1993:118). Initially it was thought that this method could be used
by sintering the Nanocat iron oxide with the silicon prior to dispersing the silicon with
another reducing agent. This would allow for intimate contact between the silicon and
one of the reducing agents (the Nanocat iron oxide). From the literature it appeared
that the Hamaker constants could be in the right range. Despite these factors, this
option cannot be used for the following reasons:
� It would entail the use of special crucibles (made from refractories such as ZrO2 or
borides of the transitions metals) which may be expensive
� The high energy cost of the sintering process
� The strong probability that during the sintering process, sufficient energy is added
to ignite the mixtures and
� The practical implications of changing the formulation process that significantly
in practice i.e. buying new equipment.
In summary, a dispersion can be stabilised if the maximum attractive energy is less
than the thermal energy. It should be noted however that the polarisability attraction,
electrostatic repulsion and steric repulsion increases with an increase in particle
diameter, whereas thermal jostling is independent of the particle diameter.
UUnniivveerrssiittyy ooff PPrreettoorriiaa eettdd –– RRiiccccoo,, II ((22000055))

Appendix L
L-11
L2 PROPOSED DISPERSION FORMULATION AIMS
The following aims would have to be achieved by the dispersion process:
� Wet the powders
� Break up particle clusters
� Ensure proper mixing
� Form dense, thin sediment layer of powders once they have settled using
centrifugation
� Allow for easy drying
� Minimise the risk of fires when handling the dry powdered formulations
downstream
� Allow for reproducible and desired burn speeds of the pyrotechnic formulations.
The addition of the wetting agent and dispersant will also affect the amount of
oxidising agent which is to be added. This is due to the fact that the carbon and
hydrogen atoms in these compounds require oxygen during the burning process of
which the oxidising agent is the only source as the reactions occur in sealed
containers.
� The surfactant should also be compatible with water.
One of the problems that may be foreseen is that despite the powders being well
dispersed in the liquid phase, upon settling, due to the density differences, there will
be preferential settling of either the oxidising agent or the silicon. This could be
overcome by either:
� Finding a surfactant or surfactant mixture that will not allow preferential settling
or
� Shin et al (1998) have developed a deposition mechanism of oxide thin films on
self-assembled organic monolayers. They developed the model because it has
been proved that oxide thin films can be deposited on silicon wafers at low
temperatures (<100°C) from an aqueous media using functionalised self-
assembled which are ordered arrays of surfactant molecules (long chain
hydrocarbons – chain lengths greater than 12CH2 units) covalently attached to the
substrate. The ordering of the surfactant molecules is as a result of the van der
Waals interactions between adjacent hydrocarbon chains. It has been found that
UUnniivveerrssiittyy ooff PPrreettoorriiaa eettdd –– RRiiccccoo,, II ((22000055))

Appendix L
L-12
both TiO2 and ZrO2 films precipitate on the sulphonate-functionalised self
assembled monolayers and are adherent and uniform in thickness (Shin et al,
1998). This method could be modified to allow for the deposition of the desired
reducing agent and not ZrO2 or TiO2 on the monolayer. This method would ideal
as it allows for proper mixing and intimate contact between the particles – i.e.
constant thermal conductivity and contact.
L3 THE USE OF DISPERSANTS AND SURFACTANTS FOR THE
DISPERSION FORMULATION
L3.1 Finding the Best Wetting Agent
A “flotation” test can be used to determine the effectiveness of the wetting agent. The
powder is distributed in the surface of a solution and the time taken by the particles to
reach the bottom of the container is measured. This time is inversely proportional to
the efficiency of the wetting agent (Mailwane, 2000).
L3.2 Choice of Surfactant – Influence of Surfactant Properties
The choice of surfactant and amount of surfactant used depends on a number of
factors, i.e. the chemical nature of the hydrophile, the cmc of the surfactant
The following surfactant properties need to borne in mind when formulating the
aqueous dispersions:
� Critical micelle concentration (CMC)- It will be necessary to operate below the
CMC in order to avoid overdosing. Surfactants are also most effective at
concentrations close to their CMC. The CMC is influenced by chemical structure,
nature of counterions, temperature and pH.
� HLB-value – This classification is only used for only for the classification of
nonionic surfactants. An increase in hydrophilicity results in an increase in the
HLB. The typical HLB range for dispersions is 8-13. It is possible to get a
measure of the HLB value from the solubility of the surfactant in water.
UUnniivveerrssiittyy ooff PPrreettoorriiaa eettdd –– RRiiccccoo,, II ((22000055))

Appendix L
L-13
� Surfactant Type - Ionic surfactants work by electrostatic forces i.e. repulsion,
while nonionic surfactants work by steric repulsion which is good for applications
where the medium is polar i.e. water. If increase the electrolyte content of the
medium, it will be possible to get close contact and flocculation. Polymeric
surfactants are nonionic and contain segments that absorb strongly onto the
particle and with a compressed conformation will lead to semisteric stabilisation.
� Water Hardness and Ionic Strength – Anionic surfactants will precipitate out as a
result of the water hardness whilst nonionic surfactants will “salt” out of the
aqueous solution as a result of the ionic strength (Bognolo, 2000)
� Solubility and Temperature – For ionic surfactants, if the temperature is increased
above the Krafft temperature solubility will increase, whilst with nonionic
surfactants if the temperature is increased above the cloud point, solubility will
decrease.
� Other properties - Foam is an undesired property that can be overcome through
the use of antifoaming agents (Broadbent, 2000). For stirred reactors and mixers
foam can reduce the batch size. According to Farminer (1973), antifoams based on
polydimethyl siloxane fluids have most of the desirable features necessary for
controlling foam in any media, i.e. fast knockdown, long lasting action, high
efficiency, low cost and ease of handling. These antifoams should, however, not
be used where it is dissolved by components of the foaming system e.g.
chlorinated hydorcarbon processing. The criteria for successful foam control are:
- A lower surface tension than the foaming media
- Insolubility in the foaming media and
- Dispersibility in the foaming media (Farminer, 1973).
The polarity of the solids will have an effect the type of surfactant that is used.
Generally for solids of low polarity long chain alcohols, POE and POE/POP may be
used, whilst for highly polar solids alkylphenols, POE, POP/POE, unsaturated
alcohols, block copolymers, di- and polyamides may be used (Bognolo, 2000).
UUnniivveerrssiittyy ooff PPrreettoorriiaa eettdd –– RRiiccccoo,, II ((22000055))

Appendix L
L-14
L3.4 Method for Choosing the Right Surfactant
The following procedure has been proposed:
� Evaluate the surfactant solubility in the medium without the powders
� Measure the zeta potential of the particles in the medium – not use cationic
dispersants if positive and anionic if negative
� Measure the viscosity of highly loaded suspension only powders and liquid (more
than 40% solids) – eliminate one with higher viscosity and poor flow
characteristics
� Observe sedimentation behaviour of 5 – 10% solids suspension – use only liquid
and powders
� Eliminate the surfactant that gives large sediment volume and does not allow for
constant and reproducible burn rates
� Check quality of complete dispersion using the British Standard (BS) 3466 (part
4) for metal oxides and ASTM standard B821-92 for metal powders or the
methods contained in section 5 (Nelson, 1996:1109).
Due to their synergistic behaviour, it has been recommended that mixtures of
surfactants be used. Unfortunately the mechanism of mixed surfactant adsorption is
not understood (Penfold et al, 1998).
L4 Dispersant and Surfactant Literature for the Dispersion of the
Individual Constituents of the Proposed Pyrotechnic Formulations
A vast amount of literature is available on types of dispersants. Comb graft
copolymers such as methoxy polyethylene glycol with an acrylic copolymer backbone
have been used with great success as a dispersant (Broadbent, 2000). Table L-4
contains examples of organic polymeric dispersants which Hann (1996:303) has
summarised.
UUnniivveerrssiittyy ooff PPrreettoorriiaa eettdd –– RRiiccccoo,, II ((22000055))

Appendix L
L-15
Table L-4:Examples of Dispersants (Hann, 1996:303).
Type Trademark Name
Poly(meth)acrylates Alcosperse, Aquatreat, Antiprex,
Alcomer, Cyanamer, Belsperse, Goodrite,
Acusol, Acumer, Tamol, Daxad.
Polymaleates Sokolan, Belsperse, Belgard, Belasol,
Norasol
Condensed phosphates
Polysulphonates Versa TL, Polyfon, Reax, Indulin,
Vanisperse, Borresperse and Ultrazine
Sulphonated polycondensates Lomar, Tamol
Tannins, lignins, glucosides, alginates Marasperse
Polyacrylates are the most flexible because they are produced in a variety of
molecular weights and degrees of anionic charge. Polymaleates are very similar to
polyacrylates, but maleic acid is not as easily copolymerised with other functional
monomers to allow tailoring for specific applications. Condensed phosphates are not
used as much today, due to the role that the phosphates play in the eutrophication of
water bodies (Hann, 1996:302).
The following recommendations and studies have already been made and conducted
respectively for the dispersion and wetting of the individual powders:
L4.1 Silicon
� Penfold et al (1998) used specular neutron reflection to measure the adsorption of
the mixed cationic/non-ionic surfactant mixture of C16TAB/C12E6 at the
hydrophilic Si/SiO2/aqueous solution interface. They found that the non-
ionic/cationic surfactant adsorbed layer at the Si/SiO2 interface is a fragmented
bilayer. The adsorbed layer can thus be described by three layers. The first layer,
adjacent to the solid surface, contains the head groups. The next layer is the
associated hydration layer containing the hydrocarbon chains interpenetrating (or
UUnniivveerrssiittyy ooff PPrreettoorriiaa eettdd –– RRiiccccoo,, II ((22000055))
Appendix L
L-16
overlapping) from both sides of the interlayer and the third layer adjacent to the
fluid phase containing the head groups and hydration. The bilayers were found to
be essentially symmetrical, the two headgroup regions appeared identical and the
alkyl chain region was less than the dimension of a fully extended chain. This was
attributed in part to the fraction of alkyl chains that were in the head group region
as a result of the constraints arising from the disparity in head group size between
the two surfactants (Penfold et al, 1998).
� Hackley et al (1997) have compared the dispersion properties of silicon powder
with and without the use of surfactants. They found that the untreated silicon
powder was easily dispersed and the results obtained were consistent with a model
of the particle-solution interface based on the SiO2-H2O systems. The suspensions
exhibited negative surface potentials at pH values exceeding 2 and were a
maximum at pH 9. Furthermore, silicon that had been aged in an electrolyte
solution had a higher surface potential, which they attributed to the increase in the
surface site density of the Si-OH groups that occurred as a result of slow surface
hydrolysis reactions. A summary of their results with various dispersants has been
summarised in Table L-5.
Table L-5: Dispersion of Silicon using various Dispersants (Hackley et al, 1997)
Dispersant Findings
Daxad 34 – anionic surfactant,
linear poly(methacrylic acid)
(PMAA)1
Had little effect on particle potential – weak
interaction with the Si surface. But the adsorption
on the negatively charged silicon was
functionally similar to the adsorption behaviour
for poly(acrylic acid) on Si3N4 and PMAA-Na+
on Al2O3 at ph values above their isoelectric pH
Betz 1190 – dimethylamine-
epichlorohydrin linear
copolymer2
Resulted in a shift in the isoelectric pH with
increasing polymer concentration (Saturation
between 0.1 – 0.5%). Also resulted in a positively
charged particle whose electrokinetic behaviour
was independent of pH or polymer concentration
UUnniivveerrssiittyy ooff PPrreettoorriiaa eettdd –– RRiiccccoo,, II ((22000055))

Appendix L
L-17
Dispersant Findings
Daxad CP2 - dimethylamine-
epichlorohydrin linear
copolymer2
Similar to results obtained with Betz 1190
Betz 1195 – cross linked form of
Betz 1190 with a higher Mr2
Similar to results obtained with Betz 1190
1 A weak acid that dissociates to form an anion. Acid-base properties dependent on
the solution pH.
2 The copolymers are salts of quaternary ammonium compounds and therefore carry a
positive charge regardless of the pH.
L4-2 Antimony Trioxide
Mailwane (2000) found during laboratory tests that calsoline oil appeared to be a
good wetting agent for antimony trioxide.
L4-3 Iron Oxide
Homopolymers have been found to be ineffective for imparting steric stabilisation as
the polymer chain prefers to associate with the solvent molecules of with the surface
of the particle and not both at the same time (van der Avort, 1992). van der Avort
(1992) has recommended that for metallic iron oxide (red) dispersion surfactants such
as Hypermer CG6 (soluble graft copolymer), A109 (modified soluble polyester), PS2
(dispersible polyester) and Atlas G4911 (soluble POE alkyl aryl phenol). These are all
nonionic surfactants, which provide steric stabilisation. The recommended dosage for
metallic oxides is 1-3% based on the mass of solids (van der Avort, 1992).
L5 DISPERSION EVALUATION
The degree of deagglomeration can be evaluated using the following methods:
� Viscosity – The viscosity of a suspension that contains clumps decreases as the
degree of deagglomeration decreases. This is attributed to the fact that the clumps
contain occluded liquid and the volume fraction of the clumps is larger than the
UUnniivveerrssiittyy ooff PPrreettoorriiaa eettdd –– RRiiccccoo,, II ((22000055))

Appendix L
L-18
volume fraction of the individual particles and so there is less free liquid to
facilitate the flow than if the clumps were deagglomerated. This method of
evaluation has a few inherent disadvantages, i.e. it is not sensitive in the final
stages of deagglomeration.
� Particle Size Distribution – The degree of deagglomeration can be monitored
using either sieving (particles >20µm) or instrumental particle size analysis for
smaller particles.
� Tinting Strength – When the particles are well dispersed, they block more light
than when there are clumps. Samples have to be taken at various intervals and a
fixed quantity of well dispersed contrasting colour pigment added. The samples
can then be analysed using a sensitive colorimeter. This method of evaluation
cannot be used if the pigment is agglomerated by the sample or the sample and
pigment settle out.
� Grind Gauge – This method has been described by Nelson (1996:1110). It cannot
be used as it involves scraping an excess amount of sample, which is a paste. This
may ignite the more sensitive pyrotechnic mixtures. The results obtained using
this method are also subject to considerable variations.
The stability to reagglomeration may be evaluated using the following procedures:
� Microscopy – The optical microscope may be used for the evaluation of dilute
suspensions (<1% solids) of particles 1-10µm. If the dispersion stable, thermal
jostling can be seen and the particles will avoid coming close to one another or
separate soon after collision.
� Sediment Volume – A stable dispersion will result in a thin sediment bed with
maximum solids packing and minimum occluded liquid as the particles will move
freely past each other to avoid contact as long as possible. Centrifugation will
have to be used to force the particles to settle within a reasonable time.
� Other Other methods that could be used include the response to electric and
acoustic fields, spectroscopy and drift in tinting strength (Nelson, 1996:1110-
1111).
� Ultrasonic Characterisation – Guidarelli et al (1998) used ultrasonic attenuation
to analyse suspensions of alumina powder in water at high concentrations (40%
vol.). The purpose of their study was to identify weak structural differences that
UUnniivveerrssiittyy ooff PPrreettoorriiaa eettdd –– RRiiccccoo,, II ((22000055))

Appendix L
L-19
occur between suspensions with different degrees of deflocculation, obtained by
varying the quantity of dispersant around the critical value. This is difficult to be
determined using other methods. They found that weakly flocculated suspensions
presented lower attenuation than well flocculated suspensions (Guidarelli et al,
1998).
Hackley et al (1997) have measured the electrokinetic sonic amplitude (ESA) for
silicon powder suspensions using an electoacoustic analyser equipped with an
autotitrater, overhead stirrer and pH, temperature and conductivity probes. The ESA
signal is proportional to the zeta potential and provides a convenient method of
determining the polarity and relative magnitude of the charge carried by the particles.
The titration data also provide a measure of the particle potential as a function of the
pH and can thus be used to determine the isoelectric point (Hackley et al, 1997).
The easiest variables to measure for the evaluation of the dispersion would be
viscosity, particle size distribution and sediment volume.
L6 DISPERSION PROCESSING EQUIPMENT
Nelson (1996:1098-1099) has described typical design elements for the wet in of
powders and wet deagglomeration, the selection of which depends on the application
It appears that for the dispersion of the pyrotechnic formulations the equipment in
Figure L-1 for the following reasons:
� The disk impeller provides a rapidly refreshed liquid surface by creating a
deep vortex. This exposes a new surface area for the powder addition
� The up and downward teeth at the edge of the impeller cause impact,
turbulence and cavitation
� The baffles force vertical circulation.
� The equipment promotes rapid wet in due to the low gas pressure, high
centrifugal force and the distribution of the powder in a thin and
deagglomerated layer on the liquid
� The provision for the flow of clear liquid down the sides of the equipment aids
in the prevention of scale and encrustation. Scale forms above the level when
UUnniivveerrssiittyy ooff PPrreettoorriiaa eettdd –– RRiiccccoo,, II ((22000055))

Appendix L
L-20
airborne dust sticks to a wall wetted either by vapour condensation of liquid
being drawn up the wall by capillary action through previously deposited
scale. Encrustation forms near the shoreline of the tank as a result of the
wetting and recession due to hydraulic pulses during agitation and then drying
near that level. These two properties are undesirable in the processing of
pyrotechnic powders as they lead to contamination of the batches which are
prepared, the encrustation allows for a dry exposed areas which are easily
ignitable and lastly during the processing and subsequent cleaning of the
equipment of hazardous powders such as red lead, operators will be exposed
directly to the powders (Nelson, 1996:1097&1099).
� A limitation of such a system is the heat that is generated to the high shear.
Care should be taken not to have a high solids loading as this will increase the
viscosity and hence the shear.
Figure L-1: Processing Equipment for Pyrotechnic Powder Wetting and Deagglomeration (Nelson,
1996:1098-1099).
Penfold et al (1996) have studied the effect of shear on the adsorption of a non-ionic
surfactant at the silicon/solution interface using a specially constructed shear cell for
neutron reflectivity measurements. They found that the hexaethylene glycol
monohexadecyl ether (C16E6) there was evidence of shear induced structures in the
vicinity of the cell wall. Furthermore at low surfactant concentrations ordered layering
of the surfactant separated by solvent-rich regions and extending into the bulk
solution was observed, in addition to the adsorbed layer on the solid surface. The
UUnniivveerrssiittyy ooff PPrreettoorriiaa eettdd –– RRiiccccoo,, II ((22000055))

Appendix L
L-21
application of Poiseuille shear flow induced a more ordered and well defined structure
at the interface (Penfold et al, 1996).
UUnniivveerrssiittyy ooff PPrreettoorriiaa eettdd –– RRiiccccoo,, II ((22000055))

14.Appendices
M
APPENDIX M
DISPERSION OF TYPE 4 SI AND CUO
EXPERIMENTAL DATA
UUnniivveerrssiittyy ooff PPrreettoorriiaa eettdd –– RRiiccccoo,, II ((22000055))