aluminum co of a1erica alcoa center pa alcoa labs f/g ... · t ncta'1j>e r l 1 ) security...
TRANSCRIPT
AD-AI15 061 ALUMINUM CO OF A1ERICA ALCOA CENTER PA ALCOA LABS F/G 11/6EVALUATION OF THE ENGINEERING PROPERTIES OF A COMMERCIALLY PROO-ETC(U)DEC 81 R C MALCOLM, A VASUDEVAN. R J BUCCI N00019-79-C-0258
UNCLASSIFIED "NL
END
l2 5
1.2L 5 j______ 6fL
41I
9,...
I Zo
;A, A.L C.O A
00* " I'
btR"
<1A,
i~4' T ; F-r1' LAS
~4 .
'- .- 14 I
APPOVE pULI RLEM
jtT'n3T* uNt1 c'-
TABLE OF CONENTS
Page No.
__ r s . . . . . . . . . . . iv-v
SPEC13ENTS A!ND TEST PROCEDRES................. 2
1. T-ensile Tests . . . . . . . . . . . . . . . . . . . . . .
.Tear Tests. ..... .............. .. .. ..
3. -Fracture Toughness Tests. .... ............... 2-4
-4 atioie Crack G;rowth (da/dN4) Tests. ..... ........ 4
cU!CEKANICGZT PROPERTIES ..... ................... 5
1. Tensile. ..................... ..... 5
2. Tear .. ................... ........ 5
3. Fracture Toughness. .. ......... ........... 5-6
4. Fatigue Crack Growth (da/dN) .. ...... .......... 6-7
5. Fractographic Examination of FCG Specim~en .. ........ 7
SI TIARY .S_Accession For
REERE11CES . . ... .......... .1 . Gp: N . . . . 9D T IC T AS
Di~
SECURITY CLASSIFICATION OF THIS PAGE (Whien Daie Entete___
REPOR DOCMENTTIONPAGEREAD ISTRUCTIO-NSREPORT DOCU TATION BEFORE COMPLETING FORM1. REPORT NUMBER 2. GOVT ACCESSION NO. S. RECIPIENT'$ CATALOG NUMBER
4. TITLE (and Subtitle) S. TYPE OF REPORT & PERIOD COVERED
,. PERFORMING ORG. REPORT NUMBER
7, AuTHOR(s) S. CONTRACT OR GRANT NUMBER(s)
9. PERFOMING ORGANIZATION NAME AND ADDRESS II. PROGRAM ELEMENT. PROJECT. TASKAREA & WORK UNIT NUMBERS
II. CONTROLLING OFFICE NAME AND ADDRESS 12. REPORT DATE
Nav: 3 is. NUMBER OF PAGES
14. MONITORING AGENCY NAME & ADDRESS(If dlfferent from Controlling Office) IS. SECURITY CLASS. (of thle report)
15s. DECLASSIF!CATION/DOWNGRADINGSCHEOULE
IS. DISTRIBUTION STATEMENT (of thl Report)
APPROVEO FO PUIJJ
DISTRIBgU'TION ~UNLIC TEDEL~AS
17. DISTRIBUTION STATEMENT (o1fig te botrocf enftedin Block 20, )1 different from Report)
IS. SUPPLEMENTARY NOTES
19, KEY WORDS (Continue on reverse ede If neceeeary and Identify by block number)
Aluminum Alloy Tensile PropertiesAluminum-Lithi'm Alloy Tear -roperties Resis~ao2020-T65l Fatigue Crack Groth Slow B,:. vChemical Analysis F'racture Toughness FractoCg.at' ,Mechanical Properties KT,,
20. ABSTRACT (Continue on reveree alde It neceeesey and Identify by block number)
Al-Cu-Li alloy 2020 was developed in the 1950's to help satisfy ti.... ood forhigh strength and high modulus of elasticity in ai aircraft structuralmaterial. The fracture toughness of alloy 2020 is comparatively bow omnpLOudto other aerospace alloys. This characteristic coupled with nmuiufacturi-rdifficulty eventually led to the withdrawal of alloy 2020 for u e incommercial products. Despite this setback, aluminum alloys containinh ] t ),remain attractive for aircraft applications because in addition to hii strentn _
DD J 1473 EDITION OF I NOV 65 IS OBSOLETE UNCLASSIFIEDSECURITY CLASSIFICATION OF THIS PAGE (When D-te Entered)

T NCTA'1j>E r l 1 )SECURITY CLASSIFICATION OF THIS PAGE(I07i Date Entered)
i 71
-'and high elastic modulus, they possess low dei.sity and the potential forhigrher resistance to fatigue. Consequently, cr-runt researc!. has Ldirected toward increasing fracture toughness of Al-Li type alloys i.to aranje acceptable for aircraft us.;.
This report sunmmarizes tensile, fracture touanjss ann fati-ue crack grcwthproperties obtained from a conercially produced lot )f alurrndnm alloy2020-T651 plate. This characterization is intended to serve as a baselinefoir alloy development work directed at improvingT damage tolerant characteris-tics of Al-Li type alloys. 7he fracture toughness characterization includesplane-strain fracture toughness Klc) values, crack growvth resistnce (R)curves, as well as results from fracture touohness indicator tests; namely,the Kahn-tvpe tear test and the slow bend precrack charpy test. Obtainedfatigue crack growth rates traverse the entire range from near-thresholJvalues to the exceedingly high rates encountered as AK values approac, thematerial toughness. Metallographic characterization of alloy 2320-1651 inaddition to fractog'aphic results from a fatigue crack growt'h test specLmenrare also included in this report.,
UNCLASSIFIEDSECURITY CLASSIFICATION OP THIS PAGE(eWhn b&ta Entered)
ii
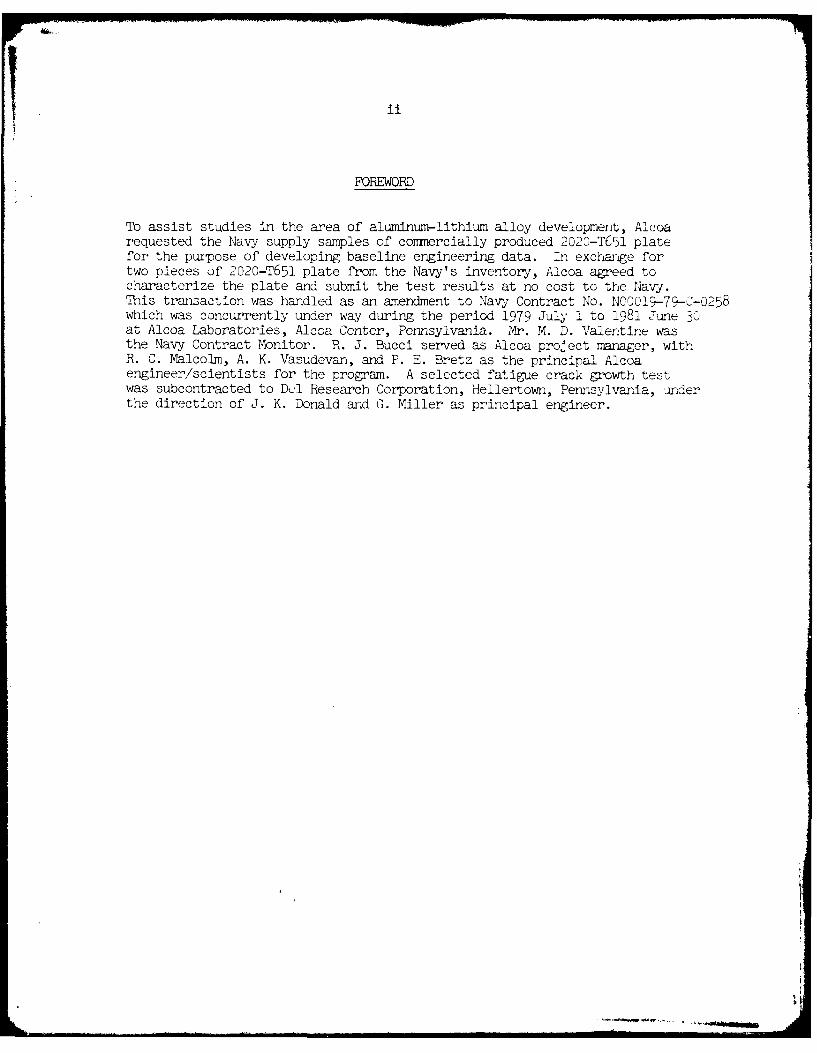
FOREWORD
To assist studies in the area of aluminum-lithium alloy development, Alcoarequested the Navy supply samples of commercially produced 2020-T651 platefor the purpose of developing baseline engineering data. In exchange fortwo pieces of 2020-T651 plate from the Navy's inventory, Alcoa agreed tocharacterize the plate and submit the test results at no cost to the Navj.This transaction was handled as an amendment to Navy Contract No. N00019-79-C-0258which was concurrently under way during the period 1979 July 1 to 1981 June 30at Alcoa Laboratories, Alcoa Center, Pennsylvania. Mr. M. D. ValentLne wasthe Navy Contract Monitor. R. J. Bucci served as Alcoa project manager, withR. C. Malcolm, A. K. Vasudevan, and P. E. Bretz as the principal Alcoaengineer/scientists for the program. A selected fatigue crack growth testwas subcontracted to Del Research Corporation, Hellertown, Pennsylvania, underthe direction of J. K. Donald and C. Miller as principal engineer.
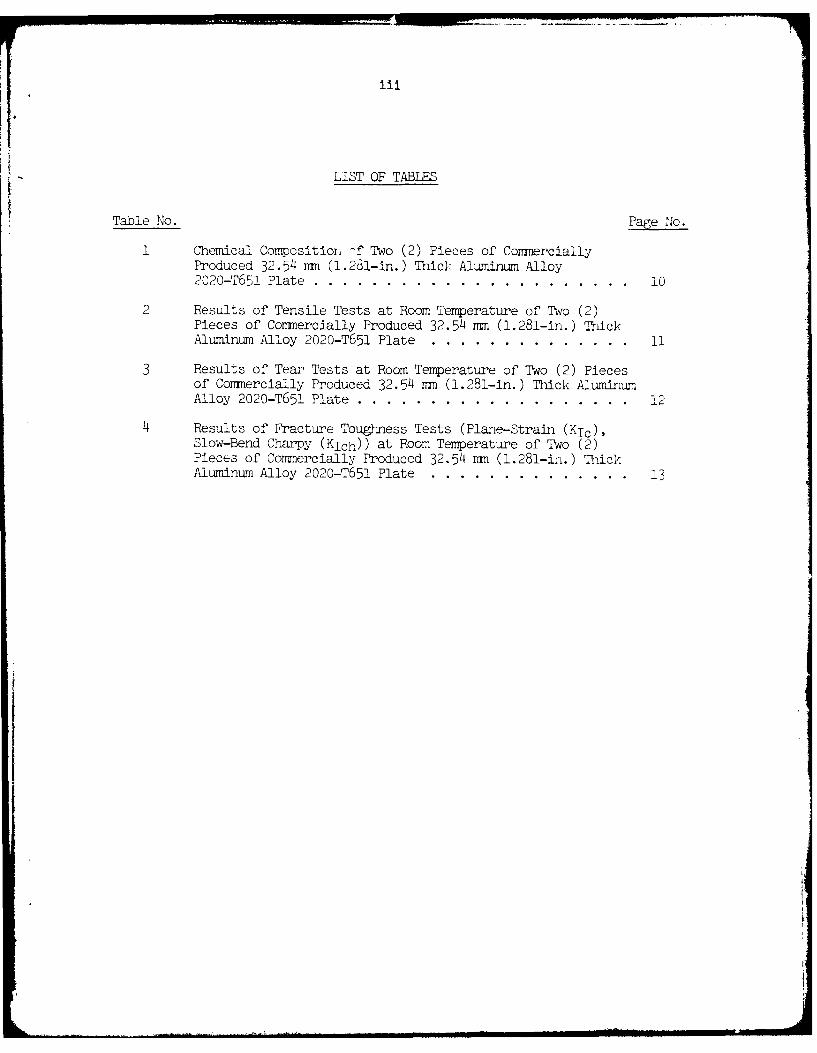
LIST OF TABLES
Table No. Page No.
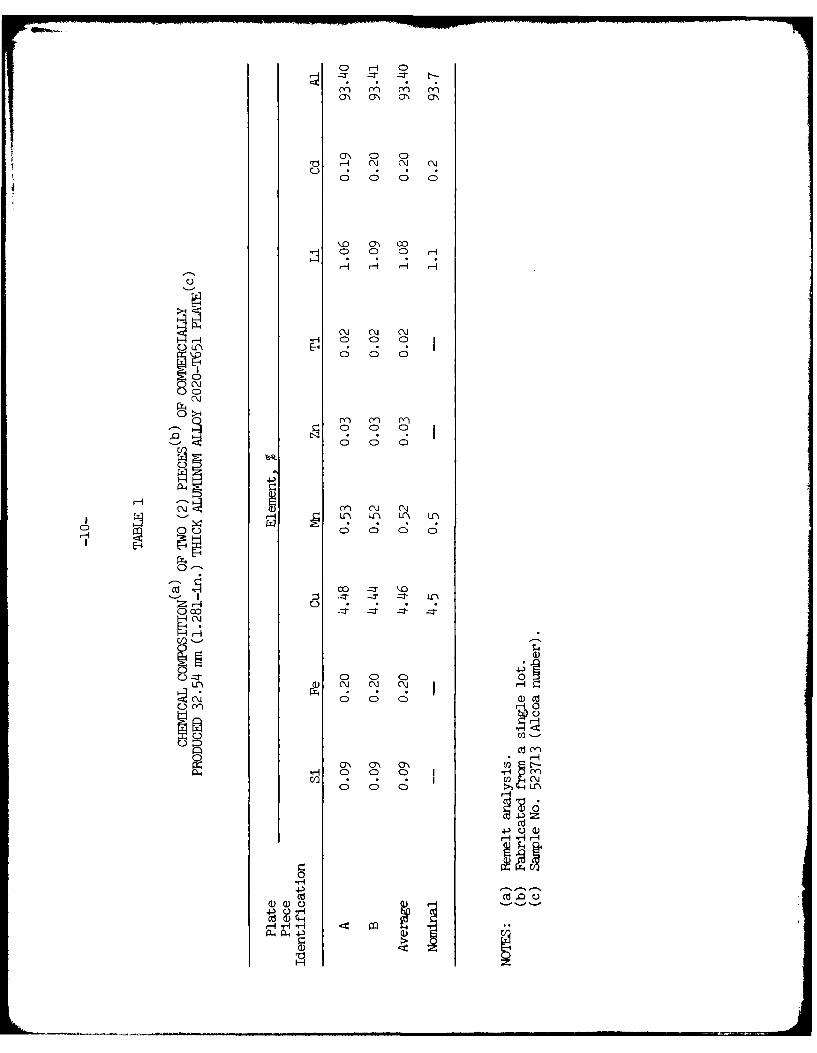
1 Chemical Composition -f Two (2) Pieces of CommerciallyProduced 32.54 mm (1.281-in.) Thick Aluminum Alloy2C20-T651 Plate ......... ...................... 10
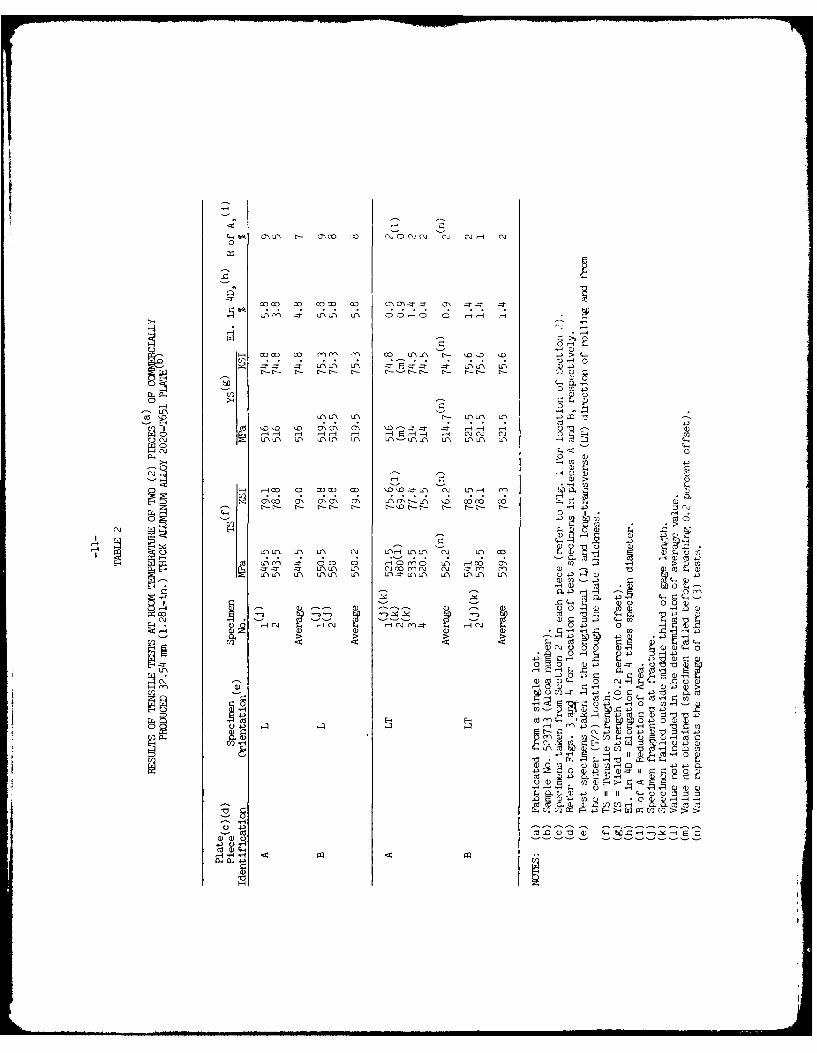
2 Results of Tensile Tests at Room Temperature of Two (2)Pieces of Commercially Produced 32.54 rn (1.281-in.) ThickAluminum Alloy 2020-T651 Plate ..... .............. .. 11
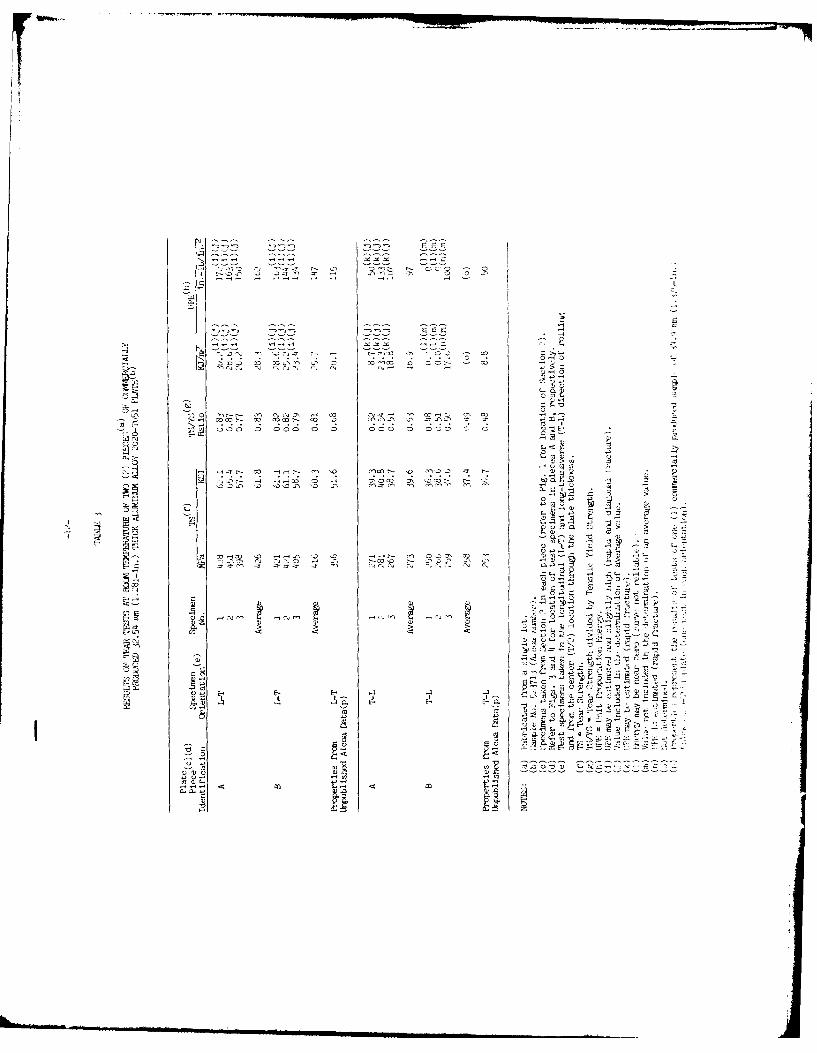
3 Results of Tear Tests at Room Temperature of Two (2) Piecesof Commercially Produced 32.54 m (i.281-in.) Thick AluminumAlloy 2020-T651 Plate . . ........ . . . . . . .. 1
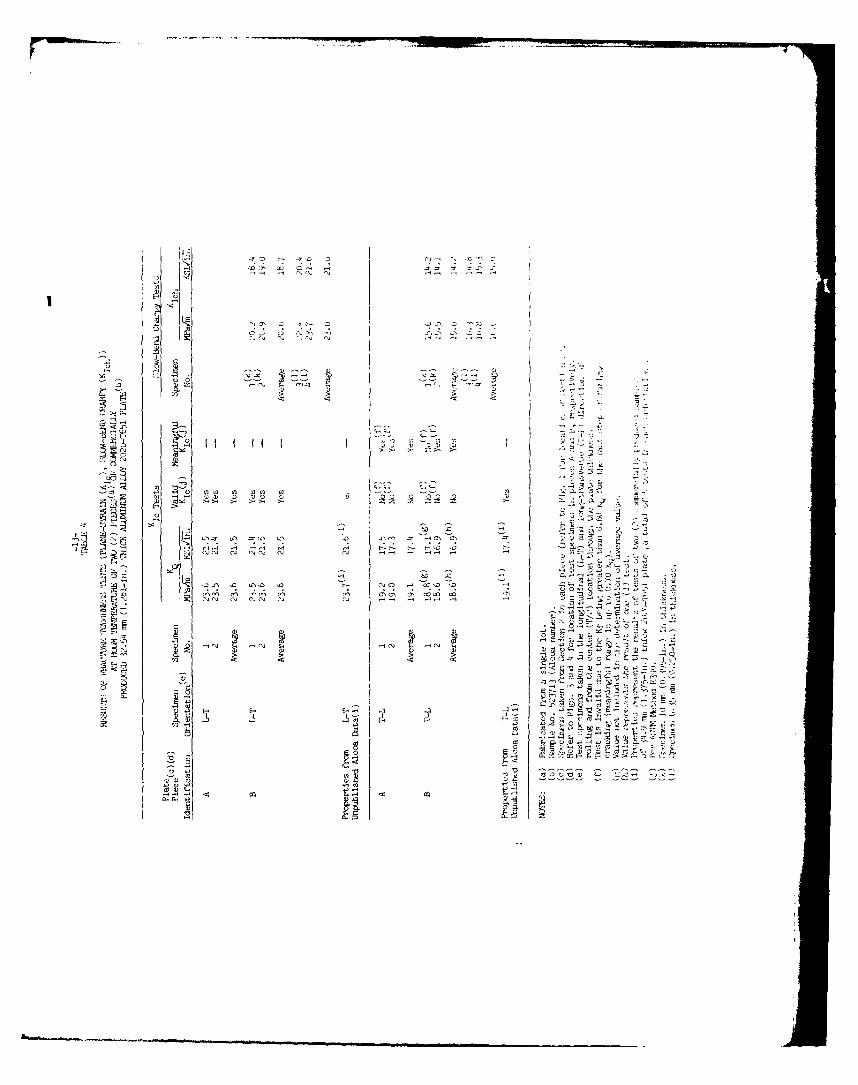
4 Results of Fracture Toughness Tests (Plane-Strain (Klc),Slow-Bend Charpy (KIch)) at Room Temperature of Two (2)Pieces of Commercially Produced 32.54 mm (1.281-in.) ThickAluminum Alloy 2020-T651 Plate ..... .............. ... 13
iv
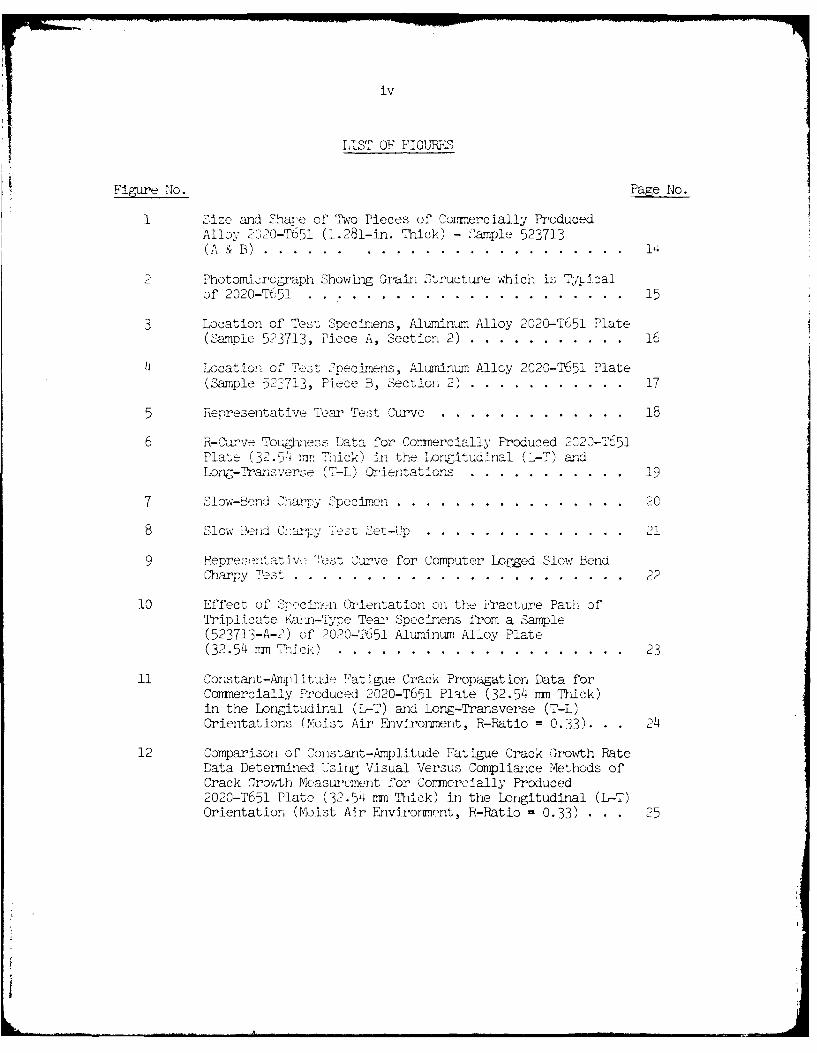
LIST OF FIGURES
Figure No. Page No.
I Slize and Fhape of 'NTo Pieces of Cornercially ProducedAlloy, 320-T65l (l.2 81-in. Thick) - S'ample r-23713(A SB). .. ... .. ......... ......... 14
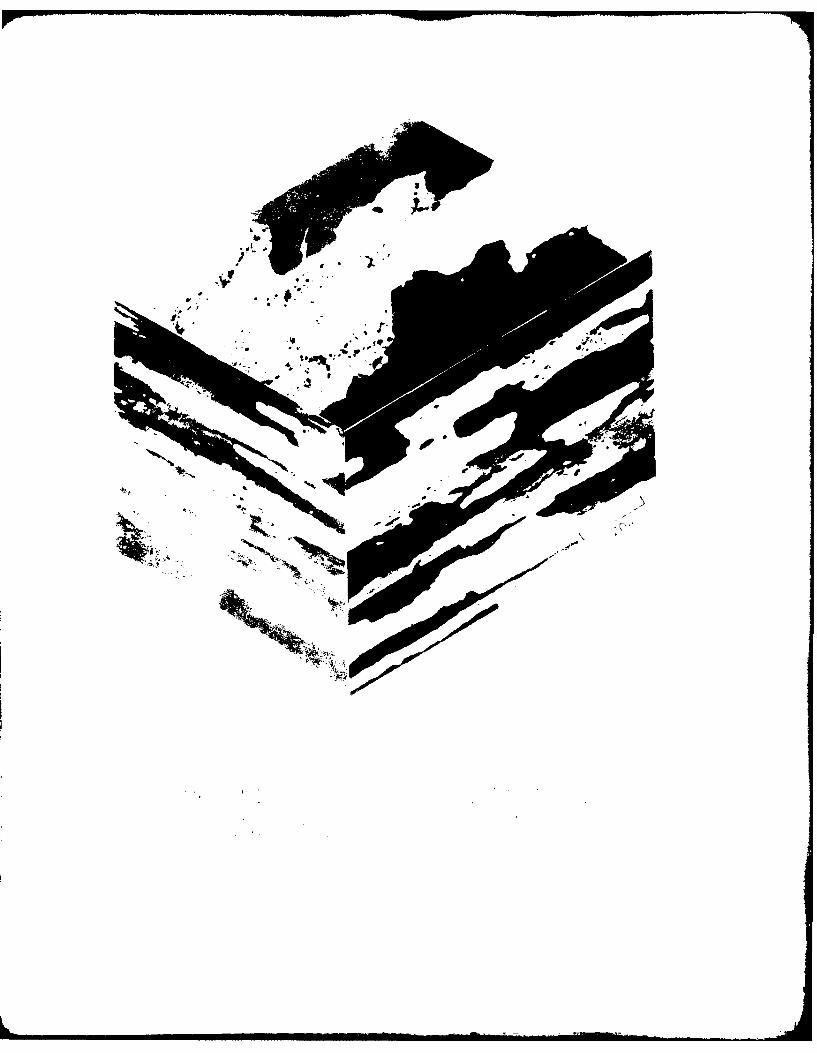
2 Photorrorgraph Showing Girain S'tructure whichn is Ty,,J.calof 2020-TC51 ..... ........... ......... 15
3 Location of Test Specimens, Aluminumz Alloy 2020-T651 Plate(Sample 523713, Piece A, Section 2) .. ... ........ 16
4 Location of Test ecm. Alumnum Alloy 2020-T651 Plate(Sample 5237-"13, Piece B, Section 2) .. ... ........ 17
5 Representative Tear Test Curve .. ...... ....... 18I
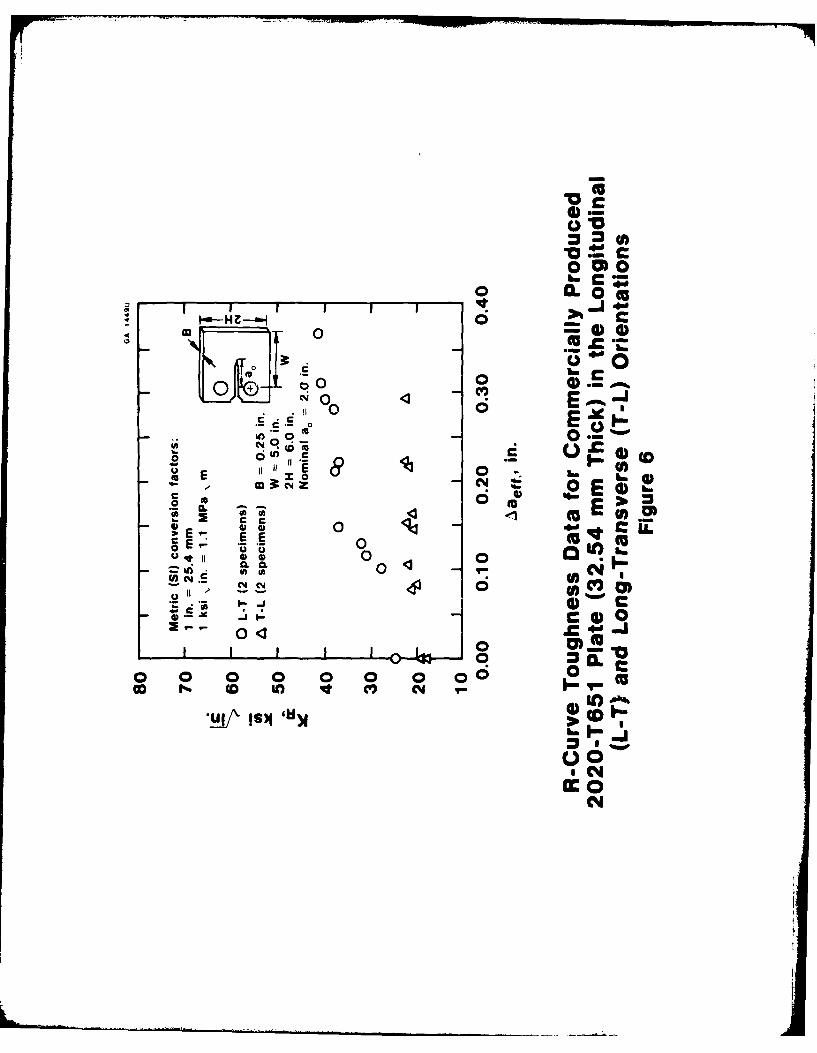
6 H-Curve Touhness Data for Comecially Produced 2"20-T651Plate (3-;.,-)4 mr-Thck in the Lonitudinal TL-T) andLong-Transverse ('T-L) Orientations. ... ......... 19
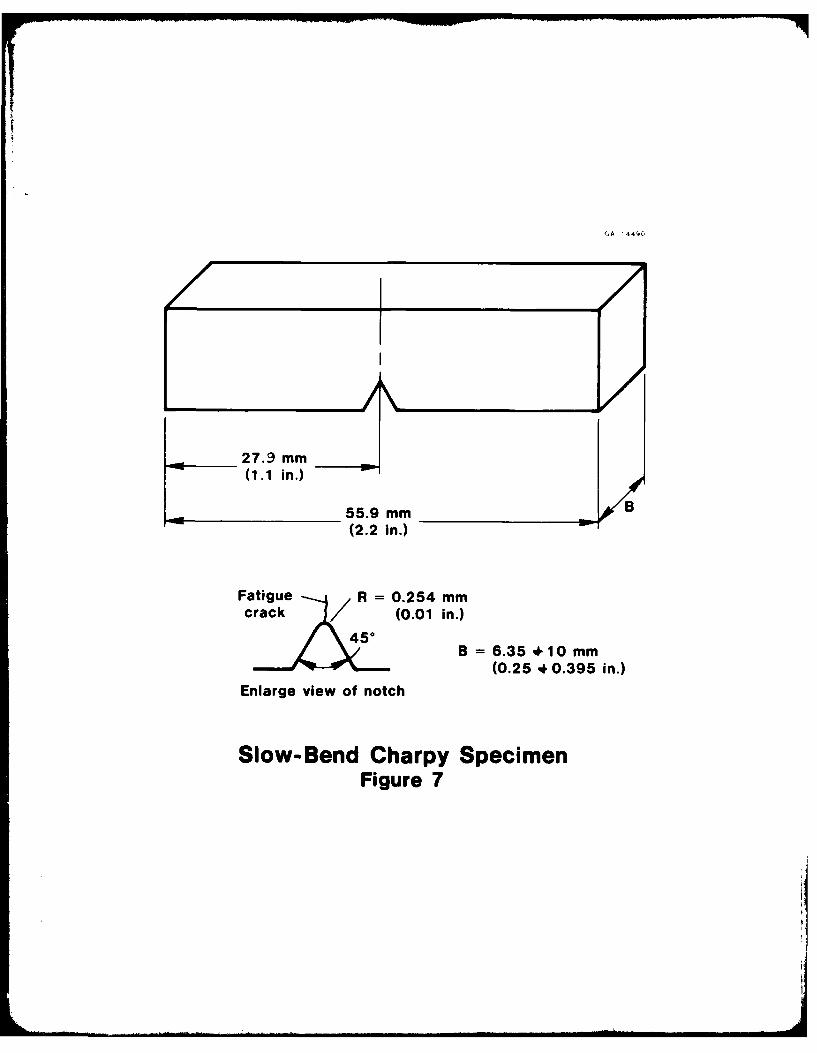
7 Slow-Bend Char-.y 7pecirien...... ... ... .. .. .. . . . ..
8 Slow Bend C~r:Test, 'Set-1Up .. ...... ........ 21
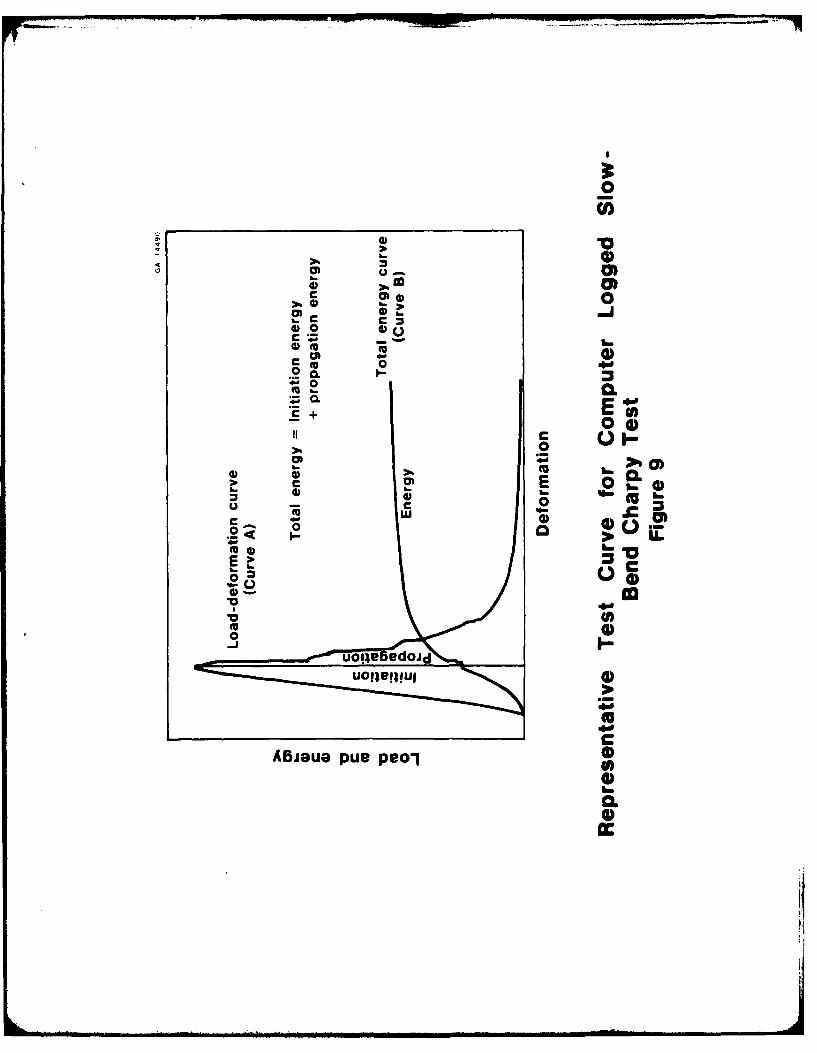
9 Repres3entllat ive- Test Curve for Computer Logged Slow BendCharpy Test .. .. ......... ......... ..
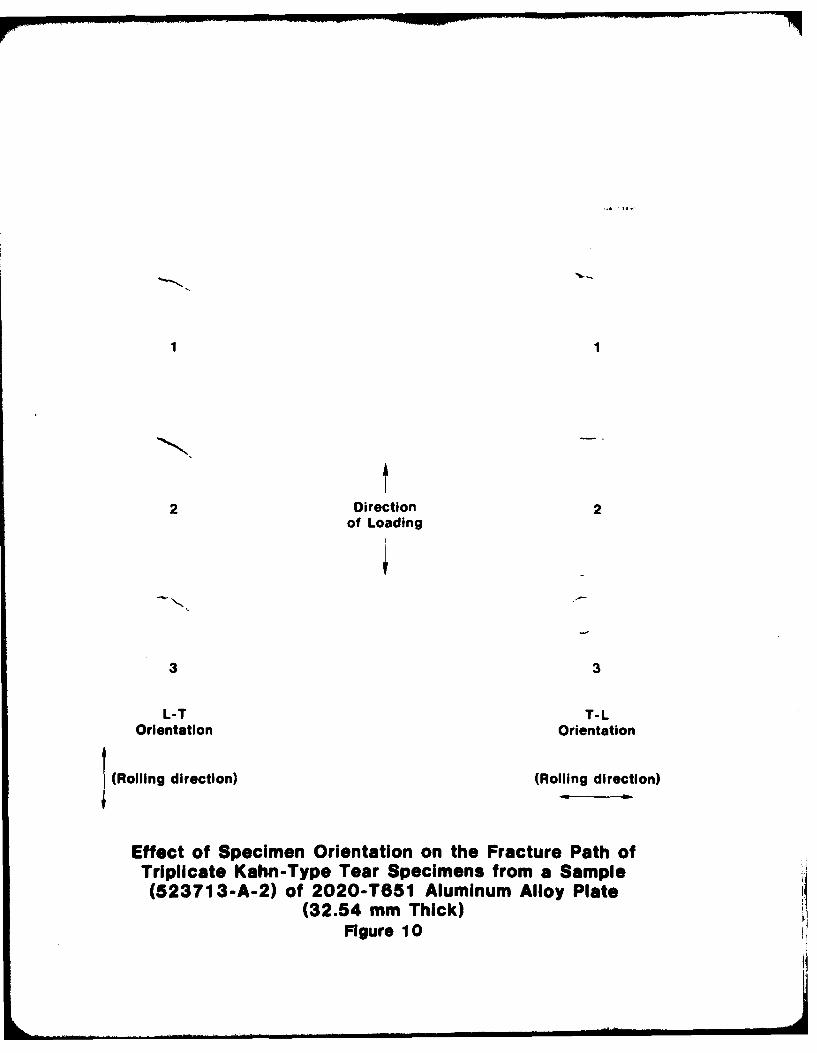
10 Effect of Sncme rientation on, the- iFractuire Path- ofTriplicate Kahn-Tynpe Teaia Specimens from a Sample(523713-A-2) of 2020-T'651 Aluminum Alloy Plate(32.54 mmz 'Thick') . ... ......... ......... 23
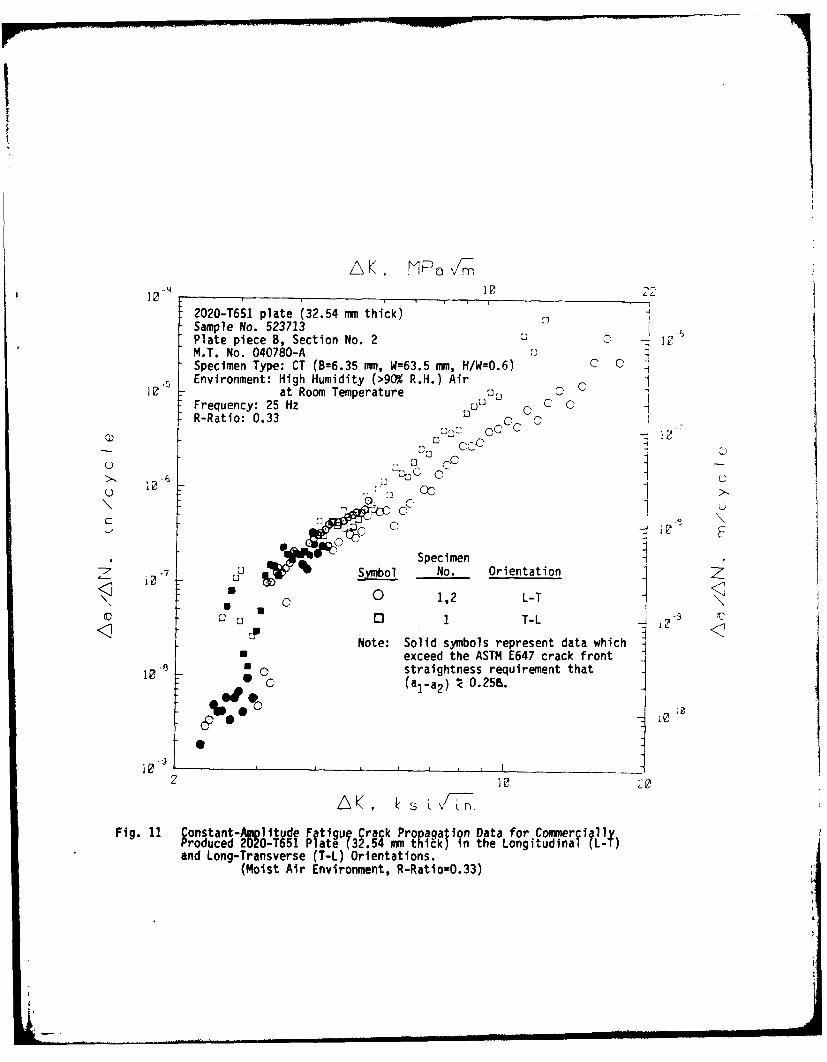
11 Constant-Amplitude Fatigue Crack Propagation Data forComercially Produced 2020-T651 Plate (32.54 mmn Thick)in the Longitudinal (r-.T) and Long-Transverse (T-L)Orientations (Moist Air Fnvi-ronment, R-Ratio = 0.33) . . . 24
12 Comparison of Constant-Amplitude Fatigue Crack (Irowth RateData Determined Us'ing Visual Versus Compliance Methods ofCrack Gjrowth Measurment for Comercially Produced2020-T651 Plate (32.54 ran Thick) in the Longitudinal (Lx-T)Orientation (Moist Air Enivironment, R-Ratio =0.33) ... 25
v
LIST OF FIGbRES (continued)
Figu'rk N4o. Page No.
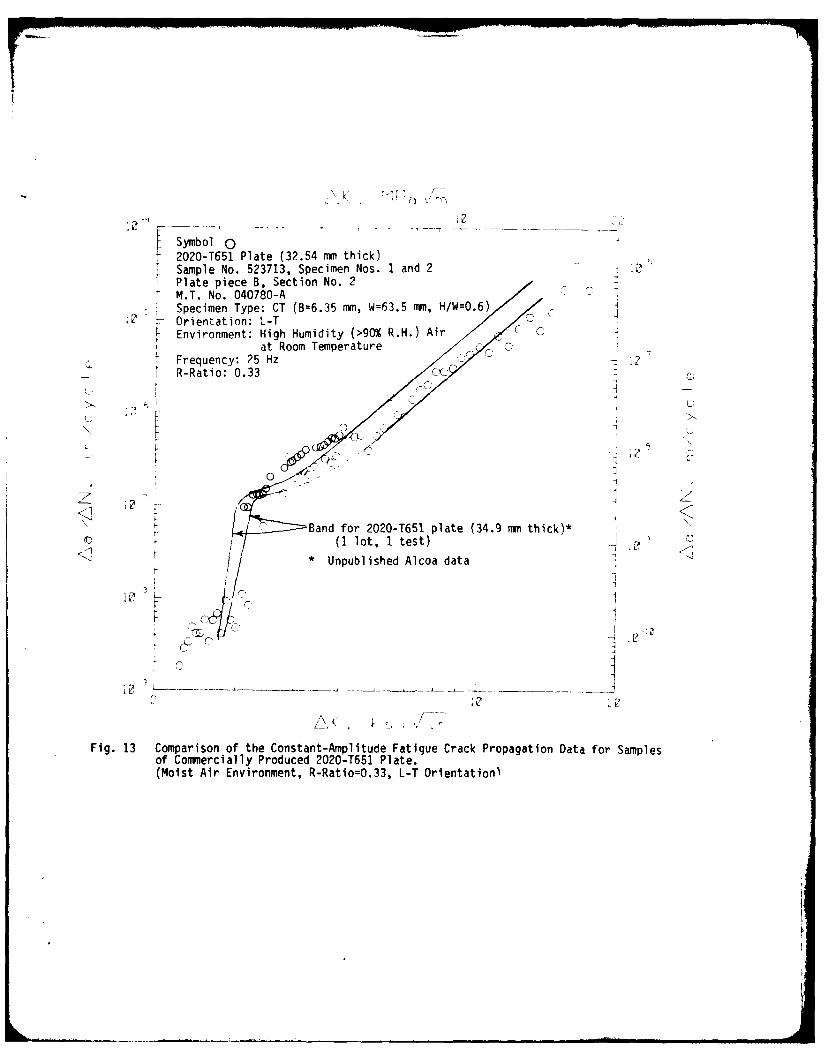
1 Compa'ison of the Constant-Amplitude Fatigue CrackPropagation Data for Samples of Commercially Produced22 T ,51 Plate (MIoist Air Environmt;it, R-Ratio = 0. 3,L - 2 i entation) ......... .................... 26
14 .omparison of Constant-Load-Amplitude Fatigue CrackPropagation Data for Comercially Produced 2 20-75,Plate with Data for Comercially and LaboratoryProduced 7075-T651 Plate and Cormmercially Produced7275-7 351 Plate (Moist Air Environment, H-Ratic = 3L-T Orientation) ....... ....................
15(a&b) !"racture Surface Appearance of Alloy 2020-Tt51' .(32.54 mn Thick) in the L-T Orientation for : .-(da/dLN) 9f 1.27 x 10⁻¹⁰ and 2.54 x 1 !,Vc',:,'c1._,(5 x 10- and 1 x 10- in./cycle, respectiv,', ..
15(c&d) Fracture Surface Appearance of Alloy , . i(32.54 mm, Thicl:) in the L-T Orientatin for-(da/dN) of 1.27 x 10 - 9 and 1.27 x - 'and 5 x 10⁻⁷ in./cycle, respectively) .........
l5(e&f) Fracture Surface Appearance of Alloy 62020-T51 F--(32.54 rm Thick) in the L-T Orientation for' I,'.; ha*. z(da/dN) of 1.27 x 10 - 7 and 1.27 x 10- 6 rrvcycle (,. x 1)-and 5 x 10- 5 in./cycle, respectively) ......... .. ,
-VALtIO~d'T :EJb.R PRP{L" OF~ A COI~~R AL
PPODUCED LUNINTJM ALLOY ,'20O-TC5l PLATE
2: w, _ 'i'__1 Iith alance Alumi.nm(3 7) was developedi irn1:>so-I:W h e for alloys with hdi strent and hihmduluIs
oh tc t :Xouia ~:aj~a:1truturs. owever, alloy 70220, particularly,z*"' ,"-"' c-:-ue u~ leveloped lwfractuare toughness compared to,
I, cniaracter'I-tic coupled with manufacturing,"" 1,-A ~ '''~ cli allj-' fo use In corr'ercial products.
* t iloCm'.all containingC 1 liium remain attractive for.a I1I"It I rrIi ca* ion bIL , in iditloni to highn s-'utngth and hihmodulus of
IA L, ' ''w t'anld th-e uotent ial for higher re,.istance tc,ii-1 loingC co it 2" Conseq4uently, current research hias teen directed
-dLX ilfi3 9 acture oAli-mealloys -*ito a -ange acceptablef'or aircrafot e ,
To ai stu i t',- uar A:-it<: 1: Lmurcvement, t'tiO,,a h.~av sppy 79 13', for the purooswc of eVt:jor'i.:geg crn
charcters~i ~ Il~'~7 aabaol~nosmtcial.iL~ xc! an~ge for two c ecof luinm llo> (.)Y Ii -Lt fbiatdfo h am o>9p ed by te
Naval A-- sem Comandl ", A c gedt hrcel the p and sutmit th!etesit results anai evaluations at no additional cost' to t xk7 Nay-,- -Ids tr'ansaction(14) was anle as an, arnenomevoi to Nay': Cotract L.X 0- ' 5S"Effect OfMicrostr'ucture on 7YQCK Ala~c l:;hoj Ta1 Io~Lt to tnsiy.
OBJECTIVES
The properties agreed upon- to !,, evaLiated on the ?0-51plate are as follows:
1. Characterize microotructiure 'by lighit miicroscouy,
2.chemnical analysis,
3. tensile,
4. tear,
5. frrlcture tough ness,
6. fatiimoe crack Ii~t i Wcnldd alir at room temperature (low, inteonnediat-e, anidhigh AK), anid
7. Practogupli,-.
-2-
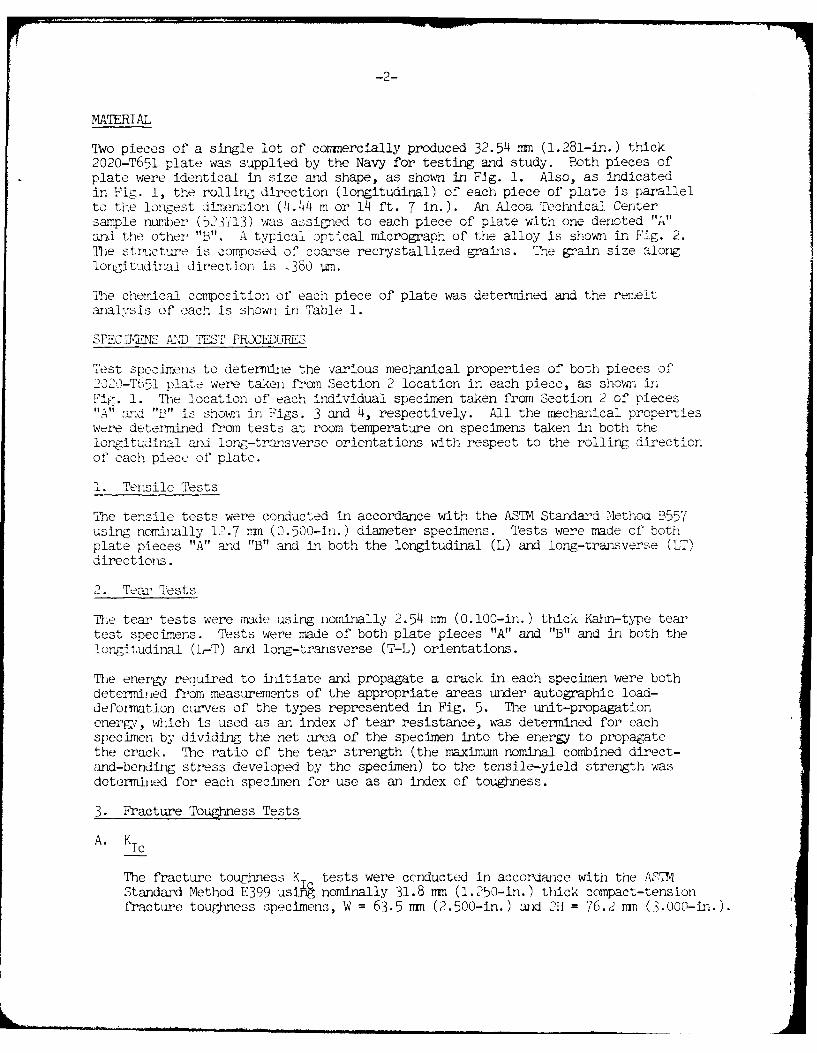
MATERIAL
7Iwo pieces of a single lot of comercially produced 32.54 Mm (1.281-in.) thick2020-T651 plate was supplied by the Navy for testing and study. Both pieces ofplate were identical in size and shape, as shown in Fig. 1. Also, as indicatedin Fig. 1, the rolling direction (longitudinal) of each piece of plate is parallelto the longest dimension (14.44 m or 14 ft. 7 in.). An Alcoa Technical Centersample number (523713) was assigned to each piece of plate with one denoted "A"and the other "B". A typical optical micrograph of the alloy is shown in Fig. 2.'Die structure is composed of coarse recrystallized grains. The grain size alonglongitudinal direction is -380 m.'De chemical composition of each piece of plate was determined and the remelt
analysis of each is shown in Table 1.
SPECDUENS A!D TEST PROCEDLRES
Test specimens to determine the various mechanical properties of both pieces of2020-Tb51 plate were taken from Section 2 location in each piece, as shown in,ig.1. The location of each individual specimen taken from Section 2 of pieces
"A" a nd "B" is shown in Figs. 3 and 4, respectively. All the mechanical propertieswere determi-ned from tests at room temperature on specimens taken in both thelongitudinal and long-transverse orientations with respect to the rolling directionof each piece of plate.
1. Tensile Tests
The tensile tests were conducted in accordance with the ASM4 Standard Method B557using nominally 12.7 Mn (0.500-in.) diameter specimens. Tests were made of bothplate pieces "A" and "B" and Ln both the longitudinal (L) and long-transverse (LT)directions.
2. Tear Tests
The tear tests were made using nominally 2.54 mn (0.100-in.) thick Kahn-t pe teartest specimens. Tests were made of both plate pieces "A" and "B" and in both thelongitudinal (L-T) and long-transverse (T-L) orientations.
The energy required to initiate and propagate a crack in each specimen were bothdetermied from measurements of the appropriate areas under autographic load-defoiation curves of the types represented in Fig. 5. The unit-propagationenergy, which is used as an index of tear resistance, was determined for eachspecimen by dividing the net area of the specimen into the energy to propagatethe crack. The ratio of the tear strength (the maximum nominal combined direct-and-bending stress developed by the specimen) to the tensile-yield strength wasdetermined for each specimen for use as an index of toughness.
3. Fracture Toughness Tests
A. Kc
The fracture tougtness KI tests were conducted in accordance with the ASTMStandard Method E399 usii nominally 31.8 mm (1.250-in.) thick compact-tensionfracture toughness specimens, W = 63.5 mm (2.500-in.) and 2H = 76.2 mm (3.000-in.).
1 t21 -1. ' I, Li p 1.D" L a di, -ra is: I a~C c lem n T-
'2 11 ent g-ag; ? 'lo 11 t ca
-''-
- I
MI-LL
1 a
twoli o-S oanm. * ~ -V::io7USn
two~~~ ~~ cj~u1 <~ ~
absorbed bv th<'o.ci r o a ' uie i_. aLOC-Cd . 21 Tm'L-(Ii agram.
Work by RF!i: iJ 5d ain-l Wy~il 2G1(') ' ccux'ti a. dlj -'1gt 1fsaax Z"
a l u m i n u m a l l o y I ' sva e ~ . b , z ' o t ' n , I c r e l t i i . b t e n(V~~~~~~~~~~~~~~~~~~ j 'nv1 to%7l.-05saie &c~a S -'':S rt tI~t wt
cr "-' "'
1
of. fl,. e - -d
.............. o
itt zli''-dian -.- 1' ra - f'-

tzr0:l a o'! -
,- con -al 4-
-. ,e 1 E 11-1
CC-. 2- a, ar
c:e-Ia n..at
uiar'ac-. eT,,Ie
A. K I
heresults-, -e~ -T Of~t C ~ii aow' :t f
the Er?' ad '.-L orletntat'o(ns ar, 4' ' . t tss cconducted for each- condition.
res-ulted in valid K10 va1,c - howeve-r, nanon 4I V1 i c.e to in th-e T--orientation resutet lin ,al!J 1'jc aI-uc'-. On "he other hand, t he v~ aluesfor the T-L orientationi cer t plate "A" tts and cne plate- "B" tecv areCconsidered meaningful. Th.e-e t 'st res-ults tl 'at toie fracturetugesof plate pieces "A" and ""are equal, owevt-,r, Itt val ues~ are rat>~- lowindicating, poor twces.in rc-flral, t0rc'prpts are, comparahic- to'those of two :ipn'of Afo onnerciall,'i prodiuce , h.9o,(.75i.thick 2020-T( 51 plate t't -peviousl-y HrbihdAlcoa data).
B. R-Curves
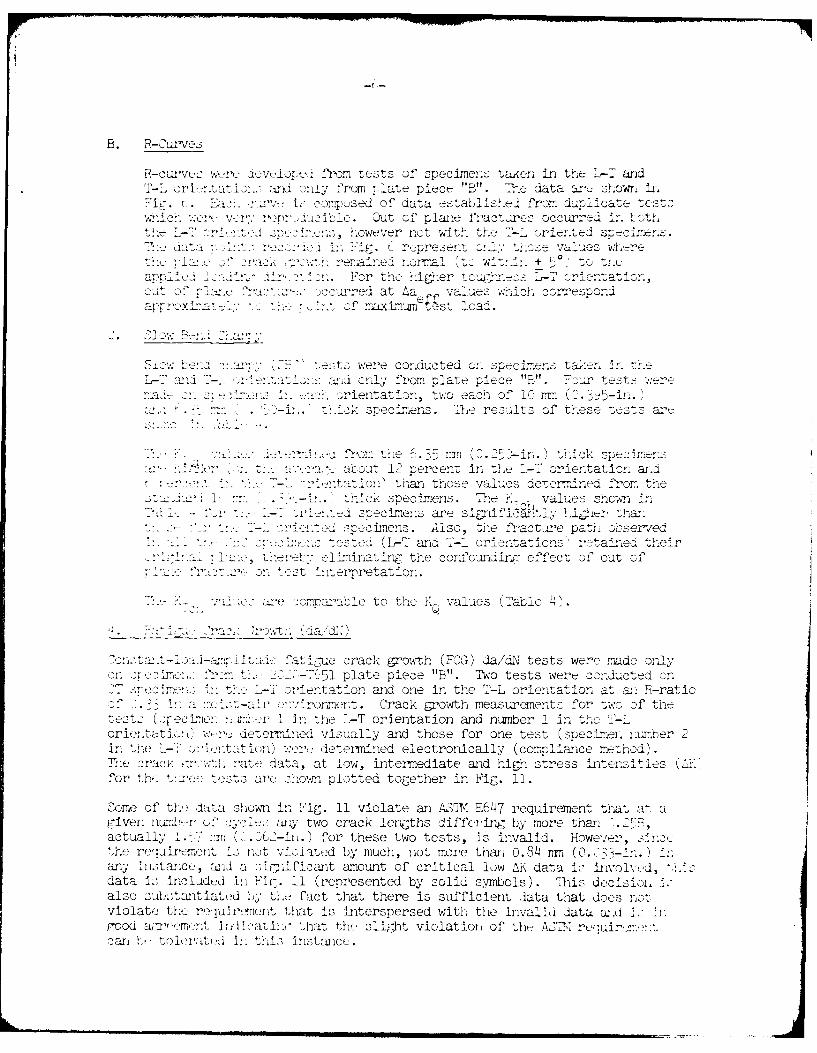
R-cu 'w= .,: .wori dilop fom tests of specimens tacen in the L- andT-L r.tatio.: 0L'd ily from pilate piece "B". -. e data aru snowr in
Fr. mpused of data establis..el from duplicate test..ee Out of plate f.act ores occurred in otn
-Z., however not wit! the '-L oriented specimens..da tId ig . t represent ' those values w-ere
. '" , remained .ormzl ( wi. + , to th.e'or the higher tou' h teus 1-1 -rietntation,
Cut of I L' , ccored at Ia value- wich correspond
C. a]n , k--. 0:,
. es-ts were conducted on specimen tae, n" ti e,-,_- and on- l c-dy from plate piece "B". Four test -.-ere
.. orientation, two each of 1, rr. (?.15_-..,. -i t.ick specimens. The results of these rest ae
from the S 3 rn (. -c. specimen:aout 12 percent in the L-7 orientation wd
tha. those values deterined from the.. thick specimens. The 'values shown iAn
v!-t-- specimens are sr-cific r I-Y-_h11er ta.* -. soecimens. Also, the fractu re pa'-, observed
eS (C? and o- ..... '. ' retained their,,-,ere!%" eliminating the confoundin- effect of out of
,i:-e:'l,:~s'--n est interpretation.
.' e "o'marale to the K_, values -_able 4.
... ,.... - ..-- .. 't- ooe crack gro;, ch (FCC) da/dN tests were made onlyor eOl -51 plate piece "B". Two tests wert- conducted on
Speclme- . i' . - orientation ard one in the T-L orientation at ani R-ratio4 f ' !.-()--a os-lr e:tvironment. Crack growth measurements for two of the
tests (.r, eI Ior I in the L-T orientation and number 1 in the T-Loriet at~; i ,;~.'e dceterined visually and those for one test (specimen num ,ber 2in he -1 t ) .er determined electronically (compliance method).
..... • ,,,--,lte data, at low, intermediate and high stress intensities (1K.for b- te -,ver Lire :ho'm plotted together in Fig. 11.
Come of tll,- data shown in 'ig. 11 violate an AZOM E647 requirement that at argiven numb-r of ye,0 an" two crack lengths differing by more than .,actually :.,, ( . :j-iii.) for these two tests, is invalid. However, sincthe reuirement i.:, nt 'aed by much, not more than 0.84 cr (0.G3-i.any' instance, rid a iflcat amount of critical low AK data i inivol,ed,data L-. included i !-' g. i1 (represented by solid symbols). his decisio,, 1also subotatiated K ti2 fact that there is sufficient data that does notviolate the reiuirement that is interspersed with the invalid data aw.d -good a- ,ment inlti that the, slight violation of the AJ, h reuim,can ho tol-','t, in , i intnc
, a- a% .. ,. . .
aI
-8-
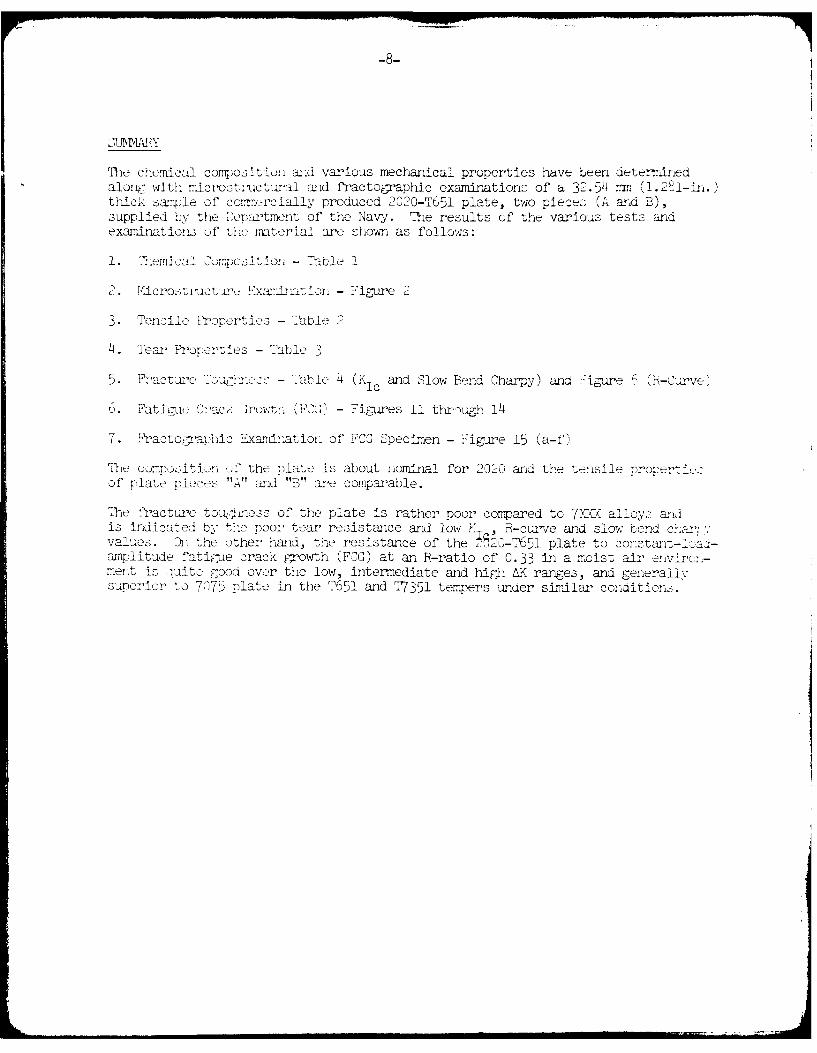
I'he chemical cono-ositiun and various mechanical properties have been determined
alon g with ancrostrutural ad fractographic examinations of a 32.54 r, (1.2 8 1-n.)thick sampqle of coi-me rcially produced 2020-T651 plate, two pieces (A and B),supplied by the Department of the Navy. The results of the various tests andexaminations of tIe material are shown as follows:
1. -, emi cai , Oesition - Table I
. ficrostoruct, I ii-nxatiorl - FiCore2
3. Tensile Properties - Table 2
4. Tear, Froperties - Table 3
5. 'acture 7oaus Table 4 (KIC and Slow Bend Charpy) and Figure (U_ (-Cu rve'
u. FatiL-ue iCara r ' - Figures 11 through 14
7. racto. ga'aic Exa'ination of FCG Specimen - Figure 15 (a-f'
'The composition of the plate is about nominal for 2020 and the tensile propero ....of plaoe pieces and "B" are comparable.
The :racture toa. hess of the plate is rather poor compared to 7)CC( alloy-: andis indizca'ed bv the poor tear resistace and low F R-curve and slow Lend charvalues. On the other iand, the resistance of the 7620-T65l plate to constant-load-amplitude fatigue crack growth (FCG) at an R-ratio of 0.33 in a moist air envircn-ment is quite good over the low, intermediate and high AK ranges, and generallysuperior to 723 plate in the '7651 and T7351 tempers under similar conditions.

* *.~*'~ . . .. . 1~
* ~,, *.2
.. .~
A1
Jj 1~ ''
~
1
uYA,
* ~ ~ V&floseu.cw.utu'u I
:IU2t1Ju ....S *J'uLz1'-rat icic tvac : ....~.. .4. tricat. , 7. '7A '9 ;;.
- . - Li
..C:StJ.LF as.: ..n:cz'Ial.'
CQ r-I Q
m' C C)
'd H CMl CM C
~o0 0 0 9 C
'ED, CM CD CM
CDO
0 0
0
CD-
H 00)
C ~i
r74
0Y)
I4-) C.)a
a) CL
0)i
P- HAQ
1 -
- -4 0I - I-- X I-- E- t-- t-- t- r- L- rC30
0.
U--4j l 0-n ' n L Ln Lll U\ Lr U'N U-N-43L
aia) a CC ) C L)~ .. o .
-4 0n - D c 4 - qo 0 o 4 1 > (7-7 '0T L"u L Lrn) u-\ 4.ui Co mI --J n rl )
'0'0 ~ ~ ~ ~ ~ - a0 0'' a 0. ,1-0~- u~ uO e 1
Q.)
-1,~ (v .)L
Q0 > a)
-~~~~a 0\<f N) 0> O1). O~C 4C C OCO C 'O'-OLC Cu ~-4Z) WO
4- (1)4 0 4-ZZE LJ 04
Icu003 -H C:
E- XV '
24 ~ 00~ca~C W C u ~ -1u)C C I) 0)~04 3 0
.7
-,--,--, '-r-r-, nn~ E 2
-. <00 -- 'N7~r t- IC 0'CZ- P- 0220 0U) 0.4Cr ~ fl.00 0 0 0 00
A ''' - - - -
-r.-r-, .- s--,-o S S S
222 <00.. Cr '.00.. -~ ., t-CrV CO 20 2~0 ZCr.-.
N.................0. 040000 0 00Cr SC C) 000 .0 000- 0
~ ~rcJ0.. N 0-COW'. 0-a N C.,-: - 0'40
70
Z 0 CrOP- CO 0-a CCJ CC -4 0 NO ~O Cr 0,-I C! = A
.4 COOP- CO 000- CO 0 44040 00 404..000 0 000 0 0 000 0 000 0
4. 0>4- C) 4~ ~
OP- 0 4.00- CO 0 COON- 0 4fl~00 O N- 0 0
0 00~ 0 -4 Cr~ 00 '.COCOO- P- .0 ~20A,.2
- 4
-- 0.,-'0 20
4E-'2 H o~2 0.-b 0 ,-P--0 .0 .2 -. 4N- CC! 020 0 Cr 04'-''
C'. C'. >0 - 0 0-00 0- 0 00 0 0O OOO OCr CaCUO.2U0. ~
00.~.C -~
0 5 0'-IC.Cr ,-<Cr 0-
-404Cr ,--:~aCr .~ 0-IS4 > 4 ~0 0
~-'.'-'j - -~ 2
.~ :-4'-'-~
5 >a; .oz.-~E ~ ~
&io 0a E-. E'. E- A A A 2~I-'~'a ~. ~
00 .4.,>~
j 400'
0000000
"44040 04-.
CO2 on
00.0
0.- ~C4 0 ...-. . X.'. 2
- VO' 444 0.4 '4 -~ -t -1X\ 2:4 4.4 ..4 0.04 "4
1 a:
K >40' .0 00- 0 '024 0 04C -
4.. 00 0 >4.0 '0 2,24 .0 CC -E 04 >4 . 'N 'N
- 3 0
44 0
a: 0 .~ 2~ 440
0 140 -404 4.40.-a44. 0 0 . -)
44 44 1. 4'-~ 4 4 4
4')
044-0-
..- 4.. -'4.-
A4 ~'-'~' 4 4 -.----- 4----
Ii 4-44. 4-' 40>.>.4j'N44 -4 ---. 4
44 .4>'- 4,4..4.4 .- 4(4 4444 44 4444 44 .- '- 42
44 0 440 0 4)0 '0 'C 00 0 o.~ ~..C) -41444 44.>. 4'- 44.>. 44.
0 0
-, '--4.4.-.. 44 -0
040404 04 -4 0 .0 "4
.0 -
21cy -.-- '-2>4~.~ 0a: -44 - -44 - '-444 0.4 0
'024 '0 24'0 '0 '~ ~ 0 0 ~'4.44 40 .4.4
4- 040 0 404'0 '0 -4 0'- 0 44(*444 (0 400* 04 (4) 0404 0' 4040 40 00404 04 0404 04 04 4,4 '4 0,4 0
4.4 ~<4 444
00 0.44
44~ ~~444 004 004 004 .44.4 .0 4~ 044 44 44 44
4/) .44 4 4 4 ~o ~
4~ -~ -~0.4
''0
.4~ .*~
.2 E E' E.44 -~ ..J .2-~ -~ 2444 EL '-
1-. 4'42 -. 4~ 44 .40.44
~0 -44.4 44 0 0 0.
~44O~> ~
~.2~4~>4'.~-'4-.( -'
44 44~ 44.4 4404400 4... 0.00
0044 0.0
,4~4 4 40 40.0.. .4 &
0
'0 0.000. A- 40

S'4 (7')35 14"35'
I (REF: FIGS.3 4 _
dcA
2
30
MIETRIC (51)CONVER~sioN FACTCA:
Iy IV Z.L
SC.ALE:0.1 IN- 2 14.TOP VIEW
FIG. I SIZE AND SHAPE OF TWO PIEC.ES OF COMMtERCIALLY PROtfl.CEL ALLokY20ZO-T6.51 PLATE (I.aei IN.THICK) - SAMPLE 523713(A4B)
.17

tMETRIc (61)COIJVERSIION FA CTO K
TEIJ- IN.I yo'4 v
SCAE. rnh IN.
F1G3 LATT!I LAT! PCIESAuIUMALYZZOT5 LT
KI,
(SArIPLE Si.3713, PIECE A. S5ECTION 2-)

ccAIVLRGION FACTOR'
SCAL N.N. LT-
(SAPL ma,3 P-r~ C. SATIt R

In)
00 C)
la)
o~o 0.
00
V-4
0~ %0
0 q0
ia C
LP, 0
4Po
la co"0
000
00Loi
I.E I EI E --0. )
C4 6 E 0.-
E s x 0 0Ecm o t
0 E4I.hI E v' 0 E
r: 0 O0 mZ6
*. 11 0 0
wii a L
c~j' EE 0 -
u~~c 4) 0 0
0 43 =
0 0 0 0 0 0 0 000co u) m~ C) N- a
IcJ
C4J
..........
GA 449C,
27.9 mm(1.1 in.)
odd 55.9 mm 00sB
(2.2 in.)
Fatigue - R = 0.254 mmcrack / (0.01 in.)
4B 6.35 +10 mm(0.25 , 0.395 in.)
Enlarge view of notch
Slow-Bend Charpy SpecimenFigure 7
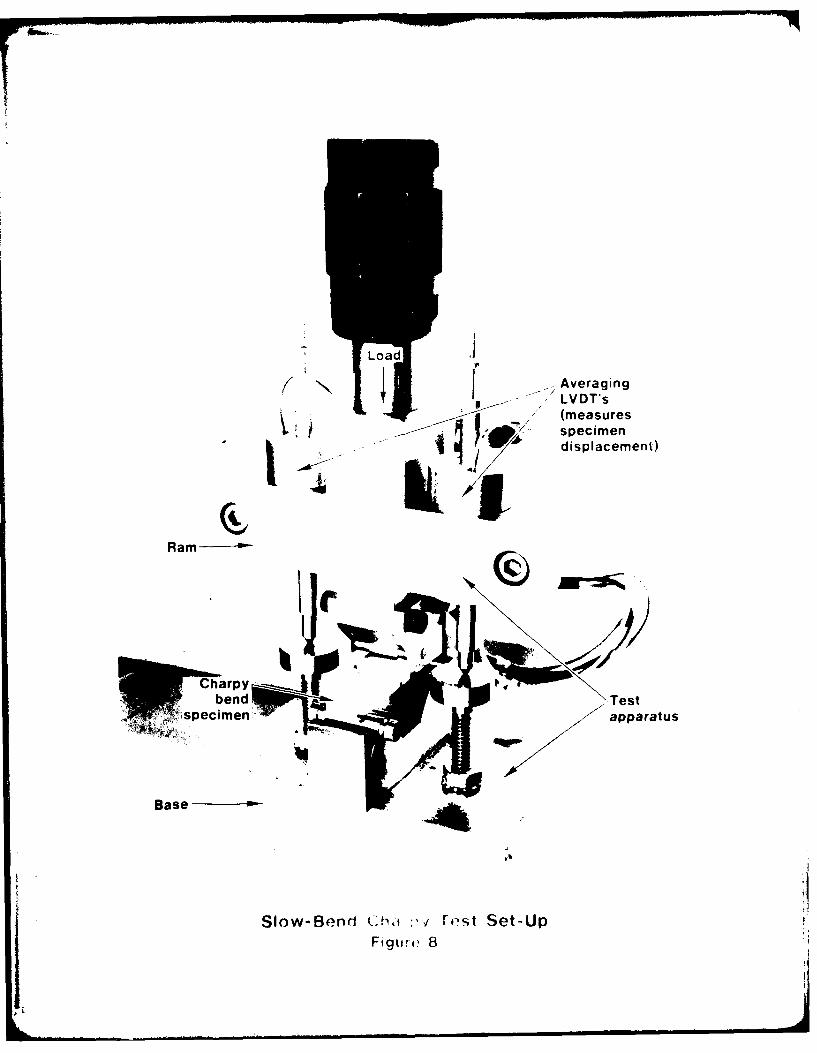
Load
tV
i "l Averaging
V ---- - ,LVDT's
(measures_.o-- - p/. ( specimen
I I displacement)
Ram 7__ -2
Charpyi! Ts
bend Testspecimen tapparatus
Base -.
Slow-Bend Fho , rst Set-UpFigure 8
0
c zi00
C610
0.2 00
0 - ).206
oo
000
0 0 0L
-i i u
4 )U
4)61
CL
2 Direction 2of Loading
3 3
L-T T-LOrientation Orientation
(Rolling direction) (Rolling direction)
Effect of Specimen Orientation on the Fracture Path ofTriplicate Kahn-Type Tear Specimens from a Sample(523713-A-2) of 2020-T651 Aluminum Alloy Plate
(32.54 mm Thick)Figure 10
m ;. ,rl ";I .. .. . I m la . . . . ... ,,, , , , I .. . . II I
101
202-T51AK, NW20
2020-T651 plate (32.54 mm thick)Sample No. 523713Plate piece B, Section No. 2 -
M.T. No. 040780-ASpecimen Type: CT (B=6.35 mm, W=63.5 mm, H/W=0.6) 0 0Environment: High Humidity (>90% R.H.) Air
at Room Temperature CFrequency: 25 Hz C0 cR-Ratio: 0.33 C C
c~) 0U ,
C 2 -~
% Specimen ,
-- u5 l Symbol No. Orientation
* c0 1,2 L-TS1 T-L io-
Note: Solid symbols represent data which* exceed the ASTM E647 crack front
10,0 straightness requirement thatSC (a-a2) Z 0.256.
.00
2 10
Fig. 11 Constant-Apltude Fatigue Crack Propagation Data for CommerciallvProduced 2020-T651 Plate (32.54 n thick) in the Longitudina (L-T)and Long-Transverse (T-L) Orientations.
(Moist Air Environment, R-Ratio=O.33)
LI.

AK. ,P~10. . .....
2020-T651 Plate (32.54 mm thick)Sample No. 523713Plate piece B, Section No. 2 c cM.T. No. 040780-ASpecimen Type: CT (B=6.35 ram, W=63.5 ram, H/W=0.6) C
1 - Environment: High Humidity (>90% R.H.) Air C
at Room Temperature 0CFrequency: 25 Hz c 00 C JR-Ratio: 0.33Specimen Orientation: L-T CCO
o 00c
0 0; C
CC C 10 FZ Z
Z iw7 bol Specimen Method of<< S No. Crack Measurement
0 1 Visual
0 2 Compliance
10- 0
2 S C
11
0
2 10 20
AK, ks 'LvfnLFig. 12 Comparison of Constant-Amplitude Fatigue Crack Growth Rate Data
Determined Using Visual Versus Compliance Methods of Crack GrowthMeasurement for Commercially Produced 2020-T651 Plate (32.54 mm thick)in the Longitudinal (L-T) Orientation
(Moist Air Environment, R-Ratio-0.33)
N!
Symbol0
2020-T651 Plate (32.54 mm thick)Sample No. 523713, Specimen Nos. 1 and 2
Plate piece B, Section No. 2M.T. No. 040780-A C -1
Specimen Type: CT (B=6.35 mm, W=63.5 mm, H/W=0.6)- Orientation: L-TF Environment: High Humidity (>90% R.H.) Air C C
at Room TemperatureFrequency: 25 Hz
F R-Ratio: 0.33 xi-
9' U
Band for 2020-T651 plate (34.9 mm thick)*© ~~(I lot , I test ) _ ..
K-Unpublished Alcoa dataI -
:I -
i ~~~ "N'.... _
Fig. 13 Comparison of the Constant-Amplitude Fatigue Crack Propagation Data for Samplesof Commercially Produced 2020-T651 Plate.(Moist Air Environment, R-Ratio=0.33, L-T Orientation)

02-T51Plit, -!.:4 an thick)Sampl~e N~o 5?3723, Specime, Rot. andPlate P ie B, Section No.Ma.T. No."O4OTRO.ASpecimen, Type: CT IP1. 35 an ', . M. HIW0,Orientation: L-1Environm~ent: Hoqh Hunidity '10-M 9.H. Air-
* at PooO, TenmperatrpFrPe9.,ency: ?5 H2A-Rat o: 0.33
- Band for 70TS.T6Sl Plate2commnercially produced lots' I tests4
.1 1aboratoryproduced lot,+ 3 tests
6.35 and 76.' - sthicknesses- t mh ickness
B :and for 7075-T7361Patcommrocla)lty P-471rd tos
03 tests
6;
2 5.,4 and 34.9 f"n thicknesses
/4 Un Spublished data/ P Oe Navair Contract Nos.
/ NOOW9-76-C-048? and
/Nr R 9Tl-79-C-O?S.R
Fig. 14 Comparis On of Constant-Loa-Anotitulo Fatmoan crack Piop~gat~on 0:at; frConiperci ally Produced 2020-7T651 ,lt ,uhDt o Comm, c ialyReLaboratory Produaced 7075-4651 Plate and Comgiue ollly Prodaced TOTS
T31Pae(Moist Air Enviroment, R-Ratlo-0.33, 1-0 Orientation)
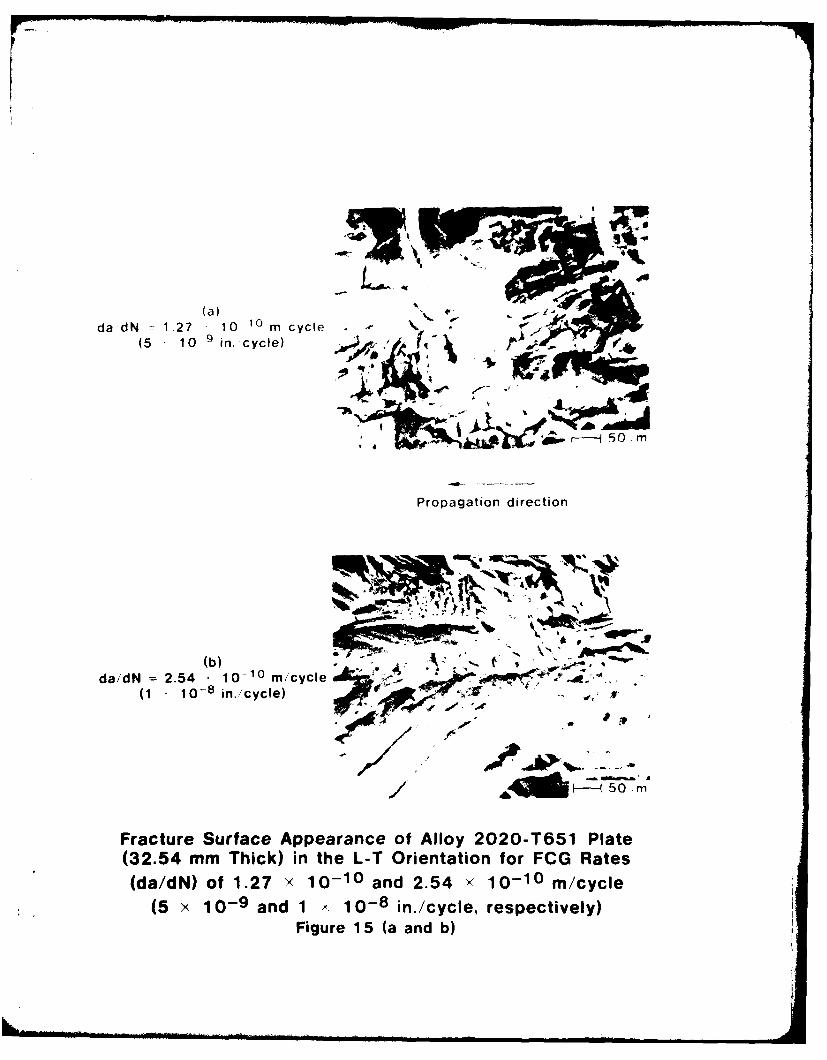
(a)
(5 10 in. cycle)
4q~
S50 -m
Propagation direction
da/dN 2.54 - 10 m/cycle(11 10-8 io./cycle) d I
/ - 50'.m
Fracture Surface Appearance of Alloy 2020-T651 Plate(32.54 mm Thick) in the L-T Orientation for FCG Rates(da/dN) of 1.27 x 10⁻¹⁰ and 2.54 ' 10-10 rn/cycle
(5 x 10⁻⁹ and 1 IX10-8 in./cycle, respectively)Figure 15 (a and b)

" -- , O,74 ---
(c)da-dN =1.27 - 10- m cycle ' -
(5 10-8 in. cycle) C
Propagation direction
(d ) 8
( a/d N ) 1. 7 f 1 .2 7 × 0 - a d 1 . 7 1 - m c y l(5 × 1 - 10 - 7 in./cycle e p ciey
II
FractreSrfaceAiperae of Allo 200n65 Plat
(3 .5 mm Thck Iin the I Oretto for r limte I
dd /N of 1.27 10-9 rn/ycl 1.27x10⁸m/y
(5 x 1 0-8 and 5 x 10⁻⁷ in./cycle, respectively)Figure 15 (c and d)
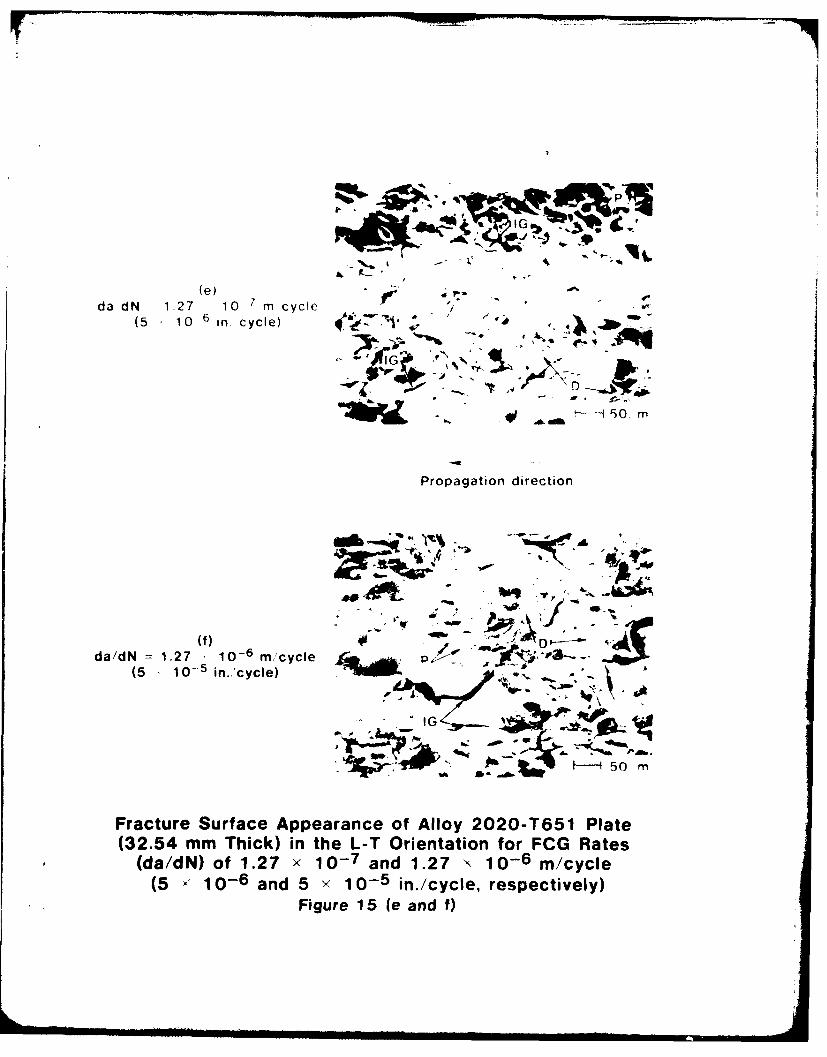
-ttLt tox - '
da dN 1.27 10 7 m cycle " -.(5 10 6 in cycle) 4 - " - , -
-,. _., 50 m
Propagation direction
da/dN 1.27 ,o 1. c 1 1 10 - 6 m/cycle(5 10-5 in. 'cycle)W
1-I 5 0 m
Fracture Surface Appearance of Alloy 2020-T651 Plate(32.54 mm Thick) in the L-T Orientation for FCG Rates
(da/dN) of 1.27 x 10⁻⁷ and 1.27 x 10⁻⁶ rn/cycle(5 - 10 - 6 and 5 Y 10 - 5 in./cycle, respectively)
Figure 15 (e and f)

D ATI